
Measurements and simulation of stratospheric NO3 at mid and high latitudes in the Northern...
13
JOURNAL OF GEOPHYSICAL RESEARCH, VOL. 106, NO. D23, PAGES 32,387-32,399, DECEMBER 16, 2001 Measurements and simulation of stratospheric NO3 at mid and high latitudes in the Northern Hemisphere J.-B. Renard,F. G. Taupin, E. D. Rivi6re, M. Pirre, N. Huret, G. Berther, C. Robert, and M. Chartier Laboratoire de Physique et Chimie de l'Environnement, CNRS, Orleans, France F. Pcp½ and M. George Observatoire de Gen•ve, Sauverny, Switzerland Abstract. Simultaneous measurements of NO3, alongwith those of 03, NO2, and aerosol extinction coefficient, havebeen performed during the nightby the AMON instrument since1992 at high andmidlatitudes andby the SALOMON instrument since1998 at midlatitude. Observations are conducted using the stellar and lunar occultation methods, respectively. Vertical profilesof NO3 are obtained after inversion of the opticaldepth spectra recorded from 650 to 670 nm, including the 662-nm absorption line. Five profiles at midlatitude andtwo profiles at high latitude are presented. Comparisons with a box modelconstrained with measured ozone andtemperatures (andNO2 at high latitude)have beenperformed, taking into account the uncertainties in the rate constants of the reactions leading to NO3 equilibrium. The modeling results canreproduce part of the observations, takinginto account possible errors in the rateconstants, temperature, or NO3 absorption cross sections. Somedisagreements nevertheless remainbetween observations and modeling outputs. In the middle stratosphere they could result from gradients of temperature. Below 30 km, other phenomena couldbe invoked to explainthe disagreements. At high latitude the presence of solidpolaraerosols induces an artifactin the datareduction. At midlatitude, large increases observed in the NO3 concentration profiles obtained between 1992 and 1994 arereal. A speculative hypothesis involving volcanic aerosols is proposed. 1. Introduction The nitrate radical (NO3) exertsa significantinfluence on the chemistryof the stratosphere. It is formed at night by reaction of NO2 with ozone. Through its subsequent reaction with NO2, it is a source of N205. It therefore controls the active nitrogen partitioning as well as the denoxification processes since heterogeneous hydrolysis of N205 leadsto the depletionof NOx and to the increase of HNO3. Since the first measurements of NO3 [Noxon et at., 1978], there have been a number of studiesof NO3 column amounts at mid and high latitudeusing the Moon as light source [Norton and Noxon, 1986; Sanders et at., 1987; Solomon et at., 1993; Lal et at., 1993; Aliwett and Jones, 1996a; Wagnere! at., 2000]. Vertical profiles of NO3 have been inferred from ground-based measurements [Smithand Solomon, 1990; Smith et at., 1993] and from the balloon- borne instruments using planets or stars as light sources [Naudet et at., 1989; Renard et at., 1996]. The ground- based measurements of columns permit the retrieval of only the generalshape of the profiles, using somea priori hypotheses. On the other hand, the balloon-borne Copyright 2001 by the American Geophysical Union. Paper number 2001JD000361. 0148-0227/01/2001JD000361509.00 measurements, with a vertical resolution down to aroundol km, allow access to altitude-dependent variations of concentrations. Differences between ground-based measurements of the NO3 column at different locations and model simulations have been pointed out. Norton and Noxon [1986] implied an unknown scavenging process to explain the results. In fact, they can be due to vapor water interference [e.g., Solomon et at., 1989]. However, similar new measurements performed by Atiwett and Jones [1996b] at midlatitudes in the NorthernHemisphere show a relatively goodagreement with simulated columns taking into account the morerecent rate andequilibrium constants and the uncertainties in these values. While Pirre et al. [1989] showed a good agreement betweenmeasured and simulated vertical profiles assuming rather large uncertainties in measurements, Renard et al. [1996] observed an excess of NO3 in the 23-27 km and 37-39 km ranges on October 16, 1993. The aim of this paperis to reexamine the consistency between modeling calculations andnew measurements by usingthe rate constants of DeMote et at. [1997] and NO3 vertical profiles measuredduring seven stratospheric balloon flights from 1992 to 1999 at mid and high latitudes. These measurements were made with the Absorptionpar les Minoritaires Ozone et NOx (AMON) instrument and by the Spectroscopie d'Absorption Lunaire pour l'Observation des Minoritaires Ozone et NOx 32,387
-
Upload
independent -
Category
Documents
-
view
4 -
download
0
Transcript of Measurements and simulation of stratospheric NO3 at mid and high latitudes in the Northern...
JOURNAL OF GEOPHYSICAL RESEARCH, VOL. 106, NO. D23, PAGES 32,387-32,399, DECEMBER 16, 2001
Measurements and simulation of stratospheric NO3 at mid and high latitudes in the Northern Hemisphere
J.-B. Renard, F. G. Taupin, E. D. Rivi6re, M. Pirre, N. Huret, G. Berther, C. Robert, and M. Chartier Laboratoire de Physique et Chimie de l'Environnement, CNRS, Orleans, France
F. Pcp½ and M. George Observatoire de Gen•ve, Sauverny, Switzerland
Abstract. Simultaneous measurements of NO3, along with those of 03, NO2, and aerosol extinction coefficient, have been performed during the night by the AMON instrument since 1992 at high and midlatitudes and by the SALOMON instrument since 1998 at midlatitude. Observations are conducted using the stellar and lunar occultation methods, respectively. Vertical profiles of NO3 are obtained after inversion of the optical depth spectra recorded from 650 to 670 nm, including the 662-nm absorption line. Five profiles at midlatitude and two profiles at high latitude are presented. Comparisons with a box model constrained with measured ozone and temperatures (and NO2 at high latitude) have been performed, taking into account the uncertainties in the rate constants of the reactions leading to NO3 equilibrium. The modeling results can reproduce part of the observations, taking into account possible errors in the rate constants, temperature, or NO3 absorption cross sections. Some disagreements nevertheless remain between observations and modeling outputs. In the middle stratosphere they could result from gradients of temperature. Below 30 km, other phenomena could be invoked to explain the disagreements. At high latitude the presence of solid polar aerosols induces an artifact in the data reduction. At midlatitude, large increases observed in the NO3 concentration profiles obtained between 1992 and 1994 are real. A speculative hypothesis involving volcanic aerosols is proposed.
1. Introduction
The nitrate radical (NO3) exerts a significant influence on the chemistry of the stratosphere. It is formed at night by reaction of NO2 with ozone. Through its subsequent reaction with NO2, it is a source of N205. It therefore controls the active nitrogen partitioning as well as the denoxification processes since heterogeneous hydrolysis of N205 leads to the depletion of NOx and to the increase of HNO3.
Since the first measurements of NO3 [Noxon et at., 1978], there have been a number of studies of NO3 column amounts at mid and high latitude using the Moon as light source [Norton and Noxon, 1986; Sanders et at., 1987; Solomon et at., 1993; Lal et at., 1993; Aliwett and Jones, 1996a; Wagner e! at., 2000]. Vertical profiles of NO3 have been inferred from ground-based measurements [Smith and Solomon, 1990; Smith et at., 1993] and from the balloon- borne instruments using planets or stars as light sources [Naudet et at., 1989; Renard et at., 1996]. The ground- based measurements of columns permit the retrieval of only the general shape of the profiles, using some a priori hypotheses. On the other hand, the balloon-borne
Copyright 2001 by the American Geophysical Union.
Paper number 2001JD000361. 0148-0227/01/2001JD000361509.00
measurements, with a vertical resolution down to aroundol km, allow access to altitude-dependent variations of concentrations.
Differences between ground-based measurements of the NO3 column at different locations and model simulations have been pointed out. Norton and Noxon [1986] implied an unknown scavenging process to explain the results. In fact, they can be due to vapor water interference [e.g., Solomon et at., 1989]. However, similar new measurements performed by Atiwett and Jones [1996b] at midlatitudes in the Northern Hemisphere show a relatively good agreement with simulated columns taking into account the more recent rate and equilibrium constants and the uncertainties in these values. While Pirre et al.
[1989] showed a good agreement between measured and simulated vertical profiles assuming rather large uncertainties in measurements, Renard et al. [1996] observed an excess of NO3 in the 23-27 km and 37-39 km ranges on October 16, 1993.
The aim of this paper is to reexamine the consistency between modeling calculations and new measurements by using the rate constants of DeMote et at. [1997] and NO3 vertical profiles measured during seven stratospheric balloon flights from 1992 to 1999 at mid and high latitudes. These measurements were made with the
Absorption par les Minoritaires Ozone et NOx (AMON) instrument and by the Spectroscopie d'Absorption Lunaire pour l'Observation des Minoritaires Ozone et NOx
32,387
32,388 RENARD ET AL.: STRATOSPHERIC NOa 1N THE NORTHERN HEMISPHERE
(SALOMON) instrument. Model studies have been performed using the MicroPhysical Lagrangian Stratospheric Model of Ozone (MiPLaSMO) described by Rivibre et al. [2000] in a zero-dimensional version.
The method of observation and the NO3 retrieval will be presented first. Then, after describing the .NO3 chemistry, the measurements will be compared to modeling outputs. Finally, the results will be discussed, emphasizing the measurements performed in presence of aerosols.
2. Experimental Data
2.1. Description of Instruments and Experiments
NO3 vertical profiles have been obtained since 1980 by three nighttime balloon-borne UV-visible spectrometers developed in the French Laboratoire de Physique et Chimie de l'Environnement (LPCE). The first two instruments, Compos6s Minoritaires Stratosph6riques (CMS) and AMON, were installed on board the stabilized platform of the Geneva Observatory, devoted to nighttime measurements. Observations were performed using the stellar occultation method, which consists in analyzing the modification of a setting star spectrum (or a planet for four CMS flights) induced by atmospheric species [e.g., Renard et al., 1996, 1998].
CMS was an instrument used between 1980 and 1985, and five vertical profiles were obtained. Variations were observed in the slant column densities profiles, but because of the poor sensitivity of instrument it was not possible to distinguish between possible instrumental errors and real intrinsic altitude-dependent structures of NO3. Then the data were smoothed, giving a vertical resolution of 2 km. In order to more precisely investigate the altitude variation of stratospheric NO2 and NO3, a more accurate instrument, AMON, has been developed. It uses a CCD camera as a detector and has operated satisfactorily since 1992. Absorption lines of 10 -3 in optical depth can be detected, which is theoretically well suited for low concentrations of NO3. The vertical resolution is around 1 km in the lower stratosphere and a few hundreds of meters in the middle stratosphere. This instrument also allows one to obtain the vertical profiles of ozone and NO2 and to retrieve the wavelength dependence of the extinction coefficient of aerosols. Five vertical profiles were obtained by this instrument.
The third instrument, SALOMON uses the Moon as light source. This instrument, which measures the same
species as AMON, is 10 times more sensitive, but the vertical resolution is between 1 and 2 km due to the
apparent size of the Moon. SALOMON has operated successfully since 1998.
The NO3 profiles obtained by CMS have been already published by Naudet et al. [1989] and will not be presented here. Nevertheless, they will be discussed in the following. The NO3 contribution was found on five successful flights Of AMON. Three flights were performed at midlatitude in 1992, 1993, and 1994, and the two other flights were performed at high latitudes in 1997 and 1999. The technical flight of SALOMON, which occurred successfully on October 3i, 1998, at midlatitude [Renard et al., 2000] has also allowed a vertical profile of NO3 in the lower stratosphere (below 27 km) to be obtained. The second flight Of SALOMON was also performed at midlatitude in 1999 [Renard et al., 1999a]. Main characteristics of these seven flights are summarized in Table 1.
2.2. NO3 Retrieval
The description of the NO3 retrieval from balloon- borne measurements is given by Renard et al. [1996, 1999a, 2000]. Nevertheless, some specific points will be discussed here.
The transmission spectra, containing only the atmospheric spectral lines, are obtained by dividing the spectra recorded during the occultation by a reference spectrum obtained while the balloon is at the float altitude and the star or the Moon is a few degrees above the horizon. This method of measurements is "self-calibrating" since no hypothesis is needed concerning the absolute response of the instrument (the limitations are only those due to the spectral resolution and the detection limit of the detector).
The optical depth spectra used for the retrieval are obtained by taking the opposite of the logarithm of the transmission spectra. The Rayleigh contribution to the optical depth spectra is calculated using Bucholtz [1995] cross sections and standard temperature and pressure profiles for flights before 1995 and measurements of these parameters performed during the flights after 1995. The ozone contribution is searched for in the Chappuis band, using •he Bremen University cross sections measured by S. Voigt, J. Orphal, and J.P. Burrows (available at web site www.iup.physik.uni-bremen.de/gruppen/molspec/). After subtracting the ozone and Rayleigh contributions, one can expect the remaining spectral structures to be only due to NO3.
Table 1. Float Altitude, Date, and Mean Universal Time of the Measurements Performed by AMON and SALOMON at Mid and High Latitudes
Midlatitude Flights Aire-sur l'Adour (44øN, 0øE)
High-Latitude Flights Esrange/Kiruna (68øN, 21 øE)
Instrument Float Altitude, km Date Hour, UT Float Altitude, km Date Hour, UT
AMON 39 May 24, 1992 0100 AMON 39 Oct. 16, 1993 0100
AMON 34 March 24, 1994 2230
SALOMON 27 Oct. 31, 1998 0130
SALOMON 32 April 28, 1999 0330
31 Feb. 26, 1997 2200 29 Feb. 12, 1999 0030
RENARD ET AL ß STRATOSPHERIC NO3 IN THE NORTHERN HEMISPHERE 32,389
NO3 exhibits two strong (and wide) lines, at 623 nm and at 662 nm. The first one cannot be easily used since it is partly overlapped by an oxygen line that has a similar shape which can lead to an overestimation of the NO3 contribution [Renard et al., 1999a]. Thus the spectral domain for the retrieval must be reduced to 650-670 nm, including the 662-nm line, which is the stronger of the two. The same spectral domain is used by Weaver et al. [1996] for ground-based measurements.
Improvements in the data reduction algorithm have been done, in addition to the one reported by Renard et al. [1996]. First, the Bremen University ozone cross sections used in the present work are spectrally more accurate than those used in the1996 paper. Second, ozone retrieval is performed in a larger spectral window, leading to more accurate slant column values. Finally, new NO• cross sections, measured at 243 K by the Bremen University group (B. Deters and J.P. Burrows, private communication, 2000), have been used. These cross sections are among those more recently measured, and they will be used for the analysis of the Scanning Imaging Absorption Spectrometer for Atmospheric Chartography (SCIAMACHY) observations, performed on board the European satellite Envisat (launch expected in 2002) dedicated to atmospheric measurements. We have chosen to use these cross sections since they exhibit a spectral resolution similar to the theoretical resolution of AMON and SALOMON.
A least squares fit between the observed optical depth spectra and the cross sections is performed in order to retrieve the NO3 slant column density for each line of sight. Compared with the previously published results for the AMON October 1993 flight, the new cross sections for Rayleigh scattering and ozone lead to changes of <20% in the absolute value, while the general shape of slants column densities profile (and thus of the vertical profile) is similar.
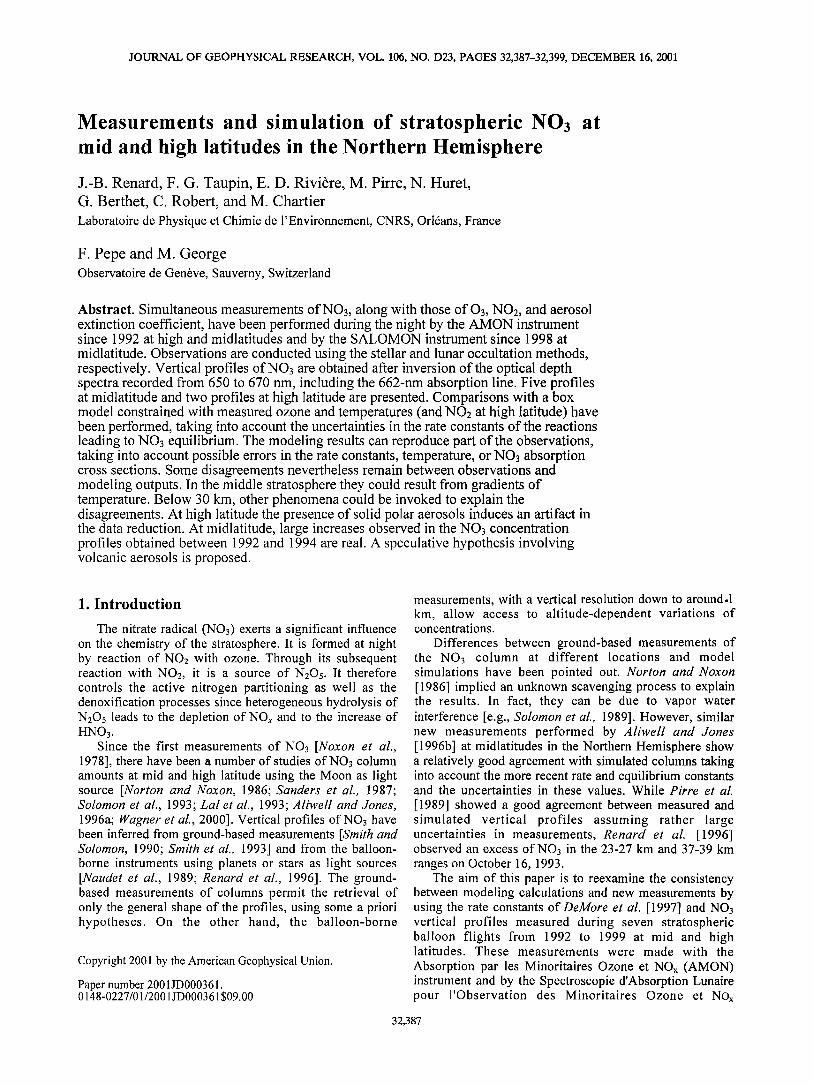
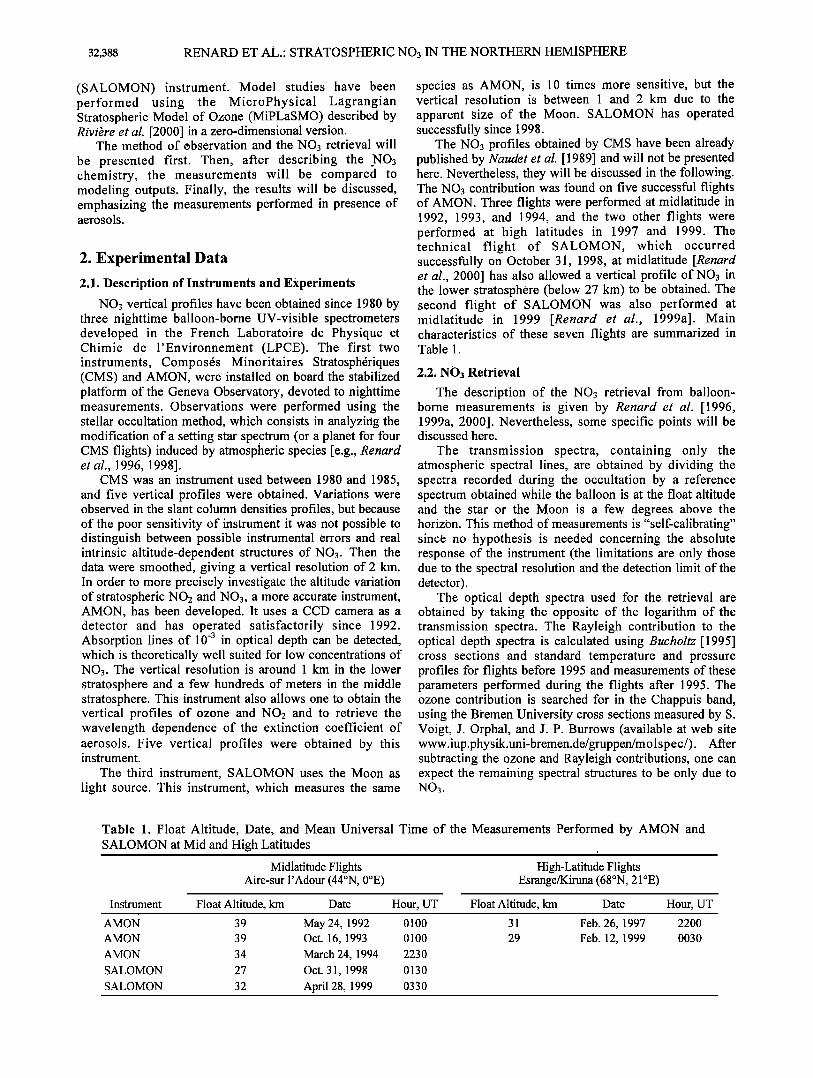
Figures 1 and 2 present examples of residual transmission spectra due to NO3 absorption for AMON and SALOMON measurements, respectively. These spectra
Elevation: -4.5
0.350 .......... • ......... , ..................
0.345
.,.•
.,.•
• 0.340
0.335
0.330 ...................................... •3 640 650 660 670 80
Wavelength (nm)
Figure 1. Transmission spectrum recorded by AMON at midlatitude on March 24, 1994, with star elevation of-4.5 ø (solid line) and comparison with a least squares fit using Bremen University cross sections (dashed line).
Elevation: -0.83 ø
0.975 ......................................
0.970
0.965
0.960
0.955
0.950 , , , , ,• • , , ! ......... i ......... I .........
640 650 660 670 680
Wavelength (nrn)
Figure 2. Transmission spectrum recorded by SALOMON at midlatitude on April 28, 1999, with a Moon elevation of -0.8 ø (solid line) and comparison with a least squares fit (dashed line).
have been obtained after removal of the ozone and
Rayleigh contributions. It can be seen that there remains a slope due to the aerosol contribution, which is steeper for low lines of sight. The aerosols spectrum is a continuum and follows a 1/X •' law (with p > 0, close to 1) in the visible domain for background aerosols. In reality, in the case of AMON observations the residual optical depth spectra present a positive or negative slope, which varies from one spectrum to another. This is the consequence of the chromatic scintillation induced by the air mass motions and local temperature gradient. A careful analysis shows that the scintillation adds a sinusoidal-like signal to the optical depth spectra. Since the exposure time of the AMON spectrometer is long (>20 s), only sinusoids with low frequencies are observed. As a consequence, the added signal is monotonous on the NO3 restricted spectral domain. Practically, the contribution due to aerosols and scintillation can then be removed using only a fit following a 1/X law, which acts as a free corrective parameter.
In the case of SALOMON observations, there is no chromatic scintillation because of the apparent size of the Moon. Thus the aerosol contribution is searched for
continuously in the 400-700 nm spectral domain using a polynomial and not only in small spectral windows. Then, in the case of SALOMON observations, there is no need for a free parameter. Taking into account the aerosols contribution, there is a very good agreement between the observation and the fit, as seen in Figures 1 and 2.
2.3. Errors Calculations
Some flights were conducted under nominal conditions, while others were not. Nevertheless, the 662-nm NO3 line is always easily detected. The errors in the slant column densities are computed from the standard deviation. between the fit using the cross sections and the observed spectra. Since the instruments are self-calibrating due to the method of observation, errors arise only from the instrumental noise and the uncertainties in the cross sections. The retrieval of the slant column densities is
32,390 RENARD ET AL.' STRATOSPHERIC NO3 IN THE NORTHERN HEMISPHERE
stopped near the end of the occultation when the signal-to- noise ratio is below 2 (i.e., error in slant column densities >50%), thus avoiding noisy data that could affect the inversion procedure.
Under nominal conditions, errors in the NOs slant column densities are of the order of 10%. The errors
increase when flight conditions lead to a too low signal-to- noise ratio, which occurred once with AMON and once with SALOMON.
Technical problems with the pointing system for the AMON flight in 1999 at high latitude, as well as both the low flux of the star used and the low NOs concentrations, have led to signal-to-noise ratios smaller than 10, corresponding to slant column densities errors >10%. Retrieval has been performed using different spectral domains smaller than the nominal one. Since similar slant column densities results were obtained and since the
signal-to-noise ratio remains above 2, the values can be considered as acceptable.
In 1999, SALOMON measurements at float altitude during moonset were stopped because of sunrise; thus only a few measurements during occultation are available. Fortunately, all the measurements performed during the ascent of the balloon can be used. For this set of data the air mass factor was small since the Moon was > 10 ̧ above
the balloon horizon, leading to the slant column density values close to the detection limit of the instrument. Thus
the errors are greater for ascent data than for occultation data but remain below the 50% criterion.
Errors in the slant column densities could also appear when a good reference spectrum cannot be obtained during the flight. This was the case in 1994 with AMON and in 1998 with SALOMON.
The float altitude of the 1994 flight was 34 km, and the reference spectrum was obtained with a star elevation of only +1 ̧ . Thus the contribution of NO3 in the reference spectrum cannot be neglected and must be sought in order to add this contribution to the occultation spectra. Fortunately, there is no strong stellar line in this spectral
region. The general trend of the reference spectrum can then be fitted using a second-order polynomial. The difference between the spectrum in the 661-663 nm range and the fit can be attributed to the NO3 contribution. In this case, the contribution is equal to 2.11 1014 cm '2, which corresponds to 25% of the maximum slant column densities measured by AMON.
The 1998 SALOMON flight was a technical flight, and the float altitude was only 27 km. As for the 1994 AMON flight, the reference spectrum contains a NO3 contribution, thus leading to smaller absorption features in the optical depth spectra and hence larger errors in the retrieval. The Fraunhoffer lines of the moon spectra do not allow the direct estimation of the NO3 contribution in the reference spectrum. In this case, large negative values appear during the retrieval: the most negative value obtained provides an estimate of this contribution, or at least its lower limit [Renard et al., 2000]. Here the correction is equal to 4 1014 cm -2, which corresponds to 50% of the maximum of the slant column densities profile.
The contribution that is added to the transmission
spectra is important, but it acts, in fact, only as an offset (or a constant shift) on the slant column densities profile. In the inversion procedure (described in section 2.4), this offset does not significantly change the structure of the profile. In that case, the NO• absorption line is stronger on the transmission spectra, thus leading to a higher signal-to- noise ratio. Then this correction does not increase the error
range during the retrieval of the slant column densities.
2.4. Slant Column Densities and Vertical Distributions
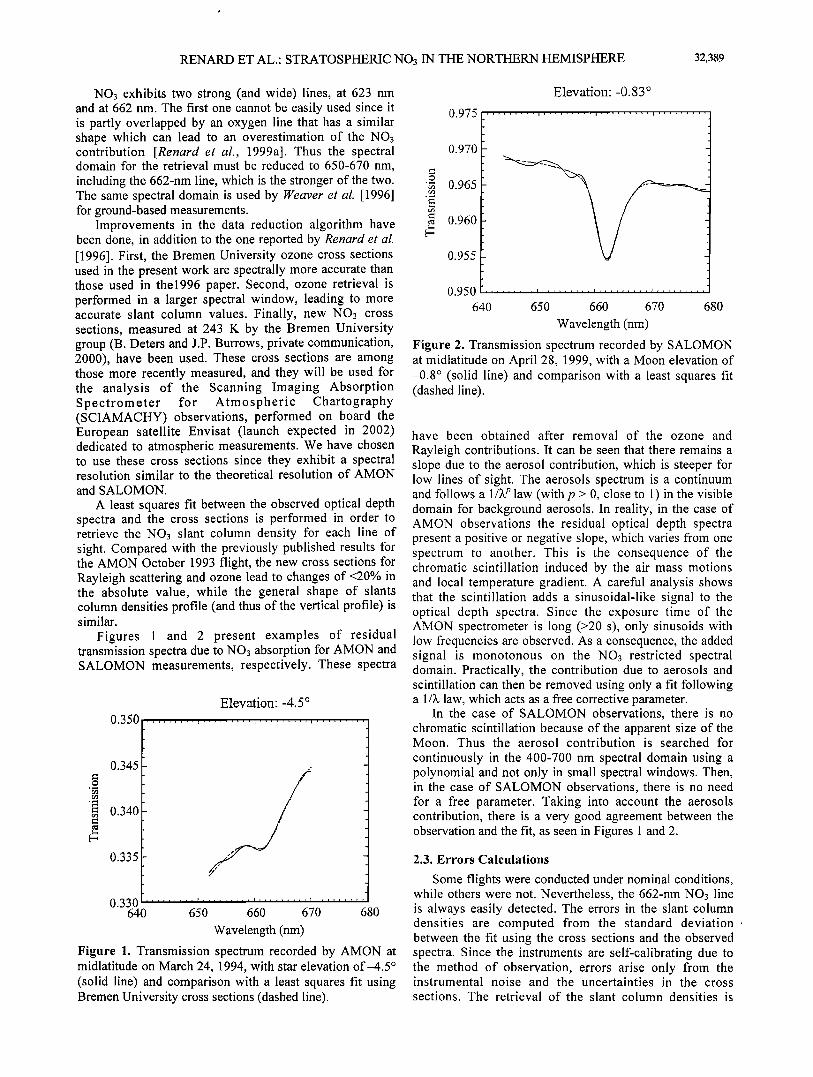
Three AMON flights are characterized by uncommon NC)3 fast slant column densities increases as a function of the star elevation. They are the 1993 and 1994 flights at midlatitude and the 1997 flight at high latitude AMON (Figure 3). Preliminary to the inversion process, we have to verify the consistency of these observations.
In 1993, three enhancements can be pointed out (Figure 3a). The first one is a small bump in the slant column
a) NO3: AMON 93
-6 -2x10¹⁴ 0 4x10 •4 8x10 •4 1.2x10 •
Slant column density (molec./cm 2)
b) NO3: AMON 94
-5
-2x10 •4 0 2x10¹⁴ 6x1014 lx10 t•
Slant column density (molec./cm 2)
4
½) NO3: AMON 97
2
,
,
-6 -2xiO :4 0 2xlO 14 4xlO TM 6xlO t4 8x
Slant column density (molec./cm 2)
Figure 3. NO3 slant column density versus elevation angle: (a) October 16, 1993, at midlatitude; (b) March 24, 1994, at midlatitude; (c) February 26, 1997, at high latitude.
014
RENARD ET AL.: STRATOSPHERIC NO3 IN THE NORTHERN HEMISPHERE 32,391
densities profile for lines of sight around +2 ø . The second one is displayed by a steep increase for lines of sight below -1 o. The last one is a strong bump for lines of sight below - 4 ø, i.e., at the end of the occultation. In 1994, one slant column density enhancement centered around -4 ø (Figure 3b) is observed.
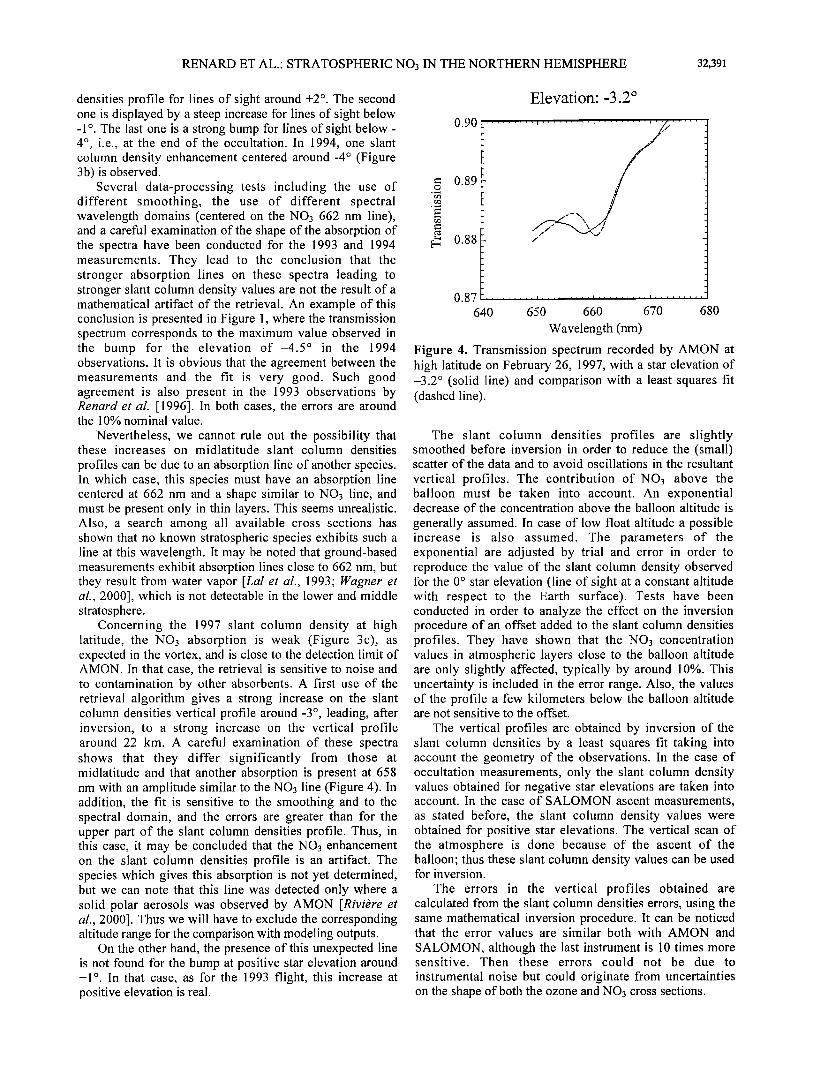
Several data-processing tests including the use of different smoothing, the use of different spectral wavelength domains (centered on the NO3 662 nm line), and a careful examination of the shape of the absorption of the spectra have been conducted for the 1993 and 1994 measurements. They lead to the conclusion that the stronger absorption lines on these spectra leading to stronger slant column density values are not the result of a mathematical artifact of the retrieval. An example of this conclusion is presented in Figure 1, where the transmission spectrum corresponds to the maximum value observed in the bump for the elevation of-4.5 ø in the 1994 observations. It is obvious that the agreement between the measurements and the fit is very good. Such good agreement is also present in the 1993 observations by Renard e! al. [1996]. In both cases, the errors are around the 10% nominal value.
Nevertheless, we cannot rule out the possibility that these increases on midlatitude slant column densities
profiles can be due to an absorption line of another species. In which case, this species must have an absorption line centered at 662 nm and a shape similar to NO3 line, and must be present only in thin layers. This seems unrealistic. Also, a search among all available cross sections has shown that no known stratospheric species exhibits such a line at this wavelength. It may be noted that ground-based measurements exhibit absorption lines close to 662 nm, but they result from water vapor [Lal et al., 1993; Wagner et al., 2000], which is not detectable in the lower and middle stratosphere.
Concerning the 1997 slant column density at high latitude, the NO3 absorption is weak (Figure 3c), as expected in the vortex, and is close to the detection limit of AMON. In that case, the retrieval is sensitive to noise and to contamination by other absorbents. A first use of the retrieval algorithm gives a strong increase on the slant column densities vertical profile around -3 ø , leading, after inversion, to a strong increase on the vertical profile around 22 kin. A careful examination of these spectra shows that they differ significantly from those at midlatitude and that another absorption is present at 658 nm with an amplitude similar to the NO3 line (Figure 4). In addition, the fit is sensitive to the smoothing and to the spectral domain, and the errors are greater than for the upper part of the slant column densities profile. Thus, in this case, it may be concluded that the NO3 enhancement on the slant column densities profile is an artifact. The species which gives this absorption is not yet determined, but we can note that this line was detected only where a solid polar aerosols was observed by AMON [Riviare et al., 2000]. Thus we will have to exclude the corresponding altitude range for the comparison with modeling outputs.
On the other hand, the presence of this unexpected line is not found for the bump at positive star elevation around +1 ø. In that case, as for the 1993 flight, this increase at positive elevation is real.
Elevation: -3.2 ø
0.90
0.87 ...... ,,.i ......... ! ......... i .........
640 650 660 670 680
Wavelength (rim)
Figure 4. Transmission spectrum recorded by AMON at high latitude on February 26, 1997, with a star elevation of -3.2 ø (solid line) and comparison with a least squares fit (dashed line).
The slant column densities profiles are slightly smoothed before inversion in order to reduce the (small) scatter of the data and to avoid oscillations in the resultant
vertical profiles. The contribution of NO3 above the balloon must be taken into account. An exponential decrease of the concentration above the balloon altitude is
generally assumed. In case of low float altitude a possible increase is also assumed. The parameters of the exponential are adjusted by trial and error in order to reproduce the value of the slant column density observed for the 0 ø star elevation (line of sight at a constant altitude with respect to the Earth surface). Tests have been conducted in order to analyze the effect on the inversion procedure of an offset added to the slant column densities profiles. They have shown that the NO3 concentration values in atmospheric layers close to the balloon altitude are only slightly affected, typically by around 10%. This uncertainty is included in the error range. Also, the values of the profile a few kilometers below the balloon altitude are not sensitive to the offset.
The vertical profiles are obtained by inversion of the slant column densities by a least squares fit taking into account the geometry of the observations. In the case of occultation measurements, only the slant column density values obtained for negative star elevations are taken into account. In the case of SALOMON ascent measurements, as stated before, the slant column density values were obtained for positive star elevations. The vertical scan of the atmosphere is done because of the ascent of the balloon; thus these slant column density values can be used for inversion.
The errors in the vertical profiles obtained are calculated from the slant column densities errors, using the same mathematical inversion procedure. It can be noticed that the error values are similar both with AMON and
SALOMON, although the last instrument is 10 times more sensitive. Then these errors could not be due to
instrumental noise but could originate from uncertainties on the shape of both the ozone and NO3 cross sections.
32,392 RENARD ET AL.' STRATOSPHERIC NO3 IN THE NORTHERN HEMISPHERE
40
30
lO - --3-- - May 24,1992,0100UT
October 16, 1993, 0100 UT
_• ...... March 24, 1994, 2230 UT 0 • ......... I ......... I ......... 0 lx107 2x10⁷ 3 x10⁷
Concentration (molec./cm 3)
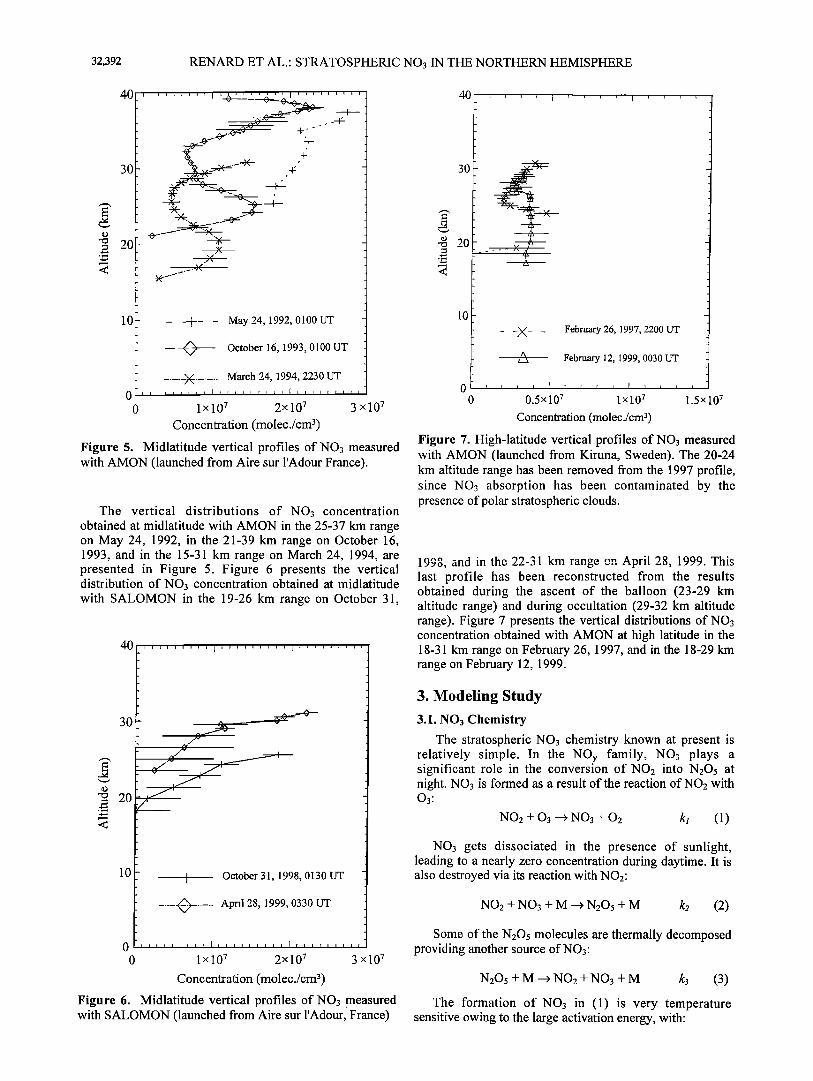
Figure 5. Midlatitude vertical profiles of NO3 measured with AMON (launched from Aire sur l'Adour France).
The vertical distributions of NO3 concentration obtained at midlatitude with AMON in the 25-37 km range on May 24, 1992, in the 21-39 km range on October 16, 1993, and in the 15-31 km range on March 24, 1994, are presented in Figure 5. Figure 6 presents the vertical distribution of NO3 concentration obtained at midlatitude with SALOMON in the 19-26 km range on October 31,
30
lO October 31, 1998, 0130 UT
.... • ..... April 28, 1999, 0330 UT
0 lx107 2x10⁷ 3x10⁷
Concentration (rnolec./cm 3)
Figure 6. Midlatitude vertical profiles of NO3 measured with SALOMON (launched from Aire sur l'Adour, France)
40
30
lO
February 26, 1997, 2200 UT
February 12, 1999, 0030 UT
0 0.5x107 lx107 1.5x10⁷
Concentration (molec./cm 3)
Figure 7. High-latitude vertical profiles of NO3 measured with AMON (launched from Kiruna, Sweden). The 20-24 km altitude range has been removed from the 1997 profile, since NO3 absorption has been contaminated by the presence of polar stratospheric clouds.
last profile has been reconstructed from the results obtained during the ascent of the balloon (23-29 km altitude range) and during occultation (29-32 km altitude range). Figure 7 presents the vertical distributions of NO3 concentration obtained with AMON at high latitude in the 18-31 km range on February 26, 1997, and in the 18-29 km range on February 12, 1999.
3. Modeling Study
3.1. NO3 Chemistry
The stratospheric NO3 chemistry known at present is relatively simple. In the NOy family, NO3 plays a significant role in the conversion of NO2 into N205 at night. NO3 is formed as a result of the reaction of NO2 with 03:
NO2 + 03 --> NO3 + 02 kj (1)
NO3 gets dissociated in the presence of sunlight, leading to a nearly zero concentration during daytime. It is also destroyed via its reaction with NO2:
NO2 + NO3 + M -• N205 + M k2 (2)
Some of the N205 molecules are thermally decomposed providing another source of NO3'
N205 + M -• NO2 + NO3 + M k3 (3)
The formation of NO3 in (1) is very temperature sensitive owing to the large activation energy, with:
RENARD ET AL ß STRATOSPHERIC NO3 IN THE NORTHERN HEMISPHERE 32,393
kj - 1.2 10 '•3 exp{-E/RT} cm 3 molecule '• s '1 E/R = 2450 + 150 [DeMore et al., 1997])
The reaction rate of the thermal decomposition of N205 in (3) is derived from the equilibrium constant k3:
k3 = k2/K K-2.7 10 '27 exp{ 11000(+500)/T} cm 3 molecule -•
Below •35 km, the stratospheric temperature is low enough so that the thermal decomposition of N205 is negligible. In this case, it is found from (1) and (2) that at equilibrium the NO3 concentration is only a function of the temperature, the ozone mixing ratio, and the air density [Sanders et al., 1987; Aliwell and dories, 1996b]. The time to reach equilibrium depends on the NO2 concentration. At midlatitudes, NO3 is close to equilibrium at the time of the AMON and SALOMON measurements performed several hours after sunset and is therefore independent of NO2. At high latitudes, where NO2 concentrations are much lower, NO3 is not always at equilibrium, and concentration at the time of measurements can depend on the NO2 concentration.
3.2. Model Description
MiPLaSMO is developed in order to study the microphysical and chemical properties of an air mass during its transport along an isentropic trajectory. In the present study, MiPlaSMO has been adapted to a box model version. The chemical code describes 41 species of the NOy, HOx, Cly, and Bry families. It takes into account 112 homogeneous reactions and 10 heterogeneous reactions. Kinetic and photochemical data was taken from DeMote e! al. [1997]. The numerical scheme of the chemical code is semi-implicit symmetric (SIS) [Ramaroson et al., 1992]. The box model calculates the concentration of different
active species relevant to the AMON and SALOMON flights in 1-km separated boxes.
As stated before, the temperature, NO2, and ozone concentrations are sensitive parameters for NO3 modeling. The O3 (and if necessary NO2) concentrations measured by AMON or SALOMON are then used to constrain the
model. When measured on board the gondola, the temperature is also used. In the other cases, average temperature values from other closest measurements, as discussed in the 3.3 section, is taken into account.
3.3. Model Conditions
Temperature and pressure, necessary for the modeling study, were measured on the gondola during the ascent of the balloon by a standard meteorological radiosonde only since 1998. In 1997, they were measured on the same day during an ozone-sounding performed close to the AMON flight site, at Sodankyla, •150 km from Kiruna. Such measurements were not available for the 1992, 1993, and 1994 flights. In these cases other measurements performed as closely as possible, in time and space, to the measurement locations have been sought, obtained, and used.
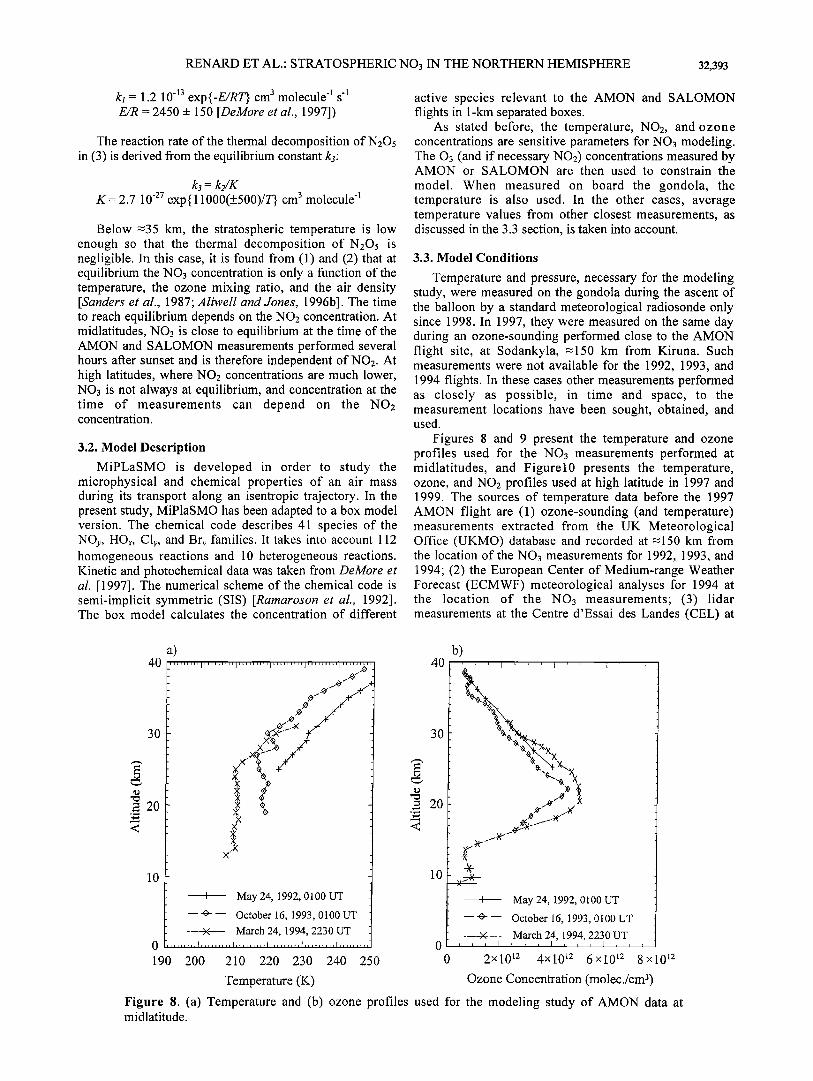
Figures 8 and 9 present the temperature and ozone profiles used for the NO3 measurements performed at midlatitudes, and Figure10 presents the temperature, ozone, and NO2 profiles used at high latitude in 1997 and 1999. The sources of temperature data before the 1997 AMON flight are (1) ozone-sounding (and temperature) measurements extracted from the UK Meteorological Office (UKMO) database and recorded at •150 km from the location of the NO3 measurements for 1992, 1993, and 1994; (2) the European Center of Medium-range Weather Forecast (ECMWF) meteorological analyses for 1994 at the location of the NO3 measurements; (3) lidar measurements at the Centre d'Essai des Landes (CEL) at
40
3O
,E 20
<
10
a)
¾
X-
,E 20
<
I May 24, 1992, 0100 UT
-- •- -- October 16, 1993, 0100 UT .... )< ..... March 24, 1994, 2230 UT
0 ......... I ......... I ......... • ......... • ......... • ......... 0
190 200 210 220 230 240 250 0
May 24, 199 • 0100 UT
--•- October 16, 1993, 0100 UT
....... .3<- ..... March 24, 1994, 2230 UT
2x10 •2 4x10 •2 6x10 •2 8x10 •2
Temperature (K) Ozone Concentration (molec./cm 3)
Figure 8. (a) Temperature and (b) ozone profiles used for the modeling study of AMON data at midlatitude.
32,394 RENARD ET AL.- STRATOSPHERIC NO3 IN THE NORTHERN HEMISPHERE
40
30
• 20
lO
a)
October 31, 1998, 0130 UT
.... O---- April 28, 1999, 0330 UT
......... I,,,,,,,,,I ..... •,,,I,,,,,,,,,I .... ,,,,,I,,,,,,,,,
200 210 220 230 240 250
Temperature (K)
b)
30
= 20
<
10
October 31, 1998, 0130 UT
..... O- .... April 28, 1999, 0330 UT
2x10¹² 4x10 TM 6 x10¹² 8 x10 •2
Ozone Concentration (molee./cm 3)
Figure 9. (a) Temperature and (b) ozone profiles used for the modeling study of SALOMON data at midlatitude.
Biscarosse, <50 km from the location of NO3 measurements, for 1992 and 1993 (P. Keckhut, personal communication, 2000); and (4) lidar measurements at the Haute Provence Observatory (OHP), =500 km from the location of NO3 measurements for 1993 and 1994 (F. Pinsard, personal communication, 2000). It should be noted that ECMWF data are available only below 10 hPa, while lidar data are available only above 10 hPa.
For the 1997, 1998, and 1999 (AMON and SALOMON) flights, temperature profiles have been interpolated each kilometer from the sounding measurements to be used in the modeling calculations. For the 1992, 1993, and 1994 flights, averaged profiles have
been constructed from all available measurements. They have also been interpolated each kilometer.
4. Results
4.1. Midlatitudes
A comparison between NO3 balloon-borne measurements and model outputs has already been published by Pirre et al [1989] concerning the CMS data and by Renard et al. [1996] concerning the AMON flight performed on the October 16, 1993. Although almost all the model outputs overlap or are close to the measurements, some discrepancies should be pointed out.
30
10
a) 40 [ ......... , ......... t ......... • ......... I ......... • ......... •
; February 26, 1997, 2200 UT
•-- February 12, 1999, 0030 UT
0 ..... '"'1 ......... I ......... t .... ,,,,,I ......... i ........
190 200 210 220 230 240 250
Temperatm'e (K)
40
3ok
20 •
lO
b)
I February 26, I997, 2200 UT
--O--- February 12, 1999, 0030 LIT
2x 10 •2 4x10 n 6 x10¹² 8 x10 '2 lx10 • 2x10 • 3 x10⁹
Ozone Concentration (molec./cm •)
c)
20
lo -]
t • February 12, 1999, 0030 UT 0 I' ......... • .......
o
NO 2 Concentration (molecYcm •)
Figure 10. (a) Temperature, (b) ozone, and (c) NO2 profiles used for the modeling study of AMON data at high latitude.
RENARD ET AL ß STRATOSPHERIC NO3 IN THE NORTHERN HEMISPHERE 32,395
a)
20
• AMON 93
.. MODEL (E/R=2600 '
10 MODEL iE/R=24501 MODEL (E/R=23501
0 lx10 7 2x10 7 3x10 7 4x10 7
Concentrahon (molec./cm 3)
40
30
20
b)
t_____2 AxMON 93
" MODEL (max. K)
10 MODEL (std. K) MODEL (min. K)
0 Ix10 7 2xl0 7 3x10 7
Concentration (molec./cm 3)
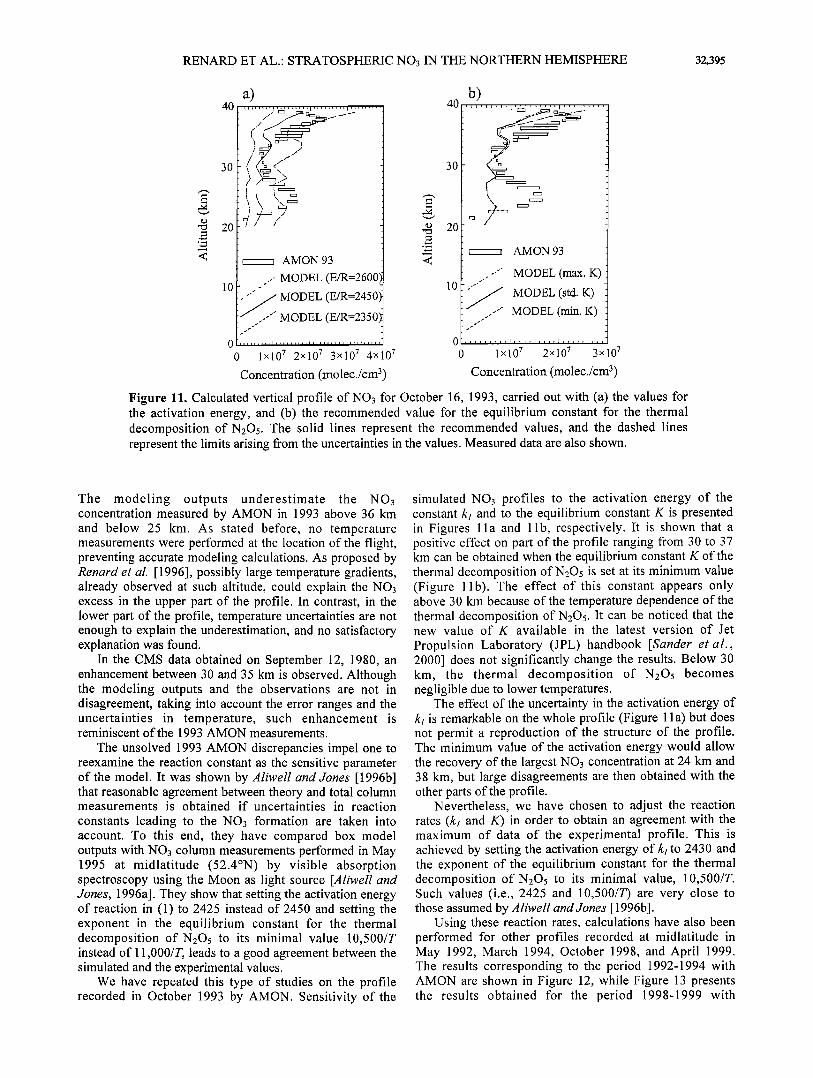
Figure 11. Calculated vertical profile of NO3 for October 16, 1993, carried out with (a) the values for the activation energy, and (b) the recommended value for the equilibrium constant for the thermal decomposition of N205. The solid lines represent the recommended values, and the dashed lines represent the limits arising from the uncertainties in the values. Measured data are also shown.
The modeling outputs underestimate the NO3 concentration measured by AMON in 1993 above 36 km and below 25 km. As stated before, no temperature measurements were performed at the location of the flight, preventing accurate modeling calculations. As proposed by Renard et al. [1996], possibly large temperature gradients, already observed at such altitude, could explain the NO3 excess in the upper part of the profile. In contrast, in the lower part of the profile, temperature uncertainties are not enough to explain the underestimation, and no satisfactory explanation was found.
In the CMS data obtained on September 12, 1980, an enhancement between 30 and 35 km is observed. Although the modeling outputs and the observations are not in disagreement, taking into account the error ranges and the uncertainties in temperature, such enhancement is reminiscent of the 1993 AMON measurements.
The unsolved 1993 AMON discrepancies impel one to reexamine the reaction constant as the sensitive parameter of the model. It was shown by Aliwell and Jones [1996b] that reasonable agreement between theory and total column measurements is obtained if uncertainties in reaction
constants leading to the NO3 formation are taken into account. To this end, they have compared box model outputs with NO3 column measurements performed in May 1995 at midlatitude (52.4øN) by visible absorption spectroscopy using the Moon as light source [Aliwell and Jones, 1996a]. They show that setting the activation energy of reaction in (1) to 2425 instead of 2450 and setting the exponent in the equilibrium constant for the thermal decomposition of N205 to its minimal value 10,500/T instead of 11,000/T, leads to a good agreement between the simulated and the experimental values.
We have repeated this type of studies on the profile recorded in October 1993 by AMON. Sensitivity of the
simulated NO3 profiles to the activation energy of the constant k/ and to the equilibrium constant K is presented in Figures 1 l a and 1 lb, respectively. It is shown that a positive effect on part of the profile ranging from 30 to 37 km can be obtained when the equilibrium constant K of the thermal decomposition of N205 is set at its minimum value (Figure 1 lb). The effect of this constant appears only above 30 km because of the temperature dependence of the thermal decomposition of N205. It can be noticed that the new value of K available in the latest version of Jet
Propulsion Laboratory (JPL) handbook [Sander et al., 2000] does not significantly change the results. Below 30 kin, the thermal decomposition of N205 becomes negligible due to lower temperatures.
The effect of the uncertainty in the activation energy of k/is remarkable on the whole profile (Figure 1 la) but does not permit a reproduction of the structure of the profile. The minilnum value of the activation energy would allow the recovery of the largest NO3 concentration at 24 km and 38 kin, but large disagreements are then obtained with the other parts of the profile.
Nevertheless, we have chosen to adjust the reaction rates (k• and K) in order to obtain an agreement with the lnaximum of data of the experimental profile. This is achieved by setting the activation energy of k• to 2430 and the exponent of the equilibrium constant for the thermal decomposition of N205 to its minimal value, 10,500/T. Such values (i.e., 2425 and 10,500/T) are very close to those assumed by Aliwel! and Jones [ 1996b].
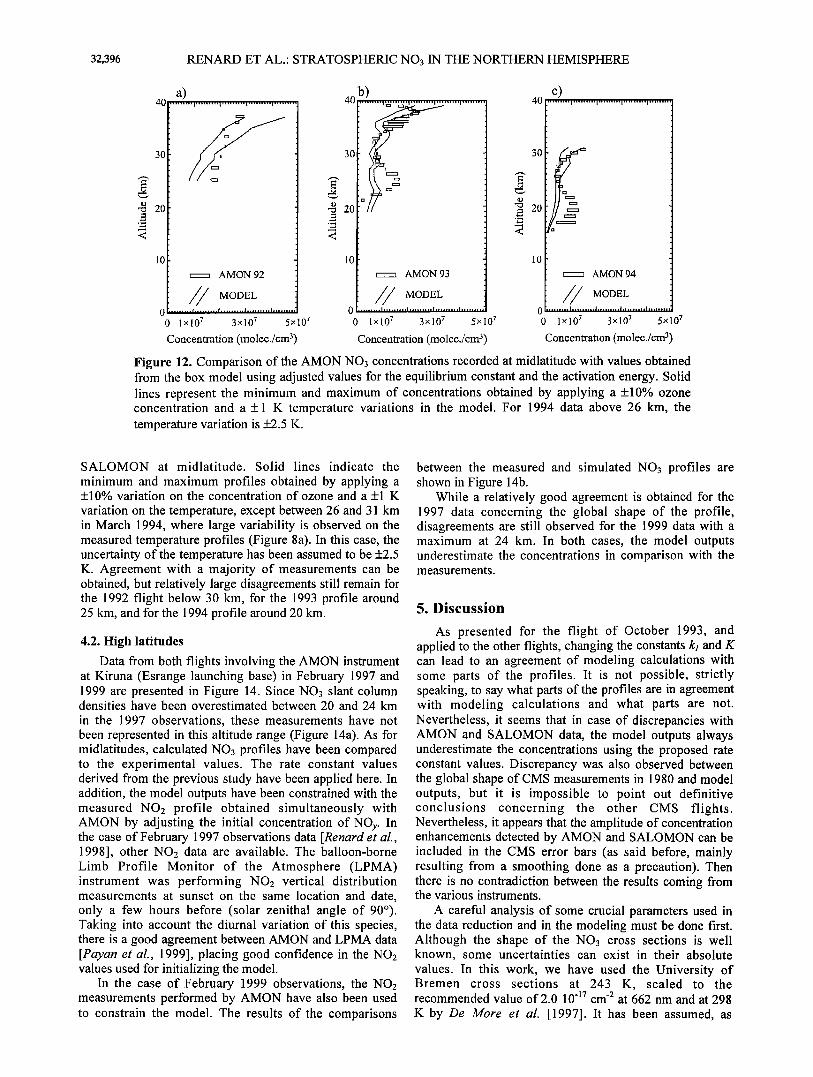
Using these reaction rates, calculations have also been performed for other profiles recorded at midlatitude in May 1992, March 1994, October 1998, and April 1999. The results corresponding to the period 1992-1994 with AMON are shown in Figure 12, while Figure 13 presents the results obtained for the period 1998-1999 with
32,396 RENARD ET AL.' STRATOSPHERIC NO3 IN THE NORTHERN HEMISPHERE
30
a) 40 ......... , ......... , ......... , ......... , .........
IO
• AMON 92
/ MODEL 0 •,1• .... I ......... I ......... I ......... I..1 ..... 0 lx107 3xl07 5x
Concentration (molec./cm •)
40
-8 20
10
b)
• AMON 93
/ MODEL 0 ii ...... I ......... II,ll,l,..Im,,. ..... I ...... ,..
0 lx107 3x10⁷ 5x 07
Concentration (molec./cm •)
40
<
c) "''"'""!'""" .... !"""'"'!' ........ I"'""' ....
• AMON 94
/ MODEL 0 ,,,,,,,, I,,,,,,,,,I,,,,,,,,, I,,,, ,,,,,I,,,,,,,,, 0 lx107 3x10⁷ 5x10⁷
Concentration (molec./cm 3)
Figure 12. Comparison of the AMON NO3 concentrations recorded at midlatitude with values obtained from the box model using adjusted values for the equilibrium constant and the activation energy. Solid lines represent the minimum and maximum of concentrations obtained by applying a +10% ozone concentration and a + 1 K temperature variations in the model. For 1994 data above 26 km, the temperature variation is +2.5 K.
SALOMON at midlatitude. Solid lines indicate the
minimum and maximum profiles obtained by applying a +10% variation on the concentration of ozone and a +1 K
variation on the temperature, except between 26 and 31 km in March 1994, where large variability is observed on the measured temperature profiles (Figure 8a). In this case, the uncertainty, of the temperature has been assumed to be +2.5 K. Agreement with a majority of measurements can be obtained, but relatively large disagreements still remain for the 1992 flight below 30 km, for the 1993 profile around 25 km, and for the 1994 profile around 20 km.
4.2. High latitudes
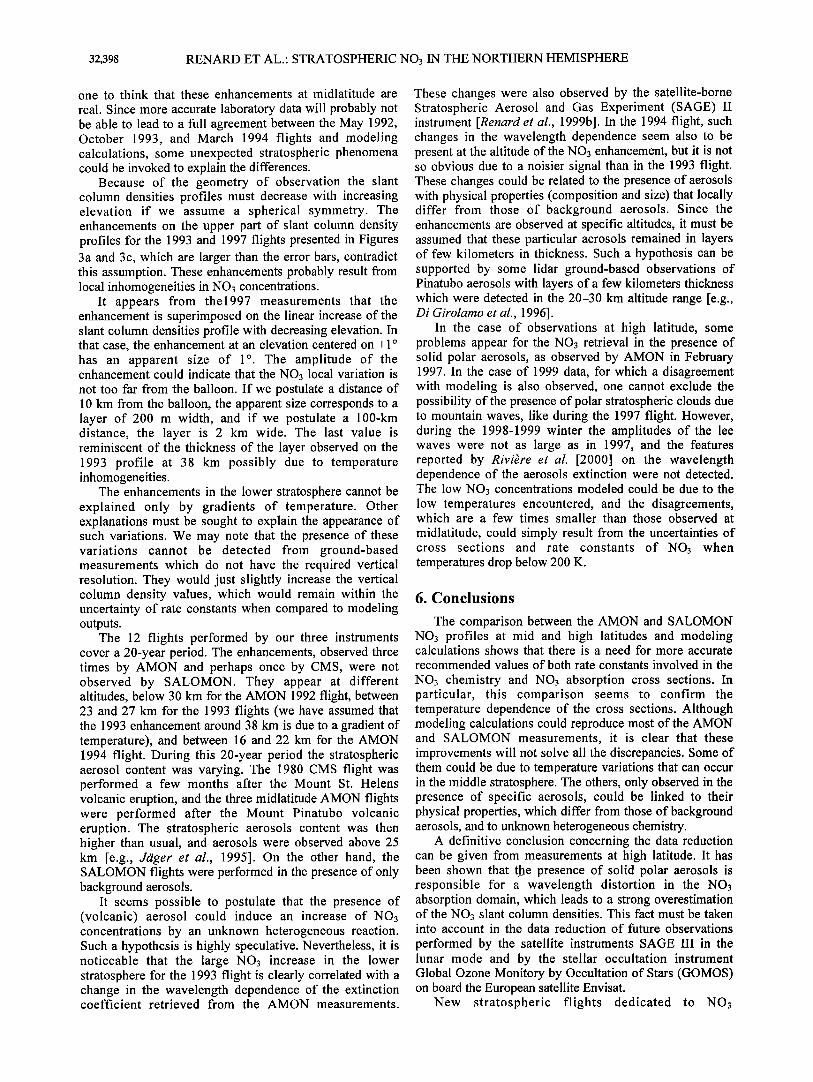
Data from both flights involving the AMON instrument at Kiruna (Esrange launching base) in February 1997 and 1999 are presented in Figure 14. Since NO3 slant column densities have been overestimated between 20 and 24 km
in the 1997 observations, these measurements have not been represented in this altitude range (Figure 14a). As for midlatitudes, calculated NO3 profiles have been compared to the experimental values. The rate constant values derived from the previous study have been applied here. In addition, the model outputs have been constrained with the measured NO2 profile obtained simultaneously with AMON by adjusting the initial concentration of NOy. IN the case of February 1997 observations data [Renard et at., 1998], other NO2 data are available. The balloon-borne Limb Profile Monitor of the Atmosphere (LPMA) instrument was performing NO2 vertical distribution measurements at sunset on the same location and date, only a few hours before (solar zenithal angle of 90ø). Taking into account the diurnal variation of this species, there is a good agreement between AMON and LPMA data [Payan et at., 1999], placing good confidence in the NO2 values used for initializing the model.
In the case of February 1999 observations, the NO2 measurements performed by AMON have also been used to constrain the model. The results of the comparisons
between the measured and simulated NO3 profiles are shown in Figure 14b.
While a relatively good agreement is obtained for the 1997 data concerning the global shape of the profile, disagreements are still observed for the 1999 data with a maximum at 24 km. In both cases, the model outputs u_n_derestimate the cnncentration.q in compariso_n_ with the measurements.
5. Discussion
As presented for the flight of October 1993, and applied to the other flights, changing the constants k/and K can lead to an agreement of modeling calculations with some parts of the profiles. It is not possible, strictly speaking, to say what parts of the profiles are in agreement with modeling calculations and what parts are not. Nevertheless, it seems that in case of discrepancies with AMON and SALOMON data, the model outputs always underestimate the concentrations using the proposed rate constant values. Discrepancy was also observed between the global shape of CMS measurements in 1980 and model outputs, but it is impossible to point out definitive conclusions concerning the other CMS flights. Nevertheless, it appears that the amplitude of concentration enhancements detected by AMON and SALOMON can be included in the CMS error bars (as said before, mainly resulting from a smoothing done as a precaution). Then there is no contradiction between the results coming from the various instruments.
A careful analysis of some crucial parameters used in the data reduction and in the modeling must be done first. Although the shape of the NO3 cross sections is well known, some uncertainties can exist in their absolute values. In this work, we have used the University of Bremen cross sections at 243 K, scaled to the recommended value of 2.0 10 '17 cm -2 at 662 nm and at 298 K by De More et at. [1997]. It has been assumed, as
RENARD ET AL.- STRATOSPHERIC NO3 IN THE NORTHERN HEMISPHERE 32,397
a) 40 ......... , ......... • ......... I ......... , ......... 40 ......... , ......... • ......... • ......... ,
3O
o 20
10 • SALOMON 98
/••/ MODEL 0 ,,,,,,,, ,,, ...... 1 ......... t ......... I ........ 0 1x10 7 3x10 7 5xl0 7
Concentration (molec./cm 3)
30
i0 r• SALOMON 99
/•/ MODEL ,,,,,,•,, ,•,,,,,•,1,,,•,,,,I,,,,,,•,,I,,,,,,,,
0 lx10 7 3x10 7 5x10 7
Concentration (molec./cm 3)
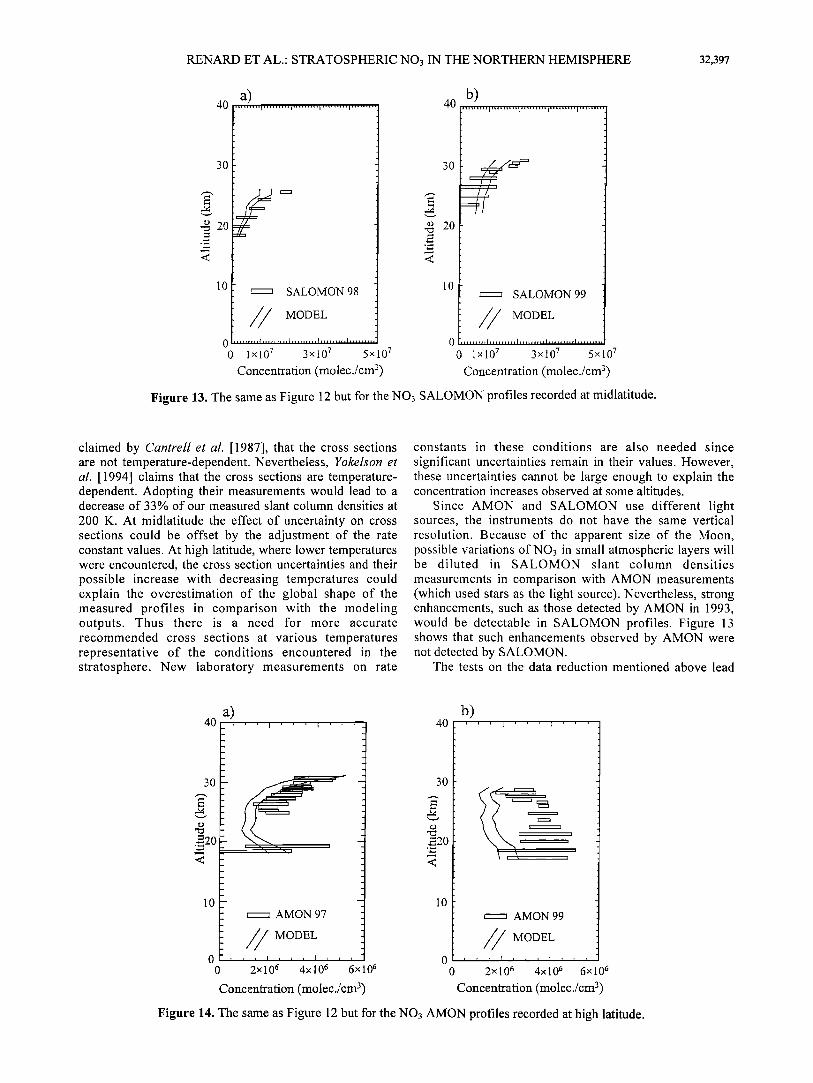
Figure 13. The same as Figure 12 but for the NOs SALOMON profiles recorded at midlatitude.
claimed by Cantrell et al. [1987], that the cross sections are not temperature-dependent. Nevertheless, Yokelson et al. [1994] claims that the cross sections are temperature- dependent. Adopting their measurements would lead to a decrease of 33% of our measured slant column densities at
200 K. At midlatitude the effect of uncertainty on cross sections could be offset by the adjustment of the rate constant values. At high latitude, where lower temperatures were encountered, the cross section uncertainties and their possible increase with decreasing temperatures could explain the overestimation of the global shape of the measured profiles in comparison with the modeling outputs. Thus there is a need for more accurate recommended cross sections at various temperatures representative of the conditions encountered in the stratosphere. New laboratory measurements on rate
constants in these conditions are also needed since
significant uncertainties remain in their values. However, these uncertainties cannot be large enough to explain the concentration increases observed at some altitudes.
Since AMON and SALOMON use different light sources, the instruments do not have the same vertical resolution. Because of the apparent size of the Moon, possible variations of NOs in small atmospheric layers will be diluted in SALOMON slant column densities
measurements in comparison with AMON measurements (which used stars as the light source). Nevertheless, strong enhancements, such as those detected by AMON in 1993, would be detectable in SALOMON profiles. Figure 13 shows that such enhancements observed by AMON were not detected by SALOMON.
The tests on the data reduction mentioned above lead
30
E20
<
• AMON 97
/MODEL , I , , , I ,
2x10 6 4x10 6 6x 10 6
b)
10
0 0 0 0
r• AMON 99
/MODEL , r • I , , • I • ,
2x10 6 4x10 6 6x10 6
Concentration (molec./cm 3) Concentration (molec./cm 2)
Figure 14. The same as Figure 12 but for the NOs AMON profiles recorded at high latitude.
32,398 RENARD ET AL.: STRATOSPHERIC NO3 IN THE NORTHERN HEMISPHERE
one to think that these enhancements at midlatitude are real. Since more accurate laboratory data will probably not be able to lead to a full agreement between the May 1992, October 1993, and March 1994 flights and modeling calculations, some unexpected stratospheric phenomena could be invoked to explain the differences.
Because of the geometry of observation the slant column densities profiles must decrease with increasing elevation if we assume a spherical symmetry. The enhancements on the upper part of slant column density profiles for the 1993 and 1997 flights presented in Figures 3a and 3c, which are larger than the error bars, contradict this assumption. These enhancements probably result from local inhomogeneities in NO3 concentrations.
It appears from the1997 measurements that the enhancement is superimposed on the linear increase of the slant column densities profile with decreasing elevation. In that case, the enhancement at an elevation centered on +1 ø has an apparent size of 1 ø. The amplitude of the enhancement could indicate that the NO3 local variation is not too far from the balloon. If we postulate a distance of 10 km from the balloon, the apparent size corresponds to a layer of 200 m width, and if we postulate a 100-km distance, the layer is 2 km wide. The last value is reminiscent of the thickness of the layer observed on the 1993 profile at 38 km possibly due to temperature inhomogeneities.
The enhancements in the lower stratosphere cannot be explained only by gradients of temperature. Other explanations must be sought to explain the appearance of such variations. We may note that the presence of these variations cannot be detected from ground-based measurements which do not have the required vertical resolution. They would just slightly increase the vertical column density values, which would remain within the uncertainty of rate constants when compared to modeling outputs.
The 12 flights performed by our three instruments cover a 20-year period. The enhancements, observed three times by AMON and perhaps once by CMS, were not observed by SALOMON. They appear at different altitudes, below 30 km for the AMON 1992 flight, between 23 and 27 km for the 1993 flights (we have assumed that the 1993 enhancement around 38 km is due to a gradient of temperature), and between 16 and 22 km for the AMON 1994 flight. During this 20-year period the stratospheric aerosol content was varying. The 1980 CMS flight was performed a few months after the Mount St. Helens volcanic eruption, and the three midlatitude AMON flights were performed after the Mount Pinatubo volcanic eruption. The stratospheric aerosols content was then higher than usual, and aerosols were observed above 25 km [e.g., d•iger et el., 1995]. On the other hand, the SALOMON flights were performed in the presence of only background aerosols.
It seems possible to postulate that the presence of (volcanic) aerosol could induce an increase of NO3 concentrations by an unknown heterogeneous reaction. Such a hypothesis is highly speculative. Nevertheless, it is noticeable that the large NO3 increase in the lower stratosphere for the 1993 flight is clearly correlated with a change in the wavelength dependence of the extinction coefficient retrieved from the AMON measurements.
These changes were also observed by the satellite-borne Stratospheric Aerosol and Gas Experiment (SAGE) II instrument [Renerd et el., 1999b]. In the 1994 flight, such changes in the wavelength dependence seem also to be present at the altitude of the NO3 enhancement, but it is not so obvious due to a noisier signal than in the 1993 flight. These changes could be related to the presence of aerosols with physical properties (composition and size) that locally differ from those of background aerosols. Since the enhancements are observed at specific altitudes, it must be assumed that these particular aerosols remained in layers of few kilometers in thickness. Such a hypothesis can be supported by some lidar ground-based observations of Pinatubo aerosols with layers of a few kilometers thickness which were detected in the 20-30 km altitude range [e.g., Di Girolemo et el., 1996].
In the case of observations at high latitude, some problems appear for the NO3 retrieval in the presence of solid polar aerosols, as observed by AMON in February 1997. In the case of 1999 data, for which a disagreement with modeling is also observed, one cannot exclude the possibility of the presence of polar stratospheric clouds due to mountain waves, like during the 1997 flight. However, during the 1998-1999 winter the amplitudes of the lee waves were not as large as in 1997, and the features reported by Riviare et el. [2000] on the wavelength dependence of the aerosols extinction were not detected. The low NO3 concentrations modeled could be due to the low temperatures encountered, and the disagreements, which are a few times smaller than those observed at
midlatitude, could simply result from the uncertainties of cross sections and rate constants of NO3 when temperatures drop below 200 K.
6. Conclusions
The comparison between the AMON and SALOMON NO3 profiles at mid and high latitudes and modeling calculations shows that there is a need for more accurate
recommended values of both rate constants involved in the
NO3 chemistry and NO3 absorption cross sections. In particular, this comparison seems to confirm the temperature dependence of the cross sections. Although modeling calculations could reproduce most of the AMON and SALOMON measurements, it is clear that these improvements will not solve all the discrepancies. Some of them could be due to temperature variations that can occur in the middle stratosphere. The others, only observed in the presence of specific aerosols, could be linked to their physical properties, which differ from those of background aerosols, and to unknown heterogeneous chemistry.
A definitive conclusion concerning the data reduction can be given from measurements at high latitude. It has been shown that the presence of solid polar aerosols is responsible for a wavelength distortion in the NO3 absorption domain, which leads to a strong overestimation of the NO3 slant column densities. This fact must be taken into account in the data reduction of future observations
performed by the satellite instruments SAGE III in the lunar mode and by the stellar occultation instrument Global Ozone Monitory by Occultation of Stars (GOMOS) on board the European satellite Envisat.
New stratospheric flights dedicated to NO3
RENARD ET AL.: STRATOSPHER!C NO3 IN THE NORTHERN HEMISPHERE 32,399
measurements and simultaneous measurements of physical properties of aerosols (obtained from extinction, polarization and counting measurements) are needed. Data acquired in the near future from satellite-borne and balloon-borne instruments in the case of presence of background aerosols, and volcanic aerosols if an eruption occurs, will allow confirmation of the aerosol hypothesis proposed for the NO3 enhancements detected by AMON.
Acknowledgments. We would like to thank F. Pinsard and P. Keckhut in the Service d'A•ronomie du CNRS (Paris, France), who provided the temperature data obtained with Lidar measurements at the Haute Provence Observatory (OHP) and at Biscarosse, respectively. We thank all the members of the CNES launching team for the Aire sur l'Adour and Kiruna flights. We also thank the UKMO and NILU data centers for providing the temperature data obtained with ozone soundings at midlatitudes. The AMON and SALOMON instruments were funded by CNES. Flights were supported by French PNCA program, by CNES and by European contracts ENV4-CT97-0532 and ENV4-CT97-0524.
References
Aliwell, S. R., and R. L. Jones, Measurement of atmospheric NO3, 1, Improved removal of water vapor absorption features in the analysis for NO3, Geophys. Res. Lett., 23(19), 2585- 2588, 1996a.
Aliwell, S. R., and R. L. Jones, Measurement of atmospheric NO3, 2, Diurnal variation of stratospheric NO3 at mid latitudes, Geophys. Res. Lett., 23(19), 2589-2592, 1996b.
Bucholtz, A., Rayleigh-scattering calculation for the terrestrial atmosphere, Appl. Opt., 34, 2765-2773, 1995.
Cantrell, C. A., R. E. Davidson, R. E. Shetter, B. A. Anderson, and J. G. Calvert, The temperature invariance of the NO3 cross section in the 662 nm region, J. Phys. Chem., 91, 5858- 5863, 1987.
DeMore, W. B., S. P. Sander, D. M. Golden, R. F. Hampson, M. J. Kurylo, C. J. Howard, A. R. Ravishankara, C. E. Kolb, and M. J. Molina, Chemical kinetics and photochemical data for use in stratospheric modeling, in Evaluation 12, JPL Publ., 97-4, 1997.
Di Girolamo, P., G. Pappalardo, N. Spinelli, V. Berardi, and R. Velotta, Lidar observations of the stratospheric aerosol layer over southern Italy in the period 1991-1995, J. Geophys. Res., i01, 18,765-18,773, 1996.
J•iger, H., O Uchino, T. Nagai, T. Fujimoto, V. Freudenthaler, and F. Homburg, Ground-based remote sensing of the decay of the Pinatubo eruption cloud at three Northern Hemisphere sites, Geophys. Res. Lett., 22(5), 607-610, 1995.
Lal, M., J. S. Sidhu, S. R. Das, and D. K. Chakrabarty, Atmospheric NO3 observations over low-latitudes Northern Hemisphere during night, J. Geophys. Res., 98, 23,029- 23,037, 1993.
Naudet, J.P., P. Rigaud, and M. Pirre, Altitude distribution of stratospheric NO3, 1, Observations of NO3 and related species, d. Geophys. Res., 94, 6374-6382, 1989.
Norton, R. B., and J. F. Noxon, Dependence of stratospheric NO• upon latitude and season, J. Geophys. Res., 91, 5323-5330, 1986.
Noxon, J. F., R. B. Norton, and W. R. Henderson, Observation of atmospheric NO3, Geophys. Res. Lett., 5, 675-678, 1978.
Payan, S., C. Camy-Peyret, P. Joseck, T. Hawat, P. Pirre, J.-B. Renard, C. Robert, F. Lef•vre, H. Kansawa, and Y. Sasano, Diurnal and nocturnal distribution of stratospheric NO2 from solar and stellar occultation measurements: comparison with models and ILAS satellite measurements, J. Geophys. Res., 104, 21,585-21,593, 1999.
Pirre, M., R. Ramaroson, J.P. Naudet, and P. Rigaud, Altitude distribution of stratospheric NO3, 2, Comparison of observations with model, J. Geophys. Res., 94, 6383-6388, 1989.
Ramaroson, R. A., M. Pirre, and D. Cariolle, A box model for on- line computations of diurnal variation in a 1-D model: Potential for application in multidimensional cases, Ann. Geophys., •0(6), 416-428, 1992.
Renard, J.-B., M. Pirre, C. Robert, G. Moreau, D. Huguenin, and J. M. Russel III, Nocturnal vertical distribution of stratospheric 03, NO2 and NO3 from balloon measurements, J. Geophys. Res., i01, 28,793-28,804, 1996.
Renard, J.-B., M. Pirre, C. Robert, F. Lef•vre, E. Lateltin, B. Nozi•re, and D. Huguenin, Vertical distribution of nighttime stratospheric NO2 from balloon measurements: Comparison with models, Geophys. Res. Lett., 24, 73-76, 1997.
Renard, J.-B., M. Pirre, C. Robert, and D. Huguenin, The possible detection of OBrO in the stratosphere, J. Geophys. Res., 103, 25,383-25,395, 1998.
Renard, J.-B., M. Chartier, G. Berthet, C. Robert, M. Pirre, and F. G.-Taupin, A new light balloon-borne UV-visible spectrometer designed for night-time observations of stratospheric trace gas species, in Proceedings 14th ESA Symposium on European Rocket and Balloon Programmes and Related Research, Postdam, Germany, ESA Spec. Publ., SP-437, 101-104, 1999a.
Renard, J.-B., C. Brogniez, M. Pirre, C. Robert, M. Chartier, E. Rivi•re, and G. Berthet, Physical properties of aerosols retrieved from their extinction coefficient measured
continuously in the UV-visible domain, poster presented at 5th European Workshop on Stratospheric Ozone, Saint-Jean de Luz, France, Sept. 27 to Oct. 1, 1999b.
Renard, J.-B., M. Chartier, C. Robert, G. Chalumeau, G. Berthet, M. Pirre, J.P. Pommereau, and F. Goutail, SALOMON: A new light balloon-borne UV-visible spectrometer for night- time observations of stratospheric trace gas species, Appl. Opt., 39(3), 386-392, 2000.
Riviere, E. D., et al., Role of lee waves in the formation of solid polar stratospheric clouds: Case studies from February 1997, J. Geophys. Res., 105, 6845-6853, 2000.
Sander, S. P., et al., Chemical kinetics and photochemical data for use in the stratospheric modeling, in Evaluation 13, JPL Publ., 00-3, 2000.
Sanders, R. W., S. Solomon, G. H. Mount, M. W. Bates, and A. L. Schmeltekopf, Visible spectroscopy at McMurdo Station, Antarctica, 3, Observation of NO3, J. Geophys. Res., 92, 8339-8342, 1987.
Smith, J.P., and S. Solomon, Atmospheric NO3, 3, Sunrise disappearance and the stratospheric profile, J. Geophys. Res., 95, 13,819-13,827, 1990.
Smith, J.P., S. Solomon, R. W. Sanders, H. L. Miller, L. M. Perliski, J. G. Keys, and A. L. Schmeltekopf, Atmospheric NO3, 4, Vertical profiles at middle and polar latitudes at sunrise, J. Geophys. Res., 98, 8983-8989, 1993.
Solomon, S., H.L. Miller, J.P. Smith, R.W. Sanders, G.H. Mount, A.L. Schmeltekopf, and J.F. Noxon, Atmospheric NO3, 1, Measurements technique and the annual cycle at 40øN, J. Geophys. Res., 94, 11,041-11,048, 1989.
Solomon, S., J.P. Smith, R. W. Sanders, L. Perliski, H. L. Miller G. H. Mount, J. G. Keys, and A. L. Schmeltekopf, Visible and near-ultraviolet spectroscopy at McMurdo Station, Antarctica, 8, Observations of nighttime NO2 and NO3 from April to October 1991, J. Geophys. Res., 98, 993-1000, 1993.
Wagner, T., C. Otten, K. Pfeilsticker, I. Pundt, and U. Platt, DOAS moonlight observation of atmospheric NO3 in the Arctic winter, Geophys. Res. Lett., 27(21), 3441-3444, 2000.
Weaver, A., S. Solomon, R.W. Sanders, K. Arpag., and H.L. Miller Jr., Atmospheric NO3, 5, Off-axis measurements at sunrise: Estimates of tropospheric NO3 at 40øN, J. Geophys. Res., 101, 18,605-18,612, 1996.
Yokelson R. J., J. B. Burkholder, R. W. Fox, R. K. Talukdar, and A. R. Ravishankara, Temperature dependence of the NO3 absorption spectrum, J. Phys. Chem., 98, 13,144-13,150, 1994.
G. Berthet, M. Chartier, N. Huret, M. Pirre, J.-B. Renard, E. D. Rivi•re, C. Robert, and F. G. Taupin, Laboratoire de Physique et Chimie de l'Environnement, CNRS, 3A avenue de la Recherche Scientifique, F-45071 Orleans cedex 2, France (j brenard•cnrs-orle ans. fr)
M. George and F. Pepe, Observatoire de Gen•ve, 58 chemin des Maillettes, CH-1290 Sauverny, Switzerland.
(Received January 10, 2001; revised June 6, 2001; accepted August 1,2001.)


![To Identify the given inorganic salt[Ba(NO3)2] To Identify the ...](https://static.fdokumen.com/doc/165x107/63169e619076d1dcf80b7c23/to-identify-the-given-inorganic-saltbano32-to-identify-the-.jpg)