Classification of Single and Multiple Disturbances in Electric Signals
Lower-Stratospheric and Upper-Tropospheric Disturbances Observed by Radiosondesover Thailand during January 2000
SHIN-YA OGINO
Institute of Observational Research for Global Change, Japan Agency for Marine-Earth Science and Technology, Yokosuka, Japan
KAORU SATO
Department of Earth and Planetary Science, Graduate School of Science, The University of Tokyo, Tokyo, Japan
MANABU D. YAMANAKA
Institute of Observational Research for Global Change, Japan Agency for Marine-Earth Science and Technology, Yokosuka,and Graduate School of Science and Technology, Kobe University, Kobe, Japan
AKIRA WATANABE
Cluster of Science and Technology, Fukushima University, Fukushima, Japan
(Manuscript received 26 January 2004, in final form 28 February 2006)
ABSTRACT
Lower-stratospheric and upper-tropospheric disturbances over Thailand during 12–21 January 2000 werestudied using the Global Energy and Water Cycle Experiment (GEWEX) Asian Monsoon Experiment-Tropics (GAME-T) intensive rawinsonde observations with fine temporal sampling intervals of 3 h. Analy-sis was focused on the wind disturbances with a period shorter than about 10 days. Frequency spectrashowed three distinct peaks: a 1-day period above a height of 20 km, a near-inertial period around 19 and27 km, and periods of 2.5–9 days (or longer) in the height range of 12–17 km.
The wave with a 1-day period was interpreted as a diurnal tide. A comparison with the migrating tide inthe global-scale wave model showed that the observational results had larger amplitude and shorter verticalwavelength than the model. The difference between the observation and the model may be caused by thesuperposition of the nonmigrating tide.
The wave with the near-inertial period was interpreted as an internal inertial gravity wave. A hodographanalysis was performed in order to investigate the wave properties. It was found that the wave, whichappeared at a height around 19 km (just above the tropopause level), propagated southwestward with aground-based group velocity of about 1.4 m s�1.
The longer period disturbances, which appeared at heights of 12–17 km, had layered structures with thevertical scales of 2–4 km. They were considered to be due to inertial instability, based on the fact that thepotential vorticity of the background atmosphere was nearly zero and that their phase structures wereconsistent with theory. It was shown by a backward trajectory analysis that the air parcel with negativepotential vorticity had its origin in equatorial Indonesia. It was also shown by a forward trajectory analysisthat the air parcel was transported to the Pacific south of Japan. This is consistent with the existence ofsimilar layered disturbances that are shown using rawinsonde data at a station there.
1. Introduction
Gravity waves are important because they play anessential role in maintaining the mean structure of the
earth’s atmosphere by transporting momentum fromsources to sinks. Therefore, the global distribution ofmomentum flux associated with gravity waves must beknown in order to quantitatively understand global cir-culation. So far, many authors have tried to describe theglobal features of gravity waves. Meridional distribu-tions of wave amplitude have been studied by manyresearchers (Hirota 1984; Kitamura and Hirota 1989;Eckermann et al. 1995; Allen and Vincent 1995; Oginoet al. 1995, 1997, 1999a,b; Sato et al. 1999, 2003;
Corresponding author address: Shin-Ya Ogino, Institute of Ob-servational Research for Global Change, Japan Agency for Ma-rine-Earth Science and Technology, 2-15, Natsushima-cho, Yoko-suka 236-0061, Japan.E-mail: [email protected]
DECEMBER 2006 O G I N O E T A L . 3437
© 2006 American Meteorological Society
JAS3801
Yamamori and Sato 2006). Most of these authors stud-ied not only the meridional variation, but also altitudi-nal or seasonal variations, or both, of gravity waves.
They clarified many important features of gravitywave distribution. However, there have been many un-certainties regarding the global distribution of gravitywaves. Recently, satellite observations have revealedthe global distributions of gravity wave amplitude(Fetzer and Gille 1994, 1996; Wu and Waters 1996a,b;Tsuda et al. 2000). However, because these studieswere based on temperature data only, wave propertiessuch as wave frequency and propagation direction werenot studied, and therefore, the momentum transport bygravity waves could not be quantified. Therefore, it isstill important to describe the wave characteristics atvarious locations, especially at places where no obser-vational work has been conducted. Southeast Asia isone of the most important regions that has not beenstudied. This paper reports worthwhile results of thedescription of the wave characteristics at NongKhai(18°N, 103°E), Thailand, on the Indochina Peninsula inSoutheast Asia during 12–21 January 2000.
Descriptions about the rawinsonde observations anddata are given in section 2. In section 3, frequency spec-tra are calculated and the existence of the three types ofdisturbances is shown. In section 4, the three types ofdisturbances are interpreted as a diurnal tide, internalinertial gravity waves, and disturbances due to inertialinstability. Section 5 summarizes the results and dis-cusses the meaning of this work.
2. Observation and data
Six enhanced rawinsonde observation campaignswere conducted by the Global Energy and Water CycleExperiment (GEWEX) Asian Monsoon Experiment-Tropics (GAME-T) project from 1996 to 2000 in Thai-land and neighboring countries. Four of the six en-hanced observation campaigns were conducted in therainy season, while the remaining two were conductedin the dry season. Observation periods of the enhancedobservation campaigns were either about 2 or 4 weeks.During each campaign period, rawinsondes werelaunched 8 or 4 times a day (every 3 or 6 h) using theAtmospheric Instrumentation Research, Inc. (AIR) ra-diosonde system.
In this paper, the results obtained from the data inthe sixth campaign are described. The sixth campaignwas conducted for about 10 days during 12–21 January2000 at NongKhai (18°N, 103°E), which is located in thenortheastern part of Thailand and in the central part ofthe Indochina Peninsula (Fig. 1). During this campaign
period, rawinsondes were launched every 3 hours con-tinuously for about 10 days (Fig. 1). In this campaign,the data in the lower stratosphere and upper tropo-sphere were the most continuously obtained in timeand height among the six campaigns because balloonswith high resistance to a low-temperature conditionwere used so that the balloons would not burst near thetropopause height. This continuous and high-resolutiondata exhibits clear wavy structures in the lower strato-sphere and layered structures in the upper troposphere.
The original sampling interval in each sounding was10 s, which corresponds to a height interval of about 50m. The data obtained were linearly interpolated into50-m height intervals.
Additionally, the 6-hourly National Centers for En-vironmental Prediction (NCEP) reanalysis data and theGeostationary Meteorological Satellite (GMS) black-body temperature data were used for describing back-ground fields in relation to excitation sources of gravitywaves in section 4b. The 6-hourly NCEP reanalysis datawere also used for the calculation of the potential vor-ticity (PV) and for the backward trajectory analysis insection 4c. The twice-daily operational rawinsonde dataat Ishigakijima, Japan (24°N, 124°E), which is one ofthe most southern rawinsonde stations of the JapanMeteorological Agency (JMA), were also used to de-scribe the layered disturbances over the Pacific Oceansouth of Japan.
Figure 2 shows a time–height section of the meridi-onal wind obtained at NongKhai during the sixth en-hanced observation period. Clear wave structures arefound without any filtering procedure above and near
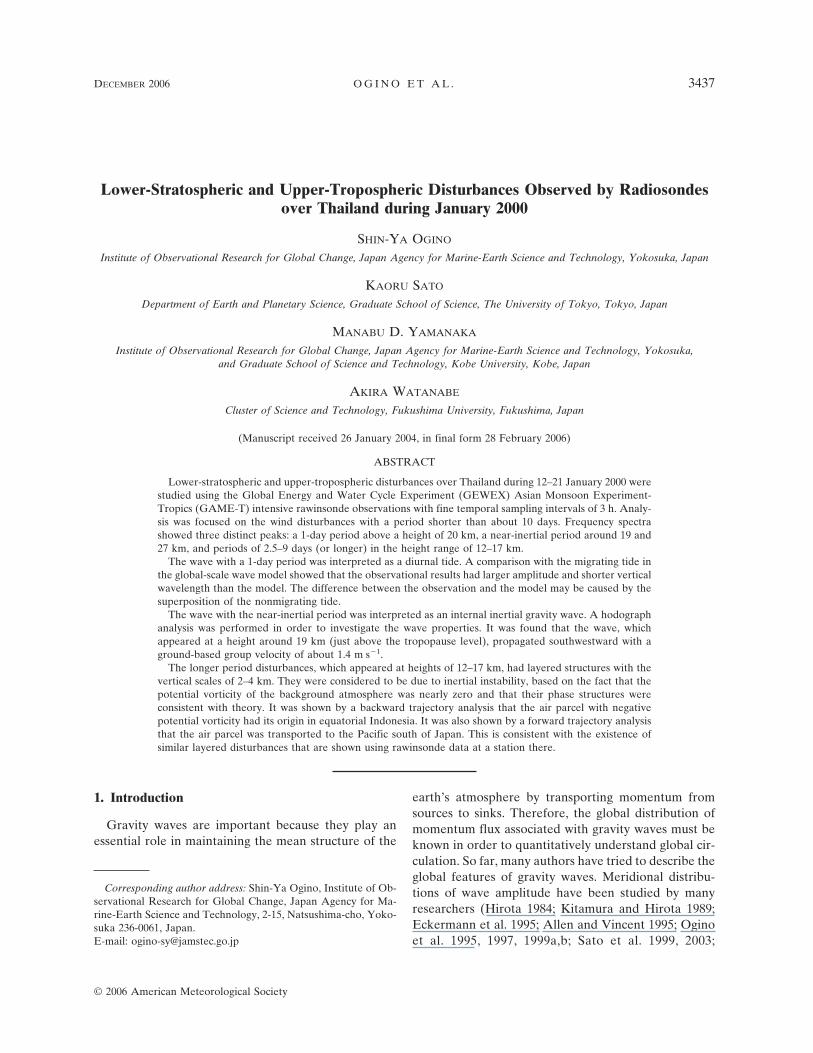
FIG. 1. A cross and plus sign denote the locations of NongKhai(18°N, 103°E) and Ishigakijima (24°N, 124°E), respectively. Con-tours show the NCEP geopotential height at 200 hPa and shadesshow the GMS blackbody temperature. Both are the mean valuesfor the whole observation period of 12–21 January 2000.
3438 J O U R N A L O F T H E A T M O S P H E R I C S C I E N C E S VOLUME 63
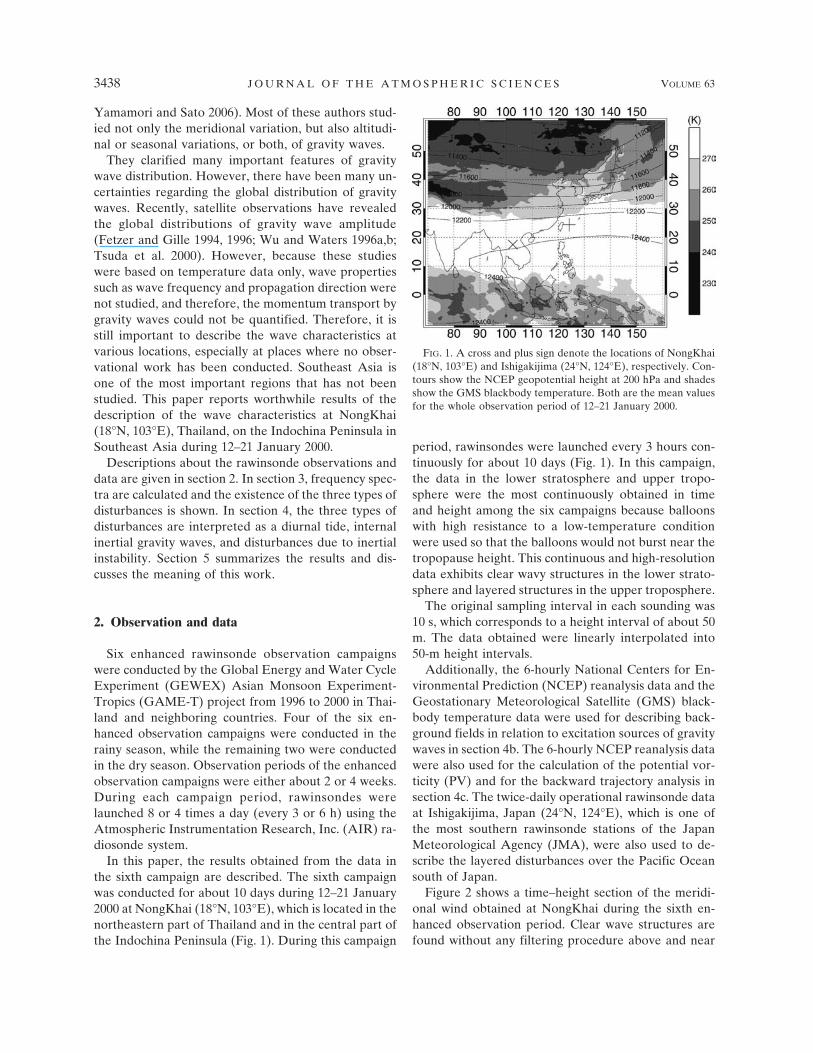
the tropopause, indicated by closed circles. Thesewaves show a downward phase progression, which sug-gests that they are internal waves and are energeticallypropagating upward. The waves seem to have differentstructures below and above a height of about 20 km.The waves above about 20 km have longer verticalwavelengths and faster downward phase velocities thanthe ones below this height. It will be shown in the nextsection that the waves above 20 km have a 1-day periodand those below 20 km have a period near the inertialperiod (�39 h at the latitude of 18°N).
Layered structures are seen in the upper troposphere(around 15 km) during the time period of 14–21 Janu-ary. This type of disturbance will be investigated insection 4c. The peak height of meridional wind wasmoving upward during 14–18 January and downwardduring 19–21 January. The former and latter periodcorrespond to the passages of synoptic-scale high andlow pressure systems, respectively.
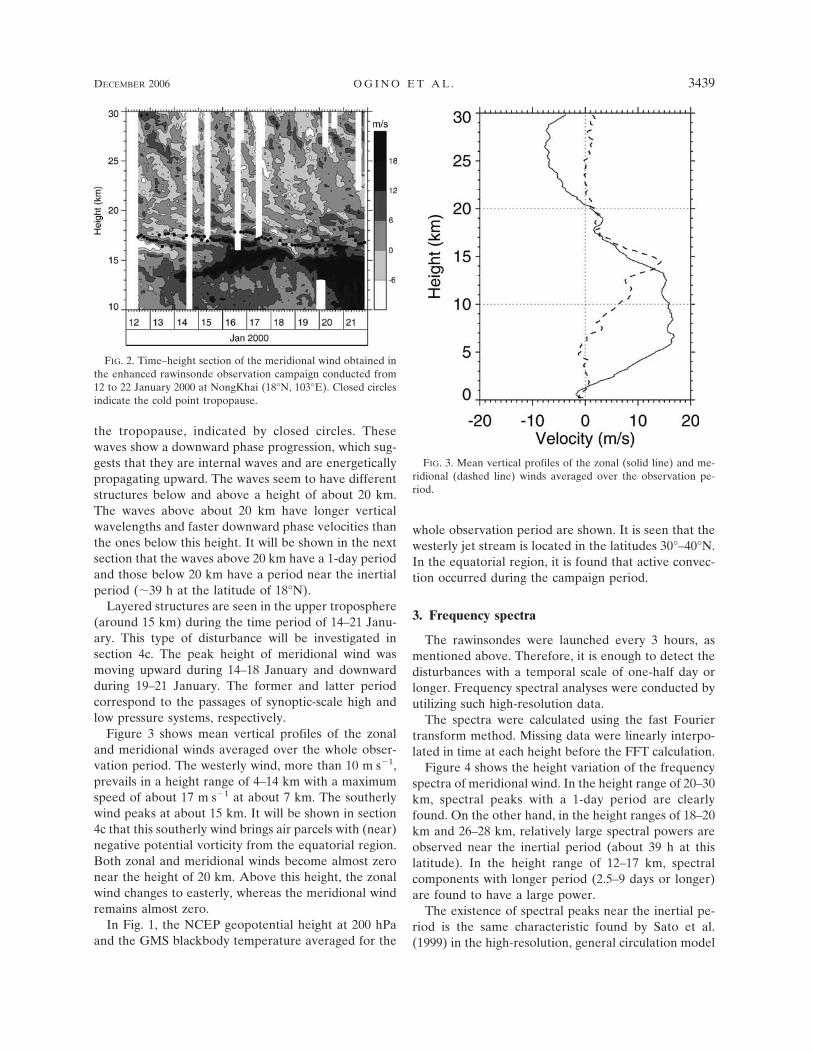
Figure 3 shows mean vertical profiles of the zonaland meridional winds averaged over the whole obser-vation period. The westerly wind, more than 10 m s�1,prevails in a height range of 4–14 km with a maximumspeed of about 17 m s�1 at about 7 km. The southerlywind peaks at about 15 km. It will be shown in section4c that this southerly wind brings air parcels with (near)negative potential vorticity from the equatorial region.Both zonal and meridional winds become almost zeronear the height of 20 km. Above this height, the zonalwind changes to easterly, whereas the meridional windremains almost zero.
In Fig. 1, the NCEP geopotential height at 200 hPaand the GMS blackbody temperature averaged for the
whole observation period are shown. It is seen that thewesterly jet stream is located in the latitudes 30°–40°N.In the equatorial region, it is found that active convec-tion occurred during the campaign period.
3. Frequency spectra
The rawinsondes were launched every 3 hours, asmentioned above. Therefore, it is enough to detect thedisturbances with a temporal scale of one-half day orlonger. Frequency spectral analyses were conducted byutilizing such high-resolution data.
The spectra were calculated using the fast Fouriertransform method. Missing data were linearly interpo-lated in time at each height before the FFT calculation.
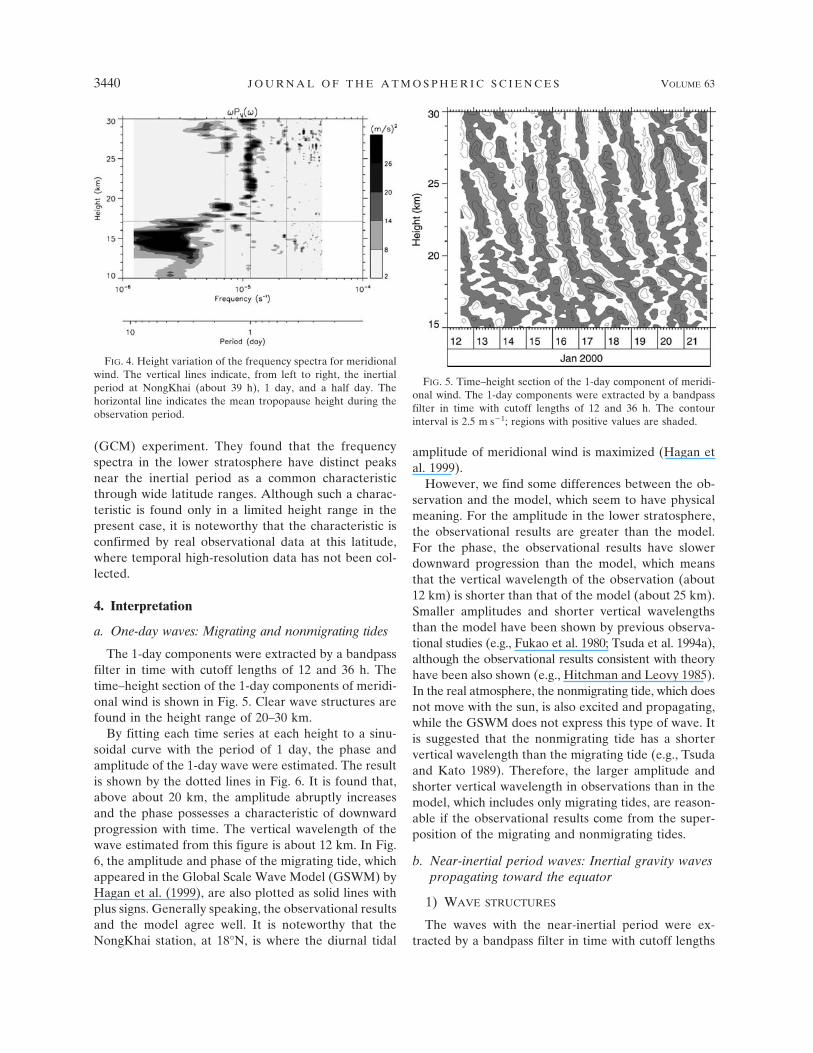
Figure 4 shows the height variation of the frequencyspectra of meridional wind. In the height range of 20–30km, spectral peaks with a 1-day period are clearlyfound. On the other hand, in the height ranges of 18–20km and 26–28 km, relatively large spectral powers areobserved near the inertial period (about 39 h at thislatitude). In the height range of 12–17 km, spectralcomponents with longer period (2.5–9 days or longer)are found to have a large power.
The existence of spectral peaks near the inertial pe-riod is the same characteristic found by Sato et al.(1999) in the high-resolution, general circulation model
FIG. 2. Time–height section of the meridional wind obtained inthe enhanced rawinsonde observation campaign conducted from12 to 22 January 2000 at NongKhai (18°N, 103°E). Closed circlesindicate the cold point tropopause.
FIG. 3. Mean vertical profiles of the zonal (solid line) and me-ridional (dashed line) winds averaged over the observation pe-riod.
DECEMBER 2006 O G I N O E T A L . 3439
(GCM) experiment. They found that the frequencyspectra in the lower stratosphere have distinct peaksnear the inertial period as a common characteristicthrough wide latitude ranges. Although such a charac-teristic is found only in a limited height range in thepresent case, it is noteworthy that the characteristic isconfirmed by real observational data at this latitude,where temporal high-resolution data has not been col-lected.
4. Interpretation
a. One-day waves: Migrating and nonmigrating tides
The 1-day components were extracted by a bandpassfilter in time with cutoff lengths of 12 and 36 h. Thetime–height section of the 1-day components of meridi-onal wind is shown in Fig. 5. Clear wave structures arefound in the height range of 20–30 km.
By fitting each time series at each height to a sinu-soidal curve with the period of 1 day, the phase andamplitude of the 1-day wave were estimated. The resultis shown by the dotted lines in Fig. 6. It is found that,above about 20 km, the amplitude abruptly increasesand the phase possesses a characteristic of downwardprogression with time. The vertical wavelength of thewave estimated from this figure is about 12 km. In Fig.6, the amplitude and phase of the migrating tide, whichappeared in the Global Scale Wave Model (GSWM) byHagan et al. (1999), are also plotted as solid lines withplus signs. Generally speaking, the observational resultsand the model agree well. It is noteworthy that theNongKhai station, at 18°N, is where the diurnal tidal
amplitude of meridional wind is maximized (Hagan etal. 1999).
However, we find some differences between the ob-servation and the model, which seem to have physicalmeaning. For the amplitude in the lower stratosphere,the observational results are greater than the model.For the phase, the observational results have slowerdownward progression than the model, which meansthat the vertical wavelength of the observation (about12 km) is shorter than that of the model (about 25 km).Smaller amplitudes and shorter vertical wavelengthsthan the model have been shown by previous observa-tional studies (e.g., Fukao et al. 1980; Tsuda et al. 1994a),although the observational results consistent with theoryhave been also shown (e.g., Hitchman and Leovy 1985).In the real atmosphere, the nonmigrating tide, which doesnot move with the sun, is also excited and propagating,while the GSWM does not express this type of wave. Itis suggested that the nonmigrating tide has a shortervertical wavelength than the migrating tide (e.g., Tsudaand Kato 1989). Therefore, the larger amplitude andshorter vertical wavelength in observations than in themodel, which includes only migrating tides, are reason-able if the observational results come from the super-position of the migrating and nonmigrating tides.
b. Near-inertial period waves: Inertial gravity wavespropagating toward the equator
1) WAVE STRUCTURES
The waves with the near-inertial period were ex-tracted by a bandpass filter in time with cutoff lengths
FIG. 4. Height variation of the frequency spectra for meridionalwind. The vertical lines indicate, from left to right, the inertialperiod at NongKhai (about 39 h), 1 day, and a half day. Thehorizontal line indicates the mean tropopause height during theobservation period.
FIG. 5. Time–height section of the 1-day component of meridi-onal wind. The 1-day components were extracted by a bandpassfilter in time with cutoff lengths of 12 and 36 h. The contourinterval is 2.5 m s�1; regions with positive values are shaded.
3440 J O U R N A L O F T H E A T M O S P H E R I C S C I E N C E S VOLUME 63

of 30 and 69 h. The meridional wind variation extractedby this filtering is shown in Fig. 7. Corresponding to thespectral peaks shown in Fig. 4, waves with verticalscales of 1–1.5 km around the 18-km height and thosewith vertical scales of 2–4 km around the 27-km heightare found. The wave properties were examined by ana-lyzing hodographs (e.g., Sato 1994; Sato et al. 2003).The result obtained from the wave around 18 km isshown below. Meaningful wave parameters could notbe analyzed for the waves around 27 km in height,probably because they are a mixture of other types ofdisturbances. Therefore, they are not discussed furtherin this paper.
An example of the hodographs for the waves around18 km is shown in Fig. 8. The hodograph is drawn withthe horizontal winds in the height range of 17.50–18.45km at 1200 UTC 17 January 2000 (Fig. 8). Additionalbandpass filtering in height with cutoff lengths of 0.5and 3.0 km was applied before performing thehodograph analysis in order to extract a monochro-matic structure more clearly. A clear elliptic rotation ofthe horizontal wind vector is found in Fig. 8. Since theshape of the hodograph ellipse did not greatly changefor several days, it is thought that the waves have thesame origin and the same propagation path during theobservation period. The wind vector rotates clockwisewith height, which indicates upward energy propaga-tion of the wave.
The vertical wavelength was estimated directly fromthe height difference of one elliptic cycle of thehodograph. The direction of the horizontal wavenum-ber vector was determined from the orientation of theellipse and the phase relationship between the wind and
FIG. 7. Time–height section of the near-inertial period compo-nents of meridional wind. The components were extracted by abandpass filter in time with cutoff lengths of 30 and 69 h. Thecontour interval is 1.5 m s�1; regions with positive values areshaded.
FIG. 6. Vertical profiles of (left) amplitude and (right) phase for the 1-day wave. Dottedlines indicate the results obtained from observation; solid lines with plus signs indicate theresults in the GSWM by Hagan et al. (1999).
DECEMBER 2006 O G I N O E T A L . 3441

temperature fluctuations, as shown in the right panel ofFig. 8. The intrinsic wave frequency �̂ was estimatedfrom the ratio of the parallel to perpendicular ampli-tudes of the horizontal winds to the horizontal wave-number vector, which corresponds to the ratio of long( |U |) to short ( |V |) axes of the ellipse:
| �̂ | �|U ||V | | f | ,
where f is the inertial frequency. The horizontal wave-number k was calculated by using the dispersion rela-tionship of a hydrostatic inertial gravity wave:
|k |2 ��̂2 � f 2
N2 m2,
where N is the Brunt–Väisälä frequency and m is thevertical wavenumber. The wave parameters estimatedby analyzing the hodograph shown above are listed asfollows:
• Vertical wavelength 2�/ |m | � 1.0 km• Direction of horizontal wavenumber vector k � 180°
(southward)• Intrinsic wave period 2�/ | �̂ | � 28 h• Horizontal wavelength 2�/ |k | � 630 km• Intrinsic horizontal phase velocity �̂/ |k | � 6.2 m s�1
(southward)
The ground-based wave frequency � was estimatedby applying �̂k obtained from the hodograph analysisinto the Doppler relationship equation:
�̂ � � � k · u,
where u is the background horizontal wind, which wascalculated in this case by averaging the horizontal windsin the height range 17.50–18.45 km during the periodfrom 1200 UTC 16 January 2000 to 1200 UTC 18 Janu-ary 2000. The ground-based wave period 2�/� was es-timated as �39 h, consistent with the frequency spectralpeak near the inertial period (�39 h) shown in section3. This suggests that the results of the hodograph analy-sis are reliable.
The vertical wind component w� can be derived fromtwo methods: one utilizes the thermodynamic equation
w� � i�̂
�T ��z � g�cp
T �,
where T is the background temperature, g is the gravityacceleration, cp is the specific heat of dry air at constantpressure, and T� is the temperature component; andanother utilizes the continuity equation
w� � �|k ||m | ��,
where � is the meridional wind component and weassume that the gravity wave propagates southward.Vertical profiles of w� derived from the two methodsare shown in Fig. 8. The two profiles agree well in bothamplitude and phase except for a part of the upperheight range, which indicates that the wave analyzedhere can be well described by the linear theory of grav-ity waves and that the analyses in this section are reli-
FIG. 8. (left) A hodograph drawn with the horizontal winds in the height range of 17.50–18.45 km at 1200 UTC 17 Jan 2000. Plus signs and squares indicate the bottom and top pointsof the height range. (middle) Corresponding vertical profiles of temperature (solid line),meridional wind (dotted line), and zonal wind (dashed line). Bandpass filters in time withcutoff lengths of 30 and 69 h and in height with cutoff lengths of 0.5 and 3 km were appliedto the data plotted in the panels in order to extract a monochromatic wave. (right) Verticalprofiles of vertical wind derived from the thermodynamic equation (solid line) and from thecontinuity equation (dotted line).
3442 J O U R N A L O F T H E A T M O S P H E R I C S C I E N C E S VOLUME 63
able. By using w� derived from the thermodynamicequation, the upward flux of northward momentum�w� associated with the gravity wave analyzed here isestimated as 6.0 10�3 m2 s�2. Note that, since thewave propagated southward, u�� and u�w� are theoret-ically expected to be zero. The �w� estimated above iscomparable to the result (�10�3 m2 s�2) in the sub-tropical lower stratosphere in the GCM experiment bySato et al. (1999). From the gravity wave parametersobserved in the subtropics using the meridional scanexperiment by Sato et al. (2003), the upward flux ofpoleward momentum is estimated as one order largerthan our result. Some observational studies for midlati-tude gravity waves (e.g., Sato 1994; Vincent et al. 1997)also showed larger values (10�1–10�2 m2 s�2). It mustbe noted that the wind fluctuations with short verticalwavelengths shown in this study were possibly attenu-ated by the smoothing procedure in the wind measure-ment of radiosonde observation (see, e.g., Yamanaka etal. 1996; Ogino et al. 1999b).
2) EXCITATION SOURCE
The ground-based group velocity
N2
�̂m2k � u
was estimated as �2.5 m s�1 toward the southwest(�120° measured clockwise from the north), that is,from the midlatitudes toward the equatorial region.The strong midlatitude jet stream or related distur-bances are possible candidates for the excitation sourceof the gravity waves, as suggested by many authors(e.g., Hirota and Niki 1985; Kitamura and Hirota 1989).Sato (1994) showed equatorward propagation of grav-ity waves around the jet stream axis in northern winter.This is consistent with the southward propagation ofthe gravity wave analyzed here. Indeed, the westerly jetstream and the related convective activities were lo-cated in the midlatitude region as shown in Fig. 1. How-ever, in order to identify the excitation source of thewave, an advanced analysis using a ray-tracing method,for example, is needed.
Cumulonimbus convection in the equatorial region,as seen in Fig. 1, is one of the possible candidates for anexcitation source of gravity waves (Tsuda et al. 1994b;Shimizu and Tsuda 1997), and it is expected that thegravity waves excited near the equator may propagatepoleward (Sato et al. 1999). However, at least duringthe enhanced observation period in January 2000, wedid not observe such poleward (northward) propagat-ing gravity waves.
c. Disturbances due to inertial instability
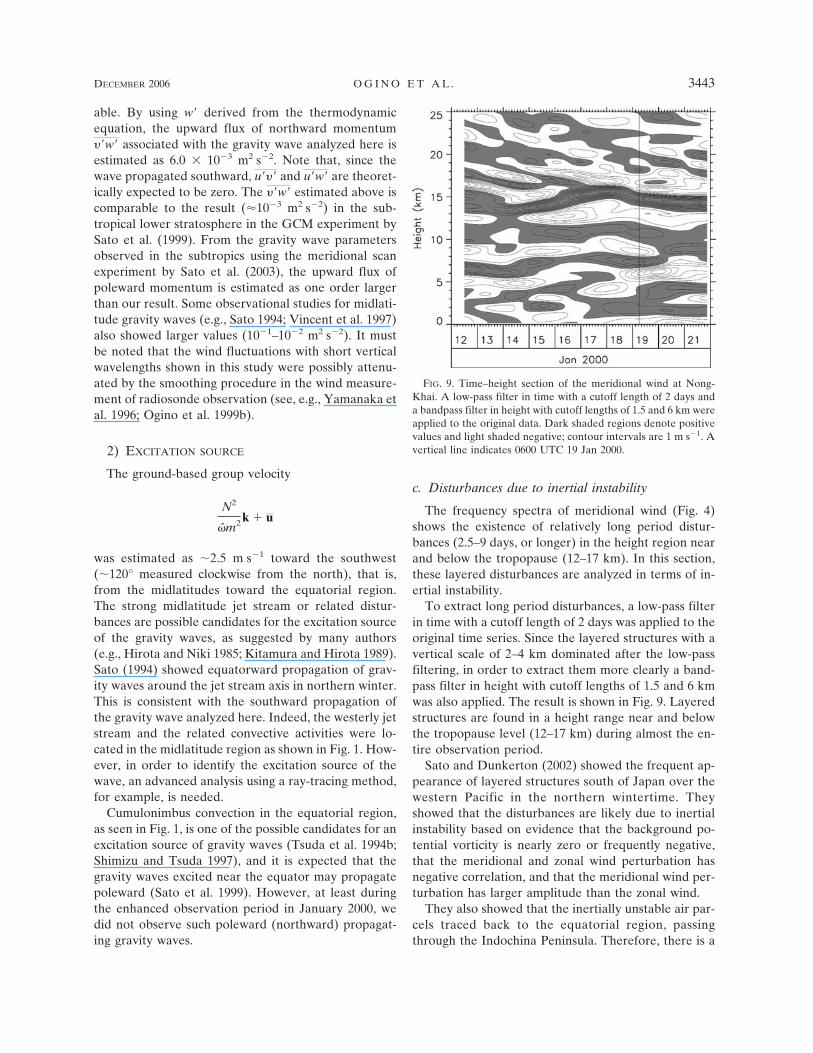
The frequency spectra of meridional wind (Fig. 4)shows the existence of relatively long period distur-bances (2.5–9 days, or longer) in the height region nearand below the tropopause (12–17 km). In this section,these layered disturbances are analyzed in terms of in-ertial instability.
To extract long period disturbances, a low-pass filterin time with a cutoff length of 2 days was applied to theoriginal time series. Since the layered structures with avertical scale of 2–4 km dominated after the low-passfiltering, in order to extract them more clearly a band-pass filter in height with cutoff lengths of 1.5 and 6 kmwas also applied. The result is shown in Fig. 9. Layeredstructures are found in a height range near and belowthe tropopause level (12–17 km) during almost the en-tire observation period.
Sato and Dunkerton (2002) showed the frequent ap-pearance of layered structures south of Japan over thewestern Pacific in the northern wintertime. Theyshowed that the disturbances are likely due to inertialinstability based on evidence that the background po-tential vorticity is nearly zero or frequently negative,that the meridional and zonal wind perturbation hasnegative correlation, and that the meridional wind per-turbation has larger amplitude than the zonal wind.
They also showed that the inertially unstable air par-cels traced back to the equatorial region, passingthrough the Indochina Peninsula. Therefore, there is a
FIG. 9. Time–height section of the meridional wind at Nong-Khai. A low-pass filter in time with a cutoff length of 2 days anda bandpass filter in height with cutoff lengths of 1.5 and 6 km wereapplied to the original data. Dark shaded regions denote positivevalues and light shaded negative; contour intervals are 1 m s�1. Avertical line indicates 0600 UTC 19 Jan 2000.
DECEMBER 2006 O G I N O E T A L . 3443
possibility that the disturbances due to inertial instabil-ity also occur over the Indochina Peninsula. Here, weexamine if the disturbances with a period longer than 2days observed in the upper troposphere at NongKhaiwere due to inertial instability.
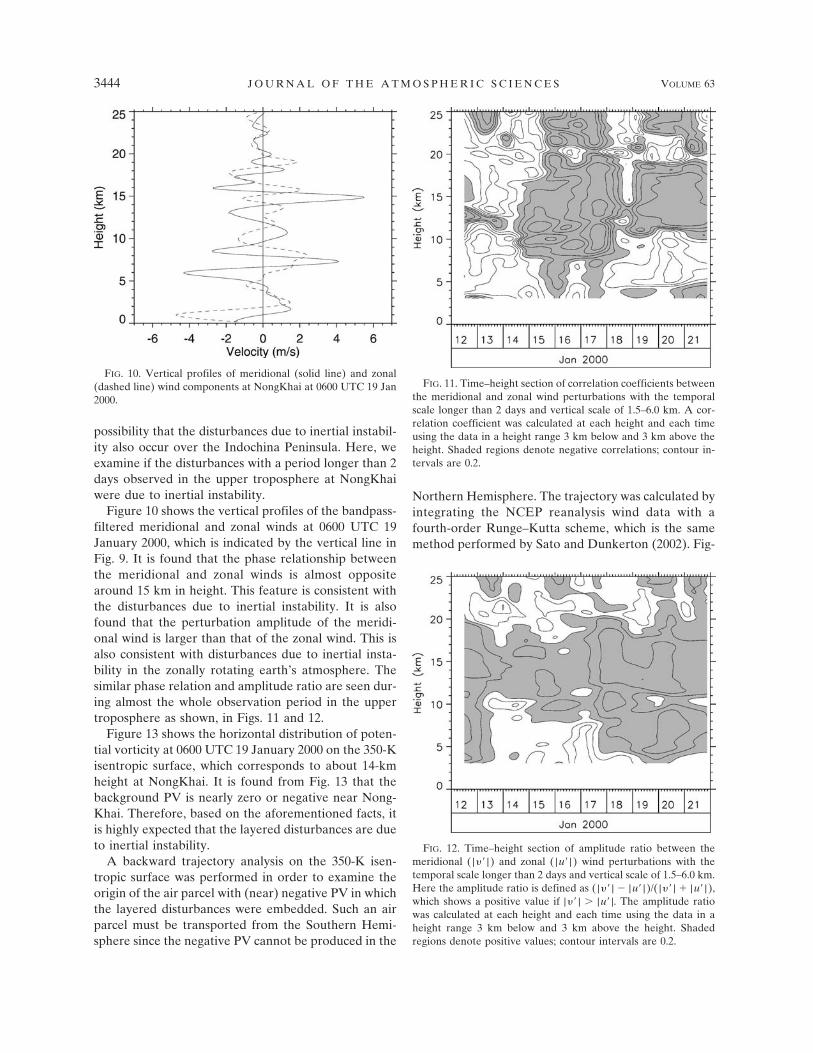
Figure 10 shows the vertical profiles of the bandpass-filtered meridional and zonal winds at 0600 UTC 19January 2000, which is indicated by the vertical line inFig. 9. It is found that the phase relationship betweenthe meridional and zonal winds is almost oppositearound 15 km in height. This feature is consistent withthe disturbances due to inertial instability. It is alsofound that the perturbation amplitude of the meridi-onal wind is larger than that of the zonal wind. This isalso consistent with disturbances due to inertial insta-bility in the zonally rotating earth’s atmosphere. Thesimilar phase relation and amplitude ratio are seen dur-ing almost the whole observation period in the uppertroposphere as shown, in Figs. 11 and 12.
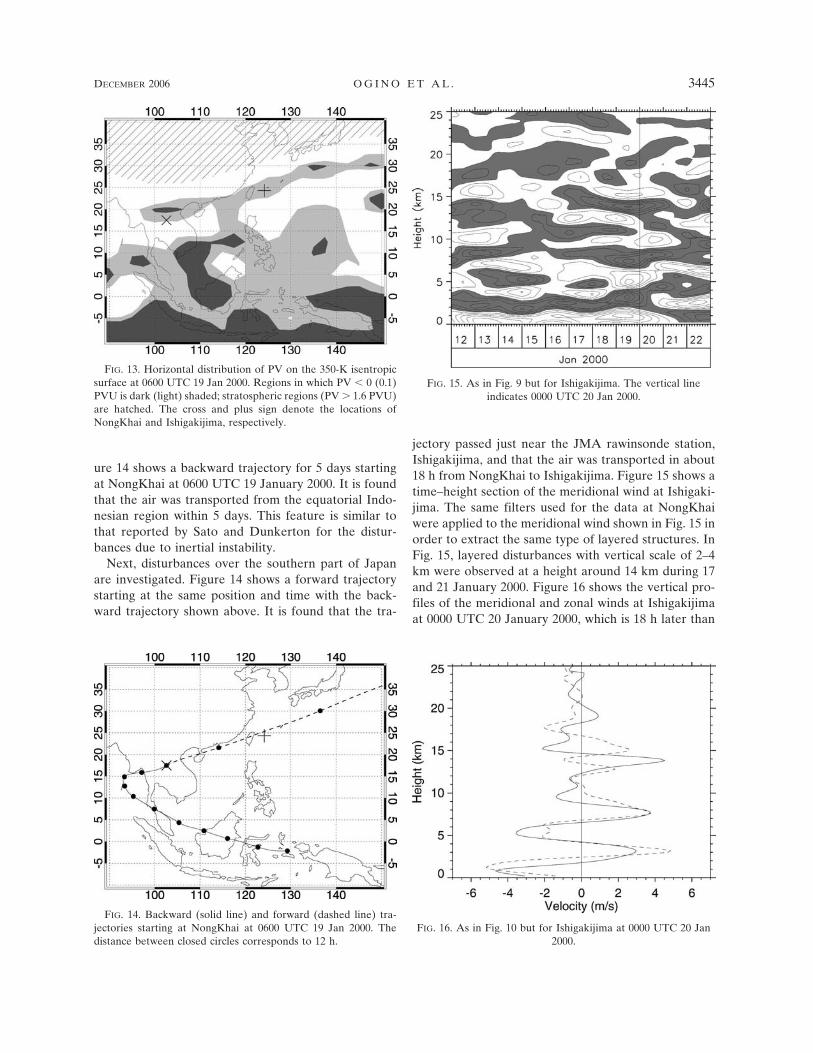
Figure 13 shows the horizontal distribution of poten-tial vorticity at 0600 UTC 19 January 2000 on the 350-Kisentropic surface, which corresponds to about 14-kmheight at NongKhai. It is found from Fig. 13 that thebackground PV is nearly zero or negative near Nong-Khai. Therefore, based on the aforementioned facts, itis highly expected that the layered disturbances are dueto inertial instability.
A backward trajectory analysis on the 350-K isen-tropic surface was performed in order to examine theorigin of the air parcel with (near) negative PV in whichthe layered disturbances were embedded. Such an airparcel must be transported from the Southern Hemi-sphere since the negative PV cannot be produced in the
Northern Hemisphere. The trajectory was calculated byintegrating the NCEP reanalysis wind data with afourth-order Runge–Kutta scheme, which is the samemethod performed by Sato and Dunkerton (2002). Fig-
FIG. 11. Time–height section of correlation coefficients betweenthe meridional and zonal wind perturbations with the temporalscale longer than 2 days and vertical scale of 1.5–6.0 km. A cor-relation coefficient was calculated at each height and each timeusing the data in a height range 3 km below and 3 km above theheight. Shaded regions denote negative correlations; contour in-tervals are 0.2.
FIG. 12. Time–height section of amplitude ratio between themeridional ( | � | ) and zonal ( |u� | ) wind perturbations with thetemporal scale longer than 2 days and vertical scale of 1.5–6.0 km.Here the amplitude ratio is defined as ( | � | � | u� | )/( | � | � |u� | ),which shows a positive value if | � | � |u� |. The amplitude ratiowas calculated at each height and each time using the data in aheight range 3 km below and 3 km above the height. Shadedregions denote positive values; contour intervals are 0.2.
FIG. 10. Vertical profiles of meridional (solid line) and zonal(dashed line) wind components at NongKhai at 0600 UTC 19 Jan2000.
3444 J O U R N A L O F T H E A T M O S P H E R I C S C I E N C E S VOLUME 63
ure 14 shows a backward trajectory for 5 days startingat NongKhai at 0600 UTC 19 January 2000. It is foundthat the air was transported from the equatorial Indo-nesian region within 5 days. This feature is similar tothat reported by Sato and Dunkerton for the distur-bances due to inertial instability.
Next, disturbances over the southern part of Japanare investigated. Figure 14 shows a forward trajectorystarting at the same position and time with the back-ward trajectory shown above. It is found that the tra-
jectory passed just near the JMA rawinsonde station,Ishigakijima, and that the air was transported in about18 h from NongKhai to Ishigakijima. Figure 15 shows atime–height section of the meridional wind at Ishigaki-jima. The same filters used for the data at NongKhaiwere applied to the meridional wind shown in Fig. 15 inorder to extract the same type of layered structures. InFig. 15, layered disturbances with vertical scale of 2–4km were observed at a height around 14 km during 17and 21 January 2000. Figure 16 shows the vertical pro-files of the meridional and zonal winds at Ishigakijimaat 0000 UTC 20 January 2000, which is 18 h later than
FIG. 13. Horizontal distribution of PV on the 350-K isentropicsurface at 0600 UTC 19 Jan 2000. Regions in which PV � 0 (0.1)PVU is dark (light) shaded; stratospheric regions (PV � 1.6 PVU)are hatched. The cross and plus sign denote the locations ofNongKhai and Ishigakijima, respectively.
FIG. 14. Backward (solid line) and forward (dashed line) tra-jectories starting at NongKhai at 0600 UTC 19 Jan 2000. Thedistance between closed circles corresponds to 12 h.
FIG. 15. As in Fig. 9 but for Ishigakijima. The vertical lineindicates 0000 UTC 20 Jan 2000.
FIG. 16. As in Fig. 10 but for Ishigakijima at 0000 UTC 20 Jan2000.
DECEMBER 2006 O G I N O E T A L . 3445
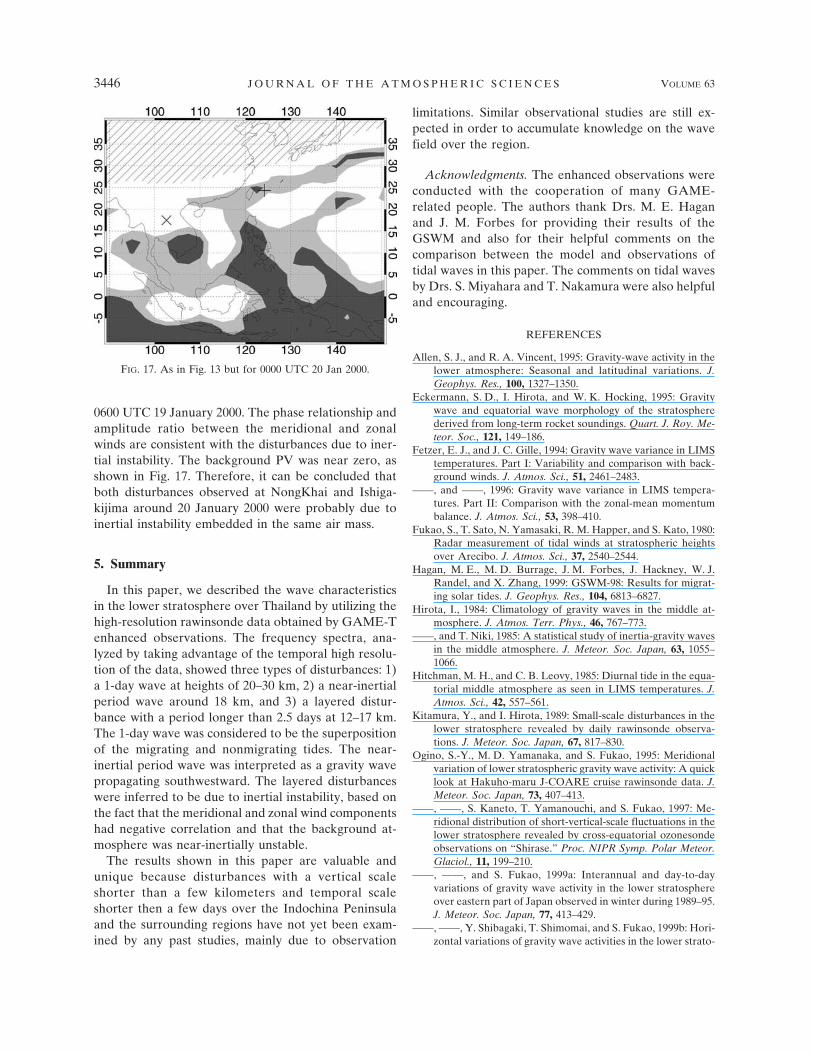
0600 UTC 19 January 2000. The phase relationship andamplitude ratio between the meridional and zonalwinds are consistent with the disturbances due to iner-tial instability. The background PV was near zero, asshown in Fig. 17. Therefore, it can be concluded thatboth disturbances observed at NongKhai and Ishiga-kijima around 20 January 2000 were probably due toinertial instability embedded in the same air mass.
5. Summary
In this paper, we described the wave characteristicsin the lower stratosphere over Thailand by utilizing thehigh-resolution rawinsonde data obtained by GAME-Tenhanced observations. The frequency spectra, ana-lyzed by taking advantage of the temporal high resolu-tion of the data, showed three types of disturbances: 1)a 1-day wave at heights of 20–30 km, 2) a near-inertialperiod wave around 18 km, and 3) a layered distur-bance with a period longer than 2.5 days at 12–17 km.The 1-day wave was considered to be the superpositionof the migrating and nonmigrating tides. The near-inertial period wave was interpreted as a gravity wavepropagating southwestward. The layered disturbanceswere inferred to be due to inertial instability, based onthe fact that the meridional and zonal wind componentshad negative correlation and that the background at-mosphere was near-inertially unstable.
The results shown in this paper are valuable andunique because disturbances with a vertical scaleshorter than a few kilometers and temporal scaleshorter then a few days over the Indochina Peninsulaand the surrounding regions have not yet been exam-ined by any past studies, mainly due to observation
limitations. Similar observational studies are still ex-pected in order to accumulate knowledge on the wavefield over the region.
Acknowledgments. The enhanced observations wereconducted with the cooperation of many GAME-related people. The authors thank Drs. M. E. Haganand J. M. Forbes for providing their results of theGSWM and also for their helpful comments on thecomparison between the model and observations oftidal waves in this paper. The comments on tidal wavesby Drs. S. Miyahara and T. Nakamura were also helpfuland encouraging.
REFERENCES
Allen, S. J., and R. A. Vincent, 1995: Gravity-wave activity in thelower atmosphere: Seasonal and latitudinal variations. J.Geophys. Res., 100, 1327–1350.
Eckermann, S. D., I. Hirota, and W. K. Hocking, 1995: Gravitywave and equatorial wave morphology of the stratospherederived from long-term rocket soundings. Quart. J. Roy. Me-teor. Soc., 121, 149–186.
Fetzer, E. J., and J. C. Gille, 1994: Gravity wave variance in LIMStemperatures. Part I: Variability and comparison with back-ground winds. J. Atmos. Sci., 51, 2461–2483.
——, and ——, 1996: Gravity wave variance in LIMS tempera-tures. Part II: Comparison with the zonal-mean momentumbalance. J. Atmos. Sci., 53, 398–410.
Fukao, S., T. Sato, N. Yamasaki, R. M. Happer, and S. Kato, 1980:Radar measurement of tidal winds at stratospheric heightsover Arecibo. J. Atmos. Sci., 37, 2540–2544.
Hagan, M. E., M. D. Burrage, J. M. Forbes, J. Hackney, W. J.Randel, and X. Zhang, 1999: GSWM-98: Results for migrat-ing solar tides. J. Geophys. Res., 104, 6813–6827.
Hirota, I., 1984: Climatology of gravity waves in the middle at-mosphere. J. Atmos. Terr. Phys., 46, 767–773.
——, and T. Niki, 1985: A statistical study of inertia-gravity wavesin the middle atmosphere. J. Meteor. Soc. Japan, 63, 1055–1066.
Hitchman, M. H., and C. B. Leovy, 1985: Diurnal tide in the equa-torial middle atmosphere as seen in LIMS temperatures. J.Atmos. Sci., 42, 557–561.
Kitamura, Y., and I. Hirota, 1989: Small-scale disturbances in thelower stratosphere revealed by daily rawinsonde observa-tions. J. Meteor. Soc. Japan, 67, 817–830.
Ogino, S.-Y., M. D. Yamanaka, and S. Fukao, 1995: Meridionalvariation of lower stratospheric gravity wave activity: A quicklook at Hakuho-maru J-COARE cruise rawinsonde data. J.Meteor. Soc. Japan, 73, 407–413.
——, ——, S. Kaneto, T. Yamanouchi, and S. Fukao, 1997: Me-ridional distribution of short-vertical-scale fluctuations in thelower stratosphere revealed by cross-equatorial ozonesondeobservations on “Shirase.” Proc. NIPR Symp. Polar Meteor.Glaciol., 11, 199–210.
——, ——, and S. Fukao, 1999a: Interannual and day-to-dayvariations of gravity wave activity in the lower stratosphereover eastern part of Japan observed in winter during 1989–95.J. Meteor. Soc. Japan, 77, 413–429.
——, ——, Y. Shibagaki, T. Shimomai, and S. Fukao, 1999b: Hori-zontal variations of gravity wave activities in the lower strato-
FIG. 17. As in Fig. 13 but for 0000 UTC 20 Jan 2000.
3446 J O U R N A L O F T H E A T M O S P H E R I C S C I E N C E S VOLUME 63
sphere over Japan: A case study in the Baiu season 1991.Earth Planets Space, 51, 107–113.
Sato, K., 1994: A statistical study of the structure, saturation andsources of inertio-gravity waves in the lower stratosphere ob-served with the MU radar. J. Atmos. Terr. Phys., 56, 755–774.
——, and T. J. Dunkerton, 2002: Layered structure associatedwith low potential vorticity near the tropopause seen in high-resolution radiosondes over Japan. J. Atmos. Sci., 59, 2782–2800.
——, T. Kumakura, and M. Takahashi, 1999: Gravity waves ap-pearing in a high-resolution GCM simulation. J. Atmos. Sci.,56, 1005–1018.
——, M. Yamamori, S.-Y. Ogino, N. Takahashi, Y. Tomikawa,and T. Yamanouchi, 2003: A meridional scan of the strato-spheric gravity wave field over the ocean in 2001 (MeSSO2001).J. Geophys. Res., 108, 4491, doi:10.1029/2002JD003219.
Shimizu, A., and T. Tsuda, 1997: Characteristics of Kelvin wavesand gravity waves observed with radiosondes over Indonesia.J. Geophys. Res., 102, 26 159–26 171.
Tsuda, T., and S. Kato, 1989: Diurnal non-migrating tides excitedby a differential heating due to land-sea distribution. J. Me-teor. Soc. Japan, 67, 43–55.
——, Y. Murayama, H. Wiryosumarto, S. W. B. Harijono, and S.Kato, 1994a: Radiosonde observations of equatorial atmo-sphere dynamics over Indonesia. 1. Equatorial waves anddiurnal tides. J. Geophys. Res., 99, 10 491–10 505.
——, ——, ——, ——, and ——, 1994b: Radiosonde observations
of equatorial atmosphere dynamics over Indonesia. 2. Char-acteristics of gravity waves. J. Geophys. Res., 99, 10 507–10 516.
——, M. Nishida, C. Rocken, and R. H. Ware, 2000: A globalmorphology of gravity wave activity in the stratosphere re-vealed by the GPS occultation data (GPS/MET). J. Geophys.Res., 105, 7257–7273.
Vincent, R. A., S. J. Allen, and S. D. Eckermann, 1997: Gravity-wave parameters in the lower stratospher. Gravity Wave Pro-cesses and Their Parameterization in Global Climate Models,K. Hamilton, Ed., Springer-Verlag, 7–25.
Wu, D. L., and J. W. Waters, 1996a: Gravity-wave-scale tempera-ture fluctuations seen by the UARS MLS. Geophys. Res.Lett., 23, 3289–3292.
——, and ——, 1996b: Satellite observations of atmospheric vari-ances: A possible indication of gravity waves. Geophys. Res.Lett., 23, 3631–3634.
Yamamori, M., and K. Sato, 2006: Characteristics of inertia grav-ity waves over the South Pacific as revealed by radiosondeobservations. J. Geophys. Res., 111, D16110, doi:10.1029/2005JD006861.
Yamanaka, M. D., S. Ogino, S. Kondo, T. Shimomai, S. Fukao, Y.Shibagaki, Y. Maekawa, and I. Takayabu, 1996: Inertio-gravity waves and subtropical multiple tropopauses: Verticalwavenumber spectra of wind and temperature observed bythe MU radar, radiosondes and operational rawinsonde net-work. J. Atmos. Terr. Phys., 58, 785–805.
DECEMBER 2006 O G I N O E T A L . 3447
Copyright © 2022 FDOKUMEN