Classification of Single and Multiple Disturbances in Electric Signals
18
Hindawi Publishing Corporation EURASIP Journal on Advances in Signal Processing Volume 2007, Article ID 56918, 18 pages doi:10.1155/2007/56918 Research Article Classification of Single and Multiple Disturbances in Electric Signals Mois ´ es Vidal Ribeiro and Jos ´ e Luiz Rezende Pereira Department of Electrical Energy, Federal University of Juiz de Fora, 36 036 330 Juiz de fora, MG, Brazil Received 19 April 2006; Revised 28 January 2007; Accepted 16 May 2007 Recommended by Pradipta Kishore Dash This paper discusses and presents a different perspective for classifying single and multiple disturbances in electric signals, such as voltage and current ones. Basically, the principle of divide to conquer is applied to decompose the electric signals into what we call primitive signals or components from which primitive patterns can be independently recognized. A technique based on such concept is introduced to demonstrate the effectiveness of such idea. This technique decomposes the electric signals into three main primitive components. In each primitive component, few high-order-statistics- (HOS-) based features are extracted. Then, Bayes’ theory-based techniques are applied to verify the ocurrence or not of single or multiple disturbances in the electric signals. The performance analysis carried out on a large number of data indicates that the proposed technique outperforms the performance attained by the technique introduced by He and Starzyk. Additionally, the numerical results verify that the proposed technique is capable of offering interesting results when it is applied to classify several sets of disturbances if one cycle of the main frequency is considered, at least. Copyright © 2007 M. V. Ribeiro and J. L. R. Pereira. This is an open access article distributed under the Creative Commons Attribution License, which permits unrestricted use, distribution, and reproduction in any medium, provided the original work is properly cited. 1. INTRODUCTION Recently, a great deal of attention has been drawn to the effi- cient and appropriate use of signal processing and computa- tional intelligence techniques for the development of power- ful tools to characterize, analyze, and evaluate the quality of power systems as well as the behavior of their loads. From a signal processing standpoint, the power quality (PQ) analysis could be listed in the following foremost topics: (i) distur- bance detection, (ii) disturbance classification, (iii) source of disturbance identification, (iv) source of disturbance local- ization, (v) signal compression, (vi) parameters estimation, (vii) signal representation or decomposition, and (viii) sig- nal and system behavior predictions. The classification or recognition topic is an important is- sue for the development of the next generation of PQ mon- itoring equipment. Basically, it refers to the use of signal processing-based technique to extract as few as possible and, at the same time, representative features from the powerline signals, which are supposed to be voltage and current ones, followed by the use of a powerful and a simple technique to classify the detected disturbances. As far as the use of pattern recognition technique for PQ applications has been concerned, the main reasons for de- veloping techniques to classify disturbances are [1] (i) im- provements in the tracking performance of abnormal be- haviors of the monitored powerlines and electrical machines and (ii) the feasible detection of disturbance sources respon- sible for causing the disturbances in the monitored power- lines or electrical machines. To succeed in this aim, several techniques have been widely applied to analyze single dis- turbances in electric signals [2–28] in the past two decades. However, it is well recognized that during an abnormal be- havior of a power system, the powerline signals are corrupted not only by single disturbance, but also by multiple ones. As a result, the majority of techniques developed so far to clas- sify single disturbances have limited applicability in moni- toring equipment since they will have to deal with multiple disturbances, even though they have not been designed to do so. Recently, in [2, 3] wavelet-based classification techniques capable of classifying single and two kinds of multiple dis- turbances have been proposed. The results reported in [2] surpass those presented in [3] and reveal that there is a room for the development of powerful, simple, and efficient tech- niques to classify other sets of multiple disturbances.
Transcript of Classification of Single and Multiple Disturbances in Electric Signals

Hindawi Publishing CorporationEURASIP Journal on Advances in Signal ProcessingVolume 2007, Article ID 56918, 18 pagesdoi:10.1155/2007/56918
Research ArticleClassification of Single and Multiple Disturbances inElectric Signals
Moises Vidal Ribeiro and Jose Luiz Rezende Pereira
Department of Electrical Energy, Federal University of Juiz de Fora, 36 036 330 Juiz de fora, MG, Brazil
Received 19 April 2006; Revised 28 January 2007; Accepted 16 May 2007
Recommended by Pradipta Kishore Dash
This paper discusses and presents a different perspective for classifying single and multiple disturbances in electric signals, suchas voltage and current ones. Basically, the principle of divide to conquer is applied to decompose the electric signals into what wecall primitive signals or components from which primitive patterns can be independently recognized. A technique based on suchconcept is introduced to demonstrate the effectiveness of such idea. This technique decomposes the electric signals into three mainprimitive components. In each primitive component, few high-order-statistics- (HOS-) based features are extracted. Then, Bayes’theory-based techniques are applied to verify the ocurrence or not of single or multiple disturbances in the electric signals. Theperformance analysis carried out on a large number of data indicates that the proposed technique outperforms the performanceattained by the technique introduced by He and Starzyk. Additionally, the numerical results verify that the proposed technique iscapable of offering interesting results when it is applied to classify several sets of disturbances if one cycle of the main frequency isconsidered, at least.
Copyright © 2007 M. V. Ribeiro and J. L. R. Pereira. This is an open access article distributed under the Creative CommonsAttribution License, which permits unrestricted use, distribution, and reproduction in any medium, provided the original work isproperly cited.
1. INTRODUCTION
Recently, a great deal of attention has been drawn to the effi-cient and appropriate use of signal processing and computa-tional intelligence techniques for the development of power-ful tools to characterize, analyze, and evaluate the quality ofpower systems as well as the behavior of their loads. From asignal processing standpoint, the power quality (PQ) analysiscould be listed in the following foremost topics: (i) distur-bance detection, (ii) disturbance classification, (iii) source ofdisturbance identification, (iv) source of disturbance local-ization, (v) signal compression, (vi) parameters estimation,(vii) signal representation or decomposition, and (viii) sig-nal and system behavior predictions.
The classification or recognition topic is an important is-sue for the development of the next generation of PQ mon-itoring equipment. Basically, it refers to the use of signalprocessing-based technique to extract as few as possible and,at the same time, representative features from the powerlinesignals, which are supposed to be voltage and current ones,followed by the use of a powerful and a simple technique toclassify the detected disturbances.
As far as the use of pattern recognition technique for PQapplications has been concerned, the main reasons for de-veloping techniques to classify disturbances are [1] (i) im-provements in the tracking performance of abnormal be-haviors of the monitored powerlines and electrical machinesand (ii) the feasible detection of disturbance sources respon-sible for causing the disturbances in the monitored power-lines or electrical machines. To succeed in this aim, severaltechniques have been widely applied to analyze single dis-turbances in electric signals [2–28] in the past two decades.However, it is well recognized that during an abnormal be-havior of a power system, the powerline signals are corruptednot only by single disturbance, but also by multiple ones. Asa result, the majority of techniques developed so far to clas-sify single disturbances have limited applicability in moni-toring equipment since they will have to deal with multipledisturbances, even though they have not been designed to doso. Recently, in [2, 3] wavelet-based classification techniquescapable of classifying single and two kinds of multiple dis-turbances have been proposed. The results reported in [2]surpass those presented in [3] and reveal that there is a roomfor the development of powerful, simple, and efficient tech-niques to classify other sets of multiple disturbances.

2 EURASIP Journal on Advances in Signal Processing
The purposes of this contribution are (i) the discussionof a formulation that facilitates the classification of singleand multiple disturbances in voltage and current signals; weargue that this formulation allows the development of pow-erful and efficient pattern recognition techniques to classifya large number of sets of disturbances; basically, the princi-ple of divide to conquer, which inspired the detection tech-nique introduced in [29], is applied to decompose the electricsignals into what we call primitive signals or primitive com-ponents from which primitive patterns can be recognizedeasily; and (ii) the discussion of a new disturbance classifi-cation technique that makes use of the proposed formula-tion to classify single and multiple disturbances in electricsignals. This technique decomposes the electric signals intothree main primitive components. In each primitive compo-nent, few high-order-statistics- (HOS-)based features are ex-tracted. Then, effortless Bayesian classifier, which makes useof normal density function and draws on the HOS-based fea-tures, can be designed to come to light single as well as mul-tiple disturbances. The rationale behind is that each prim-itive component is associated to a reduced and disjoint setof disturbances. Numerical results indicate that the proposedtechnique not only outperforms previous techniques, such as[2, 3], but also provides very interesting results in case of theframe length corresponds to at least one-cycle of the mainfrequency. This contribution was initially reported in [1] andpartially presented in [30, 31].
The paper is organized as follows. Section 2 formu-lates the problem of single and multiple disturbances clas-sification. Section 3 discusses the proposed technique, de-rived from the formulation presented in Section 2. Section 4presents computational results indicating the improved clas-sification performance offered by the proposed technique.Finally, concluding remarks are stated in Section 5.
2. PROBLEM FORMULATION:SINGLE AND MULTIPLE DISTURBANCES
The discrete version of monitored powerline signals can bedivided into nonoverlapped frames of N samples. The dis-crete sequence in a frame can be expressed as an additivecontribution of several types of phenomena:
x(n)=x(t)|t=nTs := f (n)+h(n)+i(n)+t(n)+v(n), (1)
where n = 0, . . . ,N − 1, Ts = 1/ fs is the sampling period, thesequences { f (n)}, {h(n)}, {i(n)}, {t(n)}, and {v(n)} denotethe power supply signal (or fundamental component), har-monics, interharmonics, transient, and background noise,respectively. Each of these signals is defined as follows:
f (n) := A0(n) cos[
2πf0(n)fs
n + θ0(n)]
, (2)
h(n) :=M∑
m=1
hm(n), (3)
i(n) :=J∑j=1
i j(n), (4)
t(n) := timp(n) + tnot(n) + tcas(n) + tdae(n), (5)
and v(n) is independently and identically distributed (i.i.d.)noise as normal N (0, σ2
v ) and independent of { f (n)},{h(n)}, {i(n)}, and {t(n)}.
In (2), A0(n), f0(n), and θ0(n) refer to the magnitude,fundamental frequency, and phase of the power supply sig-nal, respectively. In (3) and (4), hm(n) and i j(n) are the mthharmonic and the jth inter-harmonic, respectively, which aredefined as
hm(n) := Am(n) cos[
2πmf0(n)fs
n + θm(n)]
, (6)
i j(n) := AI , j(n) cos[
2πfI , j(n)
fsn + θI , j(n)
]. (7)
In (6), Am(n) is the magnitude and θm(n) is the phase ofthe mth harmonic. In (7), AI , j(n), fI , j(n), and θI , j(n) are themagnitude, frequency, and phase of the jth interharmonic,respectively. In (5), timp(n), tnot(n), and tcas(n) represent im-pulsive transients named spikes, notches, decaying oscilla-tions. tdae(n) refers to oscillatory transient named dampedexponentials. These transients are expressed by
timp(n) :=Nimp∑i=1
timp,i(n), (8)
tnot(n) :=Nnot∑i=1
tnot,i(n), (9)
tdec(n) :=Ndec∑i=1
Adec,i(n) cos[ωdec,i(n)n + θdec,i(n)
]
× exp[− αdec,i
(n− ndec,i
)],
(10)
tdam(n) :=Ndam∑i=1
Adam,i(n) exp[− αdam,i
(n− ndam,i
)], (11)
respectively, where timp,i(n) and timp,i(n) are the nth samplesof the ith transient named impulsive transient or notch. Notethat (10) refers to the capacitor switchings as well as signalsresulted from faulted waveforms. Equation (11) defines thedecaying exponential as well as direct current (DC) compo-nents (αdam = 0) generated by geomagnetic disturbances,and so forth.
The following definition is used in this contribution: (i)the vector x = [x(n) · · · x(n − N + 1)]T is composed ofsamples from the signal expressed by (1), the vector f =[ f (n) · · · f (n − N + 1)]T constituted by estimated samplesof the signal given by (2), the vector h = [h(n) · · ·h(n −N + 1)]T is composed of estimated samples of the signaldefined by (3), the vector i = [i(n) · · · i(n − N + 1)]T isconstituted by estimated samples of the signals defined by(4), the vector timp = [timp(n) · · · timp(n − N + 1)]T is con-stituted by estimated samples of the signals defined by (8),the vector tnot = [tnot(n) · · · tnot(n − N + 1)]T is consti-tuted by estimated samples of the signals defined by (9),the vector tdec = [tdec(n) · · · tdec(n − N + 1)]T is composedof estimated samples of the signals defined by (10), andthe vector tdam = [tdam(n) · · · tdam(n − N + 1)]T is consti-tuted by estimated samples of the signals defined by (11).

M. V. Ribeiro and J. L. R. Pereira 3
0 0.02 0.04 0.06 0.08 0.1
Time (s)
−1
0
1
(a)
0 0.02 0.04 0.06 0.08 0.1
Time (s)
−1
0
1
(b)
0 0.02 0.04 0.06 0.08 0.1
Time (s)
−0.5
0
0.5
(c)
Figure 1: (a) Monitored voltage signal, {x(n)}, (b) fundamen-tal component, { f (n)}, (c) harmonic and transient components,{h(n)} + {u(n)}.
v = [v(n) · · · v(n − N + 1)]T is constituted by samples ofthe additive noise.
It is worth mentioning that low- , medium- , and high-voltage electrical networks present different sets of single andmultiple disturbances. As a result, the design of classificationtechnique for each voltage level has to take into account theinformation and characteristics of these networks to attain ahigh classification performance. For instance, the sets of dis-turbances in the high-voltage transmission and low-voltagedistribution systems differ considerably.
The majority of classification techniques developed sofar are for single disturbances. For these techniques, thefeature extraction, as well as classification techniques, hasbeen investigated and researchers in this field have achieveda great level of development [3–28]. As a result, the cur-rent classification techniques are capable of classifying sin-gle disturbances achieving classification ratio from 90% to100%. A recent technique introduced in [32] attains classi-fication ratio very close to 100% if single disturbances areconsidered. The main advantage offered by this techniqueis the use of simple feature extraction technique along withsupport vector machine (SVM) technique. Nevertheless, onecan note that the incidence of multiple disturbances, at thesame time interval, in electric signals, is an ordinary situa-tion owing to the presence of several sources of disturbancesin the power systems. Figures 1 and 2 expose this problemvery well. One can note that Figure 1(a) shows the signal{x(n)} = { f (n)}+{h(n)}+{u(n)}+{v(n)}while Figures 1(b)and 1(c) depict the sequences { f (n)} and {x(n)} − { f (n)},respectively. This voltage measurement was obtained from
0 0.02 0.04 0.06 0.08 0.1
Time (s)
−1
0
1
(a)
0 0.02 0.04 0.06 0.08 0.1
Time (s)
−1
0
1
(b)
0 0.02 0.04 0.06 0.08 0.1
Time (s)
−1
0
1
(c)
Figure 2: (a) Monitored voltage signal, {x(n)}, (b) fundamen-tal component, { f (n)}, (c) harmonic and transient components,{h(n)} + {u(n)}.
x Featureextraction
Classifierpx r
Figure 3: Standard paradigm for the classification of single andmultiple disturbances.
IEEE working group P1159.3 website. In Figure 1(c), the sig-nal {z(n)} = {h(n)} + {t(n)} + {v(n)} is composed of 3rdharmonic, transient signal that can be a priori assumed to bea decaying oscillation, and, maybe, other disturbances verydifficult to be a priori categorized. Another illustrative ex-ample of multiple disturbances in voltage signals is shown inFigure 2. One can note the incidence of short-duration volt-age variation named sag, see Figure 2(b), harmonic compo-nents and, short-transient intervals associated with the volt-age sag as is pictured in Figure 2(c).
Presupposing that electric signals are represented by (1),the recognition of disturbance patterns composed of multi-ple disturbances cannot be an easy task to be accomplishedas in the case of single disturbance ocurrence. In fact, theincidence of more than one disturbance in the electric sig-nals can lead to techniques attaining reduced classificationperformance due to the complexity of classification region ifthe standard paradigm, which is depicted in Figure 3, is con-sidered. It refers to the fact that in the standard paradigm,the feature vector px is extracted directly from the vectorx = f + h + i + timp + tdec + tdam + v and the vector px can beunfavorable for disturbance classification purpose becausethe vector x is composed of several components, which are

4 EURASIP Journal on Advances in Signal Processing
x Signalprocessing
f Featureextraction
p fClassifier
h Featureextraction
phClassifier
i Featureextraction
piClassifier
timpFeature
extraction
pimpClassifier
tnot Featureextraction
pnotClassifier
tdec Featureextraction
pdecClassifier
Featureextraction
tdam pdamClassifier
r
Figure 4: Novel paradigm for the classification of single and multi-ple disturbances.
associated with disjoint disturbances sets. As a result, the de-sign of pattern recognition technique for classifying multipledisturbances is a very difficult task to be accomplished [5, 7].One can state that this is true because the electric signalsare in the majority of cases composed of complex patterns,which is constituted by multiple primitive patterns. There-fore, the surfaces among the classification regions that areassociated with different types of single and multiple distur-bances in the feature vector space, which is defined by theset of feature vectors px, can be very complex and difficult toattain, even though powerful feature extraction and classifi-cation techniques are applied. As a result, the design of pat-tern recognition techniques offer low performance if (1) iscomposed of multiple disturbances; see [2, 3] and referencetherein. References [2, 3] are the first contributions propos-ing pattern recognition techniques to classify one or two si-multaneous disturbances in voltage signals. The attained re-sults with synthetic data is lower than 95%, see [2]. Theseresults illustrate that a lot of efforts have to be put in for thedevelopment of powerful pattern recognition techniques ca-pable of achieving high performance.
To overcome the weakness and reduced performance ofthe standard paradigm, in the following a paradigm based onthe principle of divide to conquer is presented, which has beenwidely and succeessfully applied to many engineering appli-cations, to design powerful and efficient disturbance classifi-cation techniques for PQ applications. In this paradigm, thevector x is decomposed into what we call primitive compo-nents from which individual disturbances or, as defined here,primitive patterns can be easily classified. Here, primitivecomponents are defined as those components from whichonly single disturbances can be straightforwardly classified.The primitive components are the vectors separately consti-tuted by samples of signals expressed by (2), (3), (4), (8), (9),(10), and (11). Figure 4 illustrates the whole new paradigm.
As it can be seen, the main idea is to divide the powerlinesignals into several primitive components in which simplepattern recognition techniques can be designed easily andapplied. The motivations for decomposing the vector x intovectors f , h, i, timp, fnot, tdec, and tdam are as follows.
(i) From vector f , several disjoint disturbances that aremainly related to the fundamental component can classifyeasily. For the vector f , the primitive patterns are namedsag, swell, interruption, sustained interruption, undervolt-age, and overvoltage. As a result, the classification of distur-bances in the fundamental component can be formulated asthe decision between four hypotheses [33–35]:
H f ,1 : f = fnorm + v f ,
H f ,2 : f = funder + v f ,
H f ,3 : f = fover + v f ,
H f ,4 : f = finter + v f ,
(12)
where v f is the noise vector associated with the fundamentalcomponent. The vectors fnorm, funder, fover, and finter denotea normal condition of fundamental component, an under-voltage or sag, a disturbance called overvoltage or swell, anda disturbance named sustained interruption or interruption,respectively. One has to note that the hypothesis expressedby (12) can be split into four simple hypotheses which areexpressed by
H f ,i,0 : f = v f ,
H f ,i,1 : f = fdist + v f ,(13)
where dist denotes norm, under, over, and inter if i =1, . . . , 4, respectively.
(ii) From vector h, one can recognize the occurrence ofdistortions generated by the harmonic sources which mainlyare nonlinear loads connected to power systems. Here theprimitive pattern is called harmonic distortion. By extractingthe vector h from the vector x, the problem related to classi-fying the disturbances as harmonic distortion in voltage andcurrent signals can be formulated as follows [33, 34]:
Hh,1,0 : hh = vh,
Hh,1,1 : hh = h + vh,(14)
where vh is the noise vector associated with the harmoniccomponents. One can see that this allows the use of simpledetection technique to recognize the presence of harmonics.
(iii) The vector i is related to the incidence of interhar-monic components in the electric signals. These componentsappear due to the occurrences of flicker as well as powerelectronic-based equipment. Here, the primitive pattern isjust called interharmonic. This primitive pattern can be fur-ther decomposed into other primitive patterns if one needs toanalyze some specific groups of interharmonic components.Note that flicker is a very specific class of interharmonic inwhich the frequency is in the range 0 < f < f0 [36]. The clas-sification of the interharmonic components in voltage and

M. V. Ribeiro and J. L. R. Pereira 5
current signals can then be formulated as a decision betweentwo simple hypotheses [33, 34]:
Hi,1,0 : ii = vi,
Hi,1,1 : ii = i + vi,(15)
where vi is the noise vector associated with the inter-hamoniccomponents.
(iv) The use of timp vector provides us with the meansto detect the occurrence of impulsive transients in the pow-erline signals. Then, the classification of primitive patternas impulsive transient in voltage and current signals canbe formulated as a decision between two simple hypotheses[33, 34]:
Htimp,1,0 : ttimp = vimp,
Htimp,1,1 : ttimp = timp + vimp,(16)
where vimp is the noise vector associated with the disturbancenamed impulsive transient.
(v) The use of tnot vector allows the identification ofprimitive pattern called notch in the powerline signals and,consequently, the presence of power electronic devices. Re-garding the use of vector tnot, this classification problem canbe formulated as a decision between two simple hypotheses[33, 34]:
Htnot,1,0 : ttnot = vnot,
Htnot,1,1 : ttnot = tnot + vnot,(17)
where vimp is the noise vector associated with the disturbancecalled notch.
(vi) The use of tdec vector offers a means to recognize theso-called oscillatory transient (primitive pattern) that is de-fined as sudden, nonpower frequency changes in the steady-state condition of voltage and/or current that include bothpositive and negative polarity values. By extracting the vectortdec from the vector x, the problem related to classifying thedisturbances as decaying oscillations in voltage and currentsignals can be formulated as a decision between two simplehypotheses [33, 34]:
Htdec,1,0 : ttdec = vdec,
Htdec,1,1 : ttdec = tdec + vdec,(18)
where vdec is the noise vector associated with the disturbancecalled decaying oscillation.
(viii) The use of tdam vector offers us the means to ver-ify the incidence of the primitive pattern characterized as asudden, nonpower frequency change in the steady-state con-dition of voltage, current, or both, that is unidirectional inpolarity (primarily either positive or negative). The use oftdam allows one to recognize damped exponentials from a de-cision between two simple hypotheses [33, 34]:
Htdam,1,0 : ttdam = vdam,
Htdam,1,1 : ttdam = tdam + vdam,(19)
where vdam is the noise vector associated with the disturbancecalled damped decaying.
From all reasons and motivations stated before, it is clearthat improved performance can be attained for the classifi-cation of single and multiple disturbances in electric signals,if the electric signals can be decomposed into several primi-tive components. By using such a very simple and powerfulidea, which is named the principle of divide to conquer, thedesign of a very complex classification technique is brokenin several simple ones that can be developed easily. The re-sult derived from this paradigm is very interesting becausethe incidence of several sets of classes of disturbances canbe identified easily. In fact, each of the vectors f , h, i, timp,tnot, tdec, and tdam are related to disjointed classes of distur-bances and their recognition in parallel can be performedeasily.
From a PQ perspective, the advantages and opportunitiesoffered by this paradigm is very appealing and promising tocompletely characterize the behavior of electric signals notonly for classification purpose, but also for other very de-manding issues listed at the beginning of Section 1. To makethis strategy successful, one has to develop signal processingtechniques capable of decomposing the vector x into the vec-tors f , h, i, timp, fnot, tdec, and tdam to allow the further extrac-tion of simple and powerful feature extraction and the use ofsimple classifiers.
This is a very hard and difficult problem to be solved sothat it should be deeply investigated by signal processing re-searchers interested in this field. In fact, the decompositionof vector x into the vectors f , h, i, timp, tnot, tdec, and tdam isnot a simple task to be accomplished with simple signal pro-cessing techniques. However, if one assumes that the vector xis given by
x = f + v f + h + vh + u + vu, (20)
where v = v f + vh + vu and
u = i + timp + tnot + tdec + tdam, (21)
then some signal processing techniques can be applied to de-compose x into the vectors f , h, and u. And, as a result, high-performance pattern recognition technique for a limited andvery representative set of disturbances in electric signals canbe designed. In fact, the decomposition of the vector x intothe vectors f , h, and u allows one to design classification tech-niques for disjoint sets of disturbances associated with theprimitive components named fundamental, harmonic, andtransient, respectively. Section 3 introduces a pattern recog-nition technique for single and multiple disturbances thatmakes use of (20)-(21) and attains an interesting improve-ment.
3. PROPOSED TECHNIQUE
The scheme of the proposed technique is portrayed inFigure 5. Note that in the signal processing block, algo-rithms responsible for extracting the vectors f , h, and u areimplemented.

6 EURASIP Journal on Advances in Signal Processing
x Signalprocessing
f Featureextraction
p fClassifier
h Featureextraction
phClassifier
u Featureextraction
puClassifier
r
Figure 5: Standard paradigm for the classification of single andmultiple disturbances.
x(n)NF0
x0(n)NF1
x1(n)· · · NFM
−
xM(n)+
−
hM−1(n)
+
− +f (n)
h2(n)
Figure 6: Scheme of the signal processing block.
This signal processing block is illustrated in Figure 6,where the blocks NFi, i = 0, . . . ,M − 1, implement second-order notch filter with notch frequency ωm = 2mπ( f0/ fs).These filters are responsible for the estimations of { f (n)},{h(n)}, and {u(n)}. The z-transform of the second-ordernotch filter is expressed by
Hm(z) = 1 + amz−1 + z−2
1 + ρmamz−1 + ρ2mz−2
, (22)
where
am = −2 cosmω0, (23)
and 0 � ρm < 1 is the notch factor. One should note thatthe notch filter has some drawbacks regarding the choice ofthe parameter ρm, and also its output is, by definition, a con-tribution of information of its own internal state and the in-put. As a result, the notch filter can produce transient signalsthat reflect the changes at the input and in its states. Thiscould be a problem if the aim is to estimate the parametersof the primitive components. For this problem, the use ofhigh-order notch filter, such as 4th order or higher ones, canbe used to reduce the transient at the output of the notchfilter [37]. Although, these transients can contribute to dis-tort the primitive components, we point out that such be-havior does not minimize the classification performance. Infact, the transients at the output of the notch filter shows atypical parttern for each disturbance, then a neglible loss ofperformance has been verified for disturbance detection, see[1, 38]. An advantage regarding the use of notch filter is thatits implementation with finite word length in the δ-operatordomain is very robust against the effects of finite precision,then it can be implemented in a cheap digital signal processor
(DSP)-based equipment running with finite-precision. Thenotch filter in δ-operator domain is given by [39, 40]
Hm(δ) = Hm(z) | z=1+Δδ = 1 + αm,1δ−1 + αm,2δ−2
1 + βm,1δ−1 + βm,2δ−2, (24)
where
αm,1 = 2Δ
(1− cosmω0
),
αm,2 = 2Δ2
(1− cosmω0
),
βm,1 = 2Δ
(1− ρm cosmω0
),
βm,2 = 1 + ρ2m − 2ρm cosω0
Δ2,
(25)
where 0 < Δ � 1 is carefully chosen to minimize roundofferror effects. Although the implementation of a filter in the δoperator domain demands more computational complexity,it is very robust to the quantization effects when the samplingrate is at least 10 times higher than the frequency band ofinterest.
The vectors f , h, and u provided at the processing blockoutput are expressed by
f = f ,
h =M∑
m=2
hm,
u = xM ,
(26)
respectively, where f = [ f (n) · · · f (n − N + 1)]T , hm =[hm(n) · · · hm(n − N + 1)]T , and xM = [xM(n) · · · xM(n −N + 1)]T . If we assume ρm, m = 0, 1, . . . ,M, are very close toa unity, then
xi(n) ∼=
⎧⎪⎪⎪⎪⎪⎪⎪⎪⎪⎪⎨⎪⎪⎪⎪⎪⎪⎪⎪⎪⎪⎩
x(n + d0
)− ∣∣H0(e jω0(n)
)∣∣A0(n)
× cos(nω0(n) + θ0(n) + Δθ0(n)
)if i = 0,
xi−1(n + di−1
)−∑im=0
∣∣Hm(e jmω0(n)
)∣∣Am(n)
× cos(nmω0(n) + θm(n) + Δθm(n)
)otherwise,
(27)
where
Δθm(n) =i∑
k=0
∠Hk(mω0(n)
),
σ2m(n) = σ2
v
(1−
i∏k=0
∣∣Hk(mω0(n)
)∣∣2).
(28)
The technique implemented in the feature extractionblocks is responsible for extracting reduced and represen-tative vectors of features pi, i = f ,h,u, from the vectors f ,h, and u, respectively. Sections 3.1, 3.2, and 3.3 deal withfeature extraction, feature selection, and classification tech-niques that are considered in this contribution. Once the fea-ture vectors pi, i = f ,h,u, are extracted, the blocks named

M. V. Ribeiro and J. L. R. Pereira 7
p j
Class 1
Class 2
...
Class Cj
Decisionr j
Figure 7: Scheme of the classification block.
classifier, which implement the algorithms that decide by theincidence or not of disturbances in the vectors f , h, and u, areevaluated.
From the vector f , four disjoint patterns of disturbances,which are named sag, swell, normal, and interruption, areprimitive patterns. So, the hypothesis test formulated in (13)is applied. If one considers the vector h, then one primitivepattern called harmonic is defined and the hypothesis testformulated in (14) is considered. Finally, for the vector u, itis well known that at least five disturbances or primitive pat-terns (interharmonics, spikes, notches, decaying oscillations,and damped exponentials) can occur simultaneously in thevector u. As a result, 25 = 32 classes of disturbances can beassociated with the vector u and a very complex hypothesestest should be formulated.
As the primitive patterns are being considered in thiswork, Figure 7 portrays the scheme of the classification tech-niques applied in the classifier blocks. Note that each classblock makes use of a simple classification technique i =1, . . . ,Cj , j = f ,h,u, that is responsible for classifying eachdisturbance in the vectors f , h, and u. Since Figure 7 refersto the classifier block applied to the feature vector p f , thenC f = 4. Ch = 1 if the feature vector ph is being analyzed.Finally, Cu = 32 when one tries to classify the disturbancesin the feature vector pu. Regarding u, one has to note thatusually three, two, or one disturbances can occur and, conse-quently, the number of disturbances classes are different foreach situation.
While the design of pattern classifiers to work with thefeature vectors extracted from vectors f and h are quite sim-ple, the design of those techniques for disturbances classifi-cation in the vector u could be a very hard task to be accom-plished. However, it is worth stating that the difficulties asso-ciated with the proposed scheme are lower than the ones as-sociated with standard techniques such as the ones proposedin [2, 3]; see results in Section 4. In fact, the proposed tech-nique provides higher performance than the recently devel-oped techniques for single and multiple disturbances.
3.1. Feature extraction based onhigh-order-statistics (HOS)
As stated in [41]: Feature extraction methods determine an ap-propriate subspace of dimensionality m (either in a linear or a
nonlinear way) in the original feature space of dimensional-ity d. Linear transforms, such as principal component analy-sis, factor analysis, linear discriminant analysis, and projectionpursuit have been widely used in pattern recognition for featureextraction and dimensionality reduction.
Despite the good performance achieved by these men-tioned feature extraction techniques, it has been recentlyrecognized that higher-order-statistics- (HOS-)based tech-niques are promising approaches for features extraction ifthe patterns are modeled as non-Gaussian processes. Ana-lyzing vectors f , h, and u, one should note that these randomvectors are usually modeled as an i.i.d. random processes inwhich the elements present a non-Gaussian probability massfunction (p.m.f.).
The cumulants of higher-order statistics provide muchmore relevant information from the random processes. Be-sides that, the cumulants are blind to any kind of Gaus-sian process, whereas 2nd-order information is not. Then,cumulant-based signal processing methods can handle col-ored Gaussian noise automatically, whereas 2nd-order meth-ods may not. Therefore, cumulant-based methods boostsignal-to-noise ratio when signals are corrupted by Gaussianmeasurement noise and can capture more information fromthe random vectors [42].
Remarkable results regarding detection, classification,and system identification with cumulant-based methodshave been reported in [42–45]. Also, a recent investigationof HOS for detection of disturbances in voltage signals re-ported that the HOS-based features extracted from voltagesignals can achieve high detection ratio in a frame as shortas 1/16 of one-cycle fundamental component immersed in anoisy environment [38].
By setting the lag τi = τ, i = 1, 2, 3, . . . , the expressions ofthe diagonal slice of second- , third- , and fourthorder cumu-lant elements of a zero mean and stationary random vector z,which is assumed to be one of the vectors f−E{f}, h−E{h},and u− E{u}, are expressed by [42]
c2,z(i) = E{z(n)z(n + i)
}, (29)
c3,z(i) = E{z(n)z2(n + i)
}, (30)
c4,z(i) = E{z(n)z3(n + i)
}− 3c2,z(i)c2,z(0), (31)
respectively, where i is the ith lag. Assuming that z is an N-length vector, the standard approximation of (29)–(31) is ex-pressed by
c2(i) := 2N
N/2−1∑n=0
z(n)z(n + i), (32)
c3(i) := 2N
N/2−1∑n=0
z(n)z2(n + i), (33)
c4(i) := 2N
N/2−1∑n=0
z(n)z3(n + i)
− 12N2
N/2−1∑n=0
z(n)z(n + i)N/2−1∑n=0
z2(n),
(34)
respectively, where i = 0, 1, 2, . . . ,N/2− 1.

8 EURASIP Journal on Advances in Signal Processing
Recently, other authors proposed the use of (29)–(31)when i = 0, whose evaluation is carried out by using thestandard approximation provided by (32)–(34), for the clas-sification of two disturbances and the attained results werereported between 98% and 100%, see [46]. In this technique,a 20th-order (very long and complex) elliptic filter to emulatea notch filter responsible for the extraction of the fundamen-tal component and to allow the disturbance classification onthe resulting transient signal is applied. One has to note that4th- or 6th-order notch filter could provide very good perfor-mance without such a huge complexity and delay to removethe fundamental component, see [37].
Additionally, we have verified that the technique intro-duced in [46] leads to a low classification performance dueto the following reasons. (i) If the disturbances are related tothe fundamental component, then the transient signal couldnot be representative to allow the classification of distur-bances. Note that the disturbances related to the fundamentalcomponent are sags, swells, interruptions, and unbalances. Itseems to be one reason for the results to be between 98% and100% and not very close to 100%, as reported in Section 4.(ii) The authors made use of HOS parameters when i = 0without the knowledge of the advantages offered by (29)–(31). In fact, from (29)–(31), one can note that there is a largenumber of HOS features to be extracted for further selection.As a result, the classification for two disturbances in voltagesignal proposed in [46] is very limited in the sense that manyand more representative features could be extracted. (iii) Ifthe electric signals are composed of multiple disturbances,then the feature vector extracted from the transient signalsdoes not allow well-defined classification regions as the onesprovided in [46] for only two disturbances. It fatally con-tributes to decrease the performance of classification tech-nique applied to other disturbances. (iv) The standard ap-proximation to extract HOS-based features is not appropri-ate if the frame length is short. As a result, a high samplingrate or a long frame length has to be applied to extract rep-resentative HOS-based features. One has to note that theseconcerns, by no means, disregard the use of the techniqueproposed in [46] for its intentional application. In fact, weare just pointing out the inadequacy of this technique to an-alyze the incidence of wide-ranging set of single and multipledisturbances in electric signals.
Due to the limitation of (32)–(34) to estimate the HOS-based features and based on the fact that the electric signalscan be seen as cyclic or/and quasicyclic ones, we propose inthis contribution the use of this information to define otherapproximation of HOS parameters. By using this informa-tion into (29)–(31), the new approximation for the HOS-based feature extractions can be expressed as follows:
c2,z(i) := 1N
N−1∑n=0
z(n)z[
mod(n + i,N)], (35)
c3,z(i) := 1N
N−1∑n=0
z(n)z2[mod(n + i,N)], (36)
c4,z(i) := 1N
N−1∑n=0
z(n)z3[mod(n + i,N)]
− 3N2
N−1∑n=0
z(n)z[
mod(n + i,N)] N−1∑n=0
z2(n),
(37)
where i = 0, 1, 2, . . . ,N − 1 and mod(a, b) is the modu-lus operator, which is defined as the remainder obtainedfrom dividing a by b. The approximations presented in (35)–(37) lead to a very interesting result where one has a short-ened finite-length vector from which HOS-based parame-ters have to be extracted. The use of mod(·) operator meansthat we are assuming that the vector z is an N-length cyclicvector. The reason for this refers to the fact that by usingsuch very simple assumption we can evaluate the approxima-tion of HOS-based parameters with all available N samples.Therefore, a reduced sampling rate and/or a shortened framelength could be valuable for HOS parameters estimation.That is one of the reasons for the improved performanceachieved by the proposed technique in Section 4. The use of(35)–(37) for improved disturbance detection was presentedin [38].
Now, suppose that the elements of the vector z =[z(0), z(1), . . . , z(N − 1)]T are organized from the smallestto the largest values and the vector composed of these valuesare expressed by zor = [zor(0), zor(1), . . . , zor(N −1)]T , wherezor(0) ≤ zor(1) ≤, . . . ,≤ zor(N − 1). If one replaces the vectorz by the vector zor in (32)–(37), then the extracted cumu-lants are named ordered HOS-based features [47]. By doingso, the set of HOS-based features is composed of several el-ements. The HOS-based feature vector, whose elements arecandidates for use in the proposed classification technique,extracted from the vectors z and zor, is given by
pi =[
cTz cTzor
]T, i = 1, 2, (38)
where z denotes f , h, and u, i = 1 refers to a normal conditionof voltage signals, i = 2 denotes the incidence of single ormultiple disturbances in the vector z,
cz =[
cTz cTz]T = [cT2,z cT3,z cT4,z cT2,z cT4,z cT4,z
]T, (39)
czor =[
cTzorcTzor
]T = [cT2,zorcT3,zor
cT4,zorcT2,zor
cT3,zorcT4,zor
]T, (40)
where
c j,z =[c j,z(0)c j,z(1) · · · c j,z
(N
2− 1
)]T,
c j,z =[c j,z(0)c j,z(1) · · · c j,z(N − 1)
]T,
c j,zor =[c j,zor (0)c j,zor (1) · · · c j,zor
(N
2− 1
)]T,
c j,zor =[c j,zor (0)c j,zor (1) · · · c j,zor (N − 1)
]T,
(41)
where j = 2, 3, 4.

M. V. Ribeiro and J. L. R. Pereira 9
200 400 600 800 1000 1200 1400
Feature vector
0
2
4
FDR
valu
es
(a)
200 400 600 800 1000 1200 1400
Feature vector
0
2
4
FDR
valu
es
(b)
500 1000 1500 2000 2500 3000
Feature vector
0
2
4
FDR
valu
es
(c)
500 1000 1500 2000 2500 3000
Feature vector
0
2
4
FDR
valu
es
(d)
Figure 8: FDR values related to (a) c f , (b) c for , (c) c f , and (d) c for
feature vectors when the disturbance is sag.
3.2. Feature selection technique
As commented in [41] “The problem of feature selection is de-fined as follows: given a set of d features, select a subset of size mthat leads to the smallest classification error. The feature selec-tion is typically done in an off-line manner and the executiontime of a particular algorithm is not as critical as the optimalityof the feature subset it generates.”
The need for the use of feature selection technique in theset of features extracted from voltage and current signals isdue to the fact that the feature set is very large. Aiming atthe choice of a representative, finite, and reduced set of fea-tures from powerline signals that provides a good separabil-ity among distinct classification regions associated with allprimitive patterns, the use of the Fisher’s discriminant ratio(FDR) is applied [48].
The reason for using the FDR and not other feature se-lection technique such as sequential forward floating search(SFFS) or sequential backward floating search (SBFS) is thatthe FDR technique presented good results for this applica-tion. The FDR vector which leads to a separability in a low-dimensional space between sets of feature vectors associated
200 400 600 800 1000 1200 1400
Feature vector
0
10
20
FDR
valu
es
(a)
200 400 600 800 1000 1200 1400
Feature vector
0
10
20
FDR
valu
es
(b)
500 1000 1500 2000 2500 3000
Feature vector
0
10
20
FDR
valu
es
(c)
500 1000 1500 2000 2500 3000
Feature vector
0
10
20
FDR
valu
es
(d)
Figure 9: FDR values related to (a) c f , (b) c for , (c) c f , and (d) c for
feature vectors when the disturbance is swell.
with different primitive patterns is given by
Jc =(
m1 −m2)2 � 1
D21 + D2
2, (42)
where Jc = [J1 · · · JLl ]T , Ll is the total number of features,m1 and m2, and D2
1 and D22 are the means and variances vec-
tors of parameters vectors p1,k, k = 1, 2, . . . ,Mp, and p2,k,k = 1, 2, . . . ,Mp. p1,k and p2,k are feature vectors extractedfrom the kth voltage signals with and without disturbancesand Mp denotes the total number of feature vectors for theclasses of disturbances associated with the presence or not ofdisturbances. The symbol � refers to the Hadarmard prod-uct r� s = [r0s0 · · · rLr−1sLr−1]T . The ith element of the FDRvector, see (42), having the highest value, Jc(i), is selected foruse in the classification technique. Applying the same proce-dure, K features associated with the K highest FDR values areselected.
Figures 8, 9, 10, 11, 12, 13, 14 depict the FDR values forthe features extracted from vectors f , h, and u, respectively,when N = 1024 and fs = 256 × 60 Hz. One can note thatthe large number of extracted feature allows a better choiceof features for single and multiple disturbances classification.

10 EURASIP Journal on Advances in Signal Processing
200 400 600 800 1000 1200 1400
Feature vector
0
10
20
FDR
valu
es
(a)
200 400 600 800 1000 1200 1400
Feature vector
0
10
20
FDR
valu
es
(b)
500 1000 1500 2000 2500 3000
Feature vector
0
10
20
FDR
valu
es
(c)
500 1000 1500 2000 2500 3000
Feature vector
0
10
20
FDR
valu
es
(d)
Figure 10: FDR values related to (a) c f , (b) c for , (c) c f , and (d) c for
feature vectors when the disturbance is interruption.
200 400 600 800 1000 1200 1400
Feature vector
0
5
10
FDR
valu
es
(a)
200 400 600 800 1000 1200 1400
Feature vector
0
5
10
FDR
valu
es
(b)
500 1000 1500 2000 2500 3000
Feature vector
0
5
10
FDR
valu
es
(c)
500 1000 1500 2000 2500 3000
Feature vector
0
5
10
FDR
valu
es
(d)
Figure 11: FDR values related to (a) ch, (b) chor , (c) ch, and (d) chor
feature vectors when the disturbance is harmonic.
200 400 600 800 1000 1200 1400
Feature vector
0
5
10
FDR
valu
es
(a)
200 400 600 800 1000 1200 1400
Feature vector
0
5
10
FDR
valu
es
(b)
500 1000 1500 2000 2500 3000
Feature vector
0
5
10
FDR
valu
es
(c)
500 1000 1500 2000 2500 3000
Feature vector
0
5
10
FDR
valu
es
(d)
Figure 12: FDR values related to (a) cu, (b) cuor , (c) cu, and (d) cuor
feature vectors when the disturbance is impulsive transient.
200 400 600 800 1000 1200 1400
Feature vector
050
100
FDR
valu
es
(a)
200 400 600 800 1000 1200 1400
Feature vector
050
100
FDR
valu
es
(b)
500 1000 1500 2000 2500 3000
Feature vector
050
100
FDR
valu
es
(c)
500 1000 1500 2000 2500 3000
Feature vector
050
100
FDR
valu
es
(d)
Figure 13: FDR values related to (a) cu, (b) cuor , (c) cu, and (d) cuor
feature vectors when the disturbance is notch.

M. V. Ribeiro and J. L. R. Pereira 11
200 400 600 800 1000 1200 1400
Feature vector
0
5
10
FDR
valu
es
(a)
200 400 600 800 1000 1200 1400
Feature vector
0
5
10
FDR
valu
es
(b)
500 1000 1500 2000 2500 3000
Feature vector
0
5
10
FDR
valu
es
(c)
500 1000 1500 2000 2500 3000
Feature vector
0
5
10
FDR
valu
es
(d)
Figure 14: FDR values related to (a) cu, (b) cuor , (c) cu, and (d) cuor
feature vectors when the disturbance is oscillatory transient.
These pictures illustrate very well the limitation of the HOS-based technique proposed in [46]. In fact, the use of HOS-based features when the lag τ = 0 is not a good choice be-cause for each primitive pattern there is a distinct set of fea-tures that improves the classification ratio. Finally, to evalu-ate the HOS-based features one can note that for the majorityof the disturbance considered, the use of the approximationproposed in this contribution is better than the standard ap-proximation.
3.3. Pattern recognition technique
Pattern recognition techniques have been successfully ap-plied to power-quality applications. In these applications,the primitive patterns are represented by feature vector p j ,j = f ,h,u, or attributes viewed as a d-dimensional vectors.From the feature vectors, a decision, making process can besummarized as follows: a given pattern is to be assigned toone of c categories ω1,ω2,ω3, . . . ,ωc based on a vector of dfeatures.
Assuming that the features have a probability of massfunction conditioned on the pattern class, then a vector p j ,j = f ,h,u, associated with a pattern belonging to the class ωi
is viewed as an observation drawn randomly from the class-conditional probability function p(p j | ωi). If the a priori
0 0.01 0.02 0.03 0.04 0.05 0.06
Time (s)
−2
0
2
Am
plit
ude
(a)
0 0.01 0.02 0.03 0.04 0.05 0.06
Time (s)
−2
0
2
Am
plit
ude
(b)
0 0.01 0.02 0.03 0.04 0.05 0.06
Time (s)
−2
0
2
Am
plit
ude
(c)
Figure 15: Typical single disturbances related to vector f . (a)–(c)are samples of disturbances called sag, swell, and interruptions, re-spectively.
probability as well as the parameters of the conditioned prob-abilities are known, partially known or unknown, then differ-ent critera based on Bayes theory (ML, MAP, etc.), Neyman-Pearson, and so forth can be designed for obtaining the op-timum decision boundaries among the c classes in the d-dimensional feature vector space.
Assuming that the conditional probabilities functions areknown and modeled as Gaussian ones, classifiers based onthe maximum likelihood (ML) criterion are designed. If theGaussian function parameters are estimated from the train-ing data, which is our situation, then the likelihood ratio testof the maximum likelihood (ML) criterion is given by
pPi|Hi, j,0
(pi |Hi, j,0
)pPi|Hi, j,1
(pi |Hi, j,1
)≥<π0
π1, (43)
where π0 = 1/2 and π1 = 1/2 are the a priori probabilitiesof incidence or not of a single disturbance associated withthe voltage signals, i = f ,h,u refers to the primitive compo-nent represented by the vectors f , h, and u. j = 1, . . . ,Ci isthe jth primitive disturbance or primitive pattern associatedwith the ith primitive component. pi, i = f ,h,u, is the fea-ture vector, Hi, j,0, j = 1, . . . ,Ci, is the hypothesis without

12 EURASIP Journal on Advances in Signal Processing
0 0.01 0.02 0.03 0.04 0.05 0.06
Time (s)
−2
−1.5
−1
−0.5
0
0.5
1
1.5
2
Am
plit
ude
Figure 16: Harmonic disturbance associated with vector h.
0 0.01 0.02 0.03 0.04 0.05 0.06
Time (s)
−2
0
2
Am
plit
ude
(a)
0 0.01 0.02 0.03 0.04 0.05 0.06
Time (s)
−2
0
2
Am
plit
ude
(b)
0 0.01 0.02 0.03 0.04 0.05 0.06
Time (s)
−2
0
2
Am
plit
ude
(c)
Figure 17: Disturbances associated with the vector u. (a) is a sampleof impulsive transient, (b) is a sample of notch, and (c) is a sampleof a damped oscillation.
no incidence of the jth primitive disturbance (pattern) inthe ith primitive component. Hi, j,1, j = 1, . . . ,Ci, is the hy-pothesis with the presence of the jth primitive disturbancein the ith primitive component. Equation (43) is appliedto detect the existence of disturbances in the vectors f , h,and u.
4. NUMERICAL RESULTS
The performance of the proposed technique to classify sin-gle and multiple disturbances in voltage signals is evaluatedand compared with another technique. In Section 4.1, someresults obtained with the proposed technique applied to clas-sify single and multiple disturbances in f , h, and u compo-nents are provided and discussed. Thereafter, in Section 4.2,comparison results between the proposed technique andthe one proposed in [2], developed recently to classify sin-gle and multiple disturbances in voltage signal by consid-ering the voltage disturbances defined in [2, 3], are pre-sented.
4.1. Performance of the proposed method
To verify the performance of the proposed technique to clas-sify disturbances in the vectors f , h, and u, simulations werecarried out with several waveforms of voltage signals gener-ated with a sampling rate equal to fs = 256 × 60 samplesper second (sps) and 32 bits for amplitude quantization. Theselected primitive patterns are sag, swell, interruption, har-monic, impulsive transient, notch, and damped oscillation.Figures 15, 16, 17 show single disturbances associated withthe vectors f , h, and u, respectively.
Table 1 lists the attained classification ratio with theproposed technique applied to classify the set of primi-tive patterns (sag, swell, and interruption) that are associ-ated with the vector f . The following considerations weretaken into account for the following simulations: (i) N =128, 256, 512, 768, and 1024, then the lengths of the vec-tor f correspond to 1/2, 1, 2, 3, and 4 cycles of the funda-mental component; (ii) feature vector p f with four HOS-based features, which were previously selected with the FDRtechnique, for each primitive pattern; (iii) two thousandsets of primitive patterns generated and equally divided intotraining and test data; (iv) the use of Bayes detection tech-nique based on the ML criterion as given by (43); (v) σ2
v =−30 dB; (vi) the amplitude of the fundamental component,A0, assumes values to characterize the disturbances in ac-cordance with the IEEE 1159-1995 Standard [49] and thephase, θ0, is modeled as uniform random variable in theinterval (0, 2π]; (viii) the preprocessing block was imple-mented with finite word length with 16 bits. Figures 18,19, 20 portray the selected features extracted from vectorf by using the FDR to verify the occurrence of interrup-tions, sags, and swell. In these plots, the symbols ∗ and ◦are associated with the occurrence or not of each distur-bance in the test data. One can note that there are linearseparations, then the Bayesian classifiers reduces to a linearones.
From the results listed in Table 1, one notes that the pro-posed technique achieves good performance. In Table 1, Cmeans cycles of the fundamental component and CR refersto the classification ratio in percentage. The improvementsshown here refer to the attained CR ∼= 100% if the lengths ofvector f correspond to 1, 2, 3, and 4 cycles of the fundamentalcomponent. In the previously developed methods, the results

M. V. Ribeiro and J. L. R. Pereira 13
Table 1: Performance of the proposed technique to classify disturbances in the vector f .
Frame length Interruption (CR in %) Sag(CR in %) Swell(CR in %)
1C 99.93 99.95 100
2C 99.96 99.97 100
3C 100 99.98 100
4C 100 100 100
0 100 200 300 400 500
Feature vector
−0.08
−0.07
−0.06
−0.05
−0.04
−0.03
−0.02
−0.01
0
0.01
α1
With interruptionWithout interruption
Figure 18: HOS-based features extracted from f for interruptionα1 = c2, f (68).
−3 −2.5 −2 −1.5 −1 −0.5 0 0.5
α2
−0.03
−0.02
−0.01
0
0.01
0.02
0.03
0.04
0.05
α1
With sagWithout sag
Figure 19: HOS-based features extracted from vector f for sag α1 =c4, f (512) and α2 = c2, f (194).
are reported when N ≥ 1024 or, at least, 4 cycles of the fun-damental component, see [3, 5, 28, 32].
0 100 200 300 400 500
Feature vector
−0.06
−0.05
−0.04
−0.03
−0.02
−0.01
0
0.01
0.02
α1
With swellWithout swell
Figure 20: HOS-based features extracted from vector f for swellα1 = c2, f (191).
0 100 200 300 400 500
Feature vector
0
0.01
0.02
0.03
0.04
0.05
0.06
0.07
0.08
α1
With harmonicsWithout harmonics
Figure 21: HOS-based features extracted from h α = c2,h(0).
The numerical analysis of the proposed technique for theclassification of primitive pattern in voltage signals named

14 EURASIP Journal on Advances in Signal Processing
Table 2: Performance of the proposed technique for harmonic clas-sification.
Frame length CR in %
1/2C 100
1C 100
2C 100
3C 100
4C 100
harmonic was carried out by taking into account the fol-lowing considerations: (i) N = 128, 256, 512, 768, and 1024and, consequently, the lengths of the vector h correspondto 1, 2, 3, and 4 cycles of the fundamental component; (ii)two thousand sets of harmonic disturbances equally di-vided in training and test patterns were considered; (iii)Bayes detection technique based on the ML criterion wasdesigned; (iv) σ2
v = −30 dB; (iv) the harmonic compo-nents, whose frequency are mω0, m = 3, 5, 7, 9, 11, 13, and15, have amplitudes Ai and θi modeled as uniform ran-dom variables in the intervals (0.01, 0.4] and (0, 2π], respec-tively; (v) feature vector ph composed of one element se-lected by FDR criterion. The generated harmonics complywith the IEEE 1159-1995 standard [49]. Figure 21 shows theselected HOS feature obtained from vector h to detect har-monic presence. The symbols ∗ and ◦ are associated withthe occurrence or not of harmonic in the test data, respec-tively.
The results achieved with the proposed technique arepresented in Table 2. The CR as high as 100% is not novelif N ≥ 1024 or, at least, 4 cycles of the fundamental com-ponent are taken into account [3, 5, 28, 32]. The noveltyhere is the fact that the proposed technique is capable ofachieving CR as high as 100% if the length of vector h cor-responds to 1/2, 1, 2, 3, and 4 cycles of the fundamental com-ponent.
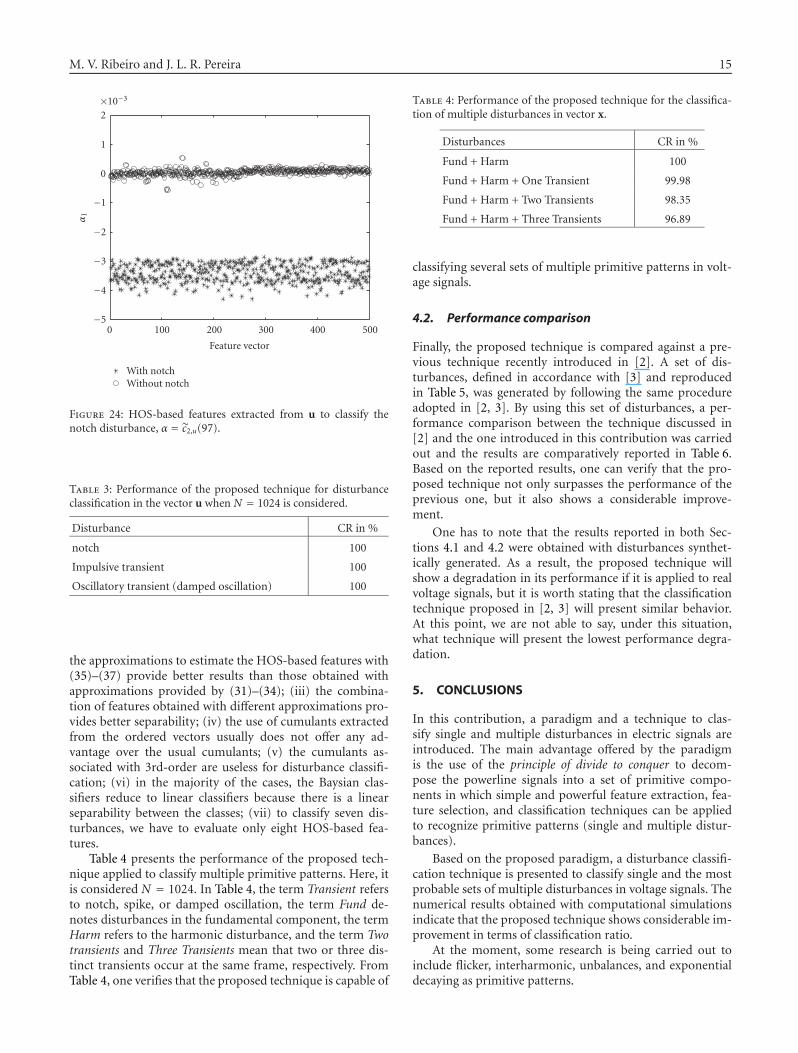
To check the effectiveness of the proposed technique forthe classification of primitive patterns in the vector u, the fol-lowing considerations were taken into account: (i) N = 1024,which corresponds to four cycles of the fundamental compo-nent; (ii) four-length feature vector pu in which all elementsare selected with the FDR technique; (iii) 3000 sets of dis-turbances such as impulsive transients, notches, and dampedoscillations equally divided into training and test data; (iv)Bayes detection technique based on the ML criterion; (v) ad-ditive noise power equal to σ2
v = −30 dB; and (vi) single in-cidence of disturbances in the vector x that appears in theprimitive component represented by the vector u. Figures 22,23, 24 depict the selected HOS-based features that were ex-tracted from vector u to classify the disturbances as oscil-latory transient (damped oscillations), impulsive transient,and notch. In these figures, the symbols ∗ and ◦ are associ-ated with the occurrence or not of each disturbance in thetest data.
The attained results with the test data are shown inTable 3. One can note that the proposed technqiue is capa-
0 100 200 300 400 500
Feature vector
−1
0
1
2
3
4
5
6
7
8
9
×10−3
α1
With damped oscillationWithout damped oscillation
Figure 22: HOS-based features extracted from u to classify the os-cillatory transient named damped oscillation, α1 = c2,u(257).
−8 −6 −4 −2 0 2 4 6×10⁻³
α2
−3
−2
−1
0
1
2
3
4
5
6×10⁻³
α1
With impulsive transientWithout impulsive transient
Figure 23: HOS-based features extracted from u to classify the im-pulsive transient α1 = c2,u(4) and α2 = c2,u(511).
ble of classifying almost all primitive patterns in the vectoru.
From the results reported in Tables 1–3, in Figures 8–14, and in Figures 18–24, one can make the following ob-servations: (i) based on the results obtained with FDR fea-ture selection technique, comulants related to 2nd-orderstatistics are more appropriate features for disturbance clas-sification in voltage signals; (ii) in the majority of the cases,
M. V. Ribeiro and J. L. R. Pereira 15
0 100 200 300 400 500
Feature vector
−5
−4
−3
−2
−1
0
1
2×10⁻³
α1
With notchWithout notch
Figure 24: HOS-based features extracted from u to classify thenotch disturbance, α = c2,u(97).
Table 3: Performance of the proposed technique for disturbanceclassification in the vector u when N = 1024 is considered.
Disturbance CR in %
notch 100
Impulsive transient 100
Oscillatory transient (damped oscillation) 100
the approximations to estimate the HOS-based features with(35)–(37) provide better results than those obtained withapproximations provided by (31)–(34); (iii) the combina-tion of features obtained with different approximations pro-vides better separability; (iv) the use of cumulants extractedfrom the ordered vectors usually does not offer any ad-vantage over the usual cumulants; (v) the cumulants as-sociated with 3rd-order are useless for disturbance classifi-cation; (vi) in the majority of the cases, the Baysian clas-sifiers reduce to linear classifiers because there is a linearseparability between the classes; (vii) to classify seven dis-turbances, we have to evaluate only eight HOS-based fea-tures.
Table 4 presents the performance of the proposed tech-nique applied to classify multiple primitive patterns. Here, itis considered N = 1024. In Table 4, the term Transient refersto notch, spike, or damped oscillation, the term Fund de-notes disturbances in the fundamental component, the termHarm refers to the harmonic disturbance, and the term Twotransients and Three Transients mean that two or three dis-tinct transients occur at the same frame, respectively. FromTable 4, one verifies that the proposed technique is capable of
Table 4: Performance of the proposed technique for the classifica-tion of multiple disturbances in vector x.
Disturbances CR in %
Fund + Harm 100
Fund + Harm + One Transient 99.98
Fund + Harm + Two Transients 98.35
Fund + Harm + Three Transients 96.89
classifying several sets of multiple primitive patterns in volt-age signals.
4.2. Performance comparison
Finally, the proposed technique is compared against a pre-vious technique recently introduced in [2]. A set of dis-turbances, defined in accordance with [3] and reproducedin Table 5, was generated by following the same procedureadopted in [2, 3]. By using this set of disturbances, a per-formance comparison between the technique discussed in[2] and the one introduced in this contribution was carriedout and the results are comparatively reported in Table 6.Based on the reported results, one can verify that the pro-posed technique not only surpasses the performance of theprevious one, but it also shows a considerable improve-ment.
One has to note that the results reported in both Sec-tions 4.1 and 4.2 were obtained with disturbances synthet-ically generated. As a result, the proposed technique willshow a degradation in its performance if it is applied to realvoltage signals, but it is worth stating that the classificationtechnique proposed in [2, 3] will present similar behavior.At this point, we are not able to say, under this situation,what technique will present the lowest performance degra-dation.
5. CONCLUSIONS
In this contribution, a paradigm and a technique to clas-sify single and multiple disturbances in electric signals areintroduced. The main advantage offered by the paradigmis the use of the principle of divide to conquer to decom-pose the powerline signals into a set of primitive compo-nents in which simple and powerful feature extraction, fea-ture selection, and classification techniques can be appliedto recognize primitive patterns (single and multiple distur-bances).
Based on the proposed paradigm, a disturbance classifi-cation technique is presented to classify single and the mostprobable sets of multiple disturbances in voltage signals. Thenumerical results obtained with computational simulationsindicate that the proposed technique shows considerable im-provement in terms of classification ratio.
At the moment, some research is being carried out toinclude flicker, interharmonic, unbalances, and exponentialdecaying as primitive patterns.

16 EURASIP Journal on Advances in Signal Processing
Table 5: Power quality disturbance models following [3].
PQ disturbance Class Model Parameters
Normal C1 x(t) = A0 sin(ω0t) A0 = 1
Swell C2
x(t) = A0{1 + α[u(t − t1)− u(t − t2)]} sin(ω0t)
t1 < t2,u(t) =⎧⎪⎨⎪⎩
1, t ≥ 0
0, t < 0
0.1 ≤ α ≤ 0.8
T ≤ t2 − t1 ≤ 9T
Sag C3 x(t) = A0{1− α[u(t − t1)− u(t − t2)]} sin(ω0t) 0.1 ≤ α ≤ 0.8, T ≤ t2 − t1 ≤ 9T
Harmonic C4x(t) = A0[α1 sin(ω0t) + α3 sin(3ω0t)
+α5 sin(5ω0t) + α7 sin(7ω0t)]
0.05 ≤ α3 ≤ 0.15, 0.05 ≤ α5 ≤ 0.15
0.05 ≤ α7 ≤ 0.15,∑α2i = 1
Outage C5 x(t) = A0{1− α[u(t − t1)− u(t − t2)]} sin(ω0t) 0.9 ≤ α ≤ 0.1, T ≤ t2 − t1 ≤ 9T
Sag + Harmonic C6
x(t) = A0{1− α[u(t − t1)−u(t − t2)]}[α0 sin(ω0t)
+α3 sin(3ω0t) + α5 sin(5ω0t)]
0.1 ≤ α ≤ 0.9, T ≤ t2 − t1 ≤ 9T
0.05 ≤ α3 ≤ 0.15, 0.05 ≤ α5 ≤ 0.15,∑α2i = 1
Swell + Harmonic C7
x(t)=A0{1+α[u(t − t1)
−u(t−t2)]}[α0 sin(ω0t)
+α3 sin(3ω0t) + α5 sin(5ω0t)]
0.1 ≤ α ≤ 0.9, T ≤ t2 − t1 ≤ 9T
0.05 ≤ α3 ≤ 0.15, 0.05 ≤ α5 ≤ 0.15,∑α2i = 1
Table 6: Performance comparison in terms of classification ratio(%) achieved by proposed technique and the technique proposedin [2].
Class Proposed technique Technique proposed in [2]
C1 100 100
C2 100 100
C3 100 85.55
C4 100 100
C5 100 82
C6 100 96.50
C7 100 100
ACKNOWLEDGMENTS
This work was supported in part by CNPq under Grants150064/2005-5 and 550178/2005-8 and FAPEMIG underGrant TEC 00181/06, all from Brazil.
REFERENCES
[1] M. V. Ribeiro, Signal processing techniques for power line com-munication and power quality applications, Ph.D. thesis, De-partment of Communications, University of Campinas, SaoPaulo, Brazil, April 2005.
[2] H. He and J. A. Starzyk, “A self-organizing learning array sys-tem for power quality classification based on wavelet trans-form,” IEEE Transactions on Power Delivery, vol. 21, no. 1, pp.286–295, 2006.
[3] T. K. Abdel-Galil, M. Kamel, A. M. Youssef, E. F. El-Saadany,and M. M. A. Salama, “Power quality disturbance classifica-tion using the inductive inference approach,” IEEE Transac-tions on Power Delivery, vol. 19, no. 4, pp. 1812–1818, 2004.
[4] T. X. Zhu, S. K. Tso, and K. L. Lo, “Wavelet-based fuzzy reason-ing approach to power-quality disturbance recognition,” IEEE
Transactions on Power Delivery, vol. 19, no. 4, pp. 1928–1935,2004.
[5] M. Wang and A. V. Mamishev, “Classification of power qualityevents using optimal time-frequency representations—part 1:theory,” IEEE Transactions on Power Delivery, vol. 19, no. 3, pp.1488–1495, 2004.
[6] M. S. Azam, F. Tu, K. R. Pattipati, and R. Karanam, “A depen-dency model-based approach for identifying and evaluatingpower quality problems,” IEEE Transactions on Power Delivery,vol. 19, no. 3, pp. 1154–1166, 2004.
[7] M. Wang, G. I. Rowe, and A. V. Mamishev, “Classifica-tion of power quality events using optimal time-frequencyrepresentations—part 2: application,” IEEE Transactions onPower Delivery, vol. 19, no. 3, pp. 1496–1503, 2004.
[8] Z.-L. Gaing, “Wavelet-based neural network for power dis-turbance recognition and classification,” IEEE Transactions onPower Delivery, vol. 19, no. 4, pp. 1560–1568, 2004.
[9] J. Chung, E. J. Powers, W. M. Grady, and S. C. Bhatt, “Powerdisturbance classifier using a rule-based method and waveletpacket-based hidden Markov model,” IEEE Transactions onPower Delivery, vol. 17, no. 1, pp. 233–241, 2002.
[10] W. R. A. Ibrahim and M. M. Morcos, “A power quality per-spective to system operational diagnosis using fuzzy logic andadaptive techniques,” IEEE Transactions on Power Delivery,vol. 18, no. 3, pp. 903–909, 2003.
[11] I. W. C. Lee and P. K. Dash, “S-transform-based intelligentsystem for classification of power quality disturbance signals,”IEEE Transactions on Industrial Electronics, vol. 50, no. 4, pp.800–805, 2003.
[12] P. K. Dash, B. K. Panigrahi, D. K. Sahoo, and G. Panda, “Powerquality disturbance data compression, detection, and classifi-cation using integrated spline wavelet and S-transform,” IEEETransactions on Power Delivery, vol. 18, no. 2, pp. 595–600,2003.
[13] J. Huang, M. Negnevitsky, and D. T. Nguyen, “A neural-fuzzyclassifier for recognition of power quality disturbances,” IEEETransactions on Power Delivery, vol. 17, no. 2, pp. 609–616,2002.

M. V. Ribeiro and J. L. R. Pereira 17
[14] A. M. Gaouda, S. H. Kanoun, M. M. A. Salama, and A. Y.Chikhani, “Wavelet-based signal processing for disturbanceclassification and measurement,” IEE Proceedings: Generation,Transmission and Distribution, vol. 149, no. 3, pp. 310–318,2002.
[15] M. Kezunovic and Y. Liao, “A novel software implementationconcept for power quality study,” IEEE Transactions on PowerDelivery, vol. 17, no. 2, pp. 544–549, 2002.
[16] J. Y. Lee, Y. J. Won, J.-M. Jeong, and S. W. Nam, “Classifica-tion of power disturbance using feature extraction in time-frequency plane,” Electronics Letters, vol. 38, no. 15, pp. 833–835, 2002.
[17] T. A. Hoang and D. T. Nguyen, “Improving training of ra-dial basis function network for classification of power qualitydisturbances,” Electronics Letters, vol. 38, no. 17, pp. 976–977,2002.
[18] J. V. Wijayakulasooriya, G. A. Putrus, and P. D. Minns,“Electric power quality disturbance classification using self-adapting artificial neural networks,” IEE Proceedings: Genera-tion, Transmission and Distribution, vol. 149, no. 1, pp. 98–101,2002.
[19] E. Styvaktakis, M. H. J. Bollen, and I. Y. H. Gu, “Expert systemfor classification and analysis of power system events,” IEEETransactions on Power Delivery, vol. 17, no. 2, pp. 423–428,2002.
[20] S. Santoso, W. M. Grady, E. J. Powers, J. Lamoree, and S. C.Bhatt, “Characterization of distribution power quality eventswith Fourier and wavelet transforms,” IEEE Transactions onPower Delivery, vol. 15, no. 1, pp. 247–254, 2000.
[21] M. Kezunovic and Y. Liao, “A new method for classificationand characterization of voltage sags,” Electric Power SystemsResearch, vol. 58, no. 1, pp. 27–35, 2001.
[22] P. K. Dash, R. K. Jena, and M. M. A. Salama, “Power qualitymonitoring using an integrated Fourier linear combiner andfuzzy expert system,” International Journal of Electrical Power& Energy System, vol. 21, no. 7, pp. 497–506, 1999.
[23] A. M. Gaouda, M. M. A. Salama, M. R. Sultan, and A. Y.Chikhani, “Power quality detection and classification usingwavelet-multiresolution signal decomposition,” IEEE Transac-tions on Power Delivery, vol. 14, no. 4, pp. 1469–1476, 1999.
[24] S.-J. Huang, C.-T. Hsieh, and C.-L. Huang, “Application ofwavelets to classify power system disturbances,” Electric PowerSystems Research, vol. 47, no. 2, pp. 87–93, 1998.
[25] C. H. Lee and S. W. Nam, “Efficient feature vector extractionfor automatic classification of power quality disturbances,”Electronics Letters, vol. 34, no. 11, pp. 1059–1061, 1998.
[26] J. S. Lee, C. H. Lee, J. O. Kim, and S. W. Nam, “Classification ofpower quality disturbances using orthogonal polynomial ap-proximation and bispectra,” Electronics Letters, vol. 33, no. 18,pp. 1522–1524, 1997.
[27] A. K. Ghosh and D. L. Lubkeman, “The classification of powersystem disturbance waveforms using a neural network ap-proach,” IEEE Transactions on Power Delivery, vol. 10, no. 1,pp. 109–115, 1995.
[28] A. M. Youssef, T. K. Abdel-Galil, E. F. El-Saadany, and M.M. A. Salama, “Disturbance classification utilizing dynamictime warping classifier,” IEEE Transactions on Power Delivery,vol. 19, no. 1, pp. 272–278, 2004.
[29] C. A. Duque, M. V. Ribeiro, F. R. Ramos, and J. Szczupak,“Power quality event detection based on the divide and con-quer principle and innovation concept,” IEEE Transactions onPower Delivery, vol. 20, no. 4, pp. 2361–2369, 2005.
[30] M. V. Ribeiro and J. L. R. Pereira, “An efficient method for theclassification of isolated and multiple disturbances in powerline signals,” in Proceedings of the 12th International Confer-ence on Harmonics and Quality of Power (ICHQP ’06), Cascais,Portugal, October 2006.
[31] D. D. Ferreira, A. S. Cerqueira, M. V. Ribeiro, and C. A. Duque,“HOS-based method for power quality event classification,” inProceedings of the 14th European Signal Processing Conference(EUSIPCO ’06), vol. 1, pp. 200–206, Florence, Italy, September2006.
[32] A. S. Cerqueira, M. V. Ribeiro, C. A. Duque, and D. D. Fer-reira, “Power quality events recognition using a SVM-basedmethod,” to appear in Electric Power System Research.
[33] H. L. van Trees, Detection, Estimation and Modulation Theory,Part I, Springer, New York, NY, USA, 1968.
[34] H. L. van Trees, Detection, Estimation and Modulation Theory,Part III, Springer, New York, NY, USA, 1971.
[35] R. N. McDonough and A. D. Whalen, Detection of Signals inNoise, Academic Press, London, UK, 1995.
[36] IEEE 519 Working Group, “IEEE 519-1995 recommendedpractices and requirements for harmonic control in electricalpower systems institute of electrical and electronics engineers,”May 1992.
[37] J. R. Carvalho, P. H. Gomes, A. S. Cerqueira, M. V. Ribeiro,C. A. Duque, and J. Szczupak, “PLL based multirate harmonicestimation,” in IEEE PES General Meeting, Tampa, Fla, USA,2007.
[38] M. V. Ribeiro, C. A. G. Marques, C. A. Duque, A. S. Cerqueira,and J. L. R. Pereira, “Detection of disturbances in voltage sig-nals for power quality analysis using HOS,” EURASIP Journalon Advances in Signal Processing, vol. 2007, Article ID 59786,13 pages, 2007.
[39] J. Kauraniemi, T. I. Laakso, I. Hartimo, and S. J. Ovaska, “Deltaoperator realizations of direct-form IIR filters,” IEEE Transac-tions on Circuits and Systems II, vol. 45, no. 1, pp. 41–52, 1998.
[40] R. H. Middleton and G. C. Goodwin, “Improved finite wordlength characteristics in digital control using delta operators,”IEEE Transactions on Automatic Control, vol. 31, no. 11, pp.1015–1021, 1986.
[41] A. K. Jain, R. P. W. Duin, and J. Mao, “Statistical pattern recog-nition: a review,” IEEE Transactions on Pattern Analysis andMachine Intelligence, vol. 22, no. 1, pp. 4–37, 2000.
[42] J. M. Mendel, “Tutorial on higher-order statistics (spectra) insignal processing and system theory: theoretical results andsome applications,” Proceedings of the IEEE, vol. 79, no. 3, pp.278–305, 1991.
[43] C. Nikias and J. Mendel, “Signal processing with higher-orderstatistics,” IEEE Transactions on Signal Processing, vol. 41, no. 1,pp. 10–38, 1999.
[44] C. L. Nikias and A. P. Petropulu, Hiher-Order SpectraAnalysis—A Nonlinear Signal Processing Framework, Prentice-Hall, Englewood Cliffs, NJ, USA, 1993.
[45] M. Frisch and H. Messer, “Transient signal detection usingprior information in the likelihood-ratio-test,” IEEE Transac-tions on Signal Processing, vol. 41, no. 6, pp. 2177–2192, 1993.
[46] O. N. Gerek and D. G. Ece, “Power-quality event analysis usinghigher order cumulants and quadratic classifiers,” IEEE Trans-actions on Power Delivery, vol. 21, no. 2, pp. 883–889, 2006.
[47] B. Picinbono, “Polyspectra of ordered signals,” IEEE Trans-actions on Information Theory, vol. 45, no. 7, pp. 2239–2252,1999.

18 EURASIP Journal on Advances in Signal Processing
[48] S. Theodoridis and K. Koutroumbas, Pattern Recognition, Aca-demic Press, San Diego, Calif, USA, 1999.
[49] IEEE 1159 Working Group, “IEEE 1159-1995 recommendedpractice on monitoring electrical power quality,” November1995.
Moises Vidal Ribeiro was born in Tres Rios,Brazil, in 1974. He received the B.S. de-gree in electrical engineering from the Fed-eral University of Juiz de Fora (UFJF), Juizde Fora, Brazil, in 1999, and the M.S. andPh.D. degrees in electrical engineering fromthe University of Campinas (UNICAMP),Campinas, Brazil, in 2001 and 2005, respec-tively. Currently, he is an Assistant Profes-sor at UFJF. Dr. Ribeiro was a Visiting Re-searcher in the Image and Signal Processing Laboratory of the Uni-versity of California, Santa Barbara, in 2004, a Postdoctoral Re-searcher at UNICAMP, in 2005, and at UFJF from 2005 to 2006. Heis guest editor for the Special Issues on Emerging Signal ProcessingTechniques for Power Quality Applications and on Advanced SignalProcessing and Computational Intelligence Techniques for PowerLine Communications for the EURASIP Journal on Applied SignalProcessing and reviewer of international journals. He has been au-thor of 15 journals and 41 conference papers, and holds six patents.His research interests include computational intelligence, digitaland adaptive signal processing, power quality, powerline commu-nication, and digital communications. Dr. Ribeiro received studentawards from IECON’01 and ISIE’03. He is a Member of the tech-nical program committee of the ISPLC’06, ISPLC’07, CERMA’06,and ANDESCOM’06, and a Member of the IEEE ComSoc Techni-cal Committee on Power Line Communications.
Jose Luiz Rezende Pereira received his B.S.in 1975 from Federal University of Juiz deFora, Brazil, the M.S. in 1978 from COPPE-Federal University of Rio de Janeiro, andthe Ph.D. degree in 1988 from UMIST, UK.From 1977 to 1992, he worked at FederalUniversity of Rio de Janeiro. Since 1993 hehas been working at Electrical EngineeringDepartment of Federal University of Juiz deFora. Dr. Pereira’s research interests includeplanning and operation modeling for transmission and distribu-tion systems.