Stratospheric water vapour budget and convection overshooting the tropopause: modelling study from...
20
Atmos. Chem. Phys., 10, 8267–8286, 2010 www.atmos-chem-phys.net/10/8267/2010/ doi:10.5194/acp-10-8267-2010 © Author(s) 2010. CC Attribution 3.0 License. Atmospheric Chemistry and Physics Stratospheric water vapour budget and convection overshooting the tropopause: modelling study from SCOUT-AMMA X. M. Liu 1 , E. D. Rivi` ere 1 , V. Mar´ ecal 2 , G. Durry 1 , A. Hamdouni 1 , J. Arteta 2,* , and S. Khaykin 3 1 Groupe de Spectrom´ etrie mol´ eculaire et Atmosph´ erique (GSMA), Universit´ e de Reims Champagne-Ardenne (URCA) and CNRS, UMR 689, Reims, France 2 Laboratoire de Physique et Chimie de l’Environnement et de l’Espace (LPC2E), CNRS and Universit´ e d’Orl´ eans, France 3 Central Aerological Observatory of Roshydromet 3, Pervomayskaya str. Dolgoprudny, Moscow region 141700, Russian Federation, Russia * now at: Centre National de Recherche M´ et´ eorologique (CNRM), M´ et´ eo-France and CNRS, Toulouse, France Received: 9 December 2009 – Published in Atmos. Chem. Phys. Discuss.: 11 February 2010 Revised: 29 July 2010 – Accepted: 2 August 2010 – Published: 3 September 2010 Abstract. The aim of this paper is to study the impacts of overshooting convection at a local scale on the water dis- tribution in the tropical UTLS. Overshooting convection is assumed to be one of the processes controlling the entry of water vapour mixing ratio in the stratosphere by inject- ing ice crystals above the tropopause which later sublimate and hydrate the lower stratosphere. For this purpose, we quantify the individual impact of two cases of overshoot- ing convection in Africa observed during SCOUT-AMMA: the case of 4 August 2006 over Southern Chad which is likely to have influenced the water vapour measurements by micro-SDLA and FLASH-B from Niamey on 5 August, and the case of a mesoscale convective system over A¨ ır on 5 August 2006. We make use of high resolution (down to 1 km horizontally) nested grid simulations with the three- dimensional regional atmospheric model BRAMS (Brazilian Regional Atmospheric Modelling System). In both cases, BRAMS succeeds in simulating the main features of the con- vective activity, as well as overshooting convection, though the exact position and time of the overshoots indicated by MSG brightness temperature difference is not fully repro- duced (typically 1 ◦ displacement in latitude compared with the overshoots indicated by brightness temperature differ- ence from satellite observations for both cases, and several hours shift for the A¨ ır case on 5 August 2006). Total water budgets associated with these two events show a significant injection of ice particles above the tropopause with maxi- Correspondence to: X. M. Liu ([email protected]) mum values of about 3.7 ton s −1 for the Chad case (4 Au- gust) and 1.4 ton s −1 for the A¨ ır case (5 August), and a to- tal upward cross tropopause transport of about 3300 ton h −1 for the Chad case and 2400 ton h −1 for the A¨ ır case in the third domain of simulation. The order of magnitude of these modelled fluxes is lower but comparable with similar studies in other tropical areas based on models. These two estima- tions exhibit significant differences and highlight variability among the cases of the impact of overshooting convection in hydrating the lower stratosphere. We show that the regional enhancement of water above the tropopause is between 0.21 to 0.67 ppmv between 380 and 400 K, generally in the range of other model estimations. The amount of water which re- mains in the stratosphere after the overshoot is estimated for both cases. A range of 330 to 507 tons is found for the Chad case and an upper limit of 200 tons is found for the A¨ ır case. Finally we emphasize that the hydrated area in the LS by overshooting convection can be advected relatively far away from the overshoot initial location, with locally mixing ra- tios of more than 3 ppmv higher than the background level, which is compatible with the balloon borne measurements performed above Niamey in the same air mass, 30 h after the overshoot. 1 Introduction Water vapour is a key component of the stratosphere, both for climate and chemistry. As the most important greenhouse gas in the atmosphere, the amount of water vapour in the stratosphere can significantly affect the earth’s climate. It Published by Copernicus Publications on behalf of the European Geosciences Union.
-
Upload
independent -
Category
Documents
-
view
1 -
download
0
Transcript of Stratospheric water vapour budget and convection overshooting the tropopause: modelling study from...

Atmos. Chem. Phys., 10, 8267–8286, 2010www.atmos-chem-phys.net/10/8267/2010/doi:10.5194/acp-10-8267-2010© Author(s) 2010. CC Attribution 3.0 License.
AtmosphericChemistry
and Physics
Stratospheric water vapour budget and convection overshooting thetropopause: modelling study from SCOUT-AMMA
X. M. Liu 1, E. D. Riviere1, V. Mar ecal2, G. Durry 1, A. Hamdouni1, J. Arteta2,*, and S. Khaykin3
1Groupe de Spectrometrie moleculaire et Atmospherique (GSMA), Universite de Reims Champagne-Ardenne (URCA) andCNRS, UMR 689, Reims, France2Laboratoire de Physique et Chimie de l’Environnement et de l’Espace (LPC2E), CNRS and Universite d’Orleans, France3Central Aerological Observatory of Roshydromet 3, Pervomayskaya str. Dolgoprudny, Moscow region 141700, RussianFederation, Russia* now at: Centre National de Recherche Meteorologique (CNRM), Meteo-France and CNRS, Toulouse, France
Received: 9 December 2009 – Published in Atmos. Chem. Phys. Discuss.: 11 February 2010Revised: 29 July 2010 – Accepted: 2 August 2010 – Published: 3 September 2010
Abstract. The aim of this paper is to study the impacts ofovershooting convection at a local scale on the water dis-tribution in the tropical UTLS. Overshooting convection isassumed to be one of the processes controlling the entryof water vapour mixing ratio in the stratosphere by inject-ing ice crystals above the tropopause which later sublimateand hydrate the lower stratosphere. For this purpose, wequantify the individual impact of two cases of overshoot-ing convection in Africa observed during SCOUT-AMMA:the case of 4 August 2006 over Southern Chad which islikely to have influenced the water vapour measurements bymicro-SDLA and FLASH-B from Niamey on 5 August, andthe case of a mesoscale convective system over Aır on 5August 2006. We make use of high resolution (down to1 km horizontally) nested grid simulations with the three-dimensional regional atmospheric model BRAMS (BrazilianRegional Atmospheric Modelling System). In both cases,BRAMS succeeds in simulating the main features of the con-vective activity, as well as overshooting convection, thoughthe exact position and time of the overshoots indicated byMSG brightness temperature difference is not fully repro-duced (typically 1◦ displacement in latitude compared withthe overshoots indicated by brightness temperature differ-ence from satellite observations for both cases, and severalhours shift for the Aır case on 5 August 2006). Total waterbudgets associated with these two events show a significantinjection of ice particles above the tropopause with maxi-
Correspondence to: X. M. Liu([email protected])
mum values of about 3.7 ton s−1 for the Chad case (4 Au-gust) and 1.4 ton s−1 for the Aır case (5 August), and a to-tal upward cross tropopause transport of about 3300 ton h−1
for the Chad case and 2400 ton h−1 for the Aır case in thethird domain of simulation. The order of magnitude of thesemodelled fluxes is lower but comparable with similar studiesin other tropical areas based on models. These two estima-tions exhibit significant differences and highlight variabilityamong the cases of the impact of overshooting convection inhydrating the lower stratosphere. We show that the regionalenhancement of water above the tropopause is between 0.21to 0.67 ppmv between 380 and 400 K, generally in the rangeof other model estimations. The amount of water which re-mains in the stratosphere after the overshoot is estimated forboth cases. A range of 330 to 507 tons is found for the Chadcase and an upper limit of 200 tons is found for the Aır case.Finally we emphasize that the hydrated area in the LS byovershooting convection can be advected relatively far awayfrom the overshoot initial location, with locally mixing ra-tios of more than 3 ppmv higher than the background level,which is compatible with the balloon borne measurementsperformed above Niamey in the same air mass, 30 h after theovershoot.
1 Introduction
Water vapour is a key component of the stratosphere, both forclimate and chemistry. As the most important greenhousegas in the atmosphere, the amount of water vapour in thestratosphere can significantly affect the earth’s climate. It
Published by Copernicus Publications on behalf of the European Geosciences Union.

8268 X. M. Liu et al.: Overshoot modelling study from SCOUTT-AMMA
also affects the ozone layer chemistry since water vapour isone of the main sources of OH hydroxyl radicals in the strato-sphere and favours ozone depletion in winter by polar strato-spheric cloud formation. A 1% increase of water vapour peryear in the stratosphere was observed (Oltmans et al., 2000;Rosenlof et al., 2001) during the second half of the last cen-tury, which is believed to be partially due to water vapourtransport across the tropical tropopause. This trend is stilldebated since Scherer et al. (2008) estimate a 0.7% increasebut Randel et al. (2006), Jones et al. (2009) and Solomon etal. (2010) rather conclude a decrease after 2000. The under-standing and the prediction of water vapour distribution inthe tropical upper troposphere (UT) and lower stratosphere(LS) is currently a key issue since this region is likely to con-trol the entry of water vapour in the stratosphere. At localscale, one important process controlling the water amount inthe LS is overshooting convection, injecting directly ice crys-tals above the tropopause which later sublimate and hydratethe LS (Pommereau and Held, 2007).
Until recently, the most accepted mechanism driving thewater vapour mixing ratio in the lower stratosphere is de-hydration by freezing. This freezing is followed by sedi-mentation during the very slow ascent (6 months between15 and 20 km) of tropospheric air due to positive radiativeheating (Holton and Gettelman, 2001; Randel et al., 2001;Gettelman et al., 2002; Fueglistaler et al., 2004; Fueglistaleret al., 2005) in the Tropical Tropopause Layer (hereafterTTL, Fueglistaler et al., 2009). This is often referred to asthe cold trap hypothesis. Concurrently, recent total waterand water vapour measurements from aircraft and balloonsshow the presence of thin layers of enhanced water vapouror sometimes ice crystals up to several kilometres abovethe tropopause (Pommereau and Held, 2007; Nielsen et al.,2007; Chaboureau et al., 2007; Corti et al., 2008; Khaykin etal., 2009). They are attributed to convective overshoots andlead to the hydration of the lower stratosphere. As also seenby the TRMM Precipitation Radar and Lightning ImagingSensor, these injections seem to occur mainly over land (Liuand Zipser, 2005; Zipser, 2006) even if the earlier study ofGettleman et al. (2002) concludes that the maximum occursabove the Pacific region. Although such events can be simu-lated by Cloud Resolving Models (Chaboureau et al., 2007;Grosvenor et al., 2007; Chemel et al., 2009) they have a toosmall horizontal size (10–20 km) and are of a too short dura-tion (typically of one hour or less) to be captured by globalNumerical Weather Prediction (NWP) models in which theirrepresentation cannot be taken into account explicitly. Theexistence of such events is now widely accepted but what isstill unknown is their importance at the seasonal scale andat global scale, which depends of their frequency in a givenconvective area. Also unknown is their relative quantitativeimpact with respect to large-scale mechanisms such as thecold trap. Aiming at a deeper investigation of the mechanismof hydration of the lower stratosphere by convective over-shoots, a series of simultaneous water vapour, particle and
ozone measurements has been carried out within a SCOUT-AMMA (Stratosphere-Climate Links With Emphasis On TheUTLS – African Monsoon Multidisciplinary Analysis) cam-paign in August 2006 from Niamey, Niger (13.6◦ N) in WestAfrica (Cairo et al., 2010). This is a location of frequentovershoots during the monsoon season according to Liu andZipser (2005).
Although during SCOUT-AMMA the set of water mea-surements by several types of instruments onboard differ-ent platforms provides an unprecedented documentation ofthe UTLS tropical water vapour distribution, they are not suf-ficient to provide a full picture of the relative impact of thedifferent processes affecting this distribution in the tropics.Conversely, a modelling approach, evaluated by such a setof measurements can be used to complement these observa-tions and to quantify the impact of these processes. In par-ticular three-dimensional limited-area meteorological mod-els (mesoscale models) with fine resolution, down to that ofcloud resolving simulations can solve explicitly deep convec-tion, and are able to represent in a consistent manner dynam-ical and microphysical processes responsible for the wateramount in the LS. Quantifying precisely the impact of sin-gle overshooting deep convection events on the LS hydrationis a key step before those results can be extrapolated at awider scale and before parameterizations of overshoots canbe developed for global models. The relative impact of over-shoots with respect to the freezing/drying mechanism in theTTL on the water budget could be then estimated. Recentstudies (Schiller et al., 2009; James et al., 2008; Fueglistaleret al., 2005) conclude that the slow ascent leading to freez-ing/drying in the cold trap is predominant, with trajectorycalculations roughly explaining the water distribution abovethe tropical tropopause. Nonetheless Schiller et al. (2009)also conclude that the impact of overshooting convection isstill detectable at the local scale up to 420 K. Another im-portant argument showing that the cold trap cannot explainalone the amount of water entering the tropical stratosphereconcerns the trends of the tropical tropopause temperature: adecrease by 0.5 K decade−1 reported in Seidel et al. (2001)should lead to an enhancement of the dehydration at thetropopause, and thus to a decrease of the water amount in thestratosphere. This is not consistent with the observed trendsof water vapour (Oltmans et al., 2000), suggesting that othermechanisms must play a significant role.
Only few estimations of the impact of single overshootingevents are available in the literature and correspond to dif-ferent areas of the globe - Maritime continent for Chemel etal. (2009), Brazil for Chaboureau et al. (2007) and Grosvenoret al. (2007) – and different models, leading sometimes todifferent impact at the local scale. The present work focuseson Africa, an area known for the relatively high frequencyof overshoots according to Liu and Zipser (2005), and whereno estimation of LS water injection by overshoot has beenprovided by CRMs up to now. Thus the aim of this study isto quantify the amount of water injected into the stratosphere
Atmos. Chem. Phys., 10, 8267–8286, 2010 www.atmos-chem-phys.net/10/8267/2010/
X. M. Liu et al.: Overshoot modelling study from SCOUTT-AMMA 8269
by two overshooting events in Africa: the first one is com-posed of several cloud clusters, and the second one is a wellorganised MCS. We also aim at complementing the few esti-mates already available in the literature which are necessarybefore parameterization of overshoots in global models canbe developed.
The present work is based on the use of the three-dimensional regional and cloud resolving model BRAMS(Brazilian Regional Atmospheric Modelling System) (Fre-itas et al., 2009). It will be used to examine how a single over-shooting deep convective system affects the water content ofthe TTL at the local scale in Africa. Here we study two over-shooting cases observed in Niger and Chad during SCOUT-AMMA (Cairo et al., 2010), a European funded campaignpart of the SCOUT-O3 programme, synchronous with the in-ternational AMMA project (Redelsperger et al., 2006): thecase of 4 August 2006 over Southern Chad that likely in-fluenced the water vapour balloon-borne measurements of 5August in Niamey (Khaykin et al., 2009, hereafter K2009),and the case of 5 to 6 August 2006 of a mesocale convec-tive system (MCS) generated over central Niger which laterpropagated toward Niamey and Burkina Faso.
The paper is organized as follows. Section 2 gives anoverview of the convective events. Section 3 describes thenumerical tool used in this study as well as the experimentaldata. Section 4 discusses the ability of the model to simulatethe observed cases. Section 5 is dedicated to the calculationof water transport to the lower stratosphere by overshootingconvection and its impact at local/regional scale in the LS.The conclusions are given in Sect. 6.
2 Overview of the observation of the convective event
Two cases of overshooting convection are presented in thispaper. Both of them occurred in a relatively active period.The first one took place over Southern Chad on 4 August2006 and is referred hereafter as the “Chad case”. The secondcase occurred in Aır (central Niger) on 5 August 2006. In thefollowing, it will be referred as the “Aır case”.
2.1 Description of the Chad case
Balloon borne water vapour measurements on 5 Au-gust 2006 from the Niamey military airport (13◦29′ N,02◦19′ E) by micro-SDLA onboard the “water vapour flightno. 1” launched at 18:40 UT and by FLASH-B launched at18:52 UT are shown in Fig. 1. Micro-SDLA is a tunablediode laser spectrometer devoted to the in situ measurementof H2O, CH4 and CO2 by infrared absorption spectroscopy(Durry et al., 2004). Three near-infrared telecommunication-type InGaAs laser diodes are connected by means of opti-cal fibres to an open multi-path optical cell providing an ab-sorption path-length of 28 m. The laser beam is absorbedby ambient gas molecules as it is bouncing back and forth
Fig. 1. UTLS water vapour profiles from Balloon-borne micro-SDLA (red line) and FLASH-B (green) measurements from Ni-amey at 18:40 and 18:52 UT (launch time) on 5 August 2006, re-spectively.
between the cell mirrors. H2O is monitored at 1.39 µm us-ing the differential detection technique. The payload also in-cludes pressure and temperature sensors. The accuracy of theH2O measurements within 160 ms is 5%. Micro-SDLA wasalready flown successfully in the tropics during the HIBIS-CUS campaign (Marecal et al., 2007). FLASH is a Lyman-α
hygrometer. The instrument as well as its measurements per-formed on 5 August 2006, 12 min later than micro-SDLAis described in K2009. Although the fine structures of themicro-SDLA profile shown in Fig. 1 are qualitatively con-sistent with FLASH observations on the same day, micro-SDLA shows a still unexplained dry bias. We suspect thisbias could be due to a mis-adjustment of the optical multi-pass cell so that a wrong value for absorption path lengthwas used in the concentration retrieval process for the watervapour channel.
The study of this case was motivated by a layer of en-hanced water vapour around 17–17.5 km altitude, seen byboth instruments in Fig. 1. The enhancement of watervapour with respect to the background value in this layeris about 2 ppbv for both instruments, and the correspond-ing mixing ratios are 8 ppmv for FLASH and 7 ppmv formicro-SDLA. This layer is located significantly above thetropopause (∼16.5 km). Using backward trajectories basedon ECMWF operational analysis winds, K2009 have relatedthis enhancement to overshooting convection from deep con-vection over Southern Chad on 4 August 2006, 14:30 UT.
Figure 2 shows a series of Meteosat Second Generation(MSG) IR images in the 10◦ E to 30◦ E and 0◦ N to 20◦ Ndomain describing the time evolution of the convectiveactivity in the Sudan/Chad area for this “Chad case”. Theconvective activity begins at 10:30 UT on the Sudan-Chadborder. It develops further in a cluster of several cloud
www.atmos-chem-phys.net/10/8267/2010/ Atmos. Chem. Phys., 10, 8267–8286, 2010

8270 X. M. Liu et al.: Overshoot modelling study from SCOUTT-AMMA
Fig. 2. Meteosat Second Generation Infrared images in the 10◦ E to 30◦ E longitude range and in the 0◦ N to 20◦ N latitude range on 4August 2006 at(a) 10:30 UT(b) 12:00 UT(c) 14:30 UT(d) 17:00 UT(e)20:00 UT.
systems, South-East of Chad at 12:00 UT (Fig. 2b). At∼12:14 UT, the Lidar instrument CALIOP onboard theCloud-Aerosol Lidar and Infrared Pathfinder Satellite Ob-servation (CALIPSO) satellite scanned the convective cloudcluster (not shown). The CALIPSO measurements highlightthat the cloud top of the cloud cluster is typically at 16.5 kmin the latitude range 10◦ N to 13◦ N and that some parts ofthis cloud top are classified as “stratospheric features” inthe version 2.0.1 of the feature mask products. Althoughthe class “stratospheric features” is not always unambiguous(see CALIPSO Quality Statement Lidar level 2 vertical fea-ture mask athttp://eosweb.larc.nasa.gov/PRODOCS/calipso/Quality Summaries/CALIOPL2VFMProducts2.01.html),
CALIOP measurements confirm that at about 12:12 UTthe cloud top is very close to the tropopause. At 14:30 UT(Fig. 2c), the convective area is composed of an East-Westband of clouds (from 22◦ E to 16◦ E; ∼11◦ N). North-Eastof this band, there is another cloud system area that joins thefirst one while it is decaying. East of the Chad/Sudan border,cluster of several convective clouds are growing. This is thetime when K2009 identify overshooting convection from the11◦ N East-West band of cloud from brightness temperaturesanalysis. They identified from a trajectory analysis that theLS air coming from the overshoot moved toward the Niameyarea and was sampled by the FLASH-B instrument aboveNiamey (Fig. 1). At 17:00 UT (Fig. 2d), the 11◦ N East-West
Atmos. Chem. Phys., 10, 8267–8286, 2010 www.atmos-chem-phys.net/10/8267/2010/

X. M. Liu et al.: Overshoot modelling study from SCOUTT-AMMA 8271
band spreads South and North while convective activitydevelops on the Eastern to North-Western part of it. At20:00 UT (Fig. 2e) the convective activity is mainly around17◦ E, 12.5◦ N, coming both from the North-East and fromthe former 11◦ N band that join together.
To identify the location and time of the overshoots associ-ated with the convective activity in the Southern Chad areawe use a detection method of overshoots from Meteosat Sec-ond Generation (MSG) observations. This method (Schmetzet al., 1997) is based on the brightness temperature differ-ence (hereafter BTD) between the 6.2 µm and the 10.8 µmchannel. The first channel is sensitive to the water vapouremission in the warmer temperature of the lower stratospherewith respect to the adiabatically cooled overshooting turrettemperature. The BTD threshold for the detection of over-shoot is set to 3 K as in Chaboureau et al. (2007) and K2009.In a study of deep convection over the Indian Ocean, Rocaet al. (2002) use a larger BTD threshold of 5 K. However, ithas been checked for a specific overshoot observational caseof SCOUT-AMMA in the afternoon of 23 August 2006, thatthe MSG BTD was about 3.2 K while the MIT radar at Ni-amey sampled a convective cell reaching 18.3 km well abovethe tropopause (∼16.5 km). This proves that the thresholdof BTD=3 K for the detection of overshoot is realistic in thisregion of Africa. Figure 3 shows the MSG pixels with BTDshigher than 3 K for the 12:15 UT to 19:15 UT with a 15-mintime resolution. It shows that the overshooting convectionactivity mainly occurs in the 11◦ N East-West band of clouds,and moves with time Westward. 14:30 UT is the time whenK2009 identify 23 overshooting pixels in this area, to be ofthe same air mass as the one sampled by FLASH 30 h laterabove Niamey. From 15:45 UT, overshooting pixels appearNorth of this band (typically 12◦ N, 20.5◦ E). From 17:00 UT,an area of overshoot is given by MSG observations in WestSudan (12◦ N, 23◦ E) and corresponds to a large red area inFig. 2d. From 19:00 UT, another area of overshooting pixelsappears around 12.3◦ N 17.8◦ E. It corresponds to the highconvective activity shown in Fig. 2e coming both from thespreading of the former East-West cloud band and the North-ern cloud cluster.
To summarize, the period after 12:00 UT on 4 August 2006in Southern Chad is a period of severe deep convection in-cluding overshoots in several subareas: the 11◦ N East-Westband of clouds at 14:30 UT, the area in Sudan close to theChad border at 17:00 UT, and later the North-West area at20:00 UT. Satellite images (Fig. 2) show that the differentcloud bands interact with each other to create a large cloudcluster.
2.2 Description of the Aır case
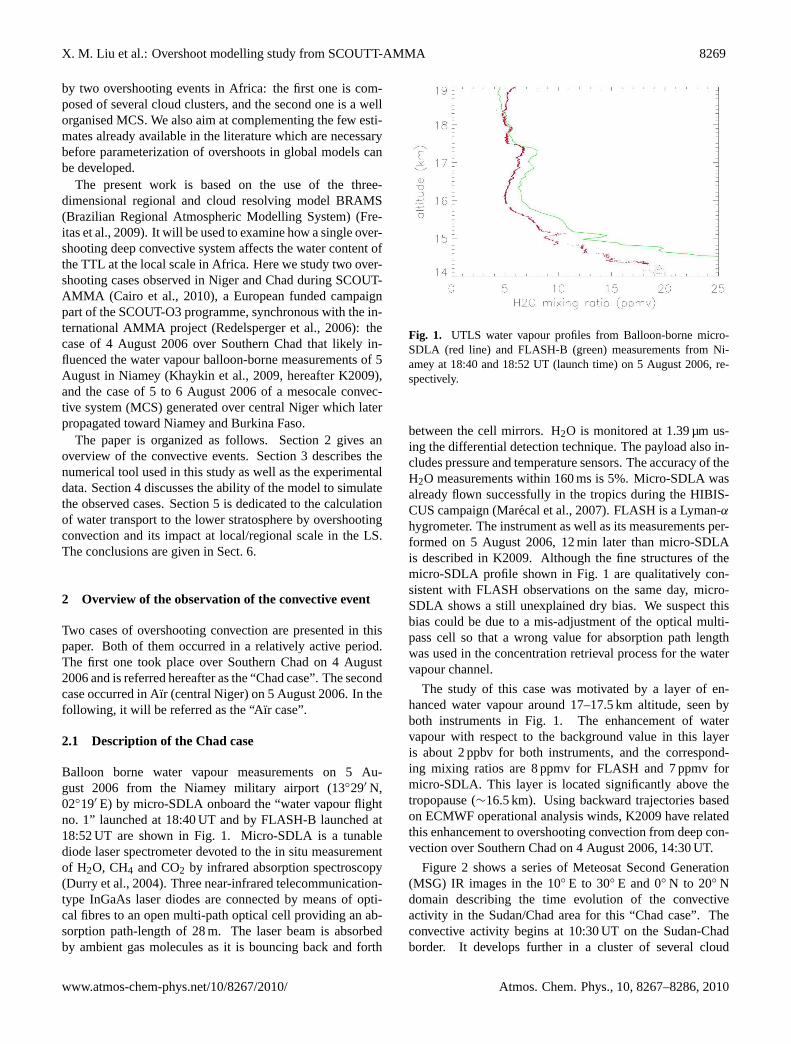
A mesoscale convective system was observed East/North-East of Niamey at the time of the balloon-borne measure-ments on 5 August 2006. Figure 4 shows the time evolutionof this “Aır case” MCS as seen by MSG. Convection triggers
Fig. 3. MSG pixels with brightness temperature difference (BTD)higher than 3 K between the 6.2 µm channel and the 10.8 µm chan-nel in Southern Chad from 12:30 UT to 19:30 UT on 4 August 2006.The time resolution of MSG data is 15 min.
in the Aır mountain area (centre Niger) at about 13:30 UT(Fig. 4a) in the 8.5◦ E, 17◦ N to 19◦ N area. Another activecloud area is observed close to the Niger/Nigeria/Chad bor-der. The Aır system grows and extends to 15◦ N and 7◦ E on5 August (Fig. 4b) becoming an organized Mesoscale Con-vective System (MCS) at 18:00 UT. At the same time, theNiger/Nigeria cloud system grows and propagates westward.The Aır MCS grows and moves westward until 18:00 UT(Fig. 4c) when it reaches its top activity. At the same time theNiger/Nigeria/Chad cloud cluster has decayed and split intotwo different parts: the first one stays at the Chad Niger bor-der while the second, at the Niger/Nigerian border (10◦ E),continue to propagate westward. It later joins the Aır MCSwhile the latter propagates south-westward towards Niamey(Fig. 4d). The total system reaches Niamey in the morningof 6 August and will later move to Burkina Faso while de-caying.
Using the same MSG brightness temperature differencetechnique as for the “Chad case”, we have checked the oc-currence of overshooting activity of the Aır MCS. Figure 5shows the overshooting pixels in central Niger for the periodfrom 14:45 UT to 17:30 UT. It shows that the Aır area hasexperienced overshooting convection during this period. Theovershooting area moves westward (slightly northward) withtime, which is compatible with the westward propagation ofthe MCS during its maximum of activity. At 15:30 UT, 16:15and 16:30 UT the number of pixels with BTD>3 K is 13,14, and 16, respectively. These numbers are smaller than forthe Chad case: at 14:30 UT, K2009 have reported a total of23 pixels with BTD>3 K (see Table 2 of K2009 for detailsabout the Chad Case BTDs). Table 1 summarizes the timeevolution of the overshoot size in pixels. It shows that themost intense overshooting activity is between 15:30 UT and16:30 UT with a maximum BTD of 4.8 K which is close tothe overshoot criteria proposed by Roca et al. (2002).
www.atmos-chem-phys.net/10/8267/2010/ Atmos. Chem. Phys., 10, 8267–8286, 2010

8272 X. M. Liu et al.: Overshoot modelling study from SCOUTT-AMMA
Table 1. Time evolution of the overshoot size in MSG pixels for theAır case, from 14:45 UT to 17:30 UT. At each time, the maximumBTD is also reported. BTD: Brightness Temperature Difference be-tween the 6.2 µm and the 10.8 µm channels.
Time of Size of overshoot Maximum BTD valueovershoot (UT) (number of pixels) of the overshoot
5 August 14:45 3 3.495 August 15:00 3 3.065 August 15:15 3 3.275 August 15:30 13 4.85 August 15:45 5 3.875 August 16:00 8 3.525 August 16:15 14 3.875 August 16:30 16 3.895 August 16:45 11 3.875 August 17:00 6 3.595 August 17:15 3 3.795 August 17:30 2 3.92
In the following we study both the Chad case and the Aırcase with a mesoscale model. It will give an opportunity tocompare the impact of different types of system on the lowerstratosphere hydration by overshooting convection. The nextsection describes the modelling tools and model setup usedin this study.
3 Modelling tools and simulation setup
The Brazilian Regional Atmospheric Modelling System(BRAMS) model is a mesoscale model tailored to the trop-ics. It is the Brazilian version of the RAMS model (Cot-ton et al., 2003) of the University of Colorado/ATMET.BRAMS (Freitas et al., 2009) was developed at CPTEC(http://brams.cptec.inpe.br/). It is designed to simulate at-mospheric circulations at different scales from large regionalsimulations down to large eddy simulations. It includes afull set of parameterizations for surface processes, radia-tive scheme, dynamics, sub grid scale convection and mi-crophysics. BRAMS differs from RAMS in improvementsconcerning cumulus convection parameterization, soil mois-ture initialization and surface scheme. BRAMS/RAMS offerthe possibility to use nested grids, each grid communicatingin a two way process with its parent or child grid. BRAMSwas successfully used to simulate water vapour distributionin the tropical UTLS in a deep convective environment overBrazil (Marecal et al., 2007).
Two simulations were run using the BRAMS model foreach of the case studies described in Sect. 2. For both simu-lations, the radiative scheme of Harrington (1997) was usedfor short and long wavelengths. The sub grid scale param-eterization of shallow and deep convection of Grell and De-
Table 2. Model setting used for the Chad (4 August 2006) and Aır(5 August 2006) case simulations. Size, resolution and starting timefor each grid are reported.
Cases Grid setting
Grid Horizontal Grid points Model startresolution (km) (NX, NY, NZ) (UT)
Chad G1 20× 20 93, 83, 68 3 August, 18:00G2 4× 4 242, 157, 68G3 1× 1 214, 110, 68
Aır G1 20× 20 152, 154, 68 5 August, 00:00G2 4× 4 162, 197, 68G3 1× 1 106, 118, 68
venyi (2002) was chosen. The setup for microphysics makesuse of the two moment scheme developed by Meyers etal. (1997). Seven types of hydrometeors are taken into ac-count in the model: liquid cloud droplets and rain for liquidparticles, and pristine, snow, hail, graupel and aggregates forice particles. In this scheme, both hydrometeor number con-centrations and mass mixing ratios are prognostic variablesof the model, assuming that each hydrometeor size distribu-tions follows a gamma function. In the simulation the shapeparameter of the gamma function is assumed to be 2 for eachcategory of hydrometeors as successfully used with BRAMSin Penide et al. (2010) for AMMA case simulations. Al-though considered as a bulk scheme, this relatively detailedscheme is particularly suitable for the quantification of watertransport across the tropopause by overshooting convection,in which ice particles are supposed to play an important role(Pommereau and Held, 2007; Grosvenor et al., 2007; Chemelet al., 2009): as a matter of fact, the number of hydrometeorsis higher than for other CRMs already used for studying therole of overshooting convection on the LS hydration. TheMeso-NH model used in Chaboureau et al. (2007) and theARW model used in Chemel et al. (2009) have 5 types ofhydrometeors (including 3 classes of ice particles). Further-more double moment schemes used in BRAMS and ARWare said to be more precise than single moment schemes asin Meso-NH. These differences among models are likely toinduce differences in the simulated amount of water injectedby overshooting convection.
Global ECMWF (European Centre for Medium-rangeWeather Forecasts) 6-hourly analyses were used in this study,both for the initialization and the nudging at the lateralboundaries of the larger BRAMS domain (Grid 1). The setof analyses used are the special AMMA reanalyses done atECMWF (Agusti-Panareda et al., 2009, 2010), which takeinto account all the radio sonde measurements of the AMMAcampaign in West Africa. Sensitivity tests have been per-formed using operational analyses instead of AMMA reanal-yses and showed a significant improvement of the BRAMSresults using the reanalyses in term of convective system for-mation, severity, lifetime and propagation.
Atmos. Chem. Phys., 10, 8267–8286, 2010 www.atmos-chem-phys.net/10/8267/2010/

X. M. Liu et al.: Overshoot modelling study from SCOUTT-AMMA 8273
Fig. 4. MSG Infrared images centered on Niger on 5 August 2006.(a) 13:30 UT(b) 16:00 UT(c) 18:00 UT(d) 23:30 UT.
Fig. 5. Same as Fig. 3 but for the Aır case from 14:45 UT to17:30 UT on 5 August 2006.
3.1 Specific setting for the Chad case
The 4 August 2006 convective system simulation includesthree nested grids as shown in Fig. 6a. The coarse grid (Grid1) covers a domain from∼8.20◦ E to 25.94◦ E in longitudeand from 2.39◦ N to 17.78◦ N in latitude including the At-
lantic Ocean in the South-West corner. Its horizontal gridspacing is 20 km. A finer resolution second grid (Grid 2), in-cluding the area where most of the deep convection was ob-served, extends from 15.18◦ E to 24.28◦ E in longitude andfrom 8.88◦ N to 14.68◦ N in latitude with 4 km grid spac-ing. The finest grid has 1 km grid spacing and covers a214×110 km domain from 19.98◦ E to 21.93◦ E in longitudeand from 11.15◦ N to 12.19◦ N in latitude focused in the areaof the East-West cloud band in its mature phase in order toproperly take into account the overshoot area highlighted byK2009. The topography is also reported in Fig. 6, indicat-ing within Grid 3 a region with hills higher that 800 m, andwithin Grid 2 an area in Sudan with topography higher than1300 m. For all these grids, the vertical coordinate is terrain-following height coordinate with 68 levels from the surfaceto 30 km altitude with 300 m spacing in the UTLS. In order todamp the gravity waves at the top of the domain, an absorb-ing layer of 5 km thickness was prescribed at the top bound-ary. The time steps used are 30 s, 10 s and 2 s for Grid 1,Grid 2 and Grid 3, respectively. The simulation was initial-ized at 18:00 UT on 3 August 2006 and ended on 5 August at12:00 UT. Model outputs were saved every hour except dur-ing the most intense period of convection in the model from4 August, 12:00 UT to 20:00 UT when model outputs weresaved every five minutes. The choice of the model configu-ration was a trade-off between high resolution and computingcost.
www.atmos-chem-phys.net/10/8267/2010/ Atmos. Chem. Phys., 10, 8267–8286, 2010

8274 X. M. Liu et al.: Overshoot modelling study from SCOUTT-AMMA
Fig. 6. Topography of the 3 nested grids used for the BRAMS sim-ulation (iso-lines for Grid 1, and shaded contour for grids 2 and 3).(a) Chad case.(b) Aır case.
3.2 Specific setup for the Aır case
The Aır system was also simulated with three nested grids(Fig. 6b). Grid 1 covers a domain from 7.942◦ W to 22.05◦ Ein longitude and from 2.02◦ S to 26.10◦ N in latitude with20 km grid spacing. This includes a large fraction of WestAfrica. A significant part of Grid 1 includes the AtlanticOcean in order to better account for the monsoon flux. Thedomain of Grid 2 is from 5.80◦ E to 12.14◦ E in longitude andfrom 13.16◦ N to 20.36◦ N in latitude. This grid, with a rel-atively fine horizontal resolution (4 km grid spacing) coversthe Aır Mountains with height higher than 1600 m in the cen-tral Niger where the MCS of interest developed, as shown bythe topography in Fig. 6b. Grid 3 has 1 km grid spacing andcovers a 106 km by 118 km domain from 7.84◦ E to 8.83◦ E
in longitude and from 15.36◦ S to 16.45◦ N in latitude, is lo-cated South of the Aır Mountains. The location of Grid 3 ischosen in the area where the modelled convection is the mostsevere from a previous simulation with two grids only. Thevertical coordinate and the time steps are the same as in theChad simulation. The simulation was initialized at 00:00 UTon 5 August 2006 and was run for 24 h saving model outputsevery hour except during the period 18:00 UT to 00:00 UTwhen model outputs were saved every 5 min to follow thedetailed evolution of the overshoots.
4 Evaluation of the simulations
In this section, we evaluate the results of the two simulationsagainst observations. We focus on the ability of the modelto reproduce the observed deep convective systems/clustersat the regional scale in which the overshoots are embed-ded and also the observed overshoots locally. We compareBRAMS outputs with TRMM (Tropical Rainfall Measur-ing Mission) estimates of surface rainrates. The TRMMdataset used was produced by the 3B42 algorithm (Huff-man et al., 2007, http://trmm.gsfc.nasa.gov). It is 3-hourlyand 0.25◦×0.25◦ resolution. The comparison is done usingthe Grid 1 results which include the mesoscale convectivesystems affecting the overshoot area. Moreover Grid 1 res-olution is close to TRMM products (20 km for Grid 1 and0.25◦ for TRMM). We also compare the model results to theMSG overshoot observations. This is done using the simula-tion fields from the finest resolution grid (Grid 3 with 1 kmhorizontal resolution). Overshooting convection can only besimulated when convective dynamical fields are explicitly re-solved in the model, i.e. using a resolution≤1 km, as shownin previous studies (Grosvenor et al., 2007; Chaboureau etal., 2007). Note that the observed overshoots are far fromthe AMMA/SCOUT-AMMA campaign zone. Therefore itwas not possible to make comparisons with balloon borne oraircraft measurements close to the overshoots.
4.1 Chad case
Figure 7 shows comparisons of surface rainrates (expressedin mm h−1) between TRMM (Fig. 7a, c, e) and BRAMSmodel outputs (Fig. 7b, d, f) for 15:00 UT (between 13:30 UTand 16:30 UT), 18:00 UT (between 16:30 UT and 19:30 UT),and for 21:00 UT (between 19:30 UT and 22:30 UT). Rain-rates are accumulated over three hour periods. The focus be-ing on the observed overshoots, we have displayed the modeland observed surface rainrates over the sub-domain of Grid 1including the convective systems that are likely to affect theovershoots. Note that this sub-domain is larger than Grid 2area and includes the whole Grid 2 domain. During the pe-riod of interest, several convective systems develop and inter-act while advected as illustrated by the time evolution of themany features appearing in the TRMM surface precipitation
Atmos. Chem. Phys., 10, 8267–8286, 2010 www.atmos-chem-phys.net/10/8267/2010/

X. M. Liu et al.: Overshoot modelling study from SCOUTT-AMMA 8275
fields (Fig. 7a, c, f) and already discussed for MSG observa-tions (see Sect. 2). The features of interest have been identi-fied in Fig. 7a, c, e by blue and green colour contours.
The first one is highlighted by the green ellipse corre-sponding to an area of precipitation in the North-East ofthe domain close to the Sudan-Chad border. This rainbandhardly moves between 13:30 UT to 22:30 UT. Only the in-tensity of the individual convective cells varies with time.BRAMS fairly well simulates the position of this rain area(Fig. 7b). However, BRAMS overestimates the intensity ofthis rain area with maxima over 10 mm h−1 while the max-ima from TRMM are usually between 5 and 10 mm h−1.
The second important precipitation feature is highlightedby a blue domain. At 15:00 UT both BRAMS and TRMMshow an East-West band of precipitation at∼11–11.5◦ Nwith the same intensity and distribution. This area corre-sponds to the zone where the K2009 Chad overshoot hasbeen highlighted. It corresponds to the purple to blue over-shooting pixel zone in Fig. 3. South of this band, BRAMSsimulates a local maximum of the same intensity as theTRMM estimation. BRAMS only fails in the North of the do-main where an isolated low precipitating cell seen by TRMMis simulated by BRAMS much further West in a larger area.Later at 18:00 UT (Fig. 7c) the TRMM products show thatthe precipitation zone spread North and South (Fig. 7c). Thisis also well captured by BRAMS (Fig. 7d), both in locationand intensity. The Northern cell in the West of the domaingiven in TRMM products intensify, as well as the cell lo-cated more West in the BRAMS simulation which is at theWest edge of the Grid 2 domain. At 21:00 UT the area ofprecipitation in the centre of the domain at 11◦ N 19◦ E forTRMM and 11.5◦ N 20◦ E for BRAMS is decaying. Concur-rently, further West, for both TRMM and BRAMS, there isan intensification of the precipitation from North to South.A very intense area in the North-West is seen by TRMM(Fig. 7e) and corresponds to the orange overshooting pixelsin Fig. 3. A detailed analysis of the MSG infrared imagesshows that this area is initially formed from an interactionbetween the Northern precipitating cells and the 11◦ N pre-cipitating band. In the BRAMS simulation (Fig. 7f), intensi-fication of the precipitation in the West from North to Southis also visible, though the location is too far West.
To evaluate the overshooting activity in BRAMS with re-spect to the MSG BTD observations, Fig. 8 shows the Grid3 points for which there is a significant ice amount (massmixing ratio above 0.05 g kg−1) above the tropopause, con-sidered here as the 380 K level (Holton et al., 1995), dur-ing the time of overshoots in BRAMS. Dependence withtime is indicated by the colour scale, chosen the same as inFig. 3. Note that the horizontal resolution of the model inGrid 3 (1 km) is higher than the MSG resolution (∼3.3 km).It shows that the overshooting activity begins at∼13:15 UTand ends at 14:45 UT. Except for a few overshooting points at11.6◦ N from ∼13:15 UT, most of them are along the 12◦ Nlatitude and move with time from East to West (from 13:15
Fig. 7
Fig. 7. Comparison between TRMM (a, c, e) and BRAMS (b, d,f) surface rainrate accumulated over 3 h periods for the Chad case.Panel (a) and (b): from 13:30 UT to 16:30 UT on 4 August 2006.Panel (c) and (d) from 16:30 to 19:30 UT. Panel (e) and (f) from19:30 UT to 21:30 UT.
to 14:15 UT). This tendency both in time and location is ingood agreement with the BTD overshooting pixels shown inFig. 3, though the observed overshooting pixels are locatedalong the 11.1◦ N latitude. This good agreement of the modelwith observations must be balanced by the fact that ice whichis calculated to be produced in overshoots at 14:00 UT is ad-vected westward in the LS before it sublimates totally. Thusthe grid points with ice mixing ratio higher than 0.05 g kg−1
should not all be considered as overshot grid points but asgrid points with ice of overshooting origin. On the otherhand, it is possible that the BTD signature is also sensitiveto advection of sublimating ice injected by overshoot whenthe cloud system below remains very active. Due to the lim-ited size of the Grid 3 domain to save computing resources,the overall overshooting activity observed by MSG in allthe Southern part of Chad cannot fully be reproduced byBRAMS. We chose to restrict our goal to reproduce the over-shoots occurring in the time range and the location pointedout by K2009, shown to influence the FLASH-B/µ-SDLAmeasurements.
Figure 9 shows a vertical cross section of total water alongthe 12◦ N latitude in the BRAMS Grid 3 domain at 14:15 UT.It highlights that the simulated cloud system overshoots thetropopause up to 17.8 km, above the 400 K level. Note thatthe position and the time of this overshooting plume is in verygood agreement with the overshoot highlighted by K2009.
www.atmos-chem-phys.net/10/8267/2010/ Atmos. Chem. Phys., 10, 8267–8286, 2010

8276 X. M. Liu et al.: Overshoot modelling study from SCOUTT-AMMA
Fig. 8. Chad case BRAMS simulation. Grid 3 time evolution ofthe grid points having an ice mixing ratio higher than 0.05 g kg−1
above the tropopause (380 K). The same color scale as in Fig. 3 ischosen.
We have also computed the ice water content (IWC) in thegrid 3 domain from 14:00 UT to 16:00 UT, and have com-pared them to measurements of stratospheric ice during pre-vious campaigns in other continents, provided in Fig. 1 ofCorti et al. (2008). This comparison shows that the IWC arecomparable in both cases, confirming that our simulation isrealistic, as discussed in more detail in Sect. 5.1.
To summarize, BRAMS succeeds in reproducing the mainfeatures of the observed precipitation, except in the West partof the domain from 18:00 UT where BRAMS produces pre-cipitation which is seen by the satellite much further Est. Themodel provides good results in the center of the domain forthe East-West band of precipitation where the K2009 over-shoots are highlighted. The overshooting activity in the timerange from 12:00 UT to 15:00 UT is in good agreement withthe observations, and the ice content in the stratosphere is ofthe same order of magnitude as the ice sampled during pre-vious airborne campaigns in other regions of the globe.
4.2 Aır case
As for the Chad case we evaluate the simulation of theAır MCS on 5 August 2006 by comparing model out-puts to TRMM rainrates and to BTD from MSG. Fig-ure 10 shows comparisons of surface rainrates (expressedin mm h−1) between TRMM (Fig. 10a, c, e) at 15:00 UT,18:00 UT and 21:00 UT, respectively, and BRAMS modeloutputs (Fig. 10b, d, f) for 14:00–17:00 UT, 17:00–20:00 UT,and 20:00–23:00 UT respectively, thus 30 min time-shiftedwith respect to the TRMM products. BRAMS outputs aredisplayed for Grid 1 in the whole geographical domain tobe comparable to the TRMM products resolution. Panel 10ashows a large area of precipitation in central Niger with amaximum at∼17◦ N, 8.5◦ E. Another area of precipitationis sampled in the South-East of the domain close to the
Fig. 9. Longitude/Altitude cross-section of condensed water mixingratio (g kg−1) around the overshoot location inside Grid 3 at 12◦ Nlatitude and 14:15 UT on 4 August 2006. The solid lines indicatethe isentropic levels 370, 380, 390 and 400 K.
Niger/Nigeria border. The corresponding BRAMS simula-tion (10b) shows a smaller area of precipitation in centralNiger because the convective system in BRAMS developslater than in the observations. However the maximum of pre-cipitation is located at the same place with a similar intensity.It is worth noticing that the convection triggers in a region ofmountains as shown in Fig. 6. Sensitivity tests on orographyparameters used in the simulation show that orography playsan important role in the convection triggering. The area ofprecipitation close to the Nigeria border is also reproducedby BRAMS, although it is located more West than the obser-vations.
Around 18:00 UT the observed and modelled rainratesboth indicate an intensification of the MCS North to South(close to 8◦ E and between 16◦ N and 18◦ N), and a westwardpropagation. The core of high rainrates is comparable in bothcases. The area of precipitation in the South-East propagatesslightly west-ward with a core of high rainrates similar inboth cases but more West in BRAMS, as at 15:00 UT. Around21:00 UT both panels 10e (TRMM) and 10f (BRAMS) showa south-westward propagation of the MCS but slower in themodel. This is due to the fact that while propagating west-ward, the BRAMS MCS gets out of Grid 2 and enters in theGrid 1 domain where convection is determined by a subgridscale parameterisation, coarsening the key parameters whichdetermine the MCS lifetime and propagation speed. TheNiger/Nigeria border area of precipitation propagates west-ward in TRMM and BRAMS. Due to the south-westwardpropagation of the MCS, this area converges to the MCS andlater forms a unique cloud system, shown in both satellite ob-servations and modelling. The TRMM outputs at 21:00 UTshow that the activity of the MCS decays as highlighted by
Atmos. Chem. Phys., 10, 8267–8286, 2010 www.atmos-chem-phys.net/10/8267/2010/

X. M. Liu et al.: Overshoot modelling study from SCOUTT-AMMA 8277
Fig. 10.Comparison between TRMM (a, c, e) and BRAMS (b, d, f)surface rainrate accumulated over 3 h periods for the Aırcase. Panel(a): from 13:30 UT to 16:30 UT on 4 August 2006. (b) From 14:00to 17:00 UT. Panel (c) from 16:30 to 19:30 UT. and (d) from 17:00to 20:00 Panel (e) from 19:30 UT to 21:30 UT and (f) from 20:00 to23:00 UT.
a maximum rainrate lower than 10 mm h−1 in the core of thesystem while BRAMS still shows a very active core. This ispartially due to the fact that BRAMS outputs are 30 min laterthan the TRMM outputs and that the observed MCS, after adecaying phase, re-intensifies later from 23:00 UT. This timeis taken into account into BRAMS in the evaluation of therainrates but is not taken into account in the TRMM outputsof the corresponding period which ends at 22:30 UT. Thisalso could be due to the fact that the modelled MCS is latewith respect to the observed one, and thus is still active atthat time.
Figure 11 illustrates the overshooting activity as seenby the BRAMS simulations within Grid 3. It shows lat-itude/longitude grid points having ice mass mixing ratiohigher than 0.1 g kg−1 above the 380 K level in the time rangebetween 18:30 UT and 21:15 UT. The threshold of 0.1 g kg−1
is twice the one chosen for the Chad to make Fig. 11 morereadable. Figure 11 uses the same colour timescale as inFig. 5 but shifted in time by 3 h and 15 min with respect tothe BTD overshooting pixels observations. This is done toaccount for the time shift of the model MCS compared to ob-servations. Panel 11b shows that the modelled MCS injects
Fig. 11. Same as Fig. 8 but for the Aır case. The same color scaleas in Fig. 5 is chosen.(a) Zoom on Grid 3 from 18:30 to 19:50 UT.(b) From 18:30 UT to 21:15 UT.
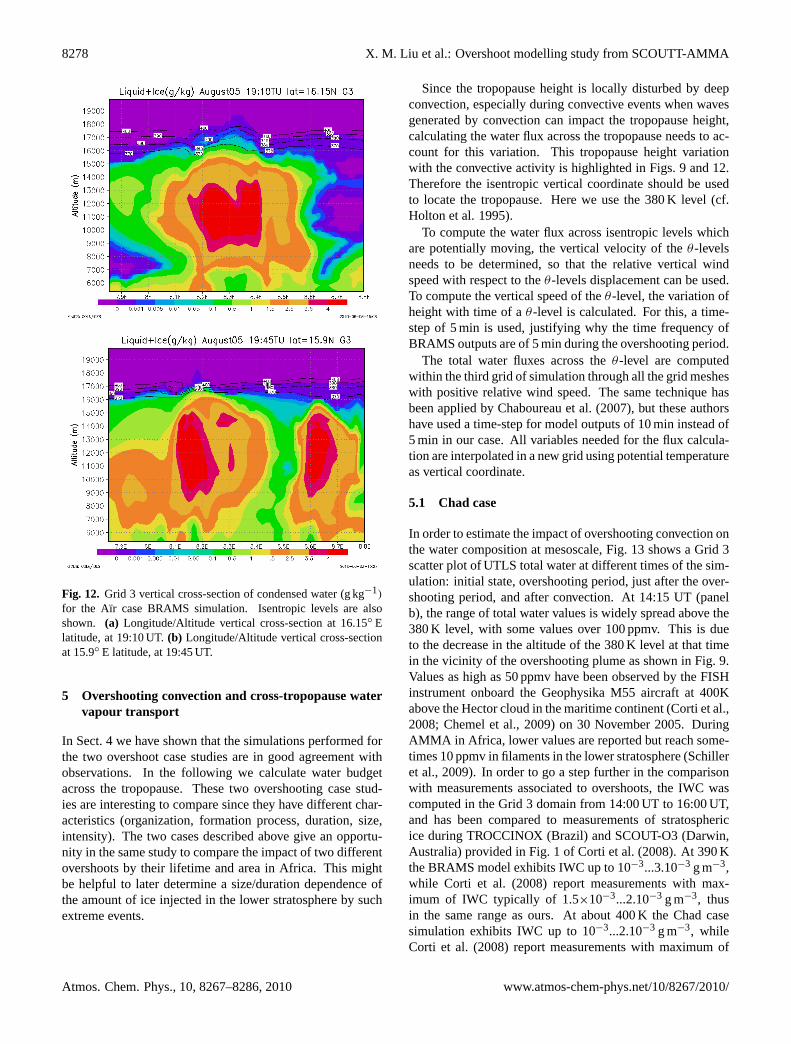
ice above the tropopause during a time range similar to theovershooting observations, but later than the observed MCS.The longitude range of the modelled overshoot is also com-parable with the observed one in the first 75 min (Fig. 11a).In contrast to the Chad case, the displacement of the over-shooting signal in BRAMS is not only due to the horizon-tal advection of ice injected by the overshoot, since there areseveral stratospheric penetrations (first at 8.35◦ E, and later at8.18◦ E) at 19:10 UT and at 19:45 UT in our simulation. Af-ter this time, BRAMS still produces ice injection above thetropopause but the geographical distribution of overshootsdiffers from the observations. Overshoots are computed inthe South-West part of the Grid while the observations onlyshow a displacement of the overshooting pixels with timefrom East to West-North-West. Nonetheless the overshoot-ing time evolution is very well reproduced by BRAMS in thefirst 75 min of the modelled overshooting period (see resultsin panel 11a) with the same direction of displacement, high-lighting that during this period, the overshoots in BRAMSare realistic even if late with respect to the observations. Ex-amination of the modelled cloud top during the overshootingperiod shows that overshoots can reach 18.5 km (Fig. 12).
To summarize, the key parameters of the 5 August 2006Aır MCS (location, propagation direction, intensity of pre-cipitation, overshooting activity) are generally well repro-duced by the BRAMS simulation. Nevertheless the modelledMCS develops later than the observations and the overshoot-ing activity is overestimated at the end of the simulation. Theend of the simulation will not be taken into account in the cal-culation of the water fluxes across the tropopause presentedin the next section.
www.atmos-chem-phys.net/10/8267/2010/ Atmos. Chem. Phys., 10, 8267–8286, 2010
8278 X. M. Liu et al.: Overshoot modelling study from SCOUTT-AMMA
Fig. 12. Grid 3 vertical cross-section of condensed water (g kg−1)
for the Aır case BRAMS simulation. Isentropic levels are alsoshown. (a) Longitude/Altitude vertical cross-section at 16.15◦ Elatitude, at 19:10 UT.(b) Longitude/Altitude vertical cross-sectionat 15.9◦ E latitude, at 19:45 UT.
5 Overshooting convection and cross-tropopause watervapour transport
In Sect. 4 we have shown that the simulations performed forthe two overshoot case studies are in good agreement withobservations. In the following we calculate water budgetacross the tropopause. These two overshooting case stud-ies are interesting to compare since they have different char-acteristics (organization, formation process, duration, size,intensity). The two cases described above give an opportu-nity in the same study to compare the impact of two differentovershoots by their lifetime and area in Africa. This mightbe helpful to later determine a size/duration dependence ofthe amount of ice injected in the lower stratosphere by suchextreme events.
Since the tropopause height is locally disturbed by deepconvection, especially during convective events when wavesgenerated by convection can impact the tropopause height,calculating the water flux across the tropopause needs to ac-count for this variation. This tropopause height variationwith the convective activity is highlighted in Figs. 9 and 12.Therefore the isentropic vertical coordinate should be usedto locate the tropopause. Here we use the 380 K level (cf.Holton et al. 1995).
To compute the water flux across isentropic levels whichare potentially moving, the vertical velocity of theθ -levelsneeds to be determined, so that the relative vertical windspeed with respect to theθ -levels displacement can be used.To compute the vertical speed of theθ-level, the variation ofheight with time of aθ -level is calculated. For this, a time-step of 5 min is used, justifying why the time frequency ofBRAMS outputs are of 5 min during the overshooting period.
The total water fluxes across theθ -level are computedwithin the third grid of simulation through all the grid mesheswith positive relative wind speed. The same technique hasbeen applied by Chaboureau et al. (2007), but these authorshave used a time-step for model outputs of 10 min instead of5 min in our case. All variables needed for the flux calcula-tion are interpolated in a new grid using potential temperatureas vertical coordinate.
5.1 Chad case
In order to estimate the impact of overshooting convection onthe water composition at mesoscale, Fig. 13 shows a Grid 3scatter plot of UTLS total water at different times of the sim-ulation: initial state, overshooting period, just after the over-shooting period, and after convection. At 14:15 UT (panelb), the range of total water values is widely spread above the380 K level, with some values over 100 ppmv. This is dueto the decrease in the altitude of the 380 K level at that timein the vicinity of the overshooting plume as shown in Fig. 9.Values as high as 50 ppmv have been observed by the FISHinstrument onboard the Geophysika M55 aircraft at 400Kabove the Hector cloud in the maritime continent (Corti et al.,2008; Chemel et al., 2009) on 30 November 2005. DuringAMMA in Africa, lower values are reported but reach some-times 10 ppmv in filaments in the lower stratosphere (Schilleret al., 2009). In order to go a step further in the comparisonwith measurements associated to overshoots, the IWC wascomputed in the Grid 3 domain from 14:00 UT to 16:00 UT,and has been compared to measurements of stratosphericice during TROCCINOX (Brazil) and SCOUT-O3 (Darwin,Australia) provided in Fig. 1 of Corti et al. (2008). At 390 Kthe BRAMS model exhibits IWC up to 10−3...3.10−3 g m−3,while Corti et al. (2008) report measurements with max-imum of IWC typically of 1.5×10⁻³...2.10−3 g m−3, thusin the same range as ours. At about 400 K the Chad casesimulation exhibits IWC up to 10−3...2.10−3 g m−3, whileCorti et al. (2008) report measurements with maximum of
Atmos. Chem. Phys., 10, 8267–8286, 2010 www.atmos-chem-phys.net/10/8267/2010/

X. M. Liu et al.: Overshoot modelling study from SCOUTT-AMMA 8279
Fig. 13. Scattergram of total H2O/potential temperature within the Grid 3 domain of BRAMS at different times of the simulation for theChad case.(a) Initial state at 18:00 UT on 3 August.(b) 14:15 UT on 4 August at the maximum of the overshooting activity.(c) 15:55 UTafter the overshooting activity.(d) 21:00 UT after the convective activity. The black solid line is the mean mixing ratio within the grid. Theblue dashed line is the initial mean mixing ratio. Purple crosses highlight grid points in the overshooting plume area (latitude from 11.95◦ Nto 12.06◦ N and longitude from 20.9◦ E to 21.1◦ E).
IWC typically of 1.10−3...3.10−3 g m−3. At this level, morecases have been sampled than at 390 K in Corti et al. (2008).Again, the measured and the observed IWCs are comparable.Between 400 and 410 K most of the BRAMS grid meshescontaining ice have IWC in the range 10−4 to 10−3 g m−3. InCorti et al. (2008), in the 400 K–420 K range, the same IWCvalues are reported but the maximum IWC values are gener-ally higher than for BRAMS. From this it can be concludedthat, although the IWC measurements reported in Corti etal. (2008) are from a different continent than Africa and can-not be directly compared with our simulation, the strato-spheric IWCs computed by BRAMS are of the same orderof magnitude and confirm that our overshoot simulation isrealistic.
In Fig. 13b purple crosses highlight grid points in the over-shooting plume area (latitude from 11.95◦ N to 12.06◦ N andlongitude from 20.9◦ E to 21.1◦ E). They show that most ofthe high water mixing ratios in the stratosphere are due tothis overshoot, enhancing the water amount of 2 to 3 ppmvabove the 400 K level.
Important to notice is that the mean profile at 14:15 UTis higher at any altitude than the initial profile, showing amean hydration at all level. The same conclusion is reached
when comparing the pre-overshoot mean profile at 12:00 UTon 4 August and the mean profile at 14:15 UT. After the over-shooting activity (panel c) stratospheric water values are lessscattered than during the overshoot. But there is still a lo-cal enhancement of 2 ppmv with respect to the mean profilebetween 380 and 390 K. A striking feature of panel b and cis the scatter of the very low water mixing ratios in the TTLbelow the tropopause, showing that deep convection can alsolead to dehydration in the upper troposphere. This tendencyis visible in the mean profile at 15:55 UT where it is lowerthan the initial state in the TTL from 360 K to 370 K. It isnot seen at 14:15 UT since deep convection leads to a lo-cal large hydration that influences the mean profile. Whenconvection disappears from Grid 3 (21:00 UT), there is al-most no variation of the water amount in the stratosphere,even if the mean profile remains significantly higher thanthe initial one. Above the tropopause, the mean profile istypically 0.21 ppmv at 400 K to 0.67 ppmv at 380 K higherthan the pre-overshoot mean profile at 12:00 UT between380 and 400 K. In the modelling study of overshooting con-vection above the Hector Cloud (maritime continent) usingthe ARW model, Chemel et al. (2009) report an estimationof 0.12 ppmv water increase in the 405–410 K range This
www.atmos-chem-phys.net/10/8267/2010/ Atmos. Chem. Phys., 10, 8267–8286, 2010

8280 X. M. Liu et al.: Overshoot modelling study from SCOUTT-AMMA
Fig. 14. Upward total water flux across different isentropic levelswithin the BRAMS Grid 3 domain between 12:00 UT and 15:55 UTfor the Chad case. For the 380 K and 390 K isentropic levels, thewater vapour flux are also shown (dashed line).
0.12 ppmv value corresponds to the maximum mean increaseout of all the increases computed every 5 K up to 425 K.This number is not directly comparable with the one givenin the present study since the size domain of the ARW sim-ulation is 341×341 km, that is 4.94 times our domain size(214×110 km). Thus the relatively low number of Chemel etal. (2009) is balanced by a larger domain. In Grosvenor etal. (2007) an idealized overshooting case over Brazil is dis-cussed. They report a mean moistening of∼0.3 ppmv abovethe tropopause in the 16–17 km range for the most vigorouscase of Grosvenor et al. (2007) with a domain size of 150×
150 km which is very close to the size of the present study.Thus, this 0.3 ppmv increase is comparable with the mix-ing ratio enhancement presented in the present study. Notealso that the Unified Model simulation of the Hector cloudalso presented in Chemel et al. (2009) which highlights a 5–6 ppmv increase in the range 410–415 K for a larger domain(240×240 km). This estimation is clearly higher than for theChad case.
Water fluxes of the Chad case are calculated for the mostactive period in Grid 3 from 12:00 UT to 16:00 UT on 4 Au-gust 2006. Figure 14 presents the times series of upwardtotal water flux through isentropic surface from 375 K to400 K. For all levels except 400 K several peaks are foundat 13:50 UT, 14:00 UT and 14:15 UT. They correspond wellto the time of overshooting plumes in Grid 3, as shown inFig. 9 for 14:15 UT. The overshooting signal is not obviousat the 400 K level. This can be explained by the fact that theovershooting plumes shown in Fig. 9 cross the 400 K level ina more limited area and that the ice mixing ratios are lower, incontrast to lowerθ -levels. Focusing on the tropopause level(380 K), the maximum instantaneous flux is of 3.77 ton s−1,which is 3 times less than for the 370 K (not shown) and1.66 times less than for the 375 K level. At the same time,note the instantaneous flux of more than 1 ton s−1 across the395 K level. After 14:15 UT, the instantaneous fluxes de-
crease rapidly to tend to the same value at levels higher than375 K when overshoot activity has disappeared in Grid 3, totend later to zero.
In order to compare our result with Chaboureau etal. (2007), upward fluxes for water vapour only at 380 Kand 390 K are reported in Fig. 14. At the maximum of theovershooting activity the water vapour flux at 380 K is 2.15times the total water flux with a value of 1.75 ton s−1. Thisconfirms that ice injection above the tropopause is a key ele-ment of the amount of water entering the stratosphere. How-ever the water vapour contribution is far from negligible. InChaboureau et al. (2007), the water upward flux reportedis 9 ton s−1 for the same isentropic level (380 K). At 390 Kthey report an 8 ton s−1 while it is 1.14 ton s−1 in the presentstudy. Keeping in mind that in Chaboureau et al. (2007)the domain of calculation is 2.66 larger than in the presentstudy, the differences highlighted here should be moderated:expressed in the same surface area as for the Chad case,the Chaboureau et al. (2007) fluxes would be 3.38 ton s−1
at 380 K and 3 ton s−1 at 390 K. Thus our calculations arecompatible with the one of Chaboureau et al. (2007) withthe same order of magnitude in the water modelling fluxesof typically a few tons per second. However our maximumestimation is still lower. This might be due to the use inour study of a double moment microphysical scheme anda budget calculation time step of 5 min instead of a singlemoment scheme. Marecal et al. (2010) have shown in a con-vective cell simulation that the amount of ice of the cell corewas higher for a single moment microphysical scheme thanfor a similar simulation using a double moment microphys-ical scheme. Another possible explanation is a differencein the vertical velocities computed in each simulation. Dur-ing the overshoot, the BRAMS simulation exhibits maximumvalues of typically 25 m s−1 with a peak value of 29 m s−1
at 14:00 UT, in contrast with the 75 m s−1 and 60 m s−1 re-ported in Chaboureau et al. (2007) which may not be realis-tic. Finally we have checked the influence of the time reso-lution to compute the fluxes on isentropic levels by choosingthe same 10 min resolution as in Chaboureau et al. (2007).No important difference appears with the 5 min time step cal-culation.
Integrated over the 4 h period covering the overshootingevent and on the surface area of Grid 3, the mass of total wa-ter crossing upward theθ -levels are given in Table 3. Thecorresponding numbers per unit of time are also given. Forthe 380 K level which corresponds to the tropopause, a to-tal mass of water of∼13 kton has crossed this level dur-ing the 4 h period. This corresponds to a mean value of∼3300 ton h−1 or 0.91 ton s−1. This computation does nottake into account potential removal of ice crystal by sedi-mentation. However, the total water relative humidity withrespect to ice computed by BRAMS highlights generally un-saturated conditions (<80%) in the LS, except a local maxi-mum of 110% at 14:20 UT at 17 km. These conditions pro-vide sublimation of ice crystal before they can be totally
Atmos. Chem. Phys., 10, 8267–8286, 2010 www.atmos-chem-phys.net/10/8267/2010/
X. M. Liu et al.: Overshoot modelling study from SCOUTT-AMMA 8281
Table 3. Water budget associated to the overshooting convection for the Chad and the Aır cases across different isentropic surfaces. Theintegrated flux is the total mass of water crossing theθ levels upward during the integration period covering the overshoot (4 h for the Chadcase and 1h 50 min for the Aır case). Also shown are the same results divided by the period of integration. The lower limit and the upperlimit of the mass of water injected by the overshoot which remains in the stratosphere after the ice disappears are given for each case.
Extra mass of water afterCases Isentropic levels (K) 370 K 375 K 380 K 385 K 390 K 395 K 400 K the overshoot (tons)
Chad Integrated flux (ton) 29 558 18 171 13 107 10 581 8963 7726 6841 Upper limit: 507Per unit time (ton h−1) 7389 4542 3276 2645 2240 1931 1710 Lower limit: 330Per unit time (ton s−1) 2.1 1.3 0.9 0.7 0.6 0.5 0.5
Aır Integrated flux (ton) 12 172 6313 4332 3465 2966 2677 2471 Upper limit: 200Per unit time (ton h−1) 6639 3443 2363 1890 1618 1460 1348Per unit time (ton s−1) 1.8 0.9 0.7 0.5 0.4 0.4 0.4
removed from the lower stratosphere by sedimentation. Nev-ertheless, ice particles do not sublimate instantaneously sothat this process could lead to a significant loss of water inthe stratosphere as suggested by Corti et al. (2008): the bud-get computed here should be seen as an upper limit.
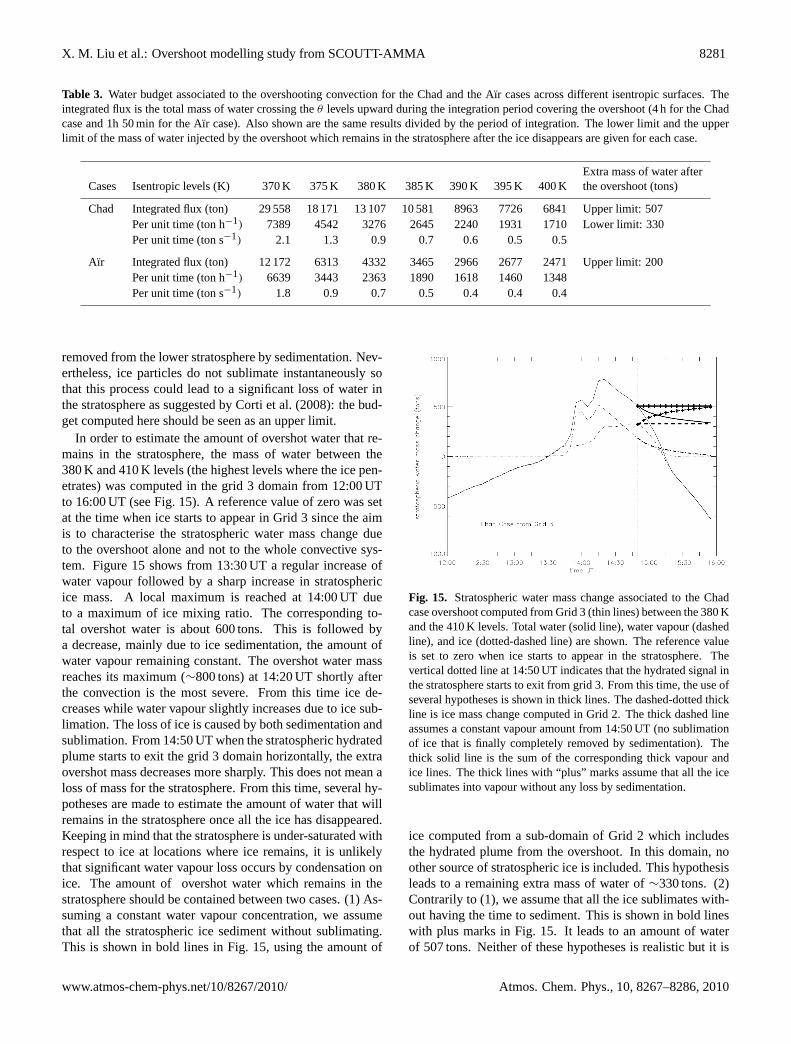
In order to estimate the amount of overshot water that re-mains in the stratosphere, the mass of water between the380 K and 410 K levels (the highest levels where the ice pen-etrates) was computed in the grid 3 domain from 12:00 UTto 16:00 UT (see Fig. 15). A reference value of zero was setat the time when ice starts to appear in Grid 3 since the aimis to characterise the stratospheric water mass change dueto the overshoot alone and not to the whole convective sys-tem. Figure 15 shows from 13:30 UT a regular increase ofwater vapour followed by a sharp increase in stratosphericice mass. A local maximum is reached at 14:00 UT dueto a maximum of ice mixing ratio. The corresponding to-tal overshot water is about 600 tons. This is followed bya decrease, mainly due to ice sedimentation, the amount ofwater vapour remaining constant. The overshot water massreaches its maximum (∼800 tons) at 14:20 UT shortly afterthe convection is the most severe. From this time ice de-creases while water vapour slightly increases due to ice sub-limation. The loss of ice is caused by both sedimentation andsublimation. From 14:50 UT when the stratospheric hydratedplume starts to exit the grid 3 domain horizontally, the extraovershot mass decreases more sharply. This does not mean aloss of mass for the stratosphere. From this time, several hy-potheses are made to estimate the amount of water that willremains in the stratosphere once all the ice has disappeared.Keeping in mind that the stratosphere is under-saturated withrespect to ice at locations where ice remains, it is unlikelythat significant water vapour loss occurs by condensation onice. The amount of overshot water which remains in thestratosphere should be contained between two cases. (1) As-suming a constant water vapour concentration, we assumethat all the stratospheric ice sediment without sublimating.This is shown in bold lines in Fig. 15, using the amount of
Fig. 15. Stratospheric water mass change associated to the Chadcase overshoot computed from Grid 3 (thin lines) between the 380 Kand the 410 K levels. Total water (solid line), water vapour (dashedline), and ice (dotted-dashed line) are shown. The reference valueis set to zero when ice starts to appear in the stratosphere. Thevertical dotted line at 14:50 UT indicates that the hydrated signal inthe stratosphere starts to exit from grid 3. From this time, the use ofseveral hypotheses is shown in thick lines. The dashed-dotted thickline is ice mass change computed in Grid 2. The thick dashed lineassumes a constant vapour amount from 14:50 UT (no sublimationof ice that is finally completely removed by sedimentation). Thethick solid line is the sum of the corresponding thick vapour andice lines. The thick lines with “plus” marks assume that all the icesublimates into vapour without any loss by sedimentation.
ice computed from a sub-domain of Grid 2 which includesthe hydrated plume from the overshoot. In this domain, noother source of stratospheric ice is included. This hypothesisleads to a remaining extra mass of water of∼330 tons. (2)Contrarily to (1), we assume that all the ice sublimates with-out having the time to sediment. This is shown in bold lineswith plus marks in Fig. 15. It leads to an amount of waterof 507 tons. Neither of these hypotheses is realistic but it is
www.atmos-chem-phys.net/10/8267/2010/ Atmos. Chem. Phys., 10, 8267–8286, 2010
8282 X. M. Liu et al.: Overshoot modelling study from SCOUTT-AMMA
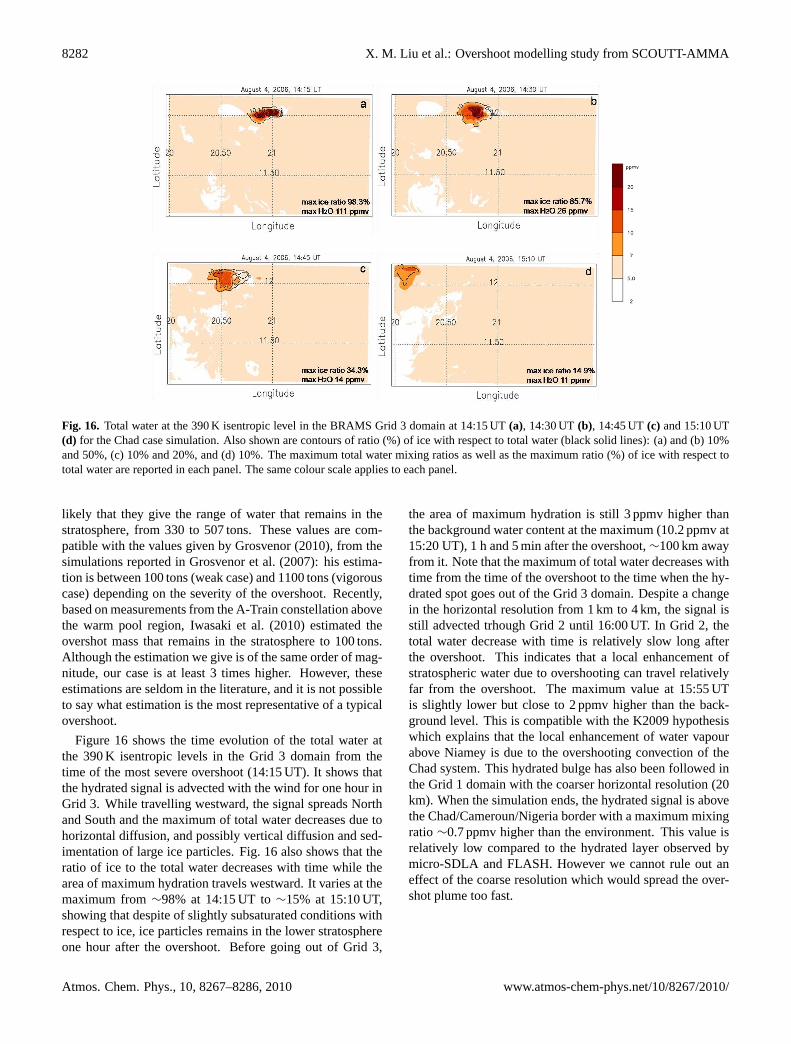
Fig. 16. Total water at the 390 K isentropic level in the BRAMS Grid 3 domain at 14:15 UT(a), 14:30 UT(b), 14:45 UT(c) and 15:10 UT(d) for the Chad case simulation. Also shown are contours of ratio (%) of ice with respect to total water (black solid lines): (a) and (b) 10%and 50%, (c) 10% and 20%, and (d) 10%. The maximum total water mixing ratios as well as the maximum ratio (%) of ice with respect tototal water are reported in each panel. The same colour scale applies to each panel.
likely that they give the range of water that remains in thestratosphere, from 330 to 507 tons. These values are com-patible with the values given by Grosvenor (2010), from thesimulations reported in Grosvenor et al. (2007): his estima-tion is between 100 tons (weak case) and 1100 tons (vigorouscase) depending on the severity of the overshoot. Recently,based on measurements from the A-Train constellation abovethe warm pool region, Iwasaki et al. (2010) estimated theovershot mass that remains in the stratosphere to 100 tons.Although the estimation we give is of the same order of mag-nitude, our case is at least 3 times higher. However, theseestimations are seldom in the literature, and it is not possibleto say what estimation is the most representative of a typicalovershoot.
Figure 16 shows the time evolution of the total water atthe 390 K isentropic levels in the Grid 3 domain from thetime of the most severe overshoot (14:15 UT). It shows thatthe hydrated signal is advected with the wind for one hour inGrid 3. While travelling westward, the signal spreads Northand South and the maximum of total water decreases due tohorizontal diffusion, and possibly vertical diffusion and sed-imentation of large ice particles. Fig. 16 also shows that theratio of ice to the total water decreases with time while thearea of maximum hydration travels westward. It varies at themaximum from∼98% at 14:15 UT to∼15% at 15:10 UT,showing that despite of slightly subsaturated conditions withrespect to ice, ice particles remains in the lower stratosphereone hour after the overshoot. Before going out of Grid 3,
the area of maximum hydration is still 3 ppmv higher thanthe background water content at the maximum (10.2 ppmv at15:20 UT), 1 h and 5 min after the overshoot,∼100 km awayfrom it. Note that the maximum of total water decreases withtime from the time of the overshoot to the time when the hy-drated spot goes out of the Grid 3 domain. Despite a changein the horizontal resolution from 1 km to 4 km, the signal isstill advected trhough Grid 2 until 16:00 UT. In Grid 2, thetotal water decrease with time is relatively slow long afterthe overshoot. This indicates that a local enhancement ofstratospheric water due to overshooting can travel relativelyfar from the overshoot. The maximum value at 15:55 UTis slightly lower but close to 2 ppmv higher than the back-ground level. This is compatible with the K2009 hypothesiswhich explains that the local enhancement of water vapourabove Niamey is due to the overshooting convection of theChad system. This hydrated bulge has also been followed inthe Grid 1 domain with the coarser horizontal resolution (20km). When the simulation ends, the hydrated signal is abovethe Chad/Cameroun/Nigeria border with a maximum mixingratio ∼0.7 ppmv higher than the environment. This value isrelatively low compared to the hydrated layer observed bymicro-SDLA and FLASH. However we cannot rule out aneffect of the coarse resolution which would spread the over-shot plume too fast.
Atmos. Chem. Phys., 10, 8267–8286, 2010 www.atmos-chem-phys.net/10/8267/2010/

X. M. Liu et al.: Overshoot modelling study from SCOUTT-AMMA 8283
Fig. 17. Same as Fig. 14 but for the Aır case, computed between18:00 UT and 19:50 UT on 5 August 2006.
5.2 Aır case and comparison with the Chad case
Similar calculations were carried out for the case of August5. The period of 18:00 UT to 19:50 UT has been used to com-pute water fluxes across different isentropic levels in the grid3 domain. We limit our calculation to this period in order tokeep only the period when there is a good agreement betweenthe MSG overshooting activity and the BRAMS overshoot-ing activity (see Sect. 4.2). The results are given in Fig. 17and flux values are summarized in Table 3. A two peak struc-ture is shown in Fig. 17, highlighting two different short pe-riods of intense overshooting convection. The first peak, at19:10 UT, is visible for allθ -levels showing that overshoot-ing convection directly injects ice particles above the 400 K,as shown in Fig. 12. At 380 K, this peak reaches a maxi-mum of 1.1 ton s−1 for total water, with a corresponding fluxfor water modelling of 0.56 ton s−1 (more than half the totalflux), which is less than the peak described for the Chad case.The latter number should be compared with the flux calcula-tion of Chaboureau et al. (2007), multiplied by the surfacearea ratio of each simulation (106×118/250×250=0.2), thatis 1.8 ton s−1 at 380 K and 1.6 ton s−1 at 390 K. Again, thecalculations of Chaboureau et al. (2007) are higher than ours.The second peak, at the end of the calculation period, reachesa higher value of 1.49 ton s−1 that is still lower than for theChad case. The difference is likely due to the smaller surfacearea of overshoots for the Aır case. Note for the second peakthat the overshooting signal is not seen at the 390 K level andabove. This illustrates that this overshoot penetrates thoselevels on smaller surface area that for the Chad case. Theintegrated fluxes during the whole period given in Table 3highlight lower values per unit of time than for the Chadcase, though the Aır case is shorter in duration. Forθ -levelsin the stratosphere (≥380 K), the Aır case budget is typically0.75 times the Chad budget. This shows the variability of theimpact of overshooting convection on the amount of waterinjected in the stratosphere among the cases.
The same stratospheric water mass change calculation hasbeen applied to the Aır case as for the Chad case. How-ever, considering the discrepancies between the model andthe BTD observation from 19:50 UT when the model over-estimates the overshooting activity, it is not possible to studythe evolution of the stratospheric hydrated plume. Contrarilyto the Chad case, the overshooting convection led to a strongincrease of ice (800 t at 19:00 UT) but was associated to aloss of water vapour in the surrounding, so that the total wa-ter increase at 19:50 UT is less than 200 tons. This numberhas to be compared with the 800 tons of total water whichare reached at maximum of the Chad case. We cannot con-clude about the water amount that remains in the stratospherebut it is clear that the Chad case hydrates significantly morethe stratosphere than the Aır case. Even assuming that the200 tons of water would remain in the stratosphere, which islikely not true, there would be at least a factor of two third be-tween the Aır and the Chad case. This highlights once againthat depending on the case studied, the impact on the strato-sphere hydration is significantly different. One of the reasonsfor the difference between the Aır and the Chad cases is thedifference with respect to the saturation: the Chad case oc-curs in a dryer environment than the Aır case. In the Aırcase, while injecting total water in the stratosphere, the satu-ration with respect to ice is reached in small area in the sur-rounding of the overshoot for all time considered at 380 K.Water vapour condenses on ice particles which fall out. Con-sequently, the modelled stratospheric water mass tends to de-crease shortly after the overshoot. Concurrently for the Chadcase, it was checked that the RHi was lower than 100% in theovershot plume. Thus ice particles tend to evaporate.
6 Conclusions
The aim of this study was to quantify the impact of two dif-ferent overshooting events on the water budget in tropicaltropopause region during the African monsoon 2006. One ofthese events was directly upstream of a pair of balloon flightsfrom Niamey measuring water vapour in the UTLS in theframe of the SCOUT-AMMA campaign. During these flightsa layer of enhanced water vapour of more than 2 ppmv wasmeasured. Three nested grids regional down to cloud resolv-ing simulations were conducted with the BRAMS model. Adouble moment bulk microphysical scheme is used in oursimulation. This study confirms previous estimates frommodel simulations that overshooting convection injects alarge amount of water via ice crystals which later sublimatein a sub saturated environment, while sedimenting. How-ever, our water modelling flux estimation is lower than theone of Chaboureau et al. (2007) who studied an overshootover Brazil. This could be due to the use of a double mo-ment scheme in BRAMS in contrast with the single momentscheme of meso-NH: single moment schemes are knownto overestimate precipitation and the concentration of ice
www.atmos-chem-phys.net/10/8267/2010/ Atmos. Chem. Phys., 10, 8267–8286, 2010

8284 X. M. Liu et al.: Overshoot modelling study from SCOUTT-AMMA
crystals with respect to double moment schemes which aremore precise. For the case of 4 August 2006 over South-ern Chad, a total amount of 13 kton is injected into thestratosphere leading locally to an enhancement of total wa-ter of 3 ppmv at 400 K and to mixing ratios higher than100 ppmv at the tropopause. At a regional scale, after theovershoot, the mean water amount in the Grid 3 domainabove the tropopause is still enhanced by 0.21 ppmv at 400 Kto 0.67 ppmv at 380 K. This result is comparable with the0.3 ppmv water enhancement given in an overshoot study inBrazil by Grosvenor et al. (2007) for a similar domain size,and is compatible with the ARW model simulated enhance-ment of 0.12 ppmv for Hector in Northern Australia (Chemelet al., 2009), in which the model size is larger than ours, mak-ing a direct comparison difficult. In the above mentionedstudy the water enhancement given by the UM model sim-ulation is much larger (5.91 ppmv) than is the present work.This highlights the variability among mesoscale models tosimulate the hydration of the lower stratosphere by deep con-vection, together with the variability of the impact of over-shoots depending on the continent considered. But whateverthis variability is, all these modelling studies conclude to apotential of overshooting convection to hydrate the LS.
A mass of extra total water that remains in the strato-sphere after the overshoot was computed: a range of 330 to507 tons was found, in the range of various estimations (100to 1100 tons) given by Grosvenor (2010). Our calculation ishigher than the estimation of 100 tons deduced from satelliteobservations (Iwasaki et al., 2010).
After being advected for more than one hour and∼100 kmaway from the overshoot, the hydrated area at the 390 K levelis still 3 ppmv higher than the background water amount,showing that the impact of the overshoot can be seen far awayfrom its location. Thus, it is likely that the water vapour en-hancement of more than 2 ppmv sampled by FLASH-B andmicro-SDLA on 5 August above Niamey is due to overshoot-ing convection over South Chad 30 h earlier, as proposed byKhaykin et al. (2009).
Another more organised overshooting system was stud-ied over Aır and the associated water budget across thetropopause was computed. It shows a total mass of waterinjected in the stratosphere 3 times lower than for the Chadsystem, though the Aır case is shorter. The difference is lessbut still significant when the result is expressed per unit oftime: 0.66 ton s−1 for the Aır case instead of 0.91 ton s−1 forthe Chad case. Our estimation of the water mass amountwhich remains in the stratosphere after the overshoot (at themost 200 tons) is two thirds that calculated for the Chad casefor the most favourable estimation. This shows the variabil-ity of the impact of overshooting convection on the hydrationpotential of the stratosphere, which was not highlighted inprevious studies.
The relative impact of overshooting convection with re-spect to the cold trap dehydration is not assessed yet. Theimpact of such mesoscale hydration at a larger space and
time scales needs to be studied first, in order to reconcilethe small scale and the larger scale H2O transport pathwayswhich are still highly debated. We propose as a first step tobetter estimate the variability of the impact of overshootingconvection among a larger set of different cases and differenttype of overshooting convection. We also propose to checkthe impact of key parameters in the model such as the mi-crophysical scheme or the model resolutions to pinpoint thereasons for the differences among models on the LS hydra-tion. Concurrently, it would be interesting in the future tocompare water budgets of the same case but with differentmesoscale models. From this, typical impact of overshootscould be obtained and be included in larger scale models toupscale the impact of overshooting convection on the wholetropical lower stratosphere.
Acknowledgements. This work was supported by the Europeanintegrated project SCOUT-O3 (GOCE-CT-2004-505390) and bythe program LEFE/INSU in France (projects UTLS-tropicale andTropopause 2009). The computer resources were provided byCRIHAN (Centre de Ressource Informatique de Haute Normandie)project n◦ 2008006 .This work was also granted access to theHPC resources of CINES under the allocation 20080125036 and2009015036 made by GENCI (Grand Equipement National deCalcul Intensif). The TRMM data were provided by GSFC/DAAC,NASA. The CALIPSO/CALIOP image was distributed by Atmo-spheric Science Data Center, at NASA Langley Research Center.Meteosat Second Generation data were provided by the AMMAdatabase and the Climserv database at Institut Pierre Simon Laplace(IPSL). One of the authors, Xiaoman Liu is funded by RegionChampagne-Ardenne. G. Penide and V. Giraud at Laboratoire deMeteorologie Physique (LaMP) are ackowledged for their advicesin the BRAMS setting. We wish to acknowledge D. Grosvenorwhose comments helped to improve the manuscript. Finally,we are grateful to the micro-SDLA technical team of DT-INSU(N. Amarouche, F. Blouzon and J. Deleglise) for their investmentduring the SCOUT-AMMA campaign in Niamey.
Edited by: N. Harris
The publication of this article is financed by CNRS-INSU.
References
Agusti-Panareda, A., Beljaars, A., Cardinali, C., Genkova, I, andThorncroft, C.: Impact of assimilating AMMA soundings onECMWF analyses and forecasts, Weather Forecast, 25(4), 1142–1160, 2010.
Agusti-Panareda, A., Vasiljevic, D., Beljaars, A., Bock, O.,Guichard, F., Nuret, M., Garcia Mendez, A., Anderson, B. E.,
Atmos. Chem. Phys., 10, 8267–8286, 2010 www.atmos-chem-phys.net/10/8267/2010/

X. M. Liu et al.: Overshoot modelling study from SCOUTT-AMMA 8285
Bechtold, P., Fink, A., Hersbach, H., Lafore, J.-P., Ngamini, J.-B., Parker, D. J., Redelsperger, J.-L., and Tompkins, A. M.: Ra-diosonde humidity bias correction over the West African regionfor the special AMMA reanalysis at ECMWF, Q. J. Roy. Meteo-rol. Soc., 135, 595–617, 2009.
Cairo, F., Pommereau, J. P., Law, K. S., Schlager, H., Garnier,A., Fierli, F., Ern, M., Streibel, M., Arabas, S., Borrmann, S.,Berthelier, J. J., Blom, C., Christensen, T., D’Amato, F., Di Don-francesco, G., Deshler, T., Diedhiou, A., Durry, G., Engelsen,O., Goutail, F., Harris, N. R. P., Kerstel, E. R. T., Khaykin, S.,Konopka, P., Kylling, A., Larsen, N., Lebel, T., Liu, X., MacKen-zie, A. R., Nielsen, J., Oulanowski, A., Parker, D. J., Pelon, J.,Polcher, J., Pyle, J. A., Ravegnani, F., Rivire, E. D., Robinson, A.D., Rockmann, T., Schiller, C., Simoes, F., Stefanutti, L., Stroh,F., Some, L., Siegmund, P., Sitnikov, N., Vernier, J. P., Volk, C.M., Voigt, C., von Hobe, M., Viciani, S., and Yushkov, V.: An in-troduction to the SCOUT-AMMA stratospheric aircraft, balloonsand sondes campaign in West Africa, August 2006: rationale androadmap, Atmos. Chem. Phys., 10, 2237–2256, doi:10.5194/acp-10-2237-2010, 2010.
Chaboureau, J.-P., Cammas, J.-P., Duron, J., Mascart, P. J., Sitnikov,N. M., and Voessing, H.-J.: A numerical study of tropical cross-tropopause transport by convective overshoots, Atmos. Chem.Phys., 7, 1731–1740, doi:10.5194/acp-7-1731-2007, 2007.
Chemel, Ch., M. Russo, J. A. Pyle, R. S. Sokhi, and C. Schiller:Quantifying the imprint of a sever Hector thunderstorm duringACTIVE/SCOUT-O3 onto the water content in the upper tropo-sphere/lower stratosphere, Mon. Weather Rev., 103, 2493–2514,doi:10.1175/2008MWR2666.1, 2009.
Corti, T., Luo, B. P., de Reus, M., Brunner, D., Cairo, F., Ma-honey, M. J., Martucci, G., Matthey, R., Mitev, V., dos Santos,F.H., Schiller, C., Shur, G., Sitnikov, N. M., Spelten, N., Voss-ing, H. J., Borrmann, S., and Peter, T.: Unprecedented evidencefor overshooting convection hydrating the tropical stratosphere,Geophys. Res. Lett., 35, L10810, doi:10.1029/2008GL033641,2008.
Cotton, W. R., Pielke Sr., R. A., Walko, R. L., Liston, G. E.,Tremback, C. J., Jiang, H., McAnelly, R. L., Harrington, J.-Y.,Nicholls, M. E., Carrio, G. G., and McFadden, J. P.: RAMS2001: Current status and future directions, Meteorol. Atmos.Phys., 82, 5–29, doi:10.1007/s00703-001-0584-9, 2003.
Durry, G., Amarouche, N., Zeninari, V., Parvitte, B., Lebarbu,T., and Ovarlez, J.: In situ sensing of the middle atmospherewith balloonborne near-infrared laser diodes, Spectrochim. Acta,60(4), 3371–3379, 2004.
Freitas, S. R., Longo, K. M., Silva Dias, M. A. F., Chatfield, R.,Silva Dias, P., Artaxo, P., Andreae, M. O., Grell, G., Rodrigues,L. F., Fazenda, A., and Panetta, J.: The Coupled Aerosol andTracer Transport model to the Brazilian developments on the Re-gional Atmospheric Modeling System (CATT-BRAMS) – Part 1:Model description and evaluation, Atmos. Chem. Phys., 9, 2843–2861, doi:10.5194/acp-9-2843-2009, 2009.
Fueglistaler, S., Wernli, H., and Peter, T.: Tropical troposphere-to-stratosphere transport inferred from trajectory calculations, J.Geophys. Res., 109, D03108, doi:10.1029/2003JD004069, 2004.
Fueglistaler, S., Bonazzola, M., Haynes, P. H., and Peter, T.: Strato-spheric water vapour predicted from Lagrangian temperature his-tory of air entering the stratosphere in the tropics, J. Geophys.Res., 110, D08107, doi:10.1029/2004JD005516, 2005.
Fueglistaler, S., Dessler, A. E., Dunkerton, T. J., Folkins, I., Fu, Q.,and Mote, P. W.: The tropical tropopause layer, Rev. Geophys.,47, RG1004, doi:10.1029/2008RG0002672009, 2009.
Gettelman, A., Salby, M. L., and Sassi, F.: The distribution andinfluence of convection in the tropical tropopause region, J. Geo-phys. Res., 107, 4080, doi:10.1029/2001JD001048, 2002.
Grell, G. A. and Devenyi, D.: A generalized approachto parameterizing convection combining ensemble and dataassimilation techniques, Geophys. Res. Lett., 29, 1693,doi:10.1029/2002GL015311, 2002.
Grosvenor, D. P., Choularton, T. W., Coe, H., and Held, G.: Astudy of the effect of overshooting deep convection on the wa-ter content of the TTL and lower stratosphere from Cloud Re-solving Model simulations, Atmos. Chem. Phys., 7, 4977–5002,doi:10.5194/acp-7-4977-2007, 2007.
Grosvenor, D.: Interactive comment on “Water vapour budget asso-ciated to overshoots in the tropical stratosphere: mesoscale mod-elling study of 4–5 August 2006 during SCOUT-AMMA” by X.M. Liu et al., Atmos. Chem. Phys. Discuss., 10, C1348–C1351,2010.
Harrington, J. Y.: The effects of radiative and microphysical pro-cesses on simulated warm and transition season Arctic stratus,PhD Diss., Atmospheric Science Paper N◦ 637, Colorado StateUniversity, Department of Atmospheric Science, Fort Collins,CO 80523, 289 pp., 1997.
Holton, J., Haynes, P., McIntyre, M., Douglass, A., Rood, R., andPfister, L.: Stratosphere-Troposphere Exchange, Rev. Geophys.,33(4), 403-439, 1995.
Holton, J. R. and Gettelman, A.: Horizontal transport and the dehy-dration of the stratosphere, Geophys. Res. Lett., 28, 2799–2802,2001.
Huffman, G. J., Adler, R. F., Bolvin, D. T., Gu, G., Nelkin, E.J., Bowman, K. P., Hong, Y., Stocker, E. F., and Wolff, D. B.:The TRMM multi-satellite precipitation analysis: quasi-global,multi-year, combined-sensor precipitation estimates at fine scale,J. Hydrometeor, 8(1), 38–55, 2007.
Iwasaki, S., Shibata, T., Nakamoto, J., Okamoto, H., Ishimoto, H.,and Kubota, H.: Characteristics of deep convection measured byusing the A-train constellation, J. Geophys. Res., 115, D06207,doi:10.1029/2009JD013000, 2010.
James, R., Bonazzola, M., Legras, B., Surbled, K., and Fueglistaler,S.: A Lagrangian analysis of a the Asian Monsoon WaterVapour Maximum at 110 hPa, Geophys. Res. Lett., 35, L20810,doi:10.1029/2008GL035441, 2008.
Jones, A., Urban, J., Murtagh, D. P., Eriksson, P., Brohede, S., Ha-ley, C., Degenstein, D., Bourassa, A., von Savigny, C., Sonkaew,T., Rozanov, A., Bovensmann, H., and Burrows, J.: Evolu-tion of stratospheric ozone and water vapour time series studiedwith satellite measurements, Atmos. Chem. Phys., 9, 6055–6075,doi:10.5194/acp-9-6055-2009, 2009.
Khaykin, S., Pommereau, J.-P., Korshunov, L., Yushkov, V.,Nielsen, J., Larsen, N., Christensen, T., Garnier, A., Lukyanov,A., and Williams, E.: Hydration of the lower stratosphere byice crystal geysers over land convective systems, Atmos. Chem.Phys., 9, 2275–2287, doi:10.5194/acp-9-2275-2009, 2009.
Liu, C. and Zipser, E. J.: Global distribution of convection penetrat-ing the tropical tropopause, J. Geophys Res., 110(D23), D23104,doi:10.1029/2005JD006063, 2005.
Marecal, V., Durry, G., Longo, K., Freitas, S., Riviere, E. D., and
www.atmos-chem-phys.net/10/8267/2010/ Atmos. Chem. Phys., 10, 8267–8286, 2010

8286 X. M. Liu et al.: Overshoot modelling study from SCOUTT-AMMA
Pirre, M.: Mesoscale modelling of water vapour in the tropi-cal UTLS: two case studies from the HIBISCUS campaign, At-mos. Chem. Phys., 7, 1471–1489, doi:10.5194/acp-7-1471-2007,2007.
Marecal, V., Pirre, M., Riviere, E. D., Pouvesle, N., Crowley, J.N., Freitas, S. R., and Longo, K. M.: Modelling the reversibleuptake of chemical species in the gas phase by ice particlesformed in a convective cloud, Atmos. Chem. Phys., 10, 4977–5000, doi:10.5194/acp-10-4977-2010, 2010.
Meyers, M. P., Walko, R. L., Harrington, J. Y., and Cotton, W. R.,New RAMS cloud microphysics parameterization. Part II: Thetwo-moment scheme, Atmos. Res., 45, 3–39, 1997.
Nielsen, J. K., Larsen, N., Cairo, F., Di Donfrancesco, G., Rosen,J. M., Durry, G., Held, G., and Pommereau, J. P.: Solid particlesin the tropical lowest stratosphere, Atmos. Chem. Phys., 7, 685–695, doi:10.5194/acp-7-685-2007, 2007.
Oltmans, S. J., Vomel, H., Hofmann, D. J., Rosenlof, K. H., andKley, D.: The increase in stratopsheric water vapour from bal-loonborne frostpoint hygrometer measurements at WashingtonDC, and Boulder, Colorado, Geophys. Res. Lett., 27, 3453–3456,2000.
Penide, G., Giraud, V., Bouniol, D., Dubuisson, P., Duroure, C.,Protat, A., and Cautenet, S.: Numerical Simulation of the 7 to9 September 2006 AMMA mesoscale convective system: Evalu-ation of the Dynamics and Cloud Microphysics using Syntheticobservations, Q. J. Roy. Meteor. Soc., 136, 304–322, 2010.
Pommereau, J.-P. and Held, G.: Is there a stratospheric fountain?,Atmos. Chem. Phys. Discuss., 7, 8933–8950, doi:10.5194/acpd-7-8933-2007, 2007.
Randel, W. J., Wu. F., Gettelman. A., Russell. J. M., Zawodny. J.M.. and Oltmans. S. J.: Seasonal variation of water vapour in thelower stratosphere observed in Halogen Occultation Experimentdata, J. Geophys. Res., 106, 14313–14326, 2001.
Randel, W. J., Wu, F., Vomel, H., Nedoluha, G. E., andForster, P.: Decreases in stratospheric water vapor after2001: Links to changes in the tropical tropopause and theBrewer-Dobson circulation, J. Geophys. Res., 111, D12312,doi:10.1029/2005JD006744, 2006.
Redelsperger, J.-L., Thorncroft, C. D., Diedhiou, A., Lebel, T.,Parker, D. J., and Polcher, J.: African monsoon multidisciplinaryanalysis: An international research project and field campaign,B. Am. Meteor. Soc., 87, 1739–1746, 2006.
Roca, R., Viollier, M., Picon, L., and Desbois, M.: A multi satelliteanalysis of deep convection and its moist environment over theIndian Ocean during the winter monsoon, J. Geophys. Res., 107,8012, doi:10.1029/2000JD000040, 2002.
Rosenlof, K., Oltmans, S., Kley, D., Russell III, J. M., et al.: Strato-spheric water vapour increases over the past half-century, Geo-phys. Res. Lett., 28(7), 1195–1198, 2001.
Scherer, M., Vomel, H., Fueglistaler, S., Oltmans, S. J., and Staehe-lin, J.: Trends and variability of midlatitude stratospheric watervapour deduced from the re-evaluated Boulder balloon series andHALOE, Atmos. Chem. Phys., 8, 1391–1402, doi:10.5194/acp-8-1391-2008, 2008.
Schiller, C., Grooß, J.-U., Konopka, P., Ploger, F., Silva dosSantos, F. H., and Spelten, N.: Hydration and dehydration atthe tropical tropopause, Atmos. Chem. Phys., 9, 9647–9660,doi:10.5194/acp-9-9647-2009, 2009.
Schmetz, J., Tjemkes, S. A., Gube, M., and van de Berg, L.: Mon-itoring deep convection and convective overshooting with ME-TEOSAT, Adv. Space Res., 19, 433–441, 1997.
Seidel, D. J., Ross, R. J., Angell, J. K., and Read, G. C.: Climato-logical characteristics of the tropical tropopause as revealed byradiosondes, J. Geophys. Res., 106, 7857–7878, 2001.
Solomon, S., Rosenlof, K. H., Portmann, R. W., Daniel, J. S.,Davis, S. M., Sanford, T. J. and Plattner, G.-K. : Contri-butions of Stratospheric Water Vapor to Decadal Changes inthe Rate of Global Warming, Science, 327, 5970, 1219–1223,doi:10.1126/science.1182488, 2010.
Stohl, A. and Seibert, P.: Accuracy of trajectories as determinedfrom the conservation of meteorological tracers, Q. J. Roy. Me-teor. Soc., 124, 1465–1484, 1998.
Zipser, E. J., Cecil, D. J., Liu, C., Nesbitt, S. W., and Yorthy, D.P.: Where are the most intense thunderstorms on Earth?, B. Am.Meteor. Soc, 87, 1058–1072, 2006.
Atmos. Chem. Phys., 10, 8267–8286, 2010 www.atmos-chem-phys.net/10/8267/2010/