Measurements and modeling of photolysis rates during the Photochemical Activity and Ultraviolet...
12
Measurements and modeling of photolysis rates during the Photochemical Activity and Ultraviolet Radiation (PAUR) II campaign D. S. Balis, 1 C. S. Zerefos, 1 K. Kourtidis, 1 A. F. Bais, 1 A. Hofzumahaus, 2 A. Kraus, 2,3 R. Schmitt, 4 M. Blumthaler, 5 and G. P. Gobbi 6 Received 6 November 2000; revised 15 June 2001; accepted 18 June 2001; published 11 September 2002. [1] In this paper we compare radiative transfer model calculations of the actinic flux in the UV spectral region with airborne measurements of the actinic flux, obtained during the Photochemical Activity and Ultraviolet Radiation (PAUR) campaign, which took place in the Aegean Sea, Greece, in June 1996, in order to assess the accuracy of the model in calculating photolysis rates, when the model input parameters are well defined from measurements. The model can simulate the total actinic flux (4p sr) in the UV-A region with an accuracy of 5% for all altitudes (0.1–12 km) in the cloud free troposphere, while in the UV-B the impact of the vertical distribution of ozone and aerosol can lead to differences, of about 5 – 10% at low altitudes up to 20% at higher altitudes. Next, the photolysis rates of J(O 1 D) and J(NO 2 ) measured during the PAUR 2, in Crete, Greece (35.5°N, 23.8°E), in May 1999, at two altitudes (Gerani 30 m and Prases 1000 m), are compared with the respective model calculations in order to examine the effect of the alternating Sahara dust/ maritime aerosol environments imposed to these photolysis rates, as well as to examine their differences due to the altitude difference. It is shown that high levels of tropospheric ozone and absorbing aerosols can cause a decrease in the photolysis rates of ozone near the surface, even under conditions of reduced total ozone content. This fact indicates that tropospheric ozone can be disproportionately important as a filter against UV-B radiation when most scattering of the radiation by air molecules and dust occurs in the troposphere. This behavior is not simulated accurately using a radiative transfer model constrained by observations of ozone and aerosol optical depths. The differences of the of the photolysis rates between the two altitudes as determined by the model and by the measurements, differ significantly for the Sahara dust event, indicating that during this event in the boundary layer, there is a mixture of desert and nonabsorbing aerosols. INDEX TERMS: 0365 Atmos- pheric Composition and Structure: Troposphere—composition and chemistry; 0368 Atmospheric Composition and Structure: Troposphere—constituent transport and chemistry; 0317 Atmospheric Composition and Structure: Chemical kinetic and photochemical properties; KEYWORDS: Total ozone, photochemistry, UVB radiation Citation: Balis, D. S., C. S. Zerefos, K. Kourtidis, A. F. Bais, A. Hofzumahaus, A. Kraus, R. Schmitt, M. Blumthaler, and G. P. Gobbi, Measurements and modeling of photolysis rates during the Photochemical Activity and Ultraviolet Radiation (PAUR) II campaign, J. Geophys. Res., 107(D18), 8138, doi:10.1029/2000JD000136, 2002. 1. Introduction [2] The knowledge of the photolysis rates of key atmos- pheric compounds is of considerable importance for the atmospheric chemistry. The photolysis of ozone (O 3 ) into O 1 D in the presence of water vapor is the main source of hydroxyl radicals (OH), which determine the oxidizing capacity of the atmosphere and thus the lifetime of many tropospheric gases. The photolysis of nitrogen dioxide (NO 2 ) controls the photochemical production of ozone and the concentrations of the total peroxy radicals. The photolysis rate coefficients are an essential input to photo- chemical models of the atmosphere. The photolysis rate of a given molecule can be calculated from J ¼ Z sl; T ð Þfl; T ð ÞF l ðÞdl; ð1Þ where s(l, T ) is the wavelength- and temperature-dependent absorption cross section of the molecule, (l, T ) is the JOURNAL OF GEOPHYSICAL RESEARCH, VOL. 107, NO. D18, 8138, doi:10.1029/2000JD000136, 2002 1 Laboratory of Atmospheric Physics, Aristotle University of Thessalo- niki, Greece. 2 Institute for Atmospheric Chemistry, Forschungzentrum Ju ¨lich, Germany. 3 Now at Gruenenthal GmbH, Aachen, Germany. 4 Meteorologie Consult GmbH, Hessen, Germany. 5 Institute of Medical Physics, University of Innsbruck, Innsbruck, Austria. 6 Instituto di Fisica Dell’ Atmosfera, Consiglio Nazionale delle Ricerche, Rome, Italy. Copyright 2002 by the American Geophysical Union. 0148-0227/02/2000JD000136$09.00 PAU 5 - 1
-
Upload
universidaddelmuseosocialargentino -
Category
Documents
-
view
0 -
download
0
Transcript of Measurements and modeling of photolysis rates during the Photochemical Activity and Ultraviolet...

Measurements and modeling of photolysis rates
during the Photochemical Activity and Ultraviolet
Radiation (PAUR) II campaign
D. S. Balis,1 C. S. Zerefos,1 K. Kourtidis,1 A. F. Bais,1 A. Hofzumahaus,2 A. Kraus,2,3
R. Schmitt,4 M. Blumthaler,5 and G. P. Gobbi6
Received 6 November 2000; revised 15 June 2001; accepted 18 June 2001; published 11 September 2002.
[1] In this paper we compare radiative transfer model calculations of the actinic flux in theUV spectral region with airborne measurements of the actinic flux, obtained during thePhotochemical Activity and Ultraviolet Radiation (PAUR) campaign, which took place inthe Aegean Sea, Greece, in June 1996, in order to assess the accuracy of the model incalculating photolysis rates, when the model input parameters are well defined frommeasurements. The model can simulate the total actinic flux (4p sr) in the UV-A region withan accuracy of 5% for all altitudes (0.1–12 km) in the cloud free troposphere, while in theUV-B the impact of the vertical distribution of ozone and aerosol can lead to differences,of about 5–10% at low altitudes up to 20% at higher altitudes. Next, the photolysis rates ofJ(O1D) and J(NO2) measured during the PAUR 2, in Crete, Greece (35.5�N, 23.8�E), inMay 1999, at two altitudes (Gerani 30 m and Prases 1000 m), are compared with therespective model calculations in order to examine the effect of the alternating Sahara dust/maritime aerosol environments imposed to these photolysis rates, as well as to examinetheir differences due to the altitude difference. It is shown that high levels of troposphericozone and absorbing aerosols can cause a decrease in the photolysis rates of ozone near thesurface, even under conditions of reduced total ozone content. This fact indicates thattropospheric ozone can be disproportionately important as a filter against UV-B radiationwhen most scattering of the radiation by air molecules and dust occurs in the troposphere.This behavior is not simulated accurately using a radiative transfer model constrained byobservations of ozone and aerosol optical depths. The differences of the of the photolysisrates between the two altitudes as determined by the model and by the measurements, differsignificantly for the Sahara dust event, indicating that during this event in the boundarylayer, there is a mixture of desert and nonabsorbing aerosols. INDEX TERMS: 0365 Atmos-
pheric Composition and Structure: Troposphere—composition and chemistry; 0368 Atmospheric Composition
and Structure: Troposphere—constituent transport and chemistry; 0317AtmosphericComposition and Structure:
Chemical kinetic and photochemical properties; KEYWORDS: Total ozone, photochemistry, UVB radiation
Citation: Balis, D. S., C. S. Zerefos, K. Kourtidis, A. F. Bais, A. Hofzumahaus, A. Kraus, R. Schmitt, M. Blumthaler, and G. P.
Gobbi, Measurements and modeling of photolysis rates during the Photochemical Activity and Ultraviolet Radiation (PAUR) II
campaign, J. Geophys. Res., 107(D18), 8138, doi:10.1029/2000JD000136, 2002.
1. Introduction
[2] The knowledge of the photolysis rates of key atmos-pheric compounds is of considerable importance for the
atmospheric chemistry. The photolysis of ozone (O3) intoO1D in the presence of water vapor is the main source ofhydroxyl radicals (OH), which determine the oxidizingcapacity of the atmosphere and thus the lifetime of manytropospheric gases. The photolysis of nitrogen dioxide(NO2) controls the photochemical production of ozoneand the concentrations of the total peroxy radicals. Thephotolysis rate coefficients are an essential input to photo-chemical models of the atmosphere. The photolysis rate of agiven molecule can be calculated from
J ¼Z
s l; Tð Þf l; Tð ÞF lð Þdl; ð1Þ
where s(l, T ) is the wavelength- and temperature-dependentabsorption cross section of the molecule, �(l, T ) is the
JOURNAL OF GEOPHYSICAL RESEARCH, VOL. 107, NO. D18, 8138, doi:10.1029/2000JD000136, 2002
1Laboratory of Atmospheric Physics, Aristotle University of Thessalo-niki, Greece.
2Institute for Atmospheric Chemistry, Forschungzentrum Julich,Germany.
3Now at Gruenenthal GmbH, Aachen, Germany.4Meteorologie Consult GmbH, Hessen, Germany.5Institute of Medical Physics, University of Innsbruck, Innsbruck,
Austria.6Instituto di Fisica Dell’ Atmosfera, Consiglio Nazionale delle
Ricerche, Rome, Italy.
Copyright 2002 by the American Geophysical Union.0148-0227/02/2000JD000136$09.00
PAU 5 - 1

quantum yield of the molecule and F(l) is the solar actinicflux for a certain zenith angle and altitude, determined as[e.g., Madronich, 1993]
F ¼ Fdir=m0 þZ2p
0
Zþ1
�1
I J;jð Þd cosJð Þdj; ð2Þ
where Fdir is the direct component of the actinic flux, m0 isthe cosine of the solar zenith angle, I is the spectral radiance(or intensity), and q and j are the polar and azimuthal anglesof the diffuse radiance.[3] The absorption cross section and the quantum yield are
measured experimentally in the laboratory, while the actinicflux over the spectral region of interest can be eithermeasured in the field or calculated theoretically, using aradiative transfer model. The photolysis of NO2 occurs for l< 420 nm, while the photolysis of O3 occurs for l < 330 nm.The well-established negative stratospheric ozone trends[e.g., World Meteorological Organization, 1999] and thestrong indications for increases of the solar UV irradiance,reaching the Earth’s surface [e.g., Zerefos et al., 1997, 1998a;Seckmeyer et al., 1997; Kerr and McElroy, 1993], suggestthat the accurate knowledge of these photolysis rates will beessential for modeling and predicting the impact of the abovementioned changes to the tropospheric chemistry.[4] There have been various studies, either experimental
or theoretical, which cover different aspects of the accuratedetermination of photolysis rates. Most of these studies referto measurement campaigns, laboratory studies, and radiativetransfer modeling. For a long time, measurements of pho-tolysis frequencies were performed using chemical actino-metry [e.g., Lantz et al., 1996; Shetter et al., 1996, andreferences therein]. Muller et al. [1995] presented a newexperimental approach for the determination of the photol-ysis rate of ozone from spectroradiometric measurementsand compared them with chemical actinometer measure-ments. They performed their measurements at ground inJulich, Germany, in the fall of 1993. The field comparisonindicated the importance of accurate measurements of theO1D quantum yield and supported laboratory studies wherethey measured O1D quantum yields of 0.2 to 0.3 between315 and 320 nm. McElroy et al. [1995] determined photol-ysis frequencies from airborne measurements of direct andscattered solar irradiance. They compared the J values withmodel calculations, using the same absorption cross sectionsand quantum yields for measurement and found agreementwithin 20% for J(NO2) and J(O1D). An accuracy of 10%was also found by Kraus et al. [2000] for the spectroradio-metric determination of J(NO2) during the JCOM97 experi-ment. Within the experimental uncertainties, Kraus andHofzumahaus [1998] found good agreement between pho-tolysis rates determined by spectroradiometry and thosedetermined by filter radiometers, absolutely calibratedagainst chemical actinometers. Lantz et al. [1996] deter-mined theoretically, as well as with radiometric and actino-metric means, the photolysis rate coefficient of NO2 duringthe Mauna Loa Observatory Photochemistry Experiment 2(MLOPEX 2) and found a discrepancy between theoreticaland measured values of the order of 40%, which could notbe attributed to any changes of an aerosol indicator. Shetteret al. [1996], also during MLOPEX 2, performed radio-
metric and actinometric measurements of the J(O1D), alongwith modeling calculations. They confirmed the importanceof the accurate experimental determination of the quantumyield, which affects the comparison between theoretical andmeasured values. A number of groups [Michelsen et al.,1994; Takahashi et al., 1996; Ball et al., 1997; Silvente et al.,1997; Talukdar et al., 1998] remeasured the O1D quantumyield in the laboratory. Talukdar et al. [1998] presentedmeasurements of the O1D quantum yields between 203 Kand 320K and 289 to 329 nm and calculated larger photolysisrates than those obtained from previous recommendations[Atkinson et al., 1992; DeMore et al., 1994] also dependingon the solar zenith angle and ozone column abundance.[5] The need for accurate photolysis rates in photochem-
ical modeling resulted in the development of variousradiative transfer models, which calculate these rates. Thereare recently many sensitivity studies, which use thesemodels to examine the influence of various input parametersin the calculated photolysis rates and in photochemicalactivity. Madronich and Granier [1994] note that increasesin tropospheric UV, resulting from stratospheric ozonedepletion will increase the reactivity of the troposphere.Krol and van Weele [1997] studied the effect of ozonedepletion, clouds, and surface reflection on photolysis ratesand their implications for global atmospheric chemistry,indicating that stratospheric ozone affects predominatelythe photolysis rate of ozone, while clouds and surfacereflectivity affect all photolysis rates. Castro et al. [1997]provided a sensitivity analysis of photolysis rates of NO2 inthe atmosphere of Mexico City and highlighted the impor-tance for providing local resolution for photolysis rates byconsidering different local conditions within the modelingdomain of air quality models. Ruggaber et al. [1997] usedtheir radiative transfer model to calculate photolysis rates inthe aqueous phase, which play an important role in atmos-pheric chemistry. Jacobson [1998] studied the effects ofaerosols on vertical photolysis rate coefficients over anurban air shed, indicating that photolysis rate changes dueto aerosols decreased near-surface ozone mixing ratios inLos Angeles by 5–8%. Liao et al. [1999] report on theeffects of various types of aerosols on 14 troposphericphotolysis reactions, indicating that nonabsorbing aerosolgenerally enhances photolysis rates above and in the upperpart of the aerosol layer, while soot and mineral aerosolreduce photolysis rates. He and Carmichael [1999] providea sensitivity of photolysis rates and ozone production in thetroposphere to aerosol properties using a coupled transport-chemistry-radiative transfer model, reporting reductions upto 70% to ground level ozone in the presence of absorbingaerosols in the boundary layer.[6] Recently, results from the International Photolysis
Frequency Measurement and Model Intercomparison(IPMMI) that was held in Boulder, Colorado, in June1998 were presented [Bais et al., 2000]. Seventeen radiativetransfer models took part in the modeling exercise, while thephotolysis frequencies were recorded at the surface byspectroradiometers, chemical actinometers, and broadbandradiometers from eight groups. The comparison amongmeasured photolysis rates showed that the majority of theinstruments are in good agreement. For clear skies thecomparability among different models depends stronglyon wavelength and solar zenith angle, and these differences
PAU 5 - 2 BALIS ET AL.: MEASUREMENTS AND MODELING OF PHOTOLYSIS RATES

are also reflected in the modeled J. The model calculationsfrom the majority of the models were in good agreement forsolar zenith angles <60�.[7] Much limited knowledge exists on the photolysis rates
over the photochemically active area of Eastern Mediterra-nean. As part of the Photochemical Activity and SolarUltraviolet Radiation (PAUR) and PAUR II projects, twomeasuring campaigns took place in Greece. The first onetook place in June 1996 on the small island of AgiosEfstratios (39.57�N, 24.97�E) in the northern Aegean Seaand in Tatoi-Athens (38.11�N, 23.78�E). During that cam-paign key chemical compounds were measured [Zerefos etal., 1998b; Hofzumahaus and Hancock, 1997], spectralmeasurements of UV irradiance were performed [Kylling etal., 1998], in addition to measurements of the aerosol opticaldepth and the ozone profile [Marenco et al., 1997]. Alsoairborne measurements of the actinic flux in the UV spectralregion were performed over the Aegean Sea [Hofzumahauset al., 2002], as part of a joint PAUR-Altitude Dependence ofthe Tropospheric Ozone Photolysis (ATOP) experiment[Zerefos et al., 1998b]. The second campaign (PAUR II)took place in Crete, Greece, during May 1999 [Zerefos et al.,2002]. During this campaign, chemical compounds and theaerosol composition were measured at two different alti-tudes. In addition, at both sites, spectral measurements of theUV irradiance were performed, as well as measurements ofthe photolysis rates of J(O1D) and J(NO2).[8] In this paper we compare radiative transfer model
calculations of the actinic flux in the UV spectral regionwith airborne measurements of the actinic flux, obtainedduring the PAUR-ATOP campaign, in order to assess theaccuracy of the model in calculating photolysis rates, whenthe model input parameters are well defined from themeasurements. Next, the photolysis rates of J(O1D) andJ(NO2) which were measured during PAUR II at twoaltitudes Gerani (35.53�N, 23.78�E, 30 m above sea level(asl)), and Prases (35.36�N, 23.85�E, 1000 m asl) arecompared with the respective model calculations in orderto examine the effect of the alternating aerosol composition(Sahara dust to maritime or urban aerosol) and of localenvironmental factors.[9] The paper is organized in the following way: First, we
give a brief description of the radiative transfer model usedin this paper together with the model input parameters. Thenwe describe the source of the measured input parametersused for the calculations, as well the instrumentation usedfor the airborne measurements of the actinic flux and for themeasurements of the photolysis rates. A brief description ofthe aerosol optical depth measurements used in this studyfollows. After that, for various altitudes in the tropospherethe model calculations of the actinic flux are compared withthe airborne measurements in order to justify its use forphotolysis rates calculations. Finally, the model calculationsof the photolysis rates are compared with the measurementsobtained during PAUR II in order to investigate the effect ofdifferent aerosol environments on these measurements.
2. Data and Modeling
2.1. Radiative Transfer Model
[10] For the model calculations presented in this study theTropospheric Ultraviolet and Visible (TUV) model was
used [Madronich, 1993] (TUV version 4), which wasavailable by anonymous ftp from S. Madronich, NationalCenter for Atmospheric Research (NCAR). TUV includesdifferent options for solving the radiative transfer equation,including various well-documented two-stream approxima-tions as well as the discrete ordinate solver (DISORT)[Stamnes et al., 1988]. In the version used, the pseudo-spherical approximation has also been incorporated [Dahl-back and Stamnes, 1991]. In our calculations we used theDISORT with the pseudo-spherical approximation. Modeland measured profiles for the atmospheric composition areused, which are scaled according to the observed O3 andaerosol amounts. Rayleigh scattering by air molecules iscalculated using the cross sections given by Nicolet [1984]and the air number density, as determined by the U.S.Standard Atmosphere (1976). Scattering by aerosols iscalculated assuming a Henyey and Greenstein [1941] phasefunction, while the aerosol single scattering albedo and theasymmetry parameter are chosen from precalculated valuesby Shettle and Fenn [1979]. The spectral resolution used forthe calculation was 0.05 nm and the ATLAS 3 SolarUltraviolet Spectral Irradiance Monitor (SUSIM) extrater-restrial spectrum (M. E. Van Hoosier, personal communi-cation, 1996) was adopted. The ozone cross sections weretaken from Bass and Paur [1985]. The specific inputparameters are discussed separately for each case the modelhas been applied in this study.
2.2. Spectral Actinic Flux Measurements
[11] For the validation of the TUV model, which wasused in this study for the calculation of photolysis rates, weused spectral measurements of the downwelling and upwell-ing actinic flux, performed with a Bentham DTM 300spectroradiometer [Hofzumahaus et al., 1999] on boardthe DLR/Falcon aircraft on 10 June 1996 [Hofzumahauset al., 2002]. The measurements were performed in theframe of the joint PAUR-ATOP experiment, which tookplace in the north Aegean Sea during June 1996 [Zerefos etal., 1998b]. The airborne measurements were performed on10 June 1996 over the Aegean Sea across the track 40�N,24�E to 30�N, 25�E, around solar noon. The measurementswere performed at six cruising levels, in the altitude rangebetween 100 and 12,000 m, which were held constant for 15min. During this time, several UV spectra were recorded.The actinic flux spectra were measured with a resolution of1 nm across the range 280–420 nm. The measurementswere absolutely calibrated [Hofzumahaus et al., 1999], andthe wavelength calibration has been made using theFraunhofer structure of the solar spectrum [Huber et al.,1995; Slaper et al., 1995] with an accuracy of 0.05 nm. Thewavelength independent calibration error of the actinic fluxis about ±6% [Hofzumahaus et al., 1999]. The angulardependence of the detection sensitivity of the combined4p sr system (one sensor looking downward and one sensorlooking upward) is not perfectly isotropic and introduces anadditional systematic error of <4%.
2.3. Measurements of J(O1D) and J(NO2) in Crete
[12] During the PAUR II campaign, two identical sets ofinstruments were operating continuously from 6 through 27May 1999, at two sites, a high-altitude station (Prases, 1000m) and a station at sea level (Gerani, 30 m). To measure
BALIS ET AL.: MEASUREMENTS AND MODELING OF PHOTOLYSIS RATES PAU 5 - 3

J(NO2), two-filter radiometers with isotropic input opticswere used to determine the integrated photolysis ratesproviding 1-min analog signals including standard devia-tion. The spectral characteristics of these radiometers matchthe photolysis spectrum of the NO2 molecule. The overallaccuracy of the measurements is �10%. To measure thephotolysis rates of ozone, two single monochromators usinga 512-pixel diode array detector were used, enabling syn-chronous sampling of all wavelengths in the spectrum. Thespectrometers are constructed using monolithic ceramicblocks (focal length 110 mm) and are equipped with thesame isotropic input optics. The characteristics of thespectrometers are full width half maximum (FWHM) 2.2nm and pixel distance 0.83 nm. To account for the differentlight levels in the UVB, the UVA and the visible adaptedintegration times are used in these spectral ranges. Thespectrum up to 325 nm is measured using an integrationtime of 5 s. The single spectral measurements are averagedto 1-min mean spectra. The error in the actinic fluxdetermination due to photon flux calibration errors is2.8%, and when propagated through to the determinationof photolysis frequencies, an error in J(O1D) of 4% isobtained. The spectra are corrected for stray light (SL)and dark current (DC) by subtracting averages of the signalsbelow 290 nm from the spectra recorded in the 290–450 nmregion. This correction reduces the SL and DC error, which,for small zenith angles, is negligible for l > 325 nm andbetween 2 and 5% for l < 325 nm.[13] At the beginning of the PAUR II experiment an
intercomparison at the sea level site (6 and 7 May) of allradiometric instruments was arranged. The two spectroradi-ometers were independently calibrated. As an additionalcheck the National Oceanic and Atmospheric Administra-tion (NOAA) portable calibration was used on the Brewerand the Bentham. The filter radiometers used in PAUR IIwere calibrated using the long-term standard radiometers505 and 720, which are compared to the chemical actino-meter at the Forschungzentrum-Julich, Germany, since1992. For the calculation of the photolysis rates from theradiometric observations the following laboratory data setswere used. The quantum yield used for the determination ofJ(O1D) was taken from Talukdar et al. [1998]. The ozoneabsorption cross sections used were adopted from Molinaand Molina [1986]. The quantum yield used for the deter-mination of the J(NO2) were taken from DeMore et al.[1997], while the absorption cross sections were thosedetermined by Harder et al. [1997].
2.4. Total Ozone and Aerosol Optical DepthMeasurements
[14] Two double monochromator spectroradiometerswere used for the determination of the total ozone amountand the aerosol optical depth during the campaign, oneBentham DTM 300, operated by the University of Inns-bruck, and one Brewer MK III [Bais et al., 1996], operatedby the University of Thessaloniki. Both groups have par-ticipated in most of the recent spectroradiometer intercom-parisons, and detailed descriptions of the characteristics ofthe instruments and on their accuracy can be found in theliterature [e.g., Gardiner and Kirsch, 1995; Bais et al.,2001]. The double Brewer spectroradiometer operated at theisland of Agios Efstratios during PAUR and at the high-
altitude site of Prases, Crete, during PAUR II. The totalozone measurements were performed according the stand-ard Brewer routines [e.g., Brewer, 1973]. The aerosoloptical depth t in the UV region (290–366 nm) and theAngstrom exponent a were determined by the methodologydescribed by Marenco et al. [1997] on the basis of abso-lutely calibrated direct irradiance spectra [Bais, 1997]. TheBentham spectroradiometer operated during PAUR II at thelow-altitude site of Gerani (30 m) and provided continuoustotal ozone and aerosol optical depth measurements basedon direct Sun irradiance measurements in the wavelengthrange 290–420 nm [Huber et al., 1995].
2.5. Lidar Measurements of Aerosol BackscatteringCoefficient
[15] Measurements of the vertical distribution of theaerosol backscatter coefficient at 532 nm were performedduring PAUR II at the sea level, near Gerani, by the Institutodi Fisica dell’ Atmosfera, Consiglio Nazionale delleRicerche (CNR), Italy, using a mobile, polarization lidarsystem based on a Nd-Yag pulsed laser source [Gobbi et al.,2000]. Extinction coefficients were estimated by means of astatistical model describing the relationship between extinc-tion and backscatter of both maritime and dust aerosols[Barnaba and Gobbi, 2001]. The integrated aerosol extinc-tion (i.e., optical depths) in the layers 150 m to 1 km and 1–12 km have been used in this study to investigate thedifferences between the photolysis rates at the two sites,which can be attributed to the aerosols present within thislayer.
3. Results and Discussion
3.1. Validation of the Radiative Transfer Model forActinic Flux Calculations
[16] Simulated spectra of the total (4p sr) actinic fluxwere calculated with the TUV model, for all the measuredspectra recorded on board the DLR Falcon on 10 June 1996.During that day, clear skies and low aerosol conditionsprevailed over the Aegean Sea, providing a unique oppor-tunity to describe the radiation field in the UV spectralregion under well-defined clear-sky conditions. The modelcalculations were made using the DISORT solver ofStamnes et al. [1988], with the pseudo-spherical approx-imation [Dahlback and Stamnes, 1991], using 32 streams.The simulated spectra were calculated with 0.05-nm reso-lution, and then they were convolved with the slit functionof the double monochromator, in the 290–405 nm spectralrange. The solar zenith angle of each measured scan wastaken into account in the calculations. The total ozone, usedas input, was determined from the Brewer measurements atAgios Efstratios and was 344 Dobson units (1 DU = 2.69 �1016 molecules cm�2). The ozone profile was taken fromthe measurement performed at the airport of Thessaloniki,�100 km northwest of the site [Kylling et al., 1998] andscaled to the total ozone amount. The aerosol optical depthat 340 nm was set to 0.2, as determined by the Brewer[Marenco et al., 1997], using Elterman’s [1968] profile forthe vertical distribution of the aerosol extinction coefficient,scaled to the measured total aerosol optical depth. Thesingle scattering albedo w and the asymmetry parameter gwere assumed to be 0.96 and 0.67, respectively, correspond-
PAU 5 - 4 BALIS ET AL.: MEASUREMENTS AND MODELING OF PHOTOLYSIS RATES
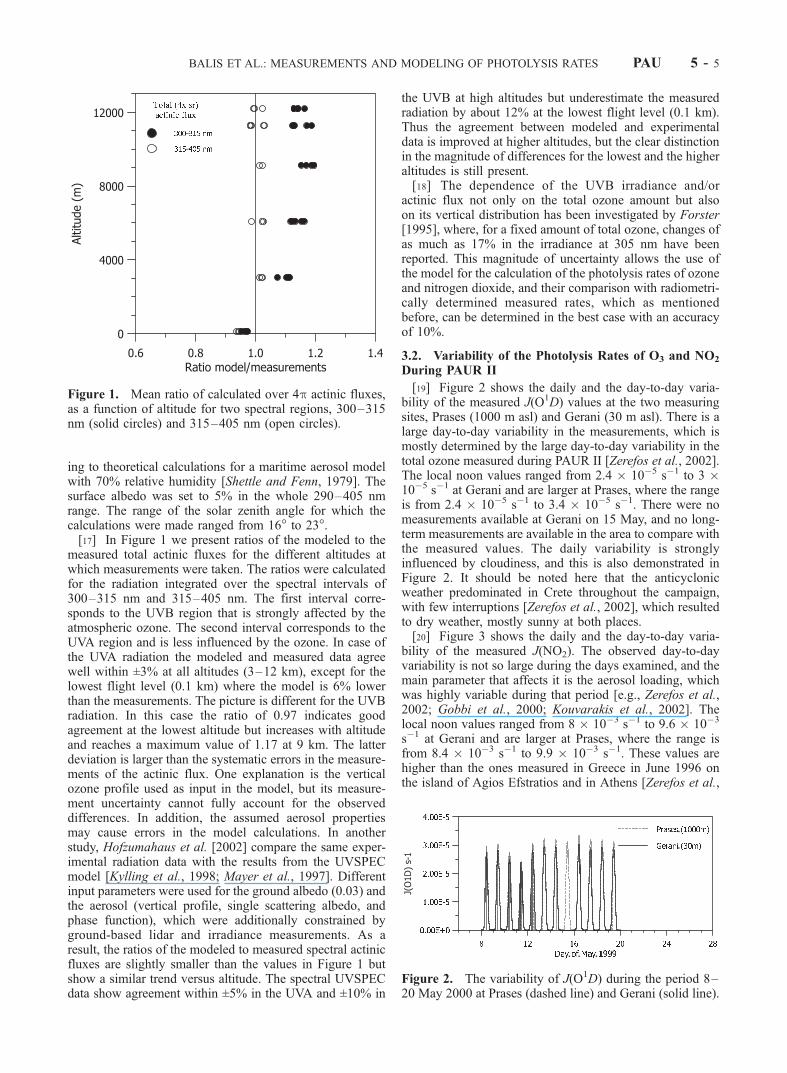
ing to theoretical calculations for a maritime aerosol modelwith 70% relative humidity [Shettle and Fenn, 1979]. Thesurface albedo was set to 5% in the whole 290–405 nmrange. The range of the solar zenith angle for which thecalculations were made ranged from 16� to 23�.[17] In Figure 1 we present ratios of the modeled to the
measured total actinic fluxes for the different altitudes atwhich measurements were taken. The ratios were calculatedfor the radiation integrated over the spectral intervals of300–315 nm and 315–405 nm. The first interval corre-sponds to the UVB region that is strongly affected by theatmospheric ozone. The second interval corresponds to theUVA region and is less influenced by the ozone. In case ofthe UVA radiation the modeled and measured data agreewell within ±3% at all altitudes (3–12 km), except for thelowest flight level (0.1 km) where the model is 6% lowerthan the measurements. The picture is different for the UVBradiation. In this case the ratio of 0.97 indicates goodagreement at the lowest altitude but increases with altitudeand reaches a maximum value of 1.17 at 9 km. The latterdeviation is larger than the systematic errors in the measure-ments of the actinic flux. One explanation is the verticalozone profile used as input in the model, but its measure-ment uncertainty cannot fully account for the observeddifferences. In addition, the assumed aerosol propertiesmay cause errors in the model calculations. In anotherstudy, Hofzumahaus et al. [2002] compare the same exper-imental radiation data with the results from the UVSPECmodel [Kylling et al., 1998; Mayer et al., 1997]. Differentinput parameters were used for the ground albedo (0.03) andthe aerosol (vertical profile, single scattering albedo, andphase function), which were additionally constrained byground-based lidar and irradiance measurements. As aresult, the ratios of the modeled to measured spectral actinicfluxes are slightly smaller than the values in Figure 1 butshow a similar trend versus altitude. The spectral UVSPECdata show agreement within ±5% in the UVA and ±10% in
the UVB at high altitudes but underestimate the measuredradiation by about 12% at the lowest flight level (0.1 km).Thus the agreement between modeled and experimentaldata is improved at higher altitudes, but the clear distinctionin the magnitude of differences for the lowest and the higheraltitudes is still present.[18] The dependence of the UVB irradiance and/or
actinic flux not only on the total ozone amount but alsoon its vertical distribution has been investigated by Forster[1995], where, for a fixed amount of total ozone, changes ofas much as 17% in the irradiance at 305 nm have beenreported. This magnitude of uncertainty allows the use ofthe model for the calculation of the photolysis rates of ozoneand nitrogen dioxide, and their comparison with radiometri-cally determined measured rates, which as mentionedbefore, can be determined in the best case with an accuracyof 10%.
3.2. Variability of the Photolysis Rates of O3 and NO2
During PAUR II
[19] Figure 2 shows the daily and the day-to-day varia-bility of the measured J(O1D) values at the two measuringsites, Prases (1000 m asl) and Gerani (30 m asl). There is alarge day-to-day variability in the measurements, which ismostly determined by the large day-to-day variability in thetotal ozone measured during PAUR II [Zerefos et al., 2002].The local noon values ranged from 2.4 � 10�5 s�1 to 3 �10�5 s�1 at Gerani and are larger at Prases, where the rangeis from 2.4 � 10�5 s�1 to 3.4 � 10�5 s�1. There were nomeasurements available at Gerani on 15 May, and no long-term measurements are available in the area to compare withthe measured values. The daily variability is stronglyinfluenced by cloudiness, and this is also demonstrated inFigure 2. It should be noted here that the anticyclonicweather predominated in Crete throughout the campaign,with few interruptions [Zerefos et al., 2002], which resultedto dry weather, mostly sunny at both places.[20] Figure 3 shows the daily and the day-to-day varia-
bility of the measured J(NO2). The observed day-to-dayvariability is not so large during the days examined, and themain parameter that affects it is the aerosol loading, whichwas highly variable during that period [e.g., Zerefos et al.,2002; Gobbi et al., 2000; Kouvarakis et al., 2002]. Thelocal noon values ranged from 8 � 10�3 s�1 to 9.6 � 10�3
s�1 at Gerani and are larger at Prases, where the range isfrom 8.4 � 10�3 s�1 to 9.9 � 10�3 s�1. These values arehigher than the ones measured in Greece in June 1996 onthe island of Agios Efstratios and in Athens [Zerefos et al.,
Figure 1. Mean ratio of calculated over 4p actinic fluxes,as a function of altitude for two spectral regions, 300–315nm (solid circles) and 315–405 nm (open circles).
Figure 2. The variability of J(O1D) during the period 8–20 May 2000 at Prases (dashed line) and Gerani (solid line).
BALIS ET AL.: MEASUREMENTS AND MODELING OF PHOTOLYSIS RATES PAU 5 - 5

1998c]. The differential cloud cover between the two sites isalso demonstrated in Figure 3.[21] The observed variability of the local noon values
will be discussed in detail in the sections 3.2.1 and 3.2.2.3.2.1. Dependence of J(O1D) on Total Ozone andAerosol Characteristics[22] During the PAUR II experiment, large variability of
the total ozone amount was detected at both sites [Zerefoset al., 2002]. As it is demonstrated in Figure 4a, the totalozone at Gerani, as measured by the Bentham spectror-adiometer, ranged from 306 to 414 DU and at Prases, asmeasured by the Brewer spectroradiometer, ranged from295 to 390 DU. Similar variability was also measured byEarth Probe (EP) Total Ozone Mapping Spectrometer(TOMS). The aerosol loading as determined by the aerosoloptical depth at 340 nm was also very variable during thisperiod. As it is shown in Figure 4b, it ranged from 0.27 to0.63 at Gerani and from 0.15 to 0.48 at Prases. The highervalues of the aerosol optical depth measured during theperiod 17–20 May 1999 is the result of Sahara dust thatwas present above both measuring sites [Gobbi et al.,2000]. The values shown in Figures 4a and 4b were usedto calculate with the TUV model the corresponding to themeasurements local noon values of J(O1D). The modelsetup was similar to the one used for validation in theprevious paragraph, except that the vertical distribution ofozone and aerosol model profiles have been used [U.S.Standard Atmosphere, 1976; Elterman, 1968]. For theperiod 8–16 May for the single scattering albedo andasymmetry parameter we assumed a maritime aerosolmodel, where w = 0.98 and g = 0.72 [Shettle and Fenn,1979], while for the Sahara dust event (17–20 May)according to He and Carmichael [1999], the correspond-ing values were set to w = 0.77 and g = 0.77. TheAngstrom exponent for the two periods was set to 1.5and 0.5, respectively, as it was determined from theanalysis of the direct Sun spectral measurements. For the
calculation of J(O1D) from the actinic flux, TUV uses forthe quantum yield the recommendation from DeMore et al.[1997] and the ozone absorption cross section from Molinaand Molina [1986]. According to Talukdar et al. [1998]the J values calculated with the quantum yields recom-mended by DeMore et al. [1997] agree with those calcu-
Figure 3. The variability of J(NO2) during the period 8–20 May 1999 at Prases (dashed line) andGerani (solid line).
Figure 4. (a) Total ozone measurements at Prases (dashedline) and Gerani (solid line) used as input to the modelcalculations, for the period 8–20 May 1999. (b) Aerosoloptical depth measurements at 340 nm at Prases (dashedline) and Gerani (solid line) used as input to the modelcalculations for the same period.
PAU 5 - 6 BALIS ET AL.: MEASUREMENTS AND MODELING OF PHOTOLYSIS RATES

lated with their quantum yields for zenith angles smallerthan 40�, which is always the case in our calculation inthis study. For all calculations, clear-sky conditions wereconsidered.[23] Figure 5a plots the local noon values of J(O1D) both
measured and calculated versus the total ozone determined
from EP TOMS for the high-altitude site. The modelindicates that the J values increase almost linearly withdecreasing total ozone. It has to be noted here that the solarzenith angle at local noon for the studied period did not varysignificantly ranging between 18.5� and 15.6�. A similarpattern is demonstrated also from the measurements, but for
Figure 5. (a) The dependence of J(O1D) on total ozone as demonstrated by the model calculations(open circles) and the measurements (solid circles) for the Prases site. The dashed line is a linear fit andcontinuous line is second-degree polynomial fit. (b) Same as Figure 5a but for the Gerani site. (c)Corresponding Angstrom exponent of the aerosol over the area.
BALIS ET AL.: MEASUREMENTS AND MODELING OF PHOTOLYSIS RATES PAU 5 - 7

total ozone of <310 DU there is a plateau, or even a decreaseof the J(O1D). For the specific zenith angle range this linearrelationship leads to a radiation amplification factor (RAF),(�J/J )/(��/�), of �1.5, which is larger than 1.1, the onecalculated from long-term measurements of UV erythemalirradiance at Thessaloniki by Zerefos et al. [1998a]. Theaverage ratio of the model values over the measurements is1.06. If we consider only the values for total ozone >310 DU,then the ratio becomes 1.02, but for ozone values <310 DU itbecomes 1.16. The same picture is demonstrated in Figure5b but for the low-altitude site. For this case the ratio model-to-measurements is 1.01 for all cases, 0.98 for total ozone>310 DU, and 1.09 for the total ozone values <310. Thedifferences between model and measurements that corre-spond to these ratios (0.98–1.09 and 1.02–1.16) are largerthan the systematic errors involved in the experimentaldetermination of the J(O1D). It should be stressed here thatby chance the low total ozone values coincide with the high-aerosol (Sahara dust) event. This confirmed in Figure 5c,which shows the corresponding Angstrom exponent for thelocal noon measurements of total ozone. Evidently, for totalozone >310 DU the average exponent is 1.5, which isrepresentative for small particles (e.g., maritime or ruralaerosols), while for the low ozone values the averageexponent is �0.7, which is representative for mineral dust[e.g., Moulin et al., 1997]. These values correspond to thedays, when Sahara dust was detected by the CNR lidar[Gobbi et al., 2000], up to 10 km, and thus the days with lowozone values coincide with Sahara dust episodes. The
measurements demonstrate that during intense dust episodesand high tropospheric ozone values, J(O1D) is lower even incomparison to days with higher total ozone. Based on theanalysis of ozone profiles at Hohenpeissenberg, Bruhl andCrutzen [1989] showed that decrease of UVB radiation at theEarth’s surface is possible even when total ozone declines.They mention that especially for small zenith angles thetropospheric ozone absorbs UVB radiation more efficientlythan stratospheric ozone because of an enhanced pathwaythrough the atmosphere caused by Rayleigh and particlescattering. This hypothesis was tested here because theseconditions (i.e., high tropospheric ozone of �50 ppb [Kour-tidis et al., 2002] and intense Sahara dust episodes) were metduring the PAUR II campaign and thus the observeddecrease in the J(O1D) with decreasing total ozone can beexplained by that mechanism. He and Carmichael [1999]point out that desert aerosols cause the largest decrease inphotolysis rates, which is attributed to their backscatteringand strongly absorbing properties, while Liao et al. [1999]note that desert dust reduces photolysis rates at all altitudesbelow the dust layer, with the largest reduction occurring inthe dust layer itself. Although it takes into account multiplescattering, the radiative transfer model used could notsimulate accurately this behavior.3.2.2. Dependence of J(NO2) on Aerosol Characteristics[24] Figure 6a plots the local noon values of J(NO2) both
measured and calculated versus the aerosol optical depth at340 nm for the Prases site. For the model calculation of theactinic flux we used the same setup as described previously.For the determination of the model-derived J(NO2), we usedthe quantum yield recommended by Gardner et al. [1987]and the used absorption cross section is from DeMore et al.[1997]. The ratio of the model-to-measurements is 0.94,which is within the uncertainty of both the measurementsand the calculations. Both the measurements and the modelshow that for the small range of solar zenith anglesconsidered here (18.5� to 15.6�), the increase in the aerosoloptical depth causes a small decrease in J(NO2). Thedecrease is larger when Sahara dust particles are present,and this is consistent both in the calculations and in themeasurements. The effect of the Sahara dust is enhanced inthe low-altitude site of Gerani, as seen in Figure 6b, wherethe aerosol optical depth is systematically larger than inPrases. For this case the model-to-measurements ratio isalso 0.94.
3.3. Altitude Effect on the Photolysis Rates
[25] Figure 7a shows the difference in J(O1D) betweenPrases and Gerani as calculated both from the measurementsand the model. The measurements indicate that the differ-ence between the two sites, which differ in altitude �1 km,is rather constant of the order of 2.5 � 10�6 s�1, which is�10% of the values measured at Prases. The model-calcu-lated difference is in agreement with the measurements forthe period 9–16 May 1999, but the model overestimatesthis difference by 5% when the Sahara dust event isprogressing. The overestimation by the model could be anindication that the aerosols within the first kilometer are notas absorbing as assumed in the model calculations and theyconsist of a mixture of nonabsorbing aerosol and dust[Kouvarakis et al., 2002]. This assumption is verified bythe model calculations (Figure 7a, solid line), since if we
Figure 6. (a) The dependence of J(NO2) on aerosol opticaldepth as demonstrated by the model calculations (opencircles) and the measurements (solid circles) for the Prasessite. The dashed line and the continuous lines are linear fits.(b) Same as Figure 5a but for the Gerani site.
PAU 5 - 8 BALIS ET AL.: MEASUREMENTS AND MODELING OF PHOTOLYSIS RATES

Figure 7. (a) Percent difference in the J(O1D) between Prases and Gerani, as calculated by the model(solid triangles) and by the measurements (open diamonds). (b) Percent difference in the J(NO2) betweenPrases and Gerani, as calculated by the model (solid triangles) and by the measurements (opendiamonds). The solid lines indicate model calculations with background aerosol conditions. (c) Integratedaerosol optical depth determined by the lidar at 532 nm in the 0–1020 m layer (solid circles), thedifferences between model and measurements for the determination of �J(O1D) (open circles) and�J(NO2) (solid triangles) between Prases and Gerani.
BALIS ET AL.: MEASUREMENTS AND MODELING OF PHOTOLYSIS RATES PAU 5 - 9

assume background conditions (same as in the previousdays) for the w and g for these days, then the model estimatesare much closer to the measured difference between the twosites. Three days backward trajectories presented by Zerefoset al. [2002] show that during the Sahara dust event the airmasses arriving at 900 hPa over Crete originate from southSpain and central Italy, and thus the existence of nonabsorb-ing aerosol in this layer can be expected. The disagreementfor 8 May is due to the large total ozone difference used asinput for that day (see Figure 4a).[26] Figure 7b shows the difference in J(NO2) between
Prases and Gerani as calculated both from the measurementsand the modeled values. There is a good agreement betweenthe model- and measurement-calculated differences for thedays with rather low aerosol optical over both sites (seeFigure 4b) and the average difference due to altitude differ-ence, is 0.3 � 10�3 s�1, which is �3% of the values inPrases. During the Sahara dust event the model overesti-mates again the attenuation of solar UV radiation if weconsider only absorbing aerosols within the first kilometer.Model estimates with background conditions for w and gshow better agreement, consistent with the discussion ofFigure 7a.[27] Apart from the absorbing properties of the aerosol in
the first kilometer, another factor that may affect the differ-ence of the J values between the two sites is the opticaldepth of the aerosols within this layer, assuming that abovethis layer the aerosol distribution is similar. In the modelcalculations we assumed that the aerosol optical depth inthis layer follows the variability of the total aerosol opticaldepth, which is not always the case. Therefore part of thedisagreement between the model and measurements indetermining the altitude effect can be attributed to thisassumption. The aerosol optical depth at 532 nm measuredby the CNR lidar, integrated over the first kilometer, isshown in Figure 7c. This optical depth correlates well, forthe non-Sahara aerosol days, with the photolysis rate differ-ence between the high- and the low-altitude sites as deter-mined by the model and the measurements shown in Figure7c. For the Sahara dust event the lidar observations showthat the lowermost aerosol layer (below 1 km), usuallydetected as liquid haze by the polarization channel, wasobserved to decrease [Gobbi et al., 2000]. This situationresulted in the aerosol optical depth (AOD) residing mainlyabove 1 km during this period as opposed to the conditionsrecorded before, when the AOD over the first kilometer wasof the same order of the AOD above 1 km altitude.Furthermore, during the dust event the lidar depolarizationchannel always observed a dominance of liquid particlesbelow 1000 m altitude, while the depolarizing (nonspher-ical) dust particles dominated the backscatter above thataltitude. Also, for these days the calculated differencesfollow the variation of the optical depth in this layer, butthere is an overestimation from the model, when we assumeonly absorbing aerosols.
4. Conclusions
[28] The main results of the present work can be sum-marized as follows:[29] Comparison of radiative transfer model calculations
of actinic flux with airborne spectral actinic flux measure-
ments indicates that the model can simulate the total actinicflux in the UVA region with an accuracy of 5% for thewhole troposphere, when the modeling case is well defined.In the UVB region the uncertainty in the vertical distribu-tion of ozone and aerosol can lead to differences, from 5–10% at low altitudes (<3 km) up to 20% at higher altitudes(>9 km).[30] The agreement between modeled and measured
photolysis rates of ozone and nitrogen dioxide at both sitesexamined is within 10%, when the uncertainty concerningthe aerosol optical properties is small.[31] For the small solar zenith angles examined, the
predominant parameter that controls the variability of thephotolysis rate of ozone is the total ozone content. However,high levels of tropospheric ozone and absorbing desertaerosols can cause a decrease in the photolysis rates ofozone, even under conditions of reduced total ozone con-tent. This fact indicates that tropospheric ozone can bedisproportionately important as a filter against UVB radia-tion when most scattering of the radiation by air moleculesand dust occurs in the troposphere. Characteristically, theRAF for the J(O1D) is �1.5 and decreases in the presenceof Sahara dust.[32] The variability of the aerosol optical depth controls
the variability of the J(NO2). The J(NO2) decreases in thepresence of Sahara dust. This decrease is evident both in themeasurements and in the model calculations. In contrast tothe model/measurement differences seen in J(O1D), thecomparison between modeled and measured J(NO2) is verygood within the uncertainties involved. This strengthens thehypothesis of the role played by tropospheric ozone in thepresence of absorbing aerosols.[33] The overestimation by the model of the effect of the
first kilometer layer relative to the measured differencebetween the two sites during the Sahara dust event indicatesthat there is a mixture of absorbing and nonabsorbingaerosols in this layer. The difference (�J ) between thephotolysis rates at the high-altitude site and the low-altitudeas determined by the model and the measurements corre-lates well with the integrated over the first kilometer aerosoloptical depth at 532 nm measured by the lidar.
[34] Acknowledgments. The greater part of this work has beenfunded by the European Commission, Environment and Climate Pro-gramme, under contracts ENV4-CT95-0048, ENV4-CT95-158, andENV4-CT97-0623.
ReferencesAtkinson, R., et al., Evaluated kinetics and photochemical data for atmo-spheric chemistry: Supplement IV, J. Phys. Chem. Ref. Data, 21, 1125–1568, 1992.
Bais, A. F., Absolute spectral measurements of direct solar ultraviolet irra-diance with a Brewer spectrophotometer, Appl. Opt., 36, 5199–5204,1997.
Bais, A. F., C. S. Zerefos, and C. T. McElroy, Solar UVB measurementswith the double- and single-monochromator Brewer ozone spectrophot-ometers, Geophys. Res. Lett., 23, 833–836, 1996.
Bais, A. F., et al., An overview of the results from the International Photo-lysis Frequency Measurement and Model Intercomparison (IPMMI), pa-per presented at the International Radiation Symposium, Int. Radiat.Comm., St. Petersburg, Russia, 2000.
Bais, A. F., et al., SUSPEN intercomparison of ultraviolet spectroradi-ometers, J. Geophys. Res., 106, 12,509–12,526, 2001.
Ball, S. M., G. Hancock, S. E. Martin, and J. C. Pinot de Moira, A directmeasurement of the O(1D) quantum yields from the photodissociation ofozone between 300 and 328 nm, Chem. Phys. Lett., 264, 531–538, 1997.
PAU 5 - 10 BALIS ET AL.: MEASUREMENTS AND MODELING OF PHOTOLYSIS RATES

Barnaba, F., and G. P. Gobbi, Lidar estimation of tropospheric aerosolextinction, surface area and volume: Maritime and desert dust cases,J. Geophys. Res., 106, 3005–3018, 2001.
Bass, A. M., and R. J. Paur, The ultraviolet cross-section of ozone, I themeasurements, in Atmospheric Ozone: Proceedings of the QuadrennialOzone Symposium, edited by C. S. Zerefos and A. Ghazi, pp. 606–610,D. Reidel, Norwell, Mass., 1985.
Brewer, A. W., A replacement for the Dobson spectrophotometer, PureAppl. Geophys., 106–108, 919–927, 1973.
Bruhl, C., and P. Crutzen, On the disproportionate role of troposphericozone as a filter against solar UV-B radiation, Geophys. Res. Lett., 16,703–706, 1989.
Castro, T., L. G. Ruiz-Suarez, J. C. Ruiz-Suarez, M. J. Molina, and M.Montero, Sensitivity analysis of UV radiation transfer model and experi-mental photolysis rates of NO2, in the atmosphere of Mexico City, Atmos.Environ., 31, 609–620, 1997.
Dahlback, A., and K. Stamnes, A new spherical model for computing theradiation field available for photolysis and heating at twilight, Planet.Space Sci., 39, 671–683, 1991.
DeMore, W. B., et al., Chemical kinetics and photochemical data for use instratospheric modeling, Evaluation 11, Jet Propul. Lab., Pasadena, Calif.,1994.
DeMore, W. B., et al., Chemical kinetics and photochemical data for use instratospheric modeling, Evaluation Number 12, JPL Publ., 97-4, 1997.
Elterman, L., UV, visible and IR for altitudes to 50 km, Rep. AFCR-68-0153, Air Force Cambridge Res. Lab., Bedford, Mass., 1968.
Forster, P. M. D. F., Modeling ultraviolet radiation at the Earth’s surface,part 1, The sensitivity of ultraviolet irradiances to atmospheric changes,J. Appl. Meteorol., 34, 2412–2425, 1995.
Gardiner, B. G., and P. J. Kirsch, Setting standards for European ultravioletspectroradiometers, Air Pollut. Res. Rep. 53, 138 pp., Comm. of the Eur.Communities, Luxembourg, 1995.
Gardner, E. P., P. D. Sperry, and J. G. Calvert, Primary quantum yields ofNO2 photodissociation, J. Geophys. Res., 92, 6642–6652, 1987.
Gobbi, G. P., F. Barnaba, R. Giorgi, and A. Santacasa, Altitude-resolvedproperties of a Sharan dust event over the Mediterranean, Atmos. Envir-on., 34, 5119–5127, 2000.
Harder, J. W., J. W. Brault, P. V. Johnston, and G. H. Mount, Temperature-dependent NO2 cross sections at high spectral resolution, J. Geophys.Res., 102, 3861–3879, 1997.
He, S., and G. R. Carmichael, Sensitivity of photolysis rates and ozoneproduction in the troposphere to aerosol properties, J. Geophys. Res.,104, 26,307–26,324, 1999.
Henyey, L. G., and J. L. Greenstein, Diffuse radiation in the galaxy, Astro-phys, J., 93, 70–83, 1941.
Hofzumahaus, A., and G. Hancock, Experimental study of the altitudedependence of the tropospheric ozone photolysis frequency between 0and 12 km height (ATOP), Final Rep. ENV4-CT95-0158 to EuropeanCommission, Dir. Gen. XII, Programme Environ. and Clim., Brussels,Belgium, 1997.
Hofzumahaus, A., A. Kraus, and M. Muller, Solar actinic spectroradiome-try: A technique for measuring photolysis frequencies in the atmosphere,Appl. Opt., 38, 4443–4460, 1999.
Hofzumahaus, A., A. Kraus, A. Kylling, and C. S. Zerefos, Solar actinicradiation (280–420 nm) in the cloud-free troposphere between groundand 12 km altitude: Measurements and model results, J. Geophys. Res.,107(DX), 10.1029/2001JD900142, 2002.
Huber, M., M. Blumthaler, W. Ambach, and J. Staehelin, Total atmosphericozone determined from spectral measurements of direct solar UV irradi-ance, Geophys. Res. Lett., 22, 53–56, 1995.
Jacobson, M. Z., Studying the effects of aerosols on vertical photolysis ratecoefficient and temperature profiles over an urban airshed, J. Geophys.Res., 103, 10,593–10,604, 1998.
Kerr, J. B., and C. T. McElroy, Evidence for large upward trends of ultra-violet-B radiation linked to ozone depletion, Science, 262, 1032–1034,1993.
Kourtidis, K. A., et al., Regional levels of ozone in the troposphereover eastern Mediterranean, J. Geophys. Res., 107(DX), 10.1029/2000JD000140, 2002.
Kouvarakis, G., Y. Doukelis, N. Mihalopoulos, S. Rapsomanikis, J. Sciare,and M. Blumthaler, Chemical, physical, and optical characterization ofaerosols during PAUR II experiment, J. Geophys. Res., 107(DX),10.1029/2000JD000291, 2002.
Kraus, A., and A. Hofzumahaus, Field measurements of atmospheric photo-lysis frequencies O3, NO2, HCHO, CH3CHO, H2O2 and HONO by UVspectroradiometry, J. Atmos. Chem., 31, 161–180, 1998.
Kraus, A., F. Rohrer, and A. Hofzumahaus, Intercomparison of NO2 photo-lysis frequency measurements by actinic flux spectroradiometry and che-mical actinometry during JCOM97, Geophys. Res. Lett., 27, 1115–1118,2000.
Krol, M. C., and M. van Weele, Implications of variations in photodissocia-tion rates for global tropospheric chemistry, Atmos. Environ., 31, 1257–1273, 1997.
Kylling, A., A. F. Bais, M. Blumthaler, J. Schreder, C. S. Zerefos, and E.Kosmidis, Effect of aerosol on solar UV irradiances during the Photo-chemical Activity and Solar Ultraviolet Radiation campaign, J. Geophys.Res, 103, 26,051–26,060, 1998.
Lantz, K. O., R. E. Shetter, C. A. Cantrell, S. J. Flocke, J. G. Calvert,and S. Madronich, Theoretical, actinometric, and radiometric determi-nations of the photolysis rate coefficient of NO2 during the MaunaLoa Observatory Experiment 2, J. Geophys. Res., 101, 14,613–14,629,1996.
Liao, H., Y. L. Yung, and J. H. Seinfeld, Effects of aerosols on troposphericrates in clear and cloudy atmospheres, J. Geophys. Res., 104, 23,697–23,707, 1999.
Madronich, S., UV radiation in the natural and perturbed atmosphere, inEnvironmental Effects of Ultraviolet Radiation, edited by M. Tevini, pp.17–69, Lewis, Boca Raton, Fla., 1993.
Madronich, S., and C. Granier, Tropospheric chemistry changes due toincreased UV-B radiation, in Stratospheric Ozone Depletion/UV-B Radia-tion in the Biosphere, edited by R. H. Biggs and M. E. B. Joyner, pp. 1–10, Springer-Verlag, New York, 1994.
Marenco, F., V. Santacesaria, A. Bais, D. Balis, A. Di Sarra, A. Papayannis,and C. S. Zerefos, Optical properties of tropospheric aerosols determinedby lidar and spectrophotometric measurements (PAUR campaign), Appl.Opt., 36, 6875–6886, 1997.
Mayer, B., G. Seckmeyer, and A. Kylling, Systematic long-term compar-ison of spectral UV measurements and UVSPEC modeling results,J. Geophys. Res., 102, 8755–8767, 1997.
McElroy, C. T., C. Midwinter, D. V. Barton, and R. B. Hall, A comparisonof J-values from composition and photodissociative flux measurementwith model calculation, Geophys. Res. Lett., 22, 1365–1368, 1995.
Michelsen, H. A., R. J. Salawitch, P. O. Wennberg, and J. G. Anderson,Production of O(1D) from photolysis of O3, Geophys. Res. Lett., 21,2227–2230, 1994.
Molina, L. T., and M. J. Molina, Absolute absorption cross section of ozonein the 185–350 nm wavelength range, J. Geophys. Res., 91, 14,501–14,508, 1986.
Moulin, C., F. Guillard, F. Dulac, and C. E. Lambert, Long-term dailymonitoring of Saharan dust load over ocean using Meteosat ISCCP-B2data, 1, Methodology and preliminary results for 1983–1994 in theMediterranean, J. Geophys. Res., 102, 16,947–16,958, 1997.
Muller, M., A. Kraus, and A. Hofzumahaus, O(1D) photolysis frequenciesdetermined from spectroradiometric measurements of solar actinic UV-radiation: Comparison with chemical actinometer measurements, Geo-phys. Res. Lett., 22, 679–682, 1995.
Nicolet, M., On the molecular scattering in the terrestrial atmosphere: Anempirical formula for its calculation in the homosphere, Planet. SpaceSci., 32, 1467–1468, 1984.
Ruggaber, A., R. Dlugi, A. Bott, R. Forkel, H. Herrmann, and H.-W. Jacobi,Modeling of radiation quantities and photolysis frequencies in the aqu-eous phase in the troposphere, Atmos. Environ., 31, 3137–3150, 1997.
Seckmeyer, G., B. Mayer, G. Bernhard, R. Erb, A. Aldbold, H. Jaeger, andW. R. Stockwell, New maximum UV irradiance levels observed in centralEurope, Atmos. Environ., 31, 2971–2976, 1997.
Shetter, R. E., et al., Actinometric and radiometric measurement and mod-eling of the photolysis rate coefficient of ozone to O(1D) during theMauna Loa Observatory Experiment 2, J. Geophys. Res., 101, 14,631–14,641, 1996.
Shettle, E. P., and R. W. Fenn, Models for the aerosols of the lower atmo-sphere and effects of humidity variations on their optical properties,Environ. Pap. 676, Air Force Geophys. Lab., Bedford, Mass., 1979.
Silvente, E., R. C. Richter, M. Zheng, E. S. Saltzman, and A. J. Hynes,Relative quantum yields of O1D production in the photolysis of ozonebetween 301 and 336 nm: Evidence for the participation of a spin-for-bidden channel, Chem. Phys. Lett., 264, 309–315, 1997.
Slaper, H., H. A. J. M. Reinen, M. Blumthaler, M. Huber, and F. Kuik,Comparing ground-level spectrally resolved solar UV measurementsusing various instruments: A technique resolving effects of wave-length shift and slit width, Geophys. Res. Lett., 22, 2721–2724,1995.
Stamnes, K., S. C. Tsay, W. J. Wiscombe, and K. Jayaweera, Numericallystable algorithm for discrete-ordinate-method radiative transfer in multi-ple scattering and emitting layered media, Appl. Opt., 27, 2502–2509,1988.
Takahashi, K., Y. Matsumi, and M. Kawasaki, Photodissociation pro-cesses of ozone in the Huggins Band at 308–326 nm: Direct observa-tion of O(1D2) and O(3Pj) products, J. Phys. Chem., 100, 4084–4089,1996.
Talukdar, R. K., C. A. Longfellow, M. K. Giles, and A. R. Ravishankara,
BALIS ET AL.: MEASUREMENTS AND MODELING OF PHOTOLYSIS RATES PAU 5 - 11

Quantum yields of O(1D) in the photolysis of ozone between 289 and329 nm as a function of temperature, Geophys. Res. Lett., 25, 143–146,1998.
World Meteorological Organization, Scientific Assessment of Ozone De-pletion: 1998, in Global Ozone Research and Monitoring Project Report,Rep. 44, Geneva, 1999.
Zerefos, C. S., D. S. Balis, A. F. Bais, D. Gillotay, P. C. Simon, B. Mayer,and G. Seckmeyer, Variability of UV-B at four stations in Europe, Geo-phys. Res. Lett., 24, 1363–1366, 1997.
Zerefos, C. S., C. Meleti, D. Balis, K. Tourpali, and A. F. Bais, Quasi-biennial and longer-term changes in clear sky UV-B solar irradiance,Geophys. Res. Lett., 25, 4345–4348, 1998a.
Zerefos, C. S., et al., Overview of results from PAUR campaign, paperpresented at the European Conference on Atmospheric UV Radiation,Eur. Comm. and Finn. Meteorol. Inst., Helsinki, Finland, 29 June to 2July 1998b.
Zerefos, C. S., et al., Photochemical Activity and Solar Ultraviolet Radia-tion (PAUR), Final Rep. ENV4-CT95-0048 to European Commission,Dir. Gen. XII, Programme Environ. and Clim., Brussels, Belgium,1998c.
Zerefos, C. S., et al., Photochemical Activity and Solar Ultraviolet Radia-
tion Modulation Factors (PAUR): An overview of the project, J. Geo-phys. Res., 107(DX), 10.1029/2000JD000134, 2002.
�����������A. F. Bais, D. S. Balis, K. Kourtidis, and C. S. Zerefos, Laboratory of
Atmospheric Physics, Physics Department, Aristotle University ofThessaloniki, Campus Box 149, Thessaloniki 54006, Greece. ([email protected]; [email protected]; [email protected])M. Blumthaler, Institute of Medical Physics, University of Innsbruck,
Muellerstrasse 44, A-6020 Innsbruck, Austria. ([email protected])G. P. Gobbi, Instituto di Fisica Dell’ Atmosfera, CNR, Via Fosso del
Cavaliere 100, Rome I-00133, Italy. ([email protected])A. Hofzumahaus, Institute for Atmospheric Chemistry, Forschungzen-
trum Juelich, Postfach 1913, Julich D-52425, Germany. ([email protected])A. Kraus, Gruenenthal GmbH, P.O. Box 500444, D-52088 Aachen,
Germany. ([email protected])R. Schmitt, Meteorologie Consult GmbH, Auf der Platt 47, D-61479
Glashuetten, Germany. ([email protected])
PAU 5 - 12 BALIS ET AL.: MEASUREMENTS AND MODELING OF PHOTOLYSIS RATES