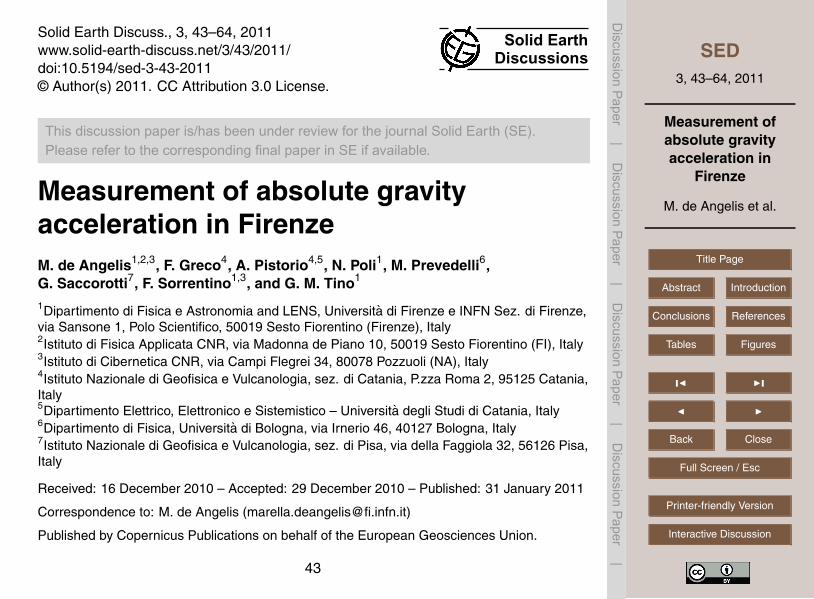
Measurement of absolute gravity acceleration in Firenze
22
SED 3, 43–64, 2011 Measurement of absolute gravity acceleration in Firenze M. de Angelis et al. Title Page Abstract Introduction Conclusions References Tables Figures Back Close Full Screen / Esc Printer-friendly Version Interactive Discussion Discussion Paper | Discussion Paper | Discussion Paper | Discussion Paper | Solid Earth Discuss., 3, 43–64, 2011 www.solid-earth-discuss.net/3/43/2011/ doi:10.5194/sed-3-43-2011 © Author(s) 2011. CC Attribution 3.0 License. Solid Earth Discussions This discussion paper is/has been under review for the journal Solid Earth (SE). Please refer to the corresponding final paper in SE if available. Measurement of absolute gravity acceleration in Firenze M. de Angelis 1,2,3 , F. Greco 4 , A. Pistorio 4,5 , N. Poli 1 , M. Prevedelli 6 , G. Saccorotti 7 , F. Sorrentino 1,3 , and G. M. Tino 1 1 Dipartimento di Fisica e Astronomia and LENS, Universit ` a di Firenze e INFN Sez. di Firenze, via Sansone 1, Polo Scientifico, 50019 Sesto Fiorentino (Firenze), Italy 2 Istituto di Fisica Applicata CNR, via Madonna de Piano 10, 50019 Sesto Fiorentino (FI), Italy 3 Istituto di Cibernetica CNR, via Campi Flegrei 34, 80078 Pozzuoli (NA), Italy 4 Istituto Nazionale di Geofisica e Vulcanologia, sez. di Catania, P.zza Roma 2, 95125 Catania, Italy 5 Dipartimento Elettrico, Elettronico e Sistemistico – Universit ` a degli Studi di Catania, Italy 6 Dipartimento di Fisica, Universit ` a di Bologna, via Irnerio 46, 40127 Bologna, Italy 7 Istituto Nazionale di Geofisica e Vulcanologia, sez. di Pisa, via della Faggiola 32, 56126 Pisa, Italy Received: 16 December 2010 – Accepted: 29 December 2010 – Published: 31 January 2011 Correspondence to: M. de Angelis (marella.deangelis@fi.infn.it) Published by Copernicus Publications on behalf of the European Geosciences Union. 43
-
Upload
independent -
Category
Documents
-
view
1 -
download
0
Transcript of Measurement of absolute gravity acceleration in Firenze
SED3, 43–64, 2011
Measurement ofabsolute gravityacceleration in
Firenze
M. de Angelis et al.
Title Page
Abstract Introduction
Conclusions References
Tables Figures
J I
J I
Back Close
Full Screen / Esc
Printer-friendly Version
Interactive Discussion
Discussion
Paper
|D
iscussionP
aper|
Discussion
Paper
|D
iscussionP
aper|
Solid Earth Discuss., 3, 43–64, 2011www.solid-earth-discuss.net/3/43/2011/doi:10.5194/sed-3-43-2011© Author(s) 2011. CC Attribution 3.0 License.
Solid EarthDiscussions
This discussion paper is/has been under review for the journal Solid Earth (SE).Please refer to the corresponding final paper in SE if available.
Measurement of absolute gravityacceleration in FirenzeM. de Angelis1,2,3, F. Greco4, A. Pistorio4,5, N. Poli1, M. Prevedelli6,G. Saccorotti7, F. Sorrentino1,3, and G. M. Tino1
1Dipartimento di Fisica e Astronomia and LENS, Universita di Firenze e INFN Sez. di Firenze,via Sansone 1, Polo Scientifico, 50019 Sesto Fiorentino (Firenze), Italy2Istituto di Fisica Applicata CNR, via Madonna de Piano 10, 50019 Sesto Fiorentino (FI), Italy3Istituto di Cibernetica CNR, via Campi Flegrei 34, 80078 Pozzuoli (NA), Italy4Istituto Nazionale di Geofisica e Vulcanologia, sez. di Catania, P.zza Roma 2, 95125 Catania,Italy5Dipartimento Elettrico, Elettronico e Sistemistico – Universita degli Studi di Catania, Italy6Dipartimento di Fisica, Universita di Bologna, via Irnerio 46, 40127 Bologna, Italy7Istituto Nazionale di Geofisica e Vulcanologia, sez. di Pisa, via della Faggiola 32, 56126 Pisa,Italy
Received: 16 December 2010 – Accepted: 29 December 2010 – Published: 31 January 2011
Correspondence to: M. de Angelis ([email protected])
Published by Copernicus Publications on behalf of the European Geosciences Union.
43
SED3, 43–64, 2011
Measurement ofabsolute gravityacceleration in
Firenze
M. de Angelis et al.
Title Page
Abstract Introduction
Conclusions References
Tables Figures
J I
J I
Back Close
Full Screen / Esc
Printer-friendly Version
Interactive Discussion
Discussion
Paper
|D
iscussionP
aper|
Discussion
Paper
|D
iscussionP
aper|
Abstract
This paper reports the results from the accurate measurement of the acceleration ofgravity g taken at two separate premises in the Polo Scientifico of the University ofFirenze (Italy). In these laboratories, two separate experiments aiming at measur-ing the Newtonian constant and testing the Newtonian law at short distances are in5
progress. Both experiments require an independent knowledge on the local value ofg. The only available datum, pertaining to the italian zero-order gravity network, wastaken more than 20 years ago at a distance of more than 60 km from the study site.Gravity measurements were conducted using an FG5 absolute gravimeter, and accom-panied by seismic recordings for evaluating the noise condition at the site. The abso-10
lute accelerations of gravity at the two laboratories are (980 492 160.6±4.0) µGal and(980 492 048.3±3.0) µGal for the European Laboratory for Non-Linear Spectroscopy(LENS) and Dipartimento di Fisica e Astronomia, respectively. Other than for the tworeferenced experiments, the data here presented will serve as a benchmark for anyfuture study requiring an accurate knowledge of the absolute value of the acceleration15
of gravity in the study region.
1 Introduction
Over the past few years two separate experiments, one for measuring the Newtonianconstant and one for testing the Newtonian law at short distances, are under develop-ment at the Physics laboratories of the University of Firenze. The experiment for the20
Newtonian constant measurement in room 67 building 3 (Department of Physics andAstronomy) is based on an atomic gradiometer that detects the differential accelerationinduced by very well known source masses Lamporesi et al. (2008); Sorrentino et al.(2010). The atomic gradiometer is a matter-wave interferometer where two clouds oflaser cooled 87Rb atoms, separated by a distance D' 30 cm are used for a simultane-25
ous measurement of local gravity with respect to the common reference frame identified
44
SED3, 43–64, 2011
Measurement ofabsolute gravityacceleration in
Firenze
M. de Angelis et al.
Title Page
Abstract Introduction
Conclusions References
Tables Figures
J I
J I
Back Close
Full Screen / Esc
Printer-friendly Version
Interactive Discussion
Discussion
Paper
|D
iscussionP
aper|
Discussion
Paper
|D
iscussionP
aper|
by the wave-fronts of the laser beam used for the atom interference interrogation. Theinstrument directly detects the differential acceleration ∆g between the two clouds andthus the common mode acceleration noise induced on the wave-fronts by acoustic andseismic vibrations is rejected. The instrument is an excellent gradiometer since thegravity gradient in the vertical direction is simply ∆g/D and can be determined with a5
statistical error essentially equal to ∆D/D (with ∆D the uncertainty on the measure ofD) which is lower than 0.1%. From ∆g and from the knowledge of the added massdistribution, it is possible to determine the value of the Newtonian constant if a rea-sonably accurate value of g is also known. Since each atom cloud can be operatedalso as a gravimeter, g can be obtained by the atom interferometer itself and indeed10
state-of-the-art instruments based on atomic interference have been built Peters et al.(1999). Due to the differential nature of the measurement, however, no special carehas been taken in insulating the experiment from seismic noise and the statistical erroris limited after 3 min of integration to a sensitivity ∆g/g= 5×10⁻⁷. Moreover with anindependent value for g of at least comparable accuracy we can check our instrument15
against various systematic effects.The experiment in room 44 building 4 (LENS) is based on optically-trapped stron-
tium atoms. The small size and high sensitivity of the atomic probe allow a model-independent acceleration measurement at distances of a few µm from the source mass,giving direct access to a poorly tested range of the Newtonian law Ferrari et al. (2006);20
Ivanov et al. (2008). In the experiment laser-cooled strontium atoms are trapped in a 1-dimensional vertical optical lattice and the combination of the periodic optical potentialand the linear gravitational potential gives rise to Bloch oscillations. From the mea-sured Bloch frequency νB the gravity acceleration along the optical lattice is estimatedwith a sensitivity of ∆g/g' 10−7 after 30 min of integration. In this experiment, that in25
principle is not devoted to an absolute g-measurement, the performance in measuringg is an index of the stability of the atom probe for the investigation of forces at smallspatial scales Poli et al. (2010).
45
SED3, 43–64, 2011
Measurement ofabsolute gravityacceleration in
Firenze
M. de Angelis et al.
Title Page
Abstract Introduction
Conclusions References
Tables Figures
J I
J I
Back Close
Full Screen / Esc
Printer-friendly Version
Interactive Discussion
Discussion
Paper
|D
iscussionP
aper|
Discussion
Paper
|D
iscussionP
aper|
These activities brought us to set reference absolute value of the acceleration ofgravity with an independent instrument and with a precision of 1 part in 10−8 or betterin the sites where we are going to perform our gravity measurements. The absoluteacceleration of gravity g has been measured in the two laboratories at the Polo Scien-tifico of University of Firenze in Sesto Fiorentino using the Microg-LaCoste FG5#2385
absolute gravimeter: in Department of Physics where the atom interferometry experi-ment aims at an accurate determination of Newtonian constant Lamporesi et al. (2008);Sorrentino et al. (2010), and in LENS where the cold strontium experiment is employedto investigate possible deviations from the Newtonian law at short distances Ferrariet al. (2006); Ivanov et al. (2008). As far as we know the closest and most recent10
measurement of the acceleration of gravity is the measurement realized beneath theItalian Zero Order Gravity Net Marson et al. (1994). The measurement was done atPalazzo al Piano (about 60 km from our location) in 1989 where a g value at ground of980 391 580(8) µGal was found, and it was performed using the absolute gravimeter ofthe IMGC (now INRIM) in Torino (see D’Agostino et al. (2008) and references therein).15
Of course the value of absolute g could be derived from the one taken in Marson et al.(1994) to our location using a relative spring gravimeter, but the main limit is that thereare no informations on the stability of the measurements in Palazzo al Piano sincemeasurements have not been repeated (Germak, personal communication, 2010) onthis site. The poor reliability of the operation persuaded us to measure absolute g20
directly in our laboratories.This paper discusses the measurements of the absolute acceleration of gravity taken
in Firenze in the period 4–6 October, 2009. In Sect. 2 we present the general descrip-tion of the site: Section 2.1 outlines the geological setting and Sect. 2.2 is dedicated tothe study of the seismic noise at the measurement locations. In Sect. 3.1 data process-25
ing and the corrections to the measurements are described, and Sect. 4 is dedicatedto the conclusions.
46
SED3, 43–64, 2011
Measurement ofabsolute gravityacceleration in
Firenze
M. de Angelis et al.
Title Page
Abstract Introduction
Conclusions References
Tables Figures
J I
J I
Back Close
Full Screen / Esc
Printer-friendly Version
Interactive Discussion
Discussion
Paper
|D
iscussionP
aper|
Discussion
Paper
|D
iscussionP
aper|
2 The site
The buildings of the Polo Scientifico of the University of Firenze in Sesto Fiorentinohave been constructed recently, and became fully operational by late 2000. The spe-cific sites where the FG5 instrument has been placed are in the room 67 in the building3 and in the room 44 in building 4. Both laboratories are at the ground floor, at an5
elevation of about 40 m a.s.l. (elevation data taken from the Gauss-Boaga Fuso1 mapof Regione Toscana, 1:2000 scale, at WGS84 coordinates 43.81916◦ N 11.19319◦ E)).The concrete floor where we installed the instrument is on the basements of the build-ings and it is covered by solid tile. In room 67 air conditioning maintains the temperatureat (20.0±0.1)◦C, while temperature stability in room 44 is not better than ±3 ◦C.10
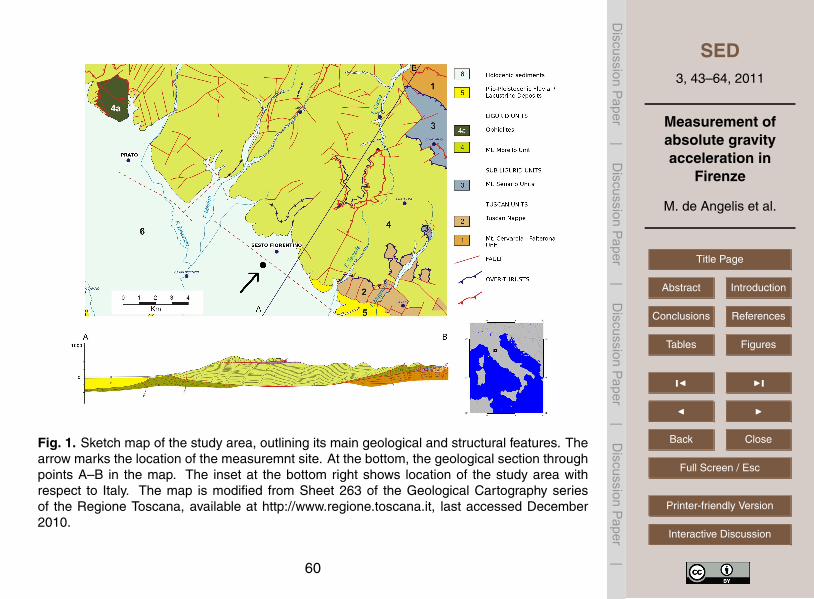
2.1 Geological setting
The site is located close to the NW border of the Middle Valdarno basin, hereinafterreferred to as the Firenze-Prato-Pistoia basin. This is one of the tectonic basins whichdeveloped since the Neogene in the Tyrrhenian side of the Apennines thrust and foldbelt, striking parallel to the main chain axis (Fig. 1). The genesis of these depressions15
is related to an extensional tectonic regime developed since Upper Tortonian age (11–7 Myr before present) and due to the opening of the Tyrrhenian Sea (see Boccaletti etal. (2001) and references therein). The Firenze-Prato-Pistoia basin extends in a NW-SE direction with a roughly rectangular shape and is delimited by Neogene-Quaternaryfaults, the most important of which is oriented NW-SE bounding the northeastern mar-20
gin of the basin.The substratum of the basin is mainly formed by rocks pertaining to the Ligurian
Units s.l. (shales, calcareous-quarzitic sandstone, calcareous turbidites and marlylimestones) that outcrop NE of the basin (Monte Morello-Calvana Ridge) and tecton-ically overlie the turbiditic formations of the Tuscan Unit (Macigno sandstone). Max-25
imum thickness of the lacustrine deposits in the middle of the basin extends up to500 m. However, the depth of the bedrock within the basin varies significantly, as a
47
SED3, 43–64, 2011
Measurement ofabsolute gravityacceleration in
Firenze
M. de Angelis et al.
Title Page
Abstract Introduction
Conclusions References
Tables Figures
J I
J I
Back Close
Full Screen / Esc
Printer-friendly Version
Interactive Discussion
Discussion
Paper
|D
iscussionP
aper|
Discussion
Paper
|D
iscussionP
aper|
consequence of several NE-SW trending faults which subdivide the bottom of the basinin a block-like structure.
Below the study area, the thickness of the sedimentary cover has been estimatedon the order of 450 m Capecchi et al. (1975). Four main sedimentary phases arerecognised (depths are referred to sea level): from about −400 m to −20 m: fluvio-5
lacustrine succession, constituted by sands, pebbles and clays whose age is generallyconsidered to be Upper Pliocene-Lower Pleistocene ('2.5 My before present); from−20 m to −5 m: pebbles, gravels and silt of fluvial fans resulting from erosion of theMonte Morello-Calvana ridge; from −5 m to +10 m: lacustrine clays and gravels; from+10 m to surface: Fluvial clays and gravels.10
The static level of the water table varies between 0.5 m and 2 m below the surface,as also visible at the numerous drainage channels present in the area Crespellani etal. (1991).From both direct and indirect measurements, shear-wave velocities have been deter-mined to vary between 200–300 m/s at the surface and 600–800 m/s at 40 m depth.15
2.2 Seismic noise
The site is located within an industrial area, and close to the A11 Highway, the Airportand a major construction site. The intense ground vibrations of both anthropic andnatural origin cause an acceleration noise which may induce a significant drop-to-dropscatter of the gravity observations.20
In order to quantify the noise conditions at the measuring site, we thus conducteda microseismic survey during an 8-day-long period encompassing the gravity mea-surements. For these measurements, we used two Nanometrics Trillium 120P seis-mometers (http://www.nanometrics.ca), whose response function is flat over the 120 s–0.02 s period range. Acquisition was performed using two 24-bit Reftek 130 portable25
recorders, with a digitising rate of 125/samples/second/channel, independently syn-chronised to the UTC time base via GPS receivers.
48
SED3, 43–64, 2011
Measurement ofabsolute gravityacceleration in
Firenze
M. de Angelis et al.
Title Page
Abstract Introduction
Conclusions References
Tables Figures
J I
J I
Back Close
Full Screen / Esc
Printer-friendly Version
Interactive Discussion
Discussion
Paper
|D
iscussionP
aper|
Discussion
Paper
|D
iscussionP
aper|
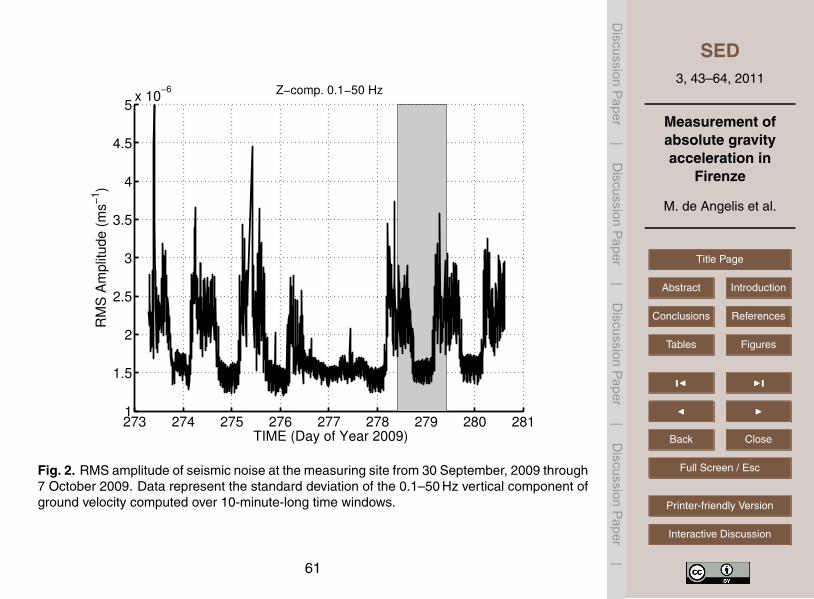
Data presented hereinafter are from station A667, which was operated at room 67throughout the duration of the microseismic survey. Figure 2 shows the time seriesof noise amplitude obtained from the standard deviation of consecutive, 600-s-longwindows of signal band–pass filtered over the 0.1 Hz–50 Hz frequency band using a2-pole, 0-phase-shift Butterworth filter.5
Seismic noise exhibits a typical weekly and daily pattern, such as the 8-hr workday,due to the intense human activities conducted both inside and in proximity of the lab-oratories. Ground vibrations at day time are 2.5–3 times larger than those observedduring the night.
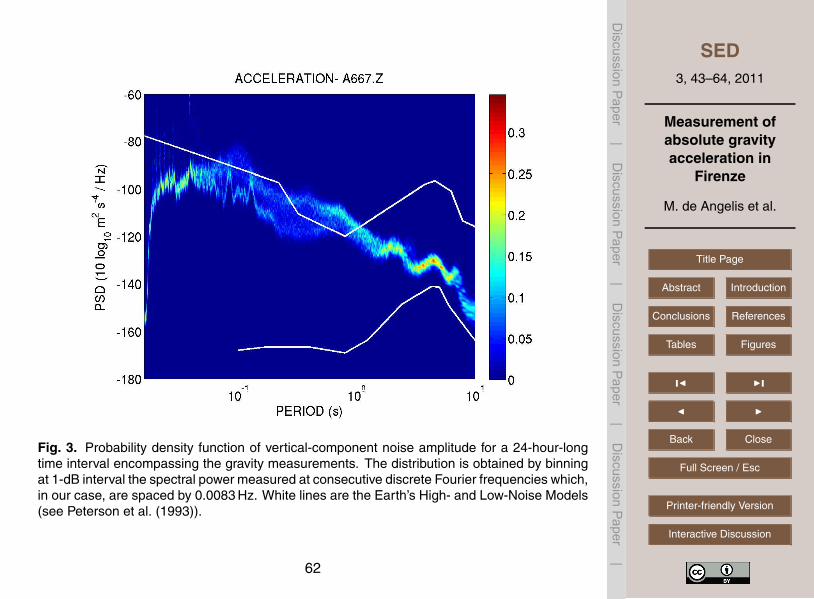
Figure 3 illustrates the probability density function (PDF) McNamara et al. (2004) of10
acceleration power spectral densities during the 24-hour-long period of gravity mea-surements. The PDF is representative of 130 spectral estimates obtained via Welch’smethod Welch et al. (1967) applied to 10 not-overlapping, 120-s-long windows of noise.Individual spectral estimates have been stabilised using a 0.1-Hz-wide smoothing win-dow. For reference, these data are compared to Peterson’s (1993) Low- and High-15
Noise Model curves Peterson et al. (1993). At periods between 5 s and 10 s, the noisePDFs are very narrow, and their peaks are rather close to the Low-Noise-Model. Thisis not surprising, once considering that the main noise source over this particular pe-riod range is marine microseismic activity, and the test site is located about 80 km farfrom the coast.20
At shorter periods (0.05–1 s, corresponding to the 1 Hz–20 Hz frequency band),the PDF becomes wider, and encompass the High-Noise-Model. The spreading ofamplitude distributions over this period range is likely related to the day-night variationof vibrations, thus suggesting a dominance of anthropic sources. At periods shorterthan 0.05 s (frequencies above 20 Hz), several narrow spectral peaks indicate the25
action of non-stationary, monochromatic vibrations from nearby sources, such as theair conditioning system.
49
SED3, 43–64, 2011
Measurement ofabsolute gravityacceleration in
Firenze
M. de Angelis et al.
Title Page
Abstract Introduction
Conclusions References
Tables Figures
J I
J I
Back Close
Full Screen / Esc
Printer-friendly Version
Interactive Discussion
Discussion
Paper
|D
iscussionP
aper|
Discussion
Paper
|D
iscussionP
aper|
3 The absolute gravity acceleration instrument and measurements
3.1 The absolute gravimeter
The Microg-LaCoste FG5#238 ballistic absolute gravimeter Niebauer et al. (1995) isa high precision, high accuracy, instrument that measures the vertical acceleration ofgravity g. The operation of the ballistic FG5 is to observe the free-falling of a repeat-5
edly dropped corner cube reflector. This test mass is contained in a co-falling servo-controlled motor-driven drag-free chamber and falls over 20 cm in 0.2 s inside a vacuumchamber. A laser interferometer is used to determine the position of the test mass asa function of time during its free-fall. This interferometer is a modified Mach-Zendertype, with a fixed (reference) arm and a variable (test) arm. During a drop, the motion10
of the test mass affects the path length of the test beam. The interference fringes thatresult from the recombination of the test beam and the reference beam provide an ac-curate measure of the motion of the test mass relative to the mass suspended on thesuperspring, which provides an inertial reference frame. As the object falls, interfer-ence fringes are formed at the optical output. The interference fringes are converted15
to a digital signal, which is transmitted to the time interval analyzer card in the systemcontroller. These fringes are counted and timed with an atomic clock to obtain precisetime and distance pairs. A least-squares fit to these data is used to determine the valueof g. The distance scale is given by a frequency-stabilized helium-neon laser used inthe interferometer. The absolute gravity measurements are therefore directly tied to20
the time and length SI units.A total of 700 time-position points are recorded over the 20 cm length of each drop.
Even if a drops can be produced up to every two seconds, in routine operation, therepetition rate is 10 s. The average of 50÷100 drops is a set, which exhibits standarddeviations of 40 to 150 nm/s2 under normal conditions. Measurements usually consist25
of one or two sets per hour with the average of several sets (usually 12 to 48) providinga gravity value. The instrumental accuracy of the FG5 is about 2 µGal as reported bythe manufacturer. A software supplied by the Microg-LaCoste company is used for data
50
SED3, 43–64, 2011
Measurement ofabsolute gravityacceleration in
Firenze
M. de Angelis et al.
Title Page
Abstract Introduction
Conclusions References
Tables Figures
J I
J I
Back Close
Full Screen / Esc
Printer-friendly Version
Interactive Discussion
Discussion
Paper
|D
iscussionP
aper|
Discussion
Paper
|D
iscussionP
aper|
acquisition. This software provides an immediate value for the local gravity, and it alsoincludes a full-featured post-processor that allows to vary data analysis procedures andenvironmental corrections.
Before being used in Firenze, the FG5#238 absolute gravimeter took part in the8th International Comparison of Absolute Gravimeters (ICAG-2009) organized by the5
Bureau International des Poids et Mesures (BIPM). The comparison was held from14 September to 3 October, 2009 in Sevres, France Arias et al. (2010). The pri-mary objective of ICAG-2009 was to determine the level of uncertainty in the abso-lute measurement of free-fall acceleration on the ground and to evaluate the possibilityof determining a comparison reference value for g at the sites of the BIPM gravity10
micro-network. Such a reference value allows determining correction factors for theinstruments participating to the comparison. The FG5#238 measured the accelera-tion of gravity at three different sites. The expanded uncertainty obtained from thesemeasurements ranges between 5.4 µGal and 6.5 µGal. The expanded uncertainty isobtained by multiplying the combined standard uncertainty by a coverage factor k cor-15
respondent to a confidence level of 95%, in our case k = 2. All absolute gravity valuesagree very well with the reference value of g at the three different sites.
3.2 Absolute gravity acceleration measurements
After the measurements taken in ICAG-2009 the instrument has been transported toPolo Scientifico of University of Firenze in Sesto Fiorentino and it has been installed20
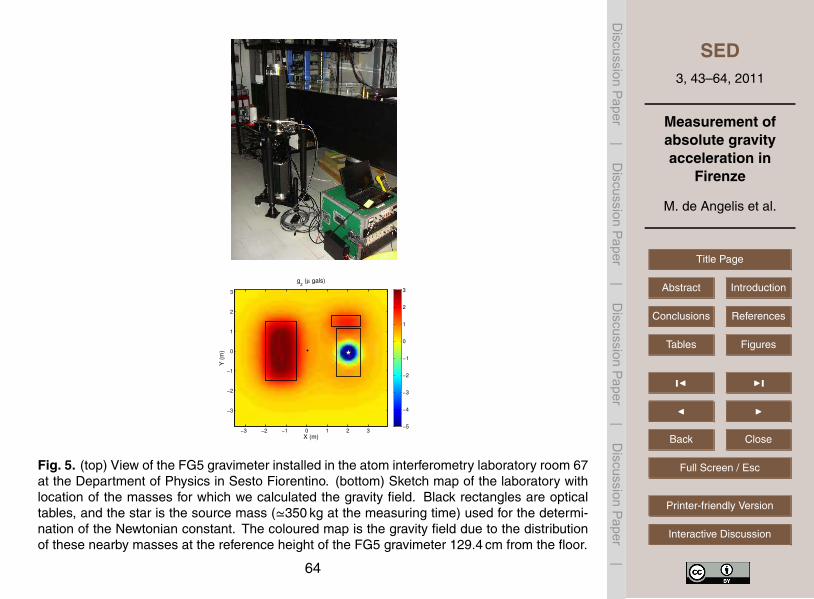
first in the room 44 at building 4, then in the room 67 at building 3 (see Fig. 5 (top);the FG5 gravimeter was positioned in the available space as close as possible to thecenter of each room. The instrument was along the north-south direction within 10◦ inorder to reduce the Coriolis effect as recommended by the manufacturer. The nom-inal measuring point elevation for the gravimeter is 129.4 cm above the floor, and it25
coincides with the top of the drop.
51
SED3, 43–64, 2011
Measurement ofabsolute gravityacceleration in
Firenze
M. de Angelis et al.
Title Page
Abstract Introduction
Conclusions References
Tables Figures
J I
J I
Back Close
Full Screen / Esc
Printer-friendly Version
Interactive Discussion
Discussion
Paper
|D
iscussionP
aper|
Discussion
Paper
|D
iscussionP
aper|
In room 44, acquisition started on 4 October 2009 at about 16:30 UTC, and lastedfor about 15 h. In room 67 acquisition started on 5 October 2009 at 10:20 UTC, andlasted for about 24 h. During both experiments, we collected a measurement set every30 min, each set being composed of 50 drops. We thus collected (29,45) sets and(1450,2250) launches for the two sites respectively. On every single set we calculated5
the standard deviation σ, rejecting all the measurements resulting out of the 3σ range.This led to 95% accepted drops for the room 44, and to 99% accepted drops for theroom 67 data.
3.3 Data processing and correction
Data acquisition and processing is accomplished with the software supplied by the10
Microg-LaCoste company, that we have also used for corrections due to systematicerrors. The data are least-squares fit to a function that uses a known a priori verticalgravity gradient in a fourth-order equation of motion Niebauer et al. (1995). The finitevalue of the speed of light gives a correction for the calculated gravity signal since theoptical interference accurs at a later time after the light is reflected by the dropped15
object, depending on interferometer arm length and speed of light. This contribution isa non negligible effect at the µGal sensitivity, and the corrected delayed time has to betaken by considering a retarded time in the function used for the least-squares fit.
The vertical gravity gradient has to be taken into account because the position of thefree falling mirror changes considerably (20 cm) along the vertical during the measure-20
ment and so does the acceleration of the falling mirror. The gradient at the measure-ment location has been measured by the atom interferometer instrument Lamporesi etal. (2006) and it agrees with the commonly used standard free air value of the gradient3.09 µGal/cm within 1%.
The gradient could be, in principle, a free parameter in the least-squares fit, but ab-25
solute gravimeter data are not generally used to determine vertical gravity gradient,because the accelerations are measured during the free fall of the object and hence atdifferent times. As a consequence the seismic noise becomes important and reduces
52
SED3, 43–64, 2011
Measurement ofabsolute gravityacceleration in
Firenze
M. de Angelis et al.
Title Page
Abstract Introduction
Conclusions References
Tables Figures
J I
J I
Back Close
Full Screen / Esc
Printer-friendly Version
Interactive Discussion
Discussion
Paper
|D
iscussionP
aper|
Discussion
Paper
|D
iscussionP
aper|
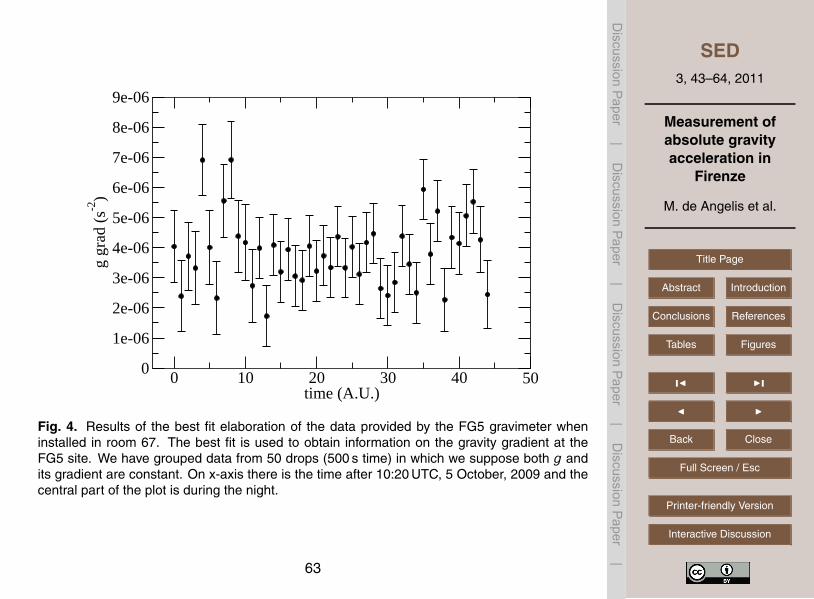
the sensitivity. Measuring the accelerations at the same time, like in the atom inter-ferometer gradiometer, is a way to reject common mode noise. Nevertheless we haveelaborated the data of the FG5 instruments to obtain information on the gravity gradientat the measuring site. We have grouped data from 50 drops (1 set, 500 s time) in whichwe suppose that both g and its gradient are constant. The average value for the gravity5
gradient is (3.8±1.2) ×10−6 s−2. Results are shown in Fig. 4 where it is possible tonotice that in the central part of the plot, corresponding to the night time, the data areless noisy and a determination of the gradient with a statistical error within 10% seemsfeasible.
Since the absolute determination of gravity with the FG5 instrument and with the10
atom interferometer experiments are neither carried out simultaneously nor at the samespot, we need to take into account gravity variations in time within each laboratory.Corrections that have been considered are Earth tides and ocean loading contribu-tions, polar motion effects, and barometric corrections. These corrections require localinstrumental measurements or geographical parameters. Moreover to be a truly useful15
measurement, we have considered the sites elevations, the measured setups heights,and we have calculated contributions due to the nearby mass distribution.
Due to the solar and lunar attraction the local value of g will change of hundredsof µGal. The common approach to correct observed gravity data for tidal effects is touse a tidal prediction program (such as Wenzel, 2002) that makes use of observed or20
predicted amplitude tidal gravity effect. The surface loading of the Earth due to theweight of the ocean tides causes a time varying deformation of the solid Earth, whichis called ocean tide loading. The vertical component of the ocean tide loading variesspatially and it is in addition to the Earth’s body tide deformation, which is typically40 cm peak to peak in mid-latitudes.25
As the Earth wobbles on its axis, the local centripetal acceleration will change thelocal value of g. This is known as Polar motion effect. The correction for polar motionhas an amplitude of ±10 µGal and two principal periods of 365 days and 435 days.It is modeled with an uncertainty much better than 1 µGal Wahr (1985). By entering
53
SED3, 43–64, 2011
Measurement ofabsolute gravityacceleration in
Firenze
M. de Angelis et al.
Title Page
Abstract Introduction
Conclusions References
Tables Figures
J I
J I
Back Close
Full Screen / Esc
Printer-friendly Version
Interactive Discussion
Discussion
Paper
|D
iscussionP
aper|
Discussion
Paper
|D
iscussionP
aper|
parameters related to the Earth’s current orientation into the software, this effect canbe corrected.
Barometric pressure correction has to be considered because as the local air pres-sure changes, so will the measured gravity value due to direct attraction. By comparingthe current pressure with the standard local value, the gravity value can be corrected5
to estimate the value on a “normal” day. A typical barometric factor of −0.3 µGal/mBaris considered.
Manufacturer also recommends to take into account uncertainties due to laser fre-quency (±0.01 µGal) and to Rubidium oscillator clock (±0.50 µGal), together with a“set-up” uncertainty (±2 µGal) depending on the instrument and on the operator.10
The floor of room 67 is 61(1) cm higher than the floor of room 44. This elevationdifference has been measured using a laser level Bosch mod.BL30 (nominal accuracy0.3 mm/m). Considering a theoretical vertical gradient of 3.09 µGal/cm we expect tosee a difference of about 188 µGal in the measured value of g in the two locations.During the measurements the rooms were occupied by optical tables and room 67 by15
the source masses for the Newtonian constant experiment. The FG5 gravimeter ispositioned close to the optical tables and, because their positions may change in thefuture, the effect of the nearby mass distribution has been evaluated for the two labora-tories as shown in Fig. 5. This correction is less than 1 µGal at both laboratories. By thetime of our measurements no rainfalls occurred and so we do not expect any significant20
gravity variations associated with changes in local hydrological accumulation.After corrections due to systematics effects, the values of the acceleration of gravity
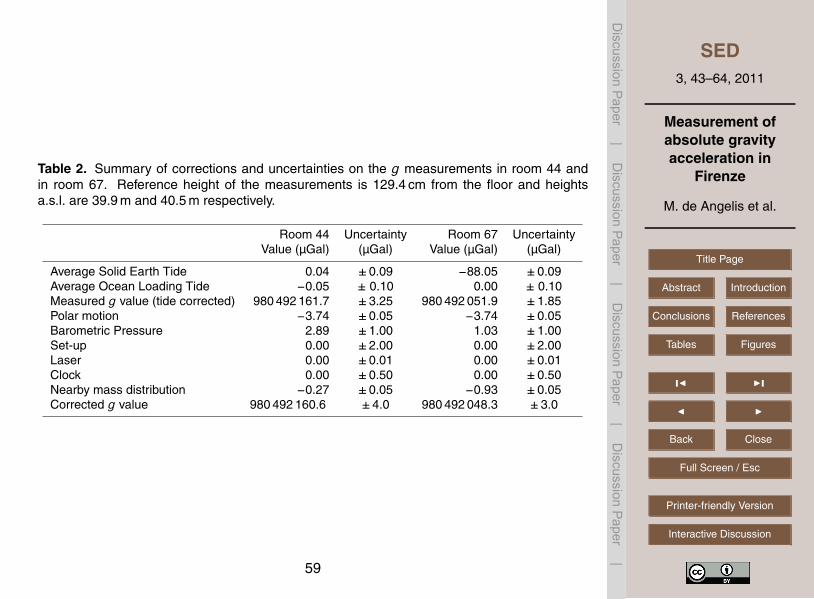
in the laboratories are (980 492 160.6±4.0) µGal in room 44 and (980 492 048.3±3.0)µGal in room 67. In Table 2 absolute gravity acceleration values are resumed with therelevant systematic effects and the respective estimated uncertainties. The difference25
between the two values can be explained with difference in building structures andgeological structures, causes that we can assume as time invariant.
54
SED3, 43–64, 2011
Measurement ofabsolute gravityacceleration in
Firenze
M. de Angelis et al.
Title Page
Abstract Introduction
Conclusions References
Tables Figures
J I
J I
Back Close
Full Screen / Esc
Printer-friendly Version
Interactive Discussion
Discussion
Paper
|D
iscussionP
aper|
Discussion
Paper
|D
iscussionP
aper|
4 Conclusions
The measurement of the absolute acceleration of gravity g has been carried out in twolaboratories at Polo Scientifico of University of Firenze in Sesto Fiorentino: room 67building 3 (Department of Physics) where atom interferometry is used for accuratemeasurement of the Newtonian constant, and room 44 building 4 (LENS) where a cold5
strontium atom sample is used for precision gravity measurements and for a test atshort distances of the Newtonian law.
A geological description of the site is reported and in order to quantify the noiseconditions at the measuring site, we have conducted a microseismic survey during an8-day-time covering the time interval of the gravimetric measurements. The seismic10
noise spectra show that ground vibration at day time are 2.5–3 times larger than thoseobserved during the night, due to the intense human activities conducted both insideand in proximity of the laboratories.
We have also taken into account gravity variations in time and in space within eachlaboratory. Gravity corrections considered are Earth tides and ocean loading contribu-15
tions, polar motion and barometric effects, site elevation, measured setup and heightcorrections. We have also introduced other corrections due to the nearest mass dis-tribution near the FG5 location. During the measurements procedures the FG5#238absolute gravimeter worked reliably and the uncertainties of the absolute gravity ac-celeration in laboratories 44 and 67 are 4.0 µGal and 3.0 µGal respectively. However,20
since there is no guarantee that the gravity acceleration value is constant at thesetwo sites, repeated measurements in time might be especially important to verify thestability of the sites.
Acknowledgements. Authors acknowledge financial support from INFN and from CNR underESF-Eurocores EUROQuasar-IQS project. The authors wish to thank ENI S.p.a., Exploration25
& Production Division for providing the FG5#238 absolute gravimeter. COREMO, the seismo-logical instruments facility at the INGV – Centro Nazionale Terremoti is greatly acknowledgedfor having provided both seismometers and portable recorders. MdA also thanks Lorenzo Ar-cidiaco from LAMMA for the site map from Regione Toscana.
55
SED3, 43–64, 2011
Measurement ofabsolute gravityacceleration in
Firenze
M. de Angelis et al.
Title Page
Abstract Introduction
Conclusions References
Tables Figures
J I
J I
Back Close
Full Screen / Esc
Printer-friendly Version
Interactive Discussion
Discussion
Paper
|D
iscussionP
aper|
Discussion
Paper
|D
iscussionP
aper|
References
Arias, E. F., Jiang, Z., Robertsson, L., and Vitushkin, L. F.: The first M.G-K1 Key Comparison:International Comparison of Absolute Gravimeters ICAG2009, in: Proceedings of the IAGSymposium on Terrestrial Gravimetry: Static and Mobile Measurements (TG-SMM2010),22–25 June, Saint Petersburg, 2010. 515
Boccaletti, M., Corti, G., Gasperini, P., Piccardi, L., Vannucci, G., and Clemente, S.: ActiveTectonics and Seismic Zonation of the Urban Area of Florence, Italy, Pure Appl. Geophys.,158, 2313–2332, 2001. 47
Capecchi, F., Guazzone, G., and Pranzini, G.: Il bacino di Firenze-Prato-Pistoia. Geologia delsottosuolo e ricostruzione evolutiva, Boll. Soc. Geol. It., 94, 637–660, 1975. 4810
D’Agostino, G., Desogus, S., Germak, A., Origlia, C., Quagliotti, D., Berrino, G., Corrado, G.,D’Errico, V., and Ricciardi, G.: The new IMGC-02 transportable absolute gravimeter: mea-surement apparatus and applications in geophysics and volcanology, Annals of Geophysics,51, 39–49, 2008. 46
Ferrari, G., Poli, N., Sorrentino, F., and Tino, G. M.: Long-Lived Bloch Oscillations with Bosonic15
Sr Atoms and Application to Gravity Measurement at the Micrometer Scale, Phys. Rev. Lett.,97, 060402, doi:10.1103/PhysRevLett.97.060402, 2006. 45, 46
Ivanov, V. V., Alberti, A., Schioppo, M., Ferrari, G., Artoni, M., Chiofalo, M. L., and Tino, G. M.:Coherent Delocalization of Atomic Wave Packets in driven Lattice Potential, Phys. Rev. Lett.,100, 043602, doi:10.1103/PhysRevLett.100.043602, 2008. 45, 4620
Lamporesi, G.: Determination of the gravitational constant by atom interferometry, PhD thesis,Universita degli Studi di Firenze, 2006. 52
Lamporesi, G., Bertoldi, A., Cacciapuoti, L., Prevedelli, M., and Tino, G. M.: Determinationof the Newtonian Gravitational Constant Using Atom Interferometry, Phys. Rev. Lett., 100,050801, doi:10.1103/PhysRevLett.100.050801, 2008. 44, 4625
Marson, I. and Palmieri, F.: Rete gravimetrica italiana: stato attuale e prospettive future, Bollet-tino di geodesia e scienze affini – IGM, LIII(2), 161–172, 1994. 46
McNamara, D. E. and Buland, R. P.:Ambient Noise Levels in the Continental United States,Bull. Seism. Soc. Am., 94, 1517–1527, 2004. 49
Niebauer, T. M., Sagasawa, G. S., Faller, J. E., Hilt, R., and Klopping, F.: A new generation of30
absolute gravimeters, Metrologia, 32, 159–180, 1995. 50, 52Peters, A., Chung, K. Y., and Chu, S.: Measurement of gravitational acceleration by dropping
56
SED3, 43–64, 2011
Measurement ofabsolute gravityacceleration in
Firenze
M. de Angelis et al.
Title Page
Abstract Introduction
Conclusions References
Tables Figures
J I
J I
Back Close
Full Screen / Esc
Printer-friendly Version
Interactive Discussion
Discussion
Paper
|D
iscussionP
aper|
Discussion
Paper
|D
iscussionP
aper|
atoms, Nature, 400, 849–852, 1999. 45Peterson, J.: Observations and Modeling of Seismic Background Noise, USGS Open file Re-
port, 93–322, 1993. 49, 62Poli, N., Wang, F.-Y., Tarallo, M. G., Alberti, A., Prevedelli, M., and Tino, G. M.: Precision
measurement of gravity with cold atoms in an optical lattice and comparison with a classical5
gravimeter, Phys. Rev. Lett. 106, 038501, doi:10.1103/PhysRevLett.106.038501, 2011. 45Sorrentino, F., Cacciapuoti, L., Lien, Y.-H., Prevedelli, M., Rosi, G., and Tino, G. M.: Sensitive
gravity-gradiometry with atom interferometry: progress towards an improved determination ofthe gravitational constant, New J. Phys., 12, 095009, doi:10.1088/1367-2630/12/9/095009,2010. 44, 4610
Crespellani, T., Ghinelli, A., Madiai, C., and Vannucchi, G.: Stratigraphical profiles and geotech-nical properties, in “Seismic hazard and site effects in the Florence area”, Proc. X Eur. Conf.Geot. Eng. (ECSMFE), vol IV, 1491–1508, Florence, 1991. 48
Wahr, J. M.: Deformation induced by polar motion, J. Geophys. Res., 90, 9363–9368, 1985. 53Welch, P.: A direct digital method of power spectrum estimation, IBM J. Res. Dev., 5, 141, 1967.15
49Wenzel, G.: ETGTAB: Earth tide prediction program, 2002. 53
57
SED3, 43–64, 2011
Measurement ofabsolute gravityacceleration in
Firenze
M. de Angelis et al.
Title Page
Abstract Introduction
Conclusions References
Tables Figures
J I
J I
Back Close
Full Screen / Esc
Printer-friendly Version
Interactive Discussion
Discussion
Paper
|D
iscussionP
aper|
Discussion
Paper
|D
iscussionP
aper|
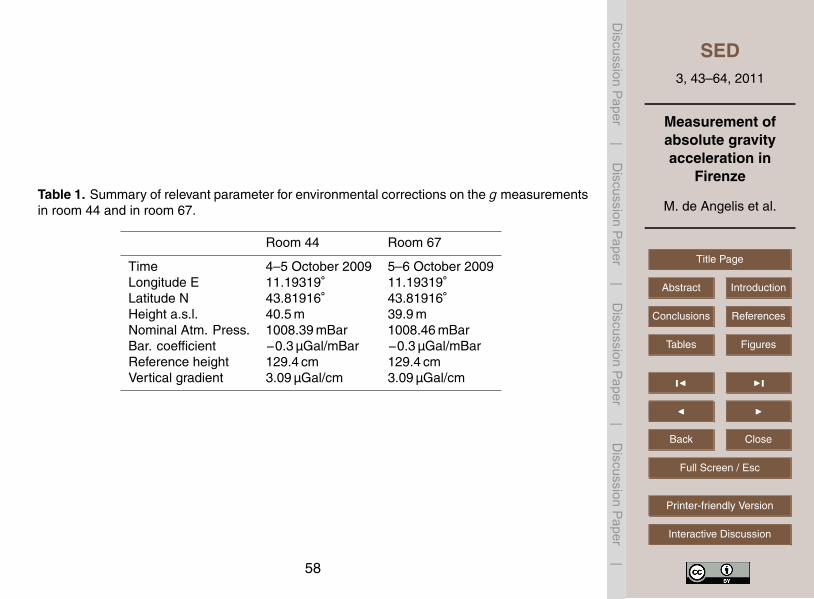
Table 1. Summary of relevant parameter for environmental corrections on the g measurementsin room 44 and in room 67.
Room 44 Room 67
Time 4–5 October 2009 5–6 October 2009Longitude E 11.19319◦ 11.19319◦
Latitude N 43.81916◦ 43.81916◦
Height a.s.l. 40.5 m 39.9 mNominal Atm. Press. 1008.39 mBar 1008.46 mBarBar. coefficient −0.3 µGal/mBar −0.3 µGal/mBarReference height 129.4 cm 129.4 cmVertical gradient 3.09 µGal/cm 3.09 µGal/cm
58
SED3, 43–64, 2011
Measurement ofabsolute gravityacceleration in
Firenze
M. de Angelis et al.
Title Page
Abstract Introduction
Conclusions References
Tables Figures
J I
J I
Back Close
Full Screen / Esc
Printer-friendly Version
Interactive Discussion
Discussion
Paper
|D
iscussionP
aper|
Discussion
Paper
|D
iscussionP
aper|
Table 2. Summary of corrections and uncertainties on the g measurements in room 44 andin room 67. Reference height of the measurements is 129.4 cm from the floor and heightsa.s.l. are 39.9 m and 40.5 m respectively.
Room 44 Uncertainty Room 67 UncertaintyValue (µGal) (µGal) Value (µGal) (µGal)
Average Solid Earth Tide 0.04 ±0.09 −88.05 ±0.09Average Ocean Loading Tide −0.05 ± 0.10 0.00 ± 0.10Measured g value (tide corrected) 980 492 161.7 ±3.25 980 492 051.9 ±1.85Polar motion −3.74 ±0.05 −3.74 ±0.05Barometric Pressure 2.89 ±1.00 1.03 ±1.00Set-up 0.00 ±2.00 0.00 ±2.00Laser 0.00 ±0.01 0.00 ±0.01Clock 0.00 ±0.50 0.00 ±0.50Nearby mass distribution −0.27 ±0.05 −0.93 ±0.05Corrected g value 980 492 160.6 ±4.0 980 492 048.3 ±3.0
59
SED3, 43–64, 2011
Measurement ofabsolute gravityacceleration in
Firenze
M. de Angelis et al.
Title Page
Abstract Introduction
Conclusions References
Tables Figures
J I
J I
Back Close
Full Screen / Esc
Printer-friendly Version
Interactive Discussion
Discussion
Paper
|D
iscussionP
aper|
Discussion
Paper
|D
iscussionP
aper|
.
Figure 1: (a) Sketch map of the study area, outlining its main geological and struc-tural features. The arrow marks the location of the measuremnt site. At the bottom,the geological section through points A-B in the map. The inset at the bottomright shows location of the study area with respect to Italy. The map is modifiedfrom Sheet 263 of the Geological Cartography series of the Regione Toscana,available at htt p : //www.regione.toscana.it/regione/opencms/RT /sito −
RT/Contenuti/sezioni/ambientet erritorio/cartogra f ia/rubriche/visualizzaa sset.html?id =105779&pagename = 382.
13
Fig. 1. Sketch map of the study area, outlining its main geological and structural features. Thearrow marks the location of the measuremnt site. At the bottom, the geological section throughpoints A–B in the map. The inset at the bottom right shows location of the study area withrespect to Italy. The map is modified from Sheet 263 of the Geological Cartography seriesof the Regione Toscana, available at http://www.regione.toscana.it, last accessed December2010.
60
SED3, 43–64, 2011
Measurement ofabsolute gravityacceleration in
Firenze
M. de Angelis et al.
Title Page
Abstract Introduction
Conclusions References
Tables Figures
J I
J I
Back Close
Full Screen / Esc
Printer-friendly Version
Interactive Discussion
Discussion
Paper
|D
iscussionP
aper|
Discussion
Paper
|D
iscussionP
aper|
.
273 274 275 276 277 278 279 280 2811
1.5
2
2.5
3
3.5
4
4.5
5x 10
−6
TIME (Day of Year 2009)
RM
S A
mpl
itude
(ms−1
)Z−comp. 0.1−50 Hz
Figure 2: RMS amplitude of seismic noise at the measuring site from September30th, 2009 through October 7th, 2009. Data represent the standard deviation of the0.1-50 Hz vertical component of ground velocity computed over 10-minute-longtime windows.
14
Fig. 2. RMS amplitude of seismic noise at the measuring site from 30 September, 2009 through7 October 2009. Data represent the standard deviation of the 0.1–50 Hz vertical component ofground velocity computed over 10-minute-long time windows.
61
SED3, 43–64, 2011
Measurement ofabsolute gravityacceleration in
Firenze
M. de Angelis et al.
Title Page
Abstract Introduction
Conclusions References
Tables Figures
J I
J I
Back Close
Full Screen / Esc
Printer-friendly Version
Interactive Discussion
Discussion
Paper
|D
iscussionP
aper|
Discussion
Paper
|D
iscussionP
aper|
.
Figure 3: Probability density function of vertical-component noise amplitude fora 24-hour-long time interval encompassing the gravity measurements. The dis-tribution is obtained by binning at 1-dB interval the spectral power measured atconsecutive discrete Fourier frequencies which, in our case, are spaced by 0.0083Hz. White lines are the Earth’s High- and Low-Noise Models (see [15]).
15
Fig. 3. Probability density function of vertical-component noise amplitude for a 24-hour-longtime interval encompassing the gravity measurements. The distribution is obtained by binningat 1-dB interval the spectral power measured at consecutive discrete Fourier frequencies which,in our case, are spaced by 0.0083 Hz. White lines are the Earth’s High- and Low-Noise Models(see Peterson et al. (1993)).
62
SED3, 43–64, 2011
Measurement ofabsolute gravityacceleration in
Firenze
M. de Angelis et al.
Title Page
Abstract Introduction
Conclusions References
Tables Figures
J I
J I
Back Close
Full Screen / Esc
Printer-friendly Version
Interactive Discussion
Discussion
Paper
|D
iscussionP
aper|
Discussion
Paper
|D
iscussionP
aper|
0 10 20 30 40 50time (A.U.)
0
1e-06
2e-06
3e-06
4e-06
5e-06
6e-06
7e-06
8e-06
9e-06g
grad
(s-2
)
Fig. 4. Results of the best fit elaboration of the data provided by the FG5 gravimeter wheninstalled in room 67. The best fit is used to obtain information on the gravity gradient at theFG5 site. We have grouped data from 50 drops (500 s time) in which we suppose both g andits gradient are constant. On x-axis there is the time after 10:20 UTC, 5 October, 2009 and thecentral part of the plot is during the night.
63
SED3, 43–64, 2011
Measurement ofabsolute gravityacceleration in
Firenze
M. de Angelis et al.
Title Page
Abstract Introduction
Conclusions References
Tables Figures
J I
J I
Back Close
Full Screen / Esc
Printer-friendly Version
Interactive Discussion
Discussion
Paper
|D
iscussionP
aper|
Discussion
Paper
|D
iscussionP
aper|
X (m)
Y (m
)
gz (µ gals)
−3 −2 −1 0 1 2 3
−3
−2
−1
0
1
2
3
−5
−4
−3
−2
−1
0
1
2
3
Figure 5: (top) View of the FG5 gravimeter installed in the atom interferometrylaboratory room 67 at the Department of Physics in Sesto Fiorentino. (bottom)Sketch map of the laboratory with location of the masses for which we calculatedthe gravity field. Black rectangles are optical tables, and the star is the source mass(' 350 kg at the measuring time) used for the determination of the Newtonianconstant. The coloured map is the gravity field due to the distribution of thesenearby masses at the reference height of the FG5 gravimeter 129.4 cm from thefloor.
17
Fig. 5. (top) View of the FG5 gravimeter installed in the atom interferometry laboratory room 67at the Department of Physics in Sesto Fiorentino. (bottom) Sketch map of the laboratory withlocation of the masses for which we calculated the gravity field. Black rectangles are opticaltables, and the star is the source mass ('350 kg at the measuring time) used for the determi-nation of the Newtonian constant. The coloured map is the gravity field due to the distributionof these nearby masses at the reference height of the FG5 gravimeter 129.4 cm from the floor.
64