Underwater Explorers: Becoming an Ambassador for Underwater Archaeology
Upload
independentCategory
view
0download
0
Geophysical Prospecting 3,805-830, 1990
MEASURED UNDERWATER NEAR-FIELD E-PATTERNS OF A PULSED, HORIZONTAL DIPOLE
ANTENNA I N AIR: COMPARISON WITH THE THEORY O F THE CONTINUOUS WAVE,
INFINITESIMAL ELECTRIC DIPOLE’
W. A. W E N S I N K , G . G R E E U W , J . H O F M A N and J . K . V A N DEEN2
ABSTRACT WENSINK, W.A., GREEUW, G., HOFMAN, J. and VAN DEEN, J.K. 1990. Measured underwater near-field E-patterns of a pulsed, horizontal dipole antenna in air: comparison with the theory of the continuous wave, infinitesimal electric dipole. Geophysical Prospecting 38, 805- 830.
At Delft Geotechnics the technique of ground-penetrating radar is in use for the detec- tion of buried objects such as pipes. To enable us to give our ‘measurements in the field’ a more quantitative interpretation than can be deduced from these alone, a series of experi- ments has been started under well-defined conditions. A cylindrical vessel containing water simulates wet soil. Mounted horizontally above the water surface is a pulsed triangular half- wave dipole which is used as a transmitting antenna (TA). It has a carrier-frequency of about 160 MHz and a pulse repetition-frequency of about 50 kHz.
A movable receiving dipole (‘ probe ’) in the water measures the transverse, mutually orthogonal E,- and E,-components of the pulses as a function of probe-position (r, O, 4) and of the height h of the TA above the water surface. When these pulses are Fourier-transformed, the transverse electric fields E, and E, at 200 MHz are obtained. The resulting field patterns are compared with computational results on the basis of the theory of the continuous wave, infinitesimal electric dipole (‘ point dipole ’). It can be concluded that:
(1) Far-field conditions have not fully developed at a depth of about 2.50 m, the largest value of the radius r at which field patterns were measured, although it represents a distance of about 15 wavelengths.
(2) The attenuation constant of the tapwater used, as deduced from E-field measure- ments for O = O, 2.50 m < r < 2.75 m, is slightly less than the value measured using a network analyser and air line combination, in agreement with (1).
(3) E, field patterns calculated using the value of the conductivity O corresponding to the former value of the attenuation constant agree reasonably well with the measured patterns for
Received June 1989, revision accepted February 1990. Delft Geotechnics, P.O. Box 69,2600 AB Delft, The Netherlands.
805
806 W. A. WENSINK E T A L .
r 2.50 m and for û < 20" at all antenna heights considered. Calculated E, patterns do not agree so well with the measured patterns when h is close to zero. With increasing height the agreement inproves.
(4) In accordance with the theory of the point-dipole, the angular distribution of the radiation patterns of the TA becomes wider as the frequency decreases.
(5) The normalized underwater pulse-spectra shift to lower frequencies with increasing 1.
This can be explained since the attenuation constant of the water rises with rising frequency.
INTRODUCTION
Ground probing radar (GPR) is used as a detection technique in a variety of fields, such as geological surveying, detection of plastic mines and civil engineering (see Daniels, Gunton and Scott 1988).
There have been many publications on the measurement and calculation of field patterns in a material half-space (' medium ') generated by commonly used sources, such as electric dipoles in air.
Annan (1973) examined theoretically the wave nature of the fields due to various types of dipole sources placed at the interface of a low-loss dielectric half-space and a two-layer earth. He showed that the field of a (horizontal) point-dipole near the interface between air and a medium can be resolved into four waves: a spherical wave plus a damped interfacial wave in air and a spherical wave plus a plane ('lateral ') wave in the medium.
Rossiter et al. (1973) carried out analogue scale model experiments and field tests on two glaciers and interpreted the results on the basis of Annan's (1973) theory. The range used in their experiments and calculations was approximately 2-20 A, where 1 is the wavelength in the medium.
Annan et al. (1975) examined theoretically as well as experimentally (by scale modelling), the continuous wave E, radiation pattern of a half-wave electric dipole in the presence of a two-layer, plane-stratified, low-loss dielectric earth. E, patterns were measured on circles with radii of 3 A, 4.5 Â. and 6 A and consequently were near-field patterns. They were compared to far-field theoretical patterns computed by Cooper (1971).
Rossiter et al. (1975) used mode theory for the propagation to describe the fields in a thin dielectric layer (0-1 Â. thickness) overlying a thick dielectric layer and compared these results with field data collected on the Juneau Icefield, Alaska.
Cooper, Mueller and Schertler (1976) measured ice thicknesses using an S-band short pulse radar aboard an all-terrain vehicle.
Annan and Davis (1976) used an impulse radar-sounding technique to map the near-surface geological structure and electrical properties of permafrost.
Chew and Kong (198 1) interpreted the electromagnetic field due to a horizontal electric dipole placed on top of a two-layer earth in terms of fields due to a dipole over a half-space earth and its image source field.
Bannister (1982) used image theory to calculate the field of a horizontal electric dipole in the presence of a conducting half-space, in the near- and far-field ranges.
Engheta, Papas and Elachi (1982) calculated the radiation patterns of interfacial
U N D E R W A T E R N E A R - F I E L D D I P O L E P A T T E R N S 807
dipole antennae, where the lower half-space is a lossless dielectric and the upper one is air. The complete far-zone-fields in both half-spaces were obtained.
Smith (1984) investigated the directive properties of antennae for transmission into a material half-space. Numerical far-field results were presented for infinitesimal electric and magnetic horizontal dipole antennae in a dielectric half-space (region 1) with directive transmission into the adjacent dielectric half-space (region 2), where the ratio of permittivities c2/c1 > 1. Measured continuous wave field patterns at a radius of about 8 Â.,,,,, for dipole and loop antennae situated near the interface between air and fresh water were compared to far-field theoretical results. It was observed that directivity increases with increasing antenna height, in accordance with theory.
At Delft Geotechnics, GPR is increasingly used for the detection of buried objects such as pipes. During the past years much experience with GPR in practical situations has been acquired. However, due to the varying conditions encountered in practice, such as type and water content of soil, the presence of inhomogeneities in it, reflection properties of buried objects, height of transmitting antenna (TA) and receiving antenna, a quantitative interpretation of the measurements is often difi- cult. Therefore a test site has been built, where GPR-measurements can be made under well-defined conditions.
A cylindrical vessel containing water simulates wet soil. The TA is mounted horizontally above the water surface. E-patterns at 200 MHz generated by this TA are measured under water. The tapwater used is a lossy medium with a moderate conductivity a,(200 MHz) = 0.063 f 0.003 S/m. Arcone and Delaney (1982), Olhoeft (1987) and Wensink (Dielectric properties of wet soils in the frequency range 3-3000 MHz, to be published) give ample evidence that, at 200 MHz, the dielectric constant ce,r of wet, clayey soils which are frequently encountered in The Netherlands, can easily have a value of about 36. Therefore water with ce,r x 80 can simulate wet, homogeneous soil very well.
The emphasis is on the measurement of underwater near-field patterns generated by the TA used, since in practice, due to the generally strong damping of radiation in soil, only buried objects in the near-field of the TA are detectable.
The measured field patterns are compared to calculated patterns on the basis of the theory of the continuous wave, horizontal infinitesimal dipole or shortly ' point dipole' (Sommerfeld 1909; Banos 1966) in the version of King et al. (1981).
In a forthcoming paper (Wensink, W.A., Hofman, J. and Van Deen, J.K.), the reflection properties of underwater steel and PVC pipes irradiated by the same tri- angular TA will be presented. Thus the near field measurements and calculations in the present paper also serve to diagnose the properties of the TA as a tool for pipe detection.
EXPERIMENTAL SET-UP
A cylindrical steel vessel (4 = 2.9 m, height = 4 m) was installed inside the labor- atory, providing a good shield from possible external electromagnetic fields, since no measurable signals could be detected when the TA was off. It was filled with tap- water, simulating wet, saturated soil. The water had a conductivity ae(200

808 W . A . W E N S I N K E T A L .
MHz) = 0.063 $I 0.003 S/m and a temperature of 20 f 1°C. Horizontally above the water surface, a pulsed triangular (full top-angle 60") half-wave dipole (nominal 300 MHz) (manufactured by GSSI, U.S.A.) is mounted as a TA. Its height relative to the water surface can be varied in steps of 2 cm. The carrier frequency of the pulses is about 160 MHz when the TA is above the water surface and their repetition- frequency is about 50 kHz. The TA is packed in a plastic cover of 5 mm thickness at the bottom, representing an electrical thickness of 5 x 1.4 = 7 mm if the dielectric constant of the plastic is estimated to be 1.96. If it is assumed that the transmitting properties of the TA are unchanged by the presence of the cover, that the cover is lossless and that reflections of the pulses from it can be neglected, its only affect is to cause an increase of 7 mm in the height h of the TA.
In the water, a movable receiving dipole antenna (probe) measures the mutually orthogonal transverse components E, and E, of the pulses as a function of its posi- tion and of the height of the TA above the centre of the water surface. This centre is the origin of our polar coordinate system (King et al. 1981).
The experimental arrangement is shown in Fig. 1. The axis of the cylindrical body 1 on which the dipole blades of the probe are mounted, is always in the vertical plane through the L-shaped rail 2 on which a small cart 3 holding line 4 can be moved. The lines 5 and 6 pass through the hollow cylinders 7 and 8 and are under permanent tension due to the weights 9 and 10. By varying the position of the cart and the length of line 4, the polar coordinates r and O can be varied. The coordinate 4 can be varied by rotating the TA. During E, measurements, the orien- tation of the axis of the blades of the probe is perpendicular to the vertical plane of the L-shaped rail. For E, measurements, the blades of the probe are rotated through 90" about the body axis of the probe, so their axis then lies in the plane just mentioned.
The probe is a half-wave dipole designed for underwater measurements; it has an impedance of about 10 R and is adapted by means of a balun and a A14 section to the 50 R coaxial cable which forms the connection with a 1 GHz sampling oscilloscope. The blades of the dipole are isolated from the surrounding water by means of an epoxy layer of 0.1 mm thickness.
The orientation of the body axis of the probe, which should always point towards the centre of the water surface, is checked by means of a small laser whose radiation propagates in a direction parallel to the body axis. The laser is in a water- tight cylinder of Teflon attached to the body of the probe (Fig. 2) At the radiating end of the laser the cylinder is sealed with a glass window. An inclinometer and a water-pressure gauge are also attached to the body of the probe.
The inclinometer is used to measure the polar coordinate 8 when O 5 8 s 20"; larger values of 8 (maximum 60") are measured by fathoming. The estimated accu- racy of O is k0. l" for O s O s 20" and f 1" for 20" s 8 s 60".
The water-pressure gauge measures the depth d of the probe with an accuracy of k2 mm. Since d = r cos 8, and 8 5 60", r is determined with an accuracy of better than + 4 mm.
The angle 4 is measured by means of an arc which is mounted on the TA; 4 is taken to be 90" when the axis of the blades of the TA is perpendicular to the plane through rail 2.

UNDERWATER NEAR-FIELD D I P O L E PATTERNS
I 1
I O 12m
I 3 4
809
O 12m
4
II 1
I ['i I I
l j 4 3
_I
I
I \
. \
./---- 1 -
I
FIG. 1. The vessel with TA and probe: (1) body of probe; (2) L-shaped rail; (3) movable cart; (4, 5, 6) lines; (7, 8) hollow cylinders; (9, 10) weights; (11) water surface.
I
I I
- 1 1
O 30m b-- 4 FIG. 2. The probe used to measure the underwater E-field patterns: (1) dipole blades (perpendicular to plane of the paper); (2) body of probe; (3) glass window; (4) Teflon cylinder with laser; (5) inclinometer; (6) water-pressure meter.
810 W. A . W E N S I N K ET A L .
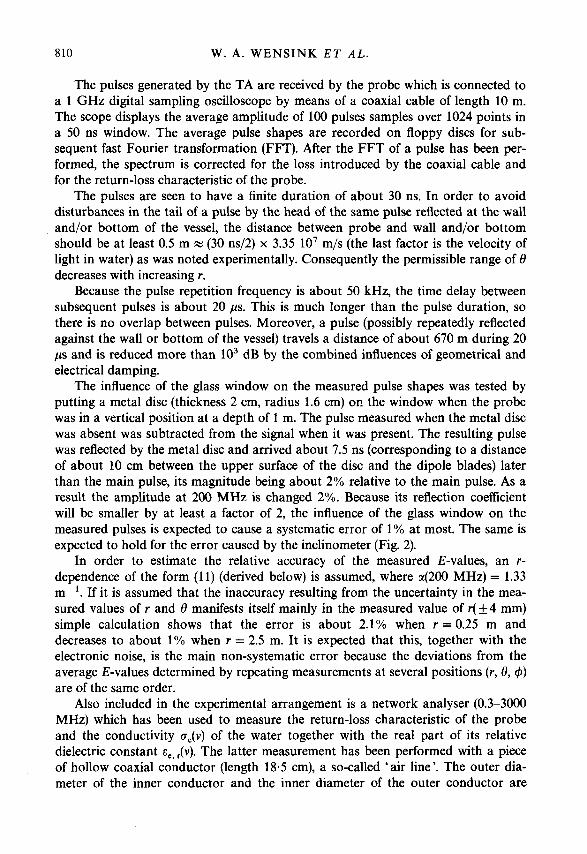
The pulses generated by the TA are received by the probe which is connected to a 1 GHz digital sampling oscilloscope by means of a coaxial cable of length 10 m. The scope displays the average amplitude of 100 pulses samples over 1024 points in a 50 ns window. The average pulse shapes are recorded on floppy discs for sub- sequent fast Fourier transformation (FFT). After the FFT of a pulse has been per- formed, the spectrum is corrected for the loss introduced by the coaxial cable and for the return-loss characteristic of the probe.
The pulses are seen to have a finite duration of about 30 ns. In order to avoid disturbances in the tail of a pulse by the head of the same pulse reflected at the wall and/or bottom of the vessel, the distance between probe and wall and/or bottom should be at least 0.5 m x (30 ns/2) x 3.35 10’ m/s (the last factor is the velocity of light in water) as was noted experimentally. Consequently the permissible range of 8 decreases with increasing r.
Because the pulse repetition frequency is about 50 kHz, the time delay between subsequent pulses is about 20 ps. This is much longer than the pulse duration, so there is no overlap between pulses. Moreover, a pulse (possibly repeatedly reflected against the wall or bottom of the vessel) travels a distance of about 670 m during 20 ps and is reduced more than 103 dB by the combined influences of geometrical and electrical damping.
The influence of the glass window on the measured pulse shapes was tested by putting a metal disc (thickness 2 cm, radius 1.6 cm) on the window when the probe was in a vertical position at a depth of 1 m. The pulse measured when the metal disc was absent was subtracted from the signal when it was present. The resulting pulse was reflected by the metal disc and arrived about 7.5 ns (corresponding to a distance of about 10 cm between the upper surface of the disc and the dipole blades) later than the main pulse, its magnitude being about 2% relative to the main pulse. As a result the amplitude at 200 MHz is changed 2%. Because its reflection coefficient will be smaller by at least a factor of 2, the influence of the glass window on the measured pulses is expected to cause a systematic error of 1 % at most. The same is expected to hold for the error caused by the inclinometer (Fig. 2).
In order to estimate the relative accuracy of the measured E-values, an r- dependence of the form (11) (derived below) is assumed, where a(200 MHz) = 1.33 m-l. If it is assumed that the inaccuracy resulting from the uncertainty in the mea- sured values of r and 8 manifests itself mainly in the measured value of r(+4 mm) simple calculation shows that the error is about 2.1% when r = 0.25 m and decreases to about 1 % when r = 2.5 m. It is expected that this, together with the electronic noise, is the main non-systematic error because the deviations from the average E-values determined by repeating measurements at several positions (r, 8, 4) are of the same order.
Also included in the experimental arrangement is a network analyser (0.3-3000 MHz) which has been used to measure the return-loss characteristic of the probe and the conductivity a,(v) of the water together with the real part of its relative dielectric constant ~Jv). The latter measurement has been performed with a piece of hollow coaxial conductor (length 18.5 cm), a so-called ‘air line’. The outer dia- meter of the inner conductor and the inner diameter of the outer conductor are

UNDERWATER NEAR-FIELD D I P O L E PATTERNS 811
h
about 3 and 7 mm respectively, to ensure a 50 R impedance for the air line. When the air line is filled with a dielectric, its impedance changes and it is no longer matched to the precision 50 R coaxial cables connecting it with the ports of the network analyser. By simultaneously measuring the coefficients of (multiple) reflec- tion and transmission of voltage of the water-filled air line as a function of the frequency v, the parameters a,(v) and E,, , (v) can be obtained. The general theory concerning (multiple) reflection and transmission of voltage is given e.g. by Van Gemert (1973).
-+ D i p o l e
A i r E, z I , G=O O c
THEORY OF P O I N T - D I P O L E , DEFINITION OF FIELD-COMPONENTS
The theory of the point-dipole is formulated most easily using cylindrical coordi- nates (z, p, 4) with corresponding E-field components E,, E, and E, (King et al. 1981), as shown in Fig. 3. A representation in spherical polar coordinates (r, 8, 4) is,
FIG. 3. Point-dipole at height h above interface of air ( E ~ , ~ = 1, O, = O) and material half- space, ‘ the medium’ (E,, , 2 1, O, 2 O). The axis of the dipole points in the positive x-direction which is defined as the direction 4 = O. In the right-handed coordinate systems used, E, points perpendicularly out of the plane of the paper towards the reader.

812 W. A . W E N S I N K ET A L .
however, preferable from a practical point of view, since this is the system in which the E-field components are measured (Fig. 1). The components are now E,, E, and E,. In Fig. 3 it can be seen that
E, = E, sin 6 - E, cos 6, (1) E , = E, cos 6 + E, sin 6, (2)
E, = E , . (3) The formulae describing E,, E, and E, are given by King et al. (1981). Their depen- dence on z and p is complicated, except for E, at the vertical under the point-dipole where
E,(z, p = O, 4) = O. (4)
However, the dependence on 4 is simple :
Combining (1H6) it is evident that
E,(r, 6 = O, 4) = O,
Further, it should be noted that according to their definitions
E&r, 6 = O, 4 = O ) = E,(r, 6 = O, 4 = 900). (10)
Strictly speaking, 4 is undefined on the vertical axis 6 = O. However, for 8 # O the maximum value of E, as a function of 4 occurs for 4 = O and for E, it occurs for 4 = 90". For this reason the notation (10) is useful.
RESULTS
The inpuence of the height of the T A
In Fig. 4 the full lines show pulses and their Fourier transforms measured at h = 0.7 cm and 2.7 cm for a probe depth of 0.5 m (the broken line in Fig. 4b shows a pulse shape to be discussed below). If h = 0.7 cm the cover of the TA just touches the water and this seems to produce spurious frequency components below 100 MHz. When the TA is raised, these components are seen to decrease considerably. In addition, the top-frequency is shifted from 176 MHz to 185 MHz. Raising the TA above 2.7 cm produces only slight changes in the measured pulse shapes, although the flanks of the spectrum rise somewhat. The full-width at half-maximum increases from 132 MHz at h = 2.7 cm to 140.5 MHz at h = 10.7 cm.

UNDERWATER NEAR-FIELD DIPOLE PATTERNS 813
i l M F DOMAIN D A T A TIME DOMAIN D A T A
FREQUENCY UOMAIN MAGNITUDE D A T A
2 5 412 5 BOOMHz 25 412 5 800 M H z ( a ) ( b )
FIG. 4. Measured E,-pulse shapes and their Fourier transforms: (a) h = 0.7 cm; (b) h = 2.7 cm. Probe on vertical: 0 = O, 4 = 90°, r = 0.5 m. Frequency-resolution in transforms: 2.5 MHz. Transforms have been corrected for cable-loss and return-loss of underwater probe. Vertical scales time domain: 1.0 = 481.0 mV (a) or 512.8 mV (b); idem, frequency domain: 1.0 = 45.63 V/m (a) or 48.65 V/m (b). The broken line in (b) is the pulse shape when r = 2.5 m where the spectrum is shifted towards lower frequencies because the attenuation constant increases with increasing frequency. The top-value for the 2.5 m spectrum is in reality a factor 59.2 smaller than the one for the 0.5 m spectrum.
In Fig. 5 , curves of E&, 8 = O, 4 = 90") versus h at 200 MHz are shown for r = 0.5 m and 2 m. It can be seen that raising the TA from 0.7 cm to 2.7 cm leaves E, unchanged to within 3%, whereas lifting it to 10.7 cm causes a decrease in E , of a factor of 2.13 at r = 0.5 m and 1.73 at r = 2 m.
Figure 5 also shows curves of E&, 8 = O, 4 = 90") calculated according to the point-dipole theory. The point-dipole expressions for the fields E,, E, and E, (King et al. 1981) are valid for unit current moment ZAl ( I is the current, Al the infinitesi- mal antenna length) of the antenna. For a current moment that is not unity all the expressions must be scaled linearly with it. Therefore, calculated values of E, are set equal to the measured ones at h = 0.7 cm. For the other values of h the same scaling constant has been used, i.e. the calculated curves in Fig. 5 are valid for a constant current 1. Deviations from the measured curves may be attributed to two causes: (1) The current distribution over the triangular TA must be expected to be 2D instead of linear. (2) From Fig. 5 it can be concluded that the experimental values of E , decrease faster than the calculated ones when the antenna is raised above 2.7 cm. Apparently the antenna current decreases when the antenna is lifted. This is consis- tent with the well-known fact that the radiation resistance of a linear half-wave

814 W . A . W E N S I N K E T A L .
10.0 I I I I
0.7 2.7 4.7 6.7 0.7 10.7 __c h (cm)
FIG. 5. Measured (x) and calculated (.) values of E&, 0 = O, 4 = 90°) for r = 0.5 m (upper pair of curves) and r = 2 m (lower pair) versus h (cm). Frequency: 200 MHz, te, = 80, 6, = 0.063 S/m. The values for the lower pair of curves are shown multiplied with a factor of 10.
dipole above ground rises (and consequently the current decreases if the power offered to the antenna is constant) for small values of h/Âsir when h is increased (Thourel 1960; King 1956).
E , and E , measurements at 200 M H z
Due to instrumental limitations, the range of 8 decreases with increasing value of r in the measured field patterns. In the calculations the values of .se, ,(200 MHz) = 80 and a,(200 MHz) = 0.063 S/m have been used. For a given antenna height the E,- and E,-values calculated at r = 0.5 m and 8 = O have been scaled to the correspond- ing measured values; all other calculated values of E, and E, in the field patterns have been multiplied with the ensuing respective scaling factors.
E,-measurements. In Fig. 6, measured and calculated E, field patterns at h = 2.7 cm are shown for 4 = 90" and r = 0.25, 0.5, 1, 1.5, 2 and 2.5 m. Measured and calculated field patterns are seen to agree well. In order to demonstrate the influence of h on the shape of the patterns, similar patterns at h = 10.7 cm are shown in Fig. 7. Again the patterns agree well. On comparing Figs 6 and 7 it can be concluded that increasing the height of the TA narrows the patterns especially at larger values of r. Consequently radiation is concentrated in a more forward direction. This is in agreement with the results of Smith (1984). The increase in height also reduces the field strength by a factor of about 2. This observation also holds for other values
Measurements were taken at the values of 8 = O, 5", lo", 2o", 3o", 45" and W, the range of 8 decreasing with increasing values of r. Therefore, the presence or absence of the indentations which appear in the calculated patterns shown in Figs. 6
of 4.

UNDERWATER NEAR-FIELD DIPOLE PATTERNS 815
1' ~ I O0 I I I
1 ~ 2 O 0 111
r ~ I 50 r r i
r ~ 2 50 rn 01 I no
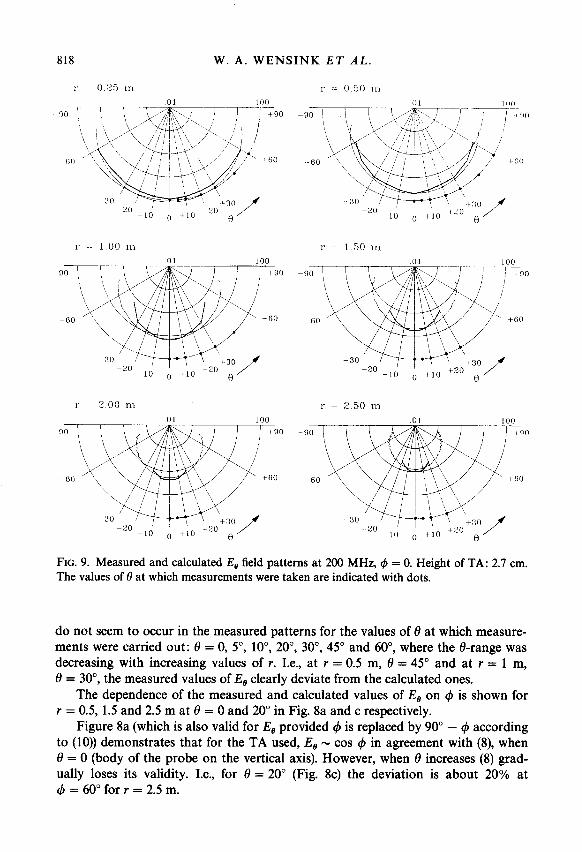
FIG. 6. Measured and calculated E, field patterns at 200 MHz, 4 = 90". Height of TA: 2.7 cm. Values of 8 at which measurements were taken are indicated with dots.
and 7 could not be established experimentally in most cases. Only in the measured pattern r = 0.5 m can it be noted that the indentation seems to be absent at û = 45". The indentations in the calculated patterns should be due to interference of the spherical and lateral underwater field components (Annan 1973).
The dependence of the measured and calculated values of E, on 4 is shown for r = 0.5, 1.5 and 2.5 m at û = O and û = 20" in Fig. 8a and b respectively. Figure 8a demonstrates that for the triangular TA used E, - sin 4 when 8 = O (body of probe on the vertical axis) in agreement with (9) which is valid for a point-dipole. However, (9) gradually loses its validity as û increases. In Fig. 8b the deviation from (9) is about 20% at 4 = 30" for r = 2.50 m.

816 W. A. W E N S I N K ET A L .
1 O 25 II1 r O 50 r i 1
1 I O0 I l l
FIG. 7. Measured and calculated E, field patterns at 200 MHz, C#J = 90". Height of TA: 10.7 cm. Values of 8 at which measurements were taken are indicated with dots.
E,-measurements. In Fig. 9 measured and calculated E, field patterns at h = 2.7 cm are shown for 4 = O and r = 0.25, 0.5, 1, 1.5, 2 and 2.5 m. There is less agree- ment between measured and calculated patterns than in the case of E,, the mea- sured patterns being narrower for r 2 0.5 m.
In Fig. 10 similar field patterns at h = 10.7 cm are shown, to demonstrate the influence of h on the shape of the field patterns. The agreement between measured and calculated patterns is better than at h = 2.7 cm. Just as in the E, measurements, the radiation is concentrated in a more forward direction, while the field strength is reduced by a factor of about 2 as compared with Fig. 9. This observation also holds for other values of 4. The indentations which are visible in the calculated patterns

UNDERWATER NEAR-FIELD DIPOLE PATTERNS 817
E O in O
Il -
O m
O
" E
* II
D "
- 0 0 0
N Y
3
O m
O
" E - 0 0 0
ci1
Il
v
E h
O
d m N
(W/A) 3
O m
O <3
- v
-0
O m
O
- 3
O m
("A) 3 (Wiz) 3
O
O
E
* II
- 0 0 0
N v
O i
818 W. A . W E N S I N K E T A L .
01 I O0
r =- I O0 III r = 1 50 rri 01 100 O I I 00
r ~ 2 0 0 m r = 2 5 0 ni O 1 100
0 O 1 I O0
FIG. 9. Measured and calculated E, field patterns at 200 MHz, 4 = O. Height of TA: 2.7 cm. The values of 0 at which measurements were taken are indicated with dots.
do not seem to occur in the measured patterns for the values of û at which measure- ments were carried out: 8 = O, 5", 10", 20", 30", 45" and 60", where the û-range was decreasing with increasing values of r. I.e., at r = 0.5 m, û = 45" and at r = 1 m, û = 30", the measured values of E , clearly deviate from the calculated ones.
The dependence of the measured and calculated values of E , on 4 is shown for r = 0.5, 1.5 and 2.5 m at û = O and 20" in Fig. 8a and c respectively.
Figure 8a (which is also valid for E, provided 4 is replaced by 90" - 4 according to (10)) demonstrates that for the TA used, E, - cos 4 in agreement with (8), when 8 = O (body of the probe on the vertical axis). However, when 8 increases (8) grad- ually loses its validity. I.e., for 8 = 20" (Fig. 8c) the deviation is about 20% at d = 60" for r = 2.5 m.
UNDERWATER NEAR-FIELD DIPOLE PATTERNS 819
O I 1 O11
!I
O I 100 01 I 0 0
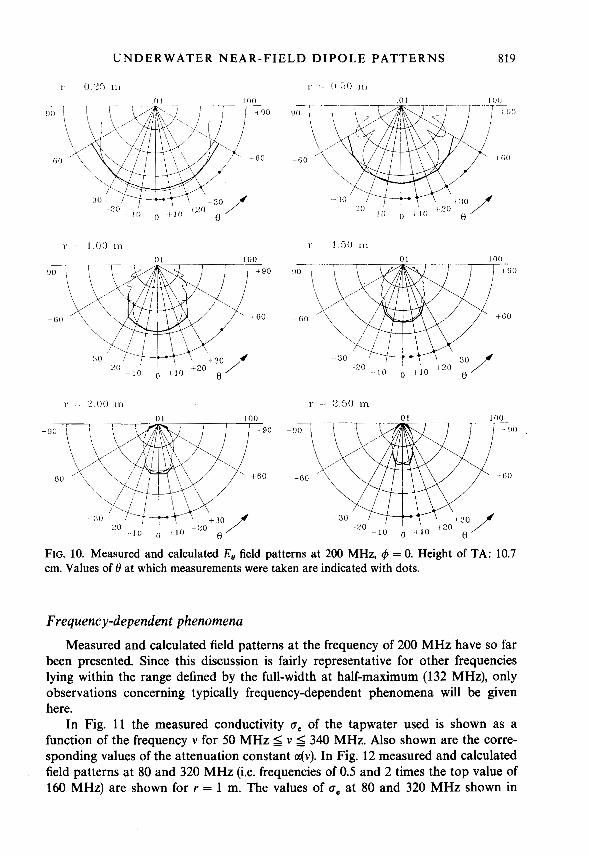
FIG. 10. Measured and calculated E, field patterns at 200 MHz, 4 = O. Height of TA: 10.7 cm. Values of 6, at which measurements were taken are indicated with dots.
Frequency-dependent phenomena Measured and calculated field patterns at the frequency of 200 MHz have so far
been presented. Since this discussion is fairly representative for other frequencies lying within the range defined by the full-width at half-maximum (132 MHz), only observations concerning typically frequency-dependent phenomena will be given here.
In Fig. 11 the measured conductivity oe of the tapwater used is shown as a function of the frequency v for 50 MHz S v 5 340 MHz. Also shown are the corre- sponding values of the attenuation constant a(v). In Fig. 12 measured and calculated field patterns at 80 and 320 MHz (i.e. frequencies of 0.5 and 2 times the top value of 160 MHz) are shown for I = 1 m. The values of oe at 80 and 320 MHz shown in

820 W. A . W E N S I N K ET A L .
7- I
U( S l m )
O 10-
2 O0 3 O0
O 10-
50 100 2 O0 3 O0 V ( M H 2 ) -
FIG. 11. Values of conductivity a,(v) (or attenuation constant GL(V)) measured with network analyzer and air line combination versus frequency v. Dots: measured values.
Fig. 11 have been used in the calculations. It can be seen that in accordance with point-dipole theory and angular distribution of the radiation patterns becomes wider when the frequency decreases.
In Fig. 4b two normalized spectra were shown for r = 0.5 m and 2.5 m. The rise of a(v) with frequency seen in Fig. 11 explains the observed shift of the normalized spectra towards lower frequencies when r is increased.
DISCUSSION
The E , and E, components
The onset of the far-field region. In the far-field region the underwater E, or E, component of the field of a point-dipole located in air at a height h 2 O m above the water surface can be written as
E+, 4 4) = D,, e(& 4) ~ X P ( - 4v)r)/r, (1 1) where D,, ,(6,4) is a direction-dependent factor and a(v) the frequency-dependent attenuation constant of the water at the frequency considered (Smith 1984). For a non-magnetic medium such as water it follows in the (slightly modified) notation of King et al. (1981) that
a(v) = 2nv(p0 E. &e, r(v))1/z[1/2({ 1 + p:(v)} - l)l/Z-J1/2, (12)

UNDERWATER NEAR-FIELD D I P O L E PATTERNS 821
O 1
I l '2
( 1 ) I ?I O 5.200 \ I I I / H
< ) 1 lp O HO O h l l l /
FIG. 12. Measured and calculated field patterns at 80 MHz and 320 MHz, at r = 1 m. ce, = 80 at both frequencies; oe = 0.0515 S/m at 80 MHz and 0.089 S/m at 320 MHz, see Fig. 11. Antenna heights h, = 2.7 cm, h , = 10.7 cm. All patterns have been normalized to the same (arbitrary) E-value at û = O.
822 W. A. W E N S I N K ET A L .
where v is the frequency of the radiation, ,uo an the permeability and the dielectric constant of vacuum, E,, ,(v) the real part of the complex frequency-dependent effec- tive relative dielectric constant E,,~, ,(v) defined by
Erei, e(V) = ce , AV) + iEe, i(v),
P X V ) = ae(vY(2zvEû Ee, r(v)) = ce , i(v)/Eû Ee, r(vL
(13)
(14)
and p,(v) the effective loss-tangent, defined as
where o,(v) is the conductivity of the medium considered, i.e. tapwater and E ~ , i(v) the imaginary part of E,,,, ,(v). Taking the logarithm of r x E,(r, 0, 4), where E, is given by (1 l), it is found that in the far-field region of a point-dipole
log [r x E&, 8, 4)] = -ar log (e) + r-independent term. (15)
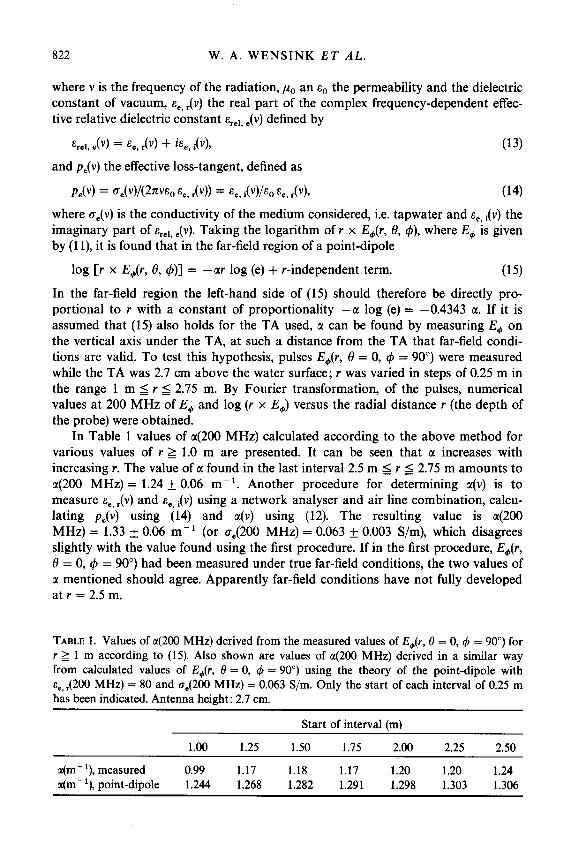
In the far-field region the left-hand side of (1 5) should therefore be directly pro- portional to r with a constant of proportionality - a log (e) = -0.4343 u. If it is assumed that (15) also holds for the TA used, a can be found by measuring E, on the vertical axis under the TA, at such a distance from the TA that far-field condi- tions are valid. To test this hypothesis, pulses E&, 8 = O, 4 = 90') were measured while the TA was 2.7 cm above the water surface; r was varied in steps of 0.25 m in the range 1 m 5 r 5 2.75 m. By Fourier transformation, of the pulses, numerical values at 200 MHz of E, and log (r x E,) versus the radial distance r (the depth of the probe) were obtained.
In Table 1 values of 4200 MHz) calculated according to the above method for various values of r 2 1.0 m are presented. It can be seen that a increases with increasing r. The value of a found in the last interval 2.5 m 5 r 5 2.75 m amounts to a(200 MHz) = 1.24 f 0.06 m-'. Another procedure for determining a(v) is to measure ce, ,(v) and ee, i(v) using a network analyser and air line combination, calcu- lating p,(v) using (14) and a(v) using (12). The resulting value is 4200 MHz) = 1.33 f 0.06 m-' (or ~ ~ ( 2 0 0 MHz) = 0.063 f 0.003 S/m), which disagrees slightly with the value found using the first procedure. If in the first procedure, E,@, 8 = O, 4 = 900) had been measured under true far-field conditions, the two values of a mentioned should agree. Apparently far-field conditions have not fully developed at r = 2.5 m.
TABLE 1. Values of a(200 MHz) derived from the measured values of E&, 0 = O, 4 = 90') for r 2 1 m according to (15). Also shown are values of 4200 MHz) derived in a similar way from calculated values of E&, 0 = O, 4 = 90") using the theory of the point-dipole with E ~ , ,(200 MHz) = 80 and oe(200 MHz) = 0.063 S/m. Only the start of each interval of 0.25 m has been indicated. Antenna height: 2.7 cm.
Start of interval (m)
1.00 1.25 1.50 1.75 2.00 2.25 2.50
a(m- '), measured 0.99 1.17 1.18 1.17 1.20 1.20 1.24 a(m-'), point-dipole 1.244 1.268 1.282 1.291 1.298 1.303 1.306
UNDERWATER NEAR-FIELD D I P O L E PATTERNS 823
The first procedure was repeated on calculated values of E6(r, 8 = O, 4 = 90") according to the theory of the point-dipole, using ~,,,(200 MHz) = 80 and 0,(200 MHz) = 0.063 S/m. The results are shown in Table 1. It can be observed that for a point-dipole, far-field conditions have also not fully developed at r = 2.5 m, since the value of a(200 MHz) = 1.306 m-' determined for the interval 2.5 m S r 5 2.75 m is lower than the far-field value of a(200 MHz) = 1.326 m-' corresponding to the imposed value 0,(200 MHz) = 0.063 S/m. Only when r 2 5.1 m ( x 30 A,,,,, at 200 MHz) are values of a 2 1.320 obtained, approaching the far-field value. It is there- fore concluded that the explanation given above for the difference between the two measured values of a(200 MHz) is correct and that in the measurements near-field conditions apply. Far-field conditions begin to develop at a radius of about 30 A,,,,, if one uses the somewhat arbitrary criterion of a 2 1.320.
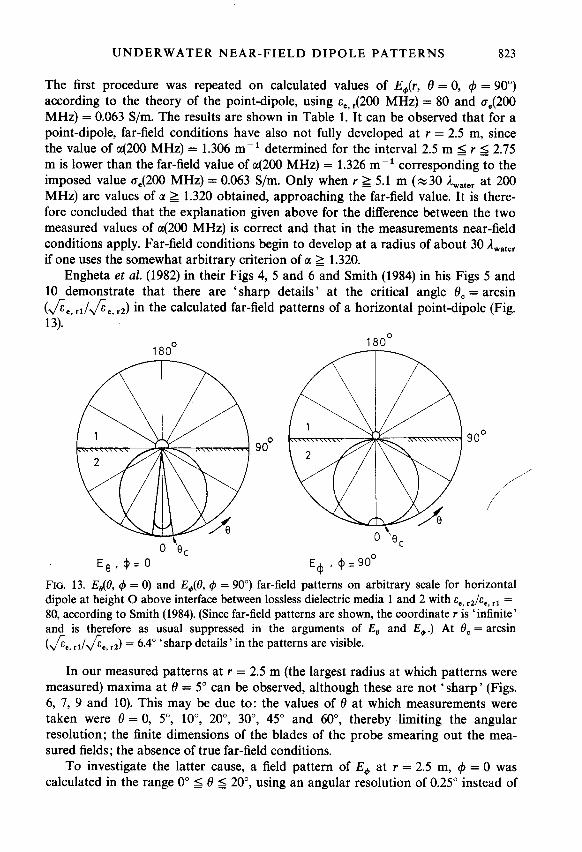
Engheta et al. (1982) in their Figs 4, 5 and 6 and Smith (1984) in his Figs 5 and 10 demonstrate that there are 'sharp details' at the critical angle 8, = arcsin (A,, 12) in the calculated far-field patterns of a horizontal point-dipole (Fig. 13).
1 80° 1 80°
FIG. 13. E&@, C$ = O) and E,(û, C$ = 90") far-field patterns on arbitrary scale for horizontal dipole at height O above interface between lossless dielectric media 1 and 2 with ee, Je,, r l = 80, according to Smith (1984). (Since far-field patterns are shown, the coordinate r is 'infinite' and is therefore as usual suppressed in the arguments of E, and E+.) At 8, = arcsin (JE,, J,,&, rz) = 6.4" 'sharp details' in the patterns are visible.
In our measured patterns at r = 2.5 m (the largest radius at which patterns were measured) maxima at 8 = 5" can be observed, although these are not 'sharp' (Figs. 6, 7, 9 and 10). This may be due to: the values of 8 at which measurements were taken were 8 = O , 5", 10", 20", 30", 45" and 60", thereby .limiting the angular resolution; the finite dimensions of the blades of the probe smearing out the mea- sured fields; the absence of true far-field conditions.
To investigate the latter cause, a field pattern of E, at r = 2.5 m, 4 = O was calculated in the range O" 5 8 5 20", using an angular resolution of 0.25" instead of
824 W . A . W E N S I N K E T AL.
2.5", the resolution used in all the other calculations in this paper. No sharper details appeared in this case, confirming the last cause above. The same conclusion had been reached from the behaviour of the measured quantity log (r x E&, O = O, 4 = 90")) versus r.
Near-$eld r-dependence. Inspection of the point-dipole expressions for E,, , E, and E, (King et al. 1981), which lead to expressions (1), (2) and (3) for E,, E, and E, respectively, reveals that in the near-field they cannot be expressed in a form similar to the far-field expression (1 1) where separate factors D,, ,(O, $), exp (-Ur) and l/r describe their angular dependence, electrical damping and geometrical damping respectively. The physical basis for this phenomenon is that all the points at the water surface irradiated by the TA act as separate 'transmitters ' according to Huygens' principle. The orientations and lengths of the position vectors of all these transmitters relative to the point of observation (the position of the probe) are gen- erally different in the near-field. Consequently, when the contributions of all these transmitters are summed to evaluate the field at the probe position (r, O, +), they interfere because their phases will generally be different and no single factors as mentioned above emerge. Therefore, empirically it is demanded that in a given direction (O, 4),
where in the far-field limit f(r) simply reduces to l/r and where, at 200 MHz, the measured value 4200 MHz) = 1.33 m-' will be used. By multiplying the measured E, = values by the factor exp (1.33r) the artificial functionf(r) can thus be found.
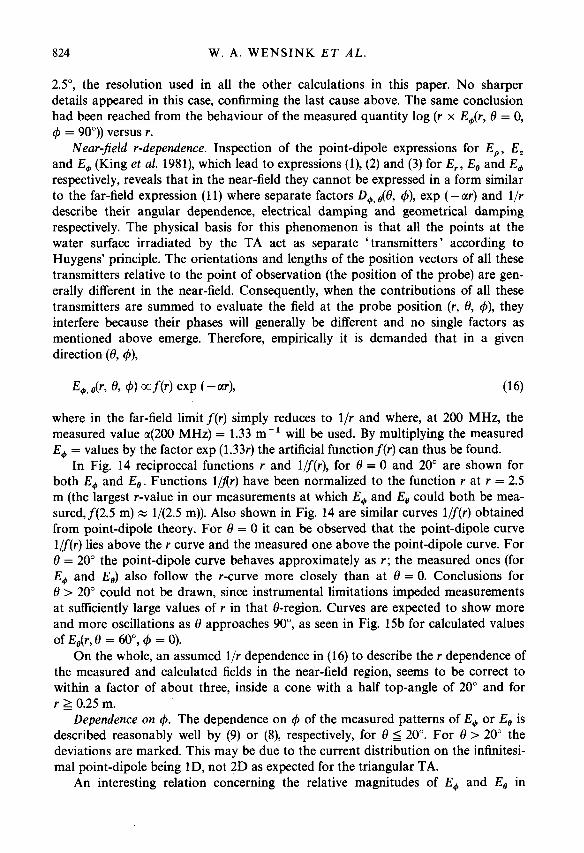
In Fig. 14 reciproccal functions r and l/f(r), for O = O and 20" are shown for both E, and E , . Functions llflr) have been normalized to the function r at r = 2.5 m (the largest r-value in our measurements at which E, and E , could both be mea- sured,f(2.5 m) N 1/(2.5 m)). Also shown in Fig. 14 are similar curves l/f(r) obtained from point-dipole theory. For O = O it can be observed that the point-dipole curve l/f(r) lies above the r curve and the measured one above the point-dipole curve. For O = 20" the point-dipole curve behaves approximately as r; the measured ones (for E, and E,) also follow the r-curve more closely than at O = O. Conclusions for O > 20" could not be drawn, since instrumental limitations impeded measurements at sufficiently large values of r in that O-region. Curves are expected to show more and more oscillations as O approaches 90°, as seen in Fig. 15b for calculated values of E&, O = 60", 4 = O).
On the whole, an assumed 1/r dependence in (16) to describe the r dependence of the measured and calculated fields in the near-field region, seems to be correct to within a factor of about three, inside a cone with a half top-angle of 20" and for r 2 0.25 m.
Dependence on 4. The dependence on 4 of the measured patterns of E, or E, is described reasonably well by (9) or (8), respectively, for O S 20". For O > 20" the deviations are marked. This may be due to the current distribution on the infinitesi- mal point-dipole being lD, not 2D as expected for the triangular TA.
An interesting relation concerning the relative magnitudes of E, and E, in

UNDERWATER NEAR-FIELD D I P O L E PATTERNS 825
3.0
2.0
1.0
o. O 1.0 2.0 3. O r ( m ) -
FIG. 14. Functions r and l l f ( r ) found by modelling measured and calculated values of EJr, 8, & = 90") and Ee(r, 8, & = O) according to (16). Functions l l f ( r ) following from measurements and calculations have been normalized to the function r at r = 2.5 m. Frequency: 200 MHz. Antenna height: 2.7 cm. Straight line through origin: the function r. Dots: point-dipole, E&, 0 = O, & = 90') or Ee(r, 8 = O, & = O). *: point-dipole, E&, 0 = 20", C$ = 90'). x : point- dipole, &(r, 0 = 20°, & = O). V : TA, E&, û = O, C$ = 90°) or Ee(r, 8 = O, & = O). O: TA, E+(r, e = 20°,& = 90"). : TA, Ee(r, e = 20°,& = O).
the case of a point-dipole has been noted. According to (lO), E&, 8 = O, 4 = O) = E&, 8 = O, 4 = 90"). From our calculations it follows that for small angles 8, O < e 5 200,
E&r, 8 > O, 4 = O) < E&, 8 > O, 4 = 90'). (17)
Using (8) and (9), it follows that
Relation (18) also seems to hold for the triangular TA used in the experiments. It has been verified for A = 30" and A = 60".

826
2
l o g I l E
O
1
- 2
- 5
W. A. WENSINK ET A L .
- 1---r--- I
0 0 0 4 O 8 1 2 16 2 0 2 4 2 8 3 2 O0 O 4 O 8 1 2 1 6 1 0 2 4 2 8 3 2 r ( m ) - rim)- -
FIG. 15. Calculated values of E , and E , at h = 2.7 cm plotted logarithmically versus r, for #J = O at û = 30" (a) and 0 = 60" (b). Frequency: 200 MHz, ee, I = 80, O, = 0.063 S/m. Vertical scale: arbitrary units.
The E,jîeld component
The component E, has not been measured. However, some calculations have been performed in order to estimate its magnitude. According to (7), E, = O for 6 = O. When 6 # O, E, # O and E, varies with 4 in the same way as E , , see (8). In Fig. 15 calculated values of log (E,) and log (E,) versus r are shown, for 6 = O and 6 = 30" (a) or 60" (b). The oscillations in Fig. 15b are probably the result of inter- ference of the lateral wave and the spherical wave, into which the underwater field can be resolved (Annan 1973). It appears that
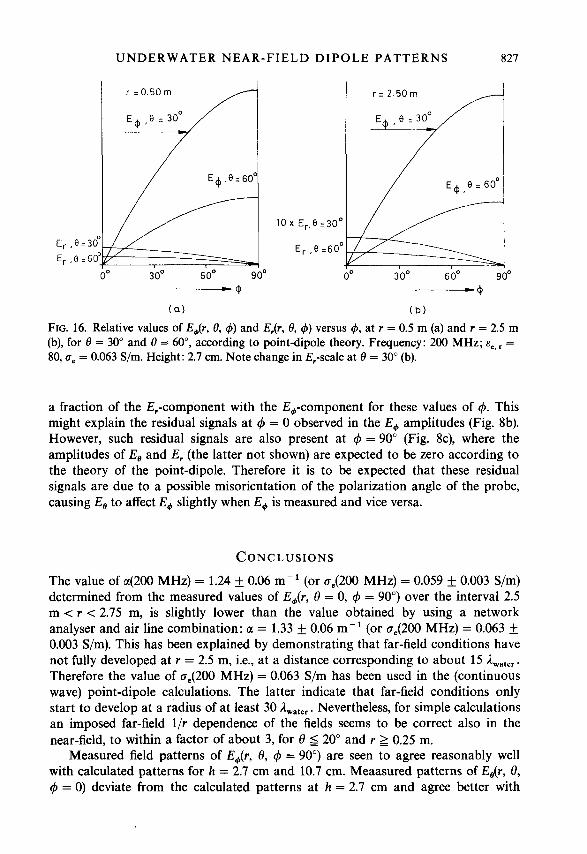
0.25 m S r 5 rmax, (20) where rmax is 1.15 m and 0.5 m for 6 = 30" and 60", respectively (Figs 6, 7,9 and 10). Thus it seems improbable that E, has disturbed the measurements of E , by a pos- sible misorientation (of at most 1") of the probe. In Fig. 16 calculated values of E, and E, versus 4 are shown for r = 0.5 m and 2.5 m, for both 6 = 30" and 60". From (9) and (8), it follows that E, = O and E, has a maximum for 4 = O, i.e. for values of 4 close to O, E, is larger than E , . A possible misorientation of the probe could mix
UNDERWATER NEAR-FIELD D I P O L E PATTERNS 827
r -0 .50m
O0 3 0' 60' goo
10
I r = 2 . 5 0 m ----
! z zkd E, , 9 =60°
O0 3 0' 6 0' 9 O" -0 -0
(a) ( b )
FIG. 16. Relative values of E&r, 8, 4) and Er(r, 8, 4) versus 4, at r = 0.5 m (a) and r = 2.5 m (b), for 8 = 30" and 8 = 60", according to point-dipole theory. Frequency: 200 MHz; ee, , = 80, O, = 0.063 S/m. Height: 2.7 cm. Note change in E,-scale at 8 = 30" (b).
a fraction of the E,-component with the E,-component for these values of 4. This might explain the residual signals at 4 = O observed in the E, amplitudes (Fig. Sb). However, such residual signals are also present at 4 = 90" (Fig. Sc), where the amplitudes of E , and E, (the latter not shown) are expected to be zero according to the theory of the point-dipole. Therefore it is to be expected that these residual signals are due to a possible misorientation of the polarization angle of the probe, causing E, to affect E, slightly when E, is measured and vice versa.
CONCLUSIONS The value of 4200 MHz) = 1.24 f 0.06 m-' (or 0,(200 MHz) = 0.059 f 0.003 S/m) determined from the measured values of E&, 8 = O, 4 = 90') over the interval 2.5 m < r < 2.75 m, is slightly lower than the value obtained by using a network analyser and air line combination: LY = 1.33 f 0.06 m-' (or 0,(200 MHz) = 0.063 f 0.003 S/m). This has been explained by demonstrating that far-field conditions have not fully developed at r = 2.5 m, i.e., at a distance corresponding to about 15 il,,,,, . Therefore the value of a,(200 MHz) = 0.063 S/m has been used in the (continuous wave) point-dipole calculations. The latter indicate that far-field conditions only start to develop at a radius of at least 30 il,,,,, . Nevertheless, for simple calculations an imposed far-field 1/r dependence of the fields seems to be correct also in the near-field, to within a factor of about 3, for O 5 20" and r 2 0.25 m.
Measured field patterns of E&, O, c$ = 90") are seen to agree reasonably well with calculated patterns for h = 2.7 cm and 10.7 cm. Meaasured patterns of E&, O, 4 = O) deviate from the calculated patterns at h = 2.7 cm and agree better with
828 W . A. W E N S I N K ET A L .
them at h = 10.7 cm. For 8 S 20" the dependence on qi of the measured patterns of E, and E, is described adequately by the respective sin qi and cos qi relations pre- dicted by the point-dipole theory. For 8 > 20" there are marked deviations. Prob- ably the deviations are caused by the 2D current distribution on the triangular TA of finite dimensions, whereas the infinitesimal, linear ' point-dipole ' possesses a 1D current distribution.
The normalized underwater spectra of the pulses radiated by the TA shift to lower frequencies with increasing radial distance I of the probe. This has been explained by observing that the attenuation constant a(v) of the water increases with the frequency v. In accordance with the point-dipole theory, the TA is seen to radiate at wider angles when the frequency decreases. The dependence of the mea- sured underwater field strengths on the antenna height h could only be compared qualitatively with results from theoretical calculations because the variation of the antenna-current with h is not known. Therefore, in the calculations a constant current, independent of h, had to be assumed.
Overall the underwater near-field patterns of the triangular TA used can be described quite adequately by the point-dipole theory, for 8 < 20" and h not too small.
ACKNOWLEDGEMENT The authors thank Professor Dr J. Kistemaker for his interest in their ground-radar project and for his encouragement during the measurements.
APPENDIX
The conversion of measured voltages to field strengths
At 200 MHz the loss-tangent pe (see (14)) of the tapwater used is about 7 x 10-'. Therefore p: S 1 and consequently the time-lag of H relative to E of a plane electro- magnetic wave propagating in the water, can be neglected (Jackson 1975).
If it is assumed that the underwater field radiated by the TA is a plane wave over the dimensions of the dipole blades of the probe, the average absolute value S of the Poynting vector equals
S = (1/2) x JEe, x ( ~ , / p , ) " ~ x E' = 0.01 186 E : , (Al) where section and the amplitude E, represents the amplitude of E, or E,.
= 80.0 around 200 MHz, E, and p, have been given in the Discussion
The power W received by the probe during one pulse of duration A is
= oprobe/A, (A2) where Oprobe is the receiving cross-section of the probe, which is assumed to be equal to the surface of the dipole blades of the probe, 8.6 x 10⁻⁴ m2.

UNDERWATER NEAR-FIELD D I P O L E PATTERNS 829
If V,(v) is the amplitude (in volts) at frequency v found after performing a FFT of the measured voltage (pulse) and corrections for return-loss and cable-loss, then also
w = (V;/2)/(Z/A)? 643) where Z is the impedance (50 Cl) of the coaxial cable between probe and scope.
used, Equating (A2) and (A3) it follows that in the present approach, for the probe
E,(v) N 31.3 Vo(v), 644) where E, is in volts/metre.
REFERENCES ANNAN, A.P. 1973. Radio interfering depth sounding. Part I. Theoretical discussion. Geophys-
ANNAN, A.P. and DAVIS, J.L. 1976. Impulse radar sounding in permafrost. Radio Science 11,
ANNAN, A.P., WALLER, W.M., STRANGEWAY, D.W., ROSSITER, J.R., REDMAN, J.D. and WATTS, R.D. 1975. The electromagnetic response of a low-loss, 2-layer, dielectric earth for hori- zontal electric dipole excitation. Geophysics 40, 285-298.
ARCONE, S.A. and DELANEY, A.J. 1982, Dielectric properties of thawed active layers overlying permafrost using radar at VHF. Radio Science 17,618-626.
BANNISTER, P.R. 1982. The image theory of electromagnetic fields of a horizontal electric dipole in the presence of a conducting half space. Radio Science 17, 1095-1 102.
BANOS, A. 1966. Dipole Radiation in the Presence of a Conducting Half-Space. Pergamon Press, Inc.
CHEW, W.C. and KONG, J.A. 1981. Electromagnetic field of a dipole on a two-layer earth. Geophysics 46, 309-3 15.
COOPER, W.W. 1971. Patterns of dipole antenna on stratified medium. Technical Report TR71-3, MIT Center for Space Research.
COOPER, D.W., MUELLER, R.A. and SCHERTLER, R.J. 1976. Remote profiling of lake ice using an S-band short-puise radar aboard an all terrain vehicle. Radio Science 11, 375-381.
DANIELS, D.J., GUNTON, D.J. and SCOTT, H.F. (guest eds) 1988. Special issue on subsurface radar. Proceedings of the IEEE F-135,277-392.
ENGHETA, N., PAPAS, C.H. and ELACHI, C. 1982. Radiation patterns of interfacial dipole antennas. Radio Science 17, 1557-1566.
JACKSON, J.D. 1975. Classicall Electrodynamics. John Wiley & Sons Inc. KING, R.W.P. 1956. The Theory of Linear Antennas. Harvard University Press. KING, R.W.P., SMITH, G.S., OWENS, M. and WU, T.S. 1981. Antennas in Matter. M.I.T. Press. OLHOEFT, G.R. 1987. Electrical properties from 10-3 to 10+9 Hz: physics and chemistry. In:
Proceedings Second International Symposium on the Physics and Chemistry of Porous Media, Schlumberger-Doll, Ridgefield, CT, 1986, American Institute of Physics, Con- ference Proceedings 154, Banavar, Koplik and Winkler (eds), AIP, 28 1-298.
ROSSITER, J.R., LATORRACA, G.A., ANNAN, A.P., STRANGWAY, D.W. and SIMMONS, G. 1973. Radio interfering depth sounding. Part II. Experimental results. Geophysics 38, 581-599.
ROSSITER, J.R., STRANGWAY, D.W., ANNAN, A.P., WATTS, R.D. and REDMAN, J.D. 1975. Detec- tion of thin layers by radio interferometry. Geophysics 40,299-308.
ics 38, 557-580.
383-394.
830 W. A. WENSINK E T AL.
SMITH, G.S. 1984. Directive properties of antennas for transmission into a material half-space.
SOMMERFELD, A. 1909. Uber die Ausbreitung der Wellen in der drahtlosen Telegraphie.
THOUREL, L. 1960. The Antenna. Chapman and Hall. VAN GERMERT, M.J.C. 1973. High-frequency time-domain methods in dielectric spectroscopy.
Philips Research Reports 28, 530-572. WENSINK, W.A., HOFMAN, J. and VAN DEEN, J.K. 1990. Measured reflection strengths of
underwater pipes irradiated by a pulsed horizontal dipole in air: comparison with con- tinuous plane wave scattering theory. Geophysical Prospecting, in press.
WENSINK, W.A., to be published. Dielectric properties of wet soils in the frequency-range 10-3000 MHz.
IEEE Transactions of Antennas and Propagation AP-32,232-246.
Annalen der Physik 28,665-737.
Copyright © 2022 FDOKUMEN