Lagrangian mechanics : - Follow fluid particles with - UCSB ...

Marine Geology 268 (2010) 1–15
Contents lists available at ScienceDirect
Marine Geology
j ourna l homepage: www.e lsev ie r.com/ locate /margeo
Mean Lagrangian flow behavior on an open coast rip-channeled beach:A new perspective
Jamie MacMahan a,⁎, Jeff Brown b, Jenna Brown b, Ed Thornton a, Ad Reniers c,d, Tim Stanton a,Martijn Henriquez d, Edith Gallagher e, Jon Morrison a, Martin J. Austin f, Tim M. Scott f, Nadia Senechal g
a Oceanography Department, Naval Postgraduate School, Monterey, CA, United Statesb Civil and Environmental Engineering, University of Delaware, Newark, DE, United Statesc Rosenstiel School of Marine Science, University of Miami, Miami, FL, United Statesd Delft University of Technology, Delft, The Netherlandse Franklin and Marshal College, Lancaster, PA, United Statesf School of Earth, Ocean and Environmental Sciences, University of Plymouth, Plymouth, PL4 8AA, UKg OASU-EPOC Université Bordeaux 1, Avenue des Facultés 33405 Talence cedex, France
⁎ Corresponding author.E-mail address: [email protected] (J. MacMahan).
0025-3227/$ – see front matter. Published by Elsevierdoi:10.1016/j.margeo.2009.09.011
a b s t r a c t
a r t i c l e i n f oArticle history:Received 17 March 2009Received in revised form 18 September 2009Accepted 29 September 2009Available online 18 October 2009
Communicated by J.T. Wells
Keywords:rip currentsurf zoneLagrangianexchange
The accepted view of rip currents is that they are an efficient mechanism for transporting material out of thesurf zone. Previous rip current campaigns on natural beaches have focused on Eulerian measurements withsparse in situ pressure and current meter arrays. Here, for the first time, spatially synoptic estimates of ripcurrent flow patterns, vorticity, and Lagrangian transport behavior are measured in the field using a fleet of30 position-tracking surfzone drifters during multiple rip current occurrences on an open coast beach inMonterey, CA. Contrary to the classic view (Shepard et al., 1941), the rip current flow field consisted of semi-enclosed, large-scale vortices that retained the drifters and resulted in a high number of Lagrangianobservations that are temporally and spatially repeated. Approximately 19% of the drifters deployed in therip currents exited the surf zone per hour, on average during the experiments. The observed surf zoneretention of drifters is consistent with measurements from different open coast beach rip current systems(14% at meso-macrotidal Truc Vert, France and 16% at macrotidal Perranporth, United Kingdom). The three-hour-average cross-shore rip current velocity at Monterey was 30 cm/s with peak time-averaged velocitiesof 40–60 cm/s depending on wave and tidal conditions. Drifters that episodically exited the surf zone weretransported approximately 2 surf zone widths offshore at ∼20 cm/s.
B.V.
Published by Elsevier B.V.
1. Introduction
Rip currents are seaward-directed flows of water that commonlyoccur on most beaches. They originate close to the shoreline andextend seaward across the surf zone, and beyond (Shepard et al.,1941; Inman and Brush, 1973; Short, 2007). Rip currents play animportant role in dispersing material , such as suspended sediments,bubbles, planktonic organisms, nutrients, humans, and other floatingmaterial, across the surf zone (Shepard et al., 1941; Inman et al., 1971;Inman and Brush, 1973; Talbot and Bate, 1987; Short and Hogan,1994; Johnson and Pattiaratchi, 2004a; Grant et al., 2005; Clarke et al.2007; Vagle et al., 2001, 2005; Short, 2007; Brown et al., 2009). Inmanand Brush (1973) referred to rip currents as “freeways” that transportmaterial outside the surf zone to the inner-shelf. Rip currents areresponsible for 80% of all surf zone rescues and more than 100fatalities each year in the U.S. [www.usla.org].
Short (1985, 1999, 2007) identifies four types of rip currents:1) accretionary beach rip currents, 2) erosional beach rip currents,3) topographic rip currents, and 4) mega-rips. Accretionary beach ripcurrents are generally fixed in location for days to weeks, whereerosional beach rip currents tend to migrate alongshore. Accretionaland erosional rip currents are classified together herein, as open coastbeach rip currents. Topographic rip currents are systems where theflow is controlled by solid structures such as groins, jetties, headlandsand reefs (Wright et al., 1980; Wind and Vreugdenhil, 1986; Short,2007). The seaward-directed flows occur adjacent to these features.Mega-rips are large-scale topographic rip currents generally associat-ed with small (3–4 km) embayed beaches that form 1–2 rip currentsduring large waves that quickly flush the embayed surf zone (Short,1985, 1999). We include in the mega-rip classification, rip currentscontrolled by offshore controls, such as submarine canyons, duringlargewaves (Shepard and Inman, 1950; Long andOzkan-Haller, 2005).
The Lagrangian surface current behavior for rip-channeled opencoast beaches away from permanent topographic features aredescribed herein. Scott et al. (2007) found that open coast beach ripcurrents occur during normal wave conditions and are the most

Table 1A summary of drifter observations, which include: 1) drifter deployment duration; 2) observed circulation pattern; 3) drifter exits per hour; 4) number of drifters entering a ripcurrent, Rin, relative to the surf zone exits, Sexit; 5) significant wave height, Hmo; 6) mean wave period, Tmo; 7) morphodynamic parameter, Ω, as a function of sediment fall velocity,ws; 8) location of the surfzone edge; and 9) surfzone width.
Year day Drifter duration(h)
Circulation pattern Exits/h(%)
Exits Rin/Sexit(%)
Hmo
(m)Tmo
(s)Ω Surf zone edge
(m)Surf zone width(m)
RCEX—Monterey, California 2007117 3.0 Rip current 22 7 1.4 11.4 3 203 155124 3.4 Rip current 15 6 1.0 13.9 2 172 126125 3.1 Rip current 4 2 1.6 8.5 4 188 140127 3.0 Meandering 28 23 0.9 8.8 2 162 122130 3.0 Meandering 24 16 1.0 9.6 2 162 120135 2.1 Meandering 21 2 0.8 7.8 2 136 90139 2.5 Alongshore 0 6 0.5 6.0 2 137 105
ECORS—Truc Vert, France 200875 3.0 Alongshore 0 0 1.3 11.8 377 2.7 Rip current 34 18 1.5 10.1 379 2.0 Meandering 31 12 1.3 12.3 283 1.0 Alongshore 0 0 2.1 12.1 492 2.5 Rip current 0 0 1.8 11.0 493 3.0 Meandering 0 0 2.3 15.0 394 2.8 Rip current 0 0 1.5 11.6 395 2.7 Rip current 22 13 0.9 11.4 2
MaTRiX—Perranporth, U.K. 2008215 1.0 No distinct pattern 0 0 0.8 8.3 3 700 152216 2.3 Rip current 19 5 0.8 9.1 2 697 180217 2.7 Rip current 13 3 1.3 7.1 5 698 187218 2.3 Alongshore 0 0 1.3 9.1 4 694 163220 3.5 Alongshore 2 2 0.9 9.1 3 675 157
Fig. 1. a) Significant wave height, Hmo b) mean wave period, Tmo and c) mean wave direction, θmo, at 13 mwater depth. d)Wind speed,ws and e) direction, θwind, at Del Monte (3 kmsouth of the experimental site). f) Tidal elevation from NOAA tidal station in Monterey harbor (6 km south of the experimental site). Shaded regions represent times of drifterdeployments.
2 J. MacMahan et al. / Marine Geology 268 (2010) 1–15

3J. MacMahan et al. / Marine Geology 268 (2010) 1–15
commonly observed rip current types. These open coast beach ripcurrents are generally coupled to an underlying morphologycharacterized by deeper, cross-shore oriented rip channels incisedin shallower shore-connected shoals or bars (Brander, 1999; Branderand Short, 2000; Sonu, 1972; MacMahan et al., 2006; Short, 2007;amongst others). On beaches with these morphologically-coupled ripcurrents, the alongshore bathymetric variation creates alongshorevariations in depth-limited wave breaking that induce alongshoregradients in pressure and momentum driving water from the shore-connected shoals toward the rip channels (Bowen, 1969; Dalrymple,1978). Wave-driven onshore flows over the shore-connected shoalsor bars transition to alongshore flows (feeder currents) near theshoreline that converge in the rip channel and become cross-shore, ripcurrent flows. The strong narrow rip current flow has traditionallybeen assumed to shoot beyond the break point and terminate welloffshore of the surf zone (Shepard et al., 1941; Inman and Brush,1973). However, the spatially synoptic rip current flow pattern hasnot been tested in the field to date.
The dimensions of the surf zonewidth and rip channel spacing for amorphologically-controlled rip current system, have made it costlyand difficult to obtain spatially synoptic velocity measurements usingonly fixed instrumentation, thus reducing the likelihood of capturingthe synoptic circulation pattern without the aid of a numerical model(Chen et al., 1999; Haas et al., 2003; Schmidt et al., 2005; Castelle et al.,2007; Reniers et al., 2007). In addition, influences of adjacent ripcurrent cells (Reniers et al., 2007) or alongshore flow patterns have
Fig. 2. Three video cameras overlooking the experiment site were mounted on a tower 18.2limited wave breaking from which morphologic beach patterns can be inferred (Lippmann abathymetric surveys (MacMahan et al., 2005). Depth-limited wave breaking occurs on the bwave breaking. Time-averaged rectified video images obtained during drifter deployments foYeardays located in upper right-hand corner of images. All images were obtained at 1700 G
traditionally been overlooked. To overcome the constraints ofdeploying stationary instrument arrays, both shore-observed dye(Inman et al., 1971; Sonu, 1972; Huntley et al., 1988; Talbot and Bate,1987; Brander, 1999; Brander and Short, 2001) and a few shore-observed drifters (Shepard et al., 1941; Shepard and Inman, 1950;Sonu, 1972; Huntley et al., 1988; Brander and Short, 2001) werevisually tracked to elucidate Lagrangian rip current flow behavior. Todate, only Talbot and Bate (1987) have qualitatively evaluatedpotential surf zone retention of rip currents by tracking dye. Thus,while commonly accepted, the traditional paradigm of cross-shoreexchange of water by open coast rip current systems has yet to bethoroughly examined and quantified.
Recent improvements in position accuracy and reductions in size ofGlobal Positioning Systems (GPSs) have enabled the development ofself-tracking surfzone drifters (Schmidt et al., 2003; Schmidt et al.,2005; Johnson et al., 2003; Johnson and Pattiaratchi, 2004b). Johnsonand Pattiaratchi (2004a) described the Lagrangian statistics associatedwith a transient rip current head using 4 drifters. Schmidt et al., 2003,2005, using 3–4 drifters, found coherent horizontal motions related tobathymetric irregularities,where a fewdrifterswould travel in circularpaths before exiting the surf zone. However, the number of GPSdrifters was limited by the high cost of each unit. Overhead videotracking of O(100) drifters in laboratory provided more detailedquantitative maps of rip current flow patterns (Kennedy and Thomas,2004), but this technique is not practical in the field with obliquelooking cameras whose pixel resolution requires large-size drifters to
m above the mean sea level. Rectified time-averaged images depict variations in depth-nd Holman 1989). The rectified time-averaged intensity images compare well with thear outlining shallow regions, while the deeper sections of the rip channel have minimalr when waves were greater than 1 m (a), approximately 1 m (b), and less than 1 m (c).MT.

4 J. MacMahan et al. / Marine Geology 268 (2010) 1–15
be observed. MacMahan et al. (2009) re-engineered inexpensive GPSunits that resulted in a drastic cost reduction for accurate positionestimates allowing for the first time the cost-effective opportunity todeploy a fleet of drifters to obtain synoptic Lagrangian surf zonemeasurements.
Lagrangian information is ideal for many applications as itdescribes the particle pathways of material transport for varyingspatial and temporal scales over a broad horizontal region. Here,observations of 30 surfzone drifters deployed in a natural rip currentsystem are used to answer the question “How is material transportedby surface currentswithin the surf zone of an open coast rip-channeledbeach”? This study describes the methods and results associated withLagrangian observations obtained during rip current experiments in arange of surfzone environments at Monterey, California, Truc Vert,France, and Perranporth, United Kingdom. These observations weremade to specifically test traditionally accepted views of rip currentcirculation.
2. Field sites
In the following, the Monterey, CA, experiment is described indetail. Truc Vert, France, and Perranporth, United Kingdom, experi-
Fig. 3. Drifter position and speed (the color of the line represents speed) tracks for drifter deBathymetric contours are plotted in the background in gray. The color bar at the top repres
ments have been described elsewhere and their relevant observations,and are included to generalize the results and conclusions discussedherein.
2.1. Monterey, CA
A rip current field experiment (RCEX) was performed in late Apriland early May, 2007, at Sand City, Monterey, California. The site wasselected owing to its year round persistent rip currents formed by nearshore-normal incident waves (MacMahan et al., 2005; Thornton et al.,2007) and existing knowledge from previous experiments (RIPEX2001) (MacMahan et al., 2004a,b, 2005, 2006; Reniers et al., 2006,2007; Thornton et al., 2007). The foreshore of the beach is relativelysteep (1:10) flattening out to a low-tide terrace (1:100) with quasi-periodic, O(125 m), incised rip channels, continuing with a 1:30offshore slope, representative of a transverse barred beach asdescribed by the Wright and Short (1984) morphodynamic model.The morphodynamic parameter, Ω=Hmo/(Tpws), has been used todescribe beach states that are associatedwith rip currents (Wright andShort, 1984; Short, 1985), and ranges from 2 to 4 for RCEX (Table 1)where Hmo is the significant wave height, Tp is the peak period, andws
is the fall velocity based on the mean grain size of 0.35 mm. Beaches
ployments on yeardays 117 (a), 124 (b), 125 (c), 127 (d), 130 (e), 135 (f), and 139 (g).ents drifter speed. Note that there are different alongshore scales.

Fig. 3 (continued).
5J. MacMahan et al. / Marine Geology 268 (2010) 1–15
with values 2bΩb6 are classified as open coast beach rip currentsystems. Monterey is located in a mesotidal setting (∼2 m tidal rangeat spring tides). Amore detailed description of the field site is given byMacMahan et al. (2005).
2.2. Truc Vert, France and Perranporth, United Kingdom
In 2008, surfzone drifterswere deployed on two additional beachesthat have commonly-occurring rip currents: 1) Truc Vert, France, and2) Perranporth, United Kingdom. Truc Vert is characterized by atransverse bar and rip system within the intertidal zone, which hasalongshore rip channel spacing of 300–400 m (Castelle et al., 2007).Themean grain size was 0.35 mm. Themorphodynamic parameter,Ω,ranges from 2 to 4, corresponding to an open coast beach rip currentsystem (Short, 2007). An outer subtidal cresentic bar with O(1000 m)wavelength is present farther offshore (see Castelle et al., 2007 foradditional details). Truc Vert is located in a meso-macrotidal setting(∼4 m tidal range at spring tide).
Perranporth is characterized as an open coast rhythmic bar and ripmorphology, which hadwavelengths of 300–400 m and amplitudes of1.5–2 m. The mean grain size was 0.30 mm (see Scott et al., 2007 forfurther site details). The Ω ranged from 2 to 5, again corresponding toan open coast beach rip current system. Perranporth is located in amacrotidal setting (∼5 m tidal range at spring tides).
3. Experiment at Monterey, California
3.1. Wave and bathymetric observations
Significant wave height (Hmo,13m), mean wave period, and meanwave directionweremeasured by an acoustic Doppler current profiler(ADCP) deployed in 13 m water depth 380 m from the shoreline(Fig. 1). The ADCP was cabled to a shore-based data acquisitionsystem and continuously sampled at 1 Hz.
Bathymetric surveys were performed using a survey-grade GPSmounted on a sonar-equipped personal watercraft, PWC (MacMahan,2001). At high tides and low wave energy conditions, the PWCtraversed from offshore to the outer edge of the transverse bars andwithin the rip channels. At low tides, the transverse bars and feederchannels were surveyed by a walking person carrying the GPS housedin a water-tight back-pack. The beachface and foredune weresurveyed with the GPS mounted on an all-terrain vehicle. Bathymetryis referenced to mean sea level (MSL). Bathymetric surveys wereperformed on yeardays 112, 121, 131, and 138.
3.2. Surfzone drifter and deployments
The drifters are described in detail by MacMahan et al. (2009) andconsist of a 0.7 m long by 0.03 m diameter PVC mast upon which a

Fig. 4. Conceptual circulation patterns for an open coast rip-channeled beach for a) asymmetric rip current, b) an asymmetric rip current, and c) sinuous alongshore current.Black lines represent the velocity flow field, gray lines are the bathymetric contours,and gray sine wave is location of the surf zone where wave breaking begins.
6 J. MacMahan et al. / Marine Geology 268 (2010) 1–15
small GPS antenna is mounted. The mast is attached to a 0.25 m longby 0.1 m diameter submerged PVC tube with external fins for sail areaand contained ballast material. The surfzone drifters were designed tominimize surfing in the breaking waves and were shown to closelyfollow simultaneous release of dye. The GPS unit is housed in a water-proof box attached to themast just above thewater line. The GPS unitsinternally record carrier phase information at the maximum samplingfrequency of 0.5 Hz and are therefore post-processed to give anaccuracy of b40 cm in position and b1 cm/s in velocity (MacMahanet al., 2009).
Surfzone drifters were deployed during a variety of wave and tideconditions. Depending on the field conditions, the number of driftersdeployed ranged from 16 to 27 and was deployed in clusters rangingfrom 4 to 16 drifters.When drifters exited the pre-defined study region,they were removed from the ocean and re-deployed in another cluster.The number of clusters deployed on a given day was dependent uponflow behavior. The drifter clusters were generally released in theprimary rip channel, but occasionally deployed in neighboring channelsdepending on the flow patterns. Drifter deployments occurred everyfew days during a field experiment providing observations over a rangeof tidal elevations and wave conditions. The position data were qualitycontrolled to remove erroneous points, and gaps in the time serieswere interpolated, consistent with surfzone drifter observations bySpydell et al. (2007).
There were seven ∼3-hour surf zone drifter deployments over thecourse of the experiment (Table 1). All deployments took place in themorning to avoid adverse windage effects from diurnal afternoon seabreezes (Fig. 1). Typical wind speeds during drifter deployments wereapproximately 1 m/s with a maximum of 6 m/s. Assuming windslippage similar to that of Murray, (1975), who used a similar drifterwith a longer mast of the same diameter, the maximum bias error forthe experiment is estimated at 0.01 m/s per m/s of wind (MacMahanet al., 2009).
Hmo,13m was greater than 1 m for the first three deployments onyeardays 117, 124, and 125, approximately 1 m on yeardays 127,130, 135, and less than 1 m on yearday 139. When Hmo,13m N1 m,wave breaking occurs within the rip channel. When Hmo,13m b1 m,there was minimal to no wave breaking in the rip channel. The surfzone edge is defined as the seaward extent of wave breaking asdetermined from rectified time-averaged video images (Fig. 2). Theaverage surf zone edge for all rip current days occurred aroundy=180 m, which coincides with where the steeper offshore slopetransitions to the flatter low-tide terrace bar. For Hmo,13m N1 m andHmo,13m ∼1 m, the surf zone width (Xs) is computed from shorelineto the outer edge of the breaking region in the rip channel (Table 1).For Hmo,13m b=1, Xs is computed from the shoreline to the outeredge of wave breaking on the shore-connected shoal. The averagesurf zone width was Xs∼135.
4. Synoptic rip current drifter observations
4.1. Rip current Lagrangian paths
The drifter positions were transformed to local cross-shore (x) andalongshore (y) coordinates. The drifter paths for all drifters deployedduring RCEX for each day are plotted in Fig. 3. Drifters were typicallyreleased at y=∼60, x=∼75m within a rip channel. Two basiccirculation patterns were observed for an open coast rip-channeledbeach: 1) rip current and 2) sinuous alongshore current (Table 1).Conceptual circulation patterns are shown in Fig. 4 to highlight thedifferences in the observed drifter-derived flow patterns. Two typesof rip current circulation patterns were observed: 1) symmetric and2) asymmetric. The symmetric rip current has two opposing circulationcells that equally occupy half of the shore-connected shoal and ripchannel, whereas the asymmetric rip current occupies one rip channeland one shore-connected shoal (Fig. 4). Rip current circulation patterns
were observed when Hmo,13m N1 m (yeardays 117, 124 and 125). Thedrifters moved in circular patterns coupled with the underlying. A ripcurrent circulation has two rip current vortices located betweenadjacent rip channels. Some drifters moved to neighboring rip currentsystems and a few drifters moved offshore.
When Hmo,13m decreased, drifters meandered alongshore in asinuous pattern coupled to the underlying morphology (Fig. 3). Thesinuous alongshore current followed the rip channel bathymetry andbore little resemblance to the traditional view of alongshore currents(yearday 139). A combination of rip current and sinuous alongshorecurrent was also observed, which is referred to as ameandering current(yeardays 127, 130 and 135). Drifters in meandering currents roamedup and down the beach, sometimes remaining within a particular ripcurrent cell or migrating to the next rip current cell, but the drifterstended to follow constant isobaths when moving alongshore.
4.2. Surf zone exits
In general, the drifters associated with rip current flow patternswere contained within the surf zone. Episodic rip current bursts

7J. MacMahan et al. / Marine Geology 268 (2010) 1–15
caused an occasional drifter to exit the surf zone, but they weresurprisingly infrequent (Table 1). The highest percentage of driftersexited on yearday 127 and was 28% per hour (weighted by number ofdrifters and length of deployments), which is believed to be related tothe low tide and lower wave energy reducing the morphodynamiccoupling/forcing. The second highest day for escapes was yearday 130(24% per hour) with similar conditions. Both of these days exhibitedmeandering current patterns. Combining the rip current pattern daysand meandering current pattern days, the average number of drifterexits was 19% per hour.
Owing to the small number of surfzone drifter exits, drifter exittracks for all deployments are combined together in Fig. 5. For RCEX, theexiting drifters generally traveled approximately two surf zone widthsoffshore from the shoreline, consistent with observations by Schmidt etal. (2003, 2005). As the focus of the experimentwas directed toward thesurf zone, these drifters were often removed from the ocean after theyexited the surf zone. However, on a few occurrences the drifters exitedthe surf zone and later re-entered the surf zone. There appears to be acrude relationship between the offshore extent and the possibility ofsurf zone re-entrance, which decreases with increasing distanceoffshore. The drifter exits have a range of directions, relative to shore-normal, and it appears that if the drifter exits the surf zonenormal to theshoreline, it travels farther offshore. Though these drifter observationsoutside of the surfzone are limited, they provide useful insight about thebehavior of rip current exits, particularly as amechanism for exchangingmaterial from the surf zone.
The deployment scheme at Truc Vert, France and Perranporth,United Kingdomwas similar to the deployments at Monterey. A rangeof wave height and periods were present at all three sites (Table 1),but note that deployments were limited to Hsb2.5 m, and that drifterswere not deployed during the largest days at Truc Vert where HsN5 mduring the experiment. Rip currents, meandering and alongshorecurrents occurred at all three sites for different days (Table 1).Combining days when rip or meandering currents occurred (exclud-ing alongshore current days for which virtually no exits occurred) theaverage percent drifter exits per hour were 14% for Truc Vert and 16%
Fig. 5. Drifter position and speed (the color of the line represents speed) tracks for drifters thplotted in the background in gray. Color bar plotted to the right representing drifter speed.
for Perranporth (Table 1). The relatively low surfzone drifter exits areconsistent amongst all beaches.
4.3. Synoptic velocity observations
Velocities are calculated using a forward-difference scheme on thedrifter locations. Davis (1991) and Swenson and Niiler (1996) notedthat the velocity statistics calculated from Lagrangian observations aresubject to biases in sample density and temporal intervals. For regionswith high flows, there are limited statistical observations as thedrifters quickly move through the regions, whereas low flow regionshave more observations per unit time. In general, oceanographicdrifters are released in specific regions (O (100 km)) and once theyexit those regions they never return. For the surfzone drifterobservations described herein, the biases are decreased as therotational nature of the rip currents resulted in many Lagrangianobservations that are repeated spatially. For alongshore current flowpatterns, drifters were quasi-continuously (re-) released upstreamand removed downstream, which only biases the end points.Therefore, the density of data is extremely high compared withtypical oceanographic drifter data. Some statistical uncertainty doesremain. Davis (1991) suggested that the spatial averaging area shouldbe much larger than spatial and temporal de-correlation scale of thedominant motions. For the purposes of resolving the synopticsurfzone circulation patterns and corresponding flow characteristics,10 m by 10 m areas (bins) are used. These bins are smaller than thescales of the predominant flow field (i.e. the circular pattern aroundthe entire surf zone).
Each drifter was considered an independent observation when in aparticular defined bin. If the drifter re-entered the same bin, it wasconsidered a new independent observation if tN lg /U had elapsed,where lg is the length of the bin (10 m) and U is the average speed inthe bin for all drifter observations, i.e. the drifter had traveled adistance greater than the length of the bin. For rip current circulationpatterns, drifters generally looped back into the same bin after∼5 min. Only bins with at least 5 independent velocity observations
at exited the surf zone for all seven deployments during RCEX. Bathymetric contours are

Fig. 6. Color represents total number of independent observations for 10 m by 10 m bins with greater than five independent observations for yeardays 117 (a), 124 (b), 125 (c), 127(d), 130 (e), 135 (f), and 139 (g). Bathymetric contours are plotted in the background in gray. The color bar at the top represents the total number of independent drifterobservations. Note that there are different alongshore scales.
8 J. MacMahan et al. / Marine Geology 268 (2010) 1–15
(degrees of freedom) are included as being statistically reliable, whichis consistent with Spydell et al. (2007) The total number ofindependent observations for each bin is plotted in Fig. 6 for theexperiment area. Most of the statistically reliable observations arewithin the surf zone for rip currents (yeardays 117, 124, and 125).When the wave energy decreases (yeardays 127 and 130), the flowpattern becomes more disorganized (decoupled from the morphol-ogy) and drifter observations are more spread out.
The velocity data are binned by location and averaged over thedeployment duration, typically 3 h, for each day to obtain a synopticview of the flow pattern (Fig. 7). For the first time, a synopticcirculation pattern of a rip current is observed in the field. Also shownin Fig. 7 is vorticity which is discussed below. Rip currents have amean offshore flowing current located near the center of the shore-
normal rip channel. Near the outer edge of the surf zone, the currentturns in the alongshore direction, just shoreward of the breakerregion. Near the center of the shore-connected shoal the current turnsagain and starts flowing shoreward. The onshore current turnsparallel to the shoreline and then flows back towards the rip channel,completing a quasi-continuous loop. For an open coast rip-channeledbeach, the rip current flow patterns represent surf zone eddies limitedby the surfzone width and rip channel spacing. Faster velocities occuralong the outer edges of the rotational elements, with the slowestvelocities occurring near the eddy centers. As suggested by thespaghetti plots (Fig. 3a, b, and c), the eddies are coherent rotationalelements and are contained within the surf zone, with the eddycenters located between x=77–125. When the waves becamesmaller (Fig. 3d and e), the alongshore sinuous flow pattern is

9J. MacMahan et al. / Marine Geology 268 (2010) 1–15
observed coupled to the underlying morphology. The large surf zoneeddies no longer exist, but smaller rotational elements located nearthe edge of the rip channels are observed.
4.4. Drifter cross-shore velocity distribution
The average cross-shore distributions of cross-shore velocitiesobtained down the center of multiple rip channels for each drifterdeployment are shown in Fig. 8 (top). The average of all rip currentvelocities within the surf zone is 0.3 m/s (solid black line) with peakvelocities between 0.4 and 0.65 m/s. The strongest velocities are onyearday 127, which corresponds to the deployment at the lowest tide.The high tide deployments on yeardays 117 and 135 show the slowestvelocities, with peak velocities of ∼0.4 m/s, consistent with previousobservations of rip current tidal modulation (Brander, 1999; amongstothers). The velocities achieve a maximum in the middle of the surfzone and decay to the outer edge of the surf zone. Slightly seaward ofthe surf zone, negative velocities are indicated by occasional weakonshore drifter movement associated with Stokes drift near wavebreaking. Seaward of the surf zone there are occasional large values ofcross-shore velocity extending approximately two surf zone widths.Offshore, it is hypothesized that drifters that exit the surf zone arecaught in rip current pulsations (or surf zone squirts, Smith and
Fig. 7. Drifter velocity data are sorted into 10 m by 10 m bins and averaged over the deploym139 (g). Vectors are shown only for bins with greater than five independent observationsrepresents vorticity estimated from velocity observations. Bathymetric contours are plottedthere are different alongshore scales.
Largier, 1995; Reniers et al., 2007). These drifters exit the surf zone atapproximately 0.2 m/s and move approximately two surf zone widthsoffshore. However, the low number of drifter observations per square-meter offshore of the surf zone (Fig. 8) reduces the significance of theoffshore observations. The large number of drifter observations withinthe surf zone (Fig. 8) supports the notion that surf zone retention (ofwater, drifters, sediments, pollutants, humans, etc.) is high. The drifternumbers decrease at around 1.25 surf zonewidths,whichwe believe isthe true location of the outer boundary of the semi-enclosed system.
4.5. Lagrangian drifter mass balance
MacMahan et al. (2005) tried to evaluate the mass balance with anumber of single-point Eulerian observations, which resulted in alarge amount of scatter. The difficultly in this approach is related tothe paucity of spatial coverage compared with the large rip currentcirculation shear (Fig. 7), potential rip current asymmetry (e.g. Figs. 4and 7), and potential Eulerian and Lagrangian volume flux mis-matches (Kennedy and Thomas, 2004).
The cross-shore volume exchange of water is evaluated using theLagrangian velocities in the middle of the surf zone. The Lagrangianvolumetric flow rate Q for yearday 124 is computed for an alongshoretransect as Q=uh ∙Δy, where u is the cross-shore velocity for a bin, Δy
ent duration (∼3 h) for yeardays 117 (a), 124 (b), 125 (c), 127 (d), 130 (e), 135 (f), and(Fig. 6). The red arrows in the upper right-hand corner provide vector scales. Colorin the background in gray. Vorticity color scale plotted at the top the right. Note that

Fig. 7 (continued).
10 J. MacMahan et al. / Marine Geology 268 (2010) 1–15
is the alongshore bin spacing, and h is the water depth at the bincenter. A spatially averaged alongshore transect of the cross-shorevelocities is computed for a given y and averaged from x=80 m andx=110 m, which are used for a volumetric flow calculation. Theconstraint of 5 independent observations is relaxed so that a quasi-continuous alongshore velocity profile can be computed. Thecomputation was performed for 220 mNyN−30 m, a region thatspans three rip channels (Fig. 9). The onshore velocity over the shoalsis of similar magnitude to the offshore velocity in the rip channels,whereas the volumetric transport per unit width is 3 times larger inthe rip channel owing to its deeper depth (Fig. 9). The net dischargesummed over the alongshore transect is near zero, with an error ofless than 5% of the gross discharge (117 m3/s). Similar results wereattained for yeardays 117, 125, and 127 supporting coherent ripcurrent circulations patterns with an average imbalance of about 5%. Ifthe vertical structure of the flow field is uniform, then it would beexpected that the currents measured at the surface by the driftersrepresent the total flow field and the conservation of mass wouldrequire that there be a mass balance. The fact that the measured massbalance is near zero suggests that there is only weak vertical flowstructure and that the drifters represent the flow field within the surfzone well. Furthermore, the surprisingly low imbalance suggests thatexchange of water between the surf zone and inner-shelf is small.
4.6. Rip current vorticity
To date comprehensive kinematic fluid characteristics of thesurfzone motions are non-existent owing to the lack of synopticallyobserved flow fields. The present data set allows us to examine thesecharacteristics in detail. Vorticity is a measure of velocity shear orparcel orientation change without change of parcel area and shape(Molinari and Kirwan, 1975). In addition, this higher order flowestimate is useful for evaluating nearshore numerical model results.The vorticity, Γ, defined as:
Γ =dvdx
− dudy
ð5Þ
is calculated in discrete form using a weighted central-differencemethod defined by:
Γi;j =1Δx
½θðvi + 1;j + 1−vi−1;j + 1Þ + ð1−2θÞðvi + 1;j−vi−1;jÞ
+ θðvi + 1;j−1−vi−1;j−1Þ�−1Δy
½θðui + 1;j + 1−ui + 1;j−1Þ
+ ð1−2θÞðui;j + 1−ui;j−1Þ + θðui−1;j + 1−ui−1;j−1Þ�
ð6Þ

Fig. 8. Cross-shore distribution of cross-shore velocities averaged for three rip channels (top) and corresponding drifter density (bottom) plotted versus cross-shore positionnormalized by surf zone width.
11J. MacMahan et al. / Marine Geology 268 (2010) 1–15
where ui,j and vi,j represent the cross-shore and alongshore velocitiesat point (xi,yj) with xi= iΔx, yj= jΔy, where Δx,Δy=10 and θ=1/3.The statistics of velocity are understood, but the statistics on thegradients in velocity that compose the vorticity calculation are notknown. Therefore, owing to the statistical uncertainty of the spatially-weighted central-difference kinematic estimate of vorticity, a MonteCarlo simulation is performed using the measured mean velocity fieldand randomizing the variations about the mean based on the velocitystandard deviation for each grid cell for yearday 124 (Fig. 10). Twosimulations were performed. The first simulation calculates thevorticity 123 times, which was the average number of independentobservations that composed the nine velocity components for yearday124 and the second simulation is performed 2000 times. The meanstandard deviations on the vorticity are the same 0.019 s−1 for bothMonte Carlo simulations, which indicates the measured vorticityhad sufficient degrees of freedom. The hot and cold mean vorticityestimates are generally larger than the standard deviation.
For rip currents occurring on yeardays 117 (Fig. 7a), 124 (Fig. 7b)and 125 (Fig. 7c), the double rip current cell structure is observed,with the two well-defined cells centered on the main rip channel androtating in opposing directions (warm and cool colors). Maximumabsolute vorticity occurs in the center of the rip current cells. Themeandering rip currents on yeardays 127 (Fig. 7d) and 130 (Fig. 7e)result in the drifters moving over a larger area decreasing the numberof bins with adequate significant independent observation, butvorticity patterns are consistent with the rip current cases.
4.7. Beach safety
The observed semi-enclosed surf zone circulation patterns havesignificant importance to the lifeguard community and to beach-
goers with regard to beach safety. During our rip current drifterdeployments, swimmers were caught in the rip current whilereleasing the drifters. Swimmers would float and ride the circulationpattern back to wading depths on the shore-connected shoal,mimicking the drifter response. Thus, the drifters can be consideredproxies for floating humans. During one of the rip currentcirculation pattern deployments (yearday 124), GPS units wereplaced on several swimmers and they freely floated in the ripcurrent system. An example of one person who floated around a ripcurrent for two revolutions is shown in Fig. 11. The averageswimmer revolution was approximately 7 min, similar to averagedrifter revolution and dye revolutions (MacMahan et al., 2009). Ingeneral, beach-goers are told to “swim parallel” or along theshoreline when pulled into a rip current (www.usla.org). However,the alongshore currents feeding the rip current can be as strong asthe rip current, which can make swimming parallel difficult(Fig. 11). Furthermore, the rip current circulations patterns tendto be biased to one direction indicating that swimming parallel inthe wrong direction could be hazardous. These results suggest that ifthe swimmer remains calm and afloat, they will be returned towading depths within a few minutes. The percentage associatedwith the likelihood that a person would be swept seaward ofthe breakers was computed by estimating the number of driftersentering the rip current relative to the number of drifters exiting thesurf zone. A drifter could enter a rip current either by deployment orre-entering the rip current after completing a revolution. It wasfound to be 10% drifters that entered a rip current exited the surfzone (Table 1). This is different than the percentage of drifters thatexits per hour (Section 4.2). There are times, though infrequent(10%), that swimmers may exit the surf zone. No swimmer exitedthe surf zone during the experiment.
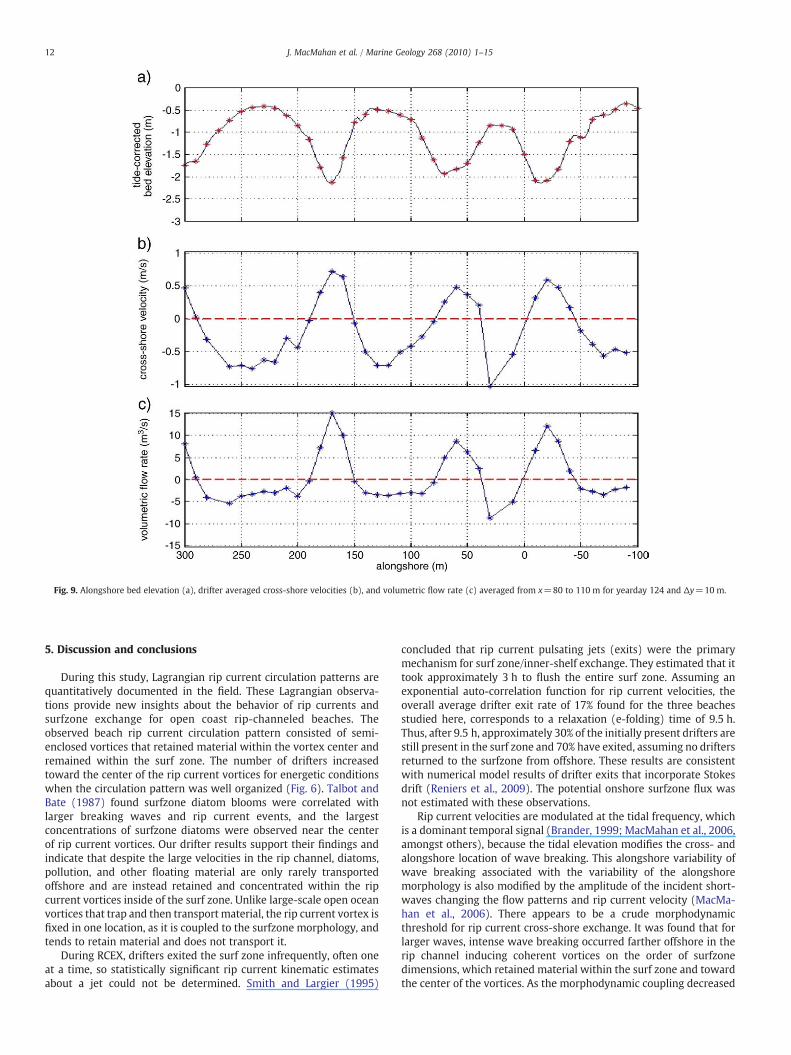
Fig. 9. Alongshore bed elevation (a), drifter averaged cross-shore velocities (b), and volumetric flow rate (c) averaged from x=80 to 110 m for yearday 124 and Δy=10 m.
12 J. MacMahan et al. / Marine Geology 268 (2010) 1–15
5. Discussion and conclusions
During this study, Lagrangian rip current circulation patterns arequantitatively documented in the field. These Lagrangian observa-tions provide new insights about the behavior of rip currents andsurfzone exchange for open coast rip-channeled beaches. Theobserved beach rip current circulation pattern consisted of semi-enclosed vortices that retained material within the vortex center andremained within the surf zone. The number of drifters increasedtoward the center of the rip current vortices for energetic conditionswhen the circulation pattern was well organized (Fig. 6). Talbot andBate (1987) found surfzone diatom blooms were correlated withlarger breaking waves and rip current events, and the largestconcentrations of surfzone diatoms were observed near the centerof rip current vortices. Our drifter results support their findings andindicate that despite the large velocities in the rip channel, diatoms,pollution, and other floating material are only rarely transportedoffshore and are instead retained and concentrated within the ripcurrent vortices inside of the surf zone. Unlike large-scale open oceanvortices that trap and then transport material, the rip current vortex isfixed in one location, as it is coupled to the surfzone morphology, andtends to retain material and does not transport it.
During RCEX, drifters exited the surf zone infrequently, often oneat a time, so statistically significant rip current kinematic estimatesabout a jet could not be determined. Smith and Largier (1995)
concluded that rip current pulsating jets (exits) were the primarymechanism for surf zone/inner-shelf exchange. They estimated that ittook approximately 3 h to flush the entire surf zone. Assuming anexponential auto-correlation function for rip current velocities, theoverall average drifter exit rate of 17% found for the three beachesstudied here, corresponds to a relaxation (e-folding) time of 9.5 h.Thus, after 9.5 h, approximately 30% of the initially present drifters arestill present in the surf zone and 70% have exited, assuming no driftersreturned to the surfzone from offshore. These results are consistentwith numerical model results of drifter exits that incorporate Stokesdrift (Reniers et al., 2009). The potential onshore surfzone flux wasnot estimated with these observations.
Rip current velocities are modulated at the tidal frequency, whichis a dominant temporal signal (Brander, 1999; MacMahan et al., 2006,amongst others), because the tidal elevation modifies the cross- andalongshore location of wave breaking. This alongshore variability ofwave breaking associated with the variability of the alongshoremorphology is also modified by the amplitude of the incident short-waves changing the flow patterns and rip current velocity (MacMa-han et al., 2006). There appears to be a crude morphodynamicthreshold for rip current cross-shore exchange. It was found that forlarger waves, intense wave breaking occurred farther offshore in therip channel inducing coherent vortices on the order of surfzonedimensions, which retained material within the surf zone and towardthe center of the vortices. As the morphodynamic coupling decreased

Fig. 10. Monte Carlo vorticity simulations showing (top) mean vorticity, (middle) standard deviation for 123 runs, which represent the average number of observations composing avorticity estimate for yearday 124, and (bottom) standard deviation for 2000 runs (meanstd is 0.019). Vectors represent deployment averagedvelocities (as in Fig. 7). The red arrows in theupper right-hand corner provide vector scales. Bathymetric contours are plotted in the background in gray. Vorticity color bar plotted at the right.
Fig. 11. Thedotted line represents the track of a humandrifter (floatingwith the current and trackedwith aGPS) on yearday 124 (Table 1). The circles on thedotted line represent locationat each 1 min interval starting at zero (green) and ending at 14 (red). The human drifter made two revolutions, the first is shown in magenta and the second is shown in blue. Vectorsrepresent deployment averaged velocities (as in Fig. 7). The red arrows in the upper right-hand corner provide vector scales. Bathymetric contours are plotted in the background in gray.
13J. MacMahan et al. / Marine Geology 268 (2010) 1–15

Fig. 12. Surfzone drifter exits for rip current (circles), meandering currents (squares), and alongshore currents (triangles) as a function of significant wave height for Monterey, CA(M), Truc Vert, France (T), and Perranporth, United Kingdom (P).
14 J. MacMahan et al. / Marine Geology 268 (2010) 1–15
with decreasing wave height, cross- and alongshore exchangeincreased. As wave energy continued to decrease and the surf zonenarrowed, the flow field became less energetic and floating materialwas retained in the surf zone and only exchanged in the alongshore.
An attempt was made to correlate the percent of drifter exits withthe independent forcing variables of Hmo, Tmo, h, and combinations ofthese variables, including Ω. The only representation that seemedmeaningful is relating drifter exists to wave height (Fig. 12), whichshowed drifter exits are smallest for the largest waves, increasing formoderatewaves, and decreasing again for small waves. Attempts havebeen made to relate rip current length scales to wave forcing,sediment characteristics and tidal elevation (Huntley and Short, 1992;Short and Brander, 1999), but most have failed to find meaningfulcorrelations. Although the wave height parameterization allows a
Fig. 13. Rip current system cross-shore exchange classification. The percentag
qualitative description of the processes within a bounded framework,there was no significant correlation found with these parameterssuggesting more complex relations.
Talbot and Bate (1987) tracked dye concentration plumes anddiatoms and found that the offshore rip current flux and surf zoneflushing varied for different rip current systems. They qualitativelyobserved rip current systems that supported cross-shore exchangeand those that did not and they classified rip currents based on theircross-shore exchange. A modified version of their rip current cross-shore exchange classification system is provided combined with therip current classification by Short (2007) based on the twenty,approximately 3 h, surfzone drifter deployments for three differentbeaches described above (Fig. 13). The classification qualitativelydescribes the potential for rip current exchange for various rip current
e of cross-shore material exchange per hour is provided for each system.

15J. MacMahan et al. / Marine Geology 268 (2010) 1–15
morphologies. There are still many unknowns associated withtopographic rip currents and behavior on near planar beaches thatinclude transient motions and undertow.
Acknowledgements
We extend our appreciation to the many folks who assisted inobtaining drifter data set: Jim Stockel, Rob Wyland, Keith Wyckoff,Ron Cowen, Natalie Lauder, Mark Orzech, Nick Dodd, Jim Lambert, andLance Valenzuela. This work was funded through the Office of NavalResearch Coastal Geosciences Program, Delaware Sea Grant, CaliforniaState Coastal Conservancy, and the National Science Foundation. Thefield experiment, travel support, and staff support (Stockel, Wyland,Wyckoff and Cowen) was provided by ONR #N0001407WR20226 and#N0001408WR20006. Supporting experimental infrastructure (di-rectional wave and video obs) was funded in part by the CaliforniaState Coastal Conservancy as part of the Coastal Ocean CirculationMonitoring Program—Northern California under contract #04-034.MacMahan was supported by ONR contract #N00014-05-1-0154,N00014-05-1-0352, N0001407WR20226, N0001408WR20006, andthe National Science Foundation OCE 0728324. Brown (JW) wassupported by the Delaware Sea Grant, University of Delaware andONR #N0001407WR20226 and #N0001408WR20006. Brown (JA)was supported by the Delaware Sea Grant, University of Delaware andONR #N0001407WR20226 and #N0001408WR20006. Thornton wassupported by ONR # N0001407WR20226. Reniers was supported byONR #N000140710556. MH was funded by Delft University ofTechnology and the Technology Foundation STW, applied sciencedivision of NWO, in the Netherlands, under project number DCB.7908.Gallagherwas supported byONR#N000140510153 and by theNSFOCEADVANCE award# 0340758. Senechalwas supported by ECORS project.We appreciate the valuable comments by Rob Brander and theanonymous reviewer for making this a better manuscript.
References
Bowen, A.J., 1969. Rip currents, 1. Theoretical Investigations. J. Geophys. Res. 74,5467–5478.
Brander, R.W., 1999. Field observations on the morphodynamic evolution of a low-energy rip current system. Mar. Geol. 157, 199–217.
Brander, R.W., Short, A.D., 2000. Morphodynamics of a large-scale rip current system atMuriwai Beach, New Zealand. Mar. Geol. 165, 27–39.
Brander, R.W., Short, A.D., 2001. Flow kinematics of low-energy rip current systems.J. Coast. Res. 17 (2), 468–481.
Brown, J., MacMahan, J.H., Reniers, A., Thornton, E., 2009. Surfzone diffusivity on a RipChanneled Beach. J. Geophys. Res. doi:10.1029/2008JC005158.
Castelle, B., Bonneton, P., Dupuis, H., Senechal, N., 2007. Double bar beach dynamics onthe high-energy meso-macrotidal French Aquitanian coast: a review. Mar. Geol.245, 141–159.
Chen, Q., Dalrymple, R.A., Kirby, J.T., Kennedy, A.B., Haller, M.C., 1999. Boussinesqmodeling of a rip current system. J. Geophys. Res. 104, 20,617–20,637.
Clarke, L., Ackerman, D., Largier, J., 2007. Dye dispersion in the surfzone: measurementsand simple models. Cont. Shelf Res. 27, 650–669.
Davis, R.E., 1991. Observing the general-circulation with floats. Deep-Sea Res. 38,S531–S571.
Dalrymple, R.A., 1978. Rip currents and their causes. Coastal Engineering 1978:Proceedings of the 16th International Conference. Am. Soc. Civ. Eng, New York, pp.1414–1427.
Grant, S., Kim, J., Jones, B., Jenkins, S., Wasyl, J., 2005. Surf zone entrainment, along-shore transport, and human health implications of pollution from tidal outlets.J. Geophys. Res. 110. doi:10.1029/2004JC002401.
Haas, K.A., Svendsen, I.A.,Haller,M.C., Zhao,Q., 2003.Quasi-three-dimensionalmodeling ofrip current systems. J. Geophys. Res. 108 (C7), 3217. doi:10.1029/2002JC001355.
Huntley, D.A., Hendry, M.D., Haines, J., Greenidge, B., 1988. Waves and rip currents on aCaribbean pocket beach, Jamaica. J. Coast. Res. 4, 69–79.
Huntley, D.A., Short, A.D., 1992. On the spacing between observed rip currents. Coast.Eng. 17 (23), 211–225.
Inman, D., Tait, R., Nordstrom, C., 1971. Mixing in the surf zone. J. Geophys. Res. 26,3493–3514.
Inman, D.L., Brush, B.M., 1973. Coastal challenge. Science 181, 20–32.Johnson, D., Stocker, R., Head, R., Imberger, J., Pattiaratchi, C., 2003. A compact, low-cost
GPS drifter for use in the oceanic nearshore zone, lakes, and estuaries. J. Atmos.Ocean. Technol. 20, 1880–1884.
Johnson, D., Pattiaratchi, C., 2004a. Transient rip currents and nearshore circulation on aswell-dominated beach. J. Geophys. Res. 109. doi:10.1029/2003JC001798.
Johnson, D., Pattiaratchi, C., 2004b. Application, modeling and validation of surfzonedrifters. Coast. Eng. 51, 455–471.
Kennedy, A.B., Thomas, D., 2004. Drifter measurements in a laboratory rip current.J. Geophys. Res. 109, C08005. doi:10.1029/2003JC001927.
Lippmann, T.C., Holman, R.A., 1989. Quantification of sand bar morphology: a videotechnique based on wave dissipation. J. Geophys. Res. 94, 995–1011.
Long, J.W., Ozkan-Haller, H.T., 2005. Offshore controls on nearshore rip currents.J. Geophys. Res. 110, C12007. doi:10.1029/2005JC003018.
MacMahan, J., 2001. Hydrographic surveying from a personal watercraft. J. Surv. Eng.127 (1), 12–24.
MacMahan, J., Reniers, A.J.H.M., Thornton, E.B., Stanton, T., 2004a. Infragravity ripcurrent pulsations. J. Geophys. Res. 109, C01033. doi:10.1029/2003JC-002068.
MacMahan, J.H., Reniers, A.J.H.M., Thornton, E.B., Stanton, T.P., 2004b. Surf zone eddiescoupled with rip current morphology. J. Geophys. Res. 109, C07004. doi:10.1029/2003JC002083.
MacMahan, J., Thornton, E.B., Stanton, T.P., Reniers, A.J.H.M., 2005. RIPEX: observationsof a rip current system. Mar. Geol. 218, 113–134.
MacMahan, J.H., Thornton, E.B., Reniers, A.J.H.M., 2006. Rip current review. Coast. Eng.53, 191–208. doi:10.1016/j.coastaleng.2005.10.009.
MacMahan, J., Brown, J., Thornton, E.B., 2009. Low-cost handheld Global PositioningSystems for measuring surf zone currents. J. Coastal Res. doi:10.2112/08-1000.
Molinari, R., Kirwan, A.D., 1975. Calculations of differential kinematic properties fromLagrangian observations in western Caribbean Sea. J. Phys. Ocean. 5, 483–491.
Murray, S.P., 1975. Trajectories and speeds of wind-driven currents near coast. J. Phys.Ocean. 5, 347–360.
Reniers, A.J.H.M., MacMahan, J., Thornton, E.B., Stanton, T.P., 2006. Modellinginfragravity motions on rip-channel beach. Coast. Eng. 53, 209–222.
Reniers, A., MacMahan, J., Thornton, E.B., Stanton, T.P., 2007. Modeling of very lowfrequency motions during RIPEX. J. Geophys. Res. doi:10.1029/2005JC003122.
Reniers, A.,MacMahan, J., Thornton, E.B., Stanton, T.P., Henriquez,M., Brown, J.W., Brown, J.A., Gallagher, E., 2009. Surfzone retention on a rip channeled beach. J. Geophys. Res.114, C10010. doi:10.1029/2008JC005153.
Schmidt, W.E., Woodward, B.T., Millikan, K.S., Guza, R.T., Raubenheimer, B., Elgar, S.,2003. A GPS-tracked surf zone drifter. J. Atmos. Ocean. Technol. 20, 1069–1075.
Schmidt, W.E., Guza, R.T., Slinn, D.N., 2005. Surf zone currents over irregularbathymetry: drifter observations and numerical simulations. J. Geophys. Res. 110,C12015. doi:10.1029/2004JC002421.
Scott, T., Russell, P., Masselink, G., Wooler, A., Short, A., 2007. Beach rescue statistics andtheir relation to nearshore morphology and hazards: a case study for southwestEngland. Proceedings of the 9th International Coastal Symposium, 1 – 6, Gold Coast,Australia: Journal of Coastal Research, p. SI 50. ISSN 0749.0208.
Shepard, F.P., Inman, D.L., 1950. Nearshore circulation related to bottom topographyand wave refraction, Eos Trans. AGU 31, 555–565.
Shepard, F.P., Emery, K.O., La Fond, E.C., 1941. Rip currents: a process of geologicalimportance. J. Geol. 49, 337–369.
Short, A.D., 1985. Rip-current type, spacing and persistence, Narrabeen Beach. Australia.Mar. Geol. 65, 47–71.
Wave-dominated beaches. In: Short, A.D. (Ed.), Beach and Shoreface Morphodynamics.John Wiley & Sons, Chichester, pp. 173–203.
Short, A.D., 2007. Australian rip systems—friend or foe. (Proceedings of the 9thInternational Coastal Symposium), 7 – 11, Gold Coast, Australia: J. Coast. Res. , p. SI50. ISSN 0749.0208.
Short, A.D., Brander, R., 1999. Regional variations in rip density. J. Coast. Res. 15 (3),813–822.
Short, A.D., Hogan, C.L., 1994. Rip currents and beach hazards, their impact on publicsafety and implications for coastal management. In: Finkl, C.W. (Ed.), CoastalHazards: J. Coast. Res., Special Issue, vol. 12, pp. 197–209.
Smith, J.A., Largier, J.L., 1995. Observations of nearshore circulation—rip currents.J. Geophys. Res. 100, 10967–10975.
Sonu, C.J., 1972. Field observation of nearshore circulation and meandering currents.J. Geophys. Res. 77, 3232–3247.
Spydell, M., Feddersen, F., Guza, R., Schmidt, W., 2007. Observing surf-zone dispersionwith drifters. J. Phys. Ocean. 37 (12), 2920–2939.
Swenson, M.S., Niiler, P.P., 1996. Statistical analysis of the surface circulation of theCalifornia Current. J. Geophy. Res. 101, 2263122645.
Talbot, M.M., Bate, G.C., 1987. Rip current characteristics and their role in the exchangeof water and surf diatoms between the surf zone and nearshore. Estuar. Coast. ShelfSci. 25 (6), 707–720.
Thornton, E.B., MacMahan, J., Sallenger, A.H., 2007. Rip currents, mega-cusps, anderoding dunes. Mar. Geol. 240 (1–4), 151–167. doi:10.1016/j.margeo.2007.02.018.
Vagle, S., Farmer, D.M., Deane, G.B., 2001. Bubble transport in rip currents. J. Geophys.Res. 106, 11677–11689.
Vagle, S., Chandler, P., Farmer, D.M., 2005. On the dense bubble clouds and near bottomturbulence in the surf zone. J. Geophys. Res. 110, C09018. doi:10.1029/2004JC002603.
Wind, H.G., Vreugdenhil, C.B., 1986. Rip-current generation near structures. J. FluidMech. 171, 459–476.
Wright, L.D., Coffey, F.C., Cowell, P.J., 1980. Nearshore Oceanography and Morphody-namics of the Broken Bay–Palm Beach Region, N.S.W.: implications for offshoredredging. Coastal Studies Unit. Dept. of Geography, University of Sydney, p. 208.
Wright, L.D., Short, A.D., 1984. Morphodynamic variability of surf zones and beaches—asynthesis. Mar. Geol. 56, 93–118.
Copyright © 2022 FDOKUMEN