MCPH1 regulates the neuroprogenitor division mode by coupling the centrosomal cycle with mitotic...
23
ARTICLES MCPH1 regulates the neuroprogenitor division mode by coupling the centrosomal cycle with mitotic entry through the Chk1–Cdc25 pathway Ralph Gruber 1,4 , Zhongwei Zhou 1,5 , Mikhail Sukchev 1,5 , Tjard Joerss 1 , Pierre-Olivier Frappart 2 and Zhao-Qi Wang 1,3,6 Primary microcephaly 1 is a neurodevelopmental disorder caused by mutations in the MCPH1 gene, whose product MCPH1 (also known as microcephalin and BRIT1) regulates DNA-damage response. Here we show that Mcph1 disruption in mice results in primary microcephaly, mimicking human MCPH1 symptoms, owing to a premature switching of neuroprogenitors from symmetric to asymmetric division. MCPH1-deficiency abrogates the localization of Chk1 to centrosomes, causing premature Cdk1 activation and early mitotic entry, which uncouples mitosis and the centrosome cycle. This misorients the mitotic spindle alignment and shifts the division plane of neuroprogenitors, to bias neurogenic cell fate. Silencing Cdc25b, a centrosome substrate of Chk1, corrects MCPH1-deficiency-induced spindle misalignment and rescues the premature neurogenic production in Mcph1-knockout neocortex. Thus, MCPH1, through its function in the Chk1–Cdc25–Cdk1 pathway to couple the centrosome cycle with mitosis, is required for precise mitotic spindle orientation and thereby regulates the progenitor division mode to maintain brain size. Genetic evolution studies indicate that the primary microcephaly (MCPH ) genes have undergone a strong positive selection in the human evolutionary lineage, which has had a great impact on brain enlargement 1–3 . Human primary microcephaly (MCPH, OMIM 251200) is a neurodevelopmental disorder characterized by a severely decreased cerebral cortex that is otherwise architecturally normal 4,5 . So far, seven genes responsible for the various subtypes of MCPH have been identified: MCPH1 (microcephalin), WDR62, CDK5RAP2, CEP152, ASPM, CENPJ and STIL (ref. 5). Interestingly, all MCPH gene products seem to associate with proteins in the cytoskeletal control of the mitotic apparatus, such as centrosomes or mitotic spindle poles 5–8 . MCPH1 patients exhibit microcephaly at birth and mild mental retardation in adulthood, without apparent neurological behaviour anomalies 4 . A hallmark of MCPH1 patient cells is premature chromosome condensation (PCC) and the MCPH1 locus is allelic to the human PCC syndrome 9,10 (OMIM 606858). The MCPH1 gene encodes MCPH1, a centrosome component that specifically interacts with condensin II (refs 11–13). MCPH1 has been implicated in ATM- and ATR-mediated DNA-damage response (DDR) and homologous recombination repair, as well as cell-cycle checkpoints 11,14–17 . MCPH1 1 Leibniz Institute for Age Research—Fritz Lipmann Institute (FLI), Beurtenbergstrasse 11, 07745 Jena, Germany. 2 Institute of Molecular Cell Biology, Centre for Molecular Biomedicine (CMB), Hans-Knöll-Strasse 2, 07745 Jena, Germany. 3 Faculty of Biology and Pharmacy, Friedrich Schiller University of Jena, Beurtenbergstrasse 11, 07745 Jena, Germany. 4 Present address: Cancer Research UK—London Research Institute, 44 Lincoln’s Inn Fields, London WC2A 3LY, UK. 5 These authors contributed equally to this work. 6 Correspondence should be addressed to Z-Q.W. (e-mail: zqwang@fli-leibniz.de) Received 27 January 2011; accepted 11 August 2011; published online 25 September 2011; DOI: 10.1038/ncb2342 interacts with the chromatin remodelling complex SWI–SNF in response to DNA damage 18 and participates in E2F1-mediated transcription of DNA-repair genes 19 . The MCPH1 disorder may be caused by neuronal attrition through DNA-damage-induced apoptosis during neurogenesis, because mutations in key DDR genes, ATM, ATR, MRE11 and NBS1, cause ataxia telangiectasia, ATR-Seckel syndrome, A–T-like disorder and Nijmegen-breakage syndrome, respectively, all of which feature in microcephaly or neurodegeneration phenotypes 20 . Of note, mutations in a centrosomal protein, pericentrin, have been found to cause another microcephaly syndrome (Pericentrin–Seckel syndrome), in which the ATR–Chk1 pathway is defective 21 . The microcephaly of MCPH1 patients may also reflect a disturbance in the mode of neuroprogenitor divisions, which modulates the neuron numbers of developing brains 5,22 . A change in division mode, for example, switching from symmetric to asymmetric cell division, is anticipated to decrease total neuron cell number and ultimately the cerebral cortex size 23,24 . The MCPH1 deficiency causes a wide range of cellular defects in DNA-damage repair, centrosome localization of proteins, cell-cycle progression and abnormal spindles, as well as chromatin remodelling (see ref. 5 for a review). However, how MCPH1 deficiency causes the microcephaly phenotype of MCPH1 patients NATURE CELL BIOLOGY VOLUME 13 | NUMBER 11 | NOVEMBER 2011 1325 © 2011 Macmillan Publishers Limited. All rights reserved.
-
Upload
independent -
Category
Documents
-
view
1 -
download
0
Transcript of MCPH1 regulates the neuroprogenitor division mode by coupling the centrosomal cycle with mitotic...

ART I C L E S
MCPH1 regulates the neuroprogenitor division modeby coupling the centrosomal cycle with mitotic entrythrough the Chk1–Cdc25 pathwayRalph Gruber1,4, Zhongwei Zhou1,5, Mikhail Sukchev1,5, Tjard Joerss1, Pierre-Olivier Frappart2
and Zhao-Qi Wang1,3,6
Primary microcephaly 1 is a neurodevelopmental disorder caused by mutations in the MCPH1 gene, whose product MCPH1 (alsoknown as microcephalin and BRIT1) regulates DNA-damage response. Here we show that Mcph1 disruption in mice results inprimary microcephaly, mimicking human MCPH1 symptoms, owing to a premature switching of neuroprogenitors from symmetricto asymmetric division. MCPH1-deficiency abrogates the localization of Chk1 to centrosomes, causing premature Cdk1 activationand early mitotic entry, which uncouples mitosis and the centrosome cycle. This misorients the mitotic spindle alignment andshifts the division plane of neuroprogenitors, to bias neurogenic cell fate. Silencing Cdc25b, a centrosome substrate of Chk1,corrects MCPH1-deficiency-induced spindle misalignment and rescues the premature neurogenic production in Mcph1-knockoutneocortex. Thus, MCPH1, through its function in the Chk1–Cdc25–Cdk1 pathway to couple the centrosome cycle with mitosis, isrequired for precise mitotic spindle orientation and thereby regulates the progenitor division mode to maintain brain size.
Genetic evolution studies indicate that the primary microcephaly(MCPH ) genes have undergone a strong positive selection inthe human evolutionary lineage, which has had a great impacton brain enlargement1–3. Human primary microcephaly (MCPH,OMIM 251200) is a neurodevelopmental disorder characterized bya severely decreased cerebral cortex that is otherwise architecturallynormal4,5. So far, seven genes responsible for the various subtypesof MCPH have been identified: MCPH1 (microcephalin), WDR62,CDK5RAP2, CEP152, ASPM, CENPJ and STIL (ref. 5). Interestingly,all MCPH gene products seem to associate with proteins in thecytoskeletal control of the mitotic apparatus, such as centrosomes ormitotic spindle poles5–8.MCPH1 patients exhibit microcephaly at birth and mild mental
retardation in adulthood, without apparent neurological behaviouranomalies4. A hallmark of MCPH1 patient cells is prematurechromosome condensation (PCC) and theMCPH1 locus is allelic tothe human PCC syndrome9,10 (OMIM 606858). The MCPH1 geneencodes MCPH1, a centrosome component that specifically interactswith condensin II (refs 11–13). MCPH1 has been implicated in ATM-and ATR-mediated DNA-damage response (DDR) and homologousrecombination repair, as well as cell-cycle checkpoints11,14–17. MCPH1
1Leibniz Institute for Age Research—Fritz Lipmann Institute (FLI), Beurtenbergstrasse 11, 07745 Jena, Germany. 2Institute of Molecular Cell Biology, Centre forMolecular Biomedicine (CMB), Hans-Knöll-Strasse 2, 07745 Jena, Germany. 3Faculty of Biology and Pharmacy, Friedrich Schiller University of Jena,Beurtenbergstrasse 11, 07745 Jena, Germany. 4Present address: Cancer Research UK—London Research Institute, 44 Lincoln’s Inn Fields, London WC2A 3LY, UK.5These authors contributed equally to this work.6Correspondence should be addressed to Z-Q.W. (e-mail: [email protected])
Received 27 January 2011; accepted 11 August 2011; published online 25 September 2011; DOI: 10.1038/ncb2342
interacts with the chromatin remodelling complex SWI–SNF inresponse to DNA damage18 and participates in E2F1-mediatedtranscription of DNA-repair genes19. The MCPH1 disorder may becaused by neuronal attrition through DNA-damage-induced apoptosisduring neurogenesis, because mutations in key DDR genes, ATM, ATR,MRE11 and NBS1, cause ataxia telangiectasia, ATR-Seckel syndrome,A–T-like disorder and Nijmegen-breakage syndrome, respectively, allof which feature in microcephaly or neurodegeneration phenotypes20.Of note, mutations in a centrosomal protein, pericentrin, have beenfound to cause another microcephaly syndrome (Pericentrin–Seckelsyndrome), in which the ATR–Chk1 pathway is defective21.The microcephaly of MCPH1 patients may also reflect a disturbance
in the mode of neuroprogenitor divisions, which modulates the neuronnumbers of developing brains5,22. A change in division mode, forexample, switching from symmetric to asymmetric cell division, isanticipated to decrease total neuron cell number and ultimately thecerebral cortex size23,24. The MCPH1 deficiency causes a wide rangeof cellular defects in DNA-damage repair, centrosome localizationof proteins, cell-cycle progression and abnormal spindles, as well aschromatin remodelling (see ref. 5 for a review). However, howMCPH1deficiency causes the microcephaly phenotype of MCPH1 patients
NATURE CELL BIOLOGY VOLUME 13 | NUMBER 11 | NOVEMBER 2011 1325
© 2011 Macmillan Publishers Limited. All rights reserved.
ART I C L E S
remains elusive. Here, we investigate the physiological function ofMCPH1 in brain size determination.
RESULTSDisruption ofMcph1 causes microcephaly in mouse modelsFirst, we evaluated the expression pattern of Mcph1 during braindevelopment by in situ hybridization using mouse Mcph1 probes.Mcph1 was expressed at a high level in the ventricular andsubventricular zones (VZ/SVZ) of the forebrain of embryonic day(E)13.5 embryos (Supplementary Fig. S1a–c), where the proliferatingneural progenitor cells are located, confirming a previous report25, andalso of E15.5 embryos (Supplementary Fig. S1d–f). Interestingly, itsexpression in newborn brains was restricted to the hippocampus, beingundetectable in the VZ/SVZ (Supplementary Fig. S1g–i).To study the physiological function ofMCPH1 in brain development,
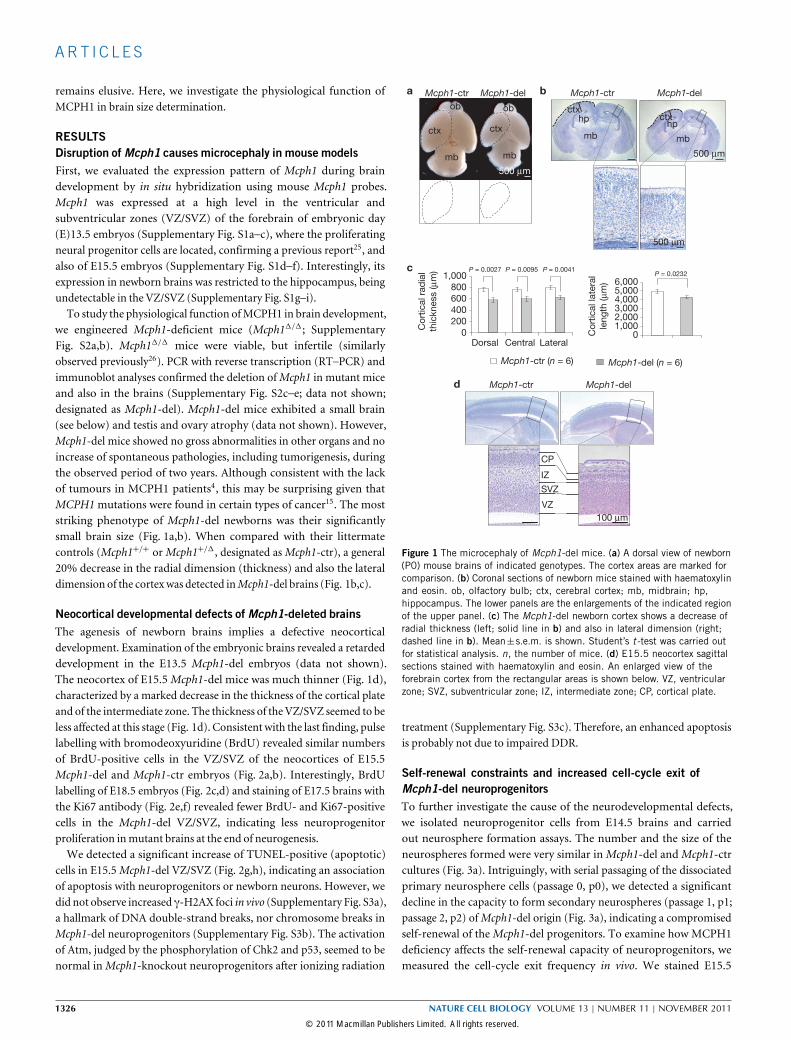
we engineered Mcph1-deficient mice (Mcph11/1; SupplementaryFig. S2a,b). Mcph11/1 mice were viable, but infertile (similarlyobserved previously26). PCR with reverse transcription (RT–PCR) andimmunoblot analyses confirmed the deletion ofMcph1 in mutant miceand also in the brains (Supplementary Fig. S2c–e; data not shown;designated as Mcph1-del). Mcph1-del mice exhibited a small brain(see below) and testis and ovary atrophy (data not shown). However,Mcph1-del mice showed no gross abnormalities in other organs and noincrease of spontaneous pathologies, including tumorigenesis, duringthe observed period of two years. Although consistent with the lackof tumours in MCPH1 patients4, this may be surprising given thatMCPH1mutations were found in certain types of cancer15. The moststriking phenotype of Mcph1-del newborns was their significantlysmall brain size (Fig. 1a,b). When compared with their littermatecontrols (Mcph1+/+ orMcph1+/1, designated asMcph1-ctr), a general20% decrease in the radial dimension (thickness) and also the lateraldimension of the cortexwas detected inMcph1-del brains (Fig. 1b,c).
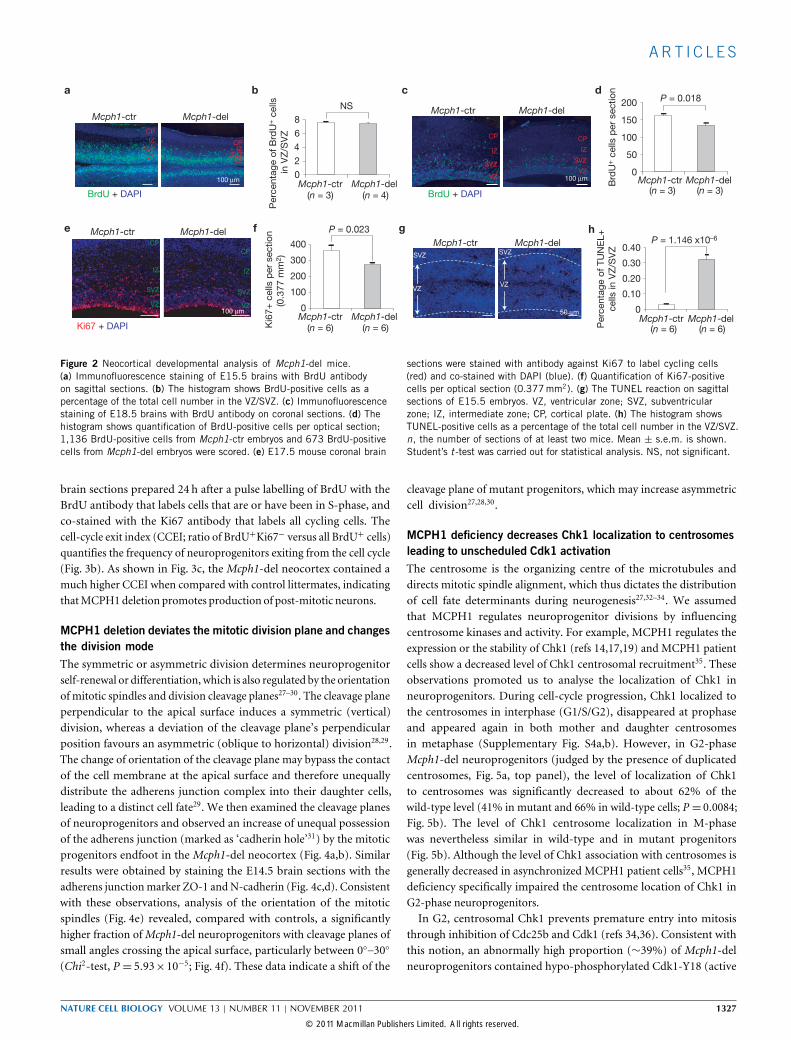
Neocortical developmental defects ofMcph1-deleted brainsThe agenesis of newborn brains implies a defective neocorticaldevelopment. Examination of the embryonic brains revealed a retardeddevelopment in the E13.5 Mcph1-del embryos (data not shown).The neocortex of E15.5Mcph1-del mice was much thinner (Fig. 1d),characterized by a marked decrease in the thickness of the cortical plateand of the intermediate zone. The thickness of the VZ/SVZ seemed to beless affected at this stage (Fig. 1d). Consistent with the last finding, pulselabelling with bromodeoxyuridine (BrdU) revealed similar numbersof BrdU-positive cells in the VZ/SVZ of the neocortices of E15.5Mcph1-del and Mcph1-ctr embryos (Fig. 2a,b). Interestingly, BrdUlabelling of E18.5 embryos (Fig. 2c,d) and staining of E17.5 brains withthe Ki67 antibody (Fig. 2e,f) revealed fewer BrdU- and Ki67-positivecells in the Mcph1-del VZ/SVZ, indicating less neuroprogenitorproliferation inmutant brains at the end of neurogenesis.We detected a significant increase of TUNEL-positive (apoptotic)
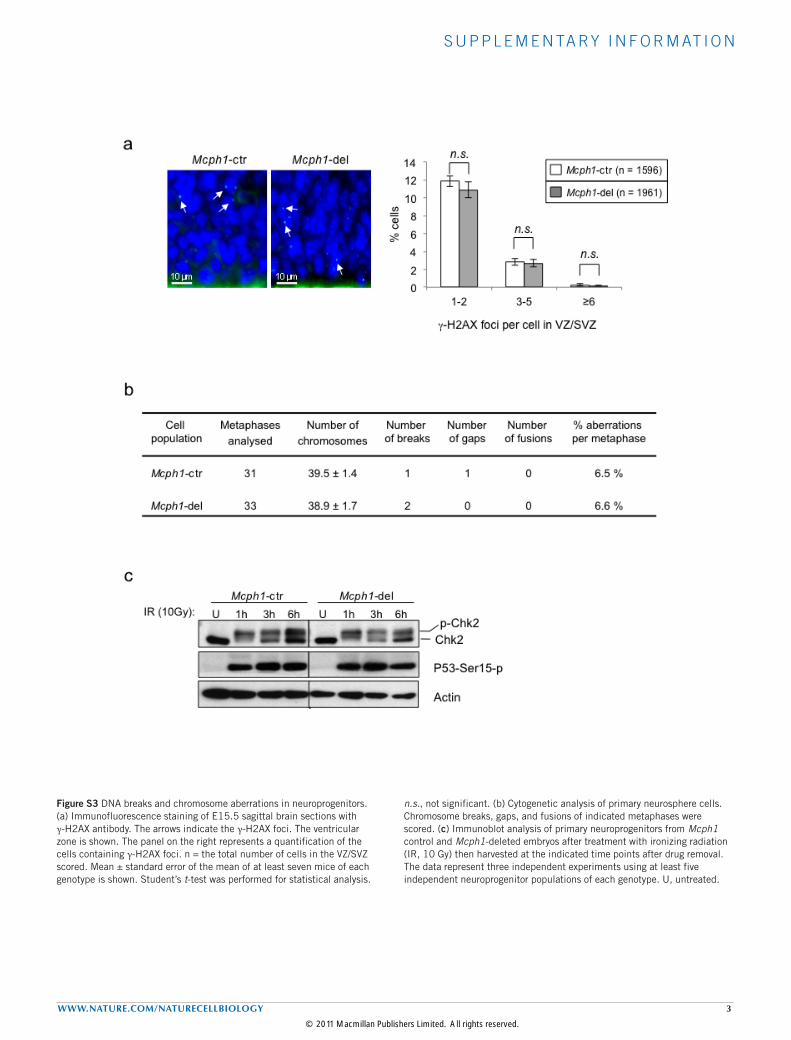
cells in E15.5Mcph1-del VZ/SVZ (Fig. 2g,h), indicating an associationof apoptosis with neuroprogenitors or newborn neurons. However, wedid not observe increased γ-H2AX foci in vivo (Supplementary Fig. S3a),a hallmark of DNA double-strand breaks, nor chromosome breaks inMcph1-del neuroprogenitors (Supplementary Fig. S3b). The activationof Atm, judged by the phosphorylation of Chk2 and p53, seemed to benormal inMcph1-knockout neuroprogenitors after ionizing radiation
Mcph1-ctr Mcph1-del
ctx
ob
mb
ctx
ob
mb
500 µm
500 µm
Mcph1-ctr Mcph1-del
VZ
SVZ
IZ
CP
P = 0.0232
Dorsal Central Lateral
Cor
tical
rad
ial
thic
knes
s (µ
m)
Cor
tical
late
ral
leng
th (µ
m)
P = 0.0027 P = 0.0095 P = 0.0041
Mcph1-ctr (n = 6) Mcph1-del (n = 6)
Mcph1-ctr Mcph1-del
ctx
mb
ctx
mb
hp hp
500 µm
100 µm
0200400600800
1,000
a
c
d
b
01,0002,0003,0004,0005,0006,000
Figure 1 The microcephaly of Mcph1-del mice. (a) A dorsal view of newborn(P0) mouse brains of indicated genotypes. The cortex areas are marked forcomparison. (b) Coronal sections of newborn mice stained with haematoxylinand eosin. ob, olfactory bulb; ctx, cerebral cortex; mb, midbrain; hp,hippocampus. The lower panels are the enlargements of the indicated regionof the upper panel. (c) The Mcph1-del newborn cortex shows a decrease ofradial thickness (left; solid line in b) and also in lateral dimension (right;dashed line in b). Mean±s.e.m. is shown. Student’s t -test was carried outfor statistical analysis. n, the number of mice. (d) E15.5 neocortex sagittalsections stained with haematoxylin and eosin. An enlarged view of theforebrain cortex from the rectangular areas is shown below. VZ, ventricularzone; SVZ, subventricular zone; IZ, intermediate zone; CP, cortical plate.
treatment (Supplementary Fig. S3c). Therefore, an enhanced apoptosisis probably not due to impaired DDR.
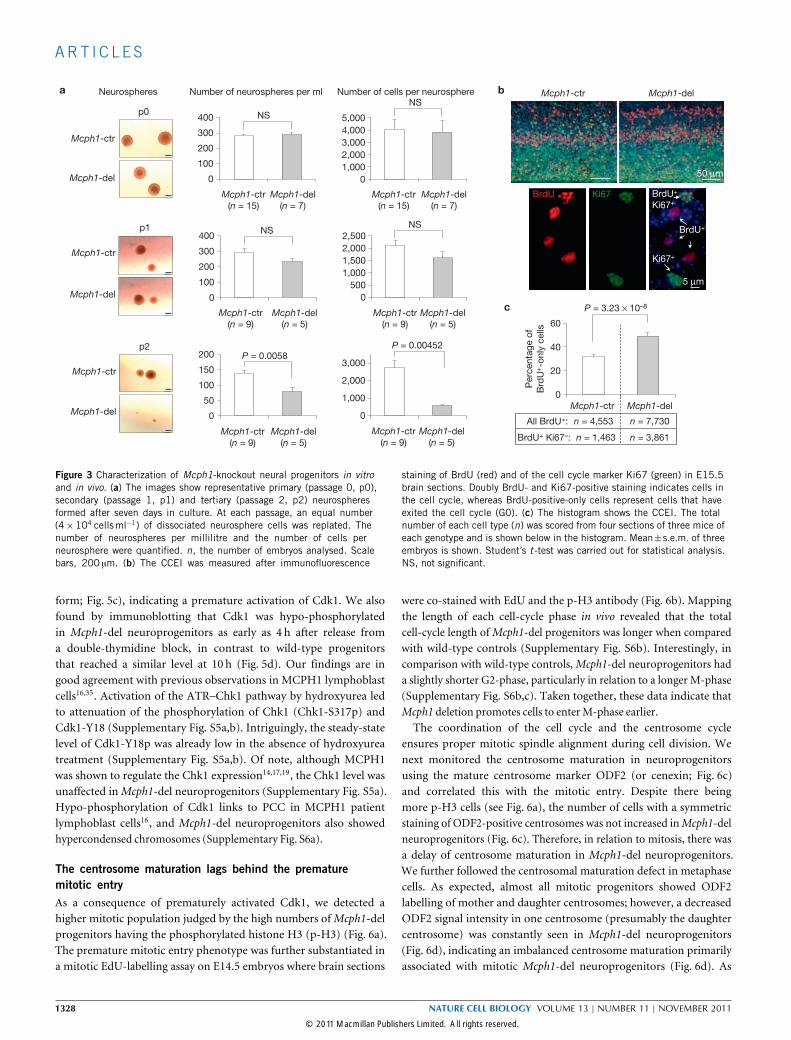
Self-renewal constraints and increased cell-cycle exit ofMcph1-del neuroprogenitorsTo further investigate the cause of the neurodevelopmental defects,we isolated neuroprogenitor cells from E14.5 brains and carriedout neurosphere formation assays. The number and the size of theneurospheres formed were very similar inMcph1-del andMcph1-ctrcultures (Fig. 3a). Intriguingly, with serial passaging of the dissociatedprimary neurosphere cells (passage 0, p0), we detected a significantdecline in the capacity to form secondary neurospheres (passage 1, p1;passage 2, p2) ofMcph1-del origin (Fig. 3a), indicating a compromisedself-renewal of theMcph1-del progenitors. To examine how MCPH1deficiency affects the self-renewal capacity of neuroprogenitors, wemeasured the cell-cycle exit frequency in vivo. We stained E15.5
1326 NATURE CELL BIOLOGY VOLUME 13 | NUMBER 11 | NOVEMBER 2011
© 2011 Macmillan Publishers Limited. All rights reserved.
ART I C L E S
Per
cent
age
of T
UN
EL+
ce
lls in
VZ
/SV
Z
P = 1.146 x10⁻⁶
VZ VZ
Mcph1-ctr Mcph1-del
VZ SVZ
CP IZ
100 µm 100 µm
50 µm100 µm
m
VZ SVZ
CP
IZ
Per
cent
age
of B
rdU
+ c
ells
in
VZ
/SV
Z
Mcph1-ctr Mcph1-del(n = 3) (n = 4)
Mcph1-ctr Mcph1-del(n = 6) (n = 6)
02468
NS
P = 0.023
Ki67 + DAPI Ki6
7+ c
ells
per
sec
tion
(0.3
77 m
m2 )
Mcph1-ctr Mcph1-del
Mcph1-ctr Mcph1-del
Mcph1-ctr Mcph1-del (n = 3) (n = 3)
Mcph1-ctr (n = 6)
P = 0.018
VZ
SVZ
CP
IZ
VZ
SVZ
CP
IZ
BrdU + DAPI BrdU + DAPI
Mcph1-ctr Mcph1-del
VZ
SVZ
CP
IZ
VZ
SVZ
CP
IZ
SVZ SVZ
0
100
200
300
400
0
0.10
0.20
0.30
0.40
0
50
100
150
200a b c
g
d
he f
Mcph1-del (n = 6)
Brd
U+ c
ells
per
sec
tion
Figure 2 Neocortical developmental analysis of Mcph1-del mice.(a) Immunofluorescence staining of E15.5 brains with BrdU antibodyon sagittal sections. (b) The histogram shows BrdU-positive cells as apercentage of the total cell number in the VZ/SVZ. (c) Immunofluorescencestaining of E18.5 brains with BrdU antibody on coronal sections. (d) Thehistogram shows quantification of BrdU-positive cells per optical section;1,136 BrdU-positive cells from Mcph1-ctr embryos and 673 BrdU-positivecells from Mcph1-del embryos were scored. (e) E17.5 mouse coronal brain
sections were stained with antibody against Ki67 to label cycling cells(red) and co-stained with DAPI (blue). (f) Quantification of Ki67-positivecells per optical section (0.377mm2). (g) The TUNEL reaction on sagittalsections of E15.5 embryos. VZ, ventricular zone; SVZ, subventricularzone; IZ, intermediate zone; CP, cortical plate. (h) The histogram showsTUNEL-positive cells as a percentage of the total cell number in the VZ/SVZ.n, the number of sections of at least two mice. Mean ± s.e.m. is shown.Student’s t -test was carried out for statistical analysis. NS, not significant.
brain sections prepared 24 h after a pulse labelling of BrdU with theBrdU antibody that labels cells that are or have been in S-phase, andco-stained with the Ki67 antibody that labels all cycling cells. Thecell-cycle exit index (CCEI; ratio of BrdU+Ki67− versus all BrdU+ cells)quantifies the frequency of neuroprogenitors exiting from the cell cycle(Fig. 3b). As shown in Fig. 3c, the Mcph1-del neocortex contained amuch higher CCEI when compared with control littermates, indicatingthatMCPH1deletion promotes production of post-mitotic neurons.
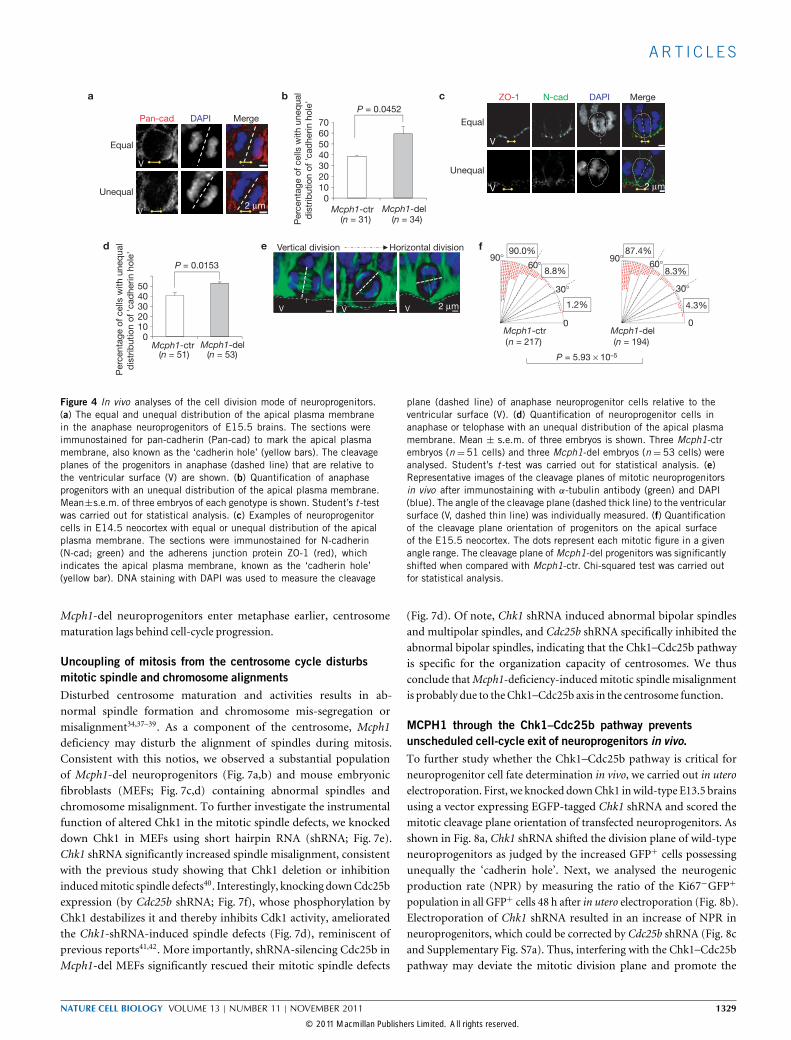
MCPH1 deletion deviates the mitotic division plane and changesthe division modeThe symmetric or asymmetric division determines neuroprogenitorself-renewal or differentiation, which is also regulated by the orientationof mitotic spindles and division cleavage planes27–30. The cleavage planeperpendicular to the apical surface induces a symmetric (vertical)division, whereas a deviation of the cleavage plane’s perpendicularposition favours an asymmetric (oblique to horizontal) division28,29.The change of orientation of the cleavage plane may bypass the contactof the cell membrane at the apical surface and therefore unequallydistribute the adherens junction complex into their daughter cells,leading to a distinct cell fate29. We then examined the cleavage planesof neuroprogenitors and observed an increase of unequal possessionof the adherens junction (marked as ‘cadherin hole’31) by the mitoticprogenitors endfoot in the Mcph1-del neocortex (Fig. 4a,b). Similarresults were obtained by staining the E14.5 brain sections with theadherens junctionmarker ZO-1 andN-cadherin (Fig. 4c,d). Consistentwith these observations, analysis of the orientation of the mitoticspindles (Fig. 4e) revealed, compared with controls, a significantlyhigher fraction ofMcph1-del neuroprogenitors with cleavage planes ofsmall angles crossing the apical surface, particularly between 0◦–30◦
(Chi2-test, P = 5.93×10⁻⁵; Fig. 4f). These data indicate a shift of the
cleavage plane of mutant progenitors, which may increase asymmetriccell division27,28,30.
MCPH1 deficiency decreases Chk1 localization to centrosomesleading to unscheduled Cdk1 activationThe centrosome is the organizing centre of the microtubules anddirects mitotic spindle alignment, which thus dictates the distributionof cell fate determinants during neurogenesis27,32–34. We assumedthat MCPH1 regulates neuroprogenitor divisions by influencingcentrosome kinases and activity. For example, MCPH1 regulates theexpression or the stability of Chk1 (refs 14,17,19) and MCPH1 patientcells show a decreased level of Chk1 centrosomal recruitment35. Theseobservations promoted us to analyse the localization of Chk1 inneuroprogenitors. During cell-cycle progression, Chk1 localized tothe centrosomes in interphase (G1/S/G2), disappeared at prophaseand appeared again in both mother and daughter centrosomesin metaphase (Supplementary Fig. S4a,b). However, in G2-phaseMcph1-del neuroprogenitors (judged by the presence of duplicatedcentrosomes, Fig. 5a, top panel), the level of localization of Chk1to centrosomes was significantly decreased to about 62% of thewild-type level (41% in mutant and 66% in wild-type cells; P = 0.0084;Fig. 5b). The level of Chk1 centrosome localization in M-phasewas nevertheless similar in wild-type and in mutant progenitors(Fig. 5b). Although the level of Chk1 association with centrosomes isgenerally decreased in asynchronized MCPH1 patient cells35, MCPH1deficiency specifically impaired the centrosome location of Chk1 inG2-phase neuroprogenitors.In G2, centrosomal Chk1 prevents premature entry into mitosis
through inhibition of Cdc25b and Cdk1 (refs 34,36). Consistent withthis notion, an abnormally high proportion (∼39%) of Mcph1-delneuroprogenitors contained hypo-phosphorylated Cdk1-Y18 (active
NATURE CELL BIOLOGY VOLUME 13 | NUMBER 11 | NOVEMBER 2011 1327
© 2011 Macmillan Publishers Limited. All rights reserved.
ART I C L E S
01,0002,0003,0004,0005,000
0500
1,0001,5002,0002,500
0
1,000
2,000
3,000
0
100
200
300
400
0
100
200
300
400
2
0
50
100
150
200
Mcph1-ctr
Mcph1-del
p0
p1
p2
a Neurospheres
Per
cent
age
of B
rdU
+-o
nly
cells
b
c
Mcph1-del Mcph1-ctr
All BrdU+: n = 4,553 n = 7,730
BrdU+ Ki67–: n = 1,463 n = 3,861
Mcph1-del Mcph1-ctr
50 µm
Mcph1-ctr(n = 9)
Mcph1-ctr(n = 9)
Mcph1-ctr(n = 9)
Mcph1-ctr(n = 9)
Mcph1-del(n = 5)
Mcph1-del(n = 5)
Mcph1-del(n = 5)
Mcph1-del(n = 5)
0
20
40
60
P = 3.23 × 10⁻⁸
P = 0.00452P = 0.0058
NS
NS
NSNS
BrdU Ki67
5 µm
BrdU+
Ki67+
BrdU+
Ki67+
Number of neurospheres per ml Number of cells per neurosphere
Mcph1-ctr(n = 15)
Mcph1-del(n = 7)
Mcph1-ctr(n = 15)
Mcph1-del(n = 7)
Mcph1-ctr
Mcph1-del
Mcph1-ctr
Mcph1-del
Figure 3 Characterization of Mcph1-knockout neural progenitors in vitroand in vivo. (a) The images show representative primary (passage 0, p0),secondary (passage 1, p1) and tertiary (passage 2, p2) neurospheresformed after seven days in culture. At each passage, an equal number(4×10⁴ cellsml−1) of dissociated neurosphere cells was replated. Thenumber of neurospheres per millilitre and the number of cells perneurosphere were quantified. n, the number of embryos analysed. Scalebars, 200 µm. (b) The CCEI was measured after immunofluorescence
staining of BrdU (red) and of the cell cycle marker Ki67 (green) in E15.5brain sections. Doubly BrdU- and Ki67-positive staining indicates cells inthe cell cycle, whereas BrdU-positive-only cells represent cells that haveexited the cell cycle (G0). (c) The histogram shows the CCEI. The totalnumber of each cell type (n) was scored from four sections of three mice ofeach genotype and is shown below in the histogram. Mean±s.e.m. of threeembryos is shown. Student’s t -test was carried out for statistical analysis.NS, not significant.
form; Fig. 5c), indicating a premature activation of Cdk1. We alsofound by immunoblotting that Cdk1 was hypo-phosphorylatedin Mcph1-del neuroprogenitors as early as 4 h after release froma double-thymidine block, in contrast to wild-type progenitorsthat reached a similar level at 10 h (Fig. 5d). Our findings are ingood agreement with previous observations in MCPH1 lymphoblastcells16,35. Activation of the ATR–Chk1 pathway by hydroxyurea ledto attenuation of the phosphorylation of Chk1 (Chk1-S317p) andCdk1-Y18 (Supplementary Fig. S5a,b). Intriguingly, the steady-statelevel of Cdk1-Y18p was already low in the absence of hydroxyureatreatment (Supplementary Fig. S5a,b). Of note, although MCPH1was shown to regulate the Chk1 expression14,17,19, the Chk1 level wasunaffected inMcph1-del neuroprogenitors (Supplementary Fig. S5a).Hypo-phosphorylation of Cdk1 links to PCC in MCPH1 patientlymphoblast cells16, and Mcph1-del neuroprogenitors also showedhypercondensed chromosomes (Supplementary Fig. S6a).
The centrosome maturation lags behind the prematuremitotic entryAs a consequence of prematurely activated Cdk1, we detected ahigher mitotic population judged by the high numbers ofMcph1-delprogenitors having the phosphorylated histone H3 (p-H3) (Fig. 6a).The premature mitotic entry phenotype was further substantiated ina mitotic EdU-labelling assay on E14.5 embryos where brain sections
were co-stained with EdU and the p-H3 antibody (Fig. 6b). Mappingthe length of each cell-cycle phase in vivo revealed that the totalcell-cycle length ofMcph1-del progenitors was longer when comparedwith wild-type controls (Supplementary Fig. S6b). Interestingly, incomparison with wild-type controls,Mcph1-del neuroprogenitors hada slightly shorter G2-phase, particularly in relation to a longer M-phase(Supplementary Fig. S6b,c). Taken together, these data indicate thatMcph1 deletion promotes cells to enterM-phase earlier.The coordination of the cell cycle and the centrosome cycle
ensures proper mitotic spindle alignment during cell division. Wenext monitored the centrosome maturation in neuroprogenitorsusing the mature centrosome marker ODF2 (or cenexin; Fig. 6c)and correlated this with the mitotic entry. Despite there beingmore p-H3 cells (see Fig. 6a), the number of cells with a symmetricstaining of ODF2-positive centrosomes was not increased inMcph1-delneuroprogenitors (Fig. 6c). Therefore, in relation to mitosis, there wasa delay of centrosome maturation in Mcph1-del neuroprogenitors.We further followed the centrosomal maturation defect in metaphasecells. As expected, almost all mitotic progenitors showed ODF2labelling of mother and daughter centrosomes; however, a decreasedODF2 signal intensity in one centrosome (presumably the daughtercentrosome) was constantly seen in Mcph1-del neuroprogenitors(Fig. 6d), indicating an imbalanced centrosome maturation primarilyassociated with mitotic Mcph1-del neuroprogenitors (Fig. 6d). As
1328 NATURE CELL BIOLOGY VOLUME 13 | NUMBER 11 | NOVEMBER 2011
© 2011 Macmillan Publishers Limited. All rights reserved.
ART I C L E S
(n = 31) (n = 34) Mcph1-ctr Mcph1-del
P = 0.0452 Pan-cad DAPI Merge
V
Per
cent
age
of c
ells
with
une
qua
ld
istr
ibut
ion
of 'c
adhe
rin h
ole'
Per
cent
age
of c
ells
with
une
qua
ld
istr
ibut
ion
of 'c
adhe
rin h
ole'
P = 0.0153
Mcph1-ctr Mcph1-del(n = 51) (n = 53)
V
ZO-1 DAPIN-cad Merge
V
V
Mcph1-del(n = 194)
P = 5.93 × 10⁻⁵
1.2%
90.0% 87.4% Horizontal division Vertical division
V VV
Equal
2 µm
2 µm
2 µmUnequal
010203040506070 Equal
Unequal
01020304050
a
d e f
b c
8.8%90°
8.3%
4.3%
90°60°
30°
0Mcph1-ctr(n = 217)
60°
30°
0
Figure 4 In vivo analyses of the cell division mode of neuroprogenitors.(a) The equal and unequal distribution of the apical plasma membranein the anaphase neuroprogenitors of E15.5 brains. The sections wereimmunostained for pan-cadherin (Pan-cad) to mark the apical plasmamembrane, also known as the ‘cadherin hole’ (yellow bars). The cleavageplanes of the progenitors in anaphase (dashed line) that are relative tothe ventricular surface (V) are shown. (b) Quantification of anaphaseprogenitors with an unequal distribution of the apical plasma membrane.Mean±s.e.m. of three embryos of each genotype is shown. Student’s t -testwas carried out for statistical analysis. (c) Examples of neuroprogenitorcells in E14.5 neocortex with equal or unequal distribution of the apicalplasma membrane. The sections were immunostained for N-cadherin(N-cad; green) and the adherens junction protein ZO-1 (red), whichindicates the apical plasma membrane, known as the ‘cadherin hole’(yellow bar). DNA staining with DAPI was used to measure the cleavage
plane (dashed line) of anaphase neuroprogenitor cells relative to theventricular surface (V). (d) Quantification of neuroprogenitor cells inanaphase or telophase with an unequal distribution of the apical plasmamembrane. Mean ± s.e.m. of three embryos is shown. Three Mcph1-ctrembryos (n =51 cells) and three Mcph1-del embryos (n =53 cells) wereanalysed. Student’s t -test was carried out for statistical analysis. (e)Representative images of the cleavage planes of mitotic neuroprogenitorsin vivo after immunostaining with α-tubulin antibody (green) and DAPI(blue). The angle of the cleavage plane (dashed thick line) to the ventricularsurface (V, dashed thin line) was individually measured. (f) Quantificationof the cleavage plane orientation of progenitors on the apical surfaceof the E15.5 neocortex. The dots represent each mitotic figure in a givenangle range. The cleavage plane ofMcph1-del progenitors was significantlyshifted when compared with Mcph1-ctr. Chi-squared test was carried outfor statistical analysis.
Mcph1-del neuroprogenitors enter metaphase earlier, centrosomematuration lags behind cell-cycle progression.
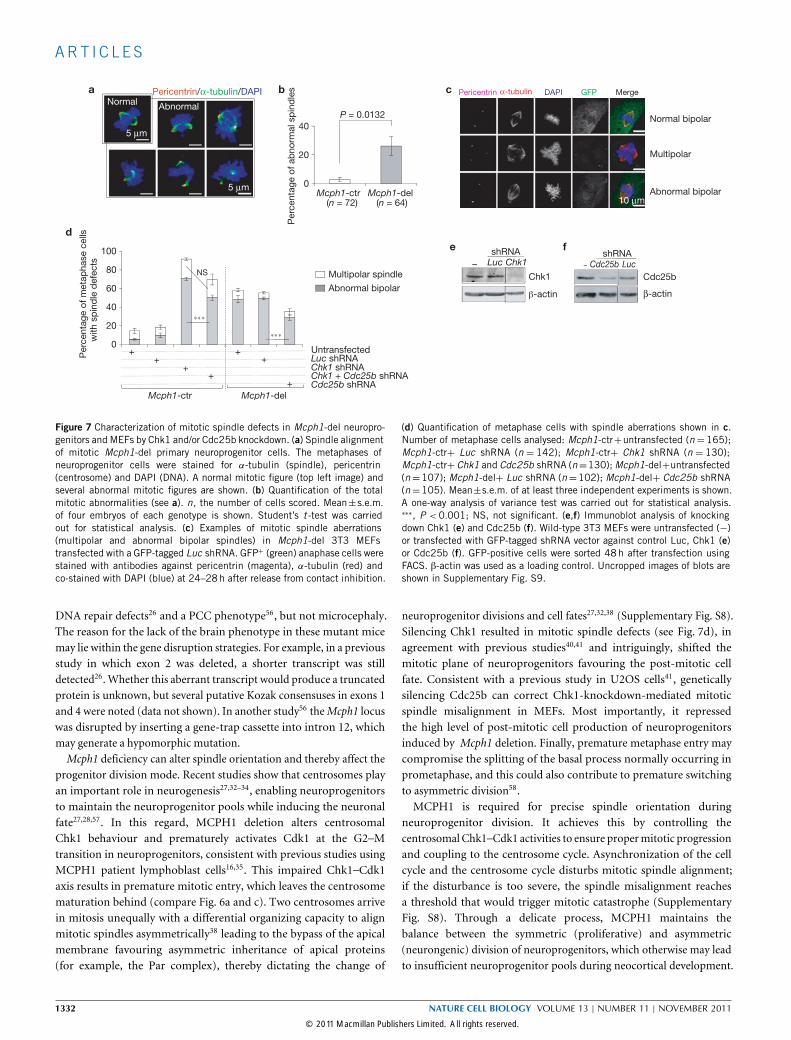
Uncoupling of mitosis from the centrosome cycle disturbsmitotic spindle and chromosome alignmentsDisturbed centrosome maturation and activities results in ab-normal spindle formation and chromosome mis-segregation ormisalignment34,37–39. As a component of the centrosome, Mcph1deficiency may disturb the alignment of spindles during mitosis.Consistent with this notios, we observed a substantial populationof Mcph1-del neuroprogenitors (Fig. 7a,b) and mouse embryonicfibroblasts (MEFs; Fig. 7c,d) containing abnormal spindles andchromosome misalignment. To further investigate the instrumentalfunction of altered Chk1 in the mitotic spindle defects, we knockeddown Chk1 in MEFs using short hairpin RNA (shRNA; Fig. 7e).Chk1 shRNA significantly increased spindle misalignment, consistentwith the previous study showing that Chk1 deletion or inhibitioninducedmitotic spindle defects40. Interestingly, knocking downCdc25bexpression (by Cdc25b shRNA; Fig. 7f), whose phosphorylation byChk1 destabilizes it and thereby inhibits Cdk1 activity, amelioratedthe Chk1-shRNA-induced spindle defects (Fig. 7d), reminiscent ofprevious reports41,42. More importantly, shRNA-silencing Cdc25b inMcph1-del MEFs significantly rescued their mitotic spindle defects
(Fig. 7d). Of note, Chk1 shRNA induced abnormal bipolar spindlesand multipolar spindles, and Cdc25b shRNA specifically inhibited theabnormal bipolar spindles, indicating that the Chk1–Cdc25b pathwayis specific for the organization capacity of centrosomes. We thusconclude thatMcph1-deficiency-induced mitotic spindle misalignmentis probably due to theChk1–Cdc25b axis in the centrosome function.
MCPH1 through the Chk1–Cdc25b pathway preventsunscheduled cell-cycle exit of neuroprogenitors in vivo.To further study whether the Chk1–Cdc25b pathway is critical forneuroprogenitor cell fate determination in vivo, we carried out in uteroelectroporation. First, we knocked downChk1 inwild-type E13.5 brainsusing a vector expressing EGFP-tagged Chk1 shRNA and scored themitotic cleavage plane orientation of transfected neuroprogenitors. Asshown in Fig. 8a, Chk1 shRNA shifted the division plane of wild-typeneuroprogenitors as judged by the increased GFP+ cells possessingunequally the ‘cadherin hole’. Next, we analysed the neurogenicproduction rate (NPR) by measuring the ratio of the Ki67−GFP+
population in all GFP+ cells 48 h after in utero electroporation (Fig. 8b).Electroporation of Chk1 shRNA resulted in an increase of NPR inneuroprogenitors, which could be corrected by Cdc25b shRNA (Fig. 8cand Supplementary Fig. S7a). Thus, interfering with the Chk1–Cdc25bpathway may deviate the mitotic division plane and promote the
NATURE CELL BIOLOGY VOLUME 13 | NUMBER 11 | NOVEMBER 2011 1329
© 2011 Macmillan Publishers Limited. All rights reserved.

ART I C L E S
Mcph1-ctr (n = 91)
Mcph1-del (n = 108)
Per
cent
age
o f C
hk1
cent
roso
me
loca
lizat
ion
NS
NS
P = 0.0084
G2 Prophase Metaphase
Merge+ DAPI
Cdk1-Y18pcycB1
Mcph1-del
Mcph1-ctr
Mcph1-del
Mcph1-ctr
Mcph1-del
Mcph1-ctr
G2 phase
Prophase
Metaphase
2 μm
39%
0%
4 6 8 10 4 6 8 10
Mcph1-ctr Mcph1-del
h after release
1.0 0.86 0.59 0.48 0.40 0.26 0.20 0.17
0
20
40
60
80
100
Mcph1-ctr
Mcph1-del
0 20 40 60
d
c
Percentage
5 μm
a b
Cdk1-Y18p
β-actin
Chk1γMerge+ DAPI-tubulin
Figure 5 Analysis of cell-cycle-dependent Chk1 centrosome localization,premature mitotic entry and centrosome maturation in primary neuroprogen-itors. (a) The centrosome localization of Chk1 (arrows). The neuroprogenitorcells in G2 phase, prophase and metaphase were fixed and stained withantibodies against Chk1 (red) and γ-tubulin (green) and counterstainedwith DAPI (blue). (b) Quantification of the cells in a with a co-localizationof Chk1 and γ-tubulin at the indicated cell-cycle phase. Mean± s.e.m.of at least three embryos is shown. n, the total number of cells scored.Student’s t -test was carried out for statistical analysis. NS, not significant.
(c) Immunofluorescence microscopy analysis of the activation of Cdk1 inprimary neuroprogenitors. Immunostaining of synchronized neuroprogenitorswith antibodies against cyclin B1 and Cdk1-Y18p. Note the increase inthe number of Mcph1-del cells with hypo-Cdk1-Y18p (dephosphorylationat Tyr 18). (d) Time course analysis of Cdk1 activation by immunoblotting.Primary neurospheres were synchronized by a double-thymidine block andproteins were analysed at indicated times after release from the block.The level of Cdk1-Y18p is presented as a percentage of endogenous actin.Uncropped images of blots are shown in Supplementary Fig. S9.
post-mitotic cell fate of progenitors, phenocopying the defects of theMcph1-del neocortex.To substantiate whether the centrosomal function of the
Chk1–Cdc25b axis was indeed responsible for the increased neurogenicdivision of Mcph1-del progenitors, we carried out genetic rescueexperiments by in utero electroporation. To this end, we knocked downCdc25b inMcph1-del neocortex (Fig. 8d).Whereas luciferase (Luc) andCdc25b shRNA had no obvious influence on the neurogenic productionof progenitors in wild-type neocortex, Cdc25b shRNA significantlyrepressed the degree of post-mitotic cell accumulation (Ki67−GFP+
cells) inMcph1-del neocortex and reached a similar level in wild-typeneocortex (Fig. 8e and Supplementary Fig. S7b). Collectively, thesedata indicate that MCPH1 deletion promotes the early cell-cycle exitof neuroprogenitors and thereby alters neuroprogenitor fate throughthe Chk1–Cdc25b pathway.
DISCUSSIONIn the present study, we show that MCPH1 deletion leads tomicrocephaly in newborn mice characterized by a specific decrease
in the thickness and in the lateral expansion of the cerebral cortex. Itseems that MCPH1 deletion affects more the neurons generated in theVZ/SVZ of the dorsal telencephalon, which migrated radially, therebycontributingmore to the radial expansion. Given that the ratio of cortexsurface between humans andmice is 1,000:1 (ref. 1) and that the humanencephalization quotient is 7.4–7.8 and the mouse is 0.5 (ref. 43),this 20% decrease in the cortex thickness inMcph1-knockout mousemodels would correspond to a severe decrease in the human cortex.Together, the neuronal and PCC phenotypes of theMcph1-knockoutmice recapitulate well themain symptoms ofMCPH1 patients4.A decreased neocortex inMcph1-knockout mice can be attributable
to neuroprogenitor apoptosis, for example due to an altered DDRin which MCPH1 is involved11,14,15,17. However, the Atm–Chk2–p53pathway seems unaffected in MCPH1-deleted neuroprogenitors incontrast to a previous study using short interfering RNA (siRNA)MCPH1 knockdown15. Moreover, we did not observe more γ-H2AX foci nor high numbers of chromosome breaks in Mcph1-delneuroprogenitors. Therefore, the increased apoptosis in the VZ/SVZis rather due to other triggers. Severe spindle misalignment and
1330 NATURE CELL BIOLOGY VOLUME 13 | NUMBER 11 | NOVEMBER 2011
© 2011 Macmillan Publishers Limited. All rights reserved.

ART I C L E S
50 μm 50 μm
2 μm
Mcph1-ctr Mcph1-del
p-H3
Mcph1-ctr Mcph1-delPer
cent
age
of p
-H3
+ c
ells
(n = 651) (n = 617)
NS
γ-tubulin ODF2 Merge
Symmetric
Asymmetric
P = 0.0079
Per
cent
age
of c
ells
with
sy
mm
etric
OD
F2
0
2
4
6
8
Mcph1-ctr Mcph1-del (n = 75) (n = 76)
ODF2 γ-tubulin Merge + DAPIP = 0.0091
Rel
ativ
e O
DF2
inte
nsity
of
dau
ghte
r ce
ntro
som
e
Mcph1-ctr Mcph1-del(n = 29) (n = 27)
Mcph1-ctr
Mcph1-del
Mito
tic E
dU
-lab
ellin
g in
dex
0 1 2 3
Hours post-EdU injection
EdU
Mcph1-del Mcph1-ctr
EdU SVZ
VZ
EdU/p-H3/DAPI
10 μm
1 μm
p-H3
p-H3 + DAPI
0
10
20
30
40
0
20
40
60
80
100
0
0.2
0.4
0.6
ca
b
d
Figure 6 Analysis of premature mitotic entry and centrosome maturation inprimary neuroprogenitors. (a) Left, p-H3 antibody staining of neuroprogenitorcells. The arrows point to p-H3-positive cells and insets are examples ofthe p-H3-positive cells. Right, quantification of mitotic cells (p-H3-positive)at 6 h after release from the double-thymidine block. n, the number ofcells scored. Mean± s.e.m.of three embryos is shown. Student’s t -testwas carried out for statistical analysis. (b) Left, examples of mitotic EdUlabelling. Embryonic brain sections were stained with p-H3-antibody(green) and EdU (magenta). The yellow arrows indicate the EdU+/p-H3+
double-positive cells in the ventricular zone. The red arrows indicate thesingle p-H3-positive cells. Mitotic cells in the SVZ were excluded from theanalysis. Scale bar, 10 µm. Right, quantification of the mitotic EdU-labellingindex of EdU+/p-H3+ double-positive cells as a percentage of p-H3+ cellsat the apical surface. Mean±s.e.m. from at least three embryos. is shown.(c) Analysis of centrosome maturation. Top, 6 h after release from the
double-thymidine block, primary neuroprogenitor cells were stained withantibodies against γ-tubulin and ODF2 (mature centrosome marker). Bottom,quantification of cells with the ODF2 marker in both centrosomes. The totalnumber of neuroprogenitor cells (n) from three embryos was quantified formature centrosomes (symmetric ODF2 staining; top panel). Student’s t -testwas carried out for statistical analysis. NS, not significant. (d) Quantitativeanalysis of centrosome maturation in metaphase neuroprogenitor cellsafter release from the double-thymidine block. Left, metaphase cells (10 hafter release) were stained with γ-tubulin (green) and ODF2 (red). Theinsets show a higher magnification of centrosomes. Right, quantificationof the ODF2 signal intensity (ODF2 channel) of presumably the daughtercentrosome (weak signal) in relation to the signal intensity of the mothercentrosome (strong signal). Mean±s.e.m. from at least three embryos isshown (Mcph1-ctr, n =29 cells; Mcph1-del, n =27 cells). Student’s t -testwas carried out for statistical analysis.
chromosome mis-segregation may trigger ‘mitotic catastrophe’ andcell death44. Prematurely activated Cdk1 would cause aberrant mitoticentry and apoptosis (ref. 45 and reference therein). Consistent withthis notion,Mcph1mutant neuroprogenitors contained a high degreeof aberrant mitotic figures and more TUNEL+ cells were found in theVZ/SVZ. Interestingly, mitotic spindle defects (or mitotic catastrophe)cause neuroprogenitor cell death in the human microcephaly disorderMajewski osteodysplastic primordial dwarfism type II (ref. 46). Inknockout studies, deletion of dynein-associated protein LIS1 causedspindle defects and massive neuroprogenitor cell death47. Furthermore,mutant mice carrying a deletion in another microcephaly gene(Cdk5rap2) exhibit increased cell death in the ventricular zone48.Therefore, the mitotic spindle defects and associated cell death44 isprobably one cause of the loss of neural cells inMcph1-delmice.
Mcph1 deficiency favours an asymmetric division, which wouldlimit neuroprogenitor production and ultimately the total neuron cellnumber. The introduction of Aspm siRNA into mouse embryonicbrains affected the cleavage plane of neural stem cells and increasedthe asymmetric division49. Disruption of Aspm in mice results inmild microcephaly50. In addition, mutations in the Drosophila ASPM(ref. 51), CDK5RAP2 (ref. 52), CENPJ (ref. 53) and MCPH1 (ref. 54)affect asymmetric division or centrosome separation.However, these flymutants do not show small brain size, perhaps owing to a compensatorymechanism existing in Drosophila37. Interestingly, in utero knockdownof Cdk5rap2 results in a decrease of the neuroprogenitor pool55 and aCdk5rap2 deletion in Hertwig’s anaemia (an) mutant mice decreasesbrain size, which is also associated with mitotic spindle misorientationin neuroprogenitors48. Two other Mcph1-knockout models showed
NATURE CELL BIOLOGY VOLUME 13 | NUMBER 11 | NOVEMBER 2011 1331
© 2011 Macmillan Publishers Limited. All rights reserved.
ART I C L E S
Multipolar spindle
Abnormal bipolar
Per
cent
age
of m
etap
hase
cel
ls
with
sp
ind
le d
efec
ts
NS
Mcph1-ctr Mcph1-del
Untransfected + + Luc shRNA+ +
Cdc25b shRNA +
Chk1 shRNA + Chk1 + Cdc25b shRNA +
P = 0.0132
Per
cent
age
of a
bno
rmal
sp
ind
les
Mcph1-ctr Mcph1-del(n = 72) (n = 64)
Pericentrin α-tubulin DAPI GFP Merge
Multipolar
Normal bipolar
Abnormal bipolar10 μm
Normal Abnormal
5 μm
5 μm
Luc Chk1shRNA
Chk1
-actin
Cdc25b
shRNA
β-actin
Pericentrin/α-tubulin/DAPI
0
20
40
0
20
40
60
80
100–
a
de f
b c
LucCdc25b–
Figure 7 Characterization of mitotic spindle defects in Mcph1-del neuropro-genitors and MEFs by Chk1 and/or Cdc25b knockdown. (a) Spindle alignmentof mitotic Mcph1-del primary neuroprogenitor cells. The metaphases ofneuroprogenitor cells were stained for α-tubulin (spindle), pericentrin(centrosome) and DAPI (DNA). A normal mitotic figure (top left image) andseveral abnormal mitotic figures are shown. (b) Quantification of the totalmitotic abnormalities (see a). n, the number of cells scored. Mean±s.e.m.of four embryos of each genotype is shown. Student’s t -test was carriedout for statistical analysis. (c) Examples of mitotic spindle aberrations(multipolar and abnormal bipolar spindles) in Mcph1-del 3T3 MEFstransfected with a GFP-tagged Luc shRNA. GFP+ (green) anaphase cells werestained with antibodies against pericentrin (magenta), α-tubulin (red) andco-stained with DAPI (blue) at 24–28h after release from contact inhibition.
(d) Quantification of metaphase cells with spindle aberrations shown in c.Number of metaphase cells analysed: Mcph1-ctr+untransfected (n=165);Mcph1-ctr+ Luc shRNA (n = 142); Mcph1-ctr+ Chk1 shRNA (n = 130);Mcph1-ctr+ Chk1 and Cdc25b shRNA (n=130);Mcph1-del+untransfected(n=107); Mcph1-del+ Luc shRNA (n=102); Mcph1-del+ Cdc25b shRNA(n=105). Mean±s.e.m. of at least three independent experiments is shown.A one-way analysis of variance test was carried out for statistical analysis.∗∗∗, P < 0.001; NS, not significant. (e,f) Immunoblot analysis of knockingdown Chk1 (e) and Cdc25b (f). Wild-type 3T3 MEFs were untransfected (−)or transfected with GFP-tagged shRNA vector against control Luc, Chk1 (e)or Cdc25b (f). GFP-positive cells were sorted 48h after transfection usingFACS. β-actin was used as a loading control. Uncropped images of blots areshown in Supplementary Fig. S9.
DNA repair defects26 and a PCC phenotype56, but not microcephaly.The reason for the lack of the brain phenotype in these mutant micemay lie within the gene disruption strategies. For example, in a previousstudy in which exon 2 was deleted, a shorter transcript was stilldetected26. Whether this aberrant transcript would produce a truncatedprotein is unknown, but several putative Kozak consensuses in exons 1and 4 were noted (data not shown). In another study56 theMcph1 locuswas disrupted by inserting a gene-trap cassette into intron 12, whichmay generate a hypomorphic mutation.Mcph1 deficiency can alter spindle orientation and thereby affect the
progenitor division mode. Recent studies show that centrosomes playan important role in neurogenesis27,32–34, enabling neuroprogenitorsto maintain the neuroprogenitor pools while inducing the neuronalfate27,28,57. In this regard, MCPH1 deletion alters centrosomalChk1 behaviour and prematurely activates Cdk1 at the G2–Mtransition in neuroprogenitors, consistent with previous studies usingMCPH1 patient lymphoblast cells16,35. This impaired Chk1–Cdk1axis results in premature mitotic entry, which leaves the centrosomematuration behind (compare Fig. 6a and c). Two centrosomes arrivein mitosis unequally with a differential organizing capacity to alignmitotic spindles asymmetrically38 leading to the bypass of the apicalmembrane favouring asymmetric inheritance of apical proteins(for example, the Par complex), thereby dictating the change of
neuroprogenitor divisions and cell fates27,32,38 (Supplementary Fig. S8).Silencing Chk1 resulted in mitotic spindle defects (see Fig. 7d), inagreement with previous studies40,41 and intriguingly, shifted themitotic plane of neuroprogenitors favouring the post-mitotic cellfate. Consistent with a previous study in U2OS cells41, geneticallysilencing Cdc25b can correct Chk1-knockdown-mediated mitoticspindle misalignment in MEFs. Most importantly, it repressedthe high level of post-mitotic cell production of neuroprogenitorsinduced by Mcph1 deletion. Finally, premature metaphase entry maycompromise the splitting of the basal process normally occurring inprometaphase, and this could also contribute to premature switchingto asymmetric division58.MCPH1 is required for precise spindle orientation during
neuroprogenitor division. It achieves this by controlling thecentrosomal Chk1–Cdk1 activities to ensure propermitotic progressionand coupling to the centrosome cycle. Asynchronization of the cellcycle and the centrosome cycle disturbs mitotic spindle alignment;if the disturbance is too severe, the spindle misalignment reachesa threshold that would trigger mitotic catastrophe (SupplementaryFig. S8). Through a delicate process, MCPH1 maintains thebalance between the symmetric (proliferative) and asymmetric(neurongenic) division of neuroprogenitors, which otherwise may leadto insufficient neuroprogenitor pools during neocortical development.
1332 NATURE CELL BIOLOGY VOLUME 13 | NUMBER 11 | NOVEMBER 2011
© 2011 Macmillan Publishers Limited. All rights reserved.

ART I C L E S
c
0
5
10
15
20
25
30
Luc shRNA
Chk1 shRNA
Chk1 + Cdc25b shRNA
* *
NS
Per
cent
age
ofG
FP+K
i67
– in
all
GFP
+
Mcph1-ctr Mcph1-del
Luc shRNA++Cdc25b shRNA ++
**
05
1015202530354045
NS*
Per
cent
age
of G
FP+K
i67–
in a
ll G
FP+
b GFP-tagged Chk1 shRNA
GFP-tagged Luc shRNA
GFP-tagged Chk1 + Cdc25b shRNA
Mcph1-ctr
Mcph1-del
50 µm
Luc shRNA Cdc25b shRNA
Cdc25b shRNA
50 µm
10 µm
10 µm
Per
cent
age
of
GFP
+ c
ells
pos
sess
ing
uneq
ually
'cad
herin
hol
e'
a
0
20
40
60
80
Luc
shRNA
(n =
20)
Equal
Unequal
P = 0.0112Chk
1 sh
RNA
(n =
23)
2 µm
NS
NSLuc shRNA
GFP+ Ki67 DNA
GFP+ Ki67 DNA
ed
N-cad DAPI GFP Merge
Figure 8 In vivo silencing of Chk1 and Cdc25b in the neocortex by inutero electroporation. (a) Analysis of the cleavage plane after Chk1 shRNAtransfection in vivo. Left, the equal and unequal distribution of the apicalplasma membrane of dividing neuroprogenitors of E15.5 brains that wereelectroporated at E13.5 with indicated EGFP-tagged shRNA vectors is shown.The sections were immunostained for N-cadherin (N-cad, red) to mark theapical plasma membrane (cadherin hole; yellow bars) of the transfected cells(green). The cleavage plane of mitotic neuroprogenitors is indicated with awhite dashed line. Right, quantification. Mean±s.e.m. of three embryos ofeach genotype is shown. n, the number of mitotic figures scored. Student’st -test was carried out for statistical analysis. (b) Representative E15.5 brainsections two days after in utero electroporation with the indicated vectorexpressing EGFP–Luc shRNA, EGFP–Chk1 shRNA or EGFP–Chk1 shRNAtogether with Cdc25b shRNA. The staining channels from the dashed squareare shown. (c) Quantification of the GFP-positive cells in b. The histogram
shows the ratio of non-proliferating neuronal (Ki67−GFP+) cells versus allGFP-positive (Ki67+GFP+ and Ki67−GFP+) cells, which indicates the NPRof transfected progenitors. Mean± s.e.m. of three to five sections of atleast three mice of each genotype is shown. A one-way analysis of variancetest was carried out for statistical analysis. (d) Representative images ofbrain sections. The cell-cycle exit was measured in wild-type (Mcph1-ctr)or mutant (Mcph1-del) E15.5 brain sections following electroporationat E13.5 with vectors expressing control EGFP-tagged Luc or Cdc25bshRNA. The staining channels from the dashed square are shown below.(e) The NPR of transfected progenitors is quantified by scoring the numberof GFP-positive-only (Ki67−GFP+) cells divided by the number of allGFP-positive (Ki67+GFP+ and Ki67−GFP+) cells. Mean±s.e.m. of at leastthree sections of three to four mice of each genotype is shown. A one-wayanalysis of variance test was carried out for statistical analysis. ∗, P <0.05;∗∗, P <0.01; NS, not significant.
This mechanism may also be of relevance to the aetiology of otherhuman neurodevelopmental disorders and mammalian brain sizemaintenance. �
METHODSMethods and any associated references are available in the onlineversion of the paper at http://www.nature.com/naturecellbiology
Note: Supplementary Information is available on the Nature Cell Biology website
ACKNOWLEDGEMENTSWe thank L. Frappart for the advice and the discussion on histological analysis andZ. Xu for the introduction into the in utero electroporation technology. We aregrateful to M. Baldauf for his histological assistance, M. Welzel for her technicalsupport and D. Galendo, C. Birch-Hirschfeld and C. Mueller for their assistance in
the maintenance of the animal colonies. We are also grateful to M. Trajkovic-Arsicfor the advice on the in situ hybridization techniques and A. Gompf for the FACS.We also would like to thank P. Herrlich, H. Heuer, T. Li and Y. Yang for theircritical reading of the manuscript. Further thanks go to E. Stoeckl for editing themanuscript. We are also grateful to many other members of our laboratory for thehelpful discussions. R.G., M.S. and Z.W.Z. are supported by a fellowship of theLeibniz Graduate School on Ageing (LGSA) Programme. P-O.F. is supported by anEmmy Noether Grant from the Deutschen Forschungsgemeinschaft (DFG). Z-Q.W.is supported in part by the DFG, Germany.
AUTHOR CONTRIBUTIONSR.G. carried out most of the experiments, analysed data and prepared thefigures and the manuscript; Z.W.Z. carried out in situ hybridization, in uteroelectroporation, immunoblot analysis and analysed data; M.S. carried out genetargeting in embryonic stem cells and analysed gene expression; P-O.F. assisted withneurosphere experiments; T.J. contributed to mouse colony maintenance; Z-Q.W.designed experiments, analysed data and composed the manuscript.
NATURE CELL BIOLOGY VOLUME 13 | NUMBER 11 | NOVEMBER 2011 1333
© 2011 Macmillan Publishers Limited. All rights reserved.

ART I C L E S
COMPETING FINANCIAL INTERESTSThe authors declare no competing financial interests.
Published online at http://www.nature.com/naturecellbiologyReprints and permissions information is available online at http://www.nature.com/reprints
1. Tang, B. L. Molecular genetic determinants of human brain size. Biochem. Biophys.Res. Commun. 345, 911–916 (2006).
2. Evans, P. D. et al. Microcephalin, a gene regulating brain size, continues to evolveadaptively in humans. Science 309, 1717–1720 (2005).
3. Wang, Y. Q. & Su, B. Molecular evolution of microcephalin, a gene determininghuman brain size. Hum. Mol. Genet. 13, 1131–1137 (2004).
4. Woods, C. G., Bond, J. & Enard, W. Autosomal recessive primary microcephaly(MCPH): a review of clinical, molecular, and evolutionary findings. Am. J.Hum. Genet. 76, 717–728 (2005).
5. Thornton, G. K. & Woods, C. G. Primary microcephaly: do all roads lead to Rome?Trends Genet. 25, 501–510 (2009).
6. Nicholas, A. K. et al. WDR62 is associated with the spindle pole and is mutated inhuman microcephaly. Nat. Genet. 42, 1010–1014 (2010).
7. Guernsey, D. L. et al. Mutations in centrosomal protein CEP152 in primarymicrocephaly families linked to MCPH4. Am. J. Hum. Genet. 87, 40–51 (2010).
8. Yu, T. W. et al. Mutations in WDR62, encoding a centrosome-associated protein,cause microcephaly with simplified gyri and abnormal cortical architecture.Nat. Genet. 42, 1015–1020 (2010).
9. Neitzel, H. et al. Premature chromosome condensation in humans associated withmicrocephaly and mental retardation: a novel autosomal recessive condition. Am. J.Hum. Genet. 70, 1015–1022 (2002).
10. Trimborn, M. et al. Mutations in microcephalin cause aberrant regulation ofchromosome condensation. Am. J. Hum. Genet. 75, 261–266 (2004).
11. Wood, J.L., Liang, Y., Li, K. & Chen, J. Microcephalin/MCPH1 associates with theCondensin II complex to function in homologous recombination repair. J. Biol. Chem.283, 29586–29592 (2008).
12. Trimborn, M., Schindler, D., Neitzel, H. & Hirano, T. Misregulated chromosomecondensation in MCPH1 primary microcephaly is mediated by condensin II.Cell Cycle 5, 322–326 (2006).
13. Jeffers, L. J., Coull, B. J., Stack, S. J. & Morrison, C. G. Distinct BRCT domains inMcph1/Brit1 mediate ionizing radiation-induced focus formation and centrosomallocalization. Oncogene 27, 139–144 (2008).
14. Lin, S. Y., Rai, R., Li, K., Xu, Z. X. & Elledge, S. J. BRIT1/MCPH1 is a DNAdamage responsive protein that regulates the Brca1-Chk1 pathway, implicatingcheckpoint dysfunction in microcephaly. Proc. Natl Acad. Sci. USA 102,15105–15109 (2005).
15. Rai, R. et al. BRIT1 regulates early DNA damage response, chromosomal integrity,and cancer. Cancer Cell 10, 145–157 (2006).
16. Alderton, G. K. et al. Regulation of mitotic entry by microcephalin and its overlapwith ATR signalling. Nat. Cell Biol. 8, 725–733 (2006).
17. Xu, X., Lee, J. & Stern, D. F. Microcephalin is a DNA damage responseprotein involved in regulation of CHK1 and BRCA1. J. Biol. Chem. 279,34091–34094 (2004).
18. Peng, G. et al. BRIT1/MCPH1 links chromatin remodelling to DNA damage response.Nat. Cell Biol. 11, 865–872 (2009).
19. Yang, S. Z., Lin, F. T. & Lin, W. C. MCPH1/BRIT1 cooperates with E2F1in the activation of checkpoint, DNA repair and apoptosis. EMBO Rep. 9,907–915 (2008).
20. McKinnon, P. J. DNA repair deficiency and neurological disease. Nat. Rev. Neurosci.10, 100–112 (2009).
21. Griffith, E. et al. Mutations in pericentrin cause Seckel syndrome with defectiveATR-dependent DNA damage signaling. Nat. Genet. 40, 232–236 (2008).
22. Bond, J. & Woods, C. G. Cytoskeletal genes regulating brain size. Curr. Opin.Cell Biol. 18, 95–101 (2006).
23. Huttner, W. B. & Kosodo, Y. Symmetric versus asymmetric cell division duringneurogenesis in the developing vertebrate central nervous system. Curr. Opin.Cell Biol. 17, 648–657 (2005).
24. Kriegstein, A., Noctor, S. & Martinez-Cerdeno, V. Patterns of neural stem andprogenitor cell division may underlie evolutionary cortical expansion. Nat. Rev.Neurosci. 7, 883–890 (2006).
25. Jackson, A. P. et al. Identification of microcephalin, a protein implicatedin determining the size of the human brain. Am. J. Hum. Genet. 71,136–142 (2002).
26. Liang, Y. et al. BRIT1/MCPH1 is essential for mitotic and meiotic recombination DNArepair and maintaining genomic stability in mice. PLoS Genet. 6, e1000826 (2010).
27. Knoblich, J. A. Mechanisms of asymmetric stem cell division. Cell 132,583–597 (2008).
28. Zhong, W. & Chia, W. Neurogenesis and asymmetric cell division. Curr. Opin.Neurobiol. 18, 4–11 (2008).
29. Fish, J. L., Dehay, C., Kennedy, H. & Huttner, W. B. Making bigger brains-theevolution of neural-progenitor-cell division. J. Cell Sci. 121, 2783–2793 (2008).
30. Buchman, J. J. & Tsai, L. H. Spindle regulation in neural precursors of flies andmammals. Nat. Rev. Neurosci. 8, 89–100 (2007).
31. Kosodo, Y. et al. Asymmetric distribution of the apical plasma membraneduring neurogenic divisions of mammalian neuroepithelial cells. EMBO J. 23,2314–2324 (2004).
32. Wang, X. et al. Asymmetric centrosome inheritance maintains neural progenitors inthe neocortex. Nature 461, 947–955 (2009).
33. Higginbotham, H. R. & Gleeson, J. G. The centrosome in neuronal development.Trends Neurosci. 30, 276–283 (2007).
34. Doxsey, S., Zimmerman, W. & Mikule, K. Centrosome control of the cell cycle.Trends Cell Biol. 15, 303–311 (2005).
35. Tibelius, A. et al. Microcephalin and pericentrin regulate mitotic entry viacentrosome-associated Chk1. J. Cell Biol. 185, 1149–1157 (2009).
36. Kramer, A. et al. Centrosome-associated Chk1 prevents premature activation ofcyclin-B-Cdk1 kinase. Nat. Cell Biol. 6, 884–891 (2004).
37. Nigg, E. A. & Raff, J. W. Centrioles, centrosomes, and cilia in health and disease.Cell 139, 663–678 (2009).
38. Rebollo, E. et al. Functionally unequal centrosomes drive spindle orientationin asymmetrically dividing Drosophila neural stem cells. Dev. Cell 12,467–474 (2007).
39. Fukasawa, K. Oncogenes and tumour suppressors take on centrosomes. Nat. Rev.Cancer 7, 911–924 (2007).
40. Zachos, G. et al. Chk1 is required for spindle checkpoint function. Dev. Cell 12,247–260 (2007).
41. Loffler, H. et al. Chk1-dependent regulation of Cdc25B functions to coordinatemitotic events. Cell Cycle 5, 2543–2547 (2006).
42. Chen, Y. & Poon, R. Y. The multiple checkpoint functions of CHK1 and CHK2 inmaintenance of genome stability. Front. Biosci. 13, 5016–5029 (2008).
43. Roth, G. & Dicke, U. Evolution of the brain and intelligence. Trends Cogn. Sci. 9,250–257 (2005).
44. Vitale, I., Galluzzi, L., Castedo, M. & Kroemer, G. Mitotic catastrophe: a mechanismfor avoiding genomic instability. Nat. Rev. Mol. Cell Biol. 12, 385–392 (2011).
45. Castedo, M. et al. Cell death by mitotic catastrophe: a molecular definition.Oncogene 23, 2825–2837 (2004).
46. Rauch, A. et al. Mutations in the pericentrin (PCNT) gene cause primordial dwarfism.Science 319, 816–819 (2008).
47. Yingling, J. et al. Neuroepithelial stem cell proliferation requires LIS1 for precisespindle orientation and symmetric division. Cell 132, 474–486 (2008).
48. Lizarraga, S. B. et al. Cdk5rap2 regulates centrosome function and chromosomesegregation in neuronal progenitors. Development 137, 1907–1917 (2010).
49. Fish, J. L., Kosodo, Y., Enard, W., Paabo, S. & Huttner, W. B. Aspm specificallymaintains symmetric proliferative divisions of neuroepithelial cells. Proc. Natl Acad.Sci. USA 103, 10438–10443 (2006).
50. Pulvers, J. N. et al. Mutations in mouse Aspm (abnormal spindle-like microcephalyassociated) cause not only microcephaly but also major defects in the germline.Proc. Natl Acad. Sci. USA 107, 16595–16600 (2010).
51. Wakefield, J. G., Bonaccorsi, S. & Gatti, M. The Drosophila protein asp is involvedin microtubule organization during spindle formation and cytokinesis. J. Cell Biol.153, 637–648 (2001).
52. Lucas, E. P. & Raff, J. W. Maintaining the proper connection between the centriolesand the pericentriolar matrix requires Drosophila centrosomin. J. Cell Biol. 178,725–732 (2007).
53. Basto, R. et al. Flies without centrioles. Cell 125, 1375–1386 (2006).54. Brunk, K. et al. Microcephalin coordinates mitosis in the syncytial Drosophila embryo.
J. Cell Sci. 120, 3578–3588 (2007).55. Buchman, J. J. et al. Cdk5rap2 interacts with pericentrin to maintain the neural
progenitor pool in the developing neocortex. Neuron 66, 386–402 (2010).56. Trimborn, M. et al. Establishment of a mouse model with misregulated chromosome
condensation due to defective Mcph1 function. PLoS ONE 5, e9242 (2010).57. Gonczy, P. Mechanisms of asymmetric cell division: flies and worms pave the way.
Nat. Rev. Mol. Cell Biol. 9, 355–366 (2008).58. Kosodo, Y. et al. Cytokinesis of neuroepithelial cells can divide their basal process
before anaphase. EMBO J. 27, 3151–3163 (2008).
1334 NATURE CELL BIOLOGY VOLUME 13 | NUMBER 11 | NOVEMBER 2011
© 2011 Macmillan Publishers Limited. All rights reserved.

DOI: 10.1038/ncb2342 METHODS
METHODSOligoneucleotide sequencesofPCRprimers. For the PCRgenotyping ofmutantmice, the following primers were used: I5s, 5′-AGATCTCATTGCAGGTGGTTG-3′;I5as, 5′-GCTGTGGATAACCTGAAGCA-3′; Neoas, 5′-AGGAGCAAAGCTGCTAT-TGG-3′; I3s, 5′-CTTCATGTAGAAAGTTTAGGACTTG-3′. The primer pair I5sand Neoas was used to detect the targeted allele (T) and the primer pair I3sand I5as was used for the detection of the deleted allele (1). The primerpair I5s and I5as could detect the wild-type allele. For RT–PCR amplifications,the following primers were used: E3s, 5′-AAGCAAGTGACCCATGTGAT-3′; E4s,5′-AGGATGGCTGGAGCACTTGT-3′; E5as, 5′-CTAGAGCTGCCTTTTGCCT-3′;E6/7as, 5′-CAACATCTGGGAGGAGGTA-3′.
RT–PCR. The total RNA was isolated from the brain using Tri-Reagent (Sigma-Aldrich). A quantity of 1 µg of RNA was used for a reverse transcription using 100units of Superscript III reverse transcriptase (Invitrogen).
Gene targeting of theMcph1 gene in embryonic stemcells and the generationofMcph1mutantmice. Weused recombineering technology to construct the genetargeting vector. One LoxP and the Flp–Neo–Flp–LoxP cassette were introducedinto intron 3 and intron 5, respectively, generating the targeting vectorMcph1Ex4–5-CKO. After electroporation of this vector into embryonic stem cells, targetedembryonic stem cell clones (Mcph1+/T ) were identified by Southern blotting.The pMC–Cre plasmid was electroporated into these embryonic stem cells todelete exons 4–5 (Mcph1+/1). Mcph1+/1 embryonic stem cells were injected intoblastocysts to establishMcph1+/1 mouse lines. To analyse the 5′-arm integration ofthe targeting vector into the Mcph1 locus, embryonic stem cell DNA was digestedwith BamHI and blots were hybridized with a probe corresponding to intron 3 (I-3).To analyse the 3′-arm of the targeting event, DNA was digested with BclI and blotswere hybridized with a probe corresponding to intron 6 (I-6). To identify the deletedallele after Cre transfection, embryonic stem cell DNAwas digestedwithHindIII andthe blot was hybridized with probe I-6.
Construction of shRNA vectors. The construction of shRNA expression vectorswas carried out as previously described59. All oligonucleotides contained the hairpinloop sequence 5′-TTCAAGAGA-3′. The targeting sequences were: luciferase shRNA,5′-GGCTTGCCAGCAACTTACA-3′; Chk1 shRNA, 5′-GGAAGAAGAGTTGTA-TGAATC-3′; Cdc25b shRNA, 5′-GGCCCGTGTCTTTCGCTCA-3′.
In situ hybridization. A complementary DNA probe corresponding to 4–954nucleotides of mouse Mcph1 cDNA (GenBank accession number NM173189) wasgenerated by PCR and subcloned into the pBluescript II SK(-) Vector (Stratagene).Sense or anti-sense probes were synthesized with the Riboprobe System-T3/T7Kit (Promega) and labelled with 35S. After a mild alkaline hydrolysis, 35S-labelledriboprobes of 250 base pairs were used for hybridization of sections and then dippedinKodakNTB2 nuclear emulsion and stored at 4 ◦C for 3–4weeks. The sectionsweredeveloped and stained with haematoxylin and eosin. Autoradiograms were analysedunder a dark-field illumination microscope.
Histological analysis. Tissues were fixed with 4% paraformaldehyde at 4 ◦C for1–2 days and embedded in paraffin. For cryosections, tissues were cryoprotected in30% sucrose at 4 ◦C, followed by freezing at −80 ◦Covernight. Paraffin blocks werecut at 5-µm thickness and cryosections at 12-µm thickness.
TUNEL reaction. Terminal deoxynucleotidyl transferase was purchased fromFermentas and the reaction was carried out according to the manufacturer’sinstructions. The TUNEL reaction was carried out on cryosections.
In vivo BrdU labelling and immunohistological staining. Pregnant mice wereinjected intraperitoneally with a single dose of BrdU at 50 µg g−1 body weight andkilled either 1 h later for the analysis of the S-phase cells or 24 h later for theanalysis of the cell-cycle exit. Immunostaining with the rat BrdU antibody (1:100,Abcam) or with rabbit Ki67 antibody (1:100, NeoMarkers) was carried out onparaffin sections. The CCEI was calculated as the number of cells that exited the cellcycle (BrdU+Ki67−) and is shown as a percentage of the total BrdU-positive cells(BrdU+Ki67− and BrdU+Ki67+). To monitor DNA breaks, the mouse monoclonalγ-H2AX antibody (1:500, Upstate) was used for staining brain cryosections.
Analysis of division plane orientation. After immunostaining with mousemonoclonal γ-tubulin antibody (1:200, Sigma-Aldrich) or with the mousemonoclonal α-tubulin antibody (1:300, Sigma-Aldrich), the position of bothcentrosomes (γ-tubulin positive) in mitotic cells marks the cleavage plane inrelation to the ventricular surface. To measure the distribution of the apical plasmamembrane, neuroprogenitor cells of brain sections were immunostained with
the rabbit polyclonal pan-cadherin antibody (1:300, Abcam), mouse monoclonalN-cadherin antibody (1:200, Becton Dickinson) or rabbit polyclonal ZO-1 antibody(1:100, Invitrogen). DAPI staining of chromosomes was used to mark the cleavageplanes of neuroepithelial cells in anaphase or telophase.
EdU labelling of neuroprogenitors. Cumulative EdU labelling was carried outbasically according to previous protocols60. Briefly, intraperitoneal injections of100 µg EdU (Sigma-Aldrich) into pregnant mice at E14.5 were repeated at 1, 2 and3 h and then every 3 h for up to 18 h. EdU staining was carried out on cryosectionsusing a Click-iT EdU AlexaFluor 647 Imaging Kit (Invitrogen). For the mitotic EdUlabelling index, before EdU staining, cryosections were stained with the monoclonalrat p-H3-antibody (1:500, Abcam) overnight at 4 ◦C and then with the anti-rat-Cy2antibody, followed by fixation with 4% paraformaldehyde.
Measurement of the cell-cycle length. The length of cell-cycle phases wascalculated within the ventricular zone by a nonlinear regression analysis of thecumulative and themitotic EdU labelling indices as described previously60,61. Briefly,the intercept of the nonlinear fit (Mcph1-ctr, R2
= 0.940; Mcph1-del, R2= 0.984)
with the abscissa (y) corresponds to the length of S-phase (TS) relative to thecell-cycle length (TC). The time point when the entire growth fraction (GF) waslabelled corresponds to TC–TS. With the equation y = (GF/TC)× t + LI0 (thelabelling index at time point t = 0) and LI0=TS/TC, the cell cycle length TC and theS-phase lengthTS were calculated61. The average length of G2 (TG2) was estimated bythe time the cells in the ventricular zone required to reach the half-maximum of theEdU labelling of apical mitotic (p-H3-positive) cells. The length of M-phase (TM)was calculated by determining the percentage of ventricular zone cells in mitosis,which corresponds to TM relative to TC. The length of G1 (TG1) was calculated withthe values of TC, TS, TG2 and TM.
In utero electroporation. In utero electroporation was carried out as previouslydescribed32,62. Briefly, plasmid DNA was injected into the lateral ventricle ofE13.5 embryos. The ventricular region of the embryos was flanked with electrodes(CUY650P5, Nepa Gene) and pulsed five times at 35V for 50ms (950ms interval)with an electroporator (T830 BTX, Genetronics).
Neurosphere culture and DNA-damage treatment. The neurosphere forma-tion assay was carried out as described previously63. For the self-renewal assay,p0 and p1 neurospheres were cultured for 7 days. Neuroprogenitor cells werecultured in self-renewal medium (DMEM-NutMix, F12 GlutaMAX (Invitrogen)supplemented with B-27, penicillin/streptomycin (Invitrogen), 10 ngml−1 EGF(Peprotech) and 20 ngml−1 bFGF (Peprotech)). For DNA-damage treatment, p0neurospheres were cultured for 5 days and treated with 2mM hydroxyurea for3 h. The cells were collected 0, 3 or 6 h after drug removal for immunoblotanalysis. For the time course analysis of Cdk1 activation, primary neurospheres weresynchronized by a double-thymidine block, starting at day 5 after dissociation andproteins were isolated at indicated times after release from the block.
Cell synchronization. For cell synchronization we followed a previous protocolwith some modifications64. Briefly, neurospheres or MEF cells were treated with2mM thymidine (Sigma-Aldrich) for 19 h and incubated with a fresh medium for9 h. The second thymidine incubation continued for another 16 h.
Immunostaining of neuroprogenitor cells in vitro. Primary neurospheres weresynchronized by a double-thymidine block, dissociated and then plated onto poly-d-lysine-coated coverslips and fixed 6 h later either with 4% paraformaldehyde for7min at 4 ◦C or with methanol for 10min at −20 ◦C. To determine the subcellularlocalization of Chk1, neuroprogenitor cells were stained with the rabbit Chk1antibody (1:200, Cell Signaling Technology) and the mouse monoclonal γ-tubulinantibody (1:300, Sigma-Aldrich). To analyse cell-cycle progression, themouse cyclinB1 antibody (1:100, Becton Dickinson), the rabbit Cdk1-Y18p antibody (1:100, CellSignaling Technology) and the rabbit p-H3 antibody (1:200, Millipore) were used.To analyse spindle alignment, the mouse monoclonal α-tubulin antibody (1:500,Sigma-Aldrich) and the rabbit polyclonal pericentrin antibody (1:200, Covance)were used. To analyse centrosomal maturation, synchronized methanol-fixedneuroprogenitor cells were stained with mouse monoclonal γ-tubulin antibody(1:300, Sigma-Aldrich) and rabbit polyclonal ODF2 antibody (1:100, Abcam).
Quantificationof theODF2signal intensity inmetaphaseneuroprogenitors.Neurospheres were synchronized by a double-thymidine block and released intometaphase. Dissociated neuroprogenitors were stained with mouse monoclonalγ-tubulin antibody (1:300, Sigma-Aldrich) and rabbit polyclonal ODF2 antibody(1:100, Abcam). Quantification of the ODF2 signal intensity was carried out usingZeiss LSM software (Zeiss).
NATURE CELL BIOLOGY
© 2011 Macmillan Publishers Limited. All rights reserved.
METHODS DOI: 10.1038/ncb2342
MEF culture, transfection, synchronization and immunostaining. MEFswere isolated and immortalized according to the 3T3 protocol. 3T3 MEFs weretransfected with GFP-shRNA vectors using the Amaxa electroporation system(Lonza) and synchronized by contact inhibition for 48 h. For immunofluorescencestaining, MEFs were fixed 24–28 h after release from contact inhibition, and thenstained with a polyclonal pericentrin antibody (1:200, Covance) and with the mousemonoclonal α-tubulin antibody (1:300, Sigma-Aldrich). For immunoblot analysis,3T3 MEFs were cultured for 48 h after transfection, followed by fluorescence-activated cell sorting (FACS) of GFP+ cells and protein isolation.
Immunoblot analysis. Immunoblotting was carried out as previously described63.Themembranes were immunoblottedwith primary antibodies: rabbit polyclonal an-tibodies to phospho-S317-Chk1 (1:1,000, Bethyl Laboratories), MCPH1, phospho-S15-p53 and phospho-Y18-Cdk1 (1:1,000, Cell Signaling Technology), mouse mon-oclonal antibodies toChk2 (1:1,000, Upstate) and β-actin (1:10,000, Sigma-Aldrich),sheep polyclonal Chk1 antibody (1:1,000, Abcam) and rabbit polyclonal Cdc25bantibody (1:1,000, Cell Signaling Technology).
Cytogenetic analysis. Metaphase spreads from neuroprogenitors were preparedas described previously63. The length of each chromosome within the individualmetaphase spreads was measured using Zeiss AxioVision software.
59. Zhou, Z. et al. PRMT5 regulates Golgi apparatus structure through methylation ofthe golgin GM130. Cell Res. 20, 1023–1033 (2010).
60. Arai, Y. et al. Neural stem and progenitor cells shorten S-phase on commitment toneuron production. Nat. Commun. 2, 154.
61. Nowakowski, R. S., Lewin, S. B. & Miller, M. W. Bromodeoxyuridine immunohisto-chemical determination of the lengths of the cell cycle and the DNA-synthetic phasefor an anatomically defined population. J. Neurocytol. 18, 311–318 (1989).
62. Saito, T. In vivo electroporation in the embryonic mouse central nervous system. Nat.Protoc. 1, 1552–1558 (2006).
63. Frappart, P. O. et al. An essential function for NBS1 in the prevention of ataxia andcerebellar defects. Nat. Med. 11, 538–544 (2005).
64. Akhter, S. et al. Deficiency in SNM1 abolishes an early mitotic checkpoint inducedby spindle stress. Mol. Cell. Biol. 24, 10448–10455 (2004).
NATURE CELL BIOLOGY
© 2011 Macmillan Publishers Limited. All rights reserved.
S U P P L E M E N TA RY I N F O R M AT I O N
WWW.NATURE.COM/NATURECELLBIOLOGY 1
DOI: 10.1038/ncb2342
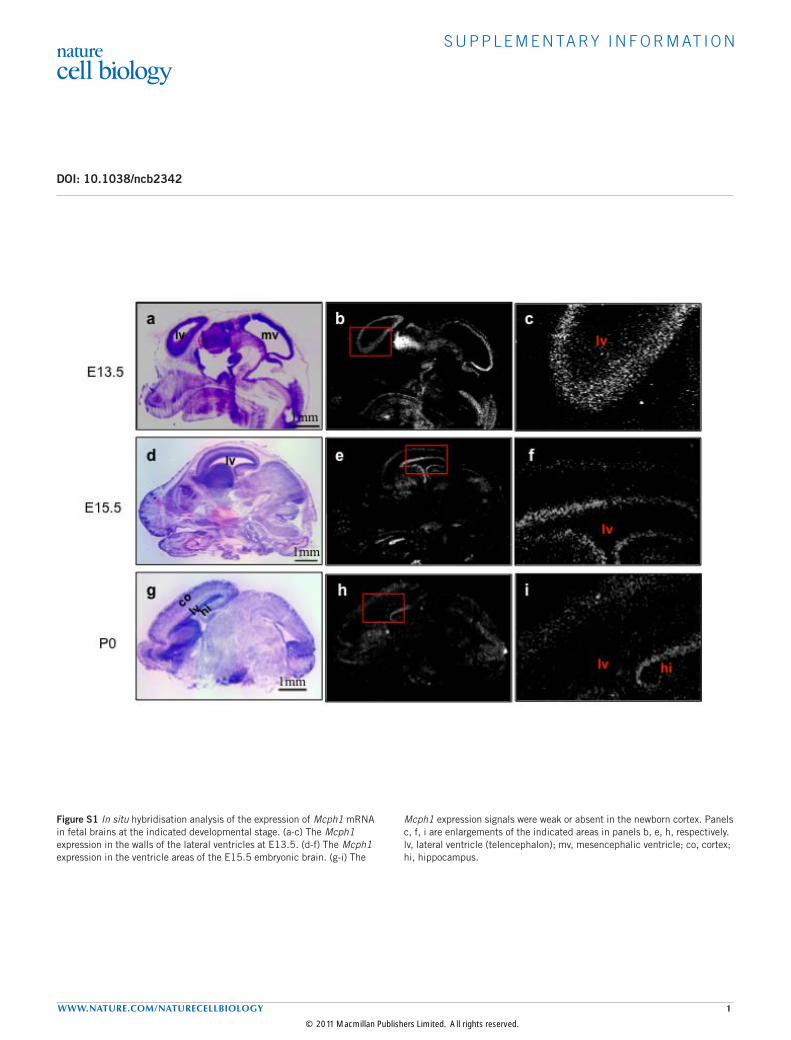
Figure S1 In situ hybridisation analysis of the expression of Mcph1 mRNA in fetal brains at the indicated developmental stage. (a-c) The Mcph1 expression in the walls of the lateral ventricles at E13.5. (d-f) The Mcph1 expression in the ventricle areas of the E15.5 embryonic brain. (g-i) The
Mcph1 expression signals were weak or absent in the newborn cortex. Panels c, f, i are enlargements of the indicated areas in panels b, e, h, respectively. lv, lateral ventricle (telencephalon); mv, mesencephalic ventricle; co, cortex; hi, hippocampus.
© 2011 Macmillan Publishers Limited. All rights reserved.

S U P P L E M E N TA RY I N F O R M AT I O N
2 WWW.NATURE.COM/NATURECELLBIOLOGY
Figure S2 Generation of Mcph1-knockout mice. (a) The gene targeting strategy to disrupt the Mcph1 gene in ES cells. After a homologous recombination, we obtained ES cells with one targeted allele of Mcph1 (Mcph1T), in which exons 4 and 5 (and a Frt-neo-Frt cassette in intron 5) were flanked by two LoxP sites. The expression of Cre recombinase in Mcph1+/T ES cells deleted exon 4–5 Mcph1 allele (Mcph1+/∆), generating stop codons in all reading frames in exon 6. The exons are indicated by the numbers in the boxes. The triangles represent the LoxP sites and the ovals represent the Frt sites. Two probes for the Southern blot analysis are indicated, I-3 and I-6. BHI, BamHI; HIII, HindIII. The letters in red indicate additional enzyme sites introduced by cloning. (b) Southern blotting of ES cells after gene targeting. DNA was digested with BamHI or BclI and hybridised with the intron 3 (I-3) or the intron 6 (I-6) probe,
respectively. After pMC-Cre transfection, ES cell clones were analysed by digestion of genomic DNA with HindIII and then hybridisation with the I-6 probe. Wt, wild type allele; T, targeted allele; ∆, deleted allele. The names of ES clones are indicated on the top of the gels. (c) RT-PCR analysis of the Mcph1 deletion in different regions of the brain. The primers used are depicted in the lower panel. The PCR reaction and the tissue samples are indicated on the right. (d) PCR analysis of the deletion of the Mcph1 gene in different regions of the brain and in neural progenitor cells isolated from three different E14.5 embryos. OB, olfactory bulb; CC, cerebral cortex; H, hypothalamus; BS, brain stem; C, cerebellum. Wt, wild type (300 bp); T, targeted (600 bp); ∆, deleted (900 bp). (e) Immunoblot analysis of the MCPH1 expression in the E14.5 neocortex and primary MEF cells of control and Mcph1-del mice. Two samples of each genotype are shown.
© 2011 Macmillan Publishers Limited. All rights reserved.
S U P P L E M E N TA RY I N F O R M AT I O N
WWW.NATURE.COM/NATURECELLBIOLOGY 3
Figure S3 DNA breaks and chromosome aberrations in neuroprogenitors. (a) Immunofluorescence staining of E15.5 sagittal brain sections with γ-H2AX antibody. The arrows indicate the γ-H2AX foci. The ventricular zone is shown. The panel on the right represents a quantification of the cells containing γ-H2AX foci. n = the total number of cells in the VZ/SVZ scored. Mean ± standard error of the mean of at least seven mice of each genotype is shown. Student’s t-test was performed for statistical analysis.
n.s., not significant. (b) Cytogenetic analysis of primary neurosphere cells. Chromosome breaks, gaps, and fusions of indicated metaphases were scored. (c) Immunoblot analysis of primary neuroprogenitors from Mcph1 control and Mcph1-deleted embryos after treatment with ironizing radiation (IR, 10 Gy) then harvested at the indicated time points after drug removal. The data represent three independent experiments using at least five independent neuroprogenitor populations of each genotype. U, untreated.
© 2011 Macmillan Publishers Limited. All rights reserved.
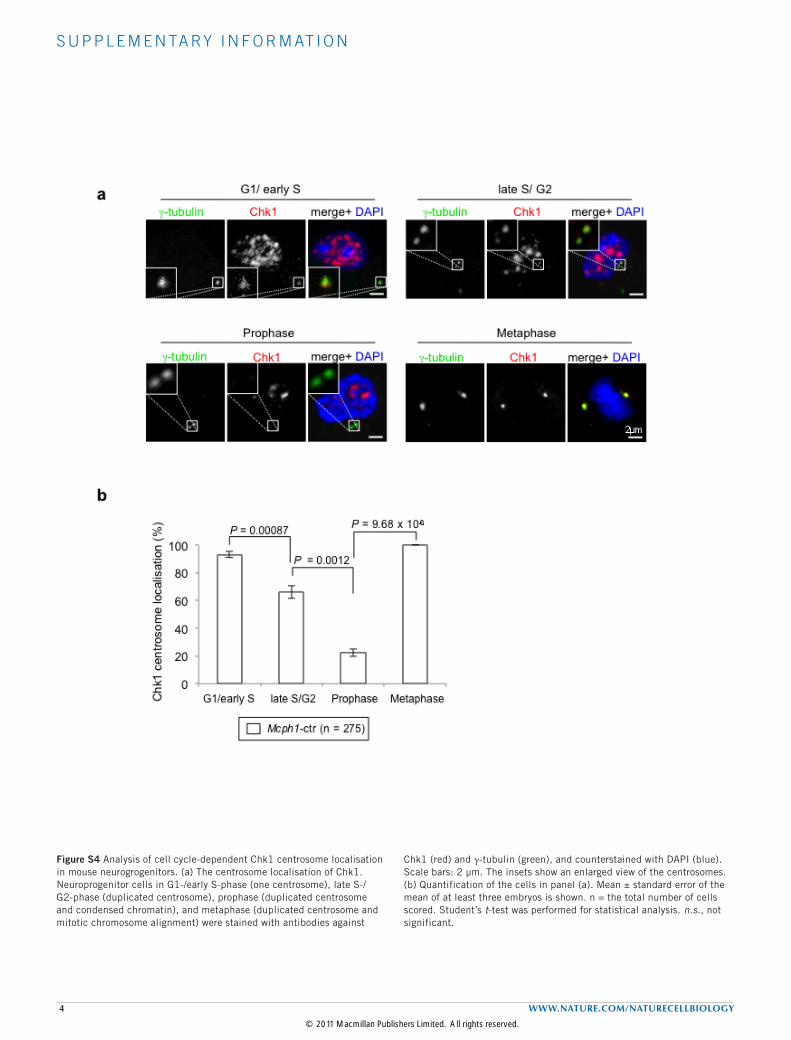
S U P P L E M E N TA RY I N F O R M AT I O N
4 WWW.NATURE.COM/NATURECELLBIOLOGY
Figure S4 Analysis of cell cycle-dependent Chk1 centrosome localisation in mouse neurogrogenitors. (a) The centrosome localisation of Chk1. Neuroprogenitor cells in G1-/early S-phase (one centrosome), late S-/G2-phase (duplicated centrosome), prophase (duplicated centrosome and condensed chromatin), and metaphase (duplicated centrosome and mitotic chromosome alignment) were stained with antibodies against
Chk1 (red) and γ-tubulin (green), and counterstained with DAPI (blue). Scale bars: 2 µm. The insets show an enlarged view of the centrosomes. (b) Quantification of the cells in panel (a). Mean ± standard error of the mean of at least three embryos is shown. n = the total number of cells scored. Student’s t-test was performed for statistical analysis. n.s., not significant.
© 2011 Macmillan Publishers Limited. All rights reserved.

S U P P L E M E N TA RY I N F O R M AT I O N
WWW.NATURE.COM/NATURECELLBIOLOGY 5
Figure S5 Immunoblot analysis of the DDR in primary neuroprogenitors. (a) Neurosphere cells from Mcph1 control and Mcph1-deleted embryos were treated with 2 mM HU for 3 h then harvested at the indicated time points after drug removal. (b) Quantification of the immunoblots shown in panel (a). The density
of the indicated protein band was corrected with respect to the actin loading control (except for the p-Chk1/Chk1 comparison). The vertical axis shows the ratio. U, untreated. The data represent three independent experiments using at least five independent neuroprogenitor populations of each genotype.
© 2011 Macmillan Publishers Limited. All rights reserved.

S U P P L E M E N TA RY I N F O R M AT I O N
6 WWW.NATURE.COM/NATURECELLBIOLOGY
Figure S6 (a) Chromosome hypercondensation in primary Mcph1-del neuroprogenitors. The representative images show metaphase spreads of Mcph1-ctr and Mcph1-del neural progenitor cells stained with DAPI (white). The panel on the right represents quantification of the relative length of all chromosomes from 15 metaphases (n) of each genotype. Mean ± standard error of mean is shown. Student’s t-test was performed for statistical analysis. (b-c) Cell cycle analysis by cumulative EdU labeling of the VZ of E14.5 brains and imbalanced maturation of centrosomes. (b) The cumulative EdU-labeling index after labelling for 1, 2, 3, 6, 9 and 18
h. The measurement of the EdU-labeling index was restricted to the VZ. The dashed line and the arrowheads indicate the growth fraction (GF). The arrows indicate the time point when the entire GF was labeled (TC-TS). Mean ± standard error of the mean is shown. (c) Cell cycle parameters of neuroprogenitors in the VZ of E14.5 embryos. The cell cycle phases were calculated from the data of the mitotic (Fig. 6b) and cumulative EdU-labelling panel (b) according to Ref 3. TC = total cell cycle length; TG1 = length of G1-phase; TS = length of S-phase; TG2 = length of G2-phase; TM = length of M-phase. S.E.M. = standard error of the mean.
© 2011 Macmillan Publishers Limited. All rights reserved.

S U P P L E M E N TA RY I N F O R M AT I O N
WWW.NATURE.COM/NATURECELLBIOLOGY 7
Figure S7 In vivo silencing Chk1 and Cdc25b in the neocortex by in utero electroporation. (a) The table summarises the total number of cells of each treatment (GFAP-ShRNA) scored from three to five sections of at least three
mice. (b) The table summarises the total number of cells of each treatment scored from at least three sections of three to four mice of each genotype (Mcph1-del and Mcph1-ctr).
© 2011 Macmillan Publishers Limited. All rights reserved.

S U P P L E M E N TA RY I N F O R M AT I O N
8 WWW.NATURE.COM/NATURECELLBIOLOGY
Figure S8 A working model to explain the function of MCPH1 in mitotic spindle alignment, neuroprogenitor division and apoptosis. Prophase and metaphase neuroprogenitors are shown. Premature mitotic entry (e.g. of Mcph1 mutant progenitors) decouples the centrosome cycle from the cell cycle, thereby affecting maturation and the activity of both mother-daughter centrosomes. Two centrosomes arrive in metaphase with an unequal organising capacity to align spindles properly. An inequality of mother-
daughter centrosomes is instrumental in guiding neuroprogenitor divisions asymmetrically. In addition, immature centrosomes or a compromised centrosome activity at mitosis may cause chromosome misalignment and chromosome catastrophe, which, depending on the severity, lead to cell death. Both the premature switch of the neuroprogenitor division mode from symmetric to asymmetric division and apoptosis will lead to a reduction of the neuroprogenitor pool and ultimately to a small brain size. See text for details.
© 2011 Macmillan Publishers Limited. All rights reserved.
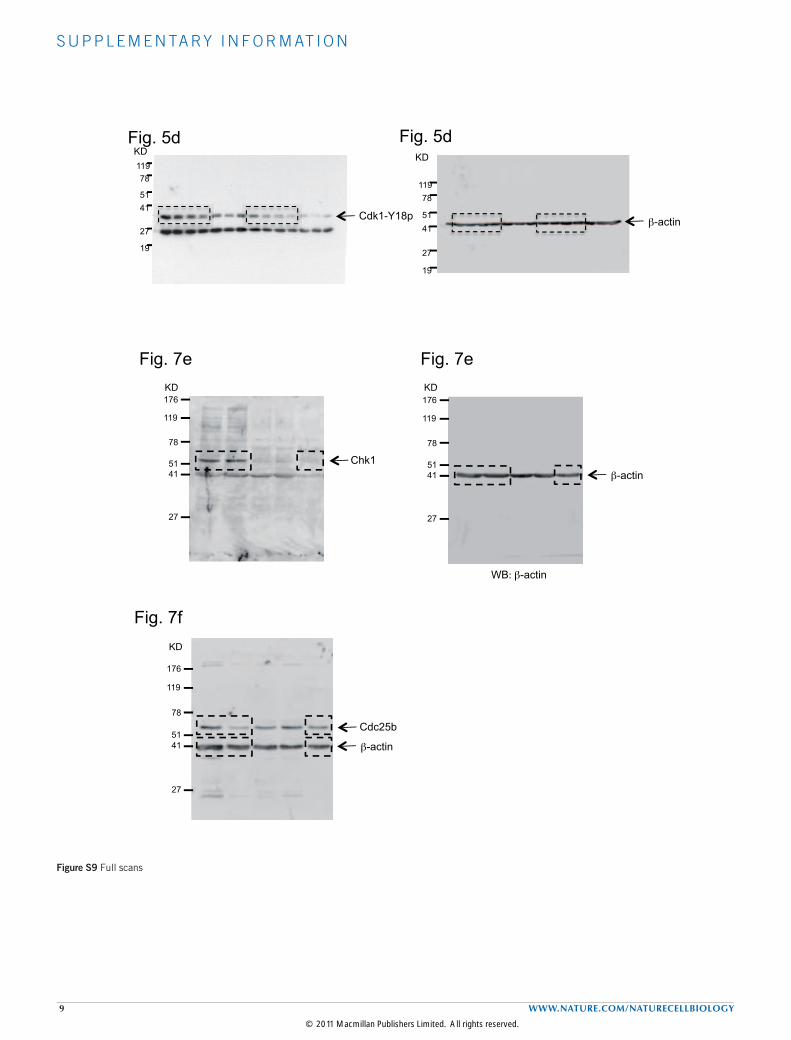
S U P P L E M E N TA RY I N F O R M AT I O N
9 WWW.NATURE.COM/NATURECELLBIOLOGY
176
119
78
51 41
27
176
119
78
51 41
27
Fig. 5d
176
119
78
51 41
27
Cdc25b
WB: -actin
#
119 78
51 41
27
19
* * * * * * 119 78
51 41
27
19
Gruber-Suppl.Fig. S9
Fig. 5d
Fig. 7e Fig. 7e
Fig. 7f
Cdk1-Y18p -actin
-actin
-actin
Chk1
KD
KD
KD
KD
KD
Figure S9 Full scans
© 2011 Macmillan Publishers Limited. All rights reserved.

S U P P L E M E N TA RY I N F O R M AT I O N
WWW.NATURE.COM/NATURECELLBIOLOGY 10
KD
176
119
78
51
41
MCPH1
KD
176
119
78
51
41
27
KD
176
119
78
51
41
27
Gruber-Suppl.Fig. S9
Suppl.Fig. S2e
Suppl.Fig. S3c
Suppl.Fig. S3c
-actin
-actin
Chk2
P53-Ser15-p
Figure S9 continued
© 2011 Macmillan Publishers Limited. All rights reserved.
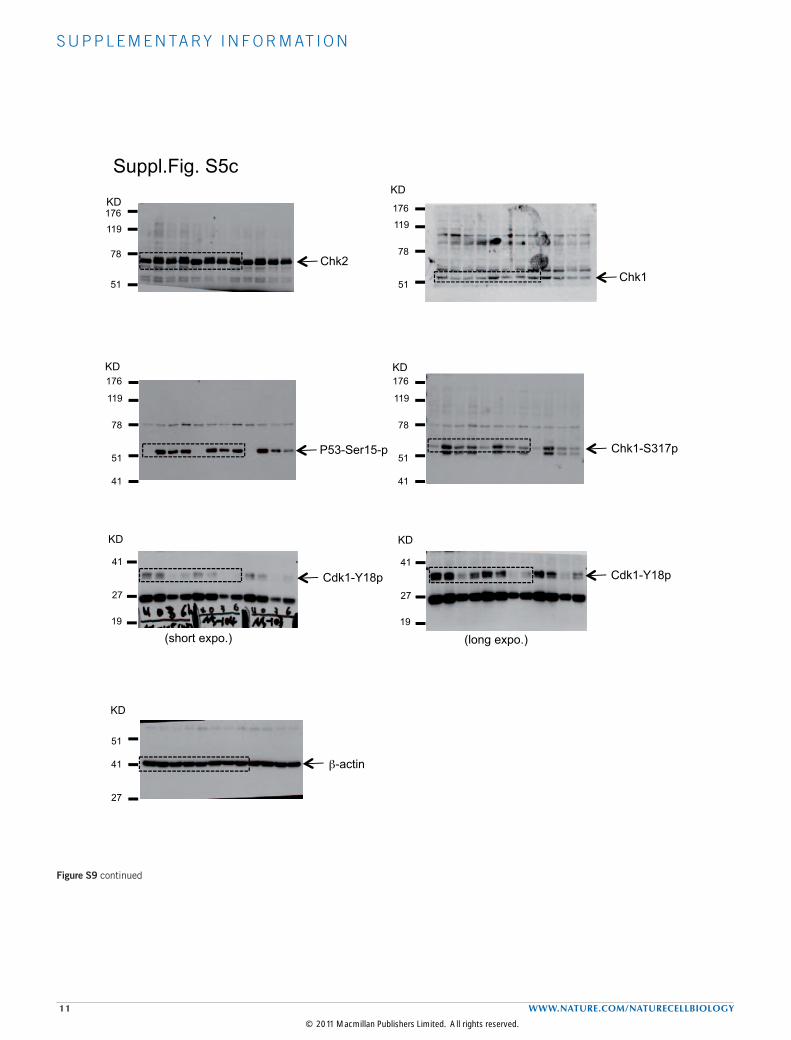
S U P P L E M E N TA RY I N F O R M AT I O N
11 WWW.NATURE.COM/NATURECELLBIOLOGY
KD 176 119
78
51
176
119
78
51
41
176
119
78
51
41
41
27
19
51
41
27
41
27
19
(short expo.) (long expo.)
176
119
78
51
Gruber-Suppl.Fig. S9
Suppl.Fig. S5c
Chk1 Chk2
P53-Ser15-p
Cdk1-Y18p Cdk1-Y18p
-actin
Chk1-S317p
KD
KD KD
KD KD
KD
Figure S9 continued
© 2011 Macmillan Publishers Limited. All rights reserved.