May 31, 2022 VIA ELECTRONIC FILING Utah Public Utilities ...
238
RICHARD GARLISH Vice President-Government Affairs & General Counsel 1407 W. North Temple, Suite 320 Salt Lake City, Utah 84116 Direct Dial: (801) 220-2533 [email protected] May 31, 2022 VIA ELECTRONIC FILING Utah Public Utilities, Energy, and Technology Interim Committee Senate Chair David P. Hinkins House Chair Carl R. Albrecht 210 House Building State Capitol Complex Salt Lake City, Utah 84114 [email protected] [email protected] Re: Sustainable Transportation and Energy Plan (STEP) Program Report Dear Chairs Hinkins and Albrecht: In accordance with section 54-20-105(6) of the Utah Code, Rocky Mountain Power hereby submits its fifth and final annual STEP Program Status Report (“STEP Report”). A similar document has been submitted to the Utah Public Service Commission, as required by state law under Senate Bill 115, Sustainable Transportation and Energy Plan Act, passed during the 2016 general session. The STEP Report contains the overall calendar year 2021 monthly accounting detail for the STEP program, as well as information on the individual STEP programs. Pursuant to section 54-20- 102(2) of the Utah Code, calendar year 2021 was the final year of the five-year pilot program. Rocky Mountain Power reports that all STEP projects have been completed, pending a few final program activities, such as final invoice payment and other close-out activities. Final individual program project reports that were not provided in previous annual reports are included in the STEP Report. If you or any committee members have questions or concerns regarding the STEP Report, please do not hesitate to reach out to me directly at [email protected] or 801-220-2533. Sincerely, Richard Garlish Vice President Government Affairs & General Counsel
-
Upload
khangminh22 -
Category
Documents
-
view
1 -
download
0
Transcript of May 31, 2022 VIA ELECTRONIC FILING Utah Public Utilities ...
RICHARD GARLISH Vice President-Government Affairs & General Counsel
1407 W. North Temple, Suite 320 Salt Lake City, Utah 84116
Direct Dial: (801) 220-2533 [email protected]
May 31, 2022 VIA ELECTRONIC FILING Utah Public Utilities, Energy, and Technology Interim Committee Senate Chair David P. Hinkins House Chair Carl R. Albrecht 210 House Building State Capitol Complex Salt Lake City, Utah 84114 [email protected] [email protected]
Re: Sustainable Transportation and Energy Plan (STEP) Program Report Dear Chairs Hinkins and Albrecht: In accordance with section 54-20-105(6) of the Utah Code, Rocky Mountain Power hereby submits its fifth and final annual STEP Program Status Report (“STEP Report”). A similar document has been submitted to the Utah Public Service Commission, as required by state law under Senate Bill 115, Sustainable Transportation and Energy Plan Act, passed during the 2016 general session.
The STEP Report contains the overall calendar year 2021 monthly accounting detail for the STEP program, as well as information on the individual STEP programs. Pursuant to section 54-20-102(2) of the Utah Code, calendar year 2021 was the final year of the five-year pilot program. Rocky Mountain Power reports that all STEP projects have been completed, pending a few final program activities, such as final invoice payment and other close-out activities. Final individual program project reports that were not provided in previous annual reports are included in the STEP Report. If you or any committee members have questions or concerns regarding the STEP Report, please do not hesitate to reach out to me directly at [email protected] or 801-220-2533. Sincerely, Richard Garlish Vice President Government Affairs & General Counsel
STEP PROGRAM STATUS REPORT
For Period Ended December 31, 2021

FIFTH ANNUAL STEP STATUS REPORT CALENDAR YEAR 2021
TABLE OF CONTENTS
Overall STEP Program Information:
STEP and USIP Accounting------------------------------------------------------- Page 1.0 STEP Assets and Liabilities ------------------------------------------------------ Page 1.1
STEP Project Reports: Electric Vehicle Charging Infrastructure-------------------------------------- Page 2.0 Woody Waste Co-Fire Biomass at Hunter Unit 3-------------------------- Page 3.0 NOx Neural Network Implementation---------------------------------------- Page 4.0 Alternative NOx Reduction------------------------------------------------------ Page 5.0 CO2 Enhanced Coal Bed Methane (CO2 Reduction)---------------------- Page 6.0 Cryogenic Carbon Capture (Emerging CO2 Capture)---------------------- Page 7.0 CARBONsafe (CO2 Sequestration Site Characterization)----------------- Page 8.0 Solar Thermal Assessment (Grid Performance)---------------------------- Page 9.0 Circuit Performance Meters (Substation Metering)--------------------- Page 10.0 Commercial Line Extension---------------------------------------------------- Page 11.0 Gadsby Emissions Curtailment------------------------------------------------ Page 12.0 Panguitch Solar and Energy Storage -----------------------------------------Page 13.0 Microgrid----------------------------------------------------------------------------Page 14.0 Smart Inverter---------------------------------------------------------------------Page 15.0 Battery Demand Response-----------------------------------------------------Page 16.0 Intermodal Hub--------------------------------------------------------------------Page 17.0 Advanced Resiliency Management System---------------------------------Page 18.0 Uinta Basin Study-----------------------------------------------------------------Page 20.0
Utah Solar Incentive Program: USIP Explanation------------------------------------------------------------------Page 19.0
2022 Annual STEP Status ReportSTEP and USIP AccountingCY 2021
2017-2021CY 2021 Cummulative
Page No. CY 2017 CY 2018 CY 2019 CY 2020 Jan-21 Feb-21 Mar-21 Apr-21 May-21 Jun-21 Jul-21 Aug-21 Sep-21 Oct-21 Nov-21 Dec-21 Total Total*
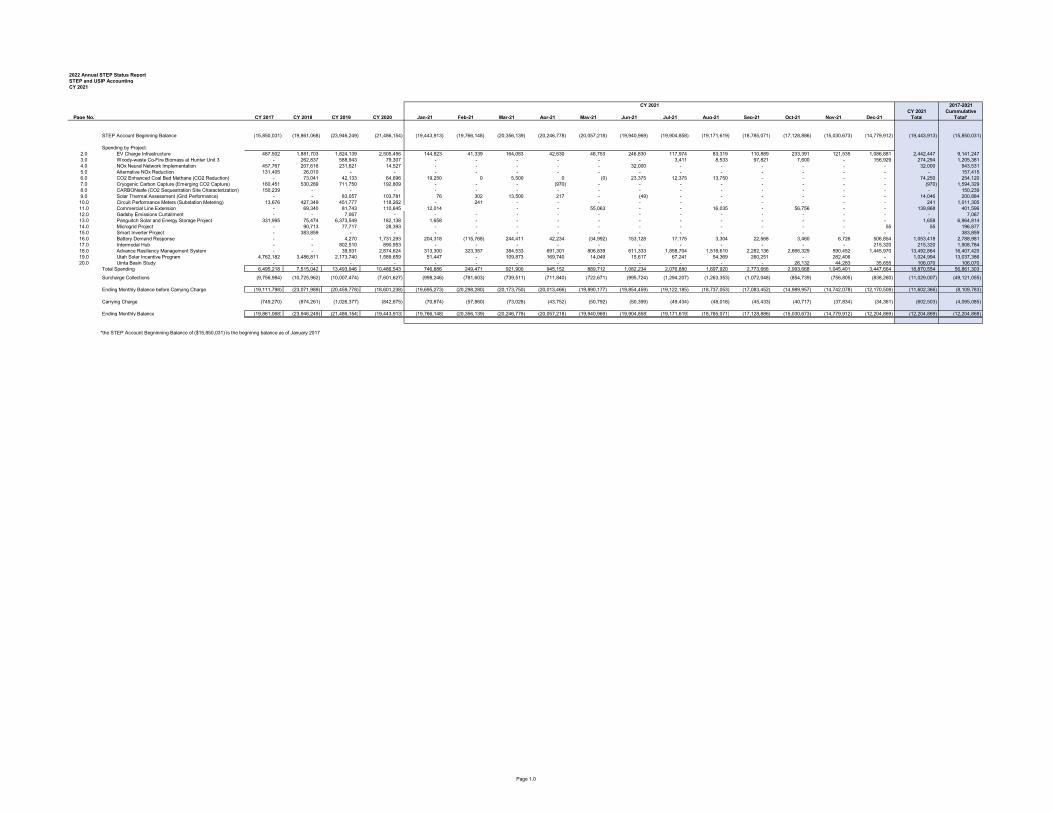
STEP Account Beginning Balance (15,850,031) (19,861,068) (23,946,249) (21,486,154) (19,443,913) (19,766,148) (20,356,139) (20,246,778) (20,057,218) (19,940,969) (19,904,858) (19,171,619) (18,785,071) (17,128,886) (15,030,673) (14,779,912) (19,443,913) (15,850,031)
Spending by Project:2.0 EV Charge Infrastructure 487,502 1,881,703 1,824,139 2,505,456 144,823 41,339 164,083 42,630 48,753 246,830 117,974 83,319 110,889 233,391 121,535 1,086,881 2,442,447 9,141,247 3.0 Woody-waste Co-Fire Biomass at Hunter Unit 3 - 262,837 588,943 79,307 - - - - - - 3,411 8,533 97,821 7,600 - 156,929 274,294 1,205,381 4.0 NOx Neural Network Implementation 457,767 207,616 231,621 14,527 - - - - - 32,000 - - - - - - 32,000 943,531 5.0 Alternative NOx Reduction 131,405 26,010 - - - - - - - - - - - - - - - 157,415 6.0 CO2 Enhanced Coal Bed Methane (CO2 Reduction) - 73,041 42,133 64,696 19,250 0 5,500 0 (0) 23,375 12,375 13,750 - - - - 74,250 254,120 7.0 Cryogenic Carbon Capture (Emerging CO2 Capture) 160,451 530,289 711,750 192,809 - - - (970) - - - - - - - - (970) 1,594,329 8.0 CARBONsafe (CO2 Sequestration Site Characterization) 150,239 - - - - - - - - - - - - - - - - 150,239 9.0 Solar Thermal Assessment (Grid Performance) - - 83,057 103,781 76 302 13,500 217 - (49) - - - - - - 14,046 200,884 10.0 Circuit Performance Meters (Substation Metering) 13,676 427,349 451,777 118,262 - 241 - - - - - - - - - - 241 1,011,305 11.0 Commercial Line Extension - 69,340 81,743 110,645 12,014 - - 55,063 - - 16,035 - 56,756 - - 139,868 401,596 12.0 Gadsby Emissions Curtailment - - 7,067 - - - - - - - - - - - - - - 7,067 13.0 Panguitch Solar and Energy Storage Project 331,995 75,474 6,373,549 182,138 1,658 - - - - - - - - - - - 1,658 6,964,814 14.0 Microgrid Project - 90,713 77,717 28,393 - - - - - - - - - - - 55 55 196,877 15.0 Smart Inverter Project - 383,859 - - - - - - - - - - - - - - - 383,859 16.0 Battery Demand Response - - 4,270 1,731,293 204,318 (115,768) 244,411 42,234 (34,992) 153,128 17,175 3,304 22,568 3,460 6,726 506,854 1,053,418 2,788,981 17.0 Intermodal Hub - - 802,510 890,953 - - - - - - - - - - - 215,320 215,320 1,908,784 18.0 Advance Resiliency Management System - - 39,931 2,874,624 313,300 323,357 384,533 691,301 806,839 611,333 1,858,704 1,518,610 2,282,136 2,666,329 590,452 1,445,970 13,492,864 16,407,420 19.0 Utah Solar Incentive Program 4,762,182 3,486,811 2,173,740 1,589,659 51,447 - 109,873 169,740 14,049 15,617 67,241 54,369 260,251 - 282,406 - 1,024,994 13,037,386 20.0 Uinta Basin Study - - - - - - - - - - - - - 26,132 44,283 35,655 106,070 106,070
Total Spending 6,495,218 7,515,042 13,493,946 10,486,543 746,886 249,471 921,900 945,152 889,712 1,082,234 2,076,880 1,697,920 2,773,666 2,993,668 1,045,401 3,447,664 18,870,554 56,861,303
Surcharge Collections (9,756,984) (10,725,962) (10,007,474) (7,601,627) (998,246) (781,603) (739,511) (711,840) (722,671) (995,724) (1,294,207) (1,263,353) (1,072,048) (854,739) (756,805) (838,260) (11,029,007) (49,121,055)
Ending Monthly Balance before Carrying Charge (19,111,798) (23,071,989) (20,459,778) (18,601,238) (19,695,273) (20,298,280) (20,173,750) (20,013,466) (19,890,177) (19,854,459) (19,122,185) (18,737,053) (17,083,452) (14,989,957) (14,742,078) (12,170,508) (11,602,366) (8,109,783)
Interest Carrying Charge (749,270) (874,261) (1,026,377) (842,675) (70,874) (57,860) (73,028) (43,752) (50,792) (50,399) (49,434) (48,018) (45,433) (40,717) (37,834) (34,361) (602,503) (4,095,085)
Ending Monthly Balance (19,861,068) (23,946,249) (21,486,154) (19,443,913) (19,766,148) (20,356,139) (20,246,778) (20,057,218) (19,940,969) (19,904,858) (19,171,619) (18,785,071) (17,128,886) (15,030,673) (14,779,912) (12,204,869) (12,204,869) (12,204,868)
*the STEP Account Begninning Balance of ($15,850,031) is the begninng balance as of January 2017
CY 2021
Page 1.0
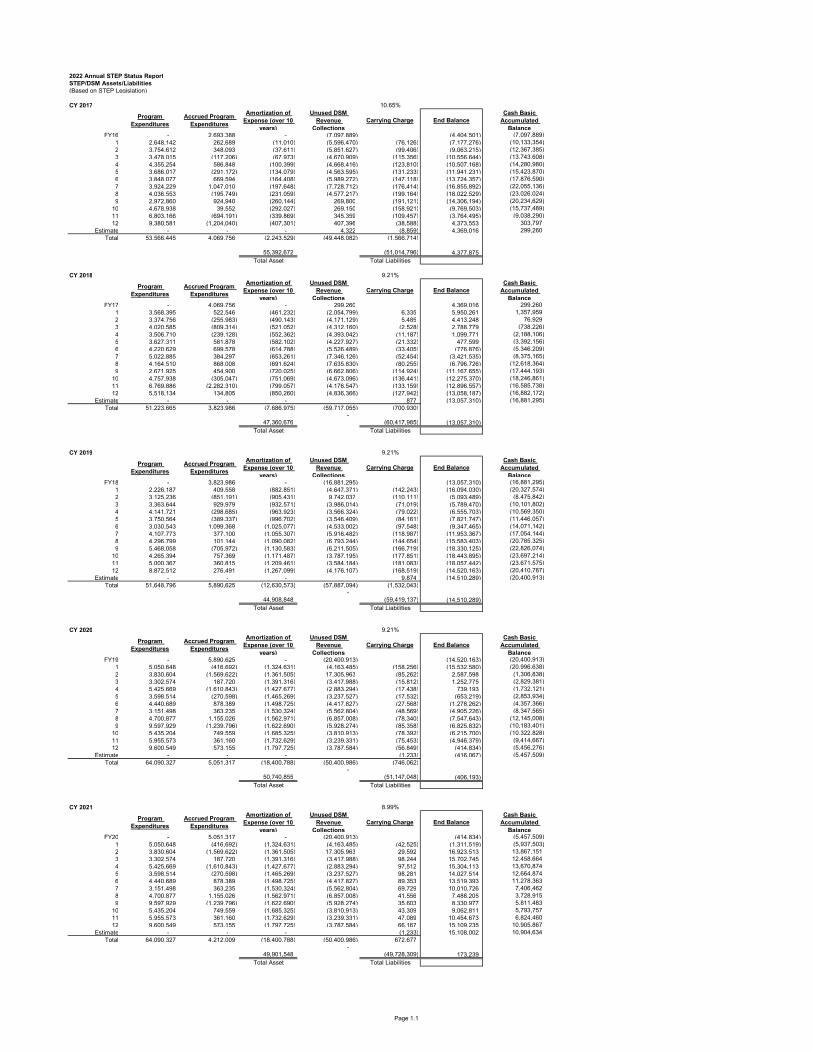
2022 Annual STEP Status ReportSTEP/DSM Assets/Liabilities(Based on STEP Legislation)
CY 2017 10.65%
Program Expenditures
Accrued Program Expenditures
Amortization of Expense (over 10
years)
Unused DSM Revenue
CollectionsCarrying Charge End Balance
Cash Basic Accumulated
BalanceFY16 - 2,693,388 - (7,097,889) (4,404,501) (7,097,889)
1 2,648,142 262,689 (11,010) (5,596,470) (76,126) (7,177,276) (10,133,354) 2 3,754,612 348,093 (37,611) (5,851,627) (99,406) (9,063,215) (12,367,385) 3 3,478,015 (117,206) (67,973) (4,670,909) (115,356) (10,556,644) (13,743,608) 4 4,355,254 586,848 (100,399) (4,668,416) (123,810) (10,507,168) (14,280,980) 5 3,686,017 (291,172) (134,079) (4,563,595) (131,233) (11,941,231) (15,423,870) 6 3,848,077 669,594 (164,408) (5,989,272) (147,118) (13,724,357) (17,876,590) 7 3,924,229 1,047,010 (197,648) (7,728,712) (176,414) (16,855,892) (22,055,136) 8 4,036,553 (195,749) (231,059) (4,577,217) (199,164) (18,022,529) (23,026,024) 9 2,972,860 924,940 (260,144) 269,800 (191,121) (14,306,194) (20,234,629)
10 4,678,938 39,552 (292,027) 269,150 (158,921) (9,769,503) (15,737,489) 11 6,803,166 (694,191) (339,869) 345,359 (109,457) (3,764,495) (9,038,290) 12 9,380,581 (1,204,040) (407,301) 407,396 (38,588) 4,373,553 303,797
Estimate - - - 4,322 (8,859) 4,369,016 299,260 Total 53,566,445 4,069,756 (2,243,529) (49,448,082) (1,566,714)
55,392,672 (51,014,796) 4,377,875 Total Asset Total Liabilities
CY 2018 9.21%
Program Expenditures
Accrued Program Expenditures
Amortization of Expense (over 10
years)
Unused DSM Revenue
CollectionsCarrying Charge End Balance
Cash Basic Accumulated
BalanceFY17 - 4,069,756 - 299,260 4,369,016 299,260
1 3,568,395 522,546 (461,232) (2,054,799) 6,335 5,950,261 1,357,959 2 3,374,756 (255,983) (490,143) (4,171,129) 5,485 4,413,248 76,929 3 4,020,585 (809,314) (521,052) (4,312,160) (2,528) 2,788,779 (738,226) 4 3,506,710 (239,128) (552,362) (4,393,042) (11,187) 1,099,771 (2,188,106) 5 3,627,311 581,878 (582,102) (4,227,927) (21,332) 477,599 (3,392,156) 6 4,220,629 699,578 (614,788) (5,526,489) (33,405) (776,876) (5,346,209) 7 5,022,885 384,297 (653,261) (7,346,126) (52,454) (3,421,535) (8,375,165) 8 4,164,510 868,008 (691,624) (7,635,830) (80,255) (6,796,726) (12,618,364) 9 2,671,925 454,900 (720,025) (6,662,806) (114,924) (11,167,655) (17,444,193)
10 4,757,938 (305,047) (751,069) (4,673,096) (136,441) (12,275,370) (18,246,861) 11 6,769,886 (2,282,310) (799,057) (4,176,547) (133,159) (12,896,557) (16,585,738) 12 5,518,134 134,805 (850,260) (4,836,366) (127,942) (13,058,187) (16,882,172)
Estimate - - - 877 (13,057,310) (16,881,295) Total 51,223,665 3,823,986 (7,686,975) (59,717,055) (700,930)
- 47,360,676 (60,417,985) (13,057,310)
Total Asset Total Liabilities
CY 2019 9.21%
Program Expenditures
Accrued Program Expenditures
Amortization of Expense (over 10
years)
Unused DSM Revenue
CollectionsCarrying Charge End Balance
Cash Basic Accumulated
BalanceFY18 - 3,823,986 - (16,881,295) (13,057,310) (16,881,295)
1 2,226,187 409,558 (882,851) (4,647,371) (142,243) (16,094,030) (20,327,574) 2 3,125,236 (851,191) (905,431) 9,742,037 (110,111) (5,093,489) (8,475,842) 3 3,363,644 929,979 (932,571) (3,986,014) (71,019) (5,789,470) (10,101,802) 4 4,141,721 (298,685) (963,923) (3,566,324) (79,022) (6,555,703) (10,569,350) 5 3,750,564 (389,337) (996,702) (3,546,409) (84,161) (7,821,747) (11,446,057) 6 3,030,543 1,099,368 (1,025,077) (4,533,002) (97,548) (9,347,465) (14,071,142) 7 4,107,773 377,100 (1,055,307) (5,916,482) (118,987) (11,953,367) (17,054,144) 8 4,296,799 101,144 (1,090,082) (6,793,244) (144,654) (15,583,403) (20,785,325) 9 5,468,058 (705,972) (1,130,583) (6,211,505) (166,719) (18,330,125) (22,826,074)
10 4,265,394 757,369 (1,171,487) (3,787,195) (177,851) (18,443,895) (23,697,214) 11 5,000,367 360,815 (1,209,461) (3,584,184) (181,083) (18,057,442) (23,671,575) 12 8,872,512 276,491 (1,267,099) (4,176,107) (168,519) (14,520,163) (20,410,787)
Estimate - - - 9,874 (14,510,289) (20,400,913) Total 51,648,796 5,890,625 (12,630,573) (57,887,094) (1,532,043)
- 44,908,848 (59,419,137) (14,510,289)
Total Asset Total Liabilities
CY 2020 9.21%
Program Expenditures
Accrued Program Expenditures
Amortization of Expense (over 10
years)
Unused DSM Revenue
CollectionsCarrying Charge End Balance
Cash Basic Accumulated
BalanceFY19 - 5,890,625 - (20,400,913) (14,520,163) (20,400,913)
1 5,050,648 (416,692) (1,324,631) (4,163,485) (158,256) (15,532,580) (20,996,638) 2 3,830,604 (1,569,622) (1,361,505) 17,305,963 (85,262) 2,587,598 (1,306,838) 3 3,302,574 187,720 (1,391,316) (3,417,988) (15,812) 1,252,775 (2,829,381) 4 5,425,669 (1,610,843) (1,427,677) (2,883,294) (17,438) 739,193 (1,732,121) 5 3,598,514 (270,598) (1,465,269) (3,237,527) (17,532) (653,219) (2,853,934) 6 4,440,689 878,389 (1,498,725) (4,417,827) (27,568) (1,278,262) (4,357,366) 7 3,151,498 363,235 (1,530,324) (5,562,804) (48,569) (4,905,226) (8,347,565) 8 4,700,877 1,155,026 (1,562,971) (6,857,008) (78,340) (7,547,643) (12,145,008) 9 9,597,929 (1,239,796) (1,622,690) (5,928,274) (85,358) (6,825,832) (10,183,401)
10 5,435,204 749,559 (1,685,325) (3,810,913) (78,392) (6,215,700) (10,322,828) 11 5,955,573 361,160 (1,732,629) (3,239,331) (75,453) (4,946,379) (9,414,667) 12 9,600,549 573,155 (1,797,725) (3,787,584) (56,849) (414,834) (5,456,276)
Estimate - - - (1,233) (416,067) (5,457,509) Total 64,090,327 5,051,317 (18,400,788) (50,400,986) (746,062)
- 50,740,855 (51,147,048) (406,193)
Total Asset Total Liabilities
CY 2021 8.99%
Program Expenditures
Accrued Program Expenditures
Amortization of Expense (over 10
years)
Unused DSM Revenue
CollectionsCarrying Charge End Balance
Cash Basic Accumulated
BalanceFY20 - 5,051,317 - (20,400,913) (414,834) (5,457,509)
1 5,050,648 (416,692) (1,324,631) (4,163,485) (42,525) (1,311,519) (5,937,503) 2 3,830,604 (1,569,622) (1,361,505) 17,305,963 29,592 16,923,513 13,867,151 3 3,302,574 187,720 (1,391,316) (3,417,988) 98,244 15,702,745 12,458,664 4 5,425,669 (1,610,843) (1,427,677) (2,883,294) 97,512 15,304,113 13,670,874 5 3,598,514 (270,598) (1,465,269) (3,237,527) 98,281 14,027,514 12,664,874 6 4,440,689 878,389 (1,498,725) (4,417,827) 89,353 13,519,393 11,278,363 7 3,151,498 363,235 (1,530,324) (5,562,804) 69,729 10,010,726 7,406,462 8 4,700,877 1,155,026 (1,562,971) (6,857,008) 41,556 7,488,205 3,728,915 9 9,597,929 (1,239,796) (1,622,690) (5,928,274) 35,603 8,330,977 5,811,483
10 5,435,204 749,559 (1,685,325) (3,810,913) 43,309 9,062,811 5,793,757 11 5,955,573 361,160 (1,732,629) (3,239,331) 47,089 10,454,673 6,824,460 12 9,600,549 573,155 (1,797,725) (3,787,584) 66,167 15,109,235 10,905,867
Estimate - - - (1,233) 15,108,002 10,904,634 Total 64,090,327 4,212,009 (18,400,788) (50,400,986) 672,677
- 49,901,548 (49,728,309) 173,239
Total Asset Total Liabilities
Page 1.1
Page 2.0
STEP Project Report Period Ending December 31, 2021
STEP Project Name: Electric Vehicle (“EV”) Charging Infrastructure:
1. EV Time of Use (“TOU”) Pilot – Schedule 2E; 2. Plug-in EV Pilot Incentive Program – Schedule 120; and 3. Plug-in EV Load Research Study Program – Schedule 121.
Project Objectives: Offer a time of use rate schedule option for residential customers who own a plug-
in electric vehicle; Promote plug-in electric vehicle charging infrastructure and time of use rates; and To study the load profiles of customers who have plug-in electric vehicles.
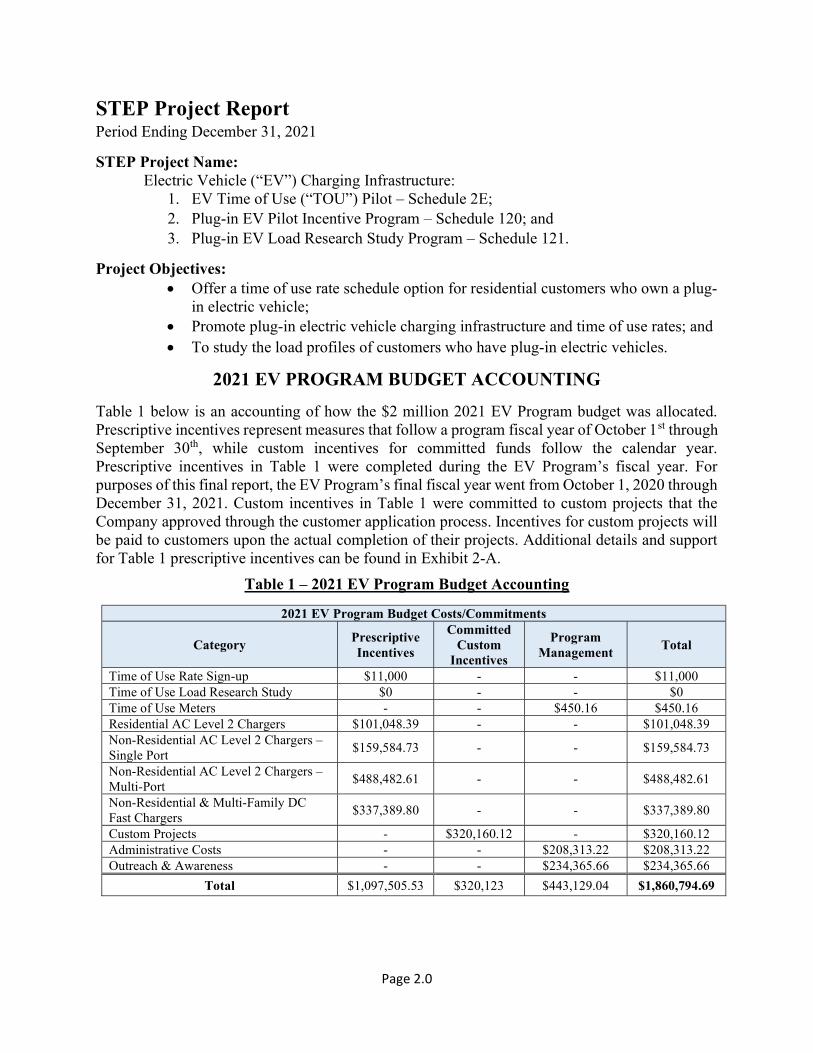
2021 EV PROGRAM BUDGET ACCOUNTING
Table 1 below is an accounting of how the $2 million 2021 EV Program budget was allocated. Prescriptive incentives represent measures that follow a program fiscal year of October 1st through September 30th, while custom incentives for committed funds follow the calendar year. Prescriptive incentives in Table 1 were completed during the EV Program’s fiscal year. For purposes of this final report, the EV Program’s final fiscal year went from October 1, 2020 through December 31, 2021. Custom incentives in Table 1 were committed to custom projects that the Company approved through the customer application process. Incentives for custom projects will be paid to customers upon the actual completion of their projects. Additional details and support for Table 1 prescriptive incentives can be found in Exhibit 2-A.
Table 1 – 2021 EV Program Budget Accounting
2021 EV Program Budget Costs/Commitments
Category Prescriptive Incentives
Committed Custom
Incentives
Program Management
Total
Time of Use Rate Sign-up $11,000 - - $11,000 Time of Use Load Research Study $0 - - $0 Time of Use Meters - - $450.16 $450.16 Residential AC Level 2 Chargers $101,048.39 - - $101,048.39 Non-Residential AC Level 2 Chargers – Single Port
$159,584.73 - - $159,584.73
Non-Residential AC Level 2 Chargers – Multi-Port
$488,482.61 - - $488,482.61
Non-Residential & Multi-Family DC Fast Chargers
$337,389.80 - - $337,389.80
Custom Projects - $320,160.12 - $320,160.12 Administrative Costs - - $208,313.22 $208,313.22 Outreach & Awareness - - $234,365.66 $234,365.66
Total $1,097,505.53 $320,123 $443,129.04 $1,860,794.69
Page 2.1
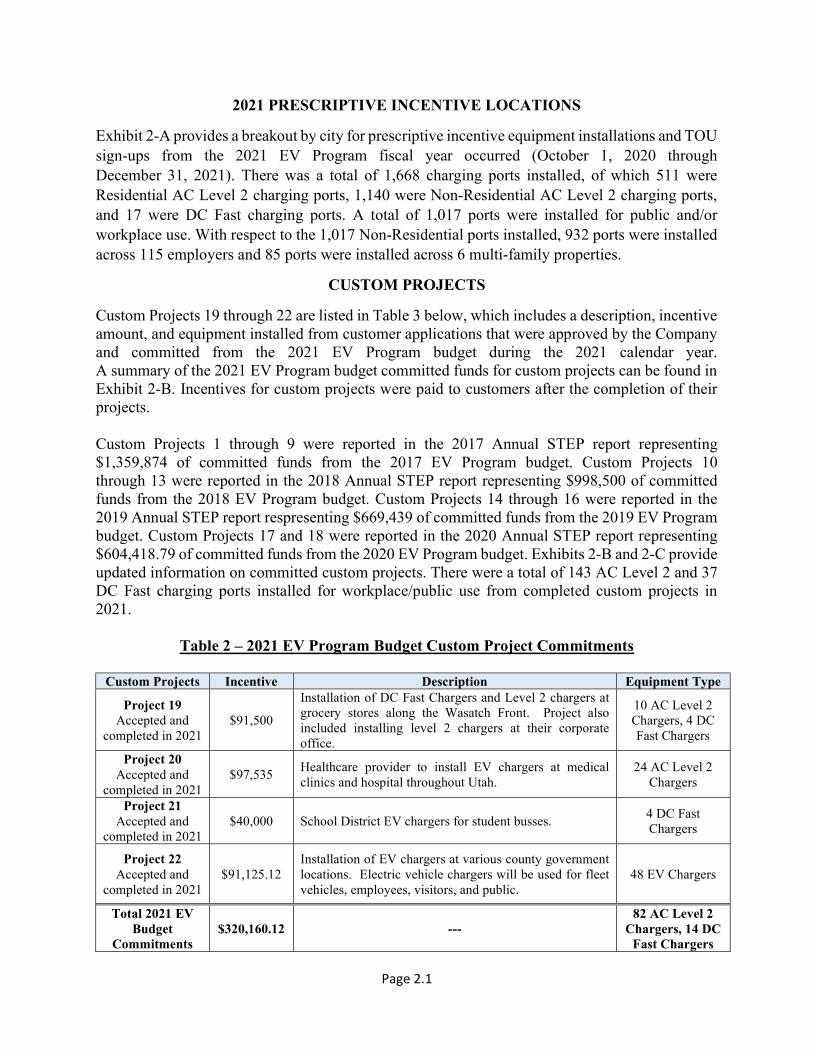
2021 PRESCRIPTIVE INCENTIVE LOCATIONS
Exhibit 2-A provides a breakout by city for prescriptive incentive equipment installations and TOU sign-ups from the 2021 EV Program fiscal year occurred (October 1, 2020 through December 31, 2021). There was a total of 1,668 charging ports installed, of which 511 were Residential AC Level 2 charging ports, 1,140 were Non-Residential AC Level 2 charging ports, and 17 were DC Fast charging ports. A total of 1,017 ports were installed for public and/or workplace use. With respect to the 1,017 Non-Residential ports installed, 932 ports were installed across 115 employers and 85 ports were installed across 6 multi-family properties.
CUSTOM PROJECTS
Custom Projects 19 through 22 are listed in Table 3 below, which includes a description, incentive amount, and equipment installed from customer applications that were approved by the Company and committed from the 2021 EV Program budget during the 2021 calendar year. A summary of the 2021 EV Program budget committed funds for custom projects can be found in Exhibit 2-B. Incentives for custom projects were paid to customers after the completion of their projects. Custom Projects 1 through 9 were reported in the 2017 Annual STEP report representing $1,359,874 of committed funds from the 2017 EV Program budget. Custom Projects 10 through 13 were reported in the 2018 Annual STEP report representing $998,500 of committed funds from the 2018 EV Program budget. Custom Projects 14 through 16 were reported in the 2019 Annual STEP report respresenting $669,439 of committed funds from the 2019 EV Program budget. Custom Projects 17 and 18 were reported in the 2020 Annual STEP report representing $604,418.79 of committed funds from the 2020 EV Program budget. Exhibits 2-B and 2-C provide updated information on committed custom projects. There were a total of 143 AC Level 2 and 37 DC Fast charging ports installed for workplace/public use from completed custom projects in 2021.
Table 2 – 2021 EV Program Budget Custom Project Commitments
Custom Projects Incentive Description Equipment Type
Project 19 Accepted and
completed in 2021 $91,500
Installation of DC Fast Chargers and Level 2 chargers at grocery stores along the Wasatch Front. Project also included installing level 2 chargers at their corporate office.
10 AC Level 2 Chargers, 4 DC Fast Chargers
Project 20 Accepted and
completed in 2021 $97,535
Healthcare provider to install EV chargers at medical clinics and hospital throughout Utah.
24 AC Level 2 Chargers
Project 21 Accepted and
completed in 2021 $40,000 School District EV chargers for student busses.
4 DC Fast Chargers
Project 22 Accepted and
completed in 2021 $91,125.12
Installation of EV chargers at various county government locations. Electric vehicle chargers will be used for fleet vehicles, employees, visitors, and public.
48 EV Chargers
Total 2021 EV Budget
Commitments $320,160.12 ---
82 AC Level 2 Chargers, 14 DC
Fast Chargers

Page 2.2
2021 CALENDAR YEAR ACCOUNTING Table 4 below provides an accounting of how the EV Program costs for calendar year 2021 are posted to SAP (the Company’s accounting system), and reconciles to the STEP accounting. The amount of funds that actually post to SAP in a calendar year is dependent upon when projects complete. For example, if custom projects that were committed in 2020 from the 2020 EV Program budget completed in 2021, the funds associated with those custom projects posted to SAP in 2021. So while SAP accounting reflects those costs in 2021, they were, in fact, counted towards the $2 million 2020 EV Program budget. Additionally, while prescriptive incentives have followed a fiscal year of October 1st through September 30th, for purposes of this final report, the 2021 fiscal year also included October 1, 2021 through December 31, 2021. As such, prescriptive incentives for the 2021 EV Program budget include the timeframe of October 1, 2020 through December 31, 2021. Note that the prescriptive incentive costs during the timeframe of October 1, 2020, through December 31, 2020, are captured in SAP for that calendar year, but were counted towards the $2 million 2021 EV Program budget, consistent with the fiscal year of the EV Program for prescriptive incentives and previous reports. Exhibit 2-D provides SAP year over year accounting for each calendar year, which reconciles to the STEP accounting, and Exhibit 2-E provides a year over year accounting for how each $2 million EV Program year budget was allocated.
Table 4 – 2021 Calendar Year Actual SAP Postings
EV Program Actual Postings in SAP by Calendar Year Category CY 2021
Time of Use Rate Sign-up $3,200 Time of Use Load Research Study $0 Time of Use Meters $450.16 Residential AC Level 2 Chargers $88,798.94 Non-Residential AC Level 2 Chargers – Single Port $152,770.67 Non-Residential AC Level 2 Chargers – Multi-Port $317,645.96 Non-Residential & Multi-Family DC Fast Chargers $279,472.31 Custom Projects $1,157,429.62 Administrative Costs $208,313.22 Outreach & Awareness $234,365.66
Total $2,442,446.54
2021 ELECTRIC VEHICLE INCENTIVE PROGRAM KEY FINDINGS
EV Education Outreach
Beginning in 2021, the Company contracted with the National Energy Foundation to administer a secondary school teacher-directed interactive program to educate students on EVs. The program, called “rEV,” provided 60 minutes secondary-level (grades 7-12) appropriate ecucational content aligning with Utah’s standards around electrical education and EV concepts.
The rEV program was available to students in the spring and fall of 2021, which resulted in both teachers and students becoming more EV literate, particularly in the understanding of EV technology, cost savings, and environmental benefits. Additional information on the rEV program is provided in Exhibits 2-F and 2-G.

Page 2.3
Attachments:
Exhibit 2-A: 2020 EV Program Budget Prescriptive Incentives Exhibit 2-B: EV Program Custom Project Committed Funds and Expenditures Exhibit 2-C: EV Program Custom Project Details Year Over Year Exhibit 2-D: EV Program Actual SAP Postings by Calendar Year Exhibit 2-E: EV Program Budget Allocations Year Over Year Exhibit 2-F: rEV Program Spring 2021 Report Exhibit 2-G: rEV Program Fall 2021 Report

Exhibit 2-A 2021 EV Program Budget Prescriptive Incentives
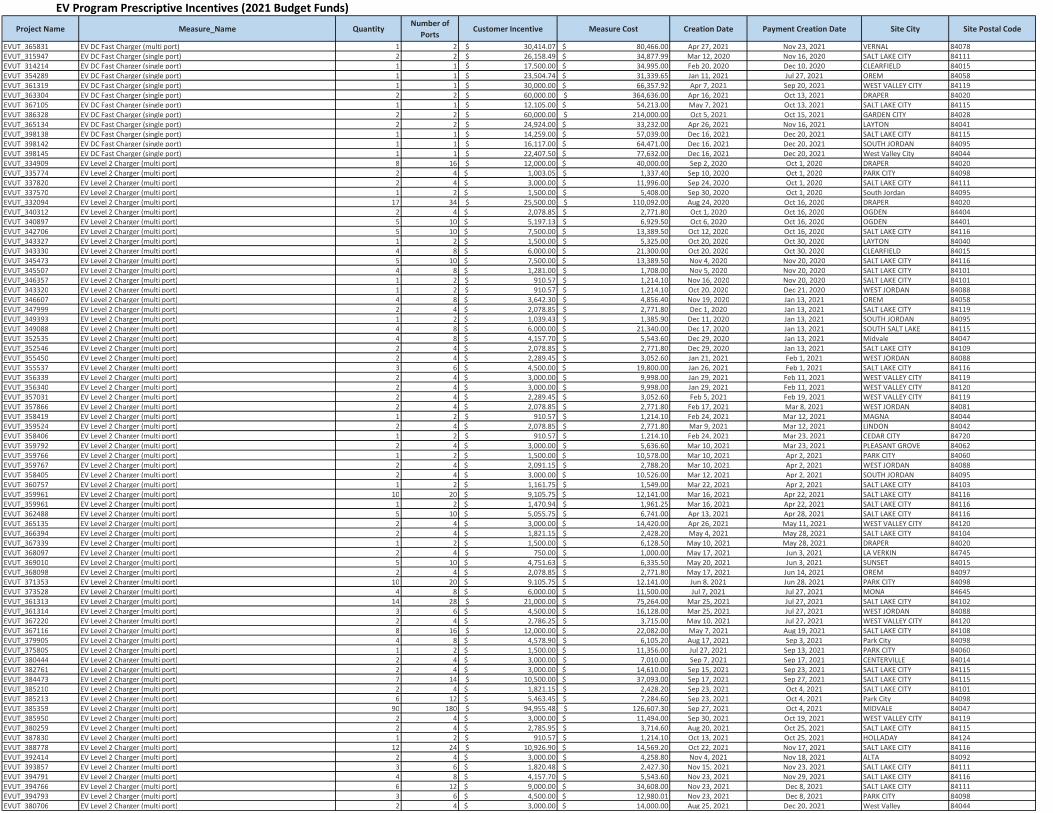
Project Name Measure_Name QuantityNumber of
PortsCustomer Incentive Measure Cost Creation Date Payment Creation Date Site City Site Postal Code
EVUT_365831 EV DC Fast Charger (multi port) 1 2 $ 30,414.07 $ 80,466.00 Apr 27, 2021 Nov 23, 2021 VERNAL 84078EVUT_315947 EV DC Fast Charger (single port) 2 2 $ 26,158.49 $ 34,877.99 Mar 12, 2020 Nov 16, 2020 SALT LAKE CITY 84111EVUT_314214 EV DC Fast Charger (single port) 1 1 $ 17,500.00 $ 34,995.00 Feb 20, 2020 Dec 10, 2020 CLEARFIELD 84015EVUT_354289 EV DC Fast Charger (single port) 1 1 $ 23,504.74 $ 31,339.65 Jan 11, 2021 Jul 27, 2021 OREM 84058EVUT_361319 EV DC Fast Charger (single port) 1 1 $ 30,000.00 $ 66,357.92 Apr 7, 2021 Sep 20, 2021 WEST VALLEY CITY 84119EVUT_363304 EV DC Fast Charger (single port) 2 2 $ 60,000.00 $ 364,636.00 Apr 16, 2021 Oct 13, 2021 DRAPER 84020EVUT_367105 EV DC Fast Charger (single port) 1 1 $ 12,105.00 $ 54,213.00 May 7, 2021 Oct 13, 2021 SALT LAKE CITY 84115EVUT_386328 EV DC Fast Charger (single port) 2 2 $ 60,000.00 $ 214,000.00 Oct 5, 2021 Oct 15, 2021 GARDEN CITY 84028EVUT_365134 EV DC Fast Charger (single port) 2 2 $ 24,924.00 $ 33,232.00 Apr 26, 2021 Nov 16, 2021 LAYTON 84041EVUT_398138 EV DC Fast Charger (single port) 1 1 $ 14,259.00 $ 57,039.00 Dec 16, 2021 Dec 20, 2021 SALT LAKE CITY 84115EVUT_398142 EV DC Fast Charger (single port) 1 1 $ 16,117.00 $ 64,471.00 Dec 16, 2021 Dec 20, 2021 SOUTH JORDAN 84095EVUT_398145 EV DC Fast Charger (single port) 1 1 $ 22,407.50 $ 77,632.00 Dec 16, 2021 Dec 20, 2021 West Valley City 84044EVUT_334909 EV Level 2 Charger (multi port) 8 16 $ 12,000.00 $ 40,000.00 Sep 2, 2020 Oct 1, 2020 DRAPER 84020EVUT_335774 EV Level 2 Charger (multi port) 2 4 $ 1,003.05 $ 1,337.40 Sep 10, 2020 Oct 1, 2020 PARK CITY 84098EVUT_337820 EV Level 2 Charger (multi port) 2 4 $ 3,000.00 $ 11,996.00 Sep 24, 2020 Oct 1, 2020 SALT LAKE CITY 84111EVUT_337570 EV Level 2 Charger (multi port) 1 2 $ 1,500.00 $ 5,408.00 Sep 30, 2020 Oct 1, 2020 South Jordan 84095EVUT_332094 EV Level 2 Charger (multi port) 17 34 $ 25,500.00 $ 110,092.00 Aug 24, 2020 Oct 16, 2020 DRAPER 84020EVUT_340312 EV Level 2 Charger (multi port) 2 4 $ 2,078.85 $ 2,771.80 Oct 1, 2020 Oct 16, 2020 OGDEN 84404EVUT_340897 EV Level 2 Charger (multi port) 5 10 $ 5,197.13 $ 6,929.50 Oct 6, 2020 Oct 16, 2020 OGDEN 84401EVUT_342706 EV Level 2 Charger (multi port) 5 10 $ 7,500.00 $ 13,389.50 Oct 12, 2020 Oct 16, 2020 SALT LAKE CITY 84116EVUT_343327 EV Level 2 Charger (multi port) 1 2 $ 1,500.00 $ 5,325.00 Oct 20, 2020 Oct 30, 2020 LAYTON 84040EVUT_343330 EV Level 2 Charger (multi port) 4 8 $ 6,000.00 $ 21,300.00 Oct 20, 2020 Oct 30, 2020 CLEARFIELD 84015EVUT_345473 EV Level 2 Charger (multi port) 5 10 $ 7,500.00 $ 13,389.50 Nov 4, 2020 Nov 20, 2020 SALT LAKE CITY 84116EVUT_345507 EV Level 2 Charger (multi port) 4 8 $ 1,281.00 $ 1,708.00 Nov 5, 2020 Nov 20, 2020 SALT LAKE CITY 84101EVUT_346357 EV Level 2 Charger (multi port) 1 2 $ 910.57 $ 1,214.10 Nov 16, 2020 Nov 20, 2020 SALT LAKE CITY 84101EVUT_343320 EV Level 2 Charger (multi port) 1 2 $ 910.57 $ 1,214.10 Oct 20, 2020 Dec 21, 2020 WEST JORDAN 84088EVUT_346607 EV Level 2 Charger (multi port) 4 8 $ 3,642.30 $ 4,856.40 Nov 19, 2020 Jan 13, 2021 OREM 84058EVUT_347999 EV Level 2 Charger (multi port) 2 4 $ 2,078.85 $ 2,771.80 Dec 1, 2020 Jan 13, 2021 SALT LAKE CITY 84119EVUT_349393 EV Level 2 Charger (multi port) 1 2 $ 1,039.43 $ 1,385.90 Dec 11, 2020 Jan 13, 2021 SOUTH JORDAN 84095EVUT_349088 EV Level 2 Charger (multi port) 4 8 $ 6,000.00 $ 21,340.00 Dec 17, 2020 Jan 13, 2021 SOUTH SALT LAKE 84115EVUT_352535 EV Level 2 Charger (multi port) 4 8 $ 4,157.70 $ 5,543.60 Dec 29, 2020 Jan 13, 2021 Midvale 84047EVUT_352546 EV Level 2 Charger (multi port) 2 4 $ 2,078.85 $ 2,771.80 Dec 29, 2020 Jan 13, 2021 SALT LAKE CITY 84109EVUT_355450 EV Level 2 Charger (multi port) 2 4 $ 2,289.45 $ 3,052.60 Jan 21, 2021 Feb 1, 2021 WEST JORDAN 84088EVUT_355537 EV Level 2 Charger (multi port) 3 6 $ 4,500.00 $ 19,800.00 Jan 26, 2021 Feb 1, 2021 SALT LAKE CITY 84116EVUT_356339 EV Level 2 Charger (multi port) 2 4 $ 3,000.00 $ 9,998.00 Jan 29, 2021 Feb 11, 2021 WEST VALLEY CITY 84119EVUT_356340 EV Level 2 Charger (multi port) 2 4 $ 3,000.00 $ 9,998.00 Jan 29, 2021 Feb 11, 2021 WEST VALLEY CITY 84120EVUT_357031 EV Level 2 Charger (multi port) 2 4 $ 2,289.45 $ 3,052.60 Feb 5, 2021 Feb 19, 2021 WEST VALLEY CITY 84119EVUT_357866 EV Level 2 Charger (multi port) 2 4 $ 2,078.85 $ 2,771.80 Feb 17, 2021 Mar 8, 2021 WEST JORDAN 84081EVUT_358419 EV Level 2 Charger (multi port) 1 2 $ 910.57 $ 1,214.10 Feb 24, 2021 Mar 12, 2021 MAGNA 84044EVUT_359524 EV Level 2 Charger (multi port) 2 4 $ 2,078.85 $ 2,771.80 Mar 9, 2021 Mar 12, 2021 LINDON 84042EVUT_358406 EV Level 2 Charger (multi port) 1 2 $ 910.57 $ 1,214.10 Feb 24, 2021 Mar 23, 2021 CEDAR CITY 84720EVUT_359792 EV Level 2 Charger (multi port) 2 4 $ 3,000.00 $ 5,636.60 Mar 10, 2021 Mar 23, 2021 PLEASANT GROVE 84062EVUT_359766 EV Level 2 Charger (multi port) 1 2 $ 1,500.00 $ 10,578.00 Mar 10, 2021 Apr 2, 2021 PARK CITY 84060EVUT_359767 EV Level 2 Charger (multi port) 2 4 $ 2,091.15 $ 2,788.20 Mar 10, 2021 Apr 2, 2021 WEST JORDAN 84088EVUT_358405 EV Level 2 Charger (multi port) 2 4 $ 3,000.00 $ 10,526.00 Mar 12, 2021 Apr 2, 2021 SOUTH JORDAN 84095EVUT_360757 EV Level 2 Charger (multi port) 1 2 $ 1,161.75 $ 1,549.00 Mar 22, 2021 Apr 2, 2021 SALT LAKE CITY 84103EVUT_359961 EV Level 2 Charger (multi port) 10 20 $ 9,105.75 $ 12,141.00 Mar 16, 2021 Apr 22, 2021 SALT LAKE CITY 84116EVUT_359961 EV Level 2 Charger (multi port) 1 2 $ 1,470.94 $ 1,961.25 Mar 16, 2021 Apr 22, 2021 SALT LAKE CITY 84116EVUT_362488 EV Level 2 Charger (multi port) 5 10 $ 5,055.75 $ 6,741.00 Apr 13, 2021 Apr 28, 2021 SALT LAKE CITY 84116EVUT_365135 EV Level 2 Charger (multi port) 2 4 $ 3,000.00 $ 14,420.00 Apr 26, 2021 May 11, 2021 WEST VALLEY CITY 84120EVUT_366394 EV Level 2 Charger (multi port) 2 4 $ 1,821.15 $ 2,428.20 May 4, 2021 May 28, 2021 SALT LAKE CITY 84104EVUT_367339 EV Level 2 Charger (multi port) 1 2 $ 1,500.00 $ 6,128.50 May 10, 2021 May 28, 2021 DRAPER 84020EVUT_368097 EV Level 2 Charger (multi port) 2 4 $ 750.00 $ 1,000.00 May 17, 2021 Jun 3, 2021 LA VERKIN 84745EVUT_369010 EV Level 2 Charger (multi port) 5 10 $ 4,751.63 $ 6,335.50 May 20, 2021 Jun 3, 2021 SUNSET 84015EVUT_368098 EV Level 2 Charger (multi port) 2 4 $ 2,078.85 $ 2,771.80 May 17, 2021 Jun 14, 2021 OREM 84097EVUT_371353 EV Level 2 Charger (multi port) 10 20 $ 9,105.75 $ 12,141.00 Jun 8, 2021 Jun 28, 2021 PARK CITY 84098EVUT_373528 EV Level 2 Charger (multi port) 4 8 $ 6,000.00 $ 11,500.00 Jul 7, 2021 Jul 27, 2021 MONA 84645EVUT_361313 EV Level 2 Charger (multi port) 14 28 $ 21,000.00 $ 75,264.00 Mar 25, 2021 Jul 27, 2021 SALT LAKE CITY 84102EVUT_361314 EV Level 2 Charger (multi port) 3 6 $ 4,500.00 $ 16,128.00 Mar 25, 2021 Jul 27, 2021 WEST JORDAN 84088EVUT_367220 EV Level 2 Charger (multi port) 2 4 $ 2,786.25 $ 3,715.00 May 10, 2021 Jul 27, 2021 WEST VALLEY CITY 84120EVUT_367116 EV Level 2 Charger (multi port) 8 16 $ 12,000.00 $ 22,082.00 May 7, 2021 Aug 19, 2021 SALT LAKE CITY 84108EVUT_379905 EV Level 2 Charger (multi port) 4 8 $ 4,578.90 $ 6,105.20 Aug 17, 2021 Sep 3, 2021 Park City 84098EVUT_375805 EV Level 2 Charger (multi port) 1 2 $ 1,500.00 $ 11,356.00 Jul 27, 2021 Sep 13, 2021 PARK CITY 84060EVUT_380444 EV Level 2 Charger (multi port) 2 4 $ 3,000.00 $ 7,010.00 Sep 7, 2021 Sep 17, 2021 CENTERVILLE 84014EVUT_382761 EV Level 2 Charger (multi port) 2 4 $ 3,000.00 $ 14,610.00 Sep 15, 2021 Sep 23, 2021 SALT LAKE CITY 84115EVUT_384473 EV Level 2 Charger (multi port) 7 14 $ 10,500.00 $ 37,093.00 Sep 17, 2021 Sep 27, 2021 SALT LAKE CITY 84115EVUT_385210 EV Level 2 Charger (multi port) 2 4 $ 1,821.15 $ 2,428.20 Sep 23, 2021 Oct 4, 2021 SALT LAKE CITY 84101EVUT_385213 EV Level 2 Charger (multi port) 6 12 $ 5,463.45 $ 7,284.60 Sep 23, 2021 Oct 4, 2021 Park City 84098EVUT_385359 EV Level 2 Charger (multi port) 90 180 $ 94,955.48 $ 126,607.30 Sep 27, 2021 Oct 4, 2021 MIDVALE 84047EVUT_385950 EV Level 2 Charger (multi port) 2 4 $ 3,000.00 $ 11,494.00 Sep 30, 2021 Oct 19, 2021 WEST VALLEY CITY 84119EVUT_380259 EV Level 2 Charger (multi port) 2 4 $ 2,785.95 $ 3,714.60 Aug 20, 2021 Oct 25, 2021 SALT LAKE CITY 84115EVUT_387830 EV Level 2 Charger (multi port) 1 2 $ 910.57 $ 1,214.10 Oct 13, 2021 Oct 25, 2021 HOLLADAY 84124EVUT_388778 EV Level 2 Charger (multi port) 12 24 $ 10,926.90 $ 14,569.20 Oct 22, 2021 Nov 17, 2021 SALT LAKE CITY 84116EVUT_392414 EV Level 2 Charger (multi port) 2 4 $ 3,000.00 $ 4,258.80 Nov 4, 2021 Nov 18, 2021 ALTA 84092EVUT_393857 EV Level 2 Charger (multi port) 3 6 $ 1,820.48 $ 2,427.30 Nov 15, 2021 Nov 23, 2021 SALT LAKE CITY 84111EVUT_394791 EV Level 2 Charger (multi port) 4 8 $ 4,157.70 $ 5,543.60 Nov 23, 2021 Nov 29, 2021 SALT LAKE CITY 84116EVUT_394766 EV Level 2 Charger (multi port) 6 12 $ 9,000.00 $ 34,608.00 Nov 23, 2021 Dec 8, 2021 SALT LAKE CITY 84111EVUT_394793 EV Level 2 Charger (multi port) 3 6 $ 4,500.00 $ 12,980.01 Nov 23, 2021 Dec 8, 2021 PARK CITY 84098EVUT_380706 EV Level 2 Charger (multi port) 2 4 $ 3,000.00 $ 14,000.00 Aug 25, 2021 Dec 20, 2021 West Valley 84044
EV Program Prescriptive Incentives (2021 Budget Funds)
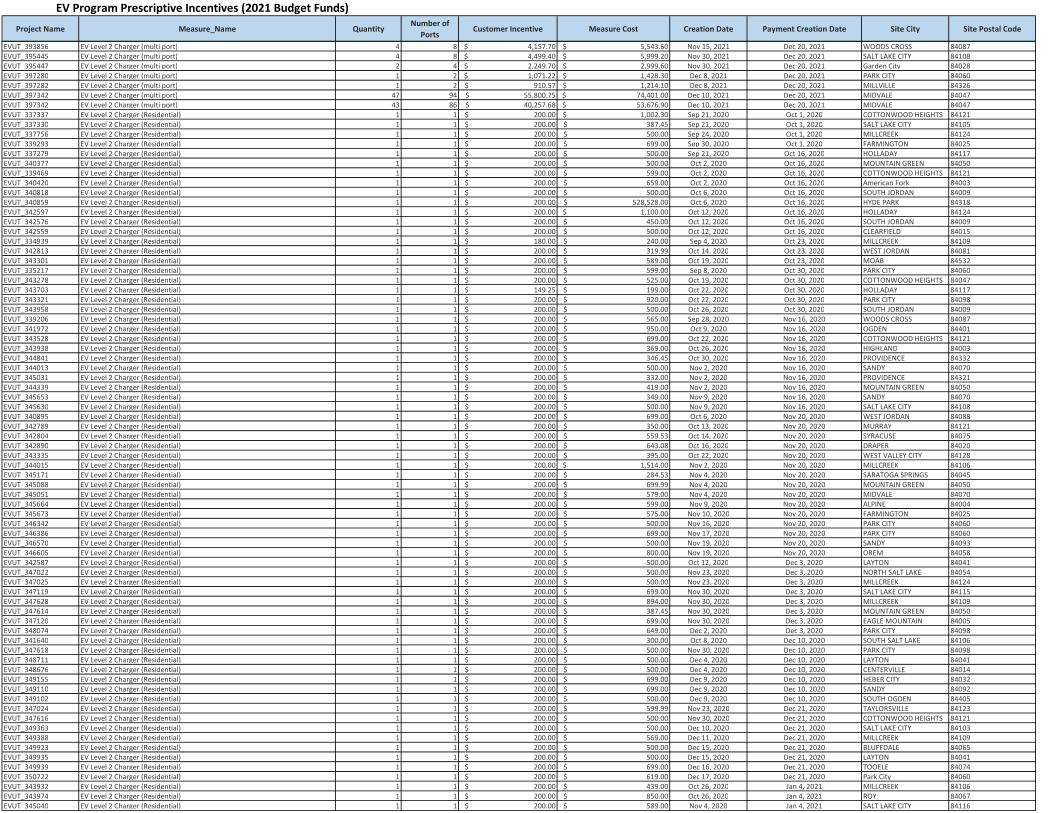
Project Name Measure_Name QuantityNumber of
PortsCustomer Incentive Measure Cost Creation Date Payment Creation Date Site City Site Postal Code
EV Program Prescriptive Incentives (2021 Budget Funds)
EVUT_393856 EV Level 2 Charger (multi port) 4 8 $ 4,157.70 $ 5,543.60 Nov 15, 2021 Dec 20, 2021 WOODS CROSS 84087EVUT_395445 EV Level 2 Charger (multi port) 4 8 $ 4,499.40 $ 5,999.20 Nov 30, 2021 Dec 20, 2021 SALT LAKE CITY 84108EVUT_395447 EV Level 2 Charger (multi port) 2 4 $ 2,249.70 $ 2,999.60 Nov 30, 2021 Dec 20, 2021 Garden City 84028EVUT_397280 EV Level 2 Charger (multi port) 1 2 $ 1,071.22 $ 1,428.30 Dec 8, 2021 Dec 20, 2021 PARK CITY 84060EVUT_397282 EV Level 2 Charger (multi port) 1 2 $ 910.57 $ 1,214.10 Dec 8, 2021 Dec 20, 2021 MILLVILLE 84326EVUT_397342 EV Level 2 Charger (multi port) 47 94 $ 55,800.75 $ 74,401.00 Dec 10, 2021 Dec 20, 2021 MIDVALE 84047EVUT_397342 EV Level 2 Charger (multi port) 43 86 $ 40,257.68 $ 53,676.90 Dec 10, 2021 Dec 20, 2021 MIDVALE 84047EVUT_337337 EV Level 2 Charger (Residential) 1 1 $ 200.00 $ 1,002.30 Sep 21, 2020 Oct 1, 2020 COTTONWOOD HEIGHTS 84121EVUT_337330 EV Level 2 Charger (Residential) 1 1 $ 200.00 $ 387.45 Sep 21, 2020 Oct 1, 2020 SALT LAKE CITY 84105EVUT_337756 EV Level 2 Charger (Residential) 1 1 $ 200.00 $ 500.00 Sep 24, 2020 Oct 1, 2020 MILLCREEK 84124EVUT_339293 EV Level 2 Charger (Residential) 1 1 $ 200.00 $ 699.00 Sep 30, 2020 Oct 1, 2020 FARMINGTON 84025EVUT_337279 EV Level 2 Charger (Residential) 1 1 $ 200.00 $ 500.00 Sep 21, 2020 Oct 16, 2020 HOLLADAY 84117EVUT_340377 EV Level 2 Charger (Residential) 1 1 $ 200.00 $ 500.00 Oct 2, 2020 Oct 16, 2020 MOUNTAIN GREEN 84050EVUT_339469 EV Level 2 Charger (Residential) 1 1 $ 200.00 $ 599.00 Oct 2, 2020 Oct 16, 2020 COTTONWOOD HEIGHTS 84121EVUT_340420 EV Level 2 Charger (Residential) 1 1 $ 200.00 $ 659.00 Oct 2, 2020 Oct 16, 2020 American Fork 84003EVUT_340818 EV Level 2 Charger (Residential) 1 1 $ 200.00 $ 500.00 Oct 6, 2020 Oct 16, 2020 SOUTH JORDAN 84009EVUT_340859 EV Level 2 Charger (Residential) 1 1 $ 200.00 $ 528,528.00 Oct 6, 2020 Oct 16, 2020 HYDE PARK 84318EVUT_342597 EV Level 2 Charger (Residential) 1 1 $ 200.00 $ 1,100.00 Oct 12, 2020 Oct 16, 2020 HOLLADAY 84124EVUT_342576 EV Level 2 Charger (Residential) 1 1 $ 200.00 $ 450.00 Oct 12, 2020 Oct 16, 2020 SOUTH JORDAN 84009EVUT_342559 EV Level 2 Charger (Residential) 1 1 $ 200.00 $ 500.00 Oct 12, 2020 Oct 16, 2020 CLEARFIELD 84015EVUT_334939 EV Level 2 Charger (Residential) 1 1 $ 180.00 $ 240.00 Sep 4, 2020 Oct 23, 2020 MILLCREEK 84109EVUT_342813 EV Level 2 Charger (Residential) 1 1 $ 200.00 $ 319.99 Oct 14, 2020 Oct 23, 2020 WEST JORDAN 84081EVUT_343301 EV Level 2 Charger (Residential) 1 1 $ 200.00 $ 589.00 Oct 19, 2020 Oct 23, 2020 MOAB 84532EVUT_335217 EV Level 2 Charger (Residential) 1 1 $ 200.00 $ 599.00 Sep 8, 2020 Oct 30, 2020 PARK CITY 84060EVUT_343278 EV Level 2 Charger (Residential) 1 1 $ 200.00 $ 525.00 Oct 19, 2020 Oct 30, 2020 COTTONWOOD HEIGHTS 84047EVUT_343703 EV Level 2 Charger (Residential) 1 1 $ 149.25 $ 199.00 Oct 22, 2020 Oct 30, 2020 HOLLADAY 84117EVUT_343321 EV Level 2 Charger (Residential) 1 1 $ 200.00 $ 920.00 Oct 22, 2020 Oct 30, 2020 PARK CITY 84098EVUT_343958 EV Level 2 Charger (Residential) 1 1 $ 200.00 $ 500.00 Oct 26, 2020 Oct 30, 2020 SOUTH JORDAN 84009EVUT_339206 EV Level 2 Charger (Residential) 1 1 $ 200.00 $ 565.00 Sep 28, 2020 Nov 16, 2020 WOODS CROSS 84087EVUT_341972 EV Level 2 Charger (Residential) 1 1 $ 200.00 $ 950.00 Oct 9, 2020 Nov 16, 2020 OGDEN 84401EVUT_343528 EV Level 2 Charger (Residential) 1 1 $ 200.00 $ 699.00 Oct 22, 2020 Nov 16, 2020 COTTONWOOD HEIGHTS 84121EVUT_343938 EV Level 2 Charger (Residential) 1 1 $ 200.00 $ 369.00 Oct 26, 2020 Nov 16, 2020 HIGHLAND 84003EVUT_344841 EV Level 2 Charger (Residential) 1 1 $ 200.00 $ 346.45 Oct 30, 2020 Nov 16, 2020 PROVIDENCE 84332EVUT_344013 EV Level 2 Charger (Residential) 1 1 $ 200.00 $ 500.00 Nov 2, 2020 Nov 16, 2020 SANDY 84070EVUT_345031 EV Level 2 Charger (Residential) 1 1 $ 200.00 $ 332.00 Nov 2, 2020 Nov 16, 2020 PROVIDENCE 84321EVUT_344339 EV Level 2 Charger (Residential) 1 1 $ 200.00 $ 419.00 Nov 2, 2020 Nov 16, 2020 MOUNTAIN GREEN 84050EVUT_345653 EV Level 2 Charger (Residential) 1 1 $ 200.00 $ 349.00 Nov 9, 2020 Nov 16, 2020 SANDY 84070EVUT_345630 EV Level 2 Charger (Residential) 1 1 $ 200.00 $ 500.00 Nov 9, 2020 Nov 16, 2020 SALT LAKE CITY 84108EVUT_340895 EV Level 2 Charger (Residential) 1 1 $ 200.00 $ 699.00 Oct 6, 2020 Nov 20, 2020 WEST JORDAN 84088EVUT_342789 EV Level 2 Charger (Residential) 1 1 $ 200.00 $ 350.00 Oct 13, 2020 Nov 20, 2020 MURRAY 84121EVUT_342804 EV Level 2 Charger (Residential) 1 1 $ 200.00 $ 559.53 Oct 14, 2020 Nov 20, 2020 SYRACUSE 84075EVUT_342890 EV Level 2 Charger (Residential) 1 1 $ 200.00 $ 643.08 Oct 16, 2020 Nov 20, 2020 DRAPER 84020EVUT_343335 EV Level 2 Charger (Residential) 1 1 $ 200.00 $ 395.00 Oct 22, 2020 Nov 20, 2020 WEST VALLEY CITY 84128EVUT_344015 EV Level 2 Charger (Residential) 1 1 $ 200.00 $ 1,514.00 Nov 2, 2020 Nov 20, 2020 MILLCREEK 84106EVUT_345171 EV Level 2 Charger (Residential) 1 1 $ 200.00 $ 284.53 Nov 4, 2020 Nov 20, 2020 SARATOGA SPRINGS 84045EVUT_345088 EV Level 2 Charger (Residential) 1 1 $ 200.00 $ 699.99 Nov 4, 2020 Nov 20, 2020 MOUNTAIN GREEN 84050EVUT_345051 EV Level 2 Charger (Residential) 1 1 $ 200.00 $ 579.00 Nov 4, 2020 Nov 20, 2020 MIDVALE 84070EVUT_345664 EV Level 2 Charger (Residential) 1 1 $ 200.00 $ 599.00 Nov 9, 2020 Nov 20, 2020 ALPINE 84004EVUT_345673 EV Level 2 Charger (Residential) 1 1 $ 200.00 $ 575.00 Nov 10, 2020 Nov 20, 2020 FARMINGTON 84025EVUT_346342 EV Level 2 Charger (Residential) 1 1 $ 200.00 $ 500.00 Nov 16, 2020 Nov 20, 2020 PARK CITY 84060EVUT_346386 EV Level 2 Charger (Residential) 1 1 $ 200.00 $ 699.00 Nov 17, 2020 Nov 20, 2020 PARK CITY 84060EVUT_346570 EV Level 2 Charger (Residential) 1 1 $ 200.00 $ 500.00 Nov 19, 2020 Nov 20, 2020 SANDY 84093EVUT_346605 EV Level 2 Charger (Residential) 1 1 $ 200.00 $ 800.00 Nov 19, 2020 Nov 20, 2020 OREM 84058EVUT_342587 EV Level 2 Charger (Residential) 1 1 $ 200.00 $ 500.00 Oct 12, 2020 Dec 3, 2020 LAYTON 84041EVUT_347022 EV Level 2 Charger (Residential) 1 1 $ 200.00 $ 500.00 Nov 23, 2020 Dec 3, 2020 NORTH SALT LAKE 84054EVUT_347025 EV Level 2 Charger (Residential) 1 1 $ 200.00 $ 500.00 Nov 23, 2020 Dec 3, 2020 MILLCREEK 84124EVUT_347119 EV Level 2 Charger (Residential) 1 1 $ 200.00 $ 699.00 Nov 30, 2020 Dec 3, 2020 SALT LAKE CITY 84115EVUT_347628 EV Level 2 Charger (Residential) 1 1 $ 200.00 $ 894.00 Nov 30, 2020 Dec 3, 2020 MILLCREEK 84109EVUT_347614 EV Level 2 Charger (Residential) 1 1 $ 200.00 $ 387.45 Nov 30, 2020 Dec 3, 2020 MOUNTAIN GREEN 84050EVUT_347120 EV Level 2 Charger (Residential) 1 1 $ 200.00 $ 699.00 Nov 30, 2020 Dec 3, 2020 EAGLE MOUNTAIN 84005EVUT_348074 EV Level 2 Charger (Residential) 1 1 $ 200.00 $ 649.00 Dec 2, 2020 Dec 3, 2020 PARK CITY 84098EVUT_341640 EV Level 2 Charger (Residential) 1 1 $ 200.00 $ 300.00 Oct 8, 2020 Dec 10, 2020 SOUTH SALT LAKE 84106EVUT_347618 EV Level 2 Charger (Residential) 1 1 $ 200.00 $ 500.00 Nov 30, 2020 Dec 10, 2020 PARK CITY 84098EVUT_348711 EV Level 2 Charger (Residential) 1 1 $ 200.00 $ 500.00 Dec 4, 2020 Dec 10, 2020 LAYTON 84041EVUT_348676 EV Level 2 Charger (Residential) 1 1 $ 200.00 $ 500.00 Dec 4, 2020 Dec 10, 2020 CENTERVILLE 84014EVUT_349155 EV Level 2 Charger (Residential) 1 1 $ 200.00 $ 699.00 Dec 9, 2020 Dec 10, 2020 HEBER CITY 84032EVUT_349110 EV Level 2 Charger (Residential) 1 1 $ 200.00 $ 699.00 Dec 9, 2020 Dec 10, 2020 SANDY 84092EVUT_349102 EV Level 2 Charger (Residential) 1 1 $ 200.00 $ 500.00 Dec 9, 2020 Dec 10, 2020 SOUTH OGDEN 84405EVUT_347024 EV Level 2 Charger (Residential) 1 1 $ 200.00 $ 599.99 Nov 23, 2020 Dec 21, 2020 TAYLORSVILLE 84123EVUT_347616 EV Level 2 Charger (Residential) 1 1 $ 200.00 $ 500.00 Nov 30, 2020 Dec 21, 2020 COTTONWOOD HEIGHTS 84121EVUT_349363 EV Level 2 Charger (Residential) 1 1 $ 200.00 $ 500.00 Dec 10, 2020 Dec 21, 2020 SALT LAKE CITY 84103EVUT_349388 EV Level 2 Charger (Residential) 1 1 $ 200.00 $ 569.00 Dec 11, 2020 Dec 21, 2020 MILLCREEK 84109EVUT_349923 EV Level 2 Charger (Residential) 1 1 $ 200.00 $ 500.00 Dec 15, 2020 Dec 21, 2020 BLUFFDALE 84065EVUT_349935 EV Level 2 Charger (Residential) 1 1 $ 200.00 $ 500.00 Dec 15, 2020 Dec 21, 2020 LAYTON 84041EVUT_349939 EV Level 2 Charger (Residential) 1 1 $ 200.00 $ 699.00 Dec 16, 2020 Dec 21, 2020 TOOELE 84074EVUT_350722 EV Level 2 Charger (Residential) 1 1 $ 200.00 $ 619.00 Dec 17, 2020 Dec 21, 2020 Park City 84060EVUT_343932 EV Level 2 Charger (Residential) 1 1 $ 200.00 $ 439.00 Oct 26, 2020 Jan 4, 2021 MILLCREEK 84106EVUT_343974 EV Level 2 Charger (Residential) 1 1 $ 200.00 $ 850.00 Oct 26, 2020 Jan 4, 2021 ROY 84067EVUT_345040 EV Level 2 Charger (Residential) 1 1 $ 200.00 $ 589.00 Nov 4, 2020 Jan 4, 2021 SALT LAKE CITY 84116

Project Name Measure_Name QuantityNumber of
PortsCustomer Incentive Measure Cost Creation Date Payment Creation Date Site City Site Postal Code
EV Program Prescriptive Incentives (2021 Budget Funds)
EVUT_345799 EV Level 2 Charger (Residential) 1 1 $ 178.12 $ 237.49 Nov 12, 2020 Jan 4, 2021 COTTONWOOD HEIGHTS 84121EVUT_349366 EV Level 2 Charger (Residential) 1 1 $ 200.00 $ 699.00 Dec 10, 2020 Jan 4, 2021 SOUTH JORDAN 84009EVUT_350936 EV Level 2 Charger (Residential) 1 1 $ 200.00 $ 399.99 Dec 21, 2020 Jan 4, 2021 SALT LAKE CITY 84106EVUT_350935 EV Level 2 Charger (Residential) 1 1 $ 200.00 $ 500.00 Dec 21, 2020 Jan 4, 2021 SANDY 84092EVUT_350887 EV Level 2 Charger (Residential) 1 1 $ 200.00 $ 477.00 Dec 21, 2020 Jan 4, 2021 FARMINGTON 84025EVUT_352001 EV Level 2 Charger (Residential) 1 1 $ 200.00 $ 538.75 Dec 22, 2020 Jan 4, 2021 SALT LAKE CITY 84108EVUT_352117 EV Level 2 Charger (Residential) 1 1 $ 200.00 $ 599.00 Dec 24, 2020 Jan 4, 2021 PARK CITY 84098EVUT_352307 EV Level 2 Charger (Residential) 1 1 $ 200.00 $ 599.00 Dec 24, 2020 Jan 4, 2021 MIDVALE 84070EVUT_352402 EV Level 2 Charger (Residential) 1 1 $ 200.00 $ 329.00 Dec 28, 2020 Jan 4, 2021 DRAPER 84020EVUT_352405 EV Level 2 Charger (Residential) 1 1 $ 200.00 $ 699.00 Dec 29, 2020 Jan 4, 2021 WEST BOUNTIFUL 84087EVUT_352505 EV Level 2 Charger (Residential) 1 1 $ 200.00 $ 589.00 Dec 29, 2020 Jan 4, 2021 SANDY 84092EVUT_352543 EV Level 2 Charger (Residential) 1 1 $ 200.00 $ 500.00 Dec 29, 2020 Jan 4, 2021 SALT LAKE CITY 84109EVUT_348748 EV Level 2 Charger (Residential) 1 1 $ 200.00 $ 400.00 Dec 7, 2020 Jan 15, 2021 HOLLADAY 84117EVUT_349378 EV Level 2 Charger (Residential) 1 1 $ 200.00 $ 500.00 Dec 10, 2020 Jan 15, 2021 WEST JORDAN 84088EVUT_352304 EV Level 2 Charger (Residential) 1 1 $ 200.00 $ 500.00 Dec 24, 2020 Jan 15, 2021 NORTH LOGAN 84341EVUT_353613 EV Level 2 Charger (Residential) 1 1 $ 200.00 $ 609.00 Dec 31, 2020 Jan 15, 2021 SALT LAKE CITY 84115EVUT_353621 EV Level 2 Charger (Residential) 1 1 $ 149.99 $ 199.99 Jan 4, 2021 Jan 15, 2021 STANSBURY PARK 84074EVUT_353620 EV Level 2 Charger (Residential) 1 1 $ 154.81 $ 206.41 Jan 4, 2021 Jan 15, 2021 OGDEN 84404EVUT_353619 EV Level 2 Charger (Residential) 1 1 $ 200.00 $ 500.00 Jan 4, 2021 Jan 15, 2021 MILLCREEK 84109EVUT_353731 EV Level 2 Charger (Residential) 1 1 $ 200.00 $ 649.00 Jan 5, 2021 Jan 15, 2021 MIDVALE 84047EVUT_353741 EV Level 2 Charger (Residential) 1 1 $ 200.00 $ 299.99 Jan 6, 2021 Jan 15, 2021 OAKLEY 84060EVUT_353751 EV Level 2 Charger (Residential) 1 1 $ 200.00 $ 649.00 Jan 6, 2021 Jan 15, 2021 OREM 84097EVUT_354275 EV Level 2 Charger (Residential) 1 1 $ 200.00 $ 350.00 Jan 11, 2021 Jan 15, 2021 SOUTH JORDAN 84009EVUT_354283 EV Level 2 Charger (Residential) 1 1 $ 200.00 $ 469.00 Jan 11, 2021 Jan 15, 2021 IVINS 84738EVUT_349270 EV Level 2 Charger (Residential) 1 1 $ 200.00 $ 374.00 Dec 9, 2020 Jan 19, 2021 TAYLORSVILLE 84129EVUT_349940 EV Level 2 Charger (Residential) 1 1 $ 200.00 $ 399.99 Dec 16, 2020 Jan 19, 2021 HERRIMAN 84096EVUT_352411 EV Level 2 Charger (Residential) 1 1 $ 200.00 $ 500.00 Dec 29, 2020 Jan 19, 2021 COTTONWOOD HEIGHTS 84121EVUT_353618 EV Level 2 Charger (Residential) 1 1 $ 200.00 $ 649.00 Jan 4, 2021 Jan 19, 2021 COTTONWOOD HEIGHTS 84121EVUT_353728 EV Level 2 Charger (Residential) 1 1 $ 200.00 $ 500.00 Jan 4, 2021 Jan 19, 2021 SOUTH JORDAN 84009EVUT_353742 EV Level 2 Charger (Residential) 1 1 $ 200.00 $ 542.00 Jan 6, 2021 Jan 19, 2021 SALT LAKE CITY 84102EVUT_354299 EV Level 2 Charger (Residential) 1 1 $ 200.00 $ 500.00 Jan 12, 2021 Jan 19, 2021 BLUFFDALE 84065EVUT_354420 EV Level 2 Charger (Residential) 1 1 $ 200.00 $ 419.00 Jan 14, 2021 Jan 19, 2021 WEST HAVEN 84401EVUT_354504 EV Level 2 Charger (Residential) 1 1 $ 200.00 $ 284.99 Jan 14, 2021 Jan 19, 2021 AMERICAN FORK 84003EVUT_354503 EV Level 2 Charger (Residential) 1 1 $ 200.00 $ 500.00 Jan 14, 2021 Jan 19, 2021 FARMINGTON 84025EVUT_355092 EV Level 2 Charger (Residential) 1 1 $ 200.00 $ 405.00 Jan 19, 2021 Jan 25, 2021 SARATOGA SPRINGS 84045EVUT_355094 EV Level 2 Charger (Residential) 1 1 $ 200.00 $ 359.00 Jan 19, 2021 Jan 25, 2021 EAGLE MOUNTAIN 84005EVUT_355106 EV Level 2 Charger (Residential) 1 1 $ 200.00 $ 439.00 Jan 19, 2021 Jan 25, 2021 SANDY 84094EVUT_352102 EV Level 2 Charger (Residential) 1 1 $ 149.99 $ 199.99 Dec 22, 2020 Feb 8, 2021 AMERICAN FORK 84003EVUT_353542 EV Level 2 Charger (Residential) 1 1 $ 200.00 $ 450.00 Dec 31, 2020 Feb 8, 2021 OREM 84059EVUT_355473 EV Level 2 Charger (Residential) 1 1 $ 200.00 $ 599.00 Jan 25, 2021 Feb 8, 2021 MILLCREEK 84109EVUT_355110 EV Level 2 Charger (Residential) 1 1 $ 200.00 $ 533.75 Jan 25, 2021 Feb 8, 2021 IVINS 84738EVUT_355525 EV Level 2 Charger (Residential) 1 1 $ 200.00 $ 500.00 Jan 26, 2021 Feb 8, 2021 LAYTON 84040EVUT_355928 EV Level 2 Charger (Residential) 1 1 $ 200.00 $ 489.00 Jan 27, 2021 Feb 8, 2021 PERRY 84302EVUT_355931 EV Level 2 Charger (Residential) 1 1 $ 200.00 $ 500.00 Jan 27, 2021 Feb 8, 2021 IVINS 84738EVUT_356315 EV Level 2 Charger (Residential) 1 1 $ 200.00 $ 500.00 Jan 28, 2021 Feb 8, 2021 TAYLORSVILLE 84123EVUT_356356 EV Level 2 Charger (Residential) 1 1 $ 200.00 $ 624.00 Feb 1, 2021 Feb 8, 2021 COTTONWOOD HEIGHTS 84121EVUT_356349 EV Level 2 Charger (Residential) 1 1 $ 200.00 $ 533.38 Feb 1, 2021 Feb 8, 2021 WEST JORDAN 84081EVUT_357019 EV Level 2 Charger (Residential) 1 1 $ 200.00 $ 500.00 Feb 5, 2021 Feb 8, 2021 WEST JORDAN 84088EVUT_356944 EV Level 2 Charger (Residential) 1 1 $ 200.00 $ 500.00 Feb 5, 2021 Feb 8, 2021 WEST VALLEY CITY 84119EVUT_356805 EV Level 2 Charger (Residential) 1 1 $ 200.00 $ 500.00 Feb 5, 2021 Feb 8, 2021 DRAPER 84020EVUT_356713 EV Level 2 Charger (Residential) 1 1 $ 200.00 $ 368.50 Feb 5, 2021 Feb 8, 2021 SOUTH SALT LAKE 84106EVUT_356343 EV Level 2 Charger (Residential) 1 1 $ 200.00 $ 329.99 Feb 1, 2021 Feb 8, 2021 SARATOGA SPRINGS 84045EVUT_355102 EV Level 2 Charger (Residential) 1 1 $ 200.00 $ 500.00 Jan 19, 2021 Feb 11, 2021 FRUIT HEIGHTS 84025EVUT_356710 EV Level 2 Charger (Residential) 1 1 $ 200.00 $ 300.00 Feb 2, 2021 Feb 11, 2021 TOOELE 84074EVUT_357076 EV Level 2 Charger (Residential) 1 1 $ 200.00 $ 1,423.00 Feb 8, 2021 Feb 11, 2021 NIBLEY 84321EVUT_357072 EV Level 2 Charger (Residential) 1 1 $ 200.00 $ 619.00 Feb 8, 2021 Feb 11, 2021 MILLCREEK 84109EVUT_357071 EV Level 2 Charger (Residential) 1 1 $ 200.00 $ 500.00 Feb 8, 2021 Feb 11, 2021 SOUTH WEBER 84405EVUT_357126 EV Level 2 Charger (Residential) 1 1 $ 127.49 $ 169.99 Feb 10, 2021 Feb 11, 2021 SYRACUSE 84075EVUT_357344 EV Level 2 Charger (Residential) 1 1 $ 200.00 $ 500.00 Feb 10, 2021 Feb 11, 2021 DRAPER 84020EVUT_345646 EV Level 2 Charger (Residential) 1 1 $ 200.00 $ 349.00 Nov 9, 2020 Feb 19, 2021 SARATOGA SPRINGS 84045EVUT_354284 EV Level 2 Charger (Residential) 1 1 $ 200.00 $ 565.00 Jan 11, 2021 Feb 19, 2021 RIVERTON 84065EVUT_355114 EV Level 2 Charger (Residential) 1 1 $ 200.00 $ 400.00 Jan 25, 2021 Feb 19, 2021 HOLLADAY 84117EVUT_356234 EV Level 2 Charger (Residential) 1 1 $ 200.00 $ 710.00 Jan 28, 2021 Feb 19, 2021 SOUTH JORDAN 84009EVUT_356353 EV Level 2 Charger (Residential) 1 1 $ 200.00 $ 649.00 Feb 1, 2021 Feb 19, 2021 MILLCREEK 84124EVUT_356942 EV Level 2 Charger (Residential) 1 1 $ 200.00 $ 439.00 Feb 5, 2021 Feb 19, 2021 SANDY 84070EVUT_357519 EV Level 2 Charger (Residential) 1 1 $ 200.00 $ 387.45 Feb 18, 2021 Feb 19, 2021 SOUTH JORDAN 84009EVUT_357902 EV Level 2 Charger (Residential) 1 1 $ 200.00 $ 500.00 Feb 18, 2021 Feb 19, 2021 OGDEN 84404EVUT_357697 EV Level 2 Charger (Residential) 1 1 $ 200.00 $ 500.00 Feb 18, 2021 Feb 19, 2021 WEST POINT 84015EVUT_357696 EV Level 2 Charger (Residential) 1 1 $ 134.04 $ 178.72 Feb 18, 2021 Feb 19, 2021 EAGLE MOUNTAIN 84005EVUT_357612 EV Level 2 Charger (Residential) 1 1 $ 200.00 $ 649.00 Feb 18, 2021 Feb 19, 2021 MILLCREEK 84109EVUT_357609 EV Level 2 Charger (Residential) 1 1 $ 200.00 $ 624.00 Feb 18, 2021 Feb 19, 2021 SALT LAKE CITY 84105EVUT_358012 EV Level 2 Charger (Residential) 1 1 $ 200.00 $ 649.00 Feb 19, 2021 Feb 19, 2021 ROY 84067EVUT_357397 EV Level 2 Charger (Residential) 1 1 $ 200.00 $ 500.00 Feb 11, 2021 Mar 1, 2021 NORTH OGDEN 84414EVUT_358008 EV Level 2 Charger (Residential) 1 1 $ 200.00 $ 539.00 Feb 22, 2021 Mar 1, 2021 ALPINE 84004EVUT_357024 EV Level 2 Charger (Residential) 1 1 $ 200.00 $ 536.25 Feb 5, 2021 Mar 12, 2021 SANDY 84092EVUT_357082 EV Level 2 Charger (Residential) 1 1 $ 200.00 $ 965.00 Feb 8, 2021 Mar 12, 2021 LAYTON 84040EVUT_357117 EV Level 2 Charger (Residential) 1 1 $ 200.00 $ 559.00 Feb 10, 2021 Mar 12, 2021 EAGLE MOUNTAIN 84005EVUT_357611 EV Level 2 Charger (Residential) 1 1 $ 200.00 $ 699.00 Feb 18, 2021 Mar 12, 2021 LIBERTY 84310EVUT_358020 EV Level 2 Charger (Residential) 1 1 $ 200.00 $ 599.00 Feb 22, 2021 Mar 12, 2021 SANDY 84093

Project Name Measure_Name QuantityNumber of
PortsCustomer Incentive Measure Cost Creation Date Payment Creation Date Site City Site Postal Code
EV Program Prescriptive Incentives (2021 Budget Funds)
EVUT_358510 EV Level 2 Charger (Residential) 1 1 $ 200.00 $ 680.00 Feb 25, 2021 Mar 12, 2021 LAYTON 84041EVUT_358508 EV Level 2 Charger (Residential) 1 1 $ 200.00 $ 699.00 Feb 25, 2021 Mar 12, 2021 MILLCREEK 84124EVUT_358625 EV Level 2 Charger (Residential) 1 1 $ 200.00 $ 500.00 Mar 1, 2021 Mar 12, 2021 RIVERDALE 84405EVUT_358622 EV Level 2 Charger (Residential) 1 1 $ 200.00 $ 500.00 Mar 1, 2021 Mar 12, 2021 LAYTON 84041EVUT_358401 EV Level 2 Charger (Residential) 1 1 $ 200.00 $ 500.00 Mar 1, 2021 Mar 12, 2021 RIVERTON 84065EVUT_358029 EV Level 2 Charger (Residential) 1 1 $ 200.00 $ 500.00 Mar 1, 2021 Mar 12, 2021 OREM 84058EVUT_358756 EV Level 2 Charger (Residential) 1 1 $ 200.00 $ 536.25 Mar 3, 2021 Mar 12, 2021 DRAPER 84020EVUT_358755 EV Level 2 Charger (Residential) 1 1 $ 200.00 $ 500.00 Mar 3, 2021 Mar 12, 2021 FARMINGTON 84025EVUT_358633 EV Level 2 Charger (Residential) 1 1 $ 200.00 $ 699.00 Mar 3, 2021 Mar 12, 2021 STANSBURY PARK 84074EVUT_358630 EV Level 2 Charger (Residential) 1 1 $ 200.00 $ 760.00 Mar 3, 2021 Mar 12, 2021 SARATOGA SPRINGS 84045EVUT_358875 EV Level 2 Charger (Residential) 1 1 $ 200.00 $ 624.00 Mar 3, 2021 Mar 12, 2021 SALT LAKE CITY 84105EVUT_359309 EV Level 2 Charger (Residential) 1 1 $ 200.00 $ 500.00 Mar 8, 2021 Mar 12, 2021 SOUTH JORDAN 84009EVUT_359521 EV Level 2 Charger (Residential) 1 1 $ 200.00 $ 649.00 Mar 10, 2021 Mar 12, 2021 AMERICAN FORK 84003EVUT_358047 EV Level 2 Charger (Residential) 1 1 $ 200.00 $ 550.00 Mar 1, 2021 Mar 12, 2021 HIGHLAND 84003EVUT_359765 EV Level 2 Charger (Residential) 1 1 $ 200.00 $ 820.00 Mar 10, 2021 Mar 23, 2021 SUMMIT COUNTY 84060EVUT_359943 EV Level 2 Charger (Residential) 1 1 $ 200.00 $ 500.00 Mar 15, 2021 Mar 23, 2021 SOUTH JORDAN 84095EVUT_359944 EV Level 2 Charger (Residential) 1 1 $ 200.00 $ 500.00 Mar 15, 2021 Mar 23, 2021 MILLCREEK 84109EVUT_357204 EV Level 2 Charger (Residential) 1 1 $ 200.00 $ 850.00 Feb 10, 2021 Apr 1, 2021 SOUTH JORDAN 84095EVUT_359312 EV Level 2 Charger (Residential) 1 1 $ 200.00 $ 500.00 Mar 8, 2021 Apr 1, 2021 ALPINE 84004EVUT_360746 EV Level 2 Charger (Residential) 1 1 $ 200.00 $ 500.00 Mar 22, 2021 Apr 1, 2021 COTTONWOOD HEIGHTS 84121EVUT_360725 EV Level 2 Charger (Residential) 1 1 $ 200.00 $ 538.75 Mar 22, 2021 Apr 1, 2021 SALT LAKE CITY 84108EVUT_360604 EV Level 2 Charger (Residential) 1 1 $ 130.50 $ 174.00 Mar 22, 2021 Apr 1, 2021 SANDY 84092EVUT_361333 EV Level 2 Charger (Residential) 1 1 $ 200.00 $ 500.00 Mar 26, 2021 Apr 1, 2021 CEDAR HILLS 84062EVUT_360810 EV Level 2 Charger (Residential) 1 1 $ 200.00 $ 500.00 Mar 26, 2021 Apr 1, 2021 DRAPER 84020EVUT_360795 EV Level 2 Charger (Residential) 1 1 $ 200.00 $ 500.00 Mar 26, 2021 Apr 1, 2021 SARATOGA SPRINGS 84045EVUT_361342 EV Level 2 Charger (Residential) 1 1 $ 200.00 $ 699.00 Mar 29, 2021 Apr 1, 2021 BLUFFDALE 84065EVUT_361340 EV Level 2 Charger (Residential) 1 1 $ 200.00 $ 275.00 Mar 29, 2021 Apr 1, 2021 MIDVALE 84070EVUT_361340 EV Level 2 Charger (Residential) 1 1 $ 200.00 $ 275.00 Mar 29, 2021 Apr 1, 2021 MIDVALE 84070EVUT_361406 EV Level 2 Charger (Residential) 1 1 $ 200.00 $ 399.99 Mar 31, 2021 Apr 1, 2021 HONEYVILLE 84314EVUT_361423 EV Level 2 Charger (Residential) 1 1 $ 200.00 $ 1,000.00 Mar 31, 2021 Apr 1, 2021 WEST JORDAN 84088EVUT_361321 EV Level 2 Charger (Residential) 1 1 $ 200.00 $ 1,095.00 Mar 26, 2021 Apr 9, 2021 HIDEOUT 84036EVUT_360816 EV Level 2 Charger (Residential) 1 1 $ 200.00 $ 650.00 Mar 26, 2021 Apr 9, 2021 SYRACUSE 84075EVUT_361898 EV Level 2 Charger (Residential) 1 1 $ 200.00 $ 699.00 Apr 5, 2021 Apr 9, 2021 PARK CITY 84098EVUT_361894 EV Level 2 Charger (Residential) 1 1 $ 200.00 $ 591.50 Apr 5, 2021 Apr 9, 2021 SNYDERVILLE 84098EVUT_361879 EV Level 2 Charger (Residential) 1 1 $ 200.00 $ 699.00 Apr 5, 2021 Apr 9, 2021 MILLCREEK 84124EVUT_361877 EV Level 2 Charger (Residential) 1 1 $ 200.00 $ 699.00 Apr 5, 2021 Apr 9, 2021 SYRACUSE 84075EVUT_361531 EV Level 2 Charger (Residential) 1 1 $ 200.00 $ 1,213.00 Apr 5, 2021 Apr 9, 2021 SALT LAKE CITY 84111EVUT_361523 EV Level 2 Charger (Residential) 1 1 $ 200.00 $ 1,000.00 Apr 5, 2021 Apr 9, 2021 KEARNS 84118EVUT_361903 EV Level 2 Charger (Residential) 1 1 $ 200.00 $ 500.00 Apr 6, 2021 Apr 9, 2021 SYRACUSE 84075EVUT_361905 EV Level 2 Charger (Residential) 1 1 $ 200.00 $ 329.00 Apr 6, 2021 Apr 9, 2021 SOUTH OGDEN 84405EVUT_361913 EV Level 2 Charger (Residential) 1 1 $ 200.00 $ 395.00 Apr 6, 2021 Apr 9, 2021 SANDY 84092EVUT_361426 EV Level 2 Charger (Residential) 1 1 $ 200.00 $ 500.00 Mar 31, 2021 Apr 19, 2021 COTTONWOOD HEIGHTS 84093EVUT_362350 EV Level 2 Charger (Residential) 1 1 $ 200.00 $ 305.99 Apr 12, 2021 Apr 19, 2021 FRUIT HEIGHTS 84037EVUT_362344 EV Level 2 Charger (Residential) 1 1 $ 200.00 $ 500.00 Apr 12, 2021 Apr 19, 2021 WEST JORDAN 84088EVUT_362339 EV Level 2 Charger (Residential) 1 1 $ 200.00 $ 699.00 Apr 12, 2021 Apr 19, 2021 SALT LAKE CITY 84103EVUT_362097 EV Level 2 Charger (Residential) 1 1 $ 149.99 $ 199.99 Apr 12, 2021 Apr 19, 2021 LAYTON 84040EVUT_360710 EV Level 2 Charger (Residential) 1 1 $ 200.00 $ 533.25 Mar 22, 2021 Apr 23, 2021 DEWEYVILLE 84309EVUT_361061 EV Level 2 Charger (Residential) 1 1 $ 171.75 $ 229.00 Mar 26, 2021 Apr 23, 2021 DRAPER 84020EVUT_360906 EV Level 2 Charger (Residential) 1 1 $ 200.00 $ 500.00 Mar 26, 2021 Apr 23, 2021 PARK CITY 84098EVUT_361392 EV Level 2 Charger (Residential) 1 1 $ 200.00 $ 284.94 Mar 31, 2021 Apr 23, 2021 FARMINGTON 84025EVUT_361870 EV Level 2 Charger (Residential) 1 1 $ 200.00 $ 1,100.00 Apr 5, 2021 Apr 23, 2021 PLAIN CITY 84404EVUT_362496 EV Level 2 Charger (Residential) 1 1 $ 200.00 $ 346.00 Apr 14, 2021 Apr 23, 2021 CEDAR CITY 84721EVUT_362495 EV Level 2 Charger (Residential) 1 1 $ 200.00 $ 634.00 Apr 14, 2021 Apr 23, 2021 BLUFFDALE 84065EVUT_360722 EV Level 2 Charger (Residential) 1 1 $ 200.00 $ 699.00 Mar 22, 2021 May 4, 2021 WEST JORDAN 84081EVUT_361312 EV Level 2 Charger (Residential) 1 1 $ 200.00 $ 500.00 Mar 26, 2021 May 4, 2021 NORTH SALT LAKE 84054EVUT_361347 EV Level 2 Charger (Residential) 1 1 $ 200.00 $ 500.00 Mar 29, 2021 May 4, 2021 VINEYARD 84059EVUT_361433 EV Level 2 Charger (Residential) 1 1 $ 200.00 $ 599.99 Apr 5, 2021 May 4, 2021 WEST VALLEY CITY 84119EVUT_361908 EV Level 2 Charger (Residential) 1 1 $ 200.00 $ 350.00 Apr 6, 2021 May 4, 2021 SANTAQUIN 84655EVUT_361919 EV Level 2 Charger (Residential) 1 1 $ 200.00 $ 340.30 Apr 7, 2021 May 4, 2021 NORTH SALT LAKE 84054EVUT_363150 EV Level 2 Charger (Residential) 1 1 $ 149.99 $ 199.99 Apr 14, 2021 May 4, 2021 WEST VALLEY CITY 84120EVUT_363342 EV Level 2 Charger (Residential) 1 1 $ 200.00 $ 500.00 Apr 19, 2021 May 4, 2021 SALT LAKE CITY 84105EVUT_363339 EV Level 2 Charger (Residential) 1 1 $ 200.00 $ 450.00 Apr 19, 2021 May 4, 2021 SALT LAKE CITY 84105EVUT_364843 EV Level 2 Charger (Residential) 1 1 $ 200.00 $ 1,000.00 Apr 23, 2021 May 4, 2021 MILLCREEK 84124EVUT_364708 EV Level 2 Charger (Residential) 1 1 $ 200.00 $ 569.00 Apr 23, 2021 May 4, 2021 SALT LAKE CITY 84109EVUT_364560 EV Level 2 Charger (Residential) 1 1 $ 200.00 $ 500.00 Apr 23, 2021 May 4, 2021 DRAPER 84020EVUT_364954 EV Level 2 Charger (Residential) 1 1 $ 200.00 $ 439.00 Apr 26, 2021 May 4, 2021 SANDY 84094EVUT_364951 EV Level 2 Charger (Residential) 1 1 $ 200.00 $ 329.99 Apr 26, 2021 May 4, 2021 LAYTON 84041EVUT_364945 EV Level 2 Charger (Residential) 1 1 $ 200.00 $ 699.00 Apr 26, 2021 May 4, 2021 SALT LAKE CITY 84105EVUT_364944 EV Level 2 Charger (Residential) 1 1 $ 200.00 $ 599.00 Apr 26, 2021 May 4, 2021 WEST JORDAN 84081EVUT_365793 EV Level 2 Charger (Residential) 1 1 $ 200.00 $ 500.00 Apr 27, 2021 May 4, 2021 FARMINGTON 84025EVUT_365794 EV Level 2 Charger (Residential) 1 1 $ 200.00 $ 599.00 Apr 28, 2021 May 4, 2021 HYDE PARK 84318EVUT_366902 EV Level 2 Charger (Residential) 1 1 $ 200.00 $ 500.00 May 6, 2021 May 11, 2021 WEST JORDAN 84081EVUT_366353 EV Level 2 Charger (Residential) 1 1 $ 200.00 $ 500.00 May 6, 2021 May 11, 2021 WEST JORDAN 84081EVUT_366338 EV Level 2 Charger (Residential) 1 1 $ 200.00 $ 439.00 May 7, 2021 May 11, 2021 SOUTH JORDAN 84095EVUT_364950 EV Level 2 Charger (Residential) 1 1 $ 168.75 $ 225.00 Apr 26, 2021 May 19, 2021 HERRIMAN 84096EVUT_367211 EV Level 2 Charger (Residential) 1 1 $ 200.00 $ 500.00 May 10, 2021 May 19, 2021 OREM 84097EVUT_367209 EV Level 2 Charger (Residential) 1 1 $ 200.00 $ 995.00 May 10, 2021 May 19, 2021 NORTH OGDEN 84414EVUT_367364 EV Level 2 Charger (Residential) 1 1 $ 200.00 $ 979.60 May 12, 2021 May 19, 2021 WEST JORDAN 84081EVUT_367365 EV Level 2 Charger (Residential) 1 1 $ 200.00 $ 500.00 May 12, 2021 May 19, 2021 DRAPER 84020

Project Name Measure_Name QuantityNumber of
PortsCustomer Incentive Measure Cost Creation Date Payment Creation Date Site City Site Postal Code
EV Program Prescriptive Incentives (2021 Budget Funds)
EVUT_367731 EV Level 2 Charger (Residential) 1 1 $ 200.00 $ 299.29 May 12, 2021 May 19, 2021 SANDY 84093EVUT_367732 EV Level 2 Charger (Residential) 1 1 $ 200.00 $ 500.00 May 12, 2021 May 26, 2021 PARK CITY 84098EVUT_361920 EV Level 2 Charger (Residential) 1 1 $ 200.00 $ 350.00 Apr 7, 2021 May 28, 2021 MIDVALE 84047EVUT_363272 EV Level 2 Charger (Residential) 1 1 $ 200.00 $ 439.00 Apr 16, 2021 May 28, 2021 NORTH SALT LAKE 84054EVUT_366074 EV Level 2 Charger (Residential) 1 1 $ 200.00 $ 439.00 Apr 28, 2021 May 28, 2021 OREM 84057EVUT_367340 EV Level 2 Charger (Residential) 1 1 $ 200.00 $ 529.00 May 10, 2021 May 28, 2021 OREM 84057EVUT_367207 EV Level 2 Charger (Residential) 1 1 $ 200.00 $ 439.00 May 10, 2021 May 28, 2021 HERRIMAN 84096EVUT_367208 EV Level 2 Charger (Residential) 1 1 $ 200.00 $ 500.00 May 10, 2021 May 28, 2021 PLEASANT GROVE 84062EVUT_367933 EV Level 2 Charger (Residential) 1 1 $ 200.00 $ 500.00 May 12, 2021 May 28, 2021 SOUTH JORDAN 84095EVUT_367736 EV Level 2 Charger (Residential) 1 1 $ 142.49 $ 189.99 May 12, 2021 May 28, 2021 WEST VALLEY CITY 84128EVUT_368074 EV Level 2 Charger (Residential) 1 1 $ 200.00 $ 399.99 May 14, 2021 May 28, 2021 SYRACUSE 84075EVUT_367994 EV Level 2 Charger (Residential) 1 1 $ 200.00 $ 649.00 May 17, 2021 May 28, 2021 SARATOGA SPRINGS 84045EVUT_368717 EV Level 2 Charger (Residential) 1 1 $ 200.00 $ 589.00 May 20, 2021 May 28, 2021 EAGLE MOUNTAIN 84005EVUT_369022 EV Level 2 Charger (Residential) 1 1 $ 200.00 $ 599.00 May 21, 2021 May 28, 2021 CENTERVILLE 84014EVUT_368934 EV Level 2 Charger (Residential) 1 1 $ 200.00 $ 319.99 May 21, 2021 May 28, 2021 WEST VALLEY CITY 84119EVUT_368719 EV Level 2 Charger (Residential) 1 1 $ 200.00 $ 429.99 May 21, 2021 May 28, 2021 WOODS CROSS 84087EVUT_369178 EV Level 2 Charger (Residential) 1 1 $ 200.00 $ 500.00 May 25, 2021 May 28, 2021 DRAPER 84020EVUT_369238 EV Level 2 Charger (Residential) 1 1 $ 200.00 $ 439.00 May 25, 2021 May 28, 2021 EAGLE MOUNTAIN 84005EVUT_369209 EV Level 2 Charger (Residential) 1 1 $ 200.00 $ 500.00 May 25, 2021 May 28, 2021 MIDVALE 84047EVUT_369556 EV Level 2 Charger (Residential) 1 1 $ 200.00 $ 399.00 May 27, 2021 May 28, 2021 SOUTH JORDAN 84095EVUT_359910 EV Level 2 Charger (Residential) 1 1 $ 200.00 $ 439.00 Mar 12, 2021 Jun 3, 2021 SOUTH JORDAN 84009EVUT_362498 EV Level 2 Charger (Residential) 1 1 $ 200.00 $ 609.00 Apr 14, 2021 Jun 3, 2021 EAGLE MOUNTAIN 84005EVUT_367206 EV Level 2 Charger (Residential) 1 1 $ 200.00 $ 399.00 May 10, 2021 Jun 3, 2021 OGDEN 84401EVUT_369711 EV Level 2 Charger (Residential) 1 1 $ 200.00 $ 500.00 May 28, 2021 Jun 3, 2021 OREM 84057EVUT_370490 EV Level 2 Charger (Residential) 1 1 $ 200.00 $ 500.00 Jun 2, 2021 Jun 3, 2021 DRAPER 84020EVUT_370482 EV Level 2 Charger (Residential) 1 1 $ 200.00 $ 699.00 Jun 2, 2021 Jun 3, 2021 FRUIT HEIGHTS 84037EVUT_369957 EV Level 2 Charger (Residential) 1 1 $ 200.00 $ 699.00 Jun 2, 2021 Jun 3, 2021 VINEYARD 84059EVUT_369955 EV Level 2 Charger (Residential) 1 1 $ 200.00 $ 500.00 Jun 2, 2021 Jun 3, 2021 COTTONWOOD HEIGHTS 84121EVUT_369938 EV Level 2 Charger (Residential) 1 1 $ 200.00 $ 599.00 Jun 2, 2021 Jun 3, 2021 NORTH SALT LAKE 84054EVUT_361439 EV Level 2 Charger (Residential) 1 1 $ 200.00 $ 299.00 Apr 5, 2021 Jun 14, 2021 APPLE VALLEY 84737EVUT_370802 EV Level 2 Charger (Residential) 1 1 $ 200.00 $ 439.00 Jun 3, 2021 Jun 14, 2021 COTTONWOOD HEIGHTS 84121EVUT_370840 EV Level 2 Charger (Residential) 1 1 $ 200.00 $ 500.00 Jun 8, 2021 Jun 14, 2021 CEDAR CITY 84720EVUT_370845 EV Level 2 Charger (Residential) 1 1 $ 200.00 $ 1,000.00 Jun 8, 2021 Jun 14, 2021 PARK CITY 84098EVUT_371342 EV Level 2 Charger (Residential) 1 1 $ 200.00 $ 312.51 Jun 8, 2021 Jun 14, 2021 WEST JORDAN 84084EVUT_371341 EV Level 2 Charger (Residential) 1 1 $ 200.00 $ 439.00 Jun 8, 2021 Jun 14, 2021 FRUIT HEIGHTS 84037EVUT_370846 EV Level 2 Charger (Residential) 1 1 $ 200.00 $ 550.00 Jun 8, 2021 Jun 14, 2021 MURRAY 84107EVUT_367984 EV Level 2 Charger (Residential) 1 1 $ 200.00 $ 599.00 May 17, 2021 Jun 28, 2021 HOLLADAY 84117EVUT_371743 EV Level 2 Charger (Residential) 1 1 $ 200.00 $ 439.00 Jun 14, 2021 Jun 28, 2021 FRUIT HEIGHTS 84037EVUT_371782 EV Level 2 Charger (Residential) 1 1 $ 200.00 $ 279.00 Jun 16, 2021 Jun 28, 2021 Riverton 84065EVUT_371797 EV Level 2 Charger (Residential) 1 1 $ 200.00 $ 987.00 Jun 16, 2021 Jun 28, 2021 HIGHLAND 84003EVUT_371793 EV Level 2 Charger (Residential) 1 1 $ 200.00 $ 279.00 Jun 16, 2021 Jun 28, 2021 SALT LAKE CITY 84109EVUT_372260 EV Level 2 Charger (Residential) 1 1 $ 200.00 $ 1,226.31 Jun 17, 2021 Jun 28, 2021 HERRIMAN 84096EVUT_372312 EV Level 2 Charger (Residential) 1 1 $ 200.00 $ 529.99 Jun 17, 2021 Jun 28, 2021 SANDY 84092EVUT_372268 EV Level 2 Charger (Residential) 1 1 $ 200.00 $ 619.00 Jun 17, 2021 Jun 28, 2021 EAGLE MOUNTAIN 84005EVUT_372711 EV Level 2 Charger (Residential) 1 1 $ 200.00 $ 449.00 Jun 24, 2021 Jun 28, 2021 SARATOGA SPRINGS 84045EVUT_372775 EV Level 2 Charger (Residential) 1 1 $ 200.00 $ 749.38 Jun 24, 2021 Jun 28, 2021 RIVERTON 84096EVUT_372825 EV Level 2 Charger (Residential) 1 1 $ 200.00 $ 1,125.00 Jun 24, 2021 Jun 28, 2021 PLEASANT VIEW 84414EVUT_372975 EV Level 2 Charger (Residential) 1 1 $ 200.00 $ 500.00 Jun 28, 2021 Jul 2, 2021 SOUTH WEBER 84405EVUT_373164 EV Level 2 Charger (Residential) 1 1 $ 200.00 $ 500.00 Jun 30, 2021 Jul 2, 2021 SANDY 84092EVUT_373002 EV Level 2 Charger (Residential) 1 1 $ 200.00 $ 500.00 Jun 30, 2021 Jul 2, 2021 KEARNS 84118EVUT_373000 EV Level 2 Charger (Residential) 1 1 $ 200.00 $ 500.00 Jun 30, 2021 Jul 2, 2021 TOQUERVILLE 84774EVUT_362359 EV Level 2 Charger (Residential) 1 1 $ 200.00 $ 500.00 Apr 12, 2021 Jul 27, 2021 MILLCREEK 84124EVUT_367218 EV Level 2 Charger (Residential) 1 1 $ 200.00 $ 1,422.50 May 10, 2021 Jul 27, 2021 MAPLETON 84664EVUT_370611 EV Level 2 Charger (Residential) 1 1 $ 200.00 $ 1,050.00 Jun 3, 2021 Jul 27, 2021 SARATOGA SPRINGS 84045EVUT_370884 EV Level 2 Charger (Residential) 1 1 $ 200.00 $ 500.00 Jun 8, 2021 Jul 27, 2021 SALT LAKE CITY 84103EVUT_371638 EV Level 2 Charger (Residential) 1 1 $ 200.00 $ 439.00 Jun 11, 2021 Jul 27, 2021 SOUTH JORDAN 84009EVUT_371603 EV Level 2 Charger (Residential) 1 1 $ 200.00 $ 439.00 Jun 11, 2021 Jul 27, 2021 AMERICAN FORK 84003EVUT_371741 EV Level 2 Charger (Residential) 1 1 $ 200.00 $ 1,075.00 Jun 14, 2021 Jul 27, 2021 SOUTH SALT LAKE 84115EVUT_371746 EV Level 2 Charger (Residential) 1 1 $ 200.00 $ 699.00 Jun 14, 2021 Jul 27, 2021 LINDON 84042EVUT_372810 EV Level 2 Charger (Residential) 1 1 $ 200.00 $ 329.99 Jun 24, 2021 Jul 27, 2021 SOUTH JORDAN 84009EVUT_372773 EV Level 2 Charger (Residential) 1 1 $ 200.00 $ 399.00 Jun 24, 2021 Jul 27, 2021 PLEASANT VIEW 84414EVUT_373418 EV Level 2 Charger (Residential) 1 1 $ 200.00 $ 424.00 Jul 2, 2021 Jul 27, 2021 SARATOGA SPRINGS 84045EVUT_373501 EV Level 2 Charger (Residential) 1 1 $ 200.00 $ 746.18 Jul 7, 2021 Jul 27, 2021 FARMINGTON 84025EVUT_373706 EV Level 2 Charger (Residential) 1 1 $ 200.00 $ 500.00 Jul 12, 2021 Jul 27, 2021 SOUTH JORDAN 84095EVUT_374733 EV Level 2 Charger (Residential) 1 1 $ 200.00 $ 545.00 Jul 15, 2021 Jul 27, 2021 RIVERTON 84065EVUT_375262 EV Level 2 Charger (Residential) 1 1 $ 200.00 $ 450.00 Jul 20, 2021 Jul 27, 2021 SOUTH OGDEN 84405EVUT_375226 EV Level 2 Charger (Residential) 1 1 $ 200.00 $ 350.00 Jul 20, 2021 Jul 27, 2021 WEST VALLEY CITY 84119EVUT_375211 EV Level 2 Charger (Residential) 1 1 $ 200.00 $ 500.00 Jul 20, 2021 Jul 27, 2021 HERRIMAN 84096EVUT_374703 EV Level 2 Charger (Residential) 1 1 $ 200.00 $ 500.00 Jul 20, 2021 Jul 27, 2021 LIBERTY 84310EVUT_374720 EV Level 2 Charger (Residential) 1 1 $ 200.00 $ 599.99 Jul 21, 2021 Jul 27, 2021 NORTH SALT LAKE 84116EVUT_375366 EV Level 2 Charger (Residential) 1 1 $ 200.00 $ 649.00 Jul 21, 2021 Jul 27, 2021 SOUTH OGDEN 84403EVUT_374731 EV Level 2 Charger (Residential) 1 1 $ 200.00 $ 500.00 Jul 21, 2021 Jul 27, 2021 VINEYARD 84059EVUT_377694 EV Level 2 Charger (Residential) 1 1 $ 200.00 $ 574.00 Aug 3, 2021 Aug 6, 2021 CENTERVILLE 84014EVUT_377446 EV Level 2 Charger (Residential) 1 1 $ 200.00 $ 625.00 Aug 3, 2021 Aug 6, 2021 HERRIMAN 84096EVUT_377939 EV Level 2 Charger (Residential) 1 1 $ 200.00 $ 500.00 Aug 5, 2021 Aug 6, 2021 RIVERTON 84065EVUT_377934 EV Level 2 Charger (Residential) 1 1 $ 200.00 $ 268.97 Aug 5, 2021 Aug 6, 2021 MAPLETON 84664EVUT_375677 EV Level 2 Charger (Residential) 1 1 $ 200.00 $ 600.00 Aug 6, 2021 Aug 13, 2021 VINEYARD 84059EVUT_375709 EV Level 2 Charger (Residential) 1 1 $ 200.00 $ 690.00 Aug 6, 2021 Aug 13, 2021 WEST HAVEN 84401EVUT_375719 EV Level 2 Charger (Residential) 1 1 $ 200.00 $ 500.00 Aug 6, 2021 Aug 13, 2021 DRAPER 84020

Project Name Measure_Name QuantityNumber of
PortsCustomer Incentive Measure Cost Creation Date Payment Creation Date Site City Site Postal Code
EV Program Prescriptive Incentives (2021 Budget Funds)
EVUT_377987 EV Level 2 Charger (Residential) 1 1 $ 200.00 $ 900.00 Aug 6, 2021 Aug 13, 2021 PARK CITY 84098EVUT_373165 EV Level 2 Charger (Residential) 1 1 $ 200.00 $ 500.00 Jun 30, 2021 Aug 16, 2021 MILLCREEK 84109EVUT_373527 EV Level 2 Charger (Residential) 1 1 $ 200.00 $ 530.00 Jul 7, 2021 Aug 16, 2021 CENTERVILLE 84014EVUT_375119 EV Level 2 Charger (Residential) 1 1 $ 200.00 $ 1,152.50 Jul 20, 2021 Aug 16, 2021 VINEYARD 84059EVUT_377362 EV Level 2 Charger (Residential) 1 1 $ 200.00 $ 499.95 Jul 29, 2021 Aug 16, 2021 HIGHLAND 84003EVUT_375690 EV Level 2 Charger (Residential) 1 1 $ 200.00 $ 500.00 Aug 6, 2021 Aug 16, 2021 OREM 84057EVUT_378136 EV Level 2 Charger (Residential) 1 1 $ 200.00 $ 5,590.85 Aug 9, 2021 Aug 16, 2021 SALT LAKE CITY 84105EVUT_378008 EV Level 2 Charger (Residential) 1 1 $ 200.00 $ 619.00 Aug 9, 2021 Aug 16, 2021 SOUTH OGDEN 84405EVUT_377996 EV Level 2 Charger (Residential) 1 1 $ 200.00 $ 2,418.67 Aug 9, 2021 Aug 16, 2021 LAYTON 84041EVUT_378243 EV Level 2 Charger (Residential) 1 1 $ 200.00 $ 500.00 Aug 12, 2021 Aug 16, 2021 OGDEN 84401EVUT_379160 EV Level 2 Charger (Residential) 1 1 $ 200.00 $ 569.00 Aug 13, 2021 Aug 16, 2021 SNYDERVILLE 84098EVUT_379161 EV Level 2 Charger (Residential) 1 1 $ 200.00 $ 850.00 Aug 13, 2021 Aug 19, 2021 NORTH OGDEN 84414EVUT_379147 EV Level 2 Charger (Residential) 1 1 $ 200.00 $ 599.99 Aug 13, 2021 Aug 19, 2021 EMIGRATION CANYON 84108EVUT_375213 EV Level 2 Charger (Residential) 1 1 $ 200.00 $ 699.00 Jul 20, 2021 Aug 30, 2021 BLUFFDALE 84065EVUT_377408 EV Level 2 Charger (Residential) 1 1 $ 200.00 $ 1,900.00 Jul 29, 2021 Aug 30, 2021 SALT LAKE CITY 84102EVUT_380212 EV Level 2 Charger (Residential) 1 1 $ 200.00 $ 589.00 Aug 19, 2021 Aug 30, 2021 SOUTH JORDAN 84095EVUT_379893 EV Level 2 Charger (Residential) 1 1 $ 200.00 $ 569.00 Aug 19, 2021 Aug 30, 2021 WEST JORDAN 84088EVUT_379200 EV Level 2 Charger (Residential) 1 1 $ 200.00 $ 292.99 Aug 19, 2021 Aug 30, 2021 WEST VALLEY CITY 84119EVUT_379179 EV Level 2 Charger (Residential) 1 1 $ 200.00 $ 599.00 Aug 19, 2021 Aug 30, 2021 ROY 84067EVUT_375816 EV Level 2 Charger (Residential) 1 1 $ 200.00 $ 950.00 Jul 29, 2021 Sep 1, 2021 WEST JORDAN 84084EVUT_375682 EV Level 2 Charger (Residential) 1 1 $ 200.00 $ 1,186.00 Aug 6, 2021 Sep 1, 2021 LIBERTY 84310EVUT_379896 EV Level 2 Charger (Residential) 1 1 $ 200.00 $ 539.00 Aug 19, 2021 Sep 1, 2021 FARMINGTON 84025EVUT_379895 EV Level 2 Charger (Residential) 1 1 $ 200.00 $ 579.00 Aug 19, 2021 Sep 1, 2021 WEST JORDAN 84088EVUT_379195 EV Level 2 Charger (Residential) 1 1 $ 200.00 $ 309.00 Aug 19, 2021 Sep 1, 2021 WEST HAVEN 84401EVUT_380399 EV Level 2 Charger (Residential) 1 1 $ 200.00 $ 500.00 Aug 24, 2021 Sep 1, 2021 SANDY 84093EVUT_380398 EV Level 2 Charger (Residential) 1 1 $ 200.00 $ 500.00 Aug 24, 2021 Sep 1, 2021 OREM 84097EVUT_380395 EV Level 2 Charger (Residential) 1 1 $ 200.00 $ 500.00 Aug 24, 2021 Sep 1, 2021 ROY 84067EVUT_380394 EV Level 2 Charger (Residential) 1 1 $ 200.00 $ 500.00 Aug 24, 2021 Sep 1, 2021 SARATOGA SPRINGS 84045EVUT_380416 EV Level 2 Charger (Residential) 1 1 $ 200.00 $ 599.00 Aug 26, 2021 Sep 1, 2021 STANSBURY PARK 84074EVUT_381202 EV Level 2 Charger (Residential) 1 1 $ 200.00 $ 500.00 Aug 26, 2021 Sep 1, 2021 COTTONWOOD HEIGHTS 84121EVUT_381242 EV Level 2 Charger (Residential) 1 1 $ 200.00 $ 500.00 Aug 27, 2021 Sep 1, 2021 WEST JORDAN 84081EVUT_381251 EV Level 2 Charger (Residential) 1 1 $ 200.00 $ 500.00 Aug 27, 2021 Sep 1, 2021 SOUTH WEBER 84405EVUT_381253 EV Level 2 Charger (Residential) 1 1 $ 200.00 $ 649.00 Aug 27, 2021 Sep 1, 2021 MILLCREEK 84109EVUT_381266 EV Level 2 Charger (Residential) 1 1 $ 200.00 $ 977.00 Aug 30, 2021 Sep 1, 2021 EAGLE MOUNTAIN 84005EVUT_381457 EV Level 2 Charger (Residential) 1 1 $ 200.00 $ 303.35 Sep 1, 2021 Sep 1, 2021 SOUTH SALT LAKE 84115EVUT_378872 EV Level 2 Charger (Residential) 1 1 $ 200.00 $ 500.00 Aug 13, 2021 Sep 10, 2021 HERRIMAN 84096EVUT_380210 EV Level 2 Charger (Residential) 1 1 $ 200.00 $ 500.00 Aug 19, 2021 Sep 10, 2021 SALT LAKE CITY 84106EVUT_381270 EV Level 2 Charger (Residential) 1 1 $ 200.00 $ 699.00 Aug 30, 2021 Sep 10, 2021 SALT LAKE CITY 84103EVUT_381881 EV Level 2 Charger (Residential) 1 1 $ 200.00 $ 500.00 Sep 3, 2021 Sep 10, 2021 SOUTH JORDAN 84009EVUT_381869 EV Level 2 Charger (Residential) 1 1 $ 200.00 $ 550.00 Sep 3, 2021 Sep 10, 2021 FARR WEST 84404EVUT_382502 EV Level 2 Charger (Residential) 1 1 $ 200.00 $ 649.00 Sep 7, 2021 Sep 10, 2021 DRAPER 84020EVUT_382733 EV Level 2 Charger (Residential) 1 1 $ 200.00 $ 500.00 Sep 7, 2021 Sep 10, 2021 DRAPER 84020EVUT_371779 EV Level 2 Charger (Residential) 1 1 $ 200.00 $ 500.00 Jun 15, 2021 Sep 13, 2021 WOODS CROSS 84087EVUT_372472 EV Level 2 Charger (Residential) 1 1 $ 200.00 $ 500.00 Jun 23, 2021 Sep 13, 2021 HIGHLAND 84003EVUT_372998 EV Level 2 Charger (Residential) 1 1 $ 200.00 $ 500.00 Jun 30, 2021 Sep 13, 2021 WOODS CROSS 84087EVUT_373358 EV Level 2 Charger (Residential) 1 1 $ 200.00 $ 500.00 Jul 2, 2021 Sep 13, 2021 LAYTON 84040EVUT_374729 EV Level 2 Charger (Residential) 1 1 $ 200.00 $ 699.00 Jul 21, 2021 Sep 13, 2021 HIGHLAND 84003EVUT_375817 EV Level 2 Charger (Residential) 1 1 $ 200.00 $ 500.00 Jul 29, 2021 Sep 13, 2021 BLUFFDALE 84065EVUT_377440 EV Level 2 Charger (Residential) 1 1 $ 200.00 $ 539.00 Aug 3, 2021 Sep 13, 2021 SALT LAKE CITY 84103EVUT_377933 EV Level 2 Charger (Residential) 1 1 $ 200.00 $ 459.00 Aug 5, 2021 Sep 13, 2021 WEST VALLEY CITY 84128EVUT_375807 EV Level 2 Charger (Residential) 1 1 $ 200.00 $ 399.00 Aug 6, 2021 Sep 13, 2021 BLUFFDALE 84065EVUT_377981 EV Level 2 Charger (Residential) 1 1 $ 200.00 $ 599.00 Aug 6, 2021 Sep 13, 2021 MIDVALE 84047EVUT_378885 EV Level 2 Charger (Residential) 1 1 $ 200.00 $ 500.00 Aug 13, 2021 Sep 13, 2021 SANDY 84092EVUT_379197 EV Level 2 Charger (Residential) 1 1 $ 200.00 $ 649.00 Aug 19, 2021 Sep 13, 2021 SALT LAKE CITY 84105EVUT_380429 EV Level 2 Charger (Residential) 1 1 $ 200.00 $ 500.00 Aug 24, 2021 Sep 13, 2021 SOUTH JORDAN 84009EVUT_380488 EV Level 2 Charger (Residential) 1 1 $ 200.00 $ 699.00 Aug 26, 2021 Sep 13, 2021 DRAPER 84020EVUT_380460 EV Level 2 Charger (Residential) 1 1 $ 200.00 $ 500.00 Aug 26, 2021 Sep 13, 2021 MILLCREEK 84109EVUT_381237 EV Level 2 Charger (Residential) 1 1 $ 200.00 $ 699.00 Aug 26, 2021 Sep 13, 2021 MIDVALE 84047EVUT_381254 EV Level 2 Charger (Residential) 1 1 $ 200.00 $ 500.00 Aug 27, 2021 Sep 13, 2021 SOUTH WEBER 84405EVUT_381278 EV Level 2 Charger (Residential) 1 1 $ 200.00 $ 293.00 Aug 30, 2021 Sep 13, 2021 SANDY 84093EVUT_381275 EV Level 2 Charger (Residential) 1 1 $ 200.00 $ 500.00 Aug 30, 2021 Sep 13, 2021 DRAPER 84020EVUT_381272 EV Level 2 Charger (Residential) 1 1 $ 200.00 $ 359.00 Aug 30, 2021 Sep 13, 2021 DRAPER 84020EVUT_381264 EV Level 2 Charger (Residential) 1 1 $ 200.00 $ 399.99 Aug 30, 2021 Sep 13, 2021 SALT LAKE CITY 84106EVUT_382500 EV Level 2 Charger (Residential) 1 1 $ 200.00 $ 500.00 Sep 7, 2021 Sep 13, 2021 SOUTH JORDAN 84095EVUT_382499 EV Level 2 Charger (Residential) 1 1 $ 200.00 $ 629.10 Sep 7, 2021 Sep 13, 2021 WEST JORDAN 84088EVUT_382497 EV Level 2 Charger (Residential) 1 1 $ 200.00 $ 297.98 Sep 7, 2021 Sep 13, 2021 AMERICAN FORK 84003EVUT_382495 EV Level 2 Charger (Residential) 1 1 $ 128.99 $ 171.99 Sep 7, 2021 Sep 13, 2021 WEST JORDAN 84081EVUT_382489 EV Level 2 Charger (Residential) 1 1 $ 200.00 $ 459.00 Sep 7, 2021 Sep 13, 2021 COTTONWOOD HEIGHTS 84121EVUT_382754 EV Level 2 Charger (Residential) 1 1 $ 200.00 $ 619.00 Sep 8, 2021 Sep 13, 2021 SUMMIT COUNTY 84098EVUT_383098 EV Level 2 Charger (Residential) 1 1 $ 200.00 $ 299.99 Sep 10, 2021 Sep 13, 2021 GRANTSVILLE 84029EVUT_382763 EV Level 2 Charger (Residential) 1 1 $ 200.00 $ 699.00 Sep 10, 2021 Sep 13, 2021 SOUTH JORDAN 84095EVUT_380432 EV Level 2 Charger (Residential) 1 1 $ 200.00 $ 625.00 Aug 24, 2021 Sep 13, 2021 SALT LAKE CITY 84106EVUT_375819 EV Level 2 Charger (Residential) 1 1 $ 162.75 $ 217.00 Jul 29, 2021 Sep 14, 2021 SOUTH JORDAN 84009EVUT_359761 EV Level 2 Charger (Residential) 1 1 $ 200.00 $ 350.00 Mar 10, 2021 Sep 17, 2021 IVINS 84738EVUT_381268 EV Level 2 Charger (Residential) 1 1 $ 200.00 $ 500.00 Aug 30, 2021 Sep 17, 2021 WEST POINT 84015EVUT_383069 EV Level 2 Charger (Residential) 1 1 $ 200.00 $ 650.00 Sep 10, 2021 Sep 17, 2021 TAYLORSVILLE 84129EVUT_383204 EV Level 2 Charger (Residential) 1 1 $ 200.00 $ 500.00 Sep 15, 2021 Sep 17, 2021 WEST JORDAN 84081EVUT_383202 EV Level 2 Charger (Residential) 1 1 $ 200.00 $ 1,000.00 Sep 15, 2021 Sep 17, 2021 MAGNA 84044EVUT_384455 EV Level 2 Charger (Residential) 1 1 $ 200.00 $ 500.00 Sep 16, 2021 Sep 17, 2021 DRAPER 84020

Project Name Measure_Name QuantityNumber of
PortsCustomer Incentive Measure Cost Creation Date Payment Creation Date Site City Site Postal Code
EV Program Prescriptive Incentives (2021 Budget Funds)
EVUT_384444 EV Level 2 Charger (Residential) 1 1 $ 200.00 $ 346.60 Sep 16, 2021 Sep 17, 2021 MILLCREEK 84107EVUT_382755 EV Level 2 Charger (Residential) 1 1 $ 200.00 $ 649.00 Sep 8, 2021 Sep 23, 2021 MOUNTAIN GREEN 84050EVUT_384479 EV Level 2 Charger (Residential) 1 1 $ 200.00 $ 459.00 Sep 17, 2021 Sep 23, 2021 NORTH LOGAN 84341EVUT_384478 EV Level 2 Charger (Residential) 1 1 $ 164.25 $ 219.00 Sep 17, 2021 Sep 23, 2021 SOUTH JORDAN 84009EVUT_384489 EV Level 2 Charger (Residential) 1 1 $ 200.00 $ 500.00 Sep 20, 2021 Sep 23, 2021 SANDY 84070EVUT_384660 EV Level 2 Charger (Residential) 1 1 $ 200.00 $ 273.60 Sep 20, 2021 Sep 23, 2021 SOUTH JORDAN 84009EVUT_384490 EV Level 2 Charger (Residential) 1 1 $ 200.00 $ 1,150.00 Sep 20, 2021 Sep 23, 2021 SALT LAKE CITY 84103EVUT_384806 EV Level 2 Charger (Residential) 1 1 $ 149.99 $ 199.99 Sep 21, 2021 Sep 23, 2021 DRAPER 84020EVUT_384446 EV Level 2 Charger (Residential) 1 1 $ 200.00 $ 488.98 Sep 16, 2021 Sep 27, 2021 WEST HAVEN 84401EVUT_384439 EV Level 2 Charger (Residential) 1 1 $ 200.00 $ 599.00 Sep 16, 2021 Sep 27, 2021 COTTONWOOD HEIGHTS 84093EVUT_384894 EV Level 2 Charger (Residential) 1 1 $ 200.00 $ 360.40 Sep 22, 2021 Sep 27, 2021 BLUFFDALE 84065EVUT_385215 EV Level 2 Charger (Residential) 1 1 $ 200.00 $ 500.00 Sep 23, 2021 Sep 27, 2021 SALT LAKE CITY 84103EVUT_385212 EV Level 2 Charger (Residential) 1 1 $ 200.00 $ 473.99 Sep 23, 2021 Sep 27, 2021 SALT LAKE CITY 84102EVUT_385207 EV Level 2 Charger (Residential) 1 1 $ 149.25 $ 199.00 Sep 23, 2021 Sep 27, 2021 EAGLE MOUNTAIN 84005EVUT_385202 EV Level 2 Charger (Residential) 1 1 $ 200.00 $ 599.00 Sep 23, 2021 Sep 27, 2021 HERRIMAN 84096EVUT_381274 EV Level 2 Charger (Residential) 1 1 $ 200.00 $ 500.00 Aug 30, 2021 Oct 4, 2021 LAYTON 84040EVUT_382491 EV Level 2 Charger (Residential) 1 1 $ 200.00 $ 300.00 Sep 7, 2021 Oct 4, 2021 IVINS 84738EVUT_383208 EV Level 2 Charger (Residential) 1 1 $ 200.00 $ 500.00 Sep 15, 2021 Oct 4, 2021 SALT LAKE CITY 84108EVUT_385238 EV Level 2 Charger (Residential) 1 1 $ 200.00 $ 500.00 Sep 27, 2021 Oct 4, 2021 AMERICAN FORK 84003EVUT_385235 EV Level 2 Charger (Residential) 1 1 $ 200.00 $ 419.00 Sep 27, 2021 Oct 4, 2021 WEST VALLEY CITY 84128EVUT_385231 EV Level 2 Charger (Residential) 1 1 $ 149.25 $ 199.00 Sep 27, 2021 Oct 4, 2021 MONA 84645EVUT_385377 EV Level 2 Charger (Residential) 1 1 $ 200.00 $ 626.60 Sep 28, 2021 Oct 4, 2021 MAPLETON 84664EVUT_385371 EV Level 2 Charger (Residential) 1 1 $ 200.00 $ 699.00 Sep 28, 2021 Oct 4, 2021 WEST VALLEY CITY 84128EVUT_385738 EV Level 2 Charger (Residential) 1 1 $ 200.00 $ 305.00 Sep 28, 2021 Oct 4, 2021 SOUTH SALT LAKE 84115EVUT_385758 EV Level 2 Charger (Residential) 1 1 $ 200.00 $ 500.00 Sep 30, 2021 Oct 4, 2021 MAPLETON 84664EVUT_378194 EV Level 2 Charger (Residential) 1 1 $ 200.00 $ 500.00 Aug 12, 2021 Oct 11, 2021 SALT LAKE CITY 84108EVUT_382804 EV Level 2 Charger (Residential) 1 1 $ 200.00 $ 649.00 Sep 10, 2021 Oct 11, 2021 SALT LAKE CITY 84116EVUT_386503 EV Level 2 Charger (Residential) 1 1 $ 200.00 $ 299.00 Oct 7, 2021 Oct 11, 2021 SALT LAKE CITY 84109EVUT_386336 EV Level 2 Charger (Residential) 1 1 $ 200.00 $ 699.00 Oct 7, 2021 Oct 11, 2021 HOLLADAY 84117EVUT_386095 EV Level 2 Charger (Residential) 1 1 $ 200.00 $ 599.00 Oct 7, 2021 Oct 11, 2021 PARK CITY 84098EVUT_386080 EV Level 2 Charger (Residential) 1 1 $ 200.00 $ 279.00 Oct 7, 2021 Oct 11, 2021 MILLCREEK 84109EVUT_386078 EV Level 2 Charger (Residential) 1 1 $ 200.00 $ 649.00 Oct 7, 2021 Oct 11, 2021 BLUFFDALE 84065EVUT_386076 EV Level 2 Charger (Residential) 1 1 $ 200.00 $ 500.00 Oct 7, 2021 Oct 11, 2021 WEST JORDAN 84081EVUT_386075 EV Level 2 Charger (Residential) 1 1 $ 200.00 $ 459.00 Oct 7, 2021 Oct 11, 2021 WEST VALLEY CITY 84128EVUT_386073 EV Level 2 Charger (Residential) 1 1 $ 200.00 $ 539.00 Oct 7, 2021 Oct 11, 2021 ROY 84067EVUT_378011 EV Level 2 Charger (Residential) 1 1 $ 200.00 $ 489.99 Aug 9, 2021 Oct 11, 2021 EAGLE MOUNTAIN 84005EVUT_373701 EV Level 2 Charger (Residential) 1 1 $ 200.00 $ 500.00 Jul 8, 2021 Oct 18, 2021 HERRIMAN 84096EVUT_373708 EV Level 2 Charger (Residential) 1 1 $ 200.00 $ 600.00 Jul 12, 2021 Oct 18, 2021 SYRACUSE 84075EVUT_377419 EV Level 2 Charger (Residential) 1 1 $ 200.00 $ 800.00 Aug 3, 2021 Oct 18, 2021 MAPLETON 84664EVUT_380476 EV Level 2 Charger (Residential) 1 1 $ 200.00 $ 359.00 Aug 26, 2021 Oct 18, 2021 TAYLORSVILLE 84129EVUT_385245 EV Level 2 Charger (Residential) 1 1 $ 128.25 $ 171.00 Sep 27, 2021 Oct 18, 2021 LAYTON 84040EVUT_386074 EV Level 2 Charger (Residential) 1 1 $ 200.00 $ 799.00 Oct 7, 2021 Oct 18, 2021 EAGLE MOUNTAIN 84005EVUT_387372 EV Level 2 Charger (Residential) 1 1 $ 200.00 $ 426.50 Oct 11, 2021 Oct 18, 2021 KAMAS 84036EVUT_387371 EV Level 2 Charger (Residential) 1 1 $ 200.00 $ 500.00 Oct 11, 2021 Oct 18, 2021 AMERICAN FORK 84003EVUT_387954 EV Level 2 Charger (Residential) 1 1 $ 200.00 $ 500.00 Oct 13, 2021 Oct 18, 2021 HUNTSVILLE 84317EVUT_387965 EV Level 2 Charger (Residential) 1 1 $ 200.00 $ 500.00 Oct 14, 2021 Oct 18, 2021 SALT LAKE CITY 84103EVUT_387977 EV Level 2 Charger (Residential) 1 1 $ 200.00 $ 574.00 Oct 15, 2021 Oct 18, 2021 MILLCREEK 84106EVUT_387510 EV Level 2 Charger (Residential) 1 1 $ 200.00 $ 645.00 Oct 14, 2021 Oct 19, 2021 SARATOGA SPRINGS 84045EVUT_387976 EV Level 2 Charger (Residential) 1 1 $ 200.00 $ 649.00 Oct 15, 2021 Oct 19, 2021 RIVERTON 84096EVUT_387985 EV Level 2 Charger (Residential) 1 1 $ 200.00 $ 500.00 Oct 15, 2021 Oct 19, 2021 SARATOGA SPRINGS 84045EVUT_388075 EV Level 2 Charger (Residential) 1 1 $ 200.00 $ 971.85 Oct 18, 2021 Oct 19, 2021 HUNTSVILLE 84317EVUT_375269 EV Level 2 Charger (Residential) 1 1 $ 200.00 $ 500.00 Jul 20, 2021 Oct 26, 2021 ROY 84067EVUT_384468 EV Level 2 Charger (Residential) 1 1 $ 200.00 $ 459.00 Sep 17, 2021 Oct 26, 2021 HERRIMAN 84096EVUT_385945 EV Level 2 Charger (Residential) 1 1 $ 200.00 $ 751.08 Oct 8, 2021 Oct 26, 2021 PARK CITY 84098EVUT_388070 EV Level 2 Charger (Residential) 1 1 $ 200.00 $ 500.00 Oct 18, 2021 Oct 26, 2021 COTTONWOOD HEIGHTS 84121EVUT_388614 EV Level 2 Charger (Residential) 1 1 $ 200.00 $ 649.00 Oct 21, 2021 Oct 26, 2021 SALT LAKE CITY 84105EVUT_388309 EV Level 2 Charger (Residential) 1 1 $ 200.00 $ 699.00 Oct 21, 2021 Oct 26, 2021 MILLCREEK 84106EVUT_388203 EV Level 2 Charger (Residential) 1 1 $ 200.00 $ 500.00 Oct 21, 2021 Oct 26, 2021 HOOPER 84315EVUT_388198 EV Level 2 Charger (Residential) 1 1 $ 200.00 $ 500.00 Oct 21, 2021 Oct 26, 2021 FARMINGTON 84025EVUT_388109 EV Level 2 Charger (Residential) 1 1 $ 200.00 $ 500.00 Oct 21, 2021 Oct 26, 2021 SALT LAKE CITY 84103EVUT_388098 EV Level 2 Charger (Residential) 1 1 $ 200.00 $ 1,586.00 Oct 21, 2021 Oct 26, 2021 VINEYARD 84059EVUT_388199 EV Level 2 Charger (Residential) 1 1 $ 200.00 $ 649.00 Oct 21, 2021 Oct 29, 2021 OREM 84097EVUT_388871 EV Level 2 Charger (Residential) 1 1 $ 200.00 $ 500.00 Oct 26, 2021 Oct 29, 2021 LAYTON 84041EVUT_388812 EV Level 2 Charger (Residential) 1 1 $ 200.00 $ 500.00 Oct 26, 2021 Oct 29, 2021 PARK CITY 84098EVUT_388811 EV Level 2 Charger (Residential) 1 1 $ 200.00 $ 599.00 Oct 26, 2021 Oct 29, 2021 HOLLADAY 84121EVUT_388810 EV Level 2 Charger (Residential) 1 1 $ 200.00 $ 599.00 Oct 26, 2021 Oct 29, 2021 WEST JORDAN 84084EVUT_388805 EV Level 2 Charger (Residential) 1 1 $ 200.00 $ 459.00 Oct 26, 2021 Oct 29, 2021 SANDY 84093EVUT_388803 EV Level 2 Charger (Residential) 1 1 $ 200.00 $ 1,965.00 Oct 26, 2021 Oct 29, 2021 SALT LAKE CITY 84108EVUT_373728 EV Level 2 Charger (Residential) 1 1 $ 200.00 $ 1,318.00 Jul 12, 2021 Nov 10, 2021 CLINTON 84015EVUT_389697 EV Level 2 Charger (Residential) 1 1 $ 200.00 $ 500.00 Nov 3, 2021 Nov 10, 2021 IVINS 84738EVUT_389693 EV Level 2 Charger (Residential) 1 1 $ 200.00 $ 599.00 Nov 3, 2021 Nov 10, 2021 SALT LAKE CITY 84108EVUT_389629 EV Level 2 Charger (Residential) 1 1 $ 200.00 $ 1,446.00 Nov 3, 2021 Nov 10, 2021 RIVERTON 84065EVUT_389628 EV Level 2 Charger (Residential) 1 1 $ 200.00 $ 749.68 Nov 3, 2021 Nov 10, 2021 DRAPER 84020EVUT_389505 EV Level 2 Charger (Residential) 1 1 $ 200.00 $ 587.39 Nov 3, 2021 Nov 10, 2021 HERRIMAN 84096EVUT_388758 EV Level 2 Charger (Residential) 1 1 $ 200.00 $ 619.00 Nov 3, 2021 Nov 10, 2021 PARK CITY 84098EVUT_392436 EV Level 2 Charger (Residential) 1 1 $ 149.25 $ 199.00 Nov 5, 2021 Nov 10, 2021 WEST BOUNTIFUL 84087EVUT_389719 EV Level 2 Charger (Residential) 1 1 $ 200.00 $ 500.00 Nov 3, 2021 Nov 11, 2021 SARATOGA SPRINGS 84045EVUT_392417 EV Level 2 Charger (Residential) 1 1 $ 200.00 $ 649.00 Nov 4, 2021 Nov 11, 2021 SOUTH JORDAN 84009EVUT_392453 EV Level 2 Charger (Residential) 1 1 $ 200.00 $ 500.00 Nov 9, 2021 Nov 11, 2021 DRAPER 84020
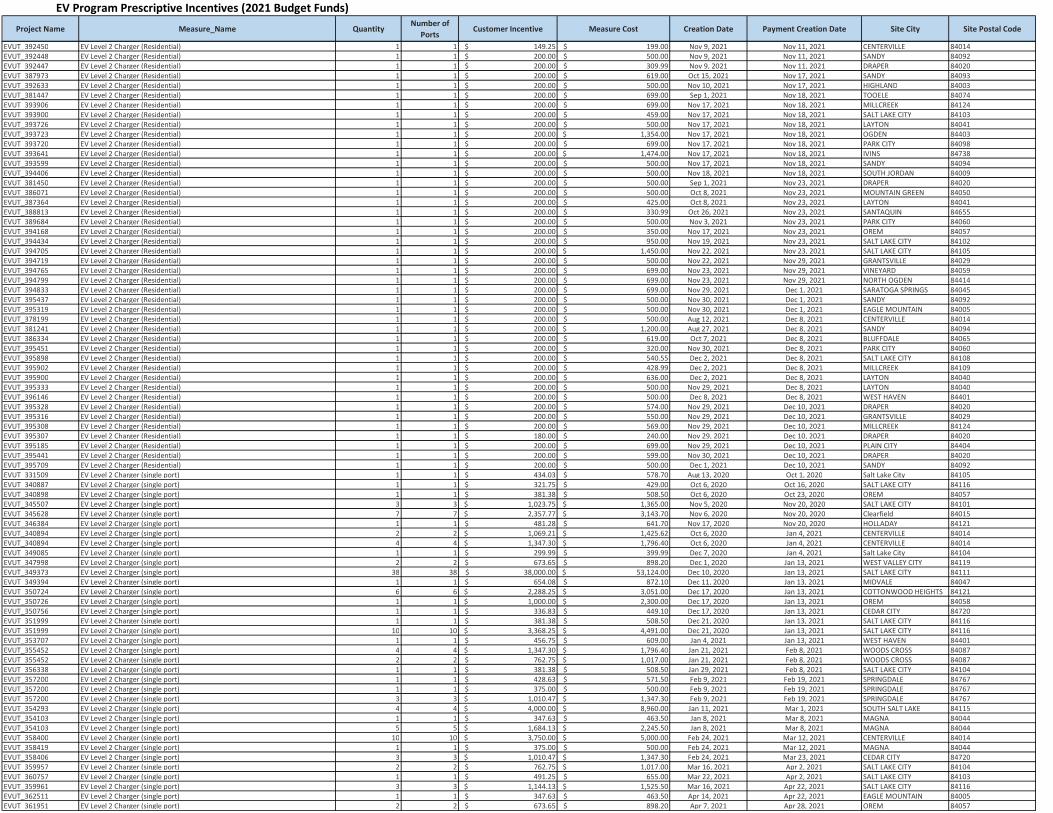
Project Name Measure_Name QuantityNumber of
PortsCustomer Incentive Measure Cost Creation Date Payment Creation Date Site City Site Postal Code
EV Program Prescriptive Incentives (2021 Budget Funds)
EVUT_392450 EV Level 2 Charger (Residential) 1 1 $ 149.25 $ 199.00 Nov 9, 2021 Nov 11, 2021 CENTERVILLE 84014EVUT_392448 EV Level 2 Charger (Residential) 1 1 $ 200.00 $ 500.00 Nov 9, 2021 Nov 11, 2021 SANDY 84092EVUT_392447 EV Level 2 Charger (Residential) 1 1 $ 200.00 $ 309.99 Nov 9, 2021 Nov 11, 2021 DRAPER 84020EVUT_387973 EV Level 2 Charger (Residential) 1 1 $ 200.00 $ 619.00 Oct 15, 2021 Nov 17, 2021 SANDY 84093EVUT_392633 EV Level 2 Charger (Residential) 1 1 $ 200.00 $ 500.00 Nov 10, 2021 Nov 17, 2021 HIGHLAND 84003EVUT_381447 EV Level 2 Charger (Residential) 1 1 $ 200.00 $ 699.00 Sep 1, 2021 Nov 18, 2021 TOOELE 84074EVUT_393906 EV Level 2 Charger (Residential) 1 1 $ 200.00 $ 699.00 Nov 17, 2021 Nov 18, 2021 MILLCREEK 84124EVUT_393900 EV Level 2 Charger (Residential) 1 1 $ 200.00 $ 459.00 Nov 17, 2021 Nov 18, 2021 SALT LAKE CITY 84103EVUT_393726 EV Level 2 Charger (Residential) 1 1 $ 200.00 $ 500.00 Nov 17, 2021 Nov 18, 2021 LAYTON 84041EVUT_393723 EV Level 2 Charger (Residential) 1 1 $ 200.00 $ 1,354.00 Nov 17, 2021 Nov 18, 2021 OGDEN 84403EVUT_393720 EV Level 2 Charger (Residential) 1 1 $ 200.00 $ 699.00 Nov 17, 2021 Nov 18, 2021 PARK CITY 84098EVUT_393641 EV Level 2 Charger (Residential) 1 1 $ 200.00 $ 1,474.00 Nov 17, 2021 Nov 18, 2021 IVINS 84738EVUT_393599 EV Level 2 Charger (Residential) 1 1 $ 200.00 $ 500.00 Nov 17, 2021 Nov 18, 2021 SANDY 84094EVUT_394406 EV Level 2 Charger (Residential) 1 1 $ 200.00 $ 500.00 Nov 18, 2021 Nov 18, 2021 SOUTH JORDAN 84009EVUT_381450 EV Level 2 Charger (Residential) 1 1 $ 200.00 $ 500.00 Sep 1, 2021 Nov 23, 2021 DRAPER 84020EVUT_386071 EV Level 2 Charger (Residential) 1 1 $ 200.00 $ 500.00 Oct 8, 2021 Nov 23, 2021 MOUNTAIN GREEN 84050EVUT_387364 EV Level 2 Charger (Residential) 1 1 $ 200.00 $ 425.00 Oct 8, 2021 Nov 23, 2021 LAYTON 84041EVUT_388813 EV Level 2 Charger (Residential) 1 1 $ 200.00 $ 330.99 Oct 26, 2021 Nov 23, 2021 SANTAQUIN 84655EVUT_389684 EV Level 2 Charger (Residential) 1 1 $ 200.00 $ 500.00 Nov 3, 2021 Nov 23, 2021 PARK CITY 84060EVUT_394168 EV Level 2 Charger (Residential) 1 1 $ 200.00 $ 350.00 Nov 17, 2021 Nov 23, 2021 OREM 84057EVUT_394434 EV Level 2 Charger (Residential) 1 1 $ 200.00 $ 950.00 Nov 19, 2021 Nov 23, 2021 SALT LAKE CITY 84102EVUT_394705 EV Level 2 Charger (Residential) 1 1 $ 200.00 $ 1,450.00 Nov 22, 2021 Nov 23, 2021 SALT LAKE CITY 84105EVUT_394719 EV Level 2 Charger (Residential) 1 1 $ 200.00 $ 500.00 Nov 22, 2021 Nov 29, 2021 GRANTSVILLE 84029EVUT_394765 EV Level 2 Charger (Residential) 1 1 $ 200.00 $ 699.00 Nov 23, 2021 Nov 29, 2021 VINEYARD 84059EVUT_394799 EV Level 2 Charger (Residential) 1 1 $ 200.00 $ 699.00 Nov 23, 2021 Nov 29, 2021 NORTH OGDEN 84414EVUT_394833 EV Level 2 Charger (Residential) 1 1 $ 200.00 $ 699.00 Nov 29, 2021 Dec 1, 2021 SARATOGA SPRINGS 84045EVUT_395437 EV Level 2 Charger (Residential) 1 1 $ 200.00 $ 500.00 Nov 30, 2021 Dec 1, 2021 SANDY 84092EVUT_395319 EV Level 2 Charger (Residential) 1 1 $ 200.00 $ 500.00 Nov 30, 2021 Dec 1, 2021 EAGLE MOUNTAIN 84005EVUT_378199 EV Level 2 Charger (Residential) 1 1 $ 200.00 $ 500.00 Aug 12, 2021 Dec 8, 2021 CENTERVILLE 84014EVUT_381241 EV Level 2 Charger (Residential) 1 1 $ 200.00 $ 1,200.00 Aug 27, 2021 Dec 8, 2021 SANDY 84094EVUT_386334 EV Level 2 Charger (Residential) 1 1 $ 200.00 $ 619.00 Oct 7, 2021 Dec 8, 2021 BLUFFDALE 84065EVUT_395451 EV Level 2 Charger (Residential) 1 1 $ 200.00 $ 320.00 Nov 30, 2021 Dec 8, 2021 PARK CITY 84060EVUT_395898 EV Level 2 Charger (Residential) 1 1 $ 200.00 $ 540.55 Dec 2, 2021 Dec 8, 2021 SALT LAKE CITY 84108EVUT_395902 EV Level 2 Charger (Residential) 1 1 $ 200.00 $ 428.99 Dec 2, 2021 Dec 8, 2021 MILLCREEK 84109EVUT_395900 EV Level 2 Charger (Residential) 1 1 $ 200.00 $ 636.00 Dec 2, 2021 Dec 8, 2021 LAYTON 84040EVUT_395333 EV Level 2 Charger (Residential) 1 1 $ 200.00 $ 500.00 Nov 29, 2021 Dec 8, 2021 LAYTON 84040EVUT_396146 EV Level 2 Charger (Residential) 1 1 $ 200.00 $ 500.00 Dec 8, 2021 Dec 8, 2021 WEST HAVEN 84401EVUT_395328 EV Level 2 Charger (Residential) 1 1 $ 200.00 $ 574.00 Nov 29, 2021 Dec 10, 2021 DRAPER 84020EVUT_395316 EV Level 2 Charger (Residential) 1 1 $ 200.00 $ 550.00 Nov 29, 2021 Dec 10, 2021 GRANTSVILLE 84029EVUT_395308 EV Level 2 Charger (Residential) 1 1 $ 200.00 $ 569.00 Nov 29, 2021 Dec 10, 2021 MILLCREEK 84124EVUT_395307 EV Level 2 Charger (Residential) 1 1 $ 180.00 $ 240.00 Nov 29, 2021 Dec 10, 2021 DRAPER 84020EVUT_395185 EV Level 2 Charger (Residential) 1 1 $ 200.00 $ 699.00 Nov 29, 2021 Dec 10, 2021 PLAIN CITY 84404EVUT_395441 EV Level 2 Charger (Residential) 1 1 $ 200.00 $ 599.00 Nov 30, 2021 Dec 10, 2021 DRAPER 84020EVUT_395709 EV Level 2 Charger (Residential) 1 1 $ 200.00 $ 500.00 Dec 1, 2021 Dec 10, 2021 SANDY 84092EVUT_331509 EV Level 2 Charger (single port) 1 1 $ 434.03 $ 578.70 Aug 13, 2020 Oct 1, 2020 Salt Lake City 84105EVUT_340887 EV Level 2 Charger (single port) 1 1 $ 321.75 $ 429.00 Oct 6, 2020 Oct 16, 2020 SALT LAKE CITY 84116EVUT_340898 EV Level 2 Charger (single port) 1 1 $ 381.38 $ 508.50 Oct 6, 2020 Oct 23, 2020 OREM 84057EVUT_345507 EV Level 2 Charger (single port) 3 3 $ 1,023.75 $ 1,365.00 Nov 5, 2020 Nov 20, 2020 SALT LAKE CITY 84101EVUT_345628 EV Level 2 Charger (single port) 7 7 $ 2,357.77 $ 3,143.70 Nov 6, 2020 Nov 20, 2020 Clearfield 84015EVUT_346384 EV Level 2 Charger (single port) 1 1 $ 481.28 $ 641.70 Nov 17, 2020 Nov 20, 2020 HOLLADAY 84121EVUT_340894 EV Level 2 Charger (single port) 2 2 $ 1,069.21 $ 1,425.62 Oct 6, 2020 Jan 4, 2021 CENTERVILLE 84014EVUT_340894 EV Level 2 Charger (single port) 4 4 $ 1,347.30 $ 1,796.40 Oct 6, 2020 Jan 4, 2021 CENTERVILLE 84014EVUT_349085 EV Level 2 Charger (single port) 1 1 $ 299.99 $ 399.99 Dec 7, 2020 Jan 4, 2021 Salt Lake City 84104EVUT_347998 EV Level 2 Charger (single port) 2 2 $ 673.65 $ 898.20 Dec 1, 2020 Jan 13, 2021 WEST VALLEY CITY 84119EVUT_349373 EV Level 2 Charger (single port) 38 38 $ 38,000.00 $ 53,124.00 Dec 10, 2020 Jan 13, 2021 SALT LAKE CITY 84111EVUT_349394 EV Level 2 Charger (single port) 1 1 $ 654.08 $ 872.10 Dec 11, 2020 Jan 13, 2021 MIDVALE 84047EVUT_350724 EV Level 2 Charger (single port) 6 6 $ 2,288.25 $ 3,051.00 Dec 17, 2020 Jan 13, 2021 COTTONWOOD HEIGHTS 84121EVUT_350726 EV Level 2 Charger (single port) 1 1 $ 1,000.00 $ 2,300.00 Dec 17, 2020 Jan 13, 2021 OREM 84058EVUT_350756 EV Level 2 Charger (single port) 1 1 $ 336.83 $ 449.10 Dec 17, 2020 Jan 13, 2021 CEDAR CITY 84720EVUT_351999 EV Level 2 Charger (single port) 1 1 $ 381.38 $ 508.50 Dec 21, 2020 Jan 13, 2021 SALT LAKE CITY 84116EVUT_351999 EV Level 2 Charger (single port) 10 10 $ 3,368.25 $ 4,491.00 Dec 21, 2020 Jan 13, 2021 SALT LAKE CITY 84116EVUT_353707 EV Level 2 Charger (single port) 1 1 $ 456.75 $ 609.00 Jan 4, 2021 Jan 13, 2021 WEST HAVEN 84401EVUT_355452 EV Level 2 Charger (single port) 4 4 $ 1,347.30 $ 1,796.40 Jan 21, 2021 Feb 8, 2021 WOODS CROSS 84087EVUT_355452 EV Level 2 Charger (single port) 2 2 $ 762.75 $ 1,017.00 Jan 21, 2021 Feb 8, 2021 WOODS CROSS 84087EVUT_356338 EV Level 2 Charger (single port) 1 1 $ 381.38 $ 508.50 Jan 29, 2021 Feb 8, 2021 SALT LAKE CITY 84104EVUT_357200 EV Level 2 Charger (single port) 1 1 $ 428.63 $ 571.50 Feb 9, 2021 Feb 19, 2021 SPRINGDALE 84767EVUT_357200 EV Level 2 Charger (single port) 1 1 $ 375.00 $ 500.00 Feb 9, 2021 Feb 19, 2021 SPRINGDALE 84767EVUT_357200 EV Level 2 Charger (single port) 3 3 $ 1,010.47 $ 1,347.30 Feb 9, 2021 Feb 19, 2021 SPRINGDALE 84767EVUT_354293 EV Level 2 Charger (single port) 4 4 $ 4,000.00 $ 8,960.00 Jan 11, 2021 Mar 1, 2021 SOUTH SALT LAKE 84115EVUT_354103 EV Level 2 Charger (single port) 1 1 $ 347.63 $ 463.50 Jan 8, 2021 Mar 8, 2021 MAGNA 84044EVUT_354103 EV Level 2 Charger (single port) 5 5 $ 1,684.13 $ 2,245.50 Jan 8, 2021 Mar 8, 2021 MAGNA 84044EVUT_358400 EV Level 2 Charger (single port) 10 10 $ 3,750.00 $ 5,000.00 Feb 24, 2021 Mar 12, 2021 CENTERVILLE 84014EVUT_358419 EV Level 2 Charger (single port) 1 1 $ 375.00 $ 500.00 Feb 24, 2021 Mar 12, 2021 MAGNA 84044EVUT_358406 EV Level 2 Charger (single port) 3 3 $ 1,010.47 $ 1,347.30 Feb 24, 2021 Mar 23, 2021 CEDAR CITY 84720EVUT_359957 EV Level 2 Charger (single port) 2 2 $ 762.75 $ 1,017.00 Mar 16, 2021 Apr 2, 2021 SALT LAKE CITY 84104EVUT_360757 EV Level 2 Charger (single port) 1 1 $ 491.25 $ 655.00 Mar 22, 2021 Apr 2, 2021 SALT LAKE CITY 84103EVUT_359961 EV Level 2 Charger (single port) 3 3 $ 1,144.13 $ 1,525.50 Mar 16, 2021 Apr 22, 2021 SALT LAKE CITY 84116EVUT_362511 EV Level 2 Charger (single port) 1 1 $ 347.63 $ 463.50 Apr 14, 2021 Apr 22, 2021 EAGLE MOUNTAIN 84005EVUT_361951 EV Level 2 Charger (single port) 2 2 $ 673.65 $ 898.20 Apr 7, 2021 Apr 28, 2021 OREM 84057
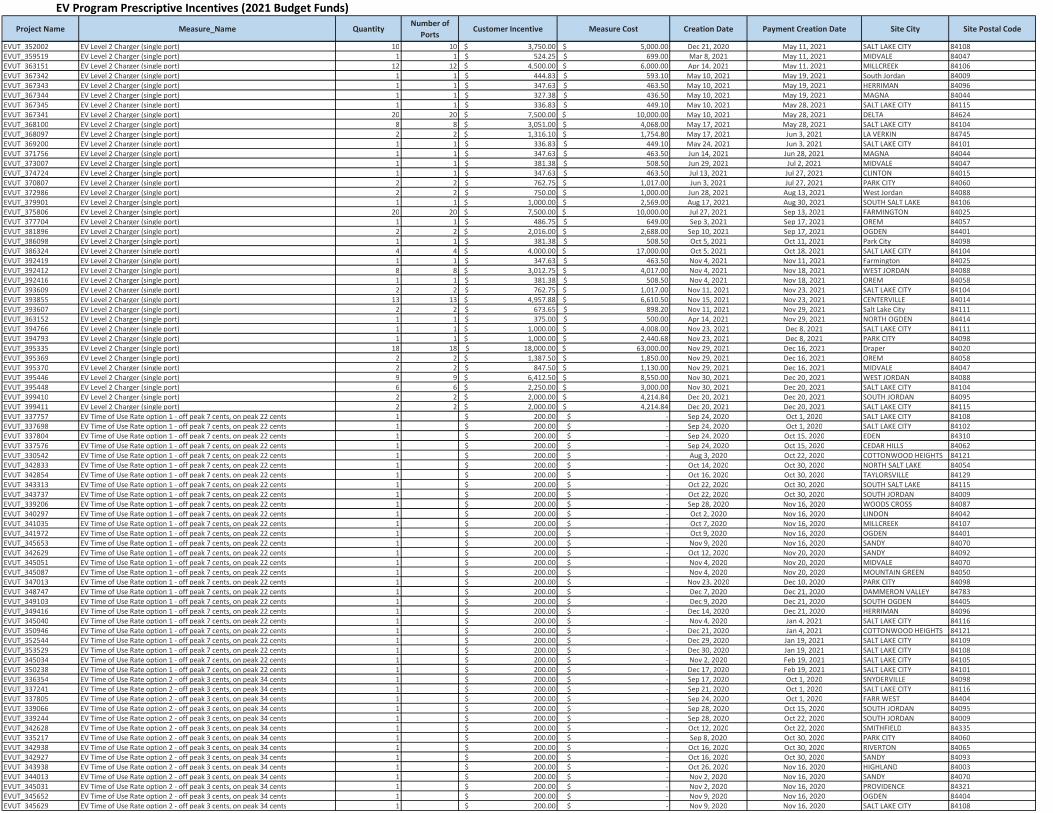
Project Name Measure_Name QuantityNumber of
PortsCustomer Incentive Measure Cost Creation Date Payment Creation Date Site City Site Postal Code
EV Program Prescriptive Incentives (2021 Budget Funds)
EVUT_352002 EV Level 2 Charger (single port) 10 10 $ 3,750.00 $ 5,000.00 Dec 21, 2020 May 11, 2021 SALT LAKE CITY 84108EVUT_359519 EV Level 2 Charger (single port) 1 1 $ 524.25 $ 699.00 Mar 8, 2021 May 11, 2021 MIDVALE 84047EVUT_363151 EV Level 2 Charger (single port) 12 12 $ 4,500.00 $ 6,000.00 Apr 14, 2021 May 11, 2021 MILLCREEK 84106EVUT_367342 EV Level 2 Charger (single port) 1 1 $ 444.83 $ 593.10 May 10, 2021 May 19, 2021 South Jordan 84009EVUT_367343 EV Level 2 Charger (single port) 1 1 $ 347.63 $ 463.50 May 10, 2021 May 19, 2021 HERRIMAN 84096EVUT_367344 EV Level 2 Charger (single port) 1 1 $ 327.38 $ 436.50 May 10, 2021 May 19, 2021 MAGNA 84044EVUT_367345 EV Level 2 Charger (single port) 1 1 $ 336.83 $ 449.10 May 10, 2021 May 28, 2021 SALT LAKE CITY 84115EVUT_367341 EV Level 2 Charger (single port) 20 20 $ 7,500.00 $ 10,000.00 May 10, 2021 May 28, 2021 DELTA 84624EVUT_368100 EV Level 2 Charger (single port) 8 8 $ 3,051.00 $ 4,068.00 May 17, 2021 May 28, 2021 SALT LAKE CITY 84104EVUT_368097 EV Level 2 Charger (single port) 2 2 $ 1,316.10 $ 1,754.80 May 17, 2021 Jun 3, 2021 LA VERKIN 84745EVUT_369200 EV Level 2 Charger (single port) 1 1 $ 336.83 $ 449.10 May 24, 2021 Jun 3, 2021 SALT LAKE CITY 84101EVUT_371756 EV Level 2 Charger (single port) 1 1 $ 347.63 $ 463.50 Jun 14, 2021 Jun 28, 2021 MAGNA 84044EVUT_373007 EV Level 2 Charger (single port) 1 1 $ 381.38 $ 508.50 Jun 29, 2021 Jul 2, 2021 MIDVALE 84047EVUT_374724 EV Level 2 Charger (single port) 1 1 $ 347.63 $ 463.50 Jul 13, 2021 Jul 27, 2021 CLINTON 84015EVUT_370807 EV Level 2 Charger (single port) 2 2 $ 762.75 $ 1,017.00 Jun 3, 2021 Jul 27, 2021 PARK CITY 84060EVUT_372986 EV Level 2 Charger (single port) 2 2 $ 750.00 $ 1,000.00 Jun 28, 2021 Aug 13, 2021 West Jordan 84088EVUT_379901 EV Level 2 Charger (single port) 1 1 $ 1,000.00 $ 2,569.00 Aug 17, 2021 Aug 30, 2021 SOUTH SALT LAKE 84106EVUT_375806 EV Level 2 Charger (single port) 20 20 $ 7,500.00 $ 10,000.00 Jul 27, 2021 Sep 13, 2021 FARMINGTON 84025EVUT_377704 EV Level 2 Charger (single port) 1 1 $ 486.75 $ 649.00 Sep 3, 2021 Sep 17, 2021 OREM 84057EVUT_381896 EV Level 2 Charger (single port) 2 2 $ 2,016.00 $ 2,688.00 Sep 10, 2021 Sep 17, 2021 OGDEN 84401EVUT_386098 EV Level 2 Charger (single port) 1 1 $ 381.38 $ 508.50 Oct 5, 2021 Oct 11, 2021 Park City 84098EVUT_386324 EV Level 2 Charger (single port) 4 4 $ 4,000.00 $ 17,000.00 Oct 5, 2021 Oct 18, 2021 SALT LAKE CITY 84104EVUT_392419 EV Level 2 Charger (single port) 1 1 $ 347.63 $ 463.50 Nov 4, 2021 Nov 11, 2021 Farmington 84025EVUT_392412 EV Level 2 Charger (single port) 8 8 $ 3,012.75 $ 4,017.00 Nov 4, 2021 Nov 18, 2021 WEST JORDAN 84088EVUT_392416 EV Level 2 Charger (single port) 1 1 $ 381.38 $ 508.50 Nov 4, 2021 Nov 18, 2021 OREM 84058EVUT_393609 EV Level 2 Charger (single port) 2 2 $ 762.75 $ 1,017.00 Nov 11, 2021 Nov 23, 2021 SALT LAKE CITY 84104EVUT_393855 EV Level 2 Charger (single port) 13 13 $ 4,957.88 $ 6,610.50 Nov 15, 2021 Nov 23, 2021 CENTERVILLE 84014EVUT_393607 EV Level 2 Charger (single port) 2 2 $ 673.65 $ 898.20 Nov 11, 2021 Nov 29, 2021 Salt Lake City 84111EVUT_363152 EV Level 2 Charger (single port) 1 1 $ 375.00 $ 500.00 Apr 14, 2021 Nov 29, 2021 NORTH OGDEN 84414EVUT_394766 EV Level 2 Charger (single port) 1 1 $ 1,000.00 $ 4,008.00 Nov 23, 2021 Dec 8, 2021 SALT LAKE CITY 84111EVUT_394793 EV Level 2 Charger (single port) 1 1 $ 1,000.00 $ 2,440.68 Nov 23, 2021 Dec 8, 2021 PARK CITY 84098EVUT_395335 EV Level 2 Charger (single port) 18 18 $ 18,000.00 $ 63,000.00 Nov 29, 2021 Dec 16, 2021 Draper 84020EVUT_395369 EV Level 2 Charger (single port) 2 2 $ 1,387.50 $ 1,850.00 Nov 29, 2021 Dec 16, 2021 OREM 84058EVUT_395370 EV Level 2 Charger (single port) 2 2 $ 847.50 $ 1,130.00 Nov 29, 2021 Dec 16, 2021 MIDVALE 84047EVUT_395446 EV Level 2 Charger (single port) 9 9 $ 6,412.50 $ 8,550.00 Nov 30, 2021 Dec 20, 2021 WEST JORDAN 84088EVUT_395448 EV Level 2 Charger (single port) 6 6 $ 2,250.00 $ 3,000.00 Nov 30, 2021 Dec 20, 2021 SALT LAKE CITY 84104EVUT_399410 EV Level 2 Charger (single port) 2 2 $ 2,000.00 $ 4,214.84 Dec 20, 2021 Dec 20, 2021 SOUTH JORDAN 84095EVUT_399411 EV Level 2 Charger (single port) 2 2 $ 2,000.00 $ 4,214.84 Dec 20, 2021 Dec 20, 2021 SALT LAKE CITY 84115EVUT_337757 EV Time of Use Rate option 1 - off peak 7 cents, on peak 22 cents 1 $ 200.00 $ - Sep 24, 2020 Oct 1, 2020 SALT LAKE CITY 84108EVUT_337698 EV Time of Use Rate option 1 - off peak 7 cents, on peak 22 cents 1 $ 200.00 $ - Sep 24, 2020 Oct 1, 2020 SALT LAKE CITY 84102EVUT_337804 EV Time of Use Rate option 1 - off peak 7 cents, on peak 22 cents 1 $ 200.00 $ - Sep 24, 2020 Oct 15, 2020 EDEN 84310EVUT_337576 EV Time of Use Rate option 1 - off peak 7 cents, on peak 22 cents 1 $ 200.00 $ - Sep 24, 2020 Oct 15, 2020 CEDAR HILLS 84062EVUT_330542 EV Time of Use Rate option 1 - off peak 7 cents, on peak 22 cents 1 $ 200.00 $ - Aug 3, 2020 Oct 22, 2020 COTTONWOOD HEIGHTS 84121EVUT_342833 EV Time of Use Rate option 1 - off peak 7 cents, on peak 22 cents 1 $ 200.00 $ - Oct 14, 2020 Oct 30, 2020 NORTH SALT LAKE 84054EVUT_342854 EV Time of Use Rate option 1 - off peak 7 cents, on peak 22 cents 1 $ 200.00 $ - Oct 16, 2020 Oct 30, 2020 TAYLORSVILLE 84129EVUT_343313 EV Time of Use Rate option 1 - off peak 7 cents, on peak 22 cents 1 $ 200.00 $ - Oct 22, 2020 Oct 30, 2020 SOUTH SALT LAKE 84115EVUT_343737 EV Time of Use Rate option 1 - off peak 7 cents, on peak 22 cents 1 $ 200.00 $ - Oct 22, 2020 Oct 30, 2020 SOUTH JORDAN 84009EVUT_339206 EV Time of Use Rate option 1 - off peak 7 cents, on peak 22 cents 1 $ 200.00 $ - Sep 28, 2020 Nov 16, 2020 WOODS CROSS 84087EVUT_340297 EV Time of Use Rate option 1 - off peak 7 cents, on peak 22 cents 1 $ 200.00 $ - Oct 2, 2020 Nov 16, 2020 LINDON 84042EVUT_341035 EV Time of Use Rate option 1 - off peak 7 cents, on peak 22 cents 1 $ 200.00 $ - Oct 7, 2020 Nov 16, 2020 MILLCREEK 84107EVUT_341972 EV Time of Use Rate option 1 - off peak 7 cents, on peak 22 cents 1 $ 200.00 $ - Oct 9, 2020 Nov 16, 2020 OGDEN 84401EVUT_345653 EV Time of Use Rate option 1 - off peak 7 cents, on peak 22 cents 1 $ 200.00 $ - Nov 9, 2020 Nov 16, 2020 SANDY 84070EVUT_342629 EV Time of Use Rate option 1 - off peak 7 cents, on peak 22 cents 1 $ 200.00 $ - Oct 12, 2020 Nov 20, 2020 SANDY 84092EVUT_345051 EV Time of Use Rate option 1 - off peak 7 cents, on peak 22 cents 1 $ 200.00 $ - Nov 4, 2020 Nov 20, 2020 MIDVALE 84070EVUT_345087 EV Time of Use Rate option 1 - off peak 7 cents, on peak 22 cents 1 $ 200.00 $ - Nov 4, 2020 Nov 20, 2020 MOUNTAIN GREEN 84050EVUT_347013 EV Time of Use Rate option 1 - off peak 7 cents, on peak 22 cents 1 $ 200.00 $ - Nov 23, 2020 Dec 10, 2020 PARK CITY 84098EVUT_348747 EV Time of Use Rate option 1 - off peak 7 cents, on peak 22 cents 1 $ 200.00 $ - Dec 7, 2020 Dec 21, 2020 DAMMERON VALLEY 84783EVUT_349103 EV Time of Use Rate option 1 - off peak 7 cents, on peak 22 cents 1 $ 200.00 $ - Dec 9, 2020 Dec 21, 2020 SOUTH OGDEN 84405EVUT_349416 EV Time of Use Rate option 1 - off peak 7 cents, on peak 22 cents 1 $ 200.00 $ - Dec 14, 2020 Dec 21, 2020 HERRIMAN 84096EVUT_345040 EV Time of Use Rate option 1 - off peak 7 cents, on peak 22 cents 1 $ 200.00 $ - Nov 4, 2020 Jan 4, 2021 SALT LAKE CITY 84116EVUT_350946 EV Time of Use Rate option 1 - off peak 7 cents, on peak 22 cents 1 $ 200.00 $ - Dec 21, 2020 Jan 4, 2021 COTTONWOOD HEIGHTS 84121EVUT_352544 EV Time of Use Rate option 1 - off peak 7 cents, on peak 22 cents 1 $ 200.00 $ - Dec 29, 2020 Jan 19, 2021 SALT LAKE CITY 84109EVUT_353529 EV Time of Use Rate option 1 - off peak 7 cents, on peak 22 cents 1 $ 200.00 $ - Dec 30, 2020 Jan 19, 2021 SALT LAKE CITY 84108EVUT_345034 EV Time of Use Rate option 1 - off peak 7 cents, on peak 22 cents 1 $ 200.00 $ - Nov 2, 2020 Feb 19, 2021 SALT LAKE CITY 84105EVUT_350238 EV Time of Use Rate option 1 - off peak 7 cents, on peak 22 cents 1 $ 200.00 $ - Dec 17, 2020 Feb 19, 2021 SALT LAKE CITY 84101EVUT_336354 EV Time of Use Rate option 2 - off peak 3 cents, on peak 34 cents 1 $ 200.00 $ - Sep 17, 2020 Oct 1, 2020 SNYDERVILLE 84098EVUT_337241 EV Time of Use Rate option 2 - off peak 3 cents, on peak 34 cents 1 $ 200.00 $ - Sep 21, 2020 Oct 1, 2020 SALT LAKE CITY 84116EVUT_337805 EV Time of Use Rate option 2 - off peak 3 cents, on peak 34 cents 1 $ 200.00 $ - Sep 24, 2020 Oct 1, 2020 FARR WEST 84404EVUT_339066 EV Time of Use Rate option 2 - off peak 3 cents, on peak 34 cents 1 $ 200.00 $ - Sep 28, 2020 Oct 15, 2020 SOUTH JORDAN 84095EVUT_339244 EV Time of Use Rate option 2 - off peak 3 cents, on peak 34 cents 1 $ 200.00 $ - Sep 28, 2020 Oct 22, 2020 SOUTH JORDAN 84009EVUT_342628 EV Time of Use Rate option 2 - off peak 3 cents, on peak 34 cents 1 $ 200.00 $ - Oct 12, 2020 Oct 22, 2020 SMITHFIELD 84335EVUT_335217 EV Time of Use Rate option 2 - off peak 3 cents, on peak 34 cents 1 $ 200.00 $ - Sep 8, 2020 Oct 30, 2020 PARK CITY 84060EVUT_342938 EV Time of Use Rate option 2 - off peak 3 cents, on peak 34 cents 1 $ 200.00 $ - Oct 16, 2020 Oct 30, 2020 RIVERTON 84065EVUT_342927 EV Time of Use Rate option 2 - off peak 3 cents, on peak 34 cents 1 $ 200.00 $ - Oct 16, 2020 Oct 30, 2020 SANDY 84093EVUT_343938 EV Time of Use Rate option 2 - off peak 3 cents, on peak 34 cents 1 $ 200.00 $ - Oct 26, 2020 Nov 16, 2020 HIGHLAND 84003EVUT_344013 EV Time of Use Rate option 2 - off peak 3 cents, on peak 34 cents 1 $ 200.00 $ - Nov 2, 2020 Nov 16, 2020 SANDY 84070EVUT_345031 EV Time of Use Rate option 2 - off peak 3 cents, on peak 34 cents 1 $ 200.00 $ - Nov 2, 2020 Nov 16, 2020 PROVIDENCE 84321EVUT_345652 EV Time of Use Rate option 2 - off peak 3 cents, on peak 34 cents 1 $ 200.00 $ - Nov 9, 2020 Nov 16, 2020 OGDEN 84404EVUT_345629 EV Time of Use Rate option 2 - off peak 3 cents, on peak 34 cents 1 $ 200.00 $ - Nov 9, 2020 Nov 16, 2020 SALT LAKE CITY 84108
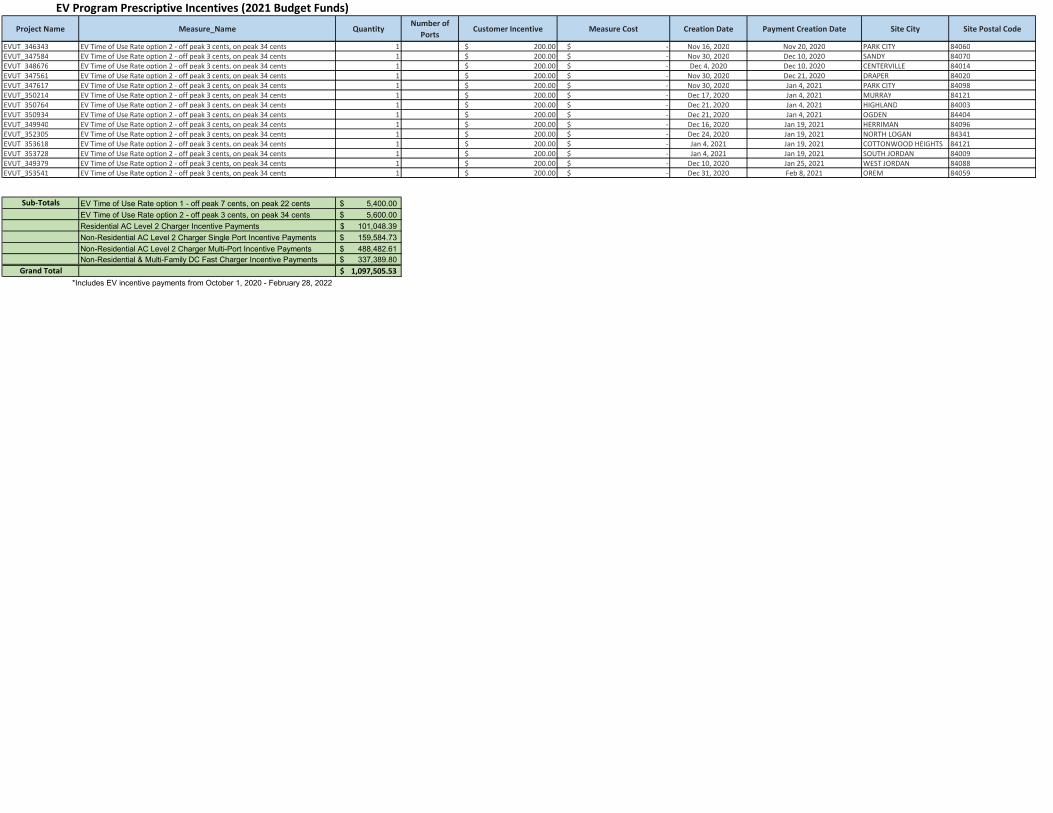
Project Name Measure_Name QuantityNumber of
PortsCustomer Incentive Measure Cost Creation Date Payment Creation Date Site City Site Postal Code
EV Program Prescriptive Incentives (2021 Budget Funds)
EVUT_346343 EV Time of Use Rate option 2 - off peak 3 cents, on peak 34 cents 1 $ 200.00 $ - Nov 16, 2020 Nov 20, 2020 PARK CITY 84060EVUT_347584 EV Time of Use Rate option 2 - off peak 3 cents, on peak 34 cents 1 $ 200.00 $ - Nov 30, 2020 Dec 10, 2020 SANDY 84070EVUT_348676 EV Time of Use Rate option 2 - off peak 3 cents, on peak 34 cents 1 $ 200.00 $ - Dec 4, 2020 Dec 10, 2020 CENTERVILLE 84014EVUT_347561 EV Time of Use Rate option 2 - off peak 3 cents, on peak 34 cents 1 $ 200.00 $ - Nov 30, 2020 Dec 21, 2020 DRAPER 84020EVUT_347617 EV Time of Use Rate option 2 - off peak 3 cents, on peak 34 cents 1 $ 200.00 $ - Nov 30, 2020 Jan 4, 2021 PARK CITY 84098EVUT_350214 EV Time of Use Rate option 2 - off peak 3 cents, on peak 34 cents 1 $ 200.00 $ - Dec 17, 2020 Jan 4, 2021 MURRAY 84121EVUT_350764 EV Time of Use Rate option 2 - off peak 3 cents, on peak 34 cents 1 $ 200.00 $ - Dec 21, 2020 Jan 4, 2021 HIGHLAND 84003EVUT_350934 EV Time of Use Rate option 2 - off peak 3 cents, on peak 34 cents 1 $ 200.00 $ - Dec 21, 2020 Jan 4, 2021 OGDEN 84404EVUT_349940 EV Time of Use Rate option 2 - off peak 3 cents, on peak 34 cents 1 $ 200.00 $ - Dec 16, 2020 Jan 19, 2021 HERRIMAN 84096EVUT_352305 EV Time of Use Rate option 2 - off peak 3 cents, on peak 34 cents 1 $ 200.00 $ - Dec 24, 2020 Jan 19, 2021 NORTH LOGAN 84341EVUT_353618 EV Time of Use Rate option 2 - off peak 3 cents, on peak 34 cents 1 $ 200.00 $ - Jan 4, 2021 Jan 19, 2021 COTTONWOOD HEIGHTS 84121EVUT_353728 EV Time of Use Rate option 2 - off peak 3 cents, on peak 34 cents 1 $ 200.00 $ - Jan 4, 2021 Jan 19, 2021 SOUTH JORDAN 84009EVUT_349379 EV Time of Use Rate option 2 - off peak 3 cents, on peak 34 cents 1 $ 200.00 $ - Dec 10, 2020 Jan 25, 2021 WEST JORDAN 84088EVUT_353541 EV Time of Use Rate option 2 - off peak 3 cents, on peak 34 cents 1 $ 200.00 $ - Dec 31, 2020 Feb 8, 2021 OREM 84059
Sub-Totals EV Time of Use Rate option 1 - off peak 7 cents, on peak 22 cents 5,400.00$
EV Time of Use Rate option 2 - off peak 3 cents, on peak 34 cents 5,600.00$
Residential AC Level 2 Charger Incentive Payments 101,048.39$
Non-Residential AC Level 2 Charger Single Port Incentive Payments 159,584.73$
Non-Residential AC Level 2 Charger Multi-Port Incentive Payments 488,482.61$ Non-Residential & Multi-Family DC Fast Charger Incentive Payments 337,389.80$
Grand Total 1,097,505.53$ *Includes EV incentive payments from October 1, 2020 - February 28, 2022

Exhibit 2-B EV Program Custom Project Committed Funds and Expenditures

Year Committed
Custom Projects
Committed Funds
Year Completed
$ Paid $ Variance
Project 1 250,000$ 2018 250,000$ -$ Project 2 8,000$ 2019 7,998$ (2.32)$ Project 3 470,000$ 456,441$ (13,558.76)$ Project 4 153,000$ 153,000$ -$ Project 5 237,500$ 2020 237,500$ -$ Project 6 50,000$ 50,000$ -$ Project 7 57,005$ 56,963$ (42.05)$ Project 8 69,369$ 69,369$ -$ Project 9 65,000$ 58,047$ (6,953)$
Total 1,359,874$ -- 1,339,317.87$ (20,556.13)$ Project 10 308,000$ 308,000$ -$ Project 11 70,000$ 70,000$ -$ Project 12 120,500$ 120,500$ -$ Project 13 500,000$ 2020 500,000$ -$
Total 998,500$ -- 998,500$ -$ Project 14 330,000$ 2020 330,000$ -$ Project 15 170,000$ 2021 117,830.50$ (52,169.50)$ Project 16 169,439.49$ 2021 169,439$ (0.49)$
Total 669,439.49$ -- 617,269.50$ (52,169.99)$ Project 17 100,000$ 2021 100,000$ -$ Project 18 504,418.79$ 2021 450,000$ (54,418.79)$
Total 604,418.79$ -- 550,000$ (54,418.79)$ Project 19 91,500$ 2021 91,500$ -$ Project 20 97,535$ 2021 97,535$ -$ Project 21 40,000$ 2021 40,000$ -$ Project 22 91,125.12$ 2021 91,125.12$ -$
Total 320,160.12$ -- 320,160.12$ -$
2021
EV Program Budget Custom Project Expenditures
2017
2018
2020
2019
2018
2018
2019

Exhibit 2-C EV Program Custom Project Details Year Over Year

Year Committed
Project # Description Equipment type Incentive Year Completed
Description Equipment type Incentive
2017 Project 1Installation of an electric bus charger for an electric bus that will provide free public transit throughout a community. The electric bus will reduce traffic congestion and improve carbon emissions.
500 kW Electric Bus Charger
250,000$ 2018 No change from committed.No change from
committed.250,000$
2017 Project 2
Project 2 covers three aspects of installation and monitoring that include: 1) fees for materials associated with installing charging units in snowy, high-alpine environments; 2) two meters to track monthly usage of Tesla and standard chargers (as this would otherwise not be available,); and 3) develop a comprehensive marketing plan to promote electric vehicle chargers and promote electric vehicles at a resort.
4 AC Level 2 Chargers (single port)
8,000$ 2019 No change from committed.No change from
committed.7,998.00$
2017 Project 3The goal of this project is to provide EV charging along major traffic corridors in Utah. DC Fast chargers will be strategically placed along interstate corridor to reduce range anxiety among EV drivers.
6 AC Level 2 Chargers & 6 DC Fast Chargers
(single port)470,000$ 2018 Acutal project costs were less than intial estimates,
resulting in a lower incentive payment.No change from
committed.456,441$
2017 Project 4
This project aims to provide electric vehicle charging for the public and employees at a prominent location in down town Salt Lake City by installing 12 AC Level 2 dual port charging stations, and infrastructure for seven future stations.
12 AC Level 2 Chargers(multi-port)
153,000$ 2018 No change from committed.No change from
committed.153,000$
2017 Project 5
The goal of this project is to significantly expand and enhance the EV charging infrastructure at a major workplace in the Salt Lake Valley.
South Parking Lot: • Five dual-port Level 2 EV chargers which will be pay-for-use and available to the public.• Three dual-port Level 2 EV chargers for fleet and enterprise vehicles. • One Level 3 pay-for-use EV charger in the east-side visitor parking area. If unable to support a Level 3 charger, the plan would be to install an additional dual-port Level 2 EV charger at this location. North Parking Lot:• Two dual-port Level 2 pay-for-use EV chargers which will be available to the public. • Tech Center: We are proposing to have two dual-port Level 2 chargers for state vehicles. We are also proposing to add two pay-for-use dual-port Level 2 chargers that would be in front of the Tech Center and be available for public use. • Multiple EV chargers throughout the campus facilities
18 AC Level 2 Chargers & 1 DC Fast Charger
(multi-port)237,500$ 2020 No change from committed.
No change from committed.
237,500$
2017 Project 6
A city plans to collaborate with commercial and industrial businesses to increase the adoption of electric vehicle purchases within the city and county in order to satisfy growing driver demand; increase property value, complement LEED and Green Building Programs, and achieve the city community fuel, carbon and energy goals. The project strives to use innovations, test new ideas, and pursue interesting opportunities to better understand how consumers think about and use PEVs to further increase the market penetration of PEVs and hybrids. Installed on city property for public use.
2 AC Level 2 Chargers and
1 DC Fast Charger(single port)
50,000$ 2018 No change from committed.No change from
committed.50,000$
2017 Project 7
The site selected for the EVSE installation is an Electric Vehicle & Roadway (EVR) Research Facility and electrified test track. The EVR is a state-of-the-art research facility at the forefront of electric vehicle charging and roadway technology development. The EVR is the most appropriate location in Rocky Mountain Power’s service area to conduct high-level EV research, enhance infrastructure, and promote sustainable transportation.
This project proposes to install two AC Level II chargers and one DC Fast Charger. All ports will be equipped with an advanced network and innovative data tracking capabilities.
The DC Fast Charger as proposed herein will be the first available to all EV drivers in Northern Utah. The customizable data will provide further research, grants, and contracts as well as fortify existing research to help develop industry partnerships.
2 AC Level 2 Chargers and
1 DC Fast Charger(multi-port)
57,005$ 2018 Acutal project costs were less than intial estimates, resulting in a lower incentive payment.
No change from committed.
56,963$
2017 Project 8
This site plans on installing four new Level 2 charging stations and one DC fast charger to increase the amount of chargers available to the public, and staff. This site currently has two Level 2 dual port charging stations. One located at the main entrance to campus for the public, free of charge in the Visitor Lot. The other charging station is located by the Facilities building for fleet vehicles. Three new level 2 charging stations will be located around the entire main grounds with one located at the West grounds. The DC Fast Charger will be located in the visitor lot in the front of campus. This is to serve the growing public facility and will be positioned with good access to I-15.
4 AC Level 2 Chargers and
1 DC Fast Charger(multi-port)
69,369$ 2018 No change from committed.No change from
committed.69,369$
2017 Project 9
This site intends to install EVSE in the parking lot next to an LEED Platinum certified Building. This project involves installing one DC Fast Charger under the solar canopy in the parking lot, and one dual port AC Level 2 charger.
1 AC Level 2 Charger and
1 DC Fast Charger(multi-port)
65,000$ 2018 Minor change in project scopeAC Level 2 charger was not installed
58,047$
2018 Project 10
A major City will be installing a city-wide system of EV equipment for residents, guests, travelers, and ride-share drivers. The City is in a key strategic position to embark on such a wide-ranging project. The City is centrally located in the Wasatch Front and has notable popular attractions within its borders which attract a considerable amount of vehicles. The city experiences significant air pollution during bad inversion events in the winter and ozone buildup in the summer. To mitigate these effects, the city believes that by providing EV equipment on a city-wide scale, residents will be encouraged to adopt zero-emissions vehicles as a way to improve air quality.
44 AC Level 2 Charging Ports and
2 DC Fast Charging Ports308,000$ 2019 No change from committed.
No change from committed.
308,000$
Committed Information Completed Information
Custom EV Projects Year over Year Committed vs. Completed
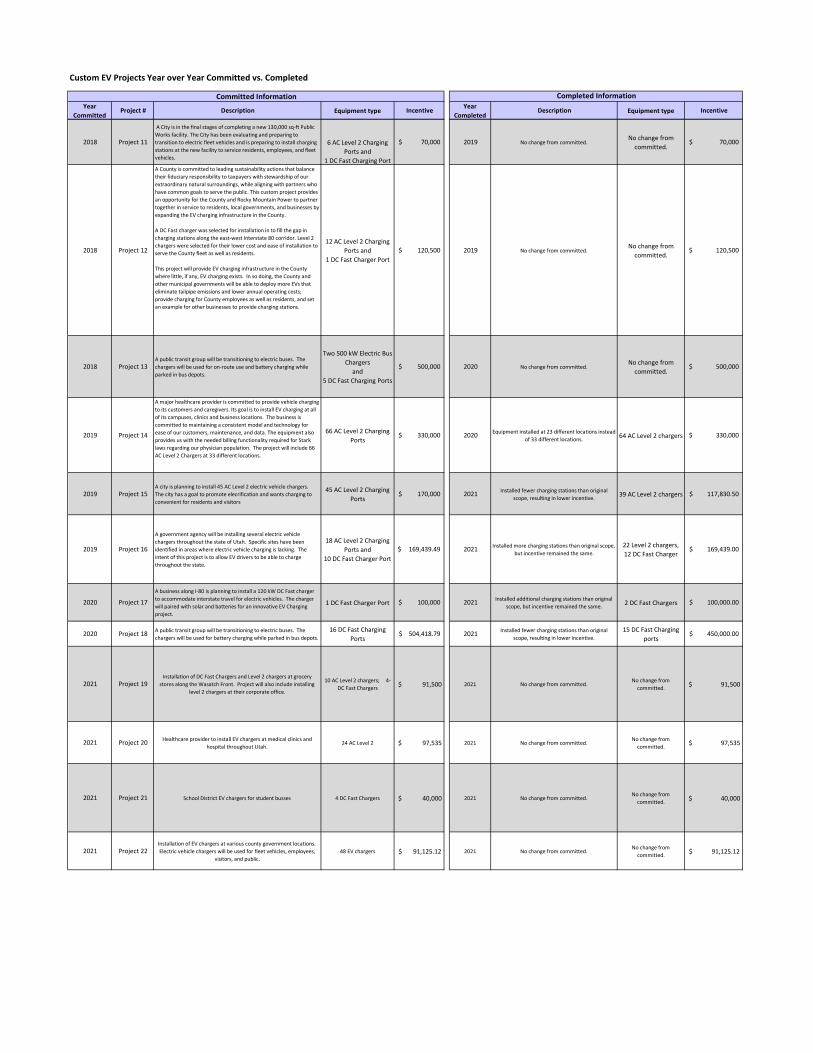
Year Committed
Project # Description Equipment type Incentive Year Completed
Description Equipment type Incentive
Committed Information Completed Information
Custom EV Projects Year over Year Committed vs. Completed
2018 Project 11
A City is in the final stages of completing a new 130,000 sq-ft Public Works facility. The City has been evaluating and preparing to transition to electric fleet vehicles and is preparing to install charging stations at the new facility to service residents, employees, and fleet vehicles.
6 AC Level 2 Charging Ports and
1 DC Fast Charging Port
70,000$ 2019 No change from committed.No change from
committed.70,000$
2018 Project 12
A County is committed to leading sustainability actions that balance their fiduciary responsibility to taxpayers with stewardship of our extraordinary natural surroundings, while aligning with partners who have common goals to serve the public. This custom project provides an opportunity for the County and Rocky Mountain Power to partner together in service to residents, local governments, and businesses by expanding the EV charging infrastructure in the County.
A DC Fast charger was selected for installation in to fill the gap in charging stations along the east-west Interstate 80 corridor. Level 2 chargers were selected for their lower cost and ease of installation to serve the County fleet as well as residents.
This project will provide EV charging infrastructure in the County where little, if any, EV charging exists. In so doing, the County and other municipal governments will be able to deploy more EVs that eliminate tailpipe emissions and lower annual operating costs; provide charging for County employees as well as residents, and set an example for other businesses to provide charging stations.
12 AC Level 2 Charging Ports and
1 DC Fast Charger Port120,500$ 2019 No change from committed.
No change from committed.
120,500$
2018 Project 13A public transit group will be transitioning to electric buses. The chargers will be used for on-route use and battery charging while parked in bus depots.
Two 500 kW Electric Bus Chargers
and5 DC Fast Charging Ports
500,000$ 2020 No change from committed.No change from
committed.500,000$
2019 Project 14
A major healthcare provider is committed to provide vehicle charging to its customers and caregivers. Its goal is to install EV charging at all of its campuses, clinics and business locations. The business is committed to maintaining a consistent model and technology for ease of our customers, maintenance, and data. The equipment also provides us with the needed billing functionality required for Stark laws regarding our physician population. The project will include 66 AC Level 2 Chargers at 33 different locations.
66 AC Level 2 Charging Ports
330,000$ 2020 Equipment installed at 23 different locations instead of 33 different locations. 64 AC Level 2 chargers 330,000$
2019 Project 15A city is planning to install 45 AC Level 2 electric vehicle chargers. The city has a goal to promote elecrification and wants charging to convenient for residents and visitors
45 AC Level 2 Charging Ports
170,000$ 2021 Installed fewer charging stations than original scope, resulting in lower incentive. 39 AC Level 2 chargers 117,830.50$
2019 Project 16
A government agency will be installing several electric vehicle chargers throughout the state of Utah. Specific sites have been identified in areas where electric vehicle charging is lacking. The intent of this project is to allow EV drivers to be able to charge throughout the state.
18 AC Level 2 Charging Ports and
10 DC Fast Charger Port169,439.49$ 2021 Installed more charging stations than original scope,
but incentive remained the same.22 Level 2 chargers, 12 DC Fast Charger
169,439.00$
2020 Project 17
A business along I-80 is planning to install a 120 kW DC Fast charger to accommodate interstate travel for electric vehicles. The charger will paired with solar and batteries for an innovative EV Charging project.
1 DC Fast Charger Port 100,000$ 2021 Installed additional charging stations than original scope, but incentive remained the same. 2 DC Fast Chargers 100,000.00$
2020 Project 18 A public transit group will be transitioning to electric buses. The chargers will be used for battery charging while parked in bus depots.
16 DC Fast Charging Ports
504,418.79$ 2021 Installed fewer charging stations than original scope, resulting in lower incentive.
15 DC Fast Charging ports
450,000.00$
2021 Project 19Installation of DC Fast Chargers and Level 2 chargers at grocery
stores along the Wasatch Front. Project will also include installing level 2 chargers at their corporate office.
10 AC Level 2 chargers; 4-DC Fast Chargers $ 91,500 2021 No change from committed.
No change from committed. $ 91,500
2021 Project 20 Healthcare provider to install EV chargers at medical clinics and hospital throughout Utah.
24 AC Level 2 $ 97,535 2021 No change from committed.No change from
committed. $ 97,535
2021 Project 21 School District EV chargers for student busses 4 DC Fast Chargers $ 40,000 2021 No change from committed.No change from
committed. $ 40,000
2021 Project 22Installation of EV chargers at various county government locations. Electric vehicle chargers will be used for fleet vehicles, employees,
visitors, and public. 48 EV chargers $ 91,125.12 2021 No change from committed.
No change from committed. $ 91,125.12

Exhibit 2-D EV Program Actual SAP Postings by Calendar Year
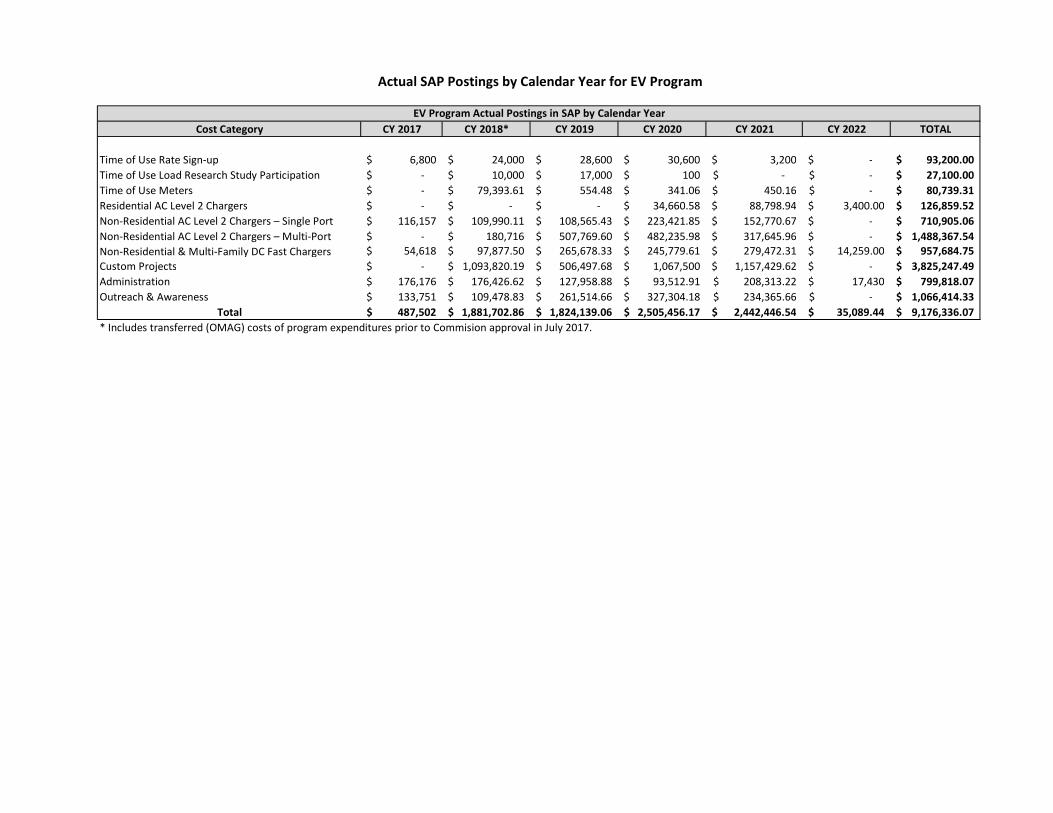
Cost Category CY 2017 CY 2018* CY 2019 CY 2020 CY 2021 CY 2022 TOTAL
Time of Use Rate Sign-up 6,800$ 24,000$ 28,600$ 30,600$ 3,200$ -$ 93,200.00$ Time of Use Load Research Study Participation -$ 10,000$ 17,000$ 100$ -$ -$ 27,100.00$ Time of Use Meters -$ 79,393.61$ 554.48$ 341.06$ 450.16$ -$ 80,739.31$ Residential AC Level 2 Chargers -$ -$ -$ 34,660.58$ 88,798.94$ 3,400.00$ 126,859.52$ Non-Residential AC Level 2 Chargers – Single Port 116,157$ 109,990.11$ 108,565.43$ 223,421.85$ 152,770.67$ -$ 710,905.06$ Non-Residential AC Level 2 Chargers – Multi-Port -$ 180,716$ 507,769.60$ 482,235.98$ 317,645.96$ -$ 1,488,367.54$ Non-Residential & Multi-Family DC Fast Chargers 54,618$ 97,877.50$ 265,678.33$ 245,779.61$ 279,472.31$ 14,259.00$ 957,684.75$ Custom Projects -$ 1,093,820.19$ 506,497.68$ 1,067,500$ 1,157,429.62$ -$ 3,825,247.49$ Administration 176,176$ 176,426.62$ 127,958.88$ 93,512.91$ 208,313.22$ 17,430$ 799,818.07$ Outreach & Awareness 133,751$ 109,478.83$ 261,514.66$ 327,304.18$ 234,365.66$ -$ 1,066,414.33$
Total 487,502$ 1,881,702.86$ 1,824,139.06$ 2,505,456.17$ 2,442,446.54$ 35,089.44$ 9,176,336.07$
Actual SAP Postings by Calendar Year for EV Program
EV Program Actual Postings in SAP by Calendar Year
* Includes transferred (OMAG) costs of program expenditures prior to Commision approval in July 2017.

Exhibit 2-E EV Program Budget Allocations Year Over Year

Prescriptive Incentives Completed
Q3 2017
Custom Incentives Committed
Q3 - Q4 2017Total 2017
Prescriptive Incentives Completed
Q4 2017 - Q3 2018
Custom Incentives Committed
Q1 - Q4 2018
Total 2018
Prescriptive Incentives Completed
Q4 2018 - Q3 2019
Custom Incentives Committed
Q1 - Q4 2019
Total 2019
Prescriptive Incentives Completed
Q4 2019 - Q3 2020
Custom Incentives Committed
Q1 - Q4 2020
Total 2020
Prescriptive Incentives Completed
Q4 2020 - Q1 2022
Custom Incentives Committed
Q1 - Q4 2021
Total 2021
TOU Incentives 2,800$ 2,800$ 22,400$ 22,400$ 29,400$ 29,400$ 30,400$ 30,400$ 11,000$ 11,000$ TOU Load Research Incentives 10,000$ 10,000$ 17,000$ 17,000$ 100$ 100$ -$ -$ TOU Meters 79,394$ 554.48$ 341.06$ 450.16$ AC Level 2 Incentives (Residential) -$ -$ -$ -$ -$ -$ 22,811.33$ 22,811.33$ 101,048.39$ 101,048.39$ AC Level 2 Incentives (Single Port) 65,309$ 65,309$ 102,907$ 102,907$ 108,013.58$ 108,013.58$ 228,573.06$ 228,573.06$ 159,584.73$ 159,584.73$ AC Level 2 Incentives (Multiple Port) 189,844$ 189,844$ 520,440.58$ 520,440.58$ 472,956.43$ 472,956.43$ 488,482.61$ 488,482.61$ DC Fast Charger Incentives 54,618$ 54,618$ 97,878$ 97,878$ 265,678.33$ 265,678.33$ 219,582.24$ 219,582.24$ 337,389.80$ 337,389.80$ Custom Project Incentives 1,359,874$ 1,359,874$ 998,500$ 998,500$ 669,439.49$ 669,439.49$ 604,418.79$ 604,418.79$ 320,160.12$ 320,160.12$
Administration 176,176$ 175,427$ 127,958.88$ 93,512.91$ 208,313.22$ Outreach & Awareness 133,751$ 109,479$ 261,514.66$ 327,304.18$ 234,365.66$
Total 1,792,528$ Total 1,785,828$ Total 2,000,000$ Total 2,000,000.00$ Total 1,860,794.69$
9,439,151$ TOTAL ALLOCATED BUDGET FOR ALL YEARS
2019 EV Budget Costs / Committed Funds 2021 EV Budget Costs / Committed Funds2020 EV Budget Costs / Committed Funds
EV Program Budget Costs / Committed Funds by Year
2017 EV Budget Costs / Committed Funds 2018 EV Budget Costs / Committed Funds

Exhibit 2-F rEV RMP Report Spring 2021
2021
ROCKY MOUNTAIN POWER rEV

Prepared for: Michael Snow
Rocky Mountain Power
1407 West North Temple
Suite 330
Salt Lake City, UT 84116
Prepared by: Kelly Flowers
rEV Director
National Energy Foundation
4516 S 700 E Suite 100
Salt Lake City, UT 84107
June 29, 2021


Table of Contents
Program Overview ...................................................................................................1Program Description 1Program Administration 1Building Collaborations 1Program Implementation 1Rocky Mountain Power rEV website 3rEV Presentation 4Student and Teacher Incentives 5Program Summary and Analysis 5rEV Share Form Data 5rEV Share Form Student Comments 6Program/Teacher Evaluation Comments 6rEV Challenge Contest 7
Attachments ..............................................................................................................9Welcome Letter 9Rewarding Results Flier 11rEV Challenge Flier 12Student Mini-Poster 13rEV Share Form Summary Report 15Program/Teacher Evaluation Report 22

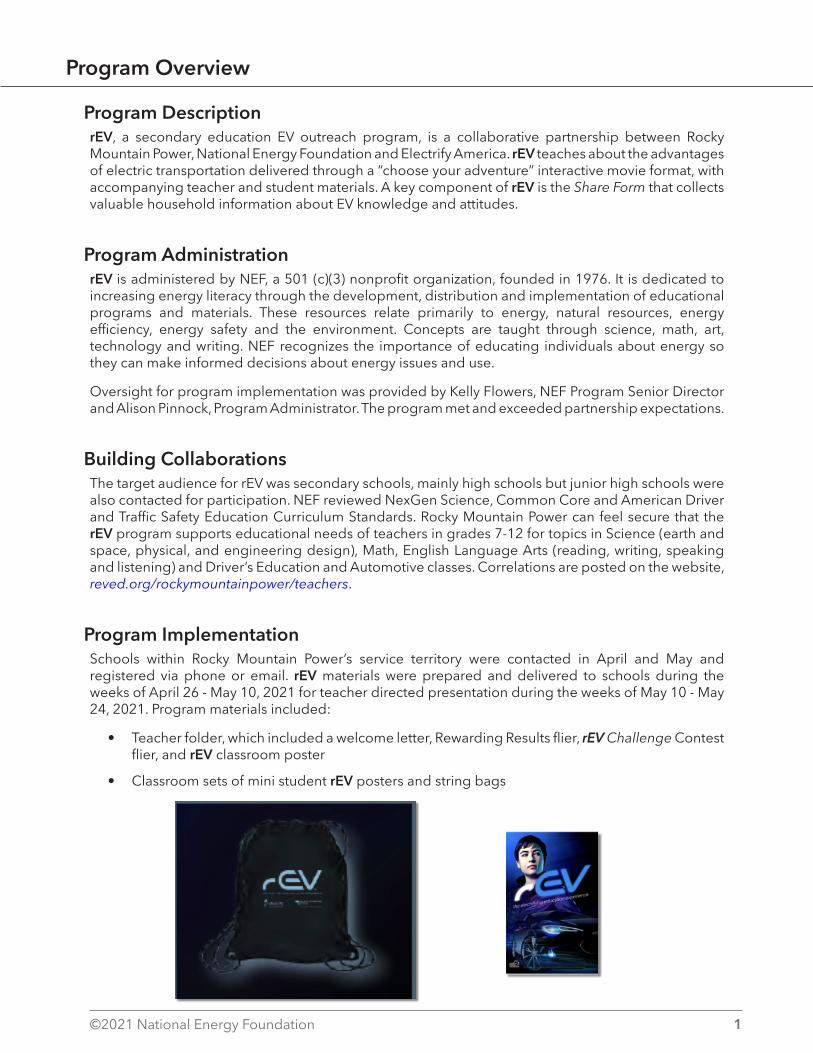
©2021 National Energy Foundation 1
Program Overview
Program DescriptionrEV, a secondary education EV outreach program, is a collaborative partnership between Rocky Mountain Power, National Energy Foundation and Electrify America. rEV teaches about the advantages of electric transportation delivered through a “choose your adventure” interactive movie format, with accompanying teacher and student materials. A key component of rEV is the Share Form that collects valuable household information about EV knowledge and attitudes.
Program AdministrationrEV is administered by NEF, a 501 (c)(3) nonprofit organization, founded in 1976. It is dedicated to increasing energy literacy through the development, distribution and implementation of educational programs and materials. These resources relate primarily to energy, natural resources, energy efficiency, energy safety and the environment. Concepts are taught through science, math, art, technology and writing. NEF recognizes the importance of educating individuals about energy so they can make informed decisions about energy issues and use.
Oversight for program implementation was provided by Kelly Flowers, NEF Program Senior Director and Alison Pinnock, Program Administrator. The program met and exceeded partnership expectations.
Building CollaborationsThe target audience for rEV was secondary schools, mainly high schools but junior high schools were also contacted for participation. NEF reviewed NexGen Science, Common Core and American Driver and Traffic Safety Education Curriculum Standards. Rocky Mountain Power can feel secure that the rEV program supports educational needs of teachers in grades 7-12 for topics in Science (earth and space, physical, and engineering design), Math, English Language Arts (reading, writing, speaking and listening) and Driver’s Education and Automotive classes. Correlations are posted on the website, reved.org/rockymountainpower/teachers.
Program ImplementationSchools within Rocky Mountain Power’s service territory were contacted in April and May and registered via phone or email. rEV materials were prepared and delivered to schools during the weeks of April 26 - May 10, 2021 for teacher directed presentation during the weeks of May 10 - May 24, 2021. Program materials included:
• Teacher folder, which included a welcome letter, Rewarding Results flier, rEV Challenge Contest flier, and rEV classroom poster
• Classroom sets of mini student rEV posters and string bags
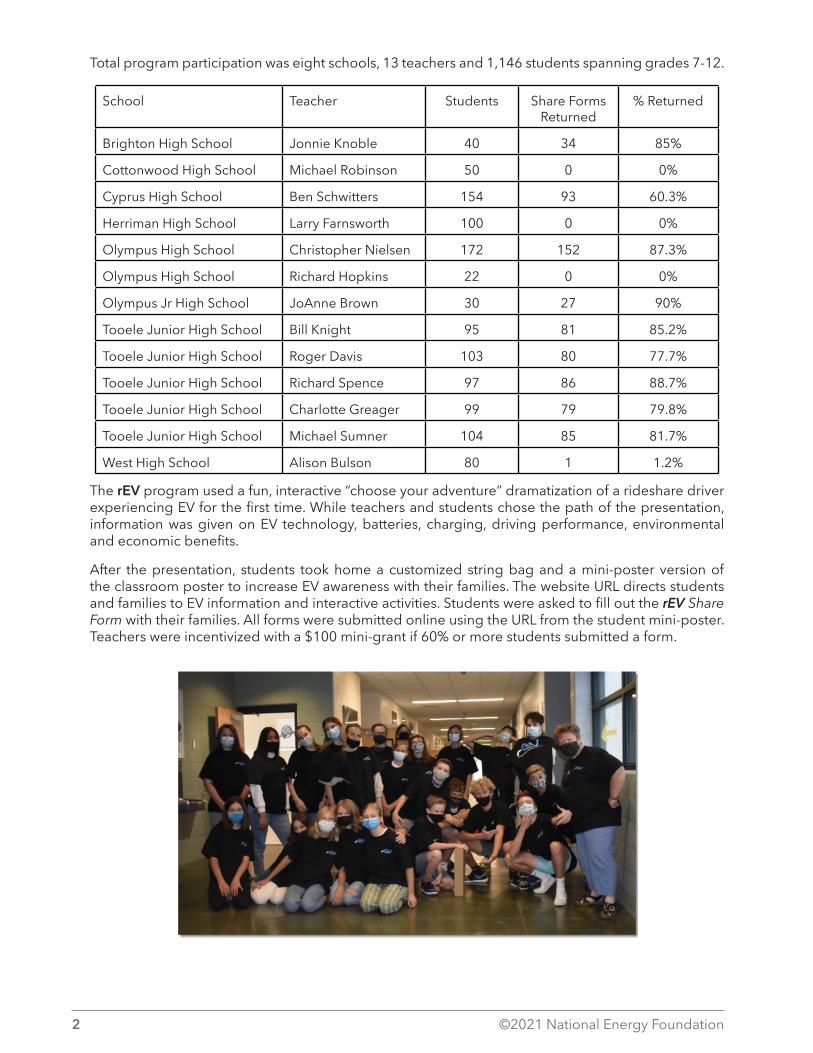
2 ©2021 National Energy Foundation
Total program participation was eight schools, 13 teachers and 1,146 students spanning grades 7-12.
School Teacher Students Share Forms Returned
% Returned
Brighton High School Jonnie Knoble 40 34 85%
Cottonwood High School Michael Robinson 50 0 0%
Cyprus High School Ben Schwitters 154 93 60.3%
Herriman High School Larry Farnsworth 100 0 0%
Olympus High School Christopher Nielsen 172 152 87.3%
Olympus High School Richard Hopkins 22 0 0%
Olympus Jr High School JoAnne Brown 30 27 90%
Tooele Junior High School Bill Knight 95 81 85.2%
Tooele Junior High School Roger Davis 103 80 77.7%
Tooele Junior High School Richard Spence 97 86 88.7%
Tooele Junior High School Charlotte Greager 99 79 79.8%
Tooele Junior High School Michael Sumner 104 85 81.7%
West High School Alison Bulson 80 1 1.2%
The rEV program used a fun, interactive “choose your adventure” dramatization of a rideshare driver experiencing EV for the first time. While teachers and students chose the path of the presentation, information was given on EV technology, batteries, charging, driving performance, environmental and economic benefits.
After the presentation, students took home a customized string bag and a mini-poster version of the classroom poster to increase EV awareness with their families. The website URL directs students and families to EV information and interactive activities. Students were asked to fill out the rEV Share Form with their families. All forms were submitted online using the URL from the student mini-poster. Teachers were incentivized with a $100 mini-grant if 60% or more students submitted a form.
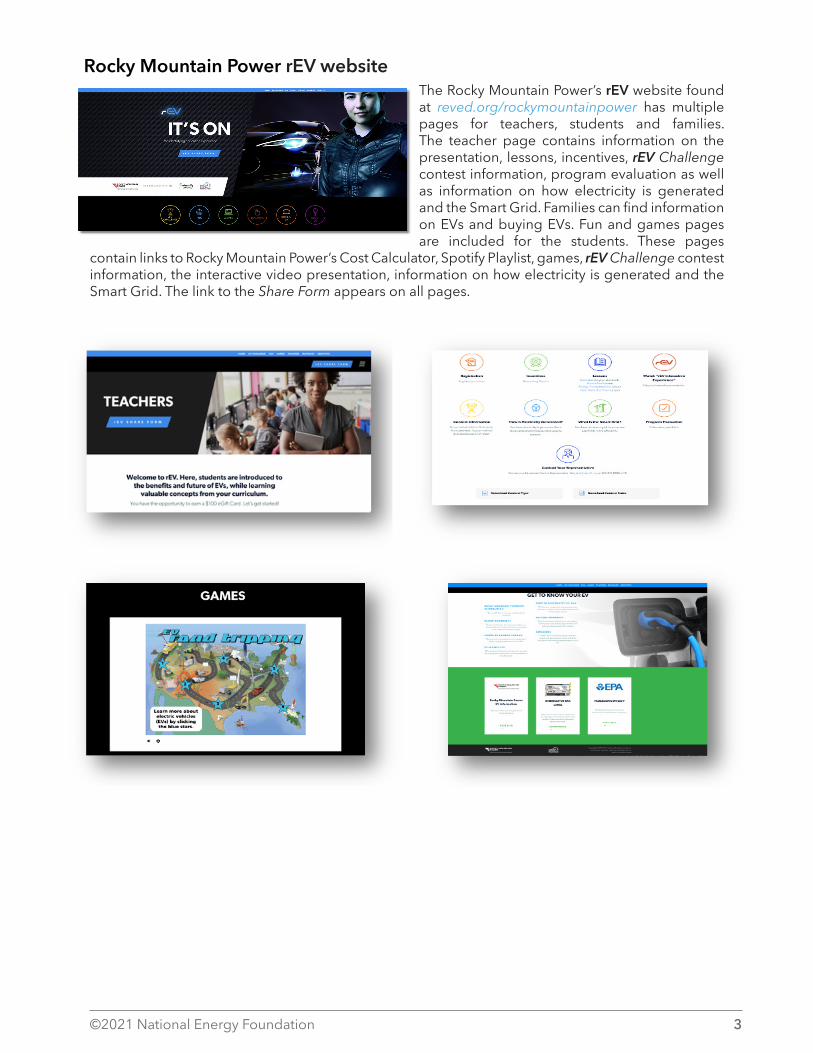
©2021 National Energy Foundation 3
Rocky Mountain Power rEV websiteThe Rocky Mountain Power’s rEV website found at reved.org/rockymountainpower has multiple pages for teachers, students and families. The teacher page contains information on the presentation, lessons, incentives, rEV Challenge contest information, program evaluation as well as information on how electricity is generated and the Smart Grid. Families can find information on EVs and buying EVs. Fun and games pages are included for the students. These pages
contain links to Rocky Mountain Power’s Cost Calculator, Spotify Playlist, games, rEV Challenge contest information, the interactive video presentation, information on how electricity is generated and the Smart Grid. The link to the Share Form appears on all pages.

4 ©2021 National Energy Foundation
rEV PresentationTHe rEV presentation is a uniquely created method of presenting. Through a series of film clips, information on EVs was relayed to the students. Sarah, the central character of the films, was introduced to EVs as a rideshare operator as her friend, Noah, tried to help her gain knowledge on EVs. Varying passengers in Sarah’s car had different views and information on EVs, often dispelling myths. Any of the various paths that the students chose for their story gave the same information.
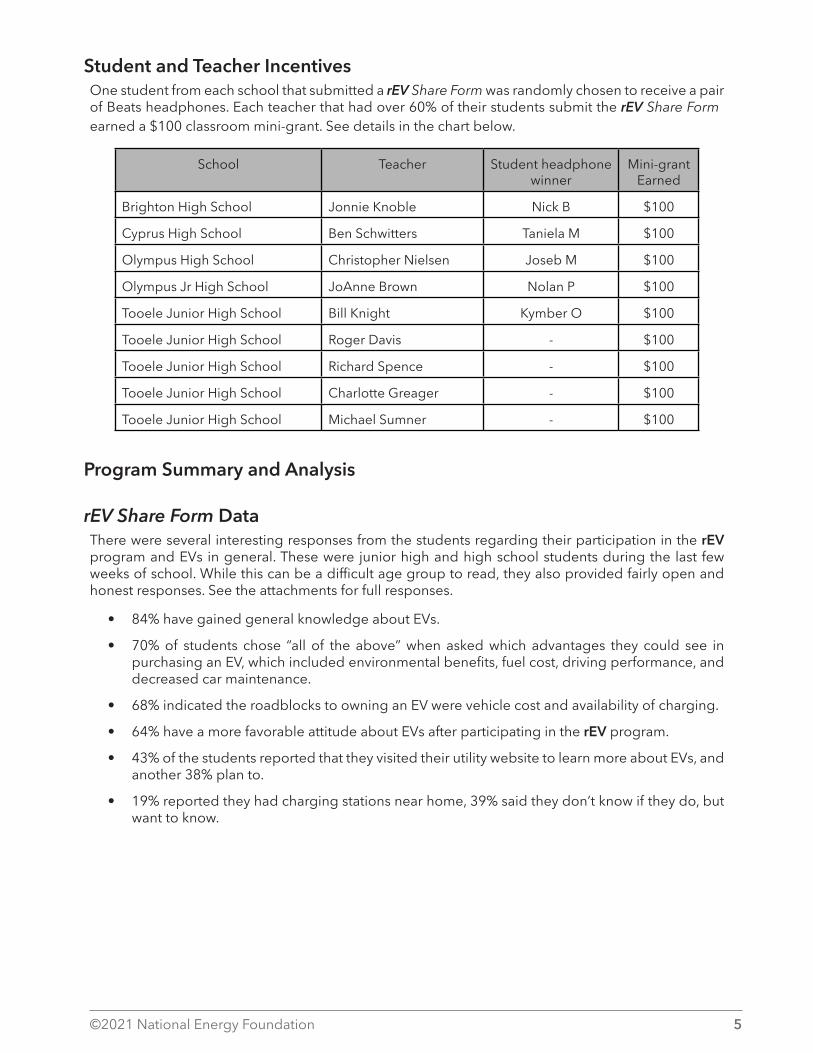
©2021 National Energy Foundation 5
Student and Teacher IncentivesOne student from each school that submitted a rEV Share Form was randomly chosen to receive a pair of Beats headphones. Each teacher that had over 60% of their students submit the rEV Share Form earned a $100 classroom mini-grant. See details in the chart below.
School Teacher Student headphone winner
Mini-grant Earned
Brighton High School Jonnie Knoble Nick B $100
Cyprus High School Ben Schwitters Taniela M $100
Olympus High School Christopher Nielsen Joseb M $100
Olympus Jr High School JoAnne Brown Nolan P $100
Tooele Junior High School Bill Knight Kymber O $100
Tooele Junior High School Roger Davis - $100
Tooele Junior High School Richard Spence - $100
Tooele Junior High School Charlotte Greager - $100
Tooele Junior High School Michael Sumner - $100
Program Summary and Analysis
rEV Share Form DataThere were several interesting responses from the students regarding their participation in the rEV program and EVs in general. These were junior high and high school students during the last few weeks of school. While this can be a difficult age group to read, they also provided fairly open and honest responses. See the attachments for full responses.
• 84% have gained general knowledge about EVs.
• 70% of students chose “all of the above” when asked which advantages they could see in purchasing an EV, which included environmental benefits, fuel cost, driving performance, and decreased car maintenance.
• 68% indicated the roadblocks to owning an EV were vehicle cost and availability of charging.
• 64% have a more favorable attitude about EVs after participating in the rEV program.
• 43% of the students reported that they visited their utility website to learn more about EVs, and another 38% plan to.
• 19% reported they had charging stations near home, 39% said they don’t know if they do, but want to know.

6 ©2021 National Energy Foundation
rEV Share Form Student CommentsStudents’ rEV Share Form responses were mostly positive with 25% giving additional comments. A few wanted to hear more about the cons of EVs, or the science behind them. See the attachments for full comments.
• Good presentation, interaction made it more engaging.
• I already have an EV but I do think this helped shed some more light on EVs.
• I know a lot more about EV’s now and their benefit to the environment, thanks!
• I love EV!! This is revolutionizing technology. The fact that we can be mobile and save the environment is great!
• I think this program is very useful and can be used to help people learn about what an ev is and their benefits
• I like this program for giving kids the chance to make a choice early, although it felt a good bit more like an advertisement than a program. It could’ve talked a bit more about the cons of EVs and how to move around them.
• It was very nice and I loved the story.
• Starting to change my mind about EVs.
Program/Teacher Evaluation CommentsTeacher comments were a mix of positive and negative. We have invited one of the teachers with a lower evaluation to be on our teacher advisory council and will incorporate ideas for improvement. See the attachments for full comments.
• It’s a good introduction to the value of electric vehicles.
• The video was too scripted.
• It was a good way to get the word out with up and coming automotive students.
• It feels like you’re selling cars when you teach it.
• This is a great program and set up really well! You might consider targeting middle school more. Even though they can’t drive more, they are thinking about it A LOT!

©2021 National Energy Foundation 7
Screen shot from the Grand Prize winning video:
rEV Challenge ContestThis unique contest asked students to create a 30-45 second video revealing the benefits and future of EVs to their friends. Students completed a digital entry form and uploaded their video file. There were nine entries from the Rocky Mountain Power service area. Judging took place in June 2021. The winning student, Jaedin M, and her teacher received an electric bike of their choice. This national winner was from the Rocky Mountain Power service area. Her video will be added to the rEV website in the fall. See contest flier in the attachments.
Program Attachments Welcome Letter
Rewarding Results Flier
rEV Challenge Flier
Student Mini-Poster
rEV Share Form Summary Report
Program/Teacher Evaluation Report

8 ©2021 National Energy Foundation

©2021 National Energy Foundation 9
AttachmentsWelcome Letter
cultivating energy literacy®
Questions? Contact:
Kelly FlowersEducation Service Representative800-616-8326 ext. [email protected]
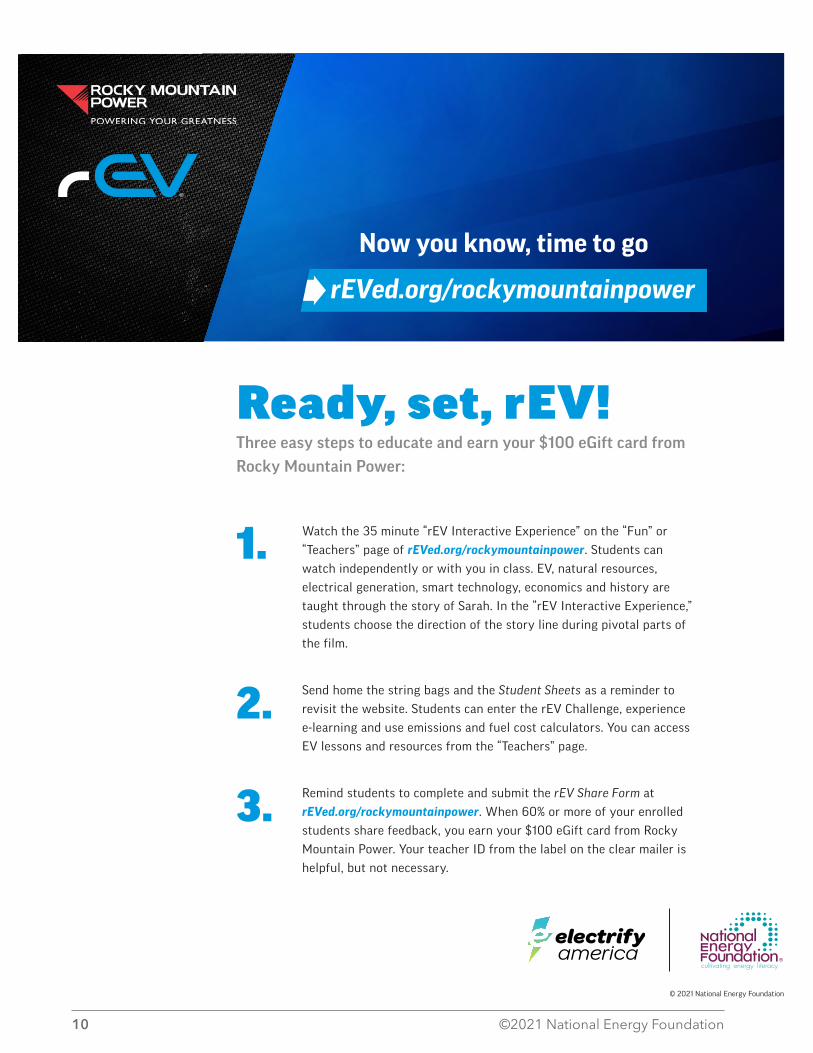
10 ©2021 National Energy Foundation
Ready, set, rEV!Three easy steps to educate and earn your $100 eGift card from
Rocky Mountain Power:
Watch the 35 minute “rEV Interactive Experience” on the “Fun” or
“Teachers” page of rEVed.org/rockymountainpower. Students can
watch independently or with you in class. EV, natural resources,
electrical generation, smart technology, economics and history are
taught through the story of Sarah. In the “rEV Interactive Experience,”
students choose the direction of the story line during pivotal parts of
the film.
Send home the string bags and the Student Sheets as a reminder to
revisit the website. Students can enter the rEV Challenge, experience
e-learning and use emissions and fuel cost calculators. You can access
EV lessons and resources from the “Teachers” page.
Remind students to complete and submit the rEV Share Form at
rEVed.org/rockymountainpower. When 60% or more of your enrolled
students share feedback, you earn your $100 eGift card from Rocky
Mountain Power. Your teacher ID from the label on the clear mailer is
helpful, but not necessary.
1.
2.
3.
rEVed.org/rockymountainpower
Now you know, time to go
© 2021 National Energy Foundation

©2021 National Energy Foundation 11
rEVed.org/rockymountainpower
Now you know, time to go
cultivating energy literacy®
Reward Your StudentsAll students receive a string bag. The string
bags will identify them as participants in the
rEV electrifying education experience.
Students who complete the rEV Share Form on
the website are entered into a drawing for a pair
of Beats headphones.
Giving a completion grade or extra credit may
encourage students to complete the form.
Reward YourselfEarn a $100 eGift Card when 60% or more of
your class completes the rEV Share Form by the
due date in your program emails.
Direct your students to the website to fill out
the form online.*
*Offer available for teachers participating in the rEV program. Classes must submit 60% or more of the
rEV Share Forms by the deadline to earn the $100 eGift card from Rocky Mountain Power.
Rewarding Results Flier

12 ©2021 National Energy Foundation
ARE YOU IN? You have learned about electric vehicles (EVs), now it is time to take the rEV Challenge!
Create a 30 – 45 second video that reveals the future of EVs to your friends. Get out your camera (even if it is your phone) to record a compelling message about the benefits of EVs.
Review the rEV Challenge official rules. bit.ly/rEVChallengeRules
Complete the digital entry form (including an electronic signature from your parent/guardian) and upload your video file. bit.ly/rEVChallengeEntry
1
2
3
© 2021 National Energy Foundation
rEV CHALLENGE
Enter by May 31, 2021 for your chance at the grand
prize, an electric bike!
You can win one for your teacher too!
Now you know, time to go rEVed.org /rockymountainpower
rEV Challenge Flier

©2021 National Energy Foundation 13
© 2021 National Energy Foundation • All rights reserved • 4516 South 700 East, Suite 100, Salt Lake City, UT 84107 • nef1.org • 800-616-8326 • This poster is an artist’s representation and is not intended to be a technical illustration.
cultivating energy literacy®
Student Mini-Poster

14 ©2021 National Energy Foundation
Easy Bein’ Green • Potential to fuel with electricity
generated with renewable resources
• Can improve local air quality and reduce carbon
• EVs can store electricity for an efficient grid
• Electricity costs are more stable than gasoline
What Is an EV? • A vehicle powered by electricity
or a combination of electricity and gasoline (HEV)
• The growing technology of tomorrow
• A truck, scooter, self-driving car, mass transit, bus or SUV
Price Is Right • Wide range of decreasing
purchase prices
• New or used
• Fewer moving parts equals less maintenance cost
• EV fueling is generally less expensive than fueling a similar, conventional vehicle
Take Charge • Like plugging in a toaster
• Charge while you shop, at work or home
• Potential to charge when electricity is cheaper
• Up to 250 miles on a single charge
Driving Experience • Smooth and quiet
• Zero to 60 mph possible in under three seconds
• Batteries can last over 200,000 miles
• Locate chargers and plan trips with ease
“rEV Interactive Experience”Watch “rEV Interactive Experience” on the “Fun” page. YOU choose what Sarah does next.
Games and InformationPlay EV games.
Picture Yourself in an EV.
rEVed.org/rockymountainpower
Now you know, time to go rEVed.org/rockymountainpower
Calculate EV SavingsDiscover fuel cost savings and find vehicle incentives at rockymountainpower.net/ev.
rEV ChallengeCreate a 30 – 45 second video to convince your friends to to drive an EV. Entry details and information about the electric bike grand prize are on the program website. Are you in?
How Do You rEV? Show your newfound knowledge with the social media links below. Bust an EV myth, share the Spotify® playlist, or encourage your friends to complete the rEV Share Form.
rEV Share Form Share your voice to earn your reward.
What is the rEV Share Form? It is a way to share insights that shape the future of your community. Visit the form on any page of rEVed.org/rockymountainpower. Two minutes is all it takes to earn a chance at wireless Beats headphones.
© 2021 National Energy Foundation • All rights reserved • 4516 South 700 East, Suite 100 • Salt Lake City, UT 84107 • nef1.org • 800-616-8326
Social icon
Rounded squareOnly use blue and/or white.
For more details check out ourBrand Guidelines.
cultivating energy literacy®
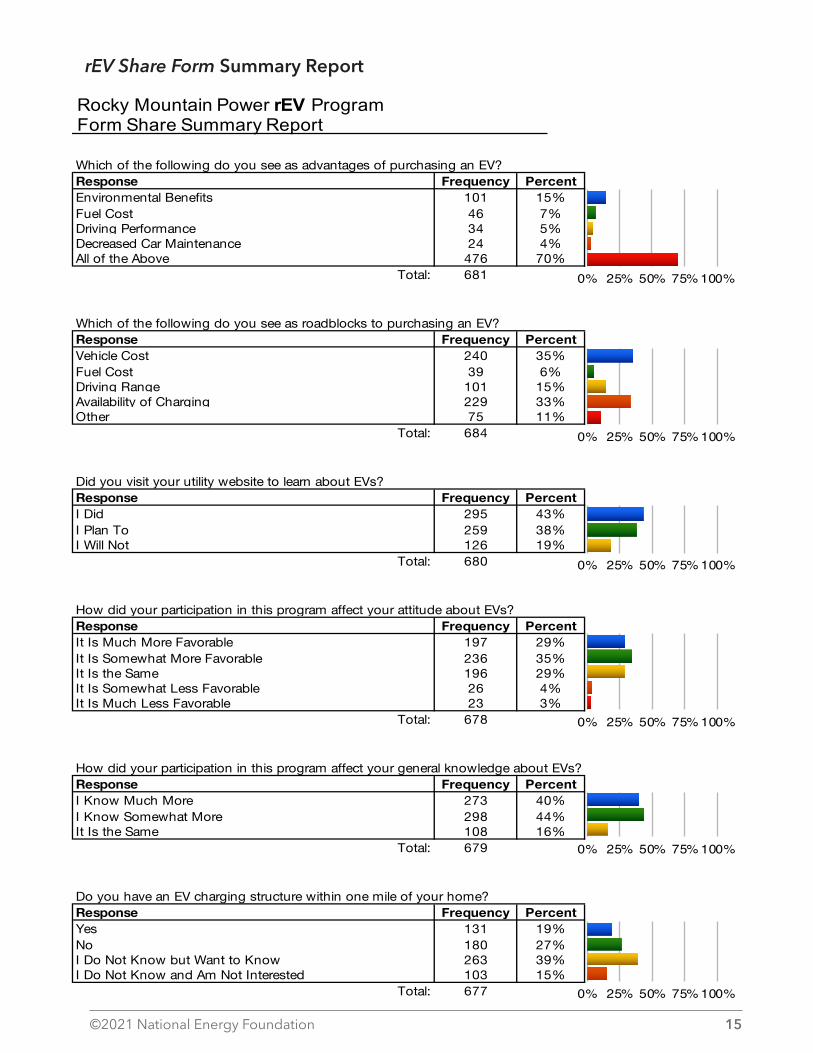
©2021 National Energy Foundation 15
Which of the following do you see as advantages of purchasing an EV?Response Frequency PercentEnvironmental Benefits 101 15%Fuel Cost 46 7%Driving Performance 34 5%Decreased Car Maintenance 24 4%All of the Above 476 70%
Total: 681
Which of the following do you see as roadblocks to purchasing an EV?Response Frequency PercentVehicle Cost 240 35%Fuel Cost 39 6%Driving Range 101 15%Availability of Charging 229 33%Other 75 11%
Total: 684
Did you visit your utility website to learn about EVs?Response Frequency PercentI Did 295 43%I Plan To 259 38%I Will Not 126 19%
Total: 680
Response Frequency PercentIt Is Much More Favorable 197 29%It Is Somewhat More Favorable 236 35%It Is the Same 196 29%It Is Somewhat Less Favorable 26 4%It Is Much Less Favorable 23 3%
Total: 678
How did your participation in this program affect your general knowledge about EVs?Response Frequency PercentI Know Much More 273 40%I Know Somewhat More 298 44%It Is the Same 108 16%
Total: 679
Do you have an EV charging structure within one mile of your home?Response Frequency PercentYes 131 19%No 180 27%I Do Not Know but Want to Know 263 39%I Do Not Know and Am Not Interested 103 15%
Total: 677
How did your participation in this program affect your attitude about EVs?
Rocky Mountain Power rEV ProgramForm Share Summary Report
0% 25% 50% 75%100%
0% 25% 50% 75%100%
0% 25% 50% 75%100%
0% 25% 50% 75%100%
0% 25% 50% 75%100%
0% 25% 50% 75%100%
rEV Share Form Summary Report
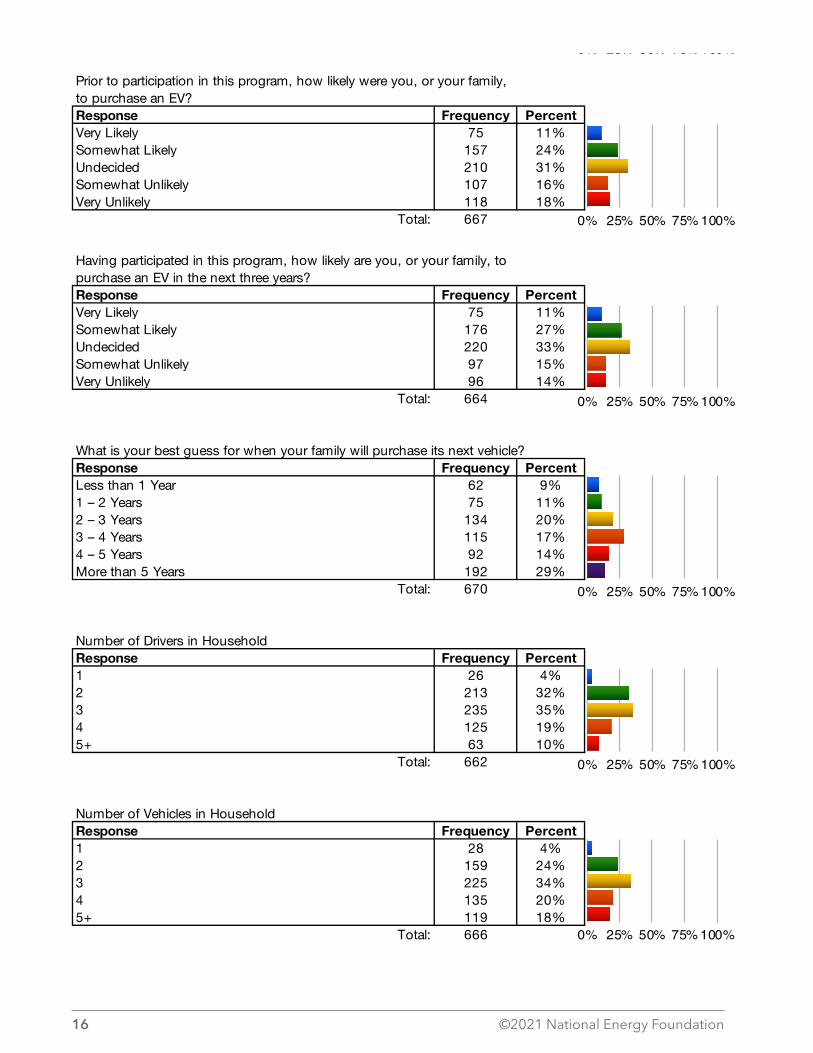
16 ©2021 National Energy Foundation
Response Frequency PercentVery Likely 75 11%Somewhat Likely 157 24%Undecided 210 31%Somewhat Unlikely 107 16%Very Unlikely 118 18%
Total: 667
Response Frequency PercentVery Likely 75 11%Somewhat Likely 176 27%Undecided 220 33%Somewhat Unlikely 97 15%Very Unlikely 96 14%
Total: 664
What is your best guess for when your family will purchase its next vehicle?Response Frequency PercentLess than 1 Year 62 9%1 – 2 Years 75 11%2 – 3 Years 134 20%3 – 4 Years 115 17%4 – 5 Years 92 14%More than 5 Years 192 29%
Total: 670
Number of Drivers in HouseholdResponse Frequency Percent1 26 4%2 213 32%3 235 35%4 125 19%5+ 63 10%
Total: 662
Number of Vehicles in HouseholdResponse Frequency Percent1 28 4%2 159 24%3 225 34%4 135 20%5+ 119 18%
Total: 666
Prior to participation in this program, how likely were you, or your family, to purchase an EV?
Having participated in this program, how likely are you, or your family, to purchase an EV in the next three years?
0% 25% 50% 75%100%
0% 25% 50% 75%100%
0% 25% 50% 75%100%
0% 25% 50% 75%100%
0% 25% 50% 75%100%
0% 25% 50% 75%100%

©2021 National Energy Foundation 17
Number of EVs in HouseholdResponse Frequency Percent0 572 87%1 51 8%2 25 4%3+ 12 2%
Total: 660
Average Miles Driven by a Household DriverResponse Frequency Percent1 to 15 Miles per Day 143 22%16 to 30 Miles per Day 262 40%31 to 45 Miles per Day 151 23%46+ Miles per Day 102 16%
Total: 658
How do you rate the rEV program?Response Frequency PercentGreat 244 37%Good 294 44%Fair 102 15%Poor 28 4%
Total: 668
0% 25% 50% 75%100%
0% 25% 50% 75%100%
0% 25% 50% 75% 100%

18 ©2021 National Energy Foundation
Additional Comment(s):5/10Cars are quite cool.CoolcoolDid she win?Esto es GenialEV are not good.ev coolev's are prettyEVs are wiered
Explaining the benefits of EVs is good but I am more interested in how they mechanically work. If you would put a little explanation of how the electric motors work, I think more people would be less scared and more interested in EVs. People are scared of what they don't understand.**** your evsgoodGood presentationGood presentation, interaction made it more engaging.Good program, just seemed like it was aimed more towards a younger audienceHope I win and will you guys let my parents knowI already have an EV but I do think this helped shed some more light on EVs.
I can tell you as a fact I will be purchasing a EV in the future when I'm old enough to legally driveI do not feel comfortable answeringi do not like nor support electric vehiclesI don't believe there are no negatives, and the only reason my family will get a new car within a year is because my family is going to get a new member soon, and our current cars are too small for a family of six. I wasn't aware EV's really existed before the thing, and again, I don't believe they have no negatives. even if I wanted an EV, I wouldn't know how or where to charge it, and I doubt I'd be able to convince anyone with any logic. there's just no way it can be that good with no negative counterbalance, and even if it COULD be, I can't drive yet, so it wouldn't matter tell the full truth. both the positives, AND the negatives. at the very least you could explain some more about what an EV can do that a regular car can't! i don't like this car type.i dont like electric carsi dont like itI Enjoyed How Educational The Interactive Experience Was.I hate all electric cars. except for the raesr tachyon speed.I have divorced parents so i just added them all together for those last few questionsi hope i win and if i dont rhen tell the person thea won kongratsI know a lot more about EV's now and their benefit to the environment, thanks!I learned a lot from this program.i like carsi like electric cars more because they are much easy to understand and probably fixi like electric cars more because they are much easy to understand and probably fix

©2021 National Energy Foundation 19
Additional Comment(s):I like this program for giving kids the chance to make a choice early, although it felt a good bit more like advertisement then a program. It could've talked a bit more about the cons of EVs and how to move around them. This could give us information on how to combat it in the future and how we can make the difference early.I like what your guys are doing and I hope that the progress continues.i liked itI love EV!! This is revolutionizing technology. The fact that we can be mobile and save the environment is great!I need some headphones.I need these beat headphonesi now know much more about evs than i did before.I really want a EVI really want a Tesla after this videoI think EV's are great and the future.i think that ev are goodi think that ev are very important to everythingi think that evs are the future but its gonna take a while for people to get use to it but there will be a bad side of it people will possibly lose there job in the gas powerd car industryi think that it is a good cause cause it helps naturei think the rEV is coolI think this program is very useful and can be used to help people learn about what an ev is and their benefitsI thought that these EVs really are the future, and this program will absolutely bring awareness of the problem of regular cars.I want da headphoni want some new head phonesi want the ear budsI want to go home.I would like to have the finish the story.I would love a pair of beats headphones. :)idk it's cool, it's better for the environment so that's good.idk what those are but they sound nice.im boredit alrightIt was a great program that really taught me about EV ‘s. It showed me what they were how do use for the are in the benefits that come with having oneIt was cool to learn about thisIt was vary nice and i loved the story.Jackson Evers, Drivers Ed, Knoble P.2love the ev"sLove this program, EVs are the future!!! I definitely want to buy an EV when I am older.May the best car win.my dad always wanted me to drive his car, but i think on considering getting a nice tesla EV.

20 ©2021 National Energy Foundation
Additional Comment(s):My Dad bought a Tesla about a year ago and he absolutely loves it and finds it much more promising than a normal carMy thing is the cost if you could sell them for like 20k or 15k instead of 60 to 70k would be more favorable to all people in general.None. Thank You so Much!!!Once tesla comes out with a cheap car then I will buy it cause im brokeOur household has many older day cars, and i think they are cool! but EV's seem like an interesting future.please give me the beats :)Please i want some headphones i only have earbuds me sad boy please.Please pick me. I have two uncles who owns a teslaplease, I have no headphones :(. My mommy wants them too)pleasseeeeeeeeeeee pick mee.Starting to change my mind about EV'sTesla is overratedthank youthank youThank you for all the information, it may help my family in the future.Thank you for this program, it is very informative.Thank you!thank you!Thanks for allowing us to do this. I'm making the students take a screenshot of their finished survey for an assignment so I wanted to complete one of these to see what it looks like when I submit it.Thanks for what you're doingThe guy talking suckedThe Learning Experience Was Great! In The Future I Will Buy An EVthe video was weridThe videos were very informational and I learned a lot, but they were very cheesy and it made them hard to watch.These EV's sound really coolthey are coolthey are fast cars that go to 60 really fastThey look stupid. But they are useful.This is a great program to learn the benefits of EV's and more about themthis is an extremely informational program, I learned a lot.This is pretty cool man.this video kinda sucked, garbage quality and didn't cover the disadvantages as much as I wished.This was a fun activityThis was a fun class but my family already has an EV and its awesome.this was really good infoThis was really great. I think that it's a good idea to switch to electric vehicles.This was very interestingThose cars look really cool.

©2021 National Energy Foundation 21
Additional Comment(s):uhhh coooolVery goodVery nicevroom vroomvroom vroomWe have an electric car and ordered another one that is coming in the beginning of June. It is great to learn more about them!why do you like electric vehicles?why does this even materwhy does this even matteryea rock onyezzuh
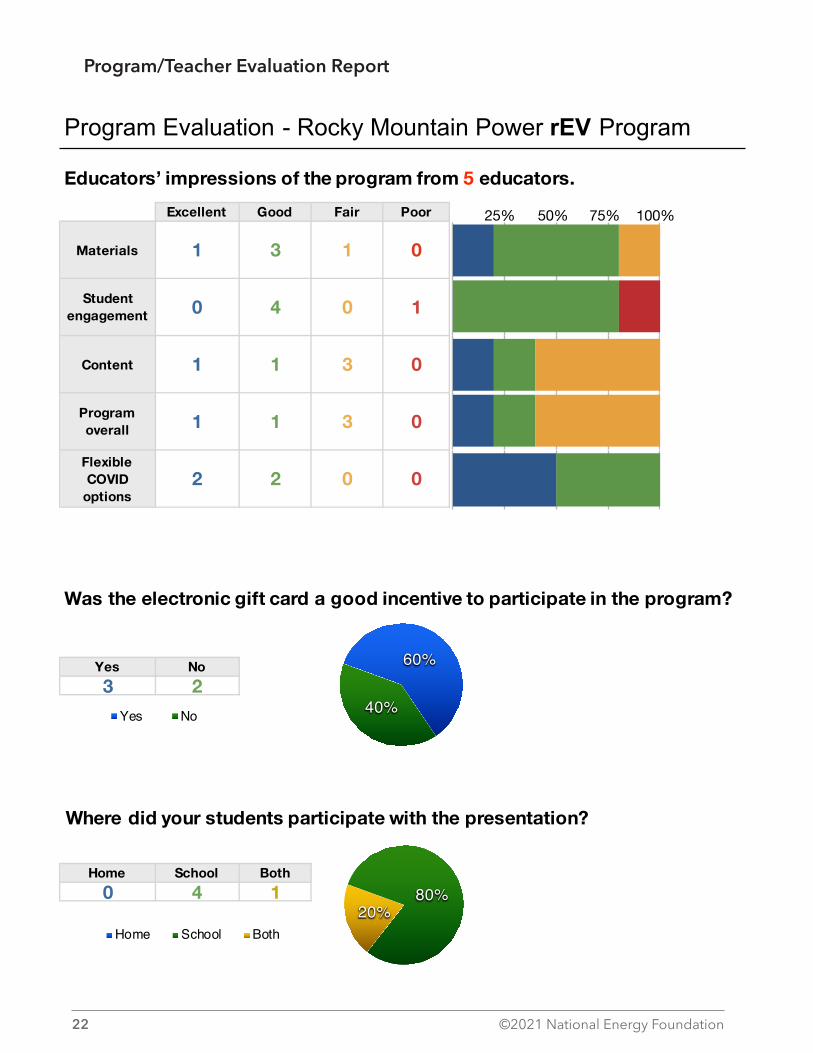
22 ©2021 National Energy Foundation
Program/Teacher Evaluation Report
Excellent Good Fair Poor
Materials 1 3 1 0
Student engagement 0 4 0 1
Content 1 1 3 0
Program overall 1 1 3 0
Flexible COVID
options2 2 0 0
Yes No3 2
Home School Both0 4 1
Program Evaluation - Rocky Mountain Power rEV Program
Educators’ impressions of the program from 5 educators.
Was the electronic gift card a good incentive to participate in the program?
60%
40%Yes No
25% 50% 75% 100%
Where did your students participate with the presentation?
80%20%
Home School Both

©2021 National Energy Foundation 23
What additional activities did you, or will you, use from the website?
Student formNothing this year since it's over.We looked at locations of EV chargers as well as some of the resources on renewable energy.Watched the interactive teachers
What would you tell other teachers about the program?
It feels like you're selling cars when you teach it.Great way to share the EV community's perspective with up and coming automotive students.It was good to get the word out.It ties really well with the 7th and 8th grade core curriculum. There are fun activities and the students love to make videos!It's a good introduction to the value of electric vehicles
What would you like us to tell rEV program sponsors about the program?
You could add in more actual science for the students to evaluate or problems to solve.Let the students work on some electric cars and see if it changes their mind. I believe the biggest issue is repairs are scary to them (or not repairable).The video was too scripted.This is a great program and set up really well! You might consider targeting middle school more. Even though they can't drive yet, they are thinking about it A LOT!
Additional comments and recommendations:
Even the students felt it was just a big ad for electric vehicles. It was so pushy, some students were turned off by EVs. The EV side needs to be more subtle and the science behind why it matters need to be up front.More curriculum about electric car maintenance or safety.I suggest you roll out the program in January or so, so that you don't hit the end of the school year.

Exhibit 2-G rEV RMP Report Fall 2021
Fall 2021
ROCKY MOUNTAIN POWER rEV


Prepared for: Michael Snow
Rocky Mountain Power
1407 West North Temple
Suite 330
Salt Lake City, UT 84116
Prepared by: Kelly Flowers
rEV Director
National Energy Foundation
4516 S 700 E Suite 100
Salt Lake City, UT 84107
February 10, 2022


Table of Contents
Program Overview ...................................................................................................1Program Description 1Program Administration 1Building Collaborations 1Program Implementation 1Rocky Mountain Power rEV website 3rEV Presentation 4Student and Teacher Incentives 5Program Summary and Analysis 5rEV Share Form Data 5rEV Share Form Student Comments 6Program/Teacher Evaluation Comments 6rEV Challenge Contest 7
Attachments ..............................................................................................................9Welcome Letter 9Rewarding Results Flier 11rEV Challenge Flier 12Student Mini-Poster 13rEV Share Form Summary Report 15Program Teacher Evaluation Report 18Student Open-ended Comments 19

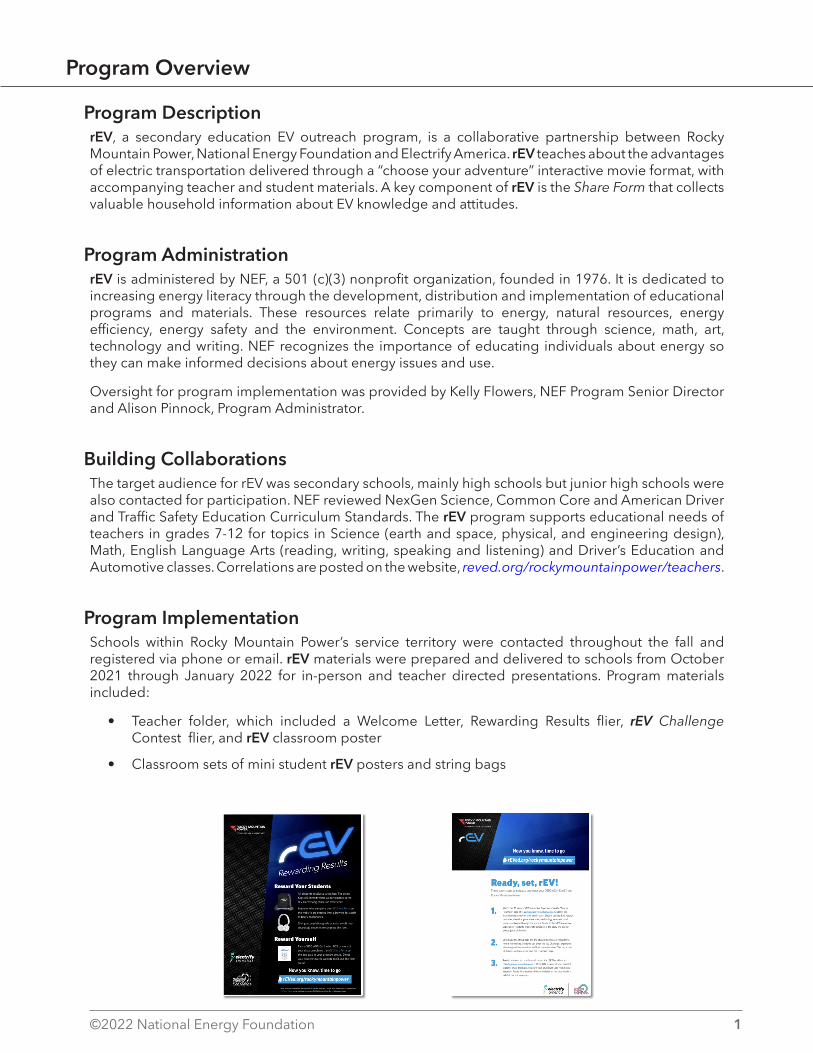
©2022 National Energy Foundation 1
Program Overview
Program DescriptionrEV, a secondary education EV outreach program, is a collaborative partnership between Rocky Mountain Power, National Energy Foundation and Electrify America. rEV teaches about the advantages of electric transportation delivered through a “choose your adventure” interactive movie format, with accompanying teacher and student materials. A key component of rEV is the Share Form that collects valuable household information about EV knowledge and attitudes.
Program AdministrationrEV is administered by NEF, a 501 (c)(3) nonprofit organization, founded in 1976. It is dedicated to increasing energy literacy through the development, distribution and implementation of educational programs and materials. These resources relate primarily to energy, natural resources, energy efficiency, energy safety and the environment. Concepts are taught through science, math, art, technology and writing. NEF recognizes the importance of educating individuals about energy so they can make informed decisions about energy issues and use.
Oversight for program implementation was provided by Kelly Flowers, NEF Program Senior Director and Alison Pinnock, Program Administrator.
Building CollaborationsThe target audience for rEV was secondary schools, mainly high schools but junior high schools were also contacted for participation. NEF reviewed NexGen Science, Common Core and American Driver and Traffic Safety Education Curriculum Standards. The rEV program supports educational needs of teachers in grades 7-12 for topics in Science (earth and space, physical, and engineering design), Math, English Language Arts (reading, writing, speaking and listening) and Driver’s Education and Automotive classes. Correlations are posted on the website, reved.org/rockymountainpower/teachers.
Program ImplementationSchools within Rocky Mountain Power’s service territory were contacted throughout the fall and registered via phone or email. rEV materials were prepared and delivered to schools from October 2021 through January 2022 for in-person and teacher directed presentations. Program materials included:
• Teacher folder, which included a Welcome Letter, Rewarding Results flier, rEV Challenge Contest flier, and rEV classroom poster
• Classroom sets of mini student rEV posters and string bags

2 ©2022 National Energy Foundation
Total program participation was 13 schools, 15 teachers and 1,973 students spanning grades 7-12.
*These teachers will implement the rEV program during their spring curriculum
The rEV program used a fun, interactive “choose your adventure” dramatization of a rideshare driver experiencing EV for the first time. While teachers and students chose the path of the presentation, information was given on EV technology, batteries, charging, driving performance, environmental and economic benefits.
After the presentation, students took home a customized string bag and a mini-poster version of the classroom poster to increase EV awareness with their families. The website URL directs students and families to EV information and interactive activities. Students were asked to fill out the rEV Share Form with their families. All forms were submitted online using the URL from the student mini-poster. Teachers were incentivized with a $100 mini-grant if 60% or more students submitted a form.
School Teacher StudentsShare Forms
Returned % ReturnedAmerican Fork High School Michael Davis 140 2 1%American Fork Jr High School Gerald Dibb 80 66 87%Butler Middle School David Olsen, Erin Hemingway 305 * *Canyon View High School Shaylie Christensen 90 73 81%Hillcrest High School Jake Flanigan 90 2 2%Hunter High School Scott Watson 197 0 0%Judge Memorial High School Dasch Houdeshel 70 23 33%Kearns High School Nick Angell 132 44 33%Northwest Middle School Dani Bainsmith, Robert Dahl 310 * *Pleasant Grove Junior High School Windee Maughan 210 80 38%Taylorsville High School Arielle Meredith 40 15 37%The Academy for Math, Engineering and Science Daane Helmus 59 0 0Wasatch Jr High School Alan Crookston 250 73 29%
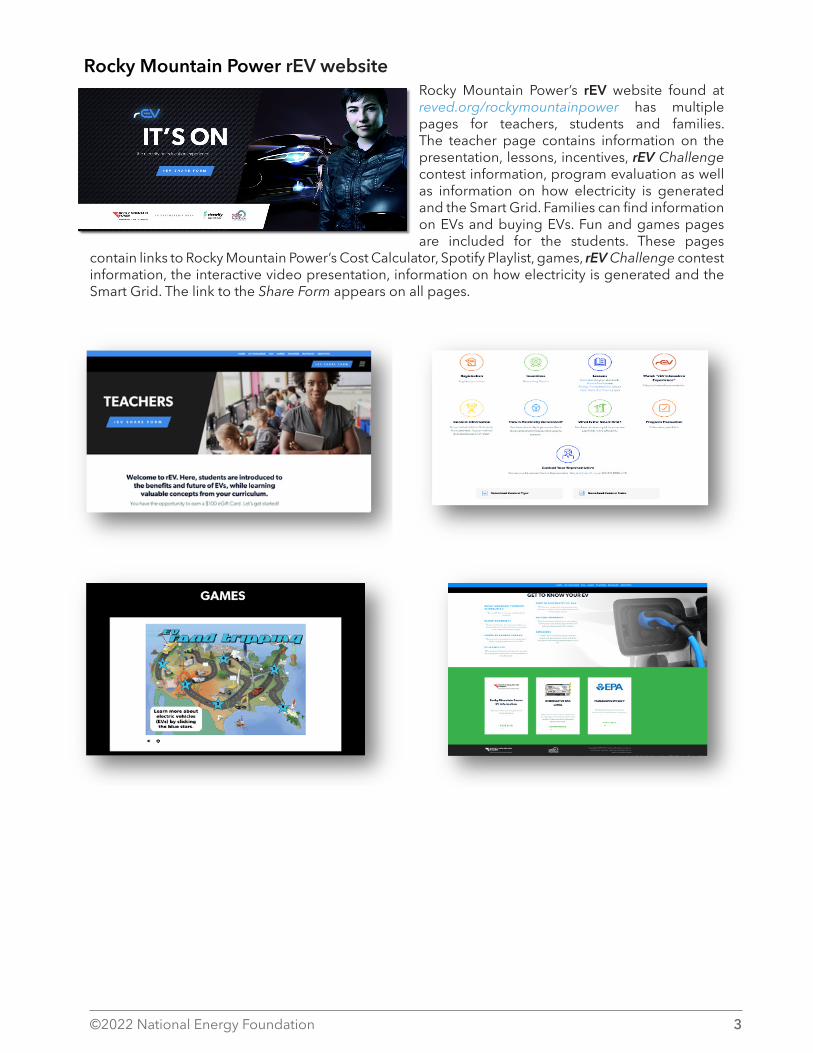
©2022 National Energy Foundation 3
Rocky Mountain Power rEV websiteRocky Mountain Power’s rEV website found at reved.org/rockymountainpower has multiple pages for teachers, students and families. The teacher page contains information on the presentation, lessons, incentives, rEV Challenge contest information, program evaluation as well as information on how electricity is generated and the Smart Grid. Families can find information on EVs and buying EVs. Fun and games pages are included for the students. These pages
contain links to Rocky Mountain Power’s Cost Calculator, Spotify Playlist, games, rEV Challenge contest information, the interactive video presentation, information on how electricity is generated and the Smart Grid. The link to the Share Form appears on all pages.

4 ©2022 National Energy Foundation
rEV PresentationTHe rEV presentation is a uniquely created method of presenting. Through a series of film clips, information on EVs was relayed to the students. Sarah, the central character of the films, was introduced to EVs as a rideshare operator as her friend, Noah, tried to help her gain knowledge on EVs. Varying passengers in Sarah’s car had different views and information on EVs, often dispelling myths. Any of the various paths that the students chose for their story gave the same information.
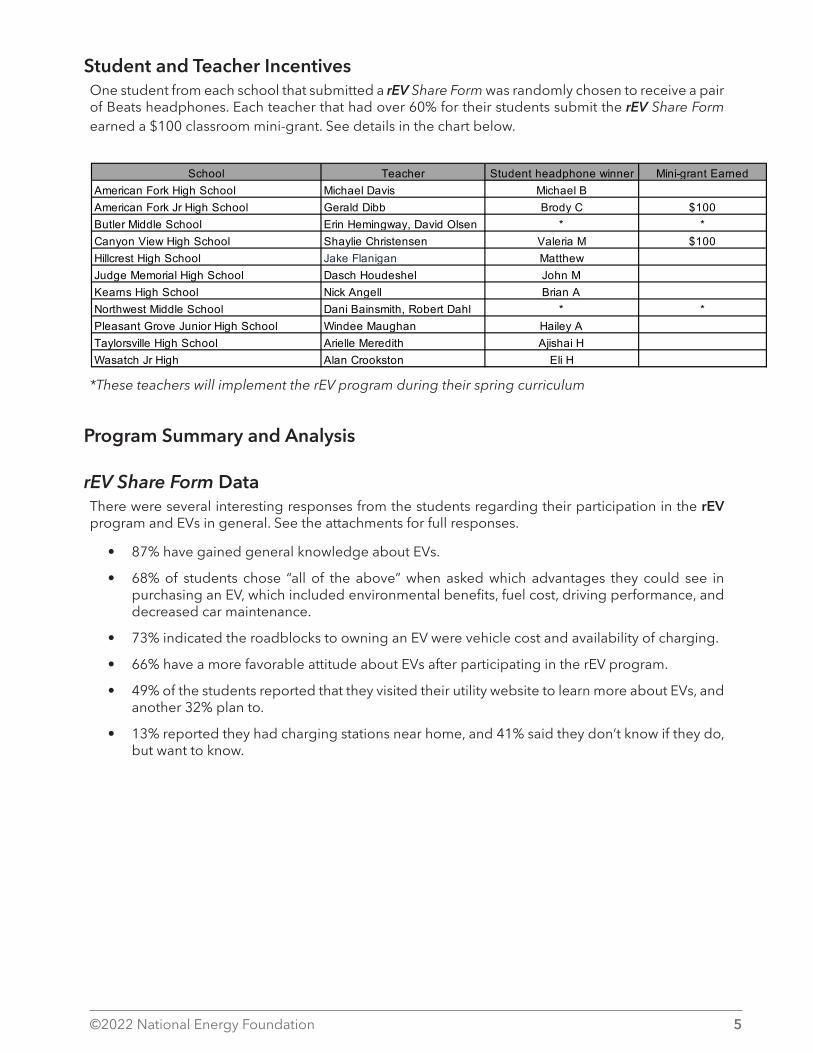
©2022 National Energy Foundation 5
Student and Teacher IncentivesOne student from each school that submitted a rEV Share Form was randomly chosen to receive a pair of Beats headphones. Each teacher that had over 60% for their students submit the rEV Share Form earned a $100 classroom mini-grant. See details in the chart below.
*These teachers will implement the rEV program during their spring curriculum
Program Summary and Analysis
rEV Share Form DataThere were several interesting responses from the students regarding their participation in the rEV program and EVs in general. See the attachments for full responses.
• 87% have gained general knowledge about EVs.
• 68% of students chose “all of the above” when asked which advantages they could see in purchasing an EV, which included environmental benefits, fuel cost, driving performance, and decreased car maintenance.
• 73% indicated the roadblocks to owning an EV were vehicle cost and availability of charging.
• 66% have a more favorable attitude about EVs after participating in the rEV program.
• 49% of the students reported that they visited their utility website to learn more about EVs, and another 32% plan to.
• 13% reported they had charging stations near home, and 41% said they don’t know if they do, but want to know.
School Teacher Student headphone winner Mini-grant EarnedAmerican Fork High School Michael Davis Michael BAmerican Fork Jr High School Gerald Dibb Brody C $100Butler Middle School Erin Hemingway, David Olsen * *Canyon View High School Shaylie Christensen Valeria M $100Hillcrest High School Jake Flanigan Matthew Judge Memorial High School Dasch Houdeshel John M Kearns High School Nick Angell Brian A Northwest Middle School Dani Bainsmith, Robert Dahl * *Pleasant Grove Junior High School Windee Maughan Hailey A Taylorsville High School Arielle Meredith Ajishai HWasatch Jr High Alan Crookston Eli H

6 ©2022 National Energy Foundation
rEV Share Form Student CommentsStudents’ rEV Share Form responses were mostly positive with many giving additional comments. See the attachments for full comments.
• This was very informational and I learned a lot.
• I want to help the environment by getting a car with renewable energy.
• EVs are awesome!
• I liked how the EVs are made because these vehicles don’t produce pollution at all, we just need more charging stations.
• Thank you for trying to make the environment better.
• I think there is a lot of potential in EVs, but from where I live I see very few electric vehicles and charging stations. Maybe this will change in the future, though.
• It was a good program and I know more about EVs.
Program/Teacher Evaluation CommentsTeachers were also asked to evaluate the program after participating. Their comments were mostly positive, with a few suggesting ways to expand the program. Here is a sample of their responses. See the attachments for full comments.
• It was good for the students to hear about EVs and know about them, more than they are just cool looking.
• It was informational and entertaining.
• It’s cool. We’re in an awkward stage of EVs where we’re just getting out of Junior high and it’s becoming more common and cool but there’s still a lot of kids that just don’t think they’re cool. This push for hybrids is great and a better selling point than a full electric car.
• Maybe have the students DO things (like go through the parts of the EV) during the presentation. Discussion is good, but if they can do something where they have to ACT during it, it would be more effective.
• A better format than the movie for me would be system drawings of how EV’s work, how the batteries work, how the electrical system was set up 20 years ago vs today vs your vision for the future. The Smart Grid video and the first stop on the EV Game are in line of what I am thinking about, but for high schoolers, I would love to see these introduce case studies. Students want to see specifics.

©2022 National Energy Foundation 7
rEV Challenge ContestThis unique contest asked students to create a 30-45 second video revealing the benefits and future of EVs to their friends. Students completed a digital entry form and uploaded their video file. There were nine entries from the Rocky Mountain Power service area. Judging took place in January 2022. The winning student and their teacher were from Eagle Valley High School in Gypsum, Colorado. They each received an electric bike of their choice. There was one honorable mention winner from Wasatch Junior High School in the Rocky Mountain service area. See contest flier in the attachments.

8 ©2022 National Energy Foundation
Program Attachments Welcome Letter
Rewarding Results Flier
rEV Challenge Flier
Student Mini-Poster
rEV Share Form Summary Report
Program/Teacher Evaluation Report

©2022 National Energy Foundation 9
AttachmentsWelcome Letter
cultivating energy literacy®
Questions? Contact:
Alison PinnockEducation Service Representative800-616-8326 ext. [email protected]

10 ©2022 National Energy Foundation
Ready, set, rEV!Three easy steps to educate and earn your $100 eGift Card from
Rocky Mountain Power:
Watch the 35 minute “rEV Interactive Experience” on the “Fun” or
“Teachers” page of rEVed.org/rockymountainpower. Students can
watch independently or with you in class. Electric vehicle (EV), natural
resources, electrical generation, smart technology, economics and
history are taught through the story of Sarah. In the “rEV Interactive
Experience,” students choose the direction of the story line during
pivotal parts of the film.
Send home the string bags and the Student Sheets as a reminder to
revisit the website. Students can enter the rEV Challenge, experience
e-learning and use emissions and fuel cost calculators. You can access
EV lessons and resources from the “Teachers” page.
Remind students to complete and submit the rEV Share Form at
rEVed.org/rockymountainpower. When 60% or more of your enrolled
students share feedback, you earn your $100 eGift Card from Rocky
Mountain Power. Your teacher ID from the label on the clear mailer is
helpful, but not necessary.
1.
2.
3.
rEVed.org/rockymountainpower
Now you know, time to go
© 2021 National Energy Foundation

©2022 National Energy Foundation 11
rEVed.org/rockymountainpower
Now you know, time to go
cultivating energy literacy®
Reward Your StudentsAll students receive a string bag. The string
bags will identify them as participants in the
rEV electrifying education experience.
Students who complete the rEV Share Form on
the website are entered into a drawing for a pair
of Beats headphones.
Giving a completion grade or extra credit may
encourage students to complete the form.
Reward YourselfEarn a $100 eGift Card when 60% or more of
your class completes the rEV Share Form by the
due date in your program emails.
Direct your students to the website to fill out
the form online.*
*Offer available for teachers participating in the rEV program. Classes must submit 60% or more of the
rEV Share Forms by the deadline to earn the $100 eGift card from Rocky Mountain Power.
Rewarding Results Flier

12 ©2022 National Energy Foundation
ARE YOU IN? You have learned about electric vehicles (EVs), now it is time to take the rEV Challenge!
Create a 30 – 45 second video that reveals the future of EVs to your friends. Get out your camera (even if it is your phone) to record a compelling message about the benefits of EVs.
Review the rEV Challenge official rules. bit.ly/rEVChallengeRules
Complete the digital entry form (including an electronic signature from your parent/guardian) and upload your video file. bit.ly/rEVChallengeEntry
1
2
3
© 2021 National Energy Foundation
rEV CHALLENGE
Enter by December 1, 2021 for your chance at the grand
prize, an electric bike!
You can win one for your teacher too!
Now you know, time to go rEVed.org /rockymountainpower
rEV Challenge Flier

©2022 National Energy Foundation 13
© 2021 National Energy Foundation • All rights reserved • 4516 South 700 East, Suite 100, Salt Lake City, UT 84107 • nef1.org • 800-616-8326 • This poster is an artist’s representation and is not intended to be a technical illustration.
cultivating energy literacy®
Student Mini-Poster

14 ©2022 National Energy Foundation
Easy Bein’ Green • Potential to fuel with electricity
generated with renewable resources
• Can improve local air quality and reduce carbon
• EVs can store electricity for an efficient grid
• Electricity costs are more stable than gasoline
What Is an EV? • A vehicle powered by electricity
or a combination of electricity and gasoline (HEV)
• The growing technology of tomorrow
• A truck, scooter, self-driving car, mass transit, bus or SUV
Price Is Right • Wide range of decreasing
purchase prices
• New or used
• Fewer moving parts equals less maintenance cost
• EV fueling is generally less expensive than fueling a similar, conventional vehicle
Take Charge • Like plugging in a toaster
• Charge while you shop, at work or home
• Potential to charge when electricity is cheaper
• Up to 250 miles on a single charge
Driving Experience • Smooth and quiet
• Zero to 60 mph possible in under three seconds
• Batteries can last over 200,000 miles
• Locate chargers and plan trips with ease
“rEV Interactive Experience”Watch “rEV Interactive Experience” on the “Fun” page. YOU choose what Sarah does next.
Games and InformationPlay EV games.
Picture Yourself in an EV.
rEVed.org/rockymountainpower
Now you know, time to go rEVed.org/rockymountainpower
Calculate EV SavingsDiscover fuel cost savings and find vehicle incentives at rockymountainpower.net/ev.
rEV ChallengeCreate a 30 – 45 second video to convince your friends to to drive an EV. Entry details and information about the electric bike grand prize are on the program website. Are you in?
How Do You rEV? Show your newfound knowledge with the social media links below. Bust an EV myth, share the Spotify® playlist, or encourage your friends to complete the rEV Share Form.
rEV Share Form Share your voice to earn your reward.
What is the rEV Share Form? It is a way to share insights that shape the future of your community. Visit the form on any page of rEVed.org/rockymountainpower. Two minutes is all it takes to earn a chance at wireless Beats headphones.
© 2021 National Energy Foundation • All rights reserved • 4516 South 700 East, Suite 100 • Salt Lake City, UT 84107 • nef1.org • 800-616-8326
Social icon
Rounded squareOnly use blue and/or white.
For more details check out ourBrand Guidelines.
cultivating energy literacy®

©2022 National Energy Foundation 15
rEV Share Form Summary Report
1. Which of the following do you see as advantages of purchasing an EV?Response Frequency PercentEnvironmental Benefits 69 20%Fuel Cost 30 8%Driving Performance 10 3%Decreased Car Maintenance 4 1%All of the Above 240 68%
Total: 353
2. Which of the following do you see as roadblocks to purchasing an EV?Response Frequency PercentVehicle Cost 114 32%Fuel Cost 12 3%Driving Range 42 12%Availability of Charging 144 41%Other 42 12%
Total: 354
3. Did you visit your utility website to learn about EVs?Response Frequency PercentI Did 172 49%I Plan To 114 32%I Will Not 67 19%
Total: 353
Response Frequency PercentIt Is Much More Favorable 106 30%It Is Somewhat More Favorable 127 36%It Is the Same 99 28%It Is Somewhat Less Favorable 6 2%It Is Much Less Favorable 14 4%
Total: 352
Response Frequency PercentI Know Much More 164 46%I Know Somewhat More 145 41%It Is the Same 44 12%
Total: 353
4. How did your participation in this program affect your attitude about EVs?
5. How did your participation in this program affect your general knowledge about EVs?
rEV ProgramForm Share Summary Report
0% 25% 50% 75%100%
0% 25% 50% 75%100%
0% 25% 50% 75%100%
0% 25% 50% 75%100%
0% 25% 50% 75%100%

16 ©2022 National Energy Foundation
6. Do you have an EV charging structure within one mile of your home?Response Frequency PercentYes 46 13%No 96 27%I Do Not Know but Want to Know 147 41%I Do Not Know and Am Not Interested 66 19%
Total: 355
Response Frequency PercentVery Likely 25 7%Somewhat Likely 77 22%Undecided 123 35%Somewhat Unlikely 60 17%Very Unlikely 68 19%
Total: 353
Response Frequency PercentVery Likely 39 11%Somewhat Likely 91 26%Undecided 118 34%Somewhat Unlikely 44 13%Very Unlikely 60 17%
Total: 352
9. What is your best guess for when your family will purchase its next vehicle?Response Frequency PercentLess than 1 Year 39 11%1 – 2 Years 74 21%2 – 3 Years 61 17%3 – 4 Years 63 18%4 – 5 Years 36 10%More than 5 Years 82 23%
Total: 355
10. Number of Drivers in HouseholdResponse Frequency Percent1 11 3%2 114 32%3 125 35%4 56 16%5+ 47 13%
Total: 353
7. Prior to participation in this program, how likely were you, or yourfamily, to purchase an EV?
8. Having participated in this program, how likely are you, or your family, to purchase an EV in the next three years?
0% 25% 50% 75%100%
0% 25% 50% 75%100%
0% 25% 50% 75%100%
0% 25% 50% 75%100%
0% 25% 50% 75%100%
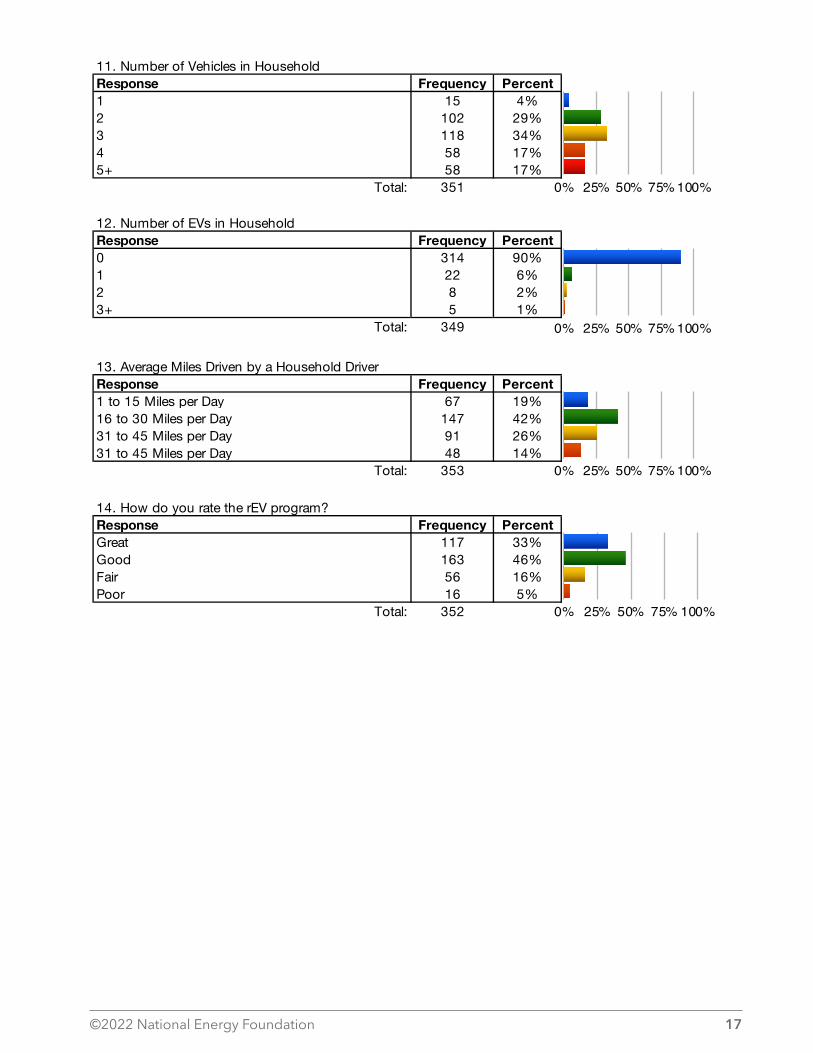
©2022 National Energy Foundation 17
11. Number of Vehicles in HouseholdResponse Frequency Percent1 15 4%2 102 29%3 118 34%4 58 17%5+ 58 17%
Total: 351
12. Number of EVs in HouseholdResponse Frequency Percent0 314 90%1 22 6%2 8 2%3+ 5 1%
Total: 349
13. Average Miles Driven by a Household DriverResponse Frequency Percent1 to 15 Miles per Day 67 19%16 to 30 Miles per Day 147 42%31 to 45 Miles per Day 91 26%31 to 45 Miles per Day 48 14%
Total: 353
14. How do you rate the rEV program?Response Frequency PercentGreat 117 33%Good 163 46%Fair 56 16%Poor 16 5%
Total: 352
0% 25% 50% 75%100%
0% 25% 50% 75%100%
0% 25% 50% 75%100%
0% 25% 50% 75% 100%

18 ©2022 National Energy Foundation
Teacher Evaluations
Timestamp 11/22/21 13:59 11/22/21 17:00 12/13/21 12:37
Email Address [email protected] [email protected] [email protected]
Name Arielle Meredith Michael Davis Dasch Houdeshel
School Taylorsville High School American Fork High Judge Memorial High School
City, State Taylorsville, UT American Fork, UT Salt Lake City, UTPlease share your impression of rEV. [Teaching materials] Good Good GoodPlease share your impression of rEV. [Student engagement] Fair Fair Good
Please share your impression of rEV. [Content] Good Fair ExcellentPlease share your impression of rEV. [Program overall] Good Fair GoodPlease share your impression of rEV. [Flexible COVID options] Good Good Excellent
What additional activities did you, or will you, use from the website?
Games and Lesson plans Some of the extras talking about the energy and EV stuff
A better format than the movie for me would be system drawings of how EV's work, how the batteries work, how the electrical system was set up 20 years ago vs today vs your vision for the future. The Smart Grid video and the first stop on the EV Game are in line of what I am thinking about, but for high schoolers, I would love to see these introduce case studies. Students want to see specifics.
What would you tell other teachers about the program? Informational and entertaining
Probably just have the kids watch the video on their own. We did it as a class and half of my classes had a hard time watching the video's acting and overselling EVs
The overall concept is good, but I was not a fan of the dramatization.
What would you like us to tell rEV program sponsors about the program?
It was good for the students to hear about EVs and know about them, more than they are just cool looking
It's cool. We're in an awkward stage of EVs where we're just getting out of Junior high and it's becoming more common and cool but there's still a lot of kids that just don't think they're cool. This push for hybrids is great and a better selling point than a full electric car.
We want more detailed systems diagrams, graphs, and infographics - what are the actual power uses of specific cars at different speeds? What triggers a hybrid to switch between electrical and gas? Give us reviews of actual things.
Where did your students participate with the presentation? (in school, virtual from home, etc.) In school
Both in class and online for those not in attendance In my class
Additional comments and recommendations:
The "choose your own destiny" wasn't much of a choose your own since it still found ways to bring it back to the other side. Which is fine but kids just wanted to screw with the destiny and few wanted to follow the correct path. Which you probably foresaw and that's why it always drove home the point each time anyway.
Look at the "data points" from HHMI - they do a really great job of explaining a particular data point with an infographic and supporting materials. Allowing students to choose a bunch of infographics to discuss would be more engaging, beneficial, and flexible.
Was the electronic gift card a good incentive to participate in the program? Yes Yes Yes
Did a presenter visit your school? No No
Program Teacher Evaluation Report

©2022 National Energy Foundation 19
Student Open-ended Comments
Student CommentsAsk drivers?CarDe LandaDo farts work a fuelEVs are awesome!!!!!!EVs are cool, and I want one but I don't know when I will get oneEVs are pretty cool, glad I know a bit more about them.EVs are sickGive me head phones nowI don't like electric cars, nor the future of technology. I would rather have none then what we're going into.I go to Kearns. Go Cougars!!!I just don´t really like EV´s. I just like the sound of actual cars.I liked how the EVs are made becuase these vehicles don't produce pollution at all, we just need more charging stations.I love EVs but my family just got 2 new cars so it will be awhileI love music and would love new headphonesI love the EV!
I personally would love to purchase a EV car but not likely in my household.I really appreciate how informative this was.I really dislike EV's they are not goodI really like EV's because we already have oneI really want an EV! This program is very informative.
I think that EV will change to whole preview and perspective of cars. Its very interesting too.I think that EVs are super cool and everyone who can buy them shouldI think the program was very interesting and helpful to understand.
I think there is a lot of potential in EVs, but from where I live I see very few electric vehicles and charging stations. Maybe this will change in the future though.I want to help the environment by getting a car with renewable energyIf there was an hand on "battery" activity to do with students that would be greatIt is coolIt is okIt was a good program and I know more about EV'sIts midjohnsonMake it more excitingMy family has a 2012 Prius (out of the 4 cars we own, we use it the most, mostly because it has good miles to gallon) and I don't know the average miles per day driven by my family, so I just guessed, but that seemed to be the most logical answer for it, but it might be more or less. (The Prius is a hybrid, BTW)My family wants an EV but a lot of ESUVs (my family only fits in an SUV) that are outside our price range.My last pair of headphones just broke recently and really need some badMy sibling is close to driving so idkEVs are very cool and I think it would be cool to drive one and learn all the new and cool thingsThank U for trying to make the environment betterThank You!The connection was really bad. I tried to do the activity but it kicked me out and the video wouldn't play.The more hands on activities the better.There's many pro's to this vehicleThis video was really garbage, please work on the acting and maybe I'll consider buying something. btw youngboy betterThis was very informational and I learned a lotWatching from Cedar City, Utah!!We have a hybrid and we really like it. It is super reliable, it uses electricity and then gasYou need to do a good truck then I will get oneYou're too biased
Page 3.0
STEP Project Report Period Ended: December 31, 2021
STEP Project Name: Co-firing Tests of Woody-waste (biomass) Materials in Hunter Unit 3
Project Objective:
This project was proposed to conduct co-firing tests of two different types of processed woody-waste (biomass) to be fired in pilot scale tests and in utility scale tests at the Hunter Unit 3 boiler. The target heat input from woody waste material was between 10% to 20% of the required total fuel input of the Unit 3 boiler, with coal making up the remainder. The processed woody waste was anticipated to consist of wood resources including scrap and waste material from logging operations and wood processing plants. A torrefied product and a steam exploded product are the two types of processed woody waste that were to be tested. The primary objective of these tests was to determine whether these processed biomass fuels can be effectively used as “drop-in” fuel replacing a portion of the coal that is burned. In addition to displacing coal and its attendant CO2 and NOx emissions, using these processed woody waste materials was expected to have the benefit of minimizing particulate matter emissions associated with either controlled or uncontrolled burns of collected forest materials. These tests were proposed to be a mechanism to further evaluate and demonstrate these processed woody waste technologies. Engineering professors from the University of Utah’s Combustion Laboratory and from Brigham Young University were contracted to be the consultants responsible for planning, conducting, and reporting the results of the tests. In Docket No. 16-035-36, the Commission approved the Company’s request to increase the original funding of $789,873 for the Co-Fired Woody Waste project by $748,980, utilizing funds from the canceled Alternative NOx project, for total project funding of $1,538,853. With these additional funds, the Company expanded the scope to substantially increase the amount of processed biomass material from both woody waste providers to extend the number of hours in the test burn and to increase the measurements taken during the test to gain a better understanding of boiler operation during the co-firing. Project Progress:
2017: PacifiCorp’s consulting contract with the University of Utah was executed with Brigham Young University as a subcontractor. Amaron and AERP (formerly AEG) were selected to process and provide torrefied and steam biomass respectively. A wood processing company in Salt Lake County was selected to provide feedstock to both vendors after it was determined that harvest and processing of deadfall material from forest areas

Page 3.1
specifically for the biomass project would add considerable cost and schedule risk to the project.
2018: Amaron and AERP worked to bring their processing facilities in Salt Lake City up to full
production capability. Successful pilot scale co-firing of the Amaron and AERP processed biomass pellets was conducted in November 2018. Amaron began producing material and delivering it to the Hunter Plant. PacifiCorp received approval from the Public Service Commission of Utah for an expanded scope for the biomass co-firing test, increasing the budget by $748,980.
2019: With the additional funds, the Company expanded the scope to substantially increase the
amount of processed biomass material from both woody waste providers to extend the number of hours in the test burn and to increase the measurements taken during the test to gain a better understanding of boiler operation during the co-firing.
Amaron provided a total of 724 tons of torrefied biomass material to the Hunter Plant. The test burn of the torrefied material was conducted in Unit 3 of the Hunter Plant on August 22nd and August 23rd of 2019 and the consultants provided a review of preliminary results of the torrefied test burn on December 5, 2019. The test used a blend of 20% biomass material and 80% coal over a period of 12 hours. The biomass fuel performed as planned in the test and produced lower concentrations of NOx and SO2 as expected. AERP, the supplier of steam exploded biomass material, moved their production facility to North Carolina. PacifiCorp and AERP entered discussions to re-negotiate the supply contract for the steam exploded biomass material with a delivery schedule in the second half of 2020.
2020: PacifiCorp and AERP re-negotiated the supply contract and set a delivery deadline of June
11, 2021 for up to 900 tons of steam exploded biomass material to be delivered to Hunter Plant. AERP made plans to build a second production facility in Maine. The test burn of the steam exploded material in Unit 3 of the Hunter Plant was scheduled to occur the week of June 14, 2021.
2021: AERP was not able to meet the June 14, 2021 production schedule in the supply contract
they had with PacifiCorp due to difficulties processing and pelletizing the biomass to meet PacifiCorp’s technical requirements. PacifiCorp and AERP rescheduled the test burn at Hunter for the fall of 2021, but an equipment failure at AERP’s processing facility in Maine halted all production. The halt in production made it impossible to schedule the utility scale test burn and analysis by the end of 2021. AERP delivered 10 tons of processed biomass material to the Hunter Plant in June 2021, which was used to conduct a pilot scale blend ratio test to study the milling characteristics
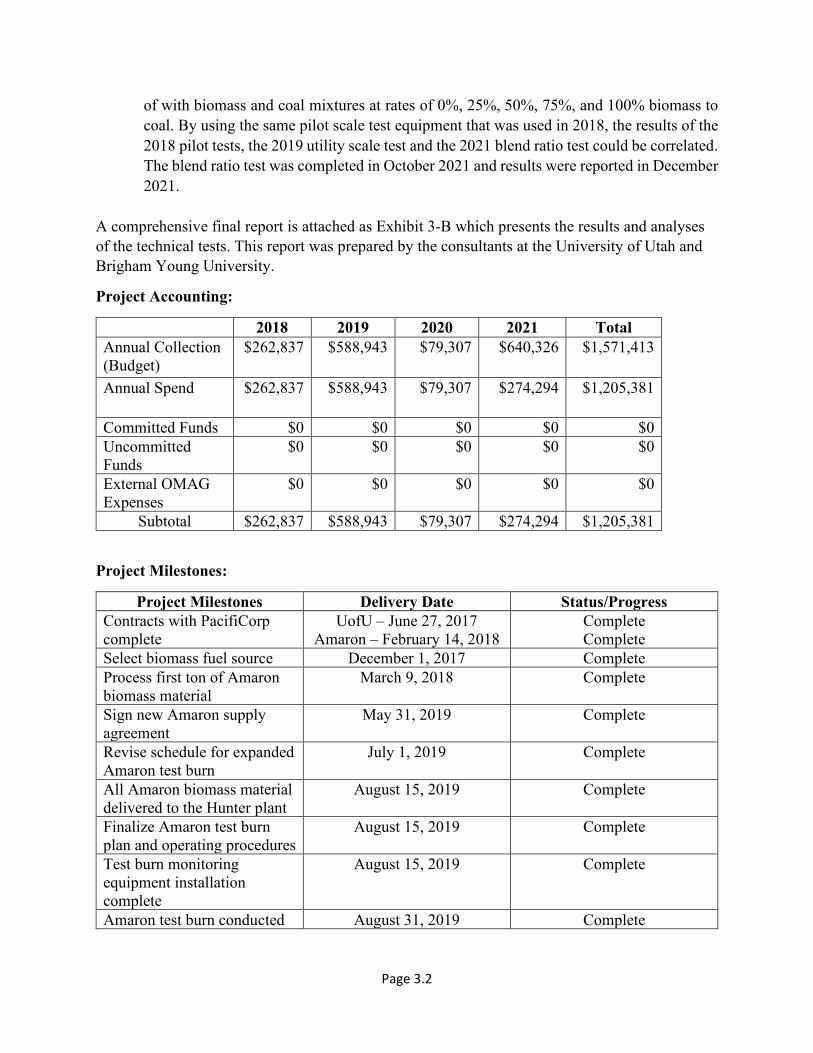
Page 3.2
of with biomass and coal mixtures at rates of 0%, 25%, 50%, 75%, and 100% biomass to coal. By using the same pilot scale test equipment that was used in 2018, the results of the 2018 pilot tests, the 2019 utility scale test and the 2021 blend ratio test could be correlated. The blend ratio test was completed in October 2021 and results were reported in December 2021.
A comprehensive final report is attached as Exhibit 3-B which presents the results and analyses of the technical tests. This report was prepared by the consultants at the University of Utah and Brigham Young University.
Project Accounting:
2018 2019 2020 2021 Total Annual Collection (Budget)
$262,837 $588,943 $79,307 $640,326 $1,571,413
Annual Spend $262,837 $588,943 $79,307 $274,294
$1,205,381
Committed Funds $0 $0 $0 $0 $0 Uncommitted Funds
$0 $0 $0 $0 $0
External OMAG Expenses
$0 $0 $0 $0 $0
Subtotal $262,837 $588,943 $79,307 $274,294 $1,205,381
Project Milestones:
Project Milestones Delivery Date Status/Progress Contracts with PacifiCorp complete
UofU – June 27, 2017 Amaron – February 14, 2018
Complete Complete
Select biomass fuel source December 1, 2017 Complete Process first ton of Amaron biomass material
March 9, 2018
Complete
Sign new Amaron supply agreement
May 31, 2019 Complete
Revise schedule for expanded Amaron test burn
July 1, 2019 Complete
All Amaron biomass material delivered to the Hunter plant
August 15, 2019 Complete
Finalize Amaron test burn plan and operating procedures
August 15, 2019 Complete
Test burn monitoring equipment installation complete
August 15, 2019 Complete
Amaron test burn conducted August 31, 2019 Complete
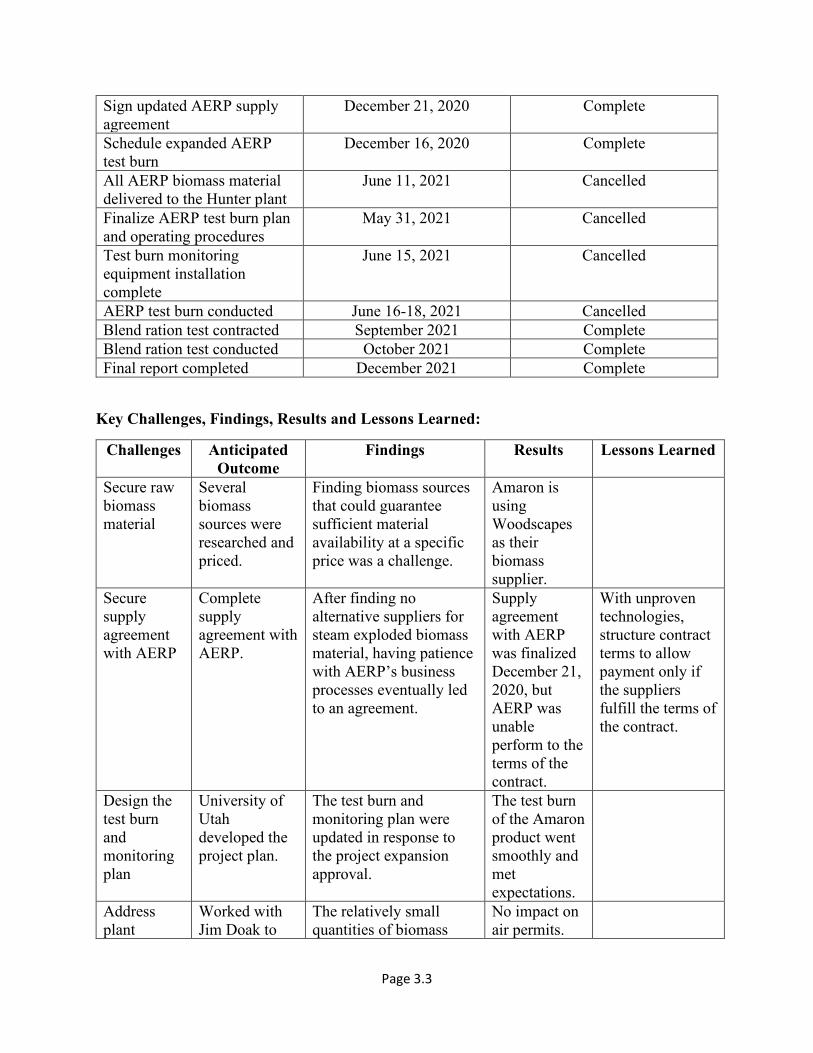
Page 3.3
Sign updated AERP supply agreement
December 21, 2020 Complete
Schedule expanded AERP test burn
December 16, 2020 Complete
All AERP biomass material delivered to the Hunter plant
June 11, 2021 Cancelled
Finalize AERP test burn plan and operating procedures
May 31, 2021 Cancelled
Test burn monitoring equipment installation complete
June 15, 2021 Cancelled
AERP test burn conducted June 16-18, 2021 Cancelled Blend ration test contracted September 2021 Complete Blend ration test conducted October 2021 Complete Final report completed December 2021 Complete
Key Challenges, Findings, Results and Lessons Learned:
Challenges Anticipated Outcome
Findings Results Lessons Learned
Secure raw biomass material
Several biomass sources were researched and priced.
Finding biomass sources that could guarantee sufficient material availability at a specific price was a challenge.
Amaron is using Woodscapes as their biomass supplier.
Secure supply agreement with AERP
Complete supply agreement with AERP.
After finding no alternative suppliers for steam exploded biomass material, having patience with AERP’s business processes eventually led to an agreement.
Supply agreement with AERP was finalized December 21, 2020, but AERP was unable perform to the terms of the contract.
With unproven technologies, structure contract terms to allow payment only if the suppliers fulfill the terms of the contract.
Design the test burn and monitoring plan
University of Utah developed the project plan.
The test burn and monitoring plan were updated in response to the project expansion approval.
The test burn of the Amaron product went smoothly and met expectations.
Address plant
Worked with Jim Doak to
The relatively small quantities of biomass
No impact on air permits.

Page 3.4
operation or air permit concerns
notify the State of Utah about the project.
material do not impact the air permit.
Program Benefits:
The project has created an option to use forest waste products to generate electricity without requiring construction of new facilities or expensive equipment retrofits at existing coal plants. The 2019 utility scale test burn proved torrefied biomass could be burned in a utility scale coal plant. The 2017 and 2021 pilot scale test burns allow industry to compare torrefied biomass with steam exploded biomass in milling and test burn scenarios and review the possibilities of using larger ratios of drop-in biomass fuel in utility scale coal facilities. The ability of an existing coal plant to supplement its coal fuel with biomass, when biomass is available, eliminates the supply chain problem of needing to have continuous biomass resources available to fuel a biomass-specific generation resource. Burning biomass in a controlled environment also provides air quality benefits compared to open burns of forest material.
Potential future applications for similar projects:
The results of this project could be used in future initiatives to improve forest health and reduce emission from forest fires and open burn piles. The project results could also inform future treatment processes for biomass material and firing parameters if biomass is burned in other coal plants.
Attachments:
• Exhibit 3-A: Executive Summary: Technical Assistance in Support of Biomass Co-firing Demonstration
• Exhibit 3-B: Technical Assistance in Support of Biomass Co-firing Demonstration (note – report is voluminous)

Exhibit 3-A Executive Summary Technical Assistance
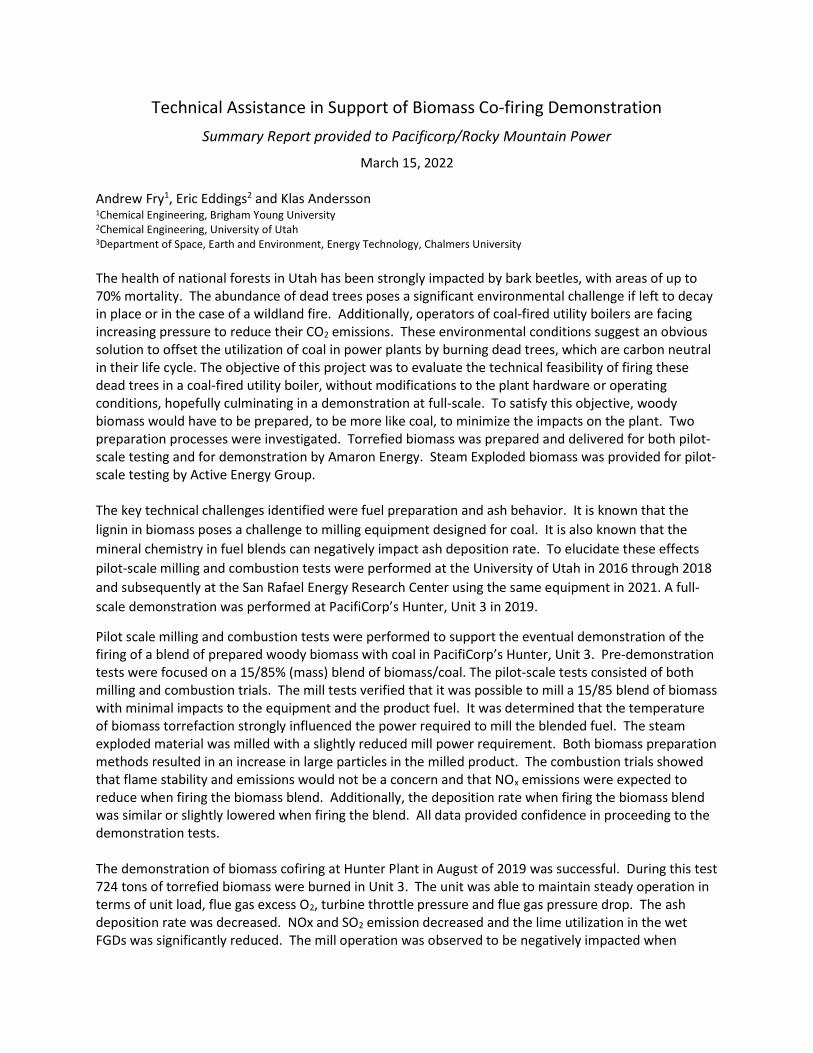
Technical Assistance in Support of Biomass Co-firing Demonstration Summary Report provided to Pacificorp/Rocky Mountain Power
March 15, 2022 Andrew Fry1, Eric Eddings2 and Klas Andersson 1Chemical Engineering, Brigham Young University 2Chemical Engineering, University of Utah 3Department of Space, Earth and Environment, Energy Technology, Chalmers University The health of national forests in Utah has been strongly impacted by bark beetles, with areas of up to 70% mortality. The abundance of dead trees poses a significant environmental challenge if left to decay in place or in the case of a wildland fire. Additionally, operators of coal-fired utility boilers are facing increasing pressure to reduce their CO2 emissions. These environmental conditions suggest an obvious solution to offset the utilization of coal in power plants by burning dead trees, which are carbon neutral in their life cycle. The objective of this project was to evaluate the technical feasibility of firing these dead trees in a coal-fired utility boiler, without modifications to the plant hardware or operating conditions, hopefully culminating in a demonstration at full-scale. To satisfy this objective, woody biomass would have to be prepared, to be more like coal, to minimize the impacts on the plant. Two preparation processes were investigated. Torrefied biomass was prepared and delivered for both pilot-scale testing and for demonstration by Amaron Energy. Steam Exploded biomass was provided for pilot-scale testing by Active Energy Group. The key technical challenges identified were fuel preparation and ash behavior. It is known that the lignin in biomass poses a challenge to milling equipment designed for coal. It is also known that the mineral chemistry in fuel blends can negatively impact ash deposition rate. To elucidate these effects pilot-scale milling and combustion tests were performed at the University of Utah in 2016 through 2018 and subsequently at the San Rafael Energy Research Center using the same equipment in 2021. A full-scale demonstration was performed at PacifiCorp’s Hunter, Unit 3 in 2019.
Pilot scale milling and combustion tests were performed to support the eventual demonstration of the firing of a blend of prepared woody biomass with coal in PacifiCorp’s Hunter, Unit 3. Pre-demonstration tests were focused on a 15/85% (mass) blend of biomass/coal. The pilot-scale tests consisted of both milling and combustion trials. The mill tests verified that it was possible to mill a 15/85 blend of biomass with minimal impacts to the equipment and the product fuel. It was determined that the temperature of biomass torrefaction strongly influenced the power required to mill the blended fuel. The steam exploded material was milled with a slightly reduced mill power requirement. Both biomass preparation methods resulted in an increase in large particles in the milled product. The combustion trials showed that flame stability and emissions would not be a concern and that NOx emissions were expected to reduce when firing the biomass blend. Additionally, the deposition rate when firing the biomass blend was similar or slightly lowered when firing the blend. All data provided confidence in proceeding to the demonstration tests. The demonstration of biomass cofiring at Hunter Plant in August of 2019 was successful. During this test 724 tons of torrefied biomass were burned in Unit 3. The unit was able to maintain steady operation in terms of unit load, flue gas excess O2, turbine throttle pressure and flue gas pressure drop. The ash deposition rate was decreased. NOx and SO2 emission decreased and the lime utilization in the wet FGDs was significantly reduced. The mill operation was observed to be negatively impacted when

milling the biomass blend in terms of power consumption and reject rate including fuel material. This adverse effect is likely the result of 1) firing the torrefied biomass at a ratio higher than was tested in the pilot-scale trials, and 2) possibly control of the torrefaction process at the required temperature and residence time, which was shown during the pilot-scale milling trials to be critical parameters during fuel preparation for mill performance. Originally, a separate demonstration test was planned to fire the steam exploded biomass. This test was not performed because the fuel supplier was not able to provide enough material for demonstration testing. As an alternative, additional pilot-scale testing was performed to investigate the impact of steam exploded biomass blend ratio on milling and combustion performance. This test was performed in October of 2021. A range of blending ratios from pure coal to pure biomass were investigated. The milling tests showed that the there was a linear increase in mill power requirement with increasing biomass content of the blend. However, after adjusting the roller spacing closer to the bowl, even pure biomass was milled with no impact on mill power requirement. Combustion testing showed that biomass decreased the intensity of the flame in the near burner region. The deposition rate decreased as a function of biomass content with no synergistic effects of blending with coal.

Exhibit 3-B Technical Assistance in Support of Biomass Co-firing Demonstration

THIS ATTACHMENT IS VOLUMINOUS AND PROVIDED SEPARATELY
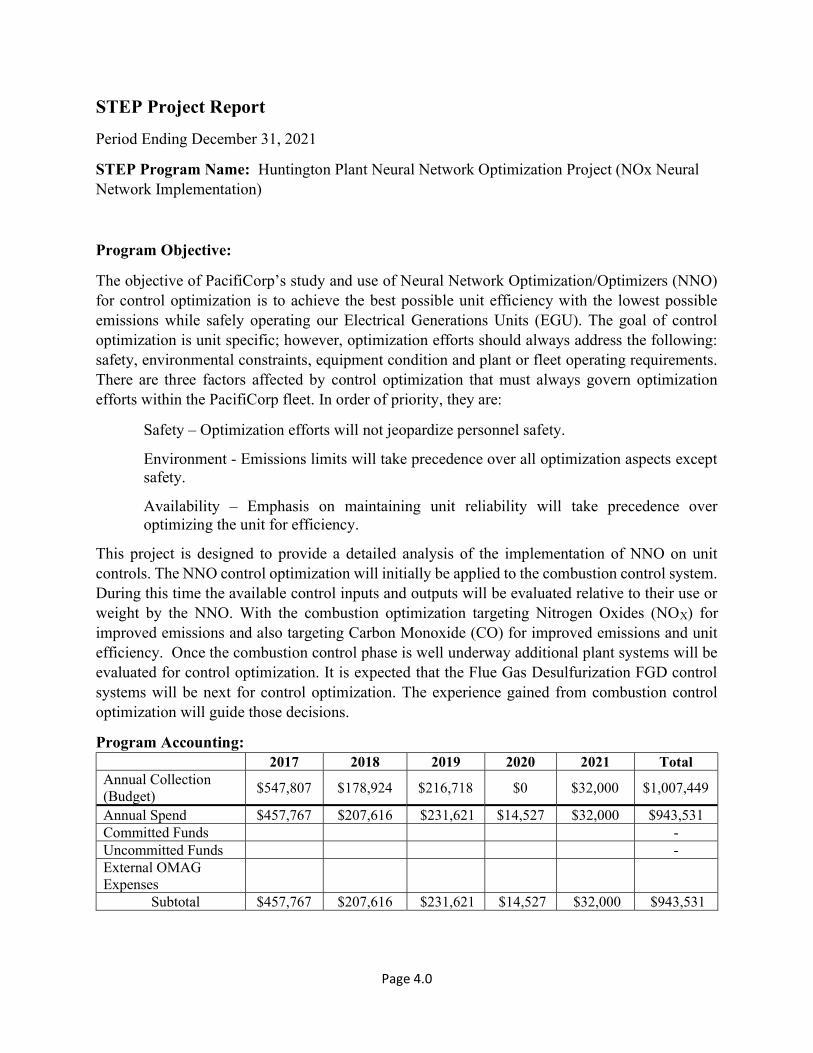
Page 4.0
STEP Project Report
Period Ending December 31, 2021
STEP Program Name: Huntington Plant Neural Network Optimization Project (NOx Neural Network Implementation)
Program Objective:
The objective of PacifiCorp’s study and use of Neural Network Optimization/Optimizers (NNO) for control optimization is to achieve the best possible unit efficiency with the lowest possible emissions while safely operating our Electrical Generations Units (EGU). The goal of control optimization is unit specific; however, optimization efforts should always address the following: safety, environmental constraints, equipment condition and plant or fleet operating requirements. There are three factors affected by control optimization that must always govern optimization efforts within the PacifiCorp fleet. In order of priority, they are:
Safety – Optimization efforts will not jeopardize personnel safety.
Environment - Emissions limits will take precedence over all optimization aspects except safety.
Availability – Emphasis on maintaining unit reliability will take precedence over optimizing the unit for efficiency.
This project is designed to provide a detailed analysis of the implementation of NNO on unit controls. The NNO control optimization will initially be applied to the combustion control system. During this time the available control inputs and outputs will be evaluated relative to their use or weight by the NNO. With the combustion optimization targeting Nitrogen Oxides (NOX) for improved emissions and also targeting Carbon Monoxide (CO) for improved emissions and unit efficiency. Once the combustion control phase is well underway additional plant systems will be evaluated for control optimization. It is expected that the Flue Gas Desulfurization FGD control systems will be next for control optimization. The experience gained from combustion control optimization will guide those decisions.
Program Accounting: 2017 2018 2019 2020 2021 Total Annual Collection (Budget)
$547,807 $178,924 $216,718 $0 $32,000 $1,007,449
Annual Spend $457,767 $207,616 $231,621 $14,527 $32,000 $943,531 Committed Funds - Uncommitted Funds - External OMAG Expenses
Subtotal $457,767 $207,616 $231,621 $14,527 $32,000 $943,531
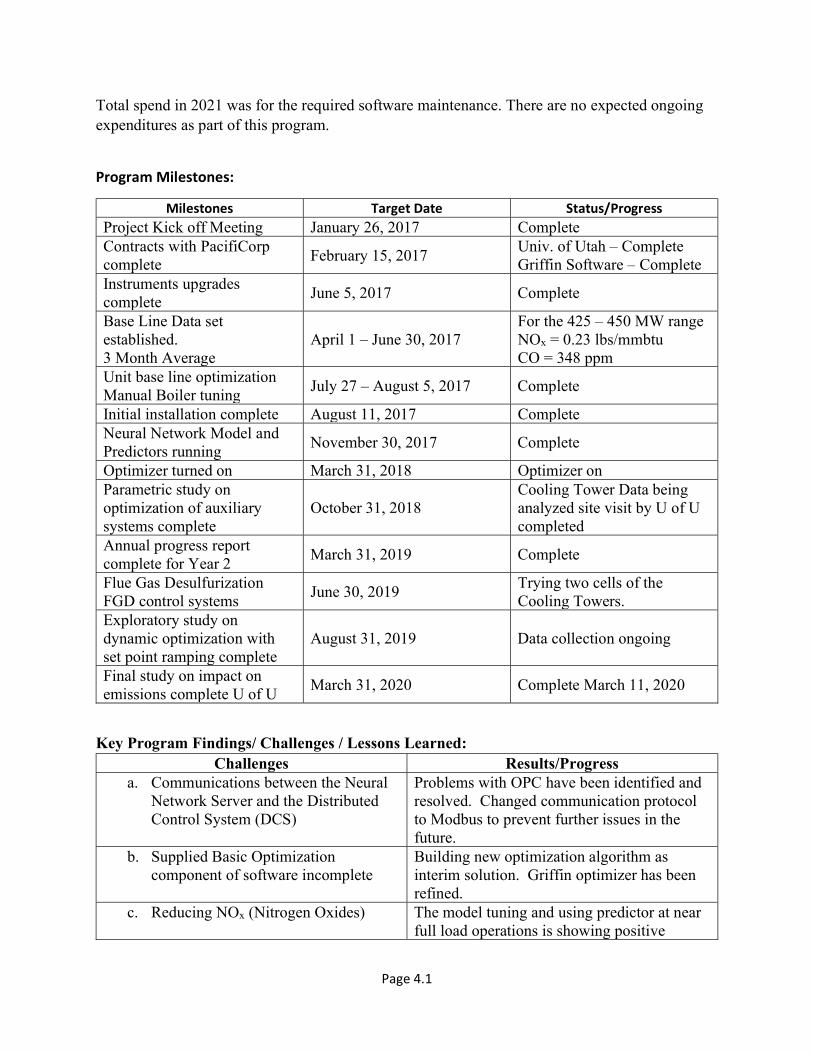
Page 4.1
Total spend in 2021 was for the required software maintenance. There are no expected ongoing expenditures as part of this program.
Program Milestones:
Milestones Target Date Status/Progress Project Kick off Meeting January 26, 2017 Complete Contracts with PacifiCorp complete
February 15, 2017 Univ. of Utah – Complete Griffin Software – Complete
Instruments upgrades complete
June 5, 2017 Complete
Base Line Data set established. 3 Month Average
April 1 – June 30, 2017 For the 425 – 450 MW range NOx = 0.23 lbs/mmbtu CO = 348 ppm
Unit base line optimization Manual Boiler tuning
July 27 – August 5, 2017 Complete
Initial installation complete August 11, 2017 Complete Neural Network Model and Predictors running
November 30, 2017 Complete
Optimizer turned on March 31, 2018 Optimizer on Parametric study on optimization of auxiliary systems complete
October 31, 2018 Cooling Tower Data being analyzed site visit by U of U completed
Annual progress report complete for Year 2
March 31, 2019 Complete
Flue Gas Desulfurization FGD control systems
June 30, 2019 Trying two cells of the Cooling Towers.
Exploratory study on dynamic optimization with set point ramping complete
August 31, 2019 Data collection ongoing
Final study on impact on emissions complete U of U
March 31, 2020 Complete March 11, 2020
Key Program Findings/ Challenges / Lessons Learned: Challenges Results/Progress
a. Communications between the Neural Network Server and the Distributed Control System (DCS)
Problems with OPC have been identified and resolved. Changed communication protocol to Modbus to prevent further issues in the future.
b. Supplied Basic Optimization component of software incomplete
Building new optimization algorithm as interim solution. Griffin optimizer has been refined.
c. Reducing NOx (Nitrogen Oxides) The model tuning and using predictor at near full load operations is showing positive
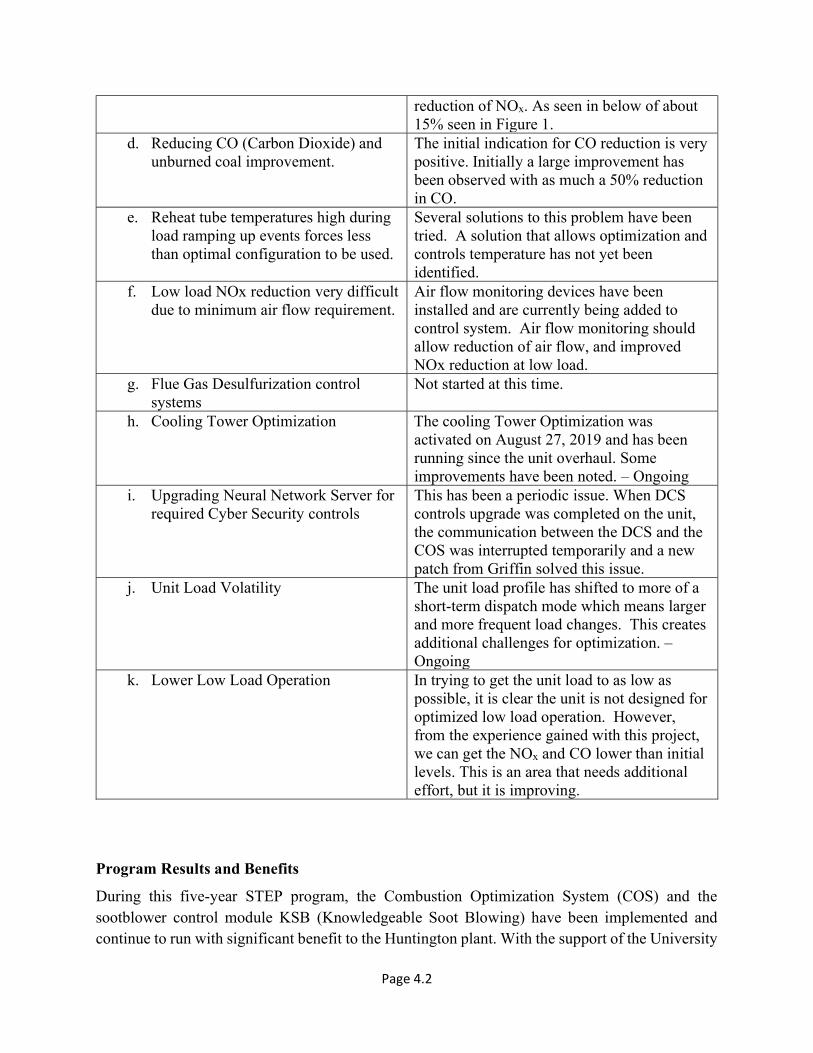
Page 4.2
reduction of NOx. As seen in below of about 15% seen in Figure 1.
d. Reducing CO (Carbon Dioxide) and unburned coal improvement.
The initial indication for CO reduction is very positive. Initially a large improvement has been observed with as much a 50% reduction in CO.
e. Reheat tube temperatures high during load ramping up events forces less than optimal configuration to be used.
Several solutions to this problem have been tried. A solution that allows optimization and controls temperature has not yet been identified.
f. Low load NOx reduction very difficult due to minimum air flow requirement.
Air flow monitoring devices have been installed and are currently being added to control system. Air flow monitoring should allow reduction of air flow, and improved NOx reduction at low load.
g. Flue Gas Desulfurization control systems
Not started at this time.
h. Cooling Tower Optimization The cooling Tower Optimization was activated on August 27, 2019 and has been running since the unit overhaul. Some improvements have been noted. – Ongoing
i. Upgrading Neural Network Server for required Cyber Security controls
This has been a periodic issue. When DCS controls upgrade was completed on the unit, the communication between the DCS and the COS was interrupted temporarily and a new patch from Griffin solved this issue.
j. Unit Load Volatility The unit load profile has shifted to more of a short-term dispatch mode which means larger and more frequent load changes. This creates additional challenges for optimization. – Ongoing
k. Lower Low Load Operation In trying to get the unit load to as low as possible, it is clear the unit is not designed for optimized low load operation. However, from the experience gained with this project, we can get the NOx and CO lower than initial levels. This is an area that needs additional effort, but it is improving.
Program Results and Benefits
During this five-year STEP program, the Combustion Optimization System (COS) and the sootblower control module KSB (Knowledgeable Soot Blowing) have been implemented and continue to run with significant benefit to the Huntington plant. With the support of the University

Page 4.3
of Utah and the Neural Network supplier, Griffin Open Systems, the NNO systems have achieved the program objectives
The baseline data measurements were taken from April 2017 through June 2017. For this period the average unit load was 282 MW with 0.230 #/mmbtu average NOX emissions and 348 CO ppm average CO emissions. For the last six months of the project, July through December 2021, the average unit load was 430 MW with 0.208 #/mmbtu average NOX emissions and 159 CO ppm average CO emissions. With both NOX and CO varying by load it was important to compare results with various loads. For the comparison periods noted above, the average NOX improvement over all loads was 15%, and the average CO improvement was 19% with over a 40% improvement at upper loads, as seen in figure 1 and figure 2 below.
Figure 1
0%
5%
10%
15%
20%
25%
30%
35%
40%
45%
0.00
0.05
0.10
0.15
0.20
0.25
0.30
0.35
0.40
NO
x #/
mm
Btu
NOX BenefitBaseline NOx '21 NOx % NOx improvement

Page 4.4
Figure 2
Since NOX and CO do vary by load, it was important to select a consistent load range in order to evaluate results over a given time period. For comparison purposes, the consistent load range of 425-450 MW was chosen. This is 90 – 95% of full load. Since this three-month baseline date was in the spring, loads were typically lower. As seen in charts 3 & 4 in appendix 1, the unit was in the upper load range of 425-450 MW most every day but at that only in this range a total of 10% of the time and only 154 of the 183 days was it in this range. The monthly average load was 429 MW. The unit was at or near full load (greater than 450 MW), 56% of the six months (see chart 3 in appendix 1).
The comparison numbers for the 425-450 MW load range show a reduction in the average NOX from 0.230 to 0.205 #/mmBtu or an 11% improvement. The CO from the baseline was 348 ppm and improved down to 156 ppm during the last six months of 2021. Both parameters indicate very good success over a six-month period which should see continued results going forward.
The KSB system has grown in usability and provides consistent operating practice even with the different operating styles of the crews. In some areas of the boiler, it has led to increased sootblower operating and others it has reduced the number of sootblower cycles. With the KSB system, the steam temperature control has improved. Overall, the sootblower operation has increased slightly, and more importantly, the best locations have been identified for when operators need to improve both NOX and steam temperatures.
The unit load volatility has played a significant role in the ability to optimize. With the unit load swinging it is more of a challenge for the system to optimize and this is true whether it is a neural network or and combustion expert. This variability was measured with a Volatility Factor. For
0%
10%
20%
30%
40%
50%
60%
0
50
100
150
200
250
300
350
400
CO Benefit
Baseline CO '21 CO % CO improvement

Page 4.5
the baseline test period, the unit load volatility factor averaged 29% from April through June 2017. In comparison, the last six months of 2021 the volatility average was 25%. However, during the five-year program there were months when the average volatility factor had a high of 44%. This volatility factor for the six months can be seen in Chart 5.
For tracking proposes CO2 was reviewed. However, since the potential for CO2 reductions was not identified in the original scope of this STEP project, no analysis of CO2 has been done. The baseline average CO2 at 425-450 MW load range was 11.14%. The last six months of 2021 at the 425-450 MW load range CO2 was 10.73%.
The acceptance of the system by the operators was a key factor and went through several iterations before the operators really accepted the system and realized there was a benefit. Part of the benefit was making their job easier. The system utilization is best when the unit is running in “normal” operating conditions. When the unit swings or gets a run back due to either equipment issues or system conditions the operators tend to turn off both the COS and the KSB. For the last six months in 2021 the average utilization rate or time on was 80% for the COS and 58% for the KSB. This indicates good “buy-in” by the operators which is key to the success of this type of optimization system.
Potential Future Applications
With the positive results, Huntington has implemented a similar Combustion and Sootblower Optimization on Unit 1. This has been a very successful project. A similar system is now installed on Hunter units 1 & 2 with similar results.
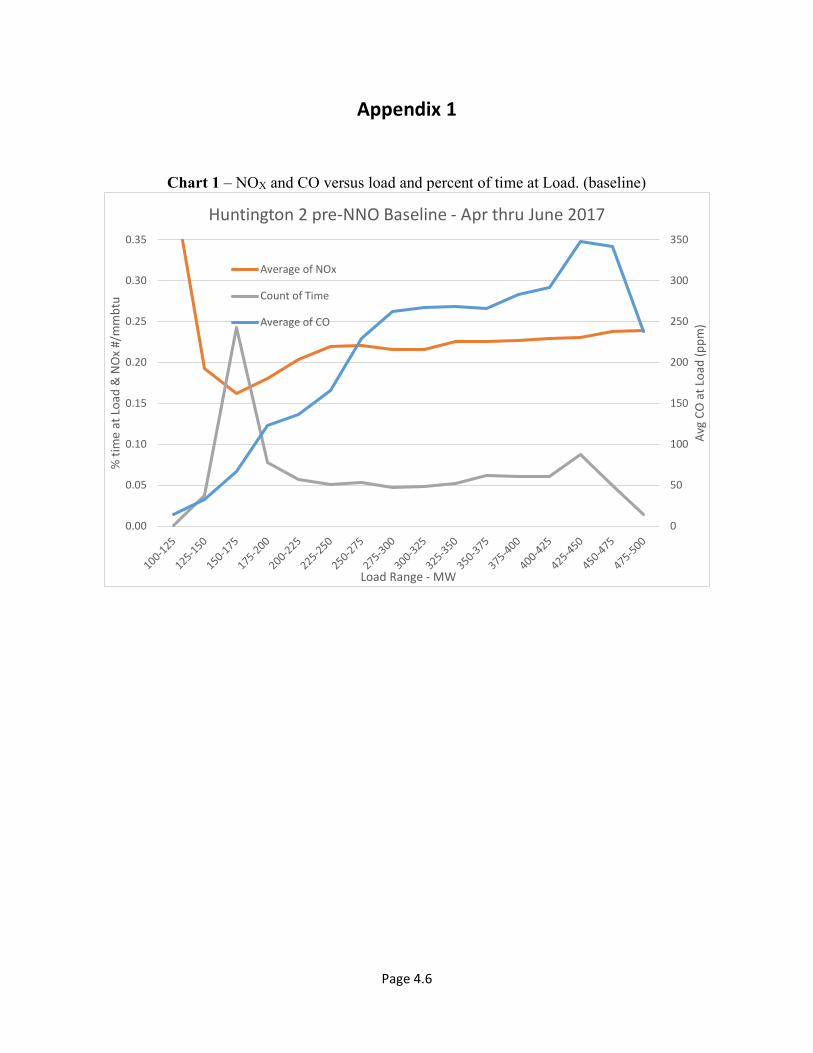
Page 4.6
Appendix 1
Chart 1 – NOX and CO versus load and percent of time at Load. (baseline)
0
50
100
150
200
250
300
350
0.00
0.05
0.10
0.15
0.20
0.25
0.30
0.35
Avg
CO a
t Loa
d (p
pm)
% ti
me
at L
oad
& N
Ox
#/m
mbt
u
Load Range - MW
Huntington 2 pre-NNO Baseline - Apr thru June 2017
Average of NOx
Count of Time
Average of CO
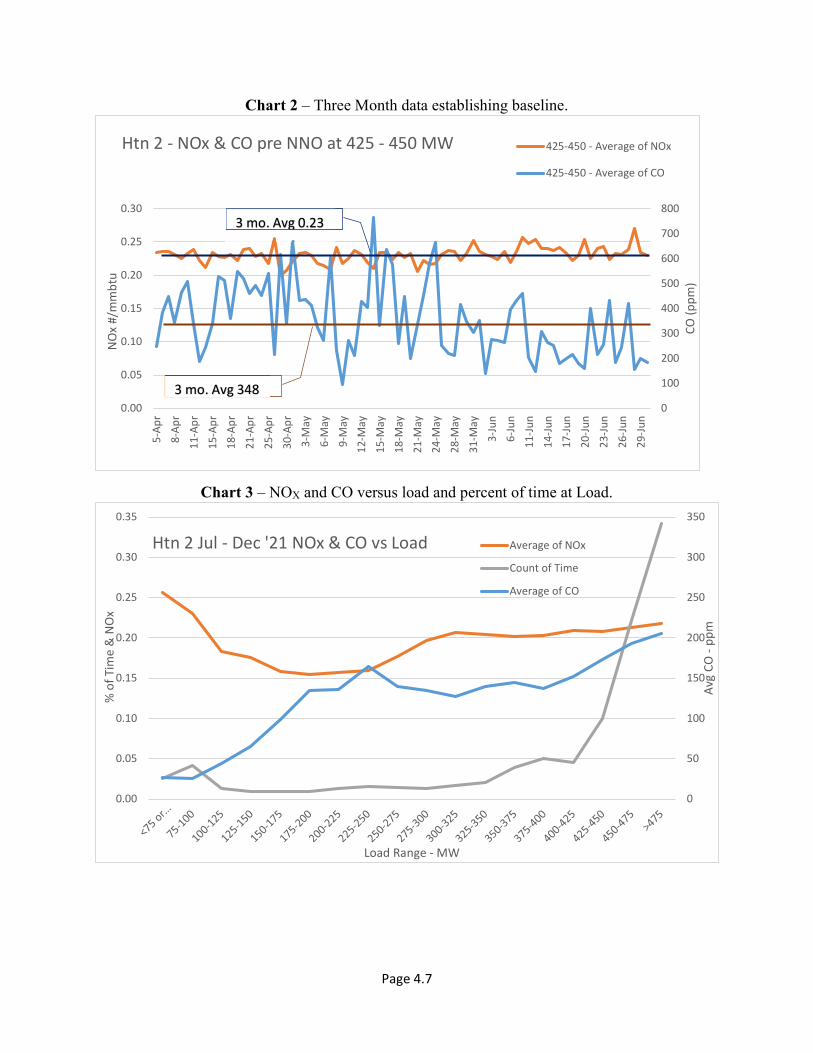
Page 4.7
Chart 2 – Three Month data establishing baseline.
Chart 3 – NOX and CO versus load and percent of time at Load.
0
100
200
300
400
500
600
700
800
0.00
0.05
0.10
0.15
0.20
0.25
0.30
5-Ap
r
8-Ap
r
11-A
pr
15-A
pr
18-A
pr
21-A
pr
25-A
pr
30-A
pr
3-M
ay
6-M
ay
9-M
ay
12-M
ay
15-M
ay
18-M
ay
21-M
ay
24-M
ay
28-M
ay
31-M
ay
3-Ju
n
6-Ju
n
11-J
un
14-J
un
17-J
un
20-J
un
23-J
un
26-J
un
29-J
un
CO (p
pm)
NO
x #/
mm
btu
Htn 2 - NOx & CO pre NNO at 425 - 450 MW 425-450 - Average of NOx
425-450 - Average of CO
3 mo. Avg 0.23
3 mo. Avg 348
0
50
100
150
200
250
300
350
0.00
0.05
0.10
0.15
0.20
0.25
0.30
0.35
Avg
CO -
ppm
% o
f Tim
e &
NO
x
Load Range - MW
Htn 2 Jul - Dec '21 NOx & CO vs Load Average of NOx
Count of Time
Average of CO
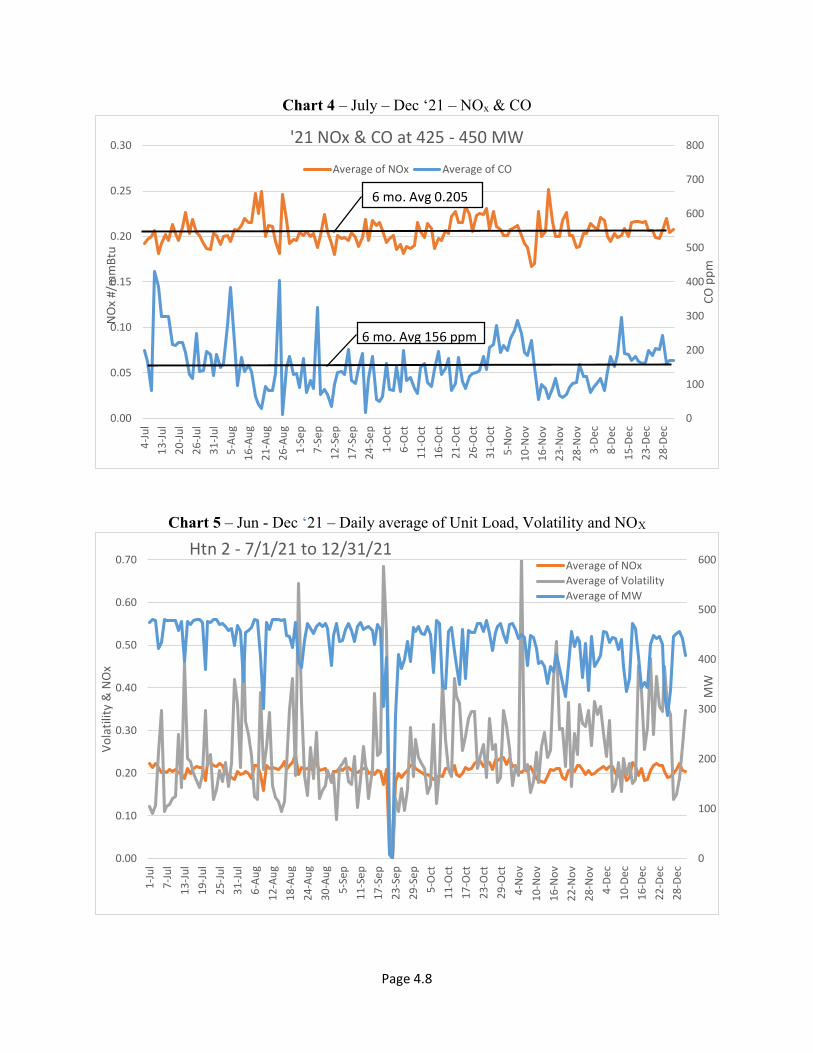
Page 4.8
Chart 4 – July – Dec ‘21 – NOx & CO
Chart 5 – Jun - Dec ‘21 – Daily average of Unit Load, Volatility and NOX
0
100
200
300
400
500
600
700
800
0.00
0.05
0.10
0.15
0.20
0.25
0.304-
Jul
13-J
ul20
-Jul
26-J
ul31
-Jul
5-Au
g16
-Aug
21-A
ug26
-Aug
1-Se
p7-
Sep
12-S
ep17
-Sep
24-S
ep1-
Oct
6-O
ct11
-Oct
16-O
ct21
-Oct
26-O
ct31
-Oct
5-N
ov10
-Nov
16-N
ov23
-Nov
28-N
ov3-
Dec
8-D
ec15
-Dec
23-D
ec28
-Dec
CO p
pm
NO
x #/
mm
Btu
'21 NOx & CO at 425 - 450 MW
Average of NOx Average of CO
6 mo. Avg 0.205
6 mo. Avg 156 ppm
0
100
200
300
400
500
600
0.00
0.10
0.20
0.30
0.40
0.50
0.60
0.70
1-Ju
l7-
Jul
13-J
ul19
-Jul
25-J
ul31
-Jul
6-Au
g12
-Aug
18-A
ug24
-Aug
30-A
ug5-
Sep
11-S
ep17
-Sep
23-S
ep29
-Sep
5-O
ct11
-Oct
17-O
ct23
-Oct
29-O
ct4-
Nov
10-N
ov16
-Nov
22-N
ov28
-Nov
4-D
ec10
-Dec
16-D
ec22
-Dec
28-D
ec
MW
Vola
tility
& N
Ox
Htn 2 - 7/1/21 to 12/31/21 Average of NOxAverage of VolatilityAverage of MW
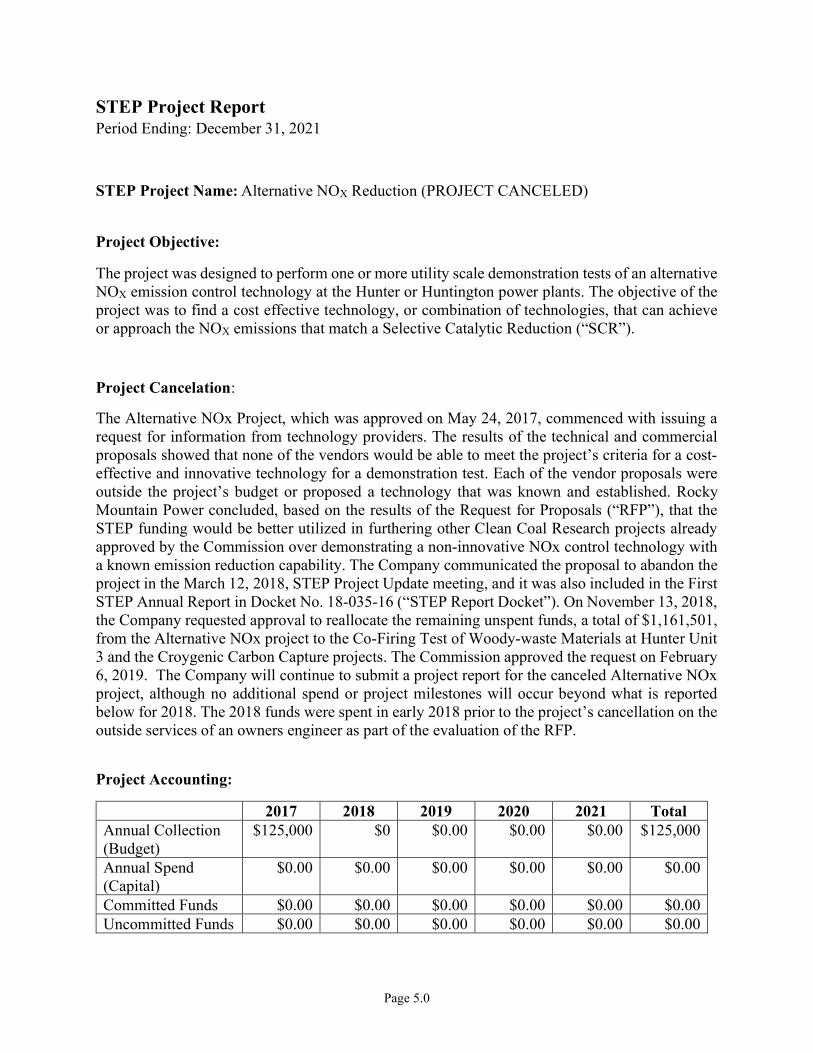
Page 5.0
STEP Project Report Period Ending: December 31, 2021
STEP Project Name: Alternative NOX Reduction (PROJECT CANCELED)
Project Objective:
The project was designed to perform one or more utility scale demonstration tests of an alternative NOX emission control technology at the Hunter or Huntington power plants. The objective of the project was to find a cost effective technology, or combination of technologies, that can achieve or approach the NOX emissions that match a Selective Catalytic Reduction (“SCR”).
Project Cancelation:
The Alternative NOx Project, which was approved on May 24, 2017, commenced with issuing a request for information from technology providers. The results of the technical and commercial proposals showed that none of the vendors would be able to meet the project’s criteria for a cost-effective and innovative technology for a demonstration test. Each of the vendor proposals were outside the project’s budget or proposed a technology that was known and established. Rocky Mountain Power concluded, based on the results of the Request for Proposals (“RFP”), that the STEP funding would be better utilized in furthering other Clean Coal Research projects already approved by the Commission over demonstrating a non-innovative NOx control technology with a known emission reduction capability. The Company communicated the proposal to abandon the project in the March 12, 2018, STEP Project Update meeting, and it was also included in the First STEP Annual Report in Docket No. 18-035-16 (“STEP Report Docket”). On November 13, 2018, the Company requested approval to reallocate the remaining unspent funds, a total of $1,161,501, from the Alternative NOx project to the Co-Firing Test of Woody-waste Materials at Hunter Unit 3 and the Croygenic Carbon Capture projects. The Commission approved the request on February 6, 2019. The Company will continue to submit a project report for the canceled Alternative NOx project, although no additional spend or project milestones will occur beyond what is reported below for 2018. The 2018 funds were spent in early 2018 prior to the project’s cancellation on the outside services of an owners engineer as part of the evaluation of the RFP.
Project Accounting:
2017 2018 2019 2020 2021 Total Annual Collection (Budget)
$125,000 $0 $0.00 $0.00 $0.00 $125,000
Annual Spend (Capital)
$0.00 $0.00 $0.00 $0.00 $0.00 $0.00
Committed Funds $0.00 $0.00 $0.00 $0.00 $0.00 $0.00 Uncommitted Funds $0.00 $0.00 $0.00 $0.00 $0.00 $0.00

Page 5.1
External OMAG Expenses
$131,405 $26,010 $0.00 $0.00 $0.00 $157,415
Subtotal $131,405 $26,010* $0.00 $0.00 $0.00 $157,415
*In the Company’s Application to Modify Funding Amounts Previously Authorized by STEP filed on November 13, 2018, in Docket No. 16-035-36, paragraph 19 of the Application stated that a total of $170,356 had been spent on the Alternative NOx project for the RFP and owner’s engineer services. This amount included $131,405 in CY 2017 expenses and $38,951 in CY 2018 expenses. The $38,951 in CY 2018 included an accounting accrual of which $12,941 was subsequently reversed. The total for CY 2018 is $26,010. Also in paragraph 19, the Company requested $1,161,501 be transferred to the other clean coal projects, leaving $89,964 unallocated. With the revision in CY 2018 expenses, the unallocated amount is revised as follows:
Original budget for the Alternative NOx Project $1,415,821
Funds spent on Alternative NOx Project $157,415 Funds transferred to other clean coal projects $1,161,501 Unallocated funds $96,905
Project Milestones:
Project Milestone Delivery Date Status
Kick off meeting March 30, 2017 Complete
Draft version of RFI for Alternative NOX Technologies
May 18, 2017 Complete, draft received on May 1, 2017
Issue RFI for Alternative NOX Technologies
May 29, 2017 Completed
RFI Response Due June 22, 2017 Completed
Summary of RFI Response August 6, 2017 Completed
Issue RFP for Alternative NOX Technologies Demonstration Test August 20, 2017
Complete, August 24,
2017
RFP Response Due October 9, 2017 Completed
Selection of Technologies for Demonstration Test
December 27, 2017 Complete
Submit Implementation APR for Demonstration Test February 20, 2018
Deferred (see key
challenges)
Project Cancellation June 30, 2018 Complete

Page 5.2
Funding Reallocation to Other STEP Clean Coal Projects
December 31, 2018 Complete
Key Challenges, Findings, Results and Lessons Learned:
Description of Investment
Anticipated Outcome
Challenges Findings Results Lessons Learned
a. Request for Information
Selected vendors for alternative emission reduction technology
Limited availability implementable technology
Sixteen vendors were approached for their technology
Two vendors provided a substantially different technology for implementation
There is limited number of technologies on the market reach SCR type emission reduction
b. Request for Proposal Cost
A technology supplier capable for performing a demonstration test within the allocated budget
Limited number low cost technology for emission reduction
Only two vendors could meet the target emission reduction rate and neither were within the target budget
No vendor could be sourced that could meet the STEP requirement and were within the allocated budget.
The company should provide more direction to potential vendors before release of the RFP to gain a better understanding as to the cost associated with a demonstration test.

Page 6.0
STEP Project Report Period Ending: December 31, 2021
STEP Project Name: Study Evaluation for CO2 Enhanced Coal Bed Methane Recovery
Project Objective:
Perform a feasibility study evaluating opportunities to use carbon dioxide (“CO2”) for beneficial use in enhanced natural gas recovery from coal seams. The focus of the study will be coal seams in the Emery County area. As part of the study, an assessment will be made on the capability of Emery County coal seams to concurrently sequester CO2. Project Progress: The feasibility study was completed by the University of Utah in November 2021. The Application Feasibility of Regional and Commerical Use of CO2 for Enhanced Coal Bed Methane Recovery final report is available in Attachment A. Key findings from the report are highlighted below: 1. Methane capture and purification before injection. Laboratory scale, experimental work
using a surrogate to flue gas (a nitrogen-carbon dioxide mixture) suggested that there could be some advantages in injecting flue gas directly without separation of the carbon dioxide explicitly. The advantage is not necessarily that NOx can be sequestered but that the presence of nitrogen may enable moving CO2 deeper into the coal (hypothesis at this point, based on laboratory observations, requiring validation).
2. Coal swelling impacts coal-bed methane production. The experience in the past has been that
chemisorption and associated swelling have reduced cleat permeability in coals. Tactical changes in the injection strategy – multiple horizontal wells, with water diversion stages and pressures above fracturing are envisioned to effectively provide conformal injection and storage of CO2 through the bulk of the reservoir. The experimental work in this study demonstrates the consequences of adsorption and points to some advantages in injecting flue gas rather than explicitly separated carbon dioxide. A carefully monitored and designed pilot injection program could safely help to clarify this at a scale larger than in the laboratory.
3. The true capacity for carbon dioxide storage in coals in-situ has not been established.
Continuous injection below fracturing pressure may not be a realistic scenario. The potential for refined injection procedures including fracturing, water stages, and in particular horizontal wells, might alleviate the mismatch between a necessarily large and constant CO2 supply and the sequestration volume in the coals. A pilot project could provide clarification. The geologic specifics of the Ferron coal/sandstone packages could be favorable for injection where the movement of carbon dioxide (or flue gas) through the sands would be relatively unimpeded and storage in the coal could move well away from the injectors. The potential complication is the potentially finite extent of the sands.

Page 6.1
4. Seal integrity and permanence of sequestration are always a concern for subsurface
storage. Effective monitoring is required. Injection of water, particularly calcified water after periodic injection of carbon dioxide could afford mineralization and more permanent sequestration. Predicting, monitoring, and mitigating leakage is a common theme of all subsurface storage operations. The overlying Mancos formation is thick and would provide an effective seal.
5. Logistics and feasibility of piping CO2 to injection equipment from a plant environment to
the injection facility. The two plants are close to a historically produced coal bed methane play. In particular, the Buzzard Bench field was evaluated in this work.
6. The estimated OGIP (original gas in place - methane) in the northern block of the Buzzard
Bench field abutting the Hunter and Huntington power plants is 153 to 202 bcf methane (using typical gas contents of 190 and 350 scf/ton, respectively for worst- and best-case scenarios). The estimated OGIP for the southern block ranges from 192 to 450 bcf methane. Some of this gas has been already produced because of coalbed production operations over the past twenty years or so.
7. The estimated CO2 maximum storage capacity: The dry-ash free CO2 gas capacity of a
Ferron coal sample at in-situ conditions was measured as 670 scf/ton, which leads to a volumetric capacity of carbon dioxide of 523 and 673 bcf of CO2, for the northern and southern Buzzard Bench blocks, respectively.
8. This is not an insignificant operation. Consider servicing the Huntington plant. As a
benchmark, consider an annual CO2 emission of 6,000,000 tons of CO2. Over twenty years, simulations suggest that about 75 to 100 injectors would be required – a significant investment with significant OPEX requirements. Only a pilot program can characterize this for sure. These numbers are conservative because the Langmuir isotherm for the CO2 was not available from Schlumberger when the simulations were completed. After those data were generated, the storage capacity appears to be substantially higher, and the number of injectors could be halved – still a significant operation.
9. A limitation on the rate of injection per well is the reduction in permeability associated with
swelling. As the permeability reduces, the injection pressure increases. The limit on the injection pressure has been taken to be minimizing the bottomhole pressure to avoid hydraulic fracturing. Only a pilot/field experimentation will ultimately confirm these pressure limitations. There is also some laboratory evidence that direct injection of flue gas may mitigate the consequences of the swelling.
10. Question: Will an increase in injection pressure due to swelling be as severe as simulated
if the interfingering sands act as a pressure relief and delivery mechanism? Almost certainly not. The Ferron sands are interfingered with the coals. Measurements of the permeability of the Ferron sand suggest preferential gas flow would occur into the sands, offering the ability to bypass locally reduced permeability in the coals. With time, flow into and adsorption would occur in the interfingered coals with accompanying sequestration.

Page 6.2
Simulations tend to suggest this as well. A pilot test would establish the value of this revolutionary concept – relying on the sands to deliver the CO2 and the coals to sequester it.
11. Question: What happens if the pressure causes local fracturing? This is an unanswered
technical question. If the fracturing is restricted to the sands and the coals, the results will be beneficial. Areas of locally reduced permeability in the coals would be breached/bypassed and injectate could move beyond the impaired zones. The concern is breaching a seal. However, the overlying Mancos formation is relatively thick and could tolerate some local fracture penetration. Consequently, the method for fracturing, as part of the storage protocol, needs to be carefully defined and tested at a pilot scale. For example, if high pressures are encountered during injection, a small slug of water might be injected to allow a small fracture to occur, to see if pressure can be relieved. This is “unexplored technical territory” and would require testing and validation. Assuming that the carbon dioxide can be maintained in a super critical state, a nominally incompressible slug (the water) may not be needed to generate a small fracture step. This is advocating the possibility of a WAG (water alternating gas) operation. Corrosion would need to be considered.
12. Question: Can flue gas be pumped? There are some indications that it could be viable to
pump flue gas or at least a nitrogen-carbon dioxide mix. Oxygen and non-scavenged H2S are undesirable from a corrosion perspective, but possibly reduced separation of the flue gas is feasible. Laboratory testing has shown that the degree of swelling is contingent on the amount of nitrogen present with the carbon dioxide and that permeability reduction is similarly impacted. If flue gas is injected, permeability reduction may be reduced. The drawbacks are that the relative concentration of carbon dioxide injected is less and the hydrostatic pressure will be reduced (with miscibility or perfect mixing) and expenditure for compression and pumping will consequently be higher.
Project Accounting:
Cost Object 2017 2018 2019 2020 2021 Total Annual Collection (Budget)
$0.00 $62,500 $42,133 $63,408 $86,024 $254,065
Annual Spend (Capital)
$0.00 $0.00 $0.00 $0.00 $0.00 $0.00
Committed Funds***
$0.00 $0.00 $0.00 $0.00 $10,529 $10,529
Uncommitted Funds
$0.00 $0.00 $0.00 $0.00 $0.00 $0.00
External OMAG Expenses*
$0.00 $73,041** $42,133 $64,696 $74,250 $254,120
Subtotal $0.00 $73,041 $42,133 $64,696 $74,250 $254,120
* All external OMAG for was for contractual payments to the University of Utah for the feasibility study they provided on the project.
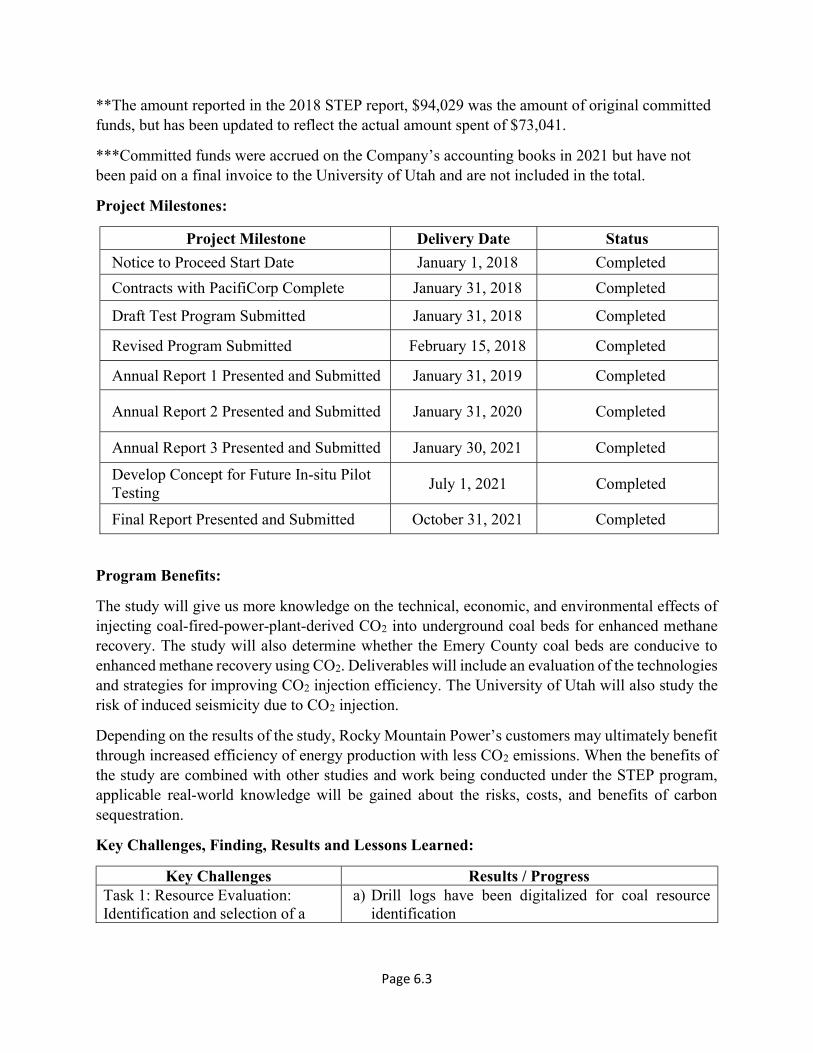
Page 6.3
**The amount reported in the 2018 STEP report, $94,029 was the amount of original committed funds, but has been updated to reflect the actual amount spent of $73,041.
***Committed funds were accrued on the Company’s accounting books in 2021 but have not been paid on a final invoice to the University of Utah and are not included in the total.
Project Milestones:
Project Milestone Delivery Date Status
Notice to Proceed Start Date January 1, 2018 Completed
Contracts with PacifiCorp Complete January 31, 2018 Completed
Draft Test Program Submitted January 31, 2018 Completed
Revised Program Submitted February 15, 2018 Completed
Annual Report 1 Presented and Submitted January 31, 2019 Completed
Annual Report 2 Presented and Submitted January 31, 2020 Completed
Annual Report 3 Presented and Submitted January 30, 2021 Completed
Develop Concept for Future In-situ Pilot Testing
July 1, 2021 Completed
Final Report Presented and Submitted October 31, 2021 Completed
Program Benefits:
The study will give us more knowledge on the technical, economic, and environmental effects of injecting coal-fired-power-plant-derived CO2 into underground coal beds for enhanced methane recovery. The study will also determine whether the Emery County coal beds are conducive to enhanced methane recovery using CO2. Deliverables will include an evaluation of the technologies and strategies for improving CO2 injection efficiency. The University of Utah will also study the risk of induced seismicity due to CO2 injection.
Depending on the results of the study, Rocky Mountain Power’s customers may ultimately benefit through increased efficiency of energy production with less CO2 emissions. When the benefits of the study are combined with other studies and work being conducted under the STEP program, applicable real-world knowledge will be gained about the risks, costs, and benefits of carbon sequestration.
Key Challenges, Finding, Results and Lessons Learned:
Key Challenges Results / Progress Task 1: Resource Evaluation: Identification and selection of a
a) Drill logs have been digitalized for coal resource identification

Page 6.4
coal resource to be studied for volumetric CO2 storage
b) Stratigraphic coal units have been identified from well logs. Six coal units have been identified in Emery County’s Buzzard Bench Field.
c) The coal units’ geological structure was delineated by identifying the top of the Ferron Sandstone from well logs.
d) The data was gathered from the geological structure of the coal units and used to develop a three-dimensional model of the study area.
e) The three-dimensonal model was completed and modeling begun to determine CO2 storage capiability of the field.
f) A 20 year CO2 simulated injection was modeled (March 2019 – Februay 2039). Injection rates of 1 million standard cubic foot per day (mmscf/d), 1.5 mmscf/d and 2.0 mmscf/d were modled to avoid fracturing the coal units.
g) At the 1.0 mmscf/d injection rate, 14.36 billion cubic feet of CO2 was injected and 12.58 bcf of CH4 produced. At 1.5mmscf/d, 18.18 bcf of CO2 was injected and 13.50 bcf of CH4 was produced. At 2.0 mmscf/d, 13.95 bcf of CH4 produced. CO2 breakthrough occurred early in the model which is detrimental to CO2 sequestion.
h) Sensitivity analysis was performed as to the injection well locations with no increase in CO2 stored or CH4 produced.
i) Further analysis of the model found that CO2 injection into the coals units may not remain within coals units and instead migrate to adjancet sandstone boundry layers. The model was expanded to include the adjacent sandstone and results indicate about 8 to 10% of the CO2 would be stored in the sandstone. The sandstone forms a conducuitve conduit and storage medium for the CO2.
j) Next stesp will be to conduct further modeling of CO2 injection into the sandstone and coal units simultaneously.
Task 2: Bench Scale Demonstration:
a) The test apparatus was designed and constructed in 2019. Shake down tests of various materials began in late 2019.
b) Labortory testing was limited in 2020 due to the University of Utah campus being shut down for the majority of the year due to the COVID-19 pandemic. Coal sample testing started in summer of 2020.
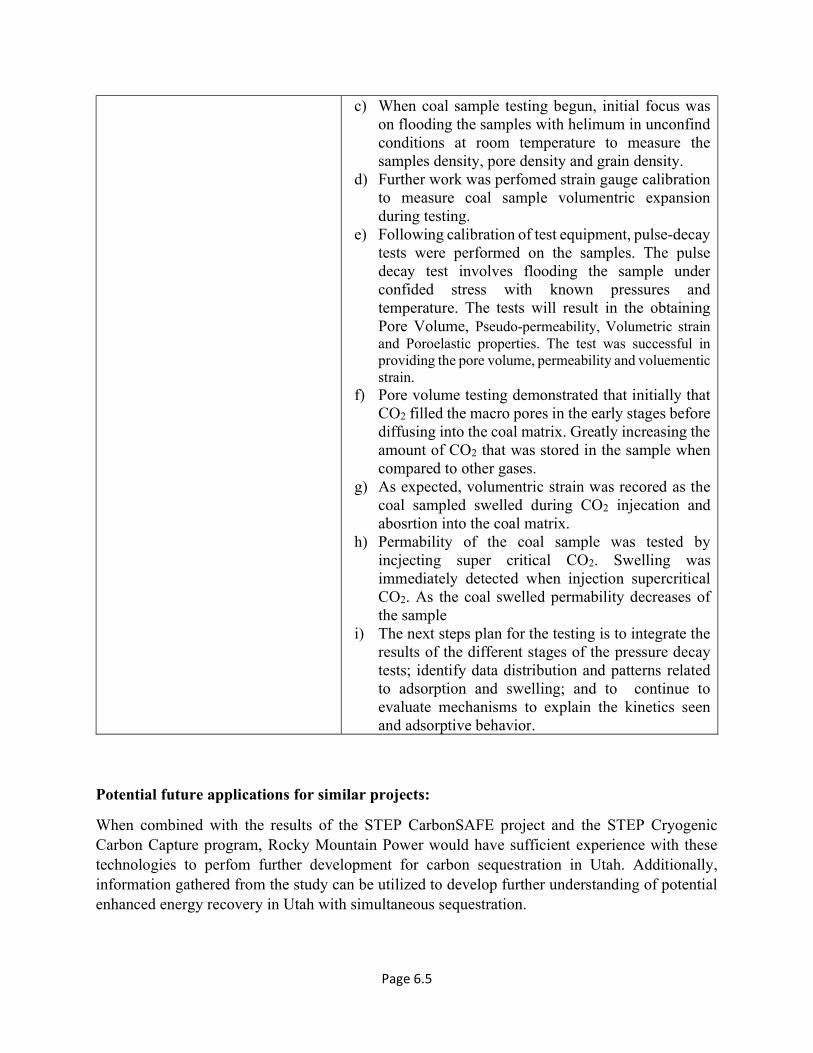
Page 6.5
c) When coal sample testing begun, initial focus was on flooding the samples with helimum in unconfind conditions at room temperature to measure the samples density, pore density and grain density.
d) Further work was perfomed strain gauge calibration to measure coal sample volumentric expansion during testing.
e) Following calibration of test equipment, pulse-decay tests were performed on the samples. The pulse decay test involves flooding the sample under confided stress with known pressures and temperature. The tests will result in the obtaining Pore Volume, Pseudo-permeability, Volumetric strain and Poroelastic properties. The test was successful in providing the pore volume, permeability and voluementic strain.
f) Pore volume testing demonstrated that initially that CO2 filled the macro pores in the early stages before diffusing into the coal matrix. Greatly increasing the amount of CO2 that was stored in the sample when compared to other gases.
g) As expected, volumentric strain was recored as the coal sampled swelled during CO2 injecation and abosrtion into the coal matrix.
h) Permability of the coal sample was tested by incjecting super critical CO2. Swelling was immediately detected when injection supercritical CO2. As the coal swelled permability decreases of the sample
i) The next steps plan for the testing is to integrate the results of the different stages of the pressure decay tests; identify data distribution and patterns related to adsorption and swelling; and to continue to evaluate mechanisms to explain the kinetics seen and adsorptive behavior.
Potential future applications for similar projects:
When combined with the results of the STEP CarbonSAFE project and the STEP Cryogenic Carbon Capture program, Rocky Mountain Power would have sufficient experience with these technologies to perfom further development for carbon sequestration in Utah. Additionally, information gathered from the study can be utilized to develop further understanding of potential enhanced energy recovery in Utah with simultaneous sequestration.

Page 6.6
Attachments:
Exhibit 6-A: The Application Feasibility for Regional and Commercial Use of CO2 for Enhanced Coal Bed Methane Recovery – Final Report

Exhibit 6-A The Application of CO2 for Enhanced Coal Bed Methane Recovery

THIS ATTACHMENT IS VOLUMINOUS AND PROVIDED SEPARATELY
Page 7.0
Cryogenic Carbon Capture - STEP Project Report Period Ending: December 31, 2021
STEP Project Name: Cryogenic Carbon Capture (CCC) Demonstration (Emerging CO2 Capture)
Project Objective:
The objective of this project was to continue the development and demonstration of promising CCC technology.
The scope of work was divided into two primary phases. The first, called the Development Phase, involves research to be performed by a contractor into specific areas where it is believed efficiency, reliability, or overall performance of the CCC process can be improved. Rocky Mountain Power (RMP) contracted with Sustainable Energy Solutions (SES) to do this work. SES’s recommendations and experimental results were used to make changes and enhancements to the skid demonstration unit provided as part of this Scope of Work. On-site preparations by SES and RMP personnel of the testing area at the Hunter Power Plant in central Utah were completed in 2019. The Field Demonstration Phase used the demonstration unit at the site during an extended test run over approximately six months. SES’s development work took place during 2017 and early 2018 with the field testing beginning in early 2019.
These phases were conducted by SES in parallel with a proposed DOE project to mature the technology and gather critical information in preparation for a scale-up.
In Docket No. 16-035-36, the Commission approved the Company’s request to increase funding for the Cryogenic Carbon Capture project by $412,521, utilizing funds from the cancelled Alternative NOx project. With these additional funds, the Company expanded the scope to plan for the next scale of CCC operation to explore the scalability of these and related unit operations as part of this investigation. This project includes one task for each of three major systems. These systems require major changes to the previous skid operation in contrast to the incremental changes supported by the current Department of Energy project. The project includes an economic assessment of utility-scale implementation of technology. In 2019 RMP hired Sargent & Lundy to deliver a report assessing the scalability of SES’s technology to a size capable of processing all exhaust flue gas from one or more existing coal fueled thermal generation power plants owned by RMP.
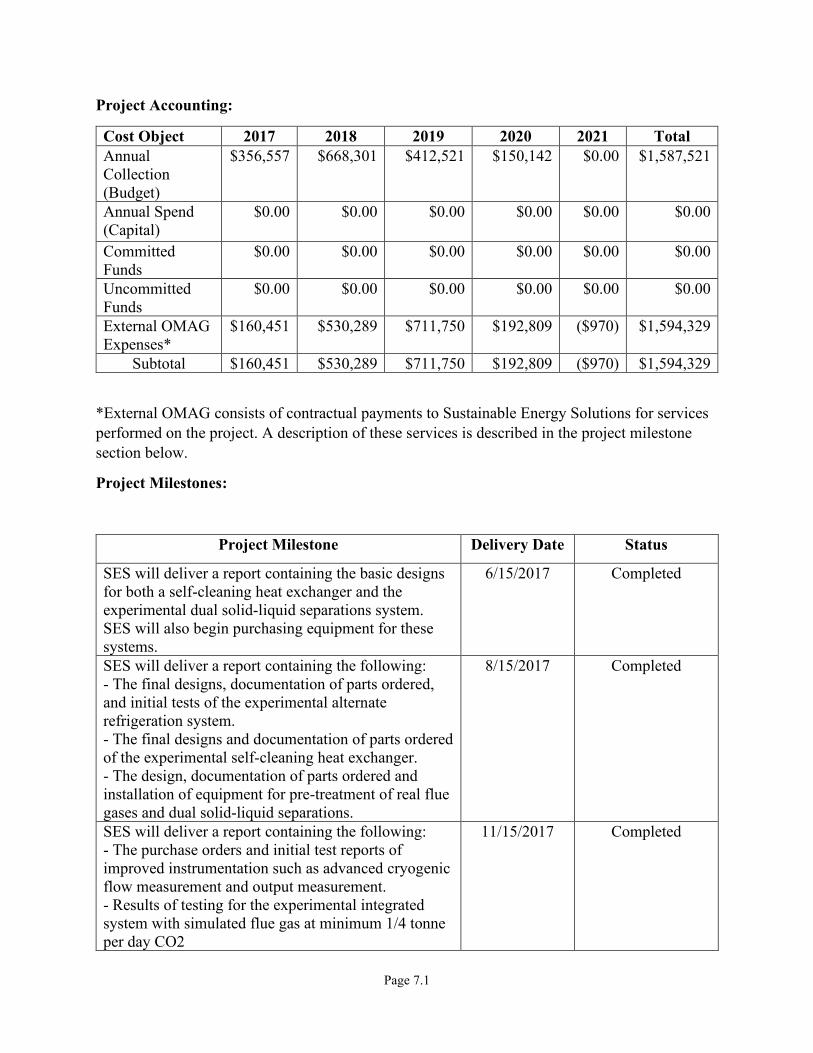
Page 7.1
Project Accounting:
Cost Object 2017 2018 2019 2020 2021 Total Annual Collection (Budget)
$356,557 $668,301 $412,521 $150,142 $0.00 $1,587,521
Annual Spend (Capital)
$0.00 $0.00 $0.00 $0.00 $0.00 $0.00
Committed Funds
$0.00 $0.00 $0.00 $0.00 $0.00 $0.00
Uncommitted Funds
$0.00 $0.00 $0.00 $0.00 $0.00 $0.00
External OMAG Expenses*
$160,451 $530,289 $711,750 $192,809 ($970) $1,594,329
Subtotal $160,451 $530,289 $711,750 $192,809 ($970) $1,594,329
*External OMAG consists of contractual payments to Sustainable Energy Solutions for services performed on the project. A description of these services is described in the project milestone section below.
Project Milestones:
Project Milestone Delivery Date Status
SES will deliver a report containing the basic designs for both a self-cleaning heat exchanger and the experimental dual solid-liquid separations system. SES will also begin purchasing equipment for these systems.
6/15/2017 Completed
SES will deliver a report containing the following: - The final designs, documentation of parts ordered, and initial tests of the experimental alternate refrigeration system. - The final designs and documentation of parts ordered of the experimental self-cleaning heat exchanger. - The design, documentation of parts ordered and installation of equipment for pre-treatment of real flue gases and dual solid-liquid separations.
8/15/2017 Completed
SES will deliver a report containing the following: - The purchase orders and initial test reports of improved instrumentation such as advanced cryogenic flow measurement and output measurement. - Results of testing for the experimental integrated system with simulated flue gas at minimum 1/4 tonne per day CO2
11/15/2017 Completed
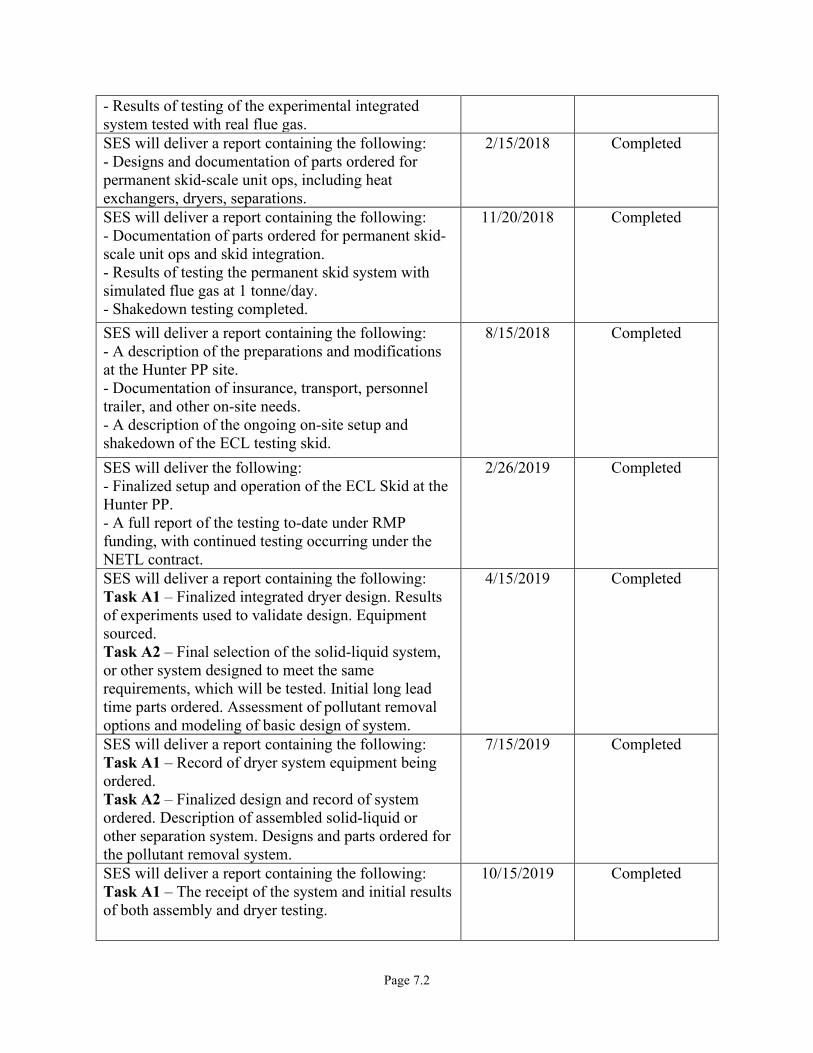
Page 7.2
- Results of testing of the experimental integrated system tested with real flue gas. SES will deliver a report containing the following: - Designs and documentation of parts ordered for permanent skid-scale unit ops, including heat exchangers, dryers, separations.
2/15/2018 Completed
SES will deliver a report containing the following: - Documentation of parts ordered for permanent skid-scale unit ops and skid integration. - Results of testing the permanent skid system with simulated flue gas at 1 tonne/day. - Shakedown testing completed.
11/20/2018 Completed
SES will deliver a report containing the following: - A description of the preparations and modifications at the Hunter PP site. - Documentation of insurance, transport, personnel trailer, and other on-site needs. - A description of the ongoing on-site setup and shakedown of the ECL testing skid.
8/15/2018 Completed
SES will deliver the following: - Finalized setup and operation of the ECL Skid at the Hunter PP. - A full report of the testing to-date under RMP funding, with continued testing occurring under the NETL contract.
2/26/2019 Completed
SES will deliver a report containing the following: Task A1 – Finalized integrated dryer design. Results of experiments used to validate design. Equipment sourced. Task A2 – Final selection of the solid-liquid system, or other system designed to meet the same requirements, which will be tested. Initial long lead time parts ordered. Assessment of pollutant removal options and modeling of basic design of system.
4/15/2019 Completed
SES will deliver a report containing the following: Task A1 – Record of dryer system equipment being ordered. Task A2 – Finalized design and record of system ordered. Description of assembled solid-liquid or other separation system. Designs and parts ordered for the pollutant removal system.
7/15/2019 Completed
SES will deliver a report containing the following: Task A1 – The receipt of the system and initial results of both assembly and dryer testing.
10/15/2019 Completed

Page 7.3
Task A2 – Results of initial testing and subsequent iteration on solid-liquid or other separations system. Description of assembled pollutant removal system.
SES will deliver a report containing the following: Task A1 – Results of further test results including using real flue gas and initial integration with skid system. Final Reporting. Task A2 – Results of testing the finalized designs. Final Reporting. Task A3 – Assessment of scale-up potential of innovative unit ops including dryer and solid-liquid separations.
1/15/2020 Completed
Sargent & Lundy scalability study assessing the scalability of the technology for complete processing of flue gas at utility power plants.
7/1/2020 Completed
Program Benefits:
This program will help determine the economic feasibility of CCC technology. The technology shows promise in being able to reduce CO2 emissions. The demonstration test proved largely successful instilling confidence in the ability of SES’s CCC technology to meet these goals.
The added milestones provide for modifications which improved the reliability and, in some cases, decreased the energy and economic costs of the process.
Potential Future Applications:
SES was awarded U. S. Department of Energy ARPA-e funding for additional work including adding energy storage capability to the CCC technology and scale up to a larger pilot project capable of over 30 tons/day of CO2 capture. Utah State funding had been approved for a larger SES CCC scale-up project which may be hosted at one of PacifiCorp’s plants; however that funding was eliminated in 2020 due to the COVID-19 pandemic. In 2020 SES was acquired by Chart Industries. Chart Industries intends to continue with the larger scale pilot project between 30 and 100 tons per day of CO2 capture.
Attachments:
• Exhibit 7-A: Final Reports for the Cryogenic Carbon Capture (CCC) Demonstration (Emerging CO2 Capture) Program

Exhibit 7-A Final Reports for the CCC Demonstration Program

THIS ATTACHMENT IS VOLUMINOUS AND PROVIDED SEPARATELY
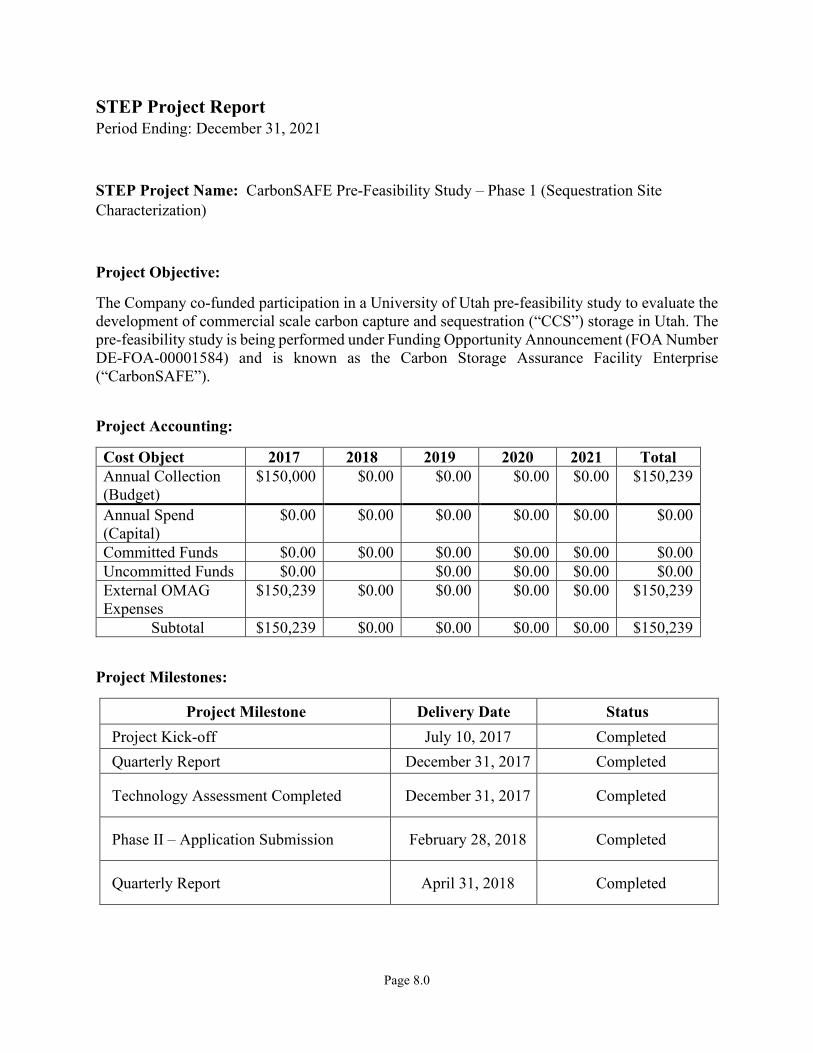
Page 8.0
STEP Project Report Period Ending: December 31, 2021
STEP Project Name: CarbonSAFE Pre-Feasibility Study – Phase 1 (Sequestration Site Characterization)
Project Objective:
The Company co-funded participation in a University of Utah pre-feasibility study to evaluate the development of commercial scale carbon capture and sequestration (“CCS”) storage in Utah. The pre-feasibility study is being performed under Funding Opportunity Announcement (FOA Number DE-FOA-00001584) and is known as the Carbon Storage Assurance Facility Enterprise (“CarbonSAFE”).
Project Accounting:
Cost Object 2017 2018 2019 2020 2021 Total Annual Collection (Budget)
$150,000 $0.00 $0.00 $0.00 $0.00 $150,239
Annual Spend (Capital)
$0.00 $0.00 $0.00 $0.00 $0.00 $0.00
Committed Funds $0.00 $0.00 $0.00 $0.00 $0.00 $0.00 Uncommitted Funds $0.00 $0.00 $0.00 $0.00 $0.00 External OMAG Expenses
$150,239 $0.00 $0.00 $0.00 $0.00 $150,239
Subtotal $150,239 $0.00 $0.00 $0.00 $0.00 $150,239
Project Milestones:
Project Milestone Delivery Date Status Project Kick-off July 10, 2017 Completed Quarterly Report December 31, 2017 Completed
Technology Assessment Completed December 31, 2017 Completed
Phase II – Application Submission February 28, 2018 Completed
Quarterly Report April 31, 2018 Completed
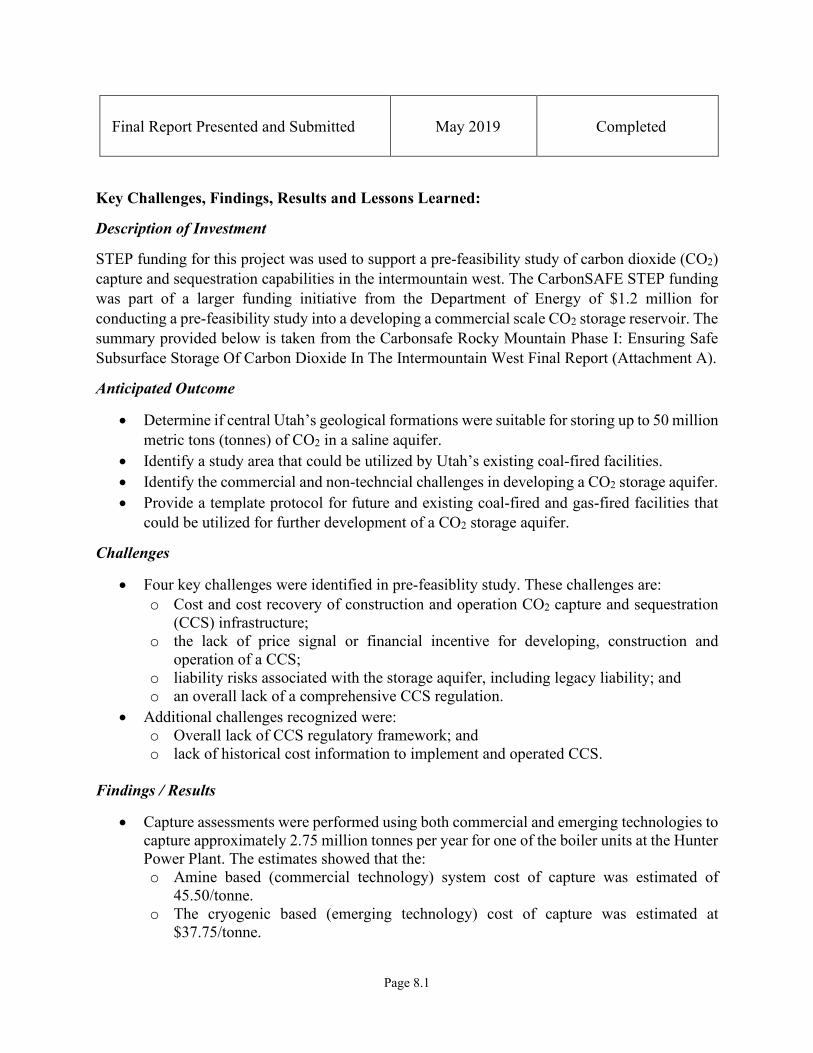
Page 8.1
Final Report Presented and Submitted May 2019 Completed
Key Challenges, Findings, Results and Lessons Learned:
Description of Investment
STEP funding for this project was used to support a pre-feasibility study of carbon dioxide (CO2) capture and sequestration capabilities in the intermountain west. The CarbonSAFE STEP funding was part of a larger funding initiative from the Department of Energy of $1.2 million for conducting a pre-feasibility study into a developing a commercial scale CO2 storage reservoir. The summary provided below is taken from the Carbonsafe Rocky Mountain Phase I: Ensuring Safe Subsurface Storage Of Carbon Dioxide In The Intermountain West Final Report (Attachment A).
Anticipated Outcome
• Determine if central Utah’s geological formations were suitable for storing up to 50 million metric tons (tonnes) of CO2 in a saline aquifer.
• Identify a study area that could be utilized by Utah’s existing coal-fired facilities. • Identify the commercial and non-techncial challenges in developing a CO2 storage aquifer. • Provide a template protocol for future and existing coal-fired and gas-fired facilities that
could be utilized for further development of a CO2 storage aquifer.
Challenges
• Four key challenges were identified in pre-feasiblity study. These challenges are: o Cost and cost recovery of construction and operation CO2 capture and sequestration
(CCS) infrastructure; o the lack of price signal or financial incentive for developing, construction and
operation of a CCS; o liability risks associated with the storage aquifer, including legacy liability; and o an overall lack of a comprehensive CCS regulation.
• Additional challenges recognized were: o Overall lack of CCS regulatory framework; and o lack of historical cost information to implement and operated CCS.
Findings / Results
• Capture assessments were performed using both commercial and emerging technologies to capture approximately 2.75 million tonnes per year for one of the boiler units at the Hunter Power Plant. The estimates showed that the: o Amine based (commercial technology) system cost of capture was estimated of
45.50/tonne. o The cryogenic based (emerging technology) cost of capture was estimated at
$37.75/tonne.
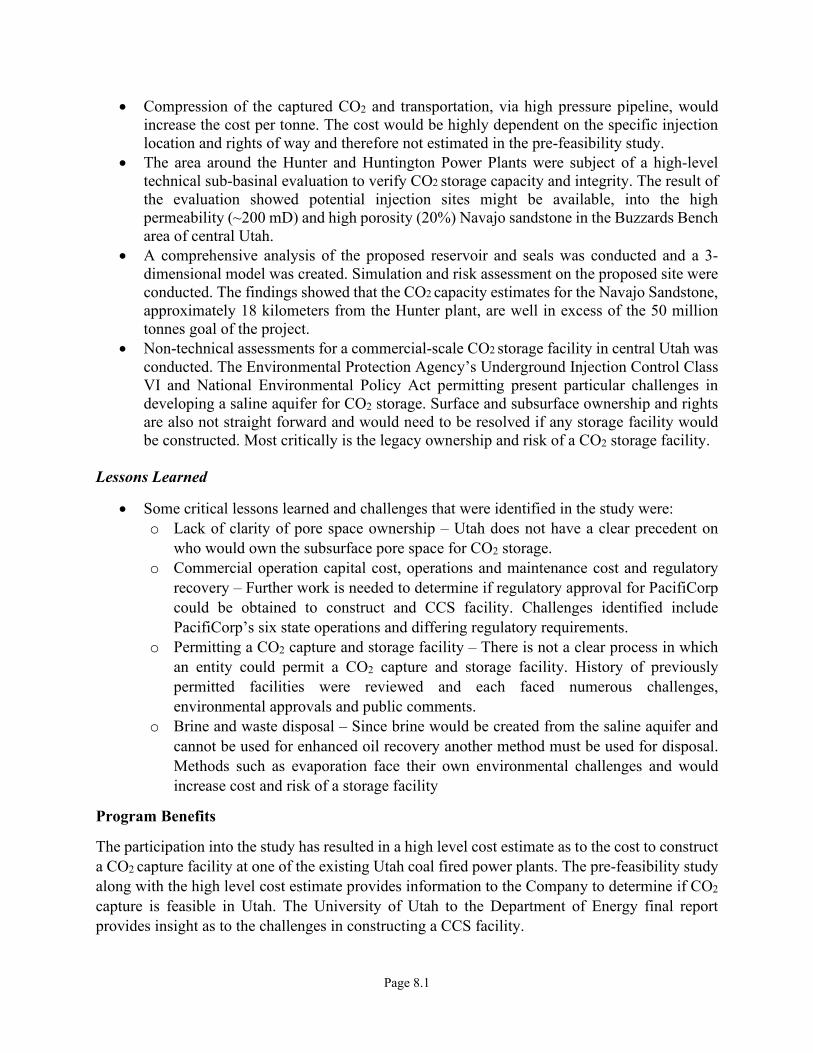
Page 8.1
• Compression of the captured CO2 and transportation, via high pressure pipeline, would increase the cost per tonne. The cost would be highly dependent on the specific injection location and rights of way and therefore not estimated in the pre-feasibility study.
• The area around the Hunter and Huntington Power Plants were subject of a high-level technical sub-basinal evaluation to verify CO2 storage capacity and integrity. The result of the evaluation showed potential injection sites might be available, into the high permeability (~200 mD) and high porosity (20%) Navajo sandstone in the Buzzards Bench area of central Utah.
• A comprehensive analysis of the proposed reservoir and seals was conducted and a 3-dimensional model was created. Simulation and risk assessment on the proposed site were conducted. The findings showed that the CO2 capacity estimates for the Navajo Sandstone, approximately 18 kilometers from the Hunter plant, are well in excess of the 50 million tonnes goal of the project.
• Non-technical assessments for a commercial-scale CO2 storage facility in central Utah was conducted. The Environmental Protection Agency’s Underground Injection Control Class VI and National Environmental Policy Act permitting present particular challenges in developing a saline aquifer for CO2 storage. Surface and subsurface ownership and rights are also not straight forward and would need to be resolved if any storage facility would be constructed. Most critically is the legacy ownership and risk of a CO2 storage facility.
Lessons Learned
• Some critical lessons learned and challenges that were identified in the study were: o Lack of clarity of pore space ownership – Utah does not have a clear precedent on
who would own the subsurface pore space for CO2 storage. o Commercial operation capital cost, operations and maintenance cost and regulatory
recovery – Further work is needed to determine if regulatory approval for PacifiCorp could be obtained to construct and CCS facility. Challenges identified include PacifiCorp’s six state operations and differing regulatory requirements.
o Permitting a CO2 capture and storage facility – There is not a clear process in which an entity could permit a CO2 capture and storage facility. History of previously permitted facilities were reviewed and each faced numerous challenges, environmental approvals and public comments.
o Brine and waste disposal – Since brine would be created from the saline aquifer and cannot be used for enhanced oil recovery another method must be used for disposal. Methods such as evaporation face their own environmental challenges and would increase cost and risk of a storage facility
Program Benefits
The participation into the study has resulted in a high level cost estimate as to the cost to construct a CO2 capture facility at one of the existing Utah coal fired power plants. The pre-feasibility study along with the high level cost estimate provides information to the Company to determine if CO2
capture is feasible in Utah. The University of Utah to the Department of Energy final report provides insight as to the challenges in constructing a CCS facility.
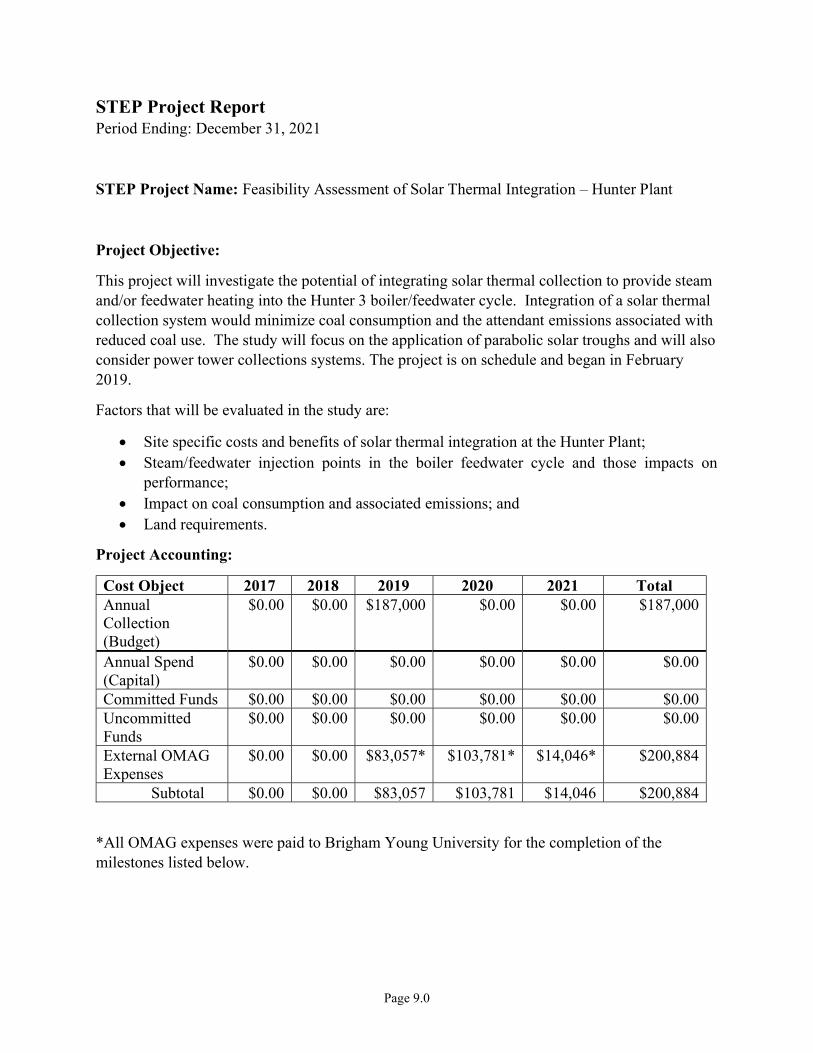
Page 9.0
STEP Project Report Period Ending: December 31, 2021
STEP Project Name: Feasibility Assessment of Solar Thermal Integration – Hunter Plant
Project Objective:
This project will investigate the potential of integrating solar thermal collection to provide steam and/or feedwater heating into the Hunter 3 boiler/feedwater cycle. Integration of a solar thermal collection system would minimize coal consumption and the attendant emissions associated with reduced coal use. The study will focus on the application of parabolic solar troughs and will also consider power tower collections systems. The project is on schedule and began in February 2019.
Factors that will be evaluated in the study are:
Site specific costs and benefits of solar thermal integration at the Hunter Plant; Steam/feedwater injection points in the boiler feedwater cycle and those impacts on
performance; Impact on coal consumption and associated emissions; and Land requirements.
Project Accounting:
Cost Object 2017 2018 2019 2020 2021 Total Annual Collection (Budget)
$0.00 $0.00 $187,000 $0.00 $0.00 $187,000
Annual Spend (Capital)
$0.00 $0.00 $0.00 $0.00 $0.00 $0.00
Committed Funds $0.00 $0.00 $0.00 $0.00 $0.00 $0.00 Uncommitted Funds
$0.00 $0.00 $0.00 $0.00 $0.00 $0.00
External OMAG Expenses
$0.00 $0.00 $83,057* $103,781* $14,046*
$200,884
Subtotal $0.00 $0.00 $83,057 $103,781 $14,046 $200,884
*All OMAG expenses were paid to Brigham Young University for the completion of the milestones listed below.

Page 9.1
Project Milestones:
Project Milestones Delivery Date Status
Contract between BYU and PacifiCorp complete
2/5/2019 Completed
Kickoff Meeting 2/12/2019 Completed Report 1 to include literature review and representative model development
4/30/2019 Completed
Report 2, baseline plant model comparison to operational data
8/31/2019
Completed
Report 3, solar resource data, solar integration point, CSP characterization for modeling
12/31/2019 Completed
Report 4, preliminary estimates of fuel reduction, estimates for land use, capital cost, and impact on power generation
4/30/2020 Completed
Report 5, refine the plant model, parametric variations and optimization analyses
12/31/2020 Completed
Final report submitted, update and compilation of previous reports, and recommendation for implementation
Extended from 12/31/2020 to 3/31/2020*
Completed
* BYU identified an opportunity for additional optimization specific to the Hunter plant and was granted a no-cost extension to March 31, 2021, to include the optimization in the final report.
Program Benefits:
Thermal energy collected from a Concentrated Solar Power (“CSP”) plant can be integrated into a traditional power plant (coal, natural gas, etc.) to offset the amount of fossil fuel required for heating. With CSP contributing to the heating load, less fuel is required, resulting in a decrease in fossil fuel cost and emissions. This study will address the viability of integrating CSP with coal-fired power plants including the Hunter Plant in Castle Dale, Utah. To aid in future evaluations, this study will include identifying a general plant model that can be used to determine hybrid feasibility and the optimization of solar integration into a general hybrid plant model. This statement of work outlines the milestones to be achieved during each period. Potential future applications for similar projects: As we learn more about the technology, we will have a better understanding of potential future applications. It is possible that this technology could be deployed at several traditional power plants.
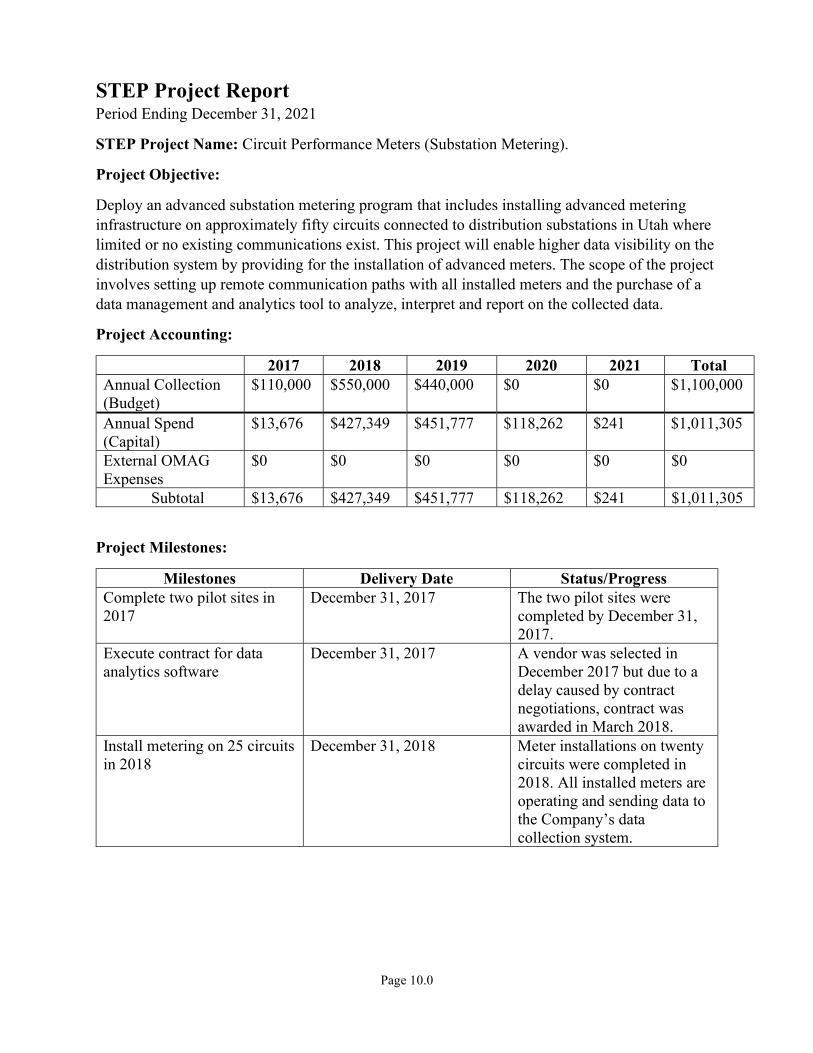
Page 10.0
STEP Project Report Period Ending December 31, 2021
STEP Project Name: Circuit Performance Meters (Substation Metering).
Project Objective:
Deploy an advanced substation metering program that includes installing advanced metering infrastructure on approximately fifty circuits connected to distribution substations in Utah where limited or no existing communications exist. This project will enable higher data visibility on the distribution system by providing for the installation of advanced meters. The scope of the project involves setting up remote communication paths with all installed meters and the purchase of a data management and analytics tool to analyze, interpret and report on the collected data.
Project Accounting:
2017 2018 2019 2020 2021 Total Annual Collection (Budget)
$110,000 $550,000 $440,000 $0 $0 $1,100,000
Annual Spend (Capital)
$13,676 $427,349 $451,777 $118,262 $241 $1,011,305
External OMAG Expenses
$0 $0 $0 $0 $0 $0
Subtotal $13,676 $427,349 $451,777 $118,262 $241 $1,011,305
Project Milestones:
Milestones Delivery Date Status/Progress Complete two pilot sites in 2017
December 31, 2017 The two pilot sites were completed by December 31, 2017.
Execute contract for data analytics software
December 31, 2017 A vendor was selected in December 2017 but due to a delay caused by contract negotiations, contract was awarded in March 2018.
Install metering on 25 circuits in 2018
December 31, 2018 Meter installations on twenty circuits were completed in 2018. All installed meters are operating and sending data to the Company’s data collection system.

Page 10.1
Install metering on 23 circuits in 2019
December 31, 2019 Meter installations on thirty four circuits were completed in 2019. All installed meters are operating and sending data to the Company’s data collection system.
Program Benefits
Enable increasing levels of distributed energy resources on the power grid by economically providing increased visibility on loading levels, load shape, and event information. Information gained will be used to develop interconnection studies and hosting capacities for customers while determining safe switching procedures and cost-effective capital improvement plans.
Assist in preventing load imbalance on a distribution circuit caused by single phase distributed energy resources which can result in three phase voltage imbalance issues and increased potential for unintended circuit breaker operations from elevated neutral currents.
Understand harmonic issues caused by distributed energy resources and take appropriate steps to resolve issues, if any, in a proactive way.
Improve optimization opportunities for capital costs and system losses by providing measurements of per-phase vector quantities for voltage and current.
Identify service quality issues early and allow timely development and implementation of cost-effective mitigation.
Enhance understanding of intermittent generation resources and their impact on the power grid.
Reduce distributed generation interconnection customer approval delays.
Provide customers with circuit information with a higher level of accuracy. Identify and control risks associated with the integration of significant penetration of
distributed energy resources. This includes controlling claims from power quality issues, customer equipment failure, utility/customer equipment damage or impact on customer generation levels.
Recommendations and lessons learned:
See section 11 of the attached final report for recommendations and lessons learned.
Attachments:
Exhibit 10-A: Substation Metering Final Report

Exhibit 10-A Substation Metering Final Report
Page 1 of 15
FINAL REPORT
Final Report Substation Metering
Utah Innovative Technologies Team
Project Sponsor: Rohit Nair
Revision #3
Revision by: Stephen Petersen
Date: February 23, 2022
IAD Originator: Sustainable Transportation and Energy Plan Workgroup

Page 2 of 15
1 Glossary Aliasing – The misidentification of a signal frequency, introducing distortion or error
APN – Access Point Name – Gateway between the cellular network and another computer network. Typical term to reference to the private cellular network utilized by the Company.
Company – Rocky Mountain Power
DER – Distributed Energy Resource – Frequently used to refer to customer owned, and operated energy generation typically used to offset the customer’s load. DER encompasses PV arrays, wind turbines, battery reserves, and cogeneration.
Distribution Circuit – 12.47 kilovolt feeder owned and operated by the Company
Grid Edge – The varying hardware, software and business innovations required to enable a connected infrastructure installed at or near the “edge” of the electric power grid. – Greentech Media
High Penetration Circuit – Distribution circuits that serve customers that produce near the circuits light loading limit.
LAN – Local area network
Meter – Measurement device with the primary purpose of recording customer energy usage. Values are retained by the device are applicable to customer usage and not system behavior
Monitor – Measurement device with the primary purpose of recording system values (Volts, Amps, Energy, and Harmonics)
SCADA – Supervisory control and data acquisition – Typically used in the Company to refer to Operations ability to view measurements and control system with real time impact
STEP – Sustainable Transportation & Energy Plan
Substation Metering & Substation Monitoring – The original project name submitted under the STEP program was Substation Metering; however, the scope and use of devices would be more suitably defined as Substation Monitoring. Consequently, Substation Metering is substituted in the body of the report with Substation Monitoring
Rocky Mountain Power
Page 3 of 15
2 Executive Summary As part of the Sustainable Transportation Energy Plan (STEP), a Utah statute, The Company deployed a substation monitoring system that installed advanced monitors on fifty-three distribution circuits in Utah. The implementation of digital metering with cellular communication provides engineers remote access and fidelity of distribution circuits not available in legacy systems. The digital monitor (Shark 250) data is accessed and retained in SCHOOL and PQView. The Company system of record, SCHOOL, retains data of system loading with PQView facilitating the role of a data analysis tool of harmonic and waveform information. The Substation Monitoring program provides a preliminary iteration of the development of a more interconnected grid by accessing substations with limited or no communication capabilities.
3 Introduction Grid edge monitoring of the electric utility’s distribution network has become a focal point of development for the electric utility industry. The increasing complexity of customers’ expectations of the grid’s capabilities and environmental concerns drives the industry’s increasing focus on system visibility. Achieving comprehensive network monitoring will be best implemented by leveraging the existing capabilities of the distribution equipment augmented by new technology. The Substation Monitoring project funded by STEP emphasized the need to balance the selection of circuits with high levels of DER capacity with substations that would not otherwise obtain communication capabilities.
Legacy systems have access to multiple communication options: Multiple Address Radio (MAS), Advanced Meter Infrastructure Silver Springs Network (AMI), secured utility local area network (LAN), Cellphone modems, and truck rolls. The concept of the Substation Monitoring project was to evaluate the use of cellphone connected monitors to provide a cost-effective expansion of system monitoring. The installation of a MAS or utility managed LAN at every distribution substation within the Company service territory would be cost prohibitive. The Company’s revenue metering system has had a long-standing use of a cellular APN to securely poll meters of high usage customers. The extrapolation of the metering group’s practices was vetted and implemented by the Substation Monitoring project with the goal of expanding the reach of the communication network beyond that of the legacy communication systems. The cellular option allowed for the targeting of circuits that would not practically receive SCADA but still have need of monitoring. The project coordinated with several business and engineering groups to ensure that efforts to expand communication to distribution substations were not duplicated, nor that the existing legacy system would be capable of reaching the selected circuit. The cellular connected digital monitors were not to supplant the operational value of a SCADA connected substation but augment what would be observable on the system.
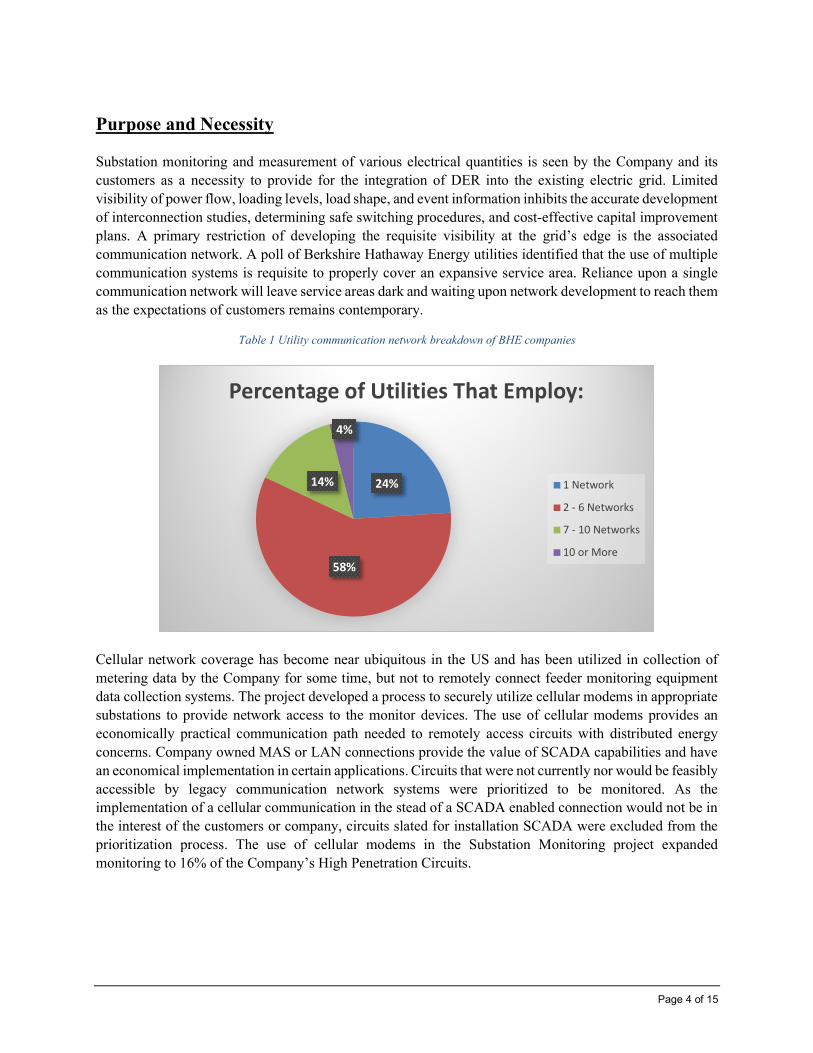
Page 4 of 15
Purpose and Necessity Substation monitoring and measurement of various electrical quantities is seen by the Company and its customers as a necessity to provide for the integration of DER into the existing electric grid. Limited visibility of power flow, loading levels, load shape, and event information inhibits the accurate development of interconnection studies, determining safe switching procedures, and cost-effective capital improvement plans. A primary restriction of developing the requisite visibility at the grid’s edge is the associated communication network. A poll of Berkshire Hathaway Energy utilities identified that the use of multiple communication systems is requisite to properly cover an expansive service area. Reliance upon a single communication network will leave service areas dark and waiting upon network development to reach them as the expectations of customers remains contemporary.
Cellular network coverage has become near ubiquitous in the US and has been utilized in collection of metering data by the Company for some time, but not to remotely connect feeder monitoring equipment data collection systems. The project developed a process to securely utilize cellular modems in appropriate substations to provide network access to the monitor devices. The use of cellular modems provides an economically practical communication path needed to remotely access circuits with distributed energy concerns. Company owned MAS or LAN connections provide the value of SCADA capabilities and have an economical implementation in certain applications. Circuits that were not currently nor would be feasibly accessible by legacy communication network systems were prioritized to be monitored. As the implementation of a cellular communication in the stead of a SCADA enabled connection would not be in the interest of the customers or company, circuits slated for installation SCADA were excluded from the prioritization process. The use of cellular modems in the Substation Monitoring project expanded monitoring to 16% of the Company’s High Penetration Circuits.
24%
58%
14%
4%
Percentage of Utilities That Employ:
1 Network
2 - 6 Networks
7 - 10 Networks
10 or More
Table 1 Utility communication network breakdown of BHE companies
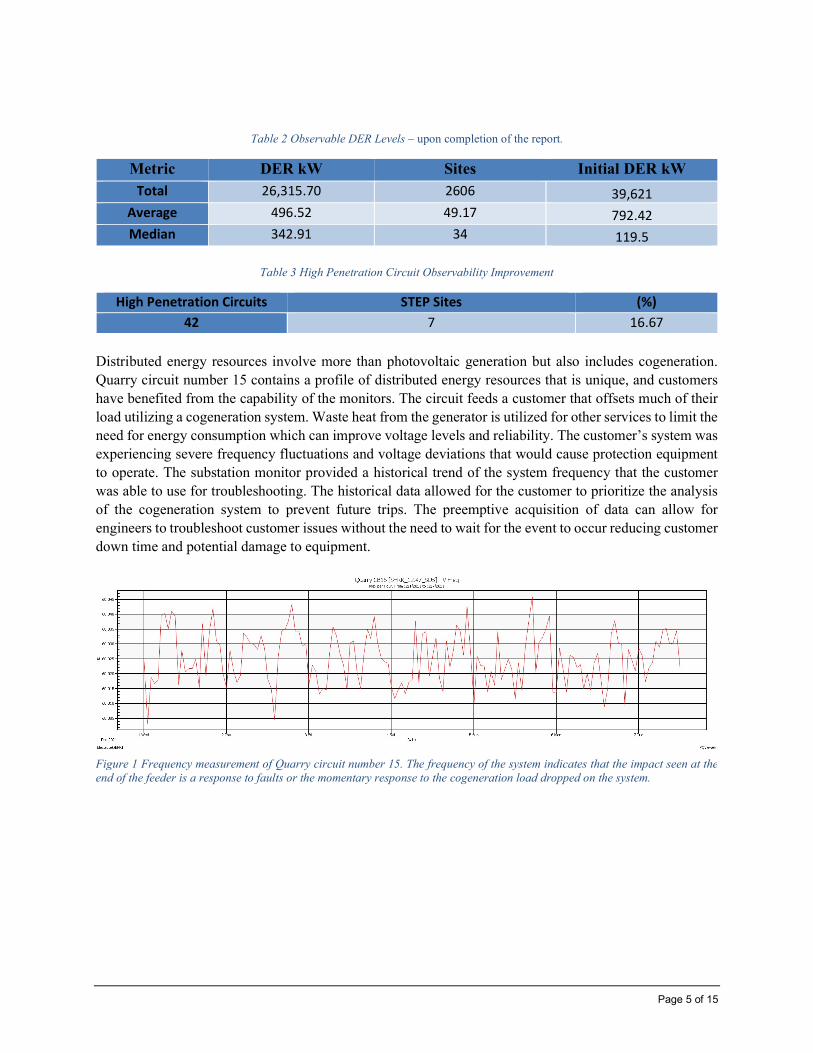
Page 5 of 15
Table 2 Observable DER Levels – upon completion of the report.
Metric DER kW Sites Initial DER kW Total 26,315.70 2606 39,621
Average 496.52 49.17 792.42 Median 342.91 34 119.5
Table 3 High Penetration Circuit Observability Improvement
High Penetration Circuits STEP Sites (%) 42 7 16.67
Distributed energy resources involve more than photovoltaic generation but also includes cogeneration. Quarry circuit number 15 contains a profile of distributed energy resources that is unique, and customers have benefited from the capability of the monitors. The circuit feeds a customer that offsets much of their load utilizing a cogeneration system. Waste heat from the generator is utilized for other services to limit the need for energy consumption which can improve voltage levels and reliability. The customer’s system was experiencing severe frequency fluctuations and voltage deviations that would cause protection equipment to operate. The substation monitor provided a historical trend of the system frequency that the customer was able to use for troubleshooting. The historical data allowed for the customer to prioritize the analysis of the cogeneration system to prevent future trips. The preemptive acquisition of data can allow for engineers to troubleshoot customer issues without the need to wait for the event to occur reducing customer down time and potential damage to equipment.
Figure 1 Frequency measurement of Quarry circuit number 15. The frequency of the system indicates that the impact seen at the end of the feeder is a response to faults or the momentary response to the cogeneration load dropped on the system.

Page 6 of 15
Single phase distributed energy resources can exacerbate load imbalance on a distribution circuit, causing three phase voltage imbalance issues. Circuit imbalances increase the potential of unintended circuit breaker operations from elevated neutral currents. While the power monitors are not capable of directly inhibiting the neutral currents, the information the monitors provide enable engineers to intervene. Huntington City number 12 is a member of the High Penetration Circuit list and had a severe ampere imbalance prior to the installation of the monitor, 96% at the extreme. The circuit imbalance was identified by the field engineer and was mitigated through load balancing measures, resulting in the ampere imbalanced reduced to below 40%. The drastic results of the feeder balancing may not be present within every circuit or appear since the completion of the project; however, the preemptive installation of monitoring to identify emerging concerns is an asset for customers.
The interaction between growing quantities of DERs and distribution system equipment can result in transient and steady state voltage levels reaching unacceptable levels. Understanding the production levels on a circuit can accurately determine the need for effective grounding and fault clearing control schemes, which if not installed appropriately can cause temporary over voltages to customers or circuits improperly protected during fault conditions. The Mountain Green circuit number 11 is an example of voltage levels that are currently monitored to ensure that the steady state does not exceed the Company’s standards.
Figure 2 Current imbalance found on Huntington City circuit number 12 and the accompanying mitigation
Figure 3 Maximum voltage values from Mountain Green circuit number 11. The circuit has been monitored to ensure that the summer voltage levels do not exceed the Company's voltage requirements.
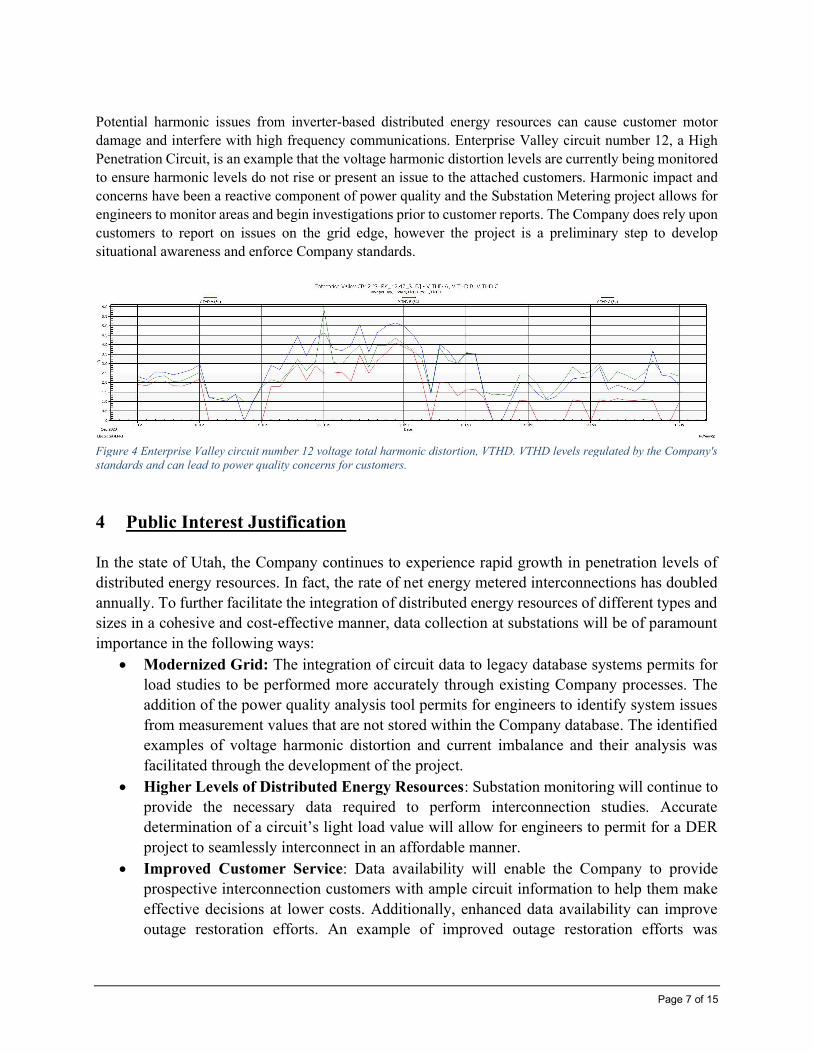
Page 7 of 15
Potential harmonic issues from inverter-based distributed energy resources can cause customer motor damage and interfere with high frequency communications. Enterprise Valley circuit number 12, a High Penetration Circuit, is an example that the voltage harmonic distortion levels are currently being monitored to ensure harmonic levels do not rise or present an issue to the attached customers. Harmonic impact and concerns have been a reactive component of power quality and the Substation Metering project allows for engineers to monitor areas and begin investigations prior to customer reports. The Company does rely upon customers to report on issues on the grid edge, however the project is a preliminary step to develop situational awareness and enforce Company standards.
4 Public Interest Justification
In the state of Utah, the Company continues to experience rapid growth in penetration levels of distributed energy resources. In fact, the rate of net energy metered interconnections has doubled annually. To further facilitate the integration of distributed energy resources of different types and sizes in a cohesive and cost-effective manner, data collection at substations will be of paramount importance in the following ways:
Modernized Grid: The integration of circuit data to legacy database systems permits for load studies to be performed more accurately through existing Company processes. The addition of the power quality analysis tool permits for engineers to identify system issues from measurement values that are not stored within the Company database. The identified examples of voltage harmonic distortion and current imbalance and their analysis was facilitated through the development of the project.
Higher Levels of Distributed Energy Resources: Substation monitoring will continue to provide the necessary data required to perform interconnection studies. Accurate determination of a circuit’s light load value will allow for engineers to permit for a DER project to seamlessly interconnect in an affordable manner.
Improved Customer Service: Data availability will enable the Company to provide prospective interconnection customers with ample circuit information to help them make effective decisions at lower costs. Additionally, enhanced data availability can improve outage restoration efforts. An example of improved outage restoration efforts was
Figure 4 Enterprise Valley circuit number 12 voltage total harmonic distortion, VTHD. VTHD levels regulated by the Company's standards and can lead to power quality concerns for customers.
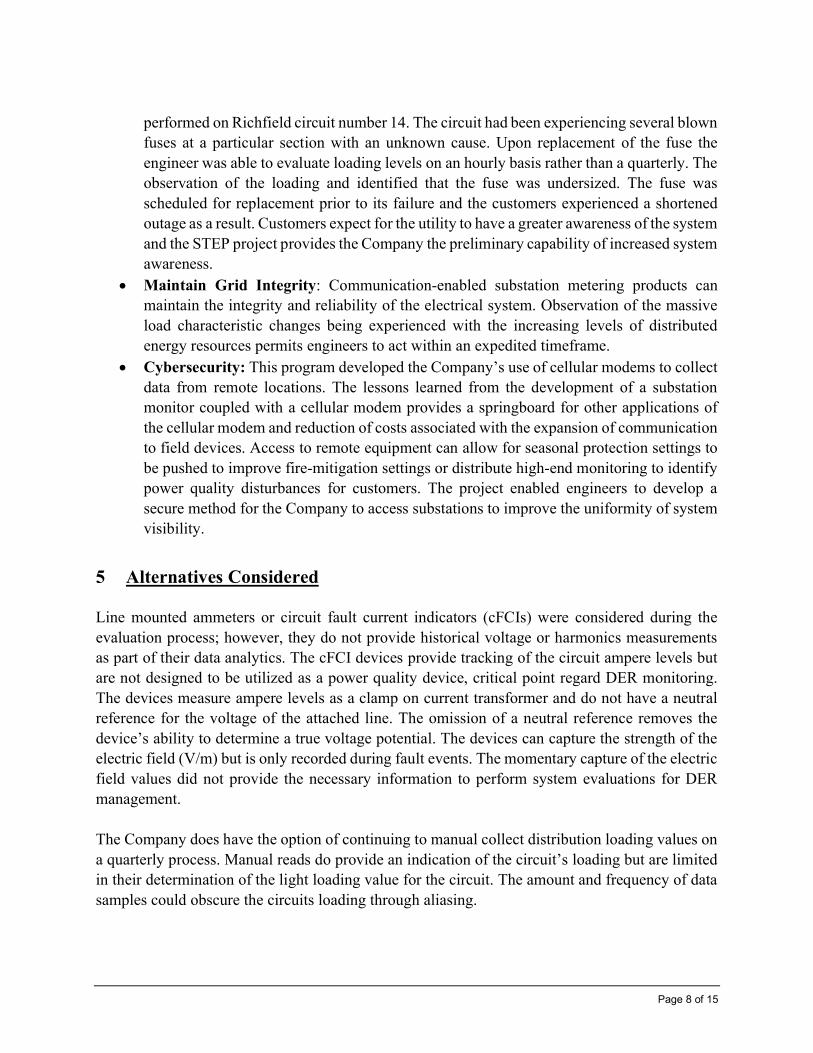
Page 8 of 15
performed on Richfield circuit number 14. The circuit had been experiencing several blown fuses at a particular section with an unknown cause. Upon replacement of the fuse the engineer was able to evaluate loading levels on an hourly basis rather than a quarterly. The observation of the loading and identified that the fuse was undersized. The fuse was scheduled for replacement prior to its failure and the customers experienced a shortened outage as a result. Customers expect for the utility to have a greater awareness of the system and the STEP project provides the Company the preliminary capability of increased system awareness.
Maintain Grid Integrity: Communication-enabled substation metering products can maintain the integrity and reliability of the electrical system. Observation of the massive load characteristic changes being experienced with the increasing levels of distributed energy resources permits engineers to act within an expedited timeframe.
Cybersecurity: This program developed the Company’s use of cellular modems to collect data from remote locations. The lessons learned from the development of a substation monitor coupled with a cellular modem provides a springboard for other applications of the cellular modem and reduction of costs associated with the expansion of communication to field devices. Access to remote equipment can allow for seasonal protection settings to be pushed to improve fire-mitigation settings or distribute high-end monitoring to identify power quality disturbances for customers. The project enabled engineers to develop a secure method for the Company to access substations to improve the uniformity of system visibility.
5 Alternatives Considered Line mounted ammeters or circuit fault current indicators (cFCIs) were considered during the evaluation process; however, they do not provide historical voltage or harmonics measurements as part of their data analytics. The cFCI devices provide tracking of the circuit ampere levels but are not designed to be utilized as a power quality device, critical point regard DER monitoring. The devices measure ampere levels as a clamp on current transformer and do not have a neutral reference for the voltage of the attached line. The omission of a neutral reference removes the device’s ability to determine a true voltage potential. The devices can capture the strength of the electric field (V/m) but is only recorded during fault events. The momentary capture of the electric field values did not provide the necessary information to perform system evaluations for DER management. The Company does have the option of continuing to manual collect distribution loading values on a quarterly process. Manual reads do provide an indication of the circuit’s loading but are limited in their determination of the light loading value for the circuit. The amount and frequency of data samples could obscure the circuits loading through aliasing.
Page 9 of 15
6 Major Project Milestones
Anticipated project start date or actual project start date: January 2017 Final in-service date: December
This project had multiple in-service dates related to the installation of the advanced meters and communications equipment at numerous substations. The installations were scheduled according to a prioritized need starting with areas with high penetrations of distributed energy resources. Additional work included the installation of the communication network and integrating the meters to the data management and analytical tool. The project team recorded the assets as technically complete in SAP as the assets were put into service.
7 Program Closure, Retirement and Removal Information The Substation Monitoring program retains active support from Power Quality, Metering, and vendor technical support through software purchases. The Company currently renews the Shark 250 management software, Communicator PQA, at intervals of 7 years with Electro Industries. The power quality dashboard PQView by Electrotek is budgeted to be renewed annually to ensure the continued development of the analytics software.
If a site does receive SCADA communication or other substation equipment, the Substation Monitoring equipment would be relocated to another distribution substation to retain the system observation obtained through the project.
0123456
1 2 3 4 5 6 7
Ener
gy
Interval of Time
Aliasing Example
Manual Read Actual Loading
Table 4 Example Visual Representation of Manual Reads
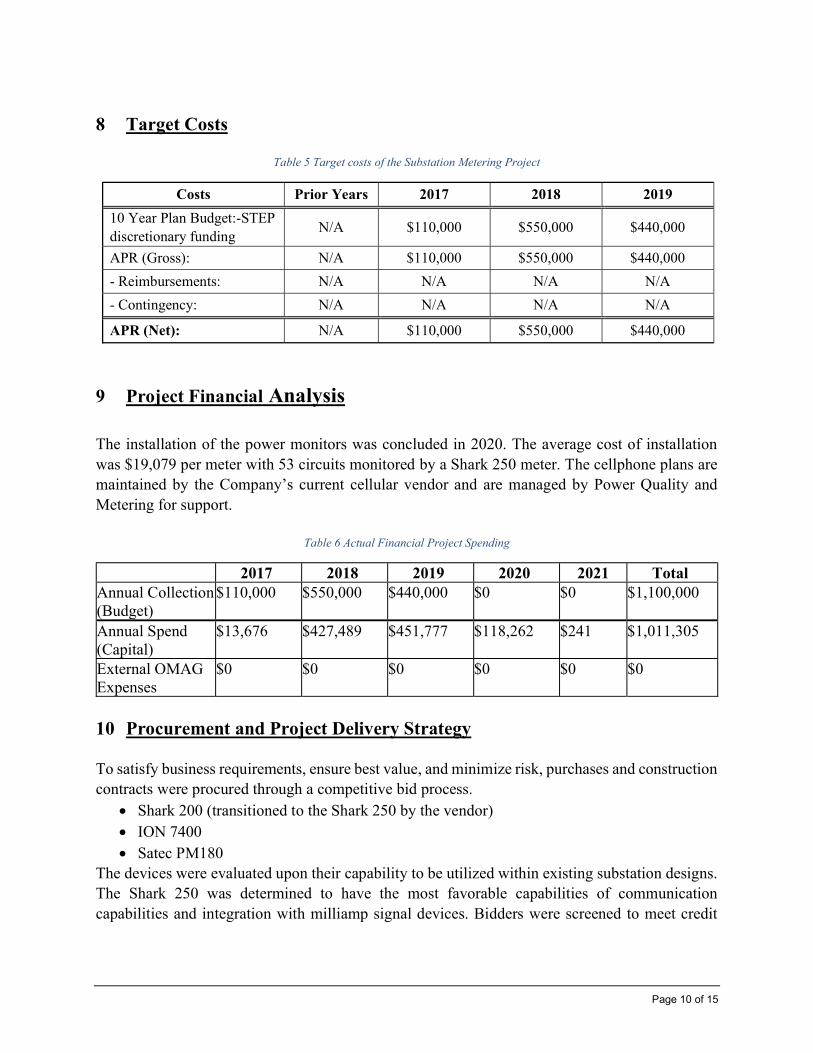
Page 10 of 15
8 Target Costs
Table 5 Target costs of the Substation Metering Project
Costs Prior Years 2017 2018 2019
10 Year Plan Budget:-STEP discretionary funding
N/A $110,000 $550,000 $440,000
APR (Gross): N/A $110,000 $550,000 $440,000
- Reimbursements: N/A N/A N/A N/A
- Contingency: N/A N/A N/A N/A
APR (Net): N/A $110,000 $550,000 $440,000
9 Project Financial Analysis
The installation of the power monitors was concluded in 2020. The average cost of installation was $19,079 per meter with 53 circuits monitored by a Shark 250 meter. The cellphone plans are maintained by the Company’s current cellular vendor and are managed by Power Quality and Metering for support.
Table 6 Actual Financial Project Spending
2017 2018 2019 2020 2021 Total Annual Collection (Budget)
$110,000 $550,000 $440,000 $0 $0 $1,100,000
Annual Spend (Capital)
$13,676 $427,489 $451,777 $118,262 $241 $1,011,305
External OMAG Expenses
$0 $0 $0 $0 $0 $0
10 Procurement and Project Delivery Strategy To satisfy business requirements, ensure best value, and minimize risk, purchases and construction contracts were procured through a competitive bid process.
Shark 200 (transitioned to the Shark 250 by the vendor) ION 7400 Satec PM180
The devices were evaluated upon their capability to be utilized within existing substation designs. The Shark 250 was determined to have the most favorable capabilities of communication capabilities and integration with milliamp signal devices. Bidders were screened to meet credit

Page 11 of 15
and procurement requirements. This process is being managed by the PacifiCorp procurement department. The Shark’s specifications were developed in accordance with applicable engineering specifications and standard designs.
11 Recommendations and Lessons Learned
The installation of advanced substation meters at distribution substations with limited or no communications can be facilitated by the Company cellular APN. The cellular network can provide a cost-effective solution beyond the reach of the MAS/LAN system.
Substation monitors installed as part of this program can provide smaller substations with remote communication capabilities. The small footprint of the communication and monitoring equipment does permit for the equipment to be relocated when legacy system grow into the area later.
The data management system that automatically downloads, analyze and interprets data from the substation monitors does require continued engineering support to maintain operations.
To ensure that all data collected is used to improve the interconnection study process in addition to improving long-term and short-term distribution and transmission planning studies, weekly inspection of meter data acquisition is performed. Ensuring SCHOOL (OSI-Soft) databases are properly populated is the mechanism to incorporate the metering data into the determination of light loading and limits of DER.
APPENDICES
Appendix A – Final list of distribution circuits
Appendix B – Initial list of distribution circuits
Appendix C – Technical requirements
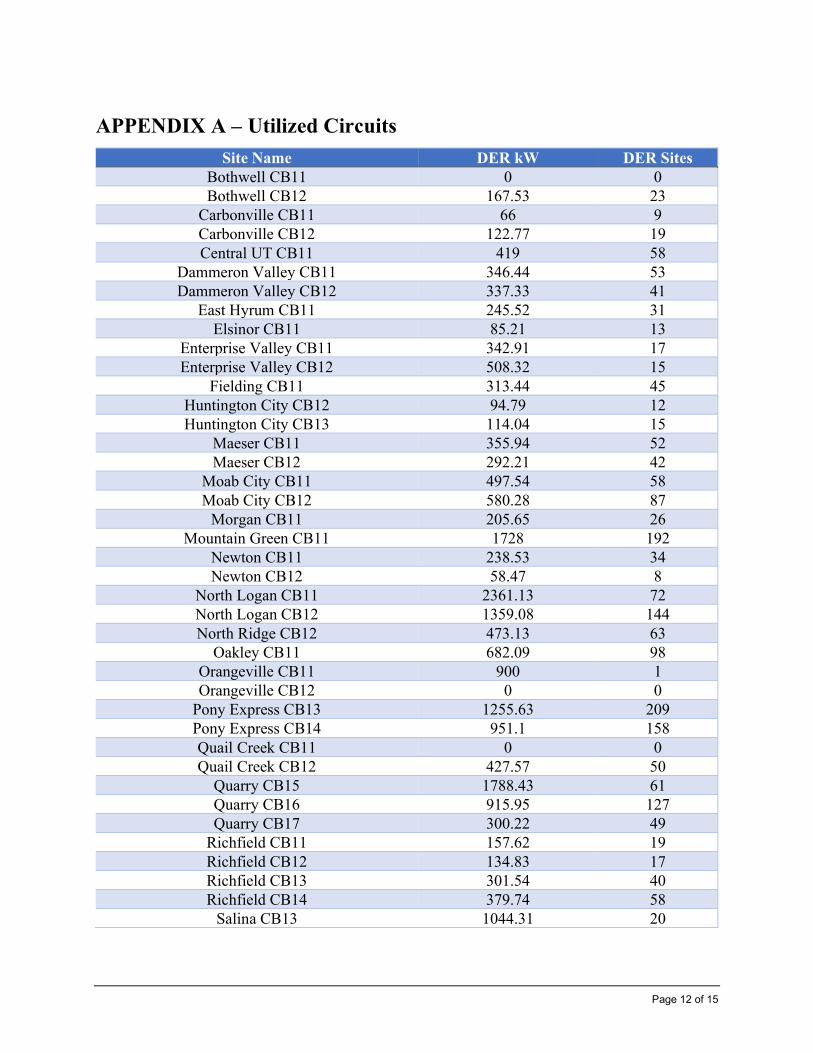
Page 12 of 15
APPENDIX A – Utilized Circuits
Site Name DER kW DER Sites Bothwell CB11 0 0 Bothwell CB12 167.53 23
Carbonville CB11 66 9 Carbonville CB12 122.77 19 Central UT CB11 419 58
Dammeron Valley CB11 346.44 53 Dammeron Valley CB12 337.33 41
East Hyrum CB11 245.52 31 Elsinor CB11 85.21 13
Enterprise Valley CB11 342.91 17 Enterprise Valley CB12 508.32 15
Fielding CB11 313.44 45 Huntington City CB12 94.79 12 Huntington City CB13 114.04 15
Maeser CB11 355.94 52 Maeser CB12 292.21 42
Moab City CB11 497.54 58 Moab City CB12 580.28 87
Morgan CB11 205.65 26 Mountain Green CB11 1728 192
Newton CB11 238.53 34 Newton CB12 58.47 8
North Logan CB11 2361.13 72 North Logan CB12 1359.08 144 North Ridge CB12 473.13 63
Oakley CB11 682.09 98 Orangeville CB11 900 1 Orangeville CB12 0 0
Pony Express CB13 1255.63 209 Pony Express CB14 951.1 158 Quail Creek CB11 0 0 Quail Creek CB12 427.57 50
Quarry CB15 1788.43 61 Quarry CB16 915.95 127 Quarry CB17 300.22 49
Richfield CB11 157.62 19 Richfield CB12 134.83 17 Richfield CB13 301.54 40 Richfield CB14 379.74 58
Salina CB13 1044.31 20
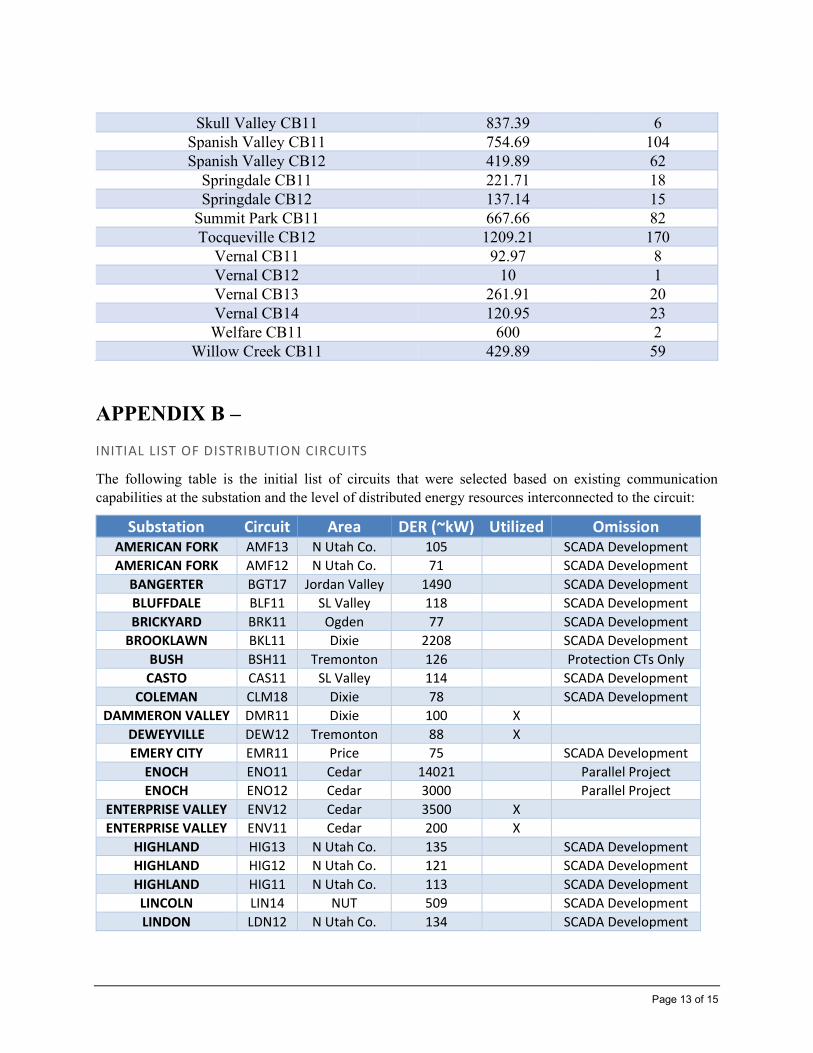
Page 13 of 15
Skull Valley CB11 837.39 6 Spanish Valley CB11 754.69 104 Spanish Valley CB12 419.89 62
Springdale CB11 221.71 18 Springdale CB12 137.14 15
Summit Park CB11 667.66 82 Tocqueville CB12 1209.21 170
Vernal CB11 92.97 8 Vernal CB12 10 1 Vernal CB13 261.91 20 Vernal CB14 120.95 23 Welfare CB11 600 2
Willow Creek CB11 429.89 59
APPENDIX B –
INITIAL LIST OF DISTRIBUTION CIRCUITS
The following table is the initial list of circuits that were selected based on existing communication capabilities at the substation and the level of distributed energy resources interconnected to the circuit:
Substation Circuit Area DER (~kW) Utilized Omission AMERICAN FORK AMF13 N Utah Co. 105 SCADA Development AMERICAN FORK AMF12 N Utah Co. 71 SCADA Development
BANGERTER BGT17 Jordan Valley 1490 SCADA Development BLUFFDALE BLF11 SL Valley 118 SCADA Development BRICKYARD BRK11 Ogden 77 SCADA Development
BROOKLAWN BKL11 Dixie 2208 SCADA Development BUSH BSH11 Tremonton 126 Protection CTs Only
CASTO CAS11 SL Valley 114 SCADA Development COLEMAN CLM18 Dixie 78 SCADA Development
DAMMERON VALLEY DMR11 Dixie 100 X DEWEYVILLE DEW12 Tremonton 88 X EMERY CITY EMR11 Price 75 SCADA Development
ENOCH ENO11 Cedar 14021 Parallel Project ENOCH ENO12 Cedar 3000 Parallel Project
ENTERPRISE VALLEY ENV12 Cedar 3500 X ENTERPRISE VALLEY ENV11 Cedar 200 X
HIGHLAND HIG13 N Utah Co. 135 SCADA Development HIGHLAND HIG12 N Utah Co. 121 SCADA Development HIGHLAND HIG11 N Utah Co. 113 SCADA Development LINCOLN LIN14 NUT 509 SCADA Development LINDON LDN12 N Utah Co. 134 SCADA Development
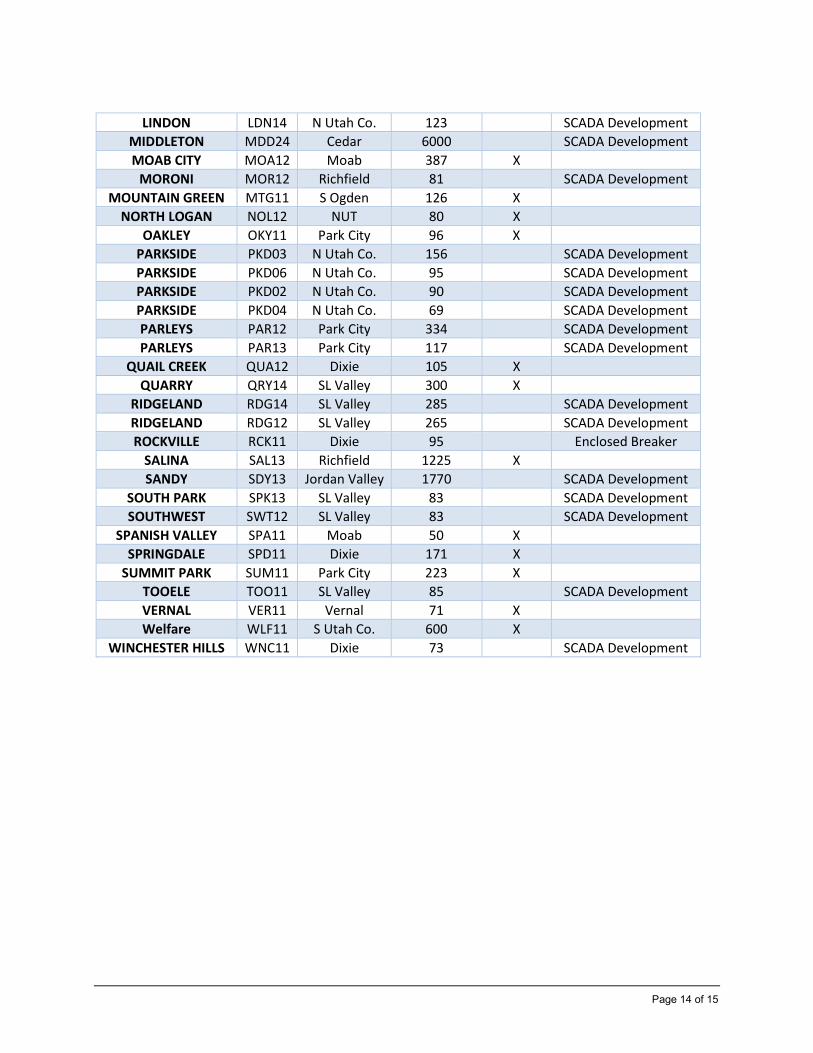
Page 14 of 15
LINDON LDN14 N Utah Co. 123 SCADA Development MIDDLETON MDD24 Cedar 6000 SCADA Development MOAB CITY MOA12 Moab 387 X
MORONI MOR12 Richfield 81 SCADA Development MOUNTAIN GREEN MTG11 S Ogden 126 X
NORTH LOGAN NOL12 NUT 80 X OAKLEY OKY11 Park City 96 X
PARKSIDE PKD03 N Utah Co. 156 SCADA Development PARKSIDE PKD06 N Utah Co. 95 SCADA Development PARKSIDE PKD02 N Utah Co. 90 SCADA Development PARKSIDE PKD04 N Utah Co. 69 SCADA Development PARLEYS PAR12 Park City 334 SCADA Development PARLEYS PAR13 Park City 117 SCADA Development
QUAIL CREEK QUA12 Dixie 105 X QUARRY QRY14 SL Valley 300 X
RIDGELAND RDG14 SL Valley 285 SCADA Development RIDGELAND RDG12 SL Valley 265 SCADA Development ROCKVILLE RCK11 Dixie 95 Enclosed Breaker
SALINA SAL13 Richfield 1225 X SANDY SDY13 Jordan Valley 1770 SCADA Development
SOUTH PARK SPK13 SL Valley 83 SCADA Development SOUTHWEST SWT12 SL Valley 83 SCADA Development
SPANISH VALLEY SPA11 Moab 50 X SPRINGDALE SPD11 Dixie 171 X
SUMMIT PARK SUM11 Park City 223 X TOOELE TOO11 SL Valley 85 SCADA Development VERNAL VER11 Vernal 71 X Welfare WLF11 S Utah Co. 600 X
WINCHESTER HILLS WNC11 Dixie 73 SCADA Development

Page 15 of 15
APPENDIX C – TECHNICAL REQUIREMENTS
1) All installations were engineered, prints issued, and as-built drawings processed. 2) Meters utilized existing current transformers, potential transformers, and meter panel
cutouts where available. Panel modifications were limited to control costs. a. Alternate designs will be available where no convenient panel space is available,
possible using transducer only versions of available meters. 3) All monitors were configured to measure and record all phase quantities in all
quadrants. 4) Monitors were configured so that that the recorded phases are consistent with system
vectors. 5) Installed stand-alone monitors are easily upgradable so that they can be incorporated
into SCADA when it becomes available at the monitoring point at a future time. 6) The monitors will support DNP and IEC 61850 Ethernet and provide at least six analog
outputs each. 7) Monitors can record waveforms of all phases at the same time. 8) Monitors read and store internally per phase: kW, kVAR, current, power factor,
frequency, accumulated energy, harmonics, and recorded waveforms generated when programed limits are exceeded.
9) Monitors can be read by cellular phone. 10) Monitors have adjustable data and storage rates to allow for different levels of
granularity and data intervals. 11) Monitors have the ability to provide live and periodic data reads to be moved into
MV90 so they can be transferred into the SCHOOL PI database.

Page 11.0
STEP Project Report Period Ending December 31, 2021
STEP Project Name: Commercial Line Extension Pilot Program.
Project Objective: Incentivize developers of commercial/industrial property to install electrical backbone within their developments, and provide for Plug-in Electrical Vehicle charging stations.
Project Accounting:
Table 1 gives the budgeted amounts through 2021. Funds are considered committed when the Company has determined the qualifying job costs and the STEP incentive amount. This is the Approved Date in Table 3. When funds are transferred into the job they are included in the Annual Spend (Capital). These correspond to the Paid items in the Status column in Table 3.
Table 1 2017 2018 2019 2020 2021 Total Annual Collection (Budget) $500,000 $500,000 $500,000 $500,000 $500,000 $2,500,000
Annual Spend (Capital)* $0.00 $69,340 $81,743 $110,645 $139,868 $401,596
Committed Funds $0.00 $0.00 $0.00 $0.00 $63,016** $63,016
Uncommitted Funds $0.00 $0.00 $0.00 $0.00 $0.00 $0.00
External OMAG Expenses $0.00 $0.00 $0.00 $0.00 $0.00 $0.00
Subtotal $0.00 $69,340 $81,743 $110,645 $139,868 $401,596
*The annual spend figures correlate to the numbers shown on the accounting information provided on page 1.0 of this report.
**The committed funds shown in 2021 will be paid in calendar year 2022.
Applications Received:
The request for primary voltage facilities also serves as the application for the Commercial Line Extension Pilot Program. When a line extension work request is received, the Company meets with the applicant and determines the nature of the project. The Company receives a wide range of line extension requests. For a request to qualify for the commercial line extension pilot program, the project must include installation of backbone infrastructure, and also not have enough electric service revenue allowances to cover the cost of that backbone. The Company notes that none of the developments receiving STEP funds are additional phases of the same development that had previously received STEP funds under a different phase.

Page 11.1
Table 2 2017 2018 2019 2020 2021 Total Applications Received 2 12 10 8 6 38
Applications Approved 2 12 10 8 6 38
Recipients Receiving Multiple Rewards
0 0 0 0 0 0
Individual Project Details:
In Docket No. 16-035-36, the Commission issued an order on February 6, 2019 approving the Company’s request to increase the per-project incentive payment limit to $250,000 from the previously approved amount of $50,000. The intention of this change was to incentivize larger projects that could benefit from the funds to participate in the program. Larger projects have been more complex, with longer timelines, selling tracts of land for individual larger customers one at a time rather than platting an entire development. The total program budget is $2.5 million over the five-year pilot program period.
As of December 31, 2021, many developments receiving STEP funds were still under construction. At the time of this report no PV charging stations have been installed but two have designated locations. Some developments only include road and utility infrastructure. These developments have no buildings or parking established by the initial developer. No charging station locations have been established at developments without buildings or parking.
Other developments have plans for specific business or buildings as part of the initial development. For those developments where parking is established, charging station locations have been provided as defined by the STEP program. However no independent charging stations have been established. Some individual customers may have charging for their own use.
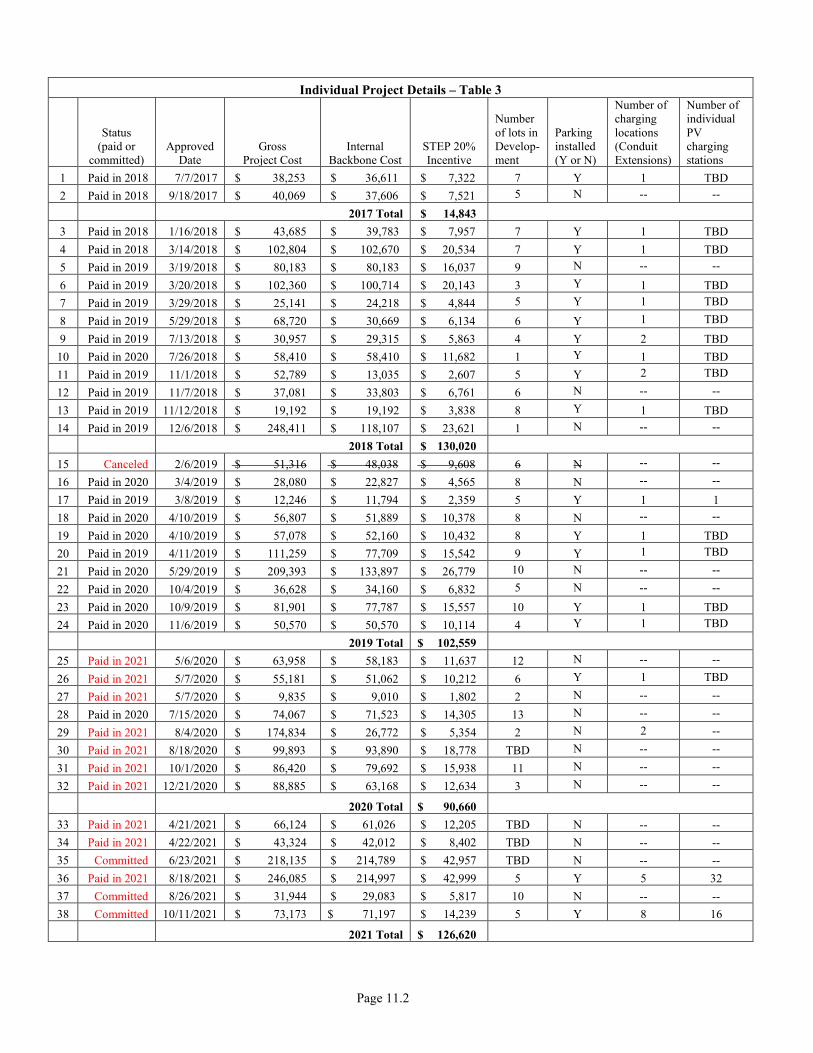
Page 11.2
Individual Project Details – Table 3
Status (paid or
committed) Approved
Date Gross
Project Cost Internal
Backbone Cost STEP 20% Incentive
Number of lots in Develop-ment
Parking installed (Y or N)
Number of charging locations (Conduit Extensions)
Number of individual PV charging stations
1 Paid in 2018 7/7/2017 $ 38,253 $ 36,611 $ 7,322 7 Y 1 TBD 2 Paid in 2018 9/18/2017 $ 40,069 $ 37,606 $ 7,521 5 N -- -- 2017 Total $ 14,843 3 Paid in 2018 1/16/2018 $ 43,685 $ 39,783 $ 7,957 7 Y 1 TBD 4 Paid in 2018 3/14/2018 $ 102,804 $ 102,670 $ 20,534 7 Y 1 TBD 5 Paid in 2019 3/19/2018 $ 80,183 $ 80,183 $ 16,037 9 N -- -- 6 Paid in 2019 3/20/2018 $ 102,360 $ 100,714 $ 20,143 3 Y 1 TBD 7 Paid in 2019 3/29/2018 $ 25,141 $ 24,218 $ 4,844 5 Y 1 TBD 8 Paid in 2019 5/29/2018 $ 68,720 $ 30,669 $ 6,134 6 Y 1 TBD 9 Paid in 2019 7/13/2018 $ 30,957 $ 29,315 $ 5,863 4 Y 2 TBD 10 Paid in 2020 7/26/2018 $ 58,410 $ 58,410 $ 11,682 1 Y 1 TBD 11 Paid in 2019 11/1/2018 $ 52,789 $ 13,035 $ 2,607 5 Y 2 TBD 12 Paid in 2019 11/7/2018 $ 37,081 $ 33,803 $ 6,761 6 N -- -- 13 Paid in 2019 11/12/2018 $ 19,192 $ 19,192 $ 3,838 8 Y 1 TBD 14 Paid in 2019 12/6/2018 $ 248,411 $ 118,107 $ 23,621 1 N -- -- 2018 Total $ 130,020
15 Canceled 2/6/2019 $ 51,316 $ 48,038 $ 9,608 6 N -- -- 16 Paid in 2020 3/4/2019 $ 28,080 $ 22,827 $ 4,565 8 N -- -- 17 Paid in 2019 3/8/2019 $ 12,246 $ 11,794 $ 2,359 5 Y 1 1 18 Paid in 2020 4/10/2019 $ 56,807 $ 51,889 $ 10,378 8 N -- -- 19 Paid in 2020 4/10/2019 $ 57,078 $ 52,160 $ 10,432 8 Y 1 TBD 20 Paid in 2019 4/11/2019 $ 111,259 $ 77,709 $ 15,542 9 Y 1 TBD 21 Paid in 2020 5/29/2019 $ 209,393 $ 133,897 $ 26,779 10 N -- -- 22 Paid in 2020 10/4/2019 $ 36,628 $ 34,160 $ 6,832 5 N -- -- 23 Paid in 2020 10/9/2019 $ 81,901 $ 77,787 $ 15,557 10 Y 1 TBD 24 Paid in 2020 11/6/2019 $ 50,570 $ 50,570 $ 10,114 4 Y 1 TBD 2019 Total $ 102,559
25 Paid in 2021 5/6/2020 $ 63,958 $ 58,183 $ 11,637 12 N -- -- 26 Paid in 2021 5/7/2020 $ 55,181 $ 51,062 $ 10,212 6 Y 1 TBD 27 Paid in 2021 5/7/2020 $ 9,835 $ 9,010 $ 1,802 2 N -- -- 28 Paid in 2020 7/15/2020 $ 74,067 $ 71,523 $ 14,305 13 N -- -- 29 Paid in 2021 8/4/2020 $ 174,834 $ 26,772 $ 5,354 2 N 2 -- 30 Paid in 2021 8/18/2020 $ 99,893 $ 93,890 $ 18,778 TBD N -- -- 31 Paid in 2021 10/1/2020 $ 86,420 $ 79,692 $ 15,938 11 N -- -- 32 Paid in 2021 12/21/2020 $ 88,885 $ 63,168 $ 12,634 3 N -- --
2020 Total $ 90,660 33 Paid in 2021 4/21/2021 $ 66,124 $ 61,026 $ 12,205 TBD N -- -- 34 Paid in 2021 4/22/2021 $ 43,324 $ 42,012 $ 8,402 TBD N -- -- 35 Committed 6/23/2021 $ 218,135 $ 214,789 $ 42,957 TBD N -- -- 36 Paid in 2021 8/18/2021 $ 246,085 $ 214,997 $ 42,999 5 Y 5 32 37 Committed 8/26/2021 $ 31,944 $ 29,083 $ 5,817 10 N -- -- 38 Committed 10/11/2021 $ 73,173 $ 71,197 $ 14,239 5 Y 8 16
2021 Total $ 126,620
Page 11.3
Project Milestones
The Commercial Line Extension Pilot Program review is applied each time a commercial or industrial developer requests installation of primary voltage backbone facilities within their development. Each development is independent, and is evaluated when the developer makes the request for service. Funds are transferred to the individual job upon the developer paying its share of the cost of the development.
Key Challenges, Findings, Results and Lessons Learned:
Program Participation
The Commercial Line Extension Pilot Program was proposed under U.C.A. § 54-20-105(1)(d) to be implemented under Regulation No. 13. The program was designed as a pilot program to encourage developers to install a full electrical backbone within their developments. By installing the electrical backbone upfront, rather than piecemeal over time as the development fills in, the Company could better design the grid for the developments. Backbone infrastructure are primary lines that serve as network facilities and do not include direct assigned facilities or terminal facilities (tap lines, transformers and services), and are not eligible for an allowance under the Company’s standard line extension Regulation No. 12, Section 4. To the extent developers would build within their developments, sites for EV charging will be identified and power made available to those locations. This would encourage adoption of EVs and contribute to the environmental benefits of EV use. The funding provided 20 percent of these eligible backbone costs, with the developer paying 80 percent.
As shown in Table 2 above, the interest in the program was less than anticipated and the number of applicants declined from 2018 to 2021. There are multiple possible reasons for the tepid interest in the program, but the Company believes it has to do with trends within the commercial development market. Anecdotally, PacifiCorp asked one of the largest developers in Utah, which mused the commercial market has transitioned from roads and utilities development, which was the target of the Commercial Line Extension Program to more vertical development. The developer further explained that it is pursuing development of planned buildings and the estimated load for those project does not qualify for Commercial line extension incentives. The values in Table 4 below indicate this may be an overall trend with developers.
Program Benefits
The project was approved in Docket No. 16-035-36 as part of Phase II of the proceeding. During the regulatory approval process, parties discussed the need to quantify the benefits from the project1. There is no proven methodology to isolate and quantify the benefits of doing a backbone installation all at once compared to doing it piecemeal. However, a possible method that has been discussed during the STEP program period is to compare the backbone costs of commercial line extension projects before and during the STEP timeframes.
1 See Docket No. 16-035-36, Direct Testimony, Phase II, of Myunghee Sim Tuttle for Division of Public Utilities filed March 7, 2017 and Phase 2 Rebuttal Testimony of Danny A.C. Martinez for the Office of Consumer Services filed March 28, 2017.
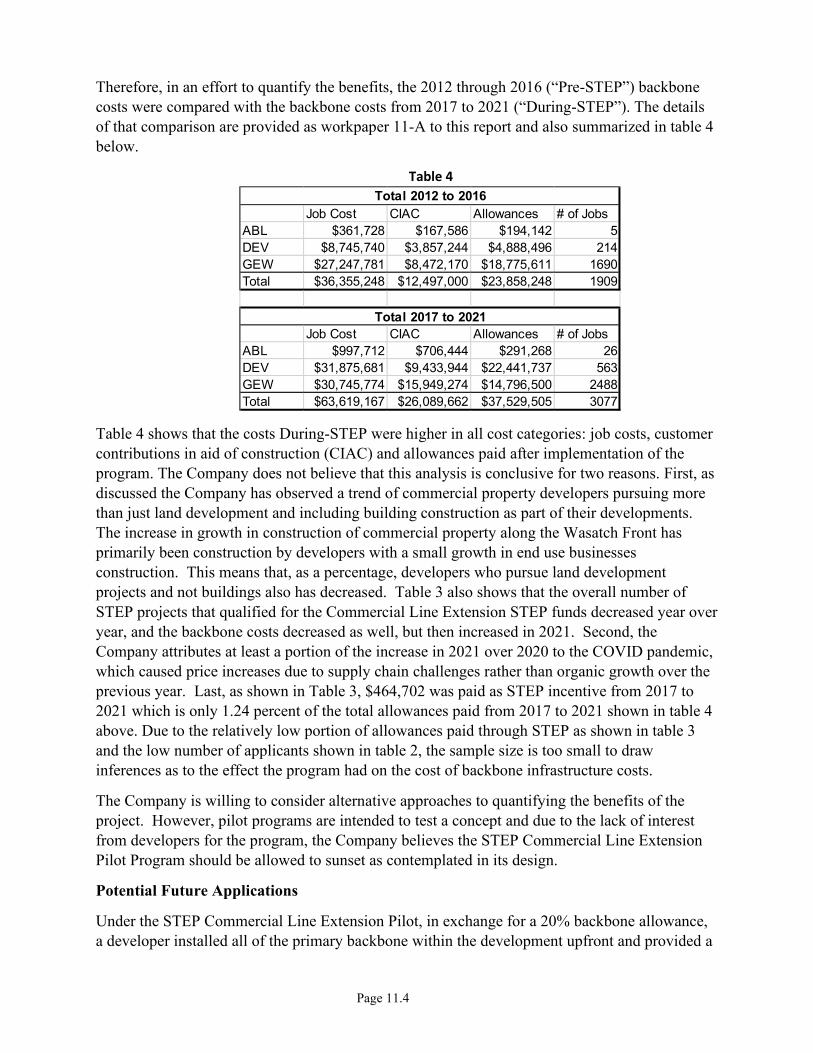
Page 11.4
Therefore, in an effort to quantify the benefits, the 2012 through 2016 (“Pre-STEP”) backbone costs were compared with the backbone costs from 2017 to 2021 (“During-STEP”). The details of that comparison are provided as workpaper 11-A to this report and also summarized in table 4 below.
Table 4
Table 4 shows that the costs During-STEP were higher in all cost categories: job costs, customer contributions in aid of construction (CIAC) and allowances paid after implementation of the program. The Company does not believe that this analysis is conclusive for two reasons. First, as discussed the Company has observed a trend of commercial property developers pursuing more than just land development and including building construction as part of their developments. The increase in growth in construction of commercial property along the Wasatch Front has primarily been construction by developers with a small growth in end use businesses construction. This means that, as a percentage, developers who pursue land development projects and not buildings also has decreased. Table 3 also shows that the overall number of STEP projects that qualified for the Commercial Line Extension STEP funds decreased year over year, and the backbone costs decreased as well, but then increased in 2021. Second, the Company attributes at least a portion of the increase in 2021 over 2020 to the COVID pandemic, which caused price increases due to supply chain challenges rather than organic growth over the previous year. Last, as shown in Table 3, $464,702 was paid as STEP incentive from 2017 to 2021 which is only 1.24 percent of the total allowances paid from 2017 to 2021 shown in table 4 above. Due to the relatively low portion of allowances paid through STEP as shown in table 3 and the low number of applicants shown in table 2, the sample size is too small to draw inferences as to the effect the program had on the cost of backbone infrastructure costs.
The Company is willing to consider alternative approaches to quantifying the benefits of the project. However, pilot programs are intended to test a concept and due to the lack of interest from developers for the program, the Company believes the STEP Commercial Line Extension Pilot Program should be allowed to sunset as contemplated in its design.
Potential Future Applications
Under the STEP Commercial Line Extension Pilot, in exchange for a 20% backbone allowance, a developer installed all of the primary backbone within the development upfront and provided a
Job Cost CIAC Allowances # of JobsABL $361,728 $167,586 $194,142 5DEV $8,745,740 $3,857,244 $4,888,496 214GEW $27,247,781 $8,472,170 $18,775,611 1690Total $36,355,248 $12,497,000 $23,858,248 1909
Job Cost CIAC Allowances # of JobsABL $997,712 $706,444 $291,268 26DEV $31,875,681 $9,433,944 $22,441,737 563GEW $30,745,774 $15,949,274 $14,796,500 2488Total $63,619,167 $26,089,662 $37,529,505 3077
Total 2012 to 2016
Total 2017 to 2021

Page 11.5
location or locations for EV changing station(s) having access to the development’s primary voltage backbone. After all the lots are sold the developer does not control what is built in the development. The installation of EV charging by the developer relies upon the developer maintaining an interest in the development. Future programs promoting EV charging need to link the program benefit with not only making EV charging station installation possible but the actual installation and maintenance of EV charging stations.
Attachments:
• Workpaper 11-A: Historical Data 2017 to 2021
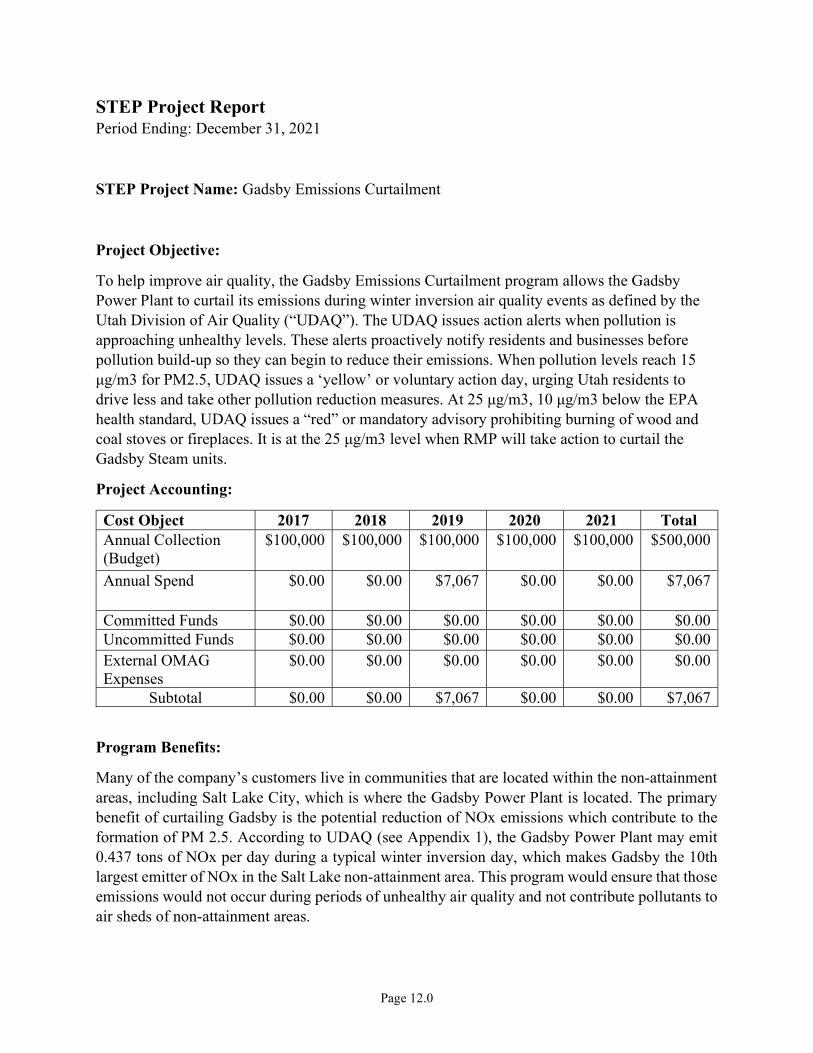
Page 12.0
STEP Project Report Period Ending: December 31, 2021
STEP Project Name: Gadsby Emissions Curtailment
Project Objective:
To help improve air quality, the Gadsby Emissions Curtailment program allows the Gadsby Power Plant to curtail its emissions during winter inversion air quality events as defined by the Utah Division of Air Quality (“UDAQ”). The UDAQ issues action alerts when pollution is approaching unhealthy levels. These alerts proactively notify residents and businesses before pollution build-up so they can begin to reduce their emissions. When pollution levels reach 15 μg/m3 for PM2.5, UDAQ issues a ‘yellow’ or voluntary action day, urging Utah residents to drive less and take other pollution reduction measures. At 25 μg/m3, 10 μg/m3 below the EPA health standard, UDAQ issues a “red” or mandatory advisory prohibiting burning of wood and coal stoves or fireplaces. It is at the 25 μg/m3 level when RMP will take action to curtail the Gadsby Steam units.
Project Accounting:
Cost Object 2017 2018 2019 2020 2021 Total Annual Collection (Budget)
$100,000 $100,000 $100,000 $100,000 $100,000 $500,000
Annual Spend $0.00 $0.00 $7,067 $0.00 $0.00 $7,067
Committed Funds $0.00 $0.00 $0.00 $0.00 $0.00 $0.00 Uncommitted Funds $0.00 $0.00 $0.00 $0.00 $0.00 $0.00 External OMAG Expenses
$0.00 $0.00 $0.00 $0.00 $0.00 $0.00
Subtotal $0.00 $0.00 $7,067 $0.00 $0.00 $7,067
Program Benefits:
Many of the company’s customers live in communities that are located within the non-attainment areas, including Salt Lake City, which is where the Gadsby Power Plant is located. The primary benefit of curtailing Gadsby is the potential reduction of NOx emissions which contribute to the formation of PM 2.5. According to UDAQ (see Appendix 1), the Gadsby Power Plant may emit 0.437 tons of NOx per day during a typical winter inversion day, which makes Gadsby the 10th largest emitter of NOx in the Salt Lake non-attainment area. This program would ensure that those emissions would not occur during periods of unhealthy air quality and not contribute pollutants to air sheds of non-attainment areas.
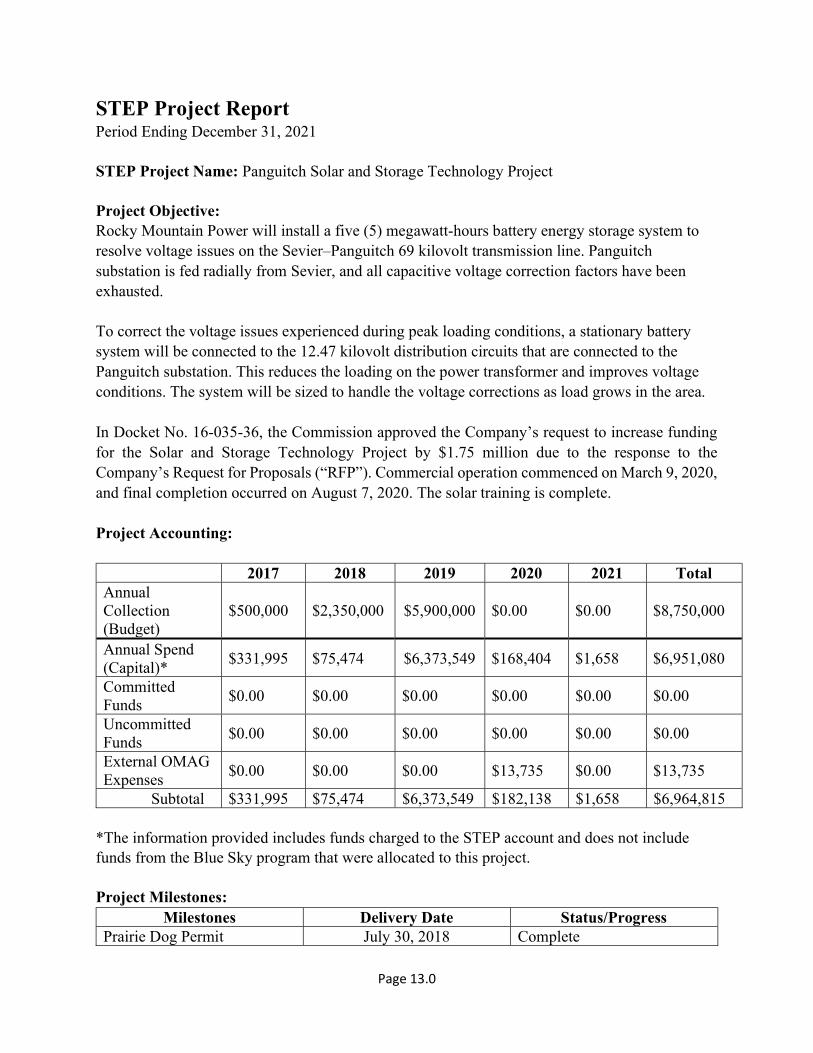
Page 13.0
STEP Project Report Period Ending December 31, 2021 STEP Project Name: Panguitch Solar and Storage Technology Project Project Objective: Rocky Mountain Power will install a five (5) megawatt-hours battery energy storage system to resolve voltage issues on the Sevier–Panguitch 69 kilovolt transmission line. Panguitch substation is fed radially from Sevier, and all capacitive voltage correction factors have been exhausted. To correct the voltage issues experienced during peak loading conditions, a stationary battery system will be connected to the 12.47 kilovolt distribution circuits that are connected to the Panguitch substation. This reduces the loading on the power transformer and improves voltage conditions. The system will be sized to handle the voltage corrections as load grows in the area. In Docket No. 16-035-36, the Commission approved the Company’s request to increase funding for the Solar and Storage Technology Project by $1.75 million due to the response to the Company’s Request for Proposals (“RFP”). Commercial operation commenced on March 9, 2020, and final completion occurred on August 7, 2020. The solar training is complete. Project Accounting:
2017 2018 2019 2020 2021 Total Annual Collection (Budget)
$500,000 $2,350,000 $5,900,000 $0.00 $0.00 $8,750,000
Annual Spend (Capital)*
$331,995 $75,474 $6,373,549 $168,404 $1,658 $6,951,080
Committed Funds
$0.00 $0.00 $0.00 $0.00 $0.00 $0.00
Uncommitted Funds
$0.00 $0.00 $0.00 $0.00 $0.00 $0.00
External OMAG Expenses
$0.00 $0.00 $0.00 $13,735 $0.00 $13,735
Subtotal $331,995 $75,474 $6,373,549 $182,138 $1,658 $6,964,815 *The information provided includes funds charged to the STEP account and does not include funds from the Blue Sky program that were allocated to this project. Project Milestones:
Milestones Delivery Date Status/Progress Prairie Dog Permit July 30, 2018 Complete

Page 13.1
Small Generation Interconnection Agreement – Finalized
June 4, 2018 Complete
Award an engineering, procurement and construction (EPC) contract.
February 22, 2019 Complete
EPC Design Complete August 1, 2019 Complete EPC Major Equipment Delivered
September 3, 2019 Complete
Construction Complete November 1, 2019 Complete Commercial Operation Begins
March 9, 2020 Complete
Final Completion August 7, 2020 Complete Key Challenges, Findings, Results and Lessons Learned:
Description of Investment
Anticipated Outcome
Challenges Findings Results Lessons Learned
a. Enable Investment Tax Credit (ITC)
Utility will operate the solar and battery system to address system issues as well as capture ITC benefits
System not original designed for such capability
The battery and solar control architecture was not initially designed to accommodate ITC requirements
Control architecture changes were implemented on January 21, 2020
During design and setting of design criteria include ITC philosophy in specification and controls
b. Interconnection cost increases
N/A Tight labor market for procurement of contractors (and with required schedule); Nine poles required replacement from Panguitch Substation to the site
Contractor cost increases; Communication costs and labor higher than originally estimated
Passage of time also impacted estimates; in the end interconnection costs increased significantly
Detailed loading information and field inspection may be needed to accurately estimate interconnection costs.
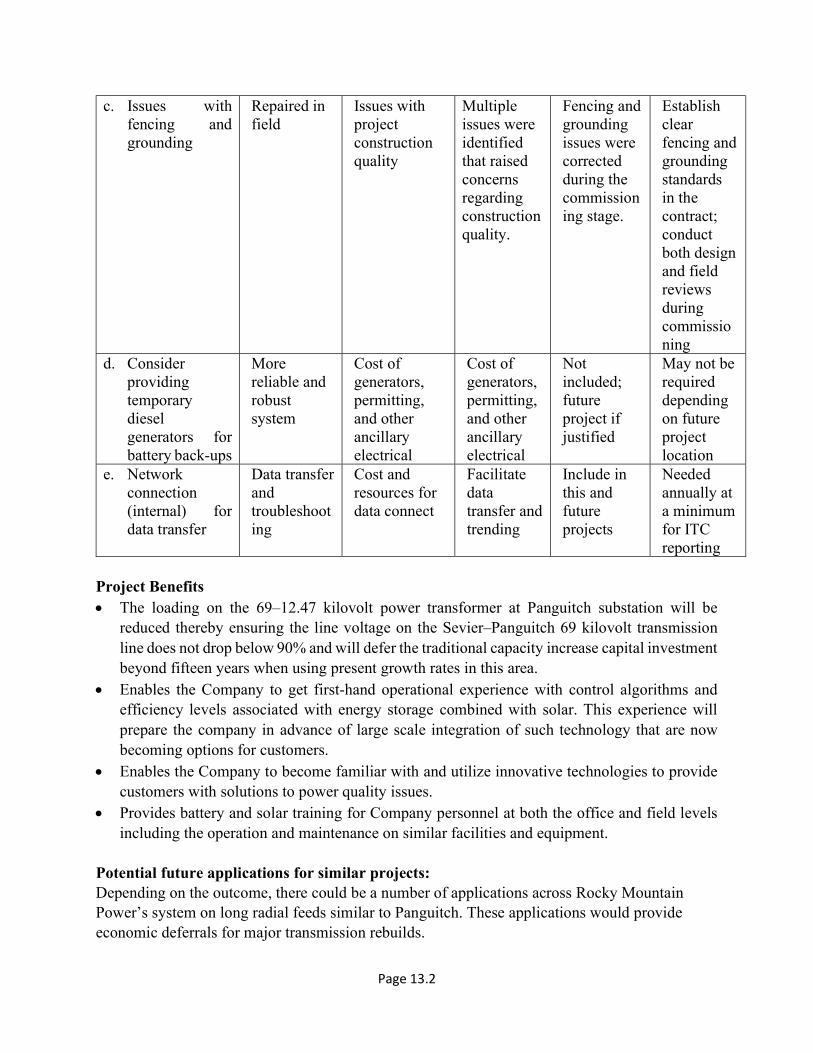
Page 13.2
c. Issues with fencing and grounding
Repaired in field
Issues with project construction quality
Multiple issues were identified that raised concerns regarding construction quality.
Fencing and grounding issues were corrected during the commissioning stage.
Establish clear fencing and grounding standards in the contract; conduct both design and field reviews during commissioning
d. Consider providing temporary diesel generators for battery back-ups
More reliable and robust system
Cost of generators, permitting, and other ancillary electrical
Cost of generators, permitting, and other ancillary electrical
Not included; future project if justified
May not be required depending on future project location
e. Network connection (internal) for data transfer
Data transfer and troubleshooting
Cost and resources for data connect
Facilitate data transfer and trending
Include in this and future projects
Needed annually at a minimum for ITC reporting
Project Benefits The loading on the 69–12.47 kilovolt power transformer at Panguitch substation will be
reduced thereby ensuring the line voltage on the Sevier–Panguitch 69 kilovolt transmission line does not drop below 90% and will defer the traditional capacity increase capital investment beyond fifteen years when using present growth rates in this area.
Enables the Company to get first-hand operational experience with control algorithms and efficiency levels associated with energy storage combined with solar. This experience will prepare the company in advance of large scale integration of such technology that are now becoming options for customers.
Enables the Company to become familiar with and utilize innovative technologies to provide customers with solutions to power quality issues.
Provides battery and solar training for Company personnel at both the office and field levels including the operation and maintenance on similar facilities and equipment.
Potential future applications for similar projects: Depending on the outcome, there could be a number of applications across Rocky Mountain Power’s system on long radial feeds similar to Panguitch. These applications would provide economic deferrals for major transmission rebuilds.

Page 13.3
Attachments: • Exhibit 13-A: Supplemental Rocky Mountain Power Final Report Dated April 18, 2022

Exhibit 13-A Supplemental Panguitch Final Report

Panguitch Solar + Storage | 2021 Project Report
PANGUITCH SOLAR + STORAGE PROJECT REPORT
Author: Rohit Nair
Approval:
Authoring Department:
File Number-Name: Panguitch_Report.docx
Date: 18 April 2022

Panguitch Solar + Storage | 2021 Project Report
PANGUITCH SOLAR + STORAGE 2021 PROJECT REPORT TABLE OF CONTENTS
1 SUMMARY ..............................................................................................................................1
2 BACKGROUND ......................................................................................................................1
3 INITIAL IMPLEMENTATION ............................................................................................1
4 FINANCIAL SUMMARY ......................................................................................................3
4.1 Preliminary Cost Analysis ...................................................................................................3
4.2 Project Funding ...................................................................................................................3
5 ENGINEER-PROCURE-CONSTRUCT ..............................................................................5
6 OBSERVATIONS ...................................................................................................................6
7 LESSONS LEARNED ............................................................................................................7
8 SUPPLEMENTAL INFORMATION ...................................................................................8
8.1 Project Location ..................................................................................................................8
8.2 Investment Tax Credits .......................................................................................................8
8.3 Project Cost Overages .........................................................................................................8
8.4 Project Performance ............................................................................................................9
8.5 Diesel Generators ..............................................................................................................10
8.6 SCADA connectivity ........................................................................................................10
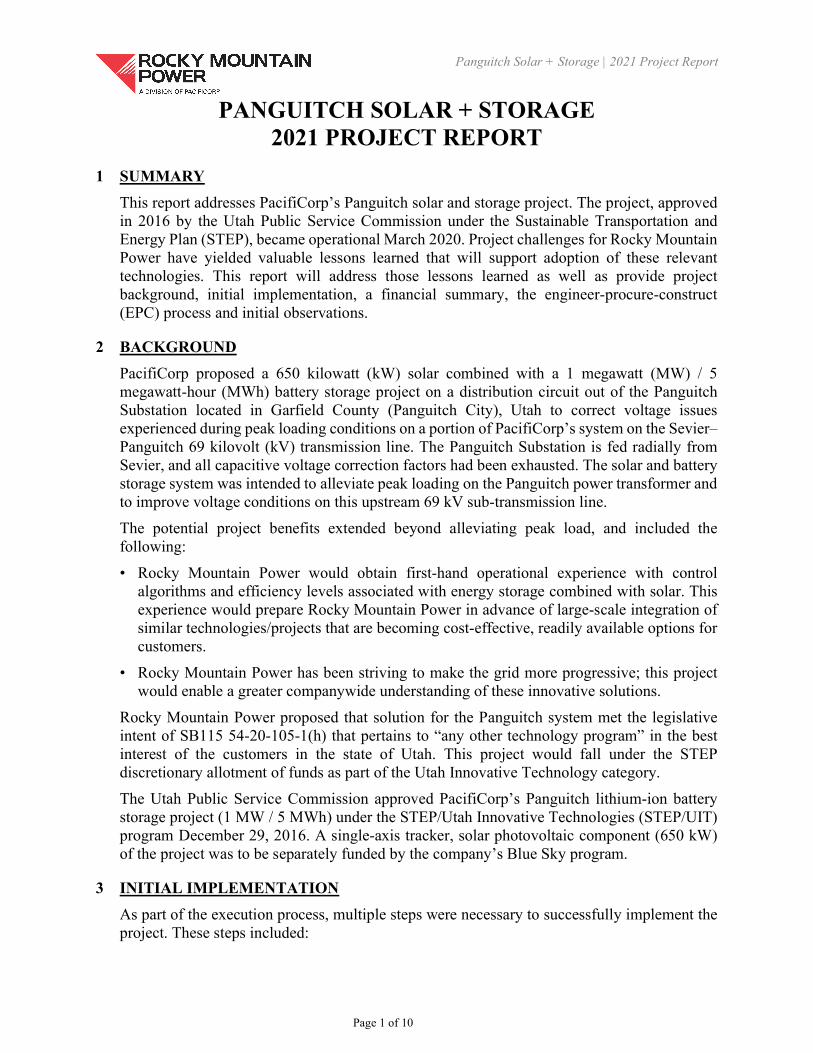
Panguitch Solar + Storage | 2021 Project Report
Page 1 of 10
PANGUITCH SOLAR + STORAGE 2021 PROJECT REPORT
1 SUMMARY
This report addresses PacifiCorp’s Panguitch solar and storage project. The project, approved in 2016 by the Utah Public Service Commission under the Sustainable Transportation and Energy Plan (STEP), became operational March 2020. Project challenges for Rocky Mountain Power have yielded valuable lessons learned that will support adoption of these relevant technologies. This report will address those lessons learned as well as provide project background, initial implementation, a financial summary, the engineer-procure-construct (EPC) process and initial observations.
2 BACKGROUND
PacifiCorp proposed a 650 kilowatt (kW) solar combined with a 1 megawatt (MW) / 5 megawatt-hour (MWh) battery storage project on a distribution circuit out of the Panguitch Substation located in Garfield County (Panguitch City), Utah to correct voltage issues experienced during peak loading conditions on a portion of PacifiCorp’s system on the Sevier–Panguitch 69 kilovolt (kV) transmission line. The Panguitch Substation is fed radially from Sevier, and all capacitive voltage correction factors had been exhausted. The solar and battery storage system was intended to alleviate peak loading on the Panguitch power transformer and to improve voltage conditions on this upstream 69 kV sub-transmission line.
The potential project benefits extended beyond alleviating peak load, and included the following:
• Rocky Mountain Power would obtain first-hand operational experience with control algorithms and efficiency levels associated with energy storage combined with solar. This experience would prepare Rocky Mountain Power in advance of large-scale integration of similar technologies/projects that are becoming cost-effective, readily available options for customers.
• Rocky Mountain Power has been striving to make the grid more progressive; this project would enable a greater companywide understanding of these innovative solutions.
Rocky Mountain Power proposed that solution for the Panguitch system met the legislative intent of SB115 54-20-105-1(h) that pertains to “any other technology program” in the best interest of the customers in the state of Utah. This project would fall under the STEP discretionary allotment of funds as part of the Utah Innovative Technology category.
The Utah Public Service Commission approved PacifiCorp’s Panguitch lithium-ion battery storage project (1 MW / 5 MWh) under the STEP/Utah Innovative Technologies (STEP/UIT) program December 29, 2016. A single-axis tracker, solar photovoltaic component (650 kW) of the project was to be separately funded by the company’s Blue Sky program.
3 INITIAL IMPLEMENTATION
As part of the execution process, multiple steps were necessary to successfully implement the project. These steps included:

Panguitch Solar + Storage | 2021 Project Report
Page 2 of 10
Rocky Mountain Power initiated a Request for Qualification (RFQ) and Request for Proposal (RFP) to identify an Owner’s Engineer (OE). As part of the process, POWER Engineers was identified as the most qualified vendor and a contract was executed to assign POWER Engineers as the OE. The responsibility of the OE was to provide technical engineering guidance to define the scope of services, identify risks, anticipate challenges and propose technical solutions.
The OE developed a model to assess the solution proposed by Rocky Mountain Power to resolve the voltage issue. The model validated Rocky Mountain Power’s proposal to solve the voltage issue by installing a 650 kW solar and 1 MW / 5 MWh energy storage project.
The OE developed detailed technical specifications required to be complied with by the project developer.
Rocky Mountain Power submitted interconnection requests for both the solar and energy storage projects. Both interconnection requests received approvals in April 2018.
Rocky Mountain Power purchased land for the project installation (see Figure 1). Rocky Mountain Power also engaged with community leaders to help them understand the value of this project for the community.
Rocky Mountain Power released an RFP to nine preselected vendors with experience in executing EPC contracts for energy storage and/or solar projects. Rocky Mountain Power received an affirmative response from two vendors. Subsequently, both vendors submitted their final bids through the Rocky Mountain Power’s e-Auction process, however only one vendor submitted a detailed bid.
The project EPC contract was awarded to Overland Contracting Inc. (OCI, Black & Veatch’s EPC company) in early in 2019 to engineer, procure and construct the project.
Rocky Mountain Power negotiated with the EPC contractor to determine contract terms and final pricing. As part of this effort, Rocky Mountain Power successfully reduced cost of the overall bid by making modifications to engineering design and material sourcing.
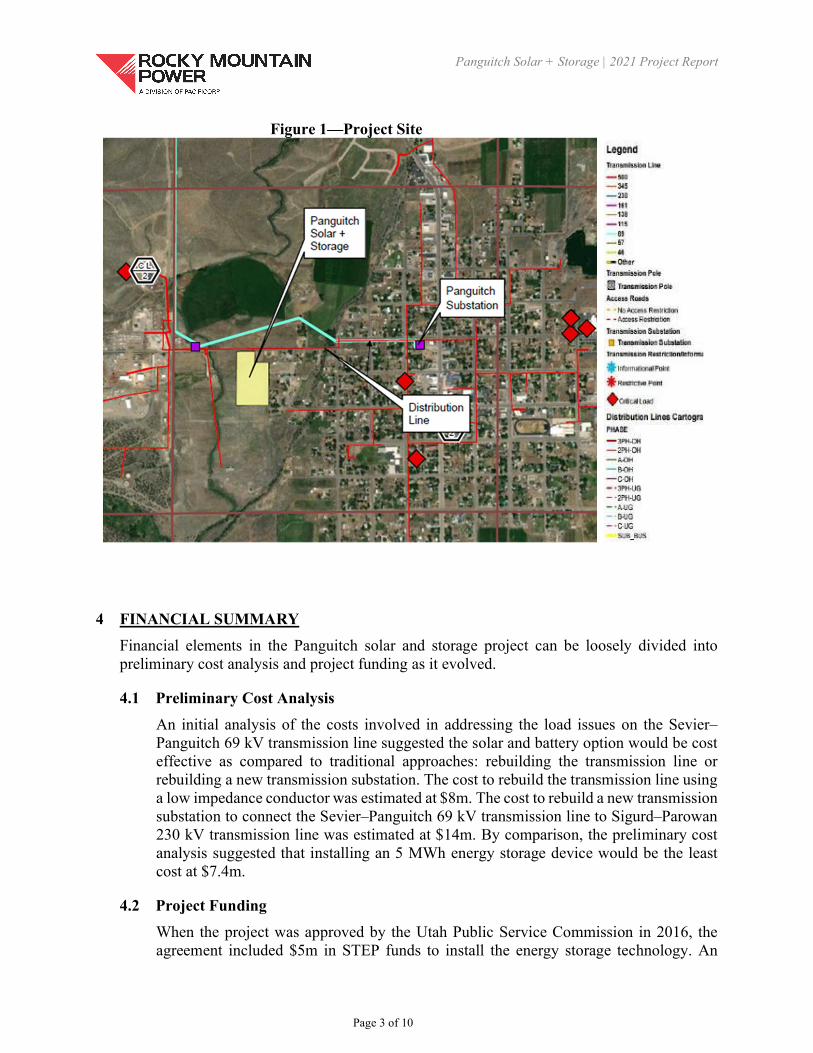
Panguitch Solar + Storage | 2021 Project Report
Page 3 of 10
Figure 1—Project Site
4 FINANCIAL SUMMARY
Financial elements in the Panguitch solar and storage project can be loosely divided into preliminary cost analysis and project funding as it evolved.
4.1 Preliminary Cost Analysis
An initial analysis of the costs involved in addressing the load issues on the Sevier–Panguitch 69 kV transmission line suggested the solar and battery option would be cost effective as compared to traditional approaches: rebuilding the transmission line or rebuilding a new transmission substation. The cost to rebuild the transmission line using a low impedance conductor was estimated at $8m. The cost to rebuild a new transmission substation to connect the Sevier–Panguitch 69 kV transmission line to Sigurd–Parowan 230 kV transmission line was estimated at $14m. By comparison, the preliminary cost analysis suggested that installing an 5 MWh energy storage device would be the least cost at $7.4m.
4.2 Project Funding
When the project was approved by the Utah Public Service Commission in 2016, the agreement included $5m in STEP funds to install the energy storage technology. An

Panguitch Solar + Storage | 2021 Project Report
Page 4 of 10
additional $2m from Blue Sky community project funds was approved for a company-owned solar project at the same location.
Rocky Mountain Power was able to secure cost savings through reduction in project management and interconnection equipment costs; however, the overall price of procuring and installing the solar and energy storage system was higher than the initial 2016 funding request. Factors that caused the increase in costs included, but were not limited to: impact of trade tariffs on imported energy storage and solar materials, increase in contractor costs for project solar and storage integration and commercial risks, increased cost for battery storage due to high demand and limited supply, and higher construction due to low unemployment and higher labor costs, as well as any other costs that might not have been considered in the previous cost estimate. The budget was revised to an overall project estimate of $8.5m. (The estimated cost of resolving the voltage issue using traditional capital investments in the form of poles, wires and/or substations was revised from $8 to $8.75m, based on $2018 current market costs.)
As reported in March of 2020, per Docket No. 16-035-36, the Utah Public Service Commission approved PacifiCorp’s request to increase funding for the Solar and Storage Technology Project by $1.75m due to the response to PacifiCorp’s request for proposals (RFP). More specific detail on the project accounting appears in Table 1.

Panguitch Solar + Storage | 2021 Project Report
Page 5 of 10
Table 1—Project Accounting
2017 2018 2019 2020 Total
Annual Collection (Budget)
$500,000 $2,350,000 $5,900,000 $0 $8,750,000
Annual Spend (Capital) $331,995 $75,474 $8,313,775 $168,404 $8,889,648
Committed Funds $0.00 $0.00 $0.00 $0.00 $0.00
Uncommitted Funds $0.00 $0.00 $0.00 $0.00 $0.00
External OMAG Expenses
$0.00 $0.00 $0.00 $13,735 $13,735
Subtotal $331,995 $75,474 $8,313,775 $182,138 $8,964,429
5 ENGINEER-PROCURE-CONSTRUCT
After the contract was awarded to OCI, construction was completed on November 5, 2019. A timeline appears in Table 2.
Table 2—EPC Milestones
Milestones Delivery Date Status/Progress Award EPC Contract February 22, 2019 Complete EPC Design Complete August 1, 2019 Complete EPC Major Equipment Procured and Delivered
September 3, 2019 Complete
Construction Complete November 5, 2019 Complete Commercial Operation Date November 15, 2019 March 9, 2020
The OCI EPC design project work consisted first of verification of system design criteria, then primarily of multiple reviews and finalization of engineering drawings (67 total) and included internal coordination with the Rocky Mountain Power interconnection team. Significant drawings included the electrical one-line and site plan. As system and subsystem designs were completed, the associated equipment was procured by OCI. Major project equipment and subsystems (and controls) through all phases of the EPC contract included: electrical; single-axis tracker photovoltaic, lithium-ion battery energy storage; battery and backup power; and control buildings. Electrical systems also included switchgear, transformers and various panels / enclosures. Solar and battery systems included inverters and additional control systems. Other balance of plant systems included communications, fire protection and a meteorological station.
Once design and procurement were nearing completion, OCI site construction began. Most permitting occurred before or concurrent with design and procurement, except for the Stormwater Pollution Prevent Plan permit (SWPPP), which was obtained immediately before site construction commenced. The general sequence of construction commenced with clearing and leveling of the property and installation of fencing including a main access gate. The next stage (civil) consisted of underground electrical, grounding grid, and the placement of 11 concrete foundations including two battery energy storage containers, two transformers and multiple cabinets / panels. Subsequently, most of the large equipment including one control building and two battery energy storage containers were installed, followed by loading of the lithium-ion batteries. Steel posts and other horizontal components, and tracking motors and sensors, for the solar modules and panels were installed shortly thereafter. Rocky Mountain Power installed wooden poles and other equipment for interconnection, and an additional control building. All electrical and control wire (including for the solar modules) were pulled,
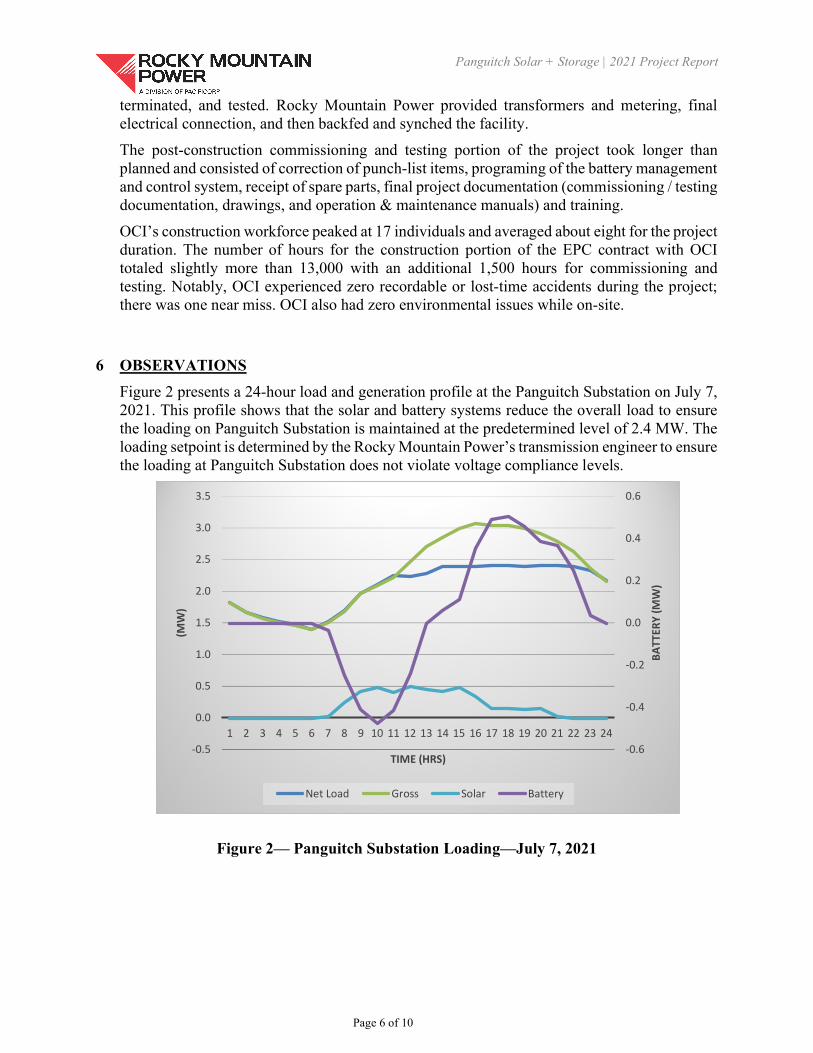
Panguitch Solar + Storage | 2021 Project Report
Page 6 of 10
terminated, and tested. Rocky Mountain Power provided transformers and metering, final electrical connection, and then backfed and synched the facility.
The post-construction commissioning and testing portion of the project took longer than planned and consisted of correction of punch-list items, programing of the battery management and control system, receipt of spare parts, final project documentation (commissioning / testing documentation, drawings, and operation & maintenance manuals) and training.
OCI’s construction workforce peaked at 17 individuals and averaged about eight for the project duration. The number of hours for the construction portion of the EPC contract with OCI totaled slightly more than 13,000 with an additional 1,500 hours for commissioning and testing. Notably, OCI experienced zero recordable or lost-time accidents during the project; there was one near miss. OCI also had zero environmental issues while on-site.
6 OBSERVATIONS
Figure 2 presents a 24-hour load and generation profile at the Panguitch Substation on July 7, 2021. This profile shows that the solar and battery systems reduce the overall load to ensure the loading on Panguitch Substation is maintained at the predetermined level of 2.4 MW. The loading setpoint is determined by the Rocky Mountain Power’s transmission engineer to ensure the loading at Panguitch Substation does not violate voltage compliance levels.
Figure 2— Panguitch Substation Loading—July 7, 2021
-0.6
-0.4
-0.2
0.0
0.2
0.4
0.6
-0.5
0.0
0.5
1.0
1.5
2.0
2.5
3.0
3.5
1 2 3 4 5 6 7 8 9 10 11 12 13 14 15 16 17 18 19 20 21 22 23 24
BATT
ERY
(MW
)
(MW
)
TIME (HRS)
Net Load Gross Solar Battery

Panguitch Solar + Storage | 2021 Project Report
Page 7 of 10
7 LESSONS LEARNED
Description of Investment
Anticipated Outcome
Challenges Findings Results Lessons Learned
Enable Investment Tax Credit (ITC)
Utility will operate the solar and battery system to address system issues as well as capture ITC benefits
System not original designed for such capability
The battery and solar control architecture were not initially designed to accommodate ITC requirements
Control architecture changes were implemented on January 21, 2020
During design and setting of design criteria include ITC philosophy in specification and controls
Interconnection cost increases
N/A Tight labor market for procurement of contractors (and with required schedule); nine poles required replacement from Panguitch Substation to the site
Contractor cost increases: communication costs and labor were higher than originally estimated
Passage of time also impacted estimates; in the end, interconnection costs increased significantly
Detailed loading information and field inspection may be needed to accurately estimate interconnection costs
Issues with fencing and grounding
Repaired in the field Issues with project construction quality
Multiple issues were identified that raised concerns regarding construction quality
Fencing and grounding issues were corrected during the commissioning stage
Establish clear fencing and grounding standards in the contract; conduct both design and field reviews during commissioning
Consider providing temporary diesel generators for battery backups
More reliable and robust system
Cost of generators, permitting (emissions) and other ancillary electrical
Cost of generators, permitting and other ancillary electrical
Not included, future project if justified
May not be required depending on future project location
Enable SCADA connectivity
Added after project commissioning was completed
No remote control capability for Rocky Mountain Power dispatch operators
N/A Completed SCADA connectivity
This is a MUST to ensure dispatch operators have complete control on battery dispatchability
Ensure access to battery software system
Remote access to battery control system software to monitor battery and solar activity
Requires field crew to drive from nearest service center to clear alarms/faults on the battery system
Firewalls and cybersecurity protocols for accessing the software should be determined during planning process
Rocky Mountain Power is currently working with the battery supplier to ensure remote accessibility to the software
Required to ensure accurate monitoring and battery control system alarms / faults can be cleared remotely
Data integrity Battery control system data is aligned with Rocky Mountain Power’s SCADA data
Confusion created due to data discrepancy
Discrepancy in data due to various issues such as scaling, data points mismatch, etc.
Battery supplier is investigating the source of the data discrepancy and provide recommendation to address future data integrity issues
Download data logs from the battery system early in the implementation phase to address the issue early in the project
Training Field crews in the Panguitch area to be well trained on battery control systems
Lack of understanding among field crews on the different battery components and maintenance and operations of the same
N/A Additional training provided to field crews to ensure all questions on operations are addressed
Have multiple trainings for field crews since they are not well-acquainted with advanced battery control systems
Panguitch Solar + Storage | 2021 Project Report
Page 8 of 10
8 SUPPLEMENTAL INFORMATION
In accordance with the Public Service Commission of Utah’s Acknowledgement Letter dated October 19, 2021 in Docket No. 21-035-29, the Company provides the following additional supplemental information as requested by the Division of Public Utilities (“DPU”) and the Office of Consumer Services (“OCS”).
8.1 Project Location
The map of the project site is provided in Figure 1 of this report, which was updated from the original version of this report filed August 25, 2021 that showed the proposed site at the time the Company was considering the project. The cost for the parcel that was selected was $99,333. The Company notes that it considered several alternative sites were considered including the proposed 10 acre property on the west side of the of Panguitch, which was marketed for $79,000. Although the originally proposed site was listed at a slightly lower price, the cost to upgrade the distribution feed to serve the proposed solar facilities would have far outweighed the benefit of the lower property cost. Therefore, the Company ultimately selected the site shown in Figure 1 of this report.
8.2 Investment Tax Credits The Project qualified for a federal Investment Tax Credit (ITC) in the amount of $2.2 million which was claimed on PacifiCorp’s 2020 federal income tax return. Investment tax credits are deferred and amortized over the estimated useful lives of the related properties, which is the treatment that was used for the ITC received for the Panguitch project. The deferred ITC is recorded to FERC Account 255. The ITC amortization is recorded to FERC Account 420.
The Company notes that ITC received for the Panguitch project is subject to the normalization requirements of the Internal Revenue Code. As a result, for ratemaking purposes, the Project ITC cannot be immediately “credited” to customers. Rather, the balance of the unamortized deferred ITC is included as a reduction to rate base, while ITC amortization may not be included as a reduction to income tax expense.
The ITC received for the Panguitch project was first recorded in March 2020, first reflected in Utah’s June 2020 Results of Operations (allocated 100% to Utah customers and reflected as a reduction to rate base) and will be reflected in rates commencing with Rocky Mountain Power’s next filed general rate case. Due to the normalization requirements of the Internal Revenue Code, the Company does not have discretion to apply any other regulatory or ratemaking treatment to the ITC received for the Panguitch Project.
8.3 Project Cost Overages
The actual expenditures for the project were $8.96 million versus the budget of $8.75 million. The cost overrun was largely due to increases in interconnection costs (design, material, equipment, and labor) that were not included in the original project budget, or the initial or subsequent funding request increase. These included nine (9) large wooden poles required replacement (65-feet including cross-arms, insulators,
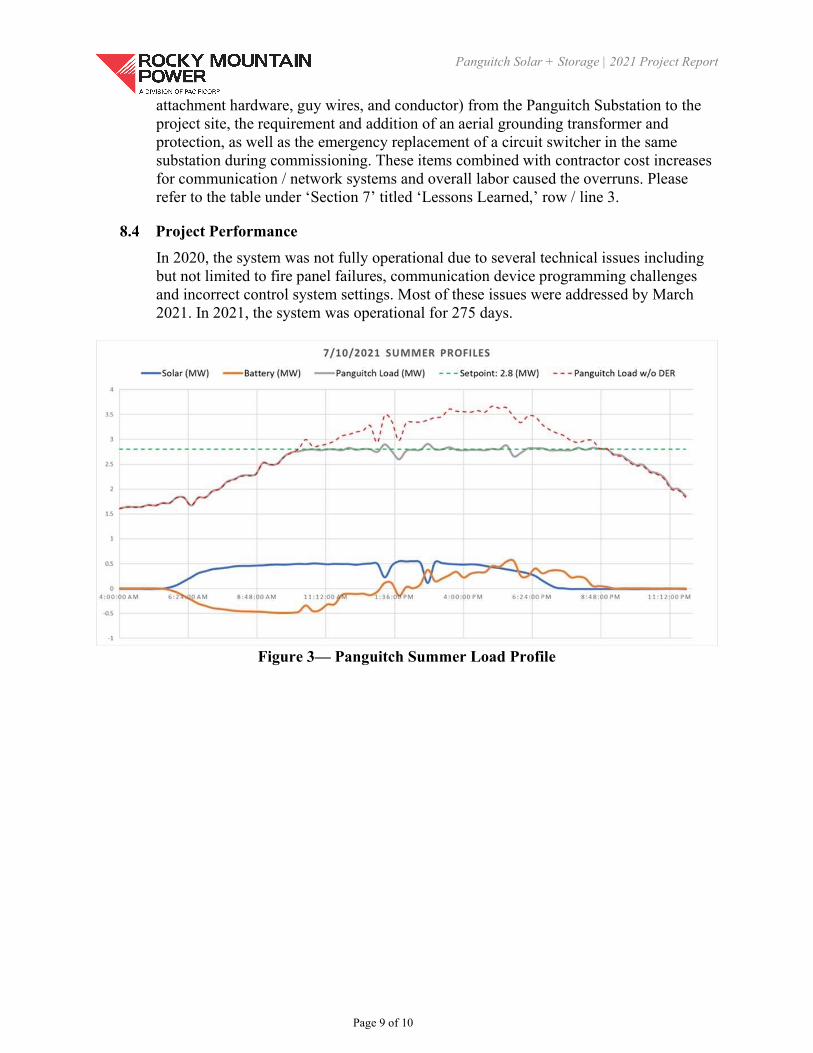
Panguitch Solar + Storage | 2021 Project Report
Page 9 of 10
attachment hardware, guy wires, and conductor) from the Panguitch Substation to the project site, the requirement and addition of an aerial grounding transformer and protection, as well as the emergency replacement of a circuit switcher in the same substation during commissioning. These items combined with contractor cost increases for communication / network systems and overall labor caused the overruns. Please refer to the table under ‘Section 7’ titled ‘Lessons Learned,’ row / line 3.
8.4 Project Performance
In 2020, the system was not fully operational due to several technical issues including but not limited to fire panel failures, communication device programming challenges and incorrect control system settings. Most of these issues were addressed by March 2021. In 2021, the system was operational for 275 days.
Figure 3— Panguitch Summer Load Profile
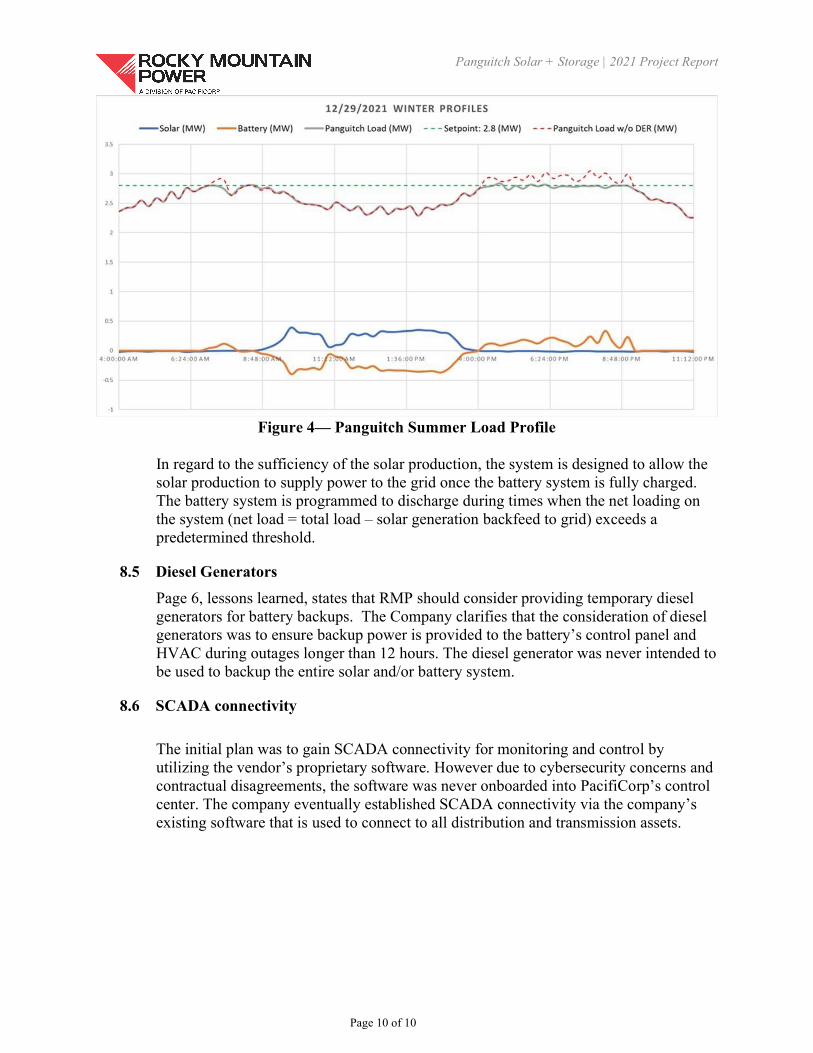
Panguitch Solar + Storage | 2021 Project Report
Page 10 of 10
Figure 4— Panguitch Summer Load Profile
In regard to the sufficiency of the solar production, the system is designed to allow the solar production to supply power to the grid once the battery system is fully charged. The battery system is programmed to discharge during times when the net loading on the system (net load = total load – solar generation backfeed to grid) exceeds a predetermined threshold.
8.5 Diesel Generators
Page 6, lessons learned, states that RMP should consider providing temporary diesel generators for battery backups. The Company clarifies that the consideration of diesel generators was to ensure backup power is provided to the battery’s control panel and HVAC during outages longer than 12 hours. The diesel generator was never intended to be used to backup the entire solar and/or battery system.
8.6 SCADA connectivity
The initial plan was to gain SCADA connectivity for monitoring and control by utilizing the vendor’s proprietary software. However due to cybersecurity concerns and contractual disagreements, the software was never onboarded into PacifiCorp’s control center. The company eventually established SCADA connectivity via the company’s existing software that is used to connect to all distribution and transmission assets.
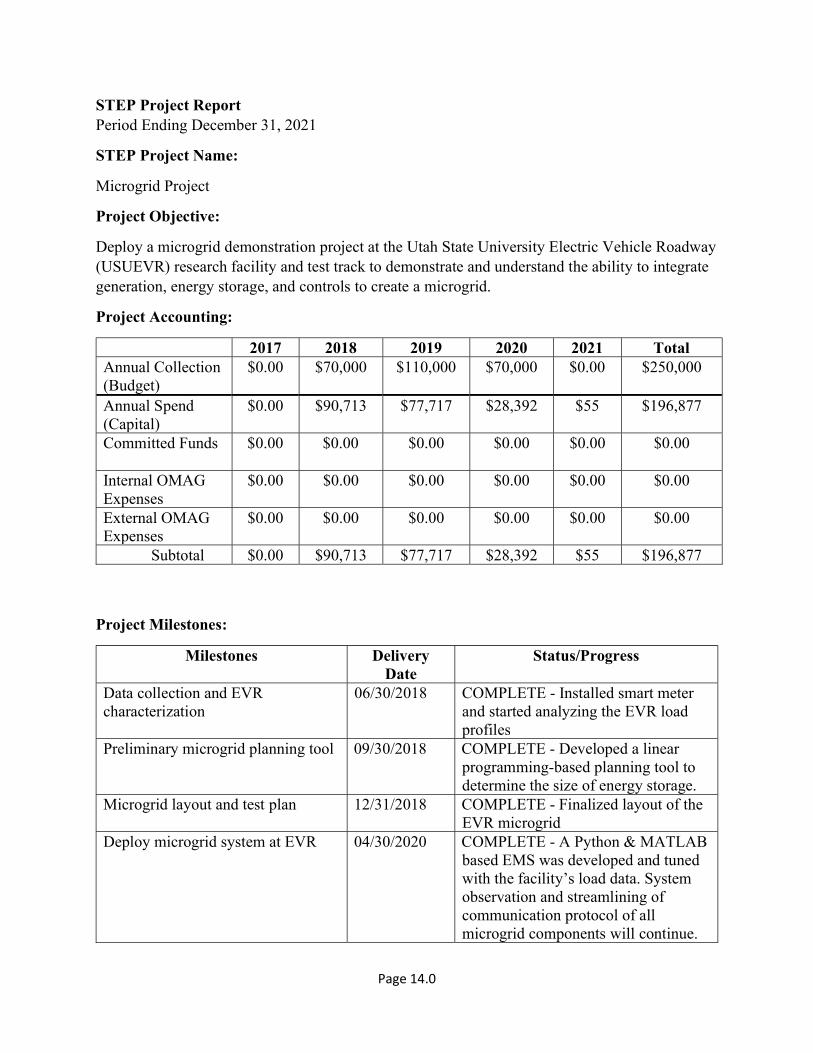
Page 14.0
STEP Project Report Period Ending December 31, 2021
STEP Project Name:
Microgrid Project
Project Objective:
Deploy a microgrid demonstration project at the Utah State University Electric Vehicle Roadway (USUEVR) research facility and test track to demonstrate and understand the ability to integrate generation, energy storage, and controls to create a microgrid.
Project Accounting:
Project Milestones:
Milestones Delivery Date
Status/Progress
Data collection and EVR characterization
06/30/2018 COMPLETE - Installed smart meter and started analyzing the EVR load profiles
Preliminary microgrid planning tool 09/30/2018 COMPLETE - Developed a linear programming-based planning tool to determine the size of energy storage.
Microgrid layout and test plan 12/31/2018 COMPLETE - Finalized layout of the EVR microgrid
Deploy microgrid system at EVR 04/30/2020 COMPLETE - A Python & MATLAB based EMS was developed and tuned with the facility’s load data. System observation and streamlining of communication protocol of all microgrid components will continue.
2017 2018 2019 2020 2021 Total Annual Collection (Budget)
$0.00
$70,000 $110,000 $70,000 $0.00
$250,000
Annual Spend (Capital)
$0.00
$90,713
$77,717
$28,392 $55
$196,877
Committed Funds $0.00 $0.00
$0.00
$0.00
$0.00
$0.00
Internal OMAG Expenses
$0.00
$0.00
$0.00
$0.00
$0.00
$0.00
External OMAG Expenses
$0.00 $0.00
$0.00
$0.00
$0.00
$0.00
Subtotal $0.00 $90,713 $77,717 $28,392 $55 $196,877
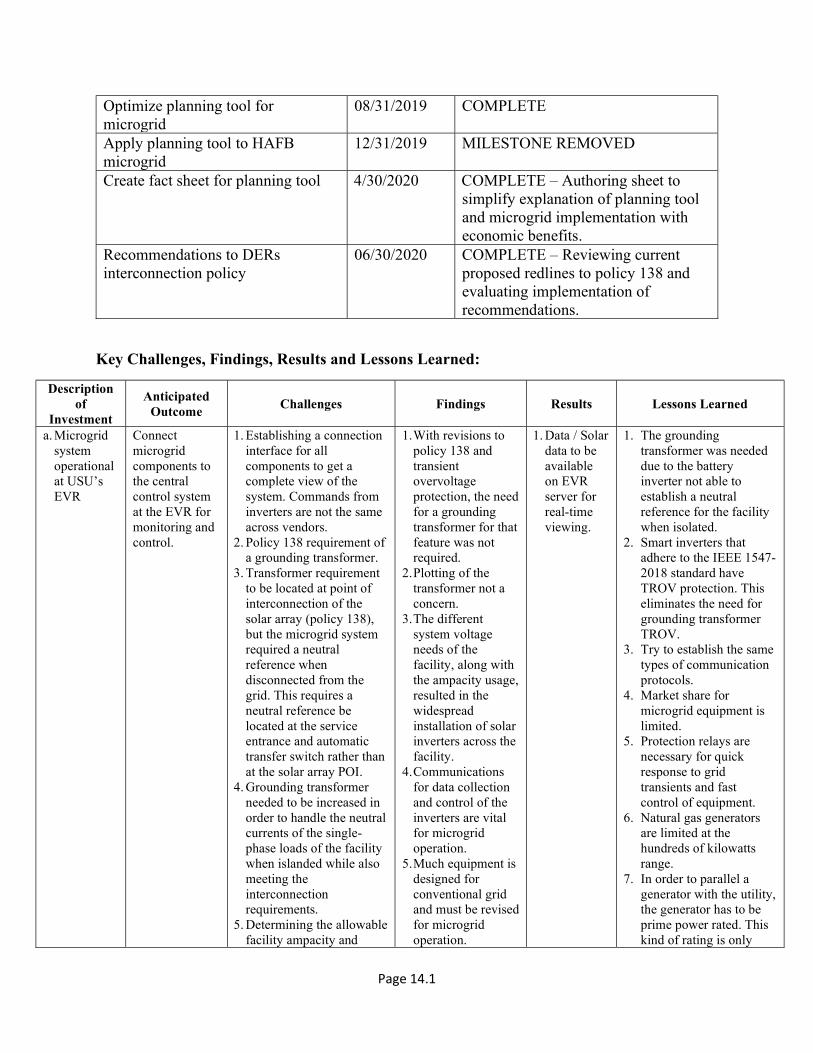
Page 14.1
Optimize planning tool for microgrid
08/31/2019 COMPLETE
Apply planning tool to HAFB microgrid
12/31/2019 MILESTONE REMOVED
Create fact sheet for planning tool 4/30/2020 COMPLETE – Authoring sheet to simplify explanation of planning tool and microgrid implementation with economic benefits.
Recommendations to DERs interconnection policy
06/30/2020 COMPLETE – Reviewing current proposed redlines to policy 138 and evaluating implementation of recommendations.
Key Challenges, Findings, Results and Lessons Learned:
Description of
Investment
Anticipated Outcome
Challenges Findings Results Lessons Learned
a. Microgrid system operational at USU’s EVR
Connect microgrid components to the central control system at the EVR for monitoring and control.
1. Establishing a connection interface for all components to get a complete view of the system. Commands from inverters are not the same across vendors.
2. Policy 138 requirement of a grounding transformer.
3. Transformer requirement to be located at point of interconnection of the solar array (policy 138), but the microgrid system required a neutral reference when disconnected from the grid. This requires a neutral reference be located at the service entrance and automatic transfer switch rather than at the solar array POI.
4. Grounding transformer needed to be increased in order to handle the neutral currents of the single-phase loads of the facility when islanded while also meeting the interconnection requirements.
5. Determining the allowable facility ampacity and
1. With revisions to policy 138 and transient overvoltage protection, the need for a grounding transformer for that feature was not required.
2. Plotting of the transformer not a concern.
3. The different system voltage needs of the facility, along with the ampacity usage, resulted in the widespread installation of solar inverters across the facility.
4. Communications for data collection and control of the inverters are vital for microgrid operation.
5. Much equipment is designed for conventional grid and must be revised for microgrid operation.
1. Data / Solar data to be available on EVR server for real-time viewing.
1. The grounding transformer was needed due to the battery inverter not able to establish a neutral reference for the facility when isolated.
2. Smart inverters that adhere to the IEEE 1547-2018 standard have TROV protection. This eliminates the need for grounding transformer TROV.
3. Try to establish the same types of communication protocols.
4. Market share for microgrid equipment is limited.
5. Protection relays are necessary for quick response to grid transients and fast control of equipment.
6. Natural gas generators are limited at the hundreds of kilowatts range.
7. In order to parallel a generator with the utility, the generator has to be prime power rated. This kind of rating is only
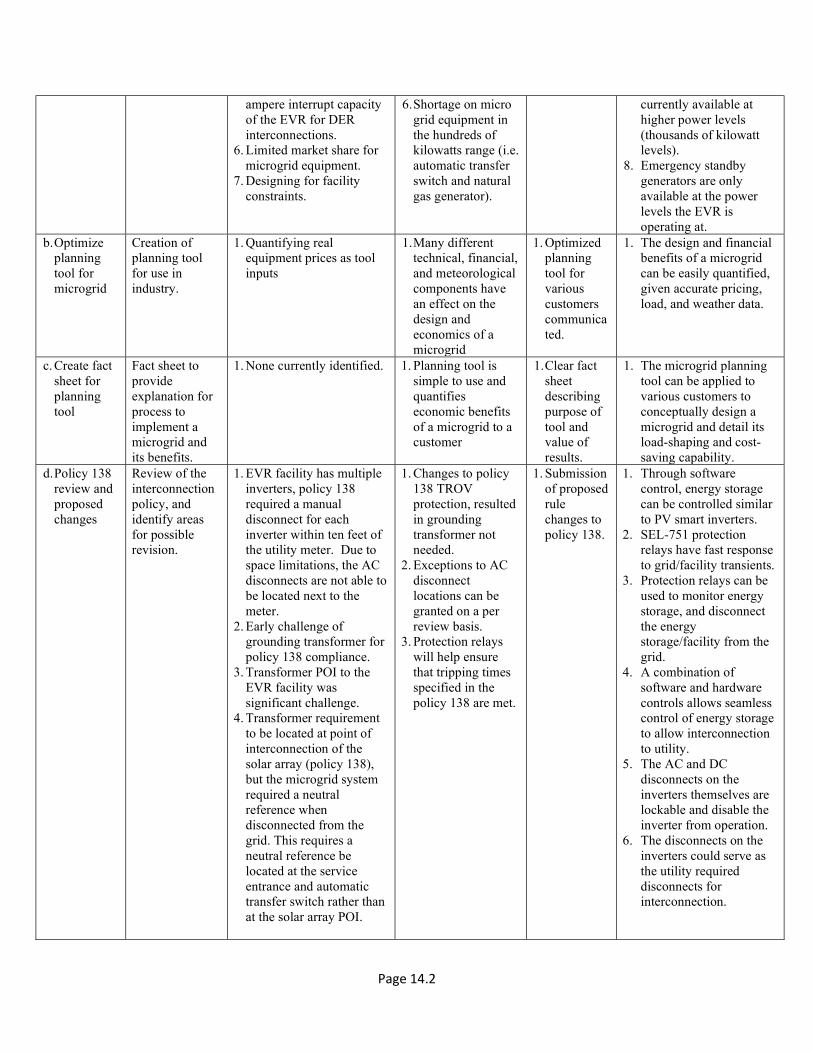
Page 14.2
ampere interrupt capacity of the EVR for DER interconnections.
6. Limited market share for microgrid equipment.
7. Designing for facility constraints.
6. Shortage on micro grid equipment in the hundreds of kilowatts range (i.e. automatic transfer switch and natural gas generator).
currently available at higher power levels (thousands of kilowatt levels).
8. Emergency standby generators are only available at the power levels the EVR is operating at.
b. Optimize planning tool for microgrid
Creation of planning tool for use in industry.
1. Quantifying real equipment prices as tool inputs
1. Many different technical, financial, and meteorological components have an effect on the design and economics of a microgrid
1. Optimized planning tool for various customers communicated.
1. The design and financial benefits of a microgrid can be easily quantified, given accurate pricing, load, and weather data.
c. Create fact sheet for planning tool
Fact sheet to provide explanation for process to implement a microgrid and its benefits.
1. None currently identified. 1. Planning tool is simple to use and quantifies economic benefits of a microgrid to a customer
1. Clear fact sheet describing purpose of tool and value of results.
1. The microgrid planning tool can be applied to various customers to conceptually design a microgrid and detail its load-shaping and cost-saving capability.
d. Policy 138 review and proposed changes
Review of the interconnection policy, and identify areas for possible revision.
1. EVR facility has multiple inverters, policy 138 required a manual disconnect for each inverter within ten feet of the utility meter. Due to space limitations, the AC disconnects are not able to be located next to the meter.
2. Early challenge of grounding transformer for policy 138 compliance.
3. Transformer POI to the EVR facility was significant challenge.
4. Transformer requirement to be located at point of interconnection of the solar array (policy 138), but the microgrid system required a neutral reference when disconnected from the grid. This requires a neutral reference be located at the service entrance and automatic transfer switch rather than at the solar array POI.
1. Changes to policy 138 TROV protection, resulted in grounding transformer not needed.
2. Exceptions to AC disconnect locations can be granted on a per review basis.
3. Protection relays will help ensure that tripping times specified in the policy 138 are met.
1. Submission of proposed rule changes to policy 138.
1. Through software control, energy storage can be controlled similar to PV smart inverters.
2. SEL-751 protection relays have fast response to grid/facility transients.
3. Protection relays can be used to monitor energy storage, and disconnect the energy storage/facility from the grid.
4. A combination of software and hardware controls allows seamless control of energy storage to allow interconnection to utility.
5. The AC and DC disconnects on the inverters themselves are lockable and disable the inverter from operation.
6. The disconnects on the inverters could serve as the utility required disconnects for interconnection.

Page 14.3
Program Benefits
Qualifies the viability of operating a microgrid on the Company’s distribution system, and any resultant reliability improvement.
Assists in understanding the intricacies of microgrid system operation, costs and their ability to address other value streams such as reliability, load shaping and power quality.
Creates a quantified list of Company distribution system impacts resulting from the interconnection of microgrids.
Enables the creation of policy and standards for subsequent microgrid interconnection requests, if and when allowed by the Company.
Enables the potential development of a future microgrid service program. Establishes a tool to optimize conceptual design for a microgrid given location, load shape,
and rate structure. Potential future applications for similar projects:
Collaborate with customers to identify and potentially deploy microgrid systems utilizing advanced control systems and Internet of Things (IoT) for optimizing distributed energy resources.
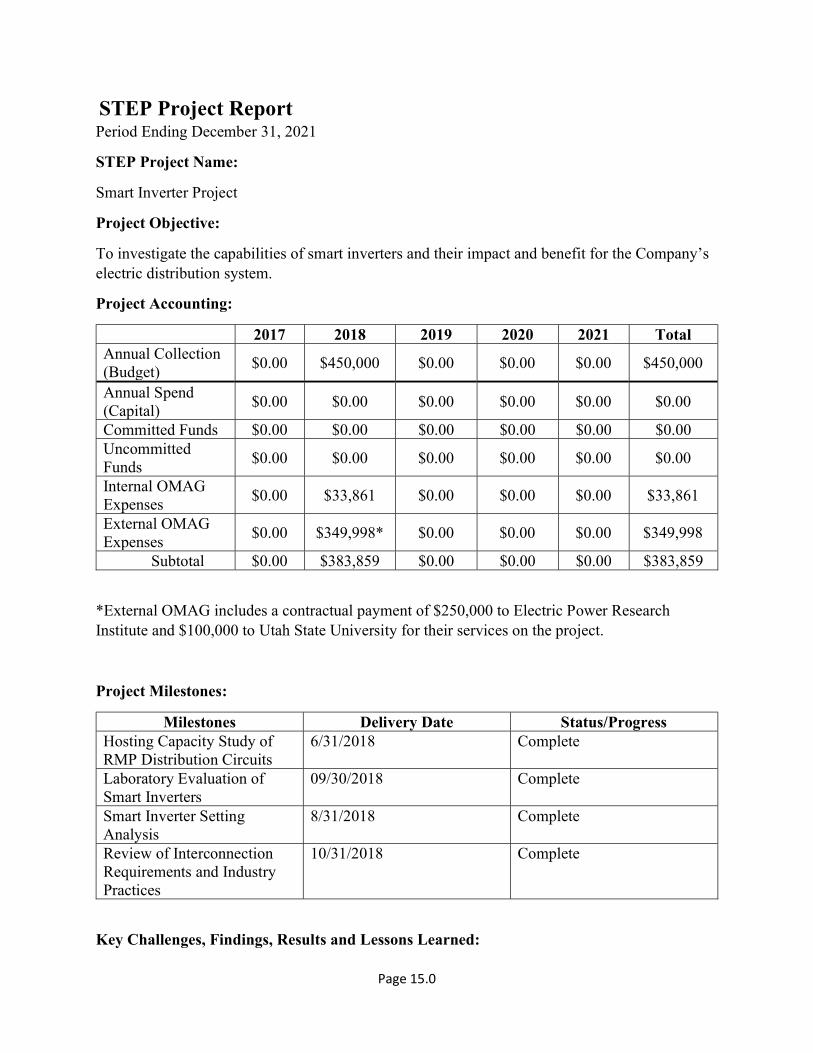
Page 15.0
STEP Project Report Period Ending December 31, 2021
STEP Project Name:
Smart Inverter Project
Project Objective:
To investigate the capabilities of smart inverters and their impact and benefit for the Company’s electric distribution system.
Project Accounting:
2017 2018 2019 2020 2021 Total Annual Collection (Budget)
$0.00 $450,000 $0.00 $0.00 $0.00 $450,000
Annual Spend (Capital)
$0.00 $0.00 $0.00 $0.00 $0.00 $0.00
Committed Funds $0.00 $0.00 $0.00 $0.00 $0.00 $0.00 Uncommitted Funds
$0.00 $0.00 $0.00 $0.00 $0.00 $0.00
Internal OMAG Expenses
$0.00 $33,861 $0.00 $0.00 $0.00 $33,861
External OMAG Expenses
$0.00 $349,998* $0.00 $0.00 $0.00 $349,998
Subtotal $0.00 $383,859 $0.00 $0.00 $0.00 $383,859
*External OMAG includes a contractual payment of $250,000 to Electric Power Research Institute and $100,000 to Utah State University for their services on the project.
Project Milestones:
Milestones Delivery Date Status/Progress Hosting Capacity Study of RMP Distribution Circuits
6/31/2018 Complete
Laboratory Evaluation of Smart Inverters
09/30/2018 Complete
Smart Inverter Setting Analysis
8/31/2018 Complete
Review of Interconnection Requirements and Industry Practices
10/31/2018 Complete
Key Challenges, Findings, Results and Lessons Learned:
Page 15.1
Description of Investment
STEP funding for this project was used to investigate the capabilities of smart inverters and their positive and negative impacts on RMP’s electric distribution system.
Anticipated Outcome
Evaluate readiness level of smart PV and battery inverters to comply with the new IEEE 1547-2018 standard.
Performance analysis of smart inverters during both steady state and transient operating conditions.
Investigate hosting capacity and potential benefit of smart inverters for several Rocky Mountain Power feeders.
Analyze smart inverter settings in detail for two different feeders, and report on the range, requirements, and benefit of adjustability.
Summarize current utility practices for voltage/frequency ride-through and communication between inverters and utility.
Challenges
There are differences in the ability to control the inverters using Modbus communication protocol, and all the settings cannot be programmed using this protocol.
Findings/ Results
All the tested PV inverters are compliant with the settings listed in category 2 of the IEEE 1547-2018, except Inverter 2, which is only compliant with category 1, and hence can only be used in areas with low distributed energy resources (DER) penetration.
Three phase PV inverters are capable of injecting 100% and absorbing 95% of rated active power. Single phase PV inverters, however, are capable of injecting and absorbing 45%-65% of rated active power.
Over the load range of 10%-100%, the efficiency of all the inverters is higher than 95% The battery inverter does not comply with most of the tests designed for smart inverter
testing. The battery inverter ensures a continuous supply to the backup load, and establishes its
local voltage within two fundamental cycles. Some of the distribution feeders studied showed hosting capacity gains by using smart
inverters; however, most saw limited improvement due to already being thermally constrained.
Because improvements in hosting capacity depended greatly on the connection point, the improvements were smaller for distributed systems than central systems because the locations were less finely controlled.
Lessons Learned
Page 15.2
The performance of all PV smart inverters matches closely to the manufacturer specifications. However, for the same power ratings, the performance of inverters differs among manufacturers.
All PV inverters are suitable for grid integration in accordance with several of the IEEE 1547-2018 standard requirements, and autonomously support grid during voltage transients.
In addition to hosting capacity, reactive power from inverters can be used to improve distribution losses and substation power factor.
With the “best” settings, Volt-VAR control performed better than the fixed power factor function; however, with bad settings the performance was worse than all fixed power factor levels.
Use of several smart inverter functions (such as Volt-VAR) will require updates to PacifiCorp’s Generator Interconnection Policy (Policy 138).
IEEE 1547 introduces the requirement for DER to have communications capability over an open protocol, utilities have not converged on an approach to interfacing with these devices.
Program Benefits
This program will enable a greater understanding of these innovative solutions as the Company continues to make the grid more progressive.
Provides the Company, Commission, and other stakeholders with information regarding the capabilities of advanced inverters and changes to interconnection standards.
The findings from this project will assist the Company in updating PacifiCorp Policy 138: Distributed energy resource interconnection policy.
Enables the Company to gain knowledge on smart inverter operation for solar and battery combined projects.
Enables the Company to become familiar with and utilize innovative technologies to provide customers with solutions to power quality issues.
Provides guidance to the Company’s distribution engineers to enhance the distribution planning process.
The Company continues to experience rapid growth in interconnection requests and considers innovative technologies such as smart inverters a valuable tool to improve service to customers.
Provides a better understanding of smart inverter settings that will potentially assist in improved utilization of grid assets, leading to cost savings for customers.
This project aligns with the goals of the program to support the greater use of renewable energy. Through this project, the Company is taking steps to prepare for increased deployment of distributed and renewable energy sources for its customers.
Potential future applications for similar projects:

Page 15.3
Develop an automated hosting capacity analysis tool to leverage on smart inverter capabilities and provide enhanced grid support using DER systems connected to the distribution system.
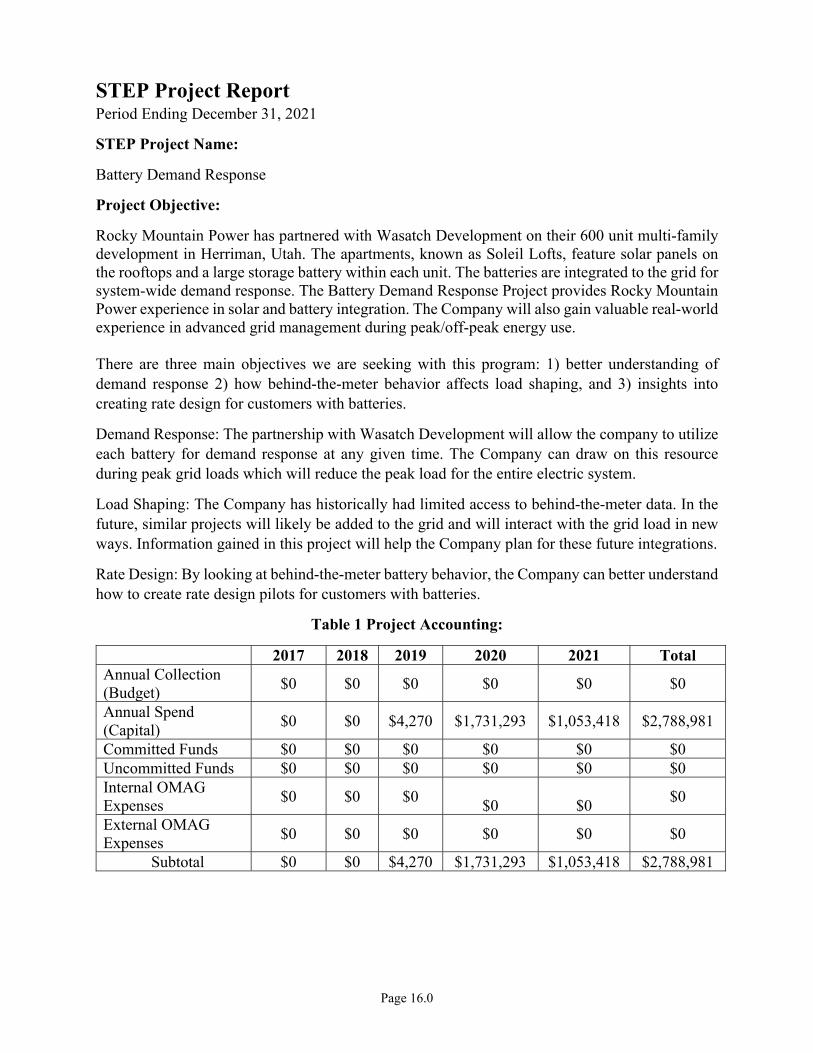
Page 16.0
STEP Project Report Period Ending December 31, 2021
STEP Project Name:
Battery Demand Response
Project Objective:
Rocky Mountain Power has partnered with Wasatch Development on their 600 unit multi-family development in Herriman, Utah. The apartments, known as Soleil Lofts, feature solar panels on the rooftops and a large storage battery within each unit. The batteries are integrated to the grid for system-wide demand response. The Battery Demand Response Project provides Rocky Mountain Power experience in solar and battery integration. The Company will also gain valuable real-world experience in advanced grid management during peak/off-peak energy use. There are three main objectives we are seeking with this program: 1) better understanding of demand response 2) how behind-the-meter behavior affects load shaping, and 3) insights into creating rate design for customers with batteries.
Demand Response: The partnership with Wasatch Development will allow the company to utilize each battery for demand response at any given time. The Company can draw on this resource during peak grid loads which will reduce the peak load for the entire electric system.
Load Shaping: The Company has historically had limited access to behind-the-meter data. In the future, similar projects will likely be added to the grid and will interact with the grid load in new ways. Information gained in this project will help the Company plan for these future integrations.
Rate Design: By looking at behind-the-meter battery behavior, the Company can better understand how to create rate design pilots for customers with batteries.
Table 1 Project Accounting:
2017 2018 2019 2020 2021 Total Annual Collection (Budget)
$0 $0 $0 $0 $0 $0
Annual Spend (Capital)
$0 $0 $4,270 $1,731,293 $1,053,418 $2,788,981
Committed Funds $0 $0 $0 $0 $0 $0 Uncommitted Funds $0 $0 $0 $0 $0 $0 Internal OMAG Expenses
$0 $0 $0
$0
$0 $0
External OMAG Expenses
$0 $0 $0 $0 $0 $0
Subtotal $0 $0 $4,270 $1,731,293 $1,053,418 $2,788,981
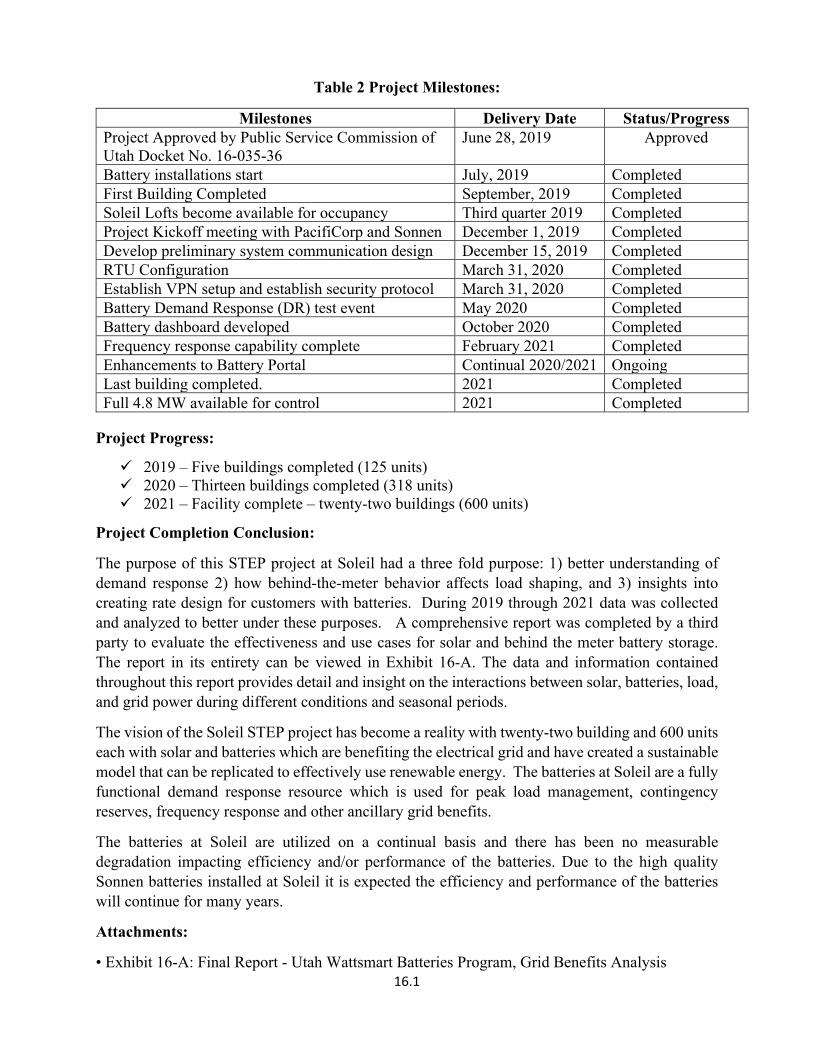
16.1
Table 2 Project Milestones:
Milestones Delivery Date Status/Progress Project Approved by Public Service Commission of Utah Docket No. 16-035-36
June 28, 2019 Approved
Battery installations start July, 2019 Completed First Building Completed September, 2019 Completed Soleil Lofts become available for occupancy Third quarter 2019 Completed Project Kickoff meeting with PacifiCorp and Sonnen December 1, 2019 Completed Develop preliminary system communication design December 15, 2019 Completed RTU Configuration March 31, 2020 Completed Establish VPN setup and establish security protocol March 31, 2020 Completed Battery Demand Response (DR) test event May 2020 Completed Battery dashboard developed October 2020 Completed Frequency response capability complete February 2021 Completed Enhancements to Battery Portal Continual 2020/2021 Ongoing Last building completed. 2021 Completed Full 4.8 MW available for control 2021 Completed
Project Progress:
2019 – Five buildings completed (125 units) 2020 – Thirteen buildings completed (318 units) 2021 – Facility complete – twenty-two buildings (600 units)
Project Completion Conclusion:
The purpose of this STEP project at Soleil had a three fold purpose: 1) better understanding of demand response 2) how behind-the-meter behavior affects load shaping, and 3) insights into creating rate design for customers with batteries. During 2019 through 2021 data was collected and analyzed to better under these purposes. A comprehensive report was completed by a third party to evaluate the effectiveness and use cases for solar and behind the meter battery storage. The report in its entirety can be viewed in Exhibit 16-A. The data and information contained throughout this report provides detail and insight on the interactions between solar, batteries, load, and grid power during different conditions and seasonal periods.
The vision of the Soleil STEP project has become a reality with twenty-two building and 600 units each with solar and batteries which are benefiting the electrical grid and have created a sustainable model that can be replicated to effectively use renewable energy. The batteries at Soleil are a fully functional demand response resource which is used for peak load management, contingency reserves, frequency response and other ancillary grid benefits.
The batteries at Soleil are utilized on a continual basis and there has been no measurable degradation impacting efficiency and/or performance of the batteries. Due to the high quality Sonnen batteries installed at Soleil it is expected the efficiency and performance of the batteries will continue for many years.
Attachments:
• Exhibit 16-A: Final Report - Utah Wattsmart Batteries Program, Grid Benefits Analysis

Exhibit 16-A Final Report - Utah Wattsmart Batteries Program, Grid Benefits Analysis
Utah Wattsmart Batteries Program GRID SERVICE BENEFITS ANALYSIS November 2021
Prepared for:
Rocky Mountain Power, PacifiCorp Shawn Grant

Prepared by:
Danielle Kolp
Stephen Treat
Ari Kornelis
Josh Fontes
Table of Contents
i
Table of Contents
Glossary of Terms ............................................................................................................................... i
Introduction ...................................................................................................................................... 1
Study Objectives ..................................................................................................................................... 1
Program Benefits ............................................................................................................................. 1
Multi-Family Pilot Facility ....................................................................................................................... 2
Methodology ..................................................................................................................................... 3
Findings ............................................................................................................................................. 4
Frequency Regulation Services ............................................................................................................... 4
Peak Load Management ......................................................................................................................... 6
Congestion Relief .................................................................................................................................... 7
Backup Power ......................................................................................................................................... 8
Summary of Findings and Recommended Next Steps ........................................................................ 13
Appendix A. Soleil Lofts Apartment Complex .................................................................................... 14
Facility Specifications ........................................................................................................................... 14
Facility Operations ................................................................................................................................ 14
Facility Load ................................................................................................................................... 14
Solar Production ............................................................................................................................ 15
Tables Table 1. Backup Power Example Assumptions (Without Solar).................................................................... 9
Table 2. Backup Power Example Assumptions (With Solar) ....................................................................... 10
Table 3. Backup Power Service Expectations for a Unit with 20 kWh or 10 kWh Battery .......................... 11
Table 4. Frequency Regulation Response by Battery Vintage .................................................................... 13
Table 5. Average Daily Solar Production and Electricity Usage by Season ................................................. 15
Figures Figure 1. Sample Daily Solar + Battery Facility Performance ........................................................................ 2
Figure 2. March Frequency Regulation Events ............................................................................................. 5
Figure 3. April Frequency Events for Three Types of Battery Charging Mode ............................................. 6
ii
Figure 4. Frequency Event Response Time Comparison ............................................................................... 6
Figure 5. Peak Management Operations, December 16, 2020 ..................................................................... 7
Figure 6. Peak Management Operations, January 2021 ............................................................................... 7
Figure 7. Distribution Circuit Congestion Event – July 24, 2021 ................................................................... 8
Figure 8. Aggregate Facility Operations, November 4, 2020 ........................................................................ 9
Figure 9. Daily Variation in Battery State of Charge (July 2021 Average) ................................................... 12
Figure 10. Per-Unit Average 24-Hour Soleil Loadshape by Season............................................................. 15

Glossary of Terms
i
Glossary of Terms
Distributed Battery Grid Management System (DBGMS)
A battery control system which provides automated integrations with a utilities energy management
system for advanced real-time grid management.
Distributed Energy Resource (DER)
A DER is a small-scale unit of power generation that operates independently and is connected to a larger
power grid.
Load
Load, or electrical load, is a portion of a circuit that consumes electric power such as appliances or
lighting.
Solar Production
Electricity produced from solar panels.
Virtual Power Plant (VPP)
A virtual power plant refers to a collection of decentralized distributed energy resources that are
aggregated to enhance power generation and dispatch of power on the grid.
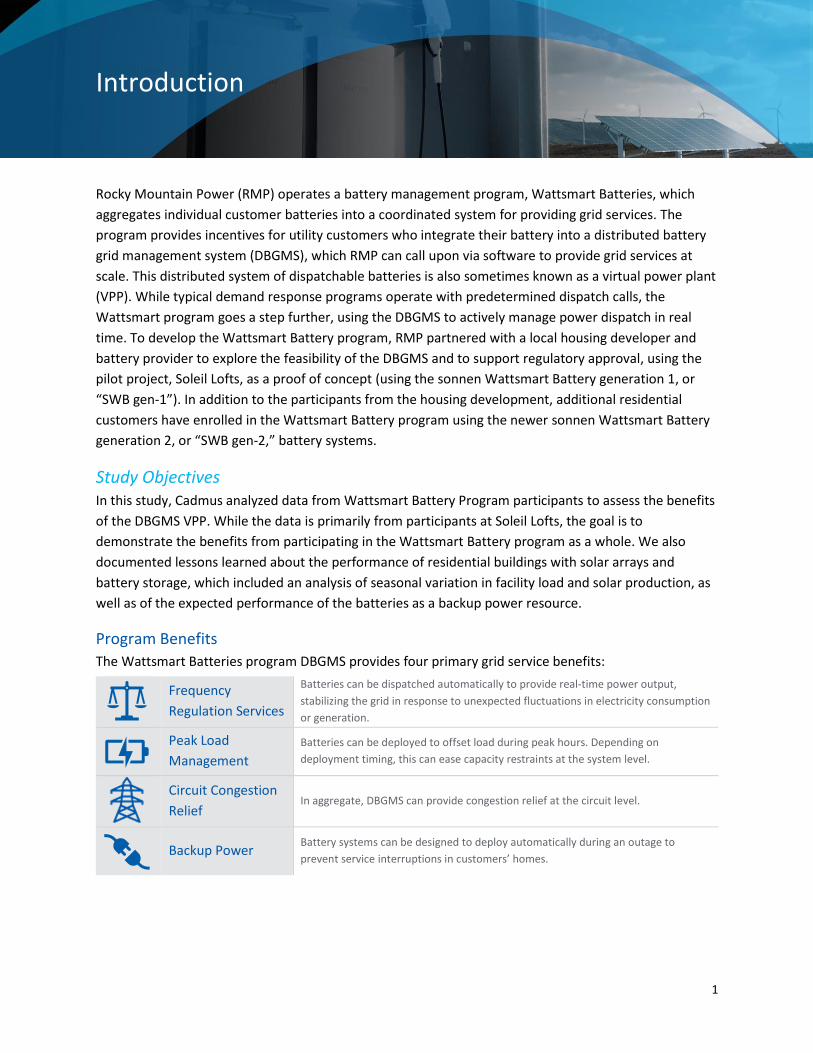
Introduction
1
Introduction
Rocky Mountain Power (RMP) operates a battery management program, Wattsmart Batteries, which
aggregates individual customer batteries into a coordinated system for providing grid services. The
program provides incentives for utility customers who integrate their battery into a distributed battery
grid management system (DBGMS), which RMP can call upon via software to provide grid services at
scale. This distributed system of dispatchable batteries is also sometimes known as a virtual power plant
(VPP). While typical demand response programs operate with predetermined dispatch calls, the
Wattsmart program goes a step further, using the DBGMS to actively manage power dispatch in real
time. To develop the Wattsmart Battery program, RMP partnered with a local housing developer and
battery provider to explore the feasibility of the DBGMS and to support regulatory approval, using the
pilot project, Soleil Lofts, as a proof of concept (using the sonnen Wattsmart Battery generation 1, or
“SWB gen-1”). In addition to the participants from the housing development, additional residential
customers have enrolled in the Wattsmart Battery program using the newer sonnen Wattsmart Battery
generation 2, or “SWB gen-2,” battery systems.
Study Objectives In this study, Cadmus analyzed data from Wattsmart Battery Program participants to assess the benefits
of the DBGMS VPP. While the data is primarily from participants at Soleil Lofts, the goal is to
demonstrate the benefits from participating in the Wattsmart Battery program as a whole. We also
documented lessons learned about the performance of residential buildings with solar arrays and
battery storage, which included an analysis of seasonal variation in facility load and solar production, as
well as of the expected performance of the batteries as a backup power resource.
Program Benefits
The Wattsmart Batteries program DBGMS provides four primary grid service benefits:
Frequency
Regulation Services
Batteries can be dispatched automatically to provide real-time power output,
stabilizing the grid in response to unexpected fluctuations in electricity consumption
or generation.
Peak Load
Management
Batteries can be deployed to offset load during peak hours. Depending on
deployment timing, this can ease capacity restraints at the system level.
Circuit Congestion
Relief In aggregate, DBGMS can provide congestion relief at the circuit level.
Backup Power
Battery systems can be designed to deploy automatically during an outage to
prevent service interruptions in customers’ homes.
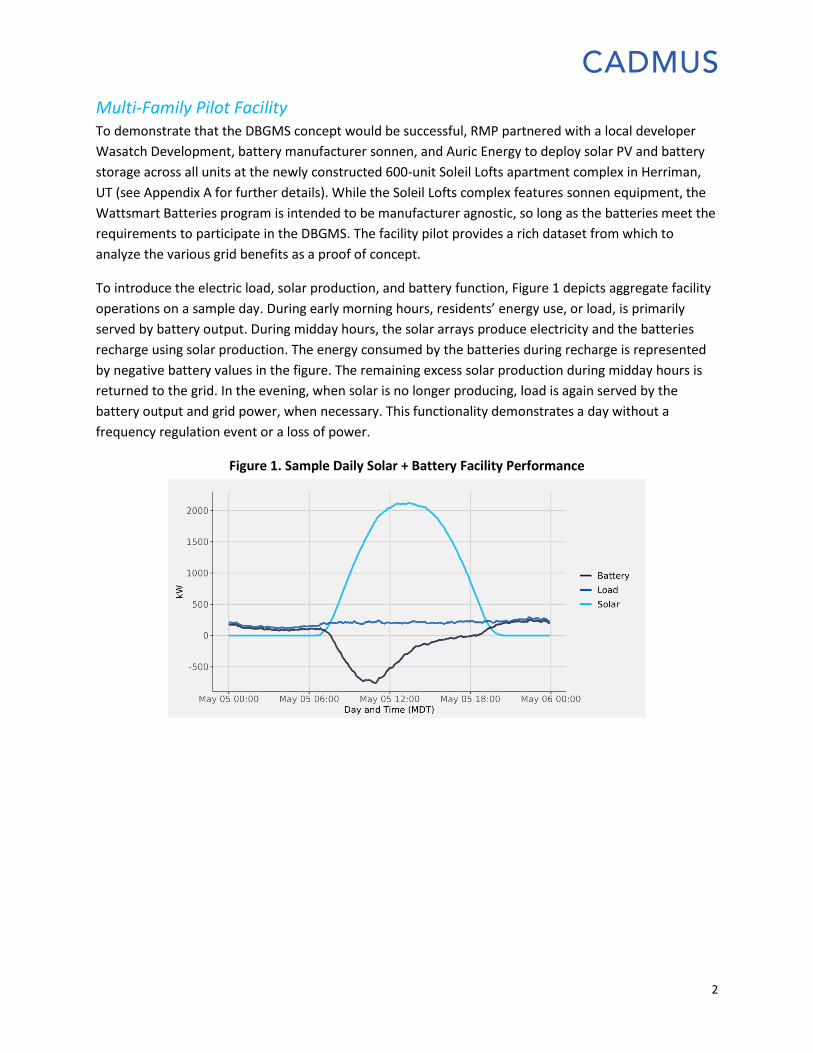
2
Multi-Family Pilot Facility To demonstrate that the DBGMS concept would be successful, RMP partnered with a local developer
Wasatch Development, battery manufacturer sonnen, and Auric Energy to deploy solar PV and battery
storage across all units at the newly constructed 600-unit Soleil Lofts apartment complex in Herriman,
UT (see Appendix A for further details). While the Soleil Lofts complex features sonnen equipment, the
Wattsmart Batteries program is intended to be manufacturer agnostic, so long as the batteries meet the
requirements to participate in the DBGMS. The facility pilot provides a rich dataset from which to
analyze the various grid benefits as a proof of concept.
To introduce the electric load, solar production, and battery function, Figure 1 depicts aggregate facility
operations on a sample day. During early morning hours, residents’ energy use, or load, is primarily
served by battery output. During midday hours, the solar arrays produce electricity and the batteries
recharge using solar production. The energy consumed by the batteries during recharge is represented
by negative battery values in the figure. The remaining excess solar production during midday hours is
returned to the grid. In the evening, when solar is no longer producing, load is again served by the
battery output and grid power, when necessary. This functionality demonstrates a day without a
frequency regulation event or a loss of power.
Figure 1. Sample Daily Solar + Battery Facility Performance

Methodology
3
Methodology
Cadmus’ approach to analysis is primarily data driven, informed by qualitative research and interviews
we used to gain useful context into the development and goals of the DBGMS for the Wattsmart
Batteries program overall. Cadmus used visual analysis and descriptive statistics to analyze the
performance of the DBGMS system and to answer a number of study research questions determined by
Cadmus and RMP at the study start. The research questions focused on assessing the impact of
distributed solar and storage on the per-unit and aggregate load over time. We also reviewed the
impact of seasonality on DBGMS performance. Cadmus collected and prepared a variety of system
performance data from the Soleil complex:
• Facility Load: per unit
• Solar Production: per unit, from date of interconnection
• Storage Recharge and Discharge
sonnen provided all other solar production, load, and battery charge data. sonnen provided the system
performance data in 5-minute intervals for May 2020 through July 2021, and provided additional
samples of 1-second interval data for analysis of frequency regulation events.
We focused on characterizing facility load, solar production, and battery storage operations for
Wattsmart Battery Program participants. Cadmus determined the daily, seasonal, and annual peak loads
and created supporting visualization. The load analysis revealed distribution outliers and provided an
overview of the seasonal variation and coincidence of solar production, as well as details of facility and
system peak load events.
Cadmus used the model1 to analyze battery storage system operations and determine the systems’
capability to provide backup power. In addition, we reviewed the average length of time the system was
able to provide backup power during an outage, how quickly it provided backup power, and at what
point the storage is recharged from the solar (specifically on November 4, 2020). As with our other
analysis, we characterized the backup power timing and recharge variation with seasonality, as
applicable.
1 Cadmus conducted nearly all the system analysis research provided in the report using R or Excel. We used data
visualization techniques and descriptive statistics to investigate relevant research questions, creating all data
visualizations using the ggplot2 and plotly packages in R.
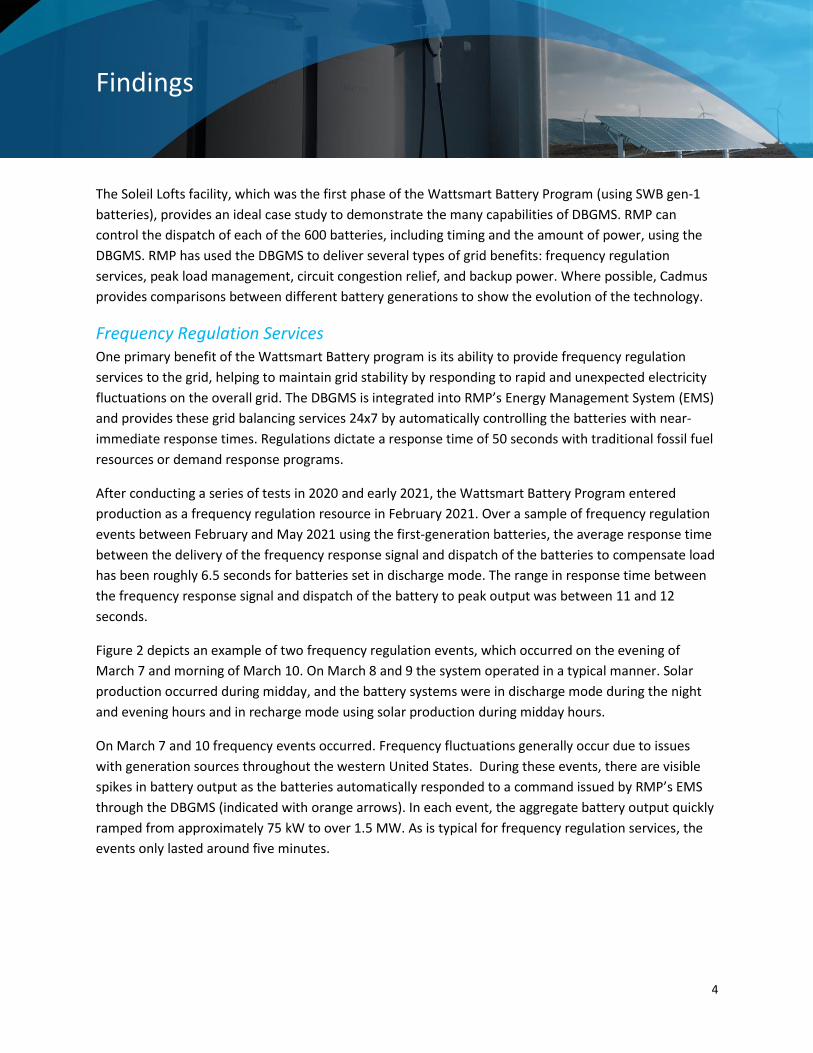
Findings
4
Findings
The Soleil Lofts facility, which was the first phase of the Wattsmart Battery Program (using SWB gen-1
batteries), provides an ideal case study to demonstrate the many capabilities of DBGMS. RMP can
control the dispatch of each of the 600 batteries, including timing and the amount of power, using the
DBGMS. RMP has used the DBGMS to deliver several types of grid benefits: frequency regulation
services, peak load management, circuit congestion relief, and backup power. Where possible, Cadmus
provides comparisons between different battery generations to show the evolution of the technology.
Frequency Regulation Services One primary benefit of the Wattsmart Battery program is its ability to provide frequency regulation
services to the grid, helping to maintain grid stability by responding to rapid and unexpected electricity
fluctuations on the overall grid. The DBGMS is integrated into RMP’s Energy Management System (EMS)
and provides these grid balancing services 24x7 by automatically controlling the batteries with near-
immediate response times. Regulations dictate a response time of 50 seconds with traditional fossil fuel
resources or demand response programs.
After conducting a series of tests in 2020 and early 2021, the Wattsmart Battery Program entered
production as a frequency regulation resource in February 2021. Over a sample of frequency regulation
events between February and May 2021 using the first-generation batteries, the average response time
between the delivery of the frequency response signal and dispatch of the batteries to compensate load
has been roughly 6.5 seconds for batteries set in discharge mode. The range in response time between
the frequency response signal and dispatch of the battery to peak output was between 11 and 12
seconds.
Figure 2 depicts an example of two frequency regulation events, which occurred on the evening of
March 7 and morning of March 10. On March 8 and 9 the system operated in a typical manner. Solar
production occurred during midday, and the battery systems were in discharge mode during the night
and evening hours and in recharge mode using solar production during midday hours.
On March 7 and 10 frequency events occurred. Frequency fluctuations generally occur due to issues
with generation sources throughout the western United States. During these events, there are visible
spikes in battery output as the batteries automatically responded to a command issued by RMP’s EMS
through the DBGMS (indicated with orange arrows). In each event, the aggregate battery output quickly
ramped from approximately 75 kW to over 1.5 MW. As is typical for frequency regulation services, the
events only lasted around five minutes.
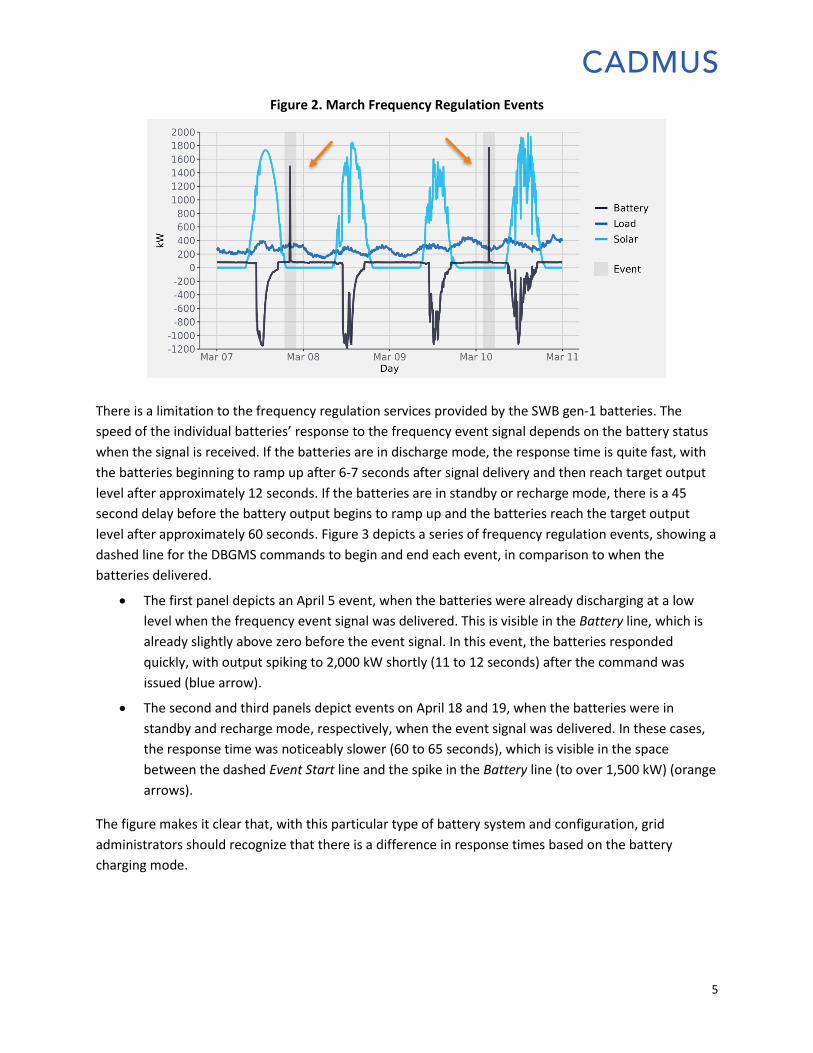
5
Figure 2. March Frequency Regulation Events
There is a limitation to the frequency regulation services provided by the SWB gen-1 batteries. The
speed of the individual batteries’ response to the frequency event signal depends on the battery status
when the signal is received. If the batteries are in discharge mode, the response time is quite fast, with
the batteries beginning to ramp up after 6-7 seconds after signal delivery and then reach target output
level after approximately 12 seconds. If the batteries are in standby or recharge mode, there is a 45
second delay before the battery output begins to ramp up and the batteries reach the target output
level after approximately 60 seconds. Figure 3 depicts a series of frequency regulation events, showing a
dashed line for the DBGMS commands to begin and end each event, in comparison to when the
batteries delivered.
• The first panel depicts an April 5 event, when the batteries were already discharging at a low
level when the frequency event signal was delivered. This is visible in the Battery line, which is
already slightly above zero before the event signal. In this event, the batteries responded
quickly, with output spiking to 2,000 kW shortly (11 to 12 seconds) after the command was
issued (blue arrow).
• The second and third panels depict events on April 18 and 19, when the batteries were in
standby and recharge mode, respectively, when the event signal was delivered. In these cases,
the response time was noticeably slower (60 to 65 seconds), which is visible in the space
between the dashed Event Start line and the spike in the Battery line (to over 1,500 kW) (orange
arrows).
The figure makes it clear that, with this particular type of battery system and configuration, grid
administrators should recognize that there is a difference in response times based on the battery
charging mode.
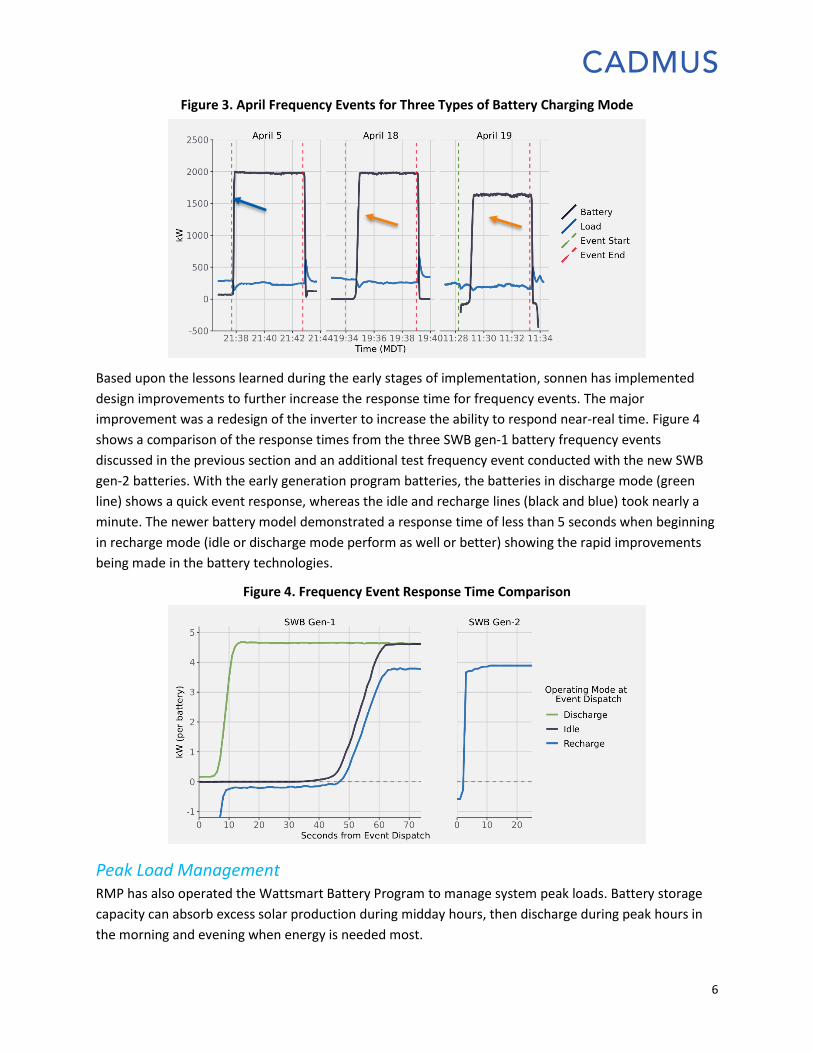
6
Figure 3. April Frequency Events for Three Types of Battery Charging Mode
Based upon the lessons learned during the early stages of implementation, sonnen has implemented
design improvements to further increase the response time for frequency events. The major
improvement was a redesign of the inverter to increase the ability to respond near-real time. Figure 4
shows a comparison of the response times from the three SWB gen-1 battery frequency events
discussed in the previous section and an additional test frequency event conducted with the new SWB
gen-2 batteries. With the early generation program batteries, the batteries in discharge mode (green
line) shows a quick event response, whereas the idle and recharge lines (black and blue) took nearly a
minute. The newer battery model demonstrated a response time of less than 5 seconds when beginning
in recharge mode (idle or discharge mode perform as well or better) showing the rapid improvements
being made in the battery technologies.
Figure 4. Frequency Event Response Time Comparison
Peak Load Management RMP has also operated the Wattsmart Battery Program to manage system peak loads. Battery storage
capacity can absorb excess solar production during midday hours, then discharge during peak hours in
the morning and evening when energy is needed most.
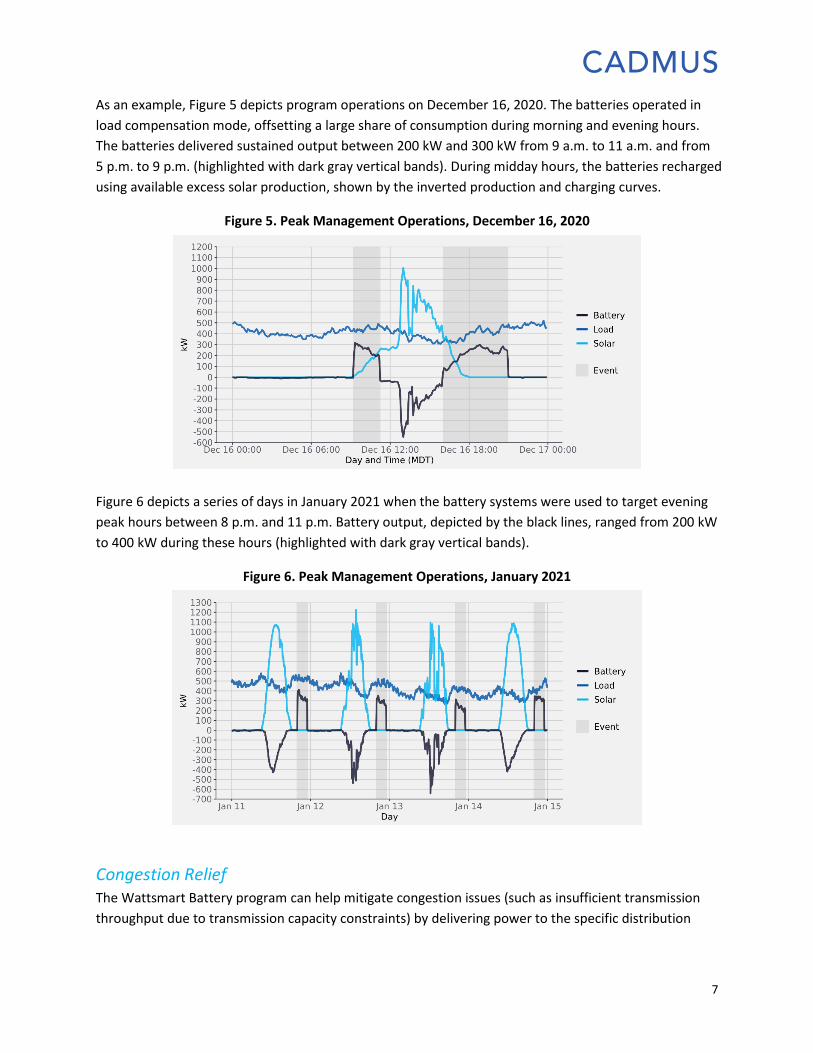
7
As an example, Figure 5 depicts program operations on December 16, 2020. The batteries operated in
load compensation mode, offsetting a large share of consumption during morning and evening hours.
The batteries delivered sustained output between 200 kW and 300 kW from 9 a.m. to 11 a.m. and from
5 p.m. to 9 p.m. (highlighted with dark gray vertical bands). During midday hours, the batteries recharged
using available excess solar production, shown by the inverted production and charging curves.
Figure 5. Peak Management Operations, December 16, 2020
Figure 6 depicts a series of days in January 2021 when the battery systems were used to target evening
peak hours between 8 p.m. and 11 p.m. Battery output, depicted by the black lines, ranged from 200 kW
to 400 kW during these hours (highlighted with dark gray vertical bands).
Figure 6. Peak Management Operations, January 2021
Congestion Relief The Wattsmart Battery program can help mitigate congestion issues (such as insufficient transmission
throughput due to transmission capacity constraints) by delivering power to the specific distribution

8
system areas that are experiencing congestion. Congestion relief from battery storage can help defer
costly future local transmission and distribution investments.
Figure 7 depicts operations during a local circuit congestion event on July 24, 2021. The figure includes
the output of the program batteries and load on the nearby circuit. Between 8:00 p.m. and 9:00 p.m.,
the Wattsmart Battery systems were dispatched to reduce load at the circuit and relieve transmission
congestion. In aggregate, the batteries delivered approximately 2 MW throughout the event hour. Due
to the battery output, load at the circuit was reduced by 30% (from approximately 250 amps to 175
amps).
Figure 7. Distribution Circuit Congestion Event – July 24, 2021
Backup Power Another major grid benefit of battery systems is the backup power they can provide during power
outages. When an outage occurs, battery output ramps up to serve electricity use in the home. If the
outage occurs while solar is being produced, the solar output will serve home power needs, preserving
energy in the battery for later use.
A power outage is known to have impacted the multi-family complex enrolled in the program (Soleil), on
November 4, 2020. Figure 8 depicts aggregate power flows for a sample of units (n=267) on that day,
where aggregate facility load is the sum of wattage used by that sample of units in 5-minute intervals.
Solar production occurred between 8 a.m. and 5 p.m., peaking around 1 p.m. (shown in light blue dots).
The green points indicate battery input and output. The positive battery values, which occurred before
8 a.m. and after 6 p.m., indicate output. The negative battery values between 8 a.m. and 5 p.m. indicate
battery recharge coinciding with solar production. The grid points depict positive and negative power
flows from the grid. Positive grid values indicate grid power consumed at the facility. Negative grid
values indicate power exported from the facility to the grid.
Energy use during night, early morning, and evening hours was served by a mix of grid power and
battery output. During midday hours, solar production serves all facility load and battery recharge, and
exports additional power to the grid.

9
The outage occurred between approximately 4 p.m. and 6:20 p.m. During the outage, there was an
interruption in data collection (the dark gray band in Figure 8). Based on information provided by RMP
and sonnen, the solar and battery systems successfully responded to the outage automatically and
provided continuous service. Few customers were aware that an outage even occurred.
Figure 8. Aggregate Facility Operations, November 4, 2020
General Backup Power Calculation
The calculation of how long a battery might last during an outage depends on many factors. Below is an
example with various assumptions, for illustrative purposes.
Table 1. Backup Power Example Assumptions (Without Solar)
Variable Assumption
Battery Size 10 kWh
State of Charge 80%
Daily Usage 24 kWh
Time of Outage 10:00 pm
𝐵𝑎𝑐𝑘𝑢𝑝 𝐶𝑜𝑣𝑒𝑟𝑎𝑔𝑒 (𝑛𝑜 𝑠𝑜𝑙𝑎𝑟) =𝐵𝑎𝑡𝑡𝑒𝑟𝑦 𝑆𝑖𝑧𝑒 × 𝑆𝑡𝑎𝑡𝑒 𝑜𝑓 𝐶ℎ𝑎𝑟𝑔𝑒
𝐷𝑎𝑖𝑙𝑦 𝑈𝑠𝑎𝑔𝑒24 ℎ𝑜𝑢𝑟𝑠
⁄
𝐵𝑎𝑐𝑘𝑢𝑝 𝐶𝑜𝑣𝑒𝑟𝑎𝑔𝑒 (𝑛𝑜 𝑠𝑜𝑙𝑎𝑟) =10 𝑘𝑊ℎ × 80%
24 𝑘𝑊ℎ24 ℎ𝑜𝑢𝑟𝑠⁄
= 8 ℎ𝑜𝑢𝑟𝑠
As can be seen from the above example (assuming no additional power from solar), a battery with 10
kWh of usable capacity, with an 80% state of charge could cover 8 hours of an average daily usage of 24
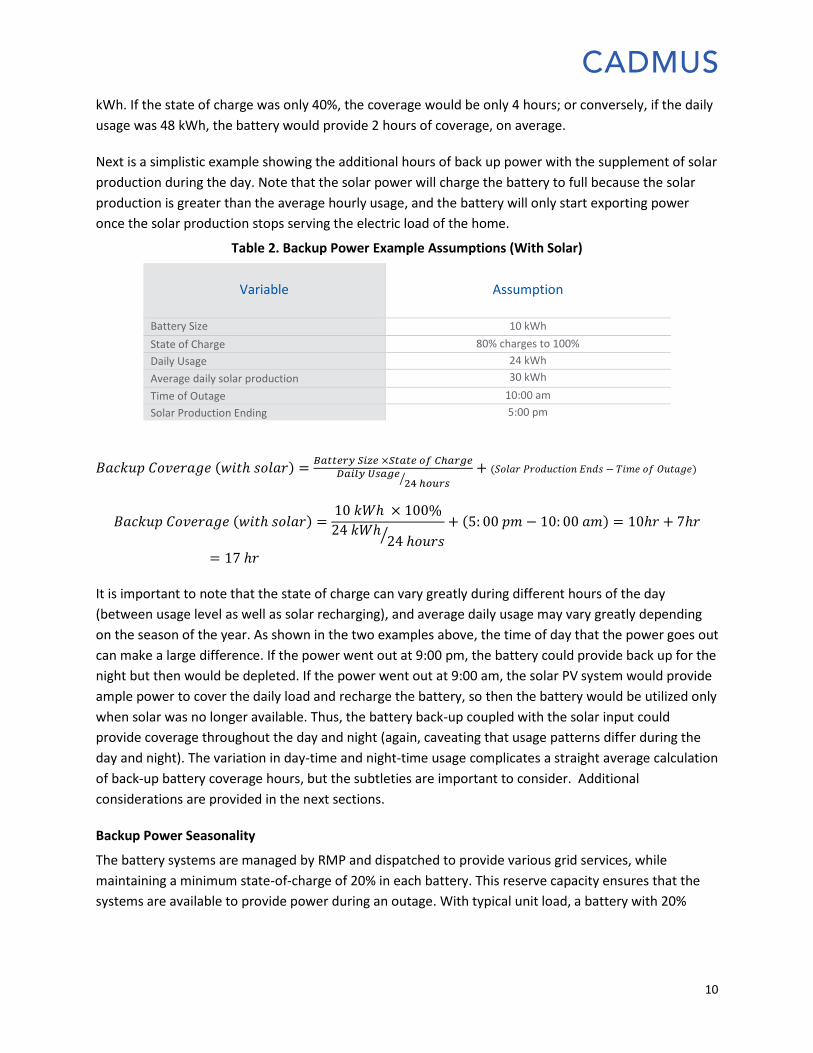
10
kWh. If the state of charge was only 40%, the coverage would be only 4 hours; or conversely, if the daily
usage was 48 kWh, the battery would provide 2 hours of coverage, on average.
Next is a simplistic example showing the additional hours of back up power with the supplement of solar
production during the day. Note that the solar power will charge the battery to full because the solar
production is greater than the average hourly usage, and the battery will only start exporting power
once the solar production stops serving the electric load of the home.
Table 2. Backup Power Example Assumptions (With Solar)
Variable Assumption
Battery Size 10 kWh
State of Charge 80% charges to 100%
Daily Usage 24 kWh
Average daily solar production 30 kWh
Time of Outage 10:00 am
Solar Production Ending 5:00 pm
𝐵𝑎𝑐𝑘𝑢𝑝 𝐶𝑜𝑣𝑒𝑟𝑎𝑔𝑒 (𝑤𝑖𝑡ℎ 𝑠𝑜𝑙𝑎𝑟) =𝐵𝑎𝑡𝑡𝑒𝑟𝑦 𝑆𝑖𝑧𝑒 ×𝑆𝑡𝑎𝑡𝑒 𝑜𝑓 𝐶ℎ𝑎𝑟𝑔𝑒
𝐷𝑎𝑖𝑙𝑦 𝑈𝑠𝑎𝑔𝑒24 ℎ𝑜𝑢𝑟𝑠⁄
+ (𝑆𝑜𝑙𝑎𝑟 𝑃𝑟𝑜𝑑𝑢𝑐𝑡𝑖𝑜𝑛 𝐸𝑛𝑑𝑠 − 𝑇𝑖𝑚𝑒 𝑜𝑓 𝑂𝑢𝑡𝑎𝑔𝑒)
𝐵𝑎𝑐𝑘𝑢𝑝 𝐶𝑜𝑣𝑒𝑟𝑎𝑔𝑒 (𝑤𝑖𝑡ℎ 𝑠𝑜𝑙𝑎𝑟) =10 𝑘𝑊ℎ × 100%
24 𝑘𝑊ℎ24 ℎ𝑜𝑢𝑟𝑠⁄
+ (5: 00 𝑝𝑚 − 10: 00 𝑎𝑚) = 10ℎ𝑟 + 7ℎ𝑟
= 17 ℎ𝑟
It is important to note that the state of charge can vary greatly during different hours of the day
(between usage level as well as solar recharging), and average daily usage may vary greatly depending
on the season of the year. As shown in the two examples above, the time of day that the power goes out
can make a large difference. If the power went out at 9:00 pm, the battery could provide back up for the
night but then would be depleted. If the power went out at 9:00 am, the solar PV system would provide
ample power to cover the daily load and recharge the battery, so then the battery would be utilized only
when solar was no longer available. Thus, the battery back-up coupled with the solar input could
provide coverage throughout the day and night (again, caveating that usage patterns differ during the
day and night). The variation in day-time and night-time usage complicates a straight average calculation
of back-up battery coverage hours, but the subtleties are important to consider. Additional
considerations are provided in the next sections.
Backup Power Seasonality
The battery systems are managed by RMP and dispatched to provide various grid services, while
maintaining a minimum state-of-charge of 20% in each battery. This reserve capacity ensures that the
systems are available to provide power during an outage. With typical unit load, a battery with 20%
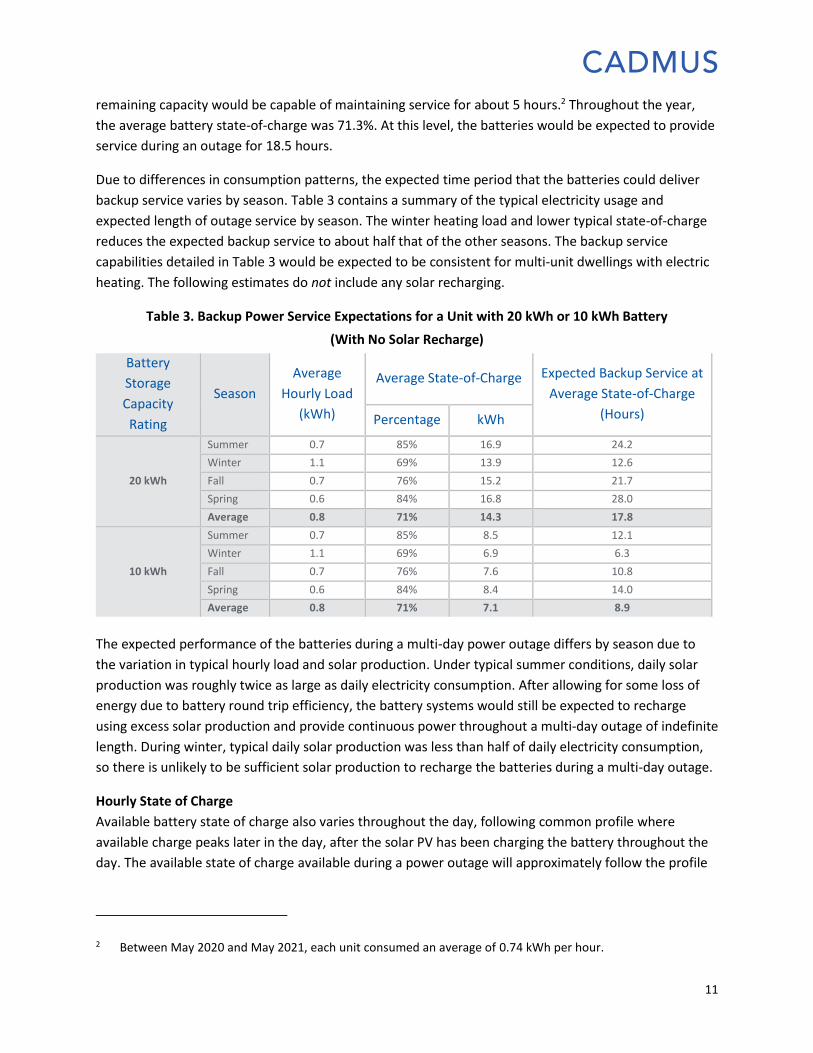
11
remaining capacity would be capable of maintaining service for about 5 hours.2 Throughout the year,
the average battery state-of-charge was 71.3%. At this level, the batteries would be expected to provide
service during an outage for 18.5 hours.
Due to differences in consumption patterns, the expected time period that the batteries could deliver
backup service varies by season. Table 3 contains a summary of the typical electricity usage and
expected length of outage service by season. The winter heating load and lower typical state-of-charge
reduces the expected backup service to about half that of the other seasons. The backup service
capabilities detailed in Table 3 would be expected to be consistent for multi-unit dwellings with electric
heating. The following estimates do not include any solar recharging.
Table 3. Backup Power Service Expectations for a Unit with 20 kWh or 10 kWh Battery
(With No Solar Recharge)
Battery
Storage
Capacity
Rating
Season
Average
Hourly Load
(kWh)
Average State-of-Charge Expected Backup Service at
Average State-of-Charge
(Hours) Percentage kWh
20 kWh
Summer 0.7 85% 16.9 24.2
Winter 1.1 69% 13.9 12.6
Fall 0.7 76% 15.2 21.7
Spring 0.6 84% 16.8 28.0
Average 0.8 71% 14.3 17.8
10 kWh
Summer 0.7 85% 8.5 12.1
Winter 1.1 69% 6.9 6.3
Fall 0.7 76% 7.6 10.8
Spring 0.6 84% 8.4 14.0
Average 0.8 71% 7.1 8.9
The expected performance of the batteries during a multi-day power outage differs by season due to
the variation in typical hourly load and solar production. Under typical summer conditions, daily solar
production was roughly twice as large as daily electricity consumption. After allowing for some loss of
energy due to battery round trip efficiency, the battery systems would still be expected to recharge
using excess solar production and provide continuous power throughout a multi-day outage of indefinite
length. During winter, typical daily solar production was less than half of daily electricity consumption,
so there is unlikely to be sufficient solar production to recharge the batteries during a multi-day outage.
Hourly State of Charge
Available battery state of charge also varies throughout the day, following common profile where
available charge peaks later in the day, after the solar PV has been charging the battery throughout the
day. The available state of charge available during a power outage will approximately follow the profile
2 Between May 2020 and May 2021, each unit consumed an average of 0.74 kWh per hour.
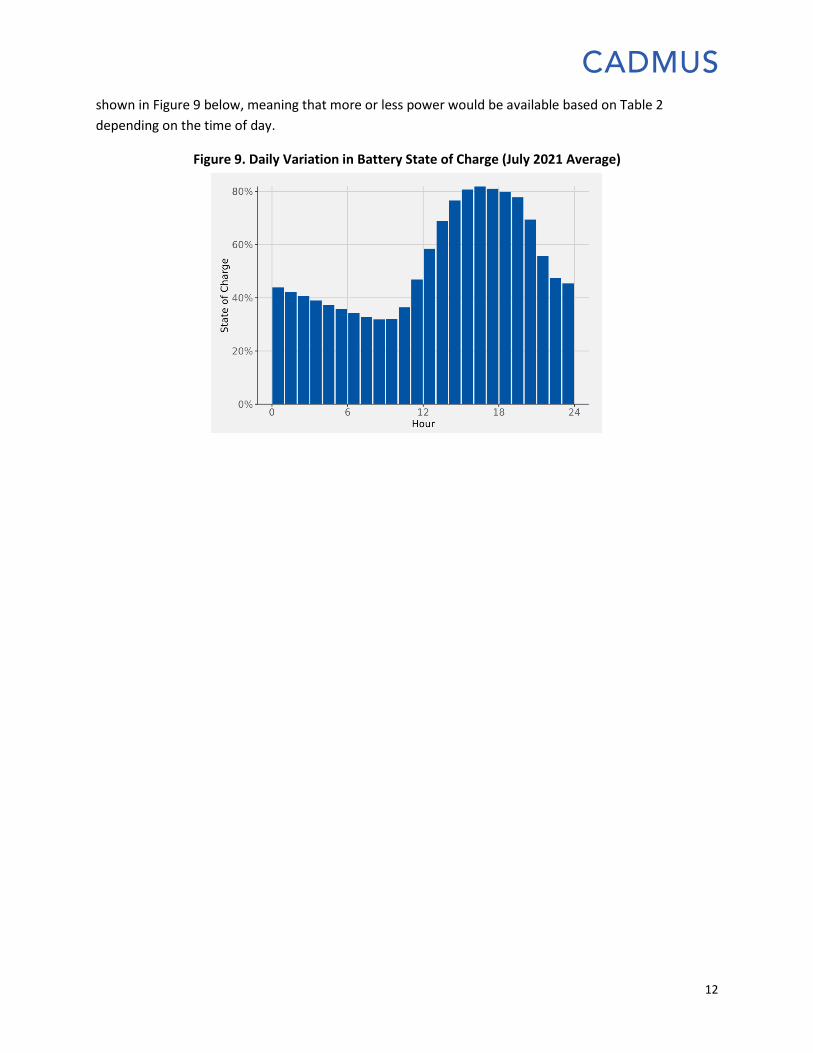
12
shown in Figure 9 below, meaning that more or less power would be available based on Table 2
depending on the time of day.
Figure 9. Daily Variation in Battery State of Charge (July 2021 Average)
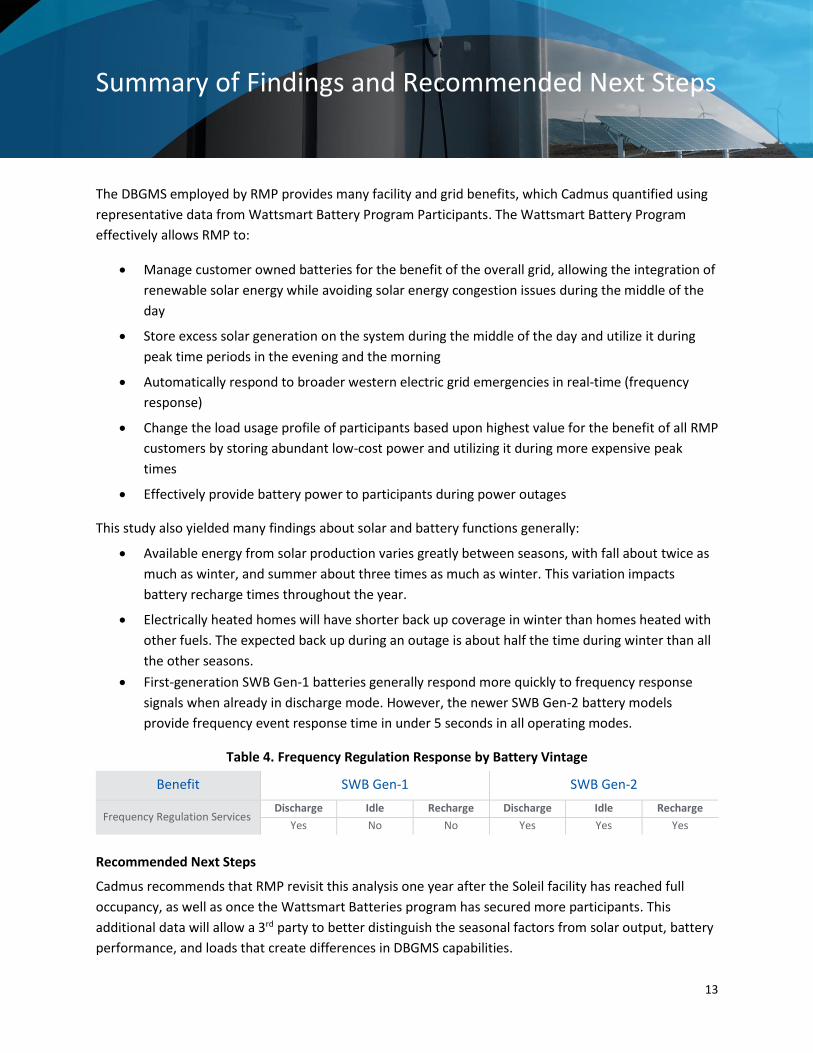
Summary of Findings and Recommended Next Steps
13
Summary of Findings and Recommended Next Steps
The DBGMS employed by RMP provides many facility and grid benefits, which Cadmus quantified using
representative data from Wattsmart Battery Program Participants. The Wattsmart Battery Program
effectively allows RMP to:
• Manage customer owned batteries for the benefit of the overall grid, allowing the integration of
renewable solar energy while avoiding solar energy congestion issues during the middle of the
day
• Store excess solar generation on the system during the middle of the day and utilize it during
peak time periods in the evening and the morning
• Automatically respond to broader western electric grid emergencies in real-time (frequency
response)
• Change the load usage profile of participants based upon highest value for the benefit of all RMP
customers by storing abundant low-cost power and utilizing it during more expensive peak
times
• Effectively provide battery power to participants during power outages
This study also yielded many findings about solar and battery functions generally:
• Available energy from solar production varies greatly between seasons, with fall about twice as
much as winter, and summer about three times as much as winter. This variation impacts
battery recharge times throughout the year.
• Electrically heated homes will have shorter back up coverage in winter than homes heated with
other fuels. The expected back up during an outage is about half the time during winter than all
the other seasons.
• First-generation SWB Gen-1 batteries generally respond more quickly to frequency response
signals when already in discharge mode. However, the newer SWB Gen-2 battery models
provide frequency event response time in under 5 seconds in all operating modes.
Table 4. Frequency Regulation Response by Battery Vintage
Benefit SWB Gen-1 SWB Gen-2
Frequency Regulation Services Discharge Idle Recharge Discharge Idle Recharge
Yes No No Yes Yes Yes
Recommended Next Steps
Cadmus recommends that RMP revisit this analysis one year after the Soleil facility has reached full
occupancy, as well as once the Wattsmart Batteries program has secured more participants. This
additional data will allow a 3rd party to better distinguish the seasonal factors from solar output, battery
performance, and loads that create differences in DBGMS capabilities.
14
Appendix A. Soleil Lofts Apartment Complex
Facility Specifications RMP partnered with battery manufacturer sonnen and Auric Energy to deploy solar PV and battery
storage across all units at the newly constructed 600-unit Soleil Lofts apartment complex in Herriman,
UT. Each Soleil housing unit has a solar photovoltaic array and sonnen battery system. Residents of Soleil
Lofts are renters, with the solar and storage simply included in rent. The battery systems have a storage
capacity of 20 kWh and the inverters produce continuous output of up to 7.2 kW. The 600 Soleil Loft
apartment units are linked through the DBGMS, creating an aggregate battery storage capacity of over
10 MWh with 4.8 MW of output potential. Each unit also includes a 5 - 8 kW solar array, for an
aggregate solar capacity up to 5 MW. RMP has access to a DBGMS dashboard that allows them to
schedule dispatches based on grid needs, initiate several automated operating scenarios it can assign,
and specify how much battery capacity should be held in reserve in the event of a power outage.
Facility Operations In the future, additional customers who enroll in the Wattsmart Batteries program will come from a mix
of single-family homes and multi-unit dwellings. The Soleil Lofts apartment complex is a unique example
of a comprehensive electric housing development. Some aspects of the unit operations are likely unique
to this type of facility, but some of the lessons learned will be applicable to any residential housing unit
with solar and storage. The following sections detail the seasonal variation in facility load and in solar
production at the Soleil complex, along with a discussion of whether the load and solar production
characteristics are unique to Soleil or can be more generally applied.
Facility Load
The Soleil Complex is a fully electrified facility, meaning that all units are designed for electric cooking,
heating, cooling, and other home energy end uses. Figure 10 depicts the average 24-hour loadshape for
a Soleil unit by season (note that weekend and weekdays did not show difference in consumption).
Overall consumption is somewhat higher in the winter, likely due to greater heating load (which typically
contributes to peak during morning [10 a.m.] and evening hours [8 p.m. to midnight] in winter months).
There also appears to be a summer peak in consumption due to increased cooling loads during late
afternoon and evening hours.
These customer loadshapes are likely somewhat unique to a fully electric multi-unit dwelling. A typical
single-family house would likely exhibit greater seasonal and daily variation in consumption.
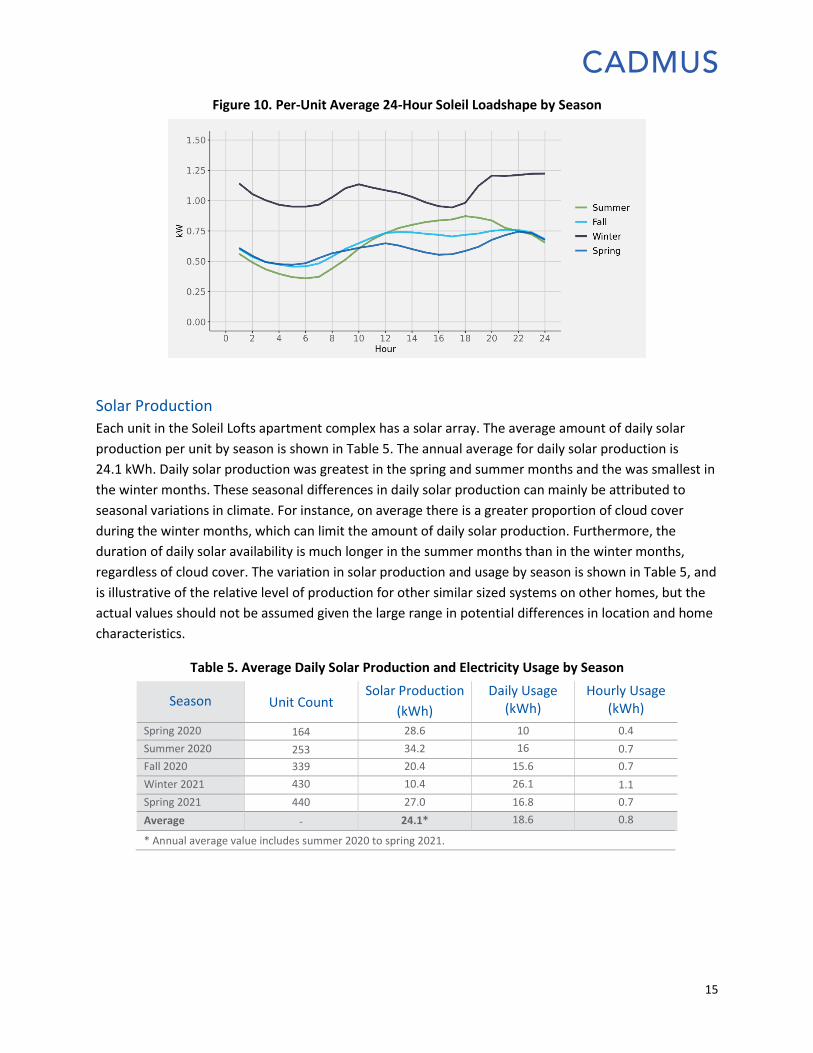
15
Figure 10. Per-Unit Average 24-Hour Soleil Loadshape by Season
Solar Production
Each unit in the Soleil Lofts apartment complex has a solar array. The average amount of daily solar
production per unit by season is shown in Table 5. The annual average for daily solar production is
24.1 kWh. Daily solar production was greatest in the spring and summer months and the was smallest in
the winter months. These seasonal differences in daily solar production can mainly be attributed to
seasonal variations in climate. For instance, on average there is a greater proportion of cloud cover
during the winter months, which can limit the amount of daily solar production. Furthermore, the
duration of daily solar availability is much longer in the summer months than in the winter months,
regardless of cloud cover. The variation in solar production and usage by season is shown in Table 5, and
is illustrative of the relative level of production for other similar sized systems on other homes, but the
actual values should not be assumed given the large range in potential differences in location and home
characteristics.
Table 5. Average Daily Solar Production and Electricity Usage by Season
Season Unit Count Solar Production
(kWh)
Daily Usage (kWh)
Hourly Usage (kWh)
Spring 2020 164 28.6 10 0.4
Summer 2020 253 34.2 16 0.7
Fall 2020 339 20.4 15.6 0.7
Winter 2021 430 10.4 26.1 1.1
Spring 2021 440 27.0 16.8 0.7
Average - 24.1* 18.6 0.8
* Annual average value includes summer 2020 to spring 2021.
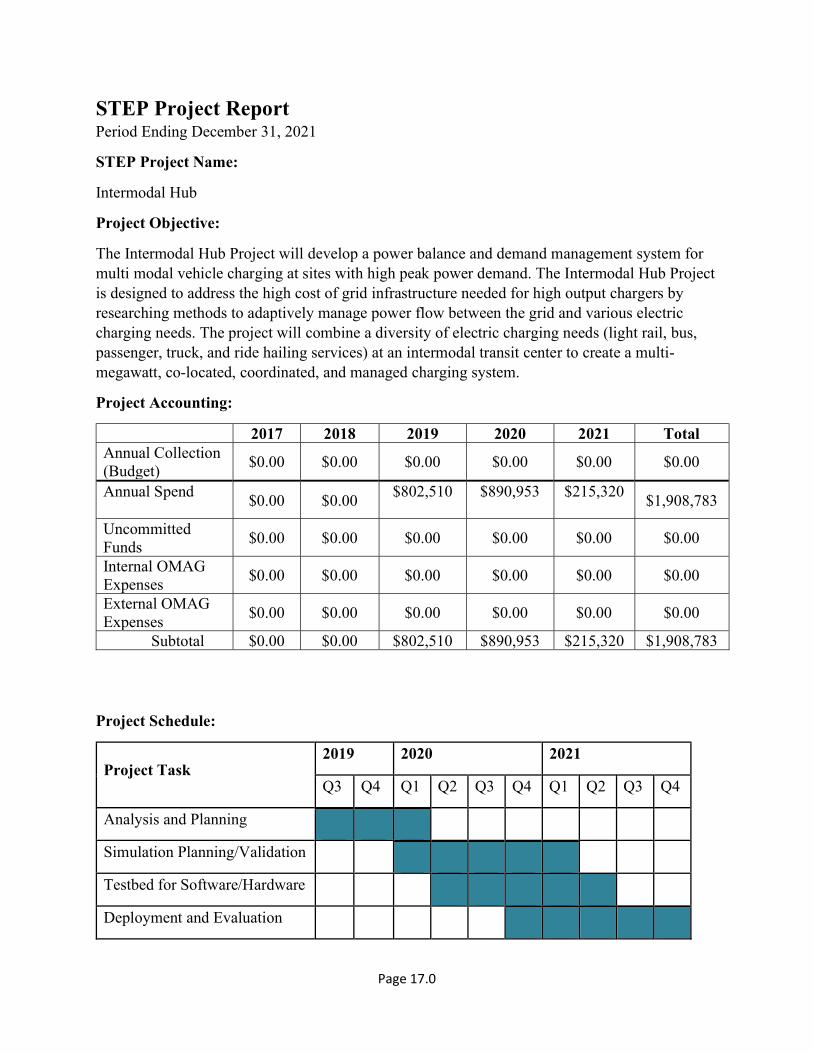
Page 17.0
STEP Project Report Period Ending December 31, 2021
STEP Project Name:
Intermodal Hub
Project Objective:
The Intermodal Hub Project will develop a power balance and demand management system for multi modal vehicle charging at sites with high peak power demand. The Intermodal Hub Project is designed to address the high cost of grid infrastructure needed for high output chargers by researching methods to adaptively manage power flow between the grid and various electric charging needs. The project will combine a diversity of electric charging needs (light rail, bus, passenger, truck, and ride hailing services) at an intermodal transit center to create a multi-megawatt, co-located, coordinated, and managed charging system.
Project Accounting:
2017 2018 2019 2020 2021 Total Annual Collection (Budget)
$0.00 $0.00 $0.00 $0.00 $0.00 $0.00
Annual Spend $0.00 $0.00
$802,510 $890,953
$215,320
$1,908,783
Uncommitted Funds
$0.00 $0.00 $0.00 $0.00 $0.00 $0.00
Internal OMAG Expenses
$0.00 $0.00 $0.00 $0.00 $0.00 $0.00
External OMAG Expenses
$0.00 $0.00 $0.00 $0.00 $0.00 $0.00
Subtotal $0.00 $0.00 $802,510 $890,953 $215,320 $1,908,783
Project Schedule:
Project Task 2019 2020 2021
Q3 Q4 Q1 Q2 Q3 Q4 Q1 Q2 Q3 Q4
Analysis and Planning
Simulation Planning/Validation
Testbed for Software/Hardware
Deployment and Evaluation
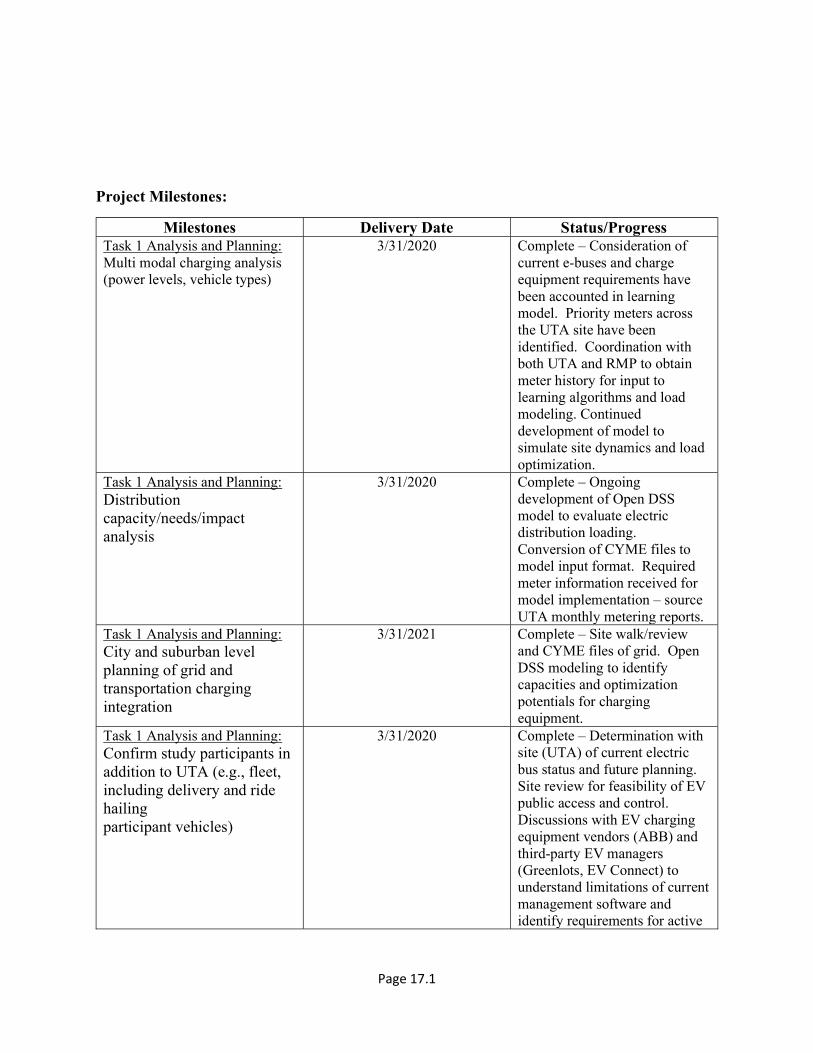
Page 17.1
Project Milestones:
Milestones Delivery Date Status/Progress Task 1 Analysis and Planning: Multi modal charging analysis (power levels, vehicle types)
3/31/2020 Complete – Consideration of current e-buses and charge equipment requirements have been accounted in learning model. Priority meters across the UTA site have been identified. Coordination with both UTA and RMP to obtain meter history for input to learning algorithms and load modeling. Continued development of model to simulate site dynamics and load optimization.
Task 1 Analysis and Planning: Distribution capacity/needs/impact analysis
3/31/2020 Complete – Ongoing development of Open DSS model to evaluate electric distribution loading. Conversion of CYME files to model input format. Required meter information received for model implementation – source UTA monthly metering reports.
Task 1 Analysis and Planning: City and suburban level planning of grid and transportation charging integration
3/31/2021 Complete – Site walk/review and CYME files of grid. Open DSS modeling to identify capacities and optimization potentials for charging equipment.
Task 1 Analysis and Planning: Confirm study participants in addition to UTA (e.g., fleet, including delivery and ride hailing participant vehicles)
3/31/2020 Complete – Determination with site (UTA) of current electric bus status and future planning. Site review for feasibility of EV public access and control. Discussions with EV charging equipment vendors (ABB) and third-party EV managers (Greenlots, EV Connect) to understand limitations of current management software and identify requirements for active
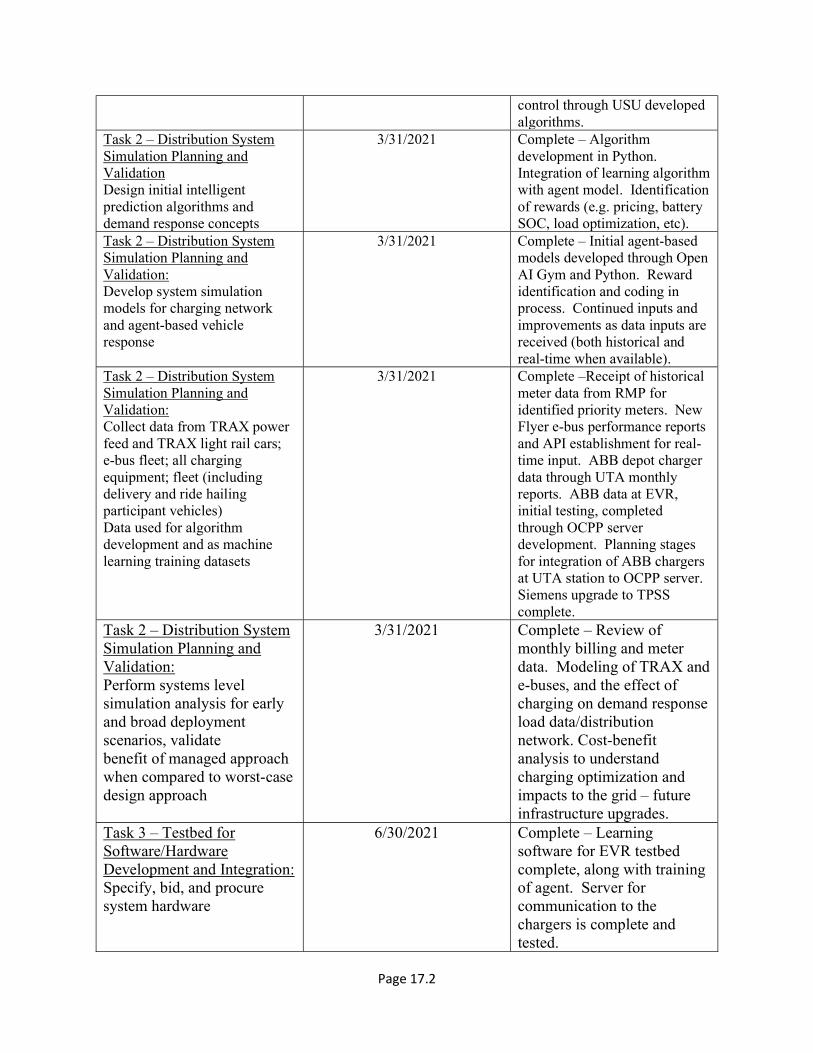
Page 17.2
control through USU developed algorithms.
Task 2 – Distribution System Simulation Planning and Validation Design initial intelligent prediction algorithms and demand response concepts
3/31/2021 Complete – Algorithm development in Python. Integration of learning algorithm with agent model. Identification of rewards (e.g. pricing, battery SOC, load optimization, etc).
Task 2 – Distribution System Simulation Planning and Validation: Develop system simulation models for charging network and agent-based vehicle response
3/31/2021 Complete – Initial agent-based models developed through Open AI Gym and Python. Reward identification and coding in process. Continued inputs and improvements as data inputs are received (both historical and real-time when available).
Task 2 – Distribution System Simulation Planning and Validation: Collect data from TRAX power feed and TRAX light rail cars; e-bus fleet; all charging equipment; fleet (including delivery and ride hailing participant vehicles) Data used for algorithm development and as machine learning training datasets
3/31/2021 Complete –Receipt of historical meter data from RMP for identified priority meters. New Flyer e-bus performance reports and API establishment for real-time input. ABB depot charger data through UTA monthly reports. ABB data at EVR, initial testing, completed through OCPP server development. Planning stages for integration of ABB chargers at UTA station to OCPP server. Siemens upgrade to TPSS complete.
Task 2 – Distribution System Simulation Planning and Validation: Perform systems level simulation analysis for early and broad deployment scenarios, validate benefit of managed approach when compared to worst-case design approach
3/31/2021
Complete – Review of monthly billing and meter data. Modeling of TRAX and e-buses, and the effect of charging on demand response load data/distribution network. Cost-benefit analysis to understand charging optimization and impacts to the grid – future infrastructure upgrades.
Task 3 – Testbed for Software/Hardware Development and Integration: Specify, bid, and procure system hardware
6/30/2021 Complete – Learning software for EVR testbed complete, along with training of agent. Server for communication to the chargers is complete and tested.

Page 17.3
Task 3 – Testbed for Software/Hardware Development and Integration: Anticipate needs for and develop cyber security management Design for compatibility with and security of communication network
6/30/2021 Complete – Cyber security vulnerabilities are being identified for EVR testbed. Discussion pending with UTA IT department to identify additional security constraints for network.
Task 3 – Testbed for Software/Hardware Development and Integration: Write code and program algorithms on servers Algorithms include energy/load balancing and management Design for compatibility with AMI
6/30/2021 Complete – Codes written for EVR testbed include energy/load balancing and management (EVR EMS). Test scenario and code development/training for learning agent complete. Scripts in progress to establish communication between models (input/outputs).
Task 3 – Testbed for Software/Hardware Development and Integration: Evaluate hardware system (with integrated software) at the USU EVR
6/30/2021 Complete
Task 3 – Testbed for Software/Hardware Development and Integration: Iterate algorithm designs and develop pilot demand response program
6/30/2021 complete
Task 4 – Deployment and Evaluation: Integrate hardware and software systems with UTA and RMP equipment and cyber secure communication network
12/31/2021 complete
Task 4 – Deployment and Evaluation: Deploy hardware system at the UTA multi-modal hub site through a phased approach in direct coordination with IT and operations at UTA
12/31/2021 complete
Task 4 – Deployment and Evaluation: Finalize recruiting, engage work with participants for pilot demand response program
12/31/2021 complete

Page 17.4
Task 4 – Deployment and Evaluation: Integrate real-time data collection from all partners and participants into the hardware system
12/31/2021 complete
Task 4 – Deployment and Evaluation: Evaluate power control and demand response performance; iterate algorithms; develop best practices and recommendations
12/31/2021 complete
Key Challenges, Findings, Results and Lessons Learned:
Description of Investment
Anticipated Outcome
Challenges Findings Results Lessons Learned
Understanding of system and energy requirements to be managed
Gather necessary meter inputs from site loads and charging equipment. Develop learning and electrical system models.
Charge equipment and meter information in as close to real-time as possible
See final report
See final report
1. Continued efforts in installing required hardware for metering information
2. Determined type of equipment upgrades required at TPSS to enable active data acquisition.
3. Upgrade installation in progress
Active control of EV equipment – OCPP communication (Open Charge Point Protocol)
Receive inputs in real-time and actively control EV equipment
1. Installation of local communication for real-time data and active control. Limitations/lag through cloud database and current OCPP
2. Debugging of
OCPP server, requires ABB assistance. ABB equipment supports OCPP 1.6 – however multiple standard interpretations by ABB requires ABB technicians to support
See final report
See final report
1. Realtime control anticipated to be accomplished in a laboratory setting and limited communication requirements, with increased complexities and public access, integration with third-party EV managers necessary. Currently these third-party managers are not actively controlling charge capacity to assist with load balancing across a site.
2. Lessons learned documentation for building OCPP for control of ABB units.
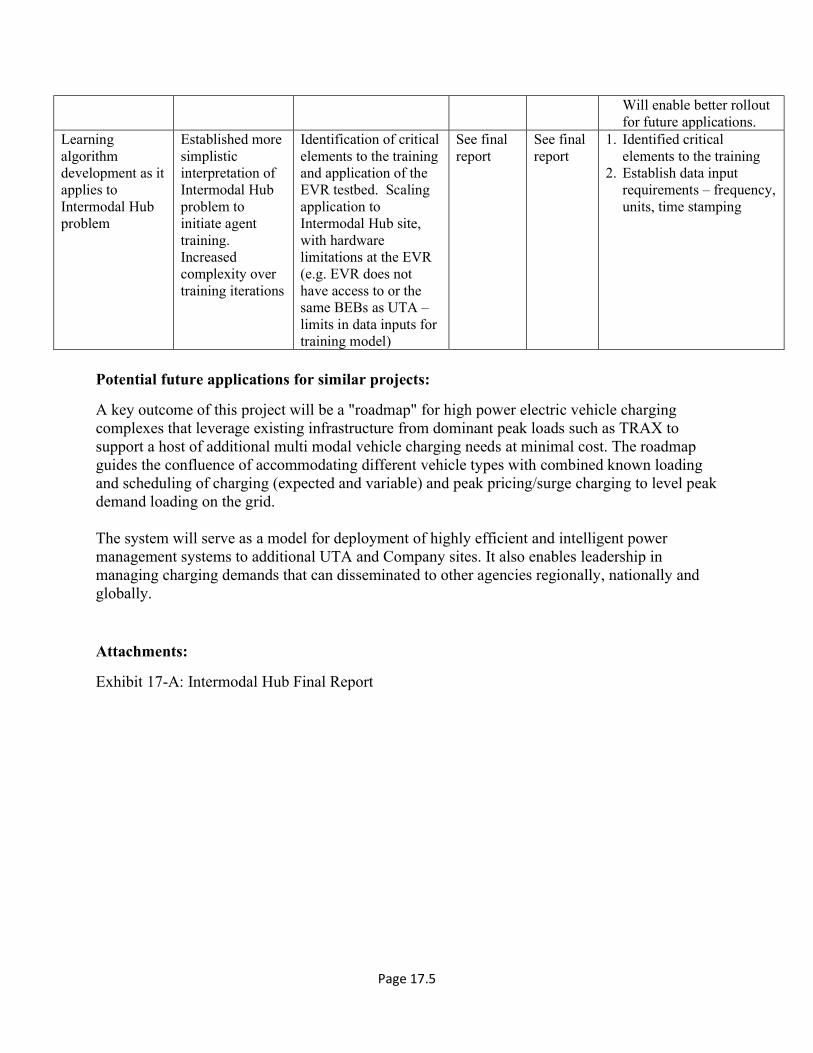
Page 17.5
Will enable better rollout for future applications.
Learning algorithm development as it applies to Intermodal Hub problem
Established more simplistic interpretation of Intermodal Hub problem to initiate agent training. Increased complexity over training iterations
Identification of critical elements to the training and application of the EVR testbed. Scaling application to Intermodal Hub site, with hardware limitations at the EVR (e.g. EVR does not have access to or the same BEBs as UTA – limits in data inputs for training model)
See final report
See final report
1. Identified critical elements to the training
2. Establish data input requirements – frequency, units, time stamping
Potential future applications for similar projects:
A key outcome of this project will be a "roadmap" for high power electric vehicle charging complexes that leverage existing infrastructure from dominant peak loads such as TRAX to support a host of additional multi modal vehicle charging needs at minimal cost. The roadmap guides the confluence of accommodating different vehicle types with combined known loading and scheduling of charging (expected and variable) and peak pricing/surge charging to level peak demand loading on the grid. The system will serve as a model for deployment of highly efficient and intelligent power management systems to additional UTA and Company sites. It also enables leadership in managing charging demands that can disseminated to other agencies regionally, nationally and globally. Attachments:
Exhibit 17-A: Intermodal Hub Final Report

Exhibit 17-A Intermodal Hub Final Report

THIS ATTACHMENT IS VOLUMINOUS AND PROVIDED SEPARATELY

Page 18.0
STEP Project Report Period Ending December 31, 2021
STEP Project Name:
Advanced Resiliency Management System
Project Objective:
The ARMS project enables outage notifications from existing ERT1 electric meters, installation of communication radios on distribution line equipment, and deployment of line sensor technology on distribution circuits. These technologies connect critical customers and enable real-time information exchange with the Company’s control center. The Company will also study if there would be benefits of deploying this technology on distribution circuits that have poor reliability.
Project Accounting:
2017 2018 2019 2020 2021 Total Annual
Collection (Budget)
$0 $0 $1,430,000 $2,874,624 $12,215,376 $16,520,000
Annual Spend (Capital)
$0 $0 $39,931 $2,874,624 $13,492,864 $16,407,419
Committed Funds
$0 $0 $0 $0 $0 $0
Uncommitted Funds
$0 $0 $0 $0 $0 $0
Internal OMAG
Expenses $0 $0 $0 $0 $0 $0
External OMAG
Expenses $0 $0 $0 $0 $0 $0
Subtotal $0 $0 $39,931 $2,874,624 $13,492,864 $16,407,419
Project Milestones:
Milestones Delivery Date Status/Progress Request for DOE funding August 2019 Complete Test cellular communications for distribution protection devices
December 2019 Complete
Develop process to finalize circuit list for fault indicator installation
December 2019 Complete
1 An encoder receiver transmitter (ERT) is a technology that allows manual meter reading to be replaced by a human driving an automobile equipped with a special computer and radio receiver. The meter's consumption data is transmitted through a simple digital radio protocol. This general technique has come to be known as automated meter reading, or AMR.

Page 18.1
Finalize Circuit List February 2020 Complete IT Cybersecurity clearance June 2020 Complete Test fault indicators June 2020 Complete Test EGMs April 2021 Complete Procure & Install EGMs Oct 2021 Complete EGMs Go Live Dec 2021 Complete
Project Benefits:
Reduces manual and mobile metering requirements by removing seven meter reading/collection FTEs and associated overhead.
Provides meter tampering detection. This ability will improve Rocky Mountain Power’s ability to detect and prevent theft.
Provides interval usage data to Utah customers through the Company’s website. Provides a platform that can be leveraged for future grid modernization applications
including distribution automation, outage management, data analytics and demand-response programs.
Reduces customer property visits, meter-reading miles, and employee exposure to safety hazards.
Reduces CO2 emissions through fewer Rocky Mountain Power vehicles on the road. Improves outage response operations by leveraging real-time information from distribution
line device. Helps determine safe switching procedures and cost effective capital improvement and maintenance plans.
Improves reliability metrics such as Sustained Average Interruption Duration Index (SAIDI) and Customer Average Interruption Duration Index (CAIDI).
Leverages real-time information collected from distribution line equipment to augment predictive capability of existing outage management systems and reduces Company reliance on customer reporting for outage notification.
Reduces operations and maintenance costs by eliminating the need for manual load reading performed on circuits that do not have sophisticated meters with remote communication capabilities.
Potential future applications for similar projects:
Lessons learned in this project can be used for a wide range of meter and circuit installations in the future. As improvements are made to the system, the Company can upgrade the system using the knowledge and experience gained from this project. See attached final report for a full explanation of lessons learned. Attachments:
• Exhibit 18-A: Final Report - Advanced Resiliency Management System

Exhibit 18-A Final Report - Advanced Resiliency Management System

FINAL REPORT
Advanced Resiliency Management System
(ARMS)
Sustainable Transportation and Energy Plan
Final Report: Advanced Resiliency Management System | Sustainable Transportation and Energy Plan
i
FINAL REPORT
ADVANCED RESILIENCY MANAGEMENT SYSTEM SUSTAINABLE TRANSPORTATION AND ENERGY PLAN
TABLE OF CONTENTS
1. SUMMARY .......................................................................................................................................... 1
A. Background and History ................................................................................................................... 1 B. ARMS Projects In Brief .................................................................................................................... 1
2. ERT GATEWAYS ............................................................................................................................... 3
A. Initial Proposals ................................................................................................................................ 3 B. Actions Taken ................................................................................................................................... 4 C. Initial Observations ........................................................................................................................... 5 D. Actions Set Aside .............................................................................................................................. 5 F. Future Expansion .............................................................................................................................. 5
3. CELLULAR FIELD AREA NETWORK ............................................................................................ 6
A. Initial Proposals and Objectives ........................................................................................................ 6 B. Actions Taken ................................................................................................................................... 7 C. Initial Observations ........................................................................................................................... 7 D. Actions Set Aside .............................................................................................................................. 8 E. Lessons Learned ................................................................................................................................ 8 F. Future Expansion .............................................................................................................................. 8
4. COMMUNICATING FAULTED CIRCUIT INDICATORS .............................................................. 8
A. Initial Proposals and Objectives ........................................................................................................ 9 B. Actions Taken ................................................................................................................................... 9 C. Actions Set Aside ............................................................................................................................ 13 D. Lessons Learned .............................................................................................................................. 13 E. Future Expansion ............................................................................................................................ 14
5. SUBSTATION CONNECTIVITY AREA NETWORK .................................................................... 15
A. Initial Proposals and Objectives ...................................................................................................... 15 B. Actions Taken ................................................................................................................................. 16 C. Initial Observations ......................................................................................................................... 16 D. Actions Set Aside ............................................................................................................................ 16 E. Lessons Learned .............................................................................................................................. 16 F. Future Expansion ............................................................................................................................ 16
6. CONCLUSION ................................................................................................................................... 17
APPENDIX A – FINANCIAL ................................................................................................................... 18
Final Report: Advanced Resiliency Management System | Sustainable Transportation and Energy Plan
ii
LIST OF TABLES
Table 1—Enhanced Distribution Connectivity Final Project Costs ............................................................. 2 Table 2—Key Project Milestones ................................................................................................................. 4 Table 3—ERT Gateway Final Project Costs ................................................................................................ 5 Table 4—Capital Expenditure Comparison for Fiber, Microwave, and Cellular Communications ............. 6 Table 5—CFAN Milestone Schedule ........................................................................................................... 7 Table 6—CFCI Timeline .............................................................................................................................. 9 Table 7—Sensor Overview ......................................................................................................................... 10 Table 8—CFCI Pilot Sensor Locations ...................................................................................................... 10 Table 9—CFCI Phase-1 Sensor Locations ................................................................................................. 11
LIST OF FIGURES
Figure 1—ERT Outage Notification Gateway .............................................................................................. 4 Figure 2—CFCI Circuit Prioritization ........................................................................................................ 12 Figure 3—CFCI Network and Software Architecture ................................................................................ 13 Figure 4—CFCI Patrol Zones ..................................................................................................................... 14
Final Report: Advanced Resiliency Management System | Sustainable Transportation and Energy Plan
iii
LIST OF ACRONYMS
AC ................................................................................. Alternating Current AMI ............................................................................... Advanced Metering Infrastructure AMR .............................................................................. Automated Meter Reading ANSI ............................................................................. American National Standards Institute ARMS ........................................................................... Advanced Resiliency Management System AWS .............................................................................. Amazon Web Services CFAN ............................................................................ Cellular Field Area Network CFCI .............................................................................. Communicating Faulted Circuit Indicator CIP ................................................................................. Critical Infrastructure Protection DNP ............................................................................... Distributed Network Protocol EGM .............................................................................. ERT Gateway Mesh EMS ............................................................................... Energy Management System ERT Meter ..................................................................... Encoder Receiver Transmitter Meter (AMR) EV ................................................................................. Electric Vehicle EVSE ............................................................................. Electric Vehicle Supply Equipment FAN ............................................................................... Field Area Network FCI ................................................................................. Faulted Circuit Indicators FEP ................................................................................ Front-End Processor IED ................................................................................ Intelligent Electronic Device IP ................................................................................... Internet Protocol MWh ............................................................................. Megawatt-hour NERC ............................................................................ North American Electric Reliability Corporation OMS .............................................................................. Outage Management System OT ................................................................................. Operational Technologies P&C ............................................................................... Protection and Control SAIDI ............................................................................ System Average Interruption Duration Index SCADA ......................................................................... Supervisory Control and Data Acquisition SCAN ............................................................................ Substation Connectivity Area Network STEP ............................................................................. Sustainable Transportation and Energy Plan TLS ................................................................................ Transport Layer Security

Final Report: Advanced Resiliency Management System | Sustainable Transportation and Energy Plan
1
1. SUMMARY
A. Background and History
In 2016, the state of Utah passed Senate Bill 0115, the Sustainable Transportation and Energy Plan (STEP) Act; it was signed into law March 29, 2016. Through STEP, Rocky Mountain Power (the company) intended to increase compliance flexibility, minimize rate impacts on customers related to coal plants, provide incentives for electric vehicle infrastructure, fund research into clean coal technology, authorize the development of a renewable energy tariff for business customers, and serve as a funding source for other innovative utility programs. In addition — and most relevant to this report — STEP allowed Rocky Mountain Power to seek funding to support improvements to its energy storage, grid management and resiliency.
In 2019, under STEP, the Public Service Commission of Utah approved the Advanced Resiliency Management System (ARMS) project. With the primary goal of increasing situational awareness about the company’s distribution grid, ARMS, the largest of several projects supported by STEP, included:
Encoder receiver transmitter (ERT) gateways Enhanced distribution connectivity
o Cellular field area network (CFAN) o Communicating faulted circuit indicator (CFCI) o Substation connectivity area network (SCAN)
The overall objective of ARMS was to support modernizing and automating the Rocky Mountain Power distribution system. This smart grid-type modernization will continue to help the company respond more effectively to outages (providing critical value to wildfire mitigation efforts that have grown in relevance since the original STEP legislation) and support more efficient grid management.
B. ARMS Projects In Brief
This 2022 report provides an overview of the end results of the four programs briefly described below, ERT Gateways and three projects that can be understood within the umbrella term enhanced distribution connectivity: CFAN, CFCI and SCAN. It will address the initial proposals, actions taken, initial observations, future expansion, and where appropriate, lessons learned and actions not taken for each of these four ARMS projects.
Encoder Receiver Transmitter Gateways
Rocky Mountain Power developed and deployed an advanced outage notification system using existing ERT-based electric meters and newly created ERT Gateway devices. With the new system in place the company will be able to respond to outages more quickly, reducing customer outage times throughout Utah.

Final Report: Advanced Resiliency Management System | Sustainable Transportation and Energy Plan
2
Enhanced Distribution Connectivity
Three projects funded through ARMS address different facets of enhanced distribution connectivity: CFAN, CFCIs and SCAN. Generally, these three programs use intelligent devices and connectivity software to improve company situational awareness related to load and outages that impact distribution infrastructure. The final costs for the ARMS-related CFAN, CFCI and SCAN projects are summarized in Table 1.
Table 1—Enhanced Distribution Connectivity Final Project Costs
Work Stream Actual 1 Approved Variance
Enhanced distribution connectivity $5.15m $5.23m $0.08m
1 Financials will not be finalized until end of March 2022
1. Cellular Field Area Network
The CFAN architecture delivers a secure, scalable alternative method for supporting communications with field-based intelligent electronic devices (IED) using commercially available cellular networks. The Rocky Mountain Power CFAN project delivers a standard, back-end infrastructure and set of operational procedures for installation, management and maintenance of communication devices that can be used to monitor and control distribution line protection and control (P&C) devices. This new, low-cost communication method provides wildfire mitigation and grid resiliency options for specific, typically remote, areas where adding communications with traditional fiber/microwave is cost prohibitive and/or requires excessively long implementation lead times.
2. Communicating Faulted Circuit Indicators
Traditional noncommunicating faulted circuit indicators (FCI) have been used for decades to locate faults on the company’s distribution system. FCIs are purely visual, rely on static trip thresholds and customer call-ins to report loss of service, and typically use time-based settings that can create confusion when subsequent faults occur on the same faulted circuit. CFCIs — equipped with advanced microprocessors and embedded cellular modems — can overcome many of the challenges associated with FCIs. Using CFCIs, abnormal circuit conditions can be immediately classified and communicated in a centrally managed system accessible to dispatchers and engineers — before, or with customer calls, to narrow down the likely outage or fault locations.
3. Substation Connectivity Area Network
The CFAN and CFCI systems enable a higher level of situational awareness on company distribution circuits. However, to gain a holistic view of the distribution system at any given point in time, it is critical to establish a similar level of connectivity and situational awareness inside substations. The SCAN project evaluates cybersecure architectures, and subsequently builds and tests the back-end infrastructure to enable
Final Report: Advanced Resiliency Management System | Sustainable Transportation and Energy Plan
3
operations and management using a new, IP-based substation connectivity model. During the early stages of the SCAN project, integrating several existing and new applications for asset management, remote system operations management, security management and compliance management into a centralized suite of applications is required for success. The AssurX SCAN system was deployed as part of the project to achieve this objective.
2. ERT GATEWAYS
Rocky Mountain Power developed and deployed an advanced outage notification system using existing ERT-based Centron C1SR AMR electric meters and newly created ERT Gateway devices. With the new system in place, the company can respond to outages more quickly, reducing customer outage times throughout the state.
A. Initial Proposals
Rocky Mountain Power has over 825,000 ERT meters1 installed in Utah that are read monthly with a mobile meter reading system to identify consumption and generate billing. These meters send out a data signal every 30 seconds with the current register read. As an additional default capability, these meters can send a power outage notification and restoration message, as well provide the current meter register reads, in each transmitted pulse. Lacking a network or devices capable of capturing loss-of-power-related signals, these outage notifications had gone unnoticed.
Before 2018, Itron, the supplier for the existing Rocky Mountain Power Centron C1SR ERT meters, had developed an “ERT Gateway” field device that interfaced with their Open Way RIVA AMI system to collect and transmit outage and restoration data from ERT-based gas and water meters. However, a similar device was not available for the existing Centron C1SR ERT electric meters.
The Utah STEP program provided a budget of $11.29m, as a component of ARMS, to fund a project to develop an ERT Gateway that would interface with Itron’s Gen5 AMI network to capture and transport ERT meter outage notifications and metered data from the existing Centron C1SR AMR meters (see Figure 1—ERT Outage Notification GatewayFigure 1). Using the outage notifications, the company can analyze and respond to loss of power more quickly, reducing overall outage times.
1 There were 764,000 meters in the original documentation. The increase in meter counts is due to customer growth over the project timeframe.
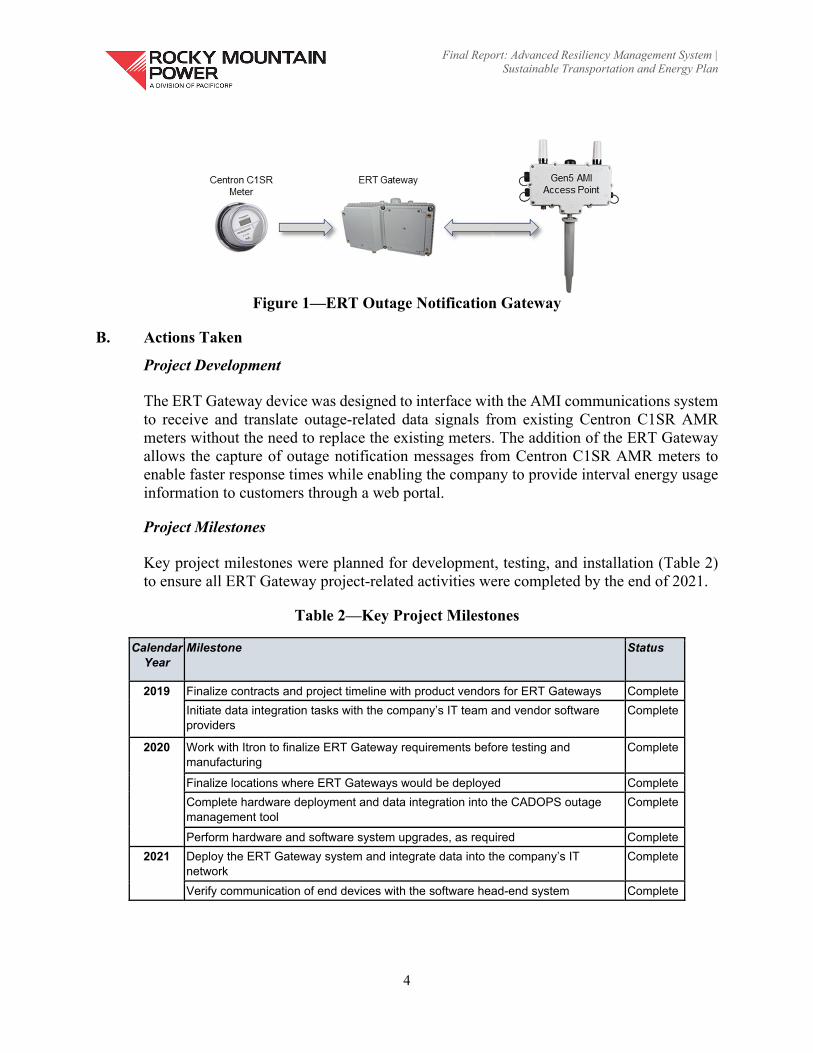
Final Report: Advanced Resiliency Management System | Sustainable Transportation and Energy Plan
4
Figure 1—ERT Outage Notification Gateway
B. Actions Taken
Project Development
The ERT Gateway device was designed to interface with the AMI communications system to receive and translate outage-related data signals from existing Centron C1SR AMR meters without the need to replace the existing meters. The addition of the ERT Gateway allows the capture of outage notification messages from Centron C1SR AMR meters to enable faster response times while enabling the company to provide interval energy usage information to customers through a web portal.
Project Milestones
Key project milestones were planned for development, testing, and installation (Table 2) to ensure all ERT Gateway project-related activities were completed by the end of 2021.
Table 2—Key Project Milestones
Calendar Year
Milestone Status
2019 Finalize contracts and project timeline with product vendors for ERT Gateways Complete
Initiate data integration tasks with the company’s IT team and vendor software providers
Complete
2020 Work with Itron to finalize ERT Gateway requirements before testing and manufacturing
Complete
Finalize locations where ERT Gateways would be deployed Complete
Complete hardware deployment and data integration into the CADOPS outage management tool
Complete
Perform hardware and software system upgrades, as required Complete
2021 Deploy the ERT Gateway system and integrate data into the company’s IT network
Complete
Verify communication of end devices with the software head-end system Complete

Final Report: Advanced Resiliency Management System | Sustainable Transportation and Energy Plan
5
While Itron continued development and testing of the ERT Gateway devices, company IT personnel designed and began development of the interfaces required to integrate the AMR metered data into the outage management and metered data systems. After all lab testing for the ERT Gateways was completed and accepted, field installations began with IT development continuing. The installation of the ERT Gateways went as expected with only a few requiring minor adjustments. These adjustments were required due to changes or additions to the equipment on the identified poles between planning and installation.
C. Initial Observations
Installation and Proof of Concept
ERT Gateway installations began on April 9, 2021, in Smithfield, Utah, with the final gateway installed on December 28, 2021, in Park City. A total of 1,588 ERT Gateways were installed and energized as part of the project.
In October 2021, proof-of-concept testing was conducted with a sample of field-installed Centron C1SR meters, ERT Gateways and the AMI network. The proof of concept was to ensure data flow from the meters to Itron’s Utility IQ (UIQ) head-end system. UIQ is the software suite that includes applications designed to collect and manage AMI metered data. This testing was completed over multiple days and proved that outage notifications, restoration messages and metered data were accurately transmitted and captured by the head-end system and could be made available to other company IT systems (e.g., PacifiCorp’s Outage Management System [OMS], ABB CADOPS, etc.).
Costs
ERT Gateway final project costs totaled $11.26m or 99.7% of the approved budget of $11.29m, see Table 3.
Table 3—ERT Gateway Final Project Costs
Work Stream Actual 1 Approved Variance
ERT Gateways $6.40m $5.58m $0.82m
IT $4.66m $4.84m $0.18m
Project management $0.20m $0.87m $0.67m
Total $11.26m $11.29m $0.03m 1 Financials will not be finalized until end of March 2022
D. Actions Set Aside
PacifiCorp has implemented all planned actions.
F. Future Expansion
AMI network installations started in January 2021 with the full AMI project to be completed by the end of 2023. As the AMI network is built out and optimized, the ERT
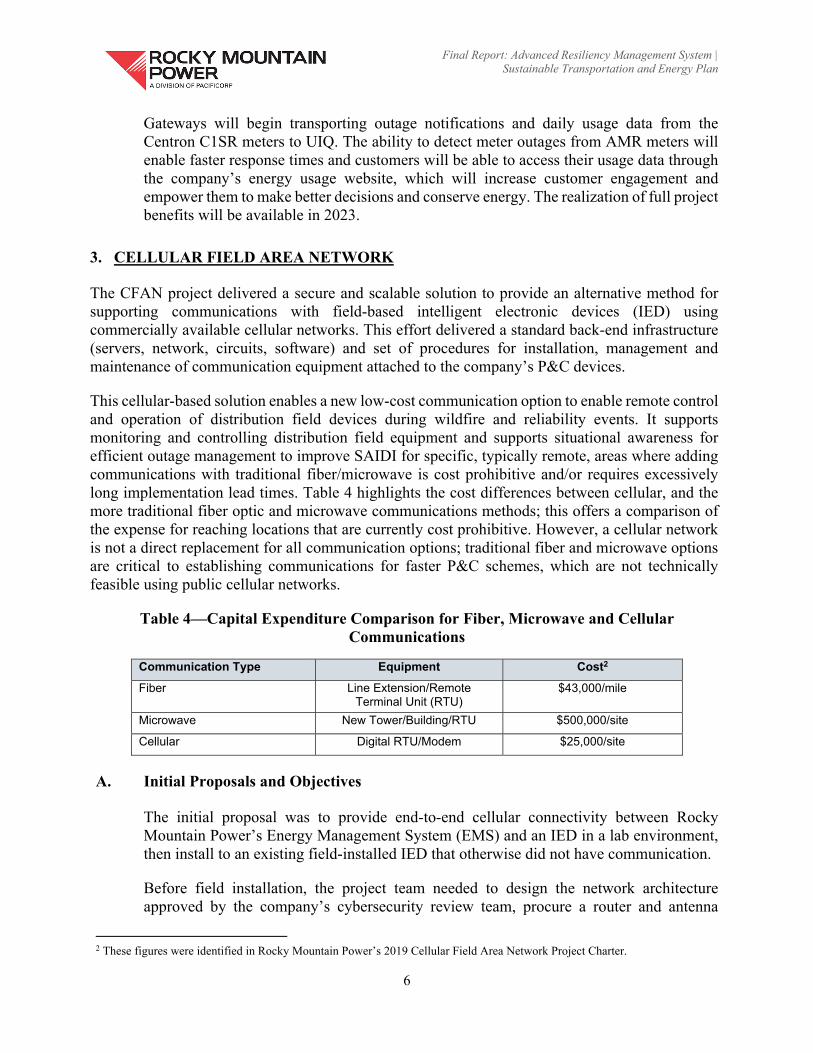
Final Report: Advanced Resiliency Management System | Sustainable Transportation and Energy Plan
6
Gateways will begin transporting outage notifications and daily usage data from the Centron C1SR meters to UIQ. The ability to detect meter outages from AMR meters will enable faster response times and customers will be able to access their usage data through the company’s energy usage website, which will increase customer engagement and empower them to make better decisions and conserve energy. The realization of full project benefits will be available in 2023.
3. CELLULAR FIELD AREA NETWORK
The CFAN project delivered a secure and scalable solution to provide an alternative method for supporting communications with field-based intelligent electronic devices (IED) using commercially available cellular networks. This effort delivered a standard back-end infrastructure (servers, network, circuits, software) and set of procedures for installation, management and maintenance of communication equipment attached to the company’s P&C devices.
This cellular-based solution enables a new low-cost communication option to enable remote control and operation of distribution field devices during wildfire and reliability events. It supports monitoring and controlling distribution field equipment and supports situational awareness for efficient outage management to improve SAIDI for specific, typically remote, areas where adding communications with traditional fiber/microwave is cost prohibitive and/or requires excessively long implementation lead times. Table 4 highlights the cost differences between cellular, and the more traditional fiber optic and microwave communications methods; this offers a comparison of the expense for reaching locations that are currently cost prohibitive. However, a cellular network is not a direct replacement for all communication options; traditional fiber and microwave options are critical to establishing communications for faster P&C schemes, which are not technically feasible using public cellular networks.
Table 4—Capital Expenditure Comparison for Fiber, Microwave and Cellular Communications
Communication Type Equipment Cost2
Fiber Line Extension/Remote Terminal Unit (RTU)
$43,000/mile
Microwave New Tower/Building/RTU $500,000/site
Cellular Digital RTU/Modem $25,000/site
A. Initial Proposals and Objectives
The initial proposal was to provide end-to-end cellular connectivity between Rocky Mountain Power’s Energy Management System (EMS) and an IED in a lab environment, then install to an existing field-installed IED that otherwise did not have communication.
Before field installation, the project team needed to design the network architecture approved by the company’s cybersecurity review team, procure a router and antenna
2 These figures were identified in Rocky Mountain Power’s 2019 Cellular Field Area Network Project Charter.
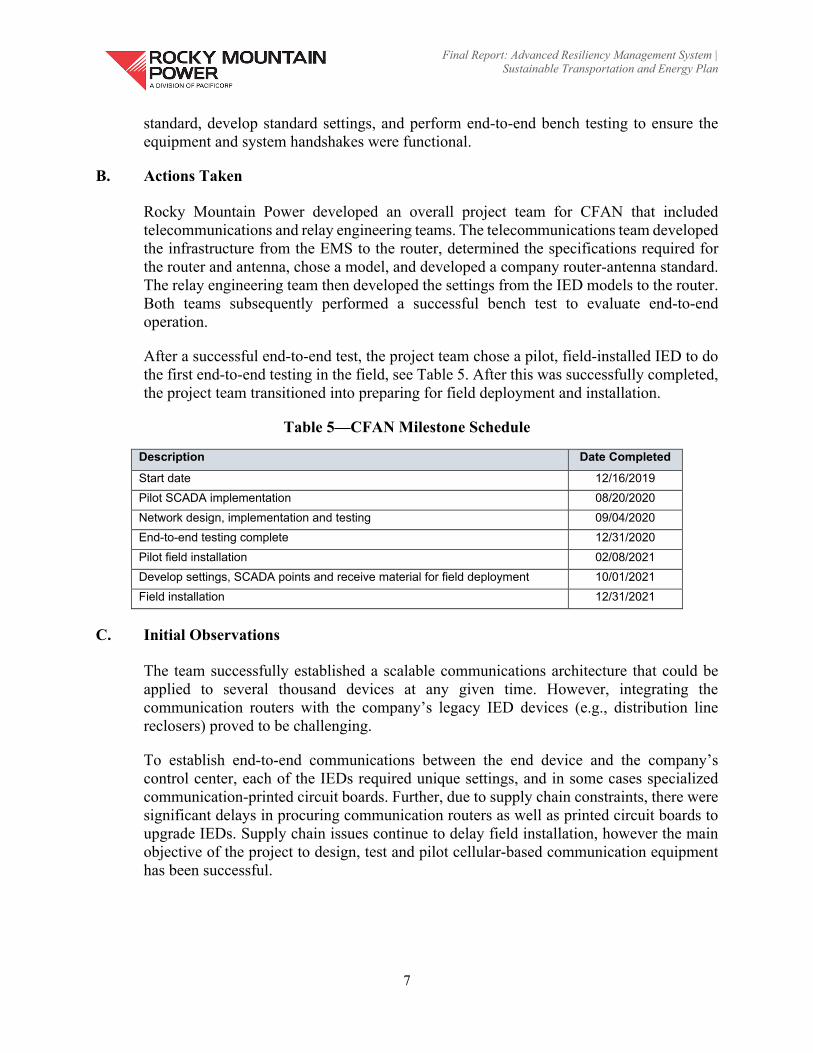
Final Report: Advanced Resiliency Management System | Sustainable Transportation and Energy Plan
7
standard, develop standard settings, and perform end-to-end bench testing to ensure the equipment and system handshakes were functional.
B. Actions Taken
Rocky Mountain Power developed an overall project team for CFAN that included telecommunications and relay engineering teams. The telecommunications team developed the infrastructure from the EMS to the router, determined the specifications required for the router and antenna, chose a model, and developed a company router-antenna standard. The relay engineering team then developed the settings from the IED models to the router. Both teams subsequently performed a successful bench test to evaluate end-to-end operation.
After a successful end-to-end test, the project team chose a pilot, field-installed IED to do the first end-to-end testing in the field, see Table 5. After this was successfully completed, the project team transitioned into preparing for field deployment and installation.
Table 5—CFAN Milestone Schedule
Description Date Completed
Start date 12/16/2019
Pilot SCADA implementation 08/20/2020
Network design, implementation and testing 09/04/2020
End-to-end testing complete 12/31/2020
Pilot field installation 02/08/2021
Develop settings, SCADA points and receive material for field deployment 10/01/2021
Field installation 12/31/2021
C. Initial Observations
The team successfully established a scalable communications architecture that could be applied to several thousand devices at any given time. However, integrating the communication routers with the company’s legacy IED devices (e.g., distribution line reclosers) proved to be challenging.
To establish end-to-end communications between the end device and the company’s control center, each of the IEDs required unique settings, and in some cases specialized communication-printed circuit boards. Further, due to supply chain constraints, there were significant delays in procuring communication routers as well as printed circuit boards to upgrade IEDs. Supply chain issues continue to delay field installation, however the main objective of the project to design, test and pilot cellular-based communication equipment has been successful.
Final Report: Advanced Resiliency Management System | Sustainable Transportation and Energy Plan
8
D. Actions Set Aside
PacifiCorp has implemented all planned actions. The company plans to continue expanding the installation of CFAN devices on an increasing number of IEDs.
E. Lessons Learned
In May 2020 the longest material lead time was approximately 80 days. One year later the lead time had jumped up to approximately 182 days. This increased lead time, based on supply limitations, condensed the field installation window by approximately two months. In hindsight, the material could have been ordered earlier; the project team could have better anticipated the increasing lead times to schedule accordingly.
F. Future Expansion
Rocky Mountain Power has several projects across the state of Utah to retrofit CFAN to existing IEDs. Currently Rocky Mountain Power has installed CFAN on approximately 20 IEDs, five of which were funded by the ARMS project. Rocky Mountain Power has another 30 CFAN+ routers ready for field installation, out of which 10 installations are expected to be completed by end of 2022. The project team has determined that no additional maintenance or maintenance scheduling will be required. The pre-existing scheduled preventative maintenance for the field IEDs covers all necessary requirements for CFAN equipment.
4. COMMUNICATING FAULTED CIRCUIT INDICATORS
Traditional FCIs have been used for over 50 years to locate faults on the company’s distribution system. FCI devices work by displaying an LED output or flag when they sense abnormally high currents, which are associated with fault conditions. Line crews tasked with patrolling a circuit can use the FCI visual targets to help pinpoint fault locations. While traditional FCIs are effective, the technology has a few key limitations:
Fault indication is purely visual and can only be observed from a short distance — 10 feet to 500 feet depending on model and field conditions. Inclement weather, lines in backlots, or FCIs located in pad-mounted equipment can make data access difficult.
Fault detection is still reliant upon customer call-ins to report a loss of service. Algorithms and trip thresholds used for fault detection are static and may not be effective if
protection settings or loading conditions on the circuit change over time. FCIs typically use time-based settings to reset visual indication. After a temporary fault the
indication may stay active for eight to 24 hours, which can cause confusion if a subsequent, unrelated permanent fault occurs on the same circuit.
CFCIs deployed in this project are equipped with advanced microprocessors and embedded cellular modems. This emerging technology overcomes many of the challenges associated with FCIs; abnormal circuit conditions can be immediately classified and communicated in a centrally managed systems accessible to dispatchers and engineers.
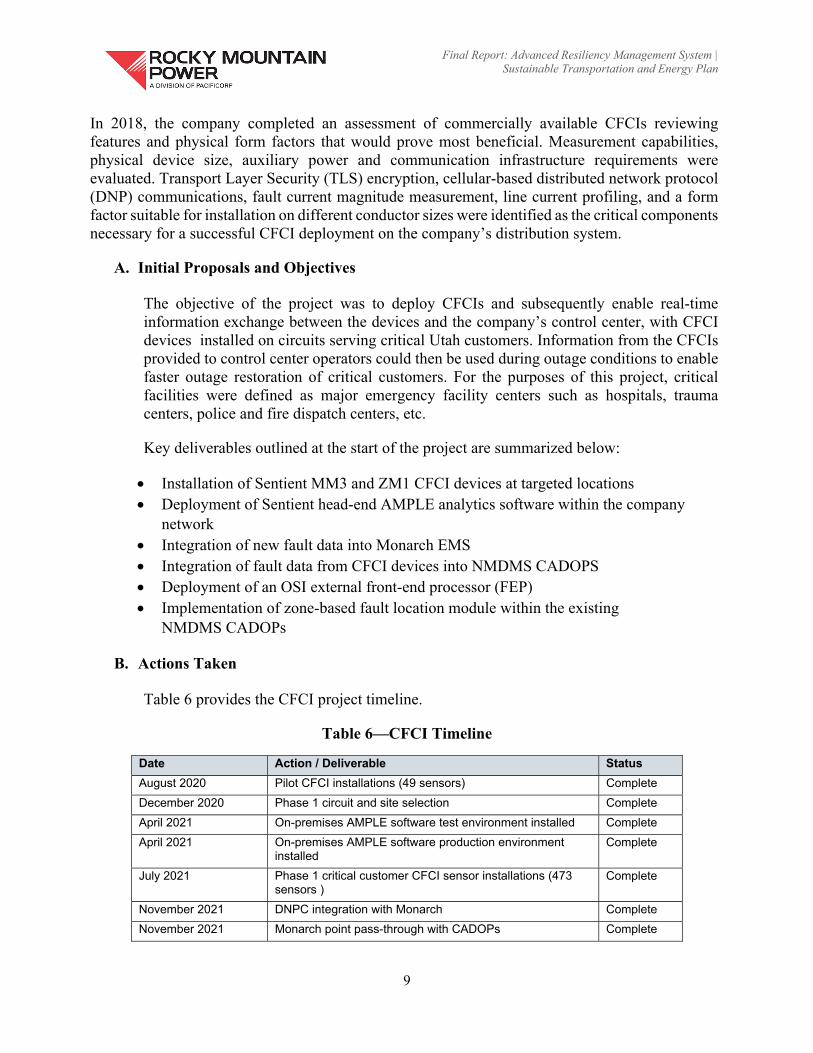
Final Report: Advanced Resiliency Management System | Sustainable Transportation and Energy Plan
9
In 2018, the company completed an assessment of commercially available CFCIs reviewing features and physical form factors that would prove most beneficial. Measurement capabilities, physical device size, auxiliary power and communication infrastructure requirements were evaluated. Transport Layer Security (TLS) encryption, cellular-based distributed network protocol (DNP) communications, fault current magnitude measurement, line current profiling, and a form factor suitable for installation on different conductor sizes were identified as the critical components necessary for a successful CFCI deployment on the company’s distribution system.
A. Initial Proposals and Objectives
The objective of the project was to deploy CFCIs and subsequently enable real-time information exchange between the devices and the company’s control center, with CFCI devices installed on circuits serving critical Utah customers. Information from the CFCIs provided to control center operators could then be used during outage conditions to enable faster outage restoration of critical customers. For the purposes of this project, critical facilities were defined as major emergency facility centers such as hospitals, trauma centers, police and fire dispatch centers, etc.
Key deliverables outlined at the start of the project are summarized below:
Installation of Sentient MM3 and ZM1 CFCI devices at targeted locations Deployment of Sentient head-end AMPLE analytics software within the company
network Integration of new fault data into Monarch EMS Integration of fault data from CFCI devices into NMDMS CADOPS Deployment of an OSI external front-end processor (FEP) Implementation of zone-based fault location module within the existing
NMDMS CADOPs
B. Actions Taken
Table 6 provides the CFCI project timeline.
Table 6—CFCI Timeline
Date Action / Deliverable Status
August 2020 Pilot CFCI installations (49 sensors) Complete
December 2020 Phase 1 circuit and site selection Complete
April 2021 On-premises AMPLE software test environment installed Complete
April 2021 On-premises AMPLE software production environment installed
Complete
July 2021 Phase 1 critical customer CFCI sensor installations (473 sensors )
Complete
November 2021 DNPC integration with Monarch Complete
November 2021 Monarch point pass-through with CADOPs Complete
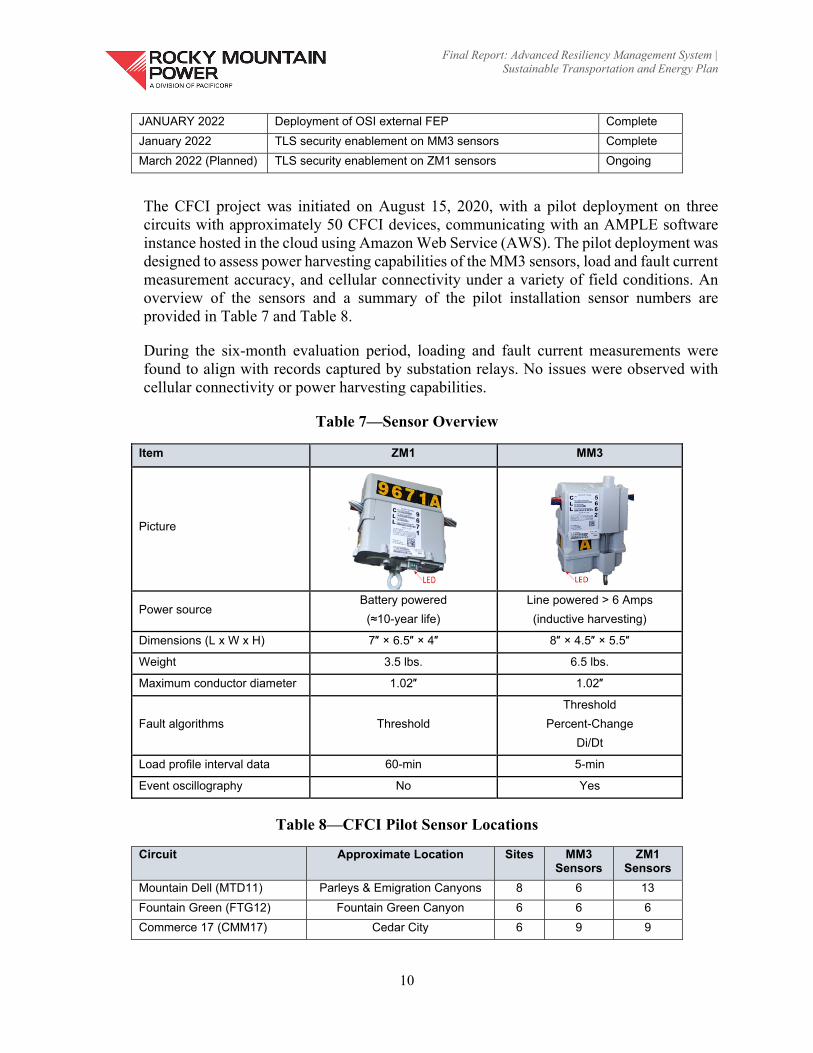
Final Report: Advanced Resiliency Management System | Sustainable Transportation and Energy Plan
10
JANUARY 2022 Deployment of OSI external FEP Complete
January 2022 TLS security enablement on MM3 sensors Complete
March 2022 (Planned) TLS security enablement on ZM1 sensors Ongoing
The CFCI project was initiated on August 15, 2020, with a pilot deployment on three circuits with approximately 50 CFCI devices, communicating with an AMPLE software instance hosted in the cloud using Amazon Web Service (AWS). The pilot deployment was designed to assess power harvesting capabilities of the MM3 sensors, load and fault current measurement accuracy, and cellular connectivity under a variety of field conditions. An overview of the sensors and a summary of the pilot installation sensor numbers are provided in Table 7 and Table 8.
During the six-month evaluation period, loading and fault current measurements were found to align with records captured by substation relays. No issues were observed with cellular connectivity or power harvesting capabilities.
Table 7—Sensor Overview
Item ZM1 MM3
Picture
Power source Battery powered
(≈10-year life)
Line powered > 6 Amps
(inductive harvesting)
Dimensions (L x W x H) 7″ × 6.5″ × 4″ 8″ × 4.5″ × 5.5″
Weight 3.5 lbs. 6.5 lbs.
Maximum conductor diameter 1.02″ 1.02″
Fault algorithms Threshold
Threshold
Percent-Change
Di/Dt
Load profile interval data 60-min 5-min
Event oscillography No Yes
Table 8—CFCI Pilot Sensor Locations
Circuit Approximate Location Sites MM3 Sensors
ZM1 Sensors
Mountain Dell (MTD11) Parleys & Emigration Canyons 8 6 13
Fountain Green (FTG12) Fountain Green Canyon 6 6 6
Commerce 17 (CMM17) Cedar City 6 9 9
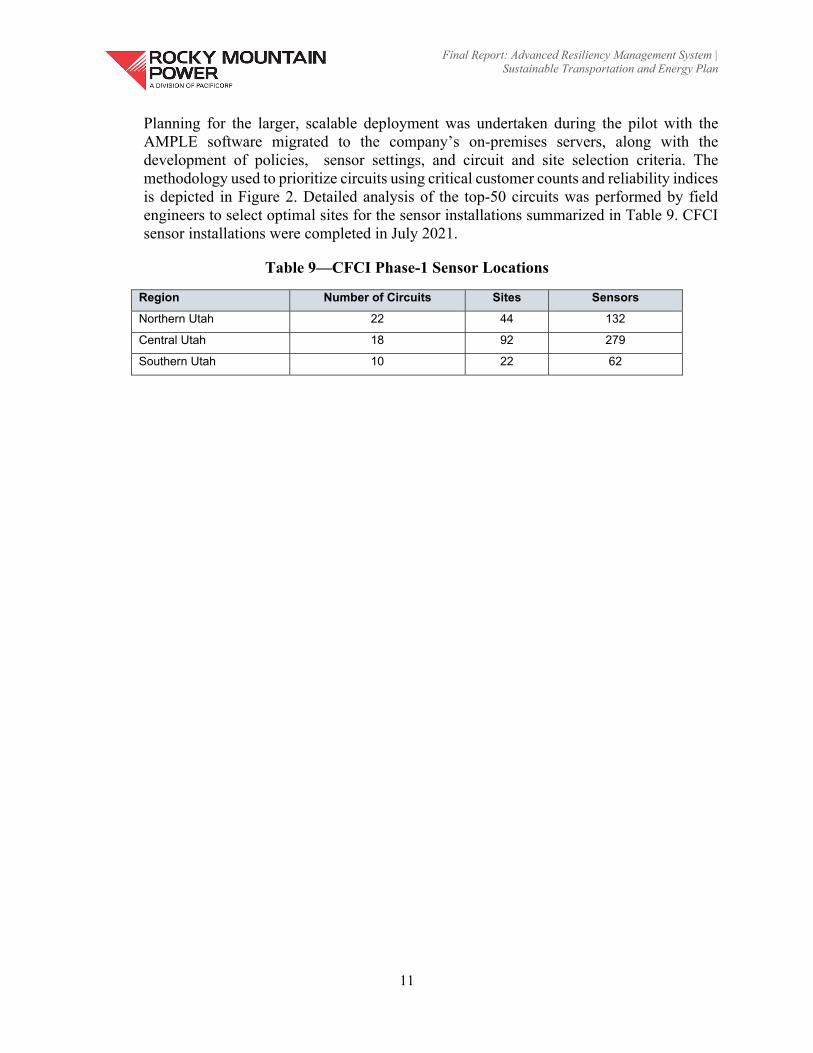
Final Report: Advanced Resiliency Management System | Sustainable Transportation and Energy Plan
11
Planning for the larger, scalable deployment was undertaken during the pilot with the AMPLE software migrated to the company’s on-premises servers, along with the development of policies, sensor settings, and circuit and site selection criteria. The methodology used to prioritize circuits using critical customer counts and reliability indices is depicted in Figure 2. Detailed analysis of the top-50 circuits was performed by field engineers to select optimal sites for the sensor installations summarized in Table 9. CFCI sensor installations were completed in July 2021.
Table 9—CFCI Phase-1 Sensor Locations
Region Number of Circuits Sites Sensors
Northern Utah 22 44 132
Central Utah 18 92 279
Southern Utah 10 22 62
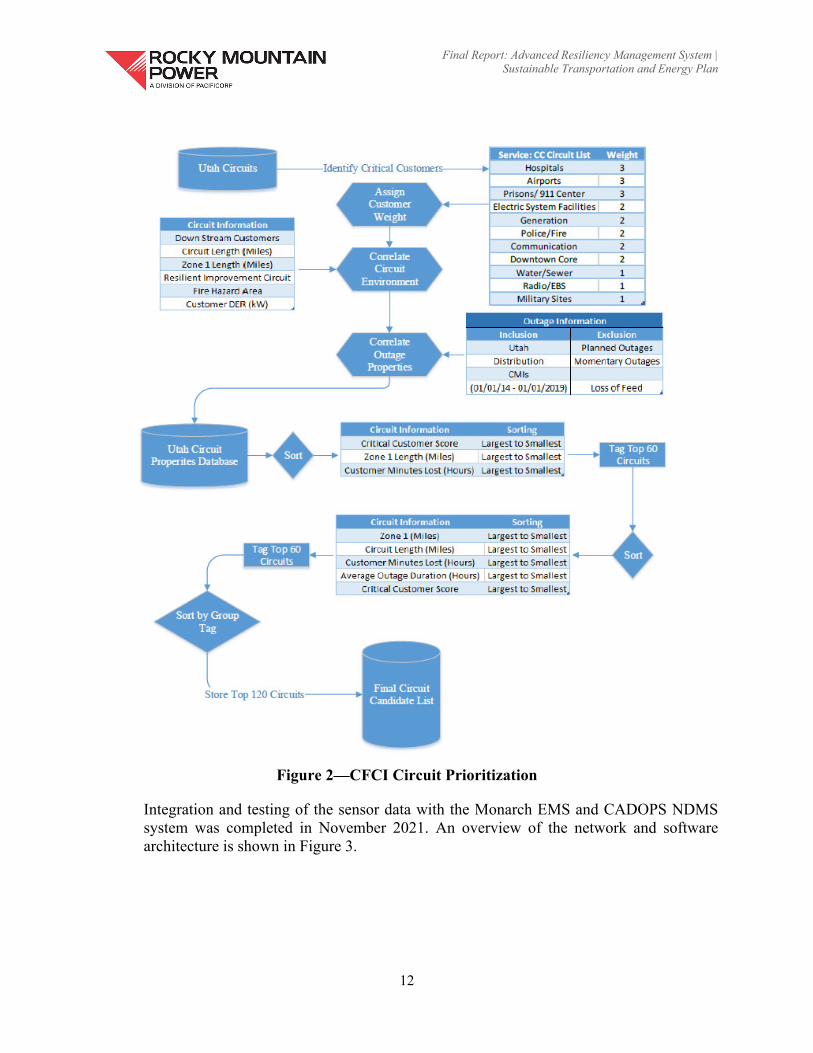
Final Report: Advanced Resiliency Management System | Sustainable Transportation and Energy Plan
12
Figure 2—CFCI Circuit Prioritization
Integration and testing of the sensor data with the Monarch EMS and CADOPS NDMS system was completed in November 2021. An overview of the network and software architecture is shown in Figure 3.
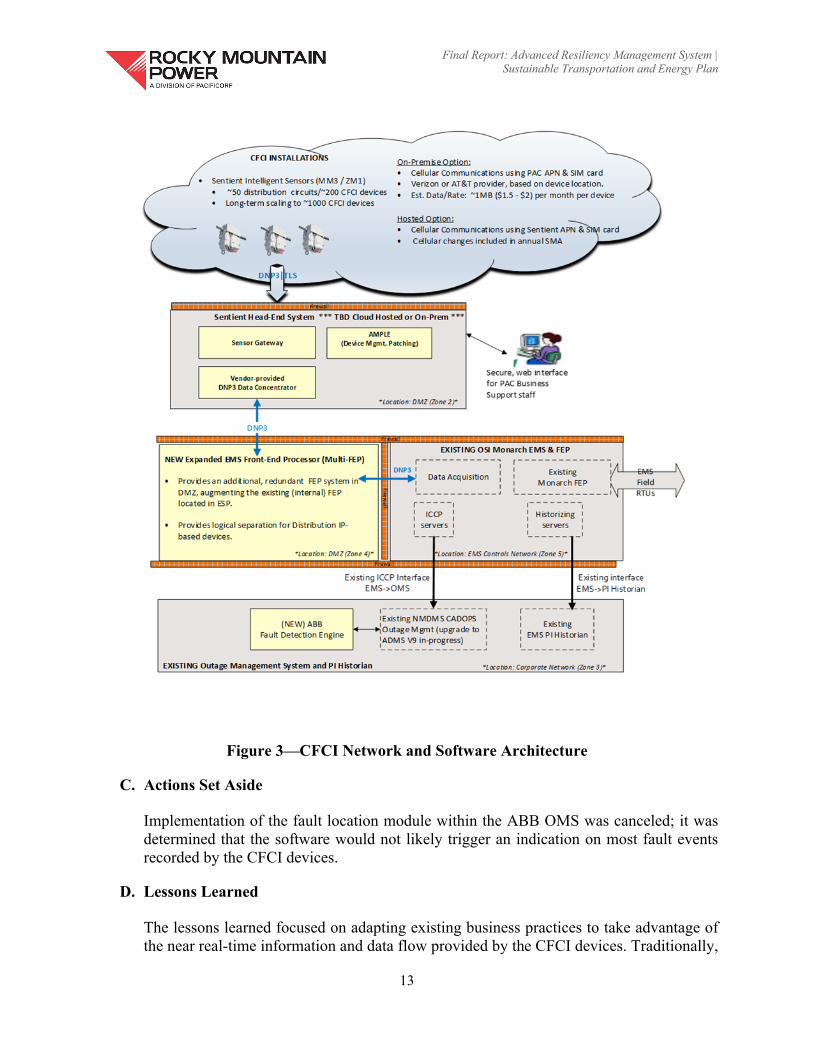
Final Report: Advanced Resiliency Management System | Sustainable Transportation and Energy Plan
13
Figure 3—CFCI Network and Software Architecture
C. Actions Set Aside
Implementation of the fault location module within the ABB OMS was canceled; it was determined that the software would not likely trigger an indication on most fault events recorded by the CFCI devices.
D. Lessons Learned
The lessons learned focused on adapting existing business practices to take advantage of the near real-time information and data flow provided by the CFCI devices. Traditionally,
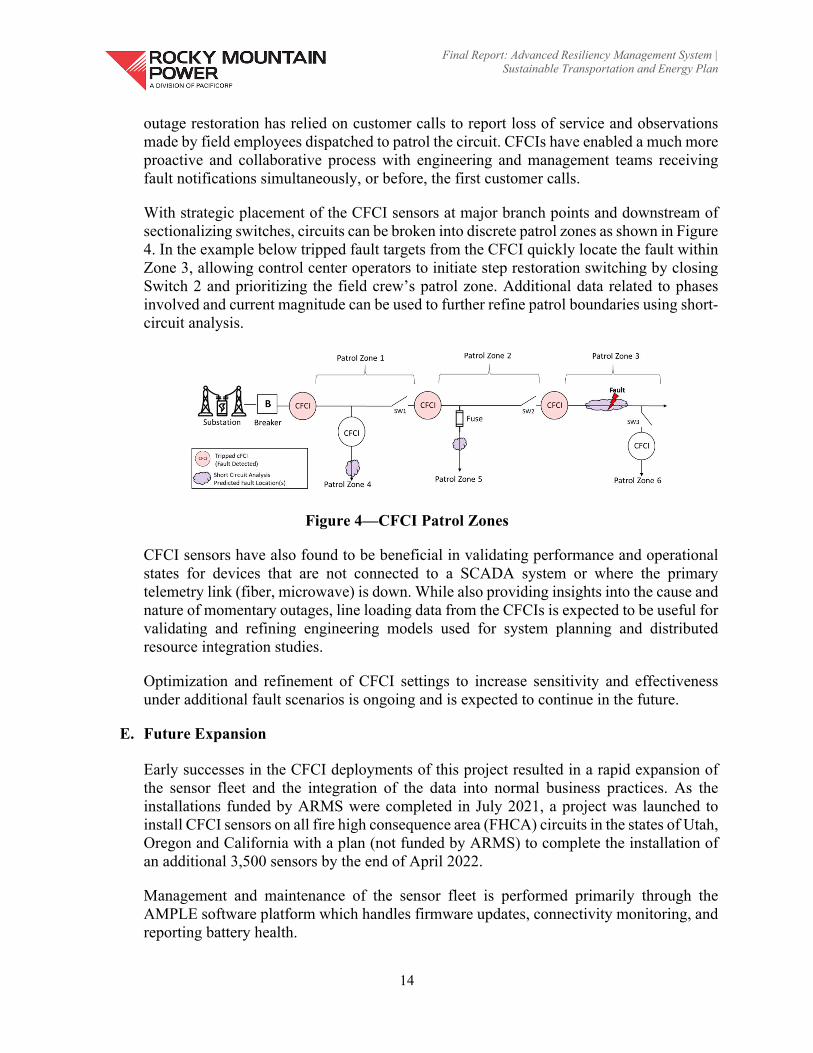
Final Report: Advanced Resiliency Management System | Sustainable Transportation and Energy Plan
14
outage restoration has relied on customer calls to report loss of service and observations made by field employees dispatched to patrol the circuit. CFCIs have enabled a much more proactive and collaborative process with engineering and management teams receiving fault notifications simultaneously, or before, the first customer calls.
With strategic placement of the CFCI sensors at major branch points and downstream of sectionalizing switches, circuits can be broken into discrete patrol zones as shown in Figure 4. In the example below tripped fault targets from the CFCI quickly locate the fault within Zone 3, allowing control center operators to initiate step restoration switching by closing Switch 2 and prioritizing the field crew’s patrol zone. Additional data related to phases involved and current magnitude can be used to further refine patrol boundaries using short-circuit analysis.
Figure 4—CFCI Patrol Zones
CFCI sensors have also found to be beneficial in validating performance and operational states for devices that are not connected to a SCADA system or where the primary telemetry link (fiber, microwave) is down. While also providing insights into the cause and nature of momentary outages, line loading data from the CFCIs is expected to be useful for validating and refining engineering models used for system planning and distributed resource integration studies.
Optimization and refinement of CFCI settings to increase sensitivity and effectiveness under additional fault scenarios is ongoing and is expected to continue in the future.
E. Future Expansion
Early successes in the CFCI deployments of this project resulted in a rapid expansion of the sensor fleet and the integration of the data into normal business practices. As the installations funded by ARMS were completed in July 2021, a project was launched to install CFCI sensors on all fire high consequence area (FHCA) circuits in the states of Utah, Oregon and California with a plan (not funded by ARMS) to complete the installation of an additional 3,500 sensors by the end of April 2022.
Management and maintenance of the sensor fleet is performed primarily through the AMPLE software platform which handles firmware updates, connectivity monitoring, and reporting battery health.
Final Report: Advanced Resiliency Management System | Sustainable Transportation and Energy Plan
15
5. SUBSTATION CONNECTIVITY AREA NETWORK
PacifiCorp’s legacy SCADA approach deployed a serial connectivity model to control devices in our substation environment. This was partially due to the available technology and best practices to support for SCADA deployment. When internet protocol (IP)-based communications3 started being integrated into the more advanced microprocessor-based P&C devices, PacifiCorp opted to keep serial connectivity to control devices. This company choice was primarily due to the mandated NERC CIP version 3 compliance requirements pertaining to IP-based connectivity. Continuing to use a serial connectivity model reduced compliance risk and decreased workloads for managing compliance to the NERC CIP standards in the substation environment.
In 2016, the NERC CIP Version 5 compliance requirements became effective, bringing substations in-scope — or applicable to the standard — and thus subject to NERC audits, regardless of connectivity type. The scoping factor for the NERC CIP Version 5 requirements is primarily based on external routable connectivity (IP-based connectivity in or out of the substations) to in-scope cyber assets at the site.
Moving toward a better reliability future, PacifiCorp is deploying newer, sophisticated microprocessor P&C devices that leverage the use of IP-based communications for larger data packet transfer4 and remote systems management. The solution proposed by this project allows PacifiCorp to capture the opportunities offered by using IP-based communications while continuing to maintain compliance to the NERC CIP and Berkshire Hathaway Energy security standards.
The IP-based connectivity model, coupled with a NERC CIP and Berkshire Hathaway Energy security-compliant substation cybersecurity infrastructure design solution, will be scalable for distribution and transmission substations regardless of criticality or NERC CIP impact rating.
During the early stages of the project, the AssurX platform was selected to allow integration of several existing and new applications for asset management, remote system operations management, security management and compliance management into a centralized suite of applications. By integrating these management systems, synergies and efficiencies can be obtained reducing the new workload on operations staff for managing remote systems configurations, security and compliance.
A. Initial Proposals and Objectives
The ARMS project was designed to increase connectivity to the company’s distribution assets. The CFAN project enabled increased connectivity to distribution assets outside the
3 IP (Internet protocol) uses what is called the OSI model of layering data into segments within a packet and sending that packet across the communications media — it allows the data to follow whatever path it can find to get to the destination because it uses an address (IP address). Serial connectivity is usually limited to point-to-point communications between two ends of the path that are already programmed between the two devices communicating via wires, fiber optics or microwave. 4 Serial communications cannot handle the bandwidth required to transport the data that engineering is trying to access using the IP connectivity. Additionally, by automating compliance-related activities and applying internal controls to monitor compliance data collection, fewer new FTE are required to manage the connected systems for CIP compliance and to reduce the compliance risk (likelihood of violation and fines).

Final Report: Advanced Resiliency Management System | Sustainable Transportation and Energy Plan
16
substation. The SCAN project was designed to increase connectivity and situational awareness inside substations.
B. Actions Taken
Berkshire Hathaway Energy entered a contract with AssurX for the purchase of the platform. The contract also included professional services for design and integration of the AssurX system to allow integration of remote system operations management applications, security and compliance management into a centralized suite of applications. PacifiCorp issued a purchase order agreement for the AssurX system and services and took delivery of the software in late 2021. Configuration design of the system components and implementation of the system is ongoing.
C. Initial Observations
The company is performing design and implementation of the system with AssurX. This system will increase oversight capabilities within the compliance organization by creating a centralized system for:
Compliance control development and monitoring Systems of record data collection and management Evidence collection and storage Compliance management dashboards Automated alerting of potential compliance risks Data reporting capabilities from a master database Document management workflows
D. Actions Set Aside
PacifiCorp has implemented all planned actions.
E. Lessons Learned
PacifiCorp is in the early stages of design and implementation. It expects to learn more over the next six to 12 months of implementing and operating the system.
F. Future Expansion
The company anticipates ongoing work to be completed by mid-2022.
Final Report: Advanced Resiliency Management System | Sustainable Transportation and Energy Plan
17
6. CONCLUSION
The company continues to develop a strategy to attain long-term goals for grid modernization and smart grid-related activities to continually improve system efficiency, reliability and safety, while providing a cost-effective service to our customers.
The ERT, CFAN, CFCI and SCAN projects, as part of ARMS, are smart grid elements that support these company goals. Using existing meters and lines, ERT, CFAN and CFCI implementation all increase infrastructure-based intelligence that allow for quicker identification and resolution of power outages. ERT and CFAN both found relatively low-cost methods to implement these improvements, by leveraging already installed AMR meters and low-cost cellular technology. The success of CFCI pilot and phase-1 deployments led to a rapid expansion of the program and the integration of the data into normal business practices. SCAN serves as part of establishing a back-end IT infrastructure necessary to maintain intelligent network improvements.
When the term “smart grid” was first officially defined in the Energy Independence and Security Act of 2007 (EISA-2007), its implications were profound and its exact form was vague. Somehow information technology would connect with grid systems to create a more reliable, secure electric infrastructure. Through these ARMS-based projects, Rocky Mountain Power, under the guidance of utility commissions, and in conjunction with manufacturers and state governance has begun transforming the initial ideal of a smart grid into specific and useful benefits for its customers.

Final Report: Advanced Resiliency Management System | Sustainable Transportation and Energy Plan
18
APPENDIX A – FINANCIAL
Work Stream Actual 1 Approved Variance
ERT Gateways $11.26m $11.29m $0.03m
Enhanced Distribution Connectivity $5.15m $5.23m $0.08m
ARMS Overall $16.41m $16.52m $0.11m 1 Financials will not be finalized until end of March 2022

Page 19.0
Utah Solar Incentive Program (USIP) The USIP amounts shown on page 1.0 represent the actual expenditures of the USIP program. When STEP commenced, the Company anticipated that a portion of STEP revenues would be necessary to fund the remainder of the USIP program obligations through 2023. The Company’s September 12, 2016, application in Docket No. 16-035-36 assumed funds would be needed for all remaining USIP project applications that had received, or were expected to receive, conditional approvals but had not yet qualified for incentive payments. At that time, the remaining USIP obligations was estimated to be $33.6 million. Since 2016, an estimated $14.2 million of projects that were previously approved for incentives have expired and are no longer eligible to receive USIP funds. Therefore, the revenues collected under the discontinued Electric Service Schedule 107 (“Schedule 107”) are sufficient to cover all remaining USIP incentive obligations without the use of any of the $50 million in STEP funds. Previously, a portion of revenues collected under STEP are credited to the USIP account. On June 28, 2019, the Commission approved the Company’s request to use the STEP funds that were previously budgeted for USIP for the Advanced Resiliency Management System project. On August 20, 2019 the Commission approved the Company’s request to begin refunding $3.06 million in surplus revenue collected through Schedule 107 through a reduction in Electric Service Schedule No. 196 Sustainable Transportation and Energy Plan (“STEP”) Cost Adjustment Pilot Program rates over one year beginning November 1, 20191. For transparency and consistency with prior reports, the company will continue to report USIP expenses in the annual STEP reports. Table 1 provides the CY 2021 USIP account balance with USIP collections under Schedule 107.
The Total Expenditure amounts showing for CY 2017, 2018, 2019, 2020 and 2021 tie to the USIP expenditures on page 1.0 of this report and also tie to Table 4 in the Company’s USIP annual reports. The 2019 and 2020 program revenue of $127,762 and $3,036,349 shown in Table 1 represents the credits back to customers through the reduction in Schedule 196 beginning November 1, 2019. The USIP workpaper provides the forecast program expenditures.
1 See Docket No. 19-035-T12.
Table 1: USIP Account Summary (With Electric Service Schedule 107 revenues only)
Order Program Total 2012 2013 2014 2015 2016 2017 2018 2019 2020 2021Program Revenue (23,361,302) (961,324) (6,293,704) (6,320,828) (6,317,639) (6,323,285) (308,633) - 127,762 3,036,349 - Program Expenditures:
Incentive 331190, 338901 - 981,796 2,328,676 3,292,006 4,884,763 4,766,963 3,459,713 2,317,571 1,585,779 1,023,487 Program Administration 331191; 338902 - 253,665 322,664 173,248 412,866 94,788 27,098 13,807 3,881 1,506
Marketing 331192; 338903 55,905 35,744 25,995 14,515 336 - - - - - Program Development 331193' 338904 30,748 99,140 577 - - - - - - -
Expired Deposits 331194; 338905 - - - (36,821) (103,963) (99,568) - (157,638) - - 408641 - - - - -
Cool Keeper program - - - - (200,000) - - - - - Total Expenditures 25,609,246 86,653 1,370,345 2,677,912 3,442,948 4,994,002 4,762,183 3,486,811 2,173,740 1,589,660 1,024,993 Interest (3,696,392) (5,995) (219,165) (473,909) (721,712) (685,628) (627,425) (569,938) (147,937) (175,669) (69,015) USIP Account Balance (Sch. 107 only) (1,448,448)
Utah Solar Incentive Program Account - Through 2021

Page 20.0
STEP Project Report Period Ending December 31, 2021
STEP Project Name:
Study of Electrification Impacts on the Uintah Basin
Project Objective:
Obtain quantitative estimates of the air quality and economic impact that electrification of the oil and gas fields would have in the Basin. The work will be performed by personnel at Utah State University Uintah Basin Bingham Research Center and SLR International Corporation. Project Accounting:
2021 Total Annual Collection
(Budget) $200,715 $200,715
Annual Spend $106,070 $106,070 Committed Funds $0 $0 External OMAG $0 $0
Total Project Spend $106,070 $106,070 Final invoicing in the amount of $94,645 was paid for the project in early 2022. The total project spend including the 2022 payments is $200,715.
Project Milestones:
Milestones Delivery Date Status/Progress A1. History of NOx source December 31, 2021 Complete A2. History of NOx emissions
December 31, 2021 Complete
A3. History of NOx Concentrations
December 31, 2021 Complete
B1. Electrifications modeling December 31, 2021 Complete B2. NOx control modeling December 31, 2021 Complete C. Power Transmission Development
December 31, 2021 Complete
D1. Data Analysis December 31, 2021 Complete D2. Final Report February 28, 2022 Complete Final Billing March 31, 2022 Complete
Project Benefits:
The wintertime Uinta Basin ozone system is under NOx control, i.e., controlling NOx emissions will have a bigger impact than controlling VOC emissions.
Electrification of the Uinta Basin oil and gas fields will permit a significant, irreversible reduction in NOx emissions and of winter ozone levels.

Page 20.1
The benefits of electrification will significantly offset other, reversible NOx emissions, such as drilling activities, and prevent a return to the very high ozone concentrations that occurred in the early 2010’s.
The logistics and economics of electrification will allow the oil and gas industry to continue operating.
Potential future applications for similar projects:
Study findings promote: More research into natural-gas fired engines as there is not definitive explanation for the
non-linear behavior of NOx emissions. Current best practices for estimating pumpjack emissions need to be revised to consider
actual operating conditions in the field. Attachment:
Exhibit 20-A: Final Report - Projecting the Impact of Electrification of the Uinta Basin Oil and Gas Fields on Air Quality dated March 15, 2022. Prepared by Liji David, Huy Tran, and Seth Lyman at the Utah State University Uintah Basin Bingham Research Center and Robert Hammer and Xin Qiu at the SLR International Corporation.

Exhibit 20-A Final Report Uinta Basin Study March 15, 2022

THIS ATTACHMENT IS VOLUMINOUS AND PROVIDED SEPARATELY