Mathematical Model оf Plasma Renin Activity After Nifedipine Treatment
12
Transcript of Mathematical Model оf Plasma Renin Activity After Nifedipine Treatment
Bulgarian Journal of Veterinary Medicine (2008), 11, No 1, 21−29
MATHEMATICAL MODEL OF PLASMA RENIN ACTIVITY
AFTER NIFEDIPINE TREATMENT
A. TOLEKOVA & K. YANKOV
Medical Faculty, Trakia University, Stara Zagora, Bulgaria
Summary
Tolekova, A. & K. Yankov, 2008. Mathematical model of plasma renin activity after
nifedipine treatment. Bulg. J. Vet. Med., 11, No 1, 21−29.
A mathematical model of plasma renin activity after nifedipine treatment is developed. The system
identification of the process is done applying the cyclic coordinate descent as optimization procedure.
The model allows predicting the effects of different drug doses and permits the researcher to examine
the behaviour of the system under all conceivable conditions.
Key words: mathematical model, plasma renin activity, renin angiotensin system, system
identification
INTRODUCTION
A mathematical model is a collection of
mathematical relationships which describe
a process. Models are by necessity
abstractions of the real situations they
represent. The power of modeling lies in
this abstraction, since a single family of
models may present a vast majority of real
systems. Mathematical modeling finds out
the mathematical relations that characte-
rize the internal structure of the delimited
system and formalizes the interdependen-
cies between the input and output variab-
les. A model is considered here as a tool
for systems representation in an abstract
sense, allowing the simulation and the
prediction of the future behaviour of the
system.
The purpose of mathematical mode-
ling is to translate the observed pheno-
mena into a set of equations, to determine
the parameter values of that model,
reflecting in a particular experimental set-
up, and then through simulation to predict
the behaviour, confirming or disputing
previous knowledge or hypotheses. Some
of advantages of modeling are:
• trials of tested systems can be accom-
plished in much shorter time period;
• system performance can be observed
under all possible conditions;
• decisions concerning future systems
presently in conceptual stage can be
examined;
• the investigated phenomenon can be
simplified, without affecting its na-
ture, in order to make its qualitative
analysis simpler, or possible at all;
• modeling can be used in education to
describe, interpret, predict or explain
phenomena;
• computer modeling and simulation
are often the only feasible or safe
techniques to analyze and evaluate a
system.

Mathematical model of plasma renin activity after nifedipine treatment
BJVM, 11, No 1 22
• simulation results can be obtained at
lower cost than in real experimen-
tation;
These general advantages give the
opportunity to speed up and make less
expensive experiments in biology and me-
dicine, aimed at formulation of new drugs
in the pre-clinical phase and to decrease
the number of experimental animals. Also,
using simulation, the results and conclu-
sions could be associated to application of
the drugs in people.
In our previous experiments (Ilieva et
al., 1995; Tolekova, 2003) we investiga-
ted the change in the regulatory kinetics of
plasma renin activity (PRA) after blocking
of the transmembrane calcium flow through
L-type calcium channels. Their dynamic
characteristics were investigated employing
system and functional analysis (Тolekova,
1998; Tolekova et al., 1998; Tolekova et
al., 2002; Yankov et al., 1998a; 1998b). A
chronological sequel of these experiments
is the creation of a mathematical model of
the change in PRA as a function of the
applied doses of the drug. The first
formulated model is for application of ni-
cardipine (Tolekova et al., 2006).
The aim of the present work was to
create a mathematical model of the dyna-
mics of renin (a key enzyme in the regu-
lation of the arterial blood pressure) after
the application of different doses nifedi-
pine. The model will be a basis of investi-
gating the enzyme activity of renin from
the point of view of the modern system
theory.
MATERIALS AND METHODS
Data acquisition
The experiments were carried out on 208
male Wistar rats. PRA was assessed ra-
dioimmunologically (DiaSorin-Biomedica
Ltd.) after oral application of nifedipine
at doses of 10 (n=35), 20 (n=69), 40
(n=69), or 60 (n=35) mg/kg body weight.
The values of experimental groups were
compared with these of a control group
(n=18). PRA was sampled at the intervals
showed in Table 1. The animals were
housed in polycarbonate cages in
temperature (18–23oC) and humidity (40–
70%) controlled conditions and 12 h
light/dark cycle, with free access to tap
water and standard laboratory chow. They
received humane care compliant with the
Institution's guidelines for humane care of
experimental animals of the Trakia Uni-
versity and with the national and Europe-
an regulatory rules (Decree for protection
and humane care of experimental animals
25/10.06.2005, Law on Veterinary Me-
dical Activities G87/11.01.2005, Art 2
(152 and 153) and Council Directive
86/609/ EEC of 24 November 1986 on the
approximation of laws, regulations and
administrative provisions of the Member
States regarding the protection of animals
used for experimental and other scientific
purposes).
The application of treatments started at
the same time of the day (at 8 AM). Until
the beginning of the experiment the
animals remained at the specified condi-
tions in the plastic cages with adaptation
purposes. The sampling of blood was
performed under general anaesthesia with
thiopental sodium at 30 mg/kg, applied
intraperitoneally. The animals were immo-
bilized on operation tables and a laparo-
tomy was performed. The arterial and ve-
nous kidney vessels were ligated on both
sides after which the chest was opened
with a sagittal cut. The right heart camera
was punctured with a syringe, previously
perfused with EDTA solution. Approxi-
mately 5 mL of blood were aspired and
used in the plasma renin analysis.

A. Tolekova & K. Yankov
BJVM, 11, No 1 23
Design of the Mathematical Model
In developing a mathematical model of a
real system, two basic approaches are
possible. The first is based on fundamen-
tal understanding of the modeled pro-
cesses that give rise to the formulation of
the mathematical model. The other is
based on experimental data and is
essentially a data-driven approach (black-
box model). Experimental modeling is
known in the literature as system
identification. System identification is a
general term to describe mathematical
tools and algorithms that build dynamical
models from measured data. A dynamical
model in this context is a mathematical
description of the dynamic behaviour of a
system or process. The identification
experiment is performed by applying a
specific input signal U(t), to the system
measuring the observed output y(t) over a
time interval and trying to determine a
mathematical relation between them
without going into the details of what is
actually happening inside the system (Fig.
1). The model is determined from measu-
red signals using some adequate identifi-
cation methods. For nonlinear models
very few results have been obtained and
there is no standard algorithm for testing a
global identifiability. Various approaches
have been proposed, e.g., power series
(Pohjanpalo, 1978), differential algebra
(Carson et al., 1983), similarity transfor-
mation methods (Vajda et al., 1989),
stochastic approximation (Petrov, 2005),
cyclic coordinate descent (Yankov, 2006).
System identification of PRA
For modeling of the PRA production
process, the identification was planned
observing the following sequence:
• Input signal U(t). A short oral appli-
cation of nifedipine is considered as
Dirac function. The signal amplitude
is correlated to the nifedipine dose.
• Identification time tp. The maximum
duration time was fixed to 11 hours.
This was expected to be sufficient
and practical. After this time the
system response reaches the steady
state level and the system state va-
riables are time independent.
• Sampling time. The first two samples
were taken at post treatment min 30
and hour 1 and the subsequent ones
were taken at every 2 h (Table 1).
• Output response y(t). During the
experiment, a discrete-time output
Ф(t) ⊂ y(t) is observed:
Ф(t) = (ф1, ф2,... фN)Т,
where: N – number of samples.
The measured data corresponding to
Ф(t) are presented in Table 1. The vector
Ф(t) is used during the identification pro-
cess. The data in Table 1 are statistically
processed (Statistica 6 for Windows, Stat-
Soft Inc). Data interpolation is performed
applying spline interpolation (Yankov,
1998a; 1998b).
Determination of the system model
This stage of identification includes the
selection of mathematical equations from
a set of candidate system descriptions
Fig. 1. System description.

Mathematical model of plasma renin activity after nifedipine treatment
BJVM, 11, No 1 24
within which a model is to be found. PRA
follows an oscillation curve. The most ap-
propriate model is a second order ordinary
differential equation (ODE):
)()()(
2)(
0
2
2
2
tUKKtydt
tdy
dt
tyduϖϖζϖ =+++ (1)
where: ζ(d) – the damping ratio; ω(d) − the undamped, natural frequency of the
system; К0(d) – the base level; Ku(d) – the
sensibility of the process to the input
influence (proportionality coefficient).
The parameters above are unknown
and they must be calculated in order to
identify the process. All of them are dose
(d) dependent and they form the identifi-
cation vector Q(d):
Q(d)=Q(ζ(d), ω(d), К0(d), Ku(d))
Because the structure of the mathematical
relation is a priori fixed. the parameters of
the structure must be fitted to the data
applying the algorithms of mathematical
optimization (Bazaraa & Shetty, 1979).
The mathematical model is identified
using the KORELIA-DYNAMIX program
(Yankov, 2006). KORELIA identifies a
set of most frequently used algebraic,
transcendental and ordinary differential
equations up to third order. As identifica-
tion method, the cyclic coordinate descent
(CCD) method is applied. The residuals
between experimental data and identified
model are minimized applying least squa-
re or uniform fitting.
RESULTS
The calculated values of the ζ(d), ω(d),
К0(d) and Ku(d) using CCD are presented
in Table 2.
Natural frequency ω is dose
independent. The coefficients ζ(d), К0(d) и Ku(d) are nonlinear toward the nifedipi-
ne dose d. They must be identified as a
function of dose quantity.
As can be seen from the graphs on Fig.
2, the dependence of the change of the
parameter on the applied dose can be
modeled with exponential decay curve:
)()(,)exp()( 0 dQdFCD
ddCdF const ∈+
∆+−= (2)
The unknown parameters for identifi-
cation are:
C0 = F(0) − Cconst
D – dose-constant.
∆d – dose correction parameter;
Cconst – free term
Applying again the CCD, the calcula-
ted values for identification parameters
are obtained (Table 3).
Table 1. Plasma renin activity in ng/(mL.h) after treatment with nifedipine at doses of 10, 20, 40
and 60 mg/kg. Data are presented as means ± standard deviation
Dose (mg/kg body weight) T (hours)
10 20 40 60
0 7.58 ± 0.8 7.58 ± 0.8 7.58 ± 0.8 7.58 ± 0.8
0.5 28.3 ± 3.1 39.1 ± 10.8 39.6 ± 13.5 40.2 ± 2.9
1 36.3 ± 9.4 50.7 ± 10.2 51.8 ± 15.7 57.3 ± 1.7
3 27.5 ± 3.4 33.0 ± 4.6 55.7 ± 13.6 62.5 ± 2.6
5 15.4 ± 4.5 26.2 ± 4.3 35.1 ± 5.9 40.1 ± 3.9
7 9.8 ± 1.5 11.9 ± 3.7 20.4 ± 4.7 23.7 ± 1.5
9 7.58 ± 0.8 8.98 ± 2.4 10.7 ± 2.8 14.3 ± 1.7
11 7.58 ± 0.6 7.56 ± 1.7 7.58 ± 1.6 9.5 ± 1.4

A. Tolekova & K. Yankov
BJVM, 11, No 1 25
A
B
C
Fig. 2. A. Damping ratio ζ(d); B. Constant
base level K0; C. Proportionality coefficient
Ku(d).
Finally, the time and dose dependent PRA
model is described by the system of
equations:
4)1000
999exp(11.15)( −
+−=d
dζ
602.0)81.23
exp()(0 +−−=d
dK
61.11)22.22
exp(86.75)( +−=d
dKu (3)
)()(6.0)(K)(36.0)(
)(2.1),(
02
2
tUdKdtydt
tdyd
dt
dtydu=+++ ζ
initial conditions: y(0) = 7.58; 0)0(=
dt
dy
The graphics of the experimental data
interpolated using cubic spline and ge-
nerated models of PRA for doses of 10,
20 ,40 and 60 mg/kg are shown on Fig. 3.
Error estimation
As mentioned above the measured values
are фi. The identified values for the same
time points are yi. For each point фi, the
residual (absolute error) is:
∆yi = || yi - фi || , i=1..N
And the relative error ri for each
experimental point is:
ri = |∆yi / фi | The maximum absolute error for the
identification interval is:
∆Ymax = max| ∆y i |
The calculated errors for tested doses
and the standard deviations in the cor-
Table 2. Identification parameters for equation 1
Nifedipine dose (mg/kg body weight) ODE parameters
10 20 40 60
ζ(d) 1.50 1.39 1.40 1.21
ω(d) 0.60 0.60 0.60 0.60
К0(d) 0.24 0.0 −0.73 − 2.51
Ku(d) 61.92 40.42 26.18 15.00
Mathematical model of plasma renin activity after nifedipine treatment
BJVM, 11, No 1 26
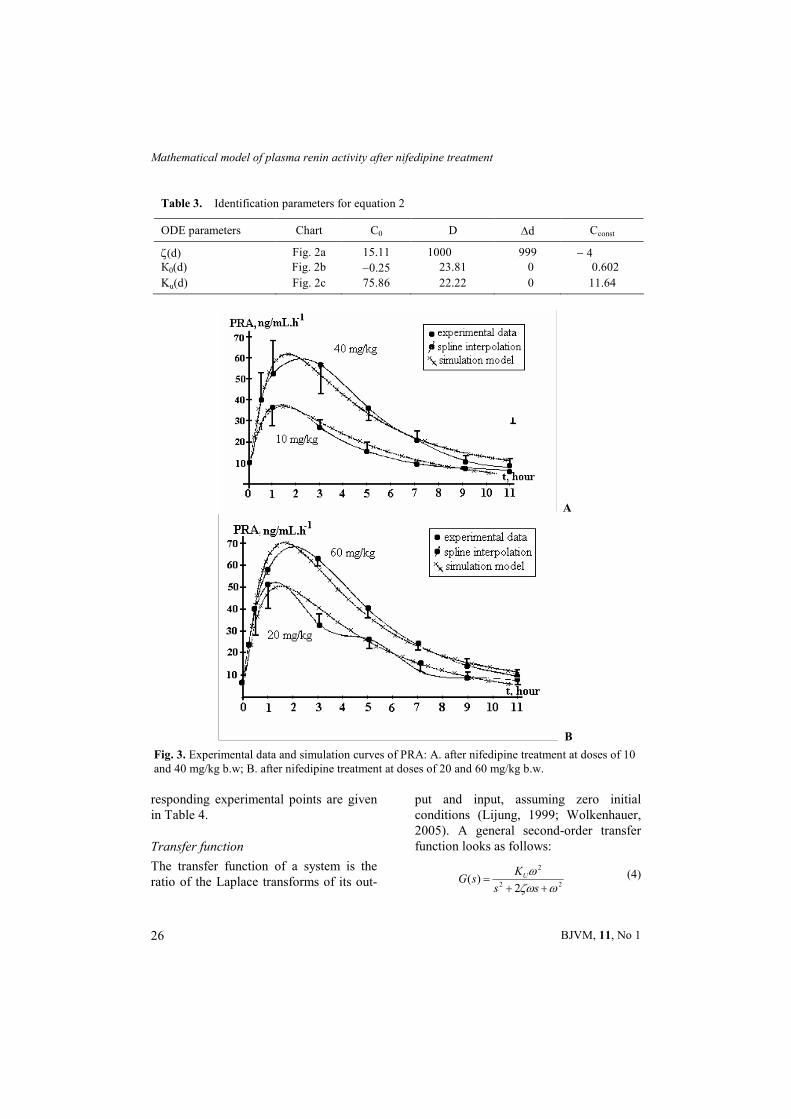
responding experimental points are given
in Table 4.
Transfer function
The transfer function of a system is the
ratio of the Laplace transforms of its out-
put and input, assuming zero initial
conditions (Lijung, 1999; Wolkenhauer,
2005). A general second-order transfer
function looks as follows:
22
2
2)(
ωζωω++
=ss
KsG U (4)
Table 3. Identification parameters for equation 2
ODE parameters Chart C0 D ∆d Cconst
ζ(d) Fig. 2a 15.11 1000 999 − 4
К0(d) Fig. 2b −0.25 23.81 0 0.602
Ku(d) Fig. 2c 75.86 22.22 0 11.64
A
B
Fig. 3. Experimental data and simulation curves of PRA: A. after nifedipine treatment at doses of 10
and 40 mg/kg b.w; B. after nifedipine treatment at doses of 20 and 60 mg/kg b.w.
A. Tolekova & K. Yankov
BJVM, 11, No 1 27
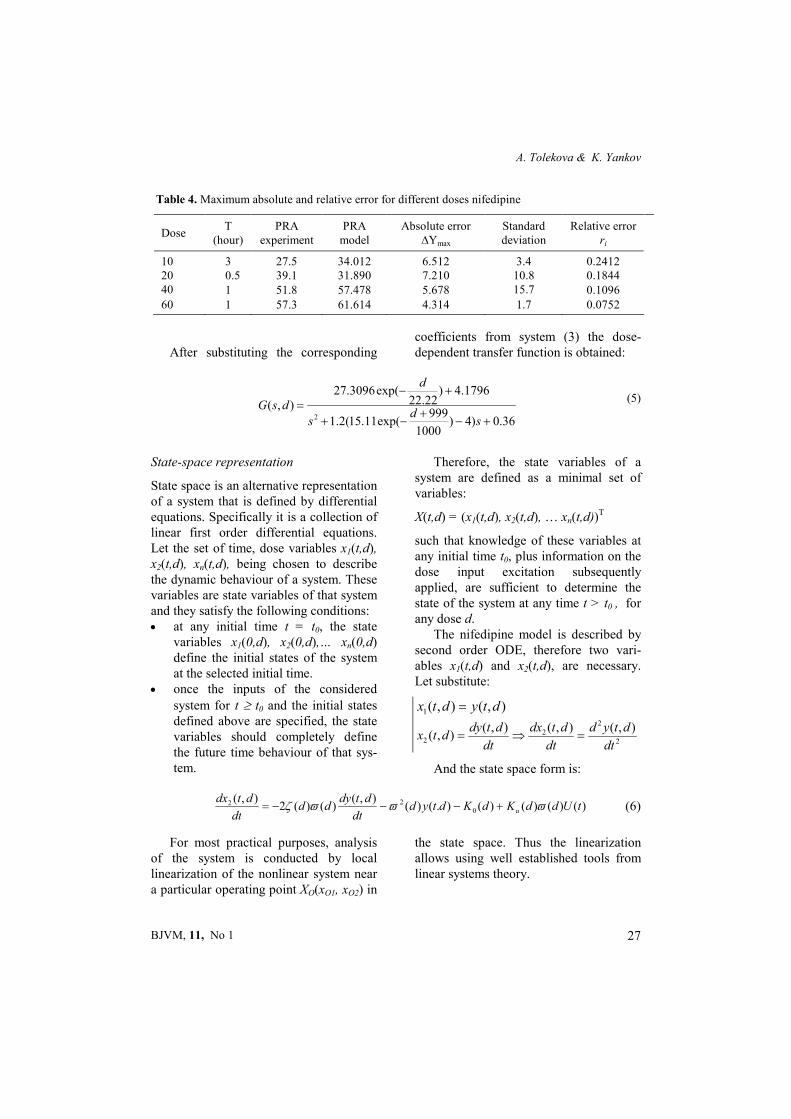
After substituting the corresponding
coefficients from system (3) the dose-
dependent transfer function is obtained:
36.0)4)1000
999exp(11.15(2.1
1796.4)22.22
exp(27.3096
),(2 +−
+−+
+−=
sd
s
d
dsG (5)
State-space representation
State space is an alternative representation
of a system that is defined by differential
equations. Specifically it is a collection of
linear first order differential equations.
Let the set of time, dose variables x1(t,d),
x2(t,d), xn(t,d), being chosen to describe
the dynamic behaviour of a system. These
variables are state variables of that system
and they satisfy the following conditions:
• at any initial time t = t0, the state
variables x1(0,d), x2(0,d),… xn(0,d)
define the initial states of the system
at the selected initial time.
• once the inputs of the considered
system for t ≥ t0 and the initial states
defined above are specified, the state
variables should completely define
the future time behaviour of that sys-
tem.
Therefore, the state variables of a
system are defined as a minimal set of
variables:
X(t,d) = (x1(t,d), x2(t,d), … xn(t,d))T
such that knowledge of these variables at
any initial time t0, plus information on the
dose input excitation subsequently
applied, are sufficient to determine the
state of the system at any time t > t0 , for
any dose d.
The nifedipine model is described by
second order ODE, therefore two vari-
ables x1(t,d) and x2(t,d), are necessary.
Let substitute:
),(),(1 dtydtx =
2
2
22
),(),(),(),(
dt
dtyd
dt
dtdx
dt
dtdydtx =⇒=
And the state space form is:
)()()()().()(),(
)()(2),(
0
22 tUddKdKdtyddt
dtdydd
dt
dtdxu ϖϖϖζ +−−−= (6)
For most practical purposes, analysis
of the system is conducted by local
linearization of the nonlinear system near
a particular operating point XO(xO1, xO2) in
the state space. Thus the linearization
allows using well established tools from
linear systems theory.
Table 4. Maximum absolute and relative error for different doses nifedipine
Dose T
(hour)
PRA
experiment
PRA
model
Absolute error
∆Ymax
Standard
deviation
Relative error
ri
10 3 27.5 34.012 6.512 3.4 0.2412
20 0.5 39.1 31.890 7.210 10.8 0.1844
40 1 51.8 57.478 5.678 15.7 0.1096
60 1 57.3 61.614 4.314 1.7 0.0752
Mathematical model of plasma renin activity after nifedipine treatment
BJVM, 11, No 1 14
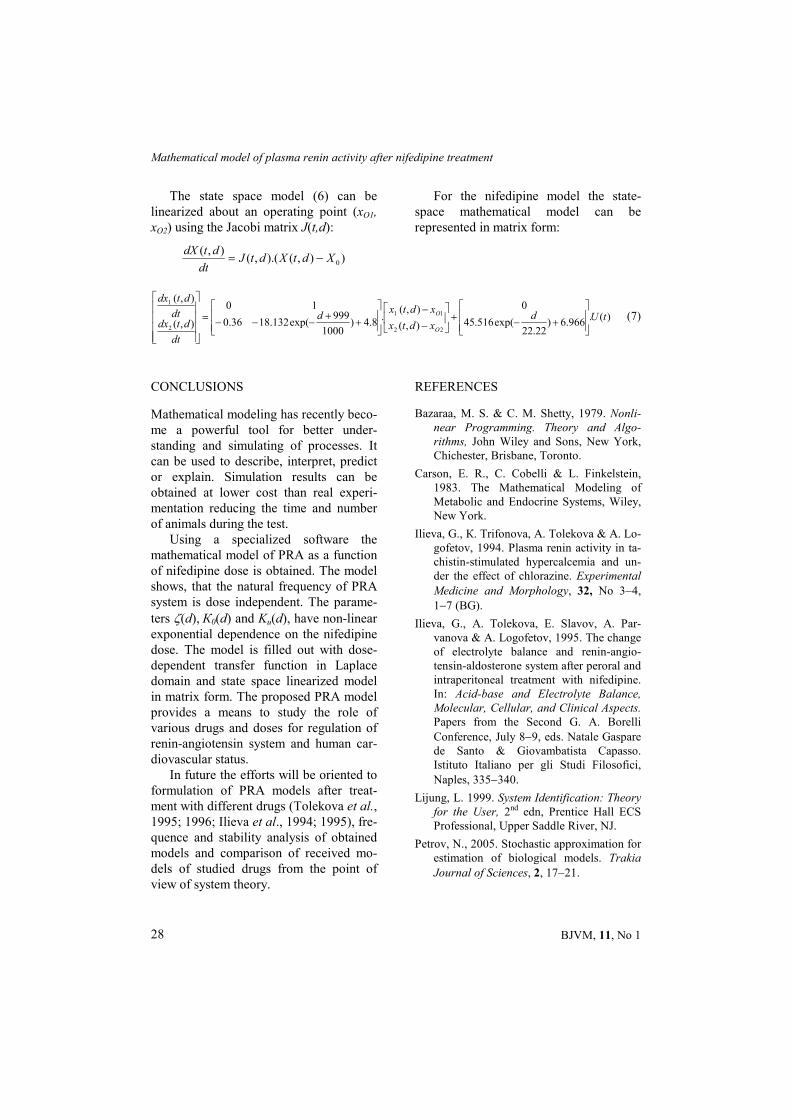
The state space model (6) can be
linearized about an operating point (xO1,
xO2) using the Jacobi matrix J(t,d):
)),().(,(),(
0XdtXdtJdt
dtdX−=
For the nifedipine model the state-
space mathematical model can be
represented in matrix form:
)(.966.6)
22.22exp(516.45
0
),(
),(.
8.4)1000
999exp(132.1836.0
10
),(
),(
22
11
2
1
tUdxdtx
xdtxd
dt
dtdxdt
dtdx
O
O
+−+
−
−
++
−−−=
(7)
CONCLUSIONS
Mathematical modeling has recently beco-
me a powerful tool for better under-
standing and simulating of processes. It
can be used to describe, interpret, predict
or explain. Simulation results can be
obtained at lower cost than real experi-
mentation reducing the time and number
of animals during the test.
Using a specialized software the
mathematical model of PRA as a function
of nifedipine dose is obtained. The model
shows, that the natural frequency of PRA
system is dose independent. The parame-
ters ζ(d), К0(d) and Ku(d), have non-linear
exponential dependence on the nifedipine
dose. The model is filled out with dose-
dependent transfer function in Laplace
domain and state space linearized model
in matrix form. The proposed PRA model
provides a means to study the role of
various drugs and doses for regulation of
renin-angiotensin system and human car-
diovascular status.
In future the efforts will be oriented to
formulation of PRA models after treat-
ment with different drugs (Tolekova et al.,
1995; 1996; Ilieva et al., 1994; 1995), fre-
quence and stability analysis of obtained
models and comparison of received mo-
dels of studied drugs from the point of
view of system theory.
REFERENCES
Bazaraa, M. S. & C. M. Shetty, 1979. Nonli-
near Programming. Theory and Algo-
rithms, John Wiley and Sons, New York,
Chichester, Brisbane, Toronto.
Carson, E. R., C. Cobelli & L. Finkelstein,
1983. The Mathematical Modeling of
Metabolic and Endocrine Systems, Wiley,
New York.
Ilieva, G., К. Trifonova, A. Tolekova & A. Lo-
gofetov, 1994. Plasma renin activity in ta-
chistin-stimulated hypercalcemia and un-
der the effect of chlorazine. Experimental
Medicine and Morphology, 32, No 3−4,
1−7 (BG).
Ilieva, G., A. Tolekova, E. Slavov, A. Par-
vanova & A. Logofetov, 1995. The change
of electrolyte balance and renin-angio-
tensin-aldosterone system after peroral and
intraperitoneal treatment with nifedipine.
In: Acid-base and Electrolyte Balance,
Molecular, Cellular, and Clinical Aspects.
Papers from the Second G. A. Borelli
Conference, July 8−9, eds. Natale Gaspare
de Santo & Giovambatista Capasso.
Istituto Italiano per gli Studi Filosofici,
Naples, 335−340.
Lijung, L. 1999. System Identification: Theory
for the User, 2nd edn, Prentice Hall ECS
Professional, Upper Saddle River, NJ.
Petrov, N., 2005. Stochastic approximation for
estimation of biological models. Trakia
Journal of Sciences, 2, 17−21.
28
A. Tolekova & K. Yankov
BJVM, 11, No 1 15
Pohjanpalo, H., 1978. System identifiability
based on the power series expansion of the
solution, Mathematical Biosciences, 41,
21–33.
Tolekova, A., G. Ilieva, M. Tzaneva, & M.
Ganeva, 1995. Effect of acute and chronic
acetylsalicylic acid administration on re-
nin-angiotensin-aldosterone system and
stomach mucosa in rats. Endocrine Regu-
lations (Bratislava), 29, No 2, 115−120.
Tolekova, A., G. Ilieva & A. Parvanova, 1996.
Comparison of the effects on RAAS of the
combination of ACE inhibition with
calcium channel blockade. In: Annual Pro-
ceedings of the International Medical
Association Bulgaria (IMAB) (scientific
papers), 2, No 1, 209−210.
Tolekova, A., 1998, Functional analysis of
changes in PRA after some pharma-
cological influences. In: Proceedings of
the 50th Anniversary of the Union of Sci-
entists in Bulgaria, Plovdiv, 2, 11−14.
Tolekova, A., K. Yankov & V. Spasov, 1998.
Dynamic parameters of plasma renin acti-
vity after blocking of l- and t- type voltage-
dependent calcium channels. In: Procee-
dings of Ninth National Conference "Mo-
dern tendencies in the development of fun-
damental and applied sciences", June 5−6 1998, Stara Zagora, Bulgaria, 198−203 (BG).
Tolekova, A. & K. Yankov, 2002. System
analysis of plasma renin activity upon con-
dition of pharmacological and physiolo-
gical stimulation. In: Proceedings of Jubi-
lee Scientific Conference, October 18−20
2002, Stara Zagora, Bulgaria, vol. 1,
Biomedical Sciences, 61−65 (BG).
Tolekova, A., 2003. Study of plasma renin
activity after some physiological and
pharmacological influences. Ph.D. Thesis,
Sofia (BG).
Tolekova, A. & K. Yankov, 2006. Model of a
plasma renin activity after nicardipine
treatment. Journal of Information, Control
and Management Systems (Slovakia), 4,
203−212.
Vajda, S., K. Godfrey & H. Rabitz, 1989.
Similarity transformation approach to
identifiability analysis of nonlinear com-
partmental models. Mathematical Bio-
sciences, 93, 217–248.
Wolkenhauer, O., 2005. Systems Biology
Dynamic Pathway Modelling. http:// www.
sbi.uni-rostock.de/dokumente/t_sb.pdf
(March 9 2008: date last accessed).
Yankov, K., 1998a. Software utilities for
investigation of regulating systems. In: Pro-
ceedings of 9th National Conference "Mo-
dern Tendencies in the Development of
Fundamental and Applied Sciences", June
5−6 1998, Stara Zagora, Bulgaria, 401−408.
Yankov, K., 1998b. Evaluation of some dyna-
mic characteristics of transient processes.
In: Proceedings of the 12th International
Conference Saer '98, St. Konstantin Resort,
September 19−20 1998, Varna, Bulgaria,
113−117.
Yankov, K., A. Tolekova & V. Spasov, 1998a.
Mathematical modelling of drug-induced
changes in plasma renin activity, Pharma-
cia, 45, No 1, 26−29.
Yankov, K. & A. Tolekova, 1998b. Functional
analysis of biological data. In: Procee-
dings of 50-th Anniversary of the Union of
Scientists in Bulgaria, Plovdiv, Vol.2,
53−56.
Yankov, K., 2006. System identification of
biological processes. In: Proceedings of 20-
th Inernational Conference "Systems for
Automation of Engineering and Research
(Saer-2006), St. Konstantin Resort, Sep-
tember 22−24, Varna, Bulgaria, 144−149.
Paper received 15.03.2007; accepted for
publication 12.11.2007
Correspondence:
Anna Tolekova, MD, PhD
Department of Physiology and Pharmacology,
Medical Faculty, Trakia University,
11 Armeiska str,
6000 Stara Zagora, Bulgaria.
29