Binary melting phase diagrams of nifedipine-PEG 4000 and nifedipine-mannitol systems
10
Journal of Thermal Analysis and Calorimetry, Vol. 77 (2004) 571–580 BINARY MELTING PHASE DIAGRAMS OF NIFEDIPINE-PEG 4000 AND NIFEDIPINE–MANNITOL SYSTEMS Natalija Zajc and Stane Sr¹i¹ * Faculty of Pharmacy, University of Ljubljana, Aške r¹eva 7, 1000 Ljubljana, Slovenia Abstract The phase diagrams of nifedipine-polyethylene glycol (PEG) 4000 and nifedipine–mannitol sys- tems have been determined. Heating experiments on thermodynamically equilibrated co-melts re- vealed eutectic behaviour for nifedipine-PEG 4000 mixtures, with the composition of the eutectic point between 40 and 45% w/w of nifedipine. These observations were supported by optical and hot stage microscopy. Nifedipine and mannitol were negligibly miscible in the solid-state, behaving as a binary system with monotectic characteristics. Application of phase diagrams to the production of solid dispersions is shown to be rational, since they provide valuable information on the state of the binary systems under preparation. Keywords: differential scanning calorimetry, mannitol, nifedipine, PEG 4000, phase diagram Introduction Nifedipine (NIF) is a calcium channel blocking agent of the dihydropyridine type, and is used in treating hypertension and angina pectoris. The combination of low aqueous solubility and rapid absorption from the gastrointestinal tract leads to its classification into class II of the Biopharmaceutical Classification System. Bioavailability of these drugs can generally be improved by formulation techniques such as forming solid dispersions [1]. For this purpose, one or more active ingredi- ents are dispersed in an inert, hydrophilic carrier or matrix in the solid-state, prepared by melting or solvent methods, or a combination of both. Nowadays, a great number of substances are recognized as meeting the require- ments for solid dispersion carriers. Polyethylene glycols (PEG) – hydrophilic poly- mers with relatively low melting point – have been successfully used for this purpose [2, 3]. The incorporation of nifedipine into a PEG matrix has been reported to result in a much greater dissolution rate than that of the drug alone [4, 5]. In the group of sugars and polyols, mannitol has attracted attention as the most popular substance for a solid dispersion matrix. It has the desired water solubility, low toxicity and appro- 1388–6150/2004/ $ 20.00 © 2004 Akadémiai Kiadó, Budapest Akadémiai Kiadó, Budapest Kluwer Academic Publishers, Dordrecht * Author for correspondence: E-mail: [email protected]
-
Upload
independent -
Category
Documents
-
view
2 -
download
0
Transcript of Binary melting phase diagrams of nifedipine-PEG 4000 and nifedipine-mannitol systems
Journal of Thermal Analysis and Calorimetry, Vol. 77 (2004) 571–580
BINARY MELTING PHASE DIAGRAMS OFNIFEDIPINE-PEG 4000 AND NIFEDIPINE–MANNITOLSYSTEMS
Natalija Zajc and Stane Sr�i�*
Faculty of Pharmacy, University of Ljubljana, Ašker�eva 7, 1000 Ljubljana, Slovenia
Abstract
The phase diagrams of nifedipine-polyethylene glycol (PEG) 4000 and nifedipine–mannitol sys-tems have been determined. Heating experiments on thermodynamically equilibrated co-melts re-vealed eutectic behaviour for nifedipine-PEG 4000 mixtures, with the composition of the eutecticpoint between 40 and 45% w/w of nifedipine. These observations were supported by optical and hotstage microscopy. Nifedipine and mannitol were negligibly miscible in the solid-state, behaving as abinary system with monotectic characteristics. Application of phase diagrams to the production ofsolid dispersions is shown to be rational, since they provide valuable information on the state of thebinary systems under preparation.
Keywords: differential scanning calorimetry, mannitol, nifedipine, PEG 4000, phase diagram
Introduction
Nifedipine (NIF) is a calcium channel blocking agent of the dihydropyridine type,and is used in treating hypertension and angina pectoris. The combination of lowaqueous solubility and rapid absorption from the gastrointestinal tract leads to itsclassification into class II of the Biopharmaceutical Classification System.Bioavailability of these drugs can generally be improved by formulation techniquessuch as forming solid dispersions [1]. For this purpose, one or more active ingredi-ents are dispersed in an inert, hydrophilic carrier or matrix in the solid-state, preparedby melting or solvent methods, or a combination of both.
Nowadays, a great number of substances are recognized as meeting the require-ments for solid dispersion carriers. Polyethylene glycols (PEG) – hydrophilic poly-mers with relatively low melting point – have been successfully used for this purpose[2, 3]. The incorporation of nifedipine into a PEG matrix has been reported to resultin a much greater dissolution rate than that of the drug alone [4, 5]. In the group ofsugars and polyols, mannitol has attracted attention as the most popular substance fora solid dispersion matrix. It has the desired water solubility, low toxicity and appro-
1388–6150/2004/ $ 20.00
© 2004 Akadémiai Kiadó, Budapest
Akadémiai Kiadó, Budapest
Kluwer Academic Publishers, Dordrecht
* Author for correspondence: E-mail: [email protected]
priate compression properties, although its high melting point and the polymorphtransition after melting make the melting method of preparation inadvisable [6].
To achieve the optimal degree of drug dispersion, melting phase diagrams canbe used for selecting a suitable drug/carrier composition [7]. Differential scanningcalorimetry (DSC) is a suitable method for evaluating transition temperatures, whichreflect the interactions in the system. On the basis of quantitative measurement withacceptable accuracy [8], the eutectic point may be obtained by studying the composi-tion dependence of the fusion enthalpy in the binary system [7]. Using DSC data, thedrug/carrier relationship and solid structure of the system can be characterized, espe-cially in cases where the fusion method is the method of choice for solid dispersionpreparation. The aim of the present study therefore is to construct phase diagrams ofthe nifedipine-PEG 4000 and nifedipine-mannitol binary systems, based on the re-sults of DSC heating experiments. An attempt to clarify the interactions between thecomponents has been made and the type of potential solid dispersion system has beenconsidered.
Experimental
Materials
Nifedipine and D-mannitol were supplied by Lek Pharmaceutical d.d., Slovenia, andpolyethylene glycol 4000 (PEG 4000) by Merck, Germany. Prior to preparing mix-tures, each powder was sieved in order to ensure a particle size ≤ 160 µm. 10.0 g ofbinary mixtures of 3 to 95% NIF in mannitol or PEG 4000 was prepared by blendingthe appropriate quantities of components in a mortar for 10 min.
Methods
Differential scanning calorimetry
Differential scanning calorimetry measurements were carried out using a Pyris 1DSC (PerkinElmer, USA), equipped with an Intracooler 2P cooling accessory. Datawere acquired using Pyris software (Version 3.81; PerkinElmer, USA). 4.5–5 mgsamples were weighed accurately in standard PerkinElmer aluminium pans and cov-ered with a pierced lid. During experiments, the DSC cell was purged by nitrogen at aflow rate of 20 mL min–1.
Scans were recorded in the temperature range of 20–185°C, using a heating rateof 10 K min–1 for NIF-PEG 4000 systems and 145–185°C, with heating rate of5 K min–1, for NIF–mannitol mixtures. Immediately after the first heating scan, sam-ples were stored for 10 min on an aluminium plate at 20±1°C. They were then re-turned to the DSC cell, the temperature was adjusted to 20 or 145°C (for PEG 4000 ormannitol systems, respectively) and the second scan triggered. Afterwards, all exam-ined samples were kept in a desiccator (RH 5%) at room temperature and scannedagain after storing for 2 months.
J. Therm. Anal. Cal., 77, 2004
572 ZAJC, SR�I�: NIF–PEG 4000 AND NIF–MANNITOL SYSTEMS

Glassy NIF was also heated repeatedly. Glassy samples were obtained by heat-ing NIF in the DSC pan to 180°C and cooling to room temperature under ambientconditions. They were then scanned successively to 130, 155 and 180°C at a heatingrate of 10°C min–1. Between the scans, samples were cooled to room temperature.
X-ray diffraction
The X-ray diffraction data were recorded using a Siemens D-5000 X-ray diffractometer(Siemens, Germany) with Ni filtered CuKα radiation. The angular range from 2 to 35 2θwas scanned with a step size of 0.040 and a time constant of 1.0 s.
Optical microscopy
Samples of physical mixtures (approx. 1 mg) were heated to 180°C on glass slidesand then cooled to room conditions. After three weeks the appearance of co-melts atroom temperature was observed using an Olympus BX50 microscope with the High-light 3100 light source (Olympus, Japan), and equipped with a Sony colour videocamera DXC-950P.
Hot-stage microscopy
Hot stage microscopy of co-melts was carried out with a hot stage table (Karl SussGmbH, Germany). Samples were examined on the metal slide three weeks after prep-aration (melting), over a temperature range from 25 to 180°C. A Mitutoyo micro-scope (Mitutoyo, Japan) was employed using a HV-C20 Hitachi camera. The heatingrate was 2°C min–1.
FTIR spectroscopy
Infrared spectra were recorded using a Nicolet Nexus (Nicolet Instrument Co., USA)equipped with InGaAs detector and ATR Smart DuraSamplIR sampling accessory.Data were acquired using OMNIC software (version 5.2, Nicolet Instrument Co.).MID spectra were measured over the range 4000–400 cm–1 with an instrument reso-lution of 4 cm–1. Each spectrum comprised an average of 32 scans.
Results and discussion
Nifedipine-PEG 4000 system
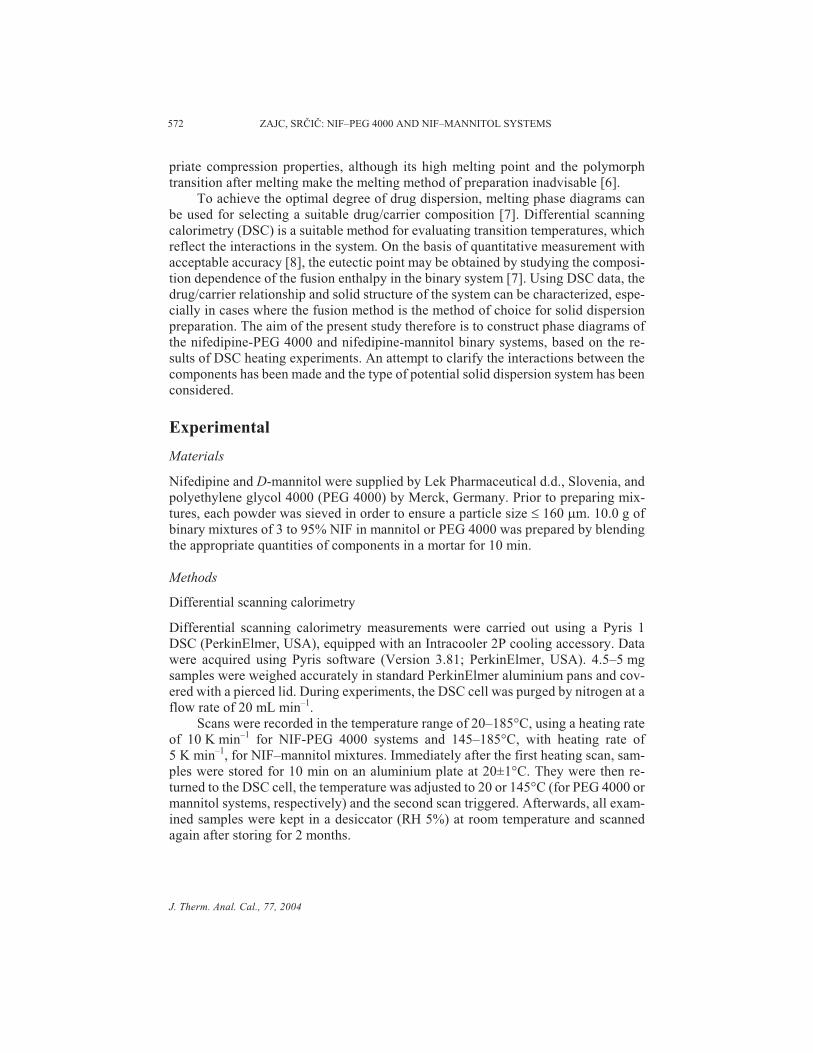
The DSC scans of pure PEG 4000 and NIF exhibited single melting endotherms, withonset temperatures at 58.1 and 173.4°C, respectively. Heating physical mixtures of PEGand NIF resulted in DSC curves with two endotherms (Fig. 1a). Transitions in the lowertemperature region (onset temperature at 55.7±1.0°C) were assigned to melting of PEG4000 and remained independent of the proportion of drug. The second endotherm re-flected NIF melting. Its onset temperature decreased with decreasing percentage of NIFdown to approximately 45% w/w of NIF, below which there was no appreciable further
J. Therm. Anal. Cal., 77, 2004
ZAJC, SR�I�: NIF–PEG 4000 AND NIF–MANNITOL SYSTEMS 573
change. Since both melting endotherms were always detectable, it was concluded thatthere was no specific interaction between NIF and PEG 4000.
To study phase interactions of more intimately blended systems, melting of in-gredients prior to analysis has been suggested [7]. Samples were therefore re-heatedafter 10 min of storage on an aluminium plate at 20°C. The DSC transitions (Fig. 1b)differed clearly from those for physical mixtures. Pure PEG 4000 displayed a multi-ple peak endotherm, consisting of a shoulder and two partly overlapping peaks. Thiswas attributed to the presence of different crystal structures of the polymer, namelytwice folded, once folded and extended chains, respectively [9, 10]. The shoulderdisappeared with increase of NIF above 3% w/w, whereas the peak corresponding tothe extended form was no longer present above 20% w/w. Verheyen and co-workerssuggested that the presence of drug influenced the structure of PEG 6000 in the soliddispersion [3]. The drug acts as impurity, promoting formation of metastable, once ortwice folded forms at the expense of the stable extended form. Our results supportthese findings since, on increasing the drug content, the peak of once folded chainsgradually dominated. From 20% w/w on, only a single peak endotherm was observedfor PEG 4000 melting. The absence of the NIF melting peak in PEG-rich samples
J. Therm. Anal. Cal., 77, 2004
574 ZAJC, SR�I�: NIF–PEG 4000 AND NIF–MANNITOL SYSTEMS
Fig. 1 DSC scans of NIF–PEG 4000 a – physical mixtures, b – co-melts (second heat-ing) after 10 min and c – co-melts after 2 months of storage. Numbers representthe mass fraction of NIF
(compositions less than 50% w/w of NIF) could be explained by the dispersion ofNIF subtle crystals into the melted carrier. It could also be the consequence of smallglassy NIF compartments, in which crystallization was impossible due to insufficientamounts of the drug. In support of this, samples rich in NIF (> 60% w/w) exhibitedshallow and broad crystallization exotherms at temperatures between 70 and 100°C[11], showing that at least part of the drug existed in glassy state.
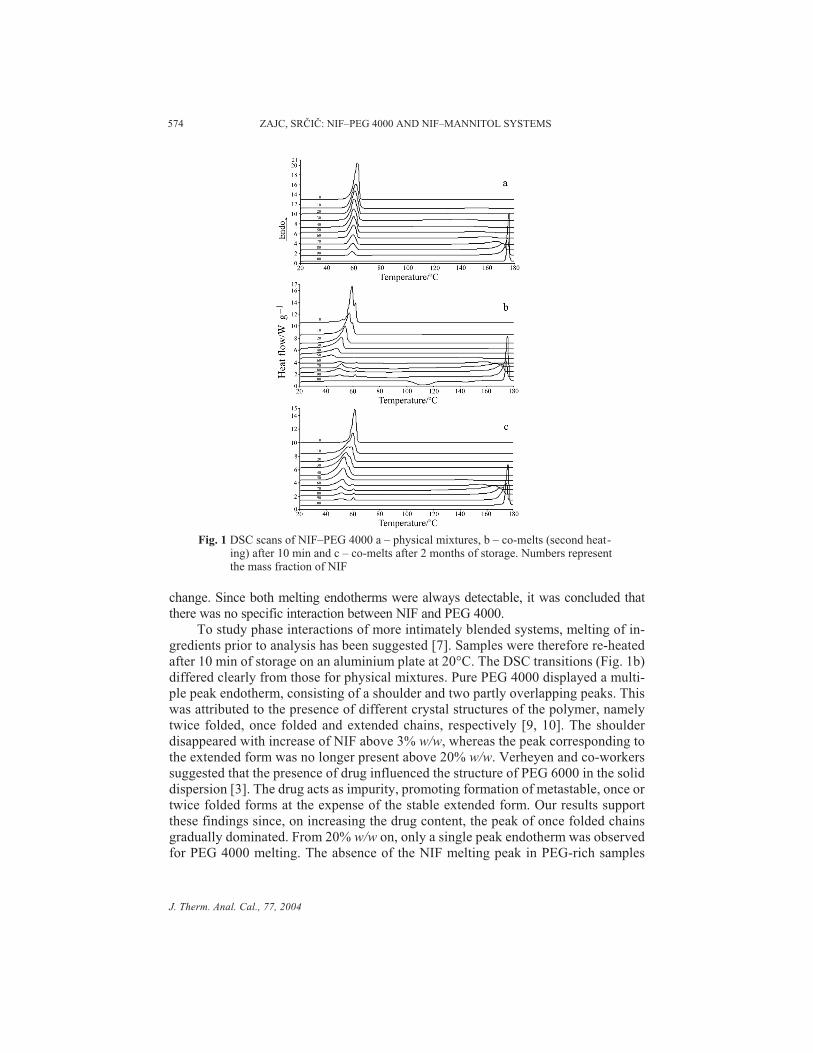
At approximately 60°C, an additional small, but sharp, endotherm appeared(Fig. 1b). The signal increased with drug content from 60% w/w upwards, and wastherefore attributed to NIF. The occurrence of this endotherm was further studied bysuccessive heating of pure glassy NIF (Fig. 2). The first heating up to 130°C(curve 1) showed the glass transition at approx. 46°C and a crystallization exothermfrom 100 to 125°C. Samples were then cooled to room conditions and scanned againto 155°C. This time, a small endotherm appeared with an onset temperature of59.8°C, followed by an exothermic transition between 130 and 145°C (curve 2).Crystallization of NIF was found to result in a complex transition in which at leastthree different polymorphs are created in a heating rate dependent process [11, 12].From this point of view it can be concluded that the endotherm in question is the re-sult of a solid-solid transition from one metastable modification of NIF to another.Finally, the crystallization at 130°C results in a stable modification, which melts atapproximately 173°C. The presence of PEG 4000 in the co-melts is seen to have pro-voked formation of a less stable NIF polymorph, which is subject to a solid-solidtransition at around 60°C.
The DSC results of a second heating (Fig. 1b) demonstrated, with respect to themultiple melting peaks of PEG 4000 and the crystallization exotherm of NIF, that thesystem was not thermodynamically equilibrated within 10 min prior to analysis.Therefore, the samples were scanned once again after 2 months of storage at roomtemperature and RH 5%. Figure 1c comprises the DSC curves corresponding to purecomponents and co-melts with different compositions. There are obvious differencesdetectable in comparison with physical mixtures and thermodynamically non-equili-brated co-melts (Fig. 1a and 1b, respectively). On increasing the amount of NIF in the
J. Therm. Anal. Cal., 77, 2004
ZAJC, SR�I�: NIF–PEG 4000 AND NIF–MANNITOL SYSTEMS 575
Fig. 2 DSC scans of pure glassy NIF: 1 – heating was stopped at 130°C; 2 – sample(1) was cooled and then re-heated to 155°C; 3 – sample (2) was cooled andre-heated to 180°C
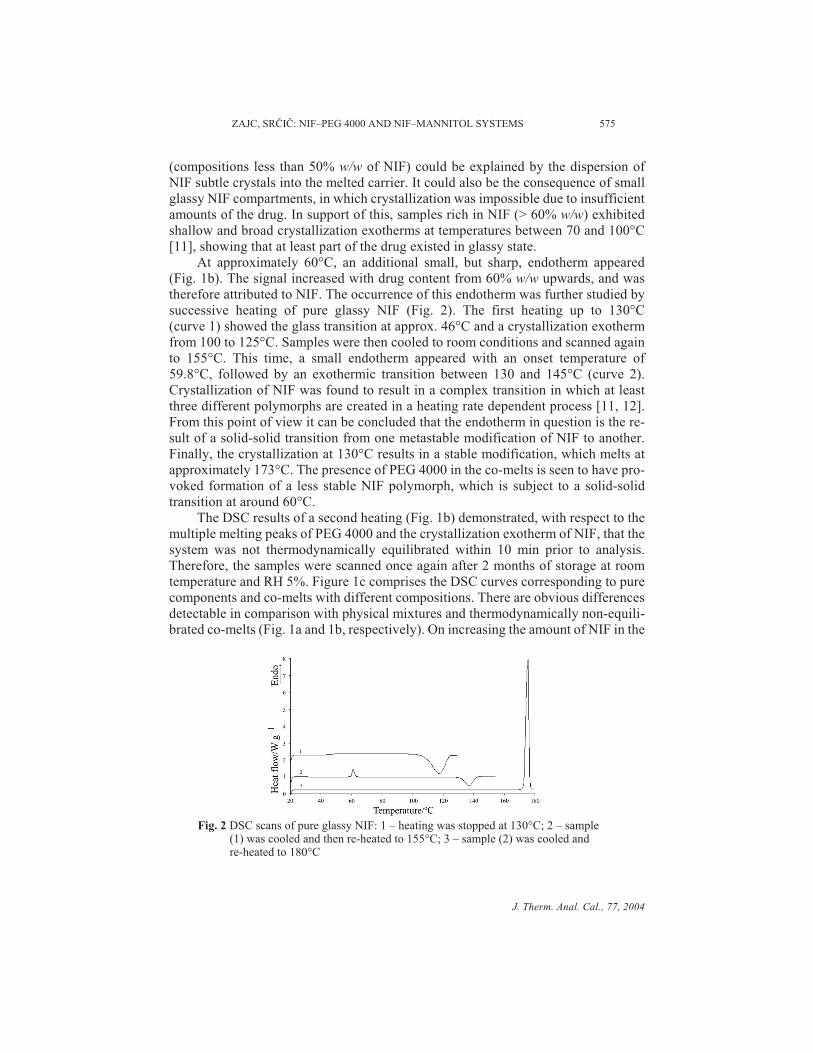
mixtures up to 40% w/w, the PEG 4000 melting peak gradually decreased and an ad-ditional endothermic peak appeared at approx. 44°C. This temperature is substan-tially lower than that of the PEG 4000 melting. This peak may be attributed to themelting of a eutectic mixture, since its enthalpy increased with NIF content, reachinga maximum at 40% w/w of drug. After that, the area under the peak curve decreasedagain. In mixtures with 45% w/w NIF or more, the DSC curves exhibited an endo-thermic peak corresponding to the melting of excess NIF. On the same curves, asmall endotherm near 60°C was present. As in the case of non-equilibrated co-melts,this peak was found to increase with NIF content suggesting that, after 2 months ofstorage, the presence of PEG 4000 still favours the NIF metastable phase. PEG 4000melting peaks were analysed using the maximum peak temperature while, for allother endotherms, the onset peak temperatures were plotted vs. NIF mass fraction. Aphase diagram was constructed using defined temperatures (Fig. 3).
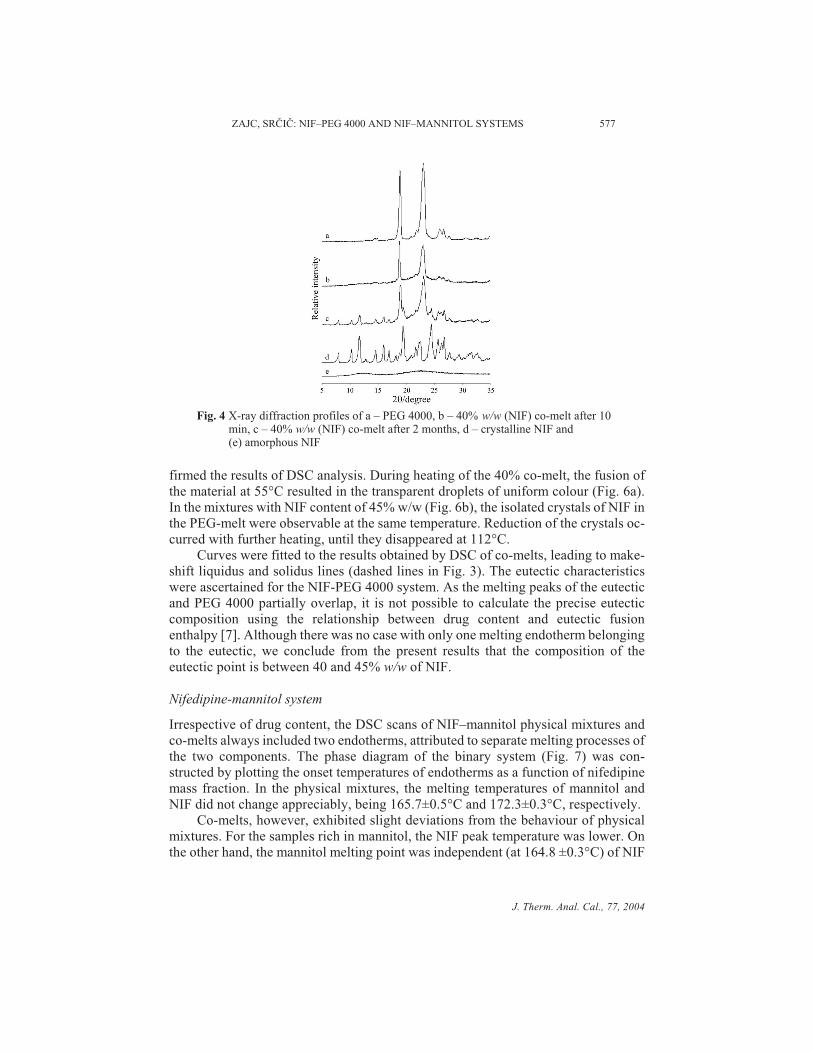
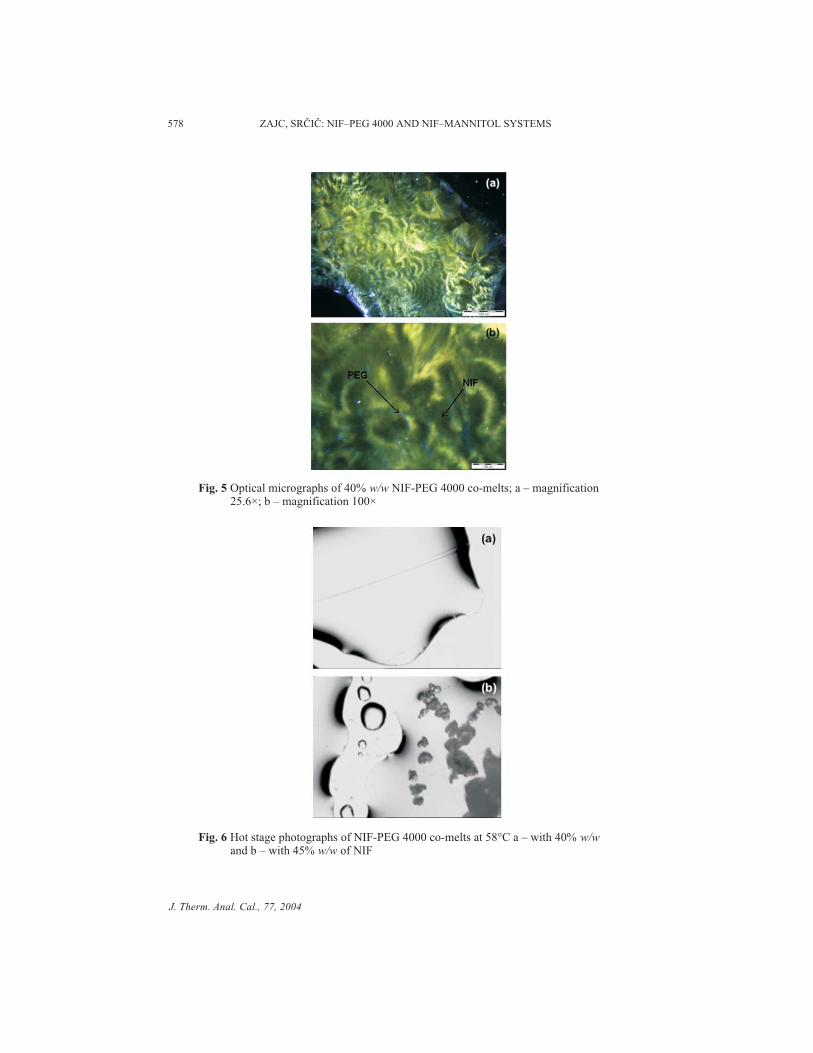
In an attempt to clarify the organization and structure of co-melted NIF-PEG4000 binary systems, they were studied by X-ray diffractometry. In the spectra ofthermodynamically non-equilibrated co-melt with 40% w/w NIF (Fig. 4b), only PEG4000 diffraction peaks were present. Deviation of the signal from baseline indicatedsimilarity to the amorphous NIF prepared by melting and subsequent rapid cooling(Fig. 4e). This provides evidence that, in the fresh co-melts, NIF was indeed in theamorphous state, but was unable to crystallize at drug contents of 50% w/w and less(Fig. 1b). After storage, the diffraction peaks of each crystalline component becamedistinguishable (Fig. 4c). Since both components are present in the crystalline form,the eutectic nature of the system had to be established. Optical micrographs of themelted mixture with 40% w/w of the drug (Fig. 5) show that, at room temperature, theco-melt area consists of separated NIF (yellow) and PEG 4000 (white) compart-ments. The PEG spherulite structure is still observable, but formation is disrupted bythe presence of subtle NIF crystals. Hot stage microscopy of selected co-melts con-
J. Therm. Anal. Cal., 77, 2004
576 ZAJC, SR�I�: NIF–PEG 4000 AND NIF–MANNITOL SYSTEMS
Fig. 3 Binary melting phase diagram of NIF and PEG 4000 systems prepared by phys-ical mixing (PM) or co-melting (CM), the latter preparation being stored for 2months prior to analysis
firmed the results of DSC analysis. During heating of the 40% co-melt, the fusion ofthe material at 55°C resulted in the transparent droplets of uniform colour (Fig. 6a).In the mixtures with NIF content of 45% w/w (Fig. 6b), the isolated crystals of NIF inthe PEG-melt were observable at the same temperature. Reduction of the crystals oc-curred with further heating, until they disappeared at 112°C.
Curves were fitted to the results obtained by DSC of co-melts, leading to make-shift liquidus and solidus lines (dashed lines in Fig. 3). The eutectic characteristicswere ascertained for the NIF-PEG 4000 system. As the melting peaks of the eutecticand PEG 4000 partially overlap, it is not possible to calculate the precise eutecticcomposition using the relationship between drug content and eutectic fusionenthalpy [7]. Although there was no case with only one melting endotherm belongingto the eutectic, we conclude from the present results that the composition of theeutectic point is between 40 and 45% w/w of NIF.
Nifedipine-mannitol system
Irrespective of drug content, the DSC scans of NIF–mannitol physical mixtures andco-melts always included two endotherms, attributed to separate melting processes ofthe two components. The phase diagram of the binary system (Fig. 7) was con-structed by plotting the onset temperatures of endotherms as a function of nifedipinemass fraction. In the physical mixtures, the melting temperatures of mannitol andNIF did not change appreciably, being 165.7±0.5°C and 172.3±0.3°C, respectively.
Co-melts, however, exhibited slight deviations from the behaviour of physicalmixtures. For the samples rich in mannitol, the NIF peak temperature was lower. Onthe other hand, the mannitol melting point was independent (at 164.8 ±0.3°C) of NIF
J. Therm. Anal. Cal., 77, 2004
ZAJC, SR�I�: NIF–PEG 4000 AND NIF–MANNITOL SYSTEMS 577
Fig. 4 X-ray diffraction profiles of a – PEG 4000, b – 40% w/w (NIF) co-melt after 10min, c – 40% w/w (NIF) co-melt after 2 months, d – crystalline NIF and(e) amorphous NIF
J. Therm. Anal. Cal., 77, 2004
578 ZAJC, SR�I�: NIF–PEG 4000 AND NIF–MANNITOL SYSTEMS
Fig. 5 Optical micrographs of 40% w/w NIF-PEG 4000 co-melts; a – magnification25.6×; b – magnification 100×
Fig. 6 Hot stage photographs of NIF-PEG 4000 co-melts at 58°C a – with 40% w/wand b – with 45% w/w of NIF
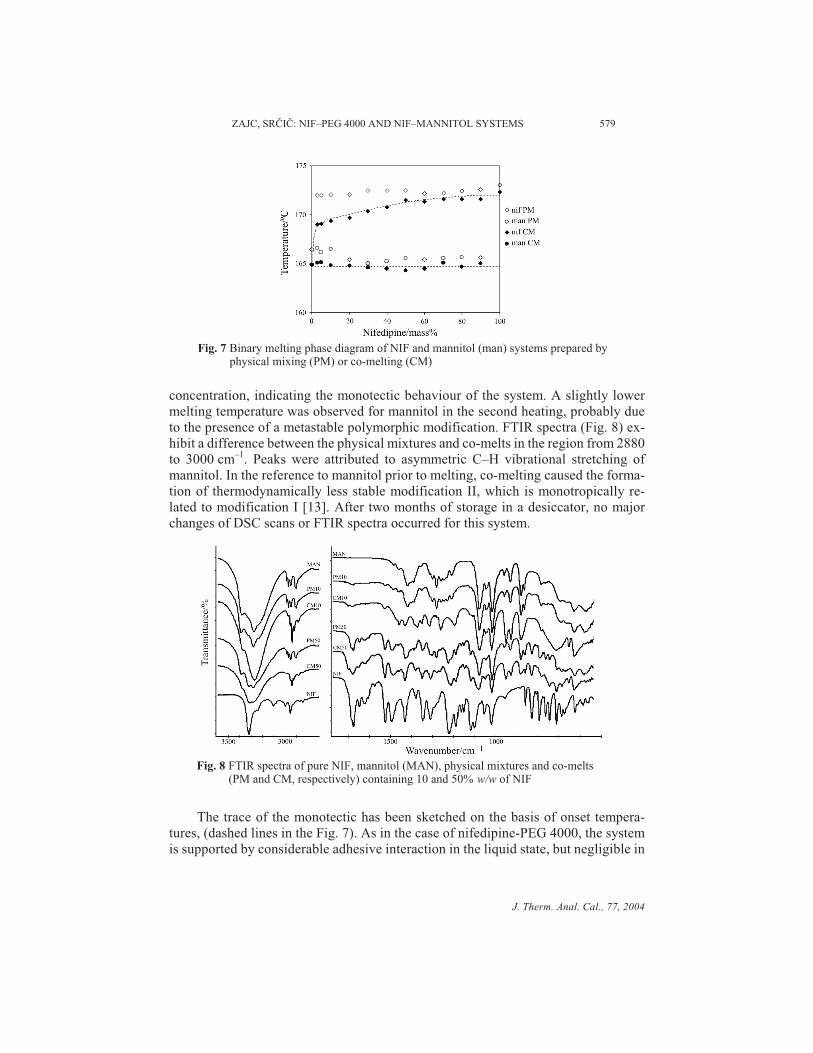
concentration, indicating the monotectic behaviour of the system. A slightly lowermelting temperature was observed for mannitol in the second heating, probably dueto the presence of a metastable polymorphic modification. FTIR spectra (Fig. 8) ex-hibit a difference between the physical mixtures and co-melts in the region from 2880to 3000 cm–1. Peaks were attributed to asymmetric C–H vibrational stretching ofmannitol. In the reference to mannitol prior to melting, co-melting caused the forma-tion of thermodynamically less stable modification II, which is monotropically re-lated to modification I [13]. After two months of storage in a desiccator, no majorchanges of DSC scans or FTIR spectra occurred for this system.
The trace of the monotectic has been sketched on the basis of onset tempera-tures, (dashed lines in the Fig. 7). As in the case of nifedipine-PEG 4000, the systemis supported by considerable adhesive interaction in the liquid state, but negligible in
J. Therm. Anal. Cal., 77, 2004
ZAJC, SR�I�: NIF–PEG 4000 AND NIF–MANNITOL SYSTEMS 579
Fig. 7 Binary melting phase diagram of NIF and mannitol (man) systems prepared byphysical mixing (PM) or co-melting (CM)
Fig. 8 FTIR spectra of pure NIF, mannitol (MAN), physical mixtures and co-melts(PM and CM, respectively) containing 10 and 50% w/w of NIF

the solid [7]. The melting points determined for NIF and mannitol in the liquid stateshow that the cohesive interactions in the former are stronger than those in the latter.
Conclusions
NIF–PEG 4000 and NIF–mannitol systems were investigated using DSC. The differ-ences observed between the melting behaviour of physically mixed and previouslyfused samples were greater in the case of PEG 4000. The melting phase diagram ofthermodynamically equilibrated NIF–PEG 4000 co-melts suggest eutectic behaviourwith the eutectic composition between 40 and 45% w/w of nifedipine. This conclu-sion was supported by results of optical and hot stage microscopy. NIF–mannitol sys-tems exhibited a monotectic relationship, as deduced from melting phase diagram.Although there are some interactions between NIF and mannitol and between NIFand PEG 4000 in the molten state, their mutual solubility after solidification is closeto zero. Therefore, after common melting, only solid suspensions can be expected inthe binary systems under investigation, exhibiting the crystalline nature of both ac-tive ingredient and auxiliary substance.
* * *
We are very grateful to Dr. Anamarija Zega for providing the FTIR apparatus and Dr. Marjan Belefrom National Institute of Chemistry Slovenia for X-ray diffraction measurements.We would alsolike to express our gratitude to the editors of this special issue, J. M. Rollinger and Cs. Novak, and tothe anonymous referees for useful comments.
References
1 W. L. Chiou and S. Riegelman, J. Pharm. Sci., 60 (1971) 1281.2 J. M. Ginés, M. J. Arias, J. R. Moyano and P. J. Sánchez-Soto, Int. J. Pharm., 143 (1996) 247.3 S. Verheyen, P. Augustijns, R. Kinget and G. Van den Mooter, Thermochim. Acta,
380 (2001) 153.4 S. L. Law, W. Y. Lo, F. M. Lin and C. H. Chaing, Int. J. Pharm., 84 (1992) 161.5 C. W. Lin and T. M. Cham, Int. J. Pharm., 127 (1996) 261.6 Á. Gombás, P. Szabó-Révész, G. Regdon Jr. and I. Er�s, J. Therm. Anal. Cal., 73 (2003) 615.7 J. L. Ford and P. Timmins, Pharmaceutical Thermal Analysis, Ellis Horwood Limited,
Chichester 1989, p. 51.8 Á. Gombás, P. Szabó-Révész, M. Kata, G. Regdon Jr. and I. Er�s, J. Therm. Anal. Cal.,
68 (2002) 503.9 D. Q. M. Craig and J. M. Newton, Int. J. Pharm., 74 (1991) 33.
10 J. M. Ginés, M. J. Arias, A. M. Rabasco, Cs. Novák, A. Ruiz-Conde and P. J. Sánchez-Soto,J. Thermal. Anal., 46 (1996) 291.
11 B. Keymolen, J. L. Ford, M. W. Powell and A. R. Rajabi-Siahboomi, Thermochim. Acta,397 (2003) 103.
12 A. Burger and K. T. Koller, Sci. Pharm., 64 (1996) 293.13 A. Burger, J. O. Henck, S. Hetz, J. M. Rollinger, A. A. Weissnicht and E. Stöttner,
J. Pharm. Sci., 89 (2000) 457.
J. Therm. Anal. Cal., 77, 2004
580 ZAJC, SR�I�: NIF–PEG 4000 AND NIF–MANNITOL SYSTEMS