Development of CdS nanorods of high aspect ratio under hydrothermal conditions with PEG template
107
1.1 INTRODUCTION ABOUT THE STUDY INTRODUCTION: CONSUMER PROMOTION DEFINITION Action intended to convince individuals to purchase a good or service. A typical business will only offer a consumer promotion like a reduced price, free sample or bonus offer for a short period in order to stimulate demand for and awareness of the product being promoted. MEANING: Consumer promotion is an ongoing challenge for all businesses. Whether just starting out or have been in business for years, the solutions that will help the business find new customers without spending a fortune. Promoting the business to potential customers gives the opportunity to increase your sales, gain a competitive advantage and enhance awareness about the range of products and/or services. SALES PROMOTION: There are number of different definitions focusing on various characteristics of sales promotion. This diversification as it will be shown later plays very important role in identifying objectives and models for promotions. 1. Sales promotion consists of a diverse collection of incentive tools, mostly short-term designed to stimulate 1
Transcript of Development of CdS nanorods of high aspect ratio under hydrothermal conditions with PEG template

1.1 INTRODUCTION ABOUT THE STUDY
INTRODUCTION:
CONSUMER PROMOTION
DEFINITION
Action intended to convince individuals to purchase a
good or service. A typical business will only offer a consumer
promotion like a reduced price, free sample or bonus offer for
a short period in order to stimulate demand for
and awareness of the product being promoted.
MEANING:
Consumer promotion is an ongoing challenge for all
businesses. Whether just starting out or have been in
business for years, the solutions that will help the business
find new customers without spending a fortune.
Promoting the business to potential customers gives the
opportunity to increase your sales, gain a competitive
advantage and enhance awareness about the range of products
and/or services.
SALES PROMOTION:
There are number of different definitions focusing on various
characteristics of sales promotion. This diversification as it
will be shown later plays very important role in identifying
objectives and models for promotions.
1. Sales promotion consists of a diverse collection of
incentive tools, mostly short-term designed to stimulate
1

quicker and/or greater purchase of a particular product
by consumers or the trade. (Kotler, 1988)
2. "Sales promotion is the direct inducement or incentive
to the sales force, the distributor or the consumer with
the primary objective of creating and immediate sale"
(Shultz, Robinson 1982)
3. "Sales promotion is the methods or techniques for
creating public acceptance of or interest in a product,
usually in addition to standard merchandising techniques,
such as advertising, and personal selling; generally
consisting of the offer of free samples, gifts made to
purchaser etc. (Random House Unabridged Dictionary 1983)
4. "Sales promotion represents those marketing efforts
that are supplementary in nature, are conducted for a
limited period of time and seek to induce buying "
(Davis, 1981)
b. Sales promotions are all marketing activities that
attempt to stimulate to quick buyer action or attempt to
promote immediate sales of product" (Shimp, 1993)
All those definitions are stressing different aspects of sales
promotions and all of them are correct ones. There are several
common characteristics that might be drown out of these
definitions. (Blattberg, Neslin 1990)
2

A) Sales promotions are action focused - the emphasis is
on consumer to make some action in a limited period of
time.
B) Sales promotions are marketing events - they all
happen within marketing strategy of the company/
organization. As early as in 1967 researchers were
concerned that interaction of the promotions with other
elements of marketing mix should not be ignored (Engel
1967). Because promotions include so many difference
tools and mechanisms there is an ongoing threat of
viewing sales promotional techniques in isolation from
other marketing mix elements.
C) Sales promotions are designed to have a direct impact
on behaviour. It is argued in the literature that while
advertising goes through the process of cognition and
then influences an action, promotion is believed to work
directly on behaviour.
CLASSIFICATION OF SALES PROMOTION:
The sales promotions consist of two types following on:
Consumer oriented sales promotion Business oriented sales promotion
3

Consumer oriented Sales promotion
Business oriented
Sales promotion
Retail Promotions
inducements offered by retailersto consumers Includes pricediscounts, retail coupons, doublecoupons, features, specialdisplay, etc.
Consumer PromotionsInducements offered bymanufacturers to wholesalersand retailers, or by includeoff-invoice discounts,merchandise allowances,promotional allowances, etc.
Trade Promotions
Inducements offered bymanufacturers to wholesalersand retailers, or by a includeoff-invoice discounts,merchandise allowances,promotional allowances, etc.
Industrial Promotions
Inducements offered by and toraw materials supplierscomponent parts manufacturers,and final producers ormanufacturers includes off-invoice discounts, merchandiseallowances, etc.
4

Business Promotions
Inducements offered bybusiness product suppliers toany other business ororganization a includes off-invoice discounts, merchandiseallowances, etc.
SALES PROMOTION AT CONSUMER’S LEVEL:
The various schemes of sales promotion at Consumer’s Level
may include.
1. Coupons (A Chit of Stated Value):-
These are given directly to the consumer these coupons
are in most cases kept inside the package. The consumers
many receive a price reduction of the stated values of the
coupon at the time of purchase. The retailer receives
reimbursement for the value of the coupon form the
manufacturer. Coupons act as a short run stimulus to the
sale of the product, since they are directly tied with the
purchase of the item. They encourage the retailer to stock
the product.
What is important is that a coupon offer does not spoil
the named price of the brand nor does it unpaired the margin
of the dealers. But it is not easy to measure the
effectiveness of a coupon offer. One over knows how many
customer would have bought the product without the
5

incentive. It is also difficult to find out how many
customers were held after the coupon offer expired.
2. Price-off-offer (Also known as bargain offer price
packs):-
This offer is intended to stimulate the sales during a
slump season. In this method the customer is offered a
reduction from the printed price list. It is also used when
a substitute for competing product enters the market.
Many experts on sales promotion fed that ‘Off Schemes’
are among the weaker and less desirable methods of
promotion. These can be trade resentment particularly when
the retailer raises the price to retain his margin. Secondly
that is not conductive to building up brand loyalty.
Consumers may simply shift to the products that offer this
scheme.
3. Samples:-
In the hope of converting a prospect into a customer a
sample (Some quantity of the product) may be given. This
helps the consumer to verify the real quality of the
product. Various pair manufacturing companies offer this
method. For developing brand loyalty this method is quite
useful. Sampling is a fast method of demand creation because
one knows the result as soon as the consumer has had time to
use the sample and buy the brand.
Disadvantage of Samples:-
6

Offering sample in quit expensive. There is the cost of
producing samples. The distribution costs are also high.
Samples have to be mailed to potential customers or to be
distributed through retail shops. There are also problems
when the real product does not resemble the sample supplied.
4. Money Refund Offer:-
An offer usually stated on the package is that
manufacturers will return with in a stated period part or
all of the purchaser’s money if he is not completely
satisfied with the product.
5. Trading Stamps:-
A premium in the form of stamps is given by the sellers
to consumers while selling goods. The number and value of
stamp that the buyer receives depends on the values of the
purchase. These stamps are redeemable through premium
catalogues at the stamp redemption centres.
6. Buy-Back Allowance:
This an allowance following a previous trade deal not
offer a certain amount of money for new purchases based on
the quantity of purchases on the first trade deal. It
extends the life of a trade deal and helps to prevent part
deal sales decline. It greatly strengthens the buyer’s
motivation to co-operate on the first deal.
7. Premium:-
7

There are various forms of premiums provided by the
manufacturer as sales promotional devices:-
(a) Coupons are supplied for effecting price reductions.
(b) Factory in pack premium these are popular in the case of
Body food and Tin food items, Spoons, Cups, Measuring, Glass
etc. and such other items are packed with the product in the
box itself. Factory in pack premium are particularly goods
for product meant for children. The Bianca Toothpaste packs
contain animal shape toys. These are very attractive and
quite popular among the children.
(c) Self Liquidating Premiums:-
The cost of the premium is collected from the buyer
himself. But when the buyers pay for it he has to pay only a
considerably low price for the premium. This is possible for
the manufacturer purchases the items in bulk at a premium
and his cost per unit as is substantially low.
8. Bonus packs.
Bonus packs are simply packages containing an extra amount
of the product but sold at the price of a regular sized
package. Bonus packs are most typically associated with
transaction building, but may serve brand building purposes as
well. For both strategies, bonus packs have their pros and
cons. For transaction building, consumers new to the brand may
appreciate the extra value a bonus pack provides. However, for
some product categories, consumers unfamiliar with a brand may
8

hesitate from purchasing a bonus pack because the extra
quantity represents a slightly larger purchase commitment to
an untried brand. For brand building, consumers loyal to a
particular brand may view the bonus pack like a small premium
a thank you for being good customers. However, the effect of
bonus packs on the value of a brand among brand loyal
consumers is not known.
9. Price off packs.
Some manufacturers offer price reductions by printing the
discount right on the package. Because it is a price based
promotion, it may have a larger impact on transaction building
than on brand building, though brand loyal customers will
certainly appreciate the savings.
Price off packs hold strong appeal for marketers because
of their simplicity. They require no coupon distribution, no
rebate offers, and even no advertising because the offer
itself is obvious and printed prominently on the package
itself.
The only major administrative tasks for price off packs
are arrangements with retailers to honour the lower price and
to reimburse retailers the difference between the discounted
price and the retailer’s regular price.
10. Sweepstakes and Contests.
Sweepstakes and contests are not synonymous. Sweepstakes
winners are determined strictly by random drawing while
9

contests require participants to perform some task or display
some talent in order to win.
Legal restrictions governing sweepstakes have left them
somewhat out of favour with promotion managers. Because
sweepstakes winners are determined by chance, they cannot be
limited to those who purchase the product. The sweepstakes
would actually be a lottery in which the product purchase
amounted to buying a ticket. Lotteries not sanctioned by a
government agency are illegal in most states. Marketers
promoting by means of sweepstakes must provide an easy
mechanism for non purchasers to enter and must note that no
purchase is necessary to enter in all material promoting the
sweepstakes.
Contests determine winners by their display of some
talent or participation in some competition. As such,
participation can be limited to those who purchase the
product. However, unlike sweepstakes which are simple to
administer, contests frequently require judging as well as the
development of rules and criteria for winning. Often
unforeseen circumstances arise that cast controversy on the
contest and by extension, its sponsor.
Promotion by either contest or sweepstakes generally
attempts to build transactions by generating excitement about
the brand. These activities serve to draw in new purchasers
but have little effect on brand loyal purchasers. They may
even participate in the contest or sweepstake, but their
purchase patterns change little as a result.
10
11. Loyalty Programs
Promotions that offer customers a reward, such as price
discounts and free products, for frequent purchasing or other
activity are called loyalty programs. These promotions have
been around for many years but grew rapidly in popularity when
introduced in the airline industry as part of frequent-flier
programs. Loyalty programs are also found in numerous other
industries, including grocery, pizza purchasing and online
book purchases
Where they may also be known as club card programs since
members often must use a verification card as evidence of
enrolment in the program.
Many loyalty programs have become ingrained as part of
the value offered by a marketer. That is, a retailer or
marketing organization may offer loyalty programs as general
business practice. Under this condition loyalty program does
not qualify as a sales promotion since it does not fit the
requirement of offering a short-term value (i.e., it is always
offered). However, even within a loyalty program that is part
of a general business practice, a sales promotion can be
offered such as special short-term offer that lowers the
number of points needed to acquire a free product.
12. Demonstrations and Personal Appearances
Many products benefit from customers being shown how
products are used through a demonstration. Whether the
demonstration is experienced in-person or via video form, such
11

as over the Internet, this promotional technique can produce
highly effective results. Unfortunately, demonstrations are
very expensive to produce. Costs involved in demonstrations
include paying for the expense of the demonstrator, which can
be high if the demonstrator is well-known (e.g., nationally
known chef), and also paying for the space where the
demonstration is given.
An in-person or personal appearance by someone of
interest to the target market, such as an author, sports
figure or celebrity, is another form of sales promotion
capable of generating customer traffic to a physical location.
However, as with demonstrations, personal appearance promotion
can be expensive since the marketer normally must pay a fee
for the person to appear.
OTHER STEPS BY MANUFACTURER FOR PROMOTING SALES:
1. Communicating Market News :-Often this service is
reciprocal the manufacturer may acquaint his dealer with the
fact relating to his production and prices while the dealer
may familiarize him in return with the information bearing
on charges in the consumer's demand, their like and dislike
complaints and criticism, substitutes etc.
2. Inviting to Sales Conference and Convention:-
12
The gestures of regard and respect pave the way for better
relation and co-operation.
3. Offering Reasonable Terms of Sale:-
Of all the forms of encouragement, the monetary incentive
evokes immediate response. Hence every producer must offer
the most responsible terms of sale such as longer periods of
credit and higher rates of descants.
4. Supplying suitable packages and useful things.
5. By taking the return back.
6. By furnishing them with sales literature and display
materials.
RETAIL PROMOTION:
1. Price cuts. A retail store putting products “on sale” is an
age old staple of retail promotions. Shopkeepers of old used
the basic laws of price and demand to move stubborn inventory
through their stores and into the hands of consumers by simply
lowering the price. Modern retailers use the same technique,
though their approach to the practice is much more scientific
and calculated. Not only do retailers attempt to forecast
demand of an item that’s put on sale, they attempt to predict
how that price change will affect sales of complimentary and
competing goods. Their goal is to vary the prices of sets of
products so as to produce maximum profits for their entire
inventory of goods. The mathematical models used for these
13

types of calculations can be quite sophisticated and
impressive. We will glimpse briefly at how these mathematical
models work later when we examine how to evaluate the success
of sales promotions. For now, we focus on the mechanics of
retail price cutting.
A. presenting the reduced price. According to Tellis
(1998), retailers rely on four basic approaches to presenting
price cuts to consumers, which vary on the basis of the
information retailers provide when giving the offer. First,
they may provide the regular and discounted prices together
and let the consumer calculate the actual discount. For
example, the retailer may present the discount on a television
by stating that the set The advantage to this approach is
that the regular price is provided, though the disadvantage is
that consumers must calculate the discount themselves.
Second, retailers may present the reduced price as the
dollar difference between the regular and discounted prices.
Similarly, third, retailers may present the discount as the
percentage difference between the regular and discounted
prices. When choosing between these two methods, research
suggests that consumer response favors the method that
suggests a larger numerical savings. This in turn may depend
on how expensive the item is to begin with. For example,
suppose a retailer reduces the price of an item from two
dollars to one dollar. For this relatively inexpensive item,
presenting the discount as “save fifty percent” or “save half”
would be more effective than “save a dollar.” On the other
hand, suppose the price of an item regularly marked for one-14

thousand dollars was reduced to nine hundred dollars. It would
probably be more effective to present the price reduction as
“save one hundred dollars” rather than save “ten percent.” of
course, these guidelines are just that: guidelines. Different
people from different perceptions of the same price
reductions.
Fourth, retailers can frame price reductions in terms of
how much more consumers can buy at the reduced amount relative
to the regular amount. For example, price reductions can be
presented as “buy three get one free,” “buy three for five
dollars,” or “get three for the price of two.” Research shows
that, of the four basic presentation methods for price
reductions, the fourth tends to elicit the strongest sales
response acres a variety of consumer product categories. Two
reasons may account for the effectiveness of this approach.
One may be simply that consumers perceive this method as being
suggestive of larger discounts. Two, and more importantly,
consumers frequently believe that the discount does not apply
unless they buy the total number stated in the offer.
B. price discounts and the law. The Federal Trade Commission
views all four of these methods as suitable ways of presenting
price discounts as long as none deceive consumers. In other
words, as long as the information is accurate and is honoured
by retailers, the does not consider any as inherently
deceptive.
Where retailers frequently run afoul of the law regards
what constitutes the “regular” price from which the discount
15

is calculated. Discount from a regular price when the product
in question is rarely or never sold at that regular price.
Discounts calculated from such unrealistic regular prices may
be seen as deceptive.
In response, retailers frequently base their discount
calculations on “manufacturer’s suggested retail price.” These
prices, arbitrarily published by manufacturers, tend to be
higher than average retail prices, which allow retailers to
claim discounts well below manufacturers suggested retail
price. Another tactic retailers use to give the appearance of
price reductions is to present the discount relative to some
arbitrary “reference price,” which may bear no relationship to
the item’s regular price.
2. Retail coupons. Retailers frequently issue their own
coupons to consumers, though they issue considerably less than
consumer products manufacturers. Indeed, little is known about
the general couponing habits of all but the largest national
retailers. This is because retailers are more numerous and
diverse than manufacturers. For example, retailers differ
widely in terms of their size, ranging from small single
outlet sole proprietorships to some of the world’s largest
corporations. Likewise, retailers are dispersed throughout all
of our country’s towns and cities. Such variation makes
systematic study of their overall promotional strategies
extremely difficult.
That said, we do know anecdotally about some ways retail
coupon promotion differs from couponing by manufacturers.
16

First, retailers are more likely than manufacturers to cross
promote merchandise. That is, retailers may offer a coupon
discount for one item if consumers purchase another usually
more popular item. Unlike manufacturers, who obviously can
only offer coupons on their own brands, retailers are free to
offer coupons on the multitude of brands that they carry. This
typically permits retailers greater flexibility in creating
coupon promotions. Second, retailers more frequently offer
blanket discounts by coupons. In other words, a retailer may
distribute a coupon offering “10% off any merchandise in the
store.” Clearly, manufacturers cannot make such blanket
offers. Third, retailers are more likely than manufacturers to
offer non price promotions by coupon. That is, relative to
manufacturers, retailers more frequently use coupons to offer
free merchandise or free services to their customers. Finally,
retailers routinely modify the dollar amounts offered by
manufacturers’ coupons. Indeed, retailers may do so with other
retailer coupons. That is, a retailer may decide to double or
even triple coupon face values. Indeed, the retailer can
target the offer to coupons for certain goods or from certain
manufacturers.
These advantages may lead you to wonder why retailers do
not coupon more often and manufacturers less often. Small
retailers, who really cannot afford to compete on price
against larger retailers, do not wish to sensitize their
customers to price, which regular couponing can do. Therefore,
refrain from price promoting for all but the most important of
occasions. Large retailers, on the other hand regularly
17

compete on price, which affords them little incentive to offer
coupons.
These retailers operate on razor thin margins every day.
Managing coupon deals on a large scale becomes more costly and
effortful than simply putting the item on sale for some period
of time. Therefore, as with smaller retailers, coupon
promotions at the retail level are generally reserved for
special occasions or unusual circumstances.
3. Retail displays. Promotion managers understand full well
that drawing attention to a promotion is the first essential
ingredient in its success. In retailing, where promotions rely
so heavily on the store’s physical environment, retail
displays provide a highly effective means of drawing consumer
attention to a promotional offer. Although attracting
attention remains the top and overriding purpose of retail
displays, attention itself is needed for a variety of more
specific purposes. Displays frequently give prominence to
price cuts, highlight many consumer promotional offers such as
premiums or bonus packs, introduce new products or services,
and permit sampling or inspection of new products.
Retailers can create their own retail displays or rely on
manufacturers to provide them with retail display materials.
Manufacturers are often eager to provide especially large
retailers with display materials in their efforts to help
retailers merchandise the manufacturers’ products. These
professionally prepared retail displays frequently boast
18
highly complex and elaborate designs with moving parts or
interactive features.
Retailers select the location for in-store retail
displays depending on the importance of the retail promotion,
the nature of the product being promoted, or the trade deals
being received from the manufacturer. Clearly, some retail
space is more desirable than others. As a general rule, the
more people that walk past a space, the more desirable that
space is for a retail display.
A. Front-of-store displays. Many retailers design into their
stores large open areas near the store entrances to hold large
retail displays. Because all customers entering the store pass
by these displays, the front of the store is the most valued
location for retail displays. Retailers offer this location to
manufacturers willing to provide valuable trade deals or other
merchandising assistance.
B. Endcap displays End caps are simply end of aisle shelving.
After the front of the store, endcaps are valued most as
retail display space. Depending on store layout, most shelving
aisles end into high traffic aisles or walkways that funnel
consumers to particular store departments or to cash
registers. Naturally, endcaps exist at both ends of a shelving
aisle. As a general rule, endcap displays nearest the cash
registers are more valued display space.
C. In-aisle displays. Retail displays may also be placed in
shelving aisles. Relative to the front of the store and
endcaps, in-aisle displays are less desirable locations. This
19

is because a given aisle will receive less traffic than other
store locations. Moreover, because of in-aisle space
limitations, these displays tend to be smaller and may draw
less consumer attention. To boost the attention given to in-
aisle displays, many use “shelf talkers,” which use a motion
sensor to trigger a brief recorded message. Thus, as shoppers
walk near the display, the shelf talker speaks to them,
drawing their attention. Such devices should be used sparingly
as they run the risk of annoying shoppers.
IMPORTANCE OF SALES PROMOTION:
First, as discussed in earlier notes, the growth of
retailer power in distribution channels has led to an
increase in consumer promotions. Sometimes, manufacturers
make special offers to consumers because a powerful
retailer insisted that they do so. Other times,
manufacturers make special offers to consumers as a way
of counteracting retailer power by strengthening the
bonds of loyalty consumers may feel toward the brand.
Either way, retailers frequently serve as the driving
force behind consumer promotions.
Second, the nature of competition has changed remarkably
over recent years resulting in ever greater consumer
price sensitivity. The proliferation of brands and brand
extensions, highly segmented consumer markets, and lower
brand loyalty have combined to make consumers much more
aware of price given that many product categories are
populated by several competitors.
20
Third, price deals have become the rule rather than the
exception for many products. Rebates on certain brands of
automobiles, department store sales, and coupons on many
grocery items are only a few areas where consumers have
grown to expect price breaks. Indeed, the expectation has
become so strong that, when possible, many consumers will
wait for promotional offers rather than buy with no deal.
Fourth, advertising clutter has forced marketers to find
new ways of getting consumer attention. Product benefits
alone frequently prove insufficient to prompt consumer
action much less get their attention. Thus, marketers
increasingly look to sales promotion to find ways of
breaking through to customers who face a constant
bombardment of promotional messages.
Finally, consumer promotion’s growth can also be
attributed to increased pressure on marketing management
for short-term results. Publicly traded companies find
themselves especially prone to this orientation. Many
investors look to immediate bottom-line results rather
than the long-term health or stability of the companies
in which they invest. Responding to this pressure,
marketing managers seek quick fixes for sagging bottom
lines. Sales promotions are often seen as ways to boost
near term sales. However, as their use becomes more
common, their costs become regular and recurring and
therefore potentially self-defeating.
FUNCTIONS OF SALES PROMOTION:
21

Production Differentiation
Use of sales promotion techniques helps to differentiate
one’s products from the of competitors. This is especially
beneficial is the product offered essentially the same
features and benefits as others on the market. A method often
used to make products stand out is to offer them at a slightly
reduced price for a short period of time.
Attract Customers
Sales promotions are used to attract customers during
periods of slow sales. For example, if the offer a seasonal
product such as barbecue grills, by running a promotion in the
middle of winter where the price is reduced may encourage
people to buy a grill at a time where it might not otherwise
cross their mind.
Increasing Market Share
Sales promotions can lead to an increase in market share for
the manufacturer. The promotion will likely increase the sales
by taking away sales from the competitors. As a result, the
market share will increase while the competitors' share
decreases.
New Product Introduction
Retailers can use sales promotions to introduce a new
product. By offering the new item at a reduced price and
placing a "new item" sign in front of it, they can persuade
customers to give the new product a try. At the same time they
can discontinue a slow-moving item in the same category by
22

marking it down and placing a "reduced for quick sale" sign in
front of it. This technique has the effect of keeping the
category fresh while freeing up needed shelf space
Inventory Control
Sales promotion can help retailers limit out-of-stock
situations by allowing them to purchase large quantities at a
reduced price. This can be especially advantageous to the
retailer for items that are popular sellers that can be
difficult to keep on the shelf.
METHODS OF SALES PROMOTION:
Percentage Sales Method :
Many companies set their promotion expenditures at a specified
percentage of sales. Accordingly the sale is set on the basis
of sales.
In this a specified sales percentage is decided for the
promotional budget Advantages of this method:
1. First, its use means that promotional budget vary with
what a company can afford.
2. Second, it encourages the management to think in terms of
the relationship among promotion costs, selling price,
and profit per unit,
3. Third, it encourages the competitive stability to the
extent that competing firms spend approximately the same
of their sales on promotion.
23

4. In spite of the advantages, the sales method has little
to justify it. Its reasoning is circular: It views sales
as the determiner of the promotion rather than as a
result. It leads to budget setting by availability of
funds rather than by marketing opportunities.
• Competitive Parity Method:
Some companies set their promotional budget to achieve
share-of-voice parity with other competitors. Two arguments
are made in support of competitive parity method.
One is that the competitor’s expenditure represents the
collective wisdom of the industry. The other is that
maintaining a competitive parity helps prevent promotional
wars.
Neither argument is valid. There are no grounds for
believing that competition knows better what should be spent
on promotion.
Objective and Task Method:
The objective & task method calls upon marketers to
develop their promotion budgets by defining their specific
objectives, determining the task that must be performed to
achieve these objectives, and estimating the cost of
performing these tasks.
Deciding on the promotion mix:
24

Companies face the task of distributing the total promotion
budget over the five promotional tools:
• Advertising
• Sales Promotion
• Public Relations and Publicity
• Sales Force
• Direct Marketing.
BENEFITS OF CONSUMER PROMOTION:
It is clear what the benefits of sales promotions are for
consumers and they know it. Demand for rewards and consumer
incentives have grown immeasurably in the last year and it’s
now what consumers expect wherever they shop. On the surface
it would appear that this is a one-sided relationship in which
consumers are holding businesses over a barrel.
Sales promotion shouldn’t and mostly isn’t something that
businesses are forced to resort to. Managed properly and
thought out thoroughly, sales promotion can be mutually
beneficial – particularly in the current economic climate.
Consumer retention
In the long-term a loyal customer is worth far more to a
business than an occasional high purchaser. When a customer is
recognised as loyal the emotional involvement with the brand
is increased. Showing recognition by offering consumer
25

incentives for loyalty stands to solidify the idea of staying
loyal to the brand. Loyalty can be rewarded in a number of
ways from offering a coupon at the checkout to point’s
collection cards.
Create positive brand associations
Working together with another brand creates a sense of
corporate validation and helps the brand to tap into new loyal
customer bases. Whatever trade in there is sure to be a
synergistic brand for the to work with, for example hotels and
theatres or gyms and sports clothing retailers. It can also
work well for pushing you brand’s image in a new direction by
moving away from the logical partnerships.
Increase brand recognition
Brand recognition is essential for enticing customers to
buy your product/service over another. The authority
recognition gives the brand offers consumer’s confidence in
the product/service, as they know what to expect. Increasing
brand recognition comes from offering the sales promotion to a
wider audience than the regular customer base. A good example
of this is featuring a consumer incentive or exclusive
discount in a loyalty and membership programme or discount
club. These programmes are usually a free marketing option,
managed by an external agency that has a large existing
customer base.
Reach new consumers
26

Sales promotion can be one of the most effective ways to
catch new customers’ eye. The best ways to offer a discount
or consumer incentive is through a loyalty and membership
programmes/ discount club or a chance to win a grand prize. By
doing this you are giving consumers a reason to stray away
from the brands they are usually loyal to. Competitions are an
instant way to catch people’s attention but loyalty and
membership programmes or discount clubs go out to an
established customer base and can sustain a lasting message.
These rewards are useful to any business and however want to
represent the brand there is a sales promotion answer for
business that can be effectively integrated to compliment any
marketing plan.
FACTORS THAT DETERMINE THE SALES PROMOTIONAL TOOLS USED:
Each of the above components of the sales promotional has
strengths and weaknesses. There are several factors that
should be taken into account in deciding which, and how much
of each tool to use in a promotional marketing campaign:
(1) Resource availability and the cost of sales promotional
Advertising (particularly on television and in the
national newspapers can be very expensive). The overall
resource budget for the promotional campaign will often
determine which tools the business can afford to use.
(2) Market size and concentration
27

If a market size is small and the number of potential
buyers is small, then personal selling may be the most cost-
effective promotional tool.
A good example of this would be businesses selling software
systems designed for supermarket retailers. On the other hand,
where markets are geographically disperse or, where there are
substantial numbers of potential customers, advertising is
usually the most effective.
(3) Customer information needs
Some potential customers need to be provided with
detailed, complex information to help them evaluate a purchase
(e.g. buyers of equipment for nuclear power stations, or
health service managers investing in the latest medical
technology). In this situation, personal selling is almost
always required - often using selling teams rather than just
one individual.
1.2 OBJECTIVES OF THE STUDY
Primary objectives:
28

To study on consumers’ promotion towards Sri Meenakshi
Motors (P) Ltd, Tirunelveli.
Secondary objectives:
To study on effectiveness of advertisement towards Sri
Meenakshi Motors (P) Ltd, Tirunelveli.
To identify the consumers’ opinion about new product
promotions in Sri Meenakshi Motors (P) Ltd, Tirunelveli.
To study about impact of promotion on consumers’
behaviour towards Sri Meenakshi Motors (P) Ltd,
Tirunelveli.
29

1.3 SCOPE OF THE STUDY
The study entitled, “A Study on consumers’ promotion
towards Sri Meenakshi Motors Pvt.Ltd., Tirunelveli” covers the
various promotional activities like exchange offer, free
trail, gift offered towards their consumers. This study
analyzes the effectiveness of advertisement of Sri Meenakshi
Motors (P) Ltd. It identifies and evaluates the consumers’
opinion towards new product promotion of Sri Meenakshi Motors.
This study helps to know the consumers’ expectation of
promotional offers from Sri Meenakshi Motors (P) Ltd,
Tirunelveli.
30

1.4 NEED OF THE STUDY
The organizations can use promotional tools as a weapon
in order to increase the sales and introducing new product in
the market for attracting more number of consumers and used to
compete with its rival environment. Hence this study is needed
for the organization. The purpose of this study to the
organization regarding the importance of consumers’ promotion.
31

1.5 LIMITATIONS OF THE STUDY
• The research study is applicable only to Sri Meenakshi Motors Pvt Ltd, Tirunelveli.
• The information given by the respondents may be biased.
32

1.6 REVIEW OF LITERATURE
Topic: Sales Promotions on Consumer Preferences
Author: Haresh B. Vaishnani
Publication year: 2002
Abstract
Behavioral research on sales promotions has tended to
focus on the demographics of deal-prone consumers (Bawa and
Shoemaker 1987; Blattberg et al. 1978; Narasimhan 1984) and on
33

the identification of personal traits such as coupon
proneness, value consciousness, or market mavenism (Feick and
Price 1987; Lichtenstein, Netemeyer, and Burton 1990 and 1995;
Mittal 1994). These studies offer a coherent portrait of the
demographic and psychographic characteristics of deal prone
consumers (for a review, see Blattberg and Neslin 1990, pp.
65-82).
However, because of their focus on individual variables, these
studies do not examine the nature, and the number, of the
specific consumer benefits of sales promotions. As a result,
most analytical and econometric models of sales promotions
simply assume that monetary savings are the only benefit
motivating consumers to respond to sales promotions (Blattberg
and Neslin 1993). Yet, some robust empirical results suggest
that monetary savings cannot fully explain why and how
consumers respond to sales promotions. For instance, why do
consumers respond more to on-shelf coupon than to a similarly
advertised temporary price reduction offering the same
monetary incentive (Dhar and Hoch 1996; Schindler 1992)? Why
do consumers respond to insignificant price reductions (Hoch,
Drèze, and Purk 1994; Inman, McAlister, and Hoyer 1990), and
why do consumers switch brands because of a coupon or a
rebate, but then do not redeem it (Bawa and Shoemaker 1989;
Dhar and Hoch 1996; Soman 1998).
Keywords: Coupons, Price discount, free gift, Trade offer,
Price sensitive.
34

2. Topic: The Effectiveness of advertising
Author: Elisabetta corvi
Publication year: 2007
Abstract
Advertising effectiveness can be defined as the extent to
which advertising generates a certain desired effect.
Measuring the effects of advertising is very important. Given
the amount of investment needed for advertising. While it is
not possible to obtain a global measure of the advertising
effectiveness, we should seek to develop and apply methods and
measures for a partial verification of results. Regarding the
difficulty of measuring the overall effectiveness, we believe
that it is due essentially to the following consideration.
Advertising interacts with other business variable
(behaviour, marketing policies, financial decision
etc...) and environment variable (competition, economic,
conjunction etc.)
The effects of advertising are varied and not always
translate into quantitative terms.
Advertising causes long term effects, therefore the
result occur in the same period in which are the cost.
35

Keywords: External factors, Attention, attitude behaviour,
Memory.
3. Topic: New product Launches and Consumer Insights-Application of Behavioural
Insights in the Marketplace
Author: S L Rao
Publication year: 2004
Abstract:In this launching new products and some insights into
consumer behavior that drove them or arose from them. Product
launches in those years were centred round manufacturing
capability. The consumer had limited choice. So did the
manufacturer who had limited options in features that he could
offer in the product. But most did consider what the consumer
wanted, her considerations in taking the purchase decision,
and ways in which it could be in favour of a particular
36

product. The consumer’s attitudes, habits and preferences were
relevant and were studied. Today of course this is much more
the case. Production capacities, packaging, pricing, use
instructions, distribution, advertising and promotion, should
usually have resulted from the understanding and
interpretation of these consumer attributes.
Many products succeeded despite the lack of such
preparatory studies because of the monopoly that was conferred
by production and import licensing and the copying of products
that had succeeded in overseas markets. In the illustrations
that I give, consciously and in a planned manner or
intuitively, consumer behaviour was at the core of all
decisions that had to do with the product. Over time, the
consumer’s concerns began to be integrated into all decisions
relating to new products, and marketing strategy became
business strategy. Many products and brands that dominated
consumer franchise for many years and others that were
successfully launched, have declined or disappeared now after
many years. The reasons have been varied: changing economic
situation; new consumer contexts, behaviours and preferences;
competing products offering better value choices to the
consumer; lack of nimbleness of the company in adapting to
changing markets; and inability to change product images and
product forms to meet new directions in consumer behaviour.
Keywords: Test marketing, Quantitative data, direct marketing,
samples,
37

4. Topic: Customers behavioural response to sales promotion
Author: Nelson oly Ndubisi
Publication year: 2007
Abstract
This research evaluates the impact of sales promotional
tools, namely coupon, price discount, free sample, bonus pack,
and in store display, on product trial and repurchases
behavior of consumers. In addition, the moderation role of
fear of losing face on the relationship between the sales
promotional tools and product trial was examined. The samples
points for the research were supermarket in Malaysia. A total
of 420 randomly selected customers were surveyed using
structured questionnaire, out of which 312 usable responses
were received. The results of data analysis show that price
discount, free samples, bonus packs, and in store display are
associated with product trial. Coupon does not have any
significant effect on product trial. Trail determines
repurchases behavior and also mediates in the relationship
between sales promotion and repurchase. Fear of losing face
significantly moderates the relationship between in store
display and product trail.
38

Keywords: coupons, Bonus pack, in store display, product
trail, repurchase.
5. Topic: “Impact of Sales Promotions on Sale of FMCG Products”
Author: Chetan Panara
Publication year: 2011
Abstract:
FMCG industry, alternatively called as Consumer packaged
goods industry primarily deals with the production,
distribution and marketing of consumer packaged goods. The
Fast Moving Consumer Goods (FMCG) is those consumables which
are normally consumed by the consumers at a regular interval.
Some of the prime activities of FMCG industry are selling,
marketing, financing, purchasing, etc. The industry also
39
engaged in operations, supply chain, production and general
management. FMCG Industry Economy FMCG industry provides a
wide range of consumables and accordingly the amount of money
circulated against FMCG products is also very high. The
competition among FMCG manufacturers is also growing and as a
result of this, investment in FMCG industry is also
increasing, specifically in India, where FMCG industry is
regarded as the fourth largest sector . FMCG Sector in India
is estimated to grow. FMCG industry is regarded as the largest
sector in New Zealand which accounts for of Gross Domestic
Product.Common FMCG products Some common FMCG product
categories include food and dairy products, glassware, paper
products, pharmaceuticals, consumer electronics, packaged food
products, plastic goods, printing and stationery, household
products, photography ,drinks etc. and some of the examples of
FMCG products are coffee, tea, dry cells, greeting cards,
gifts, detergents, tobacco and cigarettes, watches, soaps etc.
Market potentiality of FMCG industry Some of the merits of
FMCG industry, which made this industry as a potential one,
are low operational cost, strong distribution networks,
presence of renowned FMCG companies. Population growth is
another factor which is responsible behind the success of this
industry.
Keywords: None monetary. Monetary promotions, price
sensitivity,Swithover
40

6. Topic: Format Effects in Volume Discounts to Consumers
Author : Béatrice parguel
Publication year : 2008
Abstract
Using a classification of benefits and costs of
promotional offers (Raghubir et al., 2004) along three routes –
economic, informational and affective – this paper aims at
evaluating, from the consumer’s point of view, the relative
perceptual disadvantages of separate-item bundles compared to
pre-wrapped bundles. Retailers use sales promotions in a very
intensive manner to attract customers and increase their
sales. In particular, in the volume discount sales category,
bundling is a type of promotional offer in which obtaining a
free product or money discount is linked to the purchase of a
set number of product units (Guiltinan, 1987; Stremersch and
Tellis, 2002). Implementation costs for product bundles are
very high as they incur costs associated with product
identification (creation of an identification barcode),
product manufacturing (special packaging, specific shipping)
and product management (sales previsions on a per shop basis,
shelving, inventory management). Manufacturers mainly finance
these costs, which represent their second spending effort,
after production costs (Dreze and Bell, 2003). However, one
type of bundling may avoid most of these costs. Indeed,41

separate-item bundles, enabled by the use of sophisticated
cash registers by retailers, present the products separately,
and not in a pre-wrapped format as in the case of more classic
bundles.
Keywords: Bundle formats presentation, free product, money discount, campaigns
7. Topic: current issues sales promotion
Author: Henderson
Publication year: 2005
Abstract
Systematization of knowledge on sales promotion I believe
should start from systematizing the definitions of concept. There is
lack of conformity in methodology and hence in the definition of
what can be considered sales promotion. (Kotler 1983, Levy 1971,
Shimp 1993). The word "promotion" comes from a Latin word meaning
"to move forward". So, in this case any tool(s), method(s),
technique (s) that stimulates the growth of the sales can be
considered a part of sales promotion. Sales promotions are designed
42
to have a direct impact on behavior. It is argued in the literature
that while advertising goes through the process of cognition and
then influences an action, promotion is believed to work directly on
behaviour.
Also, sales promotion gives extrinsic reason to buy a product,
whereas advertising focuses to internal qualities or brand equity of
the product. A common assumption is that advertising, word-of-
mouthor the salesperson has infromed the consumer about the product,
while sales promotion gives them additional reasons to buy."Sales
promotion is an action-focused marketing event whose purpose is to
have a direct impact on the behavior of the firm's customers".
(Blattberg, Neslin 1990). One of the aspects that is not reflected
in this operational definition is the short-term effect of
promotion.
Keywords; Trade incentives, sweepstakes, in-store support,
trial of the product.
43

1.7 RESEARCH METHODOLOGY:
Research Design:
Research designs are concerned with turning the research
question into a testing project. The best design depends on
your research questions. Every design has its positive and
negative sides. The research design has been considered as a
"blueprint" for research, dealing with at least four problems:
what questions to study, what data are relevant, what data to
collect, and how to analyze the results.
Descriptive Research Design:
Descriptive research design is a scientific method which
involves observing and describing the behaviour of a subject
without influencing it in any way.
Data Collection Method:
Questionnaire was used for data collection.
A questionnaire is a research instrument consisting of a
series of questions and other prompts for the purpose of
gathering information from respondents. Although they are
often designed for statistical analysis of the responses, this
is not always the case. The questionnaire was invented by Sir
Francis Galton.
Sources of Data:
44

1. Primary data
2. Secondary data
Primary Data:
Primary research entails the use of immediate data in
determining the survival of the market. The popular ways to
collect primary data consist of surveys, interviews and focus
groups, which shows that direct relationship between potential
customers and the companies.
Secondary Data:
In secondary data, information relates to a past period.
Hence, it lacks acceptances and therefore, it has
unsatisfactory value. Primary data is more accommodating as it
shows latest information.
Secondary data is obtained from some other organization
than the one instantaneously interested with current research
project. Secondary data was collected and analyzed by the
organization to convene the requirements of various research
objectives.
45

Sampling Methods:
This study is using the Non-Probability Sampling method.
Non probability sampling does not meet this criterion and
should be used with caution. Non probability sampling
techniques cannot be used to infer from the sample to the
general population.
Sampling Techniques:
This study is using the Convenience Sampling technique.
Convenience members of the population are chosen based on
their relative ease of access. To sample friends, co-workers,
or shoppers at a single mall, are all examples of convenience
sampling.
Sampling Size:
This study is taken the sample size is 400.
Geographical Area:
The study was done in Tirunelveli city and data was
collected from the Tirunelveli town and palayankottai
Statistical Tools:
Percentage analysis.
Weighted average method.
46

Chi-square test.
Weighted average Ranking method
Percentage Analysis:
Percentage method refers to a specified kindwhich is used in making comparison between two or more
series of data. Percentages are based on descriptive
relationship. It compares relative items. Since the
percentage reduces everything to a common base and thereby
allow meaning comparison.
No of Respondents
Percentage = ________________________ X 100
Total no. of Respondents
Weighted Average Method:
The term weight stands for relative importance ofdifferent items. Weights have been assigned to various
ranks. The weights score is calculated by multiplying the
number of respondents in a cell with their relative weights
and the whole number is summed up to give the weights score
for that factor.
n ∑ i=1 value x weight ageWeighted average = Total no of respondents
47

Chi-square test
Chi- square test is a non- parametric method that can be used
to test whether and difference between observed values and
theoretical values.
Formula:
The Chi-Square test given by the formula,
d.f (Degrees of freedom) = (m-1)*(n-1)
m = no. of rows
n = no. of columns
Row total * column
total
Expected frequency (Ei) =
--------------------------------------
Grand
total n (Oi-Ei) 2
Calculated value of Chi square test = ∑---------------------
i=1 Ei
Where;
Oi= observed frequency
Ei= expected frequency
48

Weighted average Ranking Method:
Weighted average Ranking Method it means
an average that takes into account the proportional relevance
of each component, rather than treating each
component equally.
2.1 INDUSTRY PROFILE
Motorcycle:
A motorcycle (also called a motorbike, bike, motto or
cycle) is a two or three wheeled motor vehicle. Motorcycles
vary considerably depending on the task they are designed for,
such as long distance travel, navigating congested urban
traffic, cruising, sport and racing, or off-road conditions.
Motorcycles are one of the most affordable forms of
motorized transport in many parts of the world and, for most
of the world's population; they are also the most common type
of motor vehicle. There are around 200 million motorcycles
(including mopeds, motor scooters, motorized bicycles, and
other powered two and three-wheelers) in use worldwide, or
49

about 33 motorcycles per 1000 people. This compares to around
590 million cars, or about 91 per 1000 people.
Most of the motorcycles, 58%, are in the developing
countries of Asia – Southern and Eastern Asia, and the Asia
Pacific countries, excluding Japan – while 33% of the cars
(195 million) are concentrated in the United States and Japan.
In 2006, China had 54 million motorcycles in use and an annual
production of 22 million units. As of 2002, India, with an
estimated 37 million motorcycles/mopeds, was home to the
largest number of motorized two wheelers in the world. China
came a close second with 34 million motorcycles/mopeds.
History:
The first internal combustion, petroleum fueled
motorcycle was the Petroleum Reitwagen. It was designed and
built by the German inventors Gottlieb Daimler and Wilhelm
Maybes in Bad Constant, Germany in 1885. This vehicle was
unlike either the safety bicycles or the boneshaker bicycles
of the era in that it had zero degrees of steering axis angle
and no fork offset, and thus did not use the principles of
bicycle and motorcycle dynamics developed nearly 70 years
earlier. Instead, it relied on two outrigger wheels to remain
upright while turning.
50

The inventors called their invention the Reitwagen
("riding car"). It was designed as an expedient tested for
their new engine, rather than a true prototype vehicle.
If a two-wheeled vehicle with steam propulsion is
considered a motorcycle, then the first was the French
Michaux-Perreaux steam velocipede of 1868. This was followed
by the American Roper steam velocipede of 1869, built by
Sylvester H. Roper Roxbury, Massachusetts. Roper demonstrated
his machine at fairs and circuses in the eastern U.S. in 1867,
and built a total of 10 examples.
In 1894, Hildebrand & Wolfmüller became the first series
production motorcycle and the first to be called a motorcycle.
In the early period of motorcycle history, many producers
of bicycles adapted their designs to accommodate the new
internal combustion engine. As the engines became more
powerful and designs outgrew the bicycle origins, the number
of motorcycle producers increased. Many of the nineteenth
century inventors who worked on early motorcycles often moved
on to other inventions. Daimler and Roper, for example, both
went on to develop automobiles.
The motorcycle, built in 1884 by an Englishman named
Edward Butler, looked pretty silly. It had three wheels, not
two, and was really just a tricycle with a motor.
Nevertheless, people were afraid of Butler’s motorcycle so
afraid that they asked the government to pass laws against the
new machine. One law said that there must always be three
51

people on a motorcycle. Another said that a man with a red
flag must run ahead of the motorcycle, waving the flag and
yelling to warn people that a motorcycle was coming.
Until World War I, the largest motorcycle manufacturer in
the world was Indian, producing over 20,000 bikes per year. By
1920, this honor went to Harley-Davidson, with their
motorcycles being sold by dealers in 67 countries. By the late
1920s or early 1930s, DKW took over as the largest
manufacturer.
After World War II, the BSA Group became the largest
producer of motorcycles in the world, producing up to 75,000
bikes per year in the 1950s. The German company NSU held the
position of largest manufacturer from 1955 until the 1970s.
In the 1950s, streamlining began to play an increasing
part in the development of racing motorcycles and the "dustbin
fairing" held out the possibility of radical changes to
motorcycle design. NSU and Moto Gauzy were in the vanguard of
this development, both producing very radical designs well
ahead of their time NSU produced the most advanced design, but
after the deaths of four NSU riders in the 1954–1956 seasons,
they abandoned further development and quit Grand Prix
motorcycle racing. Moto Gauzy produced competitive race
machines, and by 1957 nearly all the Grand Prix races were
being won by streamlined machines.
52

The following year, 1958, full enclosure fairings were
banned from racing by the FIM in the light of the safety
concerns:
From the 1960s through the 1990s, small two-stroke
motorcycles were popular worldwide, partly as a result of East
German Walter Karen’s engine work in the 1950s.
Today, the motorcycle industry is mainly dominated by
Japanese companies such as Honda, Kawasaki, Suzuki, and
Yamaha, although Harley-Davidson and BMW continue to be
popular and supply considerable markets. Other major
manufacturers include Piaggio group of Italy, KTM, Triumph and
Ducati.
In addition to the large capacity motorcycles, there is a
large market in smaller capacity (less than 300 cc)
motorcycles, mostly concentrated in Asian and African
countries. An example is the 1958 Honda Super Cub, which went
on to become the biggest selling vehicle of all time, with its
60 millionth unit produced in April 2008. Today, this area is
dominated by mostly Indian companies with Hero Motorcar
emerging as the world's largest manufacturer of two wheelers.
Other major producers are Bajaj and TVS Motors. For example,
its Splendor model has sold more than 8.5 million to date.
Demographics:In numerous cultures, motorcycles are the primary means
of motorized transport. According to the Taiwanese government,
for example, "the number of automobiles per ten thousand
53
populations is around 2,500, and the number of motorcycles is
about 5,000.
In places such as Vietnam, motorized traffic consists of
mostly motorbikes due to a lack of public transport and low
income levels that put automobiles out of reach for many.
The four largest motorcycle markets in the world are all
in Asia: China, India, Indonesia, and Vietnam. The motorcycle
is also popular in Brazil's frontier towns. Amid the global
economic downturn of 2008, the motorcycle market grew by 6.5%.
Recent years have seen an increase in the popularity of
motorcycles elsewhere. In the USA, registrations increased by
51% between 2000 and 2005. This is mainly attributed to
increasing fuel prices and urban congestion. A Customer
Reports subscribers' survey of mainly United States motorcycle
and scooter owners reported that they rode an average of only
1,000 miles (1,600 km) per year, 82% for recreation and 38%
for commuting. Americans put 10,000–12,000 miles (16,000–
19,000 km) per year on their cars and light trucks.
As motorcyclists age, there is a tendency for riders to
choose touring bikes over sports bikes.
Uses:
While people choose to ride motorcycles for various
reasons, those reasons are increasingly practical, with riders
54

opting for a powered two-wheeler as a cost-efficient
alternative to infrequent and expensive public transport
systems, or as a means of avoiding or reducing the effects of
urban congestion. In places where it is permitted, lane
splitting, also known as filtering, allows motorcycles to use
the space between vehicles to move through stationary or slow
traffic.
Construction:
Motorcycle construction and Motorcycle design
Motorcycle construction is the engineering,
manufacturing, and assembly of components and systems for a
motorcycle which results in the performance, cost, and
aesthetics desired by the designer.
With some exceptions, construction of modern mass-
produced motorcycles has standardized on a steel or aluminum
frame, telescopic forks holding the front wheel, and disc
brakes. Some other body parts, designed for either aesthetic
or performance reasons may be added.
A petrol powered engine typically consisting of between
one and four cylinders (and less commonly, up to eight
cylinders) coupled to a manual five- or six-speed sequential
transmission drives the swing arm-mounted rear wheel by a
chain, driveshaft or belt.
55

Fuel economy:
Motorcycle fuel economy varies greatly with engine
displacement and riding styleranging from a low of 29 mpg-US
(8.1 L/100 km; 35 mpg-imp) reported by a Honda VTR1000F rider,
to 107 mpg-US (2.20 L/100 km; 129 mpg-imp) reported for the
Veracity Nitro 50 cc Scooter.
A specially designed Matzo Matsuzawa Honda XL125 achieved
470 mpg-US (0.50 L/100 km; 560 mpg-imp) "on real highways – in
real conditions. Due to low engine displacements (100 cc–200
cc), and high power-to-mass ratios, motorcycles offer good
fuel economy.
Under conditions of fuel scarcity like 1950s Britain and
modern developing nations, motorcycles claim large shares of
the vehicle market.
Electric motorcycles:
Very high fuel economy equivalents are often derived by
electric motorcycles. Electric motorcycles are nearly silent,
zero-emission electric motor-driven vehicles. Operating range
and top speed suffer because of limitations of battery
technology.
Fuel cells and petroleum-electric hybrids are also under
development to extend the range and improve performance of the
electric motors.
56

Dynamics:
Different types of motorcycles have different dynamics
and these play a role in how a motorcycle performs in given
conditions. For example, one with a longer wheelbase provides
the feeling of more stability by responding less to
disturbances. Motorcycle tires have a large influence over
handling.
Motorcycles must be leaned in order to make turns. This
lean is induced by the method known as counter steering, in
which the rider momentarily steers the handlebars in the
direction opposite of the desired turn. Because it is counter-
intuitive this practice is often very confusing to novices –
and even too many experienced motorcyclists.
Accessories:Motorcycle accessories
Various features and accessories may be attached to a
motorcycle either as OEM (factory-fitted) or after-market.
Such accessories are selected by the owner to enhance the
motorcycle's appearance, safety, performance, or comfort, and
may include anything from mobile electronics to sidecars and
trailers.
Safety:Motorcycle safety and Motorcycle safety clothing
57

Motorcycles have a higher rate of fatal accidents than
automobiles or trucks and buses. United States Department of
Transportation data for 2005 from the Fatality Analysis
Reporting System show that for passenger cars, 18.62 fatal
crashes occur per 100,000 registered vehicles. For motorcycles
this figure is higher at 75.19 per 100,000 registered vehicles
– four times higher than for cars.
The same data shows that 1.56 fatalities occur per 100
million vehicle miles travelled for passenger cars, whereas
for motorcycles the figure is 43.47–28 times higher than for
cars (37 times more deaths per mile travelled in 2007).
Types:
Types of motorcycles
There are three major types of motorcycle: street, off-
road, and dual purpose. Within these types, there are many
different sub-types of motorcycles for many different
purposes.
Street bikes include cruisers, sport bikes, scooters and
mopeds, and many other types. Off-road motorcycles include
many types designed for dirt-oriented racing classes such as
motocross and are not street legal in most areas.
Dual purpose machines like the dual-sport style are made
to go off-road but include features to make them legal and
comfortable on the street as well.
58

Each configuration offers either specialized advantage or
broad capability, and each design creates a different riding
posture.
Legal definitions and restrictions
Legal definition of motorcycle:
A motorcycle is broadly defined by law in most countries
for the purposes of registration, taxation and rider licensing
as a powered two-wheel motor vehicle. Most countries
distinguish between mopeds of 49 cc and the more powerful,
larger vehicles (scooters do not count as a separate
category). Many jurisdictions include some forms of three-
wheeled cars as motorcycles.
Environmental impact:
In 2007 and 2008, motorcycles and scooters, due to good
fuel efficiency, attracted interest in the United States from
environmentalists and those affected by increased fuel prices.
Group Americas supported this interest with the launch of a
"Vespanomics" website and platform, citing lower per-mile
carbon emissions of 0.4 lb/mile (113 g/km) less than the
average car, a 65% reduction, and better fuel economy. United
States Environmental Protection Agency 2007 certification
result reports for all vehicles versus on highway motorcycles
(which also includes scooters).
2.2 DEALER PROFILE
59

SRI MEENAKSHI MOTORS Pvt .Ltd., TIRUNELVELI
The every business is main vital role based on marketing
concepts. The products are some better condition in meet stiff
competition. Then product only consumer or services.
The motorcycle dealer only on consumer satisfaction
towards the service to successful run and wide range of
development on sales and service
They dealer in some introduction new vehicle and some
improvement on one year to another year.
Another main dealer concern on Sri Meenakshi Honda motors
to Tirunelveli. the employee on training program in service
vehicle and methods into learn only permitted on students some
years ago talents person mechanic mark level, so another
mechanic ship employee are permitted in the job on service
field.
Profile:
Sri Meenakshi Honda motors agency in Tirunelveli started on
October 31, 2004. Managing director is Mr.T.Dalton
Vision:
Honda motor will be responsive to customer requirements
consonant with its core competence and profitability. Honda
motor will provide total customer the right product, at the
right price, at the right time.
60

Mission:
We are committed to being a highly profitable, socially
responsible, and leading manufacturer of high value for money,
environmentally friendly, life time personal transportation
products under the Honda motors for customers to provide
fulfilment and prosperity for employees.
Department:
Sales
Service
accounts
HONDA MOTORCYCLE MODELS
Honda CBT twister
Honda CB unicorn
Honda Dream yuga
Honda CB shine
Honda Dio
Honda CBR 150
Honda CBR 250r
Honda Aviator
Honda Activa
Honda Stunner
61

3.1 DATA ANALYSIS AND INTERPRETATION
TABLE NO: 3.1
GENDER OF THE RESPONDENTS
S.NO GENDER NO.OF RESPONDENTS PERCENTAGE (%)
1 Male 271 67.75
2 Female 189 22.25
Total 400 100
(Source: primary data)
Inference
62

From the above table shows that, 67.5% of the respondentsare male and 22.5% of the respondents are female.
CHART NO: 3.1
GENDER OF THE RESPONDENTS
Male Female0
10
20
30
40
50
60
70
67.75
22.25
GENDER
PERCEN
TAGE
TABLE NO: 3.2
AGE OF THE RESPONDENTS
S.NO AGE NO.OF RESPONDENTS PERCENTAGE (%)
1 Below-25 years
198 49.5
2 25-35 111 27.5
3 35-45 74 18.5
4 Above-45 years
17 4.5
Total 400 100
63

(Source: primary data)
Inference
From the above table shows that 49.5% of the respondents
are below 25 years of age, 27.5% of the respondents are 25-35
years of age, 18.5% of the respondents are 35-45 years of age
and 4.5% of the respondents are above-45 years of age.
CHART NO: 3.2
AGE OF THE RESPONDENTS
Below 25 25-35 35-45 Above 450
10
20
30
40
50
60
49.5
27.518.5
4.5
AGE
PERCEN
TAGE
TABLE NO: 3.3
QUALIFICATION OF THE RESPONDENTS
S.NO QUALIFICATION NO.OF. RESPONDENTS PERCENTAGE (%)
1 School 109 27.752 DIP/IT 124 313 UG 111 27.754 PG 32 85 Illiterate 24 6
64

Total 400 100
(Source: primary data)
Inference
From the above table shows that 31% of the respondents
are Diploma holders and/IT Graduates, 27.75% of the
respondents are up to school level education, and under
graduate, 8% of the respondents are post graduate, and 6% of
the respondents are illiterate.
CHART NO: 3.3
QUALIFICATION OF THE RESPONDENTS
school Dip/IT UG PG illiterate
0
5
10
15
20
25
30
3527.75
3127.75
86
Education
Percen
tage
CHART NO: 3.4
OCCUPATION OF THE RESPONDENTS
65

S.NO OCCUPATION NO.OF RESPONDENTS PERCENTAGE (%)
1 Student 189 47.252 Professional 18 4.53 Business people 39 9.54 House wife 48 125 Government
Employee 41 10.25
6 Private Employee 55 13.75Total 400 100
(Source: primary data)
Inference
From the above table shows that 47.25%
of the respondents are students, 13.75% of the respondents are
private employee, 12 % of the respondents are house wife,
10.25 % of the respondents are government employee, 9.5 % of
the respondents are business people and remaining 4.5 % of
the respondents are professionals.
CHART NO:3.4
OCCUPATION OF THE RESPONDENTS
Student
Professional
Business people
House wife
Government employee
Private employee
0 5 10 15 20 25 30 35 40 45 50
47.25
4.5
9.5
12
10.25
13.75
PERCENTAGE
OCCUPA
TION
66

TABLE NO: 3.5
AWARENESS OF SRI MEENAKSHI MOTORS
S.NO PARTICULARS NO. OF RESPONDENTS PERCENTAGE (%)
1 Friends & relations 51 12.75
2 colleagues 116 293 Magazine 41 10.254 Newspaper 17 4.255 Banner 21 5.256 Pamphlets 118 29.57 Road show 36 9
Total 400 100
(Source: primary data)
Inference
From the above table shows that 29.5%
of the respondents said Pamphlets, 29% of the respondents
said colleagues, 12.75% of the respondents said
advertisement, 10.25% of the respondents said magazine, 9% of
the respondents said Road show, 5.25 % of the respondents said
banner, and 4.25% of the respondents said newspaper towards
the awareness of Sri Meenakshi Motors.
CHART NO: 3.5
AWARENESS OF SRI MEENAKSHI MOTORS
67

friends & relationsmagazine
bannerroadshow
0
5
10
15
20
25
30
12.75
29
10.25
4.25 5.25
29.25
9
AWARENESS OF SRI MEENAKSHI MOTORS
PERCEN
TAGE
TABLE NO.3.6
PURCHASED VEHICLE FROM SRI MEENAKSHI MOTORS ALREADY
S.NO PARTICULARS NO. OF RESPONDENTS PERCENTAGE (%)
1 Yes 219 54.75
2 No 181 45.25
Total 400 100
(Source: primary data)
Inference
From the above table shows that
54.75% of the respondents are purchased the vehicle already,
and 45.25% of the respondents are not purchased the vehicle
already.
68

CHART NO: 3.6
PURCHASED VEHICLE FROM SRI MEENAKSHI MOTORS ALREADY
yes no0
10
20
30
40
50
60
54.75 45.25
PURCHASING VEHICLE
PERCEN
TAGE
TABLE NO: 3.6 (A)
VEHICLES PURCHASED FROM SRI MEENAKSHI MOTORS ALREADY
S.NO PARTICULARS NO. OF RESPONDENTS PERCENTAGE (%)
1 CBT Twister 19 8.672 CB Unicorn 23 10.503 Dream yuga 38 17.354 CB Shine 50 22.835 Dio 30 13.696 CBR 150R 5 2.317 CBR250R 3 1.368 Aviator 16 7.319 Activa 24 10.9510 CBF Stunner 11 5.02
Total 219 100(Source: primary data)
Inference
69

From the above table shows that 22.83% of the
respondents said CB Shine, 17.35% of the respondents said Dream
yuga, 13.69% of the respondents said Dio, 10.95% of the respondents
said Activa, 10.50% of the respondents said CB Unicorn, 8.67 % of
the respondents said CBT Twister, 7.31% of the respondents said
Aviator, 5.02% of the respondents said CBF Stunner, 2.31% of the
respondents said CB 150R, and 1.36% of the respondents said CB 250R
Honda model bike purchased from Sri Meenakshi Motors.
CHART NO: 3.6 (A)
VEHICLES PURCHASED FROM SRI MEENAKSHI MOTORS ALREADY
CBT Tw
ister
CB Uni
corn
Dream
yuga
CB Shi
ne Dio
CBR 15
0R
CBR250
R
Aviato
r
Activa
CBF St
unner
0
5
10
15
20
25
8.67 10.5
17.35
22.83
13.69
2.31 1.36
7.3110.95
5.02
VEHICLES PURCHASED HONDA MODEL
PERCEN
TAGE
TABLE NO: 3.6 (B)
WEIGHTED AVERAGE RANKING METHOD
PROMOTIONS OFFERED IN PURCHASING VEHICLE
Particulars
Rank1
Rank2
Rank3
Rank4
Rank5
Rank6
Rank7
Rank8
Weighted mean
Rank
Gift 16 13 22 32 37 19 41 37 23.19 8Coupon 8 17 32 42 23 32 17 48 23.75 7
Free trial
19 40 31 29 17 18 32 31 27.22 5
70

Exchangeoffer
32 42 21 36 23 29 17 19 30.22 4
Loan 40 23 29 39 31 31 19 19 31.22 3
service 45 32 17 39 18 29 36 15 33.86 1Insurance
41 39 42 23 17 32 20 15 32.11 2
Money save benefit
13 17 30 21 39 41 23 35 24.11 6
(Source: Primary data)
Weightages
Rank 1 = 5 points
Rank 2 = 4 points
Rank 3 = 3 points
Rank 4 = 2 points
Rank 5 = 1 point
Formula
n Weighted average = ∑ i=1 (value x weightage) Total no of respondents
Inference:
From the above table shows that, most of the respondents
ranked promotional tools as first service followed by
71

Insurance, Loan , Exchange offer, Free trial, Money save
benefit, Coupon, Gift towards consumer promotional tools
respondents received.
72
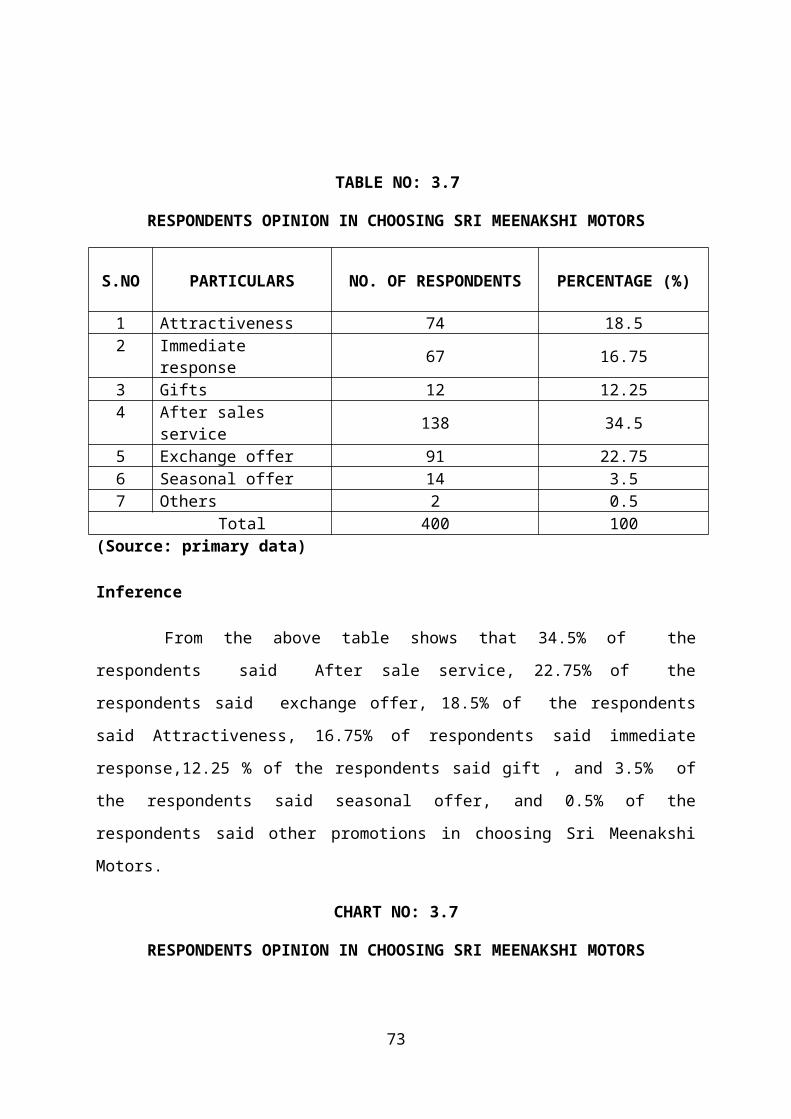
TABLE NO: 3.7
RESPONDENTS OPINION IN CHOOSING SRI MEENAKSHI MOTORS
S.NO PARTICULARS NO. OF RESPONDENTS PERCENTAGE (%)
1 Attractiveness 74 18.52 Immediate
response 67 16.75
3 Gifts 12 12.254 After sales
service 138 34.5
5 Exchange offer 91 22.756 Seasonal offer 14 3.57 Others 2 0.5
Total 400 100(Source: primary data)
Inference
From the above table shows that 34.5% of the
respondents said After sale service, 22.75% of the
respondents said exchange offer, 18.5% of the respondents
said Attractiveness, 16.75% of respondents said immediate
response,12.25 % of the respondents said gift , and 3.5% of
the respondents said seasonal offer, and 0.5% of the
respondents said other promotions in choosing Sri Meenakshi
Motors.
CHART NO: 3.7
RESPONDENTS OPINION IN CHOOSING SRI MEENAKSHI MOTORS
73

Attrac
tivene
ss
immedi
ate re
sponse gif
t
After
sale s
ervice
Exchan
ge off
er
season
al off
eroth
ers0510152025303540
18.5 16.75 12.25
34.522.75
3.5 0.5
Axis Title
Axis Title
TABLE NO: 3.8
EXPECTATIONS FROM SRI MEENAKSHI MOTORS FOR NEXT PURCHASE
S.NO PARTICULARS NO. OF RESPONDENTS PERCENTAGE (%)
1 Reduced price 55 13.752 Sweepstakes&
contest 107 26.75
3 Premium offer 104 264 Loyalty program 87 21.755 Rebates 45 11.256 others 2 0.5
Total 400 100 (Source: primary data)
Inference
From the above table shows that
26.75% of the respondents expected sweepstakes, 26% of the
respondents expected premium offer, 21.75% of the respondents
expected loyalty program, 13.75% of the respondents expected
74

Reduced price, 11.25% of the respondents expected rebates,
and 0.5% of the respondents expected others promotion.
CHART NO: 3.8
EXPECTATIONS FROM SRI MEENAKSHI MOTORS FOR NEXT PURCHASE
reduce
d pric
e
sweept
akes &
conte
st
premiu
m offe
r
loyalt
y prog
ram
rebate
s
others
05
1015202530
13.75
26.75 2621.75
11.25
0.5
RESPONDENTS EXPECTATION
PERCEN
TAGE
TABLE NO: 3.9
DIFFER FROM COMPETITORS FOR CONSUMER PROMOTION
S.NO PARTICULARS NO. OF RESPONDENTS PERCENTAGE (%)
1 After sale service 63 15.75
2 Quick response 122 30.53 Loan facility 69 17.254 Insurance 76 195 Speed delivery 70 17.756 Others - -
Total 400 100
75

(Source: primary data)
Inference
From the above table shows that 30.5%
of the respondents said quick response, 19% of the respondents
said Insurance, 17.75% of the respondents said speed
delivery.17.25% of the respondents said loan facility, and
15.75% of the respondents said after sales service.
CHART NO: 3.9
DIFFER FROM COMPETITORS FOR CONSUMER PROMOTION
after sale service loan facility
speed delivery
0
5
10
15
20
25
30
35
15.75
30.5
17.25 1917.75
0
DIFFER FROM COMPETITORS
percen
tage
TABLE NO: 3.10
WEIGHTED AVERAGE METHODRESPONDENTS OPINION TOWARDS PERFORMANCE OF SRI MEENAKSHI
MOTORS
PARTICULARS HS S NS DS HDS Weighted
AverageSeasonal offer
55 217 115 2 11 3.75
New product 43 158 192 5 2 3.62
76

offerService 22 112 77 6 2 1.75Advertisement 55 217 107 17 4 3.87(Source: Primary date)
Weightages:
HS = Highly satisfied = 5
Points
S = Satisfied = 4
Points
NS = Neutrally satisfied = 3
Points
DS = Dissatisfied = 2
Points
HDS = Highly dissatisfied = 1
Point
Formula
n ∑
i=1 (value x weightage) Weighted average = Total no of respondents
Weighted average mean = Weighted average value
Total number of attributes
Weighted average mean value = 12.99
4
77

Weighted average mean value = 3.25 = 3
Interpretation:From the above analysis, it is inferred that most of the
respondents are neutrally satisfied with the Advertisement as
the performance of Sri Meenakshi Motors ltd.
78

TABLE NO: 3.11
RESPONDENTS PREFERING TOOL TO PURCHASE VEHICLE
S.NO PARTICULARS NO. OF RESPONDENTS PERCENTAGE (%)
1 Price sensitive 52 132 Money save benefit 80 203 Service 211 52.754 Loan 57 14.25
Total 400 100(Source: primary data)
Inference
From the above table shows that 52.75% of
the respondents said service, 20% of the respondents said
money save benefit, 14.75 % of the respondents said loan
facility, and 13% of the respondents said price sensitive as
preferring tool to purchase the vehicle.
CHART NO: 3.11
79

RESPONDENTS PREFERING TOOL TO PURCHASE VEHICLE
price senstitive
money benefit service loan0
10
20
30
40
50
60
1320
52.75
14.75
RESPONDENTS PREFERENCE
PERCEN
TAGE
TABLE NO: 3.12
WEIGHTED AVERAGE RANKING METHOD
RESPONDENTS OPINION TOWARDS CONSUMER PROMOTIONAL TOOLS
Particulars
Rank1
Rank2
Rank3
Rank4
Rank5
Rank6
Rank7
Rank8
Weighted mean
Rank
Gift 15 50 32 39 43 144 55 22 44.31 8Price sensitive
67 63 55 18 37 108 27 44 50.97 6
Money save benefit
40 50 45 35 42 118 100 20 48.63 7
Exchangeoffer
32 90 55 86 82 15 30 10 57.69 3
Loan & insurance
89 41 136 45 38 16 20 15 63.75 1
service 122 68 32 30 35 58 39 16 61.16 2coupons 36 45 48 51 78 75 32 35 52.27 5Free trail
13 57 72 82 117 17 30 12 53.77 4
80

(Source: Primary data)
Weightages
Rank 1 = 5 points
Rank 2 = 4 points
Rank 3 = 3 points
Rank 4 = 2 points
Rank 5 = 1 point
Formula
n ∑ i=1 (value x weightage)Weighted average = Total no of respondents
Inference:
From the above table shows that, most of the respondents
ranked promotional tools as first Loan & insurance followed by
service, Exchange offer, free trial, Coupon, price sensitive,
Money save benefit, Gift among the respondents opinion about
the various consumer promotional tools.
81

TABLE NO: 3.13
RESPONDENTS OPINION TOWARDS MEDIA OF ADVERTISEMENT
S.NO PARTICULARS NO. OF RESPONDENTS PERCENTAGE (%)
82

1 Campaign 30 7.52 Pamphlets 131 32.753 Banner 53 13.254 Bus panel 64 165 Teaser 122 30.5
Total 400 100 (Source: primary data)
Inference
From the above table shows that 32.75% of
the respondents said pamphlets, 30.5% of the respondents said
teaser, 16 % of the respondents said bus panel, 13.25 % of the
respondents said Banner, and 7.5% of the respondents said
campaign towards the media of advertisement
CHART NO: 3.13
RESPONDENTS OPINION TOWARDS MEDIA OF ADVERTISEMENT
campagin pamphlets banner bus panel teaser
0
5
10
15
20
25
30
35
7.5
32.75
13.75 16
30.5
MEDIA OF ADVERTISEMENT
percen
tage
TABLE NO: 3.14
83

RESPONDENTS OPINION TOWARDS THE ATTRACTIVENESS OFADVERTISEMENT
S.NO PARTICULARS NO. OF RESPONDENTS PERCENTAGE (%)
1 Strongly Agree 142 35.52 Agree 228 573 Neutral 30 7.54 Disagree - -5 Strongly Disagree - -
Total 100 100 (Source: primary data)
Inference
From the above table shows that 57% of the
respondents are agreed, 35.5% of respondents are strongly
agreed and, 7.5 % of the respondents are neutrally agreed
towards the attractiveness of advertisement to purchase
vehicle.
CHART NO: 3.14
RESPONDENTS OPINION TOWARDS THE ATTRACTIVENESS OFADVERTISEMENT
84

strongly agree agree neutral disagree strongly
disagree
0
10
20
30
40
50
60
35.5
57
7.5
0 0
ATTRACTIVENESS OF ADVERTISEMENT
PERCEN
TAGE
TABLE NO: 3.15
RATING THE ATTRACTIVENESS OF ADVERTISEMENT
S.NO PARTICULARS NO. OF RESPONDENTS PERCENTAGE (%)
1 Very attractive 77 19.252 Less attractive 297 74.253 Not all
attractive 26 6.5
Total 400 100
(Source: primary data)
Inference
From the above table shows that 74.25%
of the respondents said less attractive, 19.25% of the
respondents said very attractive and, 6.5 % of the respondents
85

said not at all attractive towards the advertisement of Sri
Meenakshi motors.
CHART NO: 3.15
RATING THE ATTRACTIVENESS OF ADVERTISEMENT
Very attractive
Less attractive
Not all attractive
0 10 20 30 40 50 60 70 80
19.25
74.25
6.5
PERCENTAGE
ATTRAC
TIVENESS
OF ADVE
RTISEM
ENT
TABLE NO: 3.16
RESPONDENTS SATISFACTION LEVEL OF ADVERTISEMENT
S.NO PARTICULARS NO. OF RESPONDENTS PERCENTAGE (%)
1 Highly Satisfied 57 14.25
2 Satisfied 262 65.53 Neutral 62 15.54 Dissatisfied 13 3.255 Highly
Dissatisfied 6 1.5
Total 400 100
86
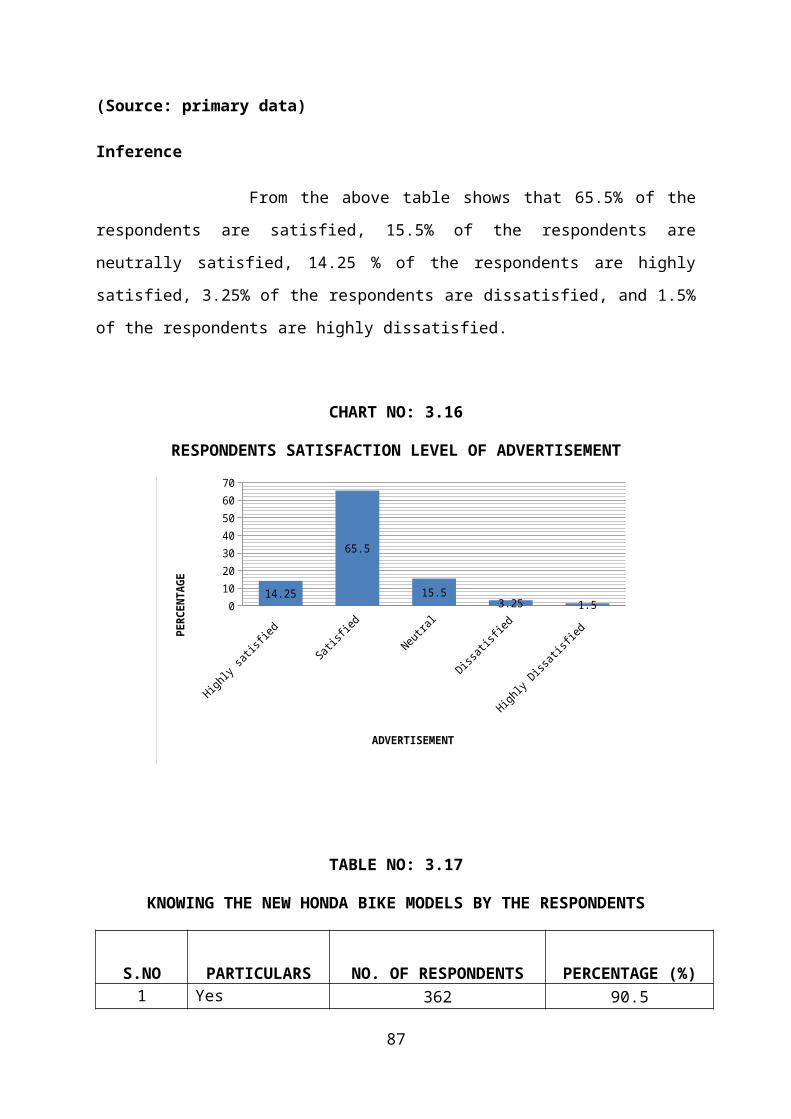
(Source: primary data)
Inference
From the above table shows that 65.5% of the
respondents are satisfied, 15.5% of the respondents are
neutrally satisfied, 14.25 % of the respondents are highly
satisfied, 3.25% of the respondents are dissatisfied, and 1.5%
of the respondents are highly dissatisfied.
CHART NO: 3.16
RESPONDENTS SATISFACTION LEVEL OF ADVERTISEMENT
Highly
satis
fied
Satisf
ied
Neutra
l
Dissat
isfied
Highly
Dissa
tisfie
d 010203040506070
14.25
65.5
15.53.25 1.5
ADVERTISEMENT
PERCEN
TAGE
TABLE NO: 3.17
KNOWING THE NEW HONDA BIKE MODELS BY THE RESPONDENTS
S.NO PARTICULARS NO. OF RESPONDENTS PERCENTAGE (%)1 Yes 362 90.5
87

2 No 38 9.5Total 400 100
(Source: primary data)
Inference
From the above table shows that 90.5% of the
respondents know new Honda bike model and 9.5% of the
respondents don’t know new Honda bike models.
CHART NO: 3.17
KNOWING THE NEW HONDA BIKE MODELS BY THE RESPONDENTS
Yes
No
0 10 20 30 40 50 60 70 80 90 100
90.5
9.5
PERCENTAGE
NEW HO
NDA BIKE
MODEL
TABLE NO: 3.17 (A)
88

RESPONDENTS AWARE OF NEW HONDA BIKE MODEL
S.NO PARTICULARS NO. OF RESPONDENTS PERCENTAGE (%)1 Dream Yuga 241 66.572 HET Scooters 121 33.43
Total 362 100
(Source: primary data)
Inference
From the above table shows that 66.57% of
the respondents said new bike model Dream Yuga, and 33.43% of
the respondents said new bike model HET Scooters.
CHART NO: 3.17(A)
RESPONDENTS AWARE OF NEW HONDA BIKE MODEL
Dream yuga HET Scooters0
10
20
30
40
50
60
70
66.57
33.43
AWARE OF NEW HONDA BIKE MODEL
PERCEN
TAGE
89
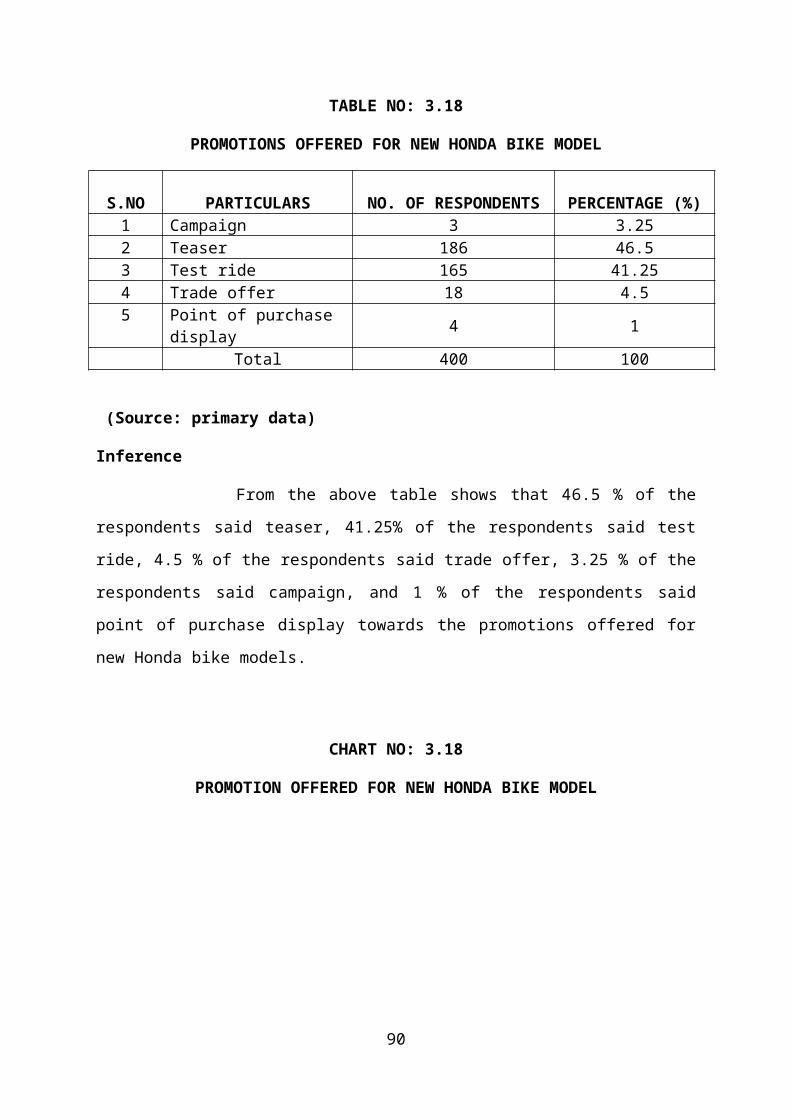
TABLE NO: 3.18
PROMOTIONS OFFERED FOR NEW HONDA BIKE MODEL
S.NO PARTICULARS NO. OF RESPONDENTS PERCENTAGE (%)1 Campaign 3 3.252 Teaser 186 46.53 Test ride 165 41.254 Trade offer 18 4.55 Point of purchase
display 4 1
Total 400 100
(Source: primary data)
Inference
From the above table shows that 46.5 % of the
respondents said teaser, 41.25% of the respondents said test
ride, 4.5 % of the respondents said trade offer, 3.25 % of the
respondents said campaign, and 1 % of the respondents said
point of purchase display towards the promotions offered for
new Honda bike models.
CHART NO: 3.18
PROMOTION OFFERED FOR NEW HONDA BIKE MODEL
90

campaign teaser test ride trade offer point of
purchase
05
101520253035404550
3.25
46.541.25
181
PROMOTION FOR NEW BIKE MODEL
PERENT
AGE
TABLE NO: 3.19
WEIGHTED AVERAGE RANKING METHOD
RESPONDENTS OPINION TOWARDS NEW PRODUCT PROMOTIONS
S.
No Particulars
Rank
1
Rank
2
Rank
3
Rank
4
Rank
5
Average Rank
1 Campaign 79 70 68 66 79 72.67 3
2 Teaser 112 102 88 32 28 88.26 1
3 Test ride 101 122 165 41 33 86.86 2
4 Trade offer 32 28 75 93 134 54.96 5
5 Point of
purchase38 40 66 130
88 59.73 4
91

(Source: Primary data)
Weightages
Rank 1 = 5 points
Rank 2 = 4 points
Rank 3 = 3 points
Rank 4 = 2 points
Rank 5 = 1 point
Formula
n ∑ i=1 (value x weightage)Weighted average = Total no of respondents
Inference:
From the above table shows that, most of the respondents
ranked promotional tools as first Teaser, followed by Test
ride, Campaign, point of purchase, Trade offer among the
respondents opinion about new product promotional tools.
.
92

TABLE NO: 3.22
RESPONDENTS OPINION IN RECOMMENDING OTHERS TO BUY THE VEHICLEIN SRI MEENAKSHI MOTORS Pvt .Ltd.
S.NO PARTICULARS NO. OF RESPONDENTS PERCENTAGE (%)1 Yes 332 832 No 68 17
93

Total 400 100
(Source: primary data)
Inference
From the above table shows that 83 % of the
respondents said that they recommend others to buy and 17 % of
the respondents said that they won’t recommend others to buy
vehicle in Sri Meenakshi Honda Motors Pvt Ltd.
CHART NO: 3.22
RESPONDENTS OPINION IN RECOMMENDING OTHERS TO BUY THE VEHICLEIN SRI MEENAKSHI MOTORS Pvt .Ltd.
Yes No0
10
20
30
40
50
60
70
80
90
83
17
RECOMMEND OTHERS TO BUY THE VEHICLE
PERCEN
TAGE
TABLE NO: 3.22 (A)
RESPONDENTS REASONS IN RECOMMENDING OTHERS TO BUY THE VEHICLEIN SRI MEENAKSHI MOTORS Pvt .Ltd.
94

S.NO PARTICULARS NO. OF RESPONDENTS PERCENTAGE (%)
1 Seasonal offer 52 132 New product offer 70 22.53 Service 221 55.754 Exchange offer 57 14.25
Total 400 100(Source: primary data)
Inference
From the above table shows that 55.75% of
the respondents said service, 22% of the respondents said New
product offer, 14.75 % of the respondents said Exchange offer,
and 13% of the respondents said seasonal offer as the reasons
in recommending others to buy the vehicle in Sri Meenakshi
Motors Pvt Ltd.
CHART NO: 3.22 (A)
RESPONDENTS REASONS IN RECOMMENDING OTHERS TO BUY THE VEHICLEIN SRI MEENAKSHI MOTORS Pvt .Ltd
seasonal offer
New product offer
Service
Exchange offer
0 10 20 30 40 50 60
13
22.5
55.75
14.25
PERCENTAGE
REASON
S IN RE
COMMENED
ING OT
HERS
95

TABLE.NO.3.23
RESPONDENTS OPINION IN SWITCH OVER OF SRI MEENAKSHI MOTORSPvt .Ltd
S.NO PARTICULARS NO. OF RESPONDENTS PERCENTAGE (%)1 Yes 42 10.52 No 358 89.5
Total 400 100
(Source: primary data)
Inference
From the above table shows that 89.5% of the
respondents said that they won’t Switch over, and 10.5% of the
respondents said that they switch over the Sri Meenakshi
Motors Pvt Ltd.
CHART NO : 3.23
RESPONDENTS OPINION IN SWITCH OVER OF SRI MEENAKSHI MOTORSPvt .Ltd.
Yes No0102030405060708090
10.5
89.5
RESPONDENTS OPINION IN SWITCH OVER OF SRI MEENAKSHI MOTORS
PERCEN
TAGE
96

TABLE NO: 3.23 (A)
RESPONDENTS REASON FOR SWITCH OVER OF SRI MEENAKSHI MOTORS Pvt.Ltd.
S.NO PARTICULARS NO. OF RESPONDENTS PERCENTAGE (%)
1 Low response 12 28.572 Poor quality of
service 10 23.80
3 Lack of festival offers 13 30.95
4 Lack of variety ofbike colour model 7 16.66
Total 42 100(Source: primary data)
Inference
From the above table shows that 30.95% of
the respondents said Lack of festival offers, 28.57% of the
respondents said Low response, 23.80 % of the respondents said
Poor quality of service, and 16.67% of the respondents said
Lack of variety of bike colour model as the reason for switch
over of Sri Meenakshi Motors Pvt Ltd.
CHART NO: 3.23 (A)
RESPONDENTS REASON FOR SWITCH OVER OF SRI MEENAKSHI MOTORS Pvt.Ltd.
97

Low response
Poor quality of service
Lack of festival offers
Lack of variety of bike colour model
0 5 10 15 20 25 30 35
28.57
23.8
30.95
16.66
PERCENTAGE
RESP
ONDENTS
REASON FOR
SWITC
H OVER
TABLE NO: 3.21
THE RELATIONSHIP BETWEEN SATISFACTION LEVEL ON PROMOTIONALOFFERS AND ITS STIMULATING LEVEL ON PURCHASING VEHICLE
Satisfaction Level on promotional offer
s Stimulating Purchasingvehicle
HighlySatisfied
Satisfied
NeutrallySatisfied
Dissatisfied
Highly Dissatisfied
Total
Very high 25 20 10 31 24 110
High 12 35 20 11 12 90
Moderate 12 25 15 12 12 76
Low 11 13 13 11 10 58
Very low 23 18 11 7 7 52
98
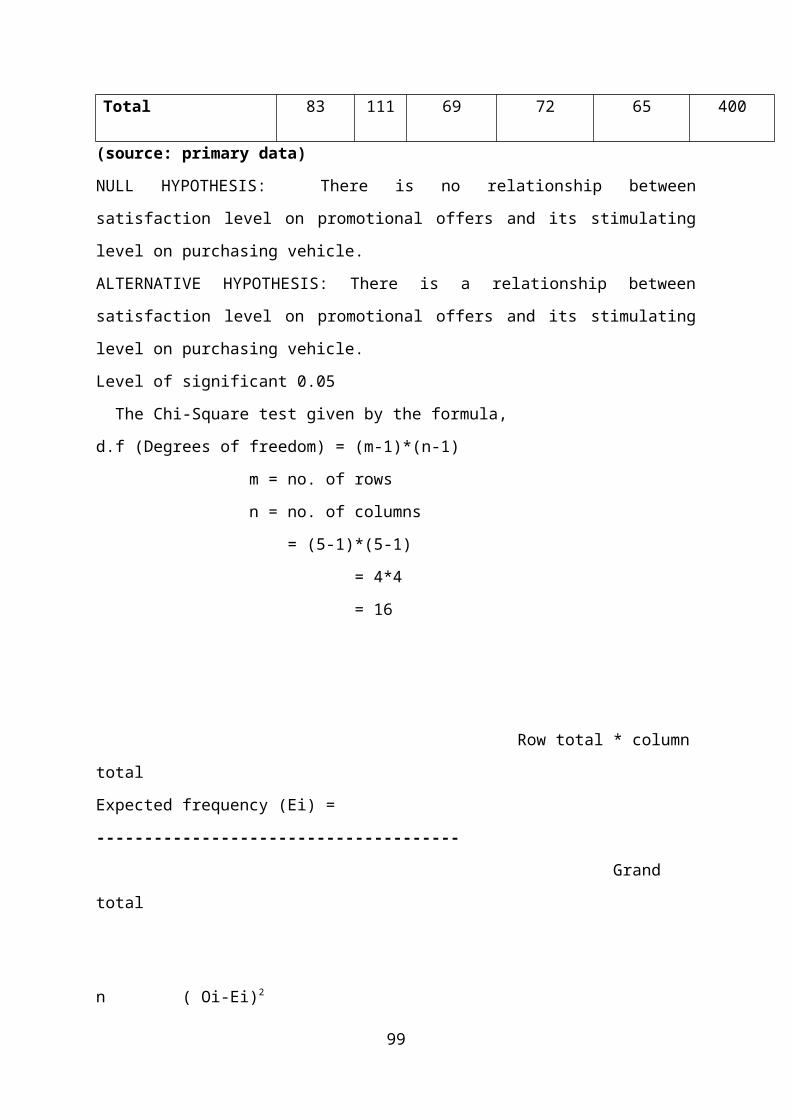
Total 83 111 69 72 65 400
(source: primary data)
NULL HYPOTHESIS: There is no relationship between
satisfaction level on promotional offers and its stimulating
level on purchasing vehicle.
ALTERNATIVE HYPOTHESIS: There is a relationship between
satisfaction level on promotional offers and its stimulating
level on purchasing vehicle.
Level of significant 0.05
The Chi-Square test given by the formula,
d.f (Degrees of freedom) = (m-1)*(n-1)
m = no. of rows
n = no. of columns
= (5-1)*(5-1)
= 4*4
= 16
Row total * column
total
Expected frequency (Ei) =
--------------------------------------
Grand
total
n ( Oi-Ei)2
99

Calculated value of Chi square test = ∑
---------------------
i=1 Ei
Where;
Oi= observed frequency
Ei= expected frequency
Calculated value =47.63
Table value = 34.43
Since the calcaluated value is higher than tabulated
value, alternative hypothesis is accepted.
Inference :
There is a relationship between the satisfaction
level on promotional offers and its stimulating level on
purchasing vehicle.
100

4.1 FINDINGS
67.5% of the respondents are male.
49.5% of the respondents are in the age group of
below 25 years.
31% of the respondents are Dip/IT Graduates.
27.75% of the respondents are up to the school level
of education.
47.25% of the respondents are students.
29.5% of the respondents said pamphlets in aware of
Sri Meenakshi Honda Motors Pvt Ltd.
54.75% of the respondents are purchased the vehicle
already in Sri meenakshi motors.
22.83% of the respondents purchased HONDA CB Shine
from Sri Meenakshi Honda Motors Pvt Ltd.
Service -31% of the respondents said service as the
promotion offered while purchasing vehicle.
34.5% of the respondents said after sale service as
the reason for choosing Sri Meenakshi Honda Motors
Pvt Ltd.
26.75% of the respondents expected sweepstakes as
benefit for next purchase.
30.5% of the respondents said quick response as the
differ of Sri Meenakshi Honda Motors Pvt Ltd from
its competitors.
101

Most of the respondents are neutrally satisfied with
the Advertisement as the performance of Sri
Meenakshi Honda Motors Pvt Ltd.
52.75% of the respondents said service as preferred
tool in purchasing vehicle.
Among the various consumer promotional tools, the
loan & Insurance holds the rank first, next to loan&
Insurance, service holds the second rank.
32.75% of the respondents said Pamphlets as the
media of Advertisement; 30.5% of the respondents
said teaser as the media of Advertisement.
57% of the respondents are agreed towards
attractiveness of advertisement.
74.25% of the respondents said advertisement is less
attractive.
65.5% of the respondents are satisfied towards
advertisement of Sri Meenakshi Honda Motors Pvt Ltd.
90.5% of the respondents know the new Honda bike
models of Sri Meenakshi Honda Motors Pvt Ltd.
66.57% of the respondents know about Dream Yuga.
46.5% of the respondents said teaser as the new
product promotion of Sri Meenakshi Honda Motors Pvt
Ltd.
Among the various new product promotional tools,
Teaser holds the rank first, next to Teaser; Test
ride holds the second rank.
102

83 % of the respondents recommend others to buy the
vehicle in Sri Meenakshi Honda Motors Pvt Ltd.
55.75% of the respondents said service as the reason
to recommend others in order to buy the vehicle in
Sri Meenakshi Honda Motors Pvt Ltd.
89.5% of the respondents said that they won’t switch
over Sri Meenakshi Honda Motors Pvt Ltd.
30.95% of the respondents said Lack of festival
offers as the reason for switch over of Sri
Meenakshi Honda Motors Pvt Ltd.
There is a relationship between the satisfaction
level on promotional offers and its stimulating
level on purchasing vehicle.
103

4.2 SUGGESTIONS
The organization can implement advertisement strategy
which is attractive and known to all consumers by the
methods like television advertisement and radio
announcement.
Benefits like sweepstakes, premium offer and loyalty
programme, are expected by the respondents. So the
organization can add these benefits in addition with its
promotional tools.
The organization can implement innovative new product
promotion tools like providing novelties, conducting
presentations about vehicle.
The organization may announce the festival offers in
order to retain existing customers and to attract the new
consumers.
104

5.1 CONCLUSION
Consumer Promotion is like promoting the business to
potential customers which gives an opportunity to increase the
sales, gain a competitive advantages and enhancing awareness
about the range of products or services of an organization.
From this study it is clear that most of the consumers are
satisfied with offers like seasonal offers, new product offer
and service rendered by the organization. If the organization
follows the researchers suggestions like implementing festival
offers and providing promotions like sweepstakes and contest,
loyalty programme, the customers could be retained and can
reach new consumers.
105

BIBLIOGRAPHY
REFERENCE BOOK
Philip Kotler and Kevin Lane, Marketing Management, (PHI
Learning / Pearson
Education 13th Edition, 2008)
Donald R. Cooper and Pamela S. Schindler, Business
Research methods ,(9th
Edition, Tata Mc Graw Hill, 2006)
106

Wells, Moriarty & Burnett, Advertising, Principles &
Practice, (Pearson Education
7th Edition, 2007)
WEBSITES:
http://smallbusiness.chron.com/consumer-sales-promotion-
techniques-1035.html
http://en.wikipedia.org/sales promotion
http://managementhelp.org/marketing/advertising/
methods.htm#anchor4293953708
www.marketingteacher.com/lesson-advertisement/lesson-
salespromotion.html
107