Master Thesis Designing Squares with Climate An ...
192
Master’s degree programme in Territorial, Urban, Environmental and Landscape Planning Curriculum: Planning for the Global Urban Agenda Master Thesis Designing Squares with Climate An Assessment of Transit-Oriented Development (TOD) projects, United States Supervisor Prof. Maurizio Tiepolo Candidate Giovanni Foresto Academic Year 2019/2020
-
Upload
khangminh22 -
Category
Documents
-
view
3 -
download
0
Transcript of Master Thesis Designing Squares with Climate An ...

Master’s degree programme in
Territorial, Urban, Environmental and Landscape
Planning
Curriculum: Planning for the Global Urban Agenda
Master Thesis
Designing Squares with Climate
An Assessment of Transit-Oriented Development
(TOD) projects, United States
Supervisor
Prof. Maurizio Tiepolo
Candidate
Giovanni Foresto
Academic Year 2019/2020

This page is intentionally left blank

i
Abstract
Transit-Oriented Development is a planning pattern based on a transit station that includes
high density and mixed-use environments that favor cycle and pedestrian pathways. The
Transit-Oriented Development primary goal is to mitigate climate change by reducing
private mobility and increasing public transports. This thesis’s purpose is to discover whether
and how the new public squares created within the Transit-Oriented Development provide
mitigation and adaptation measures to face climate change. The thesis starts arguing the
negative and unsustainable sprawl pattern that characterizes the United States suburbs and
the related car-dependency, making the automobile usage one of the principal contributors
to greenhouse gas emissions. It is within this context that the Transit-Oriented Development
pattern represents a sustainable and alternative development to sprawl. The square created
in front of the stations becomes the center of the development, which considers pedestrians
in the first place. In the case studies analyzed, different climate needs and impacts emerge
according to the Transit-Oriented Development geographical location. Although mitigation
measures are sufficiently provided in each case study, allowing walkable pathways that link
the public square and the station with the surrounding neighborhood, adaptation measures
only partially take place, making the Transit-Oriented Development’s public squares more
inclined to create pedestrian-friendly environments, rather than climate adaptable. The
research leads to understanding the gap between these two climate measures through
identifying differences of scales, besides the objectives. In fact, having the Transit-Oriented
Development pattern a regional approach, it is oriented to achieve mitigation measures,
rather than adaptation, which requires a more detailed Urban Design process to be
completely flexible according to the different climate change impacts.

ii
This page is intentionally left blank

iii
Dedication
a Lando, Ricki, Mamma e Papà
alla Banda e a Lukino
alla mia Raposa
ai miei amici e compagni di Università

iv
This page is intentionally left blank

v
Acknowledgments
I thank the Professor M. Tiepolo,
for his support and invaluable advices

vi
This page is intentionally left blank

vii
List of Acronyms and Abbreviations
BART Bay Area Rapid Transit
CC Climate Change
CNU Congress of the New Urbanism
CLUHI Canopy Layer Urban Heat Island
CO2 Carbon dioxide
EPA Environmental Protection Agency
EH Extreme Heat
EHE Extreme Heat Event
ET evapotranspiration
FEMA Federal Emergency Management Agency
FTA Federal Transit Administration
GHG Greenhouse Gases
H/W height to width ratio
IDA International Dark-Sky Association
IPCC Intergovernmental Panel on Climate Change
KAB Keep America Beautiful
KCC Köppen Climate classification
KTC Köppen-Trewartha classification
LED Light Emitting Diode
MDGs Millennium Development Goals
NCDC National Climatic Data Center
NDMC National Drought Mitigation Center
NOAA National Oceanic and Atmospheric Administration
NRDC Natural Resources Defense Council
NSC National Safety Council
NUA New Urban Agenda
PPS Project for Public Spaces
SDGs Sustainable Development Goals
SUHI Surface Urban Heat Island
TCRP Transit Cooperative Research Program
TND Traditional Neighborhood Development
TOD Transit-Oriented Development
UCSUSA Union of Concerned Scientists United States of America
UNFCCC United Nations Framework Convention on Climate Change
UHI Urban Heat Island
ULI Urban Land Institute
UN United Nations
UNFCCC United Nations Framework Convention on Climate Change
US United States (of America)
WRI World Resource Institute

viii
This page is intentionally left blank

ix
List of Figures and Tables
Chapter 1
Figure 1.1 – U.S. GHG emissions by Economic Sector (1990-2017)
Source: U.S. EPA's Inventory of U.S. Greenhouse Gases Emissions and Sinks: 1990-2017
(https://cfpub.epa.gov/ghgdata/inventoryexplorer/#allsectors/allgas/econsect/all)
Figure 1.2 – U.S. GHG emissions by GAS (1990-2017)
Source: U.S. EPA's Inventory of U.S. Greenhouse Gases Emissions and Sinks: 1990-2017
(https://cfpub.epa.gov/ghgdata/inventoryexplorer/#allsectors/allgas/gas/all)
Figure 1.3 - Typical suburban sprawl pattern in Herriman, Utah
Credit: © Michael Tuszynski
Source: Unspalsh (https://unsplash.com/photos/2osRMlJLdbU)
Figure 1.4 – Urban Heat Island (UHI) sketch
Source: Cool Parramatta (http://coolparramatta.com.au/about_us)
Figure 1.5 - Different reflected solar radiation depending on the surface’s albedo
Source: Author’s elaboration
Figure 1.6 – Comparison between mitigation and adaptation scale benefits
Source: Author's elaboration based on: (Wilbanks, Leiby, Perlack, Ensminger, & Wright, 2007)
Chapter 2
Figure 2.1 - Aerial view of SeaSide neighborhood
Source: DPZ & Co. website (https://www.dpz.com/Projects/7903#)
Figure 2.2 - Neighborhood Unit according to Perry's first Regional Plan of New York in 1929
Source: (Leccese & McCormick, 1999, p. 76)
Figure 2.3 - Dunay Plater-Zyberk’s diagram of an Urban Neighborhood
Source: (Leccese & McCormick, 1999, p. 76)
Figure 2.4 - Changes from Perry's Neighborhood Unit (1927) to Dunay Plater-Zyberk's TND (1997)
Source: (Duany, Plater-Zyberk, & Co., The Lexicon of New Urbanism, 2003, p. 3.1)
Figure 2.5 - The Urban to Rural Transect
Source: (Duany, Plater-Zyberk, & Co., The Lexicon of New Urbanism, 2003, p. 1.4)
Figure 2.6 - The Transit-Oriented Development (TOD) scheme according to Peter Calthorpe
Source: (Calthorpe, The Next American Metropolis: Ecology, Community and the American Dream, 1993, p.
56)
Figure 2.7 - Aerial view of Fruitvale Village TOD project in Oakland, California
Source: Metropolitan Research Center, University of Utah (http://mrc.cap.utah.edu/trip-and-parking-
generation-at-transit-oriented-developments-phases-i-ii/)
Figure 2.8 - TND pattern according to Duany Plater-Zyberk & Co.
Source: (Duany, Plater-Zyberk, & Co., The Lexicon of New Urbanism, 2003, p. 3.2)
Figure 2.9 - TOD pattern according to Duany Plater-Zyberk & Co.
Source: (Duany, Plater-Zyberk, & Co., The Lexicon of New Urbanism, 2003, p. 3.2)
Table 2.1 - The UHI causes and effects
Source: Author's re-elaboration based on “Table 2.1 Urban and suburban characteristics important to heat
island formation and their effect on the energy balance of the Earth’s surface” (Gartland, Heat Islands:
Understanding and Mitigating Heat in Urban Areas, 2008, p. 16).
Chapter 3
Figure 3.1 - Léon Krier's 1983 diagram on the city knitting together public and private buildings
Source: CNU Public Square (Steuteville, 2017)
Figure 3.2 - Urban Design Principles and Mitigation measures
Source: Author’s elaboration
Figure 3.3 - Urban Design Principles and Adaptation measures
Source: Author’s elaboration
Figure 3.4 - Commuting cost comparison between walking, biking, bussing and driving
Source: (Speck, 2018, p. 3)

x
Figure 3.5 - Ideal New Urbanist square
Source: (Duany, Sorlien, & Wright, The SmartCode, 2003, p. 41) e:
Figure 3.6 - Ideal New Urbanist plaza
Source: (Duany, Sorlien, & Wright, The SmartCode, 2003, p. 41)
Figure 3.7 - Comparison between homogenous and mixed building
Source: Author's elaboration
Figure 3.8 - Comparison between low and high block interconnectivity
Source: Author's elaboration
Figure 3.9 - The "plinths"
Source: (Karssenberg & Laven, 2016, p. 15)
Figure 3.10 - Active edge connecting the building and the public space in Gent, Belgium
Credit: © Joris Visser
Source: Unsplash (https://unsplash.com/photos/CecCDfKJtzk)
Figure 3.11 - Methods to incorporate parking to buildings
Source: Author's elaboration
Figure 3.12 - Height to Width ratio (H/W) in urban public spaces
Source: (Duany, Plater-Zyberk, & Co., The Lexicon of New Urbanism, 2003, p. 7.2)
Figure 3.13 - Spatial relation between H/W ratio and sense of enclosure
Source: Author's elaboration
Figure 3.14 - Explicit and formal benches
Credit: © Viktor Talashuk
Source: Unsplash (https://unsplash.com/photos/kZESeBsuwt4)
Figure 3.15 - Implicit and informal sitting places in Bologna, IT
Credit: © Maria Bobrova
Source: Unsplash (https://unsplash.com/photos/EdpbTj3Br-Y)
Figure 3.16 – Compared example of acceptable and unacceptable luminaries
Source: International Dark-Sky Association (https://www.darksky.org/our-work/lighting/lighting-for-
citizens/lighting-basics/)
Figure 3.17 - Water element attracting children in London, UK
Credit: © Robert Tudor
Source: Unsplash (https://unsplash.com/photos/V5ZKl33OQvE)
Figure 3.18 - Food trucks next to informal sitting places in Pionner Square, Portland, OR
Credit: © Sean Benesh
Source: Unsplash (https://unsplash.com/photos/87IuthTDnmQ)
Figure 3.19 - The Cloud Gate sculpture made by the British Indian artist Anish Kapoor in Chicago, IL
Credit: © Ravi Patel
Source: Unsplash (https://unsplash.com/photos/2B5aWwADOn4)
Table 3.1 - Sustainable design principles by spatial scale
Source: Author’s re-elaboration based on: (Carmona, Sustainable Urban Design: Definitions and Delivery,
2009)
Chapter 4
Figure 4.1 - Layers of interaction between the UHI effect and the built environment
Source: Author's elaboration
Figure 4.2 - Direct green façade
Credit: © Alexey Shikov
Source: Unsplash (https://unsplash.com/photos/qarKz3qU5NA)
Figure 4.3 - Living wall in Madrid, Spain
Credit: © B. Alter
Source: TreeHugger (https://www.treehugger.com/natural-sciences/madrids-green-wall-is-flourishing-as-is-the-
caixa-forum.html)
Figure 4.4 - Buildings and pavements solar exposure according to different H/W ratios and orientations
Source: (Hotkevica, 2013, p. 61)
Figure 4.5 a), b), c) - Wind flows behaviors according to different H/W ratios
Source: (Oke, Mills, Christen, & Voogt, 2017, p. 88)

xi
Table 4.1 – Types of cool pavements according to solar reflectance and application
Source: Author’s re-elaboration based on data taken from: “Heat Island: Understanding and Mitigating Heat
in Urban Areas” (Gartland, 2008, p. 92-99)
Table 4.2 - Flood adaptation measures to flooding and examples
Source: Author’s re-elaboration based on: (Silva & Costa, Flood Adaptation Measures Applicable in the
Design of Urban Public Spaces: Proposal for a Conceptual Framework, 2016, p. 7-9)
Chapter 5
Figure 5.1 – KTC in the U.S.
Credit: Adam Peterson (22 September 2016)
Source: Wikipedia
(https://en.wikipedia.org/wiki/Trewartha_climate_classification#/media/File:US_trewartha.svg)
Figure 5.2 - Map of Extreme Heat days by US county
Source: (National Resource Defense Council, s.d.)
Figure 5.3 - Map displays the number of weeks counties that have experienced D3 drought or greater
Credit: © Becky Bolinger
Source: (Bolinger, 2019)
Figure 5.4 - Map displays the number of weeks counties that have experienced D4 drought
Credit: © Becky Bolinger
Source: (Bolinger, 2019)
Wilshire Vermont (Los Angeles, California)
Figure 5.5
Source: Urban Land (https://urbanland.uli.org/development-business/remaking-greater-los-angeles-transit-
oriented-region/)
Figure 5.6,5.8
Source: Realtor (https://www.realtor.com/realestateandhomes-detail/3183-Wilshire-Blvd_Los-
Angeles_CA_90010_M21833-75972)
Figure 5.7
Source: AHBE (http://www.ahbe.com/portfolio/wilshire-vermont-station)
Figure 5.9
Source: Yelp (https://www.yelp.com/biz/wilshire-vermont-red-and-purple-line-station-los-angeles?start=20)
Figure 5.10
Source: Trulia (https://www.trulia.com/c/ca/los-angeles/wilshire-vermont-3183-wilshire-blvd-los-angeles-ca-
90010--2077203061)
Fruitvale Village (Oakland, California)
Figure 5.11, 5.10, 5.13
Source: PGAdesign (https://pgadesign.com/projects/fruitvale-transit-village/)
Figure 5.14
Source: Hiveminer (https://hiveminer.com/Tags/architecture%2Cfruitvale)
Figure 5.15
Source: Author’s production from Google Earth
Orenco Station (Hillsobro, Oregon)
Figure 5.16
Credit: © Buhacoff
Source: Flickr (https://www.flickr.com/photos/16709507@N02/26629045313/in/photolist-Gz7PqV-4tc7QJ-
51oP8U-7QEtT-5zDt9u-i9stN2-5zzbpp-4aXo4G-nzZrgp-Nz1k2Z-2cfMqaj-Qcnmbs-F1EKB-Bsdrm-Bijs8p-9TjfJs-
9Tjfhy-9Tgxd4-4t84LP-7JFnCf-9Tgt7v-kkaV3x-7JBrL4-7JBrGc-7JBrKr-7JFnJU-7JBrNp-7JFnJ7-7JBrCe-7JBrzM-
7JBrDZ-7JFnQb-7JBrSV-9Tgs5z-9TgxM8-9Tjg29-9TjfqE-31ivzk-9Tgx86-9TgrWV-AfvhUS-9Tgsdc-9TjmRh-
9Tgy3D-9Tgrgx-pm3uUD-9TjcN1-9Tjmbo-9TgsjX-9Tjkjy)
Figure 5.17, 5.18
Source: Author’s production from Google Earth
Figure 5.19
Source: Congress for the New Urbanism (https://www.cnu.org/publicsquare/2018/05/02/connected-and-
walkable-suburb)
Figure 5.20
Credit: © S. Morgan, 2016
Source:(https://commons.wikimedia.org/wiki/File:Orenco_Station_Plaza_and_Rowlock_Apartments_(2016).jp
g)
https://urbanland.uli.org/development-business/remaking-greater-los-angeles-transit-oriented-region/

xii
Figure 5.21
Credit: © M.O. Stevens
Source: (https://commons.wikimedia.org/wiki/File:Orenco_Station_Plaza_Oak_tree_-_Hillsboro,_Oregon.jpg)
CityPlace (West Palm Beach, Florida)
Figure 5.22
Source: Casa Grandview (https://casagrandview.com/blog/tag/entertainment)
Figure 5.23
Source: West Palm Beach (WPB) Magazine (https://www.wpbmagazine.com/the-plaza-in-cityplace-west-palm-
beach/)
Figure 5.24
Source: The Dish (https://thedish.blog.palmbeachdailynews.com/tag/taste-of-cityplace/)
Figure 5.25
Source: Author’s production from Google Earth
Figure 5.26
Source: Mommy Nearest (https://www.mommynearest.com/edition/south-florida/article/15-best-things-to-do-
in-west-palm-beach-with-kids)
Figure 5.27
Source: Waterfront Properties and Club Communities (https://www.waterfront-properties.com/blog/cityplace-
getting-a-new-name.html)
Market Common (Arlington, Virginia)
Figure 5.28, 5.30
Source: Antunovich Associates (https://www.antunovich.com/projects/mixed-use/the-market-common-
clarendon)
Figure 5.29
Credit: © Bozzuto Group
Source: Flickr (https://www.flickr.com/photos/bozzuto/4686327754/)
Figure 5.31, 5.32
Source: Jacobs/Ryan Associates (http://www.jacobsryan.com/New%20Pages%202013/513%20-
%20Urban%20Design%20People%20Places%20-%20Market%20Common%20Clarendon.html)
Rockville Town Center (Rockville, Maryland)
Figure 5.33
Credit: © Dan Reed (27 September 2013)
Source: Flickr (https://www.flickr.com/photos/thecourtyard/11667046585/in/photolist-iLYEtB-dqLbGg-
5bA3M5-8HgvMm-5bvKaD-5bA3FA-5bA3vd-5bvKLD-5bvKEB-5bvKtx-5bA34Y-5bvKiD-6yQimo-9CLWnb-
arAvB3-dqLm3y-9CLWQy-QeEPnZ-5bA371-5bvKqT-5bA3Ab-9CJ23g-5bvK8g-5bvKm2-9CLX3C-5bvKgt-
9CJ1TB-5bA3oY-roHVkt-5bvKyM-5bvKoD-6UyaEL-feuW8R-8HgvK7-2hhfAqE-2fDoE7-5tsw5J-cwpv1b-dqLbRc-
2gxuiu-fEharD-dqLkWU-UzGuU3-fEhasX-dN1Kt5-MTuPZ-4VSQrh-5WnX5a-2hhfAS6-5tsvim)
Figure 5.34
Credit: © Simmons B. Buntin
Source: (Buntin, 2011)
Figure 5.35
Credit: © Dan Reed (26 May 2007)
Source: Flickr (https://www.flickr.com/photos/thecourtyard/519250042/in/photolist-MThWW-dG3fav-
63P9DT-dG8Fgb-dG3gBF-dG3fmH-dG8Etw-B4atc-dG8F3w-dG3g2D-dG3gc4-dG3g6p-dG3fxi-dG8Fnj-
dG3fMB-dG8EA7-dG8EYw-dG8FCd-dG8Epb-dG8EQq-dG8FJE-dG3gtB-dG3fhT-otuc7c-7Jd4rb-9CLWLd-
dG3f7X-dG8F6m-dG3gyF-MTsQc-5bvKSD-dG3f2X-r7gSDD-2hNuRM-dG8F89-2hheCmE-iLYEtB-dqLbGg-
5bA3M5-8HgvMm-5bvKaD-5bA3FA-5bA3vd-5bvKLD-5bvKEB-5bvKtx-5bA34Y-5bvKiD-6yQimo-9CLWnb/)
Figure 5.36
Credit: © Dan Reed (16 August 2012)
Source: Flickr (https://www.flickr.com/photos/thecourtyard/8156498023/in/photolist-dqLbGg-5bA3M5-
8HgvMm-5bvKaD-5bA3FA-5bA3vd-5bvKLD-5bvKEB-5bvKtx-5bA34Y-5bvKiD-6yQimo-9CLWnb-arAvB3-
dqLm3y-9CLWQy-QeEPnZ-5bA371-5bvKqT-5bA3Ab-9CJ23g-5bvK8g-5bvKm2-9CLX3C-5bvKgt-9CJ1TB-
5bA3oY-roHVkt-5bvKyM-5bvKoD-6UyaEL-feuW8R-8HgvK7-2hhfAqE-2fDoE7-5tsw5J-cwpv1b-dqLbRc-2gxuiu-
fEharD-dqLkWU-UzGuU3-fEhasX-dN1Kt5-MTuPZ-4VSQrh-5WnX5a-2hhfAS6-5tsvim-f3qaAM)
Figure 5.37
Credit: © Simmons B. Buntin
Source: Terrain (https://www.terrain.org/unsprawl/27/)

xiii
Pentagon Row (Arlington, Virginia)
Figure 5.38, 5.43
Source: Mahan Rykiel Associates Inc. (https://www.mahanrykiel.com/portfolio/pentagon-row/)
Figure 5.39
Source: Row (http://pentagonrow.com/?attachment_id=2694)
Figure 5.40
Source: Ridge House Condominiums (https://www.arlingtonridgehouse.com/ridge-house-arlington-virginia-
pentagon-city-shopping-and-dining)
Figure 5.41
Source: MAA (https://www.maac.com/virginia/dc-metro/post-pentagon-row/)
Figure 5.42
Source: StayArlington (https://www.stayarlington.com/directory/pentagon-row/)
Richmond Village (Oakland, California)
Figure 5.44, 5.48
Source: HDR Calthorpe (https://www.calthorpe.com/richmond-transit-village)
Figure 5.45
Source: Reimagine (https://www.reimaginerpe.org/taxonomy/term/161)
Figure 5.46
Source: Richmond Confidential (https://richmondconfidential.org/2013/10/18/scenes-from-the-bart-strike/)
Figure 5.47
Source: BART (https://www.bart.gov/about/business/tod/completed)
Figure 5.49
Credit: © Pi.1415926535 (13 April 2018)
Source: Wikimedia Commons
(https://commons.wikimedia.org/wiki/File:Richmond_station_canopy_from_parking_garage_(3),_April_2018.j
pg)
Santana Row (San Jose, California)
Figure 5.50
Credit: © Ryan Ritchie
Source: Los Angeles Times (https://www.latimes.com/travel/california/la-tr-d-san-jose-escape-20141102-
story.html)
Figure 5.51
Credit: © Sergio Ruiz
Source: SPUR (https://www.spur.org/events/2017-02-02/santana-row-effect)
Figure 5.52
Source: Design for walkability SPUR (http://www.designforwalkability.com/casefive)
Figure 5.53
Source: SB Architects (http://www.sb-architects.com/project/santana-row/)
Figure 5.54
Source: San Jose (https://www.sanjose.org/neighborhoods/santana-row)
Figure 5.55
Source: San Jose (https://www.sanjose.org/listings/santana-row)
The Gateway (Salt Lake City, Utah)
Figure 5.56
Source: Building Salt Lake (https://www.buildingsaltlake.com/2018-big-year-gateway/the-gateway-olympic-
fountain/)
Figure 5.57
Source: Pentax Forums (https://www.pentaxforums.com/gallery/photo-olympic-legacy-plaza-fountain-
21268/&u=7629)
Figure 5.58, 5.59, 5.60
Source: Source: Author’s production from Google Earth
https://www.arlingtonridgehouse.com/ridge-house-arlington-virginia-pentagon-city-shopping-and-dining

xiv
Table 5.1 – Classification of climate impacts for each case study
Source: Author’s elaboration
Table 5.2 - Mitigation measures comparison according to TOD's projects
Source: Author’s elaboration
Table 5.3 - Adaptations measures comparison according to TOD's projects
Source: Author’s elaboration
Table 5.4 – Climate exposure coherence of each case study
Source: Author’s elaboration

xv
Glossary
Adaptation
“The process of adjustment to actual or expected climate and its effects. In human systems,
adaptation seeks to moderate or avoid harm or exploit beneficial opportunities. In some
natural systems, human intervention may facilitate adjustment to expected climate and its
effects.” (IPCC, Annex II: Glossary [Mach, K.J.; Planton, S.; von Stechow, C. (eds.)], 2014a,
p. 118)
Climate change
“Climate change refers to a change in the state of the climate that can be identified (e.g.,
by using statistical tests) by changes in the mean and/or the variability of its properties and
that persists for an extended period, typically decades or longer. Climate change may be
due to natural internal processes or external forcings such as modulations of the solar
cycles, volcanic eruptions and persistent anthropogenic changes in the composition of the
atmosphere or in land use.” (IPCC, Annex II: Glossary [Mach, K.J.; Planton, S.; von
Stechow, C. (eds.)], 2014a, p. 120)
Mitigation
“A human intervention to reduce the sources or enhance the sinks of greenhouse gases
(GHGs).” (IPCC, Annex II: Glossary [Mach, K.J.; Planton, S.; von Stechow, C. (eds.)],
2014a, p. 125)
Transit-Oriented Development
“A Transit-Oriented Development (TOD) is a mixed-use community within an average
2,000-foot walking distance of a transit stop and core commercial area. TODs mix
residential, retail, office, open space, and public uses in a walkable environment, making
it convenient for residents and employees to travel by transit, bicycle, foot, or car.”
(Calthorpe, The Next American Metropolis: Ecology, Community, and the American
Dream, 1993, p. 56)
Urban Design
“Urban design is the design of towns and cities, streets and spaces. It is the collaborative
and multi-disciplinary process of shaping the physical setting for life in cities, towns and
villages; the art of making places; design in an urban context. Urban design involves the
design of buildings, groups of buildings, spaces and landscapes, and the establishment of
frameworks and processes that facilitate successful development.” (Urban Design Group,
s.d.)

xvi
This page is intentionally left blank

xvii
CONTENTS
Abstract i
Dedication iii
Acknowledgments v
List of Acronyms and Abbreviations vii
List of Figures and Tables ix
Glossary xv
Introduction 1
PART I - Today's Challenge
Introduction 7
1. Climate Change in the U.S. 9
1.1. Causes 10
1.1.1. Pedestrian, bicycle and transport systems 16
1.2. Effects 18
1.2.1. The UHI effect 19
1.2.2. Flooding 24
1.2.3. Drought 26
1.3. Measures 27
1.3.1. Mitigation 28
1.3.2. Adaptation 28
2. Planning theories and actions 31
2.1. The New Urbanism and the Congress of the New Urbanism 31
2.2. The Pillars of New Urbanism 33
2.2.1. Traditional Neighborhood Development 33
2.2.2. Transit-Oriented Development 38
2.3. Connecting TOD with today’s global Agendas 41
References PART I 45
PART II - Sqaure Design: How a Square can tackle CC
Introduction 53
3. Mitigation measures 63
3.1. Walkability 63
3.1.1. Walkability benefits 64
3.2. How to reach walkability 66
3.2.1. Square dimensions 66
3.2.2. Mixed-use and density 67

xviii
3.2.3. Compactness and interconnectivity 69
3.2.4. The building’s exterior side 70
3.2.5. Sense of enclosure 74
3.2.6. Urban furniture 75
Seats and benches 76
Public realm signage 79
Public lighting 79
Garbage bins 82
Fountains and water bodies 82
Food 83
Bollards 84
3.2.7. Weather shelters 85
3.2.8. Public art 86
3.2.9. Preservation of historic and civic buildings 87
4. Adaptation measures 89
4.1. The UHI effect 90
4.1.1. Building scale 91
Cool materials 91
Green roofs and green walls 92
4.1.2. Urban space 95
Urban vegetation 95
Cool pavements 97
Water bodies 99
4.1.3. Urban geometry 99
H/W ratio 100
4.2. Flooding 103
4.3. Drought 107
References PART II 110
PART III - Case Studies
Introduction 119
5. Climate Regions and TODs in the U.S. 121
References PART III 158
Conclusions 163
Annex - The Charter of New Urbanism 167

xix
This page is intentionally left blank

xx
This page is intentionally left blank

1
Introduction
We are all witnesses and conscious that climate change is on-going. Many are the forms
in which such changes can occur, anomalous events can be found from global to local
scales, threating the places where we live as never before. Warmer temperatures and
climate alterations result in hotter heat waves, stronger flooding and storms, and longer-
lasting drought, which are already taking place, hitting the planet tangibly and leaving
indelible scars. The impacts on humans, the economic sector and the environment (both
the natural and the build one) are huge. Cities around the world are being interfaced in
the fight against climate change through the development of sustainable planning policies
and strategies especially aiming to reduce GHG emissions. Among these strategies, the
Transit-Oriented Development (TOD) proposes a planning pattern based on a transit
station around which develops a neighborhood whose main objectives include reduce
private mobility and increase density and mixed-use to favor public transport mainly by rail.
This kind of intervention primary targets suburban zones, characterized by sprawl
developments where weak infrastructural connections, minimum density, mono-use result
in car-dependent environments and greater contributors to GHG emissions per capita than
urban areas. The unsustainable sprawl development is the issue New Urbanists care the
most. New Urbanism is a movement emerged at the end of the 20th
century from the
encounter between planning theories born from schools of thought in the United States of
America. Experts like Calthorpe (1993, 2011), Duany (2002) and Plater-Zyberk (2000,
2003), Speck (2018) and many others, concentrate their ideas to face sprawl development
through alternative solutions such as the Traditional Neighborhood Development (TND)
and, indeed, the TOD.
To achieve its goals, one of the strategies provided by TOD is the creation of a vibrant
square next to the transit station instead of the usual parking lots, making the public square
the crucial node of the neighborhood. Therefore, the thesis focuses on the public square in
U.S. TOD projects and on its design toward tackling climate change. Public spaces are of
paramount importance for the community fortunes, and the square is the public space by
definition. In order to tackle climate change, a set of sustainable solutions have been
grouped within two broader containers and have been applied in the public square context:
the mitigation measures and the adaptation measures. The first group aims to reduce GHG
emission, thus, in the case of the public square, walkability is the mandatory aspect the
square should offer and implement. The second group aims to increase the ability of public
squares to adapt to (climate) changes. Both the measure types can be achieved through

2
Urban Design, a process encompassing and dealing with a broad range of sciences, from
social to architectural ones. Urban designers such as Jacobs (1961) and Lynch (1960,
1942), started to create sustainable principles since the second half of the 20th
century,
setting the design pillars on which today’s urban environments are based. Recently, with
the increasing environmental problems, designers such as Carmona (2003, 2009), Lang
(1994, 2005), Gehl (2010, 2011, 2013) and Moughtin (2003) offer urban design
solutions to better accommodate the current urban needs, including the climate changes.
Through Urban Design theories and principles, mitigation and adaptation measures can
both create a more pedestrian-friendly environment while, at the same time, be able to
shape the square and its surroundings in a flexible and efficient way. Therefore, Urban
Design is regarded in this instance as the vehicle through which the public square can face
and respond to climate change. Therefore, the thesis tries to answer the question: are the
TOD’s public squares properly designed to face climate change? Besides mitigation, are
adaptation measures also considered within the public square design process? And, if yes,
how?
To answer these questions, the thesis has been structured in three main parts. The PART I –
Today’s challenge introduces the thesis topic giving a general framework about the Urban
Heat Island, flooding and drought events, the most impacting climate changes in the U.S.
the New Urbanism ideas, grouped in the Charter of New Urbanism, are explained to bring
in the TOD pattern, recognized by the current global Agendas addressed to sustainable
developments. Subsequently, the PART II - Square Design focuses on the different strategies,
applicable at the local scale, that help to tackle climate changes. Fourteen mitigation and
fourteen adaptation measures have been extrapolated by mixing the Urban Design
principles identified by Carmona in Public Places Urban Spaces: The Dimensions of Urban
Design (2003), with the literature available on both walkability (Carmona, 2009; Gehl,
2010, 2011, 2013; Jacobs, 1961; Lang, 1994, 2005; Speck, 2018; White, 1980), to
define mitigation measures, and on urban elements that minimize climate impacts
(Gartland, 2008; Oke, 1997, 2017; Santamouris, 2001, 2004; Silva & Costa, 2016,
2018), to define adaptation measures. In PART II, the research’s radius has been limited to
the public square and its proximity, so both the measures do not consider the public square
itself, but they have been slightly expanded in order to plan squares in coherence with their
surroundings, rather than being isolated and detached from the urban context. Therefore,
mitigation measures consider also the block size, whilst, the adaptation measures
encompass also the buildings at the edge of the square, in terms of envelopes and
orientation. The last PART III - Case studies, finally, regards ten case studies and represents
the practical application of the principles and theories developed in the previous parts.

3
Each case study has been developed and analyzed according to the climate and
geographical location because, even if the climate impacts identified in the first PART I (the
Urban Heat Island effect, flooding and drought) can occur everywhere worldwide,
especially the lasts two, they can impact differently according to the location. In fact, what
climate change means, actually, is that it strengthens the impacts that would naturally occur,
enlarging heatwaves and drought periods, and empowering storms. Some areas are more
vulnerable to one or more hazards than others, according to the climate regions and to the
elements at risk. Therefore, urban and suburban settlements should be prepared to properly
respond to such events, and, at the same time, to accommodate them more softly. In order
to understand if the TOD project areas are more or less subjected to the UHI effect and/or
flooding and/or drought, each case study analysis has been developed through three steps.
First, the UHI effect is a though impact to measure to compute and assess and, although
every Comprehensive Plan of the ten TOD project’s cities has been consulted, the
information resulted inhomogeneous and they were often lacking. Therefore, the UHI effect
intensity has been extrapolated in relation to the Extreme Heat (EH) days per county. This
was possible through the interactive map supplied by the NRDC (National Resource
Defense Council, s.d.). Although the map does not refer to the real UHI effect values, the
information provided by the number of days with EH is of significant importance due to the
close link between UHI and temperatures. In fact, the number of days with EH will be more
severe in dense urban areas than in the rural ones; thus, the location of the TOD project
(T3/T4/T5) will be the discriminant factor to determine the UHI effect in each TOD project.
As suggested by the NRDC, the EH have been grouped into three class in order to define
the level of intensity the different US counties are subjected to. Therefore, counties up to 9
days (included) are classed as low subjected to UHI and EH, those from 9 to 14 days as
medium subjected and those over 14 days as highly subjected.
Second, to define the level of risk of flooding, it has been carried out a research through
the online tool FEMA Flood Map Service Center (Federal Emergency Management Agency,
2019) to understand the flooding hazard of the TOD areas interested by the research.
Three classes of risk have been identified according to the FEMA classification. Therefore,
three classes have been extrapolated according to the level of risk: Low risk, Moderate risk,
and High risk of flooding.
Third, it has been conducted the same operation to verify drought occurrence through the
maps obtained using data from the U.S. Drought Monitor for the last two decades (1999-
2019. Due to lacking information about long-period data, the only significant levels of
drought available that have been considered are the two most grave: the D3 - Extreme
Drought and the D4 - Exceptional Drought. As for the other climate impacts, also for the

4
evaluation of drought, the intensity has been considered by grouping the weeks of drought
occurred in the last two decades into three ranges: from 0 to 50 weeks, from 50 to 150
weeks and the most severe conditions from 150 weeks ahead.
Subsequently, to verify if and how the twenty-eight climate measures (14 measures aiming
at mitigation and 14 measures aiming at adaptation) take place in each case study, a
“virtual survey” through the use of Google Maps Street view tool and Google Earth software
has been performed, allowing the assessment of the TOD’s public square from the climatic
side point of view. The results are represented in different sheets, one for each case study,
that summarize the virtual survey highlights.

5
This page is intentionally left blank

6
PART I
Today’s Challenge

7
Introduction
The first chapter explains why the thesis focuses on the climate side of public elements in
North American urban and suburban settlements. It starts to dig towards the public plaza
and square, giving a general overview of climate changes in the U.S. through a brief
summary of the recent climate conditions that will be useful to illustrate the contribution’s
weight that the U.S. gives to the overall global warming. Later, the chapter will try to make
understand what are the reasons of such changes with an emphasis on the constantly
increasing world population, a variable that should be controlled and well accommodated
rather than limited (although it would help significantly). The chapter, then, focuses on one
of the main causes of climate change: the phenomenon of sprawl and the related
automobile dependency that make the suburban households larger Co2 consumers
compared to more city areas, as explained in the Transit Cooperative Research Program
(TCRP) Report 93 (Feigon, et al., 2003). The document compares the emissions per square
miles of three similar cities (Chicago, Los Angeles, and San Francisco) with their suburbs
and the emissions per household of the same cities. The results show that the city areas
produce more GHG emissions overall but, considering the production per household, the
result overturns showing that “the transportation efficiencies of dense urban areas emerge
clearly” (Feigon, et al., 2003, p. 21). Chapter 1 then turns towards the impacts generated
by CC focusing on those affecting more urbanized areas: the Urban Heat Island (UHI)
effect, floods, and droughts. To conclude, a brief overview of mitigation and adaptation
measures are explained and proposed as the two most common approaches to battle CC,
which will be further explained in PART II.

8
This page is intentionally left blank

9
1. Climate Change in the U.S.
Before start discussing public squares, it is appropriate to define the reasons why we are
arguing about today’s need to have such a well-planned city element. Today we are facing
the biggest challenge humans have ever faced: global Climate Change (CC). If we look at
CC from a negative perspective, we can say that we are feeding CC day by day just by
living our ordinary lives. The Intergovernmental Panel on Climate Change (IPCC) is the
United Nations (UN) organization that studies the global warming phenomenon by
monitoring data and developing analysis about global CC. As reported in its Synthesis
Report (2014), “human influence on the climate system is clear, and recent anthropogenic
emissions of greenhouse gases are the highest in history” (IPCC, 2014b, p. 2). The
Summary gives many warring information about climatic change conditions regarding the
atmosphere and the sea levels that are “unprecedented over decades to millennia” (IPCC,
2014b, p. 2).
It is quite common knowledge that global warming is now ongoing, and its consequences
are already taking place. It is difficult to foresee precise future predictions, but past forecasts
from the IPCC and other climate organizations guessed, were worryingly right (Kirkegaard,
2018), so we should care for the current ones. Even if world is polluting since the Second
Industrial Revolution (1870-1914) we have now reached a tipping point to preserve our
planet for the next future generations and the IPCC (2014b) is keen to stress that “continued
emission of greenhouse gases will cause further warming and long-lasting changes in all
components of the climate system” (IPCC, 2014b, p. 8). Thus, our objectives have to be
shared and the maximum efforts are needed because “Limiting climate change would
require substantial and sustained reductions in greenhouse gas emissions which, together
with adaptation, can limit climate change risks” (IPCC, 2014b, p. 8).
Climate change has disturbing effects mainly on our biodiversity, natural and environmental
systems and, consequently, also on us as human species. There are several effects in which
CC manifests itself: heatwaves, floods and droughts, ocean acidification and many others
leading to species migrations and their habitat adaptations. Humans must be included in
this discussion. An example is given by observing the glaciers which are melting rapidly,
therefore, sea-level rise proceeds aggressively towards coastal cities and people may be
forced to migrate from their houses sooner than they think. Climate Change also impacts
plants and upon the agriculture sector, influencing food and water storage threatening
human’s diet and health.
The celebrated movie The Matrix (1999), is plenty of references to CC and our present
conditions. For examples, Agent Smith stated that:
“Every mammal on this planet instinctively develops a natural
equilibrium with the surrounding environment but you humans
do not. You move to an area and you multiply and multiply
until every natural resource is consumed and the only way you
can survive is to spread to another area. There is another

10
organism on this planet that follows the same pattern. Do you
know what it is? A virus. Human beings are a disease, a cancer
of this planet.” (Wachowski, 1999)
This movie monologue clearly explains that CC is actually a paradox. Whoever would
jeopardize its own future? It can be considered a terrible exaggeration, but I think the
concept is truer than ever.
We must take into account that CC is strictly related to population growth. An increase in
population means more space needed to accommodate them, more food to feed them,
more garbage produced, and more resources are required to be consumed. In other words,
the higher the population, the higher will be the overall human footprint, obviously. Today,
the World Population Review believes that the total world population is around 7,75 billion,
the 4.27% (or 329,953,409 people) of which lives in the U.S. resulting in the third most
populated country (World Population Review , s.d.). The UN predicted that the world
population “projected to reach 8.5 billion in 2030 and to increase further to 9.7 billion in
2050 and 11.2 billion by 2100” (United Nations, s.d.).
Today is commonly acknowledged that by limiting our own footprint living in a healthier
and more sustainable way will be enough to solve CC. This is would be extremely helpful,
but “unsustainable human population growth can overwhelm those efforts, leading us to
conclude that we not only need smaller footprints, but fewer feet” (Center for Biological
Diversity, s.d.).
There are several initiatives spread around the world about limiting procreation due to
worrying population growth, from measures about women education and empowerment to
family planning strategies. These actions can truly help to achieve goals towards a
sustainable global population. But actually, considering also that the longevity rate is
constantly increasing since the 1960s (The World Bank Data, s.d.), we should take into
account that the population most likely will continue to surge. However, although our efforts
are weak to in this sense, we can do put much more exertion on how to accommodate the
current and the future population through adequate and reasonable urban planning.
1.1. Causes
This paragraph will explain why sprawl phenomenon is considered one of the main causes
of the rising Co2 emission values in the U.S., making North America one of the main
contributors to global CC. How much we grow is important and it deserves our maximum
attention, but the way in which we do so is sharply more fundamental. The IPCC and others
organizations that deal with CC - like the World Resource Institute (WRI)1
- tried to address
the causes of such increasing global changes by pointing at the anthropogenic emission
sources, largely produced through the industrial processes and the transports sector:
1 https://www.wri.org/

11
“Globally, economic and population growth continued to be the most important drivers of
increases in CO2 emissions from fossil fuel combustion” (IPCC, 2014b, p. 5).
According to the U.S. Union of Concerned Scientist (UCSUSA), China is the country that
produces more carbon dioxide (Co2) emissions worldwide (29% of the total emissions)
(UCSUSA, s.d.), besides being the most populated one (with a population equals to
18,59% of the total)2
. But if we wanted to understand who is the country that most
contributed to our actual situation, it might be better to consider the cumulative Co2
emissions. However, considering the developed countries (within the OECD list)3
, the
supremacy directly shifts from the East side of the world to the West side with the U.S. taking
the lead in the ranking largely4
. Unless China is the most worrying current national power,
according to Our World in Data from 1751 to 2017 the world has produced over 1,5
trillion Co2, 25% of which by the U.S. alone (Ritchie & Roser, 2020). According to the
Environmental Protection Agency (EPA) analysis, the graphs are shown in Figure 1.1 and
1.2 taken from the U.S. EPA's Inventory of U.S. Greenhouse Gases Emissions and Sinks:
2 China has a population equals to 1,436,427,647 or the 18,59% of the overall world population
(December 2019). Retrieved from: http://worldpopulationreview.com/(2 December 2019)
3OECD (Organisation for Economic Co-operation and Development):
https://www.oecd.org/about/document/list-oecd-member-countries.htm
4 For further information visit: https://stats.oecd.org/Index.aspx?DataSetCode=AIR_GHG
Figure 1.1 – U.S. GHG emissions by Economic Sector (1990-2017)
Source: U.S. EPA's Inventory of U.S. Greenhouse Gases Emissions and Sinks: 1990-2017
(https://cfpub.epa.gov/ghgdata/inventoryexplorer/#allsectors/allgas/econsect/all)

12
1990-2017 (U.S. Environmental Protection Agency, s.d.), clearly help us to understand
where to point the finger when talking about CC. Whilst the graph in Figure 1.1 shows that
nearly all amount of Green House Gases (GHG) produced in the U.S. is made of CO2
(carbon dioxide), the graph in Figure 1.2 identifies the principal economic sector that
produces CO2 in the U.S.: the transportation sector.
By digging down deeper into the topic, confirmations of what explained earlier are found.
In fact, according to the data collected by Our World in Data in 2014, the motor vehicles
ownership value (including automobiles, SUVs, trucks, vans, buses, commercial vehicles,
and freight motor road vehicles) per 1000 inhabitants in the U.S. is the higher worldwide
(Ritchie & Roser, 2020).
Although today the United Nations Department of Economic and Social Affairs (UN DESA)
states that the “55% of the world’s population lives in urban areas” and predicts “that is
expected to increase to 68% by 2050” (UN DESA, 2018), according to the Pew Research
Center Report more than half of the total U.S. population lives in suburbs (Parker, et al.,
2018). Except for some very few cases, the majority of the suburbs are connected with its
surroundings by roadways and, because of strong zoning, they are poorly served by primary
needs and goods, therefore, as will be better explained later, they are forced to drive.
The twentieth century will be remembered for the two World Wars and for the events that
deeply compromised and shaken the Western cities and societies in terms of environment
Figure 1.27 – U.S. GHG emissions by GAS (1990-2017)
Source: U.S. EPA's Inventory of U.S. Greenhouse Gases Emissions and Sinks: 1990-2017
(https://cfpub.epa.gov/ghgdata/inventoryexplorer/#allsectors/allgas/gas/all)

13
and urban morphology (Tagliaventi, 2002). As said before, no one would jeopardize its
own life, being conscious of it by the way. But actually, this is what we do day by day
because of improper behaviors and approaches to ordinary life issues dictated by
consumption and car-dependency. If we add to this lazy and inappropriate way of living of
human beings the blames of an inadequate urban zoning pattern and a diffuse organization
of uses and spaces, it comes itself that people would still prefer driving to achieve
consumption.
As underlined on the book Growing Cooler: The Evidence on Urban Development and
Climate Change written by Ewing et al. (2008), the answer to the question “Why Americans
are such car dependent?” (Ewing, Bartholomew, Winkelman, Walters, & Chen, 2008), is
that because they “have little alternatives” (Ewing, Bartholomew, Winkelman, Walters, &
Chen, 2008). After the Second World War, the development of cities in North America
attacked the outer areas by building suburbs spread like wildfire, disconnected among them
through the so-called phenomenon of sprawl. It is difficult to give a short and clear
definition of sprawl, but when someone sees an American suburb of the late twentieth-
century he will clearly understand what it means at a first glance (Figure 1.3). Sprawl is
characterized by detached low-density houses built far away from workplaces, by schools
unserved by public transports, by hard zoning allowing the creation of sectorial
neighborhoods (like gigantic malls and industrial district) with attached huge car-parks
tolerating the automobile as the only mean of transport.
Figure 1.3 - Typical suburban sprawl pattern in Herriman, Utah
Credit: © Michael Tuszynski
Source: Unspalsh (https://unsplash.com/photos/2osRMlJLdbU)

14
Surely it is not a so recent issue. Almost 60 years ago, the book The Death and Life of Great
American Cities (1961) of the scholar and activist Jane Jacobs was published becoming
today one of the most influential and pivotal masterpieces of the American planning culture.
The author condemns the way of building and rebuilding and the planning methods of that
time. In particular, her critics attack the worrying planning methods that divide the city uses
and functions providing long distances to travel by private car and resulting in vehicle traffic
congestion, unhealthy both for humans and also for our natural environment.
As briefly explained before, in urban developments population matters and, during the
Postwar boom period was another fundamental aspect that encouraged sprawl in the U.S.
By being only partially demographic affected by the War, and “experiencing a prodigious
baby boom, the population jumped from 150 million people to over 200 million people in
the first two full decades after the war” (Bruegmann, 2005, p. 42). As written in the book
Urban Social Geographies: An Introduction by Knox and Pinch, the baby boom generation
refers to those children born between 1946 and 1964, a period in which women got
married earlier and had at least two children resulting in a “very large cohort of individuals,
currently in their mid-40s to their early 60s, who have had, and will continue to have,
tremendous impacts on the rest of the population” (Knox & Pinch, 2010, p. 10).
More recently, around 20 years ago, Duany, Plater-Zyberk, and Speck identified in their
book Suburban Nation: The Rise of Sprawl and the Decline of the American Dream that
sprawl is characterized by five factors:
1- “Housing subdivisions, also called clusters and pods, made up only of residences”
(Duany, Plater-Zyberk, & Speck, 2000, p. 5). To better understand, someone also
calls them villages, towns or neighborhoods, mistaken because the neighborhood
is made by activities and amenities that provide services to local residents, it does
not only consist of residential houses (Duany, Plater-Zyberk, & Speck, 2000);
2- “Shopping centers, also called strip centers, shopping malls and big-box retail”
(Duany, Plater-Zyberk, & Speck, 2000, p. 6), places made for shopping only. They
shop every type of needs, from clothes to wood, from car to food changing in sizes.
They are characterized by lack of residential units and by car dependency with very
wide parking in between buildings (which does not stimulate one for a walk), the
latter always built in a single-story building;
3- “Office parks and business parks. These are places only for work” (Duany, Plater-
Zyberk, & Speck, 2000, p. 6). Basically, they are free-standing buildings isolated
from any type of function and they are characterized by being placed in the middle,
or next to, a parking area;
4- “Civic institutions and public buildings” (Duany, Plater-Zyberk, & Speck, 2000, p.
6), (e.g. libraries and schools) mostly placed in the middle of nowhere. As in the
cases before, also these places are characterized by parking lots and lack of
pedestrian accesses boosting the car as the only mode of transportation possible
to reach them;

15
5- “Roadways” (Duany, Plater-Zyberk, & Speck, 2000, p. 7), which can be suitably
seen as an incredible amount of pavemented land, especially if compared to the
use that is actually made of them. Streets are necessary for connections and
automobile movements can be allowed, but not by oversizing their widths otherwise
the consequent effect is to incentive its usage.
To summarize, we observe that “The sprawl basis of American society is automobile
dependence, absence of high social capital neighborhoods, and commodity housing”
(Hirschhorn, 2004).
Considering the five components of sprawl together, we can deduce that what suffers from
it the most is the environment (built and not) in which we live. Nowadays, the latter is
seriously compromised by the effects of Climate Change. In the C40 Blog, it is stated that
“whereas homes, businesses, and services are increasingly far apart in sprawling cities,
sustainable neighborhoods function like ecosystems” (C40, 2017). This means that the
neighborhood is made of a multitude of elements (e.g. street network, vegetation, people)
that have to work in harmony to become sustainable, otherwise, sprawl and CC are
obtained. According to C40, “as our neighborhoods get more compact and connected,
we become more resilient” (C40, 2017). Then, in order to obtain sustainable cities,
(sustainable) neighborhoods have to be considered first.
The first issue inhabitants consider public transport is whether public transports (be it the
underground, light rail or buses) does work or not. To reach this objective, Duany, Plater-
Zyberk, and Speck (2000) listed three rules a transit network must follow:
1- “Transit must be frequent and predictable.
2- Transit must follow a route that is direct and logical.
3- Transit stops must be safe, dry and dignified.” (Duany, Plater-Zyberk, & Speck,
2000, p. 202, 203)
These three points above could be taken for granted and superfluous but actually, they
represent the key elements to provide public transit opportunities for people and, possibly,
shift them from car-dependency to commuting. Not many words should be spent on the
quality of transit’ stops, but actually, this is needed. In fact, a transit stop will be much more
appealing if it offers “a transit experience both comfortable and civilized” (Duany, Plater-
Zyberk, & Speck, 2000, p. 203) instead of waiting for the bus or train in an isolated stop
under a dark bridge with no lights. Along with the present thesis, the most discussed way of
transport is the one by rail in all its forms simply because it is faster and accessible to a
larger amount of people, from light rail to underground-metro and elevated rails.
Nevertheless, also bus transport is considered but as a secondary and complementary
transport system service referring mainly to local movements.
By having different suburbs each one having different functions, one must move from one
suburb to another in order to meet his ordinary activities and needs. Since public transports

16
and cyclo-pedestrian paths are rare options (even for quite short distances), people are
forced to drive. Hence, the movements among the suburbs are possible by using private
cars, usually occupied by one single person for each one, causing a very high level of traffic
compared to the relatively high amount of people living and moving. Moreover, car-
dependency is costly in economic, environmental, health and social terms. This is why
zoning and suburban sprawl are no longer considered as good, sustainable growth. It is
reasonable, then, to consider alternative options.
There is then the necessity to find a method that disincentives automobile usage and
promote urban settlement on a human scale. This could be possible by switching people’s
behaviors and attitudes, emphasizing public life by donating more spaces to the public
realm where they are lacking and making them more comfortable where they are already
present.
1.1.1. Pedestrian, bicycle and transport systems
As explained by Cervero, a professor at the University of California, Berkeley, the most
common way of transport to get to a transit stop is the automobile, especially in the suburbs
(Cervero, 2001). Due to this fact, every rail transit stop is surrounded by huge car-parking
making them “the dominant "land uses" within a half-mile of most suburban rail stations in
the United States” (Cervero, 2001, p. 1, 2).
To get as many automobiles off the road as possible, there should be an efficient and
accessible public transport system supporting the high demand of passengers that would
be wonderfully blown from the car inside to the train carriage or bus seat. Keeping in mind
that limited and controlled use of the automobile is allowed only when other more
sustainable options are not available, the pedestrian and bicycle network should be wide-
spread and well-distributed around the neighborhood and connected with different efficient
transport systems, both on rails and roads. However, there are a lot of other factors
influencing people's choices. In an interesting article written by Saneinejad, Roorda, and
Kennedy (2012), for example, it is underlined the important aspect that weather has on
pedestrians and cyclists according to the distances they should cover on foot or by bicycle
(Saneinejada, Roorda, & Kennedy, 2012). As explained before, in American suburbs the
most commonly used way of transport is the automobile due to long distances, zoning and
lack of efficient public transports. The solution proposed by Cervero is the “transit village”
that focuses on the valid and sustainable model that prioritizes pedestrian and bicycle
patterns to reach transit stations as a way to disincentivize automobile usage. Linking this
topic to the public square issue, Professor Cervero stresses the importance of this urban
element stating that plazas are the core of public life during ordinary but fundamental
weekly days and also during weekends when more entertainment activities can be held
within the plaza (Cervero, 1996). However, “What is important is that the transit station
functions as a window, or gateway, to the rest of the region and is physically tied to and
associated with the village's major gathering place” (Cervero, 1996, p. 105, 106) as public

17
squares are. In the last decade of the 20th
century this idea of “transit village” has taken
hold and it is been developed in-depth by many experts coming from California to Florida
under the so-called New Urbanism movement that will be better explained in the next
Chapter 2.
To summarize, both walking and bicycling contribute to increasing transit passengers, but
in a slightly different way. In fact, whilst people walking can cover short distances (between
400 to 800 meters), bicyclists can cycle further distances. Therefore, walkable paths would
serve more local population and bicycle lanes, by enlarging the range of action, which
could also serve further population (Pucher & Buehler, 2010). In other terms, “Bicycling
supports public transport by extending the catchment area of transit stops far beyond
walking range and at much lower cost than neighborhood feeder buses and park-and-ride
facilities for cars” (Pucher & Buehler, 2009, p. 79). Moreover, Pucher and Bueler (2009)
exalt bicyclists stating that “Transit services also can provide convenient alternatives when
cyclists encounter bad weather, difficult topography, gaps in the bikeway network, and
mechanical failures” (Pucher & Buehler, 2009, p. 80) underling that there are many other
factors that can condition transit choices.
However, there is an infinite number of benefits from improving access for pedestrians and
bicyclists in this transit-based strategy of planning. The Federal Transit Administration (FTA)
prepared a Manual on Pedestrian and Bicycle Connections to Transit (McNeil, et al., 2017)
where some benefits of bicycling and walking to and from a transit station are listed as
follows:
▪ “Transit depends on safe and pedestrian access” (McNeil, et al., 2017, p. 8)
As previously explained, safety and easy access to transit station are binding
conditions to guarantee a sufficient transit flow;
▪ “Help improve equity” (McNeil, et al., 2017, p. 8)
It may be an underestimated factor, but transit is more affordable than driving
because of the cost of fuel and car ownership is something that not everyone can
afford. Thus, the transit system also allows to lower social disparities;
▪ “Extend the reach of transit” (McNeil, et al., 2017, p. 8)
Creating more pedestrian and cycle pathways that directly connect further areas
with the transit station would incredibly enlarge the range of action of a given
station;
▪ “Support more multimodal trips and more specific options” (McNeil, et al., 2017,
p. 9). Make more accessible a transit stop does not only imply its appealing issue
but the way it is linked with another way of transports making the multimodal aspect
of a certain station a key element on determining the commuter’s choice (Brons,
Givoni, & Rietveld, 2009);
▪ “Serve as a redundancy in cases of transit outages” (McNeil, et al., 2017, p. 9).

18
Linked with the previous benefit, the fact of having a multimodal and interchange
character, allow a transit station to be more versatile in case of unexpected
problems;
▪ “Improve health and well-being” (McNeil, et al., 2017, p. 9)
It is commonly acknowledged that doing physical activities like walking and
bicycling can help to maintain a healthy mind in a healthy body, even for short
distances.
1.2. Effects
The major impacts of CC are already in action and they are hitting worldwide. There are
different types of events through which climate change impacts on humans and our built
and natural environment. Surely climate change has negative and warring impacts, there
are so many ways in which CC strikes and affect our behaviors and environments that it is
difficult to draft a clear and simple list of impacts. First of all, to facilitate the understanding,
a net distinction between direct and indirect impacts must be done. The formers are those
that directly affect the place where they occur – thus they are spatially limited– and they are
the direct cause of global warming. An example could be the acidification of seas and
oceans due to more acid rainfalls. In other words, they happen because of climate change.
Furthermore, as reported on the website of the Union of Concerned Scientists of United
States of America (UCSUSA, s.d.), direct impacts are also a matter of social inequality. As
an example, they state that “hotter temperatures and droughts will make corn, wheat, and
other staple crop supplies less stable, leading to price spikes and foot shortages. The
roughly 800 million people currently living in extreme poverty will be most affected”
(UCSUSA, s.d.). These kinds of impacts are the indirect ones, those that affect indirectly
other populations or countries – thus they cannot spatially limited– through the share and
the exchange of certain resources hit by the direct ones (Benzie, 2014). As the IPCC states,
(direct) “Impacts can have beneficial or adverse outcomes for livelihoods, health and well-
being, ecosystems and species, services, infrastructures, and economic, social and cultural
assets” (IPCC, 2018, p. 26). However, for the purposes of this thesis, only the direct impacts
of CC will be taken into account.
The direct effects of climate change depend on the place where they occur, so they
obviously differ from country to country, region to region and city to city. According to their
location and the relative climatic region, every country, region, and city will be impacted
by CC differently. Given the complexity and mutability of CC impacts, and given the
purpose of the thesis, the scope is narrowed down by considering the impacts that CC has
on our built environment.
As said before, CC impacts cities differently according to their location and climatic region.
However, the seriousness of CC impacts depends on their strength and perseverance, but
also on their target. That is for example if a hurricane changes its course before hitting a

19
coastal city, the impact of the hurricane itself would be much softer than if it had not
changed direction destroying the city and hundreds of lives. This leads us to a fundamental
distinction between natural hazard, vulnerability, and risk explained through the formula
proposed by Varnes (1984, p. 10):
“Rt = (E) * (Rs) = (E) * (H * V)”
Where:
▪ “Natural hazard (H) means the probability of occurrence within a
specific period of time and within a given area of potentially
damaging phenomenon.
▪ Vulnerability (V) means the degree of loss to a given element or
set of elements at risk (see below) resulting from the occurrence of
a natural phenomenon of a given magnitude. It is expressed on a
scale from 0 (no damage) to 1 (total loss).
▪ Specific risk (Rs) means the expected degree of loss due to a
particular natural phenomenon. It may be expressed by the
product of H times V.
▪ Elements at risk (E) means the population, properties, economic
activities, including services, etc., at risk in a given area.
▪ Total risk (Rt) means the expected number of lives lost, person
injured, damage to property, or disruption of economic activity
due to a particular natural phenomenon, and is therefore the
product of specific risk (Rs) and element risk (E)” (Varnes, 1984, p.
10)
The direct impacts of CC are later explained, aiming to get a general framework about the
possible most common effects produced in different U.S. urban areas.
1.2.1. The UHI effect
The UHI (sketched in Figure 1.4) is an effect of CC that affect cities and their populations
worldwide. According to Landsberg (1981), “The most obvious climatic manifestation of
urbanization is the trend toward higher air temperatures. This is also the theme most
frequently discusses in the literature since its discovery by Luke Howard” (Landsberg, 1981,
p. 83) at the beginning of the 19th
century (Oke, 1982). The Urban Heat Island (UHI) effect
is the difference in air temperature between city areas compared to its rural areas. Professor
at the University of British Columbia, Vancouver, Oke dedicated his studies and researches
to urban climates and he provided important efforts on understanding the UHI effect. He

20
noticed that “air temperatures are often higher in a city than in its surrounding countryside”
(Oke, 1982, p. 2).
Therefore, the UHI effect is more perceptible in cities where there is a large number of
densely concentrated buildings and people’s activities, thus, UHI mostly occurs in medium
to large cities, where its effects are more tangible and severe. In fact, the UHI effect “is
widely recognized as a heat accumulation phenomenon, which is the most obvious
characteristic of urban climate caused by urban construction and human being activities”
(Yang, Qian, Song, & Zheng, 2016, p. 11). A typical consequence of the UHI effect is the
presence of hotter temperatures in cities during nighttime. This happens because “Man-
made surfaces store the solar energy that strikes during the day and rerelease it into the
atmosphere at night.” (Desonie, 2008, p. 35). The climatologist Landsberg that hotter
temperatures during nighttime happen because the UHI “is a reflection of the totality of
microclimatic changes brought about by man-made alterations of the urban surface”
(Landsberg, 1981, p. 84). It is clear that tampering the natural Earth’s soil by covering the
land with non-natural elements (e.g. buildings), these will act differently from normal land
coverage. Keeping it simple, the key point is to provide good and sustainable ways to apply
to such land changes.
There are several ways in which UHI can be avoided or at least limited, that focuses on the
characteristics of the cited man-made alterations. However, it is necessary to identify which
are the causes of the UHI effect (Table 1.2) and why there are such higher temperatures
within the city’s boundaries rather than in rural areas.
Table 1.2 - The UHI causes and effects
Main causes Effects
Poor vegetation Reduces evaporation
Figure 1.4 – Urban Heat Island (UHI) sketch
Source: Cool Parramatta (http://coolparramatta.com.au/about_us)

21
Elevated presence of man-made surfaces
(pavements and roofs)
Reduces evaporation
High values of thermal conductivity and heat
capacity of urban materials
Increases heat storage
Low solar reflectance (low albedo) of dark-
colored urban materials
Increases net radiation
Improper urban geometry Reduces convection
Increased levels of air pollution Increases net radiation
Increased energy used Increase anthropogenic heat
Source: Author's re-elaboration based on “Table 2.1 Urban and suburban characteristics important to heat
island formation and their effect on the energy balance of the Earth’s surface” (Gartland, Heat Islands:
Understanding and Mitigating Heat in Urban Areas, 2008, p. 16).
1. Reduced evaporation
“Evaporation is energy transmitted away from the Earth’s surface by water vapour”
(Gartland, 2008, p. 16). Considering that the Earth’s land surfaces have tampered
with both natural (e.g. vegetation) and non-natural (e.g. canopies) elements,
evaporation depends on the ability to evaporate of these surfaces. As will be later
explained (Chapter 3 and 4) vegetation is plenty of beneficial resources that help
to tackle CC. According to the master thesis of Slingerland (2012) “There are two
ways in which vegetation can contribute to the mitigation of the UHI. The first is by
providing shade, the second way is by evaporation” (Slingerland, 2012, p. 6),
better known as evapotranspiration (ET). The latter is “complicated process plants
use to keep cool” (Gartland, Heat Islands: Understanding and Mitigating Heat in
Urban Areas, 2008, p. 16) deriving from the combination of two processes:
evaporation and transpiration, which is “the loss of water vapour through their
leaves” (Chavarria & dos Santos, 2012, p. 106).
2. Increased heat storage
Besides vegetation and its natural processes, the Earth’s surface can be covered
also by non-natural surfaces. In this case, these surfaces accumulate heat
according to two material properties: “thermal conductivity and heat capacity”
(Gartland, Heat Islands: Understanding and Mitigating Heat in Urban Areas, 2008,
p. 18). Whilst with high values of thermal conductivity and heat capacity, the heat
is easily stored within the surfaces and longer-lasting, with low values of the material
properties the heat is kept and they are shorter-lasting within the surface’s material
resulting in lower temperature (Gartland, 2008).
3. Increased net radiation
According to Gartland (2008), the net radiation is made of “four different radiation
processes that occur at the Earth’s surface:

22
Net radiation = (Incoming solar –
Reflected solar + Atmospheric radiation
– Surface radiation)” (Gartland, 2008, p.
16)
Where:
▪ The “Incoming solar represents the amount of energy radiating from the sun”
(Gartland, 2008, p. 17) depending on several factors like the weather, with
clear or cloudy sky, and/or the period of the day, the incoming solar radiation
has lower values in the morning and evening compared to noon (Gartland,
2008);
▪ The “Reflected solar radiation is the amount of solar energy that bounces off
a surface, based on the solar reflectance of the material. Surfaces with high
solar reflectance, such as bright white roofing materials, reflect most of the
solar radiation that falls on them, whereas dark surfaces such as asphalt
pavement absorb most of the solar radiation” (Gartland, 2008, p. 17). The
reflected solar radiation is commonly known as albedo. The term “albedo”
(Figure 1.5) comes from the Latin (albēdo, "brightness", albus, "white") and,
according to Philander, “The more the amount of light reflected back, the
brighter the color of the object. A lesser amount of light is reflected back from
darker objects” (Philander, 2008, p. 24). Thus, in this context, materials are
characterized by their colors that can reflect incoming solar radiation with
values ranging from 0 (with withe color) to 100 (black color) (Philander, 2008).
In urbanized areas like cities and surrounding suburbs, most of the urban areas
are covered by man-made surfaces of different materials considering that
surfaces do not only include pavements but also building roofs, building
Figure 1.5 - Different reflected solar radiation depending on the surface’s albedo
Source: Author’s elaboration

23
façades and the whole built environment in general. In fact, as stated by
Mohajerani, Bakaric, and Jeffrey-Bailey in urbanized areas are mostly covered
by roofs and pavements (Mohajerani, Bakaric, & Jeffrey-Bailey, 2017) which
absorb heat from incoming solar radiation. Therefore, the material’s colors of
those surfaces are fundamental in order to reflect the maximum of solar
radiation striking on them and avoid the UHI effect;
▪ The “Atmospheric radiation is heat emitted by particles in the atmosphere, such
as water vapour droplets, clouds, pollution and dust” (Gartland, 2008, p. 17);
▪ The “Surface radiation is heat radiated from a surface itself” (Gartland, Heat
Islands: Understanding and Mitigating Heat in Urban Areas, 2008, p. 17).
Hence, surface radiation is strictly conditioned by the surface’s temperature
making hotter surfaces higher radiation emitters (Gartland, 2008).
4. Reduced convection
According to Gartland (2008) “Convection is energy that is transferred from a solid
surface to a fluid (i.e. a liquid or gas), in this case from the Earth’s surface to the
air above it” (Gartland, 2008, p. 16). Hence, convection is strictly related to wind
flows and to wind characteristics resulting in high or low convection according to
the intensity of wind flows which is one of the most important features of UHI effect,
characterized by stale warm air and an absence of air exchange (Oke 1982,
Gartland, 2008). As explained later (Chapter 4), the building, play “an important
role in the transport and removal of pollutants” (Priyadarsini, 2009, p. 263)
because, according to urban geometry (that is, building’s orientations N-S, W-E,
NW-SE, NE-SW, forms in terms of heights and location from one building to
another), wind flows be stimulated to and directed aiming to air exchange rather
than obstructing natural wind flows.
5. Increased anthropogenic heat
According to Gartland (2008), the last cause that generates the UHI effect is the
anthropogenic heat which “is generated by human activity and comes from many
sources, such as buildings, industrial processes, cars and even people themselves”
(Gartland, 2008, p. 22). Hence, anthropogenic heat depends on several different
variables like population number, the efficiency of public transports and the climate
regions resulting in diverse anthropogenic heat for every region.
In an interesting study made by Stone, Hess, and Frumkin (2010) on a comparison between
compact cities and large metropolitan regions over a given period (1956-205), have been
examined and demonstrated that Extreme Heat Events (EHEs) are most common in sprawl
metropolitan regions than in compact cities (Stone, Hess, & Frumkin, 2010). In their
research, they found that in addition to the negative features of sprawl previously listed,
lack of vegetation is a crucial driver to UHI (Oke, 1982). In this case, vegetation has to be

24
considered not as sporadic trees planted in small numbers but rather as parks and wide
green open spaces. The authors conclude stating that over the 10 years analyzed, “the
rate of deforestation in the most sprawling metropolitan regions is more than double the
rate in the most compact metropolitan regions” (Stone, Hess, & Frumkin, 2010, p. 1427).
The research made by these authors has been useful to understand that UHI occurs also,
and in some cases even harder, in sprawling areas than in more compact urban areas and,
therefore, sprawl suburbs also need strategies to tackle UHI.
1.2.2. Flooding
Floods are natural disasters meaning that it is intrinsic in climate nature and that is natural
to happen. Besides the climate regions, upon which depend on the frequency of rainfalls
and their intensity, floods can occur in every U.S. county randomly. In fact, “Floods are the
most common (and among the most deadly) natural disasters” (Denchak, 2019) and,
according to Brilly and Polic (2005), floods are the “most studied” (Brilly & Polic, 2005, p.
345) natural events since the “90 percent of weather-related disasters in the U.S. involve
some type of flooding” (Cannon, Gotham, Lauve-Moon, & Powers, 2019, p. 3). The
Federal Emergency Management Agency (FEMA) defines flooding as “A general and
temporary condition of partial or complete inundation of two or more acres of normally dry
land area” (FEMA, s.d.). Staying with this definition, it has to be pointed out that the normal
land area only refers to the climatologist status. In fact, land areas are urbanized in cities
and in suburbs, covered by impervious man-made surfaces. Because of the reasons just
cited, floods can hit and affect both people and the environment (both the built and the
natural ones) having huge impacts on our societies. According to Merz et al. (2010), there
are two types of floods damages: the direct damages that are those generated by impacts
on humans belongings, and the indirect damages which are the consequence of the direct
ones on humans livelihoods, which can last for a longer period (Merz, Kreibich, Schwarze,
& Thieken, 2010). According to the Natural Resources Defense Council (NRDC), there are
four different types of floods (Denchak, 2019):
1. River flooding
River floods require the presence of a river because they occur when “a river
overspills its banks; that is, when its flow can no longer be contained within its
channel” (Shaw, 2019).
2. Coastal flooding
This type of flooding affects those cities overlooking the sea and are, therefore,
linked to the sea level rise (e.g. Boston and San Francisco). People living in such
cities, which are real attractors due to the benefits generated by the close proximity
to the sea (Dassanayake, Burzel, & Oumeraci, 2012), are vulnerable to storm

25
events because of lacking any kind of obstacles in between (Hsu, Shih, Li, & Lin,
2017). As reported by the U.S. EPA (2016), coastal flooding in the U.S. occur
mostly in the East Coast and, comparing the two decades 2010-2015 and 1950-
1959, coastal flooding has worryingly increased (U.S. Environmental Protection
Agency, 2016). As Dassanayake, Burzel, and Oumeraci (2012) affirm, this is why
the “development of methodologies for the estimation of coastal flood risk has
become an urgent need for the identification and implementation of proper coastal
protection measures” (Dassanayake, Burzel, & Oumeraci, 2012, p. 241).
3. Flash floods
Flash floods occur when very intense rainfalls hit a dry surface lasting for a relatively
short period of time (also few hours of strong and constant rainfall could be enough
to obtain a flood) (Goudie, 2004). According to Gruntfest and Handmer (2001),
they are characterized by little lead period, ferociousness, expectancy in terms of
location and period and they generally occur at a small scale (Gruntfest &
Handmer, 2001). Moreover, flash floods are distinguished from the other types of
flooding by a high level of uncertainty; thus, covering areas with proper materials
and adaptation structures (e.g. water reservoirs) can help to alleviate the flooding
strongness and avoid severe damages. Unfortunately, due to their unexpected
nature and “because they are rare, the motivation to invest time and resources into
such activities is low.” (Montz & Gruntfest, 2002, p. 16).
4. Urban flooding
The previous types of floods can occur almost everywhere, and the severity of the
damages are related to the specific locations. When they occur in urban areas,
which are generally characterized by impervious surfaces such as streets, parking
lots and roofs, the phenomenon called “runoff” takes place (Denchak, 2019).
Urban runoff is the total amount of rain, usually fallen in a short period of time,
that could not manage to infiltrate on urban surfaces due to their imperviousness
(Rafieian, Khaleghi, Malekani, & Mahmoodi, 2014). Thus, urban flooding strictly
depends on the land uses and their respective degree of imperviousness. Natural
soils themselves have a maximum capacity of water storage according to their
pervious characteristics, once the rainfall gets over that given threshold, the water
starts flowing above ground. Considering that all kind of man-made surfaces are
less pervious than the natural ones, cities can be considered as “flood attractive”
and, due to the diffuse land consumption and its paved ground, sprawl is among
all one of the main causes of urban flooding leading to the affirmation that sprawl
is a development strategy to forget.
To conclude, floods are the most common natural disaster in the U.S. because they depend
on the interrelation of a multitude of factors and they can be generated as a consequence

26
of other natural disasters, such as storms and hurricanes (e. g. the Hurricane Katrina in
2005 with more than 1800 victims) 5
. Urbanized areas are vulnerable due to an extremely
high percentage of soil imperviousness, particularly the inner-city areas. However, urban
sprawl must be considered. Although urban density decreases further and further away from
the inner-city areas, the same does not happen for the perviousness. The main contributors
to floods in suburban areas are abundant asphalt roads, impervious roofs and wide public
parking around malls and around private houses that do not allow water to be infiltrated
causing violent surface runoff.
1.2.3. Drought
If the two previous impacts concern about an excess resulting from a collision between
natural power and anthropic influences, this third kind of impact is related, instead, to a
lack of natural primary need for human beings: the water. In fact, not only humans need
water, but it is necessary for the whole planet to continue to work (Madaan, s.d.). According
to Nagarajan (2009), drought “is the period when rainfall is less than normal for several
weeks, months or years, the flow of streams and rivers declines and water increases. If dry
weather persists and water-supply problem develops, the dry period can become a
drought” (Nagarajan, 2009, p. 3). Moreover, drought can occur in every type of climatic
regime in every part of the world, this is the reason why it is so difficult to give a unique and
comprehensive definition of drought. Nevertheless, it is easy to understand that droughts in
Sub-Saharan Africa differ from the North American ones because of a multitude of factors.
According to Trimble (2008), droughts are different because of three factors:
▪ Intensity, mainly related to the rainfall itself in terms of power and brutality of
damages caused;
▪ Duration, usually a minimum of one to a couple of months is necessary to be
considered a drought but it can last for much longer periods (even years);
▪ Spatial characteristics, which can expand or restrict according to seasons and
regions but, in general, every change in intensity occur slowly and progressively.
As in the case of floods, also droughts can be caused, or at least influenced, by urban
areas imperviousness. In fact, as noted by Szalińska, Otop and Tokarczyk, lacking water in
urban areas can be strictly linked with an elevated rate of “impervious area that increases
the surface runoff and reduces water storage in soils” (Szalińska, Otop, & Tokarczyk, 2018,
p. 2). Thus, in areas prone to droughts a well-managed system that combines both water
scarcity and rainfall should be considered in order to lower drought periods.
5 https://eu.usatoday.com/story/news/weather/2019/07/17/worst-floods-in-american-
history/39692839/

27
Similar to the other CC effects, also droughts can affect cities and societies in different ways
through direct or indirect impacts. The formers are generally environmental causes, the
latter are a consequence of the direct impacts. According to the National Drought
Mitigation Center (NDMC), drought impacts can usually affect three different sectors:
▪ Economic impacts
“Are those impacts of drought that cost people (or businesses) money” (NDMC ,
s.d.). Some examples could be related to a farmer and the monetary value of his
agriculture crops, destroyed by a drought;
▪ Environmental impacts
“Plants and animals depend on water, just like people” (NDMC , s.d.). Probably,
environmental impacts are the easiest a drought can affect because it drastically
changes their habitats and living conditions. Some examples could be related to
the drinking water scarcity for animals that would alter their capacity to face survival
problems;
▪ Social impacts
They are probably the weakest ones but have to be considered anyway. The social
impacts of droughts are those affecting “people’s health and safety” (NDMC , s.d.),
for example, respiratory problems due to polluted air caused by lack of rainfalls.
Concluding, it is difficult to define droughts due to their several and different variables that
take place. According to Wilhite and Glantz (1985), droughts depend not only on the three
factors (intensity, duration, and spatial scale) identified by Trimble (2008), “but also on the
demands made by human activities and by the vegetation on a region’s water supplies.
Drought’s characteristics along with its far-reaching impacts make its effects on society,
economy, and environment difficult, though not impossible, to identify and quantify”
(Wilhite & Glantz, 1985, p. 3).
1.3. Measures
As explained earlier in the Chapter, the climate is changing mainly due to GHG emissions
produced by human activities. In fact, as reported by the IPCC, “Human activities are
estimated to have caused approximately 1.0°C of global warming above pre-industrial
levels, with a likely range of 0.8°C to 1.2°C. Global warming is likely to reach 1.5°C
between 2030 and 2052 if it continues to increase at the current rate” (IPCC, 2018, p. 2).
Therefore, humans are at the core issue. We are producing, consuming and wasting as
never before. If we are the main cause of this tremendous change, we should also be the
ones able to control it and try to stop or, at least, limiting it. There are two main large

28
strategy policies that contain actions inside to tackle climate change: mitigation and
adaptation actions. In the research fields, they are usually considered separate. They have
nearly the same objective, that is tackle CC, but the ways in which they try to reach it is
slightly different. Nevertheless, is better to consider them as mutually necessary rather than
different and disconnected.
1.3.1. Mitigation
According to Duguma and Minang (2014), mitigation policies aim to reduce and contain
GHG emissions and increase GHG sinks (Duguma & Minang, 2014). Hardy (2003) stated
that “If we could reduce CO2 emissions at the source, we could eliminate much of the
greenhouse warming potential, but this is easier said than done” (Hardy, 2003, p. 187).
Considering the mitigation actions, they are strictly related with technologies and technical
sciences devoted to limit and control GHG emissions (Zhao, et al., 2018), which are
improving year by year and they will continue to do so even in the next future, especially in
the energy efficiency sector (Desonie, 2008). A key element in mitigation policies is,
therefore, the effort on the development of technologies to reduce GHG. According to
Desonie (2008), in order to reach the objectives fixed by the IPCC and to guarantee at
least the same healthy future for the next generations, the world society should switch to
other more sustainable energy sources avoiding those producing GHG emissions if we
want to guarantee a (Desonie, 2008).
Today is plenty of helpful and sustainable technologies that deal with climate change and
GHG reduction and they are constantly evolving, ranging from solar panels and windmills
to hydropower. Without belittling those sustainable technologies, they are not what this
thesis wants to focus on. However, as will be later explained in Chapter 3, advanced
technologies are not the only solution to mitigate CC. Actually, there is one strategy that is
100% sustainable (even more sustainable than the ones just cited), that has only positive
benefits because it is healthy, environmentally sustainable, it boosts the economy by being
free at the same time and that, therefore, has a magnificent impact on CC. This measure
is called walkability and will be detailed and explained later (in Chapter 3).
1.3.2. Adaptation
If mitigation measures help to reduce GHG emissions that generate CC, adaptation “is the
adjustment in natural or human systems in response to actual or expected climatic stimuli
or their effects, which moderates harm or exploits beneficial opportunities” (IPCC, 2007,
p. 6). Going deep into the topic, adaptation measures are those that are needed to
accommodate new conditions generated by some changes (climatic in this case). Whilst
mitigation actions involve people and cities at a larger scale, “Adaptation can be a specific
action, such as a farmer switching from one crop variety to another that is better suited to
anticipated conditions” (Leary, et al., 2008, p. 6).

29
The general background on which adaptation measures are based on is that limiting GHG
emission is mandatory for us and for future generations especially, but even if we stop
generating any kind of GHGs in a very short period of time, the world and its inhabitants
will continue to suffer from CC for a longer period. In fact, while applying mitigations
strategies and changing our consumption behaviors, everyone worldwide can decide to
“respond to environmental changes after they happen, or they can anticipate and prepare
for the changes” (Desonie, 2008, p. 156) thanks to adaptation measures.
As interestingly pointed out by Laukkonen et al. (2009), “mitigation aims to avoid the
unmanageable and adaptation aims to manage the unavoidable” (Laukkonen, et al.,
2009, p. 288). In other words, they are both useful and necessary if we want to reach the
thresholds fixed by the IPCC. McKibbin and Wilcoxen (2004) provided a perfect example
to understand that both mitigation and adaptation measures are needed. They compare
the difference between choosing mitigation or adaptation actions with the “decision to wear
seat belts versus installing anti-lock breaks on a car. The anti-lock breaks help to reduce
the likelihood of an accident (mitigation) whereas the seat belts help to prevent catastrophe
if there is an accident (adaptation)” (McKibbin & Wilcoxen, 2004, p. 1). Even if mitigation
and adaptation are both essential to tackle CC, they actually have some characteristics in
common and others in contrast. As underlined by Zhao et al. (2018), the main difference
between the two measures is concerning the scale of action. The best way to act towards
mitigation would be through policies with global range. That is, for example, prohibiting
car-driving within a certain radius from the city center, while encouraging and building
efficiency public transport systems to connects the suburbs and applying it worldwide (Zhao,
et al., 2018). In contrast, adaptation measures should act more locally and regionally to
obtain larger benefits as clearly illustrated in Figure 1.6.
Concluding, both mitigation and adaptation measures have to be considered today. They
share the same objective but they operate at different scales in time and in dimension areas
(Tol, 2005); thus, their benefits are different because “adaptation benefits are local and
mitigation benefits are global” (Locatelli, 2011). In the next Part II (Chapter 3 and 4) of
the thesis, it will be explained how these two approach options try to tackle climate change
in a very limited area: the square. The latter is considered as the central element upon
which the public realm is rooted.
Figure 1.6 – Comparison between mitigation and adaptation scale benefits Source: Author's elaboration based on: (Wilbanks, Leiby, Perlack, Ensminger, & Wright, 2007)

30
This page is intentionally left blank

31
2. Planning theories and actions
According to what discussed in the previous Chapter 1, the most immediate and obvious
idea to tackle CC would be stopping to drive. But this is not so easy, at least partially.
Moreover, in order to stay underneath the IPPC threshold6
which would allow avoiding
catastrophic consequences, complete car-removal is not mandatory, but a slightly high
decrease would be enough.
In order to face the dilated sprawl in the American suburbs, at the end of the 1980s a new
cultural and architectural movement started to be considered as the possible solution. The
New Urbanism was conceived by some experts in urban planning and architecture (among
which: Peter Calthorpe, Andres Duany, Elizabeth Plater-Zyberk, Robert Davis and Peter
Katz) in the belief of a pedestrian and bicycle-friendly, mixed-use, dense neighborhood in
a precisely defined net of blocks, streets, and squares.
New Urbanism has its roots in the Postmodernism movement, it has to be considered then
the successor of Modernism. According to Lucka (2018), considering Modernism in the
urban planning and architecture spheres, it has generated “two ‘products’: downtowns in
Le Corbusier’s style, and sprawling suburban areas” (Lucka, 2018, p. 18). It is in this context
that New Urbanists start working and developing their ideas, as this Chapter will try to
explain.
2.1. The New Urbanism and the Congress of the New Urbanism
As previously said, the ideals against which New Urbanism is been founded on start with
critiques against sprawl. Sprawl has been said that has also some positive aspects (for
example, privacy and owning a plot of land) but it definitely brings harmful and irretrievable
consequences (Lucka, 2018). Moreover, Lucka (2018) analysis the positive and negative
aspects of New Urbanism and found that, besides the evident land consumption and the
related environmental problems, suburban sprawl “leads to the spatial segregation of
inhabitants, usually based on race and income, and therefore generates concentration of
poverty” (Lucka, 2018, p. 19). Even if the thesis does not want to focus on social and
segregation aspects of sprawl, this is surely an important aspect to keep in mind.
Many professional figures were interested in getting their hands in such a problem, from
architects to sociologists to many others, given the large serious amount of negative
externalities sprawl emits. However, regarding urban planning, experts were coming from
every corner of the United States, mixing influences of the East and the West Coasts. The
main current movements of that time were the Eastern Neotraditional Planning and the
Western Transit Oriented Development (TOD), which were spatially opposite, but they
shared common ideas and principles.
6 The IPCC Reports refer to risks that may occur with global warming at temperature 1,5C° and
2C°; with risks substantially lower at 1,5C° than at 2C° (https://www.ipcc.ch/)

32
What emerged from the first “meeting” in 1991 is a set of principles better known as the
Ahwahnee Principles, the name of which derives from the “hotel in Yosemite National Park
in California where the meeting took place” (Howard, 2005, p. 31). Held in Alexandria,
Virginia, the second meeting can be considered as the birth of the New Urbanism as a kind
of reform movement. Experts in urban planning and architecture (among which: Peter
Calthorpe, Andres Duany, Elizabeth Plater-Zyberk, Robert Davis and Peter Katz) created a
non-profit organization called the Congress of the New Urbanism (CNU) in the belief of a
pedestrian and bicycle-friendly, mixed-use, dense neighborhood in a precisely defined net
of blocks, streets and squares (Howard, 2005). In 1996, a list of twenty-seven principles
institutionalized the guiding ideals of the developing movement in what is today known as
the Charter of New Urbanism (see Appendix I). So, comparing comes itself: as the Charter
of Athens7
(1938) stands for the CIAM, the Charter of New Urbanism (1996) stands for the
CNU. It could sound wired and unreasonable, but actually, as underlined by Howard
(Howard, 2005) the two movements and their relative outcomes have some features in
common. To start, both the documents emerged from the respective Congresses critique
their current situations proposing themselves as reformist movements that will ensure better
future conditions. But a great dichotomy characterizes the two Charters. The main
difference between the two lies in the fact that the CIAM in 1933 wanted to break away
from the traditional settlement of the city by pulling the land uses away from themselves
while, more recently, the CNU aims to recover the traditional neighborhood and cluster as
much uses as possible together (Howard, 2005).
The Charter of New Urbanism contains twenty-seven principles to define sustainable
planning guidelines organized in three spatial planning scales, each one holding nine
principles. The three scales are strictly linked one another starting from the smallest (the
block) which, if well managed, would give the possibility to obtain the middle scale (the
neighborhood) that, in turn, could lead to the largest one (the region) if planned according
to the principles. The latter is available in Appendix I and they are briefly explained as
follows:
▪ The region (with Metropolis, city, and town), where policies and strategies like those
for “economic development, pollution control, open-space preservation, housing”
(Leccese & McCormick, 1999, p. 13) have to match in order to obtain a region
made of villages and suburbs well connected among them and to the principal city
in terms of transportation services (including bus rapid transit and buses on
dedicated lanes, besides all types of rail transports) (Calthorpe, 2011);
▪ the neighborhood (with district and corridor), considered by the Charter as the
“heart of New Urbanism” (Leccese & McCormick, 1999, p. 71) and focuses on
mixed-use instead of zoning, density instead of spread, diversity instead of
7 The document resulted from the IV Congres Internationaux d’Architecture Moderne (CIAM) in
1933, promoted by the architect Le Corbusier.

33
uniformity aiming to social life activation in great public spaces. This middle-scale
identified by the Charter is based on the two pillars of New Urbanism: the
Traditional Neighborhood Development (TND) and the Transit-Oriented
Development (TOD), later explained;
▪ the block (with street and building), is the smallest scale and focuses on detailing
the neighborhood scale. That is, the neighborhood scale foresees diversity in its
spatial scale patter, thus this smallest scale should work on façades, for example.
In practice, this scale focuses on urban design strategies aiming to connect the built
environment with the community (Leccese & McCormick, 1999).
Respecting these explanations, it emerges that, for the scope of the thesis (squares and
plazas), only the neighborhood and especially the block scale will be detailed but having
the regional city background in mind.
2.2. The Pillars of New Urbanism
As said before, New Urbanism comes from the embrace of two schools of thought, the first
one captained by the architect and urban planner Peter Calthorpe based on the idea of
Transit Oriented Development placed in the West Coast under the technical and cultural
background of the Berkeley University. The second one, similarly, focuses on the
Neotraditional Planning led by Andres Duany and Elizabeth Plater-Zyberk (DPZ) on the
other side of the U.S. in Miami, Florida.
So far, we have discussed principles, concepts and guidelines of New Urbanism from the
theoretical point of view, but new urbanism has advanced pragmatic measures, methods
and urban patterns over time to apply in new developments. The following pages will
explain the practical features of the two urban movements developed in the 1980s that
have given rise to the New Urbanism.
2.2.1. Traditional Neighborhood Development
As described in the Charter of the New Urbanism (see Appendix I) the neighborhood is
considered as “the heart of the New Urbanism” (Leccese & McCormick, 1999) and has to
be considered as a basic “building block” (Duany, Plater-Zyberk, & Co., 2003, p. 3.2).
The architects DPZ “promoted a return to the principles of traditional urbanism and the
design of cities that fosters a sense of community” (Howard, 2005, p. 31). The return to
the concept of the traditional neighborhood meant by the New Urbanists swims against the
sprawl phenomenon. The neighborhood is considered by New Urbanists as “a compact
walkable urban pattern whose environment provides a balanced range of activities:
dwelling, working, shopping, and recreational and educational uses” (Duany, Plater-
Zyberk, & Co., 2003, p. 3.1). Even though the institutional identification of New Urbanism

34
dates from the 1990s, the architects Duany and Plater-Zyberk in the 1980s started to
develop their ideas which will become the basis of New Urbanism. In those years, they
projected SeaSide8
(Figure 2.1), a community neighborhood in Fort Walton Beach, Florida.
The neighborhood today is a kind of pedestrian-friendly resort and it is considered one of
the most iconic TND projects. The New Urbanist Traditional Neighborhood Development
(TND) derives from the Neighborohhod Unit concept that Clarence Perry designed for the
first Regional Plan of New York in 1929 (Howard, 2005). Duany Plater-Zyberk & Co. found
inspiration from Perry’s idea, and decided to modify some elements as they state (Figure
2.2 and 2.3):
▪ “Neighborohhod Unit: A diagram and description from the First Regional Plan of
New York (1929) which conceptualizes the neighborhood as the fundamental
element of planning.
▪ Traditional Neighborhood Development: A diagram that reconciles current
urbanization models with the traditional Neighborhood Unit” (Duany, Plater-
Zyberk, & Co., 2003, p. 3.1).
8 SeaSide neighborhood is the set of The Truman Show movie (1998). The fact emphasizes the
idyllic character of the Traditional Neighborhood Development character.
Figure 2.1 - Aerial view of SeaSide neighborhood Source: DPZ & Co. website (https://www.dpz.com/Projects/7903#)

35
The TND emphasizes the importance of pedestrian patterns by delineating standard
measures to apply within the neighborhood. Thus, the TND expects to be designed within
a walking distance of around 5 to 10 minutes from the core, which corresponds to a radius
of around ¼ mile from the center. What change between the two schemes proposed by
Perry and DPZ is better illustrated in Figure 2.4 retrieved from the Lexicon of the New
Urbanism (2003). The image shows that first, the DPZ’s scheme of TND is more detailed,
specifying that the school should be placed at the edge of the neighborhood in order to be
shared with the surrounding neighborhoods’ inhabitants and also changes in parking lots
and on thoroughfares types are made regarding their orientation, location and shape
having impacts on the traffic patterns (Duany, Plater-Zyberk, & Co., 2003).
Figure 2.3 - Dunay Plater-Zyberk’s diagram of an
Urban Neighborhood
Source: (Leccese & McCormick, 1999, p. 76)
Figure 9 - Dunay Plater-Zyberk’s diagram of an Urban Neighborhood Source: (Leccese & McCormick, 1999, p. 76)
Figure 2.4 - Changes from Perry's Neighborhood Unit (1927) to Dunay Plater-Zyberk's TND (1997)
Source: (Duany, Plater-Zyberk, & Co., The Lexicon of New Urbanism, 2003, p. 3.1)
Figure 2.2 - Neighborhood Unit according to Perry's
first Regional Plan of New York in 1929
Source: (Leccese & McCormick, 1999, p. 76)
Figure 8 - Neighborhood Unit according to Perry's first Regional Plan of New York in 1929 Source: (Leccese & McCormick, 1999, p. 76)

36
To define the spatial contexts in which human settlements develop, Duany Plater-Zyberk &
Co. drafted a Urban to Rural Transect (Figure 2.4) in order to differentiate developments
with different mixed-uses, densities and other urban measures according to their location
resulting in a definition of “human and natural habitats” (Duany, Plater-Zyberk, & Co.,
2003, p. 1.4).
As illustrated in Figure 2.5 retrieved from the Lexicon by DPZ (2003, p. 1.4), the Transect
is sub-divided into six zones: Natural, Rural, Suburban, General Urban, Urban Center, and
Urban Core becoming denser and more mixed going from the natural areas to the urban
ones, plus a Special District (SD) referred to industrial districts. However, according to
Duany and Talen (2002), the Transect should be considered as an approach to sustainable
urban planning “coherent in design, and composed of an array of livable, humane
environments satisfying a range of human needs” (Duany & Talen, Transect Planning,
2002, p. 245).

37
Figure 2.5 - The Urban to Rural Transect
Source: (Duany, Plater-Zyberk, & Co., The Lexicon of New Urbanism,
2003, p. 1.4)

38
2.2.2. Transit-Oriented Development
Meanwhile, in the West Coast at the University of Berkeley, California, Peter Calthorpe was
designing an idea of development called Transit-Oriented Development (TOD) with many
aspects and goals in common with the TND previously explained. TODs, differently from
its similar, are strongly centered on transit stations around which develop the whole
neighborhood guided by the New Urbanism principles. Hence, a TOD neighborhood
prefers mixed-use instead of zoning, walking pattern instead of vehicular flow (although the
automobile is allowed within certain measures) and it favors the public realm on the private
one. As already noted, TOD can be applied to different scales of planning, from the
regional one, by strengthening the rail network and concentrating sustainable urban
settlements around its stations, to more specific neighborhood Plans by the redevelopment
of existing areas or by the development of completely new projects.
In his most famous book The Next American metropolis (1993), Calthorpe gives theoretical
aspects, definitions and practical measures around which TODs are based. By definition,
TOD “is a mixed-use community within an average of 2000-foot walking distance of a
transit stop and core commercial area” (Calthorpe, The Next American Metropolis:
Ecology, Community and the American Dream, 1993, p. 56) illustrated in Figure 2.6.
What is central for all the similar development forms of New Urbanism, is that all the
elements (commercial activities, offices, residences and open public spaces) must be
covered by walkable pattern. The standard neighborhood design is obtained considering
that Calthorpe identifies a 2000-foot (around ½ mile) walking distance (around 10
Figure 2.6 - The Transit-Oriented Development (TOD) scheme according to Peter Calthorpe
Source: (Calthorpe, The Next American Metropolis: Ecology, Community and the American Dream, 1993, p.
56)

39
minutes) as comfortable for pedestrians. By designing a radius of such length around the
transit station, within the area resulting from the drafted circumference should be placed
first the commercial area next to the transit stop, then the open public spaces and the offices
and on the outwards the residential units. Obviously, not all the TODs can perfectly respect
the measure and organization of spaces as indicated in the figure proposed by Calthorpe.
Thus, the sketch must be considered as indicative, allowing soft changes according to the
context morphology in which the TOD is placed. Calthorpe identifies the most important in
his type of development not mixing uses ora density but, rather, walkability is the essential
factor TODs must consider. In fact, he states that if people commuting “can easily run
errands and coordinate trips on the way to or from a station, they are more likely to use
transit” (Calthorpe, 2011, p. 21) as happened for Fruitvale Village, Oakland (California),
which projected a pedestrian plaza/corridor next to a BART station revitalizing the
neighborhood, previously a rough area (Figure 2.7).
A similarity between the two types of development TND and TOD is that both differentiates
mixed-uses, density and parking lots according to the distance from the urban core, as
illustrated in the Urban to Rural Transect (Duany, Plater-Zyberk, & Co., 2003). But
according to Calthorpe, there also differences. He indicates that whilst a TOD must include
the transit station within the development area, the TND could be “located on a local or
feeder bus line within 10 minutes transit travel time (no more than 3 miles) from a truck line
transit stop” (Calthorpe, 1993, p. 57). Also according to Dunay & Plater-Zyberk, there is a
lot in common between TOD and TND, but their differences can be found “primarily in the
conception of the pedestrian shed: the location of its centroid, and its extent. These
Figure 2.7 - Aerial view of Fruitvale Village TOD project in Oakland, California
Source: Metropolitan Research Center, University of Utah (http://mrc.cap.utah.edu/trip-and-parking-
generation-at-transit-oriented-developments-phases-i-ii/)

40
differences manifest secondary consequences regarding the density of the required model
and the social quality of the center” (Duany, Plater-Zyberk, & Co., 2003, p. 3.2).
Comparing Figures 2.8 and 2.9, there is such a lot in common with the TND of Duany and
Plater-Zyberk and the TOD pioneered by Calthorpe that we can hazard saying that a TOD
is a TND exclusively centered on a transit station. In fact, whilst beginner TODs require
solely rail transit stop within its development, the TND, because of its greater freedom about
location, could be served by bus transports only.
As shown in Figure 2.8, the location of the
centroids in the TND pattern can be different
from the transit stop and is allowed to have
more than one of them resulting in a large
pedestrian catchment. This pedestrian priority
organization leads to relatively short walking
distances from the center enhancing bus transit
to be efficient (Duany, Plater-Zyberk, & Co.,
2003). Moreover, another advantage of TND
is that the main roads are expected on the
edges with related commercial activities,
avoiding then massive traffic transiting through
the neighborhood and having the possibility to
share commercial benefits with inhabitants
coming also from other close neighborhoods
(Duany, Plater-Zyberk, & Co., 2003). As a
negative consequence of this spatial
organization, there is the possible lack of
commercial power: because the centers do not
fit together with the rail transit stop, the
commercial spaces could serve only the
inhabitants without exploiting mass transit on
the rail network (Duany, Plater-Zyberk, & Co.,
2003).
As shown in Figure 2.9, TOD is developed
starting from a rail stop, which is “the most
efficient form of transit” (Duany, Plater-Zyberk,
& Co., 2003, p. 3.2) but also the most
expansive one, needing then high-density
population to be sustained. Contrary to the
TND, the TOD takes clear advantages from the
commercial point of view by locating its centroid on the rail station. At the same time, the
TOD pattern may be run into a lack of commercial benefits in the outward neighborhood
Figure 2.8 - TND pattern according to Duany Plater-
Zyberk & Co.
Source: (Duany, Plater-Zyberk, & Co., The Lexicon of
New Urbanism, 2003, p. 3.2)
Figure 2.9 - TOD pattern according to Duany
Plater-Zyberk & Co.
Source: (Duany, Plater-Zyberk, & Co., The Lexicon of
New Urbanism, 2003, p. 3.2)

41
areas. A challenge proposed by TOD is about the traffic flow around the transit node
because, on the one hand, it could provide very high accessibility to the station and to
commercial and institutional uses around it but, if not optimally managed, the vehicular
traffic could compromise the whole neighborhood (Duany, Plater-Zyberk, & Co., 2003).
TOD patterns have emerged to face suburban sprawl developing around the transit stations
higher density, mixed-use, and pedestrian-friendly environments. Nevertheless, TOD can
be planned also for urban areas where blocks present vacant lands that could be fulfilled
with the same development principles foreseen for those in the suburbs. In this sense, the
thesis is still focusing on the main New Urbanism’s targe area, also called “T3 - suburban
zone” by Duany, Plater-Zyberk, & Co. (The Lexicon of New Urbanism, 2003), but it will
also consider the zones “T4 – general urban zone” and T5 – urban center”, especially in
the case studies’ analysis.
2.3. Connecting TOD with today’s global Agendas
As seen in chapter 1, there are different ways in which climate change can be controlled
and limited. Due to rapid urbanization, GHG emissions and impacts on our lives, in recent
years the CC topic has reached its peak of attention. Nevertheless, it is since 19959
that
the UN held yearly Conferences of the Parties (COP) in order to set future objectives and
verify signs of progress and/or regressions on topics dealing with CC. With the TOD model,
in the 1990s New Urbanists partially anticipated what the UN proposed in 2015 and 2016
through the production of two documents. Expiring in 2030, the first document is
Transforming our world: the 2030 Agenda for Sustainable Development including 17
Sustainable Development Goals (SDGs) made of 169 targets that aim to complete, update
and improve the 8 Millennium Development Goals (MDGs) active for the period 2000-
2015. The second is The New Urban Agenda (NUA) adopted at the UN Conference on
Housing and Sustainable Urban Development (Habitat III) in 2016. These two agreements
are strictly related, but while the SDGs deal with sustainability in its broader terms, taking
care of sustainable humanity and ending poverty besides a sustainable planet, the NUA
focuses on human settlements referred to sustainable urban developments. Although this
relevant and useful difference, the two Agendas are strictly related since they share the
same aim. In order to understand how New Urbanism predicted the current problems and
conditions, is required integration between the two Agendas considering that NUA act as
a bridge for the SDGs in urban environments.
Among all, the most pertinent goal to urban development is the SDG11: Sustainable Cities
& Communities which aims to “Make cities and human settlements inclusive, safe, resilient
and sustainable” (United Nations, 2015, p. 21) and it is structured as follows:
9 The first COP meeting was held in Berlin in March 1995
(https://unfccc.int/process/bodies/supreme-bodies/conference-of-the-parties-cop)

42
“11.1 By 2030, ensure access for all to adequate, safe
and affordable housing and basic services and upgrade
slums
11.2 By 2030, provide access to safe, affordable,
accessible and sustainable transport systems for all,
improving road safety, notably by expanding public
transport, with special attention to the needs of those in
vulnerable situations, women, children, persons with
disabilities and older persons
11.3 By 2030, enhance inclusive and sustainable
urbanization and capacity for participatory, integrated
and sustainable human settlement planning and
management in all countries
11.4 Strengthen efforts to protect and safeguard the
world’s cultural and natural heritage
11.5 By 2030, significantly reduce the number of deaths
and the number of people affected and substantially
decrease the direct economic losses relative to global
gross domestic product caused by disasters, including
water-related disasters, with a focus on protecting the
poor and people in vulnerable situations
11.6 By 2030, reduce the adverse per capita
environmental impact of cities, including by paying
special attention to air quality and municipal and other
waste management
11.7 By 2030, provide universal access to safe, inclusive
and accessible, green and public spaces, in particular
for women and children, older persons and persons with
disabilities
11.a Support positive economic, social and
environmental links between urban, peri-urban and rural
areas by strengthening national and regional
development planning
11.b By 2020, substantially increase the number of cities
and human settlements adopting and implementing
integrated policies and plans towards inclusion, resource
efficiency, mitigation and adaptation to climate change,
resilience to disasters, and develop and implement, in
line with the Sendai Framework for Disaster Risk
Reduction 2015–2030, holistic disaster risk
management at all levels

43
11.c Support least developed countries, including
through financial and technical assistance, in building
sustainable and resilient buildings utilizing local
materials” (United Nations, 2015, p. 21)
The SDG11 fixes targets in order to face the rapid and unregulated urbanization in both
developed and developing countries generating un-proper suburban sprawl and slums,
respectively. To do so, “investment in public transport, creating green public spaces, and
improving urban planning and management in participatory and inclusive ways” (UNDP)
is necessary to create sustainable development and adapt cities to CC.
The concepts illustrated in the SDG11 targets are matched in some points of the NUA
which is structured in 175 points divided into 3 main chapters: the “shared vision”, the
“principles and commitments” and the “call for actions” (United Nations Habitat III, 2016).
The latter is the biggest chapter “identifying how cities should work to be sustainable”
(Okraszewska, et al., 2019, p. 6). Referring to the TOD model, the NUA’s main concepts
described in the document “have been grouped into three main pillars of sustainable
development: social, economic and environmental.” (Okraszewska, et al., 2019, p. 6).
Although TOD does not treat the topic specifically, it is acknowledged that it can be
considered a sustainable urban development thanks to the emphasis on limiting car-
dependency and combatting sprawl (Okraszewska, et al., 2019). Thus, the environmental
one seems to be the most coherent with the climatic objectives of TOD. The importance of
TOD model to tackle CC is specified in the NUA in point 114 (b) where TOD is cited and
highlighted: “Equitable “transit-oriented development” that minimizes the displacement, in
particular, of the poor, and features affordable, mixed-income housing and a mix of jobs
and services” (United Nations Habitat III, 2016, p. 29).
To conclude, this PART I highlighted that today we are facing the big and complex challenge
of CC which cornered human society. Cities and urban settlements in general play a crucial
in determining the fortunes of future generations. In this sense, urban planners and
architects should act in encouraging sustainable types of development based on pedestrian
environments and favoring the use of public transport while discouraging driving, a diffuse
practice incentivized in American suburban sprawl. Fortunately, strategies arose from a
New Urbanism, a revolutionary urban planning movement born from the encounter
between two American schools of thought, which principles and ideas are today met in the
UN goals and Agendas. New Urbanists develop theories and urban models like TOD and
TND which are applicable at almost every kind of scale, from the regional to the local one,
resulting in a very versatile model pertinent worldwide. Nevertheless, it does have a
downside. That is, by being so feasible, it could not respond to CC properly because the
same pattern should fix in different climatic areas, which are characterized by completely
different behaviors in terms of impacts. Therefore, to introduce PART II, other, more local,
strategies are needed, and they are found under the concept of Urban Design. New

44
Urbanists mention these aspects in the Block section of the Charter, but only in a
premonition way without specifying important aspects which will be underlined in PART II.

45
References PART I
Benzie, M. (2014). National Adaptation Plans and the Indirect Impacts of Climate
Change. SEI policy brief. Stockholm: Stockholm Environment Institute. Retrieved
December 23, 2019, from https://www.sei.org/publications/national-adaptation-
plans-and-the-indirect-impacts-of-climate-change/
Brilly, M., & Polic, M. (2005). Public perception of flood risks, flood forecasting and
mitigation. Natural Hazards, 5, 345–355. doi:https://doi.org/10.5194/nhess-5-
345-2005
Brons, M., Givoni, M., & Rietveld, P. (2009). Access to railway stations and its potential in
increasing rail use. Transportation Research Part A, 43(2), 136-149.
doi:https://doi.org/10.1016/j.tra.2008.08.002
Bruegmann, R. (2005). Sprawl: a compact history. Chicago: The University of Chicago
Press.
C40. (2017). How sustainable neighbourhoods are the building blocks of green, climate-
safe cities. Retrieved Novembre 26, 2019, from C40 Cities:
https://www.c40.org/blog_posts/sustainable-neighborhoods-july
Calthorpe, P. (1993). The Next American Metropolis: Ecology, Community and the
American Dream. New York: Princeton Architectural Press.
Calthorpe, P. (2011). Urbanism in the age of climate change. Washington, DC: Island
Press.
Cannon, C., Gotham, K., Lauve-Moon, K., & Powers, B. (2019, December 23). The
climate change double whammy: flood damage and the determinants of flood
insurance coverage, the case of post-katrina new orleans. Climate Risk
Management. doi:https://doi.org/10.1016/j.crm.2019.100210
Center for Biological Diversity. (n.d.). Biological Diversity. Retrieved January 23, 2020,
from Human Population Growth and Climate Change:
https://www.biologicaldiversity.org/programs/population_and_sustainability/clim
ate/
Cervero, R. (1996). California's Transit Village Movement. Journal of Public
Transportation, 1(1), 103-130. doi:https://doi.org/10.5038/2375-0901.1.1.6
Cervero, R. (2001). Walk-and-Ride: Factors Influencing Pedestrian Access to Transit.
Journal of Public Transportation, 3(4), 1-23. doi:https://doi.org/10.5038/2375-
0901.3.4.1
Chavarria, G., & dos Santos, H. (2012). Plant Water Relations: Absorption, Transport
and Control Mechanisms. In G. a. Montanaro, Advances in Selected Plant
Physiology Aspects (pp. 105-132). IntechOpen. doi:10.5772/33478
Dassanayake, D., Burzel, A., & Oumeraci, H. (2012). Extreme Storm Surges and Coastal
Flooding: Intangible Flood Losses in Integrated Risk Analysis. International Journal
of Ocean and Climate Systems, 3(4), 241-254.
doi:https://doi.org/10.1260/1759-3131.3.4.241

46
Denchak, M. (2019, April 10). Flooding and Climate Change: Everything You Need to
Know. Retrieved December 26, 2019, from Natural Resources Defense Council:
https://www.nrdc.org/stories/flooding-and-climate-change-everything-you-need-
know
Desonie, D. (2008). Climate: Causes and Effects of Climate Change. New York: Chelsea
House Publishers.
Duany, A., & Talen, E. (2002). Transect Planning. Journal of the American Planning
Association, 68(3), 245-266. doi:10.1080/01944360208976271
Duany, A., Plater-Zyberk, E., & Co. (2003). The Lexicon of New Urbanism. Retrieved from
https://www.dpz.com/Books/All
Duany, A., Plater-Zyberk, E., & Speck, J. (2000). Suburban nation: the rise of sprawl and
the decline of the American dream. New York City, NY: North point.
Duguma, L., & Minang, P. (2014). Climate Change Mitigation and Adaptation in the
Land Use Sector: From Complementarity to Synergy. Environmental Management,
54(3), 420-432. doi:https://doi.org/10.1007/s00267-014-0331-x
Ewing, R., Bartholomew, K., Winkelman, S., Walters, J., & Chen, D. (2008). Growing
Cooler: The Evidence on Urban Development and Climate Change. Washington,
DC: Urban Land Institute.
Feigon, S., Hoyt, D., McNally, L., Mooney-Bullock, R., Campbell, S., & Leach, D. (2003).
Travel Matters: Mitigating Climate Change with Sustainable Surface
Transportation. Washington, DC: Transportation Research Broad. Retrieved
January 23, 2020, from https://trid.trb.org/view/665601
FEMA. (n.d.). Definitions. Retrieved December 26, 2019, from Federal Emergency
Management Agency: https://www.fema.gov/national-flood-insurance-
program/definitions
Gartland, L. (2008). Heat Islands: Understanding and Mitigating Heat in Urban Areas.
London: Earthscan.
Goudie, A. (2004). Encyclopedia of Geomorphology. New York: Routledge Ltd.
Gruntfest, E., & Handmer, J. (2001). Coping with Flash Floods. Dordrecht: Kluwer
Academic Publishers.
Hardy, J. (2003). Climate Change: Causes, Effects, and Solutions. Chichester, West
Sussex PO19 8SQ, England: John Wiley & Sons Ltd.
Hirschhorn, J. (2004, April 5). Why Smart Growth Needs New Urbanism and Vice-Versa.
Retrieved November 25, 2019, from Planetizen - Urban Planning News, Jobs,
and Education: file:///C:/Users/giofo/Zotero/storage/Y9KD42EY/118.html
Howard, Z. (2005). New Urbanism: A New Approach to the Way American Builds.
Paisagem Ambiente: ensaios, 20, 27-46. Retrieved December 8, 2019, from
https://www.researchgate.net/publication/307728382_New_urbanism_a_new_a
pproach_to_the_way_american_builds

47
Hsu, T., Shih, D., Li, Y., & Lin, Y. (2017). A Study on Coastal Flooding and Risk
Assessment under Climate Change in the Mid-Western Coast of Taiwan. Water
MDPI Journal, 9(390), 390. doi:10.3390/w9060390
IPCC. (2007). Climate Change 2007: Impacts, Adaptation and Vulnerability. Contribution
of Working Group II to the Fourth Assessment. New York, NY: Cambridge
University Press.
IPCC. (2014a). Annex II: Glossary [Mach, K.J.; Planton, S.; von Stechow, C. (eds.)]. In
IPCC, Climate Change 2014: Synthesis Report. Contribution of Working Groups I,
II and III to the Fifth Assessment Report of the Intergovernmental Panel on Climate
Change [Core Writing Team, R.K. Pachauri and L.A. Meyer (eds.)] (pp. 117-130).
Geneva, Switzerland: IPCC.
IPCC. (2014b). Climate Change 2014: Synthesis Report. Contribution of Working Groups
I, II and III to the Fifth Assessment Report of the Intergovernmental Panel on
Climate Change [Core Writing Team, R.K. Pachauri and L.A. Meyer (eds.)].
Geneva: IPCC.
IPCC. (2018). Summary for Policymakers. In: Global warming of 1.5°C. An IPCC Special
Report on the impacts of global warming of 1.5°C above pre-industrial levels and
related global greenhouse gas emission pathways, in the context of strengthening
the global response to. Geneva, Switzerland.
Jacobs, J. (1961). The Death and Life of Great American Cities. New York: Random
House.
Kirkegaard, E. (2018, September 13). Clear Language, Clear Mind. Retrieved from Can
IPCC predict the future? Testing the 1990 predictions:
https://emilkirkegaard.dk/en/?p=7356
Knox, P., & Pinch, S. (2010). Urban Social Geography: An Introduction (6th ed.). Harlow,
UK: Pearson Education Limited.
Landsberg, H. (1981). The Urban Climate (Vol. 28). New York: Academic Press.
Laukkonen, J., Blanco, P., Lenhart, J., Keiner, M., Cavric, B., & Kinuthia-Njenga, C.
(2009). Combining climate change adaptation and mitigation measures at the
local level. Habitat International, 33, 287-292.
doi:10.1016/j.habitatint.2008.10.003
Leary, N., Adejuwon, J., Barros, V., Burton, I., Kulkarni, J., & Lasco, R. (2008). Climate
Change and Adaptation. Sterling, VA: Earthscan.
Leccese, M., & McCormick, K. (1999). Charter of the New Urbanism. New York:
McGraw-Hill / Congress for the New Urbanism.
Locatelli, B. (2011, August). Synergies between adaptation and mitigation in a nutshell.
Climate Change and Forests in the Congo Basin. doi:10.17528/cifor/003619
Lucka, D. (2018). How to build a community. New Urbanism and its critics. Urban
Development Issue, 59, 17-26.
Madaan, S. (n.d.). Natural Disaster: Types, Causes and Effects of Droughts. Retrieved
December 27, 2019, from Earth Eclipse: https://www.eartheclipse.com/natural-
disaster/types-causes-effects-of-droughts.html

48
McKibbin, W., & Wilcoxen, P. (2004). Climate policy and uncertainty: the roles of
adaptation versus mitigation. Brookings Discussion Papers in International
Economics, 61, 1-15. Retrieved December 29, 2019
McNeil, N., Dill, J., DeVitis, D., Doubleday, R., Duncan, A., & Weigand, L. (2017).
Manual on Pedestrian and Bicycle Connections to Transit. Washington, DC:
Federal Transit Administration. Retrieved from
https://trec.pdx.edu/research/project/1179/FTA_Manual_on_Pedestrian_and_Bic
ycle_Connections_to_Transit
Merz, B., Kreibich, H., Schwarze, R., & Thieken, A. (2010, August 8). Assessment of
economic flood damage. Natural Hazards and Earth System Sciences, 10, 1697-
1724. doi:https://doi.org/10.5194/nhess-10-1697-2010, 2010.
Mohajerani, A., Bakaric, J., & Jeffrey-Bailey, T. (2017, July). The urban heat island effect,
its causes, and mitigation, with reference to the thermal properties of asphalt
concrete. Journal of Environmental Management, 197, 522-538.
doi:10.1016/j.jenvman.2017.03.095
Montz, B., & Gruntfest, E. (2002). Flash flood mitigation: recommendations for research
and application. Environmental Hazards, 4, 15-22. Retrieved December 27,
2019
Nagarajan, R. (2009). Drought Assessment. New Delhi, India: Springer.
NDMC. (n.d.). Drought Effects. Retrieved December 28, 2019, from National Drought
Mitigation Center:
https://drought.unl.edu/Education/DroughtforKids/DroughtEffects.aspx
Oke, T. (1982, January). The energetic basis of the urban heat island. Quarterly Journal
of the Royal Meteorological Society, 108(455), 1-24. Retrieved December 24,
2019, from http://www.patarnott.com/pdf/Oake1982_UHI.pdf
Okraszewska, R., Jamroz, K., Michalski, L., Zukowska, J., Grzelec, K., & Birr, K. (2019).
Analysing Ways to Achieve a New Urban Agenda-Based Sustainable Metropolitan
Transport. Sustainability, 11(3), 813. doi:10.3390/su11030813
Parker, K., Horowitz, J., Brown, A., Fry, R., Cohn, D., & Igielnik, R. (2018, May 22).
Similarities and differences between urban, suburban and rural communities in
America. Retrieved November 24, 2019, from Pew Research Center’s Social &
Demographic Trends: https://www.pewsocialtrends.org/2018/05/22/what-
unites-and-divides-urban-suburban-and-rural-communities/
Philander, S. (2008). Encyclopedia of Global Warming and Climate Change. Thousand
Oaks, California: SAGE Publications, Inc.
Priyadarsini, R. (2009). Urban Heat Island and its Impact on Building Energy
Consumption. Advances in Building Energy Research, 3(1), 261-270.
doi:https://doi.org/10.3763/aber.2009.0310
Pucher, J., & Buehler, R. (2009). Integrating Bicycling and Public Transport in North
America. Journal of Public Transportation, 12(3), 79-104.
doi:http://doi.org/10.5038/2375-0901.12.3.5

49
Pucher, J., & Buehler, R. (2010). Walking and Cycling for Healthy Cities. Built
Environment, 36(4), 391-414. Retrieved December 23, 2019, from
http://www.atypon-link.com/ALEX/toc/benv/36/4
Rafieian, M., Khaleghi, S., Malekani, L., & Mahmoodi, M. (2014). The Effect of Urban
Expansion on Surface Runoff in Uremia City, Iran. [Conference paper]: 2nd
International Conference on Urbanism and Spatial Mobility: Dynamics of Space;
Mobility & Relationality. Retrieved December 27, 2019, from
https://www.researchgate.net/publication/308368406_The_Effect_of_Urban_Exp
ansion_on_Surface_Runoff_in_Uremia_City_Iran
Ritchie, H., & Roser, M. (2020). CO₂ and Greenhouse Gas Emissions. Our World in
Data. Retrieved January 24, 2020, from https://ourworldindata.org/co2-and-
other-greenhouse-gas-emissions#cumulative-co2-emissions
Saneinejada, S., Roorda, M., & Kennedy, C. (2012). Modelling the Impact of Weather
Conditions on Active Transportation Travel Behaviour. Transportation Research
Part D: Transport and Environment, 17(2), 129-137.
doi:https://doi.org/10.1016/j.trd.2011.09.005
Shaw, E. (2019, November 22). What Is a River Flood? Retrieved December 26, 2019,
from Sciencing: https://sciencing.com/about-6310709-river-flood-.html
Slingerland, J. (2012). Mitigation of the urban heat island effect by using water and
vegetation. Delft: Delft University of Technology: MSc Thesis. Retrieved from
https://repository.tudelft.nl/islandora/object/uuid:cd2976c6-7c06-4277-92d1-
a2dc5c054809/?collection=research
Stone, B., Hess, J., & Frumkin, H. (2010). Urban form and extreme heat events: are
sprawling cities more vulnerable to climate change than compact cities.
Environmental Health Perspectives, 118, 1425–1428.
doi:10.1289/ehp.0901879
Szalińska, W., Otop, I., & Tokarczyk, T. (2018, July 30). Urban drought. E3S Web of
Conferences, 45(00095). doi:https://doi.org/10.1051/e3sconf/20184500095
Tagliaventi, G. (2002). New Urbanism. Firenze: Alinea.
The World Bank Data. (n.d.). Life expectancy at birth, total (years). Retrieved November
23, 2019, from World Bank Data:
https://data.worldbank.org/indicator/SP.DYN.LE00.IN?end=2017&start=1960&
view=chart
Tol, R. (2005). Adaptation and mitigation: trade-offs in substance and methods.
Environmental Science & Policy, 8, 572-578. doi:10.1016/j.envsci.2005.06.011
Trimble, S. (2008). Encyclopedia of Water Science. Boca Raton, FL: CRC Press: Taylor &
Francis Group.
U.S. Environmental Protection Agency. (2016). Climate change indicators in the United
States, 2016 (4th ed.). Retrieved December 22, 2019, from
https://www.epa.gov/climate-indicators

50
U.S. Environmental Protection Agency. (n.d.). Greenhouse Gas Inventory Data Explorer.
Retrieved November 24, 2019, from U.S. EPA:
https://cfpub.epa.gov/ghgdata/inventoryexplorer/#allsectors/allgas/gas/all
UCSUSA. (n.d.). Climate Impacts. Retrieved December 23, 2019, from Union of
Concerned Scientists, United States of America:
https://www.ucsusa.org/climate/impacts
UCSUSA. (n.d.). Each Country's Share of CO2 Emissions. Retrieved November 23, 2020,
from Union of Concerned Scientists, United States of America:
https://www.ucsusa.org/resources/each-countrys-share-co2-emissions
UN DESA. (2018, May 16). 68% of the world population projected to live in urban areas
by 2050, says UN. Retrieved from United Nations Department of Economic and
Social Affairs: https://www.un.org/development/desa/en/news/population/2018-
revision-of-world-urbanization-prospects.html
UNDP. (n.d.). Goal 11: Sustainable cities and communities. Retrieved January 22, 2020,
from United Nations Development Programme:
https://www.undp.org/content/undp/en/home/sustainable-development-
goals/goal-11-sustainable-cities-and-communities.html
United Nations. (2015). Transforming our world: the 2030 Agenda for Sustainable
Development. New York, NY: United Nations. Retrieved January 21, 2020, from
https://sustainabledevelopment.un.org/post2015/transformingourworld
United Nations Habitat III. (2016). New Urban Agenda. Quito, EC: United Nations.
Retrieved January 21, 2020, from http://habitat3.org/the-new-urban-agenda/
United Nations. (n.d.). Population. Retrieved November 23, 2019, from United Nations:
Shaping our future together: https://www.un.org/en/sections/issues-
depth/population/index.html
Urban Design Group. (n.d.). What is Urban Design. Retrieved February 14, 2020, from
UDG: http://www.udg.org.uk/about/what-is-urban-design
Varnes, D. (1984). Landslide hazard zonation: a review of principles and practice. Paris:
United Nations Educational (UNESCO).
Wachowski, L. W. (Director). (1999). The Matrix [Motion Picture].
Wilbanks, T., Leiby, P., Perlack, R., Ensminger, J., & Wright, S. (2007). Toward an
integrated analysis of mitigation and adaptation: Some preliminary findings.
Mitigation and Adaptation Strategies for Global Change, 12, 713–725. doi::
10.1007/s11027-007-9095-4
Wilhite, D., & Glantz, M. (1985). Understanding the Drought Phenomenon: The Role of
Definitions. Water Journal, 111-120. doi:10.1080/02508068508686328
World Population Review. (n.d.). 2020 World Population by Country. Retrieved November
23, 2019, from World Population Review: http://worldpopulationreview.com/
Yang, L., Qian, F., Song, D., & Zheng, K. (2016). Research on Urban Heat-Island Effect.
Procedia Engineering, 169, 11-18. doi:10.1016/j.proeng.2016.10.002

51
Zhao, C., Yan, Y., Wang, C., Tang, M., Wu, G., Ding, D., & Song, Y. (2018).
Adaptation and mitigation for combating climate change – from single to joint.
Ecosystem Health and Sustainability, 4(4), 85-94.
doi:10.1080/20964129.2018.1466632

52
PART II
Plaza Design: How a Square can tackle CC

53
Introduction
As underlined in the masterpiece The Architecture of Community (Krier, Thadani, & Hetzel,
2009), the public squares embedded in the street networks and the public buildings have
to be considered not as layers disconnected but as one single system that dialogues every
day with the community that lives in the same system (Figure 3.1).
“All traditional architecture clearly distinguishes between public
symbolic institutional buildings, on the one hand, and utilitarian
private buildings, on the other. The former expresses the qualities
of things public, of res publica – dignity, solemnity, and grandeur;
the latter, the private activities of housing, commerce, and industry
in the res privata and the res economica. If factories have the
facades of cathedrals and houses resemble royal palaces, if
museums look like assembly lines and churches like industrial
warehouses, a basic value of the body politic is threatened, the
very nature of its public realm is in peril. But what is the nature
and hierarchy of architectural objects?” (Krier, Thadani, & Hetzel,
2009, p. 29)
Figure 3.1 - Léon Krier's 1983 diagram on the city knitting together public and private buildings
Source: CNU Public Square (Steuteville, 2017)

54
PART II starts with a brief introduction to what is Urban Design and why it plays such an
important role within the developing processes of urban and suburban TODs. Chapters 3
and 4 will deal with the thesis core topic: the plaza design. Public squares are a part of
what is called the public realm. According to Moughtin (2003), the public realm refers to
“streets, boulevards, squares and public parks together with the building façades that define
them” (Moughtin, 2003, p. 2). The first fundamental requisite for every kind of plaza in
every part of the world is the ability to host people and offer them a comfortable, safe and
pleasant place to be. But, according to the climate changes and the relative impacts in
urban and suburban areas explained in the previous Chapters, public squares, considered
as central elements of urban settlements, should also behave properly in facing CC.
Bearing in mind New Urbanists' theories and principles, this second part basically tries to
assembly methods and strategies to tackle CC with both mitigation and adaptation
measures applicable in public squares and its next surroundings through urban design. As
underlined by the CNU, “New Urbanism is focused on design, which is critical to the
function of communities” (Congress for the New Urbanism, s.d.). According to New
Urbanists, urban design is the way through which the community can recognize a sense of
belonging of a certain place, through which can be stimulated to actively participate in the
social life of the neighborhood but also through which the most important objective – walk(-
)ability – can be achieved. According to Hebbert (2003), New Urbanists have always been
attracted by Urban Design, in particular “when urban growth and renewal were managed
through design strategies that used conventional systems of streets and spaces, shaped
through techniques of alignment, active frontage, parcellation, height control and public
land scaping” (Hebbert, 2003, p. 200). Since the times of the Greek agorà, the public
square has been the place where the community could meet other people, hang out and
share lives harmoniously. Since that period, many things have changed but the public
square, if designed properly, still represents the vital core of urban and suburban
settlements. New Urbanists theories dedicate efforts to reducing car-dependency and act
towards the achievement of a pedestrian-friendly environment. To do so, as already
explained, the TOD model is based around a transit station while TND allows a larger
automobile usage and, for this reason, TOD is the model chosen to which the next Chapters
will refer to. In this context, therefore, urban design is considered as the vehicle through
which walkability can be achieved and, given its public transit nature and pedestrian-
friendly character, the promotion and attainment of walkability rules are considered as
mitigation actions.
However, as largely explained in Chapter 1, mitigating climate changes, which is
undoubtedly a pressing need, could be long-lasting and exhausting. To “alleviate” the
(hopefully not) long waiting for GHG emission reduction, adaptation actions represent a
healthy and sustainable way to answer to CC. Although New Urbanist theories do not
dedicate efforts on how to adapt to such changes, they share many aspects with the urban
design intended as:

55
“the collaborative and multi-disciplinary process of shaping the
physical setting for life in cities, towns and villages; the art of
making places; design in an urban context. Urban design
involves the design of buildings, groups of buildings, spaces
and landscapes, and the establishment of frameworks and
processes that facilitate successful development” (Urban
Design Group, s.d.).
Given this definition, Urban Design touches many different disciplines, from planners and
architects to sociologists and ecologists, at all small scales but, in this thesis, only its
sustainable and environmental side will be dealt with. Carmona is a Professor at the Bartlett
School of Planning, London, UK, focusing on Urban Design. He argues that all the different
actions act in an urban settlement should be coordinated because, even if they are placed
at very small scale (e.g. urban furniture), “their aggregation results in major effects on the
overall natural systems of the neighbourhood, town, city, region” (Carmona, Heath, Oc, &
Tiesdell, 2003, p. 40). Likewise happens for adaptation measures, because even if the real
contribution of a lonely square could seem slight, a neighborhood could be made of more
than one plaza, a city is made of more than one neighborhood and so forth until the entire
build environment worldwide. Therefore, urban design is a process that should be applied
also in public square, it is a process that every professional figure dealing with the built
environment, planners and urban designers in particular, should apply for every
development. With the growing warming cities and environments, then, urban design is
the strategy that best accommodates CC adaptations. Although in Chapter 1 has been
argued that technology advances play an important role in combatting CC (Desonie,
2008), and it is still confirmed, Lang, Professor of Architecture at the University of New
South Wales in Sydney, Australia, contrary, states that environmental threats are not
solvable by advanced and energetical efficient technologies only (Lang, 1994). PART II will
try to explain how.
Once understood that urban design can come in several forms and scales, it is necessary
to state that this PART II focuses on squares only, which exist in what Lang defines the
“terrestrial niches” aiming to “improving its quality so that it functions better as a self-
sustaining system that, in return, enriches human experiences” (Lang, 2005, p. 21).
According to Carmona (2009), Urban Design is based on nine principles:
1. Stewardship, referred to the easy management of the urban environmental
qualities: “clean and tidy, green, unpolluted, secure, safe, accessible, socially
inclusive and fulfilling, economically vital and viable, physically attractive”
(Carmona & de Magalhaes, 2009, p. 526);
2. Resource efficiency, referred to all those forms of technologies that involve
sustainable energy (from solar panel to the surface materials) but, in particular, this

56
principle refers to the strategic design of spaces which allow resource savings (e.g.
natural lighting and ventilation);
3. Diversity and choice, referred to the creation of attractive places that stimulate
people to choose walking (or bicycling) instead of driving being diverse, mixed and
easily accessible;
4. Human needs, referred to as indispensable to achieve environmental needs
because, as happens in the case of CC, human’s health and comfort are strictly
dependent on environmental impacts (Carmona, 2009);
5. Resilience, referred to the ability to adapt to present and, especially, to future
changes. In fact, in the case of public spaces, resilience is meant as the ability to
adapt to the numerous and diverse functions public spaces – like squares – can
host;
6. Pollution reduction, referred to the location and orientation (and others) of
buildings, public spaces and neighborhoods can affect the whole environment by
reducing resources needs and GHG emissions;
7. Concentration, referred to the compactness and density of urban settlements. The
principle is based on the preference of a fine-grained disposition trying to compact
not only buildings but also vehicular road, thus, removing precious space from the
drivable environment and donating it to the public realm;
8. Distinctiveness, referred to the interesting value of the public realm that
characterizes the built environment, in accordance to the aesthetical characters of
the settlement in order to be distinct and in coherence with the surroundings at the
same time;
9. Biotic support, referred to fundamental ecological efforts that plants, vegetation,
landscape, and urban green system have on the built environment.
These nine principles are valid for all the spatial scales: “the building, urban space,
quarter and settlement-wide scales” (Carmona, 2009) but, for the purpose of the thesis,
only the building, space and quarters scales are considered as explained in Table 2
(Carmona, 2009). The Table shows how the different principles of urban design can
interact according to the different spatial scales, resulting in a sort of list of guidelines
to apply in urban and suburban spaces. These guidelines are the starting point from
which to start to develop sustainable urban design places. In the case of Table 2, in
fact, Carmona (2009) delineates just some keywords that should be considered while
planning the built environment but, since every place differs from another first because
of its geographical location, we should consider that each place be designed according
to the sustainable design principles, but they should be declined according to the
climatic conditions of a certain place.

57
Table 3.1 - Sustainable design principles by spatial scale
Buildings Spaces Quarters
Stewardship Responding to and
enhancing context
Design for easy
maintenance
Responding to and
enhancing context
Managing the public realm
Allowing personalisation of
public space
Traffic calming
Design for revitalisation
Developing a long term
vision
Investing necessary
resources
Resource
efficiency
Using passive (and active)
solar gain technologies
Design for energy
retention
Reduce embodied energy
- local materials and low
energy materials
Use recycled and
renewable materials
Design for natural light
and ventilation
Layouts to allow sun
penetration
Spaces that reduce vehicle
speeds and restrict vehicle
circulation
Design spaces that reduce
wind speeds and enhance
microclimate
Using local, natural
materials
Capture and recycle water
Reduced parking standards
Urban block depths that
allow sun and natural light
penetration and which
encourage natural
ventilation
Using combined heat and
power systems
Local access to public
transport
Diversity and
Choice
Provide opportunity to mix
uses within buildings
Mix building types, ages
and tenures
Build accessible, lifetime
homes and buildings
Mix uses along streets and
in blocks
Design for walking and
cycling
Combat privatisation of the
public realm
Remove barriers to local
accessibility
Mix uses within quarters
Design a fine grained street
and space network (micro
scale)
Support diversity in
neighbourhood character
Localise facilities and
services
Human Needs Support innovation and
artistic expression in
design
Design to a human scale
Design visually interesting
buildings
Provide high quality,
legible, public spaces
Combat crime through
space design and
management
Enhance safely by reducing
pedestrian/vehicle conflict
Design for social contact
and for safe children’s play
Design visually interesting
networks of space
Enhance legibility through
landmark and space
disposition
Socially mix communities
Support social capital
Resilience Build extendible buildings
Build adaptable buildings
Build to last
Use resilient materials
Design robust spaces,
usable for many functions
Design spaces able to
accommodate above and
below ground infrastructure
requirements
Design of serviceable
space
Design to allow fine grained
changes of use across
districts
Robust urban block layouts

58
Pollution
Reduction
Reuse and recycle waste
water
Insulate for reduced noise
transmission - vertically
and horizontally
On-site foul water
treatment using SUDs
Reduce hard surfaces and
run-off
Design in recycling facilities
Design well ventilated
space to prevent pollution
build-up
Give public transport
priority
Match projected co2
emissions with tree planting
Plant trees to reduce
pollution
Tackle light pollution
Concentration Design compact building
forms to reduce heat loss
i.e. terraces
Bring derelict buildings
back into use
Consider high buildings
where appropriate
Reduce space given over to
roads
Reduce space given over to
parking
Increase vitality through
activity concentration
Intensify around transport
intersections
Raise density standards and
avoid low density building
Build at densities able to
support a viable range of
uses, transport and facilities
Respect privacy and security
needs
Distinctiveness Consider surrounding
architectural character
when designing
Enhance locally distinctive
building settings
Retain important buildings
and heritage
Reflect urban form,
townscape and site
character in design
Retain distinctive site
features
Design for sense of place -
local distinctiveness
Retain important building
groups and spaces
Reflect morphological
patterns and history -
incremental or planned
Identify and reflect
significant public
associations
Consider quarter uses and
qualities
Biotic Support Provide opportunities for
greening buildings
Consider buildings as
habitats
Design in robust soft
landscaping
Plant and renew street trees
Encourage greening and
display of private gardens
Provide minimum public
open space standards
Provide private open space
Create new or enhancing
existing habitats
Respect natural features
Source: Author’s re-elaboration based on: (Carmona, Sustainable Urban Design: Definitions and Delivery,
2009)
According to these principles, urban design is, therefore, useful to provide a proper and
sustainable environment for those using the public realm, since they provide comfort by
organizing buildings that shape public spaces and, consequently, neighborhoods.
Proceeding toward the core topic of the thesis, since these three urban scales identified are
the basis of the Urban Design process, they are able to influence, and at the same time,
they are being influenced by the CC impacts, according to the nine sustainable Urban
Design principles listed before. Therefore, the occurrence of the UHI effect, flooding, and
droughts and the intensity degree with they occur, are being influenced and, at the same

59
time influence the building, space and quarter scales. Consequently, they are involved in
the Urban Design process playing a crucial role in tackling CC. The following draft tries to
embrace specific design strategies and actions arising from the principles of Urban Design,
with particular regard for the public square. In this way, they have been subdivided
according to their principal climatic target:
▪ Mitigation goal: reduce GHG emission by reducing car-driving and increasing
pedestrian-friendly spaces;
▪ Adaptation goal: increase the ability to adjust to climate changes by making public
spaces less vulnerable to CC impacts.
Some measures identified in Figures 3.2 and 3.3, can have more than one single
functionality and be useful in achieving both the targets. Taking water bodies as an example
(e.g. fountains), their attractivity value is commonly spread worldwide since childhoods,
therefore, placing a fountain in the middle of a square could be a beneficial strategy to
increase walkability. Probably of less common knowledge is the positive effect water bodies
have on reducing high temperatures caused by the UHI effect thanks to their technical
properties.
In the following Chapters are detailed all the measures that should be designed in order to
achieve sustainable public squares in terms of CC.

60
Figure 3.2 - Urban Design Principles and Mitigation measures
Source: Author’s elaboration

61
Figure 3.3 - Urban Design Principles and Adaptation measures
Source: Author’s elaboration

62
This page is intentionally left blank

63
3. Mitigation measures
As explained in Chapter 1, mitigation measures aim to limit GHG emissions to avoid further
warmer temperatures. Considering the plaza or square as a single element of the public
sphere, it is not easy to think about it as a useful component to reduce GHG emissions but,
according to New Urbanists, an increase in the number and quality level of public spaces
and their higher expression - the square – could represent a good starting point.
The main aim of plazas is to be attractive and as accessible as possible, in other words, it
focuses on its walkability. Before starting to explain what are the urban design elements
that make a plaza appealing, we must say that a successful plaza depends not only on the
plaza itself but, firstly, on its surrounding context. Whilst the previous Chapter 2 illustrated
the benefits and characteristics of TOD, this one is working more on the pedestrian-oriented
side of cities. This because of several reasons, not least the unregulated use of the
automobile even for very short distances, causing heavy road traffic and changing
irreversibly our climate conditions. Hence, by placing pedestrians on the top of the peaky
order to be safeguarded, New Urbanists face one of today’s biggest hitch in American
cities. In a study made by NationMaster (Nation Master, 2014), after the Republic of San
Marino and Monaco, the U.S. is the country with the highest number of automobiles (797)
per 1000 capita; that means almost 1 for each American citizen. These numbers make
stand out the ideals of the New Urbanists.
There are several ways to try to solve this problem. In some cities traffic is not allowed on
the road on Sundays, in others driving is not possible between a certain period of time and
still, in other cases, some areas, frequently located in the inner ones, are completely
forbidden to motor vehicles. The latter option seems to be the easiest and efficient. Actually,
it is efficient, but not necessarily the easiest to be obtained.
3.1. Walkability
The Danish architect Gehl has dedicated his professional life to improving cities by donating
more spaces to pedestrians and cyclists and orienting them to the public realm. He states
that “Walking is first and foremost a type of transportation, a way to get around, but it also
provides an informal and uncomplicated possibility for being present in the public
environment” (Gehl, 2011, p. 133). The way in which public space is perceived is subjective
and change from person to person according to their preferences, habits, and lifestyles, of
course. A public space can have different functions and can serve a multitude of purposes
through different approaches: walking, sitting and standing (Gehl, 2011). In this Chapter,
the first approach leads the other two because while standing and sitting involves a
stationary usage, walking, as will be later explained, is a motor function with higher
potential reduction impacts on GHG emissions.

64
3.1.1. Walkability benefits
In this paragraph are explained the multiple benefits of investing in walkability. For the
purposes of this thesis, what matters the most are the impacts that walkability has on CC
but, as it will be explained, it is not only a matter of CC itself but there are many indirectly
correlated important elements that contribute to improving a community lifestyle. In fact,
walkable patterns and pedestrian-oriented developments can affect:
1. Wealth benefits
The already cited Speck, in his new book Walkable city rules: 101 steps to making
better places (Speck, 2018) states that walking costs are not expensive, especially
if compared to car and public transports (Figure 3.4).
Besides the obvious but true money-saving, according to research made by
Shrikant, operating towards walkability within cities “also attracts diverse
populations and creates jobs” (Shrikant, 2018). Furthermore, Shrikant found that
“people also tend to spend more money in walkable cities, stimulating the local
economy” (Shrikant, 2018). However, it should be considered that even if
pedestrian-oriented developments bring enormous benefits itself, in order to
completely exploit its advantages, a city should be prepared to host pedestrian flow.
That is, every form of urban planning that stimulate pedestrian flows like safe
sidewalks and attractive spots should be applied and, in terms of wealth,
commercial and retail activities (cafès, restaurant, etc.) along the pedestrian
corridors or public squares tempt pedestrians to take a walk;
Figure 3.4 - Commuting cost comparison between walking, biking, bussing and driving
Source: (Speck, 2018, p. 3)

65
2. Climate Change benefits
In an article published on The Guardian website, Milman states the biggest source
of GHG emissions are not houses and electricity but transports, including “cars,
trucks, planes, trains and shipping” (Milman, 2018). At the city, district and
neighborhood level it is, therefore, necessary to discourage the use of private
vehicles as much as possible in favor of walking, bicycling and public transports,
rather than private. As underlined by Speck, “the first thing one learns in city-
planning school is that how we move determines how we live” (Speck, 2018, p. 7),
thus, basing cities and suburbs towards pedestrian-oriented developments should
be a primary necessity. Hence, by siphoning off impermeable and polluted land
from vehicles transit, more precious pedestrian areas would be created resulting in
better climate conditions;
3. Health benefits
A walkable city can lead to saving lives. It is not news that climate change has very
dangerous impacts on human health and on our natural environment. Climate
change is produced by different sources but whilst most of the smog was previously
produced by the factory and industrial sector, today car emissions represent the
most significant ones (Lutz & Fernandez, 2010, p. 172). According to Caiazzo et
al., “in 2010 there were around 160.000 premature deaths in the U.S. due to
PM2.5 exposure and around 4300 deaths related to ozone exposure” (Caiazzo,
Ashok, Waitz, Yim, & Barrett, 2013, p. 198). It is evident that in order to obtain
cleaner air, more vehicles should be taken off the streets, and donating them to
pedestrians would be a great deal. Another important aspect of the health problem
is obesity. According to the World Population Review (Most Obese Countries
Population, 2019), the United States is one of the countries with a higher
percentage of overweight people in the world (36,2% of the total population)10
,
obesity must be considered a real health problem for Americans. Obesity is strictly
linked with the sprawl phenomenon. Its nature, in fact, by requiring the use of the
automobile as almost the only way of transports to cover all the distances, make
people deciding to take the car and turning them into lazy – and fat – human
beings. As a result, if a city is walkable, it is less likely that the population will be
overweight and, of course, fewer diseases would be caused by obesity (not to
mention the countless psychological benefits associated with physical activity). As
reported by the National Safety Council (NSC), fatal car accidents in 2018 in the
U.S. caused at least 40000 deaths for the third consecutive year (40.231 deaths
in 2017 and 40.327 deaths in 2016), and about 4,5 million people were seriously
injured (National Safety Council, s.d.). Since fatal accidents are mostly caused by
vehicle traffic, less vehicle traffic means less fatal accidents and, once again, a
10
http://worldpopulationreview.com/countries/most-obese-countries/

66
walkable city could provide nice health benefits to citizens avoiding unexpected
deaths.
3.2. How to reach walkability
After having explained – very briefly - all the positive impacts a city can benefit from the
insertion and/or the implementation and the enrichment of walkable patterns, now it is
important to define how to reach walkability. What are the elements that stimulate a person
to go-by-foot and not go-by-car? If we think of closing to motor traffic a previously busy
road randomly without thinking on details, then we might obtain an even worst result. No,
it would be not enough. As Duany, Plater-Zyberk, and Speck describe in their masterpiece
Suburban Nation: the rise of sprawl and the decline of the American dream (2000), the
devil is the details. Reminding that the focus is about how a public square can intervene in
tackling CC, the following pages of the Chapter are dedicated to the mitigation measures
that merge onto the wider, complex and sustainable Urban Design Process.
3.2.1. Square dimensions
The dimension of a square can vary depending on a multitude of factors: will the square
be created within an already existing settlement of buildings or it will be a new public space
inserted in a wider new project? What its function will be? Under which zoning regulation,
laws, urban standards, will be developed? Many others are the aspects and considerations
to take into account in order to outline square dimensions. Some scholars dealing with
urban planning and public space, in particular, tried to do so in the past resulting in a
series of ideas, principles, and approaches to public space. As already said, the concept
of public square date back to the Greek’s agorà and, since that period, many studies on
the design of public space have been carried out, especially from the European point of
view.
Camillo Sitte in 1889 published a pioneering book called Der Städtebau nach seinen
künstlerischen Grundsätzen (“City Planning According to Artistic Principles” or “The Art of
Building Cities”) on urban planning with particular regards on public spaces of that period,
especially in Germany and Italy. In his masterpiece, Sitte stated that the square dimensions
are strictly related to the road network that encompasses it. Street widths, as squares’, can
change according to the city and the location. Street measures are crucial to the valorization
of the public square and they can measure around fifteen to twenty-height meters to, as
happens in many European (e.g. Champs Elysèes in Paris) cities can reach up to more than
hundreds of meter widths. However, Sitte argues that 58 x 142 meters is the medium
dimensions in the biggest squares in ancient European cities (Sitte, 1981).
Kevin Lynch in his book Site Planning (1962), defines that “the most successful enclosed
square of the past have not exceeded 450 feet” (Lynch, 1962, p. 60) which is around 137
meters.

67
The Danish architect Gehl in Cities for People (2010) argues that a typical dimension for
public square should not exceed a hundred meter per side, resulting in a maximum square
area of one hectare.
However, all the opinions given by such important and influencing authors are obviously
related to European city structure and rich cultural heritage. Within the American context,
pretty far from the previous ones, the more recent ideas of TODs express different square
sizes. According to due Duany, Sorlien and Wright, in the manual The SmartCode Version
9.2 (2003) they define precise dimensions an open space should contain, according to the
type of public space. So far it has been discussed without making any differentiation
between the terms “square” and “plaza” but, as argued by Duany, Sorlien and Wright, they
differ both in function and dimension:
▪ “Square: An Open Space available for
unstructured recreation and Civic
purposes” (Duany, Sorlien, & Wright, The
SmartCode, 2003, p. 41). According to
Duany et al. (2003) the square (Figure
3.5) should measure between 0,2 and 2
hectares (Duany, Sorlien, & Wright, The
SmartCode, 2003).
▪ “Plaza: An Open Space available for
Civic purposes and Commercial
activities” (Duany, Sorlien, & Wright, The
SmartCode, 2003, p. 41). Thus, a plaza
(Figure 3.6) could function as an
informal public space obtained from
street intersections, ranging from 0,2 to
0,8 hectares. (Duany, Sorlien, & Wright,
The SmartCode, 2003).
3.2.2. Mixed-use and density
Today is fairly believed that high density with numerous diverse activities is the right receipt
to build lively and pedestrian-oriented cities. We can state that, in order to have livable
communities, cities should offer a diverse range of activities, services, and amenities within
certain walkable distances. A numerous variety of uses contained in a single building allow
people to have a (social and public) life at almost every moment of the day without needing
Figure 3.5 - Ideal New Urbanist square
Source: (Duany, Sorlien, & Wright, The
SmartCode, 2003, p. 41)
Figure 3.6 - Ideal New Urbanist plaza
Source: (Duany, Sorlien, & Wright, The
SmartCode, 2003, p. 41)

68
their private automobiles. That is, by having the main primary needs within walking
distances, the use of the automobile as a choice would disappear because of convenience
reasons. The easier to reach is any destination, the more people will be encouraged to use
it and reach it by walk. This could be possible by mixing land uses and uses within the same
building, in order to develop an efficient and convenient system vertical rather than
horizontal-oriented (Figure 3.7). To develop a properly mixed-use building, retail and
commercial activities should be placed on the ground floor, visible and accessible from
everyone. Unless the bar, restaurant or grocery occupy also the first floor, from the first
floor upward the spaces are occupied by offices or residential units. If buildings are well
uses-mixed, a normal worker can have a beer or go to the gym after work and children
can have an ice-cream or go to the playground after school. In her masterpiece The Death
and Life of Great American Cities, Jacobs criticizes the current planning method of
American cities characterized by diffuse sprawl. In her masterpiece, she recognizes the
essential primary need for building structured towards a mixed-uses approach identifying it
as the 1st
condition for cities:
“the district, and indeed as many of its internal parts
as possible, must serve more than one primary
function; preferably more than two. These must
ensure the presence of people who go outdoors on
different schedules and are in the place for different
purposes, but who are able to use many facilities in
common” (Jacobs, 1961, p. 152).
Another topic related to mixed-use and diversity is building density. The latter, if well
planned with diversity, allow to contrast the spread development of the majority of new
American suburbs. But whilst diversity should be implemented as far as possible, the same
thinking cannot be applied with buildings because, as explained later, density involves also
and especially the space existing on the ground floor. Thus, as recommended by Calthorpe
Figure 3.7 - Comparison between homogenous and mixed building
Source: Author's elaboration

69
(1993), high density should be set in the inner commercial area in order to allow (vertical
developed) more space for commercial and retail activities, creating a vibrant pedestrian
environment from which both people and retailers are able to benefit. Therefore, density is
strictly related to the building’s location, generally having higher and denser buildings in
inner areas that lower as moving away from the neighborhood core. However, attention in
elevating buildings should be paid in order to do not obtain the opposite result, that is
public space literally obscured by a too-tall building. In this sense, as expressed by Gehl’s
book Cities for People (2010), “what the lively city really needs is a combination of good
inviting city space and a certain critical mass of people who want to use it” (Gehl, 2010,
p. 68). In the book, he argues that in some cities, recent buildings are too high and too
dense to allow passengers an enjoyable walking through them because they do not allow
natural sunlight to illuminate and warm up public spaces. Reasonably, this is more
concerning inner-city areas characterized by their CBDs and lack of physical space; but it
must be also taken into account when projecting a new suburban public plaza because
public spaces measures may be different, but certainly not the way people perceive them.
3.2.3. Compactness and interconnectivity
As previously said, what allows a public square or plaza to have success is its attractiveness
depending on its surrounding context. Basically, a square is an open space made up of
buildings limiting the area on the perimeter; even if we know that is much more than that.
Therefore, a public plaza is strictly affected by the elements of which is surrounded by, one
for all the blocks. The location, size, and morphology of the latter have the central and, at
the same time, dangerous power of defining the road network. This point is fundamental
for square function since the road network is its accessible axes. Thus, the wider are the
surrounding roads, the more the people will feel unsafe to use and cross them.
What actually makes people decide of moving on foot is the possibility to reach the
destination easily. Studies have demonstrated that the maximum distance a people are
willing to walk – “the pedestrian shed” - is between five and ten minutes, or between ¼ a
mile (400 meters) and ½ a mile (800 meters), before deciding to drive. Calthorpe (1993,
p. 56), considers a “comfortable walking distance” the area covered within a 2000-foot
radius (about 10 minutes walking) from the transit station. This takes us to another
important element defined by the block’s physical characteristics, which is the length of their
perimeter sides. In other words, the length pedestrians should walk before changing
direction. Nevertheless, there are several factors that must be considered when talking
about “pedestrian shed” that could affect the choice of walking. Those are for example the
scope of walking and the related urgency to reach a certain destination, the different
options of moving nearby (for instance, bicycle and public transport stops), the topography,
the climate conditions, and other physical features.
Speck dedicates two rules in his book Walkable city rules: 101 steps to making better places
(2018):

70
▪ “Rule 36 – Understand Network Function”, where the author encourages to design
“porous road network” to exploit its convenience properties (e.g. flexibility in
changing destination and pattern’s choice), instead of the “dendritic (branching)”
system typical of the tentacular sprawl organization (Speck, 2018, p. 87) n. This
would ameliorate the block as a whole because it would be more attractive in terms
of pedestrian frequency and it would be able to host little vehicle traffic in inner
streets. Moreover, by removing it from the more congested arterial roads, regarding
inner streets it would mean not such severe changes but, contrary, for the arterial
thoroughfare having surrounding neighborhoods that attract traffic within them, it
would mean a lot (Speck, 2018).
▪ “Rule 37 – Keep Blocks Small”, where the author encourages to build keep blocks
within of certain measures and size, ranging from “1000-foot maximum perimeter
in cities and 2000-feet in suburbs” (Speck, 2018, p. 89) to guarantee safety,
comfort and to make them more interesting to walk through. As in the previous Rule
36, the emphasis is put upon the necessity to have blocks of a limited extent to
allow the flexibility and possibility to choose.
As illustrated in Figure 3.8, the smaller the blocks, the higher will be the possibility to change
directions leading to interconnectivity. Interconnectivity is obtained by setting
neighborhoods with small blocks, as Jacobs states “Most blocks must be short; that is,
streets and opportunities to turn corners be frequent”. (Jacobs, 1961, p. 178)
3.2.4. The building’s exterior side
As pointed out by Calthorpe, “The pedestrian life of a building is at its entry” (Calthorpe,
1993, p. 80). In order to achieve walkability, particular attention must be paid to the
exterior side of the buildings and their perimeters. These physical elements actually consist
of why people are enticed to walk in open spaces: to live their “outdoor experience”. There
Figure 3.8 - Comparison between low and high block interconnectivity
Source: Author's elaboration
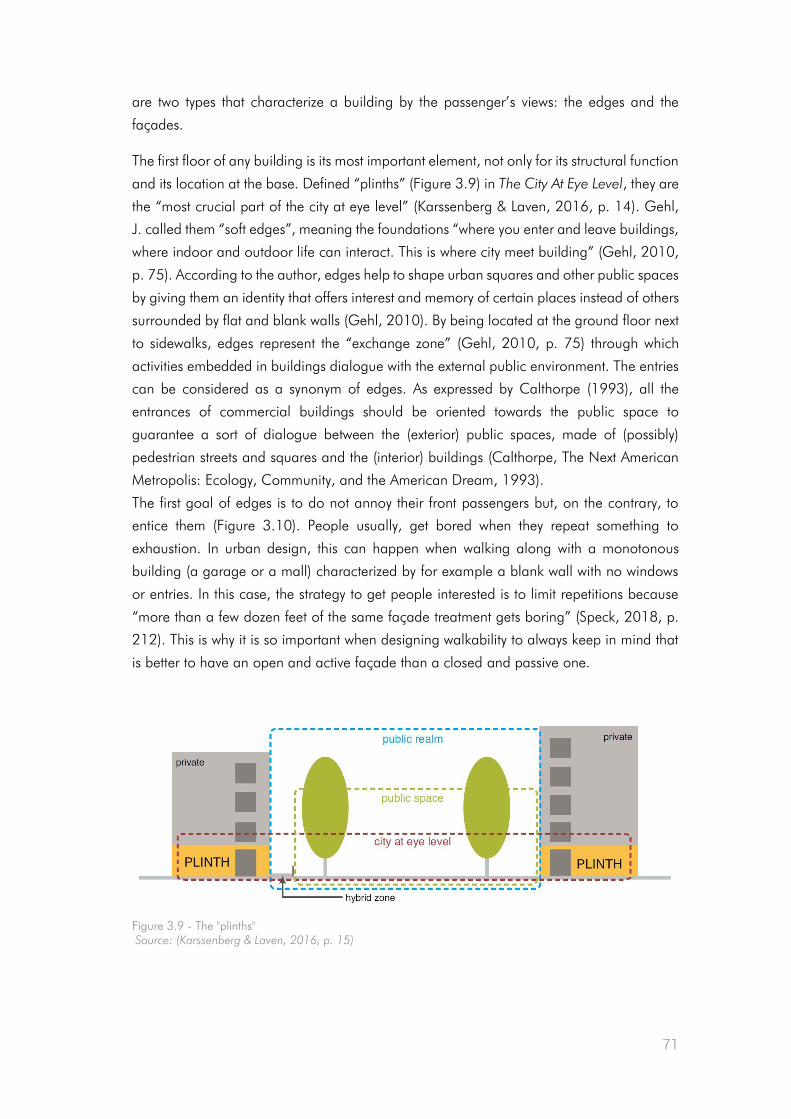
71
are two types that characterize a building by the passenger’s views: the edges and the
façades.
The first floor of any building is its most important element, not only for its structural function
and its location at the base. Defined “plinths” (Figure 3.9) in The City At Eye Level, they are
the “most crucial part of the city at eye level” (Karssenberg & Laven, 2016, p. 14). Gehl,
J. called them “soft edges”, meaning the foundations “where you enter and leave buildings,
where indoor and outdoor life can interact. This is where city meet building” (Gehl, 2010,
p. 75). According to the author, edges help to shape urban squares and other public spaces
by giving them an identity that offers interest and memory of certain places instead of others
surrounded by flat and blank walls (Gehl, 2010). By being located at the ground floor next
to sidewalks, edges represent the “exchange zone” (Gehl, 2010, p. 75) through which
activities embedded in buildings dialogue with the external public environment. The entries
can be considered as a synonym of edges. As expressed by Calthorpe (1993), all the
entrances of commercial buildings should be oriented towards the public space to
guarantee a sort of dialogue between the (exterior) public spaces, made of (possibly)
pedestrian streets and squares and the (interior) buildings (Calthorpe, The Next American
Metropolis: Ecology, Community, and the American Dream, 1993).
The first goal of edges is to do not annoy their front passengers but, on the contrary, to
entice them (Figure 3.10). People usually, get bored when they repeat something to
exhaustion. In urban design, this can happen when walking along with a monotonous
building (a garage or a mall) characterized by for example a blank wall with no windows
or entries. In this case, the strategy to get people interested is to limit repetitions because
“more than a few dozen feet of the same façade treatment gets boring” (Speck, 2018, p.
212). This is why it is so important when designing walkability to always keep in mind that
is better to have an open and active façade than a closed and passive one.
Figure 3.9 - The "plinths"
Source: (Karssenberg & Laven, 2016, p. 15)

72
In this context come in handy the concept of the demise line11
to model the rhythmic form
of the building side that creates the effect of having architecturally and aesthetically different
buildings one next to the other. In this case, the devotion to fine details make the difference,
hence, it is mandatory to develop building’s rhythm by choosing aesthetically appealing
11
“A demise line is an artificial vertical boundary that breaks a façade conceptually into several
smaller units” (Speck, 2018, p. 214).
Figure 3.10 - Active edge connecting the building and the public space in Gent, Belgium
Credit: © Joris Visser
Source: Unsplash (https://unsplash.com/photos/CecCDfKJtzk)

73
design elements like windows, visible showcases, appropriate materials and other items to
enrich the buildings facing the public realm (but this context will be better explained later).
The aesthetical aspect necessarily leads to the development of the façades. The perimeter’s
shape of a certain plaza or the rhythm of a certain street strongly influences the people’s
desire to have an outdoor experience. To stimulate people in walking rather than driving,
the buildings’ edges should be active both in terms of opening and closing time of the
ground floor activities (obviously, more open diverse activities attract more people looking
for diverse scopes), but also in terms of rhythm, “provided by buildings having vertical rather
than horizontal articulation” (Speck, 2018, p. 210). The façades of buildings should offer
a variety of elements of different colors and materials without burdening distances and
making pedestrians interested in walking along streets and squares. Many are the aspects
that influence the fortunes about a successful or failed attractiveness of first floors. The most
physical ones have been previously described, ranging from active façades and vibrant
walls to attractive colors and materials. But they are not the only ones. It can seem obvious,
but if there are not many people walking by buildings’ plinths, there will not be many people
interacting with them, and walkability fails at its roots. To operate in this sense, a strategy
has been developed to ensure successful plinths considering three mandatory layers: the
building, the street, the context. It is important to consider these three layers as a whole,
constantly dialoguing. As Karssenberg and Laven argue (2016), it does not matter if there
is one single fantastic building but standing alone and surrounded by degraded areas,
there would be no changes to obtain walkability in this way. Rather, it would be better to
create a system within all the parts and elements (plinths included) are interacting and
operating towards the same scope of walkability (Karssenberg & Laven, 2016). This is why
efforts should be committed not on the square space itself, which is surely fundamental, but
also on its surrounding environment. Edges and façades can also have a covering function
when considering structured parking. There are several methods to hide a visibly unpleasant
huge parking (Figure 3.11). From an urban design perspective, they can literally hide and
disguise the parking structure and letting its exterior’s side facing a pedestrian street with
active façades instead of empty and blank walls (Speck, 2018, p. 219).
Figure 3.11 - Methods to incorporate parking to buildings
Source: Author's elaboration

74
3.2.5. Sense of enclosure
It is fundamental for pedestrians to perceive a comfortable feeling while walking and resting
in public spaces. This is what is obtained through an adequate sense of enclosure. The
latter is given by a proportioned use of the public space, which is the ratio between the
buildings’ height that surround the square, plaza or street and the width of the public space
itself. The height to width ratio is “the proportion of spatial enclosure related to the
physiology of the human eye” (Duany, Plater-Zyberk, & Co., 2003, p. 7.2).
Similarly to the dimensions of a square, there are no standard and universal measures
regarding the relationship between the height and width (H/W) since the design of public
space is strictly dependent on its surrounding context, as already mentioned. However, in
The Lexicon of the New Urbanism Duany, Plater-Zyberk & Co. sketched some examples to
give an idea of the most appropriate H/W ratio. As illustrated in Figure 3.12, the H/W
ratio can depend on the context but also on the function the public space would have. The
relation indicated in the Figure, of course, does not has to perfectly respected and can
change according to different locations but Duany and Plater-Zyberk have set different
ratios to different public spaces.
Figure 3.12 - Height to Width ratio (H/W) in urban public spaces
Source: (Duany, Plater-Zyberk, & Co., The Lexicon of New Urbanism, 2003, p.
7.2)

75
Duany, Plater_zyberk & Co. consider that an approximately 1:1 ratio is ideal for
thoroughfares, that could be used for the commercial corridor, for examples. Regarding
public squares, a 1:3 ratio is considered the best choice, giving a perfect sense of enclosure
with a maximum 1:6 ratio, assumed as the maximum in order to perceive the sense of
enclosure. The sense of enclosure depends on the H/W ratio counting on the fact that at a
higher value of H/W correspond higher value of the sense of enclosure (Figure 3.13). If the
existing buildings that surround the square are not tall enough, other vertical elements
could be added back to increase the sense of enclosure.
3.2.6. Urban furniture
Urban furniture is not only made by benches, but it is a fundamental branch of the wider
Urban Design process which makes the public square a more comfortable and enjoyable
place furnishing it of elements that can be considered of secondary importance, but that
actually makes the difference. In other words, urban furniture “can improve the quality of
life for the inhabitants of a city” (Tosca, 2018). The following pages are going to explain
where, how and why urban furniture components in public spaces – especially squares and
plazas – contribute to reaching walkability. It is not enough to shake urban furniture
elements like dice and hoping that they will work appropriately. The risk is to fall down and
degenerates in the so-called “defensive planning”, “defensive urban architecture”,
“excluding architecture”, “disciplinary architecture”, “hostile architecture”, and even “evil
architecture” (de Fine Licht, 2017, p. 27). These synonyms refer to those urban elements
that repulse people rather than welcome them. Even if it could sound wired, there are many
cases in which, for example, ledges are designed uncomfortable on purpose, letting people
leaning against them but forbidding a comfortable solution. But let’s concentrate on the
urban furniture elements that help to stimulate, protect and enhance walkability.
Figure 3.13 - Spatial relation between H/W
ratio and sense of enclosure
Source: Author's elaboration

76
Seats and benches
In order to determine the degree of success or failure of a certain square or plaza, there
are many variable aspects to take into account but, here, the evaluation will be based on
how much the public space is frequented by pedestrians in order to encourage walkability.
According to Gehl & Svarre, useful aspects to contemplate are, therefore, how many people
attend the social life within the square and how much time they spend in it (How To Study
Public Life, 2013). The first variable (how many) is strictly related to the square’s function
and to the number and quality of the activities and services settled in the square (in turn
dependent on the edges and façades characteristics previously described) and is necessary
to understand and measure “how many people are moving (pedestrian flow) and how many
people are staying (stationary activity)” (Gehl & Svarre, 2013, p. 13). The stationary activity
usually occupies the exterior layer of the public space next to building frontages and helps
us to better recognize the second variable (how much). According to Gehl (2013), there
are two types of stationary activity: standing and sitting. The latter implies a fundamental
public space element: the sitting places explained as follows.
There is an infinite multitude of typologies regarding sitting places, varying from their
materials to their design. However, aiming to walkability, what we can do is to study where
and how to locate sitting places. The latter, as already explained, belong to a wider
container – known as urban furniture – in which are included all the physical elements that
fill the urban public environment, within which seats and benches play a primary role.
It is largely acknowledged that public space needs a relatively great number of sitting places
to give the possibility to benefit from their comfort by a relatively great amount of people.
Nevertheless, their location is particularly important in defining public spaces in order to
allow meeting, waiting and socializing, comfortable practices (Yücel, 2013). With particular
regard to public squares, sitting places should be integrated within the existing environment
already placed in outdoor spaces, “so that when seats are not in use they do not create a
sense of isolation or emptiness” (Yücel, 2013). Assuming that benches and sitting places
are needed where there is the lively and continuous pedestrian flow when thinking about
their location is important to have in mind that when people are seeking to seats, they
prefer to watch what happen on their surrounding environment and they prefer to have their
back protected (Gehl, 2011). As Gehl states (2011), single sitting places like benches
should not be located alone and detached from the other elements that made up the square
but, rather, it is preferred to place them “along facades and spatial boundaries” (Gehl,
2011, p. 157). To remark the location importance, that every bench should be better
placed in a closed and protected space rather than wide-open space to stimulate “intimacy
and security and, as a rule, a good microclimate as well” (Gehl, 2011, p. 159).
The Project for Public Spaces is a non-profit organization devoted to the creation and
support of public spaces aiming to generate a community environment. In an article posted
on their website (2008), they draw up a list of good practices creating a sort of guidelines
to follow in order to perceive their objective: create community. The guidelines go in-depth

77
with sitting places details, and specify that they should: “be set back at least 24 inches from
the pedestrian walkway”, they should be placed next to other urban furniture elements and
other street amenities, “placed at a 90 to 120 degree angle, which is good both for
conversations and for sitting alone” because of people’s intimacy, “not be lined up in a
row because this makes it difficult for a group to have a conversation”, they should be
“movable” because fixed benches do not allow people do arrange them as they need, and
they should provide spaces for disabled people (Project for Public Spaces, 2008). The
guidelines just described are surely useful to have an overview of the sitting places’
importance. But, as already said, many variables occur when dealing with public spaces.
In fact, benches can differ in many aspects: seat width, length, heights, materials, with or
without armrests, with backs or backless, design, etc. but the two most important aspects
to consider about sitting places are their physical comfort and their psychological comfort,
both necessary to obtain a useful and appreciated sitting area. In turn, the psychological
aspect has a double meaning: it is related to the choice of seats because of privacy issues,
but one can also choose where to sit down because of a certain level of privacy, this involves
the security facet that will strongly affect people’s decisions. Besides this, it must be
considered also another fundamental feature for urban design that aims to better
accommodate its users, that is the thermal comfort (which will be explained in the next
Chapter 4), related not just to seating areas but to all the components of urban furniture.
For the purpose of the thesis, two conceptual typologies of seats emerge:
1. The explicit and formal
This category refers to those sitting places inevitable in a busy public space, defined
by Gehl as “primary seating” (Gehl, 2011, p. 159). In fact, as illustrated in Figure
3.14, they are the most common benches findable in most public spaces (like
squares and parks) and they are explicitly recognized as places where to sit on.
Figure 3.14 - Explicit and formal benches
Credit: © Viktor Talashuk
Source: Unsplash (https://unsplash.com/photos/kZESeBsuwt4)

78
Benches of this group are located and designed for people seeking a medium-high
level of privacy, meaning for those who want to chill out and rest alone or to those
looking for a quiet place where to read a book, for example. Considering, for
example, those benches facing a spectacular view. In this case, benches function
as a place where to rest and enjoy the panorama and they are not surely aiming to
create social contacts (even if it could happen, of course). But this was just an
example. As underlined by the PPS (2008) and by Yücel (2013), in order to avoid
the problem of intimacy due to direct eye contact with strangers, benches should
be placed between 90 and 120 degree from each other, allowing “both
socialization and sitting alone” (Yücel, 2013, p. 628).
2. The integral and informal sitting places
Conversely, these kinds of seats mainly regard steps and low walls (Figure 3.15).
These sitting places differ from the previous one first of all because of their
“clientele”. The typology of these sitting places can be obtained by other elements
already present in the square like steps from the elevated building, low walls from
fountains and flowerbeds, and from building ledges. Low walls and steps are
usable and enjoyable by young and people that have the ability to sit down and
get up easily, in this case, for certain groups of people, “the general situation plays
a more important part than the seat does” (Gehl, 2011, p. 159). Consequently,
for the elderly and disabled persons, this kind of seats are not available and,
therefore, they are more oriented towards a primary (explicit and formal) seating.
However, many people use and benefit from them, they allow socialization and
they can be gained from the presence of other urban furniture elements (for
instance, flowerbeds, fountains, and stairways) which can be exploited with a
double useful function.
Figure 3.15 - Implicit and informal sitting
places in Bologna, IT
Credit: © Maria Bobrova
Source: Unsplash
(https://unsplash.com/photos/EdpbTj3Br-Y)

79
To summarize, when planning seating areas in public spaces, a brief analysis of the
location, orientation and physical comfort in relation to the public space usage should be
done in order to obtain a public space full of empty benches or seating areas. The best
solution is to try to provide a balanced mix of both formal and informal places so that
people will have a wide range of sitting typologies. A large range of sitting opportunities
can be achieved by squeezing “the sittability of inherent features. This means making ledges
so they are sittable, or making other flat surfaces do double duty as table tops or seats”
(White, 1980, p. 28).
Public realm signage
Reminding what public realm is, Lang in Urban Design: A Typology of Procedures and
Products (2005), considers it “those places to which everybody has access to, although this
access may be controlled at times. It consists of both outdoor and indoor spaces” (Lang,
2005, p. 7). Therefore, the public realm is present in any city and suburb, wherever the
private and public sphere interact. Thus, it “can play a vital role in influencing socio-
behavioural as well as articulating relations in experiencing and identifying urban identities
of the environments” (Cheshmehzangi, 2012, p. 313). Talking about urban furniture in the
public realm, considered for a busy plaza or square, what can be more influencing than
indications? This is what public realm signage stands for, it helps people to walk in the
direction they are looking for. It is the way through which a certain place communicates
with its users. Obviously is not useful for locals and people living nearby, but for those who
visit a certain square for certain reasons, it is extremely useful. Moreover, public signage is
particularly helpful when located within a square next to train stations or bus stop to indicate
useful information (for instance, bus or train schedule) for those who come afar. In the
Public Realm Design Guidelines of South Australia is remarked that the pedestrian signage
“improve accessibility, orientation and connectivity of spaces and functions” (Local
Government Association of South Australia, 2014, p. 20). Thanks to indications, one can
be more stimulated to move also in a new place by transit or by foot, counting on public
realm signage.
Besides its directional function which allows people to find their ways, signage has another
important function, that is giving information about the place and its surroundings (e.g. its
history).
Public lighting
Sunlight is probably the most important natural element that public space must have for its
users because it allows people to fully enjoy the public spaces. As happens in other contexts,
humans tend to realize the importance of something only when they cannot benefit from it
anymore, so it also happens about light (Augustesen, et al., 2006, p. 8). However, sunlight
is not always available. Especially in northern cities where dark hours come early
particularly during winter seasons, is necessary to allow people to spend ordinary daily life

80
and benefit from public spaces also without natural light. Nevertheless, “there is a big
difference between “‘more light’ and ‘better light’” (Peña-García, Hurtado, & Aguilar-
Luzón, 2015, p. 142-143). A good public lighting system is indispensable for public
spaces’ quality and walkability for two main reasons:
1. Safety
If people do not feel safe outdoor during nighttime, they will not use public spaces
in certain periods. Well-projected public illumination will reduce people’s fear of
crime. Generally, is acknowledged that lighting can warn people of possible
wrongdoers in public spaces by increasing visibility but lighting alone may not be
enough. According to Welsh (2007), this is because the positive impacts carried
out by improvements in public lighting can vary according to several variables (for
example, the area dimension and design) and because they “are likely to be greater
if the existing lighting is poor and if the improvement in lighting is considerable”
(Welsh & Farrington, 2007). Therefore, if the aim of lighting is to guarantee the
safety of a certain place, the lighting system should be implemented and reinforced
by a supporting video surveillance system that works together. For example, lighting
that focuses on a withdraw machine may be not enough for people’s fears during
nighttime but, with a video security camera pointing on the same spot it would
notably increase its security environment, and vice versa;
2. Appealing
Lighting systems, if properly managed, can make a difference in the quality of urban
public spaces. They can create a charming atmosphere that encourages people to
attend a certain square, for example. As illustrated in Light for Cities: Lighting
Design for Urban Spaces. A Handbook, “to draw on a ‘family of luminaries’ is a
tried and trusted method” (Brandi & Geissmar-Brandi, 2007, p. 50). Through a
careful arrangement of luminaries and poles is possible to create a very appealing
public space. Brandi and Geissmar-Brandi support that the family group of
luminaries should be placed at different heights starting from the ground floor with,
for example, illuminated bollards (explained later) and going upward “up to 16
meters” (Brandi & Geissmar-Brandi, 2007, p. 51). With this approach lighting
rhythm emerges and pedestrians are attracted to frequent public spaces longer
(reminding that pedestrians are not only one that can benefit from the proper light
system, but also activities on the spot can enjoy the benefits). Considering shopping
or restoration areas and commercial streets, public lighting can also represent a
strategic technique that plays a decorative role. In this sense, lighting “could be
one of those last finishing touches that reinforce a unique idea” (Brandi &
Geissmar-Brandi, 2007, p. 52).

81
While it is true that lighting is an item of vital furniture for public space, this is also costly
both in terms of light pollution and for energy, besides it is an expenditure. Considering
lighting demands for energy, thus, energy-efficient luminaries like LED are preferred. As
reported in the International Dark-Sky Association (IDA) website, LED luminaires can solve
all the problems just cited, except the costs (which occur for every kind of need). In fact,
LED can solve high energy demand problems by dimming and saving light and energy
when not necessary. Consequently, having less lighted areas means that light pollution can
also be positively altered (International Dark-Sky Association, s.d.). Moreover, luminaries
and bulbs should be shielded in order to avoid skyglow, glare and light pollution. Figure
3.16 has been made by IDA and tries to collect some examples of appropriate lighting
furniture.
Figure 3.16 – Compared example of acceptable and unacceptable luminaries
Source: International Dark-Sky Association (https://www.darksky.org/our-work/lighting/lighting-
for-citizens/lighting-basics/)

82
Garbage bins
Whoever would lay down on a flowerbed made of waste or sit down on a bench next to
litter and rubbish? The answer is easy: nobody. The cleanliness of public spaces and
particularly of a public square will surely affect its vitality. Generous bins located at the
main affluent spots of public spaces enhance people to use them and, even better, recycling
bins offer the possibility to recycle properly. In fact, Alec Cooley, the Director of Recycling
Programs at Keep America Beautiful12
, states that locating garbage bins (possibly recycling)
“can reinforce the community’s values as an inviting, clean and environmentally conscious
place to visit” (Cooley, 2017). To facilitate pedestrians for recycling, a widespread strategy
is to introduce clear signage by associating different colors to each different type of waste
so that, in doing so, people will automatically recognize the correct bin.
Fountains and water bodies
The presence of water elements in public spaces has several important benefits. Firstly, its
thermal, sustainable and natural benefits positively affect its surrounding urban
microclimate but, in this Chapter, water elements and fountains will focus on its social side
to encourage walkability. Before explaining the numerous advantages from which a
community can benefit from water elements, it is necessary to point out that these kinds of
urban furniture cannot be applied everywhere. In cities with droughts problems (e.g. Los
Angeles, Phoenix and El Paso) droughts are a real problem against which local
communities have to fight (hardly or softly) every year. It comes alone that fountains and
similar would be a needless waste of such a precious resource. Nevertheless, fortunately,
in cities that do not face these environmental issues, fountains can be the element that
makes the difference regarding a public square due to many reasons. Public squares,
plazas or parks can survive without a fountain but, conversely, we can find fountains only
in the public realm and especially only in squares, plazas, parks or in open or semi-open
public spaces. This leads to the strong public character of this water element. It could sound
wired but, actually, there is another kind of place where water elements abound, and those
are in Buddhist temples. This is because water elements have a lot of acoustic benefits
coming from the sound they release and, today, water bodies are applied for “meditation
and visualization sessions” (Sheppard, 2017). It does not mean that people must meditate
to enjoy fountain or other water elements, but people can benefit from them because they
release a quiet and relaxing environment visually and acoustically. This is also extremely
positive for activities in the fountain’s visual proximity - like restaurant businesses – enjoying
a delightful landscape over the plaza. Water can come in every aspect, as long as it is
visually and acoustically accessible. There is another component through which people can
interact with water elements, that is by touching it, even if this is not always possible.
12
Established in 1953, Keep America Beautiful is a non-profit organization that “provides the
expertise, programs and resources to help people End Littering, Improve Recycling, and Beautify
America’s Communities” (Keep American Beautiful, s.d.)

83
According to White (1980), fountains and similar are fundamental to public vitality (Figure
3.17). Thus, once they are installed, people should be able to interact with them in every
manner they can, otherwise, it does not make any sense to install it (White, 1980).
Moreover, he states that “Safety is the usual reason given for keeping people away. But
there are better ways than electrocution to handle this problem” (White, 1980, p. 48).
However, another water bodies’ positive effect of is “its ability to reflect its surroundings.
Thus, water surfaces can be placed in the immediate vicinity of buildings in order to
enhance their image” (Oikonomou, 2005, p. 132) creating an visual impact.
If climatic conditions allow it and the square location does not suffer from draughts,
fountains for drinking water could be a great deal for attracting people and stimulate
walkability.
Food
However, what attracts people the most is food. “Food attracts people who attract more
people” (White, 1980, p. 52) having then the possibility to exponentially increase
walkability. This can happen especially in squares (Figure 3.18), where passenger or
workers from nearby offices go to have their meals, and when they forgot their packed
lunch, a food truck must be there or, conversely, a variety of food trucks can be the reason
for not having carried it. As White pointed out, “If you want to seed a place with activity,
put out food” (White, 1980, p. 50). Food trucks and vendors are fundamental in their
primary function that is serving sandwiches, hot dogs and similar. However, they also own
Figure 3.17 - Water element attracting children in London, UK
Credit: © Robert Tudor
Source: Unsplash (https://unsplash.com/photos/V5ZKl33OQvE)

84
a very powerful attracting value resulting in a real meeting point where workers and
passengers stop to eat and socialize. Food vendors, whether they are trucks, cafè-bars or
restaurants, usually have fantastic business acumen, or at least they should. Wherever
pedestrian flows are present, food vendors also do (White, 1980). Therefore, there is also
a subjective component that lets the vendor choose among multiple and diverse options, it
is up to the vendor to choose the best one before it gets stolen by another competitor.
Besides location choice, the “optical leverage” (White, 1980, p. 52) of these kinds of
activities plays a crucial role, especially in public squares. In this case, the entire area full
filled with other components of urban furniture spread in an organized system, could largely
benefit or be disadvantaged by the food vendors' disposition and appealing. This does not
mean that particularly designed elements are needed, but some chairs and tables in the
shade of a parasol would be enough, creating a spectacular pedestrian environment
(White, 1980).
Less impacting but still attractive and useful are the vending carts offering water, beverages
and other types of snacks for those who are in a hurry and do not have time to have a
relaxing and enjoyable meal.
Bollards
The last – but not least - element of urban furniture analyzed are the bollards. Usually, they
are not noticed by pedestrians because of their low and thin size and because they are
taken from granted. They are not compulsory, but actually, bollards are key elements in
Figure 3.18 - Food trucks next to informal sitting places in Pionner Square, Portland, OR
Credit: © Sean Benesh
Source: Unsplash (https://unsplash.com/photos/87IuthTDnmQ)

85
urban furniture in terms of pedestrian safety to enhance walkability. Obviously, they are not
the only tool to secure pedestrian from vehicle’s traffic, there are a lot of strategies,
standards, and measures to apply to pedestrian surfaces close to thoroughfares - like
crossings and sidewalks - but bollards are the most commonly used type of physical barrier
because they help to fully protect pedestrians from automobiles without being too much in
the way.
There is a very large variety of bollard’s typologies according to their specific purpose and
site location. They can be fixed or removable depending on the purpose of having a total
pedestrian area or semi-total (to allow trucks for loading and unloading services of
restoration activities, for instance). They can differ according to the interval distance
between one another according to the site requirements (different measures for schools,
civic and institutional buildings, for instance). Moreover, bollards can have a decorative
and landscape function to limiting a particular area (a flowerbed in front of an institutional
building, for instance) and, finally, there can be short-term bollards to use for single special
events in squares or public spaces in general (Reliance Foundry, 2019).
3.2.7. Weather shelters
The ways in which pedestrians are sheltered are crucial. This is because shelters offer the
possibility to enjoy public spaces even with hostile weather events (for example rainfalls and
elevate solar heating), hence contributing to reaching walkability although adverse climate
conditions. Weather shelter provides a repair for pedestrians while they are walking and
there is an unexpected heavy rainfall from nowhere or when you want to shop during lunch-
break but there is a burning sun. The need of creating shelters for pedestrians can be
exploited by animating façades facing public squares or plazas, which aesthetical and
visual component is fundamental (as explained earlier in this chapter) for creating an
appealing and interesting public environment.
Pedestrian shelters are very useful in very busy places and especially where people have to
wait, having thus the possibility to do it by being protected from sunlight or rainfall. That is
why, with a proper set of benches and sitting areas, shelter protection is a strong
recommendation for TOD squares. There are many ways in which weather shelters can be
provided. Surely vegetation could be a good option, but it depends on the foliage
dimension and on the fact that during some period of the year trees can be barren.
However, vegetation benefits will be better explained in the next Chapter 4. However,
besides vegetation, “Weather protection for pedestrians in public spaces can be provided
by canopies, awnings or lattice work” (Institute of Public Administration, 1977, p. 12), being
all of them absolutely essential to transit stations, or at least for its surrounding environment.
In this case, weather shelters can be scattered within the square and exploit them by creating
a stunning and comfortable environment even during hot and wet days.

86
3.2.8. Public art
All forms of art, whether they are enclosed in a museum or they are accessible for everyone
creating open-air museums (e.g. the project developed to regenerate the Bairro Alto
neighborhood in Lisbon), always fascinate and arouses curiosity. Regarding public spaces,
public art “potentially includes all forms of creative expression in public space” (Fisher,
1996, p. 43). One thing is for sure: public art directly affects people that use the public
space where it is located (Figure 3.19). However, this cannot happen so automatically. As
previously explained for other public space elements (urban furniture, for instance) the
single art sculpture, graffiti or illumination is strictly related to its surroundings, that is: a
dirty, neglected public space will not improve thanks to public art itself, but there must be
a general requalification of the area otherwise the public art got lost and abandoned. Only
after a proper regeneration, the area can benefit from public art, which impacts can result
in a very extraordinary upgrade of a certain place.
Public art has numerous benefits. It can be seen as a mean through which the community
“enhances meaning in civic spaces, and adds uniqueness to communities. Public art
humanizes the built environment” (Walsh, 2018). It has also economic benefits and it can
be exploited as a strategy in this way. All forms of public art differ from one another creating
a sense of uniqueness around an artistic mural, sculpture or a design element intrinsic in
the work of art itself. This sense of uniqueness, especially if placed in an already busy area,
Figure 3.19 - The Cloud Gate sculpture made by the British Indian artist Anish Kapoor in Chicago, IL
Credit: © Ravi Patel
Source: Unsplash (https://unsplash.com/photos/2B5aWwADOn4)

87
creates a dynamic environment around it, resulting in an incredibly positive effect in the
surrounding areas and activities that would be highly supported by visitors.
The uniqueness issue was introduced by Lynch in The Image of the City (1960), referring to
the concept of imageability:
“that quality in a physical object which gives it a high
probability of evoking a strong image in any given
observer. It is that shape, color, or arrangement
which facilitates the making of vividly identified,
powerfully structured, highly useful mental images of
the environment” (Lynch, 1960, p. 9).
To conclude, public art is able to bring close community and artists through works that
represent them and the work of art’s area. It has, then, social effects creating a sense of
place and identity (or “imageability”) but public art can also be useful in economic terms,
being a unique item, in fact, public art can attract locals but also foreign visitors and
commercial and restoration activities would benefit from it. finally, keeping it simple, it is
much better to see an artistic mural instead of a blank wall.
3.2.9. Preservation of historic and civic buildings
As a form of art, architecture also plays an important role in public spaces. Buildings shape
squares and streets, thus, the more appealing they are, the more walkable is the ground
space they draw. Civic and historical buildings have much more to say in this context. We
can say that aged buildings have the same function of public art wherever they surround
public space and are perceivable from pedestrians. In fact, also old buildings reveal
economic benefits. As Jacobs (1961) pointed out, whilst new building construction is
characterized by economic value mainly according to their location and design, “the
economic value of old buildings is irreplaceable at will. It is created by time” (Jacobs, 1961,
p. 199) resulting in a diverse element within the environment enhancing imageability and,
therefore, walkability. Besides the flow of local and (possibly) foreign visitors, aged buildings
attract people. Aged buildings have something special that is intrinsic in themselves.
Whether it is the memory they represent or the architectural style from which they are shaped
and designed, “Americans prefer to picture themselves living around old buildings” (Rocchi,
2015).

88
This page is intentionally left blank

89
4. Adaptation measures
Chapter 4 aims to understand how public squares and plazas adapt to CC through urban
design with a basic background thinking: “What was made by people can also be changed
by people” (Beck, 1992, p. 157). Adaptation measures in response to the climate impacts
identified in Chapter 1 are the core of the chapter. The measures to avoid the UHI effect,
drought and flooding will be analyzed and developed at different scales assuming that,
contrary to mitigation and walkability, adaptation measures benefit more through local and
punctual actions on the built environment instead of interventions at larger scales (regional
or global). Thus, urban design is the delivery vehicle through which adaptation measures
take place.
As seen in Chapter 1, adaptation means “the adjustment in natural or human systems in
response to actual or expected climatic stimuli or their effects, which moderates harm or
exploits beneficial opportunities” (IPCC, 2007, p. 6). It has already been argued that both
mitigation and adaptation measures are needed. The latter is considered more recent than
mitigation ones, but there has been an advancement in CC adaptation measures through
recent studies and researches “in urban areas specifically” (Carter, et al., 2015, p. 3).
Adaptation measures are wrongly considered less important than the mitigation ones
because their narrower radius of action, which actually it is right. While mitigation strategies
point towards the roots of the problem, adaptation actions look like having a passive
behavior. The core aspect of adaptation measures lies in the method by which communities
sustainably approach to an ever-evolving changing future (Arizona State University, 2007).
The key concept of adaptation measures and of the current Chapter is that by being more
local-efficient, adaptation strategies can largely vary from North to South and from East to
West, from coastal cities to inner-land cities and so on. As highlighted by Smit et al. (2000),
adaptation measures vary because climate stimuli vary. This means that weather and
climatic conditions come in very different forms and impacts on humans and the built
environment where they live. Therefore, diverse strategies to adapt to CC are requested
from every single environment in order to better and stronger accommodate CC impacts
(Smit, Burton, Klein, & Wandel, 2000, p. 229-230). In many cases one single measure can
operate both towards mitigation and adaptation objective but, in other cases, they can be
in contrast. For example, if we think about the positive externalities that high urban densities
have on pedestrian behavior, we might also have to consider that narrow and tall buildings
increase temperature because they do not allow natural ventilation leading to the
generation and/or incrementation of the UHI effect. Therefore, it is necessary to fit together
all the objectives and needs of both mitigation and adaptation actions within the sustainable
urban and suburban environments (Shaw, Colley, & Connell, 2007). Another important
factor to consider is the relationships between the different effects of adaptation measures
taken at different scales. In fact, there are differences between “large-scale adaptation
strategies at the conurbation scale (e.g. networks of open spaces) and smaller scale options
(e.g. orientation of individual buildings)” (Shaw, Colley, & Connell, 2007, p. 17). However,

90
in order to understand the best and proper adaptation actions to apply to public squares
in suburban areas, only measures at the smaller scale (those regarding the buildings
enclosing the square area and the square itself) will be considered.
4.1. The UHI effect
As previously explained, the UHI effect is one of the most frequent consequences of CC
and it strictly deals with anthropogenic behaviors. Many scientists and researchers state that
UHI “is the most documented phenomenon of climate change” (Santamouris, Cooling the
cities – A review of reflective and green roof mitigation technologies to fight heat island
and improve comfort in urban environments, 2012, p. 682). The UHI effect is a very wide
and complex phenomenon that can vary according to a multitude of factors resulting under
different characteristics, intensity degree and impacts. The UHI effect generated in cities
involves wide areas of them both in vertical and in the horizontal direction. Limiting the
research to the public square element and what surrounds it closely, for the purpose of this
thesis what matters and thus what it will be considered are two types of UHI zones (Figure
4.1). The first is the Surface Urban Heat Island (SUHI), that is where impacts of the UHI
effect can be perceived at the ground level and “is defined by the temperature of the surface
that extends over the entire 3-D envelope of the surface” (Roth, 2013, p. 146). The second
is called Canopy Layer Urban Heat Island (CLUHI), that starts from the ground level
(incorporating it) up to “below the tops of trees and roofs” (U.S. Environmental Protection
Agency, 2008, p. 3).
Once these preliminary assumptions are made, we can then analyze which are the best
and most efficient solutions to apply to answer to the five main causes of the UHI effect
(underlined in Chapter 1) and adapt communities to the UHI effect in the built environment
at different scales. Therefore, the following pages discuss adaptation to the UHI effect and
they have been subdivided according to three different approaches that interact with the
built environment: the building scale, the urban space, and the urban geometry.
Figure 4.1 - Layers of interaction between the UHI effect and the built environment
Source: Author's elaboration

91
4.1.1. Building scale
The mandatory introduction before starting to argue on buildings is that everything that will
be explained at this scale regards only those buildings that limit the square.
Two are the types of surfaces that interact with the UHI effect at the building scale: the
surfaces of the building, intended as those covering the vertical surfaces, and the roofs that
coating the horizontal surface. What is particularly important in this context is the materials
of which the buildings are made of. Buildings play a crucial role in the creation of a warmer
built environment because they can influence both the SUHI and the CLUHI affecting the
entire climatic space surrounding them, which is where people live. The main influence that
buildings have on the UHI creation concerns their coating.
In the next pages will be given a brief overview of the benefits of cool materials that strike
on the UHI effect from the point of view of their reflectance features. The aim is not to
understand the specific energetic benefits and when they may occur or may not but, rather,
the following pages point to understand how this kind of material can be useful in adapting
to CC. A single chapter alone would not be enough to investigate on all the benefits of
cool materials. In fact, besides the reflective properties of cool materials, there are many
other more specific and case-to-case variables that interplay with solar reflection which can
be ever-changing (e.g., the geographical location, the building shape and its exposure to
sunlight, the building’s roughness, and so on).
Cool materials
As previously said, buildings are covered by the materials both on vertical and horizontal
surfaces (façades and roofs, respectively). Both of them can be covered by cool materials,
which most important property is albedo because it “directly determines the absorptivity of
an opaque surface” (Oke, Boundary Layer Climates, 1987, p. 229) and help to lower as
much as possible the temperature difference between urban/suburban areas and the rural
ones, which can reach “up to 10 degrees of temperature difference” (Santamouris, et al.,
2001, p. 203). By reflecting and not absorbing solar radiation, reflective materials make
the buildings’ interior cooler resulting in lower demand energy. This benefit can be
perceived as mitigation rather than adaptation measure and, actually, it is. Reflective
materials are just one of the several strategies that fall back both in the mitigation and in
adaptation measures, that is, they can be both a tactic to adapt our built environment to
CC but also a way to reduce GHG emissions.
Looking at the adaptation side of cool materials, cool materials are characterized by high
albedo features able to reflect solar radiation instead of holding it. For the purposes of the
thesis, the most important aspect of cool materials is that high albedo surfaces are also
characterized by lower temperatures compared to those with low albedo and, since
buildings encompassing public square are made of materials, their albedo properties affect
the temperature within public spaces (Shahmohamadi, Che-Ani, Maulud, Tawil, &

92
Abdullah, 2011, p. 7). Without going in-depth with energetic issues of materials, the
discriminant factor to decide whether a building coating is reflective or not is its color. As
explained in Chapter 1, high albedo materials are light-colored and low-albedo materials
are dark-colored. However, reflective materials “can also have a number of indirect effects,
such as glare and increased reflected radiation on pedestrians and building façades
(included on glazed openings)” (Erell, Pearlmutter, & Williamson, 2011, p. 79). Thus, a
strategic approach comprehensive of all the different aspects that interplay between the
building’s materials and the people that living around it is necessary. In order to have both
buildings covered with cool materials without creating disturbs of glare on pedestrians, a
strategy usually practiced is to place vegetation next to the building’s sides that are exposed
to solar radiation. It is in this context that cool materials are able to adapt to the surrounding
building of a square; by reducing temperatures of building’s façades and, consequently,
decreasing the temperature in their surrounding environments.
For what concerns the roofs, “the most promising passive strategies seem to be the use of
highly-reflective coatings (cool roof) and the placement of a vegetation cover on top of the
roof surface (green roof)” (Costanzo, Evola, & Marletta, 2016, p. 247). According to
Gartland (2008), roofs represent around 20% of the total surfaces in suburban and urban
areas. As in the case of façades, also roofs can be adapted to CC by using light-colored
materials that reflect more solar radiation than the dark-colored. In this instance, the
difference between façades and roofs lies in their solar exposure, which is much higher in
the case of roofs, depending in turn according to their slope. Moreover, if buildings can be
supported by vegetation in adapting to CC, also roofs (when they are flat) can implement
vegetation on them. But vegetation applied at the building scale will be detailed later.
Returning to roofs made of cool materials they can be applied roofs belongs to separated
and not so tall houses since they can be visible from the street level. In this case, white or
bright colors may not be appreciated by the house owner that could decide to change the
roof color (Moriyama & Takebayashi, 2012). Thus, a valid alternative to white and bright
roofs are colored cool roofs which can also avoid if glare problems occur, “especially for
steep slope roofs” (Synnefa & Santamouris, 2012, p. 55). As it happens with every material,
even the cool ones are subject to deterioration. It is important to remind that cool material
properties can perform with lower efficiency if they are aged (Prado. & Ferreira, 2005, p.
298). Thus, in order to obtain the same result constantly over time, regular maintenance
and, when needed, a replacement is necessary.
Green roofs and green walls
The second adaptation measure applicable at the building scale is subdivided in green
roofs and green walls, considered as sustainable envelopes that contribute to limiting the
UHI effect. “Since in densely urbanized areas there are few residual spaces that can be
converted into green areas, one solution could be to turn traditional black flat roofs into
green ones” (Susca, Gaffin, & Dell'Osso, 2011, p. 2119). A fundamental characteristic of

93
green roofs is that they can tackle CC due to the presence of vegetation that cools air
through the processes of “evaporation and evapotranspiration” and “by reducing
impervious surfaces which cause temperatures to rise (Ngan, 2004, p. 5). Moreover, “In
addition to increasing roof membrane life, green roofs provide shade and insulation,
resulting in energy savings and mitigation of the urban heat island” (Getter & Rowe, 2006,
p. 1279). There are no uniform benefits from green roofs, the intensity and the
“performance of green roofs is dependent on the status of the vegetation, the roof position
and the ambient air flow conditions” (Lalosevic, Komatina, Milos, & Rudonja, 2018, p. 2).
As Getter and Rowe state (2006), green roofs increase the membrane life of the building’s
roof. This is possible thanks to a multiple reflective and absorbing layer stratification that
enlarge the increase the space before the solar radiation impacts on the building’s roof.
Green roofs are generally divided in:
▪ Extensive green roofs
This typology of green roofs includes all the roof vegetation on a thin substrate with
little or no irrigation and management. In this type of green roof vegetation is
established either artificially by seeding or planting, or naturally: mosses,
succulents, few herbs and grasses are the kind of vegetation findable on extensive
green roofs. According to the U.S. EPA, since extensive green roofs require very
little maintenance and irrigation, they can be perfectly fixed on buildings located in
climatic areas that suffer from dry climate conditions and where drought events
could occur (U.S. Environmental Protection Agency, 2008).
▪ Intensive green roofs
On the contrary, intensive green roofs present roof vegetation on a thin substrate
but with irrigation and management. As in the other type, also in this case the
vegetation can grow naturally or artificially and the vegetation typologies could be
perennials, grasses, small trees, rooftop farming, and all those plant species that
require management (U.S. Environmental Protection Agency, 2008).
Besides green roofs, green systems can be applied also on their façades. Green walls are
helpful elements that present several benefits in adapting to the UHI effect. Potentially, they
could have even more benefits than the green roofs if we consider that the surfaces of the
façade are usually wider than the roof one, especially regarding buildings located in dense
urban and suburban settlements (Köhler, 2008). Moreover, green walls are relatively easy
to install since “Little ground space is required, installation costs are low, and over a 10-
year period, the ecological benefits are significant” (Köhler, 2008, p. 434). In recent years,
greening systems have been subjected to an advance in technology and today there are
many definitions and nomenclatures to refer to them. However, Manso and Castro-Gomez
have identified two main categories: green façades and living walls. They state that green
façades (Figure 4.2) consist in “climbing plants grow along the wall covering it”, whilst

94
living walls (Figure 4.3) “include materials and technology to support a wider variety of
plants, creating a uniform growth along the surface” (Manso & Castro-Gomez, 2015, p.
864). They further categorize green façades in: direct, when vegetation is directly attached
Figure 4.2 - Direct green façade
Credit: © Alexey Shikov
Source: Unsplash (https://unsplash.com/photos/qarKz3qU5NA)
Figure 4.3 - Living wall in Madrid,
Spain
Credit: © B. Alter
Source: TreeHugger
https://www.treehugger.com/natural-
sciences/madrids-green-wall-is-
flourishing-as-is-the-caixa-forum.html

95
to the building wall, and indirect, when a supporting structure is to the building wall, and
indirect needed (Manso & Castro-Gomez, 2015).
Therefore, comparing the green roofs and the green walls can be considered as extensive,
referring to green façades, and intensive, referring to the living wall (Osmond & Sharifi,
2017).
Besides their fundamental environmental performances which allow to mitigate the UHI
effect and to cooling air, the presence of greening systems in built areas is crucial for their
appealing potential, thus, having also social and psychological benefits (Manso & Castro-
Gomez, 2015). In fact, just looking at Figures 20 and 21, it is understandable that green
walls or façades have an elevated attraction value, and this is vital when talking about
public spaces like squares. The aesthetic aspect is important in the urban or suburban
square because they are able to increase walkability, by the way, because, as Sutton states,
to be appreciated, the greening system “it must be seen and experienced” (Sutton, 2014,
p. 6). However, greening systems could also bring economic benefits. Considering the
aesthetic values of green roofs, in fact, they are not always visible from the ground public
space, but they can be enjoyed by people when they are accessible. Obviously, we are
talking about intensive green roofs, where a combination of environmental and social
benefits can take place at the same time if, for example, a restaurant, bar or any other
recreational activity is located on rooftop buildings, a strategic solution to exploit spaces
that, otherwise, would be empty and heavy UHI contributors.
To conclude, it is clear that even if cool roofs made up of cool materials, green roofs and
green façades are applicable at the building scale, only one or a weak bunch of buildings
alone cannot impact hard on the UHI effect but, rather, a system of green or cool buildings
set in dense urban or suburban areas would help to hedge the effort. Thus, to obtain
significant results at the city scales, cool materials should be applied at multiple building
scales.
4.1.2. Urban space
The adaptation solutions that are considered in the “urban space” layer are those that
contribute to reducing the UHI effect working at a larger approach scale than the previous
one.
Urban vegetation
Among the several causes of the UHI effect, the absence of vegetation is probably the
aspect that, wherever lacking and needing to be implemented, could have the most
significant improvement in reducing the UHI impacts because it has large environmental
benefits, besides social and psychological effects. Within the context of the thesis,
vegetation can be used to adapt to the UHI effect with twofold effect according to the
number of buildings involved (Akbari, Davis, Dorsano, Huang, & Winnett, 1992, p. 28):

96
1. “Indirect effect”, those that refer to the modification of a whole urban space
like a public square changing its “environmental conditions” (Akbari, Davis,
Dorsano, Huang, & Winnett, 1992, p. 28). A typical example of the indirect
effect is the process of evapotranspiration, which involves both evaporation
and transpiration of plants. According to the U.S. EPA, the transpiration is
given by the fact that “Trees and vegetation absorb water through their
roots and emit it through their leaves” (U.S. Environmental Protection
Agency, 2008, p. 3). Whilst evaporation is “the conversion of water from a
liquid to a gas” (U.S. Environmental Protection Agency, 2008, p. 3). It is
obvious that vegetation performances strictly depend on the species and,
thus, on their location. Furthermore. Evapotranspiration can also be
introduced by other types of vegetation in the form shrubs and green verge,
they are smaller, and they usually get overlooked but, at the local and
pedestrian scale, they can donate a modest positive influence on cooling
air temperature affecting the SUHI. When vegetation is lacking in urban or
suburban areas, it means that the built environments struggle with
breathing. Urban and suburban areas can breathe thanks to the
evapotranspiration, the fundamental function of vegetation for the purpose
of this thesis, besides providing shading.
2. “Direct effect” are those providing shade and wind speed reduction are
generally influencing one single building only (Akbari, Davis, Dorsano,
Huang, & Winnett, 1992). Vegetation shading and vegetation in general,
have, in turn, a twofold function since it is commonly known that, besides
the environmental effects previously explained, it has an astonishing impact
on pedestrians, increasing the effort that people could spend on walking.
However, as it is valid in every street and any public space, also public
plazas and squares would benefit of cooler air if trees and vegetation are
placed within the public space but also right next to buildings because of
two reasons. First, they can cover building façades avoiding glare from
reflective surfaces that, otherwise, would heat the pavements on the public
squares and that would warm the air in the square during hot summer days.
Contrary, during wintertime, shaded areas could be a problem for
pedestrians but, at the same time, trees and shrubs can provide repairs
from biting wind gusts. The second aspect strictly depends on the tree
species and their foliage dimensions but, thanks to leaves and branches,
trees shading located in plazas could offer shading places where to rest
and relax during lunch break or while waiting for public transport. In
general terms, it is been found that during summers only 10 to 30 percent
of solar radiation strikes the shaded area provided by the tree foliage,

97
making the tree shadings a fresher place to be (U.S. Environmental
Protection Agency, 2008).
Even though both the effects of vegetation described are very important to adapt to the UHI
effect, many studies state that the most important between the two functions is shading. In
particular, “the significant characteristic of the landscape element is its shape, volume and
leaf density” (Rosheidat, Hoffman, & Bryan, 2008, p. 200). However, considering both the
functions together, helpful results in tackling the UHI effect can be obtained. In fact,
according to Laïlle et al., by providing shadowing, vegetation can avoid warmer
temperatures at the surfaces shadowed “and, combined with the cooling effect of
evapotranspiration, this ensures that the air below the tree canopy remains at a more
pleasant temperature” (Laïlle, Provendier, Colson, & Salanié, 2014, p. 8). To conclude, it
is important to stress that native plants are preferred instead non-native plants because the
formers are “accustomed to the local climate conditions” (Santamouris, et al., 2004, p.
50) and therefore they can perform better the process of evapotranspiration. As will be later
explained, native vegetation is highly recommended in dry climate areas.
Cool pavements
According to Gartland, pavements cover the built environment approximately from 25 to
50 percent of the total surfaces (2008) resulting in one of the main causes of “higher
temperatures” (van Ooststroom, 2011, p. 26). As for cool roofs, also in the case of
pavements white and light-colors are preferred to the black and darker ones. Therefore, in
order to reduce the UHI effect, the key component delineating pavements are, once again,
the materials and their colors of which they are made. If we consider pavements in their
broader terms – including also roads and sidewalks - the two most common materials are
asphalt and cement. Gartland states that “there are two ways to make pavements cooler:
(1) by increasing their solar reflectance, and/or (2) by increasing their ability to store and
evaporate water” (Gartland, 2008, p. 85). To satisfy the first option, light-colored materials
should be applied to pavements surfaces but, exactly as in the case of cool roofs, to
brightness may generate glare problems (Gartland, 2008), affecting pedestrians and the
surrounding buildings. Referring to the second requirement, instead, the capacity to
evaporate and store water represents its perviousness (or porousness). Besides the benefits
of cool pavements that would arise when flooding occurs (later explained), porous
pavements can also reduce the UHI effect by “Evaporating water draws heat from the
pavement, keeping the pavement cooler in the sun” (Gartland, 2008, p. 85). Since the
reflectance issue of cool materials has already been argued, a brief in-depth on this last
pavement characteristic is needed.
The porous feature of pavement can be obtained by having pavements made of porous
materials themselves. In this pavement pattern, the process that establishes is similar to the
evapotranspiration method happening with vegetation, that is “water passes through the

98
voids and into the soil” (U.S. Environmental Protection Agency, 2008, p. 8) getting
absorbed and transformed in water vapor due to heat of the pavement surface, “thus
drawing heat out of the pavement” (U.S. Environmental Protection Agency, 2008, p. 8).
Although asphalt and concrete in their natural form are the opposite of cool pavements, if
the material of which is made of getting modified with a more porous one, they can increase
their capacity to drain water. There is plenty of pavement typology with high permeable
properties, among which: “permeable asphalt pavements, porous concrete pavements,
pervious cast concrete pavements, and interlocking concrete pavements” (Li, Harvey, &
Jones, 2013, p. 98). According to Gartland, pavements could be of two types: asphalt,
usually black colored “with solar reflectance values of 5–10 per cent” (2008, p. 86), or
concrete, usually “light grey in colour with solar reflectance values usually between 35 and
40 per cent” (2008, p. 88). There are types of pavements that are cool by themselves, and
others that can be made (Table 1).
Table 4.1 – Types of cool pavements according to solar reflectance and application
Type of pavement Solar reflectance Usual application
Portland Cement
concrete
35% – 40% Roads, parking lots, sidewalks and
other paved areas
White topping 35% – 40% Covering existing asphalt pavements
on all types of roads, parking lots,
sidewalks and other paved areas
Interlocking concrete
pavers
They are often tinted
with pigment, so
interlocking pavers can
have a wide range of
reflectance values if
light colored pigments
are applied
High load conditions such as
industrial and warehouse operations,
airplane taxiways and airport hubs,
as well as in lower load applications
such as sidewalks and driveways.
Colored asphalt
seals and seal coats
Depending on the color
applied
All types of surfaces, especially used
to designate different traffic areas
(bike lanes versus car lanes) and for
decorative design purposes
Open-graded
asphalt pavements
Up to 30% Roads, parking lots and other
applications
Pavement texturing Depending on the color
applied
Street paving, traffic calming,
pedestrian areas, medians and

99
boulevards, parking lots, playgrounds
and other applications
Porous block
pavement systems
30% - 50% Pedestrian walkways, driveways,
parking lots, overflow parking, fire
lanes or any other less frequently
travelled surfaces
Source: Author’s re-elaboration based on data taken from: “Heat Island: Understanding and Mitigating Heat
in Urban Areas” (Gartland, 2008, p. 92-99)
To conclude, cool pavements can be achieved via high perviousness materials or high
reflectance materials. However, as for all the adaptation measures, also cool pavements
should be adapted to the climatic conditions according to the location because, as
underlined by Buyung and Ghani, pavements perform better in humid climatic regions
where rainfalls are frequent and humidity is constant, otherwise they could get the opposite
result causing higher temperatures than “conventional pavement” (Buyung & Ghani, 2017,
p. 6).
Water bodies
Water elements in urban and suburban areas can have important impacts on the reduction
of the UHI effect because “surface water acts as a cooling element in cities (Theeuwes,
Solcerová, & Steeneveld, 2013, p. 8894). According to the Ph.D. thesis of Kleerekoper,
the processes of cooling air can be performed by water bodies through “evaporation, by
absorbing heat when there is a large water mass which functions as a heat buffer - or by
transporting heat out of the area by moving” (Kleerekoper, 2016, p. 81). The performance
of water bodies within built environments depend on multiple factors, the most important
one is the air exchange above the wet surfaces (Manteghi, Imit, & Remaz, 2015).
Water sparkling is commonly considered as an important waste of such a precious
resource. The drawback of water sparkling and water surfaces as adaptation action is its
limited availability. To cope with such lacking, grey water or water coming from rainwater
storage could be used (Bougiatioti, 2005, p. 121). Water elements are better enjoyed in
dry climates, where summers are hot and not in places where the humidity is already
existing. water bodies are elements of urban design besides its environmental benefits. In
fact, using water bodies for cooling function, their shapes, locations, and dimensions could
also be exploited to create paths that direct pedestrians or that remove them from certain
forbidden spaces.
4.1.3. Urban geometry
Everything that has been discussed reducing the UHI effect so far deals with urban
geometry. This paragraph deals with the UHI effect through the consciousness that every

100
location and orientation directly affects the intensity of UHI. In this sense, buildings are
physical barriers to normal environmental fluxes – like natural ventilation - that would
normally occur if cities and their suburbs would be flat. Public squares are surrounded by
buildings; therefore, public squares are directly affected by the climate influenced by urban
geometry and, vice versa, their orientation and H/W ratio should be designed according
to the local climate to better adapt to CC.
H/W ratio
We have already discussed the height (H) to width (W) ratio (H/W) in the previous Chapter
3 from the “sense of enclosure” point of view, but H/W is also a fundamental pillar of
urban geometry. Considering its influential character on shading and on ventilation of
urban spaces, H/W here is thought as an adaptation measure to involve in urban planning
and urban design processes with specific regard to public squares. With appropriate and
balanced dimensions, buildings heights and square (or street) widths can orient both wind
and shadows affecting, therefore, the “thermal comfort” (Taslim, Parapari, & Shafaghat,
2015, p. 121). According to the Kleerekoper’s Ph.D. Thesis on thermal comfort in Dutch
neighborhood, urban geometry and its density “influence the incidence of radiation on
materials that can store heat, and the trapping of radiation by multiple reflections between
buildings and street surface” (Kleerekoper, 2016, p. 86). As previously explained, H/W
ratio is strictly dealing with two conditions: shading, which should in order to allow the
“optimal shading” and ventilation: optimal shading, obtainable according to the
orientation of buildings and the climate conditions affecting the location, and natural
ventilation,
1. Optimal shading
As seen before, a sustainable method to shadow buildings is through the use of
vegetation with a strategic location allowing a covered layer before the solar
radiation strikes on buildings. Nevertheless, shadowing can be obtained also by
the buildings themselves with accurate H/W ratio. Through the Hotkevica Master
Thesis, it has been possible to understand “how much area is exposed to the sun
and for how many hours” (Hotkevica, 2013, p. 60). In her work (Figure 4.4), she
matched different H/W (2:1, 1:1, 1:2, 1:3) to four different building’s orientations
(N-S, NE-SW, NW-SE, W-E) identifying the diurnal solar exposure areas according
to time. Her research has been made considering street’s H/W ratios, but they can
also be applied for square contexts. The results show that with 1:2 and 1:3 H/W
ratios at all the four square possible orientations, and with 1:1 H/W ratio W-E
oriented, the buildings surrounding the square but also the pavements are highly
subjected to solar radiation (Hotkevica, 2013). These most vulnerable square
conditions are enclosed in the red box of Figure 23. The important and useful
research made by Hotkevica shows that shading can be obtained not only by

101
vegetation, which still remains fundamental but also by building’s H/W ratio. In this
context, to match adaptation and mitigation goals, and overall and intersected
vision is needed. Thus, it is reasonable to link optimal shading with a sense of
enclosure, where a 1:3 H/W ratio has been considered the most realistic for the
public square to accommodate pedestrians (Chapter 3). This scenario (illustrated
Figure 4.4 - Buildings and pavements solar exposure according to different H/W ratios and
orientations
Source: (Hotkevica, 2013, p. 61)

102
on the right side of the Figure 4.4) is the most critical among all those analyzed by
Hotkevica because are those that let buildings and pavements to higher solar
radiation exposure due to their lower H/W ratio (it is obvious that with 1:6 ratio the
solar exposure would be higher and critical but is also true that at that H/W ratio
sense of enclosure is not perceived). This result leads to thinking that in order to
obtain shadows in urban and suburban squares, buildings alone are not sufficient
and, consequently, a balanced proportion of H/W and other adaptation measures
– first of all, vegetation – should be integrated to obtain shadowed and cool urban
squares.
2. Natural ventilation
Besides the features of the fundamental material of the building itself and the just
explained shading value, it is also crucial the orientation of the square (and the
related surrounding buildings) to favor UHI effect reduction by natural ventilation.
At urban and suburban square scale, wind flows play an important role to blow the
heat away and alleviate high temperatures caused by the UHI effect. Assuming that
the most common H/W ratio for plazas is 1:3 (in this case is more appropriate to
consider it as H/W= 0,33), buildings on the edge are quite widely separated from
the ones in front of them. As underlined by Oke et al. (2017), wind flows interact
with the built environment not only because they break on buildings, but wind flows
are affected by their H/W ratio. If the relation between buildings is characterized by
large space in between (H/W < 0,35) then wind flows act as if they were isolated
buildings because the wind breaks on them bypassing them (Figure 4.5a)
continuing its natural flow (Oke, Mills, Christen, & Voogt, 2017). The authors affirm
that with shorter distances between the buildings edging the square (that is, H/W
ratio between 0,35 and 0,65), interferences between wind flows occur (Figure
4.5b). In this case, “the vortex in the cavity behind the upwind building is reinforced
by the flow down the windward face of the next building” (Oke, Mills, Christen, &
Voogt, 2017, p. 87) resulting in the possible violent wind flows. The third type of
wind flow that may occur is called “skimming flow” and arise when the H/W ratio
is higher than 0.65. In this case, such a close proximity allow very weak wind flows
to enter in the so-called “urban canyons” where “the flow above the roof has
become partially de-coupled from that in the canyons” (Oke, Mills, Christen, &
Voogt, 2017, p. 87) as illustrated in (Figure 4.5c).

103
Concluding, the UHI effect is one of the major and negative consequences of CC. The
positive aspect is that it can be reduced by both mitigation (which are not treated in this
thesis) and adaptation actions, reducing its impact on the public realm and its pedestrians.
The scope of this paragraph is to identify measures to draw from in order to better adapting
to such a problem. Assuming H/W equal to 1:3 (or 0,33) as a standard one for square, it
is very challenging to provide shading by building heights and widths only. Vegetation is
always a good element to implement, especially in those squares characterized by very low
H/W ratios. In fact, thanks to the foliage area, trees can shade buildings and pavements
representing a valid possible incrementation to add in wide urban squares and plazas.
A useful strategy concerns the orientation of the buildings that surround the square which
partially allow every orientation, excluding the N-S one, according to the diurnal time.
Regarding ventilation, a clear natural flow should be provided by buildings’ H/W ratios to
allow air exchange. Whilst it can be difficult to obtain a significant air exchange with
elevated H/W ratio, urban and suburban square should be planned with lower H/W ratio
(e.g. H/W= 0,35) being aware to do not exaggerate, otherwise, sense of enclosure would
become overwhelming and natural ventilation could not reach the SUHI.
4.2. Flooding
Floods are natural disasters meaning that is they are intrinsic effects of climate nature and
that is natural to happen. Besides the climate regions, upon which depend on the frequency
of rainfalls and their intensity, floods can occur in every U.S. county randomly. Always
focusing on urban public squares and plazas as the key point for pedestrian life, they are
commonly constructed and planned in order to accommodate social interactions and to
boost economic activities rather than an extreme event like floods (Silva & Costa, 2018).
Figure 4.5 a), b), c) - Wind flows behaviors according to different H/W ratios
Source: (Oke, Mills, Christen, & Voogt, 2017, p. 88)

104
In fact, they are normally not prepared for such natural disasters and their presence
immediately shifts from being essential and vital to being one of the reasons why such
natural events become a complete catastrophe, as it happens wherever a land-use change
has become anthropized. As described in Chapter 1, CC changes the frequency and
intensity of the rainfall, “leading to some regions suffering increased storminess and hence
increased flooding incidents” (Lamond, Booth, Hammond, & Proverbs, 2017, p. 210).
Flood adaptation measures can occur at three different urban scales: local, district and
regional. If drainage systems are integrated at all those spatial scales, they can provide a
strategic and efficient way to accommodate heavy rainfalls resulting in helpful to avoid
flooding (Wong, 2006). To deal with the purpose of the thesis only the actions at the square
level (within the local scale) will be treated. Adaptation measures to flooding at the local
and square level have been grouped by category typology as follows:
▪ Urban greenery
It considers all the vegetation that present at the ground level regarding public
spaces and also vegetation in the form of green walls and green roofs, rather
than wider green spaces (e.g. urban parks and similar) because, even though
the latter can infiltrate larger amount of rainfalls, the focus in this instance is on
the public square capacity to adapt to floods. Due to the high value of
impervious surfaces in dense urban and suburban areas, it is difficult to deals
with extreme rainfall events when they occur (Kim, Lee, & Sung, 2016).
Vegetation and green spaces applied on building’s surfaces have two main
benefits: “1) increasing water interception due to vegetation cover, and; 2)
increasing storage capacity and infiltration of the soil” (Zimmermann,
Bracalenti, Piacentini, & Inostroza, 2016, p. 2242).
▪ Reservoir
There are several types of reservoirs helping to control flooding, for this
instance, we take into account detention reservoirs, which can function as a big
bowl storing excess of water coming from heavy rainfalls. The fact of locating
such a structure within the square can have multiple benefits. The first is the
direct effect it could have on the amount of water stored within the basis that
would otherwise become surface runoff. The second is related to its recreational
function emerging once the rainfall event ends and the square, fulfilled with
water, can “provide facilities for water based recreational activities”
(Hettiarachchi, 2016, p. 57). Even if the reservoir could be placed “somewhere
upstream” (Hettiarachchi, 2016, p. 57), locating it within the plaza can also

105
function as a sort of arena where, when rainfalls do not occur, the reservoir
becomes a basketball playground or a skate park, for example.
▪ Bioretention
The bioretention category deals with vegetation that, in case of flooding, helps
to avoid or at least limiting surface runoff due to the fact that trees and plants
require the presence of soil. In technical words, this means a highly porous and
permeable surface. Once the surface runoff is absorbed by the vegetation soil,
then it could go through two processes. The first is related to the connection of
a drainage system which allows water absorbed to be channeled. The second
involved a further infiltration into the underneath soil layer (Blick, Kelly, Skupien,
Friedman, & Jacobus, 2004, p. 9.1). Bioretention option can be provided in
two forms: “a bioretention basin or a longer, narrower bioretention swale”
(Blick, Kelly, Skupien, Friedman, & Jacobus, 2004, p. 9.1).
▪ Permeable pavements
Besides their fundamental cooling function which allows evaporation,
permeable pavements are especially useful in mitigating floods due to their
capacity that allows urban and suburban areas to act as “sponges”. Generally,
permeable pavements are block pavers characterized by open joint spaces in
between one another (Shafique, Kim, & Kyung-Ho, 2018). In this way
permeable pavements are able to “collect, treat and infiltrate freely any surface
runoff to support groundwater recharge” (Scholz & Grabowiecki, 2007, p.
3831). According to Hu et al., it is not easy to define a general and standard
real efficiency of permeable pavements because it depends on ”the types of
permeable pavements, the clogging situation of permeable pavements, and the
initial water content at the beginning of the storm event” (Hu, et al., 2018, p.
9). Also, porous pavements can contribute to runoff reduction and stormwater
infiltration but, compared to permeable pavements, their properties allow lower
water infiltration.
▪ Infiltration techniques
In this case, infiltration techniques refer to infiltration trenches which consist of
substrate layers made of rocks of different sizes (Chahar, Graillot, & Gaur,
2012). Thanks to this layer made of stones, water in the soil can infiltrate easier
and faster, allowing a larger amount of water to enters the soil that otherwise
would be transformed into surface runoff. Usually, infiltration techniques are
“used for small drainage areas” (Chahar, Graillot, & Gaur, 2012, p. 275) but,

106
if integrated with other flood adaptation measures together they can cover
wider areas like those of public squares.
The categories identified above, have been matched with some real examples worldwide
by Silva and Costa (2016, p. 7-9) and are proposed in Table 4.2.
Table 4.2 - Flood adaptation measures to flooding and examples
Category Function Adaptation
measure
typology
Project Name Location
Urban
greenery
Water
interception,
Stormwater
infiltration
Green walls
Caixa Forum plaza Madrid
Westblaak’ car
park silo
Rotterdam
Green roofs
Dakpark Rotterdam
Promenade Plantée Paris
European Patent
Office
Rijswijk
Womans University Seoul
High Line Park New York
Reservoir
Flood
control,
Detention,
Storage
Artificial
detention
basins
Parc de Diagonal
Mar
Barcelona
Parc del Poblenou Barcelona
Water plazas
Benthemplein
square
Rotterdam
Tanner Springs
Park
Portland
Underground
reservoirs
Parc de Joan Miró Barcelona
Escola Industrial Barcelona
Postdamer
Platz
Berlin
Museumpark car
park
Rotterdam
Place Flagey Brussels
Bioretention
Stormwater
infiltration,
Runoff
reduction
Bioswales
Trabrennbahn
Farmsen
Hamburg
Elmhurst parking
lot
New York City
Ecocity
Augustenborg
Malmö
Museum of Science Portland
High Point 30th
Ave
Seattle
Moor Park Blackpool
Ribblesdale Road Nottingham

107
Bioretention
planters
South Australian
Museum
Adelaide
Columbus Square Philadelphia
Derbyshire Street London
Onondaga County New York
Rain gardens
Edinburgh Gardens Melbourne
Taasinge Square Copenhagen
Australia Road London
East Liberty Town
Square
Pittsburgh
Permeable
pavements
Runoff
reduction,
Stormwater
Infiltration
Open cell
pavers
Can Caralleu Barcelona
Zollhallen Plaza Freiburg
Interlocking
pavers
Green park of
Mondego
Coimbra
Bakery Square 2.0 Pittsburgh
Porous paving
Praça do Comércio Lisbon
Percy Street Philadelphia
Greenfield
Elementary
Philadelphia
Infiltration
techniques
Infiltration
trenches
Etna Butler Street Pittsburgh
Community
College
Philadelphia
Elmer Avenue
Neighborhood
Los Angeles
Source: Author’s re-elaboration based on: (Silva & Costa, Flood Adaptation Measures Applicable in the
Design of Urban Public Spaces: Proposal for a Conceptual Framework, 2016, p. 7-9)
4.3. Drought
Drought is probably the natural disaster towards which the design of the square and its
characteristics can do less. This is because “Unlike other urban disasters (e.g., flood,
earthquake, and fire), urban drought happens silently and often without visible warnings”
(Zhang, et al., 2019, p. 2). Besides the several factors under which drought gravity
depends, which have been underlined in Chapter 1 (duration, intensity, and geographical
area affected), droughts are also affected by the “demands made by human activities and
by the vegetation on a region’s water supplies” (Wilhite & Glantz, Understanding the
Drought Phenomenon: The Role of Definitions, 1985, p. 3). This implies that droughts
adaptation measures concerning public squares are limited to two actions: drought-tolerant
vegetation and water storage.
Vegetation choice, to allow trees and plants to perform their multiple fundamental functions
(described before) in an efficient way even during extreme and long-lasting natural events.
To do so, native plants and trees are preferred because they can properly survive droughts.
Thus, the most important plant function in this context is called “drought resistance” (DR)

108
and it is available in those species characterized by high adaptation capacity that “enable
them to escape, avoid, or tolerate drought stress” (Basu, Ramegowda, Kumar, & Pereira,
2016, p. 3). The problem regarding vegetation during the drought period is linked to the
irrigation issue. Native plants can last for a very long period without being irrigated whilst,
other types of species could suffer if they do not be irrigated constantly. Thinking about
cactus in the desert is a good one, but it would be quite uncommon and dangerous to have
cactus in public square which are recommended to be safe for pedestrian flows (including
children). There are several and not dangerous types of drought-tolerant plants proper for
climate regions where drought happens or where the dry climate is constant (South West
U.S.). In such cases, drought-tolerant plants can survive thanks to their water efficiency
properties, such as: “extensive root systems, thick leaf waxes and periderm, good stomatal
control, and the capacity for leaf cells to function at low water contents are needed” (Coder,
2018). According to Coder (2018), in order to obtain heat and drought-resistant plants in
Southern U.S. climatic regions, they should be (Coder, 2018, p. 2):
▪ Natives, because of their adaptability to specific local climate conditions;
▪ Multilayered, in terms of quantity of branches and leaves allowing high water-
efficient property;
▪ Taller, rather than wider, in terms of crown shape since “cone or cylinder shaped
crowns” have a “great effect on heat dissipation and water use” (Coder, 2018, p.
2);
▪ Small leaves sized, rather than large because they “shed heat and have few pores
from which to lose water” (Royal Horticultural Society);
▪ Broad-leaved trees, since they are able to “reflect 25% more light than conifer trees
on average” (Coder, 2018, p. 2);
The other applicable adaptation action is water storage installation, to be able to rely on
the water resource in order to supply to agricultural needs during droughts. This kind of
adaptation action is similar to what explained water reservoirs but with a huge difference.
The reservoirs used for flooding purposes have the function to accommodate water in
excess that occurs with storms and heavy rainfalls. In the case of droughts, in contrast, water
storage would serve for the opposite purpose, that is to save water from rainfalls.
Even if few measures have been identified, droughts adaptation measures are clearly
difficult to apply to public squares and to public spaces in general but that does not mean
they are not important. On the contrary, they are fundamental to prevent urban droughts
problems (especially those related to vegetation), but through planning processes and
policies rather than the Urban Design ones.
The next and final Chapter 6 will analyze case studies in different climatic regions across
the USA and they will be based around TOD areas in order to verify if all the components
developed so far match in some way and, if any, how they develop strategies to adapt and
mitigate CC.

109
This page is intentionally left blank

110
References PART II
Akbari, H., Davis, S., Dorsano, S., Huang, Y., & Winnett, S. (1992). Cooling Our
Communities: A Guidebook on Tree Planting and Light-Colored Surfacing. U.S.
Environmental Protection Agency, Office of Policy Analysis, Climate Change
Division. Retrieved from http://repositories.cdlib.org/lbnl/LBL-31587
Arizona State University. (2007, February 8). Adaptation To Global Climate Change Is
An Essential Response To A Warming Planet. ScienceDaily. Retrieved January 4,
2020, from www.sciencedaily.com/releases/2007/02/070207171745.htm
Augustesen, C., Brandi, U., Dietrich, U., Friederici, A., Geissmar-Brandi, C., Thule
Kristensen, P., . . . Wiegelmann, A. (2006). Lighting Design: Principles,
Implementation, Case Studies. Munich: Institut für internationale Architektur-
Dokumentation GmbH & Co. KG.
Basu, S., Ramegowda, V., Kumar, A., & Pereira, A. (2016). Plant adaptation to drought
stress [version 1; peer review: 3 approved]. F1000Research, 5(F1000 Faculty
Rev), 1554. doi:https://doi.org/10.12688/f1000research.7678.1
Beck, U. (1992). Risk Society: Towards a New Modernity. London, UK: SAGE
Publications.
Blick, S., Kelly, F., Skupien, J., Friedman, B., & Jacobus, S. (2004). New Jersey
Stormwater Best Management Practices Manual. Trenton, New Jersey: New Jersey
Department of Environmental Protection. Division of Watershed Management.
doi:https://doi.org/doi:10.7282/T3K64GFK
Bougiatioti, F. (2005). The Thermal Role of Materials in Mediterranean Cities. In D.
Babalis, Ecopolis: Sustainable Planning and Design Principles (pp. 115-123).
Firenze: Alinea International.
Brandi, U., & Geissmar-Brandi, C. (2007). Light for Cities: Lighting Design for Urban
Spaces. A Handbook. Basel: Birkhäuser - Publishers for Architecture.
Buyung, N., & Ghani, A. (2017, October). Permeable pavements and its contribution to
cooling effect of surrounding temperature. Proceedings of the International
Conference of Global Network for Innovative Technology and AWAM
International Conference in Civil Engineering (IGNITE-AICCE’17). AIP Conf. Proc.
1892, 170003. doi:https://doi.org/10.1063/1.5005783
Caiazzo, F., Ashok, A., Waitz, I., Yim, S., & Barrett, S. (2013, November). Air pollution
and early deaths in the United States. Part I: Quantifying the impact of major
sectors in 2005. Atmospheric Environment, 79, pp. 198-208.
doi:https://doi.org/10.1016/j.atmosenv.2013.05.081
Calthorpe, P. (1993). The Next American Metropolis: Ecology, Community, and the
American Dream. New York: Princeton Architectural Press.
Carmona, M. (2009). Sustainable Urban Design: Definitions and Delivery. International
Journal for Sustainable Development, 12(1), 48-77.
doi:10.1504/IJSD.2009.027528

111
Carmona, M., & de Magalhaes, C. (2009). Local Environmental Quality: Establishing
Acceptable Standards in England. The Town Planning Review, 80(4/5), 517-548.
doi:10.3828/tpr.2009.9
Carmona, M., Heath, T., Oc, T., & Tiesdell, S. (2003). Public Places Urban Spaces: The
Dimensions of Urban Design. Oxford: Architectural Press.
Carter, J., Cavan, G., Connelly, A., Guy, S., Handley, J., & Kazmierczak, A. (2015).
Climate change and the city: Building capacity for urban adaptation. Progress in
Planning, 95, 1-66. doi:http://dx.doi.org/10.1016/j.progress.2013.08.001
Chahar, B., Graillot, D., & Gaur, S. (2012). Storm-water management through
Infiltration trenches. Journal of Irrigation and Drainage Engineering, American
Society of Civil Engineers, 138(3), 274-281. doi:: 10.1061/(ASCE)IR.1943-
4774.0000408
Cheshmehzangi, A. (2012). Identity and Public Realm. Procedia - Social and Behavioral
Sciences, 50, 307-317. doi:https://doi.org/10.1016/j.sbspro.2012.08.036
Coder, K. (2018). Drought Resistant Trees Drought Resistant Trees. Warnell School of
Forestry & Natural Resources, University of Georgia. Retrieved January 31, 2020,
from https://www.warnell.uga.edu/outreach/publications/individual/drought-
resistant-trees-0
Congress for the New Urbanism. (n.d.). What is New Urbanism? Retrieved from CNU:
https://www.cnu.org/resources/what-new-urbanism
Cooley, A. (2017, October 6). What the effort. Recycling today. Retrieved December 21,
2019, from http://magazine.recyclingtoday.com/article/october-2017/public-
space-recycling-worth-the-effort.aspx
Costanzo, V., Evola, G., & Marletta, L. (2016). Energy savings in buildings or UHI
mitigation? Comparison between green roofs and cool roofs. Energy and
Buildings, 114, 247-255. doi:http://dx.doi.org/10.1016/j.enbuild.2015.04.053
de Fine Licht, K. (2017). Hostile urban architecture: A critical discussion of the seemingly
offensive art of keeping people away. Etikk I Praksis - Nordic Journal of Applied
Ethics, 11(2), 27-44. doi:https://doi.org/10.5324/eip.v11i2.2052
Desonie, D. (2008). Climate: Causes and Effects of Climate Change. New York: Chelsea
House Publishers.
Duany, A., Plater-Zyberk, E., & Co. (2003). The Lexicon of New Urbanism. Retrieved from
https://www.dpz.com/Books/All
Duany, A., Sorlien, S., & Wright, W. (2003). The SmartCode. The Town Paper Publisher.
Retrieved from https://www.dpz.com/Books/All
Erell, E., Pearlmutter, D., & Williamson, T. (2011). Urban Microclimate: Designing the
Spaces Between Buildings. London, UK: Earthscan.
Fisher, D. (1996). Public Art and Public Space. Soundings: An Interdisciplinary Journal,
79(1/2), 41-57. Retrieved December 22, 2019
Gartland, L. (2008). Heat Islands: Understanding and Mitigating Heat in Urban Areas.
London: Earthscan.

112
Gehl, J. (2010). Cities for People. Washington, DC: Island Press.
Gehl, J. (2011). Life Between Buildings: Using Public Space. Washington, DC: Island
Press.
Gehl, J., & Svarre, B. (2013). How To Study Public Life. Washington, DC: Island Press.
Getter, K., & Rowe, D. (2006). The Role of Extensive Green Roofs in Sustainable
Development. HortScience, 41(5), 1276-1285.
doi:https://doi.org/10.21273/HORTSCI.41.5.1276
Hebbert, M. (2003). New Urbanism — the Movement in Context. Built Environment
(1978-), 29(3), 193-209. Retrieved January 26, 2020, from
www.jstor.org/stable/23287649
Hettiarachchi, P. (2016). Detention Reservoirs as a Flood Control Measure. Engineer,
42(2), 57-60. doi:10.4038/engineer.v44i2.7023
Hotkevica, I. (2013). Green elements in street canyons: Research by design for heat
mitigation and thermal comfort in urban areas. Wageningen, NL: Wageningen
University: MSc Thesis. Retrieved from
https://library.wur.nl/WebQuery/kvk/2035703
Hu, M., Zhang, X., Siu, Y., Li, Y., Tanaka, K., Yang, H., & Xu, Y. (2018). Flood Mitigation
by Permeable Pavements in Chinese Sponge City Construction. Water, 10, 172.
doi:https://doi.org/10.3390/w10020172
Institute of Public Administration. (1977). People Movement for Downtown Improvement.
Washington, DC: Department of Transportation, Urban Mass Transportation
Administration.
International Dark-Sky Association. (n.d.). Outdoor Lighting Basics. Retrieved December
21, 2019, from IDA: https://www.darksky.org/our-work/lighting/lighting-for-
citizens/lighting-basics/
IPCC. (2007). Climate Change 2007: Impacts, Adaptation and Vulnerability. Contribution
of Working Group II to the Fourth Assessment. New York, NY: Cambridge
University Press.
Jacobs, J. (1961). The Death and Life of Great American Cities. New York: Random
House.
Karssenberg, H., & Laven, J. (2016). The City At Eye Level. In H. Karssenberg, J. Laven,
M. Glaser, & M. van 't Hoff, The City At Eye Level: Lesson For Street Plinths.
Second and extend version. Delft, NL: Eburon Academic Publishers.
Keep American Beautiful. (n.d.). About Keep American Beautiful. Retrieved December 21,
2019, from KAB: https://kab.org/about/
Kim, H., Lee, D., & Sung, S. (2016). Effect of Urban Green Spaces and Flooded Area
Type on Flooding Probability. Sustainability, 8(2), 134. doi:10.3390/su8020134
Kleerekoper, L. (2016). Urban Climate Design: Improving thermal comfort in Dutch
neighbourhoods. Delft: Delft University of Technology: PhD Thesis. Retrieved
January 9, 2020, from

113
https://www.researchgate.net/publication/307652991_Urban_Climate_Design_I
mproving_thermal_comfort_in_Dutch_neighbourhoods/citations
Köhler, M. (2008). Green facades - a view back and some visions. Urban Ecosyst, 11,
423-436. doi:10.1007/s11252-008-0063-x
Krier, L., Thadani, A. D., & Hetzel, P. (2009). The Architecture of Community.
Washington, DC: Island Press.
Laïlle, P., Provendier, D., Colson, F., & Salanié, J. (2014). The Benefits of Urban
Vegetation: A Study of the Scientific Research and Method of Analysis. Cité Verte.
Retrieved January 8, 2020, from
https://www.academia.edu/10048653/THE_BENEFITS_OF_URBAN_VEGETATIO
N
Lalosevic, M., Komatina, M., Milos, M., & Rudonja, N. (2018, January). Green roofs and
cool materials as retrofitting strategies for urban heat Island mitigation - Case
study in Belgrade, Serbia. Thermal Science. doi:10.2298/TSCI171120086L
Lamond, J., Booth, C., Hammond, F., & Proverbs, D. (2017). Flood Hazards: Impacts
and Responses for the Built Environment. Boca Raton, FL: CRC Press: Taylor &
Francis Group.
Lang, J. (1994). Urban Design: The American Experience. New York: Van Nostrand
Reinhold.
Lang, J. (2005). Urban Design: A typology of Procedures and Products. Illustrated with
over 50 Case Studies. Oxford: Architectural Press.
Li, H., Harvey, J., & Jones, D. (2013, December). Cooling Effect of Permeable Asphalt
Pavement Under Dry and Wet Conditions. Transportation Research Record:
Journal of the Transportation Research Board, 3(2372), 97-107.
doi:10.3141/2372-11
Local Government Association of South Australia. (2014). Public Realm: Urban Design
Guidelines. South Australia.
Lutz, C., & Fernandez, A. (2010). Carjacked: the culture of the automobile and its effect
on our lives. New York: Palgrave Macmillan.
Lynch, K. (1960). The Image of the City. Cambridge, Mass: The MIT Press.
Lynch, K. (1962). Site Planning. Cambridge, Mass: The MIT Press.
Manso, M., & Castro-Gomez, J. (2015, January). Green wall systems: A review of their
characteristics. Renewable and Sustainable Energy Reviews, 41, 863-871.
doi:https://doi.org/10.1016/j.rser.2014.07.203
Manteghi, G., Imit, H., & Remaz, D. (2015). Water bodies an urban microclimate: A
review. Modern Applied Science, 9(6), 1-12. doi:10.5539/mas.v9n6p1
Milman, O. (2018, January 1). Vehicles are now America's biggest CO2 source but EPA
is tearing up regulations. Retrieved November 4, 2019, from The Guardian:
https://www.theguardian.com/environment/2018/jan/01/vehicles-climate-
change-emissions-trump-administration

114
Moriyama, M., & Takebayashi, H. (2012). Colored Cool Materials. In D. S. Kolokotsa,
Advances in the Development of Cool Materials for the Built Environment (pp. 72-
82). Bentham Books. Retrieved January 7, 2020, from
https://www.academia.edu/24302676/Advances_in_the_Development_of_Cool_
Materials_for_the_Built_Environment
Moughtin, C. (2003). Urban Design: Street and Square (3rd ed.). Oxford: Architectural
Press.
Nation Master. (2014). Motor vehicles per 1000 people. Retrieved December 2, 2019,
from Nation Master: https://www.nationmaster.com/country-
info/stats/Transport/Road/Motor-vehicles-per-1000-people#-amount
National Safety Council. (n.d.). Vehicle Deaths Estimated at 40,000 for Third Straight
Year. Retrieved from National Safety Council: https://www.nsc.org/road-
safety/safety-topics/fatality-estimates
Ngan, G. (2004). Green Roof Policies: Tools for Encouraging Sustainable Design.
Vancouver, Canada: Landscape Architecture Canada Foundation. Retrieved
January 7, 2020
Oikonomou, A. (2005). Bioclimatic Design of Water Elements in Mediterranean Cities. In
D. Babalis, Ecopolis: Sustainable Planning and Design Principles (pp. 125-132).
Firenze: Alinea International.
Oke, T. (1987). Boundary Layer Climates (2nd ed.). London: Routledge.
doi:https://doi.org/10.4324/9780203407219
Oke, T., Mills, G., Christen, A., & Voogt, J. (2017). Urban Climates. Cambridge:
Cambridge University Press.
Osmond, P., & Sharifi, E. (2017). Guide to Urban Cooling Strategies. Sydney: Low
Carbon Living CRC, University of New South Wales.
Peña-García, A., Hurtado, A., & Aguilar-Luzón, M. C. (2015). Impact of public lighting
on pedestrians’ perception of safety and well-being. Safety Science, 78, 142-148.
doi:https://doi.org/10.1016/j.ssci.2015.04.009
Prado, R., & Ferreira, F. (2005). Measurement of albedo and analysis of its influence the
surface temperature of building roof materials. Energy and Buildings, 37, 295-
300. doi:10.1016/j.enbuild.2004.03.009
Project for Public Spaces. (2008, December 31). Have a seat: movable chairs or
benches? Retrieved December 22, 2019, from PPS:
https://www.pps.org/article/movable-seating
Reliance Foundry. (2019, June 17). Proper spacing for a range of bollard applications.
Retrieved December 21, 2019, from A Guide to Bollard Spacing and Site
Planning: https://www.reliance-foundry.com/blog/guide-to-bollard-spacing
Rocchi, J. (2015, November 10). Six Practical Reasons to Save Old Buildings. Retrieved
December 22, 2019, from National Trust for Historic Preservation:
https://savingplaces.org/stories/six-reasons-save-old-buildings#.Xf-bB0dKhPY
Rosheidat, A., Hoffman, D., & Bryan, H. (2008). Visualizing pedestrian comfort using
ENVI-met. SimBuild 2008, Third National Conference of IBPSA - USA (pp. 198-

115
205). University of California, Berkeley. Retrieved from https://ibpsa-
usa.org/index.php/ibpusa/issue/view/32
Royal Horticultural Society. (n.d.). Drought-resistant plants. Retrieved January 31, 2020,
from RHS: https://www.rhs.org.uk/advice/profile?pid=397
Santamouris, M. (2012, July 30). Cooling the cities – A review of reflective and green
roof mitigation technologies to fight heat island and improve comfort in urban
environments. Solar Energy, 103, 682-703.
doi:https://doi.org/10.1016/j.solener.2012.07.003
Santamouris, M., Adnot, J., Alvarez, S., Klitsikas, N., Orphelin, M., Lopes, C., & Sànchez,
E. (2004). Cooling the cities: Rafraîchir les villes. Paris: Ecole des Mines de Paris.
Santamouris, M., Papanikolaou, N., Livada, I., Koronakis, I., Georgakis, C., Argiriou, A.,
& Asimakopoulos, D. (2001). On the impact of urban climate on the energy
consuption of building. Solar Energy, 70(3), 201-216. doi:10.1016/S0038-
092X(00)00095-5
Scholz, M., & Grabowiecki, P. (2007). Review of permeable pavement systems. Building
and Environment, 42(11), 3830–3836. doi:10.1016/j.buildenv.2006.11.016
Shafique, M., Kim, R., & Kyung-Ho, K. (2018). Rainfall Runoff Mitigation by Retrofitted
Permeable Pavement in an Urban Area. Sustainability, 10(4), 12231.
doi:https://doi.org/10.3390/su10041231
Shahmohamadi, P., Che-Ani, A., Maulud, K., Tawil, N., & Abdullah, N. (2011). The
Impact of Anthropogenic Heat on Formation of Urban HeatIsland and Energy
Consumption Balance. Urban Studies Research, 2011.
doi:10.1155/2011/497524
Shaw, R., Colley, M., & Connell, R. (2007). Climate change adaptation by design: a
guide for sustainable communities. London, UK: TCPA.
Sheppard, E. (2017, August 17). 6 Benefits of Having an Outdoor Water Fountain in Your
Garden. Retrieved December 21, 2019, from Plano Sod Installation:
https://planosod.com/6-benefits-outdoor-water-fountain-garden/
Shrikant, A. (2018, October 26). Why walkable cities are good for the economy,
according to a city planner: People spend more money when cities are less
vehicle-oriented. Retrieved from Vox: https://www.vox.com/the-
goods/2018/10/26/18025000/walkable-city-walk-score-economy
Silva, M., & Costa, J. (2016). Flood Adaptation Measures Applicable in the Design of
Urban Public Spaces: Proposal for a Conceptual Framework. Water, 8, 284.
doi:10.3390/w8070284
Silva, M., & Costa, P. (2018). Urban Floods and Climate Change Adaptation: The
Potential of Public Space Design When Accommodating Natural Processes.
Water, 10(2), 180. doi: https://doi.org/10.3390/w10020180
Sitte, C. (1981). L'arte di costruire le città: l'urbanistica secondo i suoi fondamenti artistici.
Milano: Jaca Book.

116
Smit, B., Burton, I., Klein, R., & Wandel, J. (2000). An anatomy of adaptation to climate
change and variability. Climate Change, 45, 223–251.
doi:https://doi.org/10.1023/A:1005661622966
Speck, J. (2018). Walkable city rules: 101 steps to making better places. Washington,
DC: Island Press.
Steuteville, R. (2017, July 20). Great idea: The public realm. Retrieved from CNU:
https://www.cnu.org/publicsquare/2017/07/20/great-idea-public-realm
Susca, T., Gaffin, S., & Dell'Osso, G. (2011). Positive effects of vegetation: Urban heat
island and green roofs. Environmental Pollution, 159, 2119-2126.
doi:https://doi.org/10.1016/j.envpol.2011.03.007
Sutton, R. (2014, March). Aesthetics for Green Roofs and Green Walls. Journal of Living
Architecture. Retrieved January 8, 2020, from
https://www.researchgate.net/publication/282172544_Aesthetics_for_Green_Ro
ofs_and_Green_Walls
Synnefa, A., & Santamouris, M. (2012). White or Light Colored Cool Roofing Materials.
In D. Kolokotsa, M. Santamouris, & H. Akbari, Advances in the Development of
Cool Materials for the Built Environment (pp. 33-71). Bentham Books. Retrieved
January 7, 2020, from
https://www.academia.edu/24302676/Advances_in_the_Development_of_Cool_
Materials_for_the_Built_Environment
Taslim, S., Parapari, D., & Shafaghat, A. (2015). Urban Design Guidelines to Mitigate
Urban Heat Island (UHI) Effects In Hot-Dry Cities. Jurnal Teknologi: Sciences &
Engineering, 74(4), 119-124. doi:https://doi.org/10.11113/jt.v74.4619
Theeuwes, N., Solcerová, A., & Steeneveld, G. (2013). Modeling the influence of open
water surfaces on the summertime temperature and thermal comfort in the city.
Journal of Geophysical Research: Atmospheres, 8881–8896.
doi:10.1002/jgrd.50704
Tosca, K. (2018, November 18). What is urban furniture? Retrieved December 18, 2019,
from Neko Europe: https://www.neko-europe.com/what-is-urban-furniture/
U.S. Environmental Protection Agency. (2008). Cool Pavements. In U. E. Agency,
Reducing Urban Heat Islands: Compendium of Strategies. Draft. Retrieved from
https://www.epa.gov/heat-islands/heat-island-compendium
U.S. Environmental Protection Agency. (2008). Green Roofs. In U. E. Agency, Reducing
Urban Heat Islands: Compendium of Strategies. Draft. Retrieved from
https://www.epa.gov/heat-islands/heat-island-compendium
U.S. Environmental Protection Agency. (2008). Trees and Vegetation. In U. E. Agency,
Reducing Urban Heat Islands: Compendium of Strategies. Draft. Retrieved from
https://www.epa.gov/heat-islands/heat-island-compendium
Urban Design Group. (n.d.). What is Urban Design. Retrieved from Urban Design Group:
http://www.udg.org.uk/about/what-is-urban-design
van Ooststroom, H. (2011). Urban Heat Island adaptation through Urban Planning and
Design: the struggle of the city of Los Angels. Groningen, NL.

117
Walsh, P. (2018, August 30). Five Reasons Why Public Art Matters. Retrieved from
Americans for the Arts: https://www.americansforthearts.org/2019/05/15/five-
reasons-why-public-art-matters
Welsh, B., & Farrington, D. (2007). Improved Street Lighting. Preventing Crime: What
Works for Children, Offenders, Victims, and Places, 209-224.
doi:https://doi.org/10.1007/978-0-387-69169-5_14
White, W. (1980). The Social Life of Small Urban Spaces. Washington, DCNew York, NY:
Project for Public Spaces.
Wilhite, D., & Glantz, M. (1985). Understanding the Drought Phenomenon: The Role of
Definitions. Water Journal, 111-120. doi:10.1080/02508068508686328
Wong, T. (2006). Water sensitive urban design - the journey thus far. Australian Journal
of Water Resources, 10(3), 213-222. doi:10.1080/13241583.2006.11465296
World Population Review. (2019, October 24). Most Obese Countries Population.
Retrieved from World Population Review:
http://worldpopulationreview.com/countries/most-obese-countries/
Yücel, G. (2013). Street Furniture and Amenities: Design the User-Oriented Landscape.
(M. Ozyavuz, Ed.) Advances in Landscape Architecture, 623-644.
doi:10.5772/51738
Zhang, X., Chen, N., Sheng, H., I. C., Yang, L., Chen, Y., . . . Niyogi, D. (2019,
November 25). Urban drought challenge to 2030 sustainable development
goals. Science of The Total Environment, 693, 133536.
doi:https://doi.org/10.1016/j.scitotenv.2019.07.342
Zimmermann, E., Bracalenti, L., Piacentini, R., & Inostroza, L. (2016). Urban Flood Risk
Reduction by Increasing Green Areas For Adaptation To Climate Change.
Procedia Engineering, 161, 2241-2246. doi: 10.1016/j.proeng.2016.08.822

118
PART III
Case Studies

119
Introduction
Chapter 5 analyses the square design of 10 TOD projects around the U.S., which have
been selected according to the different climate regions that characterize the United States,
the third-largest country in the world (Mattyasovszky, 2019). Project by project, all the
mitigation and adaptation measures identified and separately developed in Chapters 3 and
4 respectively, will be managed in this instance as a unique and comprehensive system that
works in symbiosis under the common aim of tackling CC. To do so, all the case studies
are analyzed with a “virtual survey” through the use of the Google Maps Street view tool
and Google Earth software.
Mitigation actions have been conceived as actions to reach the walkability, according to
the New Urbanists theories. Thus, it will be looked at all the walkability components (urban
compactness, mixed-use, building edges and façades, sense of enclosure, urban furniture,
weather shelter, and public art, if any). Regarding adaptation actions, they have been
considered as measures to adapt to CC impacts that occur according to different climate
regions. Likewise, it will be verified if the selected squares in TOD projects have been
planned to face specific climate vulnerabilities. Thus, the material color of buildings’
envelopes, pavements, vegetation and the square geometry will be considered. This implies
that the location of each case study will automatically delete some adaptation measures.
For example, in regions characterized by dry spells and poor total yearly precipitations,
flooding measures will not be a discriminatory factor on the evaluation of the square project
and, in contrast, droughts measures in flooding vulnerable areas are considered
superfluous.

120
This page is intentionally left blank

121
5. Climate Regions and TODs in the U.S.
As pointed out several times during the development of the thesis, all the measures
(mitigation and adaptation) strictly depends on their location since different climate zones
occur with different locations. There are several types of climates characterizing the U.S.
The first scholar dealing with climate regions that proposed a climate classification was the
German geographer, botanic and climatologist Köppen in 1900 which studies have been
updated several times by Geiger in 1954 and 1961 (Kottek, Grieser, Beck, Rudolf, & Rubel,
2006). More recently, Trewartha proposed adjustments to the original classification of
Köppen – called KCC - in terms of “both the original temperature criteria and the
thresholds separating wet and dry climates” (Belda, Holtanová, Halenka, & Kalvová, 2014,
p. 2) resulting in a new classification better known as Köppen-Trewartha classification
(KTC), which this thesis will refer to. The KTC includes “6 main climatic groups. Five of
them (denoted as A, C, D, E, and F) are basic thermal zones. The sixth group B is the dry
climatic zone that cuts across the other climate types, except for the polar climate F” (Belda,
Holtanová, Halenka, & Kalvová, 2014, p. 3). Considering that the UHI effect actually
depends on the city structure and geometry, rather than climate regions the climate impacts
depending on climate regions are drought and flooding. All the 6 groups in the U.S.
Figure 5.1 – KTC in the U.S.
Credit: © Adam Peterson (22 September 2016)
Source: Wikipedia
(https://en.wikipedia.org/wiki/Trewartha_climate_classification#/media/File:US_trewartha.svg)

122
included in the KTC and are represented in Figure 5.1. The map illustrates that, except
polar climates, all the 5 types are present in North America, which is characterized by a net
division between East and West.
While in the former there are mainly three types of climates (Dc, Do, Cf and also Aw and
Ar climates in the South end of Florida) according to different latitudes and they are clearly
separated, in the Western part of U.S. there are 4 types of climates which are completely
mingled with their respective subtypes, ranging from boreal climates to desert ones.
Once these assumptions are made, it is possible to understand that the climatic
characteristics that occur in TOD projects across the U.S. could be very different and so do
the adaptation and mitigation measures to tackle CC in different locations. Having public
squares in suburban areas as the prime target to analyze, the location choice referred to
the Urban to Rural Transect subdivision defined by Duany, Sorlien and Wright in The
SmartCode (2003). The first tricky challenge was concerning the case study selection. The
research to identify TOD projects as case studies has been carried out firstly with the
objective to choose projects located in different climatic regions and verify how the
interested public square behaves in different climate conditions. The second discriminant
factor in the choice process was about finding projects in the suburbs (T3), rather than in
urban areas (T4, T5). This step brought about a large number of possibilities but with one
crucial element missing, a proper public square possibly in front of the transit station or at
least within the entire TOD project. Several times the TOD projects found presented a mere
widening in front of the station with not enough material to work on, which lead to the next
choice step. Given the rarity of TOD projects in suburban areas located in different climatic
regions and including a proper square, the selection process enlarged the research
allowing TOD projects in more dense and inner urban areas, without considering neither
only suburban projects nor super dense areas in the city centers. Therefore, the case studies'
choice has been enlarged to the T4 (General Urban) and T5 (Urban Center) zones, besides
the T3 (Sub-Urban) of the Urban to Rural Transect. The zones identified in the research
differ mainly in density characteristics: T3 is made of 1-to-2 story buildings, T4 made of 2-
to-3 story buildings and, T5 made of 3-to-5 story buildings.
The problematic research of the right case studies immediately arose one crucial aspect:
the concrete lack of public squares in the suburbs, the urban areas targeted by the New
Urbanist and TOD’s objectives. The difficult choice led to an appeal by the TOD Institute,
which website lists several successful TOD experiences across the U.S. that has been helpful
for the case studies choice. Nevertheless, the 10 case studies identified are:
▪ Wilshire Vermont (Los Angeles, California)
▪ Fruitvale Village (Oakland, California)
▪ Orenco Station (Hillsboro, Oregon)
▪ CityPlace (West Palm Beach, Florida)
▪ Market Common (Arlington, Virginia)
▪ Rockville Town Center (Rockville, Maryland)

123
▪ Pentagon Row (Arlington, Virginia)
▪ Richmond Village (Oakland, California)
▪ Santana Row (San Jose, California)
▪ The Gateway (Salt Lake City, Utah)
A more specialized survey on climate impacts has been carried out for each case study
analyzed. In order to understand if the TOD project areas are more or less subjected to the
UHI effect, flooding and/or drought, each case study analysis has been developed through
three steps. First, the UHI effect is a though the impact to measure to compute and,
although every Comprehensive Plan of the relative cities has been consulted, the
information resulted inhomogeneous and they were often lacking. Therefore, the UHI effect
intensity has been extrapolated in relation to the Extreme Heat (EH) days per county. This
was possible through the interactive map supplied by the NRDC (National Resource
Defense Council, s.d.) and represented in Figure 5.2.
Extreme Heat is intended a period of days with “high heat and humidity with temperatures
above 90 degrees” (Ready, s.d.), which is equal to around 32 C°. Although the map does
not refer to the real UHI effect values, the information provided by the number of days with
EH is of significant importance due to the close link between UHI and temperatures. In fact,
the number of days with Extreme Heat will be more severe in dense urban areas than in the
rural ones; thus, the location of the TOD project (T3/T4/T5) will be the discriminant factor
to determine the UHI effect in each TOD project.
As suggested by the NRDC, the EH have been grouped into three class in order to define
the level of intensity the different US counties are subjected to. Therefore, counties up to 9
days (included) are classed as low subjected to UHI and EH, those from 9 to 14 days as
medium subjected and those over 14 days as highly subjected.
Figure 5.2 - Map of Extreme Heat days by US county
Source: (National Resource Defense Council, s.d.)

124
Second, to define the level of risk of flooding, it has been carried out research through the
online tool FEMA Flood Map Service Center (Federal Emergency Management Agency,
2019) to understand the flooding hazard of the TOD areas interested by the research.
Three classes of risk have been identified according to the FEMA classification13
. Therefore,
three classes have been extrapolated: Low risk of flooding, for areas within zone C, X,
Moderate risk of flooding for areas within zone B, X500, and High risk for areas within zone
A, AE, A1-30, AH, AO, AR, A99, V, VE, V1-30, D.
Third, it has been conducted the same operation to verify drought occurrence through the
maps (Bolinger, 2019) obtained using data from the U.S. Drought Monitor for the last two
decades (1999-2019) as represented in Figures 5.3, 5.4. Due to lacking information about
long-period data, the only significant levels of drought available that have been considered
are the two most grave: the D3 - Extreme Drought and the D4 - Exceptional Drought. The
D3 (the second-highest level of drought) “where major crop and pasture losses are
common, fire risk is extreme, and widespread water shortages can be expected requiring
restrictions” (National Climatic Data Center, s.d.), and D4 (the highest level of drought)
that “corresponds to an area experiencing exceptional and widespread crop and pasture
losses, fire risk, and water shortages that result in water emergencies” (National Climatic
Data Center, s.d.). As for the other climate impacts, also for the evaluation of drought the
intensity has been considered by grouping the weeks of drought in three ranges: from 0 to
50 weeks, from 50 to 150 weeks and the most sever from 150 ahead.
13
http://www.floodmaps.com/zones.htm
Figure 5.3 - Map displays the number of weeks counties that have experienced D3 drought or greater
Credit: © Becky Bolinger
Source: (Bolinger, 2019)

125
According to the three impacts’ classification described, the type of climate impacts and
their severities has been evaluated for each case study and they are summarized in Table
5.1. Considering that the blank cells have no value due to insufficient data, the results show
that all the TOD projects examined are located in flooding areas at minimum risk, thus,
flooding is the less worrying impacts. Contrary, the UHI effect, and EH hazard is the one
that could occur with more continuity across the case studies, presenting at least the
medium impact’ severity for all the examples and the minimum value only in the case of
San Jose, California. The latter state is the protagonist of drought impact in negative terms.
In fact, all the case studies confined within California’s boundaries present the higher value
of drought risk, which is of lower severity in the other TOD projects. The analysis
summarized in Table 5.1, is useful to understand what type of impacts the TOD projects
examined and their public squares are more vulnerable. In the following pages, are
presented different sheets, one for each case study, in order to identify whether and how
the 14 mitigation and 14 adaptation measures have been applied in the TOD projects to
tackle CC and be prepared for the most worrying climate impacts identified in that specific
area. In order to achieve this objective, a virtual but meticulous survey has been conducted
through the use of the Google Maps Street view tool and Google Earth software.
Figure 5.4 - Map displays the number of weeks counties that have experienced D4 drought
Credit: © Becky Bolinger
Source: (Bolinger, 2019)

126
Table 5.1 – Classification of climate impacts for each case study
Source: Author’s elaboration
Location Climate type
UHI &
Extreme
Heat
Flooding Drought
Los Angeles
(CA)
Subtropical/Mediterranean
(Cs )2 1 3 2
Oakland
(CA)
Subtropical/Mediterranean
(Cs )2 1 3 2
Hillsbro
(OR)
Temperate Oceanic
(Do )2 1 1 1
West Palm
Beach
(FL)
Tropical Wet
(Ar )3 1 2 2
Arlington
(VA)
Humid Subtropical
(Cf )3 1 1 2
Rockville
(MD)
Temperate Oceanic
(Do )NDA 1 1 1
Arlington
(VA)
Humid Subtropical
(Cf )3 1 1 2
Oakland
(CA)
Subtropical/Mediterranean
(Cs )2 1 3 2
San Jose
(CA)
Subtropical/Mediterranean
(Cs )1 NDA 3 2
Salt Lake
City (UT)
Continental
(Dc )2 1 2 2
2 1 2
Climate Impacts
The Gateway
Wilshire Vermont
Fruitvale Village
Orenco Station
CityPlace
Market Common
TOD project
Rockville Town Center
Pentagon Row
Richmond Village
Santana Row
0 - 50 1
50 - 150 2
> 150 3
Legend - Drought
W
E
E
K
S
Low 1
Moderate 2
High 3
Legend - Flooding
R
I
S
K
≤9 1
> 9 - 14 2
> 14 3
Legend -UHI & Extreme Heat
D
A
Y
S

127
This page is intentionally left blank

128
MITIGATION measures 14Urban morphology
Urban furniture
Mixed-uses Interconnectivity Active edges and façades Sense of enclosure
Seating Public signage Lighting Recylce bins
Water bodiesFood Bollards
Weather shelters Public art Civic buildings
LEGEND
Other elements

129
ADAPTATION measures
UHI effect
Floods
14
Cool roofs and façades
Water bodies
Green roofs & green walls
Vegetation Cool pavements
Permeable pavementsOptimal shading Natural ventilation
Green roofs & green walls
Permeable pavements Water reservoir Bioretention
Droughts
Drought-tolerant plants Water storage

130
Wilshire Vermont (Los Angeles, California)
Located on more than three acres, this new mixed-use development consists of six levels of residential apartments (449 units), built above 36,000 sq. ft of com-mercial retail space on the ground level. The design integrated public spaces - the street and public plaza - with private out-door environments. The project is located above an existing MTA Metro Rail subway station and includes a new entry into the station, considered a major public tran-sportation hub in Los Angeles. The consul-tant team coordinated the project’s design with the City of Los Angeles Neighborho-od Initiative’s master plan.
Source: A Healthy Beautiful Environment [1]
Wilshire Vermont station is a TOD project in the Ko-reatown district of Central Los Angeles (CA). Here the climate is subtropical/mediterranean type (Cs), thus it experience hot and dry summers and mild
winters. The station serves both the Red and Purple Lines connecting the city center with the North-We-stern zones of the LA county. The role of the square in the project is crucial.
California
“
”
LosAngeles
Geographical BACKGROUND
H/W ratio0,67(31 m/46 m)
Orientation
Tranist node
N-S
Metro (Red and Purple lines) and Buses
Scale: 1:1.000.000
Station typologyUndergroundT5 - Urban Center
MetroStation
TODSquare
UHI effect&Extreme Heat
Extreme events &Flooding
Droughts
CLIMATE HAZARDS
Square GENERALITIESTOD location

131
MITIGATION measures
Figure 5.5
Figure 5.6
Figure 5.7
Figure 5.8
Figure 5.9
Figure 5.10
ABSENCE
PRESENCE
ADAPTATION measures
ABSENCE
PRESENCE
9
Present but scarce
5
5 9
14
14
Block size: 2.102 [ft]
H/W: 0,67
H/W > 0,65

132
The ground floor of Fruitvale Village is home to locally-owned retail spaces. The second floor offers Office spaces for im-portant community resources and organi-zations. Finally, 47 one- and two-bedro-om apartments offer housing on the third floor. Of the 47 units, 10 are designated as affordable units for residents earning between 35 – 80% of the Area Median Income.
Source: The Unity Council [2]
The station of Fruitvale Village deals with the Bay Area Rapid Transit (BART) connecting an old nei-ghborhood to Oakland’s downtown. The project is a mixed-use TOD aiming to create a connection with the rest of the neighborhood. This was possible
thanks to a pedestrian plaza shaped like a corrdior relating the BART station with the Internationl Bou-levard, which is the commercial core of the entire neighborhood two blocks to the North. Still located in California, around 340 miles from Los Angeles, the climate type is still mediterranean (Cs). Thus, the climate hazards are still the UHI ef-fect and extreme events.
California
“
”
AlamedaCounty
Geographical BACKGROUND
Scale: 1:1.000.000
Fruitvale Village (Oakland, California)
0,78 (12,5 m/64 m)NE-SW
Rapid transit/Commuter rail, Light rail (BART) and Buses
ElevatedT4 - General Urban
BARTStation
TODSquare
CLIMATE HAZARDS
Square GENERALITIES
Extreme events &Flooding
Droughts
UHI effect&Extreme Heat
H/W ratioOrientation
Tranist node
Station typologyTOD location

133
MITIGATION measures
Figure 5.11 Figure 5.12
Figure 5.13
Figure 5.14
Figure 5.15
ABSENCE
PRESENCE
ADAPTATION measures
ABSENCE
PRESENCE
9 5
8 6
14
14
H/W: 0,78
Block size: 936 [ft]
H/W > 0,65

134
Extreme events &Flooding
Droughts
UHI effect&Extreme Heat
Completed in 2003, the Orenco Sta-tion neighborhood of Hillsboro, Oregon, a suburb of Portland, remains a shining example of neighborhood transforma-tion from suburban sprawl into a pede-strian-friendly, high-density, mixed-use, transit-oriented community. Orenco Sta-tion, a case-study of transit-oriented, walkable, New Urbanist developmen-ts, has won numerous awards including the 1998 Oregon Governor’s Livability Award, the 1998 Best Masterplanned Community in America Award by the Na-tional Association of Home Builders, and the 1999 AIA/ULI/FTA/STPP Transit Com-munities Livable Design Award.
Source: CNU [3]
mate (Do) characterized by cool summers and wet winters ranging from elevated to low temperatures. Thus, climate extremes are
Oregon
“
”
WashingtonCounty
Geographical BACKGROUND
CLIMATE HAZARDS
Scale: 1:1.000.000
Orenco Station (Hillsboro, Oregon)
0,25 (20 m/78,6 m)W-E
Light rail (Orange line of the MAX Light Rail)
Ground levelT4 - General Urban
MAXStation
TODSquare
The Orenco station is located in the Portland West suburb of Hillsbro connected with the downtown thanks to the efficient Metropolitan Area Express (MAX) Light Rail system. The role of the plaza in this case is crucial since it is located next to the station stop. The climate class is temperate oceanic cli-
Square GENERALITIES
H/W ratioOrientation
Tranist node
Station typologyTOD location

135
MITIGATION measures
Figure 5.16 - © Buhacoff Figure 5.18
Figure 5.19
Figure 5.20 - © S. Morgan, 2016
Figure 5.21 - © M.O. Stevens
ABSENCE
PRESENCE
ADAPTATION measures
ABSENCE
PRESENCE
3
9 5
14
14
H/W: 0,25
Block size: 1.023,3 [ft]
H/W < 0,35
Figure 5.17
11

136
CityPlace was designed according to the DPZ code and is integrated seamlessly into the street grid.
Source: CNU [4]
Florida
“
”
Palm BeachCounty
Geographical BACKGROUND
CLIMATE HAZARDS
Scale: 1:1.000.000
0,29 (16,2 m/56 m)W-E
Commuter rail (Tri-rail) and Buses
Ground levelT5 - Urban Center
TODSquare
City place is a high-density mixed-use project con-ditioned by a tropical wet climate (Ar) able to host a huge variety of entertainment and retail activities. Central to CityPlace project is Rosemary square, located around 8 minutes walking from Brightli-ne station. The square is characterized by a chur-
CityPlace (West Palm Beach,Florida)
Square GENERALITIES
H/W ratioOrientation
Tranist node
Station typologyTOD location
Extreme events &Flooding
Droughts
UHI effect&Extreme Heat
ch facing the plaza with a show fountain and it is surrounded by double palm tree lines allowing shadowing. The latter’s presence, considering the climate type, is mandatory to attract people during daytime, giving the possibility to enjoy the vibrant environment the Rosemary square can offer to inah-biants both during daytime and nightime. The plaza is become the pincipal meeting place of the area thanks to the pedestrain axes with active ground floor that connect the square with the surroundings blocks and thanks to the climate measures adapted.

137
MITIGATION measures
Figure 5.22 Figure 5.24
Figure 5.25
Figure 5.26
Figure 5.27
PRESENCE
ADAPTATION measures
ABSENCE
PRESENCE
13
9 5
14
14
H/W: 0,29
Block size: 1.178 [ft]
H/W < 0,65
Figure 5.23
ABSENCE 1

138
The Market Common Clarendon won the 2005 Urban Land Institute Award of Excellence and was featured on the cover of Winning Shopping Center Designs as it won the 28th International Design and Development Award from the Internatio-nal Council of Shopping Centers.
Source: Jacobs/Ryan Associates [5]
Virginia
“
”
ArlingtonCounty
Geographical BACKGROUND
Scale: 1:1.000.000
TODSquare
Market Common TOD project is affected by a hu-mid subtropical climate (Cf) with cold winters and quite hot and humid summers. The project is in between two metro stations and is characterized by the “U” square around which are developed com-merical and retatil spaces at ground floor, and re-
Market Common (Arlington, Virginia)
0,4 (18,4 m/45 m)N-S
Metro (Orange and Silver lines) and Buses
UndergroundT5 - Urban Center
CLIMATE HAZARDS
Square GENERALITIES
Extreme events &Flooding
Droughts
UHI effect&Extreme Heat
H/W ratioOrientation
Tranist node
Station typologyTOD location
sidences on the upper floor. Given the shape of the project, the square take the forms of a pedestrain corridor, linking the main infrastructural axes on the North with the commercial center’s entry on the South. The public square is pedestrian-oriented be-cause it offers a variety of attracting elements (e.g. fountains, shaded seating areas and a playground).

139
MITIGATION measures
Figure 5.28 Figure 5.30
Figure 5.31 Figure 5.32
PRESENCE
ADAPTATION measures
ABSENCE
PRESENCE
8
9 5
14
14
H/W: 0,4 Block size: 2.080 [ft]
0,35< H/W >0,65
Figure 5.29 - © Bozzuto Group
ABSENCE 6

140
Rockville Town Square features a broad town plaza, state-of-the-art library, arts and business innovation center and pede-strian-oriented shops and restaurants with condominiums and apartments above. The redevelopment incorporates a variety of facades and other architectural ele-ments; a six-story clock tower; an inviting streetscape of wide sidewalks, street furni-ture and trees
Source: Buntin, S.B. (2011) [6]
Maryland
“
”
MontgomeryCounty
Geographical BACKGROUND
Scale: 1:1.000.000
TODSquare
The Rockville Town Center project connect the city of Rockville with the Washington urban core through an efficient rail tranist system that offers both undergorund Metro and elevated commuter rail services. The project is affected by a tempera-te oceanic climate (Do). The current TOD lies on
Rockville Town Center (Rockville, Maryland)
0,52 (18,8m/36m)N-S, W-E
Metro (Red line) and Commuter rail (MARC)
Underground andElevated
T5 - Urban Center
CLIMATE HAZARDS
Square GENERALITIES
Extreme events &Flooding
Droughts
UHI effect&Extreme Heat
H/W ratioOrientation
Tranist node
Station typologyTOD location
a redevelopment area where a shopping mall fai-led. The square is the node on which pedestrian pathways gravitate allowing a safe and pedestrian environment connecting the transit station with the activities and residencies around it.

141
MITIGATION measures
Figure 5.33 - © Dan Reed, 2013) Figure 5.35 - © Dan Reed, 2007
Figure 5.36 - © Dan Reed, 2012 Figure 5.37 - © Simmons B. Buntin
ADAPTATION measures
ABSENCE
PRESENCE
14
14
H/W: 0,52
Block size: 528,4[ft]
0,35< H/W >0,65
Figure 5.34 - © Simmons B. Buntin
PRESENCE
ABSENCE 113
10 4

142
Pentagon Row is a vibrant shopping and entertainment destination with a unique combination of specialty retailers, exciting restaurants and amenities. This outdoor, walkable shopping center features dozens of specialty shops and an ice skating rink. Eat inside, outside or fireside.
Source: StayArlington [7]
Virginia
“
”
ArlingtonCounty
Geographical BACKGROUND
Scale: 1:1.000.000
TODSquare
Pentagon Row is a mixed-uses, dense TOD project in the Washington suburb with a humid subtropical climate (Cf) that characterizes the area. The TOD is directly linked with Washington inner areas through a bus stop in front of the square and is easily acces-sible from the Pentagon City Metro station (about
Pentagon Row (Arlington, Virginia)
0,38 (24 m/64 m)W-E
Metro (Blue and Yellow lines) and Buses
T5 - Urban Center
Square GENERALITIES
CLIMATE HAZARDS
Bus Stop
Underground andGround level
Extreme events &Flooding
Droughts
UHI effect&Extreme Heat
H/W ratioOrientation
Tranist node
Station typologyTOD location
10 minutes walking). The square is the core of the TOD project, it adapts to the local climate offering sheltered spots during hot summer days and ice rink entertaining local population and attracting forei-gners from surrounding neighborhoods. The square has cool pavements and presents vegetation on the edges and laws, resulting in a pleasant place to be.

143
MITIGATION measures
Figure 5.38 Figure 5.40
Figure 5.41 Figure 5.43
ADAPTATION measures
14
14
H/W: 0,4
0,35< H/W >0,65
Figure 5.39
Figure 5.42
ABSENCE
PRESENCE
9 5
Block size: 2.080 [ft]
ABSENCE
PRESENCE
8 6

144
Richmond Transit Village has successfully transformed underutilized land while pro-moting transit ridership and home owner-ship. It has also helped to revitalize the hi-storic commercial core of Richmond and encouraged other mixed use projects in the area.
Source: HDR Calthorpe [8]
The Richmond station is the terminus of the Red and Orange lines of the BART rail system con-necting the N-W part of Oakland with San Franci-sco. Richmond is a suburban TOD village affected by a mediterranean climate (Cs) characetrized by
residential uses surrounding the station with a squa-re and a pedestrian walkway directing to the sta-tion. The station ticipity is represented by the “park & ride” character, offered through a drop-off & pi-ck-up area and a structured parking which allow commuters to approach to Oakland’s inner areas without using the automobile.
California
“
”
AlamedaCounty
Geographical BACKGROUND
Scale: 1:1.000.000
Richmond Village (Oakland, California)
0,25 (10,5 m/41 m)W-E
Rapid transit/Commuter rail, Light rail (BART)
Ground levelT3 - Suburban
BARTStation
TODSquare
CLIMATE HAZARDS
Square GENERALITIES
Extreme events &Flooding
Droughts
UHI effect&Extreme Heat
H/W ratioOrientation
Tranist node
Station typologyTOD location

145
MITIGATION measures
ABSENCE
PRESENCE
ADAPTATION measures
ABSENCE
PRESENCE
7 7
1
14
14
H/W: 0,25
Block size: 1143 [ft]
H/W < 0,35
13
Figure 5.44 Figure 5.46
Figure 5.47 Figure 5.49 - © Pi.1415926535, 2018
Figure 5.45
Figure 5.48

146
The project replaces a 1950s-era subur-ban shopping mall that formerly occupied the site, exchanging an aging single-story mall with a densely designed, multi-story mixed-use community that incorporates all of its parking needs within the new structures. The heart of the project is the retail main street, highlighted by a median park and lined with ground-floor retail, re-staurants and public gathering spaces
Source: SB Architects [9]
The TOD project is served by a poor tranist system having bus stops around the neighborhood but no rail or Metro stations. Private vehicles are the the-refore allowed to tranist around the area but they cannot cross the square because it has been closed
to motor vehicles allowing a safe pedestrain-frien-dly environment, at least within the public square. The square is considered as a luxury pedestrian and commercial corridor, full of activities at ground floor that create rythm on façades with vegetation and seating areas in the middle.
California
“
”
Santa ClaraCounty
Geographical BACKGROUND
Scale: 1:1.000.000
Santana Row (San Jose, California)
0,42 (16 m/37,5 m)N-S
Buses
Ground levelT4 - General Urban
TODSquare
CLIMATE HAZARDS
Square GENERALITIES
Extreme events &Flooding
Droughts
UHI effect&Extreme Heat
H/W ratioOrientation
Tranist node
Station typologyTOD location
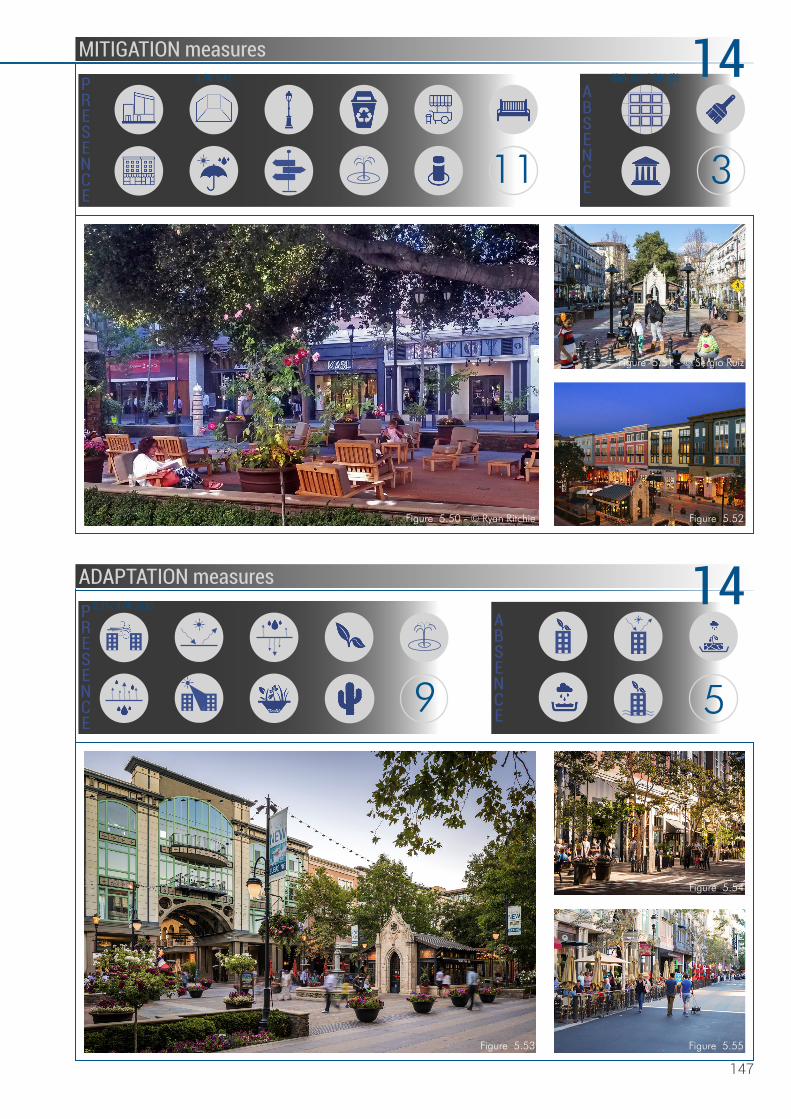
147
MITIGATION measures
Figure 5.50 - © Ryan Ritchie Figure 5.52
Figure 5.53
Figure 5.54
Figure 5.55
ABSENCE
PRESENCE
ADAPTATION measures
ABSENCE
PRESENCE
3
9 5
14
14
H/W: 0,42 Block size: 2.544 [ft]
Figure 5.51 - © Sergio Ruiz
11
0,35< H/W >0,65

148
The Gateway isn’t a mall. It’s Salt Lake City’s downtown destination for shopping and dining, entertainment, communi-ty-driven events, urban living, and creative office space. With direct access to public transit, The Gateway serves up a one-of-a-kind blend of unique retail, hip nightlife, a cutting-edge arts and culture scene, an innovative technology hub, and more.
Source: The Gateway [10]
The Gateway is a versatile TOD project characte-rized by residential units, offices, and commercial and retail activities centered in the Olympic Legacy Plaza. The latter has faced several redevelopment before and after the Olympics Games (2002) re-
sulting today a crucial node for the community. The square is affected by a continental climate (Dc) cha-racterized by very different seasons, very cold win-ters and hot dry summers. The large fountain is the focus of the square, surrounded by seating areas and lawns making it a pleasant and relaxing place for its users
Utah
“
”
Santa ClaraCounty
Geographical BACKGROUND
Scale: 1:1.000.000
The Gateway (Salt Lake City, Utah)
0,3 (24,3 m/81 m)N-S, W-E
Commuter rail, Light rail (Blue and Green lines UTA TRAX)
Ground levelT5 - Urban Center
TODSquare
CLIMATE HAZARDS
Square GENERALITIES
Extreme events &Flooding
Droughts
UHI effect&Extreme Heat
H/W ratioOrientation
Tranist node
Station typologyTOD location

149
MITIGATION measures
Figure 5.56 Figure 5.57
Figure 5.58
Figure 5.59
Figure 5.60
ABSENCE
PRESENCE
ADAPTATION measures
3
14
14
H/W: 0,3 Block size: 2.653 [ft]
ABSENCE
PRESENCE
410H/W < 0,35
11

150
From the sheets’ elaboration (summarized in Table 5.2, 5.3) emerges the gap between
mitigation and adaptation measures applied in the selected TOD projects. Public squares
are designed for pedestrians only, thus, walkability should be always an intrinsic value of
public squares. Nevertheless, as explained in Chapter 3, promoting walkability is not only
a matter of providing the pedestrian space itself, rather, is the way the pedestrian space is
settled and organized within the square. It is through this kind of approach that mitigation
measures have been evaluated, with quite satisfactory results. The important aspect is that,
in the majority of the cases where mitigation measures were lacking, they were referring to
some elements of the urban furniture (e.g. garbage bin) which, in spite of their importance,
they do not affect the public square walkability as whole (as sense of enclosure and mixed-
use would do). In particular, the least frequent elements to enhance walkability are the civic
buildings and public art installations, which have been found present only 2 and 3 times
out of 10 case studies, respectively. Contrary, the presence of active edges and façades,
seating areas and proper lighting systems are always present in all the 10 case studies,
meaning that every public square is provided of pleasant and comfortable environments
usable both during the daytime and night-time. Moreover, mixed-use buildings, restoration
activities, public signage, water bodies, and recycled bins are quite constantly applied.
However, all the TOD projects analyzed resulted in having an average of 10 out to 14
mitigation measures overall, none of which without falling below 7 measures.
Table 5.2 - Mitigation measures comparison according to TOD's projects
Source: Author’s elaboration
Measure present
Measure absent
Mix
ed-use
Inte
rco
nnectivity
Edges &
fa
çades
Sense o
f enclo
sure
Seating
Fo
od
Public sig
nage
Bo
llards
Lig
hting
Wate
r bo
die
s
Recycle
d bin
s
Weath
er shelters
Public art
Civ
ic buildin
gs
To
ta
l
Avera
ge
9
9
11
13
8
13
11
7
11
11
Total 9 6 10 6 10 9 9 5 10 8 9 7 3 2 103
Average
10
7
Rockville Town Center, MD
Pentagon Row, VA
Richmond Village, CA
Santana Row, CA
The Gateway, UT
Market Common, VA
Mitigation measures
Fruitvale Village, CA
Orenco Station, OR
CityPlace, FL
TOD project, State
Wilshire Vermont, CA

151
If walkability is encouraged through the square design, the lower emphasis is applied to
adaptation measures. According to their climate vulnerabilities, in fact, TOD’s public
squares turn out to be weakly prepared and ready to adapt to CC. The results emerging
from the virtual survey report that none of the adaptation strategies is ever-present in each
case study, some of them have never been found in any of the case studies resulting in
average 8 adaptation measures out of 14 (57%) for a single TOD project. Considering
green roofs, for example, their benefits have been largely explained in Chapter 4, but none
of the case studies analyzed apply them to exploit their benefits. Considering also the
medium risk of drought for the overall case study analysis, also water storage could be a
strategic idea to insert within the squares or plazas design, as explained in Chapter 4, but
none of the TOD projects include this adaptation measure. Nevertheless, water storage
could be placed in areas out of the public square and, in this case, drought-tolerant plants
would be the most important action to apply in tackling drought periods. In this instance,
8 TOD’s squares out of 10 have cared for drought issues by inserting drought-tolerant
plants. The element that seemed to be the most important, is represented by the measures
dealing with cool pavements and permeable pavements which occur in the 90% of the
TOD projects.
Table 5.3 - Adaptation measures comparison according to TOD's projects
Source: Author’s elaboration
Measure present
Measure absent
Co
ol ro
ofs
&
fa
çades
Green ro
ofs
&
w
alls
Vegeta
tio
n
Co
ol pavem
ents
Perm
eable
pavem
ents
Wate
r bo
die
s
Optim
al shadin
g
Natu
ral ventila
tio
n
Green ro
ofs
&
w
alls
Perm
eable
pavem
ents
Wate
r reservo
ir
Bio
rete
ntio
n
Dro
ught-
tole
rant pla
nts
Wate
r sto
rage
To
ta
l
Avera
ge
5
8
9
9
9
10
8
1
9
10
7 0 8 9 9 8 6 8 0 8 0 6 8 0 78Total
Orenco Station, OR
CityPlace, FL
Wilshire Vermont, CA
Fruitvale Village, CA
Average 6
8
Rockville Town Center, MD
Pentagon Row, VA
Richmond Village, CA
Santana Row, CA
The Gateway, UT
Adaptation measures
UHI effect
TOD project, State
Flooding Drought
Market Common, VA

152
Through a cross-check analysis between the climate impacts and vulnerabilities (Table 5.1),
and the mitigation and adaptation measures verified and summarized in Table 5.2 and
5.3, it has been possible to understand the climate behavior of each public square or plaza
examined. The results for each TOD’s public square are described as follows:
▪ Wilshire Vermont (Los Angeles, California)
The square above the Wilshire Vermont Metro station is a recognizable place due
to building façades located at the entry/exit of the square, that people have to go
through to reach the underground transit platform. The edges are active and the
ground floor is animated with retail, commercial and restaurant activities ready to
host and entertain a great number of commuters. Being vulnerable to EH and
drought periods, the square presents a narrow and enclosed environment allowing
optimal shading but suffering from it in terms of sense of enclosure and natural
ventilation. Although drought-tolerant plants have been planted to face drought
issues, they are scarce and isolated, providing poor shading to the buildings’
façades more exposed to solar radiation. Therefore, besides cool and permeable
pavements, there are no measures to cool the square environment and adapt to
CC.
▪ Fruitvale Village (Oakland, California)
The Fruitvale Village is located in the Oakland suburbs and represents a successful
example of TOD. The square analyzed, which is actually a pedestrian corridor
linking the BART station with the main commercial boulevard, is located in one of
the two phases that characterize the whole TOD project. The pedestrian corridor,
being a street and not a square, is characterized by buildings on both sides
narrowing the sense of enclosure, typical of more widen spaces. Nevertheless, its
design enhances walkability through attention to the details creating a pedestrian-
friendly environment. Like the previous case study, the main climate hazards
concern the EH and drought, partially faced by the corridor design. In particular,
shading is obtained by the narrowness of the corridor and by the drought-tolerant
vegetation homogenously distributed along the pedestrian path. Although flooding
risk is at the minimum level, permeable and cool pavements characterize the entire
walkway.
▪ Orenco Station (Hillsboro, Oregon)
Orenco Station is another successful example of the TOD project. The public
square in front of the transit platform is well furnished by almost every kind of urban
amenities creating a vibrant and comfortable public space, except for civic building,
public art and weather shelters. The shading function is neither provided by the
urban geometry, due to the unbuilt Southern side of the public square facing the
station nor by vegetation, only present in small dimensions except for an isolated
huge tree that shades the main restoration activities at the ground floor. The wide

153
located buildings at the edge with an uncovered side, allow natural ventilation and
the consequent air exchange in the public square.
▪ CityPlace (West Palm Beach, Florida)
After the TOD redevelopment, the Rosemary square becomes the core and meeting
point of West Palm Beach downtown. The entire environment is characterized by
local architecture, a large fountain in the center of the square that faces a local
church making the square a place ready to accommodate people every time of the
day and able to host concerts and other public events for the community. Except
for public art, every element to boost walkability is present and organized in a cozy
way, retail, commercial and restoration activities fill up the ground floor and also
the first floor, shaped as long porticoes running all along the square perimeter. This
is particularly helpful to adapt to EH, which the square location suffers from at the
highest level. Another adaptation measure to cool the environment is the central
fountain, having a cooling function, besides attractive. The vegetation is crucial in
the square because, by being located along the building edges, it provides a cool
effect both for inner building spaces and also for pedestrians using the square.
Although the presence of drought-tolerant plants, the square does not offer water
storage to tackle a moderate drought risk.
▪ Market Common (Arlington, Virginia)
Located along the famous Rosslyn-Ballston Corridor, the Market Common is a
TOD project that offers a well-organized mixed-use environment around a central
long square, located around 10 minutes walking from the underground station.
The public square is characterized by a vehicular street that surrounds the square
on each side, lowering the pedestrian safety also because of the lack of bollards
on the sidewalk’s perimeter. Moreover, although few ground floor openings, the
block that including the square is huge, discouraging walkability. In this case, the
square can be considered as a human-scale park given the high amount of
vegetation that characterizes it. The Market Common TOD project is more “climate
adaptive-oriented” than “climate mitigated-oriented” thanks to its greenness that,
despite is not provided by urban geometry, allows shading along the entire
walkway, a fundamental resource considering the maximum level of EH identified.
▪ Rockville Town Center (Rockville, Maryland)
Probably the most successful among those analyzed, the square of the Rockville
Town Center is located around five minutes-walk from the Metro and commuter
rail station. Except for the sense of enclosure, the square has got all the elements
identified to boost walkability and, looking at images on the sheet, it seems that
climate mitigation measures do not lie. In fact, the square designed as the perfect
place where to go and gather, relax and hanging out with friends enhancing the

154
transit transports due to its close proximity. The square is next to a library that
reinforces the public domain of the place and is meticulously design for pedestrians.
From the adaptation side, although data are unavailable concerning the UHI effect
and the EH, the square is prepared to adapt to such climate impacts guaranteeing,
at the same time, a comfortable, pleasant, and shaded environment.
▪ Pentagon Row (Arlington, Virginia)
In a different location but with the same climate risks of the Market Common,
Pentagon Row is another project human-scaled designed with an unbuilt side (that
exposed to the West). Although the pedestrian environment of the TOD project
could be stunning at a first glance, analyzing it in-depth it is discovered not being
such a walkable area. In fact, the absence of bollards and the excessive dimension
of the block that encloses the square, make it quite uncomfortable and not fully
safe. Nevertheless, a passage in the Eastern side of the square is able to link it with
the underground Metro station around 10 minutes walking from the square.
Moreover, although the square presents a very cozy environment characterized by
a central pedestrian path and different fountains, the Pentagon Row is also
prepared to accommodate the climate risks except for shading provided by urban
geometry and the never-present green roof and façades. Vegetation element is
present especially in the forms of lawns (placed in the middle of the square) and
bioretention. Also, trees are present but scarcely and isolated.
▪ Richmond Village (Oakland, California)
The only case study placed in the T3 Transect suburban zone is the Richmond
Village, located at the North-West terminus of the BART rail system. The design of
the square of the transit station is the least walkable and climate adaptive oriented
of the TOD projects studied. Starting with mitigation measures, the square is
characterized by a very low sense of enclosure and there are no mixed-use
buildings, bollards and restoration activities, making the square a mere pedestrian
place linking the car-parking and residential houses with the transit station. From
the climate adaptation point of view is even worst. In particular, although the
location is affected by the high risk of drought and a medium level of EH, the only
adaptation measure applied is found on the natural ventilation, obtained by the
low building heights and the absence of dense environments. In such climatic
conditions, vegetation and drought-tolerant plants could be a strategic action to
adapt to CC, but actually, the only vegetative elements are represented by low
shrubs which are, obviously, not considered as a real adaptation measure. The
pavement surfaces are impervious and made of dark-color materials, which
enhance the UHI effect, rather than limiting it.

155
▪ Santana Row (San Jose, California)
Although it presents weak transit connections, a further example of a successful
TOD pedestrian corridor is offered by Santana Row. Previously crossed by one road
on both sides, they have been closed to vehicular traffic to boost walkability. The
latter is enhanced by a pedestrian-friendly environment with several and diverse
commercial, retail and restorative activities at the building’s ground floors. The
central stripe is the real pedestrian-oriented character of the TOD project, with
shaded seating areas, public games, and a fountain. Also, climate adaptation is
substantially obtained, especially providing a good portion of the public space
shaded by buildings and trees, surely precious for pedestrians in such climate
conditions.
▪ The Gateway (Salt Lake City, Utah)
The TOD project has faced several redevelopments before and after the Olympics
Games (2002) resulting in today a crucial node for the community. Developed on
different height levels, the circular public rounded square presents a unique
environment in Salt Lake City downtown, connected with light and commuter rail
transit stations. The main attraction of the square is the ground-based fountain that
entertains the community. The negative side of the TOD’s square is represented by
the absence of bollards that, considering the vehicular road cutting the square, do
not allow a fully safe public space. Considering the local climate risks, the square
behaves regularly in every instance, except regarding drought issues in terms of
water storage.
Conclusions
The production of the sheets through the virtual survey using the Google Maps Street view
tool and Google Earth software has been of paramount importance, besides the only
evaluation method available. Thanks to these tools and software have been possible to
recognize the presence and absence of mitigation and adaptation measures both at the
ground floor, especially through the Google Maps Street view tool, and also from an aerial
perspective, especially through the Google Earth software. In this way, physical elements
such as benches, vegetation, retail and commercial activities, fountains, pavements
typology and many other measures have been easy to investigate in terms of visual presence
or absence. Therefore, assembling all the information collected through the case studies
analysis and summarized in Table 5.2 and 5.3 the following conclusions can be drawn:
1. Mitigation measures (103 out of 140, or 74%) are more frequently applied than
adaptation measures (78 out of 140, or 55%) overall;
2. Mitigation measures identified are 14 overalls, and there have been found with an
average of 10 (or 71%) for each case study analyzed;

156
3. Adaptation measures identified are 14 overalls, and there have been found with an
average of 7 (or 50%) for each case study analyzed;
4. The public squares with the highest number of mitigation measures (13 out of 14,
or 93%) are the ones concerning the CityPlace, (West Palm Beach, FL) and the
Rockville Town Center (Rockville, MA) TOD projects;
5. The public squares with the highest number of adaptation measures (10 out of 14,
or 71%) are the ones concerning the Rockville Town Center (Rockville, MA) and the
Gateway (Salt Lake City, UT) TOD projects;
6. Table 5.4 shows the coherence between the climate impact of a certain public
square, and the real actions applied to tackle that impact. The most respected
climate impact is the UHI & EH with 55 out of 80 adaptation measures (or 69%),
followed by the 9 out of 20 drought adaptation measures (or 45%), and the least
14 out of 40 flooding adaptation measures (35%). Nevertheless, the flooding risk
is at the minimum level in each case study therefore, although little applied, the
adaptation measures to flooding can face climate risk. Contrary, the drought
measures, although they are quite often applied, can result not sufficient for the
climate risk, especially in all the Californian cases circled in blue (Wilshire Vermont,
Fruitvale Village, Richmond Village, Santana Row).
However, the qualitative evaluation of the measures identified are not such detailed, in fact,
the analysis also presents some limits. First, the impact severities have been calculated
Table 5.4 – Climate exposure coherence of each case study
Source: Author’s elaboration
Climate
Impact
N° of
measures
present
N° of
measures
available
%Climate
Impact
N° of
measures
present
N° of
measures
available
%Climate
Impact
N° of
measures
present
N° of
measures
available
%
2 4 8 50% 1 0 4 0% 3 1 2 50%
2 6 8 75% 1 1 4 25% 3 1 2 50%
2 6 8 75% 1 2 4 50% 1 1 2 50%
3 7 8 88% 1 1 4 25% 2 1 2 50%
3 6 8 75% 1 2 4 50% 1 1 2 50%
NDA 7 8 88% 1 2 4 50% 1 1 2 50%
3 5 8 63% 1 2 4 50% 1 1 2 50%
2 1 8 13% 1 0 4 0% 3 0 2 0%
1 6 8 75% NDA 2 4 50% 3 1 2 50%
2 7 8 88% 1 2 4 50% 2 1 2 50%
2 55 80 69% 1 14 40 35% 2 9 20 45%
TOD project
DroughtFloodingUHI & Extreme Heat
Wilshire Vermont
(CA)
Fruitvale Village
(CA)
Orenco Station
(OR)
CityPlace
(FL)
Market Common
(VA)
Rockville Town
Center
(MD)
Pentagon Row
(VA)
Richmond Village
(CA)
Santana Row
(CA)
The Gateway
(UT)
Total

157
according to the scale of analysis larger than the one of the singe TOD projects. Regarding
the UHI and EH, and the drought risk, they have been considered analyzing maps produced
by the NRDC (s.d.) and Bolinger (2019) respectively, at the county scale resulting in quite
reliable but not fully precise information. The only type of impact easy to calculate is
concerning the flooding risk, the only one that, according to FEMA Flood Map Service
Center (2019) always results at the minimum level for all the TOD’s public squares. A
second limit of the research regards the quality of the information collected to define the
mitigation and adaptation measures. Through the Google Maps Street view tool and the
Google Earth software, in fact, only a partial evaluation was possible. The vegetation
typology planted, the roofs materials, the pavements features, and the H/W ratios and other
square dimensions have been assessed as precise and in-depth as possible resulting
inevitably in an approximate outcome. Further and more accurate variables, for example,
the type and quality of the water and the irrigation systems were impossible to recognize
through the type of survey that has been carried out, making the result’s analysis not entirely
reliable, but still credible.
Therefore, the whole analysis has to be considered not as a hundred percent precise and
completely demonstrated, like a field survey would provide but, rather, as an attempt at
assessment if and how the TOD’s public squares are oriented to climate mitigation and
adaptation, at least at a first glance. As previously said, the research should be integrated
with further and more accurate information, but the assessment obtained by the thesis can
be considered as a starting point for further researches.

158
References PART III
AHBE. (n.d.). Wilshire Vermont Station Apts. & TOD Plaza. Retrieved January 12, 2020,
from ahbe: http://www.ahbe.com/portfolio/wilshire-vermont-station
Belda, M., Holtanová, E., Halenka, T., & Kalvová, J. (2014). Climate classification
revisited: from Köppen to Trewartha. Climate Research, 59(1), 1-13.
doi:10.3354/cr01204
Bolinger, B. (2019, August 18). How Drought Prone is Your State? A Look at the Top
States and Counties in Drought Over the Last Two Decades. Retrieved February
10, 2020, from National Integrated Drought Information System. U.S. Drought
Portal: https://www.drought.gov/drought/news/how-drought-prone-your-state-
look-top-states-and-counties-drought-over-last-two-decades
Buntin, S. (2011, April 4). Rockville Town Square in Rockville, Maryland. Retrieved
February 5, 2020, from Terrain:
https://www.terrain.org/2011/unsprawl/rockville-town-square/
Congress for the New Urbanism. (n.d.). Orenco Station. Retrieved January 13, 2020,
from CNU: https://www.cnu.org/what-we-do/build-great-places/orenco-station
Duany, A., Sorlien, S., & Wright, W. (2003). The SmartCode. The Town Paper Publisher.
Retrieved from https://www.dpz.com/Books/All
Federal Emergency Management Agency. (2019, April). FEMA Flood Map Service Center:
Search By Address. Retrieved February 10, 2020, from FEMA:
https://msc.fema.gov/portal/search?AddressQuery=hillsboro#searchresultsanch
or
HDR Calthorpe. (n.d.). HDR Calthorpe. Retrieved February 9, 2020, from Calthorpe:
https://www.calthorpe.com/richmond-transit-village
Henry, J. (2005). Tropical and Equatorial Climates. In J. O. Oliver, Encyclopedia of
World Climatology (pp. 742-749). Dordrecht, Netherlands: Springer.
Jacobs/Ryan Associates. (n.d.). Market Common Clarendon. Retrieved February 3, 2020,
from Jacobs/Ryan Associates:
http://www.jacobsryan.com/New%20Pages%202013/513%20-
%20Urban%20Design%20People%20Places%20-
%20Market%20Common%20Clarendon.html
Kottek, M., Grieser, J., Beck, C., Rudolf, B., & Rubel, F. (2006). World Map of the
Köppen-Geiger climate classification updated. Meteorologische Zeitschrif, 15(3),
259-263. doi:10.1127/0941-2948/2006/0130
Mattyasovszky, M. (2019, December 16). The Largest Countries in the World. Retrieved
January 11, 2020, from WorldAtlas: https://www.worldatlas.com/articles/the-
largest-countries-in-the-world-the-biggest-nations-as-determined-by-total-land-
area.html

159
National Climatic Data Center. (n.d.). DROUGHT: Degrees of Drought Reveal the True
Picture. Retrieved February 10, 2020, from NCDC:
https://www.ncdc.noaa.gov/news/drought-degrees-drought-reveal-true-picture
National Resource Defense Council. (n.d.). Climate Change and Health: Extreme Heat.
Retrieved February 10, 2020, from NRDC: https://www.nrdc.org/climate-change-
and-health-extreme-heat
Peel, M., Finlayson, B., & Mcmahon, T. (2007). Updated world map of the Köppen-
Geiger climate classification. Hydrology and Earth System Sciences Discussions,
European Geosciences Union, 11(5), 1633-1644.
doi:https://doi.org/10.5194/hess-11-1633-2007
Pentagon Row. (n.d.). Retrieved February 9, 2020, from StayArlington: National History.
Local Flavor: https://www.stayarlington.com/directory/pentagon-row/
Ready. (n.d.). Extreme Heat. Retrieved February 10, 2020, from Ready.gov:
https://www.ready.gov/heat
SB Architects. (n.d.). Santana Row. Retrieved February 9, 2020, from SB Architects:
http://www.sb-architects.com/project/santana-row/
Steuteville, R. (2005, June 1). Public Square - West Palm leaps forward, with TOD on the
way. Retrieved January 22, 2020, from CNU:
https://www.cnu.org/publicsquare/2005/06/01/west-palm-leaps-forward-tod-
way
The Gateway. (n.d.). Premiere Dining, Entertainment and Shopping in Salt Lake City.
Retrieved February 10, 2020, from The Gateway: http://shopthegateway.com/
The Unity Council. (n.d.). Fruitvale Village. Retrieved January 14, 2020, from The Unity
Council: https://unitycouncil.org/property/fruitvale-village/
GIS data sources:
California
▪ Wilshire Vermont, Los Angeles: Los Angeles County GIS Data Portal
(https://egis3.lacounty.gov/dataportal/2016/11/03/countywide-building-
outlines-2014-update-public-domain-release/)
▪ Fruitvale Village, Oakland: Berkely Library Geodata
(https://geodata.lib.berkeley.edu/catalog/stanford-mq273bz6123)
▪ Richmond Village, Oakland: Berkely Library Geodata
(https://geodata.lib.berkeley.edu/catalog/stanford-mq273bz6123)
▪ Santana Row, San Jose: Berkely Library Geodata
(https://geodata.lib.berkeley.edu/catalog/stanford-mq273bz6123)

160
Oregon
▪ Orenco Station, Hillsbro: Oregon Geospatial Enterprise Office
(https://www.oregon.gov/geo/Pages/census.aspx)
Florida
▪ Rosemary Square, West Palm Beach: Official State of Florida Geographic Data
Portal (http://geodata.myflorida.com/datasets/swfwmd::florida-
counties?geometry=-91.866%2C24.375%2C-75.387%2C31.173)
Virginia
▪ Market Common, Arlington: Virginia National International Network
(https://www.arcgis.com/home/item.html?id=777890ecdb634d18a02eec604d
b522c6)
▪ Pentagon Row, Arlington
(https://www.arcgis.com/home/item.html?id=777890ecdb634d18a02eec604d
b522c6)
Maryland
▪ Rockville Town Center, Rockville: Maryland Physical Boundaries - County
Boundaries (Generalized)
(https://data.imap.maryland.gov/datasets/4c172f80b626490ea2cff7b699febed
b_1)
Utah
▪ Olympic Legacy Plaza, Salt Lake City: US Census Bureau, Department of
Commerce (https://catalog.data.gov/dataset/tiger-line-shapefile-2016-state-
utah-current-county-subdivision-state-based)
Notes
[1]: (AHBE, s.d.)
[2]: (The Unity Council, s.d.)
[3]: (Congress for the New Urbanism, s.d.)
[4]: (Steuteville, 2005)
[5]: (Jacobs/Ryan Associates, s.d.)
[6]: (Buntin, 2011)
[7]: (Pentagon Row, s.d.)
[8]: (HDR Calthorpe, s.d.)
[9]: (SB Architects, s.d.)
[10]: (The Gateway, s.d.)

161
This page is intentionally left blank

162
This page is intentionally left blank

163
Conclusions
The thesis objective was to assess the climate behavior of ten TOD’s public squares and
plazas through the analysis of ten case studies in different US states characterized by
different climate conditions. After a preliminary study on New Urbanism theories and the
TOD planning pattern emerged that, being oriented towards increasing density and transit
ridership mainly in suburban areas, the TOD aims to reduce GHG emissions by limiting
the private transit and automobile usage. To reach this objective, TODs enhance the
alternative way of transports focusing on rail transit systems surrounded by bicycle and
walkable environments. Being the thesis research based on the public spaces, walkability
has been regarded to create a sense of belonging for the local community, especially in
the public squares. Therefore, walkability has been considered as a mitigation action and,
given the TOD objectives, the probabilities to achieve it are positively confident. The real
challenge of the thesis, in fact, was to verify the climatic side of TOD’s public squares from
the adaptation point of view, which is not deliberatively expressed as a TOD goal.
Nevertheless, the first tricky challenge of the thesis was concerning the case studies
selection. Due to the rare cases of TOD projects in suburban areas located in different
climatic regions including a proper public square, the research has been enlarged to the
projects in T4 and T5 zones of Urban to Rural Transect. Nevertheless, with the aid of the
TOD Institute list, ten TOD projects have been selected trying to obtain TOD case studies
in diverse climate conditions. The emerging results from the analysis on the public squares
of the ten projects have largely demonstrated that they are only partially designed to face
CC. Although the importance of a successful TOD is crucial for tackling CC, their
parameters have been taken for granted since their presence in the TOD Institute list.
Rather, the central node of the case studies – the public squares - represents a sustainable
pattern for the community that uses it, and therefore they have been the study object. To
address public squares in this direction, the Urban Design process defines principles and
approaches to apply at different scales. Even though sustainable Urban Design principles
are the linchpins around which New Urbanists and TOD theories pivot on, their full and
concrete application towards tackling CC has not always been found. In particular, whilst
some measures, both mitigation and adaptation, were surely not applied, some others were
impossible to define due to the virtual survey restrictions. Nevertheless, the measure that
was possible to find has been considered in relation to their climate hazards and risks. Each
of the TOD’s public square examined, in fact, has been evaluated through a cross-cutting
check between the mitigation and adaptation measures found, and the climatic risks the
public square is affected by. In this way was possible to understand if each public square
in the selected ten TOD projects is properly designed to face their specific climate threats.
Regarding mitigation actions, the results have proven to live up to expectations. In
particular, from the evaluation of the case study has been possible to notice the effort put
on the public square design to privilege the pedestrian environment at the expense of the
vehicular one. Other than the Richmond case study, in fact, it is perceived that every public

164
square has been designed for pedestrians with an eye for details. Although the mitigation
measures appeared in different forms and distribution among the case studies, each TOD’s
public square offers areas for waiting and relaxing, shaded by vegetation and filled up with
spaces and activities aiming to involve the community. Even though some elements of urban
furniture were sometimes lacking, the overall environments created in TOD’s public squares
can be considered walkable-oriented. Considering that not all the adaptation measures
were clearly visible and or not visible at all (e.g. water storage), different outcomes arise
from the climate adaptation evaluation. From the available tools and software emerges
that the need to adapt to the UHI effect and EH days is regarded as a priority among all
the case studies analyzed, and measures to adapt to such climate impacts are
homogeneously spread in TOD’s public squares. Of lesser interest, appear to be the
drought and flooding risks, due to their unexpected and uncommon character with which
they occur. This lack has different implications. Although actions to tackle flooding events
are the least frequent among the adaptation measures identified, the risk of flooding in the
TOD’s public squares is at the minimum, making the flooding measures not strictly
necessary. Contrary, the drought measures have been found present in a ½ ratio but,
considering the fairly high drought risk (especially in Californian case studies), the drought
measures visible through the virtual survey are not sufficiently applied. Surprisingly, none of
the case studies presented green roofs and façades, which could be of paramount
importance especially in those areas affected by strong UHI effect and EH. The investigation
on adaptation measures unveils that, although the climate impacts and risks have been
sufficiently respected by the design of the TOD’s public squares, the adaptation measures
seem to be applied merely by chance, rather than being the result of a proper and accurate
climate assessment.
From the case studies analysis emerge that the square design of TOD’s projects seems to
be more oriented toward achieving the walkability goal and the reduction of the causes of
climate change, rather than adapting to such changes. This comes to the conclusion that
whilst pedestrian areas are present, linked with the surroundings by walkable pathways and
they are furnished to allow pedestrian-friendly environments, the actions to adapt to CC
are in some cases weak, seeming to be less important and needed. The thesis states that
TOD ideals and principles consider mitigation measures as the primary mission to achieve
and consider adaptation measures as a secondary goal. This is confirmed by the fact that,
as expressed in the final page of Chapter 1, the difference between mitigation and
adaptation measures is a matter of scale, besides objectives. Having a mere regional
character, the TOD pattern points to satisfy first its mitigation goals, without worrying about
more local issues, leaving adaptations to CC a crucial but partially developed aspect in
TOD’ squares.
The literature on CC, TOD and Urban Design is wide. Today CC is a trendy topic to
investigate in, TOD pattern and New Urbanism spread development processes and ideas
that deal with today’s issues and Urban Design is a largely well-documented process
constantly evolving with current challenges. But, according to the public square, they result

165
fragmented. The current thesis, therefore, helps to embrace the three macro-topics argued
toward the public square. In this sense, the thesis provides an interesting starting point to
reflect and analyze in-depth the adaptation issue in TOD’s public squares from the thermal
comfort point of view involving the perception of local inhabitants too. This would verify the
real impact at the local scale of the few and feeble adaptation measures identified and
discussed through the Google Street view tools available.

166
This page is intentionally left blank

167
Annex – The Charter of New Urbanism
The preamble of the Charter states that:
“The Congress for the New Urbanism views disinvestment in central cities,
the spread of placeless sprawl, increasing separation by race and income,
environmental deterioration, loss of agricultural lands and wilderness, and
the erosion of society’s built heritage as one interrelated community-
building challenge.
We stand for the restoration of existing urban centers and towns within
coherent metropolitan regions, the reconfiguration of sprawling suburbs
into communities of real neighborhoods and diverse districts, the
conservation of natural environments, and the preservation of our built
legacy.
We advocate the restructuring of public policy and development practices
to support the following principles: neighborhoods should be diverse in use
and population; communities should be designed for the pedestrian and
transit as well as the car; cities and towns should be shaped by physically
defined and universally accessible public spaces and community
institutions; urban places should be framed by architecture and landscape
design that celebrate local history, climate, ecology, and building practice.
We recognize that physical solutions by themselves will not solve social and
economic problems, but neither can economic vitality, community stability,
and environmental health be sustained without a coherent and supportive
physical framework.
We represent a broad-based citizenry, composed of public and private
sector leaders, community activists, and multidisciplinary professionals.
We are committed to reestablishing the relationship between the art of
building and the making of community, through citizen-based participatory
planning and design.
We dedicate ourselves to reclaiming our homes, blocks, streets, parks,
neighborhoods, districts, towns, cities, regions, and environment” (Congress
for the New Urbanism, s.d.)

168
The twenty-seven principles are organized according to their spatial scale as follows:
The Region: Metropolis, city, and town:
“1) Metropolitan regions are finite places with geographic boundaries
derived from topography, watersheds, coastlines, farmlands, regional
parks, and river basins. The metropolis is made of multiple centers that are
cities, towns, and villages, each with its own identifiable center and edges.
2) The metropolitan region is a fundamental economic unit of the
contemporary world.
Governmental cooperation, public policy, physical planning, and economic
strategies must reflect this new reality.
3) The metropolis has a necessary and fragile relationship to its agrarian
hinterland and natural landscapes. The relationship is environmental,
economic, and cultural. Farmland and nature are as important to the
metropolis as the garden is to the house.
4) Development patterns should not blur or eradicate the edges of the
metropolis. Infill development within existing urban areas conserves
environmental resources, economic investment, and social fabric, while
reclaiming marginal and abandoned areas. Metropolitan regions should
develop strategies to encourage such infill development over peripheral
expansion.
5) Where appropriate, new development contiguous to urban boundaries
should be organized as neighborhoods and districts, and be integrated with
the existing urban pattern. Noncontiguous development should be
organized as towns and villages with their own urban edges, and planned
for a jobs/housing balance, not as bedroom suburbs.
6) The development and redevelopment of towns and cities should respect
historical patterns, precedents, and boundaries.
7) Cities and towns should bring into proximity a broad spectrum of public
and private uses to support a regional economy that benefits people of all
incomes. Affordable housing should be distributed throughout the region to
match job opportunities and to avoid concentrations of poverty.
8) The physical organization of the region should be supported by a
framework of transportation alternatives. Transit, pedestrian, and bicycle
systems should maximize access and mobility throughout the region while
reducing dependence upon the automobile.
9) Revenues and resources can be shared more cooperatively among the
municipalities and centers within regions to avoid destructive competition
for tax base and to promote rational coordination of transportation,
recreation, public services, housing, and community institutions” (Congress
for the New Urbanism, s.d.)

169
The neighborhood, the district, and the corridor:
“10) The neighborhood, the district, and the corridor are the essential
elements of development and redevelopment in the metropolis. They form
identifiable areas that encourage citizens to take responsibility for their
maintenance and evolution.
11) Neighborhoods should be compact, pedestrian friendly, and mixed-
use. Districts generally emphasize a special single use, and should follow
the principles of neighborhood design when possible. Corridors are
regional connectors of neighborhoods and districts; they range from
boulevards and rail lines to rivers and parkways.
12) Many activities of daily living should occur within walking distance,
allowing independence to those who do not drive, especially the elderly
and the young. Interconnected networks of streets should be designed to
encourage walking, reduce the number and length of automobile trips, and
conserve energy.
13) Within neighborhoods, a broad range of housing types and price levels
can bring people of diverse ages, races, and incomes into daily interaction,
strengthening the personal and civic bonds essential to an authentic
community.
14) Transit corridors, when properly planned and coordinated, can help
organize metropolitan structure and revitalize urban centers. In contrast,
highway corridors should not displace investment from existing centers.
15) Appropriate building densities and land uses should be within walking
distance of transit stops, permitting public transit to become a viable
alternative to the automobile.
16) Concentrations of civic, institutional, and commercial activity should be
embedded in neighborhoods and districts, not isolated in remote, single-
use complexes. Schools should be sized and located to enable children to
walk or bicycle to them.
17) The economic health and harmonious evolution of neighborhoods,
districts, and corridors can be improved through graphic urban design
codes that serve as predictable guides for change.
18) A range of parks, from tot-lots and village greens to ballfields and
community gardens, should be distributed within neighborhoods.
Conservation areas and open lands should be used to define and
connect different neighborhoods and districts” (Congress for the New
Urbanism, s.d.)
The block, the street, and the building:

170
“19) A primary task of all urban architecture and landscape design is the
physical definition of streets and public spaces as places of shared use.
20) Individual architectural projects should be seamlessly linked to their
surroundings. This issue transcends style.
21) The revitalization of urban places depends on safety and security. The
design of streets and buildings should reinforce safe environments, but not
at the expense of accessibility and openness.
22) In the contemporary metropolis, development must adequately
accommodate automobiles. It should do so in ways that respect the
pedestrian and the form of public space.
23) Streets and squares should be safe, comfortable, and interesting to the
pedestrian. Properly configured, they encourage walking and enable
neighbors to know each other and protect their communities.
24) Architecture and landscape design should grow from local climate,
topography, history, and building practice.
25) Civic buildings and public gathering places require important sites to
reinforce community identity and the culture of democracy. They deserve
distinctive form, because their role is different from that of other buildings
and places that constitute the fabric of the city.
26) All buildings should provide their inhabitants with a clear sense of
location, weather and time. Natural methods of heating and cooling can
be more resource-efficient than mechanical systems.
27) Preservation and renewal of historic buildings, districts, and
landscapes affirm the continuity and evolution of urban society” (Congress
for the New Urbanism, s.d.)
References
Congress for the New Urbanism, s.d. The Charter of the New Urbanism. [Online]
Available at: https://www.cnu.org/who-we-are/charter-new-urbanism
[Consultato il giorno November 26 2019].