
DESIGNING RELIABLE CASTINGS
15
DESIGNING RELIABLE CASTINGS Malcolm Blair 1 , Raymond Monroe 1 , Christoph Beckermann 2* , Richard Hardin 2 , Kent Carlson 2 , Charles Monroe 2 1 Steel Founders' Society of America, 780 McArdle Drive, Unit G, Crystal Lake, IL 60014 2 University of Iowa, Department of Mechanical and Industrial Engineering, 2412 SC, Iowa City, IA 52242-1527 *Corresponding Author: (319) 335-5681; fax (319) 335-5669; [email protected]. Castings offer flexible and efficient design solutions for many products. However, designs are generally based on strength of materials calculations and the experience of the designer. Industrial experience with current products tends to dominate in the development of future designs. This process leads to an incremental development of designs utilizing factors of safety, which lead to increased component weights and inefficient use of materials. Factors of safety are one means of developing cushions to avoid unforeseen failures due to unexpected loads on the part or reductions in expected properties due to the method of manufacture. In castings unquantifiable factors (such as shrinkage, porosity, hot tears and inclusions) lead to more and more conservative design rules. Non-destructive testing, such as radiography and surface inspection, does not give the designer any way to assess the effect of indications on part performance. This paper describes recent work to predict the occurrence and nature of defects in castings and determine their effect on performance. The development of new quantitative design methodologies for castings, together with tailored non-destructive testing standards and techniques, is progressing through an integrated approach between producers, users and researchers. INTRODUCTION Designers are responsible for the performance of their designs. Traditionally, designers have used simple shapes and homogenous material properties to calculate the adequacy of their designs. A factor of safety is usually incorporated into a design to compensate for uncertainties caused by a complicated part shape, unknown service or load conditions, or undesirable manufacturing features. These factors of safety have resulted in reliable performance and, when adjusted or “tuned” based on performance testing, they have become the standard approach for most designs. Many designs are incremental designs based on analogous parts in prior designs. In high volume transportation applications, such as in the automotive industry, durability and warranty experience allow designs to be customized to give optimal performance. In other applications, larger margins of safety are used to ensure performance. In critical applications where performance is at a premium, such as in the aerospace industry, safety margins are reduced through the use of extensive engineering modeling, durability testing, and nondestructive examination. Designing castings is difficult. Today, designers are less familiar with the casting process than in the past. Plates, bars, and beams have relatively uniform properties and are examined during manufacturing to ensure quality. Forgings benefit primarily from the purchase of these homogeneous starting materials. Casting complex shapes is limited by solidification behaviors that can result in undesirable features that may affect performance. While commonly called defects or discontinuities, these features are not necessarily the result of poor practice or lack of effort. These features can be controlled by special casting techniques or they can be removed
-
Upload
independent -
Category
Documents
-
view
5 -
download
0
Transcript of DESIGNING RELIABLE CASTINGS

DESIGNING RELIABLE CASTINGS
Malcolm Blair1, Raymond Monroe1, Christoph Beckermann2*, Richard Hardin2, Kent Carlson2,
Charles Monroe2
1Steel Founders' Society of America, 780 McArdle Drive, Unit G, Crystal Lake, IL 60014
2University of Iowa, Department of Mechanical and Industrial Engineering, 2412 SC, Iowa City, IA 52242-1527
*Corresponding Author: (319) 335-5681; fax (319) 335-5669; [email protected]. Castings offer flexible and efficient design solutions for many products. However, designs are generally based on strength of materials calculations and the experience of the designer. Industrial experience with current products tends to dominate in the development of future designs. This process leads to an incremental development of designs utilizing factors of safety, which lead to increased component weights and inefficient use of materials. Factors of safety are one means of developing cushions to avoid unforeseen failures due to unexpected loads on the part or reductions in expected properties due to the method of manufacture. In castings unquantifiable factors (such as shrinkage, porosity, hot tears and inclusions) lead to more and more conservative design rules. Non-destructive testing, such as radiography and surface inspection, does not give the designer any way to assess the effect of indications on part performance. This paper describes recent work to predict the occurrence and nature of defects in castings and determine their effect on performance. The development of new quantitative design methodologies for castings, together with tailored non-destructive testing standards and techniques, is progressing through an integrated approach between producers, users and researchers.
INTRODUCTION Designers are responsible for the performance of their designs. Traditionally, designers have used simple shapes and homogenous material properties to calculate the adequacy of their designs. A factor of safety is usually incorporated into a design to compensate for uncertainties caused by a complicated part shape, unknown service or load conditions, or undesirable manufacturing features. These factors of safety have resulted in reliable performance and, when adjusted or “tuned” based on performance testing, they have become the standard approach for most designs. Many designs are incremental designs based on analogous parts in prior designs. In high volume transportation applications, such as in the automotive industry, durability and warranty experience allow designs to be customized to give optimal performance. In other applications, larger margins of safety are used to ensure performance. In critical applications where performance is at a premium, such as in the aerospace industry, safety margins are reduced through the use of extensive engineering modeling, durability testing, and nondestructive examination. Designing castings is difficult. Today, designers are less familiar with the casting process than in the past. Plates, bars, and beams have relatively uniform properties and are examined during manufacturing to ensure quality. Forgings benefit primarily from the purchase of these homogeneous starting materials. Casting complex shapes is limited by solidification behaviors that can result in undesirable features that may affect performance. While commonly called defects or discontinuities, these features are not necessarily the result of poor practice or lack of effort. These features can be controlled by special casting techniques or they can be removed
and replaced by welding. Designers are uncomfortable with this aspect of casting design, and yet they must use castings to achieve performance in the most demanding applications or in the most complex geometries. Extensive nondestructive evaluation is often required by the purchaser to reduce the perceived risk of uncertain casting quality. Unfortunately, these nondestructive examinations are not engineering standards and have little relationship to part performance. These standards are often subjective and would fail common requirements for reliability, such as a gage R&R evaluation. Campbell [1] provides an overview of the deleterious effects of defects on casting properties in which he addresses this issue: “the size of the defect is often of much less importance than its form and position. For instance, a large pore in a low stressed area of the casting may be far less detrimental than a small region of layer porosity in a sharp corner subject to a high tensile stress. To have blanket specifications requiring elimination of all types of defect from every area of the casting is therefore not appropriate, and has resulted in the scrapping of many serviceable castings.” Castings are not used in many applications because of the perceived risk, the lack of design approaches to assure performance, and the cost and time needed to achieve the desired quality and performance. Casting producers are normally outside suppliers and not typically involved in the design process. As a result, the design may be difficult to cast and will be a source for much of the lack of quality and reliability. The designer unfamiliar with casting practices creates a geometry that is poorly suited to casting, is inefficient, and imposes nondestructive requirements and tolerances that are difficult to achieve and unnecessary for meeting the performance requirements. While casting producers advise users, they are unwilling to warranty the casting performance, creating concern on the part of the user. An inefficient design process is a major problem in the effective use of castings. Computer modeling approaches in design, manufacturing, and nondestructive evaluation are making possible real progress toward more reliable and efficient design of castings. This paper reviews current activity in the development of integrated approaches to design that ties together service performance, manufacturing, and quality assurance. Even though most of the results presented are for steel castings, the general approaches discussed here are believed to be applicable to other cast materials as well.
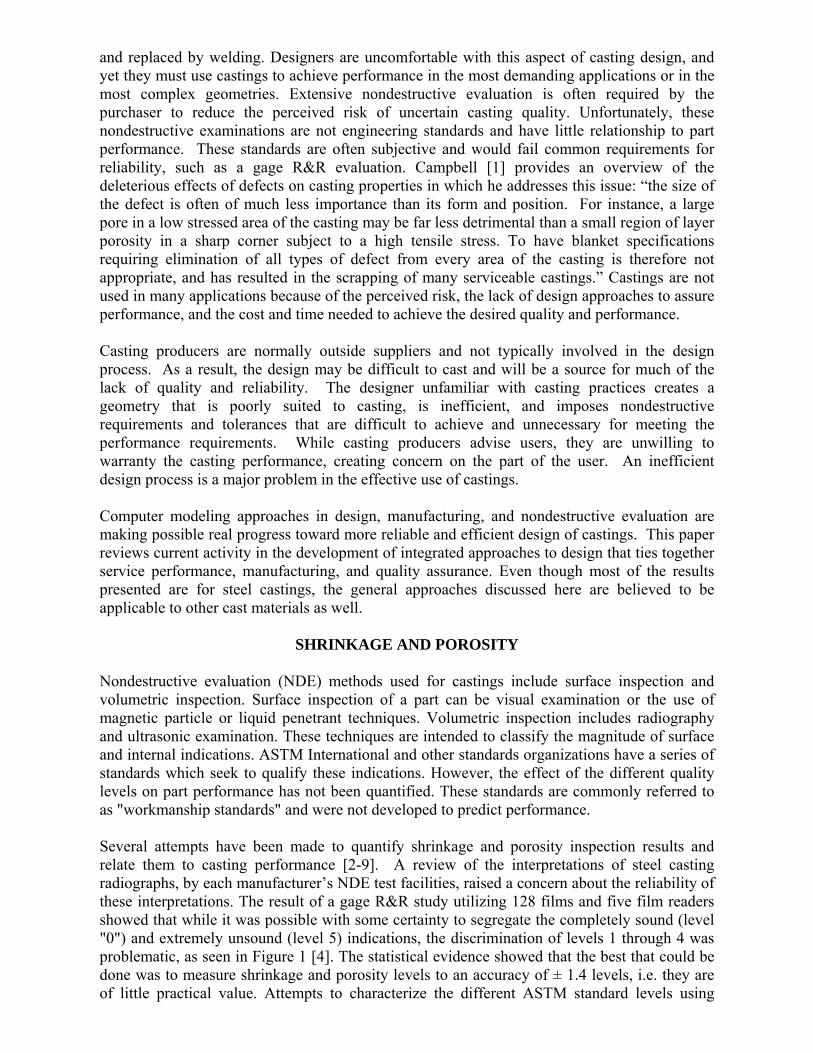
SHRINKAGE AND POROSITY Nondestructive evaluation (NDE) methods used for castings include surface inspection and volumetric inspection. Surface inspection of a part can be visual examination or the use of magnetic particle or liquid penetrant techniques. Volumetric inspection includes radiography and ultrasonic examination. These techniques are intended to classify the magnitude of surface and internal indications. ASTM International and other standards organizations have a series of standards which seek to qualify these indications. However, the effect of the different quality levels on part performance has not been quantified. These standards are commonly referred to as "workmanship standards" and were not developed to predict performance. Several attempts have been made to quantify shrinkage and porosity inspection results and relate them to casting performance [2-9]. A review of the interpretations of steel casting radiographs, by each manufacturer’s NDE test facilities, raised a concern about the reliability of these interpretations. The result of a gage R&R study utilizing 128 films and five film readers showed that while it was possible with some certainty to segregate the completely sound (level "0") and extremely unsound (level 5) indications, the discrimination of levels 1 through 4 was problematic, as seen in Figure 1 [4]. The statistical evidence showed that the best that could be done was to measure shrinkage and porosity levels to an accuracy of ± 1.4 levels, i.e. they are of little practical value. Attempts to characterize the different ASTM standard levels using
computerized image analysis also met with little success. Fundamentally, a lack of scaling, quantification and location information poses a barrier to using the standard as it exists to predict part performance.
Ideally, the ability to predict the shrinkage and porosity seen in radiographs with casting simulation would be of great advantage. A multi-phase (solid, liquid and porosity) model that predicts melt pressure, feeding flow, and porosity formation and growth during solidification has recently been developed and implemented in a general-purpose casting simulation code [5]. The model is able to predict the location in a casting, amount (volume percentage), and size (diameter of individual pores) of both microporosity, which consists of tiny pores too small to be seen on radiographs, as well as macroporosity, such as larger holes that form in castings when feeding flow is not available to a casting section during solidification. The results of an application of the model to predict macroporosity in a steel casting are given in Figure 2. This figure compares experimental porosity results (Figures 2a and 2b) with simulated porosity results (Figures 2c and 2d). Figure 2a shows a top-view radiograph of a 1 in. thick by 5.5 in. wide by 19 in. long (2.54 cm x 14.0 cm x 48.3 cm) steel plate. A total of fifteen such plates were cast in the experiments (five each from three different foundries), all using 3 in. (7.62 cm) diameter risers. The radiographs of each plate were overlaid with a fine grid, and the severity of porosity in each grid square was rated from 0 (no porosity) to 3 (severe porosity). After averaging the severity values over all fifteen plates, a composite map of the average severity and location of porosity was obtained (Figure 2b). The wide band of macroporosity measured in this plate geometry is commonly referred to as centerline shrinkage. Figures 2c and 2d show top and side cross-sectional views of the predicted porosity distribution for the plate shown in Figure 2a. Good overall agreement between the simulation and experiment can be observed. Other validation studies have indicated that microporosity is also well predicted by the multi-phase model [5, 6]. Microporosity can be particularly troublesome, since it usually escapes radiographic detection and is known to be detrimental to ductility and fatigue properties. Fatigue test specimens were produced from AISI 8630 quenched and tempered steel castings [6]. Micropores of 10 to 20 µm diameter size and about 0.65 volume percentage were found dispersed uniformly throughout the specimens, as shown in Figure 3a on a polished cut section. Also, on three fracture surfaces, such as the one shown in Figure 3b, micropores as large as 200 µm diameter were readily observed, since these pores were determined to be fatigue fracture initiation sites. The fatigue test results for these microporosity specimens are provided in the strain-life plot shown in Figure 3c. The solid curve in Figure 3c is the measured strain-life curve for the corresponding sound material without micropores [7]. Clearly, micropores can cause a reduction in the fatigue life of up to an order of magnitude. Assuming that the micropores behave as spherical notches, strain-life calculations were made to determine the effect of pores having diameters of 10, 20, 100 and 200 µm on the fatigue life (interrupted lines in Figure 3c). It can be seen that the strain-life calculation results for a 200 µm notch agree well with the measured fatigue lives of the three specimens found to have 200 µm diameter micropores on the fracture surface. This good agreement indicates that the reduction in fatigue life due to the presence of microporosity can be quantitatively predicted if the size of the micropores is accurately known. Since microporosity is generally undetectable by standard NDE, casting simulation that provides actual pore size information, as described above, is of great value. Macroporosity, on the other hand, is readily detected by radiography, but its effect on performance and fatigue life is not well understood. In a recent study [6, 8], mold geometries were designed to produce a range of macroporosity in AISI 8630 cast steel mechanical test specimens. A typical sectioned surface from a macroporosity specimen is shown in Figure 4a. Measurements were made of the apparent (or effective) elastic modulus of the macroporosity-
containing specimens [9]. Figure 4b shows that the effective elastic modulus decreases linearly with increasing maximum sectional porosity measured from the specimen radiographs. Fatigue tests on the macroporosity specimens indicated substantial reductions in the fatigue life, relative to the microporosity results, as shown in Figure 4c [6]. The scatter in the data can be explained by the different macroporosity levels in the cast specimens. A fatigue notch factor, Kf, was back-calculated for each of the specimens using the measured apparent elastic modulus, the measured fatigue life, and the local-strain life approach [6]. The fatigue notch factor determined in this manner is plotted in Figure 4d versus the ratio of the maximum pore dimension to the specimen diameter, which was measured from radiographs of each specimen. It can be seen that the fatigue notch factor increases with the size of the macropores. Also shown in Figure 4d (solid line) is the variation of the static stress concentration factor Kt (which should be larger than Kf) for a spherical hole of diameter d centered in a cylindrical section of diameter D subject to an axial stress, as obtained from a handbook [10]. Even though the actual macropore shapes are much different from a spherical hole, the comparison in Figure 4d indicates that, as a first approximation, the fatigue notch factor for macropores may be calculated from available relations for spherical holes [9]. The above relations between porosity and mechanical properties, as well as the porosity distribution predicted by casting simulation, can then be used in finite-element stress and strain-life fatigue durability simulations to evaluate the service performance of a cast part. Example results for a case study involving a large steel casting are shown in Figure 5 [9]. Figure 5a shows the predicted porosity distribution. The simulation reveals not only the large shrinkage indications that are rated in the ASTM standards, but also small microporosity (less than 1%) that is usually invisible on radiographic film. This porosity distribution is then transferred to the stress and durability codes. Figure 5b shows the predicted fatigue life distribution in the part without porosity, and with porosity taken into account in Figure 5c. For this particular case study the porosity does not appear to affect the fatigue life significantly. Nonetheless, the figure illustrates the concept that porosity is acceptable in a casting at locations where it can be tolerated due to low stress levels, but soundness must be ensured in high stress regions to achieve the desired fatigue life.
CRACKS AND TEARS The classification of surface indications has been addressed by designers and standards developers in a similar manner to shrinkage and porosity. The existing ASTM standards are "workmanship standards" and have no clear relationship to the performance of parts in service. To date, they are the least investigated aspect of casting design and production. Surface indications are not characterized in any published papers other than to address them as laps, cold shuts, cracks, linear indications, etc. Due to this lack of knowledge, surface indications are treated in an arbitrary manner where the designer will require that they must be reduced to a level that the foundry can live with and the purchaser can afford. The effect of the rectification process on the performance of the part has not been studied, but it is a commonly held belief that welding of these indications may produce a more deleterious effect than that of the untouched indication. A project is currently in the early stages to provide data as to the root cause of the indication, the depth of the indications into the casting, the sensitivity of the inspection techniques to small discontinuities (in terms of indication size), the differences in anomaly characteristics between magnetic particle indications and dye penetrant indications at the same level, and the ability of an operator to reliably discriminate between the different levels. In addition, efforts are underway to predict surface indications using casting simulation and quantitatively assess their effect on service performance.

Hot tears are one example of surface indications in castings. The incidence of hot tears is often a result of the casting design [11]. Hot tears occur when there is restraint in the casting during solidification, causing an unfed area in the casting to be pulled apart [12]. The ability to reliably predict the incidence of hot tears is vital in developing casting designs that have significantly reduced hot tearing tendencies [13]. By combining feeding flow predictions (in order to detect the lack of feeding that would prevent a hot tear from healing) with stress modeling (in order to determine the strains during solidification), a hot tear indicator was recently developed for use in casting simulation [14]. Figure 6 shows an example of a hot tear prediction for a steel casting obtained in this manner, together with the corresponding casting trial results. This work is ongoing [14].
INCLUSIONS Inclusions represent another common indication in castings that is difficult to eliminate [15, 16]. Inclusions are generally associated with the flow of liquid metal into the mold during pouring. However, modeling and verification trials in foundries have failed to indicate how gating systems may be universally improved [17, 18]. Simple rules, such as filling the runner system as quickly as possible, are certainly true and have proven effective to some degree. Still, the fine tuning of gating systems to optimize their performance has been largely unsuccessful. While it is relatively easy to produce dirty castings with a bad gating system, the use of a good gating system does not necessarily lead to clean castings. It is well known that oxidation of the melt due to exposure to the atmosphere during mold filling is the root cause for the formation of a significant portion of the inclusions found in castings. For instance, in low alloy steel, reoxidation inclusions account for 83% of all inclusions [17]. In steel castings, reoxidation inclusions are often found as discrete indications on the cope surface, as shown in Figures 7a and 7b. Campbell has extensively studied surface oxide films in aluminum castings [19, 20]. The problem with gating systems is directly linked to how the metal is delivered into the gating system, and each part of the delivery system cannot be treated in isolation [19]. Water modeling [17, 21] has shown the highly variable nature of current pouring systems. Studies of the hydraulic issues and analysis [17] have shown that velocity is the largest single contributor to air entrainment in the gating system, and consequently the amount of inclusions is dependent on the air entrained. This is in agreement with the studies performed by Campbell [20, 21]. A model has recently been developed to predict the formation and movement of reoxidation inclusions during filling of steel castings [22]. Figures 7c and 7d show the results of a simulation that predicts the final location of inclusions in an experimental plate casting. It can be seen that a number of large inclusions, about 2 mm in diameter, are predicted at the cope surface of the plate, which qualitatively agrees with the corresponding casting trial results shown in Figure 7b. Research is currently underway to determine the effect of such inclusions on mechanical properties.
FUTURE DIRECTIONS The need to design and produce lighter-weight and higher-performing castings will continue to increase in the future. The goal of the research programs described in this paper is to develop computer simulation methodologies to predict the performance of cast parts. The manufacturing process of a proposed design will be simulated, and the part performance will be assessed using realistic material properties that develop during manufacturing. The acceptable design will have customized examination requirements allowing verification of part performance. The resulting designs should be less expensive to develop, requiring less time, testing, and design iteration. The manufacture of the parts should require less process development. The quality testing should be directly related to the performance requirements. To

meet these demands, simulation needs to be robust, and needs to predict to a high degree of reproducibility the quality of the casting. Accomplishing this will require software that is able to predict the size and location of porosity, inclusions, hot tears and other casting defects, as well as being able to interface with stress and durability analysis software. Finally, simulation will need to be able to produce custom standards capable of assuring part performance.
ACKNOWLEDGEMENTS The research summarized here was undertaken through several sponsored projects: as part of the Integrated Design of Steel Castings for Service Performance project which is funded by the United States Department of Defense through the American Metalcasting Consortium (AMC) PRO-ACT program - AMC’s PRO-ACT program is sponsored by the Defense Supply Center Philadelphia (DSC, Philadelphia, PA) and the Defense Logistics Agency (DLA, Ft. Belvoir, VA); and as part of the Cast Metals Coalition and E-SMARRT projects conducted under sponsorship of the United States Department of Energy (DoE). This research is also performed under the auspices of the Steel Founders' Society of America (SFSA), and through substantial in-kind support, guidance and interest from SFSA member foundries and MAGMA GmbH. Any opinions, findings, conclusions, or recommendations expressed herein are those of the authors and do not necessarily reflect the views of DSC, DLA, DoE, MAGMA GmbH, or the SFSA and any of its member foundries.
REFERENCES 1. J. Campbell, Castings (Oxford, England: Butterworth-Heineman, 1991), 273-283. 2. K. Carlson et al., “Development of New Feeding Distance Rules Using Casting Simulation: Part I. Methodology”, Met. Trans. B, 33B (2002), 731-740. 3. S. Ou et al., “Development of New Feeding Distance Rules Using Casting Simulation Part II: The New Rules,” Met. Trans. B, 33B (2002), 741-755. 4. K. Carlson et al., “Analysis of ASTM X-ray Shrinkage Rating for Steel Castings”, Int. J. Cast Metals Res., 14 (3) (2001), 169-183. 5. K.D. Carlson et al., “Modeling of Porosity Formation and Feeding Flow in Steel Casting”, Modeling of Casting, Welding and Advanced Solidification Processes - X, ed. D.M. Stefanescu et al. (Warrendale, PA: The Minerals, Metals, and Materials Society, 2003), 295-302. 6. K.M. Sigl, R. Hardin, R.I. Stephens, and C. Beckermann, “Fatigue of 8630 Cast Steel in the Presence of Porosity,” International Journal of Cast Metals Research, 17 (3) (2004), 130-146. 7. R. I. Stephens, Fatigue and Fracture Toughness of Five Carbon or Low Alloy Cast Steels at Room or Low Climatic Temperatures (Carbon and Low Alloy Technical Research Committee, Steel Founders’ Society of America, Des Plaines, IL, 1982). 8. R. Hardin, and C. Beckermann, “Effect of Shrinkage on Service Performance of Steel Castings” (Paper presented at the 56th Steel Founders’ Society of America National Technical & Operating Conference, Chicago, Illinois, 7-9 November 2002), 29. 9. R. Hardin, and C. Beckermann, “Effect of Porosity on Mechanical Properties of 8630 Cast Steels,” (Paper presented at the 58th Steel Founders’ Society of America National Technical & Operating Conference, Chicago, Illinois, 4-6 November 2004), 19.

10. W.D. Pilkey, Stress Concentration Factors (2nd ed., Wiley-Interscience, New York, 1997), p. 349. 11. C.W. Briggs, Hot Tears in Steel Castings (Crystal Lake, IL: Steel Founders’ Society of America, 1968). 12. M. Rappaz, J.-M. Drezet, and M. Gremaud, “A new hot–tearing criterion,” Metallurgical and Materials Transactions A, 30A (1999), 449-455. 13. J. Campbell and T.W. Clyne, “Hot Tearing in Al-Cu Alloys,” Cast Metals, 3 (1991), 453-460. 14. C. Monroe and C. Beckermann, “Development of a Hot Tear Indicator for Use in Casting Simulation”, (Paper presented at the 58th Steel Founders’ Society of America National Technical & Operating Conference, Chicago, Illinois, 4-6 November 2004). 15. J. Campbell, Castings (Woburn, MA: Butterworth-Heinemann, 1993), 10-26, 53-63. 16. J.M. Svoboda et al., “Appearance and Composition of Oxide Macroinclusions in Steel Castings,” AFS Transactions, 95 (1987), 187-202. 17. J.A. Griffin and C.E. Bates, “Ladle Treating, Pouring and Gating for the Production of Clean Steel Castings” (SFSA Research Report No. 104, Steel Founders’ Society of America, Crystal Lake, Illinois, 1991). 18. P. Scarber, Jr., C.E. Bates, and J.A. Griffin, “Using Gating Design to Minimize and Localize Reoxidation” (Paper presented at the 56th Steel Founders’ Society of America National Technical & Operating Conference, Chicago, Illinois, 7-9 November 2002). 19. N.W. Lai, W.D. Griffiths, and J. Campbell, “Modelling of the Potential for Oxide Film Entrainment in Light Metal Alloy Castings,” Modeling of Casting, Welding and Advanced Solidification Processes X, ed. D.M. Stefanescu, J.A. Warren, M.R. Jolly, and M.J.M. Krane (Warrendale, Pennsylvania: The Minerals, Metals, and Materials Society, 2003), 415-422. 20. J.J. Runyoro, S.M.A. Boutorabi, and J. Campbell, “Critical Gate Velocity for Film-Forming Casting,” AFS Transactions, 100 (1992), 225-234. 21. Wanstall, C., J.A. Griffin, and C.E. Bates, “Water Modeling of Steel Pouring Practices”, (Paper presented at the 47th Steel Founders’ Society of America National Technical & Operating Conference, Chicago, Illinois, November 1993). 22. K.D. Carlson and C. Beckermann, “Modeling of Reoxidation Inclusion Formation During Filling of Steel Castings” (Paper presented at the 58th Steel Founders’ Society of America National Technical & Operating Conference, Chicago, Illinois, 4-6 November 2004).

LIST OF FIGURES
Figure 1. Average one-sided confidence intervals (CI) of ASTM x-ray level ratings, grouped by average x-ray level; average CI for all ratings is 1.42 levels [4]. Figure 2. Comparison of experimental and simulated porosity distributions in plate castings made of low-alloy steel; porosity in castings is controlled by the riser system design [2, 3]. (a) top-view radiograph of one of the 15 plates, showing centerline shrinkage porosity; (b) map showing average experimental porosity distribution for all 15 plates; (c) top-view and (d) side-view cross-sectional simulated porosity results for the plate shown in (a). Figure 3. Effect of microporosity on fatigue properties of 8630 cast steel [6]. (a) typical micropores of about 10 µm diameter found on the polished surface of specimens; (b) SEM image of near-surface micropore, approximately 200 µm in diameter, on fracture surface; (c) strain-life curve for sound material, microporosity data, and model calculations for microporosity specimens using 10, 20, 100 and 200 µm diameter surface notches. Figure 4. Effect of macroporosity on static and fatigue properties of 8630 cast steel [9]. (a) surface of a typical sectioned specimen with macroporosity; (b) apparent elastic modulus versus maximum section porosity percentage measured from radiograph; (c) stress-life curve for specimens with macroporosity compared with microporosity data curve; (d) fatigue notch factor Kf calculated from fatigue test data versus maximum porosity dimension measured from radiographs compared with stress concentration factor Kt for spherical hole in round bar from [10]. Figure 5. Case study illustrating the integration of porosity predictions into fatigue life simulations for a steel casting. (a) predicted porosity fraction distribution in an interior section; (b) predicted life distribution in loading cycles to failure without including effects of porosity; (c) predicted life distribution in loading cycles to failure including effects of the porosity distribution shown in (a). Figure 6. Example of a hot tear prediction for an experimental steel casting [14]; the incidence of hot tears is often a result of the casting design [11]; hot tears occur late in solidification when an unfed area in the casting is subject to tensile stresses. Figure 7. Comparison of experimental and predicted reoxidation inclusion locations in a steel casting [22]; inclusion formation in castings is primarily controlled by the pouring and gating system design [1]. (a) picture of a typical reoxidation inclusion; (b) two experimental 1 in. by 10 in. by 12 in. (2.54 cm by 25.4 cm by 30.5 cm) plate casting results (with inclusions circled); (c) top-view and (d) iso-view of simulated inclusion distribution.
Figure 1. Average one-sided confidence intervals (CI) of ASTM x-ray level ratings, grouped by average x-ray level; average CI for all ratings is 1.42 levels [4].
0.0
0.5
1.0
1.5
2.0
2.5
0 1 2 3 4 5
Xav
g < 0
.5
0.5 ≤
Xav
g < 1
.5
3.5 ≤
Xav
g < 4
.5
2.5 ≤
Xav
g < 3
.5
1.5 ≤
Xav
g < 2
.5
Ave
rage
One
-Sid
ed 9
5%
Con
fiden
ceIn
terv
al(C
I)
Average X-ray Level (Xavg) Groupings
≥ 4.
5

Figure 2. Comparison of experimental and simulated porosity distributions in plate castings made of low-alloy steel; porosity in castings is controlled by the riser system design [2, 3]. (a) top-view radiograph of one of the 15 plates, showing centerline shrinkage porosity; (b) map showing average experimental porosity distribution for all 15 plates; (c) top-view and (d) side-view cross-sectional simulated porosity results for the plate shown in (a).
Riser (a)
(d)
(c)
(b)
1.401.201.000.800.600.400.200.00
Porosity Severity
Pore Volume
[%]

Cycles to Failure, Nf
Stra
inA
mpl
itude
,∆ε/
2
101 102 103 104 105 106 107
10-3
10-2
10-1
Microporosity dataStrain-life curve for sound material10 µm diam pore20 µm diam pore100 µm diam pore200 µm diam pore
}Strain-life calculations
Circled specimens were found to have pore diameters º 200 mm responsible for failure
Figure 3. Effect of microporosity on fatigue properties of 8630 cast steel [6]. (a) typical micropores of about 10 µm diameter found on the polished surface of specimens; (b) SEM image of near-surface micropore, approximately 200 µm in diameter, on fracture surface; (c) strain-life curve for sound material, microporosity data, and model calculations for microporosity specimens using 10, 20, 100 and 200 µm diameter surface notches.
(a)
(c)
(b)

Cycles to Failure, Nf
Stre
ssA
mpl
itude
(MPa
)
102 103 104 105 106 1070
50
100
150
200
250
300
Microporosity CurvefitMacroporosity Data
Maximum Porosity Dimension toSpecimen Diameter Ratio for Kf, and d/D for Kt
Fatig
ueN
otch
Fact
orK
f,a
ndSt
ress
Con
cent
ratio
nFa
ctor
Kt
0 0.1 0.2 0.3 0.4 0.5 0.6 0.7 0.8 0.9 12
3
4
5
6
7
8
9Kf computed from fatigue test dataKt for spherical hole from [10]
Maximum Section Porosity in SpecimenDetermined from Radiograph (%)
Elas
ticM
odul
usE
(GPa
)
0 25 50 75 1000
50
100
150
200 Modulus from fatigue testLinear variation in modulus
1 mm
Figure 4. Effect of macroporosity on static and fatigue properties of 8630 cast steel [9]. (a) surface of a typical sectioned specimen with macroporosity; (b) apparent elastic modulus versus maximum section porosity percentage measured from radiograph; (c) stress-life curve for specimens with macroporosity compared with microporosity data curve; (d) fatigue notch factor Kf calculated from fatigue test data versus maximum porosity dimension measured from radiographs compared with stress concentration factor Kt for spherical hole in round bar from [10].
(a) (b)
(c) (d)

Longer Life
Shorter Life
Longer Life
Shorter Life
(a)
(b)
(c)
Figure 5. Case study illustrating the integration of porosity predictions into fatigue life simulations for a steel casting. (a) predicted porosity fraction distribution in an interior section; (b) predicted life distribution in loading cycles to failure without including effects of porosity; (c) predicted life distribution in loading cycles to failure including effects of the porosity distribution shown in (a).

Hot Tear
Figure 6. Example of a hot tear prediction for an experimental steel casting [14]; the incidence of hot tears is often a result of the casting design [11]; hot tears occur late in solidification when an unfed area in the casting is subject to tensile stresses.

Figure 7. Comparison of experimental and predicted reoxidation inclusion locations in a steel casting [22]; inclusion formation in castings is primarily controlled by the pouring and gating system design [1]. (a) picture of a typical reoxidation inclusion; (b) two experimental 1 in. by 10 in. by 12 in. (2.54 cm by 25.4 cm by 30.5 cm) plate casting results (with inclusions circled); (c) top-view and (d) iso-view of simulated inclusion distribution.
(b)
(d)
(c) Diameter [mm]
(a) 2 mm