Marques, M.R., “Identification of polymorphisms and characterization of new ovine growth hormone...
170
UNIVERSITY OF ALGARVE FACULTY OF ENGINEERING OF NATURAL RESOURCES IDENTIFICATION OF POLYMORPHISMS AND CHARACTERIZATION OF NEW OVINE GROWTH HORMONE V ARIANTS ASSOCIATED WITH MILK TRAITS IN “SERRA DA ESTRELA” OVINE BREED. (Thesis dissertation presented to obtain the PhD degree in Biology, speciality of Population Biology) Maria do Rosário Fernandes Marques FARO (2006)
-
Upload
independent -
Category
Documents
-
view
1 -
download
0
Transcript of Marques, M.R., “Identification of polymorphisms and characterization of new ovine growth hormone...
UNIVERSITY OF ALGARVE
FACULTY OF ENGINEERING OF NATURAL RESOURCES
IDENTIFICATION OF POLYMORPHISMS AND CHARACTERIZATION
OF NEW OVINE GROWTH HORMONE VARIANTS ASSOCIATED
WITH MILK TRAITS IN “SERRA DA ESTRELA” OVINE BREED.
(Thesis dissertation presented to obtain the PhD degree in Biology, speciality of Population Biology)
Maria do Rosário Fernandes Marques
FARO (2006)

UNIVERSITY OF ALGARVE
FACULTY OF ENGINEERING OF NATURAL RESOURCES
IDENTIFICATION OF POLYMORPHISMS AND CHARACTERIZATION
OF NEW OVINE GROWTH HORMONE VARIANTS ASSOCIATED
WITH MILK TRAITS IN “SERRA DA ESTRELA” OVINE BREED.
(Thesis dissertation presented to obtain the PhD degree in Biology, speciality of Population Biology)
Maria do Rosário Fernandes Marques
Supervisor: Doutor Alfredo Jaime Morais Cravador
Committee: Chairman: Reitor da Universidade do Algarve
Members: Doutor Alfredo Jaime Morais Cravador, Professor Catedrático da Faculdade de Engenharia de Recursos Naturais da Universidade do Algarve; Doutor Carlos Alberto Gonçalves Carmona Belo, Investigador Coordenador da Estação Zootécnica Nacional;
Doutor Gustavo Nuno Barbosa Nolasco, Professor Associado com agregação da Faculdade de Engenharia de Recursos Naturais da Universidade do Algarve;
Doutor Nuno Miguel dos Santos Ferrand de Almeida, Professor Associado da Faculdade de Ciências da Universidade do Porto; Doutor Luís Lavadinho Telo da Gama, Professor Associado convidado do Instituto Superior de Agronomia da Universidade Técnica de Lisboa; Doutor Maria Leonor dos Santos Orge, Técnica Superior do Laboratório Nacional de Investigação Veterinária, na qualidade de especialista.
FARO (2006)


i
À minha Mãe

ii
�������������� ���
Marques MR, Santos IC, Carolino N, Belo CC, Renaville R and Cravador A 2006
Effects of genetic polymorphisms at the growth hormone gene on milk yield in Serra
da Estrela sheep. Journal of Dairy Research 73 394–405.

iii
���� ����������
I would like to express my gratitude to so many people involved in this thesis. Without
their help and encouragement, I would not have been able to accomplish this project.
I sincerely thank to my advisor, Professor Alfredo Cravador for accepting me to
develop my doctoral research on his group at the University of Algarve. With his strong
support and scientific guidance he helped me through all of the difficulties during my
research. I will always be grateful to him for giving me this opportunity.
I express my gratitude to Professor Vaz Portugal, Doctor Rui Leitão and Doctor
Ramalho Ribeiro, Directors of “Estação Zootécnica Nacional” (EZN), and to Doctor Luís
Telo da Gama, head of the department of “Genética e Melhoramento Animal” of the EZN for
allowing me to perform part of the experimental work in the laboratories of their institution.
I would like to express my deep gratitude to my “co-adviser”, Doctor Carlos Carmona
Belo, head of the department of “Sistemas e Técnicas de Produção Animal” of the EZN, an
outstanding person who always had his door open for me. He taught me a lot and helped to
build up my academic background with his scientific capabilities, enthusiasm and generosity.
His constant constructive comments, support, encouragement and friendship gave me the
strength and ability to believe in myself and believe that anything is possible.
I am very grateful to Dr. Vaz Patto for giving me the opportunity to work with “Serra
da Estrela” ovine breed. I thank also Engº Rui Dinis, Dr. Fernando Esteves, Engº Pedro
Campos and other ANCOSE staff who helped me with the questionnaire to the breeders and
with blood collection and finally providing me with the milk data records.
Deep thanks are due to the “Serra da Estrela” ovine breeders who kindly answered the
questionnaires and especially to the ones who allowed blood collection in their animals.
Without their collaboration this work could not have been performed.
I thank Ingrid Santos, a dear colleague and great friend, for the fruitful brainstorms that
we had during this study and also for the philosophical talks about science and life. I thank her
also for all the laboratory support she gave me and for the patient reviews and suggestions to
this manuscript.

iv
Special thanks are due to Deolinda Carvalho, a dear friend whose wide technical
support made my live much easier in the laboratory. I thank also Esperança Maurício for lab
support.
I am also grateful to Lénia Ferrão, Cristina Couto, Elisabete Malveiro, Patrícia
Marques, Luís Queirós, Nuno Felício and Rodrigo Agrícola, colleagues and friends from
EZN, for their support during DNA extraction and SSCP analysis.
I thank Marta Silva Pereira and Nuno Carolino for statistical assistance and amity.
I thank Ana Cristina Coelho for tips in the lab work, and Dina Neves, Marília Horta,
Nelson Sousa and Paula Caetano, colleagues from the University of Algarve for logistic
support and hospitality.
I also would like to thank all my friends, in particular Doctor Ana Teresa Carmona
Belo. She is a wonderful friend, always willing to listen and help. Her constant support and
advises during the manuscript reviewing were precious and helped me a lot.
Quero também, e em especial, endereçar à minha Mãe o meu profundo agradecimento
por todo o apoio demonstrado ao longo deste trabalho. Obrigada por estares sempre comigo
em todas as ocasiões. Sem o teu suporte e incentivo não teria sido possível chegar até aqui.
This work was financed by the European Community - III Framework Programme for
Research and Technological Development, co-financed by the European Social Fund (ESF)
and by national funding from Ministry of Science, Technology and Higher Education (PhD
grant SFRH/BD/1140/2000).
My grateful thanks are due to all
Maria do Rosário Fernandes Marques
v
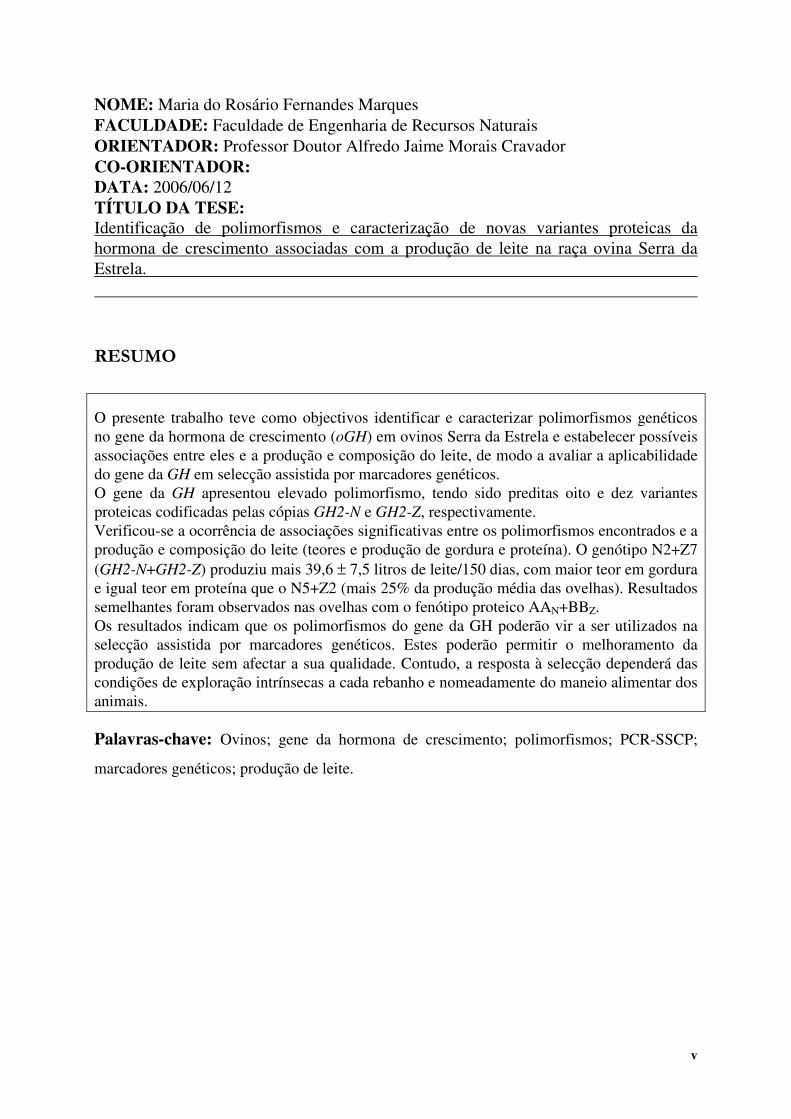
NOME: Maria do Rosário Fernandes Marques FACULDADE: Faculdade de Engenharia de Recursos Naturais ORIENTADOR: Professor Doutor Alfredo Jaime Morais Cravador CO-ORIENTADOR: DATA: 2006/06/12 TÍTULO DA TESE: Identificação de polimorfismos e caracterização de novas variantes proteicas da hormona de crescimento associadas com a produção de leite na raça ovina Serra da Estrela. �������
O presente trabalho teve como objectivos identificar e caracterizar polimorfismos genéticos no gene da hormona de crescimento (oGH) em ovinos Serra da Estrela e estabelecer possíveis associações entre eles e a produção e composição do leite, de modo a avaliar a aplicabilidade do gene da GH em selecção assistida por marcadores genéticos. O gene da GH apresentou elevado polimorfismo, tendo sido preditas oito e dez variantes proteicas codificadas pelas cópias GH2-N e GH2-Z, respectivamente. Verificou-se a ocorrência de associações significativas entre os polimorfismos encontrados e a produção e composição do leite (teores e produção de gordura e proteína). O genótipo N2+Z7 (GH2-N+GH2-Z) produziu mais 39,6 ± 7,5 litros de leite/150 dias, com maior teor em gordura e igual teor em proteína que o N5+Z2 (mais 25% da produção média das ovelhas). Resultados semelhantes foram observados nas ovelhas com o fenótipo proteico AAN+BBZ. Os resultados indicam que os polimorfismos do gene da GH poderão vir a ser utilizados na selecção assistida por marcadores genéticos. Estes poderão permitir o melhoramento da produção de leite sem afectar a sua qualidade. Contudo, a resposta à selecção dependerá das condições de exploração intrínsecas a cada rebanho e nomeadamente do maneio alimentar dos animais.
Palavras-chave: Ovinos; gene da hormona de crescimento; polimorfismos; PCR-SSCP;
marcadores genéticos; produção de leite.
vi
TITLE: Identification of polymorphisms and characterization of new ovine growth hormone variants associated with milk traits in “Serra da Estrela” ovine breed. ���������
The objectives of the present work were the identification and characterisation of nucleotidic polymorphisms naturally occurring at the growth hormone gene (oGH) in "Serra da Estrela" sheep, and the establishment of associations with milk traits in order to evaluate GH as a useful candidate gene for marker assisted selection. The oGH gene was found to be highly polymorphic. Polymorphisms found in coding regions allowed the prediction of eight protein variants coded by the GH2-N copy and ten by the GH2-Z copy. Milk yield and milk composition (fat and protein contents and yields) were associated with GH polymorphisms by restricted maximum likelihood (REML) through a univariate best linear unbiased prediction (BLUP) animal model with repeated measures. The N2+Z7 (GH2-N+GH2-Z) genotype produced 39.6 ± 7.5 litres of milk/150 days more than N5+Z2 (more 25 % than the mean milk yield of the studied population), with higher milk fat content and similar protein content. Moreover, a similar result was obtained for the protein phenotype AAN+BBZ ewes. The results indicate that using GH polymorphisms as genetic markers could improve milk yield potential in “Serra da Estrela” ewes without detrimental impact on milk quality. The extent of the response, however, might depend on the environmental conditions within the flock, namely on an appropriate feeding management of the animals.
Key words: Ovis aries; growth hormone gene; polymorphism; PCR-SSCP; genetic markers;
milk yield.
vii
���� ��� �������
THESIS PUBLICATIONS ........................................................................................................ ii
ACKNOWLEDGMENTS......................................................................................................... iii
RESUMO..................................................................................................................................... v
ABSTRACT ............................................................................................................................... vi
TABLE OF CONTENTS ......................................................................................................... vii
LIST OF TABLES...................................................................................................................... x
LIST OF FIGURES.................................................................................................................. xii
LIST OF ABBREVIATIONS ................................................................................................. xiii
LIST OF AMINO ACIDS ...................................................................................................... xvii
I. INTRODUCTION AND OBJECTIVES............................................................................... 1
I.1 Introduction................................................................................................................ 3
I.2 Objectives.................................................................................................................... 4
II. LITERATURE REVIEW..................................................................................................... 5
II.1 Serra da Estrela ovine breed..................................................................................... 7
II.2 The growth hormone gene......................................................................................... 9 II.2.1 oGH gene duplication......................................................................................................... 10
II.3 Transcription regulation of the GH gene .............................................................. 11 II.3.1 Pituitary-specific transcription factor (POU1F1)............................................................... 12 II.3.2 Thyroid hormone and retinoic acid receptors response elements ...................................... 13 II.3.3 Glucocorticoid receptor (GR) ............................................................................................ 13 II.3.4 Ubiquitous transcription factors......................................................................................... 14
II.3.4.1 Stimulating protein 1 (Sp1)......................................................................................... 14 II.3.4.2 Zinc finger protein (Zn15/Zn16)................................................................................. 14
II.3.5 Silencer element ................................................................................................................. 14
II.4 Neuroendocrine regulation of GH secretion.......................................................... 15 II.4.1 Growth hormone-releasing hormone (GHRH)................................................................... 15 II.4.2 Somatostatin (SRIF) ........................................................................................................... 16 II.4.3 Pituitary adenylate cyclase-activating polypeptide (PACAP)............................................ 16 II.4.4 Ghrelin................................................................................................................................ 17 II.4.5 Leptin ................................................................................................................................. 17 II.4.6 Other GH-Regulating Neuropeptides ................................................................................. 18
II.4.6.1 Catecholamines ........................................................................................................... 18 II.4.6.2 Neuropeptide Y (NPY) ............................................................................................... 19 II.4.6.3 Galanin ........................................................................................................................ 19 II.4.6.4 Neurotransmiters amino acids..................................................................................... 20
viii
II.5 GH signal transduction regulation ......................................................................... 20 II.5.1 GH binding to cellular GH receptors..................................................................................21 II.5.2 GH-dependent activation of JAK2 .....................................................................................22 II.5.3 Activation of MAPK signalling pathway ...........................................................................23 II.5.4 GH signalling through PKC................................................................................................24 II.5.5 GH-dependent activation of the STAT proteins family .....................................................24 II.5.6 GH signalling inhibition .....................................................................................................25
II.6 GH and milk production ......................................................................................... 26 II.6.1 Mammary gland development ............................................................................................27
II.6.1.1 From birth to partum ...................................................................................................28 II.6.1.2 Throughout lactation ...................................................................................................29
II.6.2 Mechanisms of GH action during lactation........................................................................31 II.6.2.1 Lipid metabolism.........................................................................................................31 II.6.2.2 Carbohydrate metabolism............................................................................................33 II.6.2.3 Protein metabolism......................................................................................................34
II.6.3 Recombinant somatotropin and milk production in ewes ..................................................34
II.7 Transgenic animals expressing an additional GH copy........................................ 36
II.8 Impact of GH polymorphisms on productive traits .............................................. 36
III. MATERIALS AND METHODS ...................................................................................... 41
III.1 Serra da Estrela sheep production system ............................................................. 43 III.1.1 Geographical area ...............................................................................................................43 III.1.2 Topography and soil types..................................................................................................43 III.1.3 Climate................................................................................................................................44 III.1.4 Sheep production system....................................................................................................44
III.1.4.1 Land utilization............................................................................................................44 III.1.4.2 Feeding system ............................................................................................................44 III.1.4.3 Flocks management .....................................................................................................45 III.1.4.4 Milk production and utilization...................................................................................45
III.2 Animals and milk records........................................................................................ 46
III.3 oGH gene copy number genotypes ......................................................................... 47
III.4 oGH gene analysis by PCR-SSCP........................................................................... 48
III.5 Cloning and sequencing of the oGH gene copies and of the inter copy-region .. 50
III.6 Statistical analysis .................................................................................................... 52 III.6.1 oGH copy number genotypes .............................................................................................52
III.6.1.1 Data set 1 – Milk yield in the genotyped ewes............................................................52 III.6.1.2 Data set 2 – Milk yield in the genotyped animals’ progeny........................................53
III.6.2 Polymorphism at the oGH copies .......................................................................................54
III.7 Bioinformatics........................................................................................................... 55 III.7.1 Gene finding .......................................................................................................................55 III.7.2 Transcription factors binding sites .....................................................................................55 III.7.3 Protein analysis...................................................................................................................56

ix
IV. RESULTS ........................................................................................................................... 57
IV.1 oGH copy number genotypes .................................................................................. 59 IV.1.1 Probe preparation ............................................................................................................... 59 IV.1.2 oGH copy number genotyping ........................................................................................... 59 IV.1.3 Statistical analysis .............................................................................................................. 60
IV.1.3.1 Milk yield in the genotyped ewes ............................................................................... 60 IV.1.3.2 Milk yield in the genotyped ewes animals’ progeny .................................................. 61
IV.2 oGH gene SSCPs’ detection, charaterization and influence on milk traits ........ 61 IV.2.1 PCR-SSCP analysis ............................................................................................................ 61 IV.2.2 Hardy-Weinberg equilibrium test....................................................................................... 65 IV.2.3 Sequencing of the inter-copy region and separate PCR-SSCP fragment analysis of each oGH gene copy ................................................................................................................................. 66 IV.2.4 Molecular characterization of the SSCP patterns .............................................................. 68
IV.2.4.1 oGH haplotypes........................................................................................................... 71 IV.2.4.2 oGH protein variants................................................................................................... 71
IV.2.5 Statistical analysis .............................................................................................................. 72 IV.2.5.1 Milk yield.................................................................................................................... 72 IV.2.5.2 Milk composition ........................................................................................................ 82
IV.3 Single nucleotide polymorphisms (SNPs) .............................................................. 87
IV.4 Transcription factors binding sites ........................................................................ 91
IV.5 Protein structure prediction.................................................................................... 92
V. DISCUSSION....................................................................................................................... 93
V.1 Animals and milk records ....................................................................................... 95
V.2 oGH copy number genotypes .................................................................................. 95 V.2.1 Implications in milk yield................................................................................................... 96 V.2.2 Transcription factors binding sites and oGH copies regulation......................................... 97
V.3 PCR-SSCP polymorphisms at the oGH gene ........................................................ 97 V.3.1 Molecular characterization of the SSCP patterns .............................................................. 99
V.3.1.1 oGH gene polymorphisms........................................................................................... 99 V.3.1.2 Predicted protein variants ......................................................................................... 100
V.4 Milk yield and composition ................................................................................... 102
V.5 Single nucleotide polymorphisms (SNPs) ............................................................ 104
V.6 Future perspectives:............................................................................................... 105
VI. CONCLUSIONS .............................................................................................................. 107
VII. REFERENCES ............................................................................................................... 111
APPENDICES......................................................................................................................... 139 Appendix 1 Questionnaire for dairy sheep farmers ................................................................... 141 Appendix 2 Flocks’ average milk data records in the lactations of the years 95/96 and 96/97
(36 flocks and 2520 ewes)....................................................................................... 144 Appendix 3 GenBank accession number DQ238053 - the oGH gene inter copy region ........... 145 Appendix 4 Putative transcription factors binding sites at the 5’ region of oGH gene ............. 148
x
���� �������
Table �II.1. Evolution of “Serra da Estrela” total milk yields (TMY; l) and milk yields in 150 days (MY; l/150 d) between 1944 and 2004. ................................................................................7
Table �II.2. Biological effects of GH in farm animals during lactation. ..................................................30 Table �II.3. Polymorphisms at the GH gene significantly associated with production traits and
metabolic parameters in bovines. ................................................................................................37
Table �III 1. Flocks’ mean milk yield (l/150 days) in the period 1995-2000...........................................46 Table �III 2. Flocks’ mean milk yield (l/150 d), fat content (g/kg), protein content (g/kg), fat yield
(kg/150 d, protein yield (kg/150 d) and fat plus protein yield (kg/150 d) in 1998. ....................47 Table �III 3. Length and localisation of PCR-SSCP fragments of the oGH gene and primers used
for the PCR analysis ....................................................................................................................49
Table �IV 1. SSCP patterns found at the oGH fragments I, II, III and IV, the corresponding genotypes (in italic figures) and frequencies (%) in “Serra da Estrela” sheep population (SE) and in each of the seven flocks (FL1 to FL7). ....................................................................63
Table �IV 2. SSCP patterns found at the oGH fragments V, VI and VII, the corresponding genotypes (in italic figures) and frequencies (%) in “Serra da Estrela” sheep population (SE) and in each of the seven flocks (FL1 to FL7). ....................................................................64
Table �IV 3. Hardy-Weinberg equilibrium, heterozygote deficit and excess tests’ significance levels for the oGH copy gene fragments IN to IVN, VIN, VIIN, IIIZ, IVZ, VIZ and VIIZ. ..............66
Table �IV 4. Nucleotide sequence characterisation of SSCP alleles of each amplified fragment at the GH2-N (or GH1) and GH2-Z copies. ....................................................................................69
Table �IV 5. Polymorphisms found in the coding regions of the oGH gene copies, predicted amino acid changes and protein variants.....................................................................................70
Table �IV 6. Predicted protein variants’ frequencies (%) at the GH2-N and GH2-Z copies....................72 Table �IV 7. GH2-N genotypes, their respective frequencies (%) and milk yield deviation (l/150
d) ± standard error from the most frequent homozygous GH2-N genotype in all flocks but FL1+FL4 (deviation from the most frequent genotype within the flock). ..................................74
Table �IV 8. GH2-Z genotypes, their respective frequencies (%) and milk yield deviation (l/150 d) ± standard error from the most frequent homozygous GH2-Z genotype. ...............................75
Table �IV 9. Associated GH2-N+GH2-Z genotypes, their respective frequencies (%) and milk yield deviation (l/150 d) ± standard error from the most frequent GH2-N+GH2-Z genotype. .....................................................................................................................................77
Table �IV 10. GH2-N phenotypes, their respective frequencies (%) and milk yield deviation (L/150 d) ± standard error from the most frequent homozygous GH2-N phenotype..................79
Table �IV 11. GH2-Z phenotypes, their respective frequencies (%) and milk yield deviation (L/150 d) ± standard error from the most frequent homozygous GH2-Z phenotype. .................80
Table �IV 12. Associated GH2-N+GH2-Z phenotypes, their respective frequencies (%) and milk yield deviation (L/150 d) ± standard error from the most frequent homozygous GH2-N+GH2-Z phenotype...................................................................................................................81
Table �IV 13. GH2-N and GH2-Z genotypes, their respective frequencies and deviation of milk yield, fat and protein contents, and fat, protein and fat+protein yields at 150 days of lactation ± standard error for the most frequent homozygous GH2-N and GH2-Z genotype. .....................................................................................................................................83

xi
Table �IV 14. Associated GH2-N+GH2-Z genotypes, their respective frequencies (%) and
deviation of milk yield, fat and protein contents (g/kg), and fat, protein and fat+protein yields (kg/150 d) at 150 days of lactation ± standard error for the most frequent homozygous associated GH2 N+GH2 Z genotype. .................................................................... 84
Table �IV 15. GH2-N, GH2-Z and associated GH2-N+GH2-Z phenotypes, their respective frequencies (%) and deviation of milk yield (l/150 d), fat and protein contents (g/kg), and fat, protein and fat+protein yields (kg/150 d) at 150 days of lactation ± standard error for the most frequent homozygous phenotype.................................................................................. 85
Table �IV 16. GH1 or GH2-N SNPs and their respective genotype and allele frequencies (%).............. 88 Table �IV 17. GH2-Z SNPs and their respective genotype and allele frequencies (%). .......................... 89 Table �IV 18. Endonucleases that discriminate SNPs found by SSCP analysis or DNA sequencing
along the oGH gene copies. ........................................................................................................ 90 Table �IV 19. Protein motif comparison between several oGH protein variants. .................................... 92

xii
���� ����������
Figure �II.1. Evolution of the number of “Serra da Estrela” ewes inscribed in the breed Herd Book (FAO, 2004)........................................................................................................................ 8
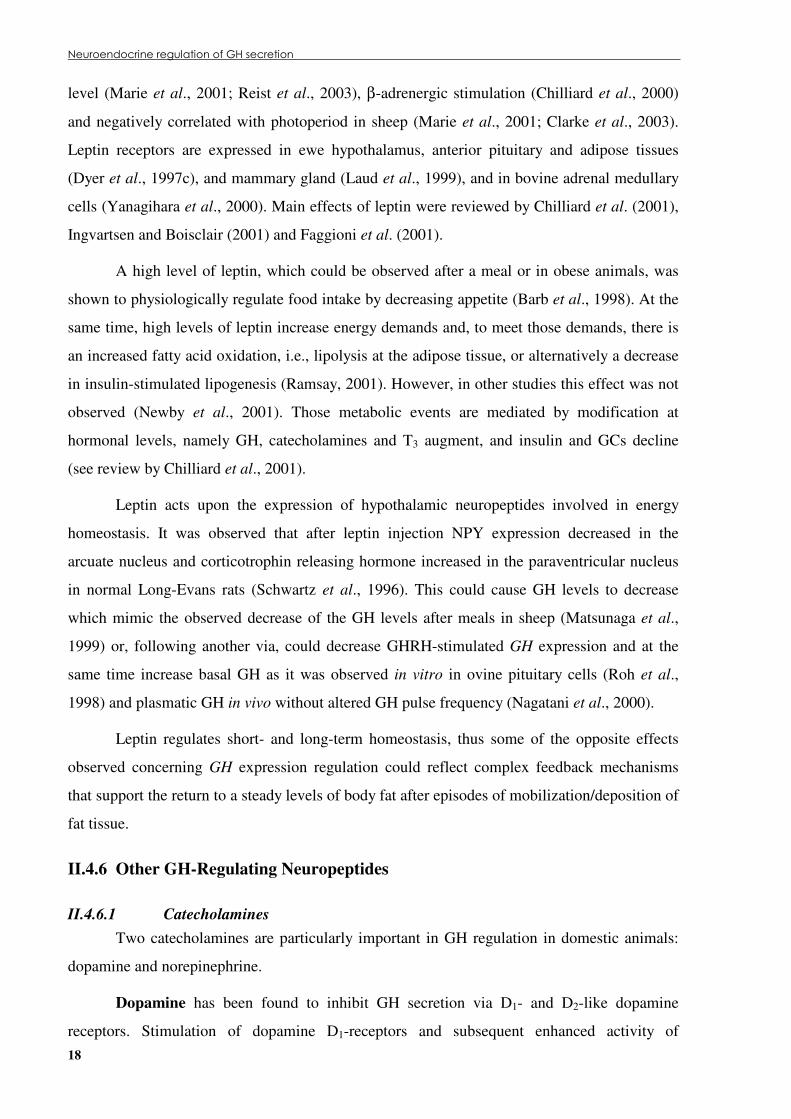
Figure �II.2. Schematic representation of oGH gene structure (2162 bp; Orian et al., 1988)....................9 Figure �II.3. oGH gene alleles Gh1 and Gh2 in sheep (based on Valinsky et al., 1990). ........................10 Figure �II.4. Regulatory sequences at the promoter of the oGH gene......................................................11 Figure �II.5. Rainbow-colored ribbon diagram of the hGH from the 3HHR crystallographic
structure. ......................................................................................................................................20 Figure �II.6. The structure of the 1:2 complex of the hGH with the hGHR extracelular domain
(hGH/hGHBP2 complex).............................................................................................................21 Figure �II.7. Binding sites at the GHR responsive for GH binding and GH-GHR signal
transduction and their putative biological functions. ..................................................................23 Figure �II.8. Diagram of the GH-dependent transcription of the insulin-like growth factor I
(IGF-I) gene pathway. .................................................................................................................25 Figure �II.9. GHR-expressing cells’ in response to GH or GH plus GH-antagonist treatment................26 Figure �II.10. Hormonal regulation of the mammary gland development. ..............................................27 Figure �II.11. Changes in blood serum concentrations of putative homeorhetic hormones in cows. ......32 Figure� II.12. Milk production in lactating ewes submitted to recombinant bovine ST (rbsT)
treatment. .....................................................................................................................................35
Figure �III.1. Municipalities of the geographical area of the Demarcated Region of the “Serra da Estrela” Cheese (DRSEG)...........................................................................................................43
Figure �III.2. Gh2 allele in sheep (following Valinsky et al., 1990) containing the GH2-N and GH2-Z copies in tandem..............................................................................................................51
Figure �IV.1. Evaluation of PCR-DIG labelling efficiency of the 2055 bp probe in agarose gel electrophoresis.............................................................................................................................59
Figure �IV.2. EcoRI-restriction fragment length polymorphism at the growth hormone locus in “Serra da Estrela” sheep..............................................................................................................60
Figure �IV.3. oGH copy number genotypic and allelic frequencies in the “Serra da Estrela” sheep. .....60 Figure �IV.4. Effect of the probability of a ewe to receive alleles Gh1, Gh2 or either from their
progenitor on milk yield adjust to 150 lactation days. ................................................................61 Figure �IV.5. PCR-SSCP patterns for fragments I (5’-UTR, exon 1), II (5’-UTR, exon 1, intron
1), III (intron 1, exon 2, intron 2), IV (intron 2, exon 3, intron 3), V (intron 3, exon 4, intron 4), VI (intron 4, exon 5, 3’-UTR) and VII (exon 5, 3’-UTR) of “Serra da Estrela”.........62
Figure �IV.6. Alignment of the sequence of a fragment of the inter-copy region DQ238053 (our results) containing the 5’-UTR of the GH2-Z copy with previously published sequences of fragments containing the 5’-UTR of the GH2-N copy (M37310; Byrne et al., 1987) and GH1 copy (X12546; Orian et al., 1988) and with primer GHT-Fwd specific for GH1 copy (or GH2-N) amplification. ..................................................................................................67
Figure �IV.7. PCR-SSCP analysis of the fragment IV of the oGH gene..................................................67 Figure �IV.8. Partial electropherogram of the PCR product of the GH2-Z copy presenting SNPs
I4Z1551 (C/T) and I4Z1558 (T/G)....................................................................................................87 Figure �IV.9. Putative transcription factors binding sites at the 5’-region at GH1, GH2-N and
GH2-Z copies. .............................................................................................................................91
xiii
���� ���������� ���
∞∞∞∞ infinite χχχχ2 chi-square µµµµl micro litre(s) µµµµM micro molar A adenine residue aa amino acid(s) AFLP amplified fragment length polymorphism ALS acid-labile subunit ANCOSE National Association of the Breeders of the “Serra da Estrela” Sheep Ap-1 activator protein 1 bGH bovine growth hormone BLUP Best Linear Unbiased Predictor bp base pair(s) BSA bovine serum albumin bST bovine somatotropin C cytosine residue Ca2+ calcium ion CAAT box consensus sequence GGCCAATCT cAMP cyclic adenosine 3’,5’-monophosphate c-fos cellular fos oncogene cm centimetre(s) CREB cAMP-responsive element binding protein CSPD chemiluminescent alkaline phosphatase substrate d day(s) D1 D1-like dopamine receptor D2 D2- like dopamine receptor DAG 1,2-diacylglycerol DIG digoxigenin DNA deoxyribonucleic acid DNase I deoxyribonuclease I dNTP 2’-deoxynucleoside triphosphate DRSEG Demarcated Region of “Serra da Estrela” Cheese EC European Community EDTA potassium-ethylenediaminetetracetic acid EGF epidermal growth factor ERK extracellular-signal-regulated kinase FAO Food and Agriculture Organization of the United Nations FBAT Family-Based Association Tests FL(s) flock(s) Fwd forward g gram (s) G guanine residue GABA �-aminobutyric acid GalR galanin receptor GC glucocorticoid(s) gGH goat growth hormone
xiv
GH growth hormone GH1 growth hormone codified by the ovine GH1 gene copy GH1 growth hormone gene copy of the ovine Gh1 allele Gh1 non-duplicated ovine growth hormone gene allele Gh2 duplicated ovine growth hormone gene allele GH2-N 5’ growth hormone gene copy of the ovine Gh2 allele GH2-N growth hormone codified by the ovine GH2-N gene copy GH2-Z 3’ growth hormone gene copy of the ovine Gh2 allele GH2-Z growth hormone codified by the ovine GH2-Z gene copy GHBP growth hormone binding protein GHMM generalized hidden Markov models GHR growth hormone receptor GHRH growth hormone-releasing hormone GHRHR growth hormone-releasing hormone receptor GHRP growth hormone-releasing peptide GI inhibitory guanyl nucleotide-binding protein GIP glucose-dependent insulin-inducing peptide GLUT1 erythrocyte-type glucose transporter GLUT2 liver-type glucose transporter GLUT4 insulin-responsive glucose transporter GLUT5 intestinal-type glucose transporter GR glucocorticoid receptor Grb10 growth-factor-bound protein 10 Grb2 growth-factor-bound protein 2 GS stimulatory guanyl nucleotide-binding protein ha hectare hGH human growth hormone hGHBP human growth hormone binding protein hGH-N human growth hormone gene copy N hGHRH human growth hormone-releasing hormone HMM hidden Markov models HWE Hardy-Weinberg equilibrium IGF insulin-like growth factor IGFBP insulin-like growth factor binding proteins INE National Institute of Statistics of Portugal JAK Janus tyrosine kinase kb kilo base pair(s) KCl potassium chloride kg kilogram(s) l litre(s) LCR locus control region LPA lysophosphatidic acid M molar MAP mitogen-activated protein MAPK mitogen-activated protein kinase MAS marker assisted selection MEK MAP/ERK kinase mg milligram MgCl2 magnesium chloride MGF mammary gland factor; STAT5
xv
min minute(s) MKP1 MAPK phosphatase 1 mm millimetre(s) MME mixed model equations mRNA messenger ribonucleic acid MspI restriction endonuclease MspI MTDFREML multiple-trait derivative free restricted maximum likelihood MY milk yield My Million years N North NaOH sodium hydroxide nd no date; not determined NEFA non-esterified fatty acids NPY neuropeptide Y NPY-Y neuropeptide Y receptor NRE negative regulatory element nt nucleotide(s) OB leptin ob leptin gene ºC degrees Celsius oGH ovine growth hormone PACAP pituitary adenylate cyclase-activating polypeptide PCR polymerase chain reaction PDGF platelet-derived growth factor PDO protected denomination of origin PDO Protected Denomination of Origin PEPCK phosphoenolpyruvate carboxykinase pGH pig growth hormone PKA protein kinase A PKC protein kinase C PL placental lactogen polyA polyadenylation POU Pit-1/Oct-1/Unc-86 POU1F1 pituitary-specific transcription factor 1 PRL prolactin PRLR prolactin receptor PROP1 prophet of Pou1F1 QTL quantitative trait loci raf ras oncogene RAPD random amplified polymorphic DNA RAR retinoic acid receptor ras ras oncogene REML Restricted Maximum Likelihood Rev reverse RFLP restriction fragment length polymorphism rGH rat growth hormone RNA ribonucleic acid s second(s) SE Standard error SH2 Src homology 2
xvi
Shc SH2-containing protein SHP SH2 domain-containing protein tyrosine phosphatases SIRP�1 signal regulatory protein-�1 SNP single nucleotide polymorphism SOCS suppressors of cytokine signalling Sos son-of-sevenless Sp1 stimulating protein 1 Spi2.1 serine protease inhibitor 2.1 gene SRIF somatotropin release-inhibiting factor; somatostatin SSCP single-strand conformation polymorphism sst SRIF receptor ST somatotropin; used as synonymous of exogenously administrated GH STAT signal transducers and activators of transcription T thymine residue T3 3,5,3’-triiodothyronine; thyroid hormone T3R thyroid hormone receptor TATA box consensus sequence TATAAAT TBE Tris/borate/EDTA TMY total milk yield TRE thyroid hormone response element UTR untranslated region V Volt(s) vs. versus W Watt(s); West WAP whey acidic protein YY1 yin and yang factor 1 Zn-15 zinc finger protein Zn15/Zn16 zinc finger transcription factor

xvii
���� ���� �� �������
One- and three- letter symbols for amino acids: A Ala Alanine C Cys Cysteine D Asp Aspartic acid E Glu Glutamic acid F Phe Phenylalanine G Gly Glycine H His Histidine I Ile Isoleucine K Lys Lysine L Leu Leucine M Met Methionine N Asn Asparagine P Pro Proline Q Gln Glutamine R Arg Arginine S Ser Serine T Thr Threonine V Val Valine W Trp Tryptophan Y Tyr Tyrosine X Xxx undetermined or non-standard aa
Notations: P-7L amino acid residue P (proline) at position -7 of a given protein sequence changed to amino
acid residue L (leucine) G9R amino acid residue G (glycine) at position 9 of a given protein sequence changed to amino
acid residue R (arginine) P89 amino acid residue P (proline) at position 89 of a given protein sequence

�� �
������������
�� �����������
“The beginning of knowledge is the discovery of something
we do not understand.”
Frank Herbert (1920-1986)

�� ������������� ����������............................................................................ 1
I.1 Introduction............................................................................................................................... 3
I.2 Objectives .................................................................................................................................. 4
� � ����������������� ���� �
3
I.1 Introduction
Powerful molecular biology tools are nowadays available that significantly help in
fundamental research and much contribute to technical developments in many scientific
domains. In particular, their impact in animal science has been considerable (Vignal et al.,
2002). These techniques have applications so diverse as fraud control and animal products
traceability (Botter et al., 2003; Brodman and Moor, 2003), genetic diversity characterization
(Rendo et al., 2004) or parentage testing (Werner et al., 2004). It is also possible, through
molecular techniques, to select animals having lower susceptibility to a disease (Brandsma et
al., 2005), or favourable genotype for productive traits such as growth performance in cattle,
sheep and pigs (Johnson et al., 2005; Maj et al., 2006; McRae et al., 2005; Taylor et al., 1998;
Wimmers et al., 2002) or milk production and composition in dairy cattle (Blott et al., 2003;
Kaminski et al., 2005; Shariflou et al., 2000) and sheep (Barillet et al., 2005; De Vries et al.,
2005; Diez-Tascón et al., 2001).
The search for polymorphism in candidate genes thought to affect production traits has
contributed to a better understanding of the basic biology of milk production and composition,
and to intensify selection for these traits, namely in dairy cattle. Hence, effort has been made to
identify candidate gene markers for milk selection within the somatotropic axis (Di Stasio et
al., 2005; Parmentier et al., 1999; Renaville and Portetelle, 1998) with particular emphasis on
growth hormone gene (GH) (Malveiro et al., 2001; Marques et al., 2003; Lagziel et al., 1999).
Various studies have shown that administration of GH to lactating animal increases milk
production and feed conversion efficiency without detrimental effects on milk composition.
The choice of new selection processes linked to the polymorphism at the GH, a
hormone that plays an essential role in milk production, is a possibility for a faster genetic
progress and thus flocks improvement since females can be tested at birth.
Some initial studies on molecular diversity of somatotropic axis’ genes have been
performed in the “Serra da Estrela” ovine breed (Barracosa, 1996; Ramos et al., 2002). The use
of molecular markers to improve milk production could considerably contribute to speed up
genetic progress in this autochthonous breed. Thus, it could have a major impact on the
preservation of the breed as it should help in implementing more efficient breeding programs
leading to increased productivity while maintaining flock size. Breeders would be stimulated to
maintain autochthonous breeds instead of introducing foreign breeds characterised by higher
milk productions but non-adapted to traditional Portuguese grazing conditions. The
4
preservation of native breed would thus be promoted and the biodiversity assured while
providing financial conditions for maintaining farmers in the rural areas.
I.2 Objectives
Throughout the literature review of this work, the principal regulatory mechanisms of
GH gene expression and their effects on milk production in lactating ruminants will be looked
into. Special emphasis will be given to the important roles that GH, or other genes under its
control, plays in the animal body growth until puberty, in mammary gland development during
puberty, gestation and possibly in the early lactation period, and in the homeorhetic control of
female metabolism during gestation and lactation. Some considerations will be made about the
ethical questions linked to the use of exogenous GH or transgenic animals for milk production.
The main objectives of the present work were to identify and characterise nucleotidic
polymorphisms naturally occurring at the oGH gene in "Serra da Estrela" sheep, and associate
them with milk traits in order to evaluate GH as a useful candidate gene for marker assisted
selection. To attain those objectives, both copies of the oGH gene were genotyped, putative
transcription factors binding sites at each copy’s promoter were screened and GH genotypes
and phenotypes were established. Once the putative GH variants were identified, their
associations with milk yield and composition were also evaluated.
��� �
�����������
����� �
“Science is the knowledge of consequences and dependence of one fact upon another.”
Thomas Hobbes (1588–1679)

6
�� ���� ���� � ............................................................................................................. 1
��� ��������������� ................................................................................................ 5
II.1 Serra da Estrela ovine breed.................................................................................................... 7
II.2 The growth hormone gene ....................................................................................................... 9
II.3 Transcription regulation of the GH gene ............................................................................. 11
II.4 Neuroendocrine regulation of GH secretion ........................................................................ 15
II.5 GH signal transduction regulation........................................................................................ 20
II.6 GH and milk production ........................................................................................................ 26
II.7 Transgenic animals expressing an additional GH copy ...................................................... 36
II.8 Impact of GH polymorphisms on productive traits ............................................................ 36
� � ��������������� ��
7
II.1 Serra da Estrela ovine breed
The “Serra da Estrela” ovine breed was considered one of the best Portuguese dairy
breeds in the 40s and one of the best in the world (Alberty cit. by Borrego, 1982). The official
milk records were initiated in the years 1944/45. The Herd Book of the breed started in 1984
and is presently at ANCOSE (National Association of the Breeders of the “Serra da Estrela”
Sheep). The totality of the milk yielded by “Serra da Estrela” ewes is transformed into “Serra
da Estrela” cheese which has a Protected Denomination of Origin (PDO). This cheese is
manufactured exclusively with milk from this ovine breed and is the main agricultural product
of this region, and has a high socio-economical importance for rural populations.
Despite all the efforts towards genetic improvement of the “Serra da Estrela” breed, the
milk yield levels have not increased (Table �II-1) as in foreign breeds and the breed is
nowadays considered a low milk yield breed in the Mediterranean context (Boyazoglu, 1991a
cit by Georgoudis, 1998). Presently, the milk yield potential of the “Serra da Estrela” breed
(148 l/150 d; Carolino et al., 2003b) is much lower than that of Awassi (506 l/214 d; Pollott
and Gootwine, 2001, 2004), Assaf (334 l/173 d; Pollot and Gootwine, 2004) or Lacaune
(270 l/165 d, Barillet et al., 2001; 230 l/145d at the 1st lactation, Rupp et al., 2003) breeds.
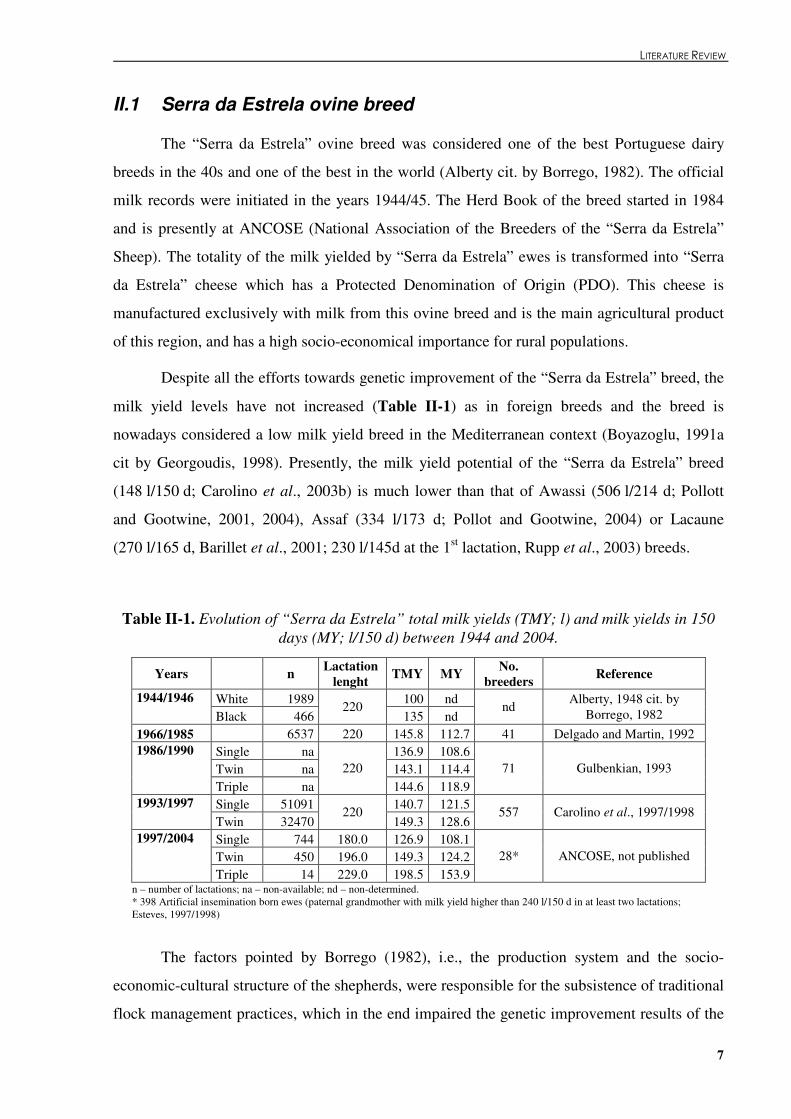
Table �II-1. Evolution of “Serra da Estrela” total milk yields (TMY; l) and milk yields in 150 days (MY; l/150 d) between 1944 and 2004.
Years n Lactation lenght TMY MY No.
breeders Reference
White 1989 100 nd 1944/1946 Black 466
220 135 nd
nd Alberty, 1948 cit. by Borrego, 1982
1966/1985 6537 220 145.8 112.7 41 Delgado and Martin, 1992 Single na 136.9 108.6 Twin na 143.1 114.4
1986/1990
Triple na 220
144.6 118.9 71 Gulbenkian, 1993
Single 51091 140.7 121.5 1993/1997 Twin 32470
220 149.3 128.6
557 Carolino et al., 1997/1998
Single 744 180.0 126.9 108.1 Twin 450 196.0 149.3 124.2
1997/2004
Triple 14 229.0 198.5 153.9 28* ANCOSE, not published
n – number of lactations; na – non-available; nd – non-determined. * 398 Artificial insemination born ewes (paternal grandmother with milk yield higher than 240 l/150 d in at least two lactations; Esteves, 1997/1998)
The factors pointed by Borrego (1982), i.e., the production system and the socio-
economic-cultural structure of the shepherds, were responsible for the subsistence of traditional
flock management practices, which in the end impaired the genetic improvement results of the
�� �������� ����������� ���� � �
8
breed. Indeed, “Serra da Estrela” ovine breeders have seen no substantial improvement on
flocks´ milk yields via the classical genetic selection programme. Simultaneously, ewes’ milk
prices have decreased in the Portuguese market (from € 1.00/l in 1995 to € 0.87/l in 2004; INE,
2006). The joint effect of these two factors could be the loss of economic sustainability of the
traditional ovine production system based on “Serra da Estrela” ewes and the abandonment of
this autochthonous breed in favour of higher yielding foreign breeds such as Lacaune, Assaf
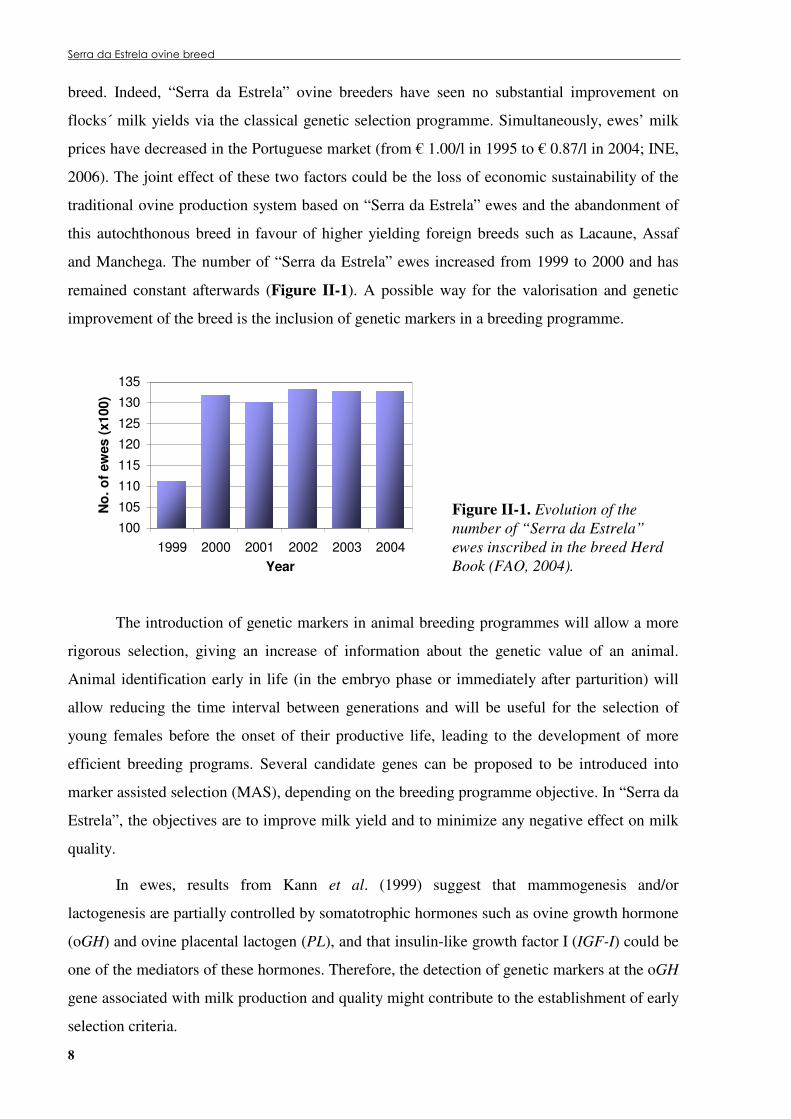
and Manchega. The number of “Serra da Estrela” ewes increased from 1999 to 2000 and has
remained constant afterwards (Figure �II-1). A possible way for the valorisation and genetic
improvement of the breed is the inclusion of genetic markers in a breeding programme.
100
105
110
115
120
125
130
135
1999 2000 2001 2002 2003 2004Year
No.
of e
wes
(x10
0)
Figure �II-1. Evolution of the number of “Serra da Estrela” ewes inscribed in the breed Herd Book (FAO, 2004).
The introduction of genetic markers in animal breeding programmes will allow a more
rigorous selection, giving an increase of information about the genetic value of an animal.
Animal identification early in life (in the embryo phase or immediately after parturition) will
allow reducing the time interval between generations and will be useful for the selection of
young females before the onset of their productive life, leading to the development of more
efficient breeding programs. Several candidate genes can be proposed to be introduced into
marker assisted selection (MAS), depending on the breeding programme objective. In “Serra da
Estrela”, the objectives are to improve milk yield and to minimize any negative effect on milk
quality.
In ewes, results from Kann et al. (1999) suggest that mammogenesis and/or
lactogenesis are partially controlled by somatotrophic hormones such as ovine growth hormone
(oGH) and ovine placental lactogen (PL), and that insulin-like growth factor I (IGF-I) could be
one of the mediators of these hormones. Therefore, the detection of genetic markers at the oGH
gene associated with milk production and quality might contribute to the establishment of early
selection criteria.

� � ��������������� ��
9
II.2 The growth hormone gene
The GH is a member of a multigene family which includes chorionic
somatomammotropin, prolactin (PRL) and PL genes as well as several other genes, all of which
evolved through series of gene duplications. Extensive reviews concerning the evolution,
structure, function and molecular biology of the growth hormone gene family have been
published (Bluet-Pajot et al, 1998; Cooke and Liebhaber, 1995; Chappel and Murphy, 2000;
Forsyth and Wallis, 2002; Miller and Eberhardt, 1983). Thus, the present review will briefly
focus on domestic animals’ GH, with special emphasis on ovine (whenever information exists),
its structure, regulation, metabolic effects and impact on animals’ productive traits.
GH genes have been isolated and characterized in detail in different domestic animals
species such as ovine (Byrne et al., 1987; Guron et al., 1992; Orian et al., 1988), caprine
(Kioka et al., 1989; Yamano et al., 1988; Yato et al., 1988), bovine (Miller et al., 1980;
Woychik et al., 1982), bubaline (Maithal et al., 2001; Verma et al., 1999), porcine (Chen et al.,
1970; Vize and Wells, 1987), equine (Conde et al., 1973), dromedary (Martinat et al., 1990)
and chicken (Zhvirblis et al., 1987).
CDS1 CDS3
intron1 intron2 intron3 intron4
polyA signal1
polyA site1TATA signal1
exon1 exon2 exon3 exon4 exon5
Figure �II-2. Schematic representation of oGH gene structure (2162 bp; Orian et al., 1988).
The oGH gene has been mapped to 11q25 (Hediger et al., 1990) being entirely located
within a 3.9 kb BamHI/HindIII fragment (Byrne et al., 1987). The oGH coding sequence
contains five exons with 71, 161, 117, 162 and 198 bp in length (according to Orian et al.,
1988; see Figure �II-2) interrupted by four introns (with sizes between 227 and 275 bp). Several
highly conserved regions were described at the 5’ end of the gene: a TATAAA sequence
(TATA signal 1) is located at position -30 from the transcription starting point, and a
CATAAAT sequence at position -84. The AATAAA polyadenylation signal (polyA signal 1 at
position 2032) and polyA site1 (at position 2055) are present at the 3’-untranslated region
(3’-UTR) of the gene.
Signal peptide Mature peptide
����� ������� ���������� � �
10
The oGH predicted amino acid sequence, established by Orian et al. (1988) from an
ovine pituitary genomic library, consists of a signal peptide composed of 26 amino acids in
length and a mature peptide of 191 amino acids (Swiss-Prot accession no. P01247). The GH
amino acid sequence is 99 % identical between ovine, caprine, bovine and bubaline, but differs
markedly from non ruminant sequences [about 88% identical to pig GH (pGH) and 65% to
human GH (hGH)].
In ovine, the GH family genes are expressed in the anterior pituitary somatotrophs
(Sartin et al., 1996) and in the trophectoderm and syncytial placenta cells in a temporal-specific
way (Lacroix et al., 1996; 1999).
II.2.1 oGH gene duplication
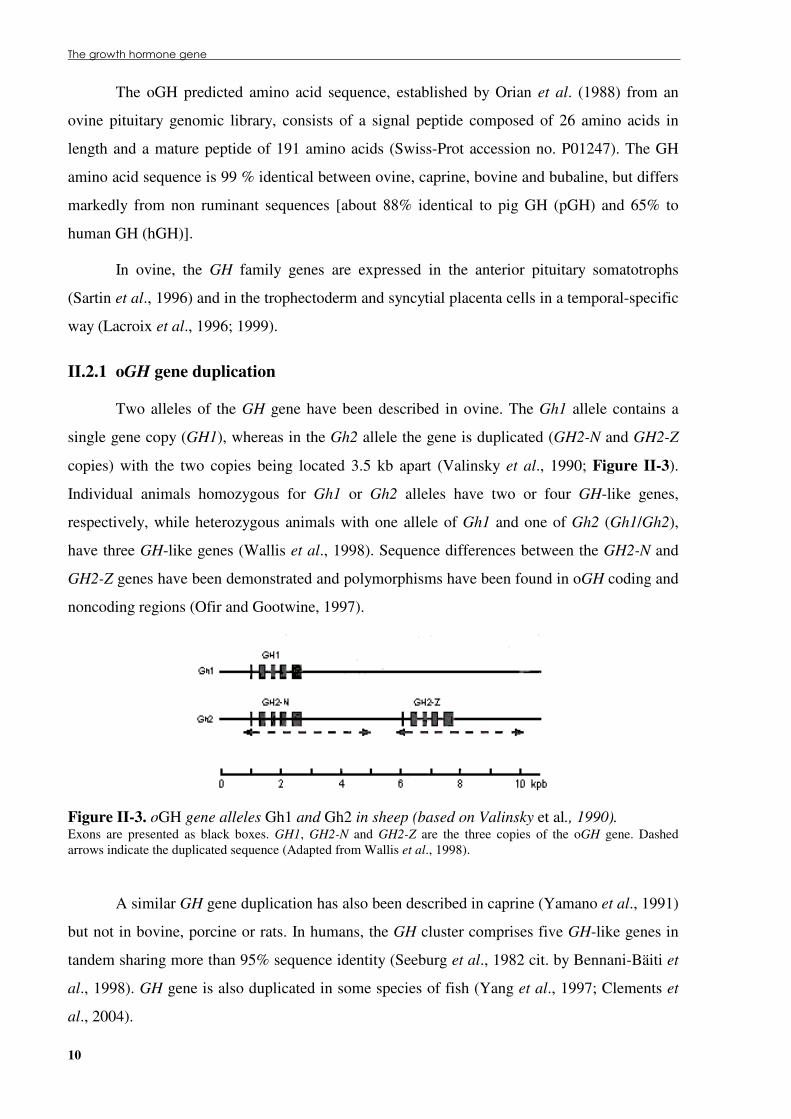
Two alleles of the GH gene have been described in ovine. The Gh1 allele contains a
single gene copy (GH1), whereas in the Gh2 allele the gene is duplicated (GH2-N and GH2-Z
copies) with the two copies being located 3.5 kb apart (Valinsky et al., 1990; Figure �II-3).
Individual animals homozygous for Gh1 or Gh2 alleles have two or four GH-like genes,
respectively, while heterozygous animals with one allele of Gh1 and one of Gh2 (Gh1/Gh2),
have three GH-like genes (Wallis et al., 1998). Sequence differences between the GH2-N and
GH2-Z genes have been demonstrated and polymorphisms have been found in oGH coding and
noncoding regions (Ofir and Gootwine, 1997).
Figure �II-3. oGH gene alleles Gh1 and Gh2 in sheep (based on Valinsky et al., 1990). Exons are presented as black boxes. GH1, GH2-N and GH2-Z are the three copies of the oGH gene. Dashed arrows indicate the duplicated sequence (Adapted from Wallis et al., 1998).
A similar GH gene duplication has also been described in caprine (Yamano et al., 1991)
but not in bovine, porcine or rats. In humans, the GH cluster comprises five GH-like genes in
tandem sharing more than 95% sequence identity (Seeburg et al., 1982 cit. by Bennani-Bäiti et
al., 1998). GH gene is also duplicated in some species of fish (Yang et al., 1997; Clements et
al., 2004).

� � ��������������� �
11
Sequence differences at the expressed protein level have been demonstrated. Lacroix et
al. (1996) detected two GH-like proteins in the ovine placenta: one identical to the amino acid
sequence deduced from the nucleotide sequence published by Orian et al. (1988) which is the
pituitary product of the oGH gene (copy GH1 or GH2-N); the other, is the product of the
oGH2-Z copy gene, differs from the first in three amino acids: one at the signal peptide (P-7L),
a second at the border of helix1 (G9R) of the GH molecule and a third one (G63S) at a loop
structure of the binding site 1 (described in hGH; de Vos et al., 1992; see �II.4).
II.3 Transcription regulation of the GH gene
Within the numerous transcription factors acting upon the anterior pituitary gland
(Savage et al., 2003), several play a determinant role in somatotroph development and in the
GH gene regulation. Binding sites to several of those transcription factors were disclosed by
DNase I footprinting experiments, methylation-interference assays and band-shift analysis
mainly at hGH, rat GH (rGH) and bovine GH (bGH). Putative binding sites could also be found
at the oGH gene promoter (Figure �II-4).
-200 AGTGGAGAGG GGATGATGAC GAGCCTGGGG GACATGACCC CAGAGAAGGA TRE -150 ACGGGAACAG GATGAGTGAG AGGAGGTTCT AAATTATCCA TTAGCACAGG Sp1 POU1F1(d) NRE(YY1) Zn-15... -100 CTGCCAGTGG TCCTTGCATA AATGTATAGA GCACACAGGT GGGGGGAAAG ...Zn-15 POU1F1(p) CAT box -50 GGAGAGAGAA GAAGCCAGGG TATAAAAAGG GCCCAGCAGA GACCAATTCC TATA box 1 AGGATCCCAG GACCCAGTTC ACCAGACGAC TCAGGGTCCT GCTGACAGCT M M A A 51 CACCAGCTAT GATGGCTGCA GGTAAGCTCA CGAAAATCCC CTCCATTAGC 101 GTGTCCTAAG GGGGTGATGC GGGGGGCCCT GCCGATGGAT GTGTCCACAG 151 CTTTGGGTTT TAGGGCTTCT GAATGTGAAC ATAGGTATCT GCACCCGACA 201 TTTGGCCAAG TTTGAAATGT TCTCAGTCCC TGGAGGGAAG GGCAGGCGGG GR
Figure �II-4. Regulatory sequences at the promoter of the oGH gene. The sequence of the sense strand of the oGH promotor region (from Orian et al., 1988) is shown together with the putative locations of the following transcription factors’ binding sites (boxed bold sequences): TRE (T3 response element), Sp1 (stimulating protein 1), POU1F1(d) and POU1F1(p) (distal and proximal pituitary-specific transcription factor 1), NRE (negative regulatory element), YY1 (yin and yang factor 1), Zn-15 (zinc finger protein) and GR (glucocorticoid receptor). CAT and TATA boxes are also shown. The exon 1 sequence is underlined, and the first four NH2-terminal amino acids of the signal peptide are shown in blue.
� ���� ������� ��������������������� � �
12
Despite GH promoters’ species-specific organization (Chuzhanova et al., 2000)
throughout vertebrate evolution, some common features subsist. The following sub-sections
will briefly focus on the general action of individual transcription factors (with special
emphasis on POU1F1) and on the synergic action between them that lead to the transcriptional
control of GH gene expression.
II.3.1 Pituitary-specific transcription factor (POU1F1)
Two pituitary-specific transcription factor (POU1F1, also called Pit-1, GHF-1, PUF-1
or GC-1) binding sites are present in the oGH promoter at position -118 (ATTATCCAT in
agreement with the consensus sequences; Ingraham et al., 1988; Rhodes and Rosenfeld, 1996)
and at position -87 [TTGCATAA; differs at 1 nt from hGH (Lemaigre et al., 1990) and at 2 nt
from rGH (Kim et al., 1996)]. In addition to GH promoter POU1F1 binding sites, the presence
of at least two POU1F1 binding sites within the chromatin Dnase I hypersensitive sites (HS I, II
– F14 segment) of the locus control region (LCR; Jones et al., 1995) located -14.5 kb upstream
of the hGH-N gene seem to be fundamental for the appropriate pituitary hGH-N gene
expression in transgenic mouse (Shewchuk et al., 1999). Whether this LCR is also important
for GH expression in transgenic sheep with additional GH copies was not discussed (Adams et
al., 2002, 2005).
POU1F1 is a pituitary-specific POU-homeodomain protein (Ingraham et al., 1988)
essential for thyrotrophs, somatotrophs and lactotrophs differentiation and survival (Li et al.,
1990). It regulates the GH gene expression activation at the somatotrophs and its repression at
the lactotrophs (Scully et al., 2000).
In the early embryonic life following the formation of Rathke’s pouch, the primordium
of the pituitary gland, POU1F1 expression is activated by the Prophet of POU1F1 (PROP1)
binding to POU1F1 early enhancer (Sornson et al., 1996), possibly not alone but with the
synergic action of vitamin D receptor and retinoic acid receptor (RAR) binding (Cohen et al.,
1999; DiMattia et al., 1997). As soon as levels of PROP1 decay, POU1F1 expression changes
to an auto-regulatory pathway (Rhodes et al., 1993 cit by Sornson et al., 1996).
POU1F1 expression is dependent on its auto-regulation as POU1F1 promoter contains
several binding sites to POU1F1 at its proximal and distal regions (Rhodes et al., 1993 cit by
DiMattia et al., 1997) and is age (DiMattia et al., 1997) and gender (Gonzalez-Parra et al.,
1996) dependent. Distinct signal-transduction pathways could thus regulate POU1F1 activity.
These pathways are mediated by intracellular levels of cyclic adenosine 3’,5’-monophosphate
� � ��������������� �
13
(cAMP) or by mitogen-activated protein kinases (MAPK) and/or protein kinase A (PKA)
activities in response to the epidermal growth factor (EGF) or insulin and involve a co-
repressor complex containing the nuclear receptor co-repressor N-CoR/SMRT, mSin3A/B and
histone deacetylases, and a co-activator complex containing cAMP-response element binding
protein (CREB) and p/CAF (Xu et al., 1998).
POU1F1 activity depends also on other peptides, e.g. activin inhibits POU1F1 binding
to GH promoter and consequently GH expression (Struthers et al., 1992). This effect is
mediated by an increase in POU1F1 phosphorylation which also decreases POU1F1 stability
(Gaddy-Kurten and Vale, 1995).
Mutations at the POU1F1 gene interrupt the normal development of the anterior
pituitary gland (dwarf genotype; Li et al., 1990; Pfäffle et al., 1992; 1993; Aarskog et al., 1997)
and may lead to combined pituitary hormone deficiency (Cohen et al., 1995; Vallette-Kasic et
al., 2001). POU1F1 genotypes affect milk yield in humans (Pfäffle et al., 1996), milk yield and
conformational traits in bovine (Renaville et al., 1997), and plasma GH and PRL levels (Sun et
al., 2002) and growth and carcass traits in porcine (Stancekova et al., 1999; Yu et al., 1995).
However, in other studies no associations were found between productive traits and POU1F1
genotypes, e.g., with meat production traits in Piemontese bovine breed (Di Stasio et al., 2002).
II.3.2 Thyroid hormone and retinoic acid receptors response elements
One 3,5,3’-triiodothyronine receptor (T3R) response element (TRE)/ retinoic acid
receptor (RAR) element is present in the oGH promoter at position -172 (GGGACATGACCC
identical to bGH; Brent et al., 1988 cit. by Williams et al., 1992). The presence of such an
element near the POU1F1 binding site is concomitant with the finding in rat, that GH
transcription is enhanced by straight cooperation between T3R and RAR and POU1F1 via
direct protein-protein interaction (Palomino et al., 1998).
II.3.3 Glucocorticoid receptor (GR)
A glucocorticoid receptor (GR) site is present in the oGH promoter at position +218
(TGTTCT) within the intron 1 as in the hGH (Moore et al., 1985) and in the goat GH (gGH;
Kioka et al., 1989) promoters. Several works conducted in rat (reviewed by Theill and Karin,
1993) and in humans (Isaacs et al., 1987 cit. by Theill and Karin, 1993) reported that the GH
gene expression was stimulated by glucocorticoids (GCs) and that GCs promote hGH mRNA
stability (Paek and Axel, 1987 cit. by Theill and Karin, 1993). However, familial GC
� ���� ������� ��������������������� � �
14
deficiency has been associated with tall stature in human (Elias et al., 2000 cit. by van der
Eerden et al., 2003), which is in accordance with findings that GC inhibits GH release in
pituitary (Allen, 1996 and Luo and Murphy, 1989 cited by van der Eerden et al., 2003). Thus,
considering the conflicting results obtained in the referred two species and that regulation of
GH transcription by GR was not investigated in ovine, the real impact of GCs on oGH gene
remains to be clarified.
II.3.4 Ubiquitous transcription factors
II.3.4.1 Stimulating protein 1 (Sp1) One stimulating protein 1 (Sp1) binding site is present in the oGH promoter at position
-134 [TGAGAGG; different in 1 nt from rGH (Kim et al., 1996)]. This site is near to the
POU1F1 distal binding site and some authors suggested that Sp1 and POU1F1 binding could
be mutually exclusive (Lemaigre et al., 1990). Nevertheless, Sp1 is thought to positively
influence GH expression.
II.3.4.2 Zinc finger protein (Zn15/Zn16) A zinc finger protein (Zn15/Zn16) binding site is present in the oGH promoter at
position -108 (AGCACAGGCTGCCAGTGG; Lipkin et al., 1993 cit by Das et al., 1996).
Zn15/Zn16 is a member of the Cys/His zinc finger transcription factor superfamily which can
act synergistically with POU1F1 to enhance GH expression (VanderHeyden et al., 2000).
II.3.5 Silencer element
A negative regulatory element (NRE; sequence TCCATTAGC at position -114) with
sequence similar to the yin and yang factor 1 (YY1) binding site, described in bovine (Park and
Roe, 1996a, 1996b) and red deer (Lioupis et al., 1997), is present in the oGH promoter. Park
and Roe’s results (1996b) suggest that bGH expression is negatively regulated by YY1 or by a
very similar YY1 homolog via NRE binding.
The joint action of the tissue-specific POU1F1 trans-acting factor and the ubiquitous
factors referred before (and possibly others) should contribute to the tissue specific
transcription of oGH gene, as it has been observed in other species.

� � ��������������� �
15
II.4 Neuroendocrine regulation of GH secretion
Regulatory pathways of GH expression are not straightforward. They involve chain
reactions whereby a peptide could simultaneously regulate expression of several genes.
Transcription regulation of GH gene was addressed in the previous section, but many of those
transcription factors are actively involved in the regulation of other peptides which in turn
regulate GH expression. An example is POU1F1: it regulates GH-releasing hormone receptor
(GHRHR) gene expression, and thus indirectly GH secretion by GH-releasing hormone
(GHRH) signalling (Godfrey et al., 1993 cit by DiMattia et al., 1997).
Pituitary somatotroph cells possess receptors to GHRH, somatostatin (somatotropin
release-inhibiting factor, SRIF), pituitary adenylate cyclase-activating polypeptide (PACAP)
and GH secretagogue (ghrelin) peptides that control the GH expression at those cells.
Hypothalamic neurons secreting GHRH are located in the arcuate nucleus and those
secreting SRIF are in the periventricular nucleus and arcuate nucleus (Leshin et al., 1994 cit by
McMahon et al., 2000). GHRH and SRIF could mutually inhibit each other’s synthesis in the
arcuate nucleus neurons, but GHRH and SRIF syntheses and consequently GH regulation could
be modulated also by neuropeptides such as leptin, insulin and IGF-1, dopamine,
norepinephrine, serotonin, thyrotropin-releasing hormone, acetylcholine, neuropeptide Y
(NPY) and galanin (see McMahon et al., 2001). Their influence upon GH synthesis and
secretion of some of those peptides will be briefly discussed.
II.4.1 Growth hormone-releasing hormone (GHRH)
GHRH is structurally related to the glucagon superfamily, which include also PACAP,
glucagons and glucose-dependent insulin-inducing peptide (GIP) (Cummings et al., 2002; for
review see Mayo et al., 2003).
GHRH stimulates equally the synthesis and the GH pulse secretion in sheep. Indeed, it
was observed a significant association between GHRH and GH peaks, but not between SRIF
and GH peaks in unanesthetized ovariectomized ewes (Frohman et al., 1990). Moreover, other
studies reported an increase in plasma GH levels when lambs were injected with a GHRH
analogue with increased feed conversion and leaner carcasses (Godfredson et al., 1990), and
recently the injection of a myogenic expression GHRH plasmid DNA into Inner Mongolia fuzz
lambs resulted in higher GH levels and in organomegaly (Meng et al., 2004).
������������������ ���������������
16
The GHRH-stimulated GH release in the somatotrophs is presumably cAMP- and
Ca2+-dependent in sheep (Sartin et al., 1996). In vitro results suggest that Ca2+ pathway
presumably acts via calmodulin activation and concomitant/subsequent activation of PKA
which promotes GH release induced by cAMP (Sartin et al., 1996; for a review see Bluet-Pajot
et al., 1998).
II.4.2 Somatostatin (SRIF)
SRIF is a hypothalamic cyclic polypeptide with two bioactive isoforms (SRIF-14 and
SRIF-28; Møller et al., 2003) that negatively regulate GH release (Davis, 1975; Kazmer et al.,
2000) by SRIF receptors (sst-1 and sst-2) activation. Besides GH, an extensive list of hormones
is inhibited by SRIF; among them are PRL, insulin, thyroid-stimulating hormone and almost all
hormones from the gastrointestinal tract, inhibiting also the nutrient absorption at intestinal
level (reviewed by Møller et al., 2003).
SRIF binds to its receptor activating the cAMP and phosphoinositide signal
transduction pathways (Møller et al., 2003). Specifically and in opposition to what happens
when GHRH binds to its receptor, when SRIF binds to guanyl nucleotide-binding proteins
(GI-proteins) linked cell surface receptor, the activity of the adenylate cyclase is reduced
resulting in lower levels of cAMP and in PKA inhibition. PKA inhibition reduces CREB
phosphorylation, a key step in POU1F1 transcription regulation. SRIH and GHRH signal
transduction pathways converge at Ca2+ ion channels with presumably metabolic antagonist
effect.
Under insulin hypoglycaemia conditions, SRIF secretion increases and in response, GH
levels decrease in ewes (Frohaman et al., 1990). However, when lactating ewes were
immunized against SRIF (Sun et al., 1990), no GH level change was observed yet milk yield
increased. It was suggested that more nutrients reach the mammary gland in response to the
blocking of the inhibitory action of SRIF upon the gastrointestinal tract and consequent
increase in nutrient absorption. In growing cattle also immunized against SRIF, Ingvartsen and
Sejrsen (1995 cit. by Ingvartsen and Andersen, 2000) observed a somehow similar effect as the
animals grew faster and, despite a higher feed intake, the feed conversion ratio improved.
II.4.3 Pituitary adenylate cyclase-activating polypeptide (PACAP)
PACAP is a neuropeptide expressed in the central nervous system acting
simultaneously as a neurohormone and a neurotransmitter (Montero et al., 2000). It is also
� � ��������������� �
17
expressed within the gonads (reviewed by Moretti et al., 2002) and the adrenal gland (Ghatei et
al., 1993 cit by Cummings et al., 2002). In ovine, PACAP was found to stimulate the
accumulation of cAMP in the pituitary cells (Miyata et al., 1989 and 1990 cit. by Cummings et
al., 2002) similarly to what occurs after GHRH stimulation. Moreover, in meal-fed Holstein
steers injected with PACAP before feeding, the GH peak levels increased in serum. It was thus
postulated that PACAP induces GH secretion maybe in association with GHRH (Radcliff et al.,
2001).
II.4.4 Ghrelin
Ghrelin (also known as GH secretagogue) is a growth hormone-releasing acylated
peptide synthesised in the oxyntic glands of the stomach and intestine (Date et al., 2000). It
stimulates GH secretion in small ruminants (Hayashida et al., 2001; Sugino et al., 2004) by
activating ghrelin receptor (reviewed by Davenport et al., 2005) in the pituitary. It is thought
that ghrelin may have a role in feeding regulation in domestic animals and thus in energy
homeostasis, as it was suggested by the results of studies in ghrelin knockout mice (Wortley et
al., 2005) and in fat and lean lines of sheep (French et al., 2006).
Ghrelin and GHRH act synergistically to promote GH release. Moreover, GHRH and
GH-releasing peptide 2 (GHRP-2; a synthetic secretagogue) were shown to regulate their
receptor synthesis in a time-dependent way in ovine pituitary cell cultures, playing also an
important role in GH, GHRHR, POU1F1, sst-1 and sst-2 expression and GH synthesis (Yan et
al., 2004). Ghrelin regulation of GH secretion could also be mediated by the activation of the
NPY-Y1 receptor pathway (Shintani et al., 2001).
The first studies with synthetic secretagogues (GHRP-6 and more recently GHRP-2)
showed that secretagogues enhance GH secretion by a different via than that used by GHRH.
GH-release via ghrelin involves inhibition of K+ channels and somatotroph depolarization with
consequent Ca2+ channel rearrangement. However, GHRH and ghrelin pathways communicate
trough signalling pathways involving intricate ionic exchanges (Chen et al., 1996 cit. by
Casanueva et al., 1999).
II.4.5 Leptin
Leptin (or OB protein) is the product of the ob gene expression in the adipose tissue
(Zhang et al., 1994 cit. by Schwartz et al., 1996) and placenta (Anthony et al., 2001). The
leptin levels are positively correlated with body fat mass (Delavaud et al., 2002), energy intake
�� ��������������� ����������������������� � �
18
level (Marie et al., 2001; Reist et al., 2003), β-adrenergic stimulation (Chilliard et al., 2000)
and negatively correlated with photoperiod in sheep (Marie et al., 2001; Clarke et al., 2003).
Leptin receptors are expressed in ewe hypothalamus, anterior pituitary and adipose tissues
(Dyer et al., 1997c), and mammary gland (Laud et al., 1999), and in bovine adrenal medullary
cells (Yanagihara et al., 2000). Main effects of leptin were reviewed by Chilliard et al. (2001),
Ingvartsen and Boisclair (2001) and Faggioni et al. (2001).
A high level of leptin, which could be observed after a meal or in obese animals, was
shown to physiologically regulate food intake by decreasing appetite (Barb et al., 1998). At the
same time, high levels of leptin increase energy demands and, to meet those demands, there is
an increased fatty acid oxidation, i.e., lipolysis at the adipose tissue, or alternatively a decrease
in insulin-stimulated lipogenesis (Ramsay, 2001). However, in other studies this effect was not
observed (Newby et al., 2001). Those metabolic events are mediated by modification at
hormonal levels, namely GH, catecholamines and T3 augment, and insulin and GCs decline
(see review by Chilliard et al., 2001).
Leptin acts upon the expression of hypothalamic neuropeptides involved in energy
homeostasis. It was observed that after leptin injection NPY expression decreased in the
arcuate nucleus and corticotrophin releasing hormone increased in the paraventricular nucleus
in normal Long-Evans rats (Schwartz et al., 1996). This could cause GH levels to decrease
which mimic the observed decrease of the GH levels after meals in sheep (Matsunaga et al.,
1999) or, following another via, could decrease GHRH-stimulated GH expression and at the
same time increase basal GH as it was observed in vitro in ovine pituitary cells (Roh et al.,
1998) and plasmatic GH in vivo without altered GH pulse frequency (Nagatani et al., 2000).
Leptin regulates short- and long-term homeostasis, thus some of the opposite effects
observed concerning GH expression regulation could reflect complex feedback mechanisms
that support the return to a steady levels of body fat after episodes of mobilization/deposition of
fat tissue.
II.4.6 Other GH-Regulating Neuropeptides
II.4.6.1 Catecholamines Two catecholamines are particularly important in GH regulation in domestic animals:
dopamine and norepinephrine.
Dopamine has been found to inhibit GH secretion via D1- and D2-like dopamine
receptors. Stimulation of dopamine D1-receptors and subsequent enhanced activity of

� � ��������������� �
19
periventricular SRIF neurons increases SRIF secretion into hypophysial-portal vessels and
GHRH-induced release of GH into blood decreases in steers (McMahon et al., 1998; West et
al., 1997). In addition, dopamine or D2-receptors activation inhibit GHRH-induced GH
secretion and decrease cAMP levels in sheep pituitary cells culture (Law et al., 1984).
Norepinephrine effects are mediated by its �1-, �2- and β-adrenergic receptors. It was
observed that GH secretion is inhibited by �1- and stimulated by �2-adrenergic receptors
activation in rat (Willoughby et al., 1993). �2-adrenergic receptor activation also stimulated GH
secretion in ovine (Soyoola et al., 1994 cit. by McMahon et al., 2001) and bovine (Gaynor et
al., 1993). Furthermore, pulse GH secretion before feeding and basal GH levels post-feeding
are apparently mediated by �2-adrenergic receptor stimulation in Holstein steers (Gaynor et al.,
1993). β-adrenergic receptors activation was found to inhibit GH secretion hypothetically by
SRIF-enhanced secretion in ewes (Thomas et al., 1994).
II.4.6.2 Neuropeptide Y (NPY) NPY is an orexigenic peptide from the pancreatic peptide family. In ovine, the
expression of the NPY-Y1 receptor was seen within the arcuate nucleus and paraventricular
nucleus of the hypothalamus, the dentate gyrus of the hippocampus and in pancreatic, anterior
pituitary, and adipose tissues, and the expression of the NPY-Y2 receptor within hippocampus
and within pancreatic tissue (Dyer et al., 1997a).
Administration of NPY was shown to strongly increase GH secretion in sheep
(Morrison et al., 2003) and cattle (Garcia et al., 2004; Thomas et al., 1999). However, the
effect of NPY on GH secretion was attenuated if cows were primarily injected with leptin
(Garcia et al., 2004). Furthermore, in a comparative study, underfed ewes presented higher
number of immunoreactive cells for NPY at the arcuate nucleus and median eminence, higher
density of NPY terminal fields at arcuate nucleus and pre-optic area, paraventricular nucleus,
and higher plasma levels of GH than well-fed ewes (Barker-Gibb and Clarke, 1996). Taken
together, those observations suggest that NPY is a mediator signal reporting overall body
energy status to the brain, probably within an insulin-leptin-NPY pathway as hypothesised by
Dyer et al. (1997b), where ghrelin could also be involved (Shintani et al., 2001).
II.4.6.3 Galanin Galanin neurons were found in several regions of the hypothalamus. Galanin has two
subtypes of receptors: GalR1 and GalR2 (Wang et al., 1998 cit. by McMahon et al., 2001). In
pituitary slices of young male calves, galanin was shown to have a significant stimulatory effect
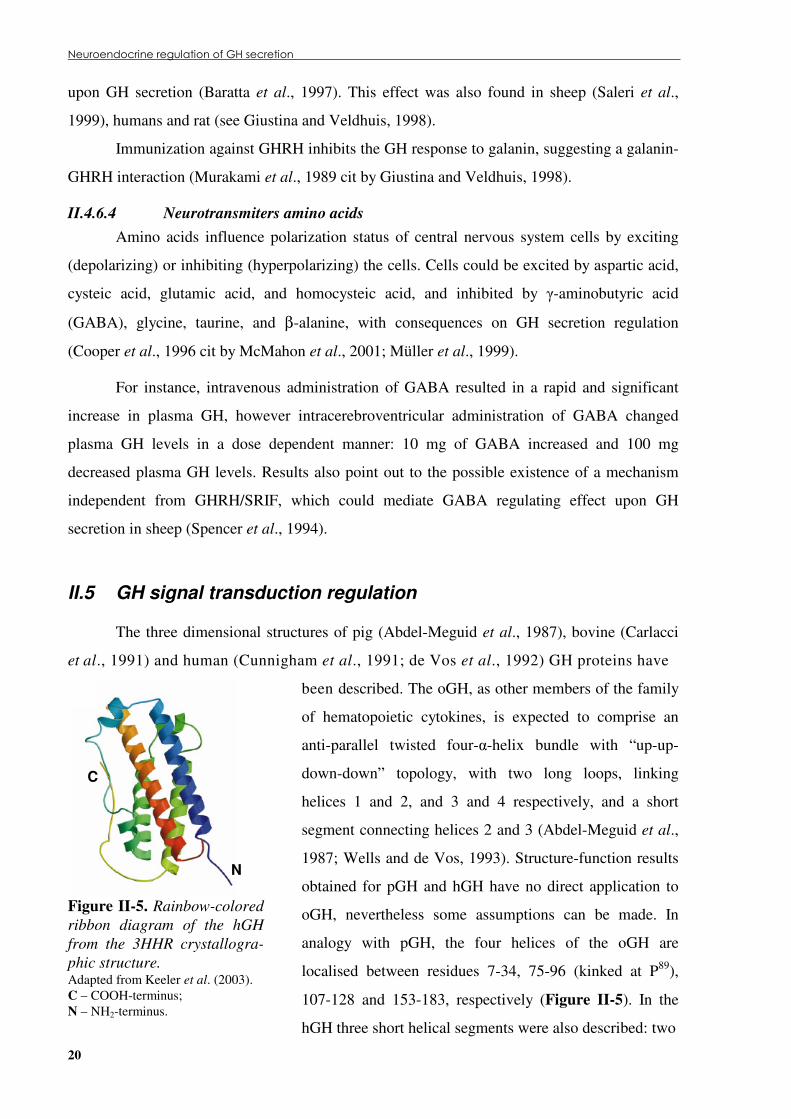
������������������ ���������������
20
upon GH secretion (Baratta et al., 1997). This effect was also found in sheep (Saleri et al.,
1999), humans and rat (see Giustina and Veldhuis, 1998).
Immunization against GHRH inhibits the GH response to galanin, suggesting a galanin-
GHRH interaction (Murakami et al., 1989 cit by Giustina and Veldhuis, 1998).
II.4.6.4 Neurotransmiters amino acids Amino acids influence polarization status of central nervous system cells by exciting
(depolarizing) or inhibiting (hyperpolarizing) the cells. Cells could be excited by aspartic acid,
cysteic acid, glutamic acid, and homocysteic acid, and inhibited by �-aminobutyric acid
(GABA), glycine, taurine, and β-alanine, with consequences on GH secretion regulation
(Cooper et al., 1996 cit by McMahon et al., 2001; Müller et al., 1999).
For instance, intravenous administration of GABA resulted in a rapid and significant
increase in plasma GH, however intracerebroventricular administration of GABA changed
plasma GH levels in a dose dependent manner: 10 mg of GABA increased and 100 mg
decreased plasma GH levels. Results also point out to the possible existence of a mechanism
independent from GHRH/SRIF, which could mediate GABA regulating effect upon GH
secretion in sheep (Spencer et al., 1994).
II.5 GH signal transduction regulation
The three dimensional structures of pig (Abdel-Meguid et al., 1987), bovine (Carlacci
et al., 1991) and human (Cunnigham et al., 1991; de Vos et al., 1992) GH proteins have
Figure �II-5. Rainbow-colored ribbon diagram of the hGH from the 3HHR crystallogra-phic structure. Adapted from Keeler et al. (2003). C – COOH-terminus; N – NH2-terminus.
been described. The oGH, as other members of the family
of hematopoietic cytokines, is expected to comprise an
anti-parallel twisted four-�-helix bundle with “up-up-
down-down” topology, with two long loops, linking
helices 1 and 2, and 3 and 4 respectively, and a short
segment connecting helices 2 and 3 (Abdel-Meguid et al.,
1987; Wells and de Vos, 1993). Structure-function results
obtained for pGH and hGH have no direct application to
oGH, nevertheless some assumptions can be made. In
analogy with pGH, the four helices of the oGH are
localised between residues 7-34, 75-96 (kinked at P89),
107-128 and 153-183, respectively (Figure �II-5). In the
hGH three short helical segments were also described: two
N
C
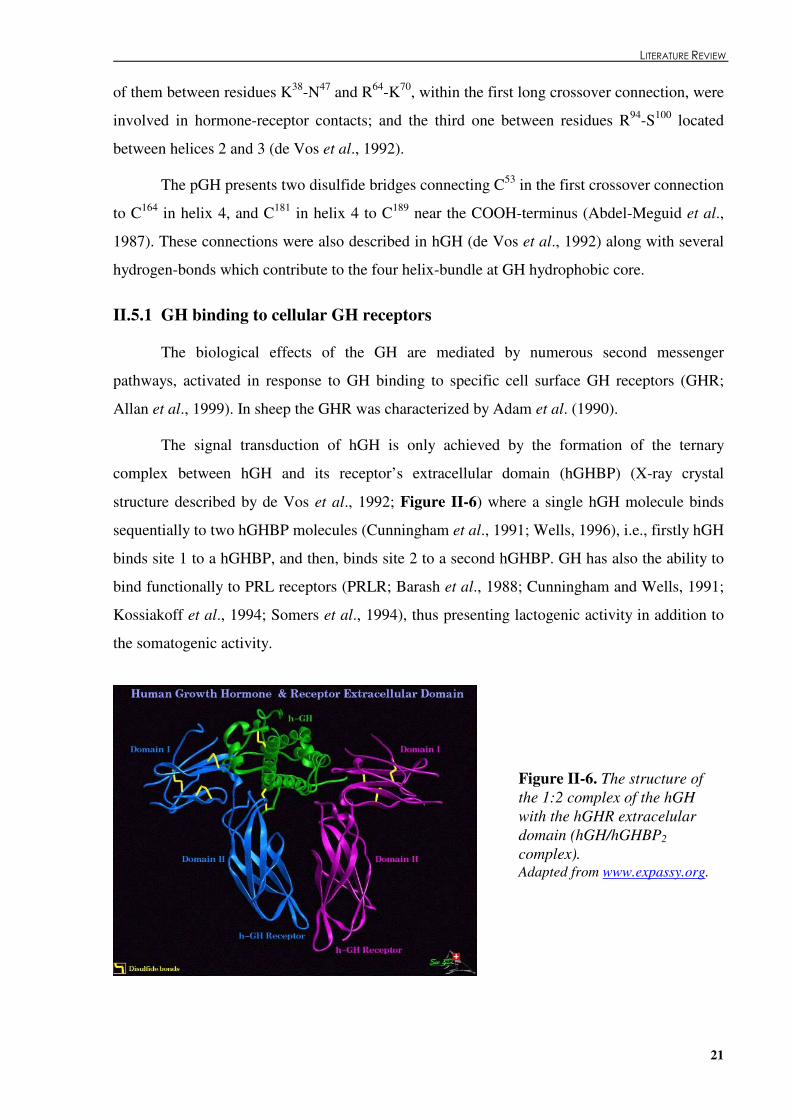
� � ��������������� ��
21
of them between residues K38-N47 and R64-K70, within the first long crossover connection, were
involved in hormone-receptor contacts; and the third one between residues R94-S100 located
between helices 2 and 3 (de Vos et al., 1992).
The pGH presents two disulfide bridges connecting C53 in the first crossover connection
to C164 in helix 4, and C181 in helix 4 to C189 near the COOH-terminus (Abdel-Meguid et al.,
1987). These connections were also described in hGH (de Vos et al., 1992) along with several
hydrogen-bonds which contribute to the four helix-bundle at GH hydrophobic core.
II.5.1 GH binding to cellular GH receptors
The biological effects of the GH are mediated by numerous second messenger
pathways, activated in response to GH binding to specific cell surface GH receptors (GHR;
Allan et al., 1999). In sheep the GHR was characterized by Adam et al. (1990).
The signal transduction of hGH is only achieved by the formation of the ternary
complex between hGH and its receptor’s extracellular domain (hGHBP) (X-ray crystal
structure described by de Vos et al., 1992; Figure �II-6) where a single hGH molecule binds
sequentially to two hGHBP molecules (Cunningham et al., 1991; Wells, 1996), i.e., firstly hGH
binds site 1 to a hGHBP, and then, binds site 2 to a second hGHBP. GH has also the ability to
bind functionally to PRL receptors (PRLR; Barash et al., 1988; Cunningham and Wells, 1991;
Kossiakoff et al., 1994; Somers et al., 1994), thus presenting lactogenic activity in addition to
the somatogenic activity.
Figure �II-6. The structure of the 1:2 complex of the hGH with the hGHR extracelular domain (hGH/hGHBP2 complex). Adapted from www.expassy.org.

�������������� �������� ����� � ��
22
The hGH amino acid residues involved in hGH/hGHBP binding sites 1 and 2 have been
elucidated by Cunningham et al. (1991) and de Vos et al. (1992): site 1 - residues of the helix
1, of the short helical segment connecting helices 1 and 2 and more than half of the residues of
the helix 4; site 2 - 13 residues across NH2-terminus, the first residues of helix 1 and some
residues of helix 3. In a subsequent review of the structure and function of the hGH (Wells and
de Vos, 1993), the authors reported that only part of the hGH residues involved in
hGH/hGHBP contact interface are actually functional epitopes, i.e., residues whose substitution
generate a twofold reduction in binding activity. It has also been emphasised the hypothesis that
many of the hydrophilic contacts are functionally silent or deleterious. Recently, Kouadio et al.
(2005) showed by shotgun alanine scanning that minimal binding sites are necessary for
functional hGH binding to its receptor. The authors also demonstrated that the stability of the
ternary hGH/hGHBP2 complex depends on the hormone – receptor affinity for binding site 2.
The extracellular domain of the hGHR covers two partial domains (Figure �II-6): the
NH2-terminal domain I and the COOH-terminal domain II β-sheets. From the crystallographic
structure of the hGH/hGHBP2 complex, it is clear that the site 1 at hGH is larger than site 2,
and that hGHBPs’ binding residues are mostly the same, i.e. S145, H150, D152, Y200 and S201,
showing also, similar structures (de Vos et al., 1992).
GH mutations might prevent receptor dimerization [e.g. hGH(G120R); Ultsch and de
Vos, 1993; Clackson et al., 1998] and cause diseases and/or growth disorders such as short
stature in humans by bio-inactivation of GH (Takahashi et al., 1997). However, mutations have
been described that do no block GH/GHR binding activity, e.g. the ovine GH molecule with
deletion of residues 33 through 46 continues to show significant GHR-binding activity (Sami et
al., 1999). Another GH mutant molecule such as the hGH44-191 has been reported to retain high
affinity to lactogenic receptors (PRLR) but not to the somatogenic ones (GHR) (Haro et al.,
1996).
II.5.2 GH-dependent activation of JAK2
When GH binds to cell surface, it induces GHR homodimerization and consequent
conformational changes that trigger GHR association with the intracellular Janus tyrosine
kinase 2 (JAK2; Argetsinger et al., 1993), which phosphorilates both GHR and JAK2 itself,
creating high-affinity binding sites for several signalling molecules with Src homology 2 (SH2)
and phosphotyrosine binding sites (Carter-Su et al., 2000). The tyrosine residues of the GHR
necessary for association and activation of the JAK2 were identified in Chinese hamster ovary
� � ��������������� �
23
cells expressing wild-type or truncated GHR (VanderKuur et al., 1994) and also in humans
(Hansen et al., 1996) and pigs (Wang et al., 1996) by GHR mutational studies (Figure �II-7).
Activation of JAK2 is the initial event for GHR signal, mediating several biological responses
in the cells, e.g.: stimulation of tyrosyl phosphorylation of p97, activation of MAPK, protein
kinase C (PKC) and signal transducer and activator of transcription (STAT) pathways and
Spi2.1 and c-fos expression, increase of protein synthesis and insulin secretion, and thus
influencing metabolism and cellular proliferation and differentiation (reviewed by Carter-Su et
al., 2000).
Figure �II-7. Binding sites at the GHR responsive for GH binding and GH-GHR signal transduction and their putative biological functions. C – extracellular cysteines linked by disulfide bonds; N – potential N-linked glycosylation sites; Y – tyrosines of rat GHR cytoplasmic region; Box 1 and Box 2 – intracellular proline rich domains; IRS – insulin receptor substrate; MAP kinase – mitogen-activated protein kinase; SHC – Src homologous containing proteins; Spi2.1 –serine protease inhibitor 2.1; STAT – signal transducer and activator of transcription. Adapted from Argetsinger and Carter-Su (1996) and Carter-Su et al. (1996).
II.5.3 Activation of MAPK signalling pathway
JAK2 activation could be the trigger event for the activation of other tyrosine kinases or
for the inhibition of tyrosine phosphorylases. One of the pathways affected by such stimuli
involves MAPK and extracellular-signal-regulated kinases 1 and 2 (ERK1/2) proteins which
are phosphorylated in reply to GH stimuli, mediating pathways controlling cellular growth,
�����������
!"��������� ����������� ���������� � �
24
differentiation (Cobb and Goldsmith, 1995 cit. by Argetsinger and Carter-Su, 1996) and Ca2+
equilibrium (Olszewska-Pazdrak et al., 2004 cit. by Werry et al., 2005).
The Ras-MAPK-dependent membrane receptor tyrosine kinase activation is another via
of GHR signalling mediated by Src homologous containing (Shc), Grb2, son-of-sevenless
(Sos), ras, raf, and also by MAP/ERK kinase (MEK) (Smit et al., 1999 cit. by Carter-Su et al.,
2000). Additionally, MAPK is a mediator between seven-transmembrane spanning (G-protein-
coupled) receptors and their target effectors ERK1/2, in processes involving feedback
regulation of the phospholipase A2, phosphodiesterases and cytoskeletal proteins and also
downregulating MAPK phosphatase 1 (MKP1) (Werry et al., 2005).
II.5.4 GH signalling through PKC
The ability of GH to regulate several metabolic pathways is reduced by the inhibition of
PKC (Argetsinger and Carter-Su, 1996). There are two second messengers that mediate PKC
activation and translocation to the cytosol: Ca2+ and 1,2-diacylglycerol (DAG). Distinct
pathways are thought to generate those messengers after GH stimulation depending on cell
type: the inositol 1,4,5-triphosphate pathway generates Ca2+ and DAG; alternatively, in another
pathway phospholipase C or D are necessary to hydrolyse the phosphatidylcholine generating
only DAG (Argetsinger and Carter-Su, 1996).
II.5.5 GH-dependent activation of the STAT proteins family
Various signal transducers and activators of transcription (STATs) were identified until
now (STAT1, 2, 3, 4, 5a, 5b and 6; Wakao et al., 1992, 1994; Liu et al., 1995; Silva et al.,
1996), all of them containing a SH2 domain. Many of the functional roles of STAT family
proteins were understood after studies in knockout mice (see Akira et al., 1999).
STATs play an important role in the early embryogenesis, and in the GH-regulated
somatic growth pathway, by enhancing insulin (Galsgaard et al., 1996), IGF-I (Wang and
Jiang, 2005), and acid-labile subunit (ALS) of the IGF-binding protein-3 complex (IGFBP-3)
expression in the liver (namely through STAT5b; Woelfle and Rotwein, 2004). Furthermore,
STAT5 (also known as mammary gland factor, MGF) identified in sheep mammary gland
(Wakao et al., 1994), is involved in the milk secretion by regulating the mammary gland
development (Liu et al., 1995; Matsumoto et al., 1999; Iavnilovitch et al., 2002), and the
transcription of milk caseins (Inuzuka et al., 1999; Schmitt-Ney et al., 1991; Wakao et al.,

� � ��������������� �
25
1992, 1994; Wartmann et al., 1996) and whey acidic proteins (WAP; Li and Rosen, 1995; Jura
et al., 2005; Mukhopadhyay et al., 2001).
STATs, activated after GH-induced tyrosine phosphorylation (Xu et al., 1996), could
form homodimers or heterodimers that, binding to specific sites at different genes, enhance the
expression of those genes, e.g.: STAT5 homodimer binds to IGF-I intron 2 at the HS7 site
(Woelfle and Rotwein, 2004), enhancing IGF-1 expression by interacting with the transcription
factors present at the two IGF-I promoters (Figure �II-8). The GH-STAT-IGF-1 axis is the
main system of GH-transduction signalling in living organisms, mediating many of the GH
biological function.
Figure �II-8. Diagram of the GH-dependent transcription of the insulin-like growth factor I (IGF-I) gene pathway. GH-GHR binding induces GHR dimerization and association, and activation of the JAK2 tyrosine kinase in the cell cytoplasm, with GHR-JAK2 cross-phosphorylation (1). STAT5b is tyrosine phosphorylated at the GHR (2) and form homodimers (3) which migrate to the cell nucleus (4). Within the nucleus, STAT5b binds to IGF-I intron 2 at the HS7 site, and interacting with the transcription factors present at the two IGF-I promoters (large arrows), it induces IGF-I gene transcription (angled arrows). Adapted from Woelfle et al. (2005).
II.5.6 GH signalling inhibition
GH secretion could be regulated by GH-dependent and/or independent negative
feedback mechanisms. High concentration of GH can negatively regulate GH signalling by
saturating GHR, inducing a dose dependent response to GH somehow similar to the response
obtained when GH-antagonists are used (Frank, 2002; Figure �II-9). It is thought that, as GHR
has high affinity for the GH binding site 1, and because binding to sites 1 and 2 occurs
sequentially (see section I.4.1), low number of GHR will be available for the formation of the
GHR Cell Membrane
Cytoplasm
Nucleus

�������������� �������� ����� � �
26
GH/GHR2 ternary complex, fundamental for the correct GH-signal transduction (reviewed by
Frank, 2002).
GH-dependent negative feedback was not observed at somatotrophs in sheep when
injected intravenously or intracerebroventricularly with human or bovine GH (Spencer, 1997).
These findings, in association with previous studies from Spencer et al. (1991 cit. by McMahon
et al., 2001), seem to suggest that the basal secretion of oGH is not influenced by GH feedback.
GH signalling inhibition could be enhanced by the following factors: prolonged insulin
treatment via STAT1 and STAT3 inhibition (Xu et al., 2005); SOCS (Adams et al., 1998;
Cooney et al., 2002; Greenhalgh and Alexander, 2004; Greenhalgh et al., 2005; Ram and
Waxman, 1999), signal regulatory protein-�1 (SIRP�1; Stofega et al., 2000), SHP1 and SHP2
(Ram and Waxman, 1997; Rui et al., 2000b) via decreasing JAK2 activation; platelet-derived
growth factor (PDGF) and lysophosphatidic acid (LPA) in a PKC-dependent pathway (Rui et
al., 2000a); Grb-10 with reduced c-fos and Spi2.1 transactivation (Moutoussamy et al., 1998);
and via ubiquitin/proteasome pathway required for GHR endocytosis/degradation (Strous and
van Kerkhof, 2002; van Kerkhof and Strous, 2001).
Detailed information on the mechanisms involved in GH signalling inhibition has been
reviewed by Frank (2001) and Flores-Morales et al. (2006).
Figure �II-9. GHR-expressing cells’ in response to GH or GH plus GH-antagonist treatment. Adapted from Frank and Messina (2002).
II.6 GH and milk production
Milk production potential depends on the mammary cell differentiation in puberty,
pregnancy and early lactation, on the secretory rate of differentiated mammary cells and on cell
death (apoptosis) throughout lactation (Pollott, 2000, 2002). Daily expression of the animal’s
dairy potential depends also on the daily nutrient supply to the mammary gland. This complex
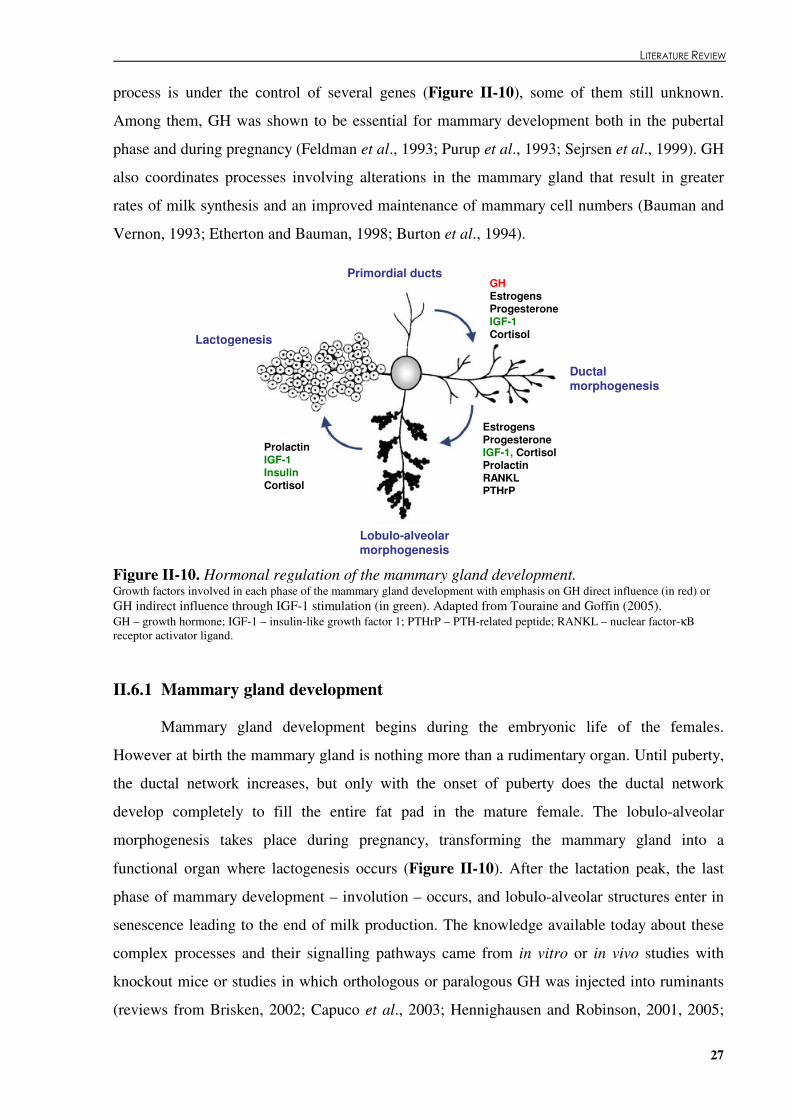
� � ��������������� �
27
process is under the control of several genes (Figure �II-10), some of them still unknown.
Among them, GH was shown to be essential for mammary development both in the pubertal
phase and during pregnancy (Feldman et al., 1993; Purup et al., 1993; Sejrsen et al., 1999). GH
also coordinates processes involving alterations in the mammary gland that result in greater
rates of milk synthesis and an improved maintenance of mammary cell numbers (Bauman and
Vernon, 1993; Etherton and Bauman, 1998; Burton et al., 1994).
Figure �II-10. Hormonal regulation of the mammary gland development. Growth factors involved in each phase of the mammary gland development with emphasis on GH direct influence (in red) or GH indirect influence through IGF-1 stimulation (in green). Adapted from Touraine and Goffin (2005). GH – growth hormone; IGF-1 – insulin-like growth factor 1; PTHrP – PTH-related peptide; RANKL – nuclear factor-κB receptor activator ligand.
II.6.1 Mammary gland development
Mammary gland development begins during the embryonic life of the females.
However at birth the mammary gland is nothing more than a rudimentary organ. Until puberty,
the ductal network increases, but only with the onset of puberty does the ductal network
develop completely to fill the entire fat pad in the mature female. The lobulo-alveolar
morphogenesis takes place during pregnancy, transforming the mammary gland into a
functional organ where lactogenesis occurs (Figure �II-10). After the lactation peak, the last
phase of mammary development – involution – occurs, and lobulo-alveolar structures enter in
senescence leading to the end of milk production. The knowledge available today about these
complex processes and their signalling pathways came from in vitro or in vivo studies with
knockout mice or studies in which orthologous or paralogous GH was injected into ruminants
(reviews from Brisken, 2002; Capuco et al., 2003; Hennighausen and Robinson, 2001, 2005;
Lactogenesis
Primordial ducts
Prolactin IGF-1 Insulin Cortisol
Ductal morphogenesis
Lobulo-alveolar morphogenesis
GH Estrogens Progesterone IGF-1 Cortisol
Estrogens Progesterone IGF-1, Cortisol Prolactin RANKL PTHrP
!"��������#�� ��������� � �
28
Kelly et al., 2002; Neville et al., 2002 and Touraine and Goffin, 2005). In this review,
emphasis will be given to the effect of GH during mammary gland development and lactation
metabolism.
II.6.1.1 From birth to partum The presence of GH is necessary for the formation of normal mammary gland ducts in
the prepuberal phase (Kelly et al., 2002). During ductal morphogenesis, GH binds to stroma
GHRs stimulating IGF-1 secretion and influencing the epithelial compartment in a paracrine
way (Hovey et al., 2002 cit. by Neville et al., 2002). Until recently, it was considered the major
effect of GH in mammary development. However,
- the observed increase in mammary parenchymal cell numbers in primigravid ewes
injected with bovine somatotropin (exogenous bGH, bST) (Stelwagen et al., 1993);
- the tendency to higher mammary DNA concentration associated with higher levels of
plasma GH and IGF-1 and higher milk production in ewes artificially induced to lactate
and injected with hGHRH (Kann, 1997; Kann et al., 1999); and
- the discovery of GHR in the mammary epithelium as well as in stroma in mice and
sheep (Gallego et al., 2001; Jammes et al., 1991; Ilkbahar et al., 1999; Chun et al.,
2005),
suggest that GH may play other direct roles in mammary development during pregnancy and
lactogenesis. Indeed, mammary GH gene expression induced by endogenous progesterone
levels across the oestrous cycle was observed in normal human and dog mammary glands
during the proliferation phase of epithelial cells (Lantinga-van Leeuwen et al., 1999; reviewed
by van Garderen and Schalken, 2002), and also in sheep induced to lactate after treatment with
progesterone and estradiol (Kann, 1997). Moreover, higher levels of progesterone in
twin-bearing ewes (Nanalu and Sumaryadi, 1998 cit. by Manalu et al., 1999) and in
superovulated Javanese thin-tail ewes were correlated with a higher growth of mammary ductal
system in the early phase of pregnancy (Manalu et al., 1999) and with higher mammary gland
synthetic activity (Frimawaty and Manalu, 1999) which consequently increased milk
production. Whether GH gene is expressed or not in the mammary gland in ovine is still
unknown.
GHR and GHBPs were found to increase throughout pregnancy until the onset of
lactation in Préalpes du Sud ewes mammary cells and their location change over time (Chun et
al., 2005), similarly to what was previously reported in mice (Ilkbahar et al., 1995). In ovine,
GHR-like immunoreactivity was found in the epithelial cells from alveoli at the 90th day of
� � ��������������� �
29
pregnancy, in plasma membrane and cytosol of the epithelial cells at the 140th day of
pregnancy, and in the apical part of the alveolar cells, near the alveolar lumina, at the 3th day of
lactation (Chun et al., 2005). Furthermore, it was also observed that GH could activate STAT5
and MAPK pathways in ovine mammary acini. These finding suggest that GH could act
directly upon mammary growth and lactogenesis through its own receptors, PRLR and/or
GHR-PRLR heterodimers (Herman et al., 2000).
II.6.1.2 Throughout lactation During lactation, milk is synthesised within the epithelial cells, secreted to the alveolar
lumen and then sent to the mammary gland cistern by a system of ducts. Milk production
depends on epithelial cell number and on their activity level. As lactation peak is reached
around the third week of lactation in ewes (Cardellino and Benson, 2002; Delgado and Martin,
1992; Ribeiro, 1999; Ruiz et al., 2000), some increase in mammary cell number or in
mammary cell activity occurs during early lactation (Tucker, 1981), depending on the species.
For instance, an increase in secretory cell number was observed before the lactation peak in
goats, which accounts for the increased milk production on that lactation period (Knight and
Peaker, 1984 cit. by Capuco et al., 2003). But in dairy cows, the increased milk production that
occurs at the referred lactation phase seems to be the result of the enhanced activity of the cells
only (Capuco et al., 2001). After the lactation peak, the rapid drop in milk production, and
consequently reduced lactation persistency, appears to be related with the decline in mammary
epithelial cell number in cows (Capuco et al., 2001). So, the lactation persistence depends on
the ratio between cell proliferation and cell death (apoptosis; see Capuco et al., 2001; 2003).
The administration of ST is one of the factors pointed out to improve lactation
persistency (Baldi et al., 2002; Bauman et al., 1999; Capuco et al., 2001; Gallo et al., 1997). It
appears to act via two mechanisms, a direct and/or indirect stimulus upon cell proliferation, and
an indirect inhibition of cell apoptosis mediated by IGF-1 (Forsyth, 1996) and
plasminogen/plasmin system (Politis et al., 1990). Indeed, it was observed that IGF-1 promotes
the ductal system and acini development in mammary cell cultures throughout lactation (Plaut
et al., 1993; Dallard et al., 2005). However, IGF-1 action is controlled by a loop mechanism
whereby it could be inhibited (Sejrsen et al., 1999; Berry et al., 2001) or enhanced (Grill and
Cohick, 2000 cit. by Cohick et al., 2000) by IGF-binding protein type 3 (IGFBP-3) depending
on the nutritional status of the animal (Vestergaard et al., 1995; Sejrsen et al., 2000) and on the
lactation stage (Sejrsen et al., 2001) and, together with cAMP, could regulate IGFBP-3 gene
expression (Vestergaard et al., 1995; Cohick et al., 2000).
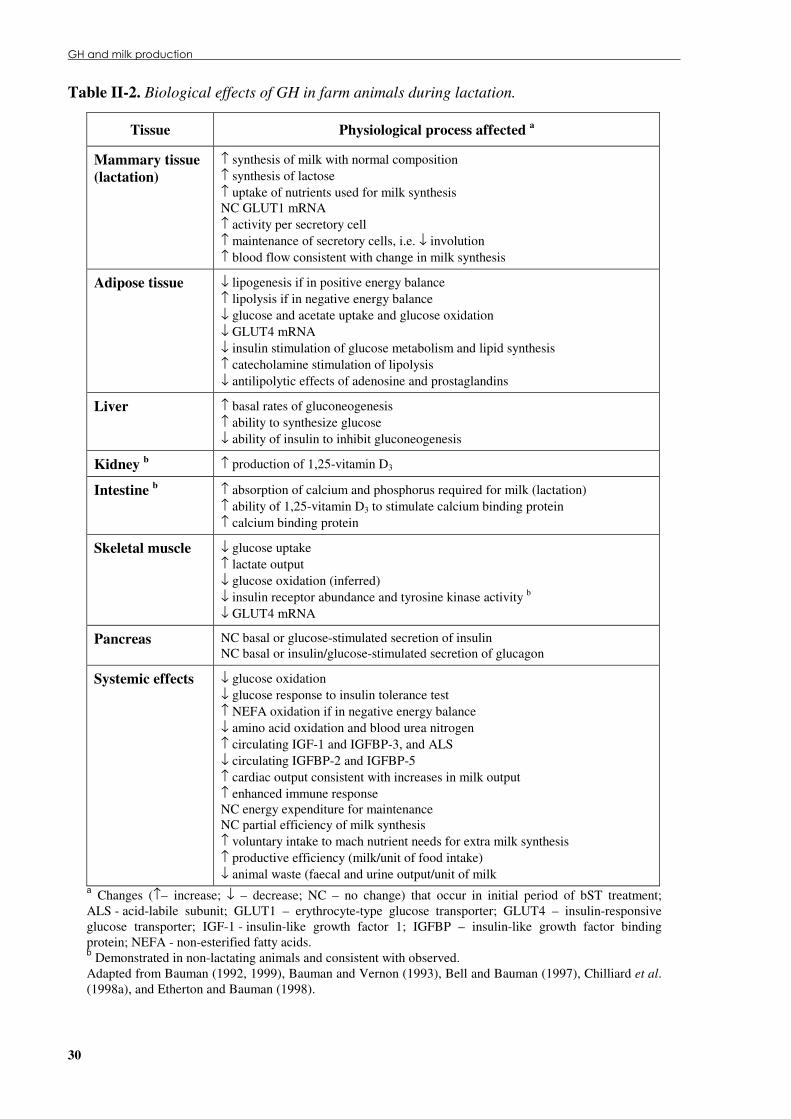
������������ ����� �� � �
30
Table �II-2. Biological effects of GH in farm animals during lactation.
Tissue Physiological process affected a
Mammary tissue (lactation)
↑ synthesis of milk with normal composition ↑ synthesis of lactose ↑ uptake of nutrients used for milk synthesis NC GLUT1 mRNA ↑ activity per secretory cell ↑ maintenance of secretory cells, i.e. ↓ involution ↑ blood flow consistent with change in milk synthesis
Adipose tissue ↓ lipogenesis if in positive energy balance ↑ lipolysis if in negative energy balance ↓ glucose and acetate uptake and glucose oxidation ↓ GLUT4 mRNA ↓ insulin stimulation of glucose metabolism and lipid synthesis ↑ catecholamine stimulation of lipolysis ↓ antilipolytic effects of adenosine and prostaglandins
Liver ↑ basal rates of gluconeogenesis ↑ ability to synthesize glucose ↓ ability of insulin to inhibit gluconeogenesis
Kidney b ↑ production of 1,25-vitamin D3
Intestine b ↑ absorption of calcium and phosphorus required for milk (lactation) ↑ ability of 1,25-vitamin D3 to stimulate calcium binding protein ↑ calcium binding protein
Skeletal muscle ↓ glucose uptake ↑ lactate output ↓ glucose oxidation (inferred) ↓ insulin receptor abundance and tyrosine kinase activity b ↓ GLUT4 mRNA
Pancreas NC basal or glucose-stimulated secretion of insulin NC basal or insulin/glucose-stimulated secretion of glucagon
Systemic effects ↓ glucose oxidation ↓ glucose response to insulin tolerance test ↑ NEFA oxidation if in negative energy balance ↓ amino acid oxidation and blood urea nitrogen ↑ circulating IGF-1 and IGFBP-3, and ALS ↓ circulating IGFBP-2 and IGFBP-5 ↑ cardiac output consistent with increases in milk output ↑ enhanced immune response NC energy expenditure for maintenance NC partial efficiency of milk synthesis ↑ voluntary intake to mach nutrient needs for extra milk synthesis ↑ productive efficiency (milk/unit of food intake) ↓ animal waste (faecal and urine output/unit of milk
a Changes (↑– increase; ↓ – decrease; NC – no change) that occur in initial period of bST treatment; ALS - acid-labile subunit; GLUT1 – erythrocyte-type glucose transporter; GLUT4 – insulin-responsive glucose transporter; IGF-1 - insulin-like growth factor 1; IGFBP – insulin-like growth factor binding protein; NEFA - non-esterified fatty acids. b Demonstrated in non-lactating animals and consistent with observed. Adapted from Bauman (1992, 1999), Bauman and Vernon (1993), Bell and Bauman (1997), Chilliard et al. (1998a), and Etherton and Bauman (1998).
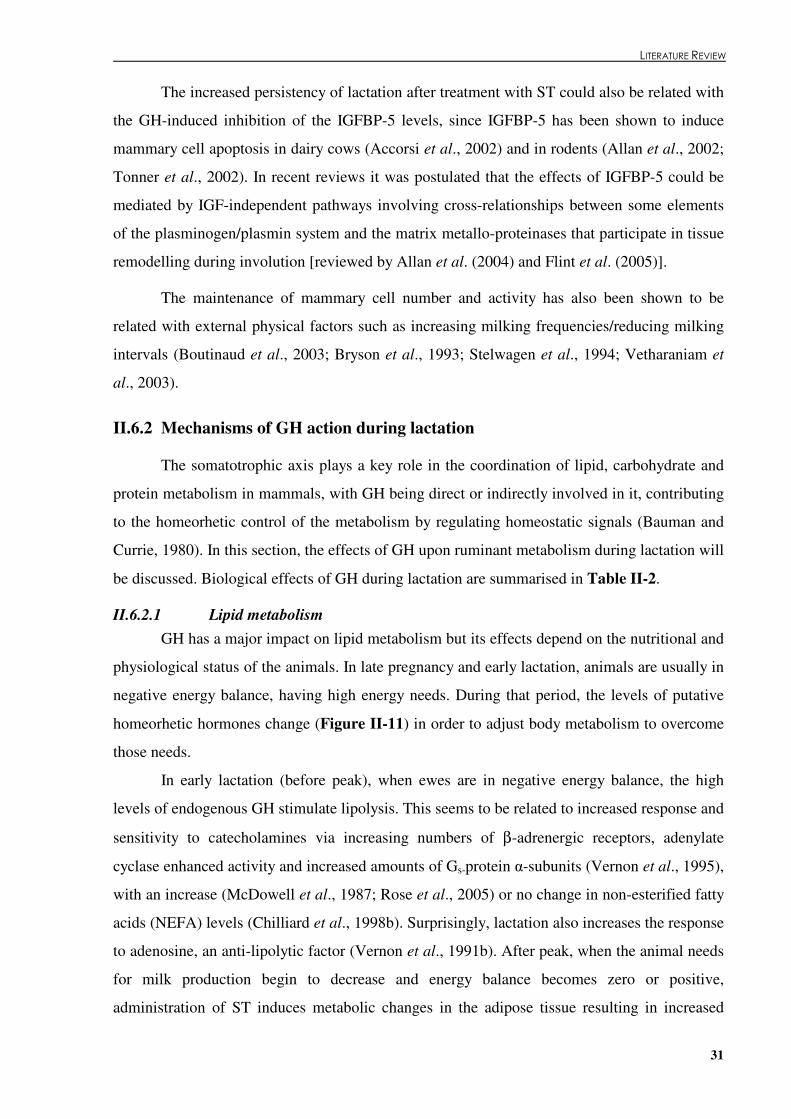
� � ��������������� �
31
The increased persistency of lactation after treatment with ST could also be related with
the GH-induced inhibition of the IGFBP-5 levels, since IGFBP-5 has been shown to induce
mammary cell apoptosis in dairy cows (Accorsi et al., 2002) and in rodents (Allan et al., 2002;
Tonner et al., 2002). In recent reviews it was postulated that the effects of IGFBP-5 could be
mediated by IGF-independent pathways involving cross-relationships between some elements
of the plasminogen/plasmin system and the matrix metallo-proteinases that participate in tissue
remodelling during involution [reviewed by Allan et al. (2004) and Flint et al. (2005)].
The maintenance of mammary cell number and activity has also been shown to be
related with external physical factors such as increasing milking frequencies/reducing milking
intervals (Boutinaud et al., 2003; Bryson et al., 1993; Stelwagen et al., 1994; Vetharaniam et
al., 2003).
II.6.2 Mechanisms of GH action during lactation
The somatotrophic axis plays a key role in the coordination of lipid, carbohydrate and
protein metabolism in mammals, with GH being direct or indirectly involved in it, contributing
to the homeorhetic control of the metabolism by regulating homeostatic signals (Bauman and
Currie, 1980). In this section, the effects of GH upon ruminant metabolism during lactation will
be discussed. Biological effects of GH during lactation are summarised in Table �II-2.
II.6.2.1 Lipid metabolism GH has a major impact on lipid metabolism but its effects depend on the nutritional and
physiological status of the animals. In late pregnancy and early lactation, animals are usually in
negative energy balance, having high energy needs. During that period, the levels of putative
homeorhetic hormones change (Figure �II-11) in order to adjust body metabolism to overcome
those needs.
In early lactation (before peak), when ewes are in negative energy balance, the high
levels of endogenous GH stimulate lipolysis. This seems to be related to increased response and
sensitivity to catecholamines via increasing numbers of β-adrenergic receptors, adenylate
cyclase enhanced activity and increased amounts of Gs-protein �-subunits (Vernon et al., 1995),
with an increase (McDowell et al., 1987; Rose et al., 2005) or no change in non-esterified fatty
acids (NEFA) levels (Chilliard et al., 1998b). Surprisingly, lactation also increases the response
to adenosine, an anti-lipolytic factor (Vernon et al., 1991b). After peak, when the animal needs
for milk production begin to decrease and energy balance becomes zero or positive,
administration of ST induces metabolic changes in the adipose tissue resulting in increased
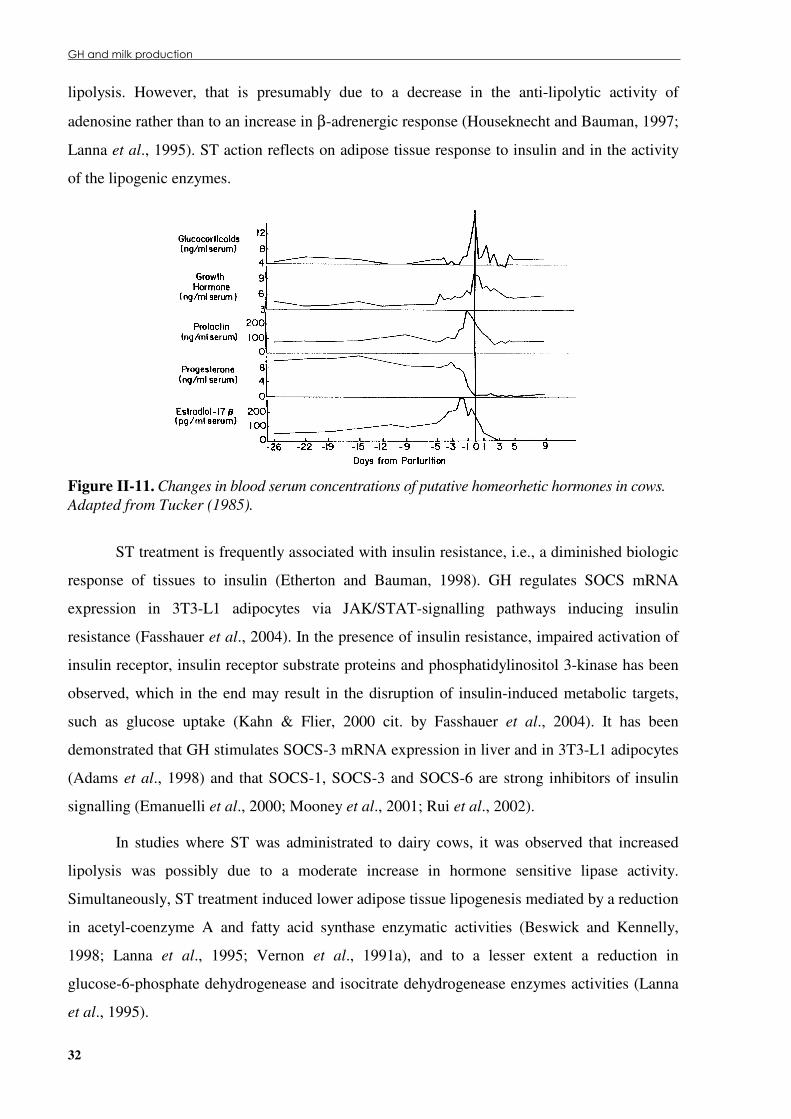
!"��������#�� ��������� � �
32
lipolysis. However, that is presumably due to a decrease in the anti-lipolytic activity of
adenosine rather than to an increase in β-adrenergic response (Houseknecht and Bauman, 1997;
Lanna et al., 1995). ST action reflects on adipose tissue response to insulin and in the activity
of the lipogenic enzymes.
Figure �II-11. Changes in blood serum concentrations of putative homeorhetic hormones in cows. Adapted from Tucker (1985).
ST treatment is frequently associated with insulin resistance, i.e., a diminished biologic
response of tissues to insulin (Etherton and Bauman, 1998). GH regulates SOCS mRNA
expression in 3T3-L1 adipocytes via JAK/STAT-signalling pathways inducing insulin
resistance (Fasshauer et al., 2004). In the presence of insulin resistance, impaired activation of
insulin receptor, insulin receptor substrate proteins and phosphatidylinositol 3-kinase has been
observed, which in the end may result in the disruption of insulin-induced metabolic targets,
such as glucose uptake (Kahn & Flier, 2000 cit. by Fasshauer et al., 2004). It has been
demonstrated that GH stimulates SOCS-3 mRNA expression in liver and in 3T3-L1 adipocytes
(Adams et al., 1998) and that SOCS-1, SOCS-3 and SOCS-6 are strong inhibitors of insulin
signalling (Emanuelli et al., 2000; Mooney et al., 2001; Rui et al., 2002).
In studies where ST was administrated to dairy cows, it was observed that increased
lipolysis was possibly due to a moderate increase in hormone sensitive lipase activity.
Simultaneously, ST treatment induced lower adipose tissue lipogenesis mediated by a reduction
in acetyl-coenzyme A and fatty acid synthase enzymatic activities (Beswick and Kennelly,
1998; Lanna et al., 1995; Vernon et al., 1991a), and to a lesser extent a reduction in
glucose-6-phosphate dehydrogenease and isocitrate dehydrogenease enzymes activities (Lanna
et al., 1995).

� � ��������������� �
33
II.6.2.2 Carbohydrate metabolism As mentioned in Table �II-2, GH influences carbohydrate metabolism in several tissues
during lactation. Glucose availability at the mammary gland level is a limiting factor in milk
synthesis, since it is the key precursor for lactose synthesis at the mammary epithelial cells
(Neville et al., 1983 cit. by Zhao et al., 1996). In ruminants, the main source of glucose is the
hepatic gluconeogenesis that uses mainly the propionate originated by rumen microbial
fermentations (Bauman and Elliot, 1983). Indeed, hepatic phosphoenolpyruvate carboxykinase
(PEPCK) mRNA expression has been shown to be higher in dairy cows receiving ST,
presumably reflecting a major ability for gluconeogenesis from gluconeogenic precursors,
namely propionate, than from oxaloacetate under ST treatment (Velez and Donkin, 2004), as it
was observed that the conversion rate of propionate to glucose increased in cows receiving ST
without changes on the conversion rate of propionate to succinate, malate, and oxaloacetate
taken together (Knapp et al., 1992 cit. by Velez and Donkin, 2004). Authors also postulate that
the increased PEPCK expression could be a sign of hepatic insulin insensitivity that has been
described in ruminants.
It has not been unanimously demonstrated that higher extracellular glucose
concentration could influence glucose mammary uptake in lactating ruminants (Miller et al.,
1991; Peel et al., 1982). Accordingly, a sodium-dependent and a facilitative family of
tissue-specific glucose transporters have been proposed to regulate glucose uptake in cells
(Gould and Holman, 1993 cit. by Zhao et al., 1996a). Facilitative glucose transporters family,
which transport glucose according to its concentration gradient, mediate glucose withdrawal
from liver, kidney and intestine cells to plasma (reviewed by Hocquette and Abe, 2000). ST
and GHRH administration favours the repartitioning of glucose to the mammary gland by
decreasing significantly the expression level of the insulin-responsive glucose transporter gene
(GLUT4) in skeletal muscle, with the same tendency observed at the omental fat tissue (Zhao et
al., 1996b). However, no changes were observed upon erythrocyte-type glucose transporter
(GLUT1), liver-type glucose transporter (GLUT2) and intestinal-type glucose transporter
(GLUT5) mRNA expression levels in liver or in kidney (Zhao et al., 1996a). GLUT1 mRNA
expression seems to be dominant in lactating bovine mammary tissue (Zhao et al., 1993 cit. by
Nielsen et al., 2001). It was thus suggested that glucose uptake in ruminant mammary gland
occurs by an insulin-independent mechanism in which glucose transport could probably be
done by GLUT1 (Komatsu et al., 2005; Nielsen et al., 2001). Those results, taken together with
others suggest that the ST’s effects upon milk production may involve: an increase in
mammary glucose uptake due to a higher mammary blood flow rather than changes in glucose

!"��������#�� ��������� � �
34
transporters; and an enhanced lactose synthesis through a more efficient intracellular glucose
metabolism as proposed in goats by Nielsen et al. (2001).
II.6.2.3 Protein metabolism High levels of endogenous GH observed in late pregnancy/early lactation and ST
treatment are known to change amino acids and protein metabolism in lactating mammals (Bell
et al., 1995). Amino acids are fundamental for milk synthesis at the mammary gland during
lactation (Bauman et al., 1988), being also precursors for hepatic gluconeogenesis along with
propionate, lactate and, to a lesser extent, glycerol (see Bell and Bauman, 1997).
The main changes that high levels of GH induce in protein metabolism consist in an
increase in body protein mobilization, namely skeletal muscle amino acids. This has been
suggested to be concomitant with a possible decrease in amino acid catabolism and an increase
in hepatic glucose and protein synthesis, as well as a more efficient mammary gland milk
protein synthesis (Reynolds et al., 1994). A decrease in amino acid catabolism was associated
with reduced levels of plasma urea nitrogen (Morris et al., 1992 cit. by Velez and Donkin,
2004). This was observed in several studies in lactating cows (Sechen et al., 1989), goats
(Disenhaus et al., 1995) and ewes (Sallam et al., 2005) treated with ST, but was not observed
in others studies (e.g., Velez and Donkin, 2004).
The mechanism by which GH promotes amino acid mobilization in skeletal muscle, and
simultaneously increases milk protein synthesis in mammary gland, appears to involve insulin
receptor signalling impairment at organs other than mammary gland, and enhanced expression
of IGF-1 at the mammary gland.
II.6.3 Recombinant somatotropin and milk production in ewes
Since the 50’s, ST effects upon ewes’ milk yield have been studied (Dracy and Jordan,
1954; Jordan and Shaffhausen, 1954). Lactating ewes treated with ST yielded significantly
more milk (Brozos et al., 1998; Chiofalo et al., 1999; Fernandez et al., 1995, 1997, 2001;
Leibovich et al., 2001; Min et al., 1997; Sallam et al., 2005; Sandles et al., 1988) (Figure
�II-12). This was also achieved by giving GHRH to ewes in artificially induced lactation (Kann,
1997). Another way to increase milk yield in ewes is through the immunization of pregnant
ewes against SRIF (Sun et al., 1990; Westbrook et al., 1993). Accordingly, milk production in
ewes seems to be regulated by genes from the somatotrophic axis as it was also demonstrated
in dairy cows (Bauman, 1999; Chilliard et al., 1998a; Etherton and Bauman, 1998; Rose et al.,
2005) and goats (Boutinaud et al., 2003; Gallo et al., 1997).
� � ��������������� �
35
Figure �II-12. Milk production in lactating ewes submitted to recombinant bovine ST (rbsT) treatment. Adapted from Sallam et al. (2005).
Factors such as lactation number and stage, flocks’ average milk production, animals’
body condition score and weight at the beginning of the treatment influence the ST dose that
should be given to the ewes (Fernandez et al., 1997) and at which time intervals (Fernandez et
al., 2001).
In general, the use of recombinant ST for ewes’ milk production allows to obtain higher
productions with no detrimental effects on milk gross composition and coagulating properties
(except in the advanced stage of lactation; Baldi, 1999), which is of great importance for cheese
manufacture. Nevertheless, as far as the application of this technology to dairy cows is
concerned, 79 % of the UK dairy farmers and 65.4 % of the UK consumers did not consider
bST ‘ethically acceptable’ (Millar et al., 1999 cit. by Mepham, 2000). These acceptability
problems are expected to arise in respect to dairy sheep industry. The immunization of pregnant
ewes against SRIF as proposed by Westbrook et al. (1993) has the advantage of obtaining more
milk without injecting the animals during the lactation period, and thus without the negative
impact on consumer’s opinion.
With regard to animals’ health, ST treatment did not change hematological parameters
(Sallam et al., 2005), mastitis incidence or milk somatic cell count (Fernandez et al., 1995).
However, in dairy cows some increase in milk somatic cells count was attributed to the higher
milk production (see Chilliard et al., 1998a). It was also reported a higher occurrence of foot
and leg disorders in cows subjected to long-term treatment with ST (Zhao et al., 1992; Collier
et al., 2001), which may also occur in ewes since GH axis has been seen to promote bone
growth (Braithwaite, 1975). The above mentioned health effects upon females injected with
!"��������#�� ��������� � �
36
bST resulted in increasing culling rates in multiparous cows (European Commission, 1999a cit.
by Mepham et al., 2000), thus increasing milk production costs. This correlates with studies
that reported that GH deficiency due to GH gene deletion or to combined pituitary hormone
deficiencies - as observed in Ames dwarf mice (PROP1 mutation; Bartke and Brown-Borg,
2004), in Snell dwarf mice (POU1F1 mutations; Lin et al., 1994) - or deficient transduction of
GH signal - as in Laron mice (GHR knock-out; Coschigano et al., 2003), which usually result
in lower body weight and decreased insulin and IGF-I levels. As a consequence, the GH
deficiency improves lifespan.
II.7 Transgenic animals expressing an additional GH copy
Due to its effects on animal metabolism and its proved efficiency in increasing
productivity in animal husbandry, GH is a natural target for genetic manipulation in livestock.
Experiments in this field were performed in sheep (Adams et al., 2002; Adams and Briegel,
2005). The authors reported that, when expressed, the impact of the transgene depends on age,
breed and sex of the transgenic animal. Nevertheless, animals expressing an additional GH
gene presented a plasma GH level twofold higher that the non-transgenic animals, but GH
expression was continuous. Transgenic animals were leaner, grew faster and had similar wool
productions (Adams et al., 2002). Ewes had greater ovulation and foetal death rates (Adams
and Briegel, 2005). In addition, health problems such as higher parasite faecal egg count and
foot problems (swollen metatarsal and metacarpal joints) were present in transgenic animals
(Adams et al., 2002; Adams and Briegel, 2005). Skeletal malformations had been observed
before in transgenic sheep (Ward et al., 1990), and foot problems observed in dairy cows
injected with bST, accounting for the reduced lifespan of those animals (Zhao et al., 1992;
Collier et al., 2001).
II.8 Impact of GH polymorphisms on productive traits
In the 90’s, with the huge development of the molecular biology techniques, scientists
begun to search more actively for polymorphisms at the DNA level that might be responsible
for alterations of gene functions leading to changes that could be involved in a disease situation
or impair/enhance a production trait. Several techniques were developed and refinements are
proposed every day, and applied to domestic animals to look for polymorphisms at candidate

� � ��������������� �
37
genes that are suspected to influence a particular production trait. Examples of these techniques
are: restriction fragment length polymorphism (RFLP; Beckmann and Soller, 1983 cit. by
Valinsky et al., 1990), SSCP (Orita et al., 1989) and single nucleotide polymorphism (SNP;
reviewed by Kwok and Chen, 2003); or in genomic regions that might be close to a gene that
regulates a production trait (quantitative trait loci; QTL), e.g. microsatellites (Weber and May,
1989), random amplified polymorphic DNA (RAPD; Williams et al., 1990) and amplified
fragment length polymorphism (AFLP; Vos et al., 1995).
GH gene polymorphisms were shown to be a possible selection criterion for milk
production traits of high merit animals, mostly in dairy cattle (Lucy et al., 1993; Falaki et al.,
1996b; Lagziel et al., 1996). Small ruminant species have been much less studied.
Polymorphisms at the GH gene were identified in bovine: two insertion/deletion in the
promoter region (ins/del AAG - Rodrigues et al., 1998; ins/del TGC – Yao et al., 1996); a
MspI-RFLP at the intron 3 (Zhang et al., 1993; Lagziel et al., 2000; Khatami et al., 2005); two
SNPs detected by SSCP in intron 4 (Lee et al., 1994b); an AluI-RFLP at the exon 5 (Lucy et al.,
1991; Zhang et al., 1993; Chrenek et al., 1998b); a HaeIII-RFLP at the exon 5 (Unanian et al.,
1994); and GH gene haplotypes established by SSCP (Lagziel and Soller, 1999). It was also
described a splicing variant of the bGH gene which results from nonsplicing of the intron 4
(Hampson and Rottman, 1987). Some of the polymorphisms were identified in several breeds
and associations with meat and milk production traits, metabolic parameters and reproduction
traits were established (Table �II-3), sometimes reaching contradictory conclusions.
Table �II-3. Polymorphisms at the GH gene significantly associated with production traits and metabolic parameters in bovines.
Site Polymor-phisms Breed Effect References
L127V (exon 5)
AluI-RFLP
Holstein, Brown Swiss, Guernsey, Jersey, and Ayrshire
Estimates of transmitting ability for milk production tended to be: • greater for LL Holstein cows; • greater for VV Jersey cows; • no differences for Holstein sires.
Lucy et al., 1993
L127V (exon 5)
AluI-RFLP
Holstein AluI(+/-), i.e., the presence of V allele: • ↓ 170 kg of EBV-milk and • ↓ 240 kg of AYD-milk
Lee et al., 1996
L127V (exon 5)
AluI-RFLP
Simmental VV genotypes: • ↓ body weight; • ↓ average daily gain.
Chrenek et al., 1998a
L127V (exon 5)
AluI-RFLP
Simmental LV genotypes: • ↑ carcass gain.
Schlee et al., 1994a
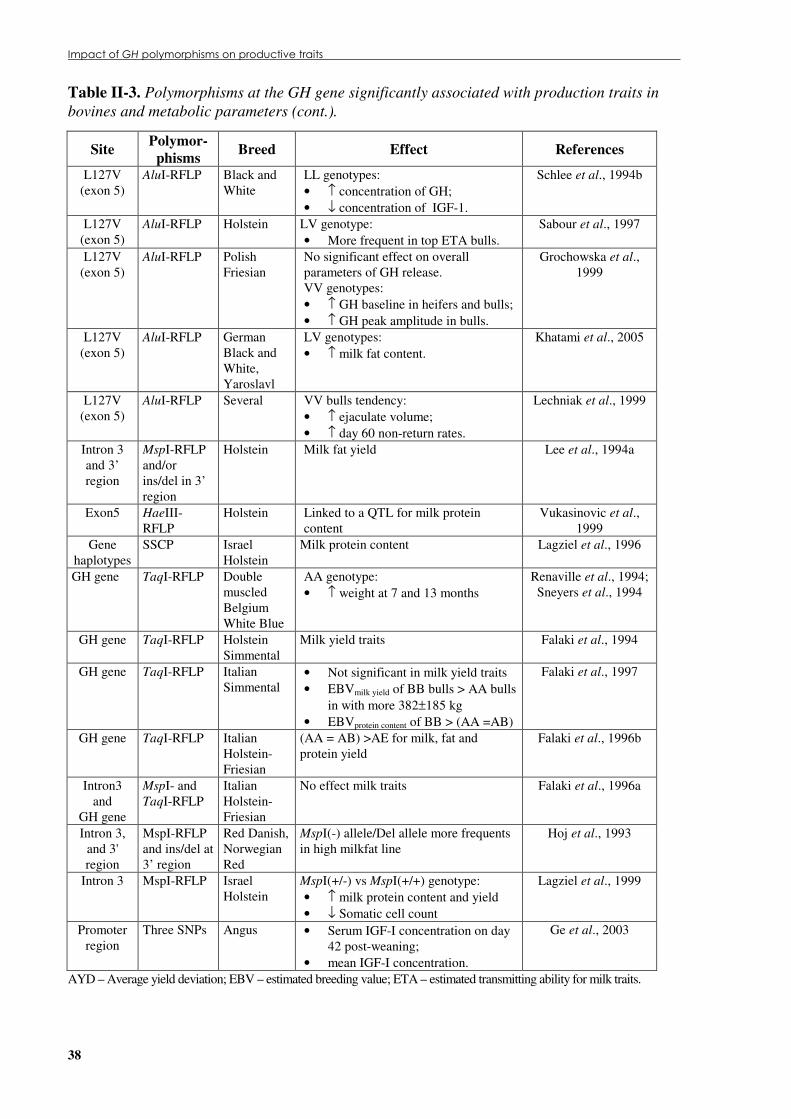
������������������� �������������������������� � �
38
Table II-3. Polymorphisms at the GH gene significantly associated with production traits in bovines and metabolic parameters (cont.).
Site Polymor-phisms Breed Effect References
L127V (exon 5)
AluI-RFLP
Black and White
LL genotypes: • ↑ concentration of GH; • ↓ concentration of IGF-1.
Schlee et al., 1994b
L127V (exon 5)
AluI-RFLP
Holstein LV genotype: • More frequent in top ETA bulls.
Sabour et al., 1997
L127V (exon 5)
AluI-RFLP
Polish Friesian
No significant effect on overall parameters of GH release. VV genotypes: • ↑ GH baseline in heifers and bulls; • ↑ GH peak amplitude in bulls.
Grochowska et al., 1999
L127V (exon 5)
AluI-RFLP
German Black and White, Yaroslavl
LV genotypes: • ↑ milk fat content.
Khatami et al., 2005
L127V (exon 5)
AluI-RFLP
Several VV bulls tendency: • ↑ ejaculate volume; • ↑ day 60 non-return rates.
Lechniak et al., 1999
Intron 3 and 3’ region
MspI-RFLP and/or ins/del in 3’ region
Holstein Milk fat yield Lee et al., 1994a
Exon5 HaeIII-RFLP
Holstein Linked to a QTL for milk protein content
Vukasinovic et al., 1999
Gene haplotypes
SSCP Israel Holstein
Milk protein content Lagziel et al., 1996
GH gene TaqI-RFLP Double muscled Belgium White Blue
AA genotype: • ↑ weight at 7 and 13 months
Renaville et al., 1994; Sneyers et al., 1994
GH gene TaqI-RFLP Holstein Simmental
Milk yield traits Falaki et al., 1994
GH gene TaqI-RFLP Italian Simmental
• Not significant in milk yield traits • EBVmilk yield of BB bulls > AA bulls
in with more 382±185 kg • EBVprotein content of BB > (AA =AB)
Falaki et al., 1997
GH gene TaqI-RFLP Italian Holstein-Friesian
(AA = AB) >AE for milk, fat and protein yield
Falaki et al., 1996b
Intron3 and
GH gene
MspI- and TaqI-RFLP
Italian Holstein-Friesian
No effect milk traits Falaki et al., 1996a
Intron 3, and 3' region
MspI-RFLP and ins/del at 3’ region
Red Danish, Norwegian Red
MspI(-) allele/Del allele more frequents in high milkfat line
Hoj et al., 1993
Intron 3 MspI-RFLP Israel Holstein
MspI(+/-) vs MspI(+/+) genotype: • ↑ milk protein content and yield • ↓ Somatic cell count
Lagziel et al., 1999
Promoter region
Three SNPs Angus • Serum IGF-I concentration on day 42 post-weaning;
• mean IGF-I concentration.
Ge et al., 2003
AYD – Average yield deviation; EBV – estimated breeding value; ETA – estimated transmitting ability for milk traits.

� � ��������������� �
39
Some polymorphisms were identified at the oGH gene: TaqI- and PvuII-RFLP
(Gootwine et al., 1993, 1996; Parsons et al., 1992) and EcoRI-RFLP (Barracosa, 1996;
Gootwine et al., 1998), and PCR-SSCP polymorphisms (Bastos et al., 2001; Santos et al.,
2004) have been reported.
Recent studies conducted on dairy goats have shown associations between PCR-SSCP
at the GH gene and milk production traits: polymorphisms at exons 4 and 5 were significantly
associated to milk yield in “Algarvia” goats (Malveiro et al., 2001). In another study, it was
observed that goats with SSCP pattern A/B at the GH exon 2 yielded more milk than the other
goats from the “Serrana Jarmelista” ecotype; goats with SSCP pattern A/B at the GH exon 4
yielded more milk than the other goats from “Serrana Ribatejano” ecotype; in the “Serrana
Ribatejano” ecotype, goats with patterns A/B at the GH exon 1 and B/B at the GH exon 2 had
higher milk protein content than the other goats (Marques et al., 2003).


���� �
���������
�� ��������
“I am among those who think that science has great beauty.
A scientist in his laboratory is not only a technician: he is also a child
placed before natural phenomena which impress him like a fairy tale.”
Marie Curie (1867-1934)

42
���� ���������� �������__________________________________________ 41
III.1 Serra da Estrela sheep production system____________________________________ 43
III.1 Animals and milk records _________________________________________________ 46
III.2 oGH gene copy number genotypes __________________________________________ 47
III.3 oGH gene analysis by PCR-SSCP___________________________________________ 48
III.4 Cloning and sequencing of the oGH gene copies and of the inter-copy region ______ 50
III.5 Statistical analysis _______________________________________________________ 52
III.6 Bioinformatics __________________________________________________________ 55
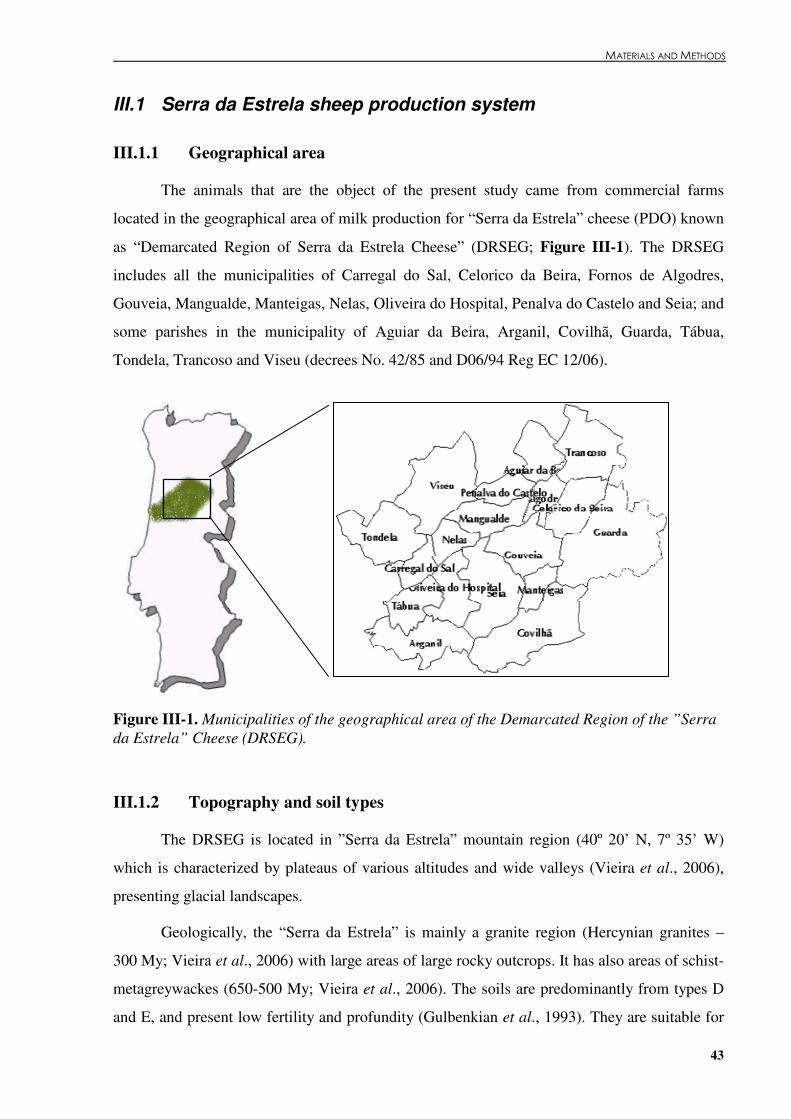
� � ��������������� ��
43
III.1 Serra da Estrela sheep production system
III.1.1 Geographical area
The animals that are the object of the present study came from commercial farms
located in the geographical area of milk production for “Serra da Estrela” cheese (PDO) known
as “Demarcated Region of Serra da Estrela Cheese” (DRSEG; Figure �III-1). The DRSEG
includes all the municipalities of Carregal do Sal, Celorico da Beira, Fornos de Algodres,
Gouveia, Mangualde, Manteigas, Nelas, Oliveira do Hospital, Penalva do Castelo and Seia; and
some parishes in the municipality of Aguiar da Beira, Arganil, Covilhã, Guarda, Tábua,
Tondela, Trancoso and Viseu (decrees No. 42/85 and D06/94 Reg EC 12/06).
Figure �III-1. Municipalities of the geographical area of the Demarcated Region of the ”Serra da Estrela” Cheese (DRSEG).
III.1.2 Topography and soil types
The DRSEG is located in ”Serra da Estrela” mountain region (40º 20’ N, 7º 35’ W)
which is characterized by plateaus of various altitudes and wide valleys (Vieira et al., 2006),
presenting glacial landscapes.
Geologically, the “Serra da Estrela” is mainly a granite region (Hercynian granites –
300 My; Vieira et al., 2006) with large areas of large rocky outcrops. It has also areas of schist-
metagreywackes (650-500 My; Vieira et al., 2006). The soils are predominantly from types D
and E, and present low fertility and profundity (Gulbenkian et al., 1993). They are suitable for
�����������������������������������
44
forest and pastoral activities. Viera et al. (2006) and Natura 2000 report
(http://www.eco.science.ru.nl/expploec/Estrela/natura2K.html) reviewed the information
concerning topography, geomorphology and vegetation distribution in the “Serra da Estrela”
mountain.
III.1.3 Climate
This region has a temperate and humid Mediterranean climate (Le Houerou, 2004), with
cold temperatures in winter (often below 0ºC) and hot temperatures in summer (often over
30°C from June to August) with more than 1000 mm of annual rainfall, mainly distributed
from October to May and with a high number of rainy days in the western side of the “Serra da
Estrela” mountain where a large part of the DRSEG is located.
III.1.4 Sheep production system
In this study a brief characterisation of the “Serra da Estrela” sheep production system
was made based on the answers by farmers to the questionnaire presented in Appendix 1. An
extensive characterization of the “Serra da Estrela” sheep production system had been
conducted by Gulbenkian (1993). The questionnaire was answered in 1998 by 36 sheep farmers
from municipalities of Oliveira do Hospital, Carregal do Sal and Gouveia. Only farmers who
owned brucellosis free flocks (B4) were requested to answer.
Three main aspects were considered:
III.1.4.1 Land utilization Farms had on average 30 ha (owned and mainly rented land). The foremost occupation
of land was the natural (some of them under olive trees) and sown pastures. The forage
production practised by the farmers was based upon annual crops. The principal species sown
in autumn were rye-grass, rye, oat, and some legumes as clovers and alfalfa and, in spring,
sorghum and corn forage (“Milharada”). Pastures were fertilized in all the farms and spring
crops were irrigated. Pasture lands were divided in parcels with fences. Generally, the distance
between pasture and pen house was covered in less than 30 minutes. Only 15% of the inquired
farmers used to graze their sheep in communitary barren lands.
III.1.4.2 Feeding system One of the most important factors affecting milk production is ewes’ nutrition.
Throughout the year, feeding regime changes to accommodate the evolution of grass
production and the availability of other feeding products in the farm:
� � ��������������� ��
45
- From September to March (autumn/winter): 90% of the flocks graze natural pastures, rye-
grass and rye and/or oat, and some legumes. A small percentage of flocks graze shrubs,
crops and vineyard remains, and sown pastures.
- From April to August (autumn/winter): ewes graze the remaining of the natural pastures,
some communitary pastures in June and above all corn forage (“Milharada”) and sorghum.
The ewes receive a feed supplement during milking: a commercial mix in 80% of the
flocks with some corn, or rye or oat (250 g to 400 g/ewe). Other flocks receive corn and/or
potatoes or a mixture of potatoes and cabbages. Inside the pen overnight, the animals have also
rye-grass, oat or natural pasture hay (alfalfa in a very small number of flocks) or oat, rye or corn
straw.
Forty percent of the farmers separate the lactating ewes in order to adequate their
feeding level to the nutritional needs of the lactation period.
III.1.4.3 Flocks management Sheep production in the region is mostly a familial activity, with more than 75% of the
farmers shepherding their own ewes with the help of a family member. Only less than 25% of
the farmers had a shepherd to conduct their ewes to the pastures and to do the milking.
Mating season is in April/May. The lambing season begins in August/September and
more than 50% of the multiparous ewes lamb in October. Ewes nurse their lambs 8 to 30 days
whereas they are to be sold to be slaughter (“Canastra” lambs). Lambs for flock replacement
are weaned at 45-60 days. Ewes are replaced with ewes that are born in the flock, and rams are
brought from outside the flock.
III.1.4.4 Milk production and utilization Milking begins in September/October and ends in June. Ewes are machine (20%) or
manually (80%) milked in the morning and evening. The higher milk yield is obtained in
October and November. Average milk yields of the inquired flocks are shown in Appendix 2.
Most farmers (65%) produce milk for sale. “Serra da Estrela” cheese producers need 5.5 to 6 l
of milk to manufacture 1 kg of cheese during winter and approximately 5 l of milk during
spring. “Serra da Estrela” cheese is a mature cheese prepared by traditional methods from raw
milk, and curdled with Cynara cardunculus. It has a soft consistency, buttery texture and clean,
smooth and slightly acid flavour.
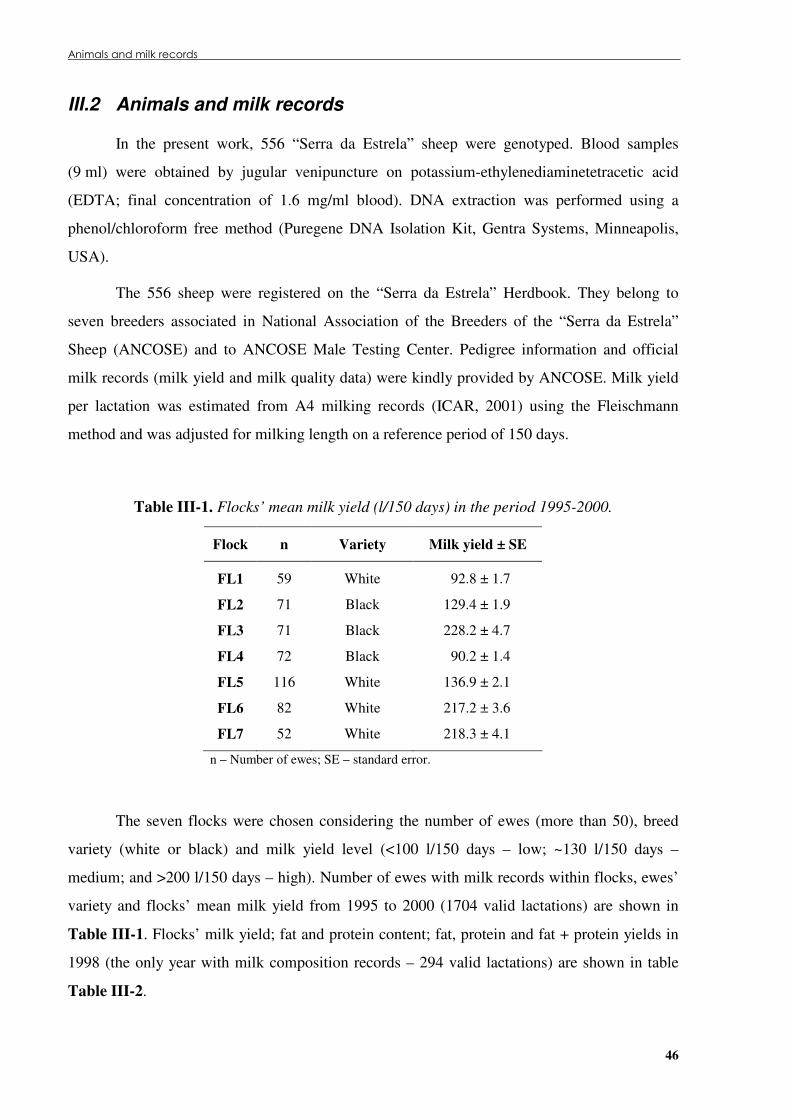
���������������������
46
III.2 Animals and milk records
In the present work, 556 “Serra da Estrela” sheep were genotyped. Blood samples
(9 ml) were obtained by jugular venipuncture on potassium-ethylenediaminetetracetic acid
(EDTA; final concentration of 1.6 mg/ml blood). DNA extraction was performed using a
phenol/chloroform free method (Puregene DNA Isolation Kit, Gentra Systems, Minneapolis,
USA).
The 556 sheep were registered on the “Serra da Estrela” Herdbook. They belong to
seven breeders associated in National Association of the Breeders of the “Serra da Estrela”
Sheep (ANCOSE) and to ANCOSE Male Testing Center. Pedigree information and official
milk records (milk yield and milk quality data) were kindly provided by ANCOSE. Milk yield
per lactation was estimated from A4 milking records (ICAR, 2001) using the Fleischmann
method and was adjusted for milking length on a reference period of 150 days.
Table �III-1. Flocks’ mean milk yield (l/150 days) in the period 1995-2000.
Flock n Variety Milk yield ± SE
FL1 59 White 92.8 ± 1.7
FL2 71 Black 129.4 ± 1.9
FL3 71 Black 228.2 ± 4.7
FL4 72 Black 90.2 ± 1.4
FL5 116 White 136.9 ± 2.1
FL6 82 White 217.2 ± 3.6
FL7 52 White 218.3 ± 4.1
n – Number of ewes; SE – standard error.
The seven flocks were chosen considering the number of ewes (more than 50), breed
variety (white or black) and milk yield level (<100 l/150 days – low; ~130 l/150 days –
medium; and >200 l/150 days – high). Number of ewes with milk records within flocks, ewes’
variety and flocks’ mean milk yield from 1995 to 2000 (1704 valid lactations) are shown in
Table �III-1. Flocks’ milk yield; fat and protein content; fat, protein and fat + protein yields in
1998 (the only year with milk composition records – 294 valid lactations) are shown in table
Table �III-2.

� � ��������������� ��
47
Table �III-2. Flocks’ mean milk yield (l/150 d), fat content (g/kg), protein content (g/kg), fat yield (kg/150 d, protein yield (kg/150 d) and fat plus protein yield (kg/150 d) in 1998.
Flock n Milk yield
± SE
Fat content
± SE
Protein
content ± SE
Fat yield
± SE
Protein
yield ± SE
Fat + Protein
Yield ± SE
FL1 46 93.4 ± 3.9 73.2 ± 1.3 67.5 ± 1.0 6.9 ± 0.3 6.3 ± 0.3 13.2 ± 0.6
FL2 57 152.3 ± 3.6 81.9 ± 1.2 67.2 ± 0.9 12.6 ± 0.4 10.2 ± 0.3 22.8 ± 0.7
FL3 43 227.0 ± 9.1 78.7 ± 1.6 68.9 ± 1.0 17.9 ± 0.8 15.5 ± 0.6 33.5 ± 1.4
FL4 54 98.9 ± 2.8 76.6 ± 1.4 66.7 ± 0.8 7.6 ± 0.3 6.6 ± 0.2 14.2 ± 0.5
FL6 54 238.0 ± 8.0 82.8 ± 2.0 63.2 ± 0.8 19.5 ± 0.7 15.0 ± 0.5 34.5 ± 1.1
FL7 40 239.3 ± 8.7 83.7 ± 1.8 58.6 ± 1.0 20.1 ± 0.9 14.1 ± 0.6 34.2 ± 1.4
n – Number of ewes; SE – standard error.
III.3 oGH gene copy number genotypes
To determine the copy number genotype of the oGH gene, a total of 89 “Serra da
Estrela” sheep (56 ewes and 33 rams) from the white (61%) and the black (39%) varieties were
analysed by Southern blotting.
A 2055 bp DNA probe containing the oGH gene was amplified by PCR with the
primers GHT-Fwd (5’ CCA GAG AAG GAA CGG GAA CAG GAT GAG 3’) and GHT-Rev
(5’ ATA GAG CCC ACA GCA CCC CTG CTA TTG 3’) designed according to the published
oGH gene sequence (GenBank accession number: X12546, Orian et al., 1988). The PCR
reaction was performed in a final volume of 50 µl according to the following conditions:
500 ng of genomic DNA; 6 pmoles of each primer; 2.0 unit of TaKaRa LA TaqTM (TAKARA
SHUZO CO., Ltd, Japan); 1x of 2x GC Buffer I with 2.5 mM MgCl2 and 400 µM of each
dNTP. Amplification cycles included an initial denaturation at 94ºC for 1 min followed by
30 cycles of denaturation at 98ºC for 20 s, annealing from 62ºC for 12 min, and a final
extension at 72ºC for 10 min. The 2055 bp DNA probe was digoxigenin (DIG)-labelled with
the PCR DIG Probe Synthesis Kit (Roche Diagnostics GmbH, Indianapolis, USA) according to
the instruction manual.
Fifteen µg of genomic DNA were digested overnight, separately, with EcoRI, BamHI
and HindIII restriction endonucleases (Invitrogen Life Technologies; Carlsbad, CA, USA). The
digested fragments were separated on a 0.8% agarose gel (2 V/cm) with 0.5x TBE buffer
(0.045 M borate, 0.001 M EDTA) for 13 h, denatured in 0.5 M NaOH for 30 min, transferred
by capillarity to a positively charged nylon membrane (HybondTM-N+, Amersham Pharmacia
��������������� ����������� � �
48
Biotech, Ireland), and UV-cross linked to the membrane. The blots were hybridized with the
2055 bp DIG-labelled probe at 45ºC in DIG Easy Hyb solution (Roche Diagnostics GmbH,
Indianapolis, USA) for 16 h. The probe-target hybrids were immunodetected on the blots with
an alkaline phosphatase-conjugated anti-DIG antibody from sheep (Anti-Digoxigenin-AP, Fab
fragments; Roche Diagnostics GmbH, Indianapolis, USA) and visualized with the
chemiluminescent alkaline phosphatase substrate CSPD (Roche Diagnostics GmbH,
Indianapolis, USA). Then the blots were exposed to X-ray film (Kodak BioMax MS1, Eastman
Kodak Company, Rochester, NY, USA) for 45 min according to the standard DIG
chemiluminescent detection procedure.
The Hardy-Weinberg equilibrium (HWE) for the oGH copy number genotypes was
tested by �2 analysis (Statistica software, StatSoft, Inc., Tulsa, OK, USA).
III.4 oGH gene analysis by PCR-SSCP
Five hundred and twenty three “Serra da Estrela” ewes from white (64%) and black
(36%) varieties were analysed by SSCP to determine oGH polymorphisms.
Seven DNA fragments (I to VII) of the oGH gene comprising the five exons (including
intron-exon junctions), and the 5’-UTR and 3’-UTR regions, were amplified by PCR with
copy-unspecific primer pairs (Invitrogen Life Technologies, Barcelona, Spain) shown in Table
�III-3. Sizes of amplified fragments ranged from 112 to 289 bp. PCR reactions of the fragments
II to VI were performed in a final volume of 25 µl using Ready-To-Go PCR Beads (Amersham
Biosciences, Buckinghamshire, England) according to the following conditions: 25 to 50 ng of
genomic DNA; 0.16 to 0.64 µM of each primer; 1.5 units of Taq DNA polymerase; 10 mM
Tris-HCl (pH 9); 50 mM KCl; 1.5 or 2.5 mM MgCl2; 200 µM of each dNTP and stabilisers
including BSA. PCR reactions of the fragments I and VII were performed in a final volume of
25 µl according to the following conditions: 50 ng of genomic DNA; 12 pmoles of each primer;
1.0 unit of Taq DNA polymerase (Roche Diagnostics GmbH, Indianopolis, USA); 10 mM
Tris-HCl (pH 9); 50 mM KCl; 3.5 mM or 4.5 mM MgCl2; and 200 µM of each dNTP.
Amplification cycles included an initial denaturation at 95ºC for 5 min followed by 30 cycles of
denaturation at 95ºC for 30 s, annealing from 57ºC to 68ºC for 30 s (Table �III-3), extension at
72ºC for 30 s and a final extension at 72ºC for 5 min. Amplification products were analysed by
electrophoresis on ethidium bromide stained 2% agarose gels (5 V/cm), with 1x TBE buffer
(0.09 M borate, 0.002 M EDTA).
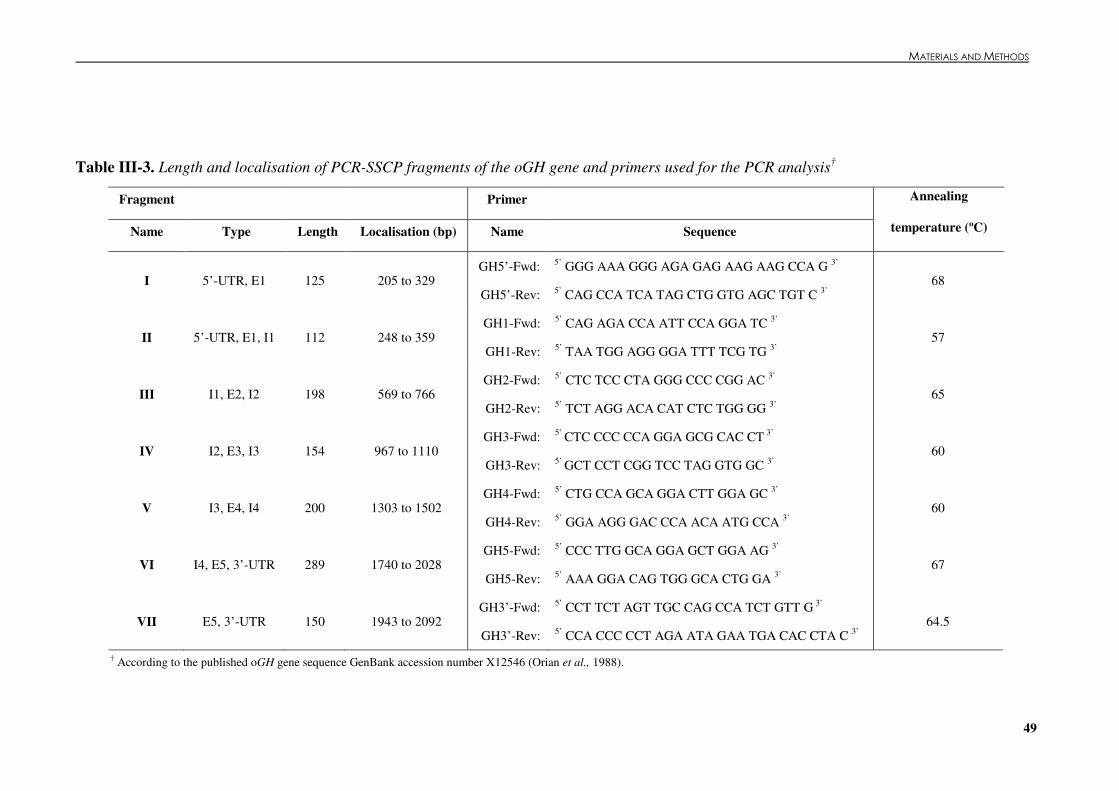
� � � � � � � ����������������������� ��
49
Table �III-3. Length and localisation of PCR-SSCP fragments of the oGH gene and primers used for the PCR analysis†
Fragment Primer
Name Type Length Localisation (bp) Name Sequence
Annealing
temperature (ºC)
I 5’-UTR, E1 125 205 to 329 GH5’-Fwd:
GH5’-Rev:
5’ GGG AAA GGG AGA GAG AAG AAG CCA G 3’
5’ CAG CCA TCA TAG CTG GTG AGC TGT C 3’ 68
II 5’-UTR, E1, I1 112 248 to 359 GH1-Fwd:
GH1-Rev:
5’ CAG AGA CCA ATT CCA GGA TC 3’
5’ TAA TGG AGG GGA TTT TCG TG 3’ 57
III I1, E2, I2 198 569 to 766 GH2-Fwd:
GH2-Rev:
5’ CTC TCC CTA GGG CCC CGG AC 3’
5’ TCT AGG ACA CAT CTC TGG GG 3’ 65
IV I2, E3, I3 154 967 to 1110 GH3-Fwd:
GH3-Rev:
5’ CTC CCC CCA GGA GCG CAC CT 3’
5’ GCT CCT CGG TCC TAG GTG GC 3’ 60
V I3, E4, I4 200 1303 to 1502 GH4-Fwd:
GH4-Rev:
5’ CTG CCA GCA GGA CTT GGA GC 3’
5’ GGA AGG GAC CCA ACA ATG CCA 3’ 60
VI I4, E5, 3’-UTR 289 1740 to 2028 GH5-Fwd:
GH5-Rev:
5’ CCC TTG GCA GGA GCT GGA AG 3’
5’ AAA GGA CAG TGG GCA CTG GA 3’ 67
VII E5, 3’-UTR 150 1943 to 2092 GH3’-Fwd:
GH3’-Rev:
5’ CCT TCT AGT TGC CAG CCA TCT GTT G 3’
5’ CCA CCC CCT AGA ATA GAA TGA CAC CTA C 3’ 64.5
† According to the published oGH gene sequence GenBank accession number X12546 (Orian et al., 1988).
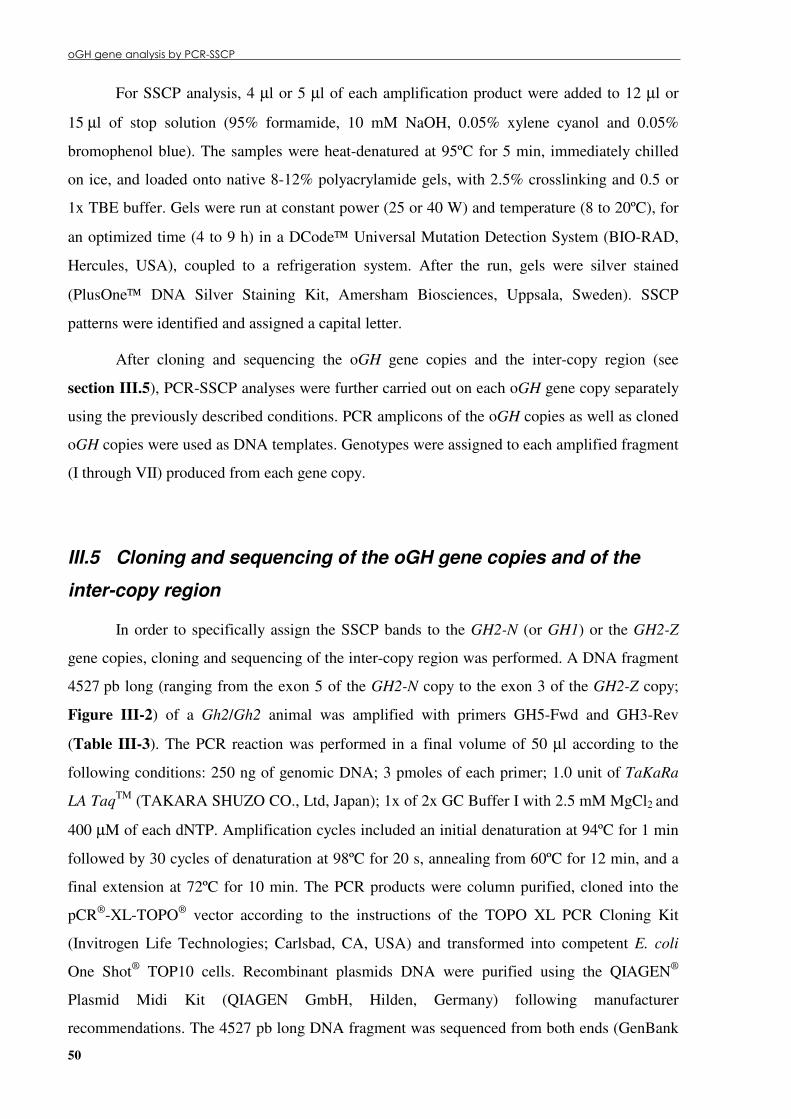
��� �����������!�"#�$��#"
50
For SSCP analysis, 4 µl or 5 µl of each amplification product were added to 12 µl or
15 µl of stop solution (95% formamide, 10 mM NaOH, 0.05% xylene cyanol and 0.05%
bromophenol blue). The samples were heat-denatured at 95ºC for 5 min, immediately chilled
on ice, and loaded onto native 8-12% polyacrylamide gels, with 2.5% crosslinking and 0.5 or
1x TBE buffer. Gels were run at constant power (25 or 40 W) and temperature (8 to 20ºC), for
an optimized time (4 to 9 h) in a DCode Universal Mutation Detection System (BIO-RAD,
Hercules, USA), coupled to a refrigeration system. After the run, gels were silver stained
(PlusOne DNA Silver Staining Kit, Amersham Biosciences, Uppsala, Sweden). SSCP
patterns were identified and assigned a capital letter.
After cloning and sequencing the oGH gene copies and the inter-copy region (see
section �III.5), PCR-SSCP analyses were further carried out on each oGH gene copy separately
using the previously described conditions. PCR amplicons of the oGH copies as well as cloned
oGH copies were used as DNA templates. Genotypes were assigned to each amplified fragment
(I through VII) produced from each gene copy.
III.5 Cloning and sequencing of the oGH gene copies and of the
inter-copy region
In order to specifically assign the SSCP bands to the GH2-N (or GH1) or the GH2-Z
gene copies, cloning and sequencing of the inter-copy region was performed. A DNA fragment
4527 pb long (ranging from the exon 5 of the GH2-N copy to the exon 3 of the GH2-Z copy;
Figure �III-2) of a Gh2/Gh2 animal was amplified with primers GH5-Fwd and GH3-Rev
(Table �III-3). The PCR reaction was performed in a final volume of 50 µl according to the
following conditions: 250 ng of genomic DNA; 3 pmoles of each primer; 1.0 unit of TaKaRa
LA TaqTM (TAKARA SHUZO CO., Ltd, Japan); 1x of 2x GC Buffer I with 2.5 mM MgCl2 and
400 µM of each dNTP. Amplification cycles included an initial denaturation at 94ºC for 1 min
followed by 30 cycles of denaturation at 98ºC for 20 s, annealing from 60ºC for 12 min, and a
final extension at 72ºC for 10 min. The PCR products were column purified, cloned into the
pCR®-XL-TOPO® vector according to the instructions of the TOPO XL PCR Cloning Kit
(Invitrogen Life Technologies; Carlsbad, CA, USA) and transformed into competent E. coli
One Shot® TOP10 cells. Recombinant plasmids DNA were purified using the QIAGEN®
Plasmid Midi Kit (QIAGEN GmbH, Hilden, Germany) following manufacturer
recommendations. The 4527 pb long DNA fragment was sequenced from both ends (GenBank
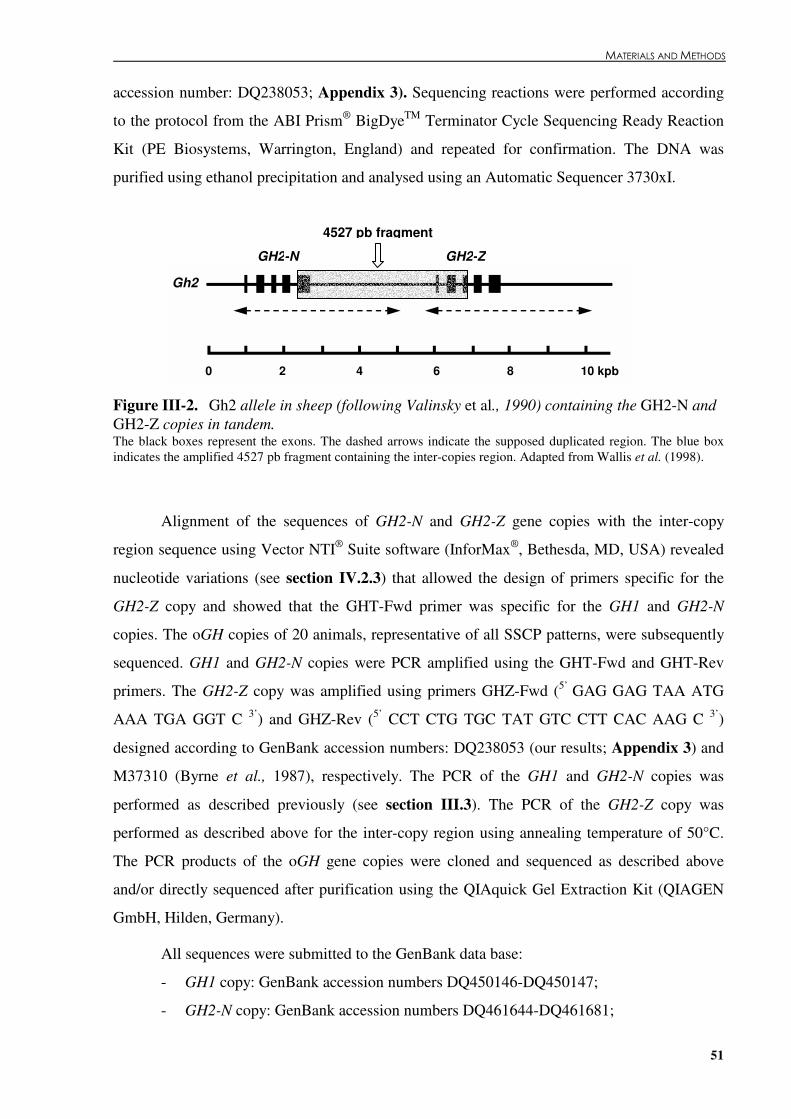
� � ��������������� ��
51
accession number: DQ238053; Appendix 3). Sequencing reactions were performed according
to the protocol from the ABI Prism® BigDyeTM Terminator Cycle Sequencing Ready Reaction
Kit (PE Biosystems, Warrington, England) and repeated for confirmation. The DNA was
purified using ethanol precipitation and analysed using an Automatic Sequencer 3730xI.
Figure �III-2. Gh2 allele in sheep (following Valinsky et al., 1990) containing the GH2-N and GH2-Z copies in tandem. The black boxes represent the exons. The dashed arrows indicate the supposed duplicated region. The blue box indicates the amplified 4527 pb fragment containing the inter-copies region. Adapted from Wallis et al. (1998).
Alignment of the sequences of GH2-N and GH2-Z gene copies with the inter-copy
region sequence using Vector NTI® Suite software (InforMax®, Bethesda, MD, USA) revealed
nucleotide variations (see section �IV.2.3) that allowed the design of primers specific for the
GH2-Z copy and showed that the GHT-Fwd primer was specific for the GH1 and GH2-N
copies. The oGH copies of 20 animals, representative of all SSCP patterns, were subsequently
sequenced. GH1 and GH2-N copies were PCR amplified using the GHT-Fwd and GHT-Rev
primers. The GH2-Z copy was amplified using primers GHZ-Fwd (5’ GAG GAG TAA ATG
AAA TGA GGT C 3’) and GHZ-Rev (5’ CCT CTG TGC TAT GTC CTT CAC AAG C 3’)
designed according to GenBank accession numbers: DQ238053 (our results; Appendix 3) and
M37310 (Byrne et al., 1987), respectively. The PCR of the GH1 and GH2-N copies was
performed as described previously (see section �III.3). The PCR of the GH2-Z copy was
performed as described above for the inter-copy region using annealing temperature of 50°C.
The PCR products of the oGH gene copies were cloned and sequenced as described above
and/or directly sequenced after purification using the QIAquick Gel Extraction Kit (QIAGEN
GmbH, Hilden, Germany).
All sequences were submitted to the GenBank data base:
- GH1 copy: GenBank accession numbers DQ450146-DQ450147;
- GH2-N copy: GenBank accession numbers DQ461644-DQ461681;
Gh2
0 2 4 6 8 10 kpb
GH2-N GH2-Z
4527 pb fragment

������������� ��������������������������������������������������������� �
52
- GH2-Z copy: GenBank accession numbers DQ461615-DQ461643.
After alignment of the sequencing data (Vector NTI Suite software, InforMax,
Bethesda, MD, USA), GH2-N, GH2-Z and associated GH2-N and GH2-Z genotypes were
established. Haplotypes and their frequencies were inferred using the Family-Based
Association Tests software (FBAT; Horvath et al., 2004).
The HWE of the SSCP alleles of GH2-N and GH2-Z copies was tested with the
population genetic software package GENEPOP v3.4 (http://wbiomed.curtin.edu.au/genepop/;
Garnier-Gere and Dillmann, 1992; Raymond and Rousset, 1995a, b). Estimation of exact
P-values was performed by the Markov chain method. Markov chain parameters for all tests
were: dememorization – 10000; batches – 100; and iterations per batch – 5000.
III.6 Statistical analysis
III.6.1 oGH copy number genotypes
Two different statistical analyses were performed considering two data sets:
- Data set 1 – milk yield records of the genotyped ewes;
- Data set 2 – milk yield records of the genotyped animals (ewes and rams) progeny.
III.6.1.1 Data set 1 – Milk yield in the genotyped ewes
Data set 1 was statistically analysed to test possible associations between milk yield
adjusted to 150 lactation days and copy number genotypes. Data was analysed by restricted
maximum likelihood (REML) through univariate analyses with repeated measures using the
BLUP - Animal Model and multiple-trait derivative free restricted maximum likelihood
analysis (MTDFREML; Boldman et al., 1993). The following model was used:
y = Xβ + Zaa + Zpp + e
where, y is the vector of milk records; ββββ is the vector of fixed effects which included
the effect of year-flock (year 1992 flock 1, year 1997 flock 1, …, year 2001 flock 7), of month
of lambing (August, September, …, December), type of lambing (simple or multiple), variety
(white or black), the linear and quadratic effect of the ewes’ lambing age, and the effect
associated with the genotypes studied; a is the vector of random additive genetic effects; p is
the vector of random permanent environmental effects; e is the vector of random residual

� � ��������������� ��
53
effects. X, Za and Zp are the incidence matrixes which relate the fixed (X) and random (Za and
Zp) effects with the vector of milk records, y. In the relationship matrix A 750 animals were
considered.
To solve the mixed model equations (MME; 1) it was assumed that �=2.4, which
corresponds to milk production heritability of 0.25 and that γ=4, which corresponds to a
repeatability of 0.40.
(1) ���
�
�
���
�
�
=���
�
�
���
�
�
���
�
�
���
�
�
γ+α+ −
yZ
yZ
yX
p
a
b
IZZZZXZ
ZZAZZXZ
ZXZXXX
''
'
''''''
'''1
In the mixed model equations, A is the relationship matrix between all animals
(genotyped ewes with milk records and their pedigrees: 750 animals); I is the identity matrix;
b is the solution for fixed effects; a is the solution for genetic effects and p is the solution for
permanent environmental effects, where:
2
2
a
e
σσ
=α and 2
2
pe
e
σσ=γ
Solutions for the effects of the analysed genotypes upon milk yield, contrasts between
the analysed genotypes and the corresponding significance test were obtained through option 4
of the subroot MTDFRUN (solutions for MME then sampling variances) from the
MTDFREML program (Boldman et al., 1993), using estimates of genetic additive ( 2aσ ),
permanent environmental ( 2peσ ) and residual ( 2
eσ ) variances of the "Serra da Estrela" ovine
population (Department of "Genética e Melhoramento Animal" of the EZN, personnal
communication).
Only genotypes Gh1/Gh2 and Gh2/Gh2 were considered, as genotype Gh1/Gh1 was
only found in one ewe.
III.6.1.2 Data set 2 – Milk yield in the genotyped animals’ progeny
Data set 2 was statistically analysed to test possible associations between milk yield
adjusted to 150 lactation days and the probability of a ewe to receive allele Gh2 from its
genotyped progenitor (dam or sire). The probability values were 0, 0.5 or 1 depending on
whether the progenitor genotype was Gh1/Gh1, Gh1/Gh2 or Gh2/Gh2. Data was analysed
following two models.
�������������������
54
Model 1 was similar to the model described in section �III.6.1.1, considering the
probability of a ewe to receive allele Gh2 from its genotyped progenitor (dam or sire) as a fixed
effect. The fixed effect of the genotyped progenitor was added to the model. . Thus the vector
of fixed effects (ββββ) included the effect of year-flock (year 1995 flock 1, year 1997 flock 1, …,
year 2005 flock 30), of month of lambing (August, September, …, February), type of lambing
(simple or multiple), variety (white or black), the linear and quadratic effect of the ewes’
lambing age, and the effect of the probability of a ewe to receive allele Gh2 from its genotyped
progenitor (dam or sire). In the relationship matrix A 1113 animals were considered.
Model 2 was similar to model 1, but the probability of a ewe to receive allele Gh2 from
its genotyped progenitor (dam or sire) was analysed as a covariate. A regression coefficient (b1)
was obtained for the Gh2 allele, which corresponds to the milk yield deviation observed for
each additional Gh2 allele received from the progenitor. Regression coefficient was considered
significant (P<0.05) when b1 absolute value was higher than twice its respective standard error
(SE) (if �b1�– 2×SE > 0, then P<0.05; Boldman et al., 1995).
III.6.2 Polymorphism at the oGH copies
Data was statistically analysed to test possible associations between milk, fat and
protein yields adjusted to 150 lactation days, fat and protein contents and oGH2-N and GH2-Z
copies genotypes and phenotypes taken separately or associated. Data was analysed as
described in section �III.6.1.1. The vector of fixed effects (ββββ) included the effect of year-flock
(year 1996 flock 1, year 1997 flock 1, …, year 2000 flock 7), of month of lambing (August,
September, …, December), type of lambing (simple or multiple), variety (white or black), the
linear and quadratic effect of the ewes’ lambing age, and the effect associated with the
genotypes and phenotypes studied. In the relationship matrix A 750 animals were considered.
Milk fat and protein contents and milk fat and protein yield were only available from
1998 and in six flocks. Thus, the effect of year-flock was replaced by the effect of the flock
only. To solve the mixed model equations (1, see section �III.6.1.1) a heritability of 0.40 was
considered for milk fat and protein contents and of 0.25 for milk fat and protein yields.
� � ��������������� ��
55
III.7 Bioinformatics
The sequences obtained were analysed using specific bioinformatics tools.
III.7.1 Gene finding
Gene finding were performed both by homology and ab initio methods. The homology
method used was BLASTN (Altschul et al., 1997; http://www.ncbi.nlm.nih.gov/BLASTN/), a
standard pairwise comparison method which indicates the rough position of exons. The ab
initio methods used were:
- NetGene2 v2.4 (Brunak et al., 1991; Hebsgaard et al., 1996; http://www.cbs.dtu.dk/
services/NetGene2/) uses artificial neural networks to predict splice sites location.
- GENSCAN 1.0 (Burge and Karlin, 1997; http://genes.mit.edu/GENSCAN.html). It
uses generalized hidden Markov models (GHMM) to predict complete gene
structures.
- Eukaryotic GeneMark.hmm v2.2a (Lomsadze et al., 2005; http://exon.gatech.edu/
GeneMark/eukhmm.cgi) with Homo sapiens matrix. It uses explicit state duration
hidden Markov models (HMMs). The optimal gene candidates, selected by HMM
and dynamic programming are further processed by a ribosomal binding site
recognition algorithm.
The combined results of the referred methods led to a consensus in exon prediction and
allowed sequences annotation and subsequently protein inference.
III.7.2 Transcription factors binding sites
Sequencing results showed that the 5’ region of the oGH gene is identical in the GH1
and GH2-N copies and different from the GH2-Z copy. Thus, a characterization of the
regulatory factors involved in the oGH gene copies transcription control (~1 kb upstream of the
exon 1) was performed. Putative transcription factors binding sites were identified using the
PATCH public 1.0 pattern search for transcription factor binding sites (http://www.gene-
regulation.com/cgi-bin/pub/programs/patch/bin/patch.cgi) using TRANSFAC® 6.0 public sites
(BIOBASE Biological Databases/ Biologische Datenbanken GmbH, Wolfenbüttel, Germany;
Matys et al., 2003). The TRANSPLORER® site prediction tool uses position weight matrix
(Chen et al., 1995) and matrices derived from the TRANSFAC® database
(http://www.biobase.de/pages/ products/databases.html).

'����&��������
56
III.7.3 Protein analysis
Conceptual translation of each haplotype was done with Vector NTI Suite software
(InforMax, Bethesda, MD, USA). Protein motif search was run under PROSITE
(http://www.expasy.org/prosite/).

��� �
������
“Perfect as the wing of a bird may be, it will never enable the bird to fly if
unsupported by the air. Facts are the air of science.”
Ivan Pavlov (1849 - 1936)

58
��� �����___________________________________________________________ 57
IV.1 oGH copy number genotypes ______________________________________________ 59
IV.2 oGH gene SSCPs’ detection, charaterization and influence on milk traits ______________ 61
IV.3 Single nucleotide polymorphisms (SNPs) _______________________________________ 87
IV.4 Transcription factors binding sites ____________________________________________ 91
IV.5 Protein structure prediction _______________________________________________ 92
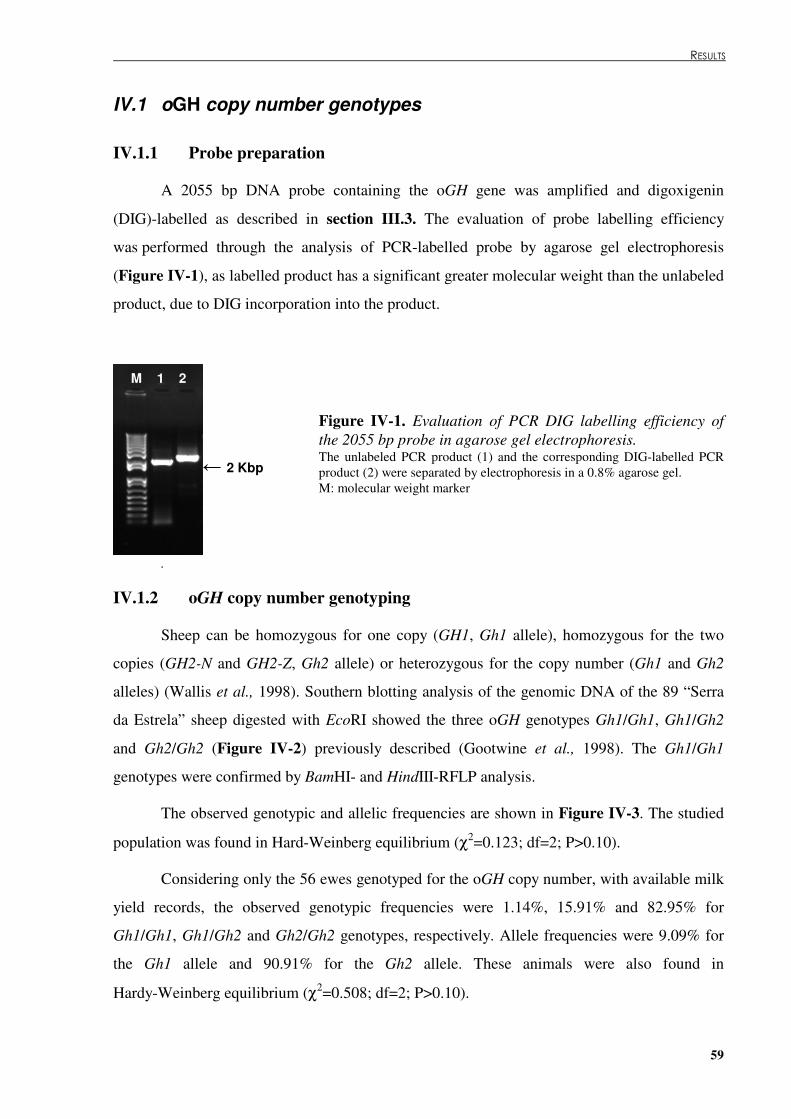
� � ��������
59
IV.1 oGH copy number genotypes
IV.1.1 Probe preparation
A 2055 bp DNA probe containing the oGH gene was amplified and digoxigenin
(DIG)-labelled as described in section �III.3. The evaluation of probe labelling efficiency
was performed through the analysis of PCR-labelled probe by agarose gel electrophoresis
(Figure �IV-1), as labelled product has a significant greater molecular weight than the unlabeled
product, due to DIG incorporation into the product.
Figure �IV-1. Evaluation of PCR DIG labelling efficiency of the 2055 bp probe in agarose gel electrophoresis. The unlabeled PCR product (1) and the corresponding DIG-labelled PCR product (2) were separated by electrophoresis in a 0.8% agarose gel. M: molecular weight marker
.
IV.1.2 oGH copy number genotyping
Sheep can be homozygous for one copy (GH1, Gh1 allele), homozygous for the two
copies (GH2-N and GH2-Z, Gh2 allele) or heterozygous for the copy number (Gh1 and Gh2
alleles) (Wallis et al., 1998). Southern blotting analysis of the genomic DNA of the 89 “Serra
da Estrela” sheep digested with EcoRI showed the three oGH genotypes Gh1/Gh1, Gh1/Gh2
and Gh2/Gh2 (Figure �IV-2) previously described (Gootwine et al., 1998). The Gh1/Gh1
genotypes were confirmed by BamHI- and HindIII-RFLP analysis.
The observed genotypic and allelic frequencies are shown in Figure �IV-3. The studied
population was found in Hard-Weinberg equilibrium (χ2=0.123; df=2; P>0.10).
Considering only the 56 ewes genotyped for the oGH copy number, with available milk
yield records, the observed genotypic frequencies were 1.14%, 15.91% and 82.95% for
Gh1/Gh1, Gh1/Gh2 and Gh2/Gh2 genotypes, respectively. Allele frequencies were 9.09% for
the Gh1 allele and 90.91% for the Gh2 allele. These animals were also found in
Hardy-Weinberg equilibrium (χ2=0.508; df=2; P>0.10).
� 2 Kbp
M 1 2

����� ������������� ���� � �
60
Figure �IV-2. EcoRI-restriction fragment length polymorphism at the growth hormone locus in “Serra da Estrela” sheep. Ovine genomic DNA was digested with EcoRI, separated on a 0.8% agarose gel, and blotted onto positively charged nylon membranes. The blots were hybridized with 50 ng/mL of a DIG-labeled oGH gene DNA probe. Chemiluminescent detection was according to the standard DIG chemiluminescent detection procedure using CSPD at 0.25 mM final concentration and exposure of the blot to X-ray film for 30 min.
15.73
2.25
82.02
10.11
89.89
0
20
40
60
80
100
Gh1/Gh1 Gh1/Gh2 Gh2/Gh2 Gh1 Gh2
%
Figure �IV-3. oGH copy number genotypic and allelic frequencies in the “Serra da Estrela” sheep.
IV.1.3 Statistical analysis
IV.1.3.1 Milk yield in the genotyped ewes The impact of the oGH copy number genotype on milk yield adjusted to 150 lactation
days was statistically analysed as described section �III.6.1.1. The number of records used in
univariate analyses was 259 lactations from the 56 oGH copy number genotyped ewes. The
mean milk yield adjusted to 150 lactation days (± SD) was 180.8 ± 90.6 l.
Ewes with Gh2/Gh2 genotype produced 4.9 ± 8.6 l/150 d more than ewes with
Gh1/Gh2 genotype (P>0.05). Only one ewe of the genotyped population presented the
Gh1/Gh1 genotype, so this genotype was not considered in the analysis.
IV.1.3.2 Milk yield in the genotyped ewes animals’ progeny The impact of the probability of a ewe to receive the Gh2 allele from either progenitor
on milk yield adjusted to 150 lactation days was statistically analysed as described in
12 kb
6 kb
������� ������� � ��� ���� �
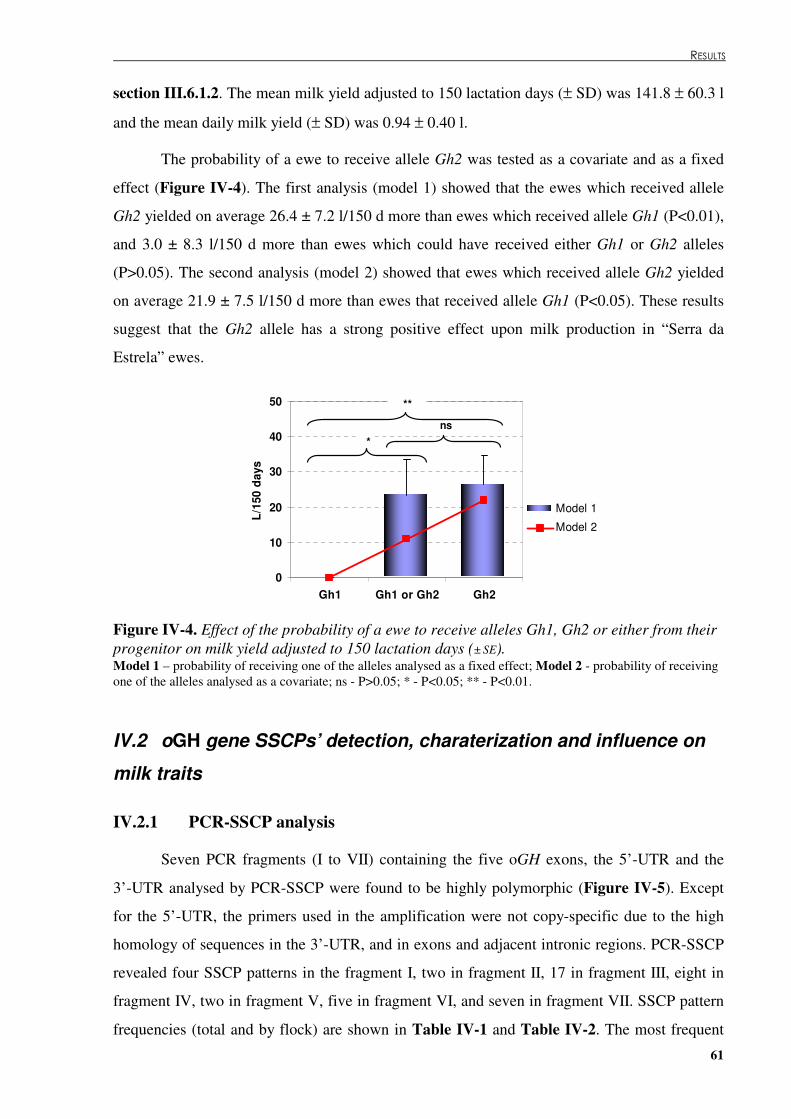
� � ��������
61
section �III.6.1.2. The mean milk yield adjusted to 150 lactation days (± SD) was 141.8 ± 60.3 l
and the mean daily milk yield (± SD) was 0.94 ± 0.40 l.
The probability of a ewe to receive allele Gh2 was tested as a covariate and as a fixed
effect (Figure �IV-4). The first analysis (model 1) showed that the ewes which received allele
Gh2 yielded on average 26.4 ± 7.2 l/150 d more than ewes which received allele Gh1 (P<0.01),
and 3.0 ± 8.3 l/150 d more than ewes which could have received either Gh1 or Gh2 alleles
(P>0.05). The second analysis (model 2) showed that ewes which received allele Gh2 yielded
on average 21.9 ± 7.5 l/150 d more than ewes that received allele Gh1 (P<0.05). These results
suggest that the Gh2 allele has a strong positive effect upon milk production in “Serra da
Estrela” ewes.
0
10
20
30
40
50
Gh1 Gh1 or Gh2 Gh2
L/15
0 da
ys
Model 1
Model 2
*
**
ns
Figure �IV-4. Effect of the probability of a ewe to receive alleles Gh1, Gh2 or either from their progenitor on milk yield adjusted to 150 lactation days (± SE). Model 1 – probability of receiving one of the alleles analysed as a fixed effect; Model 2 - probability of receiving one of the alleles analysed as a covariate; ns - P>0.05; * - P<0.05; ** - P<0.01.
IV.2 oGH gene SSCPs’ detection, charaterization and influence on
milk traits
IV.2.1 PCR-SSCP analysis
Seven PCR fragments (I to VII) containing the five oGH exons, the 5’-UTR and the
3’-UTR analysed by PCR-SSCP were found to be highly polymorphic (Figure �IV-5). Except
for the 5’-UTR, the primers used in the amplification were not copy-specific due to the high
homology of sequences in the 3’-UTR, and in exons and adjacent intronic regions. PCR-SSCP
revealed four SSCP patterns in the fragment I, two in fragment II, 17 in fragment III, eight in
fragment IV, two in fragment V, five in fragment VI, and seven in fragment VII. SSCP pattern
frequencies (total and by flock) are shown in Table �IV-1 and Table �IV-2. The most frequent
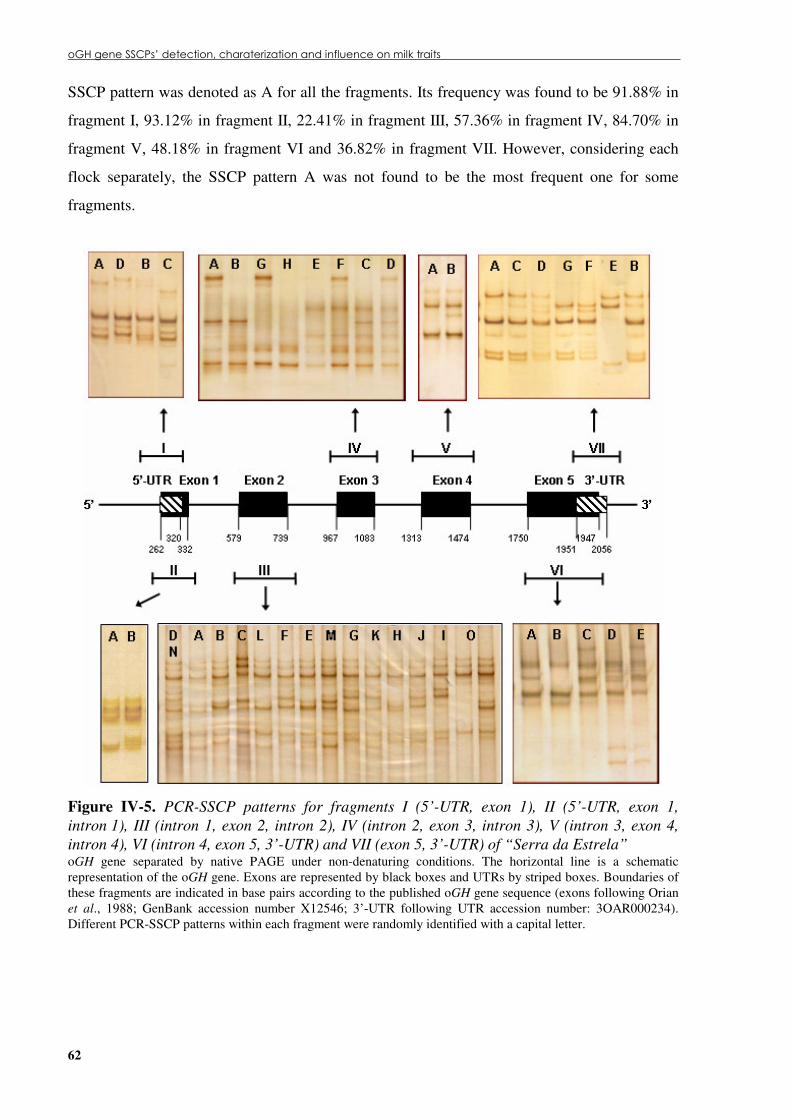
���� ����������������� ���������������� �� ��� ���� ���� ������������� �
62
SSCP pattern was denoted as A for all the fragments. Its frequency was found to be 91.88% in
fragment I, 93.12% in fragment II, 22.41% in fragment III, 57.36% in fragment IV, 84.70% in
fragment V, 48.18% in fragment VI and 36.82% in fragment VII. However, considering each
flock separately, the SSCP pattern A was not found to be the most frequent one for some
fragments.
Figure �IV-5. PCR-SSCP patterns for fragments I (5’-UTR, exon 1), II (5’-UTR, exon 1, intron 1), III (intron 1, exon 2, intron 2), IV (intron 2, exon 3, intron 3), V (intron 3, exon 4, intron 4), VI (intron 4, exon 5, 3’-UTR) and VII (exon 5, 3’-UTR) of “Serra da Estrela” oGH gene separated by native PAGE under non-denaturing conditions. The horizontal line is a schematic representation of the oGH gene. Exons are represented by black boxes and UTRs by striped boxes. Boundaries of these fragments are indicated in base pairs according to the published oGH gene sequence (exons following Orian et al., 1988; GenBank accession number X12546; 3’-UTR following UTR accession number: 3OAR000234). Different PCR-SSCP patterns within each fragment were randomly identified with a capital letter.
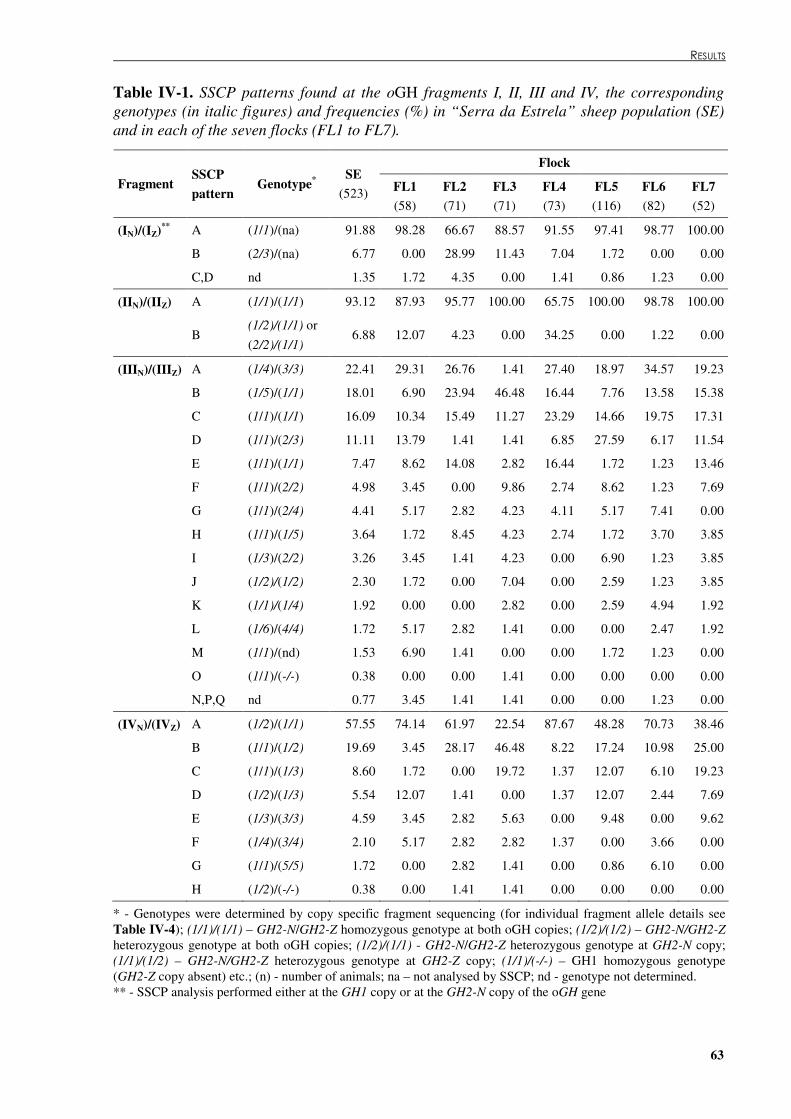
� � ��������
63
Table �IV-1. SSCP patterns found at the oGH fragments I, II, III and IV, the corresponding genotypes (in italic figures) and frequencies (%) in “Serra da Estrela” sheep population (SE) and in each of the seven flocks (FL1 to FL7).
Flock Fragment
SSCP pattern
Genotype* SE
(523) FL1 (58)
FL2 (71)
FL3 (71)
FL4 (73)
FL5 (116)
FL6 (82)
FL7 (52)
(IN)/(IZ)** A (1/1)/(na) 91.88 98.28 66.67 88.57 91.55 97.41 98.77 100.00
B (2/3)/(na) 6.77 0.00 28.99 11.43 7.04 1.72 0.00 0.00
C,D nd 1.35 1.72 4.35 0.00 1.41 0.86 1.23 0.00
(IIN)/(IIZ) A (1/1)/(1/1) 93.12 87.93 95.77 100.00 65.75 100.00 98.78 100.00
B
(1/2)/(1/1) or (2/2)/(1/1)
6.88 12.07 4.23 0.00 34.25 0.00 1.22 0.00
(IIIN)/(IIIZ) A (1/4)/(3/3) 22.41 29.31 26.76 1.41 27.40 18.97 34.57 19.23
B (1/5)/(1/1) 18.01 6.90 23.94 46.48 16.44 7.76 13.58 15.38
C (1/1)/(1/1) 16.09 10.34 15.49 11.27 23.29 14.66 19.75 17.31
D (1/1)/(2/3) 11.11 13.79 1.41 1.41 6.85 27.59 6.17 11.54
E (1/1)/(1/1) 7.47 8.62 14.08 2.82 16.44 1.72 1.23 13.46
F (1/1)/(2/2) 4.98 3.45 0.00 9.86 2.74 8.62 1.23 7.69
G (1/1)/(2/4) 4.41 5.17 2.82 4.23 4.11 5.17 7.41 0.00
H (1/1)/(1/5) 3.64 1.72 8.45 4.23 2.74 1.72 3.70 3.85
I (1/3)/(2/2) 3.26 3.45 1.41 4.23 0.00 6.90 1.23 3.85
J (1/2)/(1/2) 2.30 1.72 0.00 7.04 0.00 2.59 1.23 3.85
K (1/1)/(1/4) 1.92 0.00 0.00 2.82 0.00 2.59 4.94 1.92
L (1/6)/(4/4) 1.72 5.17 2.82 1.41 0.00 0.00 2.47 1.92
M (1/1)/(nd) 1.53 6.90 1.41 0.00 0.00 1.72 1.23 0.00
O (1/1)/(-/-) 0.38 0.00 0.00 1.41 0.00 0.00 0.00 0.00
N,P,Q nd 0.77 3.45 1.41 1.41 0.00 0.00 1.23 0.00
(IVN)/(IVZ) A (1/2)/(1/1) 57.55 74.14 61.97 22.54 87.67 48.28 70.73 38.46
B (1/1)/(1/2) 19.69 3.45 28.17 46.48 8.22 17.24 10.98 25.00
C (1/1)/(1/3) 8.60 1.72 0.00 19.72 1.37 12.07 6.10 19.23
D (1/2)/(1/3) 5.54 12.07 1.41 0.00 1.37 12.07 2.44 7.69
E (1/3)/(3/3) 4.59 3.45 2.82 5.63 0.00 9.48 0.00 9.62
F (1/4)/(3/4) 2.10 5.17 2.82 2.82 1.37 0.00 3.66 0.00
G (1/1)/(5/5) 1.72 0.00 2.82 1.41 0.00 0.86 6.10 0.00
H (1/2)/(-/-) 0.38 0.00 1.41 1.41 0.00 0.00 0.00 0.00
* - Genotypes were determined by copy specific fragment sequencing (for individual fragment allele details see Table �IV-4); (1/1)/(1/1) – GH2-N/GH2-Z homozygous genotype at both oGH copies; (1/2)/(1/2) – GH2-N/GH2-Z heterozygous genotype at both oGH copies; (1/2)/(1/1) - GH2-N/GH2-Z heterozygous genotype at GH2-N copy; (1/1)/(1/2) – GH2-N/GH2-Z heterozygous genotype at GH2-Z copy; (1/1)/(-/-) – GH1 homozygous genotype (GH2-Z copy absent) etc.; (n) - number of animals; na – not analysed by SSCP; nd - genotype not determined. ** - SSCP analysis performed either at the GH1 copy or at the GH2-N copy of the oGH gene
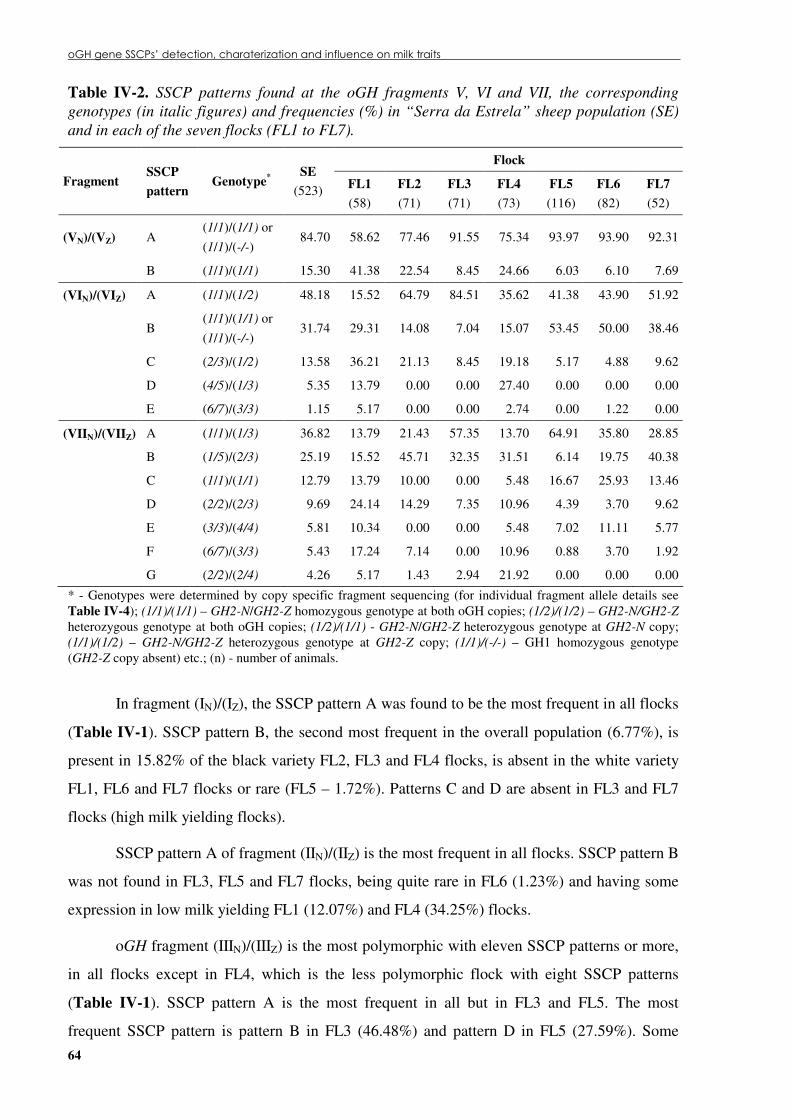
����������������������������������������������� !�����������!"�������� �
64
Table �IV-2. SSCP patterns found at the oGH fragments V, VI and VII, the corresponding genotypes (in italic figures) and frequencies (%) in “Serra da Estrela” sheep population (SE) and in each of the seven flocks (FL1 to FL7).
Flock Fragment
SSCP pattern
Genotype* SE
(523) FL1 (58)
FL2 (71)
FL3 (71)
FL4 (73)
FL5 (116)
FL6 (82)
FL7 (52)
(VN)/(VZ) A (1/1)/(1/1) or (1/1)/(-/-)
84.70 58.62 77.46 91.55 75.34 93.97 93.90 92.31
B (1/1)/(1/1) 15.30 41.38 22.54 8.45 24.66 6.03 6.10 7.69
(VIN)/(VIZ) A (1/1)/(1/2) 48.18 15.52 64.79 84.51 35.62 41.38 43.90 51.92
B
(1/1)/(1/1) or (1/1)/(-/-)
31.74 29.31 14.08 7.04 15.07 53.45 50.00 38.46
C (2/3)/(1/2) 13.58 36.21 21.13 8.45 19.18 5.17 4.88 9.62
D (4/5)/(1/3) 5.35 13.79 0.00 0.00 27.40 0.00 0.00 0.00
E (6/7)/(3/3) 1.15 5.17 0.00 0.00 2.74 0.00 1.22 0.00
(VIIN)/(VIIZ) A (1/1)/(1/3) 36.82 13.79 21.43 57.35 13.70 64.91 35.80 28.85
B (1/5)/(2/3) 25.19 15.52 45.71 32.35 31.51 6.14 19.75 40.38
C (1/1)/(1/1) 12.79 13.79 10.00 0.00 5.48 16.67 25.93 13.46
D (2/2)/(2/3) 9.69 24.14 14.29 7.35 10.96 4.39 3.70 9.62
E (3/3)/(4/4) 5.81 10.34 0.00 0.00 5.48 7.02 11.11 5.77
F (6/7)/(3/3) 5.43 17.24 7.14 0.00 10.96 0.88 3.70 1.92
G (2/2)/(2/4) 4.26 5.17 1.43 2.94 21.92 0.00 0.00 0.00
* - Genotypes were determined by copy specific fragment sequencing (for individual fragment allele details see Table �IV-4); (1/1)/(1/1) – GH2-N/GH2-Z homozygous genotype at both oGH copies; (1/2)/(1/2) – GH2-N/GH2-Z heterozygous genotype at both oGH copies; (1/2)/(1/1) - GH2-N/GH2-Z heterozygous genotype at GH2-N copy; (1/1)/(1/2) – GH2-N/GH2-Z heterozygous genotype at GH2-Z copy; (1/1)/(-/-) – GH1 homozygous genotype (GH2-Z copy absent) etc.; (n) - number of animals.
In fragment (IN)/(IZ), the SSCP pattern A was found to be the most frequent in all flocks
(Table �IV-1). SSCP pattern B, the second most frequent in the overall population (6.77%), is
present in 15.82% of the black variety FL2, FL3 and FL4 flocks, is absent in the white variety
FL1, FL6 and FL7 flocks or rare (FL5 – 1.72%). Patterns C and D are absent in FL3 and FL7
flocks (high milk yielding flocks).
SSCP pattern A of fragment (IIN)/(IIZ) is the most frequent in all flocks. SSCP pattern B
was not found in FL3, FL5 and FL7 flocks, being quite rare in FL6 (1.23%) and having some
expression in low milk yielding FL1 (12.07%) and FL4 (34.25%) flocks.
oGH fragment (IIIN)/(IIIZ) is the most polymorphic with eleven SSCP patterns or more,
in all flocks except in FL4, which is the less polymorphic flock with eight SSCP patterns
(Table �IV-1). SSCP pattern A is the most frequent in all but in FL3 and FL5. The most
frequent SSCP pattern is pattern B in FL3 (46.48%) and pattern D in FL5 (27.59%). Some
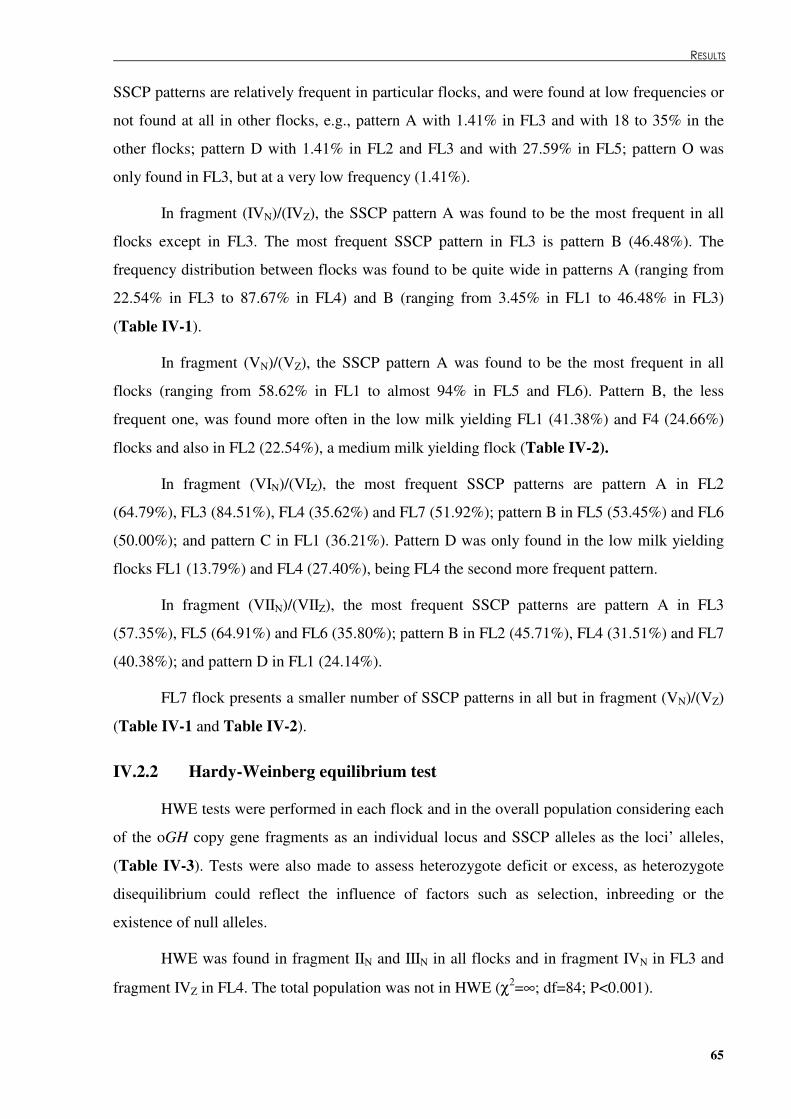
� � ��������
65
SSCP patterns are relatively frequent in particular flocks, and were found at low frequencies or
not found at all in other flocks, e.g., pattern A with 1.41% in FL3 and with 18 to 35% in the
other flocks; pattern D with 1.41% in FL2 and FL3 and with 27.59% in FL5; pattern O was
only found in FL3, but at a very low frequency (1.41%).
In fragment (IVN)/(IVZ), the SSCP pattern A was found to be the most frequent in all
flocks except in FL3. The most frequent SSCP pattern in FL3 is pattern B (46.48%). The
frequency distribution between flocks was found to be quite wide in patterns A (ranging from
22.54% in FL3 to 87.67% in FL4) and B (ranging from 3.45% in FL1 to 46.48% in FL3)
(Table �IV-1).
In fragment (VN)/(VZ), the SSCP pattern A was found to be the most frequent in all
flocks (ranging from 58.62% in FL1 to almost 94% in FL5 and FL6). Pattern B, the less
frequent one, was found more often in the low milk yielding FL1 (41.38%) and F4 (24.66%)
flocks and also in FL2 (22.54%), a medium milk yielding flock (Table �IV-2).
In fragment (VIN)/(VIZ), the most frequent SSCP patterns are pattern A in FL2
(64.79%), FL3 (84.51%), FL4 (35.62%) and FL7 (51.92%); pattern B in FL5 (53.45%) and FL6
(50.00%); and pattern C in FL1 (36.21%). Pattern D was only found in the low milk yielding
flocks FL1 (13.79%) and FL4 (27.40%), being FL4 the second more frequent pattern.
In fragment (VIIN)/(VIIZ), the most frequent SSCP patterns are pattern A in FL3
(57.35%), FL5 (64.91%) and FL6 (35.80%); pattern B in FL2 (45.71%), FL4 (31.51%) and FL7
(40.38%); and pattern D in FL1 (24.14%).
FL7 flock presents a smaller number of SSCP patterns in all but in fragment (VN)/(VZ)
(Table �IV-1 and Table �IV-2).
IV.2.2 Hardy-Weinberg equilibrium test
HWE tests were performed in each flock and in the overall population considering each
of the oGH copy gene fragments as an individual locus and SSCP alleles as the loci’ alleles,
(Table �IV-3). Tests were also made to assess heterozygote deficit or excess, as heterozygote
disequilibrium could reflect the influence of factors such as selection, inbreeding or the
existence of null alleles.
HWE was found in fragment IIN and IIIN in all flocks and in fragment IVN in FL3 and
fragment IVZ in FL4. The total population was not in HWE (χ2=∞; df=84; P<0.001).
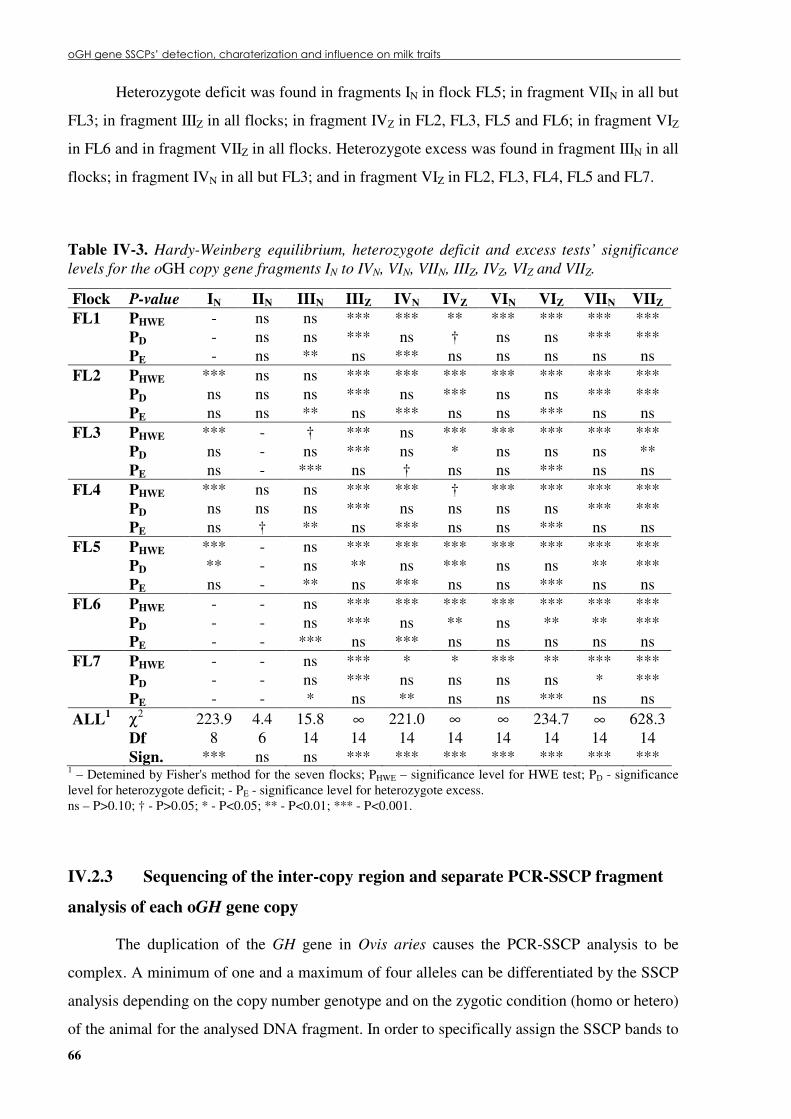
����������������������������������������������� !�����������!"�������� �
66
Heterozygote deficit was found in fragments IN in flock FL5; in fragment VIIN in all but
FL3; in fragment IIIZ in all flocks; in fragment IVZ in FL2, FL3, FL5 and FL6; in fragment VIZ
in FL6 and in fragment VIIZ in all flocks. Heterozygote excess was found in fragment IIIN in all
flocks; in fragment IVN in all but FL3; and in fragment VIZ in FL2, FL3, FL4, FL5 and FL7.
Table �IV-3. Hardy-Weinberg equilibrium, heterozygote deficit and excess tests’ significance levels for the oGH copy gene fragments IN to IVN, VIN, VIIN, IIIZ, IVZ, VIZ and VIIZ.
Flock P-value IN IIN IIIN IIIZ IVN IVZ VIN VIZ VIIN VIIZ FL1 PHWE - ns ns *** *** ** *** *** *** *** PD - ns ns *** ns † ns ns *** *** PE - ns ** ns *** ns ns ns ns ns FL2 PHWE *** ns ns *** *** *** *** *** *** *** PD ns ns ns *** ns *** ns ns *** *** PE ns ns ** ns *** ns ns *** ns ns FL3 PHWE *** - † *** ns *** *** *** *** *** PD ns - ns *** ns * ns ns ns ** PE ns - *** ns † ns ns *** ns ns FL4 PHWE *** ns ns *** *** † *** *** *** *** PD ns ns ns *** ns ns ns ns *** *** PE ns † ** ns *** ns ns *** ns ns FL5 PHWE *** - ns *** *** *** *** *** *** *** PD ** - ns ** ns *** ns ns ** *** PE ns - ** ns *** ns ns *** ns ns FL6 PHWE - - ns *** *** *** *** *** *** *** PD - - ns *** ns ** ns ** ** *** PE - - *** ns *** ns ns ns ns ns FL7 PHWE - - ns *** * * *** ** *** *** PD - - ns *** ns ns ns ns * *** PE - - * ns ** ns ns *** ns ns ALL1 χ2 223.9 4.4 15.8 ∞ 221.0 ∞ ∞ 234.7 ∞ 628.3 Df 8 6 14 14 14 14 14 14 14 14
Sign. *** ns ns *** *** *** *** *** *** *** 1 – Detemined by Fisher's method for the seven flocks; PHWE – significance level for HWE test; PD - significance level for heterozygote deficit; - PE - significance level for heterozygote excess. ns – P>0.10; † - P>0.05; * - P<0.05; ** - P<0.01; *** - P<0.001.
IV.2.3 Sequencing of the inter-copy region and separate PCR-SSCP fragment
analysis of each oGH gene copy
The duplication of the GH gene in Ovis aries causes the PCR-SSCP analysis to be
complex. A minimum of one and a maximum of four alleles can be differentiated by the SSCP
analysis depending on the copy number genotype and on the zygotic condition (homo or hetero)
of the animal for the analysed DNA fragment. In order to specifically assign the SSCP bands to
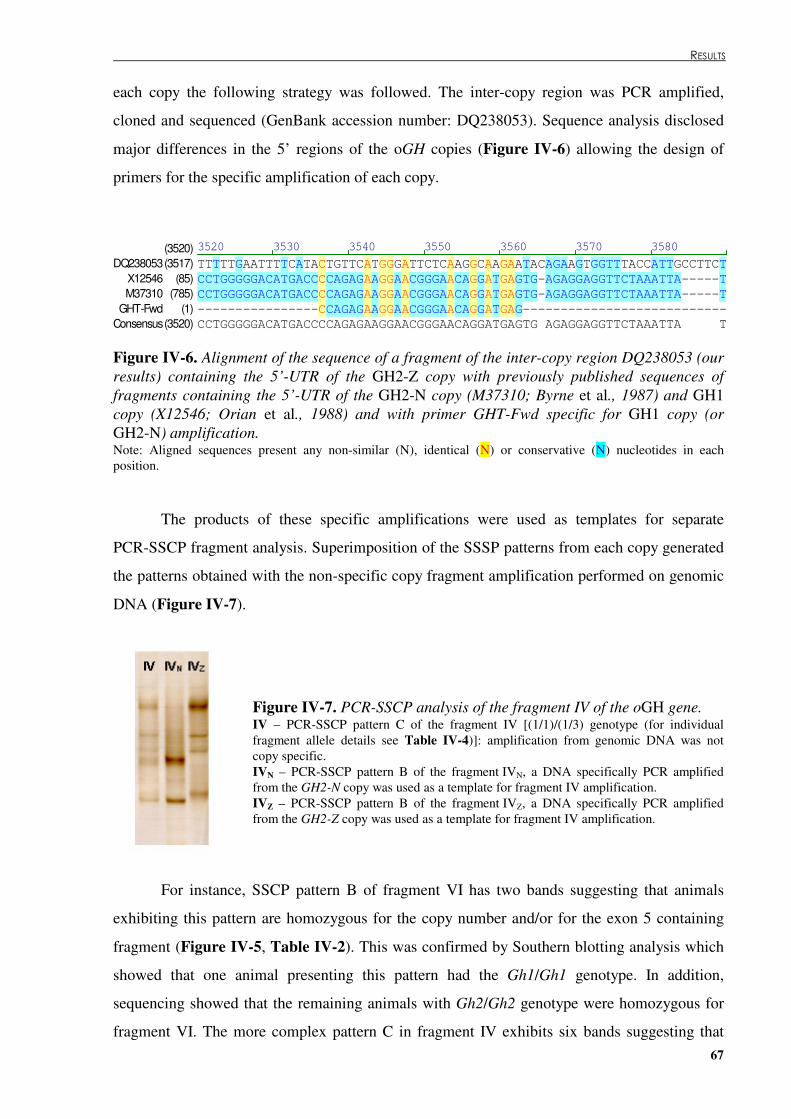
� � ��������
67
each copy the following strategy was followed. The inter-copy region was PCR amplified,
cloned and sequenced (GenBank accession number: DQ238053). Sequence analysis disclosed
major differences in the 5’ regions of the oGH copies (Figure �IV-6) allowing the design of
primers for the specific amplification of each copy.
3520 3530 3540 3550 3560 3570 3580(3520)TTTTTGAATTTTCATACTGTTCATGGGATTCTCAAGGCAAGAATACAGAAGTGGTTTACCATTGCCTTCTDQ238053(3517)CCTGGGGGACATGACCCCAGAGAAGGAACGGGAACAGGATGAGTG-AGAGGAGGTTCTAAATTA-----TX12546 (85)CCTGGGGGACATGACCCCAGAGAAGGAACGGGAACAGGATGAGTG-AGAGGAGGTTCTAAATTA-----TM37310 (785)----------------CCAGAGAAGGAACGGGAACAGGATGAG---------------------------GHT-Fwd (1)CCTGGGGGACATGACCCCAGAGAAGGAACGGGAACAGGATGAGTG AGAGGAGGTTCTAAATTA TConsensus(3520)
Figure �IV-6. Alignment of the sequence of a fragment of the inter-copy region DQ238053 (our results) containing the 5’-UTR of the GH2-Z copy with previously published sequences of fragments containing the 5’-UTR of the GH2-N copy (M37310; Byrne et al., 1987) and GH1 copy (X12546; Orian et al., 1988) and with primer GHT-Fwd specific for GH1 copy (or GH2-N) amplification. Note: Aligned sequences present any non-similar (N), identical (N) or conservative (N) nucleotides in each position.
The products of these specific amplifications were used as templates for separate
PCR-SSCP fragment analysis. Superimposition of the SSSP patterns from each copy generated
the patterns obtained with the non-specific copy fragment amplification performed on genomic
DNA (Figure �IV-7).
Figure �IV-7. PCR-SSCP analysis of the fragment IV of the oGH gene. IV – PCR-SSCP pattern C of the fragment IV [(1/1)/(1/3) genotype (for individual fragment allele details see Table �IV-4)]: amplification from genomic DNA was not copy specific. IVN – PCR-SSCP pattern B of the fragment IVN, a DNA specifically PCR amplified from the GH2-N copy was used as a template for fragment IV amplification. IVZ – PCR-SSCP pattern B of the fragment IVZ, a DNA specifically PCR amplified from the GH2-Z copy was used as a template for fragment IV amplification.
For instance, SSCP pattern B of fragment VI has two bands suggesting that animals
exhibiting this pattern are homozygous for the copy number and/or for the exon 5 containing
fragment (Figure �IV-5, Table �IV-2). This was confirmed by Southern blotting analysis which
showed that one animal presenting this pattern had the Gh1/Gh1 genotype. In addition,
sequencing showed that the remaining animals with Gh2/Gh2 genotype were homozygous for
fragment VI. The more complex pattern C in fragment IV exhibits six bands suggesting that

����������������������������������������������� !�����������!"�������� �
68
animals presenting this pattern have the Gh2/Gh2 genotype and are heterozygous for the
fragment IV in one copy and homozygous in the other, or alternatively have the Gh1/Gh2
genotype and are heterozygous for the GH2-N copy. Southern blotting analysis and sequencing
showed that the first hypothesis applies (Table �IV-2 and Figure �IV-7).
IV.2.4 Molecular characterization of the SSCP patterns
Twenty sheep carrying each of the SSCP patterns shown in Figure �IV-5 were selected
and genotyped for the copy number. One of these animals had the Gh1/Gh1 genotype, two the
Gh1/Gh2 genotype and 17 the Gh2/Gh2 genotype. The nucleotide sequence of each oGH gene
copy fragment was established for the selected animals. SSCP alleles at each fragment were
molecularly characterized and denoted by an italic figure (Table �IV-1 and Table �IV-4): e.g.,
allele 1 of fragment IIN [at GH2-N (or GH1) copy] carries bases T301 (T at position 301,
according to sequence GenBank accession number X12546; Orian et al., 1988) and G305;
allele 1 of fragment IIIZ (at GH2-Z copy) carries bases G644, C649, C668, C704 and G712. For
each fragment’s SSCP patterns, a fragment genotype was thus established (Table �IV-1 and
Table �IV-2).
A total of 2055 bp were sequenced at the GH2-N (or GH1) copy and of 2100 bp at
GH2-Z copy in each of the selected animals. Twenty-four polymorphic sites were found at the
GH2-N (or GH1) copy and 14 at the GH2-Z copy. Some of these polymorphisms were
previously reported (Table �IV-4). Comparing with the GH1 sequence firstly reported by Orian
et al. (1988) the GH2-N (or GH1) copy presented a total of 16 transitions, six transversions and
two insertions/deletions of one nucleotide each. Comparing with the GH2-Z sequence reported
by Ofir and Gootwine (1997) the GH2-Z copy showed a total of 11 transitions and three
transversions. Nucleotide polymorphisms were found in all of the studied fragments of the
GH2-N (or GH1) copy but in fragment VN and in fragments IIIZ, IVZ, VIZ and VIIZ of the
GH2-Z copy. Although two SCCP patterns were found in the fragments VN and VZ no
polymorphisms were identified.
The polymorphic sites were distributed as follows at the GH2-N (or GH1) copy: two in
fragment IN, two in fragment IIN, seven in fragment IIIN, three in fragment IVN, four in
fragment VIN and seven in fragment VIIN; at the GH2-Z copy: five in fragment IIIZ, five in
fragment IZ, two in fragment VZ and two in fragment VIZ. The GH2-N copy was found to be
more polymorphic than the GH2-Z copy. The number of alleles ranged from two in fragment IN
to seven in fragment VN and fragment VIN.
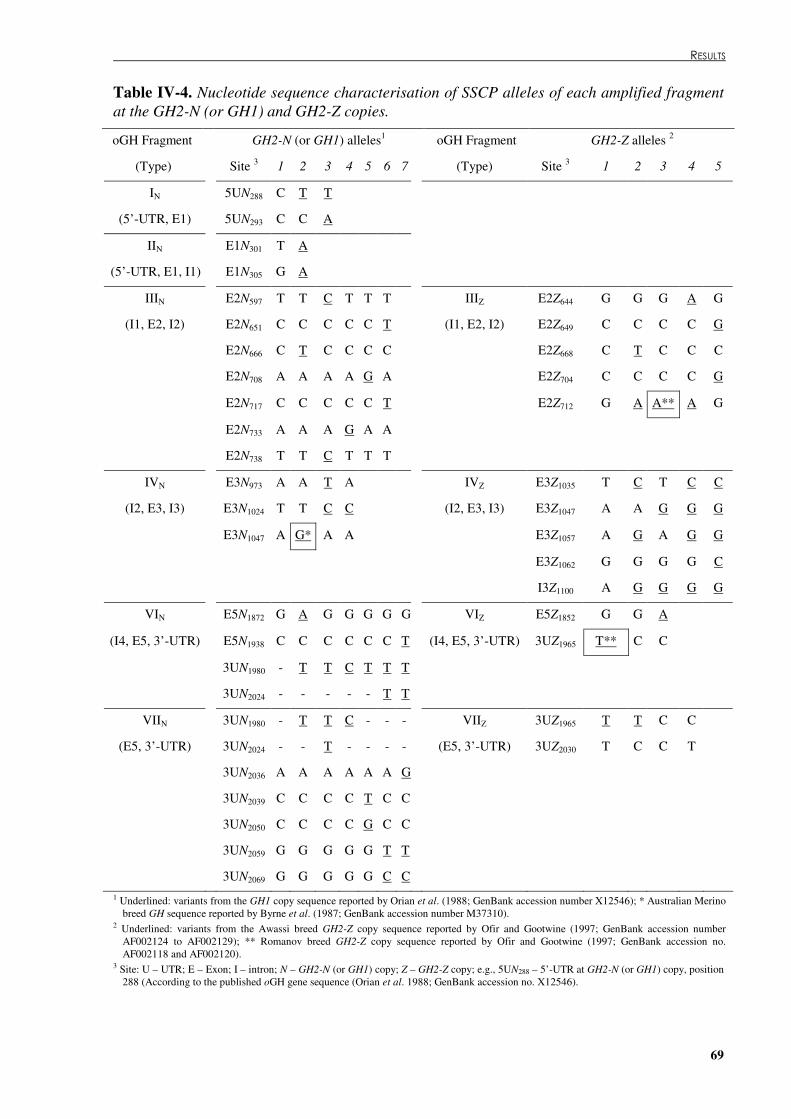
� � ��������
69
Table �IV-4. Nucleotide sequence characterisation of SSCP alleles of each amplified fragment at the GH2-N (or GH1) and GH2-Z copies.
oGH Fragment GH2-N (or GH1) alleles1 oGH Fragment GH2-Z alleles 2
(Type) Site 3 1 2 3 4 5 6 7 (Type) Site 3 1 2 3 4 5
IN 5UN288 C T T
(5’-UTR, E1) 5UN293 C C A
IIN E1N301 T A
(5’-UTR, E1, I1) E1N305 G A
IIIN E2N597 T T C T T T IIIZ E2Z644 G G G A G
(I1, E2, I2) E2N651 C C C C C T (I1, E2, I2) E2Z649 C C C C G
E2N666 C T C C C C E2Z668 C T C C C
E2N708 A A A A G A E2Z704 C C C C G
E2N717 C C C C C T E2Z712 G A A** A G
E2N733 A A A G A A
E2N738 T T C T T T
IVN E3N973 A A T A IVZ E3Z1035 T C T C C
(I2, E3, I3) E3N1024 T T C C (I2, E3, I3) E3Z1047 A A G G G
E3N1047 A G* A A E3Z1057 A G A G G
E3Z1062 G G G G C
I3Z1100 A G G G G
VIN E5N1872 G A G G G G G VIZ E5Z1852 G G A
(I4, E5, 3’-UTR) E5N1938 C C C C C C T (I4, E5, 3’-UTR) 3UZ1965 T** C C
3UN1980 - T T C T T T
3UN2024 - - - - - T T
VIIN 3UN1980 - T T C - - - VIIZ 3UZ1965 T T C C
(E5, 3’-UTR) 3UN2024 - - T - - - - (E5, 3’-UTR) 3UZ2030 T C C T
3UN2036 A A A A A A G
3UN2039 C C C C T C C
3UN2050 C C C C G C C
3UN2059 G G G G G T T
3UN2069 G G G G G C C 1 Underlined: variants from the GH1 copy sequence reported by Orian et al. (1988; GenBank accession number X12546); * Australian Merino
breed GH sequence reported by Byrne et al. (1987; GenBank accession number M37310). 2 Underlined: variants from the Awassi breed GH2-Z copy sequence reported by Ofir and Gootwine (1997; GenBank accession number
AF002124 to AF002129); ** Romanov breed GH2-Z copy sequence reported by Ofir and Gootwine (1997; GenBank accession no. AF002118 and AF002120).
3 Site: U – UTR; E – Exon; I – intron; N – GH2-N (or GH1) copy; Z – GH2-Z copy; e.g., 5UN288 – 5’-UTR at GH2-N (or GH1) copy, position 288 (According to the published oGH gene sequence (Orian et al. 1988; GenBank accession no. X12546).

����������������������������������������������� !�����������!"�������� �
70
Table �IV-5. Polymorphisms found in the coding regions of the oGH gene copies, predicted amino acid changes and protein variants.
oGH GH1 or GH2-N Variants GH2-Z Variants
Fragment Site* nt aa no. aa a b c d e Site* nt aa no. aa a b c III E2N597 T�C -16 Leu�Pro L L P L L E2Z644 G�A -1 Gly G G G
(E2) E2N651 C�T 3 Pro�Leu P P P P L E2Z649 C�G 2 Phe�Leu F F L E2N666 C�T 8 Ser�Phe S F S S S E2Z668 C�T 9 Arg�Cys R C R E2N708 A�G 22 His�Arg H H H R H E2Z704 C�G 21 Leu�Val L L V E2N717 C�T 25 Ala�Val A A A A V E2Z712 G�A 23 Gln G G G E2N733 A�G 30 Lys K K K K K E2N738 T�C 32 Phe�Ser F F S F F
IV E3N973 A�T 35 Thr�Ser T S T E3Z1035 T�C 55 Ser S S S (E3) E3N1024 T�C 52 Phe�Leu F L L E3Z1047 A�G 59 Pro P P P
E3N1047 A�G 59 Pro P P P E3Z1057 A�G 63 Ser�Gly S G G E3Z1062 G�C 64 Asn�Lys K K N
VI E5N1872 G�A 166 Arg R E5Z1852 G�A 160 Gly�Ser G S (E5) E5N1938 C�T 188 Ser S
* According to the published oGH gene sequence (Orian et al., 1988; GenBank accession number X12546). E – exon. nt – nucleotide; aa no. – amino acid number of the mature protein (considering N-terminal alanine as amino acid 1 which corresponds to amino acid 27 of the published oGH sequence with GenPept accession number CAA31063) (Orian et al., 1988).
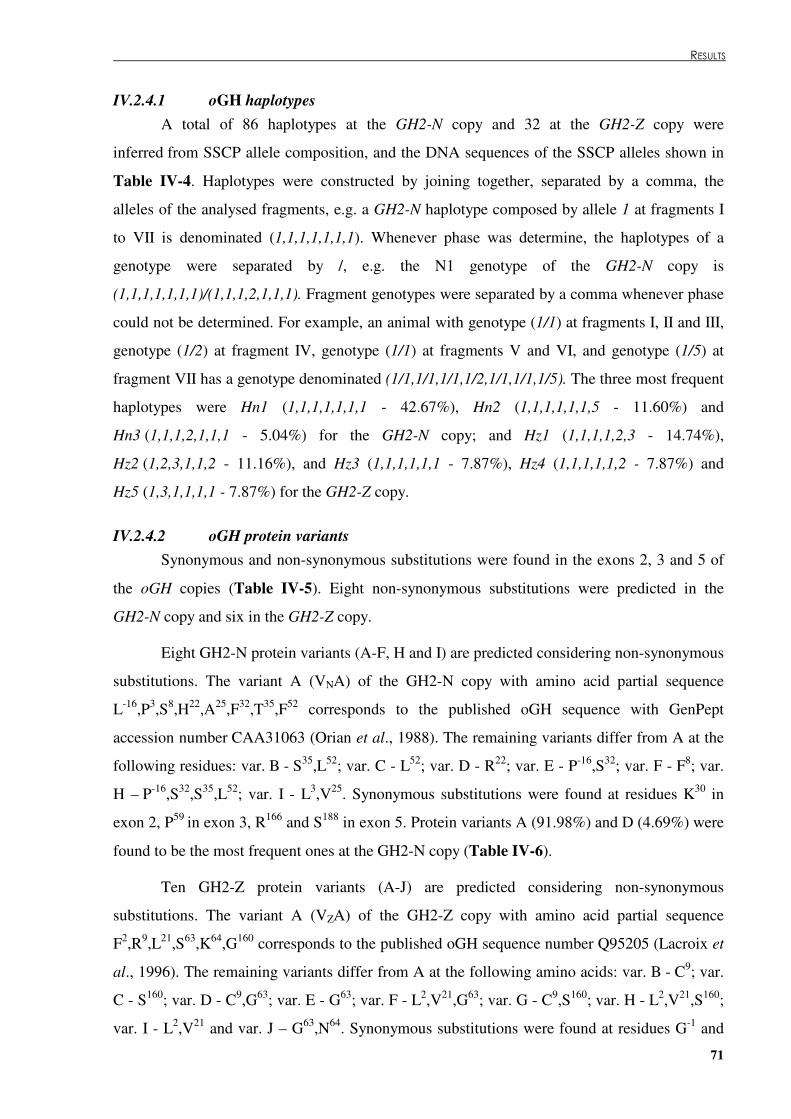
� � ��������
71
IV.2.4.1 oGH haplotypes A total of 86 haplotypes at the GH2-N copy and 32 at the GH2-Z copy were
inferred from SSCP allele composition, and the DNA sequences of the SSCP alleles shown in
Table �IV-4. Haplotypes were constructed by joining together, separated by a comma, the
alleles of the analysed fragments, e.g. a GH2-N haplotype composed by allele 1 at fragments I
to VII is denominated (1,1,1,1,1,1,1). Whenever phase was determine, the haplotypes of a
genotype were separated by /, e.g. the N1 genotype of the GH2-N copy is
(1,1,1,1,1,1,1)/(1,1,1,2,1,1,1). Fragment genotypes were separated by a comma whenever phase
could not be determined. For example, an animal with genotype (1/1) at fragments I, II and III,
genotype (1/2) at fragment IV, genotype (1/1) at fragments V and VI, and genotype (1/5) at
fragment VII has a genotype denominated (1/1,1/1,1/1,1/2,1/1,1/1,1/5). The three most frequent
haplotypes were Hn1 (1,1,1,1,1,1,1 - 42.67%), Hn2 (1,1,1,1,1,1,5 - 11.60%) and
Hn3 (1,1,1,2,1,1,1 - 5.04%) for the GH2-N copy; and Hz1 (1,1,1,1,2,3 - 14.74%),
Hz2 (1,2,3,1,1,2 - 11.16%), and Hz3 (1,1,1,1,1,1 - 7.87%), Hz4 (1,1,1,1,1,2 - 7.87%) and
Hz5 (1,3,1,1,1,1 - 7.87%) for the GH2-Z copy.
IV.2.4.2 oGH protein variants Synonymous and non-synonymous substitutions were found in the exons 2, 3 and 5 of
the oGH copies (Table �IV-5). Eight non-synonymous substitutions were predicted in the
GH2-N copy and six in the GH2-Z copy.
Eight GH2-N protein variants (A-F, H and I) are predicted considering non-synonymous
substitutions. The variant A (VNA) of the GH2-N copy with amino acid partial sequence
L-16,P3,S8,H22,A25,F32,T35,F52 corresponds to the published oGH sequence with GenPept
accession number CAA31063 (Orian et al., 1988). The remaining variants differ from A at the
following residues: var. B - S35,L52; var. C - L52; var. D - R22; var. E - P-16,S32; var. F - F8; var.
H – P-16,S32,S35,L52; var. I - L3,V25. Synonymous substitutions were found at residues K30 in
exon 2, P59 in exon 3, R166 and S188 in exon 5. Protein variants A (91.98%) and D (4.69%) were
found to be the most frequent ones at the GH2-N copy (Table �IV-6).
Ten GH2-Z protein variants (A-J) are predicted considering non-synonymous
substitutions. The variant A (VZA) of the GH2-Z copy with amino acid partial sequence
F2,R9,L21,S63,K64,G160 corresponds to the published oGH sequence number Q95205 (Lacroix et
al., 1996). The remaining variants differ from A at the following amino acids: var. B - C9; var.
C - S160; var. D - C9,G63; var. E - G63; var. F - L2,V21,G63; var. G - C9,S160; var. H - L2,V21,S160;
var. I - L2,V21 and var. J – G63,N64. Synonymous substitutions were found at residues G-1 and
����������������������������������������������� !�����������!"�������� �
72
G23 in exon 2, and S55 and P59 in exon 3. Protein variants A (71.89%), B (13.29%) and E
(7.68%) were found to be the most frequent ones at the GH2-Z copy (Table �IV-6).
Table �IV-6. Predicted protein variants’ frequencies (%) at the GH2-N and GH2-Z copies.
VN GH2-N (%) VZ GH2-Z (%)
A L-16,P3,S8,H22,A25,F32,T35,F52 91.98 A F2,R9,L21,S63,K64,G160 71.89
B L-16,P3,S8,H22,A25,F32,S35,L52 0.69 B F2,C9,L21,S63,K64,G160 13.29
C L-16,P3,S8,H22,A25,F32,T35,L52 0.57 C F2,R9,L21,S63,K64,S160 3.90
D L-16,P3,S8,R22,A25,F32,T35,F52 4.69 D F2,C9,L21,G63,K64,G160 0.86
E P-16,P3,S8,H22,A25,S32,T35,F52 0.46 E F2,R9,L21,G63,K64,G160 7.68
F L-16,P3,F8,H22,A25,F32,T35,F52 0.58 F L2,R9,V21,G63,K64,G160 0.20
H P-16,P3,S8,H22,A25,S32,S35,L52 0.57 G F2, C9,L21,S63,K64,S160 0.40
I L-16,L3,S8,H22,V25,F32,T35,F52 0.46 H L2,R9,V21,S63,K64,S160 0.20
I L2,R9,V21,S63,K64,G160 1.49
J F2,R9,L21,G63,N64,G160 0.09
VN – predicted protein variant at the GH2-N copy; VZ – predicted protein variant at the GH2-Z copy.
In all the genotyped sheep exhibiting the two oGH copies (seventeen Gh2/Gh2 and two
Gh1/Gh2 animals) two amino acid changes were always found between GH2-N and GH2-Z
copies: aa-7 (P → L) and aa9 (G → R or C). Aa63 differs also between copies (G → S), except
in animals carrying VZD, VZE, VZF and VZJ protein variants as they present a G63 in both
copies.
IV.2.5 Statistical analysis
IV.2.5.1 Milk yield The influence of oGH copies genotypes and phenotypes on milk yield adjusted to 150
lactation days was statistical analysed as described in section �III.6.2. Data concerning 1704
valid lactations from 513 ewes’ official milk records between 1996 and 2000 were used in the
univarieted analysis. The mean milk yield adjusted to 150 lactation days (± SD) was
159.5 ± 72.2 l.
� � ��������
73
The statistical analyses were performed considering the GH2-N and GH2-Z copies
genotypes (Table �IV-7 and Table �IV-8) and phenotypes (Table �IV-10 and Table �IV-11) taken
separately or associated (Table �IV-9 and Table �IV-12) in the overall population and also by
flock. Contrasts were performed considering the differences of milk yield adjusted to
150 lactation days between the different genotypes or phenotypes and the most frequent
homozygous genotype or phenotypes (whenever it was possible) in each oGH gene copy or
associated GH2-N and GH2-Z genotype or phenotypes. Genotypes and phenotypes with
frequencies lower than 2% were excluded from the analysis. The different genotypes and
phenotypes found in the GH2-N and GH2-Z copies were found to have significant influence on
milk yield in “Serra da Estrela” ewes (P<0.05). The analyses of the influence of oGH genotypes
and phenotypes upon milk production within each flock showed that they influence milk yield
differently depending presumably on flocks’ management, namely at nutritional level, and on
particular environmental factors of the regions where animals are reared.
Within GH2-N genotypes a milk yield differential of 21.4 ± 5.9 l/150 d (P<0.01) was
found between the most (N7) and the least (N5) productive one (Table �IV-7). The ewes with
N7 genotype produced respectively 6.3 ± 5.3 l/150 d and 10.5 ± 5.6 l/150 d more milk than
ewes with genotypes N1 and N2 which were the most abundant in the studied population
(13.0% each), however this values were not statistically significant (P>0.05). By flock, the
major significant differences found in milk yield of animals with different GH2-N genotypes
were as follows: N11 ewes from FL2 yielded 27.2 ± 11.9 l/150 d more milk than N1 ewes
(P<0.05); N1 ewes from FL3 yielded 79.2 ± 12.9 l/150 d more milk than N8 ewes (P<0.001);
N18 ewes from FL5 yielded 52.3 ± 16.3 l/150 d more milk than N10 ewes (P<0.05); N4, N7
and N8 ewes from FL6 yielded respectively 47.6 ± 9.3 l/150 d, 66.7 ± 11.8 l/150 d and
62.2 ± 11.9 l/150 d more milk than N2 ewes (P<0.001), with no significant differences in milk
yield between them (P>0.05); N18 ewes from FL7 yielded 83.7 ± 16.5 l/150 d more milk than
N2 ewes (P<0.001). No significant milk yield differences were found between GH2-N
genotypes at FL1+FL4 flock. Increasing the number of N7 and N18 genotypes might contribute
to the improvement of milk yield in “Serra da Estrela” flocks. Ewes with the N5 genotype, the
worst in the total population, were not the worst in any particular flock; nevertheless, their milk
yield was always found to be low. Ewes with the N2 genotype were found to be the lowest
producing ones in FL6 and FL7 high producing flocks, but in the other flocks they were within
the best milk producing animals.
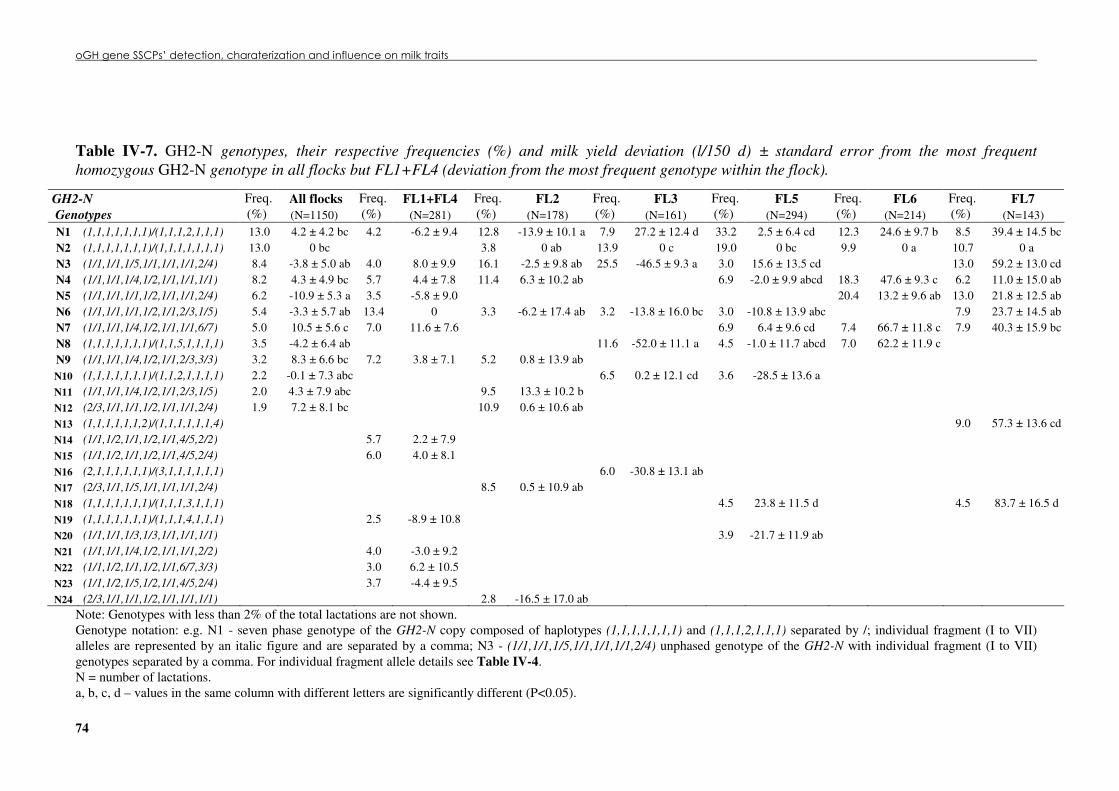
����������������������������������������������� !�����������!"�������� �
74
Table �IV-7. GH2-N genotypes, their respective frequencies (%) and milk yield deviation (l/150 d) ± standard error from the most frequent homozygous GH2-N genotype in all flocks but FL1+FL4 (deviation from the most frequent genotype within the flock).
GH2-N All flocks FL1+FL4 FL2 FL3 FL5 FL6 FL7 Genotypes
Freq. (%) (N=1150)
Freq. (%) (N=281)
Freq. (%) (N=178)
Freq. (%) (N=161)
Freq. (%) (N=294)
Freq. (%) (N=214)
Freq. (%) (N=143)
N1 (1,1,1,1,1,1,1)/(1,1,1,2,1,1,1) 13.0 4.2 ± 4.2 bc 4.2 -6.2 ± 9.4 12.8 -13.9 ± 10.1 a 7.9 27.2 ± 12.4 d 33.2 2.5 ± 6.4 cd 12.3 24.6 ± 9.7 b 8.5 39.4 ± 14.5 bc N2 (1,1,1,1,1,1,1)/(1,1,1,1,1,1,1) 13.0 0 bc 3.8 0 ab 13.9 0 c 19.0 0 bc 9.9 0 a 10.7 0 a N3 (1/1,1/1,1/5,1/1,1/1,1/1,2/4) 8.4 -3.8 ± 5.0 ab 4.0 8.0 ± 9.9 16.1 -2.5 ± 9.8 ab 25.5 -46.5 ± 9.3 a 3.0 15.6 ± 13.5 cd 13.0 59.2 ± 13.0 cd N4 (1/1,1/1,1/4,1/2,1/1,1/1,1/1) 8.2 4.3 ± 4.9 bc 5.7 4.4 ± 7.8 11.4 6.3 ± 10.2 ab 6.9 -2.0 ± 9.9 abcd 18.3 47.6 ± 9.3 c 6.2 11.0 ± 15.0 ab N5 (1/1,1/1,1/1,1/2,1/1,1/1,2/4) 6.2 -10.9 ± 5.3 a 3.5 -5.8 ± 9.0 20.4 13.2 ± 9.6 ab 13.0 21.8 ± 12.5 ab N6 (1/1,1/1,1/1,1/2,1/1,2/3,1/5) 5.4 -3.3 ± 5.7 ab 13.4 0 3.3 -6.2 ± 17.4 ab 3.2 -13.8 ± 16.0 bc 3.0 -10.8 ± 13.9 abc 7.9 23.7 ± 14.5 ab N7 (1/1,1/1,1/4,1/2,1/1,1/1,6/7) 5.0 10.5 ± 5.6 c 7.0 11.6 ± 7.6 6.9 6.4 ± 9.6 cd 7.4 66.7 ± 11.8 c 7.9 40.3 ± 15.9 bc N8 (1,1,1,1,1,1,1)/(1,1,5,1,1,1,1) 3.5 -4.2 ± 6.4 ab 11.6 -52.0 ± 11.1 a 4.5 -1.0 ± 11.7 abcd 7.0 62.2 ± 11.9 c N9 (1/1,1/1,1/4,1/2,1/1,2/3,3/3) 3.2 8.3 ± 6.6 bc 7.2 3.8 ± 7.1 5.2 0.8 ± 13.9 ab N10 (1,1,1,1,1,1,1)/(1,1,2,1,1,1,1) 2.2 -0.1 ± 7.3 abc 6.5 0.2 ± 12.1 cd 3.6 -28.5 ± 13.6 a N11 (1/1,1/1,1/4,1/2,1/1,2/3,1/5) 2.0 4.3 ± 7.9 abc 9.5 13.3 ± 10.2 b N12 (2/3,1/1,1/1,1/2,1/1,1/1,2/4) 1.9 7.2 ± 8.1 bc 10.9 0.6 ± 10.6 ab N13 (1,1,1,1,1,1,2)/(1,1,1,1,1,1,4) 9.0 57.3 ± 13.6 cd N14 (1/1,1/2,1/1,1/2,1/1,4/5,2/2) 5.7 2.2 ± 7.9 N15 (1/1,1/2,1/1,1/2,1/1,4/5,2/4) 6.0 4.0 ± 8.1 N16 (2,1,1,1,1,1,1)/(3,1,1,1,1,1,1) 6.0 -30.8 ± 13.1 ab N17 (2/3,1/1,1/5,1/1,1/1,1/1,2/4) 8.5 0.5 ± 10.9 ab N18 (1,1,1,1,1,1,1)/(1,1,1,3,1,1,1) 4.5 23.8 ± 11.5 d 4.5 83.7 ± 16.5 d N19 (1,1,1,1,1,1,1)/(1,1,1,4,1,1,1) 2.5 -8.9 ± 10.8 N20 (1/1,1/1,1/3,1/3,1/1,1/1,1/1) 3.9 -21.7 ± 11.9 ab N21 (1/1,1/1,1/4,1/2,1/1,1/1,2/2) 4.0 -3.0 ± 9.2 N22 (1/1,1/2,1/1,1/2,1/1,6/7,3/3) 3.0 6.2 ± 10.5 N23 (1/1,1/2,1/5,1/2,1/1,4/5,2/4) 3.7 -4.4 ± 9.5 N24 (2/3,1/1,1/1,1/2,1/1,1/1,1/1) 2.8 -16.5 ± 17.0 ab
Note: Genotypes with less than 2% of the total lactations are not shown. Genotype notation: e.g. N1 - seven phase genotype of the GH2-N copy composed of haplotypes (1,1,1,1,1,1,1) and (1,1,1,2,1,1,1) separated by /; individual fragment (I to VII) alleles are represented by an italic figure and are separated by a comma; N3 - (1/1,1/1,1/5,1/1,1/1,1/1,2/4) unphased genotype of the GH2-N with individual fragment (I to VII) genotypes separated by a comma. For individual fragment allele details see Table �IV-4. N = number of lactations. a, b, c, d – values in the same column with different letters are significantly different (P<0.05).
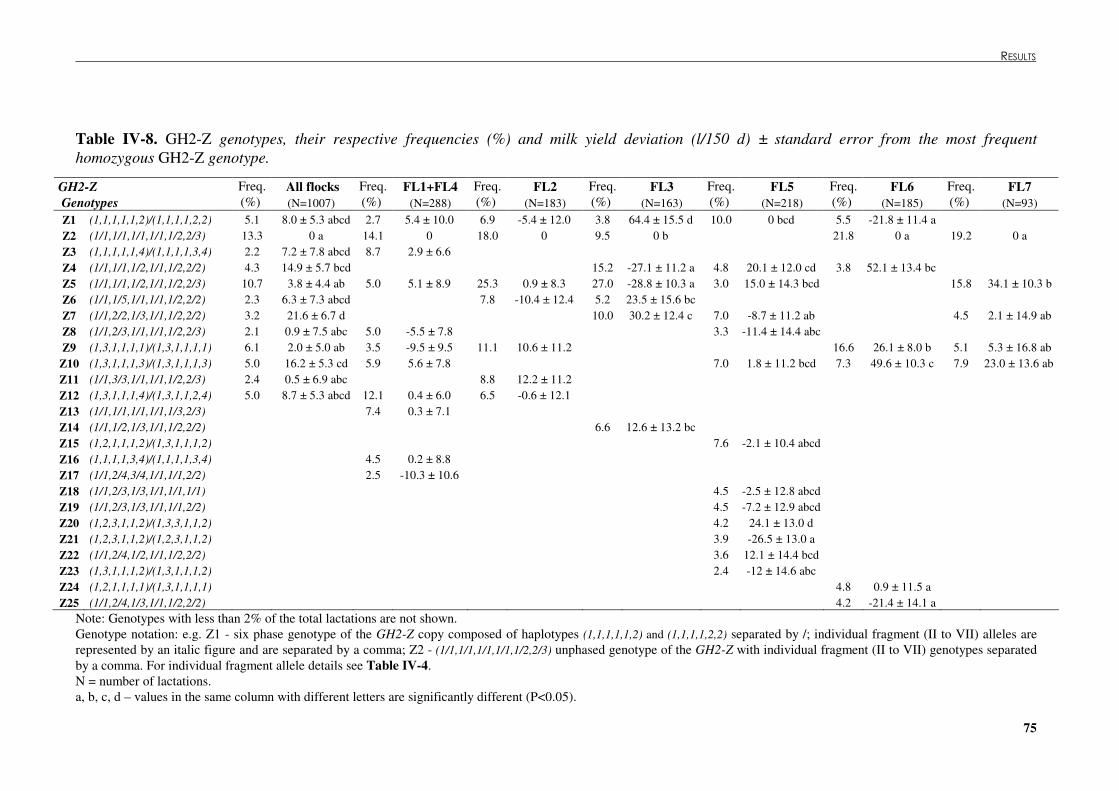
� � � � � � � � � ��������������
75
Table �IV-8. GH2-Z genotypes, their respective frequencies (%) and milk yield deviation (l/150 d) ± standard error from the most frequent homozygous GH2-Z genotype.
GH2-Z All flocks FL1+FL4 FL2 FL3 FL5 FL6 FL7 Genotypes
Freq. (%) (N=1007)
Freq. (%) (N=288)
Freq. (%) (N=183)
Freq. (%) (N=163)
Freq. (%) (N=218)
Freq. (%) (N=185)
Freq. (%) (N=93)
Z1 (1,1,1,1,1,2)/(1,1,1,1,2,2) 5.1 8.0 ± 5.3 abcd 2.7 5.4 ± 10.0 6.9 -5.4 ± 12.0 3.8 64.4 ± 15.5 d 10.0 0 bcd 5.5 -21.8 ± 11.4 a Z2 (1/1,1/1,1/1,1/1,1/2,2/3) 13.3 0 a 14.1 0 18.0 0 9.5 0 b 21.8 0 a 19.2 0 a Z3 (1,1,1,1,1,4)/(1,1,1,1,3,4) 2.2 7.2 ± 7.8 abcd 8.7 2.9 ± 6.6 Z4 (1/1,1/1,1/2,1/1,1/2,2/2) 4.3 14.9 ± 5.7 bcd 15.2 -27.1 ± 11.2 a 4.8 20.1 ± 12.0 cd 3.8 52.1 ± 13.4 bc Z5 (1/1,1/1,1/2,1/1,1/2,2/3) 10.7 3.8 ± 4.4 ab 5.0 5.1 ± 8.9 25.3 0.9 ± 8.3 27.0 -28.8 ± 10.3 a 3.0 15.0 ± 14.3 bcd 15.8 34.1 ± 10.3 b Z6 (1/1,1/5,1/1,1/1,1/2,2/2) 2.3 6.3 ± 7.3 abcd 7.8 -10.4 ± 12.4 5.2 23.5 ± 15.6 bc Z7 (1/1,2/2,1/3,1/1,1/2,2/2) 3.2 21.6 ± 6.7 d 10.0 30.2 ± 12.4 c 7.0 -8.7 ± 11.2 ab 4.5 2.1 ± 14.9 ab Z8 (1/1,2/3,1/1,1/1,1/2,2/3) 2.1 0.9 ± 7.5 abc 5.0 -5.5 ± 7.8 3.3 -11.4 ± 14.4 abc Z9 (1,3,1,1,1,1)/(1,3,1,1,1,1) 6.1 2.0 ± 5.0 ab 3.5 -9.5 ± 9.5 11.1 10.6 ± 11.2 16.6 26.1 ± 8.0 b 5.1 5.3 ± 16.8 ab
Z10 (1,3,1,1,1,3)/(1,3,1,1,1,3) 5.0 16.2 ± 5.3 cd 5.9 5.6 ± 7.8 7.0 1.8 ± 11.2 bcd 7.3 49.6 ± 10.3 c 7.9 23.0 ± 13.6 ab Z11 (1/1,3/3,1/1,1/1,1/2,2/3) 2.4 0.5 ± 6.9 abc 8.8 12.2 ± 11.2 Z12 (1,3,1,1,1,4)/(1,3,1,1,2,4) 5.0 8.7 ± 5.3 abcd 12.1 0.4 ± 6.0 6.5 -0.6 ± 12.1 Z13 (1/1,1/1,1/1,1/1,1/3,2/3) 7.4 0.3 ± 7.1 Z14 (1/1,1/2,1/3,1/1,1/2,2/2) 6.6 12.6 ± 13.2 bc Z15 (1,2,1,1,1,2)/(1,3,1,1,1,2) 7.6 -2.1 ± 10.4 abcd Z16 (1,1,1,1,3,4)/(1,1,1,1,3,4) 4.5 0.2 ± 8.8 Z17 (1/1,2/4,3/4,1/1,1/1,2/2) 2.5 -10.3 ± 10.6 Z18 (1/1,2/3,1/3,1/1,1/1,1/1) 4.5 -2.5 ± 12.8 abcd Z19 (1/1,2/3,1/3,1/1,1/1,2/2) 4.5 -7.2 ± 12.9 abcd Z20 (1,2,3,1,1,2)/(1,3,3,1,1,2) 4.2 24.1 ± 13.0 d Z21 (1,2,3,1,1,2)/(1,2,3,1,1,2) 3.9 -26.5 ± 13.0 a Z22 (1/1,2/4,1/2,1/1,1/2,2/2) 3.6 12.1 ± 14.4 bcd Z23 (1,3,1,1,1,2)/(1,3,1,1,1,2) 2.4 -12 ± 14.6 abc Z24 (1,2,1,1,1,1)/(1,3,1,1,1,1) 4.8 0.9 ± 11.5 a Z25 (1/1,2/4,1/3,1/1,1/2,2/2) 4.2 -21.4 ± 14.1 a
Note: Genotypes with less than 2% of the total lactations are not shown. Genotype notation: e.g. Z1 - six phase genotype of the GH2-Z copy composed of haplotypes (1,1,1,1,1,2) and (1,1,1,1,2,2) separated by /; individual fragment (II to VII) alleles are represented by an italic figure and are separated by a comma; Z2 - (1/1,1/1,1/1,1/1,1/2,2/3) unphased genotype of the GH2-Z with individual fragment (II to VII) genotypes separated by a comma. For individual fragment allele details see Table �IV-4. N = number of lactations. a, b, c, d – values in the same column with different letters are significantly different (P<0.05).

����������������������������������������������� !�����������!"�������� �
76
Within GH2-Z genotypes a milk yield differential of 21.6 ± 6.7 l/150 d (P<0.01) was
found between the most (Z7) and the least (Z2) productive one (Table �IV-8). The ewes with Z2
genotype were found to be, simultaneously, the most abundant and less productive in the
studied population (13.3%). By flock, the major significant differences in milk yield of animals
with different GH2-Z genotypes are as follows: Z1 ewes from FL3 yielded respectively 93.2 ±
13.9 l/150 d and 91.6 ± 14.7 l/150 d more milk than Z5 and Z4 ewes (P<0.001); Z20 ewes from
FL5 yielded 50.6 ± 15.7 l/150 d more milk than Z21 ewes (P<0.01); Z10 ewes from FL6
yielded respectively 71.4 ± 13.5 l/150 d and 71.0 ± 15.9 l/150 d more milk than Z1 and Z25
ewes (P<0.001); and Z5 ewes from FL7 yielded 34.1 ± 10.3 l/150 d more milk than Z2 ewes
(P<0.01). No significant milk yield differences were found between GH2-Z genotypes at
FL1+FL4 and FL2 flocks. Some contradictory results arise from Table �IV-8, namely between
results from FL3 versus all the other flocks; i.e., ewes with genotype Z1 are the best producing
ewes from FL3, but the worst from FL6; and similarly ewes with Z5 are the best producing
ewes from the flock FL7, but are ones of the worst from FL3.
The effect of associated GH2-N and GH2-Z genotypes revealed a milk yield differential of
39.6 ± 7.5 l/150 d of milk (P<0.001) between the most (N2+Z7) and the least (N5+Z2) productive
one (Table �IV-9). The ewes with N2+Z7 genotype yielded 24.7 ± 6.9 l/150 d more milk
(P<0.001) than ewes with N3+Z5 genotype which were found to be the most abundant in the
studied population (9.0%). By flock, the major significant differences in milk yield of animals
with different associated GH2-N and GH2-Z genotypes were as follows: N2+Z7 ewes from FL3
yielded respectively 84.2 ± 12.7 l/150 d and 78.2 ± 11.0 l/150 d more milk than N8+Z4 and
N3+Z5 ewes (P<0.001); N18+Z20 ewes from FL5 yielded 48.6 ± 15.7 l/150 d more milk than
N20+Z21 ewes (P<0.01); N4+Z9, N7+Z10 and N8+Z4 ewes from FL6 yielded significantly more
milk (P<0.05) than N1+Z24, N2+Z25 and N5+Z2 ewes, with N8+Z4 ewes yielding 74.1 ± 17.2
l/150 d more milk than N2+Z25 ewes (P<0.001); N3+Z5 ewes from FL7 yielded respectively
32.6 ± 16.1 l/150 d, 34.8 ± 11.8 l/150 d and 38.4 ± 15.2 l/150 d more milk than N2+Z7, N5+Z2
and N6+Z2 ewes (P<0.05). No significant milk yield differences were found between the
associated GH2-N and GH2-Z genotypes at FL1+FL4 and FL2 flocks. The ewes from F3 with
the N2+Z7 genotype were found to be the best producing ones only in this flock; but not in flocks
FL5 and FL7 where N2+Z7 ewes presented quite low milk yields. The N3+Z5 genotype seems to
be a quite consensual high producing genotype, being the highest producing one from FL1+FL4
and FL7, and one of the highest from FL5; however it was one of the worst genotypes from FL3.
Thus, the contradictory results shown above also appear to occur with the associated GH2-N and
GH2-Z genotypes.
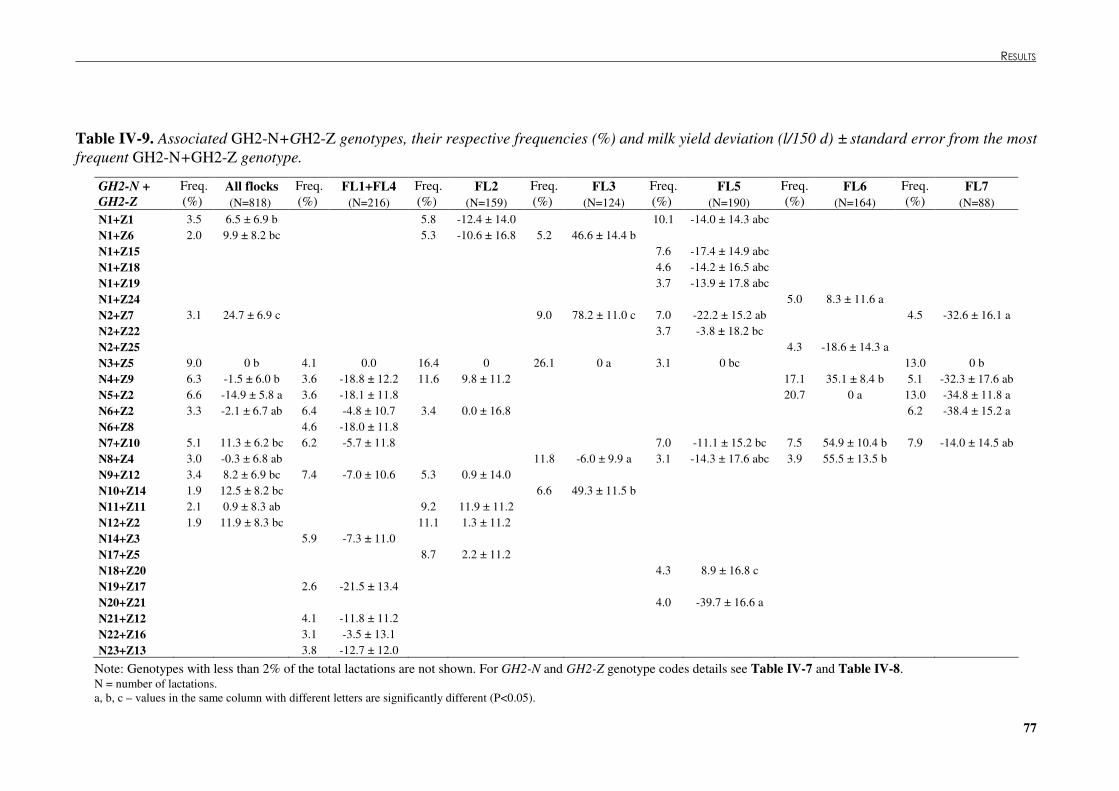
� � � � � � � � � ��������������
77
Table �IV-9. Associated GH2-N+GH2-Z genotypes, their respective frequencies (%) and milk yield deviation (l/150 d) ± standard error from the most frequent GH2-N+GH2-Z genotype.
All flocks FL1+FL4 FL2 FL3 FL5 FL6 FL7 GH2-N + GH2-Z
Freq. (%) (N=818)
Freq. (%) (N=216)
Freq. (%) (N=159)
Freq. (%) (N=124)
Freq. (%) (N=190)
Freq. (%) (N=164)
Freq. (%) (N=88)
N1+Z1 3.5 6.5 ± 6.9 b 5.8 -12.4 ± 14.0 10.1 -14.0 ± 14.3 abc N1+Z6 2.0 9.9 ± 8.2 bc 5.3 -10.6 ± 16.8 5.2 46.6 ± 14.4 b N1+Z15 7.6 -17.4 ± 14.9 abc N1+Z18 4.6 -14.2 ± 16.5 abc N1+Z19 3.7 -13.9 ± 17.8 abc N1+Z24 5.0 8.3 ± 11.6 a N2+Z7 3.1 24.7 ± 6.9 c 9.0 78.2 ± 11.0 c 7.0 -22.2 ± 15.2 ab 4.5 -32.6 ± 16.1 a N2+Z22 3.7 -3.8 ± 18.2 bc N2+Z25 4.3 -18.6 ± 14.3 a N3+Z5 9.0 0 b 4.1 0.0 16.4 0 26.1 0 a 3.1 0 bc 13.0 0 b N4+Z9 6.3 -1.5 ± 6.0 b 3.6 -18.8 ± 12.2 11.6 9.8 ± 11.2 17.1 35.1 ± 8.4 b 5.1 -32.3 ± 17.6 ab N5+Z2 6.6 -14.9 ± 5.8 a 3.6 -18.1 ± 11.8 20.7 0 a 13.0 -34.8 ± 11.8 a N6+Z2 3.3 -2.1 ± 6.7 ab 6.4 -4.8 ± 10.7 3.4 0.0 ± 16.8 6.2 -38.4 ± 15.2 a N6+Z8 4.6 -18.0 ± 11.8 N7+Z10 5.1 11.3 ± 6.2 bc 6.2 -5.7 ± 11.8 7.0 -11.1 ± 15.2 bc 7.5 54.9 ± 10.4 b 7.9 -14.0 ± 14.5 ab N8+Z4 3.0 -0.3 ± 6.8 ab 11.8 -6.0 ± 9.9 a 3.1 -14.3 ± 17.6 abc 3.9 55.5 ± 13.5 b N9+Z12 3.4 8.2 ± 6.9 bc 7.4 -7.0 ± 10.6 5.3 0.9 ± 14.0 N10+Z14 1.9 12.5 ± 8.2 bc 6.6 49.3 ± 11.5 b N11+Z11 2.1 0.9 ± 8.3 ab 9.2 11.9 ± 11.2 N12+Z2 1.9 11.9 ± 8.3 bc 11.1 1.3 ± 11.2 N14+Z3 5.9 -7.3 ± 11.0 N17+Z5 8.7 2.2 ± 11.2 N18+Z20 4.3 8.9 ± 16.8 c N19+Z17 2.6 -21.5 ± 13.4 N20+Z21 4.0 -39.7 ± 16.6 a N21+Z12 4.1 -11.8 ± 11.2 N22+Z16 3.1 -3.5 ± 13.1 N23+Z13 3.8 -12.7 ± 12.0
Note: Genotypes with less than 2% of the total lactations are not shown. For GH2-N and GH2-Z genotype codes details see Table �IV-7 and Table �IV-8. N = number of lactations. a, b, c – values in the same column with different letters are significantly different (P<0.05).
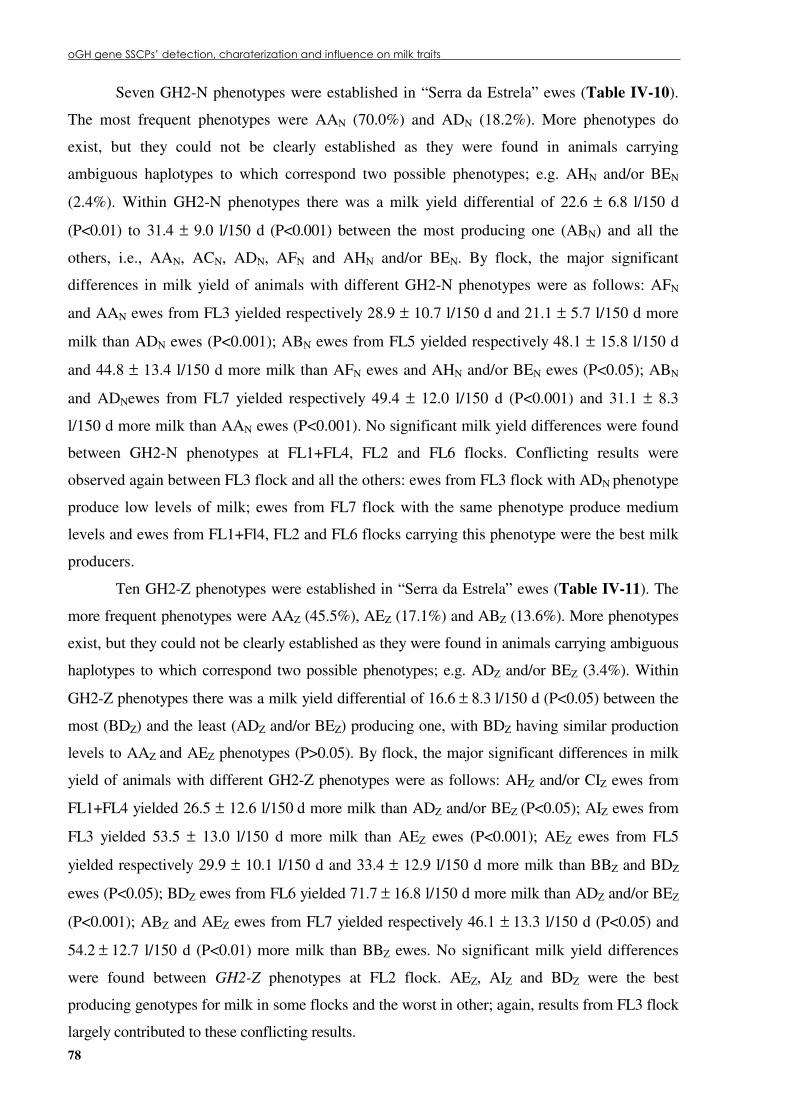
����������������������������������������������� !�����������!"�������� �
78
Seven GH2-N phenotypes were established in “Serra da Estrela” ewes (Table �IV-10).
The most frequent phenotypes were AAN (70.0%) and ADN (18.2%). More phenotypes do
exist, but they could not be clearly established as they were found in animals carrying
ambiguous haplotypes to which correspond two possible phenotypes; e.g. AHN and/or BEN
(2.4%). Within GH2-N phenotypes there was a milk yield differential of 22.6 ± 6.8 l/150 d
(P<0.01) to 31.4 ± 9.0 l/150 d (P<0.001) between the most producing one (ABN) and all the
others, i.e., AAN, ACN, ADN, AFN and AHN and/or BEN. By flock, the major significant
differences in milk yield of animals with different GH2-N phenotypes were as follows: AFN
and AAN ewes from FL3 yielded respectively 28.9 ± 10.7 l/150 d and 21.1 ± 5.7 l/150 d more
milk than ADN ewes (P<0.001); ABN ewes from FL5 yielded respectively 48.1 ± 15.8 l/150 d
and 44.8 ± 13.4 l/150 d more milk than AFN ewes and AHN and/or BEN ewes (P<0.05); ABN
and ADNewes from FL7 yielded respectively 49.4 ± 12.0 l/150 d (P<0.001) and 31.1 ± 8.3
l/150 d more milk than AAN ewes (P<0.001). No significant milk yield differences were found
between GH2-N phenotypes at FL1+FL4, FL2 and FL6 flocks. Conflicting results were
observed again between FL3 flock and all the others: ewes from FL3 flock with ADN phenotype
produce low levels of milk; ewes from FL7 flock with the same phenotype produce medium
levels and ewes from FL1+Fl4, FL2 and FL6 flocks carrying this phenotype were the best milk
producers.
Ten GH2-Z phenotypes were established in “Serra da Estrela” ewes (Table �IV-11). The
more frequent phenotypes were AAZ (45.5%), AEZ (17.1%) and ABZ (13.6%). More phenotypes
exist, but they could not be clearly established as they were found in animals carrying ambiguous
haplotypes to which correspond two possible phenotypes; e.g. ADZ and/or BEZ (3.4%). Within
GH2-Z phenotypes there was a milk yield differential of 16.6 ± 8.3 l/150 d (P<0.05) between the
most (BDZ) and the least (ADZ and/or BEZ) producing one, with BDZ having similar production
levels to AAZ and AEZ phenotypes (P>0.05). By flock, the major significant differences in milk
yield of animals with different GH2-Z phenotypes were as follows: AHZ and/or CIZ ewes from
FL1+FL4 yielded 26.5 ± 12.6 l/150 d more milk than ADZ and/or BEZ (P<0.05); AIZ ewes from
FL3 yielded 53.5 ± 13.0 l/150 d more milk than AEZ ewes (P<0.001); AEZ ewes from FL5
yielded respectively 29.9 ± 10.1 l/150 d and 33.4 ± 12.9 l/150 d more milk than BBZ and BDZ
ewes (P<0.05); BDZ ewes from FL6 yielded 71.7 ± 16.8 l/150 d more milk than ADZ and/or BEZ
(P<0.001); ABZ and AEZ ewes from FL7 yielded respectively 46.1 ± 13.3 l/150 d (P<0.05) and
54.2 ± 12.7 l/150 d (P<0.01) more milk than BBZ ewes. No significant milk yield differences
were found between GH2-Z phenotypes at FL2 flock. AEZ, AIZ and BDZ were the best
producing genotypes for milk in some flocks and the worst in other; again, results from FL3 flock
largely contributed to these conflicting results.
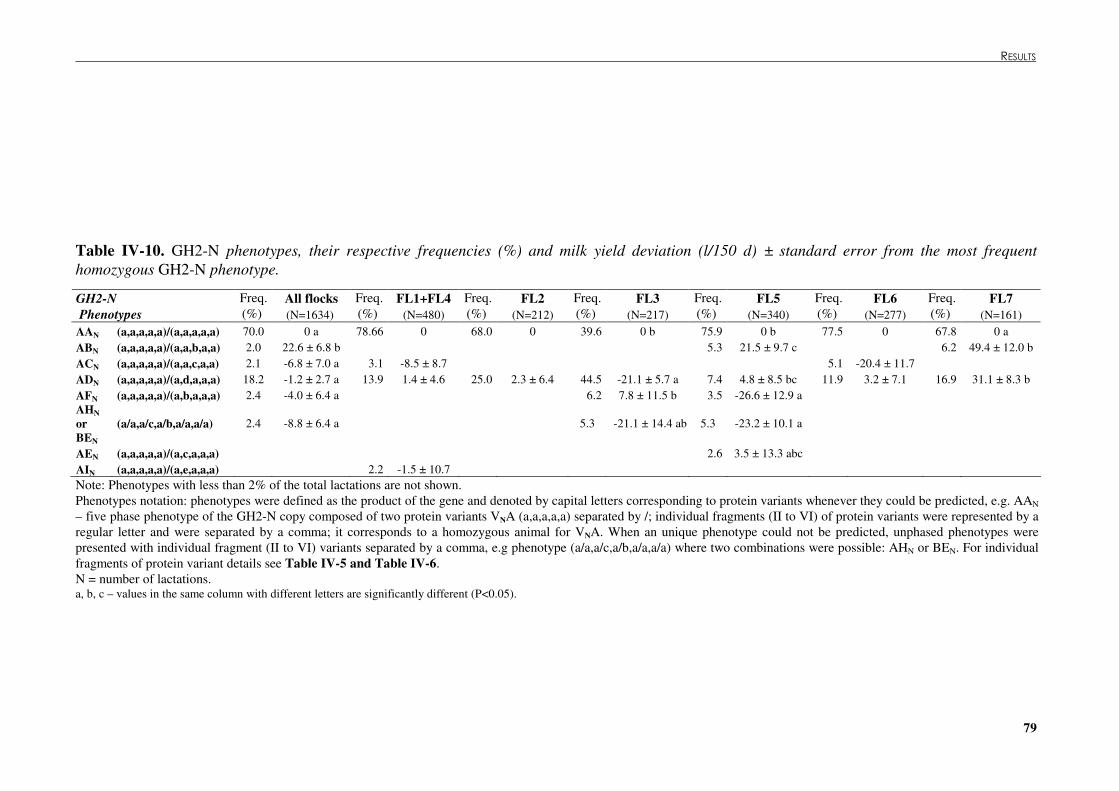
� � � � � � � � � ��������������
79
Table �IV-10. GH2-N phenotypes, their respective frequencies (%) and milk yield deviation (l/150 d) ± standard error from the most frequent homozygous GH2-N phenotype.
GH2-N All flocks FL1+FL4 FL2 FL3 FL5 FL6 FL7 Phenotypes
Freq. (%) (N=1634)
Freq. (%) (N=480)
Freq. (%) (N=212)
Freq. (%) (N=217)
Freq. (%) (N=340)
Freq. (%) (N=277)
Freq. (%) (N=161)
AAN (a,a,a,a,a)/(a,a,a,a,a) 70.0 0 a 78.66 0 68.0 0 39.6 0 b 75.9 0 b 77.5 0 67.8 0 a ABN (a,a,a,a,a)/(a,a,b,a,a) 2.0 22.6 ± 6.8 b 5.3 21.5 ± 9.7 c 6.2 49.4 ± 12.0 b ACN (a,a,a,a,a)/(a,a,c,a,a) 2.1 -6.8 ± 7.0 a 3.1 -8.5 ± 8.7 5.1 -20.4 ± 11.7 ADN (a,a,a,a,a)/(a,d,a,a,a) 18.2 -1.2 ± 2.7 a 13.9 1.4 ± 4.6 25.0 2.3 ± 6.4 44.5 -21.1 ± 5.7 a 7.4 4.8 ± 8.5 bc 11.9 3.2 ± 7.1 16.9 31.1 ± 8.3 b AFN (a,a,a,a,a)/(a,b,a,a,a) 2.4 -4.0 ± 6.4 a 6.2 7.8 ± 11.5 b 3.5 -26.6 ± 12.9 a AHN or BEN
(a/a,a/c,a/b,a/a,a/a) 2.4 -8.8 ± 6.4 a 5.3 -21.1 ± 14.4 ab 5.3 -23.2 ± 10.1 a
AEN (a,a,a,a,a)/(a,c,a,a,a) 2.6 3.5 ± 13.3 abc AIN (a,a,a,a,a)/(a,e,a,a,a) 2.2 -1.5 ± 10.7 Note: Phenotypes with less than 2% of the total lactations are not shown. Phenotypes notation: phenotypes were defined as the product of the gene and denoted by capital letters corresponding to protein variants whenever they could be predicted, e.g. AAN – five phase phenotype of the GH2-N copy composed of two protein variants VNA (a,a,a,a,a) separated by /; individual fragments (II to VI) of protein variants were represented by a regular letter and were separated by a comma; it corresponds to a homozygous animal for VNA. When an unique phenotype could not be predicted, unphased phenotypes were presented with individual fragment (II to VI) variants separated by a comma, e.g phenotype (a/a,a/c,a/b,a/a,a/a) where two combinations were possible: AHN or BEN. For individual fragments of protein variant details see Table �IV-5 and Table �IV-6. N = number of lactations. a, b, c – values in the same column with different letters are significantly different (P<0.05).
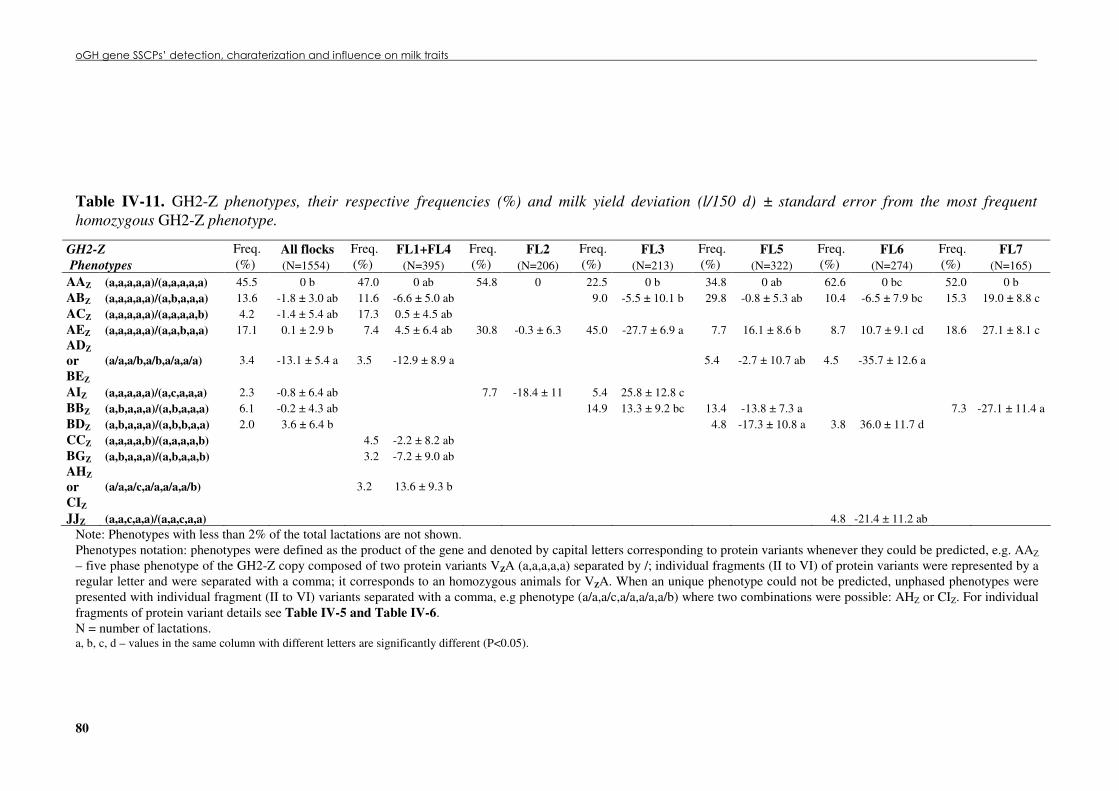
����������������������������������������������� !�����������!"�������� �
80
Table �IV-11. GH2-Z phenotypes, their respective frequencies (%) and milk yield deviation (l/150 d) ± standard error from the most frequent homozygous GH2-Z phenotype.
GH2-Z All flocks FL1+FL4 FL2 FL3 FL5 FL6 FL7 Phenotypes
Freq. (%) (N=1554)
Freq. (%) (N=395)
Freq. (%) (N=206)
Freq. (%) (N=213)
Freq. (%) (N=322)
Freq. (%) (N=274)
Freq. (%) (N=165)
AAZ (a,a,a,a,a)/(a,a,a,a,a) 45.5 0 b 47.0 0 ab 54.8 0 22.5 0 b 34.8 0 ab 62.6 0 bc 52.0 0 b ABZ (a,a,a,a,a)/(a,b,a,a,a) 13.6 -1.8 ± 3.0 ab 11.6 -6.6 ± 5.0 ab 9.0 -5.5 ± 10.1 b 29.8 -0.8 ± 5.3 ab 10.4 -6.5 ± 7.9 bc 15.3 19.0 ± 8.8 c ACZ (a,a,a,a,a)/(a,a,a,a,b) 4.2 -1.4 ± 5.4 ab 17.3 0.5 ± 4.5 ab AEZ (a,a,a,a,a)/(a,a,b,a,a) 17.1 0.1 ± 2.9 b 7.4 4.5 ± 6.4 ab 30.8 -0.3 ± 6.3 45.0 -27.7 ± 6.9 a 7.7 16.1 ± 8.6 b 8.7 10.7 ± 9.1 cd 18.6 27.1 ± 8.1 c ADZ or BEZ
(a/a,a/b,a/b,a/a,a/a) 3.4 -13.1 ± 5.4 a 3.5 -12.9 ± 8.9 a 5.4 -2.7 ± 10.7 ab 4.5 -35.7 ± 12.6 a
AIZ (a,a,a,a,a)/(a,c,a,a,a) 2.3 -0.8 ± 6.4 ab 7.7 -18.4 ± 11 5.4 25.8 ± 12.8 c BBZ (a,b,a,a,a)/(a,b,a,a,a) 6.1 -0.2 ± 4.3 ab 14.9 13.3 ± 9.2 bc 13.4 -13.8 ± 7.3 a 7.3 -27.1 ± 11.4 a BDZ (a,b,a,a,a)/(a,b,b,a,a) 2.0 3.6 ± 6.4 b 4.8 -17.3 ± 10.8 a 3.8 36.0 ± 11.7 d CCZ (a,a,a,a,b)/(a,a,a,a,b) 4.5 -2.2 ± 8.2 ab BGZ (a,b,a,a,a)/(a,b,a,a,b) 3.2 -7.2 ± 9.0 ab AHZ or CIZ
(a/a,a/c,a/a,a/a,a/b) 3.2 13.6 ± 9.3 b
JJZ (a,a,c,a,a)/(a,a,c,a,a) 4.8 -21.4 ± 11.2 ab Note: Phenotypes with less than 2% of the total lactations are not shown. Phenotypes notation: phenotypes were defined as the product of the gene and denoted by capital letters corresponding to protein variants whenever they could be predicted, e.g. AAZ – five phase phenotype of the GH2-Z copy composed of two protein variants VZA (a,a,a,a,a) separated by /; individual fragments (II to VI) of protein variants were represented by a regular letter and were separated with a comma; it corresponds to an homozygous animals for VZA. When an unique phenotype could not be predicted, unphased phenotypes were presented with individual fragment (II to VI) variants separated with a comma, e.g phenotype (a/a,a/c,a/a,a/a,a/b) where two combinations were possible: AHZ or CIZ. For individual fragments of protein variant details see Table �IV-5 and Table �IV-6. N = number of lactations. a, b, c, d – values in the same column with different letters are significantly different (P<0.05).

� � � � � � � � � ��������������
81
Table �IV-12. Associated GH2-N+GH2-Z phenotypes, their respective frequencies (%) and milk yield deviation (l/150 d) ± standard error from the most frequent homozygous GH2-N+GH2-Z phenotype.
All flocks FL1+FL4 FL2 FL3 FL5 FL6 FL7 GH2-N + GH2-Z
Freq. (%) (N=1369)
Freq. (%) (N=377)
Freq. (%) (N=194)
Freq. (%) (N=199)
Freq. (%) (N=292)
Freq. (%) (N=235)
Freq. (%) (N=138)
AAN+AAZ 42.1 0 ab 43.1 0 ab 54.3 0 17.1 0 a 33.9 0 b 56.7 0 b 47.5 0 ab AAN+ABZ 10.0 -4.6 ± 3.5 ab 10.6 -8.1 ± 5.2 a 22.6 -3.6 ± 5.7 ab 10.4 -12.6 ± 8.0 ab 7.3 22.7 ± 12.5 bc AAN+ACZ 2.4 2.2 ± 7.1 ab 9.6 3.9 ± 5.7 ab AAN+AIZ 2.3 1.3 ± 6.8 ab 7.7 -17.8 ± 11.1 5.4 49.6 ± 13.6 cd AAN+BBZ 3.3 7.9 ± 5.8 b 9.5 45.8 ± 11.0 cd 6.8 -9.5 ± 9.4 ab 6.2 -22.8 ± 12.4 a ADN+AAZ 2.0 3.6 ± 6.8 ab 4.0 -4.0 ± 8.2 ab 5.4 62.6 ± 12.5 d 5.9 -26.1 ± 9.6 a ADN+ACZ 7. 7 -4.7 ± 6.3 ab ADN+AEZ 14.2 0.1 ± 3.4 ab 5.0 11.2 ± 7.9 b 25.8 0.4 ± 6.8 41.4 -15.1 ± 7.8 a 6.0 5.2 ± 9.5 bc 5.2 23.9 ± 10.9 c 16.9 32.5 ± 8.7 c AFN+ABZ 2.1 0.7 ± 7.2 ab 6.3 26.7 ± 12.0 bc (AHN or BEN)+BBZ 2.5 -8.3 ± 6.6 a 5.4 -1.7 ± 14.2 ab 5.4 -24.9 ± 10.4 a
AAN+(ADZ or BEZ) 2.1 -5.7 ± 7.1 ab 4.5 7.9 ± 11.6 bc
AAN+CCZ 4.5 -2.5 ± 8.3 ab AAN+BGZ 3.2 -7.9 ± 9.1 ab AAN+BDZ 3.3 -20.8 ± 13.4 ab AAN+(AHZ or CIZ)
3.2 13.1 ± 9.4 b
ABN+ABZ 4.5 22.1 ± 10.9 c ACN+(ADZ or BEZ) 2.5 -11.8 ± 10.2 ab ADN+JJZ 3.1 8.8 ± 13.9 bc
Note: Phenotypes with less than 2% of the total lactations are not shown. For GH2-N and GH2-Z phenotypes codes details see Table �IV-10 and Table �IV-11. N = number of lactations. a, b, c, d – values in the same column with different letters are significantly different (P<0.05).
����������������������������������������������� !�����������!"�������� �
82
The effect of associated GH2-N and GH2-Z phenotypes revealed a milk yield
differential of 16.2 ± 8.1 l/150 d of milk (P<0.05) between the most (AAN+BBZ) and the least
[(AHN and/or BEN)+BBZ] producing phenotype (Table �IV-12). The ewes with AAN+BBZ
phenotype yielded 7.9 ± 5.8 l/150 d more milk (P>0.05) than ewes with AAN+AAZ (42.1%)
and ADN+AEZ (14.19%) phenotypes which were the two most abundant in the studied
population and presented similar milk yields between them (P>0.05). By flock, the major
significant differences in milk yield were as follows: ADN+AEZ and [AAN+(AHZ and/or CIZ)]
ewes from FL1+FL4 yielded respectively 19.3 ± 8.9 l/150 d and 21.2 ± 10.3 l/150 d more milk
than AAN+ABZ ewes (P<0.05); ADN+AAZ ewes from FL3 yielded respectively 62.6 ± 12.5
l/150 d and 77.7 ± 11.6 l/150 d more milk than ADN+AEZ ewes (P<0.001); ABN+ABZ ewes
from FL5 yielded 47.0 ± 14.0 l/150 d more milk than [(AHN and/or BEN)+BBZ] ewes (P<0.01);
ADN+AEZ ewes from FL6 yielded 50.0 ± 13.5 l/150 d more milk than ADN+AAZ ewes
(P<0.01); ADN+AEZ ewes from FL7 yielded 56.3 ± 13.9 l/150 d more milk than AAN+BBZ
ewes (P<0.01). No significant milk yield differences were found between the associated GH2-
N and GH2-Z phenotypes at FL2 flock. Ewes with ADN+AEZ phenotype were the best
producing ones in FL6 and FL7 flocks, one of the best in FL1+FL4 and the worst in FL3.
IV.2.5.2 Milk composition The records of milk fat and protein contents and yields were available for 294 ewes for
one year (1998) and their mean milk production adjusted to 150 lactation days (± SD) on that
year was 171.4 ± 75.9 l with 79.5 ± 11.8 g of fat/kg of milk and 65.5 ± 7.2 g of protein/kg of
milk. Mean fat yield was 13.8 ± 6.7 kg, mean protein yield was 11.1 ± 4.7 kg and mean
fat+protein yield was 25.0 ± 11.3 kg. The statistical analyses were performed considering the
GH2-N and GH2-Z copies genotypes (Table �IV-13) and phenotypes (Table �IV-15) taken
separately or associated (Table �IV-14 and Table �IV-15) in the population. Contrasts were
performed considering the differences between the different genotypes or phenotypes for each
parameter and the most frequent homozygous genotype or phenotypes in each oGH gene copy,
or associated GH2-N and GH2-Z genotypes or phenotypes. Genotypes and phenotypes with
frequencies lower than 2% were excluded from the analysis. The genotypes and phenotypes
found in the GH2-N and GH2-Z copies had significant influence on milk yield traits and on
milk fat and protein contents in “Serra da Estrela” ewes (P<0.05). Exceptions were found for
GH2-N genotype effects on protein content and for GH2-N phenotype effects on milk yield, fat
and protein content, and fat+protein yield and for GH2-Z phenotype effects on fat content
(P>0.05). The major significant effects are described below.
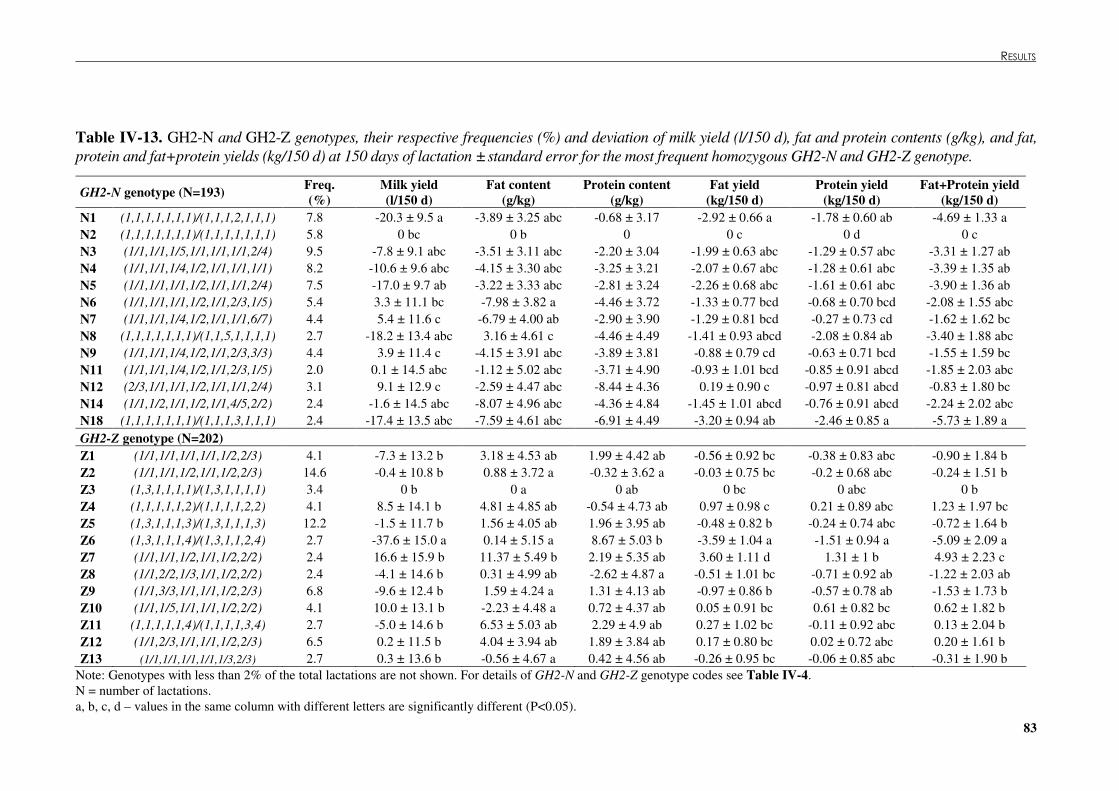
� � � � � � � � � ��������������
83
Table �IV-13. GH2-N and GH2-Z genotypes, their respective frequencies (%) and deviation of milk yield (l/150 d), fat and protein contents (g/kg), and fat, protein and fat+protein yields (kg/150 d) at 150 days of lactation ± standard error for the most frequent homozygous GH2-N and GH2-Z genotype.
GH2-N genotype (N=193) Freq. (%)
Milk yield (l/150 d)
Fat content (g/kg)
Protein content (g/kg)
Fat yield (kg/150 d)
Protein yield (kg/150 d)
Fat+Protein yield (kg/150 d)
N1 (1,1,1,1,1,1,1)/(1,1,1,2,1,1,1) 7.8 -20.3 ± 9.5 a -3.89 ± 3.25 abc -0.68 ± 3.17 -2.92 ± 0.66 a -1.78 ± 0.60 ab -4.69 ± 1.33 a N2 (1,1,1,1,1,1,1)/(1,1,1,1,1,1,1) 5.8 0 bc 0 b 0 0 c 0 d 0 c N3 (1/1,1/1,1/5,1/1,1/1,1/1,2/4) 9.5 -7.8 ± 9.1 abc -3.51 ± 3.11 abc -2.20 ± 3.04 -1.99 ± 0.63 abc -1.29 ± 0.57 abc -3.31 ± 1.27 ab N4 (1/1,1/1,1/4,1/2,1/1,1/1,1/1) 8.2 -10.6 ± 9.6 abc -4.15 ± 3.30 abc -3.25 ± 3.21 -2.07 ± 0.67 abc -1.28 ± 0.61 abc -3.39 ± 1.35 ab N5 (1/1,1/1,1/1,1/2,1/1,1/1,2/4) 7.5 -17.0 ± 9.7 ab -3.22 ± 3.33 abc -2.81 ± 3.24 -2.26 ± 0.68 abc -1.61 ± 0.61 abc -3.90 ± 1.36 ab N6 (1/1,1/1,1/1,1/2,1/1,2/3,1/5) 5.4 3.3 ± 11.1 bc -7.98 ± 3.82 a -4.46 ± 3.72 -1.33 ± 0.77 bcd -0.68 ± 0.70 bcd -2.08 ± 1.55 abc N7 (1/1,1/1,1/4,1/2,1/1,1/1,6/7) 4.4 5.4 ± 11.6 c -6.79 ± 4.00 ab -2.90 ± 3.90 -1.29 ± 0.81 bcd -0.27 ± 0.73 cd -1.62 ± 1.62 bc N8 (1,1,1,1,1,1,1)/(1,1,5,1,1,1,1) 2.7 -18.2 ± 13.4 abc 3.16 ± 4.61 c -4.46 ± 4.49 -1.41 ± 0.93 abcd -2.08 ± 0.84 ab -3.40 ± 1.88 abc N9 (1/1,1/1,1/4,1/2,1/1,2/3,3/3) 4.4 3.9 ± 11.4 c -4.15 ± 3.91 abc -3.89 ± 3.81 -0.88 ± 0.79 cd -0.63 ± 0.71 bcd -1.55 ± 1.59 bc N11 (1/1,1/1,1/4,1/2,1/1,2/3,1/5) 2.0 0.1 ± 14.5 abc -1.12 ± 5.02 abc -3.71 ± 4.90 -0.93 ± 1.01 bcd -0.85 ± 0.91 abcd -1.85 ± 2.03 abc N12 (2/3,1/1,1/1,1/2,1/1,1/1,2/4) 3.1 9.1 ± 12.9 c -2.59 ± 4.47 abc -8.44 ± 4.36 0.19 ± 0.90 c -0.97 ± 0.81 abcd -0.83 ± 1.80 bc N14 (1/1,1/2,1/1,1/2,1/1,4/5,2/2) 2.4 -1.6 ± 14.5 abc -8.07 ± 4.96 abc -4.36 ± 4.84 -1.45 ± 1.01 abcd -0.76 ± 0.91 abcd -2.24 ± 2.02 abc N18 (1,1,1,1,1,1,1)/(1,1,1,3,1,1,1) 2.4 -17.4 ± 13.5 abc -7.59 ± 4.61 abc -6.91 ± 4.49 -3.20 ± 0.94 ab -2.46 ± 0.85 a -5.73 ± 1.89 a GH2-Z genotype (N=202) Z1 (1/1,1/1,1/1,1/1,1/2,2/3) 4.1 -7.3 ± 13.2 b 3.18 ± 4.53 ab 1.99 ± 4.42 ab -0.56 ± 0.92 bc -0.38 ± 0.83 abc -0.90 ± 1.84 b Z2 (1/1,1/1,1/2,1/1,1/2,2/3) 14.6 -0.4 ± 10.8 b 0.88 ± 3.72 a -0.32 ± 3.62 a -0.03 ± 0.75 bc -0.2 ± 0.68 abc -0.24 ± 1.51 b Z3 (1,3,1,1,1,1)/(1,3,1,1,1,1) 3.4 0 b 0 a 0 ab 0 bc 0 abc 0 b Z4 (1,1,1,1,1,2)/(1,1,1,1,2,2) 4.1 8.5 ± 14.1 b 4.81 ± 4.85 ab -0.54 ± 4.73 ab 0.97 ± 0.98 c 0.21 ± 0.89 abc 1.23 ± 1.97 bc Z5 (1,3,1,1,1,3)/(1,3,1,1,1,3) 12.2 -1.5 ± 11.7 b 1.56 ± 4.05 ab 1.96 ± 3.95 ab -0.48 ± 0.82 b -0.24 ± 0.74 abc -0.72 ± 1.64 b Z6 (1,3,1,1,1,4)/(1,3,1,1,2,4) 2.7 -37.6 ± 15.0 a 0.14 ± 5.15 a 8.67 ± 5.03 b -3.59 ± 1.04 a -1.51 ± 0.94 a -5.09 ± 2.09 a Z7 (1/1,1/1,1/2,1/1,1/2,2/2) 2.4 16.6 ± 15.9 b 11.37 ± 5.49 b 2.19 ± 5.35 ab 3.60 ± 1.11 d 1.31 ± 1 b 4.93 ± 2.23 c Z8 (1/1,2/2,1/3,1/1,1/2,2/2) 2.4 -4.1 ± 14.6 b 0.31 ± 4.99 ab -2.62 ± 4.87 a -0.51 ± 1.01 bc -0.71 ± 0.92 ab -1.22 ± 2.03 ab Z9 (1/1,3/3,1/1,1/1,1/2,2/3) 6.8 -9.6 ± 12.4 b 1.59 ± 4.24 a 1.31 ± 4.13 ab -0.97 ± 0.86 b -0.57 ± 0.78 ab -1.53 ± 1.73 b Z10 (1/1,1/5,1/1,1/1,1/2,2/2) 4.1 10.0 ± 13.1 b -2.23 ± 4.48 a 0.72 ± 4.37 ab 0.05 ± 0.91 bc 0.61 ± 0.82 bc 0.62 ± 1.82 b Z11 (1,1,1,1,1,4)/(1,1,1,1,3,4) 2.7 -5.0 ± 14.6 b 6.53 ± 5.03 ab 2.29 ± 4.9 ab 0.27 ± 1.02 bc -0.11 ± 0.92 abc 0.13 ± 2.04 b Z12 (1/1,2/3,1/1,1/1,1/2,2/3) 6.5 0.2 ± 11.5 b 4.04 ± 3.94 ab 1.89 ± 3.84 ab 0.17 ± 0.80 bc 0.02 ± 0.72 abc 0.20 ± 1.61 b Z13 (1/1,1/1,1/1,1/1,1/3,2/3) 2.7 0.3 ± 13.6 b -0.56 ± 4.67 a 0.42 ± 4.56 ab -0.26 ± 0.95 bc -0.06 ± 0.85 abc -0.31 ± 1.90 b
Note: Genotypes with less than 2% of the total lactations are not shown. For details of GH2-N and GH2-Z genotype codes see Table �IV-4. N = number of lactations. a, b, c, d – values in the same column with different letters are significantly different (P<0.05).

����������������������������������������������� !�����������!"�������� �
84
Table �IV-14. Associated GH2-N+GH2-Z genotypes, their respective frequencies (%) and deviation of milk yield (l/150 d), fat and protein contents (g/kg), and fat, protein and fat+protein yields (kg/150 d) at 150 days of lactation ± standard error for the most frequent homozygous associated GH2-N+GH2-Z genotype.
GH2-N+GH2-Z genotypes (N=150)
Freq. (%)
Milk yield (l/150 d)
Fat content (g/kg)
Protein content (g/kg)
Fat yield (kg/150 d)
Protein yield (kg/150 d)
Fat+Protein yield (kg/150 d)
N3+Z5 9.5 0 cd 0 a 0 ab 0 bc 0 ab 0 bc N5+Z2 7.5 -19.7 ± 9.6 ab 0.29 ± 3.30 ab 0.52 ± 3.21 ab -1.05 ± 0.67 b -0.77 ± 0.60 a -1.82 ± 1.34 ab N4+Z9 6.8 -11.3 ± 9.7 abc 0.15 ± 3.35 ab 0.47 ± 3.26 ab -0.57 ± 0.67 bc -0.31 ± 0.61 ab -0.88 ± 1.35 abc N9+Z12 4.4 2.0 ± 10.6 cd -0.33 ± 3.67 abc -0.50 ± 3.58 ab 0.43 ± 0.74 cd 0.25 ± 0.67 ab 0.68 ± 1.48 bc N7+Z10 4.1 7.4 ± 11.0 cd -3.66 ± 3.80 a 0.13 ± 3.71 ab 0.28 ± 0.77 bcd 0.83 ± 0.69 b 1.09 ± 1.54 bc N6+Z2 2.7 8.8 ± 12.7 cde -4.14 ± 4.39 a -0.94 ± 4.28 ab 0.60 ± 0.88 bcd 0.74 ± 0.80 ab 1.32 ± 1.77 bc N8+Z4 2.7 -11.8 ± 12.6 abcd 9.55 ± 4.36 bc -1.95 ± 4.25 ab 1.11 ± 0.88 cd -0.74 ± 0.79 ab 0.50 ± 1.76 bc N12+Z2 2.7 18.0 ± 12.3 de 0.26 ± 4.27 abc -6.54 ± 4.16 a 2.17 ± 0.86 d 0.31 ± 0.77 ab 2.47 ± 1.72 c N14+Z3 2.4 -0.1 ± 14.4 abcd -3.77 ± 4.93 a -1.22 ± 4.81 ab 0.20 ± 1.00 bcd 0.33 ± 0.90 ab 0.53 ± 2.01 abc N2+Z7 2.0 40.1 ± 13.3 de 10.47 ± 4.59 c 0.98 ± 4.48 ab 6.13 ± 0.93 e 3.21 ± 0.84 c 9.36 ± 1.86 d N1+Z6 2.0 -36.0 ± 13.3 a -2.11 ± 4.60 a 6.73 ± 4.49 b -3.14 ± 0.93 a -1.18 ± 0.84 a -4.26 ± 1.86 a N6+Z8 2.0 -2.6 ± 14.5 abcd -2.31 ± 4.99 abc -3.10 ± 4.87 ab -0.15 ± 1.01 bcd -0.28 ± 0.91 ab -0.44 ± 2.03 abc N11+Z11 2.0 1.4 ± 14.5 bcd 2.44 ± 5.03 abc 0.26 ± 4.90 ab 0.56 ± 1.01 bcd 0.28 ± 0.91 ab 0.81 ± 2.02 bc
Note: Genotypes with less than 2% of the total lactations are not shown. For details of GH2-N and GH2-Z genotype codes see Table �IV-13. N = number of lactations. a, b, c, d, e – values in the same column with different letters are significantly different (P<0.05).
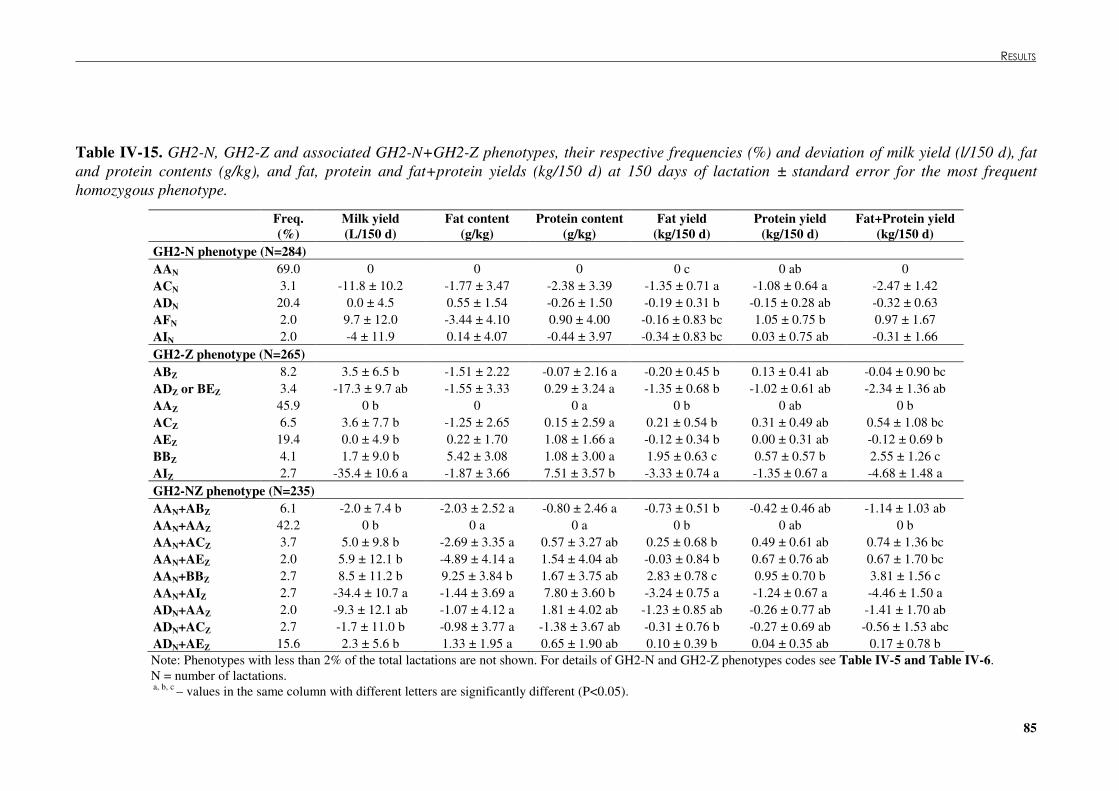
� � � � � � � � � ��������������
85
Table �IV-15. GH2-N, GH2-Z and associated GH2-N+GH2-Z phenotypes, their respective frequencies (%) and deviation of milk yield (l/150 d), fat and protein contents (g/kg), and fat, protein and fat+protein yields (kg/150 d) at 150 days of lactation ± standard error for the most frequent homozygous phenotype.
Freq. (%)
Milk yield (L/150 d)
Fat content (g/kg)
Protein content (g/kg)
Fat yield (kg/150 d)
Protein yield (kg/150 d)
Fat+Protein yield (kg/150 d)
GH2-N phenotype (N=284) AAN 69.0 0 0 0 0 c 0 ab 0 ACN 3.1 -11.8 ± 10.2 -1.77 ± 3.47 -2.38 ± 3.39 -1.35 ± 0.71 a -1.08 ± 0.64 a -2.47 ± 1.42 ADN 20.4 0.0 ± 4.5 0.55 ± 1.54 -0.26 ± 1.50 -0.19 ± 0.31 b -0.15 ± 0.28 ab -0.32 ± 0.63 AFN 2.0 9.7 ± 12.0 -3.44 ± 4.10 0.90 ± 4.00 -0.16 ± 0.83 bc 1.05 ± 0.75 b 0.97 ± 1.67 AIN 2.0 -4 ± 11.9 0.14 ± 4.07 -0.44 ± 3.97 -0.34 ± 0.83 bc 0.03 ± 0.75 ab -0.31 ± 1.66 GH2-Z phenotype (N=265) ABZ 8.2 3.5 ± 6.5 b -1.51 ± 2.22 -0.07 ± 2.16 a -0.20 ± 0.45 b 0.13 ± 0.41 ab -0.04 ± 0.90 bc ADZ or BEZ 3.4 -17.3 ± 9.7 ab -1.55 ± 3.33 0.29 ± 3.24 a -1.35 ± 0.68 b -1.02 ± 0.61 ab -2.34 ± 1.36 ab AAZ 45.9 0 b 0 0 a 0 b 0 ab 0 b ACZ 6.5 3.6 ± 7.7 b -1.25 ± 2.65 0.15 ± 2.59 a 0.21 ± 0.54 b 0.31 ± 0.49 ab 0.54 ± 1.08 bc AEZ 19.4 0.0 ± 4.9 b 0.22 ± 1.70 1.08 ± 1.66 a -0.12 ± 0.34 b 0.00 ± 0.31 ab -0.12 ± 0.69 b BBZ 4.1 1.7 ± 9.0 b 5.42 ± 3.08 1.08 ± 3.00 a 1.95 ± 0.63 c 0.57 ± 0.57 b 2.55 ± 1.26 c AIZ 2.7 -35.4 ± 10.6 a -1.87 ± 3.66 7.51 ± 3.57 b -3.33 ± 0.74 a -1.35 ± 0.67 a -4.68 ± 1.48 a GH2-NZ phenotype (N=235) AAN+ABZ 6.1 -2.0 ± 7.4 b -2.03 ± 2.52 a -0.80 ± 2.46 a -0.73 ± 0.51 b -0.42 ± 0.46 ab -1.14 ± 1.03 ab AAN+AAZ 42.2 0 b 0 a 0 a 0 b 0 ab 0 b AAN+ACZ 3.7 5.0 ± 9.8 b -2.69 ± 3.35 a 0.57 ± 3.27 ab 0.25 ± 0.68 b 0.49 ± 0.61 ab 0.74 ± 1.36 bc AAN+AEZ 2.0 5.9 ± 12.1 b -4.89 ± 4.14 a 1.54 ± 4.04 ab -0.03 ± 0.84 b 0.67 ± 0.76 ab 0.67 ± 1.70 bc AAN+BBZ 2.7 8.5 ± 11.2 b 9.25 ± 3.84 b 1.67 ± 3.75 ab 2.83 ± 0.78 c 0.95 ± 0.70 b 3.81 ± 1.56 c AAN+AIZ 2.7 -34.4 ± 10.7 a -1.44 ± 3.69 a 7.80 ± 3.60 b -3.24 ± 0.75 a -1.24 ± 0.67 a -4.46 ± 1.50 a ADN+AAZ 2.0 -9.3 ± 12.1 ab -1.07 ± 4.12 a 1.81 ± 4.02 ab -1.23 ± 0.85 ab -0.26 ± 0.77 ab -1.41 ± 1.70 ab ADN+ACZ 2.7 -1.7 ± 11.0 b -0.98 ± 3.77 a -1.38 ± 3.67 ab -0.31 ± 0.76 b -0.27 ± 0.69 ab -0.56 ± 1.53 abc ADN+AEZ 15.6 2.3 ± 5.6 b 1.33 ± 1.95 a 0.65 ± 1.90 ab 0.10 ± 0.39 b 0.04 ± 0.35 ab 0.17 ± 0.78 b Note: Phenotypes with less than 2% of the total lactations are not shown. For details of GH2-N and GH2-Z phenotypes codes see Table �IV-5 and Table �IV-6. N = number of lactations. a, b, c – values in the same column with different letters are significantly different (P<0.05).
����������������������������������������������� !�����������!"�������� �
86
The analysis of GH2-N genotypes revealed that N7, N9 and N12 ewes yielded
respectively 25.7 ± 10.5 l/150 d, 24.1 ± 10.2 l/150 d and 29.4 ± 11.9 l/150 d more milk than N1
ewes (P<0.05; Table �IV-13). It was also found that the milk of the N8 ewes had significantly
higher fat content 11.14 ± 4.93 g/kg than the milk of N6 ewes(P<0.05). N2 and N12 ewes
yielded respectively 2.92 ± 0.66 kg/150 d and 3.39 ± 0.83 kg/150 d more fat than N1 ewes
(P<0.01). N2 ewes yielded also 2.46 ± 0.85 kg/150 d (P<0.05) more protein and
5.73 ± 1.89 kg/150 d (P<0.01) more fat+protein than N18 ewes.
The analysis of GH2-Z genotypes revealed that Z7 ewes yielded 54.2 ± 15.6 l/150 d
more milk than Z6 ewes (P<0.01), but not than the other ewes. The milk of the Z7 ewes had
significantly higher fat content (P<0.05) than Z2, Z3, Z6, Z9, Z10 (more 13.60 ± 5.12 g/kg) and
Z13 ewes, which milks have similar fat contents (P>0.05). The milk of the N6 ewes had
respectively 8.99 ± 3.86 g/kg and 11.29 ± 5.12 g/kg higher protein content than the milk of Z2
and Z8 ewes (P<0.05). Z7 ewes yielded also significantly more fat (7.19 ± 1.08 kg/150 d;
P<0.001), protein (2.82 ± 0.98 kg/150 d; P<0.05) and fat+protein (10.02 ± 2.18 kg/150 d;
P<0.001) than Z6 ewes (Table �IV-13).
The analysis of associated GH2-N+GH2-Z genotypes revealed that N2+Z7 ewes yielded
significantly (P<0.001) more milk (76.1 ± 17.4 l/150 d), fat (9.27 ± 1.21 kg/150 d), protein
(4.39 ± 1.10 kg/150 d) and fat+protein (13.62 ± 2.44 kg/150 d), and their milk had significantly
higher fat content (12.57 ± 6.00 g/kg; P<0.05) than N1+Z6 ewes and that N2+Z7 and N1+Z6
ewes had identical protein content (Table �IV-14). Furthermore, the milk of N2+Z7 ewes had
also higher levels of fat content than the milk of N3+Z5, N7+Z10, N6+Z2 and N14+Z3 ewes. It
was also observed that the milk of N1+Z6 ewes had significantly higher protein content
(13.27 ± 5.44 kg/150 d; P<0.05) than the milk of N12+Z2 ewes.
The analysis of GH2-N phenotypes revealed that AFN ewes yielded more milk
(21.4 ± 15.6 l/150 d; P>0.05), fat (1.19 ± 1.09 kg/150 d; P<0.05), protein (2.13 ± 0.98 kg/150 d;
P<0.05) and fat+protein (3.44 ± 2.18 kg/150 d; P>0.05) than ACN ewes, and that these phenotypes
exhibited identical milk fat and protein contents (Table �IV-15). It was also observed that AAN
ewes yielded 1.35 ± 0.71 kg/150 d more fat than ACN ewes (P<0.05).
The analysis of GH2-Z phenotypes revealed that AAZ, ABZ, ACZ, AEZ and BBZ
ewes yielded on average 37.2 ± 12.08 l/150 d more milk (P<0.05) than AIZ ewes (Table
�IV-15). All phenotypes presented identical milk fat contents. The milk of AIZ ewes had on
average 7.09 ± 4.15 g/kg more protein contents than all the other ewes (P<0.05). The major
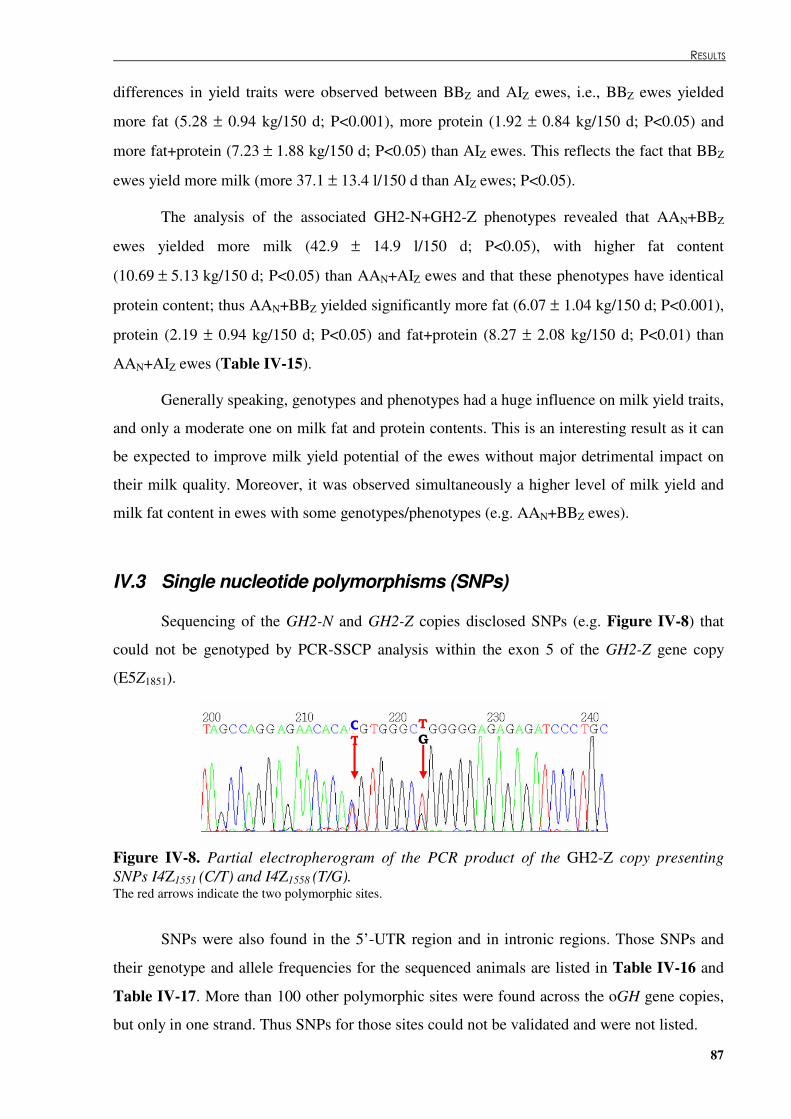
� � ��������������
87
differences in yield traits were observed between BBZ and AIZ ewes, i.e., BBZ ewes yielded
more fat (5.28 ± 0.94 kg/150 d; P<0.001), more protein (1.92 ± 0.84 kg/150 d; P<0.05) and
more fat+protein (7.23 ± 1.88 kg/150 d; P<0.05) than AIZ ewes. This reflects the fact that BBZ
ewes yield more milk (more 37.1 ± 13.4 l/150 d than AIZ ewes; P<0.05).
The analysis of the associated GH2-N+GH2-Z phenotypes revealed that AAN+BBZ
ewes yielded more milk (42.9 ± 14.9 l/150 d; P<0.05), with higher fat content
(10.69 ± 5.13 kg/150 d; P<0.05) than AAN+AIZ ewes and that these phenotypes have identical
protein content; thus AAN+BBZ yielded significantly more fat (6.07 ± 1.04 kg/150 d; P<0.001),
protein (2.19 ± 0.94 kg/150 d; P<0.05) and fat+protein (8.27 ± 2.08 kg/150 d; P<0.01) than
AAN+AIZ ewes (Table �IV-15).
Generally speaking, genotypes and phenotypes had a huge influence on milk yield traits,
and only a moderate one on milk fat and protein contents. This is an interesting result as it can
be expected to improve milk yield potential of the ewes without major detrimental impact on
their milk quality. Moreover, it was observed simultaneously a higher level of milk yield and
milk fat content in ewes with some genotypes/phenotypes (e.g. AAN+BBZ ewes).
IV.3 Single nucleotide polymorphisms (SNPs)
Sequencing of the GH2-N and GH2-Z copies disclosed SNPs (e.g. Figure �IV-8) that
could not be genotyped by PCR-SSCP analysis within the exon 5 of the GH2-Z gene copy
(E5Z1851).
Figure �IV-8. Partial electropherogram of the PCR product of the GH2-Z copy presenting SNPs I4Z1551 (C/T) and I4Z1558 (T/G). The red arrows indicate the two polymorphic sites.
SNPs were also found in the 5’-UTR region and in intronic regions. Those SNPs and
their genotype and allele frequencies for the sequenced animals are listed in Table �IV-16 and
Table �IV-17. More than 100 other polymorphic sites were found across the oGH gene copies,
but only in one strand. Thus SNPs for those sites could not be validated and were not listed.
��
��
�
�
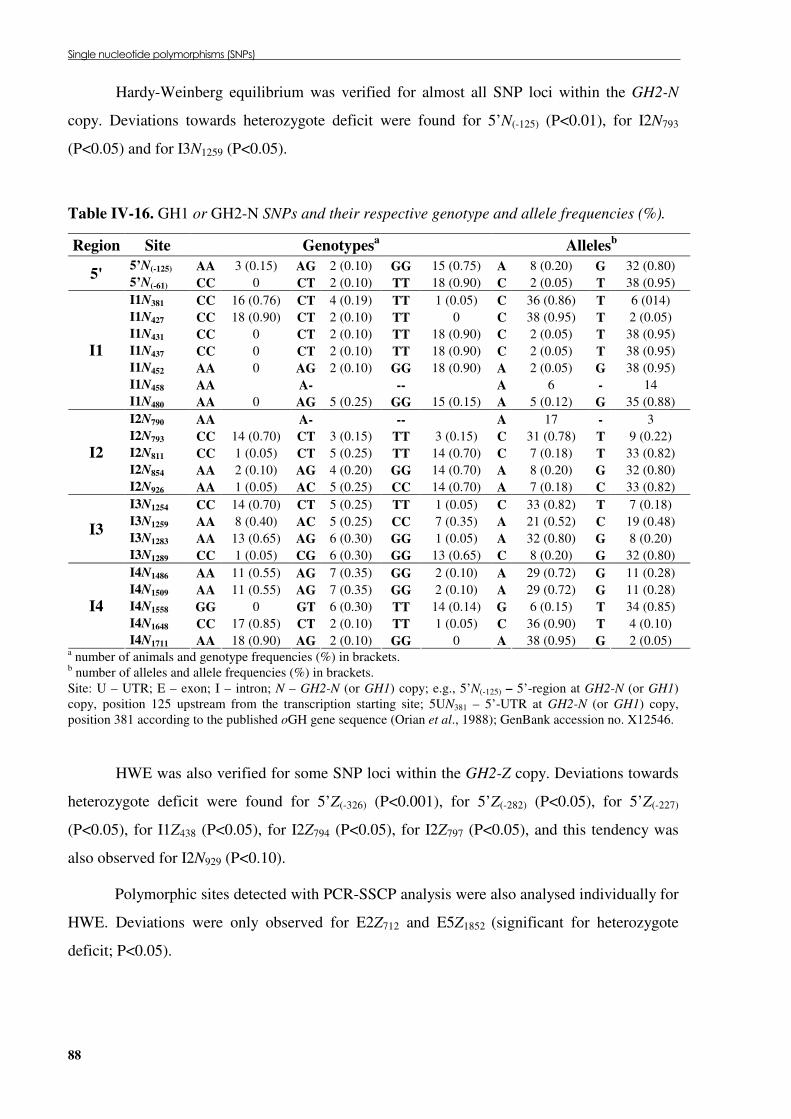
����!�����!���������! ����������#�$��%� � �
88
Hardy-Weinberg equilibrium was verified for almost all SNP loci within the GH2-N
copy. Deviations towards heterozygote deficit were found for 5’N(-125) (P<0.01), for I2N793
(P<0.05) and for I3N1259 (P<0.05).
Table �IV-16. GH1 or GH2-N SNPs and their respective genotype and allele frequencies (%).
Region Site Genotypesa Allelesb 5’N(-125) AA 3 (0.15) AG 2 (0.10) GG 15 (0.75) A 8 (0.20) G 32 (0.80) 5' 5’N(-61) CC 0 CT 2 (0.10) TT 18 (0.90) C 2 (0.05) T 38 (0.95) I1N381 CC 16 (0.76) CT 4 (0.19) TT 1 (0.05) C 36 (0.86) T 6 (014) I1N427 CC 18 (0.90) CT 2 (0.10) TT 0 C 38 (0.95) T 2 (0.05) I1N431 CC 0 CT 2 (0.10) TT 18 (0.90) C 2 (0.05) T 38 (0.95) I1N437 CC 0 CT 2 (0.10) TT 18 (0.90) C 2 (0.05) T 38 (0.95) I1N452 AA 0 AG 2 (0.10) GG 18 (0.90) A 2 (0.05) G 38 (0.95) I1N458 AA A- -- A 6 - 14
I1
I1N480 AA 0 AG 5 (0.25) GG 15 (0.15) A 5 (0.12) G 35 (0.88) I2N790 AA A- -- A 17 - 3 I2N793 CC 14 (0.70) CT 3 (0.15) TT 3 (0.15) C 31 (0.78) T 9 (0.22) I2N811 CC 1 (0.05) CT 5 (0.25) TT 14 (0.70) C 7 (0.18) T 33 (0.82) I2N854 AA 2 (0.10) AG 4 (0.20) GG 14 (0.70) A 8 (0.20) G 32 (0.80)
I2
I2N926 AA 1 (0.05) AC 5 (0.25) CC 14 (0.70) A 7 (0.18) C 33 (0.82) I3N1254 CC 14 (0.70) CT 5 (0.25) TT 1 (0.05) C 33 (0.82) T 7 (0.18) I3N1259 AA 8 (0.40) AC 5 (0.25) CC 7 (0.35) A 21 (0.52) C 19 (0.48) I3N1283 AA 13 (0.65) AG 6 (0.30) GG 1 (0.05) A 32 (0.80) G 8 (0.20)
I3 I3N1289 CC 1 (0.05) CG 6 (0.30) GG 13 (0.65) C 8 (0.20) G 32 (0.80) I4N1486 AA 11 (0.55) AG 7 (0.35) GG 2 (0.10) A 29 (0.72) G 11 (0.28) I4N1509 AA 11 (0.55) AG 7 (0.35) GG 2 (0.10) A 29 (0.72) G 11 (0.28) I4N1558 GG 0 GT 6 (0.30) TT 14 (0.14) G 6 (0.15) T 34 (0.85) I4N1648 CC 17 (0.85) CT 2 (0.10) TT 1 (0.05) C 36 (0.90) T 4 (0.10)
I4
I4N1711 AA 18 (0.90) AG 2 (0.10) GG 0 A 38 (0.95) G 2 (0.05) a number of animals and genotype frequencies (%) in brackets. b number of alleles and allele frequencies (%) in brackets. Site: U – UTR; E – exon; I – intron; N – GH2-N (or GH1) copy; e.g., 5’N(-125) – 5’-region at GH2-N (or GH1) copy, position 125 upstream from the transcription starting site; 5UN381 – 5’-UTR at GH2-N (or GH1) copy, position 381 according to the published oGH gene sequence (Orian et al., 1988); GenBank accession no. X12546.
HWE was also verified for some SNP loci within the GH2-Z copy. Deviations towards
heterozygote deficit were found for 5’Z(-326) (P<0.001), for 5’Z(-282) (P<0.05), for 5’Z(-227)
(P<0.05), for I1Z438 (P<0.05), for I2Z794 (P<0.05), for I2Z797 (P<0.05), and this tendency was
also observed for I2N929 (P<0.10).
Polymorphic sites detected with PCR-SSCP analysis were also analysed individually for
HWE. Deviations were only observed for E2Z712 and E5Z1852 (significant for heterozygote
deficit; P<0.05).
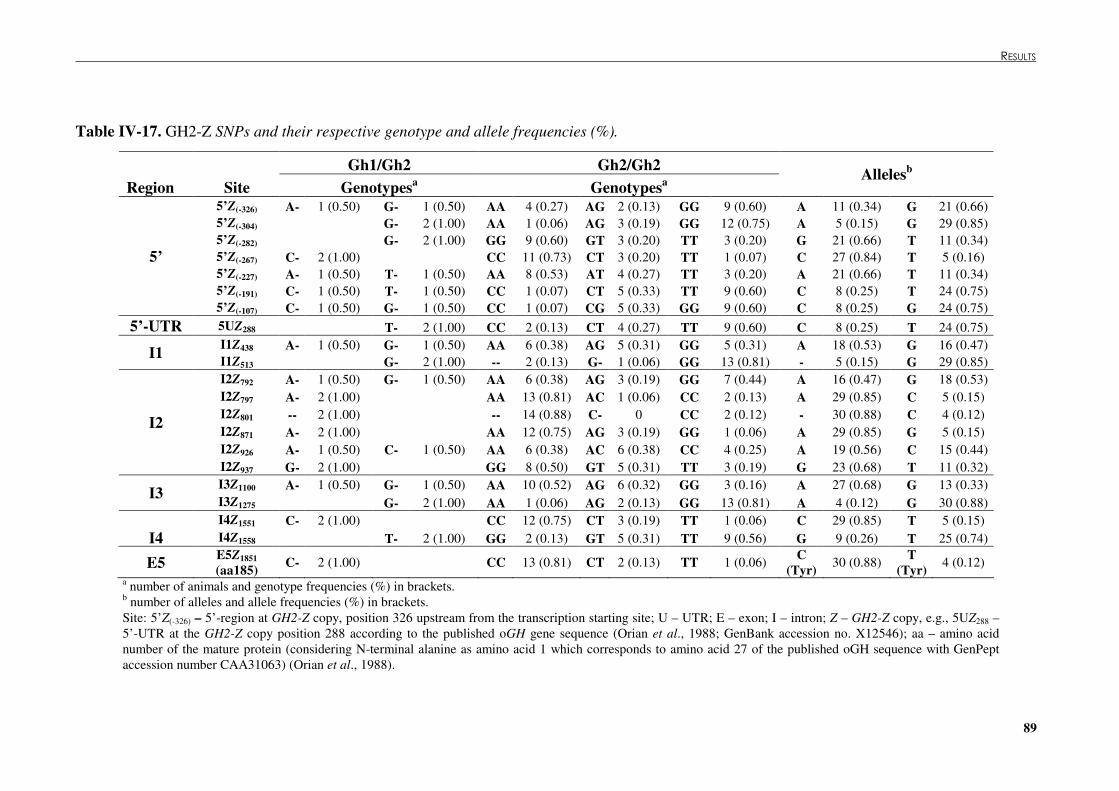
� � � � � � � � � ��������������
89
Table �IV-17. GH2-Z SNPs and their respective genotype and allele frequencies (%).
Gh1/Gh2 Gh2/Gh2 Region Site Genotypesa Genotypesa
Allelesb
5’Z(-326) A- 1 (0.50) G- 1 (0.50) AA 4 (0.27) AG 2 (0.13) GG 9 (0.60) A 11 (0.34) G 21 (0.66) 5’Z(-304) G- 2 (1.00) AA 1 (0.06) AG 3 (0.19) GG 12 (0.75) A 5 (0.15) G 29 (0.85) 5’Z(-282) G- 2 (1.00) GG 9 (0.60) GT 3 (0.20) TT 3 (0.20) G 21 (0.66) T 11 (0.34) 5’Z(-267) C- 2 (1.00) CC 11 (0.73) CT 3 (0.20) TT 1 (0.07) C 27 (0.84) T 5 (0.16) 5’Z(-227) A- 1 (0.50) T- 1 (0.50) AA 8 (0.53) AT 4 (0.27) TT 3 (0.20) A 21 (0.66) T 11 (0.34) 5’Z(-191) C- 1 (0.50) T- 1 (0.50) CC 1 (0.07) CT 5 (0.33) TT 9 (0.60) C 8 (0.25) T 24 (0.75)
5’
5’Z(-107) C- 1 (0.50) G- 1 (0.50) CC 1 (0.07) CG 5 (0.33) GG 9 (0.60) C 8 (0.25) G 24 (0.75) 5’-UTR 5UZ288 T- 2 (1.00) CC 2 (0.13) CT 4 (0.27) TT 9 (0.60) C 8 (0.25) T 24 (0.75)
I1Z438 A- 1 (0.50) G- 1 (0.50) AA 6 (0.38) AG 5 (0.31) GG 5 (0.31) A 18 (0.53) G 16 (0.47) I1 I1Z513 G- 2 (1.00) -- 2 (0.13) G- 1 (0.06) GG 13 (0.81) - 5 (0.15) G 29 (0.85) I2Z792 A- 1 (0.50) G- 1 (0.50) AA 6 (0.38) AG 3 (0.19) GG 7 (0.44) A 16 (0.47) G 18 (0.53) I2Z797 A- 2 (1.00) AA 13 (0.81) AC 1 (0.06) CC 2 (0.13) A 29 (0.85) C 5 (0.15) I2Z801 -- 2 (1.00) -- 14 (0.88) C- 0 CC 2 (0.12) - 30 (0.88) C 4 (0.12) I2Z871 A- 2 (1.00) AA 12 (0.75) AG 3 (0.19) GG 1 (0.06) A 29 (0.85) G 5 (0.15) I2Z926 A- 1 (0.50) C- 1 (0.50) AA 6 (0.38) AC 6 (0.38) CC 4 (0.25) A 19 (0.56) C 15 (0.44)
I2
I2Z937 G- 2 (1.00) GG 8 (0.50) GT 5 (0.31) TT 3 (0.19) G 23 (0.68) T 11 (0.32) I3Z1100 A- 1 (0.50) G- 1 (0.50) AA 10 (0.52) AG 6 (0.32) GG 3 (0.16) A 27 (0.68) G 13 (0.33) I3 I3Z1275 G- 2 (1.00) AA 1 (0.06) AG 2 (0.13) GG 13 (0.81) A 4 (0.12) G 30 (0.88) I4Z1551 C- 2 (1.00) CC 12 (0.75) CT 3 (0.19) TT 1 (0.06) C 29 (0.85) T 5 (0.15)
I4 I4Z1558 T- 2 (1.00) GG 2 (0.13) GT 5 (0.31) TT 9 (0.56) G 9 (0.26) T 25 (0.74)
E5 E5Z1851 (aa185) C- 2 (1.00) CC 13 (0.81) CT 2 (0.13) TT 1 (0.06) C
(Tyr) 30 (0.88) T (Tyr) 4 (0.12)
a number of animals and genotype frequencies (%) in brackets. b number of alleles and allele frequencies (%) in brackets. Site: 5’Z(-326) – 5’-region at GH2-Z copy, position 326 upstream from the transcription starting site; U – UTR; E – exon; I – intron; Z – GH2-Z copy, e.g., 5UZ288 – 5’-UTR at the GH2-Z copy position 288 according to the published oGH gene sequence (Orian et al., 1988; GenBank accession no. X12546); aa – amino acid number of the mature protein (considering N-terminal alanine as amino acid 1 which corresponds to amino acid 27 of the published oGH sequence with GenPept accession number CAA31063) (Orian et al., 1988).
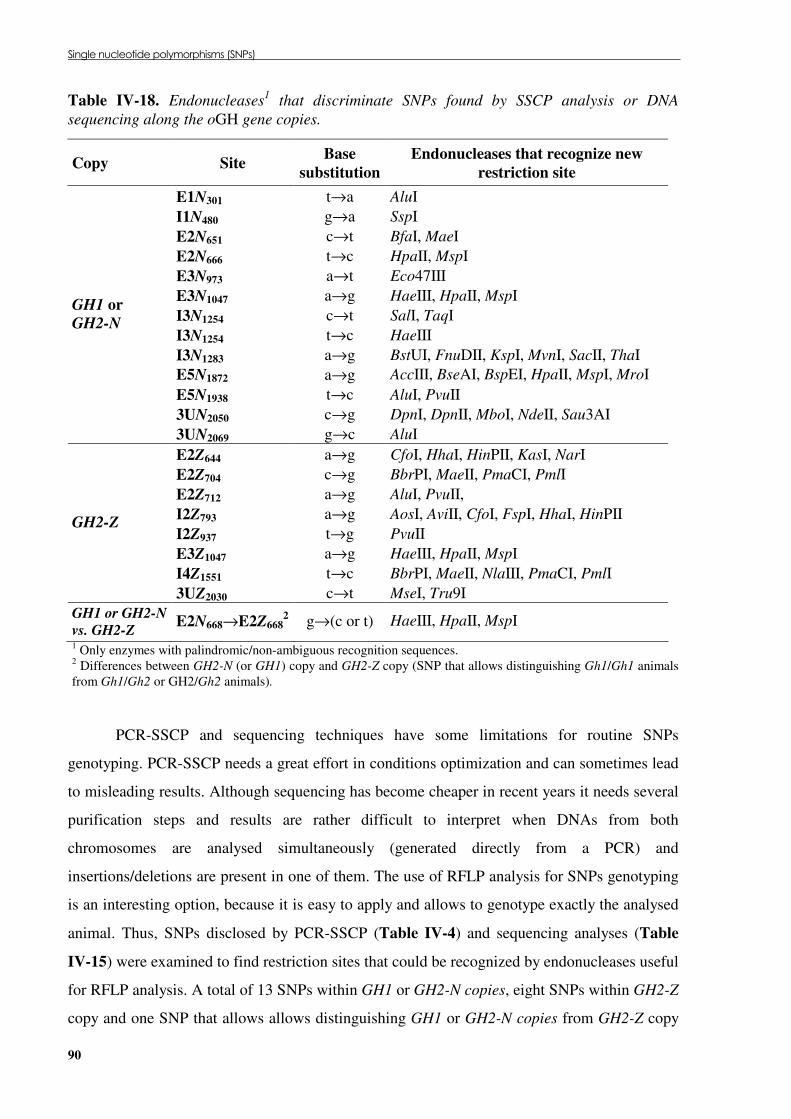
����!�����!���������! ����������#�$��%� � �
90
Table �IV-18. Endonucleases1 that discriminate SNPs found by SSCP analysis or DNA sequencing along the oGH gene copies.
Copy Site Base substitution
Endonucleases that recognize new restriction site
E1N301 t→a AluI I1N480 g→a SspI E2N651 c→t BfaI, MaeI E2N666 t→c HpaII, MspI E3N973 a→t Eco47III E3N1047 a→g HaeIII, HpaII, MspI I3N1254 c→t SalI, TaqI I3N1254 t→c HaeIII I3N1283 a→g BstUI, FnuDII, KspI, MvnI, SacII, ThaI E5N1872 a→g AccIII, BseAI, BspEI, HpaII, MspI, MroI E5N1938 t→c AluI, PvuII 3UN2050 c→g DpnI, DpnII, MboI, NdeII, Sau3AI
GH1 or GH2-N
3UN2069 g→c AluI E2Z644 a→g CfoI, HhaI, HinPII, KasI, NarI E2Z704 c→g BbrPI, MaeII, PmaCI, PmlI E2Z712 a→g AluI, PvuII, I2Z793 a→g AosI, AviII, CfoI, FspI, HhaI, HinPII I2Z937 t→g PvuII E3Z1047 a→g HaeIII, HpaII, MspI I4Z1551 t→c BbrPI, MaeII, NlaIII, PmaCI, PmlI
GH2-Z
3UZ2030 c→t MseI, Tru9I GH1 or GH2-N vs. GH2-Z E2N668→E2Z668
2 g→(c or t) HaeIII, HpaII, MspI 1 Only enzymes with palindromic/non-ambiguous recognition sequences. 2 Differences between GH2-N (or GH1) copy and GH2-Z copy (SNP that allows distinguishing Gh1/Gh1 animals from Gh1/Gh2 or GH2/Gh2 animals).
PCR-SSCP and sequencing techniques have some limitations for routine SNPs
genotyping. PCR-SSCP needs a great effort in conditions optimization and can sometimes lead
to misleading results. Although sequencing has become cheaper in recent years it needs several
purification steps and results are rather difficult to interpret when DNAs from both
chromosomes are analysed simultaneously (generated directly from a PCR) and
insertions/deletions are present in one of them. The use of RFLP analysis for SNPs genotyping
is an interesting option, because it is easy to apply and allows to genotype exactly the analysed
animal. Thus, SNPs disclosed by PCR-SSCP (Table �IV-4) and sequencing analyses (Table
�IV-15) were examined to find restriction sites that could be recognized by endonucleases useful
for RFLP analysis. A total of 13 SNPs within GH1 or GH2-N copies, eight SNPs within GH2-Z
copy and one SNP that allows allows distinguishing GH1 or GH2-N copies from GH2-Z copy
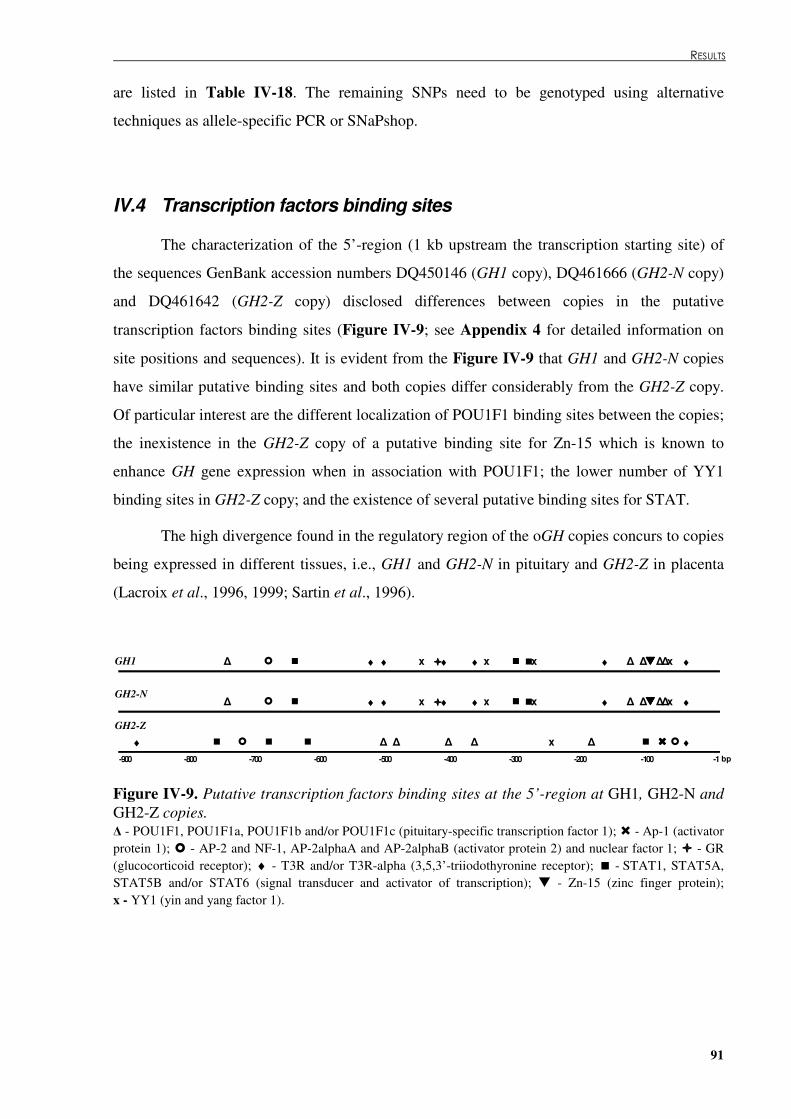
� � ��������������
91
are listed in Table �IV-18. The remaining SNPs need to be genotyped using alternative
techniques as allele-specific PCR or SNaPshop.
IV.4 Transcription factors binding sites
The characterization of the 5’-region (1 kb upstream the transcription starting site) of
the sequences GenBank accession numbers DQ450146 (GH1 copy), DQ461666 (GH2-N copy)
and DQ461642 (GH2-Z copy) disclosed differences between copies in the putative
transcription factors binding sites (Figure �IV-9; see Appendix 4 for detailed information on
site positions and sequences). It is evident from the Figure �IV-9 that GH1 and GH2-N copies
have similar putative binding sites and both copies differ considerably from the GH2-Z copy.
Of particular interest are the different localization of POU1F1 binding sites between the copies;
the inexistence in the GH2-Z copy of a putative binding site for Zn-15 which is known to
enhance GH gene expression when in association with POU1F1; the lower number of YY1
binding sites in GH2-Z copy; and the existence of several putative binding sites for STAT.
The high divergence found in the regulatory region of the oGH copies concurs to copies
being expressed in different tissues, i.e., GH1 and GH2-N in pituitary and GH2-Z in placenta
(Lacroix et al., 1996, 1999; Sartin et al., 1996).
� � � ♦ ♦ x ����♦ ♦ x ��x ♦ � �������x ♦
� � � ♦ ♦ x ����♦ ♦ x ��x ♦ � �������x ♦
♦ � � � � � � � � x � � ���� � ♦-1-900 -500-600-700-800 -100-200-300-400
Figure �IV-9. Putative transcription factors binding sites at the 5’-region at GH1, GH2-N and GH2-Z copies. � - POU1F1, POU1F1a, POU1F1b and/or POU1F1c (pituitary-specific transcription factor 1); � - Ap-1 (activator protein 1); � - AP-2 and NF-1, AP-2alphaA and AP-2alphaB (activator protein 2) and nuclear factor 1; ���� - GR (glucocorticoid receptor); ♦ - T3R and/or T3R-alpha (3,5,3’-triiodothyronine receptor); � - STAT1, STAT5A, STAT5B and/or STAT6 (signal transducer and activator of transcription); � - Zn-15 (zinc finger protein); x - YY1 (yin and yang factor 1).
GH1 GH2-N GH2-Z
bp

����������������������������� � �
92
IV.5 Protein structure prediction
The protein structure analysis comparison between GH1, GH2-N and GH2-Z was
performed by using the the PROSITE SCAN package tools (http://us.expasy.org/) from the
ExPASy Molecular Biology Server.
All the analysed protein variants have a GH/PRL and related hormones signature 1
(motif CfSetIpAPtgkneAqqksdleLlrisllLiqSW) and 2 (motif CFRkDLhkTetYlrVmkC) at
positions 53-86 and 164-181, respectively. Tyrosine kinase phosphorylation site (motif
Kef.Ert.Y at position 30-36) and luecine zipper pattern (motif LlknyglLscfrkdLhktetyL at
position 155-176) are present also in all the protein variants analysed. Amino acid substitution
originate differences in the number of N-myristoylation, protein kinase C phosphorylation,
casein kinase II phosphorylation and N-glycosylation sites found at each of the oGH copies
(Table �IV-19). All GH2-N protein variants have a N-myristoylation site (motif GLfaNA) at
positions 9-14, but this site is absent in the GH2-Z protein variants in which G9 is substituted
by C9 or R9 (Table �IV-5).
Table �IV-19. Protein motif comparison between several oGH protein variants.
Location* Motif VNA VN(S32)a VZA VZ(G63)b VZ(G63,N64)c VZ(S160)d N-myristoylation site 9 – 14 GLfaNA x x – – – – 40 – 45 GQrySI x x x x x x 63 – 68 GNneAQ – – – – x – 160 – 165 GLlsCF x x x x x – Protein kinase C phosphorylation site 28 – 30 TfK x x x x x x 32 – 34 SeR – x – – – – 62 – 64 TgK x x x x – x 106 – 108 SdR x x x x x x 131 – 133 TpR x x x x x x Casein kinase II phosphorylation site 28 – 31 TfkE x x x x x x 63 – 66 SknE – – x – – x 71 – 74 SdlE x x x x x x ASN_glycosylation site 158 – 161 NYSL – – – – – x
a - VNH; b – VZD and VZE; c – VZJ; d - VZC, VZG and VZH (see Table �IV-6).

�� �
���������
“The most exciting phrase to hear in science, the one that heralds new discoveries, is not 'Eureka!' (I found it!) but 'That's funny ...'.”
Isaac Asimov (1920 - 1992)

94
�� �������� ................................................................................................................. 93
V.1 Animals and milk records ...................................................................................................... 95
V.2 oGH copy number genotypes ................................................................................................. 95
V.3 PCR-SSCP polymorphisms at the oGH gene ....................................................................... 97
V.4 Milk yield and composition.................................................................................................. 102
V.5 Single nucleotide polymorphisms (SNPs) ........................................................................... 104
V.6 Future perspectives: ............................................................................................................. 105

� � �����������
95
V.1 Animals and milk records
The main objective of the present work was to detect polymorphisms at the oGH gene
in “Serra da Estrela” animals reared under the “traditional” production system. As each
shepherd practices his own system according to the genetic potential of his animals, the feed
availability at the farm at each moment and other management decisions related with individual
flocks’ constraints at each moment, the present study was extended to seven flocks. All the
animals present in each flock were sampled for blood regardless whether they were related or
not. This kind of approach may have limited the level of polymorphism found in this study.
However this could have been in part overcome by the fact that the analyses were performed in
seven flocks. Rams from ANCOSE Male Testing Centre were also genotyped. These rams
came from different flocks spread all over the “Serra da Estrela” region and are sons of the best
yielding ewes, thus pre-selected as it often happens in studies seeking for genetic markers for
milk production (Parmentier et al., 1999), not randomly chosen as it is mandatory in genetic
diversity studies.
The seven flocks were chosen according to the number of ewes (50 or more), breed
variety (white or black in a proportion similar to the one of the overall population) and milk
yield levels (low, medium and high). The mean number of ewes in “Serra da Estrela” flocks is
low. However flocks with a lower number of animals were not chosen because it would impair
the statistical analysis.
Answers to the production system questionnaire suggest that the production system
changed little since it was thoroughly characterised in 1993 (Gulbenkian et al.). Minor
differences could perhaps be related with the high number of animals in each flock and with the
sanitary legislation related to brucellosis control that restricted the use of communitary barren
lands.
V.2 oGH copy number genotypes
Duplication of the oGH gene has been described in sheep (Valinsky et al., 1990), in
goat (Yamano et al., 1991) and in humans (Chen et al., 1989), but not in bovine. Allele Gh1
(not duplicated) was found to be rare (10%) in “Serra da Estrela” population as it was observed
also in Assaf, Awassi and Merino (Valinsky et al., 1990), and in “Merino da Beira Baixa” (I.C.
Santos, personal communication) ovine breeds. Moreover, in ovine breeds, animals carrying

��� �������������� ��� � �
96
the GH2-Z copy (Gh2 allele) represented approximately 90% of the population suggesting that
it may confer some selective advantage. Moreover, as duplication confers tissue- and
stage-specific activity to the GH2-Z gene, amino acid divergence between the oGH copies was
possibly caused by positive Darwinian selection as suggested by Ohta (1993).
V.2.1 Implications in milk yield
The number of studies analysing the biological effect of oGH copy number are scarce.
Nevertheless, it was investigated in ram lambs selected for body composition and GH levels
(lean and fat lines). Although GH copy number genotypes had no effect on GH secretion
parameters or body composition, it was observed that they significantly influenced the response
to GHRH (Gootwine et al., 1998) suggesting that the natural occurring variation in oGH copy
number influence GH axis response to different nutritional and perhaps physiological status.
Other studies reported that the effects of the oGH copy number in transgenic animals
expressing an additional oGH gene copy were an increased growth rate and a decreased body
fat content (Adams et al., 2002). The effects of the naturally occurring variation in oGH copy
number have been studied in Awassi dairy sheep (Gootwine and Ofir, 1996). The progeny of
two GH1/GH2 rams were studied showing that GH1/GH2 daughters of only one of them
yielded significantly more milk per lactation than their GH2/GH2 half sib (513 l vs 465 l).
“Serra da Estrela” ewes that received the Gh2 allele from their progenitor yielded
21.9 ± 7.5 l/150 d more milk than ewes that received the Gh1 allele (model 2; Figure �IV-4).
The higher milk yield observed in ewes with increasing number of Gh2 alleles points to a
possible dominant effect of Gh2 allele.
The GH2-N is expressed in anterior pituitary gland somatotrope cells (Warwick et al.,
1989). As the GH2-N and GH2-Z gene copies are regulated differently, GH2-Z is not expressed
in the pituitary (Gootwine et al., 1996). It is expressed in placenta trophoblasts and syncitium
between day 30 and 60 of gestation, a period of maximum placental growth (Lacroix et al.,
1996; 1999). Therefore, during early gestation, animals carrying Gh2 allele have two sources of
circulating GH: the pituitary GH derived from GH2-N copy expression and the placental GH
derived from GH2-Z copy expression. Hence, it is reasonable to hypothesise that Gh2 carrying
ewes have higher levels of GH which might influence directly placental and mammary gland
development in the early gestation, and indirectly mammary cell differentiation in the last
phase of gestation through higher levels of placental PRL.
� � �����������
97
V.2.2 Transcription factors binding sites and oGH copies regulation
The analysis of 1 kb fragment upstream from the start of transcription binding site,
revealed that GH1 and GH2-N copies have identical promoter sequences, divergent from
GH2-Z promoter (Figure �IV-9). Of particular importance in transcription regulation are the
binding sites located between positions -300 to -1. This region presents at GH1 and GH2-N
copies four POU1F1 binding sites and a Zn-15 binding site between them; the proximal
POU1F1 binding site interacting with an YY1 binding site. This group of binding factor sites is
flanked by two T3R response elements. Putative binding sites for STATs were predicted within
the -300 to -250 region, flanked proximally by an YY1 putative binding site. The T3R
proximal element is the only one common to the three GH copies. At GH2-Z copy, one binding
site for each AP-1, AP-2, STATs, POU1F1 and YY1 transcription factors was predicted. In
Figure �IV-9 and in Appendix 4, only putative binding sites similar to those described in GH,
PRL and chorionic somatomammotropin genes in human and rat were listed. However a
considerable higher number of transcription factors binding sites were predicted: among them
are several GR, Sp1 and nuclear factor-I (NF-1) binding sites. The differences in the
localisation of the observed putative binding sites are in agreement with the differential
activation of GH and chorionic somatomammotropin gene expression by Sp1 and T3R (Tansey
and Catanzaro, 1991). In addition, the presence of an AP-2 binding site at position -64 of the
GH2-Z copy might mediate GH2-Z copy expression in the placenta in a similar way to the
AP-2 mediated trophoblast-specific transcription of the oPL gene (Liang et al., 1999).
To elucidate the effective role played by the predicted binding sites in regulation of
oGH gene copies, DNase I protection analysis, electrophoretic mobility-shift assays and
mutational analysis should be performed in the future.
V.3 PCR-SSCP polymorphisms at the oGH gene
The high level of polymorphism detected in each oGH gene copy and between oGH
gene copies confirms the PCR-SSCP as an efficient technique to detect mutations (Table �IV-1
and Figure �IV-5), as it has been shown in other studies in sheep (Bastos et al., 2001; Santos et
al., 2004), in goats (Malveiro et al., 2001; Marques et al., 2003), in cattle (Lee et al., 1994b;
Lagziel et al., 1996; Yao et al., 1996; Hines et al., 1998; Lagziel and Soller, 1999) and in pigs
(Kaminski and Wachek, 2002). Moreover, it is cheaper and faster than other techniques like
��������� ���� �������������������� � �
98
allele-specific PCR or RFLP. Nevertheless, it has limitations such as the occasional appearance
of extra bands that may complicate the analysis specially when analysing a duplicated gene.
Up to seven alleles were discriminated by SSCP in the analysed oGH fragments (Table
�IV-1), some of them present at low frequencies in the studied flocks. Fragments III, IV, VI and
VII are illustrative of the high variability of the oGH gene in “Serra da Estrela” breed. The high
number of SSCP patterns found was somehow expected since the analyses were performed
simultaneously on the two copies of the oGH gene.
The optimal conditions for the PCR-SSCP analysis, once settled, can be used to
genotype for known mutations and to screen for new ones simultaneously, being for that
reason, very popular in cancer research (Berggren et al., 2000; Frayling, 2002; Kringen et al.,
2002) and in monitoring microbial communities (Albuquerque and Costa, 2003; Anderson and
Cairney, 2004; Etchebehere et al., 2003). The application of PCR-SSCP to detect
polymorphism in animals has increased in the last years and it probably will continue to
increase concomitantly with the emergence of alternative ways to perform the SSCP analysis
(Ganguly, 2002) such as capillary electrophoresis-based SSCP (Andersen et al., 2003; Larsen et
al., 1999) or fluorescent-SSCP (Scholl et al., 2001) for instance.
SSCP patterns were found to be present at different frequencies in each flock (Table
�IV-1). In fragments I, II and V, pattern A is largely dominant over the others (frequency higher
than 90%), namely in the high milk yielding flocks, what suggests that through traditional
selection, unfavourable alleles were eliminated, thus possibly changing population HWE.
Results from HWE tests (Table �IV-3) showed deviations from the expected values in
all but fragments IIN and IIIN. It is interesting to notice that for the same fragment in copies
GH2-N and GH2-Z, the deviation from HWE seems to be due to different causes. In fragments
IIIN, IVN and VIZ deviation from HWE is mainly due to significant levels of heterozygote
excess which might indicate the presence of overdominant selection or the occurrence of
outbreeding. However, in fragments VIIN and IIIZ, IVZ and VIIZ HWE deviation results from a
homozygote excess what could indicate the occurrence of one or more of the following four
events: 1) those fragments were under selection; 2) a “null allele” could be present leading to a
false observation of homozygote excess what is most likely to be the case in GH2-Z fragments;
3) high levels of inbreeding could have occured; 4) the population could be substructured
leading to Wahlunds’ effect (Dorak, 2006). Indeed, Gh1/Gh2 animals, if they result from a
Gh1/Gh1 x Gh1/Gh2 mating, are identical to their Gh1/Gh2 parent at GH2-Z copy and thus
� � �����������
99
their inbreeding coefficient is probably higher increasing artificially the homozygote excess in
the GH2-Z copy fragments.
V.3.1 Molecular characterization of the SSCP patterns
As GH1, GH2-N and GH2-Z sequences are highly homologous it was not possible to
design specific primers for the exons and the 3’-UTR of each copy. However, the approach
described in the present study (section �IV.2.3) allowed the SSCP patterns to be interpreted and
GH2-N and GH2-Z copies genotypes attributed.
Valinsky et al. (1990), Gootwine et al. (1993; 1996) and Ofir and Gootwine (1997)
reported three PvuII-RFLPs related to the oGH copy number, located at position 712 in exon 2
(restriction site present only in the GH2-N copy), position 932-937 in the intron 2 (restriction
site mutated in the GH2-Z copy) and position 1935-1939 in the exon 5 (restriction site present
both in the GH2-N and GH2-Z copies). The existence of polymorphisms at PvuII restriction
sites in exons 2 (GH2-N copy) and 5 (GH2-Z copy), identified in the present work, excluded
the use of PvuII-RFLP to discriminate between oGH copies (Table �IV-4); this could be
achieved using PCR-SSCP analysis of exon 2 as described (section �III.4).
V.3.1.1 oGH gene polymorphisms Results presented in Table �IV-4 and Table �IV-5 revealed copy specific polymorphisms
(24 at the GH2-N and 14 at the GH2-Z copies) and a common polymorphism at position 1047.
Alignment of sequences of the GH2-N and GH2-Z predicted mature proteins from all the
genotyped sheep exhibiting the two oGH gene copies (17 Gh2/Gh2 and two Gh1/Gh2 animals),
revealed that the protein copies always differ at two amino acids (aa): aa(-7) (P → L; site 624)
and aa9 (G → R or C; site 668) as reported by Wallis et al. (1998). Aa63 differs also between
the predicted protein copies (G → S; site 1057) in most animals; however, in some, G63 is
present in both GH2-Z and GH2-N copies. GH1 protein sequence was found to be identical to
the GH2-N consensus sequence (Orian et al., 1988) in accordance with the finding by Ofir and
Gootwine (1997) in Awassi, Romanov and Romney ewes.
The present (Table �IV-1, Table �IV-4, Table �IV-5 and Figure �IV-5) and previous
results in other Portuguese ovine breeds (Bastos et al., 2001; Santos et al., 2004), as well as in
Assaf breed (Santos et al., unpublished results), in Israeli breed (Ofir and Gootwine, 1997) and
in Indian breeds (GenBank accession numbers: DQ166369-74 and DQ176733-47) showed that
coding regions are much more polymorphic in ovine than in bovine GH gene. In bovine,
polymorphisms detected by SSCP analysis are present mainly in non-coding regions and in
��������� ���� �������������������� � �
100
exon 5 (Falaki et al., 1997; Lagziel and Soller, 1999; Ge et al., 2003). The low level of
polymorphism observed in the 5’-UTR and in exon 1 (fragments I and II, respectively) is in
agreement with previous findings indicating that these regions are highly conserved in GH1
and GH2-N genes in ovine (Ofir and Gootwine, 1997). Exon 2 was the most polymorphic one
in “Serra da Estrela” ewes and also in Merino da Beira Baixa (Santos et al., 2004), but not in
caprine breeds (Malveiro et al., 2001; Marques et al., 2003). This suggests that those
polymorphisms arose after species differentiation. In exon 4, no polymorphism was revealed in
spite of the two observed SSCP patterns, suggesting that DNA modification(s) other than
nucleotide mutations could be detected by SSCP analysis. Conversely, eight variants were
described in exon 4 (GenBank accession numbers: DQ176740-47) in Indian ovine breeds,
mainly within the exon 4-intron 4 junction region, and a high polymorphism level was also
observed in caprine breeds (Malveiro et al., 2001; Marques et al., 2003).
Many of the polymorphic sites detected by SSCP analysis were located near to CCC or
AAA repeated regions suggesting that SSCP analysis might bias SNP detection towards
repeated sequences with low secondary structure of the single strand DNA being less efficient
in mutation dectetion within complex local secondary structures as palindromic regions, as
observed in bovine and humans (Barendse and Armitage, 2001).
Taking fragment genotypes as a starting point, oGH haplotypes were inferred in both
copies for some genotypes, but it was not possible to determine the phase for all genotypes, so
statistical analyses could not be performed involving haplotypes as it has been done in bovine
by Lagziel et al. (1996). At the time of blood collection many of the ewes’ sires were no longer
in the flocks, and therefore could not be genotyped. Nevertheless, considering pedigree
information of 750 animals, a large number of oGH haplotypes was inferred, hence revealing
considerable genetic diversity at the oGH gene within this breed. Eighty six haplotypes were
inferred in the GH2-N copy, and 32 in the GH2-Z copy which is much more than the 14
different haplotypes reported by Lagziel et al. (1996) in Israel Holstein bovine breed.
V.3.1.2 Predicted protein variants The genetic polymorphisms detected in both copies could either involve regulatory
regions and affect gene transcription rate (Pesole et al., 2000; discussed in section �V.2.2), or
influence the secondary structure of the protein and its post-transcriptional function (Woychik
et al., 1984), or be linked to a genotype of interest located elsewhere (Sneyers et al., 1994).
Predicted protein variants are listed in Table �IV-6. Considering the predicted amino
acid changes between GH2-N protein variants, aa(-16) is part of the GH signal peptide, aa3 is

� � �����������
101
near the GH NH2-terminal, amino acids 8, 22, 25 and 32 are in helix 1, with aa8 being involved
in the second receptor-binding site as defined by Cunningham et al. (1991) for hGH. The
remaining amino acids involved in variant differentiation are between helices 1 and 2.
Considering the predicted GH2-Z protein variants, aa(-1) is part of the GH signal
peptide, aa2 is near the GH NH2-terminal, amino acids 9, 21 and 23 are in helix 1, with aa9
being part of the second receptor-binding site, amino acids 55, 59, 63 and 64 are between helix
1 and 2, with aa63 being part of the first receptor-binding site, and aa160 is between helix 3
and 4. NH2-terminal residues, involved in the GH receptor binding, have a substantial
galactopoietic activity in cows (Eppard et al., 1992). Hence, polymorphisms found in this
region could account for the differences observed in the milk yield.
Several amino acid substitutions found within and/or between GH copies were
predicted to change the nature/number of protein’s motifs (Table �IV-19) that might influence
protein structure, stability, or activity:
- The changes at position 9 (G to R in GH2-N or to C in GH2-Z) disrupt the
N-myristoylation site. The possible link between a fatty acyl group and GH could
mediate protein-protein interactions or change the structure and activity of the protein to
which it binds (Voet et al., 1999). S160 GH2-Z variants (VZC, VZG, and VZH) have also
the N-myristoylation site disrupted, and inversely the VzJ (G63,N64) variant presents an
extra N-myristoylation site.
- Several predicted GH variants could be differently regulated as they were found to:
either have one additional PKC phosphorylation site (S32 in VNH) or lack one (G63,N64
in VZJ) as compared with VNA and VZA variants, respectively; and/or lack one casein
kinase II phosphorylation site (VzD and VZJ) with regard to the VZA variant.
- The occurrence of a putative N-glycosylation site in VZC, VZG, and VZH variants and
the presence of the appropriate oligosaccharide-processing enzymes could lead to the
cotranslational N-glycosylation of GH (Voet et al., 1999). It is not known whether it
affects the biological function of the protein or not.
Some authors report that GHR processes great conformational plasticity to bond with
dissimilar sites on GH, thus an amino acid substitution per si possibly does not disrupt
GH/GHR binding (Sami et al., 1999). However, GH myristoylation, phosphorylation and/or
glycosylation states might reduce the GH/GHR binding affinity altering GH-signal transduction
and consequently its biological activity.
��������� ���� �������������������� � �
102
The present work disclosed new oGH variants coded by both gene copies. To elucidate
the influence of the underlying amino acid changes on the structure-function of the GH further
studies are needed. One possible approach could be the heterologous production of functional
GH variants as suggested by Appa Rao et al. (1997).
V.4 Milk yield and composition
Recent studies performed in goats (Malveiro et al., 2001; Marques et al., 2003) and
cattle (Lagziel et al., 1996; Lagziel and Soller, 1999; Yao et al., 1996) allowed the
establishment of associations of GH SSCP patterns with milk traits.
In the present work significant associations were found between oGH genotypes (Table
�IV-7, Table �IV-8 and Table �IV-9) or phenotypes (Table �IV-10, Table �IV-11 and Table
�IV-12) and milk production in “Serra da Estrela” ewes. Some of the alleles uncovered by SSCP
and sequencing analyses were not found to correspond to homozygous genotypes (and their
corresponding phenotypes). This limited the statistical analysis to the use of a model where
only additive genetic effects were considered.
Considering the overall population, differences of approximately 21 l/150 d (P<0.05)
were observed between the most and the least productive genotypes either for GH2-N (N7 vs.
N5; Table �IV-7) or GH2-Z copies (Z7 vs. Z2; Table �IV-8). However, milk yield differences
reach 31.4 ± 9.0 l/150 d between the extreme productive GH2-N phenotypes [ABN vs. (AHN
and /or BEN); Table �IV-10], and only 16.6 ± 8.3 l/150 d between the extreme productive GH2-
Z phenotypes [BDZ vs. (ADZ and/or BEZ); Table �IV-11]. The results suggest that selecting for
the highest milk yielding GH2-N phenotype would maximise the selection response.
At the GH2-N copy, the least (N5) and the most (N7) productive GH2-N genotypes
code for the same protein variant. Therefore, the observed effect upon milk yield could be due
to the efficiency of mRNA processing or to the stability of its pre-processed form.
In the GH2-Z copy, the Z2 genotype codes to a protein variant with the following amino
acids: F2,R9,L21,S63,K64,G160. It corresponds to the published oGH sequence number Q95205
(Lacroix et al., 1996) and differs in one amino acid from the one coded by the Z7 genotype that
has a C in position 9 (C9). The effect of an arginin at position 9 was discussed by Wallis et al.
(1998) who suggested that a R9 variant can have increased binding affinity to GHR binding site
2 as it enables a salt bridge formation with E122 and hydrogen bond to S120 of the GHR.
� � �����������
103
Whether the Arg→Cys substitution influences GH binding to its receptor or protein folding
remains to be elucidated. In any way, the genotypes which code for C9 variant were positively
(P<0.05) associated with milk yield (Table �IV-9).
The phenotypes ABN vs. (AHN and /or BEN), corresponding to the GH2-N copy, are the
most and least productive ones respectively; they differ from each other in aa(-16) and aa32.
The Leu→Pro substitution at aa(-16) introduces probably a kink in the GH signal peptide in
variants VNE and VNH (both with P-16), which might impair their binding to the signal
recognition particle and reduce GH secretion rate. As a result, animals carrying the P-16 protein
variant could have reduced circulating GH level and consequently lower milk yielding aptitude
as suggested by the present results. Additionally, a Phe→Ser substitution at aa32 located in
helix 1 creates an additional PKC phosphorylation site that might interfere with VNE and VNH
protein folding.
The phenotypes BDZ vs. (ADZ and/or BEZ), corresponding to the GH2-Z copy, are the
most and least productive ones respectively; they differ from each other in aa9 and aa63. BDZ
is homozygous for C9, and ADZ and BEZ are heterozygous phenotypes in which variants VZA
and VZE present an Arg at position 9 and variants VZB and VZD carry a Cys at position 9. The
putative influence of these amino acid changes were discussed above. The three phenotypes are
heterozygous for aa63. Aa63 belongs to the binding site 1 in human GH (de Vos et al., 1992).
Wallis et al. (1998) suggest that the substitution of S63 together with an Arg at position (R9) at
the GH2-Z copy (VZA) could inhibit GH-GHR binding. The presence of the G63, described for
the first time in ovine populations in the present work, and its positive effect on milk yield is in
agreement with that assumption. In nature, although acting at different stages, both oGH copies
act to control ewes’ metabolism. The GH2-N copy contribute to the homeorhetic control of the
metabolism throughout life (Bauman and Currie, 1980) and GH2-Z copy is thought to
influence placental and foetal growth, contributing to successful gestations of twins (Lacroix et
al., 1999). Whether the GH2-Z copy influences directly milk yield, or not, remains
controversial. However, significant interactions between GH2-N and GH2-Z were observed
(Table �IV-9 and Table �IV-12) indicating that some epistatic effects may occur between GH
copies, i.e., the effect of one copy depends on the other copy genotype/phenotype. Considering
both copies simultaneously, the milk yield differential between (N2+Z7) and (N5+Z2)
genotypes was 39.6 ± 7.5 l/150 d (Table �IV-9) and the differential between (AAN+BBZ) and
[(AHN and/or BEN)+BBZ] phenotypes was only 16.2 ± 8.1 l/150 d (Table �IV-12). Thus, the
apparent joint effect of GH2-N and GH2-Z genotype could improve milk yield in 25% as

��������������� �������� � �
104
compared with mean milk yield of the analysed population. Within each flock, the positive
influence of the combined genotypes on milk yield ranged from 10% in FL2 to approximately
35% in FL3, FL5 and FL6.
The effect of genotypes/phenotypes differences in milk yield changes from flock to
flock. In fact, one genotype/phenotype presenting the highest milk yield within one flock could
be not the best in other flock. The results suggest that genotype/phenotype x environment
interaction might influence the expression of milk yield potential in ewes as it was previously
described in “Serra da Estrela” ewes (Carolino et al., 2003) and in Sarda ewes (Sanna et al.,
2002). Nevertheless, the ranking of genotypes/phenotypes in each flock according to their
effects on milk yield showed that those which influence milk yield positively within a flock
have an expected similar effect in the other flocks and the same occurs for the low yielding
genotypes/phenotypes. However, exceptions can occur as observed in FL5. Thus, it is
important to test genotypes x environement (i.e., flock) interaction.
The influence of oGH genotypes/phenotypes were also tested on milk yield composition
(Table IV-13, Table IV-14 and Table IV-15). Ewes with associated GH2-N+GH2-Z genotype
N2+Z7 more milk with higher milk fat content and similar protein content than ewes with
genotype N5+Z2. Moreover, a similar observation was made for AAN+BBZ protein phenotype.
In general, the oGH genotypes/phenotypes with higher milk yield potential influenced
positively milk fat and protein content, and milk fat, protein and fat+protein yields. This is an
interesting result because usually, increasing milk yield results in lower fat and protein
contents. However further studies should be performed to confirm the present results, because
only one year of milk composition records was consider. Nevertheless, previous studies
reported a positive effect of GH polymorphisms in milk fat content (Khatami et al., 2005; Lee
et al., 1994a). The higher milk fat content observed could result form the enhanced availability
of milk fat precursors due to GH-induced increase in adipose tissue lipolysis.
V.5 Single nucleotide polymorphisms (SNPs)
In this work, the oGH copies were sequenced to characterise SSCP alleles. The
procedure followed adopted, in addition to the detection of polymorphisms not identified by
SSCP, to screen intronic regions for SNPs. SNPs were found to be more frequent in intron 1 at
the GH2-N copy, and in the 5’-region and in intron 2 at the GH2-Z copy. It was also found a

� � �����������
105
SNP (synonymous mutation) in the exon 5 at the GH2-Z copy not detected by SSCP analysis
(Table IV-16 and Table IV-17).
SNPs found in the intronic regions were expected to be in HWE, but some were not.
Deviation from HWE could be due to selection as well as to other factors discussed in section
V.3. Deviation of HWE towards homozygote excess suggests that selection could have been
applied to sites 5’N(-125), I2N793 and I3N1259. Site 5’N(-125) is located at the GH1 and GH2-N
promoter regions between Sp1 and POU1F1 binding sites (position -125; Figure II-4), within
an important region for oGH gene transcription regulation where SNPs have been shown to
affect IGF-1 concentration in cattle (Ge et al., 2003). SNPs in intronic regions of several genes
from the somatotropic axis have been shown to influence productive traits: e.g., a SNP in
intron 3 of the GH gene influenced milk fat yield in Holstein cows (Lee et al., 1994a) and a
SNP in intron 5 of POU1F1 influenced milk and protein yields, fat percentage, body depth,
angularity, and rear leg set in Italian Holstein-Friesian bulls (Renaville et al., 1997).
Homozygote excess was also observed for several SNPs at the GH2-Z copy.
Due to the insufficient number of animals screened, statistical analyses were not
attempted to search for associations between SNPs and milk production traits. In Table IV-18
a list of endonucleases is proposed to rapidly identify some of the SNPs found at the oGH in
“Serra da Estrela” ovine breed through RFLP analysis.
V.6 Future perspectives:
In traditional quantitative genetics, selection is based on phenotypes and parental
information whereas in molecular genetics, selection could be made directly upon a genotype
via candidate gene marker approach.
An ideal dairy system would be the one where:
- all animals could be correctly identified (e.g., combining traditional identification
systems with electronic identification such as reticulo-ruminal encapsulated
chips);
- parental information is accurate (extensive use of artificial insemination, AI,
and/or parentage testing) and available for all individuals; and
- phenotype data records are fully reliable (data normalization and validation).

"������ ��� ����#��� � �
106
Combining quantitative and molecular genetics (i.e., MAS) in a selection index where
the best males are selected to sire the next generation should maximise genetic progress.
However, the “Serra da Estrela” traditional ovine production system is not an ideal one,
namely because AI application is still limited. An alternative approach to improve the existing
selection scheme would be to GH genotype solely lamb daughters of the best females within
the flock and retain only those with the most production-relevant genotypes. Such an approach
might reduce generation intervals and improve greatly the milk yield response in dairy ewes.
��� �
���������
One never notices what has been done;
one can only see what remains to be done.”
Marie Curie, letter to her brother (1894)

� � ����$������
109
In conclusion, the GH2-N and GH2-Z genotypes were shown to significantly affect milk
yield in the “Serra da Estrela” ewes. The apparent joint effect of GH2-N and GH2-Z genotypes
could, on average improve milk yield adjusted to 150 d lactation on 25% as compared with
mean milk yield of the analysed population.
The high level of polymorphism observed suggests that genetic variability at the GH
gene in Ovis aries could be exploited to produce genotypes with increased genetic merit.
In addition the present results suggest that oGH genotypes/phenotypes influence
significantly milk yield in sheep, without detrimental influence in milk composition. However,
the use of the oGH gene as a marker for sheep selection requires a previous knowledge of the
animals’ behaviour within the flock where they are reared.

���� �
�� �������

� � �%"%�%��%��
113
Aarskog D, Eiken HG, Bjerknes R and Myking OL 1997 Pituitary dwarfism in the R271W Pit-1 gene mutation. European Journal of Pediatrics 156 829-834.
Abdel-Meguid SS, Shieh H-S, Smith WW, Dayringer HE, Violand BN and Bentle LA 1987 Three-dimensional structure of a genetically engineered variant of porcine growth hormone. Proceedings of the
National Academy of Science U.S.A. 84 6434-6437.
Accorsi PA, Pacioni B, Pezzi C, Forni M, Flint DJ and Seren E 2002 Role of prolactin, growth hormone and insulin-like growth factor 1 in mammary gland involution in the dairy cow. Journal of Dairy Science 85 507-513.
Adams NR and Briegel JR 2005 Multiple effects of an additional growth hormone gene in adult sheep. Journal
of Animal Science 83 1868-1874.
Adams NR, Briegel JR and Ward KA 2002 The impact of a transgene for ovine growth hormone on the performance of two breeds of sheep. Journal of Animal Science 80 2325-2333.
Adams TE, Baker L, Fiddes RJ and Brandon MR 1990 The sheep growth hormone receptor: molecular cloning and ontogeny of mRNA expression in the liver. Molecular and Cellular Endocrinology 73 135-145.
Adams TE, Hansen JA, Starr R, Nicola NA, Hilton DJ and Billestrup N 1998 Growth hormone preferentially induces the rapid, transient expression of SOCS-3, a novel inhibitor of cytokine receptor signaling. Journal
of Biological Chemistry 273 1285-1287.
Akira S 1999 Functional roles of STAT family proteins: lessons from knockout mice. Stem Cells 17 138-146.
Albuquerque DM and Costa SCB 2003 Genotyping of human cytomegalovirus using non-radioactive single-strand conformation polymorphism (SSCP) analysis. Journal of Virological Methods 110 25-28.
Allan GJ, Beattie J and Flint DJ 2004 The role of IGFBP-5 in mammary gland development and involution. Domestic Animal Endocrinology 27 257-266.
Allan GJ, Shand JH, Beattie J and Flint DJ 1999 Identification of novel sites in the ovine growth hormone receptor involved in binding hormone and conferring species specificity. European Journal of Biochemistry 261 555-562.
Allan GJ, Tonner E, Barber MC, Travers MT, Shand JH, Vernon RG, Kelly PA, Binart N and Flint DJ 2002 Growth hormone, acting in part through the insulin-like growth factor axis, rescues developmental, but not metabolic, activity in the mammary gland of mice expressing a single allele of the prolactin receptor. Endocrinology 143 4310-4319.
Altschul, SF, Madden TL, Schäffer AA, Zhang J, Zhang Z, Miller W and Lipman DJ 1997 Gapped BLAST and PSI-BLAST: a new generation of protein database search programs. Nucleic Acids Research 25 3389-3402.
Andersen PS, Jespersgaard C, Vuust J, Christiansen M and Larsen LA 2003 Capillary Electrophoresis-Based Single Strand DNA Conformation Analysis in High-Throughput Mutation Screening. Human Mutation 21 455-465.
Anderson IC and Cairney JWG 2004 Diversity and ecology of soil fungal communities: increased understanding through the application of molecular techniques. Environmental Microbiology 6 769-779.
Anthony RV, Limesand SW and Jeckel KM 2001 Transcriptional regulation in the placenta during normal and compromised fetal growth. Biochemical Society transactions 29 42-48.
Appa Rao KB, Garg LC, Panda AK and Totey SM 1997 High-level expression of ovine growth hormone in Escherichia coli: single-step purification and characterization. Protein Expression and Purification 11 201-208.
114
Argetsinger LS and Carter-Su C 1996 Mechanism of signaling by growth hormone receptor. Physiological
Reviews 76 1089-1107.
Argetsinger LS, Campbell GS, Yang X, Witthuhn BA, Silvennoinen O, Ihle JN and Carter-Su C 1993 Identification of JAK2 as a growth hormone receptor-associated tyrosine kinase. Cell 74 234-244.
Baldi A 1999 Manipulation of milk production and quality by use of somatotropin in dairy ruminants other than cow. Domestic Animal Endocrinology 17 131-137.
Baldi A, Modina S, Cheli F, Gandolfi F, Pinotti L, Scesi LB, Fantuz F and Dell'Orto V 2002 Bovine somatotropin administration to dairy goats in late lactation: effects on mammary gland function, composition and morphology. Journal of Dairy Science 85 1093-1102.
Barash I, Cromlish W and Posner BI 1988 Prolactin (PRL) receptor induction in cultured rat hepatocytes: dual regulation by PRL and growth hormone. Endocrinology 122 1151-1158.
Baratta M, Saleri R, Mascadri C, Coy DH, Negro-Vilar A, Tamanini C and Giustina A 1997 Modulation by galanin of growth hormone and gonadotropin secretion from perifused pituitary and median eminence of prepubertal male calves. Neuroendocrinology 66 271-277.
Barb CR, Yan X, Azain MJ, Kraeling RR, Rampacek GB and Ramsay TG 1998 Recombinant porcine leptin reduces feed intake and stimulates growth hormone secretion in swine. Domestic Animal Endocrinology 15 77-86.
Barendse W and Armitage SM 2001 The single strand conformational analysis of cattle and human single nucleotide polymorphisms may be biased towards specific sequence motifs that minimize local secondary structure of single strand DNA. Animal Biotechnology 12 21-28.
Barillet F, Arranz JJ and Carta A 2005 Mapping quantitative trait loci for milk production and genetic polymorphisms of milk proteins in dairy sheep. Genetic, Selection and Evolution 37 Suppl 1 S109-S123.
Barillet F, Marie C, Jacquin M, Lagriffoul G and Astruc JM 2001 The French Lacaune dairy sheep breed: use in France and abroad in the last 40 years. Livestock Production Science 71 17-29.
Barker-Gibb ML and Clarke IJ 1996 Increased galanin and neuropeptide-Y immunoreactivity within the hypothalamus of ovariectomised ewes following a prolonged period of reduced body weight is associated with changes in plasma growth hormone but not gonadotropin levels. Neuroendocrinology 64 194-207.
Barracosa HMGP 1996 [Study of genetic polymorphism and its’ association with milk yield potential in Algarvia goat breed and Serra da Estrela sheep breed]. MSc Dissertation, University of Algarve, 86 pp.
Bartke A and Brown-Borg H 2004 Life extension in the dwarf mouse. Current Topics in Developmental Biology 63 189-225.
Bastos E, Cravador A, Azevedo J and Guedes-Pinto H 2001 Single strand conformation polymorphism (SSCP) detection in six genes in Portuguese indigenous sheep breed "Churra da Terra Quente". Biotechnologie,
Agronomie, Société et Environnement 5 7-15.
Bauman DE 1992 Bovine Somatotropin: Review of an Emerging Animal Technology. Journal of Dairy Science 75 3432-3451.
Bauman DE 1999 Bovine somatotropin and lactation: from basic science to commercial application. Domestic
Animal Endocrinology 17 101-116.
Bauman DE and Currie WB 1980 Partitioning of nutrients during pregnancy and lactation: a review of mechanisms involving homeostasis and homeorhesis. Journal of Dairy Science 63 1514-1529.
Bauman DE and Elliot JM 1983 Control of nutrient partitioning in lactating ruminants. In: Biochemistry of lactation. Ed. TB Mepham. Elsevier Science Publishers BV, Amsterdam, pp 437-468.
� � �%"%�%��%�
115
Bauman DE and Vernon G 1993 Effects of exogenous bovine somatotropin on lactation. Annual Reviews of
Nutrition 13 437-461.
Bauman DE, Everett RW, Weiland WH and Collier RJ 1999 Production responses to bovine somatotropin in northeast dairy herds. Journal of Dairy Science 82 2564-2573.
Bauman DE, Peel CJ, Steinhour WD, Reynolds PJ, Tyrrell HF, Brown AC and Haaland GL 1988 Effect of bovine somatotropin on metabolism of lactating dairy cows: influence on rates of irreversible loss and oxidation of glucose and nonesterified fatty acids. Journal of Nutrition 118 1031-1040.
Bell AW 1995 Regulation of Organic Nutrient Metabolism During Transition from Late Pregnancy to Early Lactation. Journal of Animal Science 73 2804-2819.
Bell AW and Bauman DE 1997 Adaptations of glucose metabolism during pregnancy and lactation. Journal of
Mammary Gland Biology and Neoplasia 2 265-278.
Bennani-Baiti IM, Asa SL, Song D, Iratni R, Liebhaber SA and Cooke NE 1998 DNase I-hypersensitive sites I and II of the human growth hormone locus control region are a major developmental activator of somatotrope gene expression. Proceedings of the National Academy of Science U.S.A. 95 10655-10660.
Berggren P, Steineck G and Hemminki K 2000 A rapid fluorescence based multiplex polymerase chain reaction - single-strand conformation polymorphism method for p53 mutation detection. Electrophoresis 21 2335-2342.
Berry SD, McFadden TB, Pearson RE and Akers RM 2001 A local increase in the mammary IGF-1: IGFBP-3 ratio mediates the mammogenic effects of estrogen and growth hormone. Domestic Animal Endocrinology 21 39-53.
Beswick NS and Kennelly JJ 1998 The influence of bovine growth hormone and growth hormone releasing factor on acetyl-CoA carboxylase and fatty acid synthase in primiparous Holstein cows. Comparative
biochemistry and physiology. Part C, Pharmacology, toxicology & endocrinology 120 241-249.
Blott S, Kim JJ, Moisio S, Schmidt-Kuntzel A, Cornet A, Berzi P, Cambisano N, Ford C, Grisart B, Johnson D, Karim L, Simon P, Snell R, Spelman R, Wong J, Vilkki J, Georges M, Farnir F and Coppieters W 2003 Molecular dissection of a quantitative trait locus: a phenylalanine-to-tyrosine substitution in the transmembrane domain of the bovine growth hormone receptor is associated with a major effect on milk yield and composition. Genetics 163 253-266.
Bluet-Pajot MT, Epelbaum J, Gourdji D, Hammond C and Kordon C 1998 Hypothalamic and hypophyseal regulation of growth hormone secretion. Cellular and Molecular Neurobiology 18 101-123.
Boldman KG, Kriese LA, van Vleck LD and Kachman SD 1993 A set of programs to obtain estimates of variances and covariances. In A manual for use of MTDFREML (draft). USDA ARS, US Meat Animal Research Center, Clay, NE.
Boldman KG, Kriese LA, van Vleck LD, van Tassel1 CP and Kachman SD 1995 A manual for use for MTDFREML. A set of programs to obtain estimates of variance and covariance (Draft). U.S. Department of Agriculture/ Agricultural Research Service.
Borrego D 1982 Ovinos da Serra da Estrela, Importância - evolução - futuro. In: A produção de queijo da Serra. XI Jornadas de Ovinicultura, Oliveira do Hospital, 1 to 3 of April 1982. pp. 11-36.
Botter MT, Civera T, Nucera D, Rosati S, Sacchi P and Turi RM 2003 A multiplex polymerase chain reaction for the identifcation of cows', goats' and sheep's milk in dairy products. International Dairy Journal 13 277-282.
Boutinaud M, Rousseau C, Keisler DH and Jammes H 2003 Growth hormone and milking frequency act differently on goat mammary gland in late lactation. Journal of Dairy Science 86 509-520.
116
Braithwaite GD 1975 The effect of growth hormone on calcium metabolism in the sheep. British Journal of
Nutrition 33 309-314.
Brandsma JH, Janss LLG and Visscher AH 2005 Association between PrP genotypes and performance traits in an experimental Dutch Texel herd. Livestock Production Science 95 89-94.
Brisken C 2002 Hormonal control of alveolar development and its implications for breast carcinogenesis. Journal
of Mammary Gland Biology and Neoplasia 7 39-48.
Brodmann PD and Moor D 2003 Sensitive and semi-quantitative TaqManTM real-time polymerase chain reaction systems for the detection of beef (Bos taurus) and the detection of the family Mammalia in food and feed. Meat Science 65 599-607.
Brozos C, Saratsis Ph, Boscos C, Kyriakis SC and Tsakalof P 1998 Effects of long-term recombinant bovine somatotropin bST administration on milk yield, milk composition and mammary gland health of dairy ewes. Small Ruminant Research 29 113-120.
Brunak S, Engelbrecht J and Knudsen S. 1991 Prediction of human mRNA donor and acceptor sites from the dna sequence. Journal of Molecular Biology 220 49-65.
Bryson JM, Wilde CJ and Addey CVP 1993 Effect of unilateral changes in milking frequency on mammary mRNA concentrations in the lactating goat. Biochemical Society Transactions 21 294S.
Burge C and Karlin S 1997 Prediction of complete gene structures in human genomic DNA. Journal of
Molecular Biology 268 78-94.
Burton JL, McBride BW, Block E, Glimm DR and Kennelly JJ 1994 A review of bovine growth hormone. Canadian Journal of Animal Science 74 167-201.
Byrne CR, Wilson BW and Ward KA 1987 The isolation and characterisation of the ovine growth hormone gene. Australian Journal of Biological Science 40 459-468.
Capuco AV, Ellis SE, Hale SA, Long E, Erdman RA, Zhao X and Paape MJ 2003 Lactation persistency: insights from mammary cell proliferation studies. Journal of Animal Science 81 Suppl 3 18-31.
Capuco AV, Wood DL, Baldwin R, McLeod K and Paape MJ 2001 Mammary cell number, proliferation, and apoptosis during a bovine lactation: relation to milk production and effect of bST. Journal of Dairy Science 84 2177-2187.
Cardellino RA and Benson ME 2002 Lactation curves of commercial ewes rearing lambs. Journal of Animal
Science 80 23-27.
Carlacci L, Chou KC and Maggiora GM 1991 A heuristic approach to predicting the tertiary structure of bovine somatotropin. Biochemistry 30 4389–4398.
Carolino N, Gama L, Dinis R and de Sá T 2003a [Milk records in Serra da Estrela ewes]. Archivos de
Zootecnia. 52 113-116.
Carolino N, Gama L, Dinis R and de Sá T 2003b [Productive characteristics of “Serra da Estrela” ewes] Archivos de Zootecnia 52 3-14.
Carolino N, Gama LT, Dinis R and Sá PT 1997/98 Caracterização do potencial produtivo da ovelha Serra da Estrela com referência às várias zonas de dispersão da raça. Colectânea SPOC 8 113-134.
Carter-Su C, Rui L and Herrington J 2000 Role of the tyrosine kinase JAK2 in signal transduction by growth hormone. Pediatric Nephrology 14 550-557.
Casanueva FF and Dieguez C 1999 Growth hormone secretagogues: physiological role and clinical utility. TEM 10 30-38.
Chappel S and Murphy W 2000 Growth hormone. Cytokines 1 251-265.
� � �%"%�%��%�
117
Chen EY, Liao Y-C, Smith DH, Barrera-Saldana HA, Gelinas RE and Seeburg PH 1989 The human growth hormone locus: nucleotide sequence, biology, and evolution. Genomics 4 479–497.
Chen HC, Wilhelmi AE and Howard SC 1970 Purification and characteristics of porcine growth hormone. Journal of Biological Chemistry 245 3402-3406.
Chen QK, Hertz JZ and Stormo GD 1995 MATRIX SEARCH 1.0: a computer program that scans DNA sequences for transcriptional elements using a database of weight matrices. Computer applications in the
biosciences: CABIOS 11 563-566.
Chilliard Y, Bonnet M, Delavaud C, Faulconnier Y, Leroux C, Djiane J and Bocquier F 2001 Leptin in ruminants. Gene expression in adipose tissue and mammary gland, and regulation of plasma concentration. Domestic Animal Endocrinology 21 271-295.
Chilliard Y, Colleau JJ, Disenhaus C, Lerondelle C, Mouchet C and Paris A 1998b L'hormone de croissance recombinante : intérêt et risques potentiels de son utilisation pour la production laitière bovine. INRA
Productions Animales 11 15-32.
Chilliard Y, Ferlay A, Despres L and Bocquier F 1998c Plasma non esterified fatty acid response to a beta-adrenergic challenge before or after feeding in energy underfed or overfed, dry or lactating cows. Animal
Science 67 213–223.
Chilliard Y, Ferlay A, Faulconnier Y, Bonnet M, Rouel J and Bocquier F 2000 Adipose tissue metabolism and its role in adaptations to undernutrition in ruminants. Proceedings of the Nutrition Society 59 127-134.
Chiofalo V, Baldi A, Savoini G, Polidori F, Dell'Orto V and Politis I 1999 Response of dairy ewes in late lactation to recombinant bovine somatotropin. Small Ruminant Research 34 119-125.
Chrenek P, Kmef J, Sakowski D, Huba J and Chrenek J 1998a Relationships of growth hormone genotypes with meat production traits of slovak pied bulls. Czech Journal of Animal Science 43 541-544.
Chrenek P, Vasicek D, Bauerová M and Bulla J 1998b Simultaneous analysis of bovine growth hormone and prolactin alleles by multiplex PCR and RFLP. Czech Journal of Animal Science 43 53-55.
Chun EY, Belair L, Jolivet G, Djiane J and Jammes H 2005 Transduction pathways of GH in ovine mammary acini involving regulated and functional growth hormone receptors. Growth Factors 23 55-66.
Chuzhanova NA, Krawczak M, Nemytikova LA, Gusev VD and Cooper DN 2000 Promoter shuffling has occurred during the evolution of the vertebrate growth hormone gene. Gene 254 9-18.
Clackson T, Ultsch MH, Wells JA and de Vos AM 1998 Structural and functional analysis of the 1:1 growth hormone:receptor complex reveals the molecular basis for receptor affinity. Journal of Molecular Biology 277 1111-1128.
Clarke I, Rao A, Chilliard Y, Delavaud C and Lincoln GA 2003 Photoperiod effects on gene expression for hypothalamic appetite-regulating peptides and food intake in the ram. American journal of physiology.
Regulatory, integrative and comparative physiology 284 R101-R115.
Clements MD, Bart HL, Jr. and Hurley DL 2004 Isolation and characterization of two distinct growth hormone cDNAs from the tetraploid smallmouth buffalofish (Ictiobus bubalus). General and Comparative
Endocrinology 136 411-418.
Cohen LE, Wondisford FE, Salvatoni A, Meghnie M, Brucker-Davis F and Weintraub BD 1995 A "hot spot" in the pit-1 gene responsible for combined pituitary hormone deficiency: Clinical and molecular correlates. Journal of Clinical Endocrinology and Metabolism 80 679-684.
Cohen LE, Zanger K, Brue T, Wondisford FE and Radovicks S 1999 Defective retinoic acid regulation of the Pit-1 gene enhancer: a novel mechanism of combined pituitary hormone deficiency. Mol.Cell Endocrinol. 13 476-484.
118
Cohick WS, Wang B, Verma P and Boisclair YR 2000 Insulin-like growth factor I (IGF-I) and cyclic adenosine 3',5'-monophosphate regulate IGF-binding protein-3 Gene expression by transcriptional and posttranscriptional mechanisms in mammary epithelial cells. Endocrinology 141 4583-4591.
Collier RJ, Byatt JC, Denham SC, Eppard PJ, Fabellar AC, Hintz RL, McGrath MF, McLaughlin CL, Shearer JK, Veenhuizen JJ and Vicini JL 2001 Effects of sustained release bovine somatotropin (sometribove) on animal health in commercial dairy herds. Journal of Dairy Science 84 1098-1108.
Conde RD, Paladini AC, Santome JA and Dellacha JM 1973 Isolation, purification and characterization of equine growth hormone. European Journal of Biochemistry 32 563-568.
Cooke N and Liebhaber SA 1995 Molecular biology of the growth hormone - prolactin gene system. Vitamines
and Hormones 50 385-459.
Cooney RN 2002 Suppressors of cytokine signaling (SOCS): Inhibitors of the JAK/STAT pathway. Shock 17 83-90.
Coschigano KT, Holland AN, Riders ME, List EO, Flyvbjerg A and Kopchick JJ 2003 Deletion, but not antagonism, of the mouse growth hormone receptor results in severely decreased body weights, insulin, and insulin-like growth factor I levels and increased life span. Endocrinology 144 3799-3810.
Cummings KJ, Gray SL, Simmons CJT, Kozak CA and Sherwood NM 2002 Mouse pituitary adenylate cyclase-activating polypeptide (PACAP): gene, expression and novel splicing. Molecular and Cellular
Endocrinology 192 133-145.
Cunningham BC and Wells JA 1991 Rational design of receptor-specific variants of human growth hormone. Proceedings of the National Academy of Science U.S.A. 88 3407-3411.
Cunningham BC, Ultsch M, de Vos AM, Mulkerrin MG, Clauser KR and Wells JA 1991 Dimerization of the extracellular domain of the human growth hormone receptor by a single hormone molecule. Science 254 821-825.
Dallard BE, Ortega HH, Lorente JA and Romano GS 2005 Immunolocalization and expression of insulin-like growth factor I (IGF-I) in the ovine mammary gland during mammogenesis, lactation and involution. Small
Ruminant Research 58 1-11.
Das P, Meyer L, Seyfert HM, Brockmann G and Schwerin M 1996 Structure of the growth hormone-encoding gene and its promoter in mice. Gene 169 209-213.
Date Y, Kojima K, Hosoda H, Sawaguchi A, Mondal MS, Suganuma T, Matsukura S, Kangawa K and Nakazato M. 2000 Ghrelin, a novel growth-hormone-releasing acylated peptide, is synthesized in a distinct endocrine cell type in the gastrointestinal tract of rats and humans. Endocrinology 141 4255-4261.
Davenport AP, Bonner TI, Foord SM, Harmar AJ, Neubig RR, Pin JP, Spedding M, Kojima M and Kangawa K 2005 International Union of Pharmacology. LVI. Ghrelin receptor nomenclature, distribution, and function. Pharmacological Reviews 57 541-546.
Davis SL 1975 Somatostatin: its influence on plasma levels of growth hormone, prolactin and thyrotropin in sheep. Journal of Animal Science 40 911-916.
de Vos AM, Ultsch M and Kossiakoff AA. 1992 Human growth hormone and extracellular domain of its receptor: crystal structure of the complex. Science 255 306-312.
De Vries F, Hamann H, Drogemuller C, Ganter M and Distl O 2005 Analysis of associations between the prion protein genotypes and production traits in East Friesian milk sheep. Journal of Dairy Science 88 392-398.
� � �%"%�%��%�
119
Delavaud C, Ferlay A, Faulconnier Y, Bocquier F, Kann G and Chilliard Y 2002 Plasma leptin concentration in adult cattle: Effects of breed, adiposity, feeding level, and meal intake. Journal of Animal Science 80 1317-1328.
Delgado FJ and Martin TG 1992 Extension factors for incomplete lactations of Serra-da-Estrela sheep. Journal
of Dairy Science 75 1731-1735.
Di Stasio L, Destefanis G, Brugiapaglia A, Albera A and Rolando A 2005 Polymorphism of the GHR gene in cattle and relationships with meat production and quality. Animal Genetics 36 138-140.
Di Stasio L, Sartore S and Albera A 2002 Lack of association of GH1 and POU1F1 gene variants with meat production traits in Piemontese cattle. Animal Genetics 33 61-64.
Diez-Tascón C, Bayón Y, Arranz JJ, de la Fuente LF and San Primitivo F 2001 Mapping quantitative trait loci for milk production traits on ovine chromosome 6. Journal of Dairy Research 68 389-397.
DiMattia GE, Rhodes SJ, Krones A, Carrière C, O'Connell S, Kalla K, Arias C, Sawchenko P and Rosenfeld MG 1997 The PIT-1 gene is regulated by distinct early and late pituitary-specific enhancers. Developmental Biology 182 180-190.
Disenhaus C, Jammes H, Hervieu J, Ternois F and Sauvant D 1995 Effects of recombinant bovine somatotropin on goat milk yield, composition and plasma metabolites. Small Ruminant Research 15 139-148.
Dorak MT 2006 Basic population genetics. [http://dorakmt.tripod.com/evolution/popgen.html] in 2006/05/08.
Dracy A and Jordan RM 1954 The effect of bovine and porcine somatotropin upon lactating ewes. Journal of
Animal Science 13 1018-1019.
Dyer CJ, Simmons JM, Matteri RL and Keisler DH 1997a cDNA cloning and tissue-specific gene expression of ovine leptin, NPY- Y1 receptor, and NPY-Y2 receptor. Domestic Animal Endocrinology 14 295-303.
Dyer CJ, Simmons JM, Matteri RL and Keisler DH 1997b Effects of an intravenous injection of NPY on leptin and NPY-Y1 receptor mRNA expression in ovine adipose tissue. Domestic Animal Endocrinology 14 325-333.
Dyer CJ, Simmons JM, Matteri RL and Keisler DH 1997c Leptin receptor mRNA is expressed in ewe anterior pituitary and adipose tissues and is differentially expressed in hypothalamic regions of well- fed and feed-restricted ewes. Domestic Animal Endocrinology 14 119-128.
Emanuelli B, Peraldi P, Filloux C, Sawka-Verhelle D, Hilton D and Van Obberghen E 2000 SOCS-3 is an insulin-induced negative regulator of insulin signaling. Journal of Biological Chemistry 275 15985–15991.
Eppard PJ, Bentle LA, Violand BN, Ganguli S, Hintz RL, Kung L, Jr, Krivi GG and Lanza GM 1992 Comparison of the galactopoietic response to pituitary-derived and recombinant-derived variants of bovine growth hormone. Journal of Endocrinology 132 47-56.
Esteves, F. 1997/98 Perspectivas da actividade do Centro de Testagem de Reprodutores Serra da Estrela. Colectânea SPOC 8(1): 143-147.
Etchebehere C, Cabezas A, Dabert P and Muxi L 2003 Evolution of the bacterial community during granules formation in denitrifying reactors followed by molecular, culture-independent techniques. Water Science and
Technology 48 75-79.
Etchebehere C, Cabezas A, Dabert P and Muxi L 2003 Evolution of the bacterial community during granules formation in denitrifying reactors followed by molecular, culture-independent techniques. Water Science and
Technology 48 75-79.
Etherton TD and Bauman DE 1998 Biology of somatotropin in growth and lactation of domestic animals. Physiological Reviews 78 745-761.
Faggioni R, Feingold KR and Grunfeld C 2001 Leptin. Cytokines 1-10.
120
Falaki M, Gengler N, Sneyers M, Prandi A, Massart S, Formigoni A, Burny A, Portetelle D and Renaville R 1996a Relationships of polymorphisms for growth hormone and growth hormone receptor genes with milk production traits for Italian Holstein- Friesian bulls. Journal of Dairy Science 79 1446-1453.
Falaki M, Prandi A, Corradini C, Sneyers M, Gengler N, Massart S, Fazzini U, Burny A, Portetelle D and Renaville R 1997 Relationships of growth hormone gene and milk protein polymorphisms to milk production traits in Simmental cattle. Journal of Dairy Research 64 47-56.
Falaki M, Renaville R, Sneyers M, Prandi A, Massart S, Devolder A, Burny A and Portetelle D 1994 Restriction fragment length polymorphism in cattle. Journal of Animal Science 72 316.
Falaki M, Sneyers M, Prandi A, Massart S, Corradini C, Formigoni A, Burny A, Portetelle D and Renaville R 1996b TaqI growth hormone gene polymorphism and milk production traits in Holstein-Friesian cattle. Animal Science 63 175-181.
FAO 2004 Recursos genéticos animais [http://dad.fao.org].
Fasshauer M, Kralisch S, Klier M, Lossner U, Bluher M, Klein J and Paschke R 2004 Insulin resistance-inducing cytokines differentially regulate SOCSmRNA expression via growth factor- and Jak/Stat-signalingpathways in 3T3-L1 adipocytes. Journal of Endocrinology 181 129-138.
Feldman M, Ruan W, Cunningham BC, Wells JA and Kleinberg DL 1993 Evidence that the growth hormone receptor mediates differentiation and development of the mammary gland. Endocrinology 133 1602-1608.
Fernandez N, Molina MP, Balasch S, Torres A and Adriaens F 2001 Bovine somatotropin dose titration in lactating dairy ewes. 3. Treatment interval. Journal of Dairy Science 84 2170-2176.
Fernandez N, Rodriguez M, Peris C, Barcelo M, Molina MP, Torres A and Adriaens F 1995 Bovine somatotropin dose titration in lactating dairy ewes. 1. Milk yield and milk composition. Journal of Dairy
Science 78 1073-1082.
Fernandez N, Rodriguez M, Peris C, Molina MP and Torres A 1997 Bovine somatotropin dose titration in lactating dairy ewes. 2. Dose determination and factors affecting the response. Journal of Dairy Science 80 818-829.
Flint DJ, Boutinaud M, Tonner E, Wilde CJ, Hurley W, Accorsi PA, Kolb AF, Whitelaw CBA, Beattie J and Allan GJ 2005 Insulin-like growth factor binding proteins initiate cell death and extracellular matrix remodeling in the mammary gland. Domestic Animal Endocrinology 29 274-282.
Flores-Morales A, Greenhalgh CJ, Norstedt G and Rico-Bautista E 2006 Negative regulation of growth hormone receptor signaling. Molecular Endocrinology 20 241-253.
Forsyth IA 1996 The insulin-like growth factor and epidermal growth factor families in mammary cell growth in ruminants: action and interaction with hormones. Journal of Dairy Science 79 1085-1096.
Forsyth IA and Wallis M 2002 Growth hormone and prolactin—molecular and functional evolution. Journal of
Mammary Gland Biology and Neoplasia. 7 291-312.
Frank SJ 2001 Growth hormone signalling and its regulation: Preventing too much of a good thing. Growth
Hormone & IGF Research 11 201-212.
Frank SJ 2002 Receptor dimerization in GH and erythropoietin action-it takes two to tango, but how? Endocrinology 143 2-10.
Frank SJ and Messina JL 2002 Growth hormone receptor. In Cytokine Reference On-Line. Eds JJ Oppenhein and M Feldman. London: Academic Press. Harcourt (Online).
Frayling IM 2002 Methods of molecular analysis: mutation detection in solid tumours. Journal of clinical
Pathology 55 73-79.

� � �%"%�%��%�
121
French MC, Littlejohn RP, Greer GJ, Bain WE, McEwan JC and Tisdall DJ 2006 Growth hormone and ghrelin receptor genes are differentially expressed between genetically lean and fat selection lines of sheep. Journal of Animal Science 84 324-331.
Frimawaty E and Manalu W 1999 Milk yield and lactose synthetase activity in the mammary glands of superovulated ewes. Small Ruminant Research 33 271-278.
Frohman LA, Downs TR, Clarke IJ and Thomas GB 1990 Measurement of growth hormone-releasing hormone and somatostatin in hypothalamic-portal plasma of unanesthetized sheep. Spontaneous secretion and response to insulin-induced hypoglycemia. The Journal of Clinical Investigation 86 17-24.
Gaddy-Kurten D and Vale WW 1995 Activin increases phosphorylation and decreases stability of the transcription factor Pit-1 in MtTW15 somatotrope cells. Journal of Biological Chemestry 270 28733–28739.
Gallego MI, Binart N, Robinson GW, Okagaki R, Coschigano KT, Perry J, Kopchick JJ, Oka T, Kelly PA and Hennighausen L 2001 Prolactin, growth hormone, and epidermal growth factor activate Stat5 in different compartments of mammary tissue and exert different and overlapping developmental effects. Developmental biology 229 163-175.
Gallo L, Bailoni L, Schiavon S, Carnier P, Ramanzin M, Andrighetto I and Bittante G 1997 Effect of slow-release somatotropin on the pattern of milk yield between and within injection intervals. Journal of Dairy
Science 80 46-51.
Galsgaard ED, Gouilleux F, Groner B, Serup P, Nielsen JH and Billestrup N 1996 Identification of a growth hormone-responsive STAT5-binding element in the rat insulin 1 gene. Molecular Endocrinology 10 652-660.
Ganguly A 2002 An Update on Conformation Sensitive Gel Electrophoresis. Human Mutation 19 334-342.
Garcia MR, Amstalden M, Keisler DH, Raver N, Gertler A and Williams GL 2004 Leptin attenuates the acute effects of centrally administered neuropeptide Y on somatotropin but not gonadotropin secretion in ovariectomized cows. Domestic Animal Endocrinology 26 189-200.
Garnier-Gere, P and Dillmann, C 1992 A computer program for testing pairwise linkage disequilibria in subdivided populations. Journal of Heredity 83 239.
Gaynor PJ, Chapin LT, Lookingland KJ and Tucker HA 1993 Alpha 2-adrenergic receptor-mediated regulation of growth hormone secretion in meal-fed Holstein steers. Proceeding of the Society for
Experimental Biology and Medicine 204 318-322.
Ge W, Davis ME, Hines HC, Irvin KM and Simmen RCM 2003 Association of single nucleotide polymorphisms in the growth hormone and growth hormone receptor genes with blood serum insulin-like growth factor I concentration and growth traits in Angus cattle Journal of Animal Science 81 641-648.
Georgoudis A. 1998 Considerations for the mixed production system in the Mediterranean area. Options Méditerranéennes 35 123-131.
Giustina A and Veldhuis JD 1998 Pathophysiology of the neuroregulation of growth hormone secretion in experimental animals and the human. Endocrine Reviews 19 717-797.
Godfredson JA, Wheaton JE, Crooker BA, Wong EA, Campbell RM and Mowles TF 1990 Growth performance and carcass composition of lambs infused for 28 days with a growth hormone-releasing factor analogue. Journal of Animal Science 68 3624-3632.
Gonzalez-Parra S, Chowen JA, Segura LMG and Argente J 1996 Ontogeny of pituitary transcription factor-1 (Pit-1), growth hormone (GH) and prolactin (PRL) mRNA levels in male and female rats and the differential expression of Pit-1 in lactotrophs and somatothrophs. Journal of Neuroendocrinology 8 211-225.
Gootwine E, Ofir R 1996 Polymorphism at the growth hormone locus and milk production in Awassi dairy sheep. Proceedings of the 25th meeting of the International Society for Animal Genetic, Tours, France, Abst. E074.
122
Gootwine E, Ofir R and Yossefi S 1996 Characterization of PvuII polymorphisms between the ovine growth hormone GH2-N and GH2-Z gene copies. Animal Biotechnology 7 135-143.
Gootwine E, Sise JA, Penty JM and Montgomery GW 1993 The duplicated gene copy of the ovine growth hormone gene contains a PvuII polymorphism in the second intron. Animal Genetics 24 319-321.
Gootwine E, Suttie JM, McEwan JC, Veenvliet BA, Littlejohn RP, Fennessy PF and Montgomery GW 1998 The physiological effects of natural variation in growth hormone gene copy number in ram lambs. Domestic
Animal Endocrinology 14 381-390.
Greenhalgh CJ and Alexander WS 2004 Suppressors of cytokine signalling and regulation of growth hormone action. Growth Hormone & IGF Research 14 200-206.
Greenhalgh CJ, Rico-Bautista E, Lorentzon M, Thaus AL, Morgan PO, Willson TA, Zervoudakis P, Metcalf D, Street I, Nicola NA, Nash AD, Fabri LJ, Norstedt G, Ohlsson C, Flores-Morales A, Alexander WS and Hilton DJ 2005 SOCS2 negatively regulates growth hormone action in vitro and in vivo. The Journal of Clinical Investigation 115 397-406.
Grochowska R, Zwierzchowski L, Snochowski M and Reklewski Z 1999 Stimulated growth hormone (GH) release in Friesian cattle with respect to GH genotypes. Reproduction Nutrition and Development 39 171-180.
Gulbenkian, M. 1993 The potentials for improvement of traditional sheep cheese production systems in Portugal. Thesis submitted in fulfilment of the requirements for the degree of Doctor in Philosophy, Veterinary Epidemiology and Economics research Unit, Department of Agriculture and Horticulture, University of Reading, England.
Guron C, Rao KB, Jain SK, Totey SM and Talwar GP 1992 Cloning and nucleotide sequencing of sheep growth hormone cDNA. Indian J.Exp.Biol. 30 659-663.
Hampson RK and Rottman FM 1987 Alternative processing of bovine growth hormone mRNA: nonsplicing of the final intron predicts a high molecular weight variant of bovine growth hormone. Proceedings of the
National Academy of Science U.S.A. 84 2673-2677.
Hansen LH, Wang X, Kopchick JJ, Bouchelouche P, Nielsen JH, Galsgaard ED and Billestrup N 1996 Identification of tyrosine residues in the intracellular domain of the growth hormone receptor required for transcriptional signaling and Stat5 activation. Journal of Biological Chemistry 271 12669-12673.
Haro LS, Singh RN, Lewis UJ, Martinez AO, Galosy SS, Staten NR and Krivi GG 1996 Human growth hormone deletion mutant (hGH44-191) binds with high affinity to lactogenic receptors but not to somatogenic receptors. Biochemical and Biophysical Research Communications 222 421-426.
Hayashida T, Murakami K, Mogi K, Nishihara M, Nakazato M, Mondal MS, Horii Y, Kojima M, Kangawa K and Murakami N 2001 Ghrelin in domestic animals: distribution in stomach and its possible role. Domestic Animal Endocrinology 21 17-24.
Hebsgaard SM, Korning PG, Tolstrup N, Engelbrecht J, Rouze P and Brunak S 1996 Splice site prediction in Arabidopsis thaliana DNA by combining local and global sequence information. Nucleic Acids Research 24 3439-3452.
Hediger R, Johnson SE, Barendse W, Drinkwater RD, Moore SS and Hetzel J 1990 Assignment of the growth hormone gene locus to 19q26-qter in cattle and to 11q25-qter in sheep by in situ hybridization. Genomics 8 171-174.
Hennighausen L and Robinson GW 2001 Signaling pathways in mammary gland development (review). Developmental Cell 1 1-20.
Hennighausen L and Robinson GW 2005 Information networks in the mammary gland. Nature Reviews -
Molecular Cell Biology 6 715-725.
� � �%"%�%��%�
123
Herman A, Bignon C, Daniel N, Grosclaude J, Gertler A and Djiane J 2000 Functional heterodimerization of prolactin and growth hormone receptors by ovine placental lactogen. Journal of Biological Chemistry 275 6295-6301.
Hines HC, Ge W, Zhao Q and Davis ME 1998 Association of genetic markers in growth hormone and insulin-like growth factor-I loci with lactation traits in Holsteins (Abstract). Animal Genetics 29 63.
Hoj S, Fredholm M, Larsen NJ and Nielsen VH 1993 Growth hormone gene polymorphism associated with selection for milk fat production in lines of cattle. AnimalGenetics 24 91-95.
Horvath S, Xu X, Lake S, Silverman E, Weiss S, and Laird N 2004 Tests for associating haplotypes with general phenotype data: application to asthma genetics. Genetic Epidemiology 26 61-69.
Houseknecht KL and Bauman DE 1997 Regulation of lipolysis by somatotropin: functional alteration of adrenergic and adenosine signaling in bovine adipose tissue. Journal of Endocrinology 152 465–475.
Iavnilovitch E, Groner B and Barash I 2002 Overexpression and forced activation of STAT5 in mammary gland of transgenic mice promotes cellular proliferation, enhances differentiation, and delays postlactational apoptosis. Molecular Cancer Research 1 32-47.
Ilkbahar YN, Thordarson G, Camarillo IG and Talamantes F 1999 Differential expression of the growth hormone receptor and growth hormone-binding protein in epithelia and stroma of the mouse mammary gland at various physiological stages. Journal of Endocrinology 161 77-87.
Ilkbahar YN, Wu K, Thordarson G and Talamantes F 1995 Expression and distribution of messenger ribonucleic acids for growth hormone (GH) receptor and gh-binding protein in mice during pregnancy. Endocrinology 136 386-392.
Ingraham HA, Ruoping C, Mangalam HJ, Elsholtz HP, Flynn SE, Lin CR, Simmons DM, Swanson L and Rosenfeld MG 1988 A tissue-specific transcription factor containing a homeodomain specifies a pituitary phenotype. Cell 55 519-529.
Ingvartsen KL and Andersen JB 2000 Integration of metabolism and intake regulation: a review focusing on periparturient animals. Journal of Dairy Science 83 1573-1597.
Ingvartsen KL and Boisclair YR 2001 Leptin and the regulation of food intake, energy homeostasis and immunity with special focus on periparturient ruminants. Domestic Animal Endocrinology 21 215-250.
International Committee for Animal Recording (ICAR) 2001 International agreement of recording practices, Version 23 May 2001 (E:\ICAR\GUDELINES and SPECIAL STAMP\NEW GUIDELINES\02 SECTION 01-10 (AFTER PARIS 17-05-01).DOC AUTHOR OF LAST SAVE: CESARE MOSCONI), Vila Nomentana 134, Rome, Italy.
Inuzuka H, Yamanouchi K, Tachi C and Tojo H 1999 Expression of milk protein genes is induced directly by exogenous STAT5 without prolactin-mediated signal transduction in transgenic mice. Molecular
Reproduction and Development 54 121-125.
Jammes H, Gaye P, Belair L and Djiane J 1991 Identification and characterization of growth hormone receptor mRNA in the mammary gland. Molecular and Cellular Endocrinology 75 27-35.
Johnson PL, McEwan JC, Dodds KG, Purchas RW and Blair HT 2005 A directed search in the region of GDF8 for quantitative trait loci affecting carcass traits in Texel sheep. Journal of Animal Science 83 1988-2000.
Jones BK, Monks BR, Liebhaber SA and Cooke NE 1995 The human growth hormone gene is regulated by a multicomponent locus control region. Molecular and Cellular Biology 15 7010-7021.
Jordan RM and Shaffhausen DD 1954 Effect of somatotropin on milk yield of ewes. Journal of Animal Science 13 706-710.
124
Jura J, Jura J, Murzyn K, Wegrzyn P and Zarebski A 2005 Cloning and characterization of 5' upstream promoter region of rat WAP gene. Biochimica et Biophysica Acta 1727 58-64.
Kaminski S and Wachek M 2002 Single-strand conformation polymorphism within the porcine growth hormone gene promoter. Animal Science Papers and Reports 20 47-53.
Kaminski S, Ahman A, Rusé A, Wójcik E and Malewski T 2005 MilkProtChip - a microarray of SNPs in candidate genes associated with milk protein biosynthesis - development and validation. Journal of Applied
Genetics 46 45-58.
Kann G 1997 Evidence for a mammogenic role of growth hormone in ewes: effects of growth hormone-releasing factor during artificial induction of lactation. Journal of Animal Science 75 2541-2549.
Kann G, Delobelle-Deroide A, Belair L, Gertler A and Djiane J 1999 Demonstration of in vivo mammogenic and lactogenic effects of recombinant ovine placental lactogen and mammogenic effect of recombinant ovine GH in ewes during artificial induction of lactation. Journal of Endocrinology 160 365-377.
Kazmer GW, Zinn SA and Strausbaught LD 2000 Short communication: Growth hormone response to somatostatin-28 and growth hormone-releasing factor in dairy heifers. Journal of Dairy Science 83 2282-2284.
Keeler C, Dannies PS and Hodsdon ME 2003 The tertiary structure and backbone dynamics of human prolactin. Journal of Molecular Biology 328 1105-1121.
Kelly PA, Bachelot A, Kedzia C, Hennighausen L, Ormandy CJ, Kopchick JJ and Binart N 2002 The role of prolactin and growth hormone in mammary gland development. Molecular and Cellular Endocrinology 197 127-131.
Khatami SR, Layebnyi OE, Maksimenko VF and Sulimova GE 2005 [Association of DNA polymorphisms of the growth hormone and prolactin genes with milk productivity in Yaroslavl and black-and-white cattle]. Genetika 41 229-36 (Abstract).
Kim SW, Ahn IM and Larsen PR 1996 In vivo genomic footprinting of thyroid hormone-responsive genes in pituitary tumor cell lines. Molecular and Cellular Biology 16 4465-4477.
Kioka N, Manabe E, Abe M, Hashi H, Yato M, Okuno M, Yamano Y, Sakai H, Komano T, Utsumi K and Iritani A 1989 Cloning and sequencing of goat growth hormone gene. Agric.Biol.Chem. 53 1583-1587.
Komatsu T, Itoh F, Kushibiki S and Hodate K 2005 Changes in gene expression of glucose transporters in lactating and nonlactating cows. Journal of Animal Science 83 557-564.
Kossiakoff AA, Somers W, Ultsch M, Andow J, Muller YA and de Vos AM 1994 Comparison of the intermediate complexes of human growth hormone bound to the human growth hormone and prolactin receptors. Protein Science 3 1697-1705.
Kouadio JLK, Horn JR, Pal G and Kossiakoff AA 2005 Shotgun alanine scanning shows that growth hormone can bind productively to its receptor through a drastically minimized interface. Journal of Biological
Chemistry 280 25524-25532.
Kringen P, Egedal S, Pedersen JC, Harbitz TB, Tveit KM, Berg K, Borresen-Dale AL and Andersen TI 2002 BRCA1 mutation screening using restriction endonuclase fingerprinting-single-strand conformation polymorphism in an automated capillary electrophoresis system. Electrophoresis 23 4085-4091.
Kwok P-Y and Chen X 2003 Detection of Single Nucleotide Polymorphisms. Current Issues in Molecular
Biology 5 43-60.
Lacroix MC, Devinoy E, Cassy S, Servely JL, Vidaud M and Kann,G. 1999 Expression of growth hormone and its receptor in the placental and feto-maternal environment during early pregnancy in sheep. Endocrinology 140 5587-5597.

� � �%"%�%��%�
125
Lacroix MC, Devinoy E, Servely JL, Puissant C and Kann G 1996 Expression of the growth hormone gene in ovine placenta: detection and cellular localization of the protein. Endocrinology 137 4886-4892.
Lagziel A and Soller M 1999 DNA sequence of SSCP haplotypes at the bovine growth hormone (bGH) gene. Animal Genetics 30 362-365.
Lagziel A, DeNise S, Hanotte O, Dhara S, Glazko V, Broadhead A, Davoli R, Russo V and Soller M 2000 Geographic and breed distribution of an MspI PCR-RFLP in the bovine growth hormone (bGH) gene. Animal Genetics 31 210-213.
Lagziel A, Lipkin E and Soller M 1996 Association between SSCP haplotypes at the bovine growth hormone gene and milk protein percentage. Genetics 142 945-951 (Corrigendum 1997 Genetics 146 442).
Lagziel A, Lipkin E, Ezra E, Soller M and Weller JI 1999 An MspI polymorphism at the bovine growth hormone (bGH) gene is linked to a locus affecting milk protein percentage. Animal Genetics 30 296-299.
Lanna DPD, Houseknecht KL, Harris DY and Bauman DE 1995 Effect of somatotropin treatment on lipogenesis, lipolysis, and related cellular mechanisms in adipose tissue of lactating cows. Journal of Dairy
Science 78 1703-1712.
Lantinga-van Leeuwen IS, Oudshoorn M and Mol JA 1999 Canine mammary growth hormone gene transcription initiates at the pituitary-specific start site in the absence of Pit-1. Molecular and Cellular
Endocrinology 150 121-128.
Larsen LA, Christiansen M, Vuust J and Andersen PS 1999 High-Throughput Single-Strand Conformation Polymorphism Analysis by Automated Capillary Electrophoresis: Robust Multiplex Analysis and Pattern-Based Identification of Allelic Variants. Human Mutation 13 318-327.
Laud K, Gourdou I, Belair L, Keisler DH and Djiane J 1999 Detection and regulation of leptin receptor mRNA in ovine mammary epithelial cells during pregnancy and lactation. FEBS Letters 463 194-198.
Law GJ, Ray KP and Wallis M 1984 Effects of growth hormone-releasing factor, somatostatin and dopamine on growth hormone and prolactin secretion from cultured ovine pituitary cells. FEBS Letters 166 189-193.
Le Houerou HN 2004 An agro-bioclimatic classification of arid and semiarid lands in the isoclimatic mediterranean zones. Arid Land Research and Management 18 301-346.
Lechniak D, Machnik G, Szydlowski M and Switonski M 1999 Growth hormone gene polymorphism and reproductive performance of AI bulls. Theriogenology 52 1145-1152.
Lee BK, Crooker BA, Hansen LB and Chester-Jones H 1994a Polymorphism in the third intron of somatotropin (bST) gene and its association with selection for milk yield in Holstein cows. Journal of Animal
Science 72 316 (Abstract).
Lee BK, Foster DN and Crooker BA 1994b Detection of mutations in the bovine somatotropin (bST) gene by single strand conformation polymorphism (SSCP) analyses. Journal of Animal Science 72 316.
Lee BK, Lin GF, Crooker BA, Murtaugh MP, Hansen LB and Chester-Jones H 1996 Association of somatotropin (BST) gene polymorphism at the 5th exon with selection for milk yield in Holstein cows. Domestic Animal Endocrinology 13 373-381.
Leibovich H, Gertler A, Bazer F and Gootwine E 2001 Effects of recombinant ovine placental lactogen and recombinant ovine growth hormone on growth of lambs and milk production of ewes. Livestock Production
Science 68 79-86.
Lemaigre FP, Lafontaine DA, Courtois SJ, Durviaux SM and Rousseau GG 1990 Sp1 Can Displace GHF-1 from Its Distal Binding Site and Stimulate Transcription from the Growth Hormone Gene Promoter. Molecular and Cellular Biology 10 1811-1814.

126
Li S and Rosen JM 1995 Nuclear factor I and mammary gland factor (STAT5) play a critical role in regulating rat whey acidic protein gene expression in transgenic mice. Mol Cell Biol 15 2063-2070.
Li S, Crenshaw EB, Rawson EJ, Simmons DM, Swanson LW and Rosenfeld MG 1990 Dwarf locus mutants lacking three pituitary cell types result from mutations in the POU-domain gene pit-1. Nature 347 528-533.
Liang R, Limesand SW and Anthony RV 1999 Structure and transcriptional regulation of the ovine placental lactogen gene. European Journal of Biochemistry 265 883-895.
Lin SC, Li S, Drolet DW and Rosenfeld MG 1994 Pituitary ontogeny of the Snell dwarf mouse reveals Pit-1-independent and Pit-1-dependent origins of the thyrotrope. Development 120 515-522.
Lioupis A, Wallis OC and Wallis M 1997 Cloning and characterisation of the gene encoding red deer (Cervus
elaphus) growth hormone: implications for the molecular evolution of growth hormone in artiodactyls. Journal of Molecular Endocrinology 19 259-266.
Liu X, Robinson GW, Gouilleux F, Groner B and Hennighausen L 1995 Cloning and expression of Stat5 and an additional homologue (Stat5b) involved in prolactin signal transduction in mouse mammary tissue. Proceedings of the National Academy of Science U.S.A. 92 8831-8835.
Lomsadze A, Ter-Hovhannisyan V, Chernoff Y and Borodovsky M. 2005 Gene identification in novel eukaryotic genomes by self-training algorithm. Nucleic Acids Research 33 6494-6506.
Lucy MC, Hauser SD, Eppard PJ, Krivi GG and Collier RJ 1991 Genetic polymorphism within the bovine somatotropin (bST) gene detected by polymerase chain reaction and endonuclease digestion. Journal of
Dairy Science 74 284.
Lucy MC, Hauser SD, Eppard PJ, Krivi GG, Clark JH, Bauman DE and Collier RJ 1993 Variants of somatotropin in cattle: gene frequencies in major dairy breeds and associated milk production. Domestic
Animal Endocrinology 10 325-333.
Maithal K, Krishnamurty HG and Muralidhar K 2001 Physico-chemical characterization of growth hormone from water buffaloes (Bubalus bubalis). Indian J.Biochem.Biophys. 38 375-383.
Maj A, Oprzadek J, Dymnicki E and Zwierzchowski L 2006 Association of the polymorphism in the 5'-noncoding region of the bovine growth hormone receptor gene with meat production traits in Polish Black-and-White cattle. Meat Science 72 539-544.
Malveiro E, Pereira M, Marques PX, Santos IC, Belo C, Renaville R and Cravador A 2001 Polymorphisms at the five exons of the growth hormone gene in the algarvia goat: possible association with milk traits. Small
Ruminant Research 41 163-170.
Manalu W, Sudjatmogo MYS and Satyaningtijas AS 1999 Mammary gland differential growth during pregnancy in superovulated Javanese thin-tail ewes. Small Ruminant Research 33 279-284.
Marie M, Findlay PA, Thomas L and Adam CL 2001 Daily patterns of plasma leptin in sheep: effects of photoperiod and food intake. Journal of Endocrinology 170 277-286.
Marques PX, Pereira M, Marques MR, Santos IC, Belo CC, Renaville R and Cravador A 2003 Association of milk traits with SSCP polymorphisms at the growth hormone gene in the Serrana goat. Small Ruminant
Research 50 177-185.
Martinat N, Anouassi A, Huet JC, Pernollet JC, Segard V and Combarnous Y 1990 Purification and partial characterization of growth hormone from the dromedary (Camelus dromedarius). Domestic Animal
Endocrinology 7 527-535.
Matsumoto A, Seki Y, Kubo M, Ohtsuka S, Suzuki A, Hayashi I, Tsuji K, Nakahata T, Okabe M, Yamada S and Yoshimura A 1999 Suppression of STAT5 functions in liver, mammary glands, and T cells in
� � �%"%�%��%�
127
cytokine-inducible SH2-containing protein 1 transgenic mice. Molecular and Cellular Biology 19 6396-6407.
Matsunaga N, Arakawa NT, Goka T, Nam KT, Ohneda A, Sasaki Y and Katoh K 1999 Effects of ruminal infusion of volatile fatty acids on plasma concentration of growth hormone and insulin in sheep. Domestic
Animal Endocrinology 17 17-27.
Matys V, Fricke E, Geffers R, Gößling E, Haubrock M, Hehl R, Hornischer K, Karas D, Kel AE, Kel-Margoulis OV, Kloos D-U, Land S, Lewicki-Potapov B, Michael H, Münch R, Reuter I, Rotert S, Saxel H, Scheer M, Thiele S and Wingender E 2003 TRANSFAC®: transcriptional regulation, from patterns to profiles. Nucleic Acids Research 31 374-378.
Mayo KE, Miller LJ, Bataille D, Dalle S, Göke B, Thorens B and Drucker DJ 2003 International Union of Pharmacology. XXXV. The glucagon receptor family. Pharmacological Reviews 55 167-194.
McDowell GH, Hart IC and Kirby AC 1987 Local intra-arterial infusion of growth hormone into the mammary glands of sheep and goats: effects on milk yield and composition, plasma hormones and metabolites. Australian Journal of Biological Science 40 181-189.
McMahon CD, Chapin LT, Lookingland KJ and Tucker HA 1998 Stimulation of dopamine D1 receptors increases activity of periventricular somatostatin neurons and suppress concentrations of growth hormone. Domestic Animal Endocrinology 15 257-265.
McMahon CD, Chapin LT, Lookingland KJ, Radcliff RP and Tucker HA 2000 Feeding reduces activity of growth hormone-releasing hormone and somatostatin neurons. Proceeding of the Society for Experimental
Biology and Medicine 223 210-217.
McMahon CD, Radcliff RP, Lookingland KJ and Tucker HA 2001 Neuroregulation of growth hormone secretion in domestic animals. Domestic Animal Endocrinology 20 65-87.
McRae AF, Bishop SC, Walling GA, Wilson AD and Visscher PM 2005 Mapping of multiple quantitative trait loci for growth and carcass traits in a complex commercial sheep pedigree. Animal Science 80 135-141.
Meng QY, Chen ZQ, Yu ZQ, Xie QF and Li N 2004 Increased body weight via injecting myogenic expression growth hormone-releasing hormone (GHRH) plasmid DNA into sheep. Animal Biotechnology 15 175-192.
Mepham TB 2000 The role of food ethics in food policy. Proceedings of the Nutrition Society 59 609–618.
Miller PS, Reis BL, Calvert CC, DePeters EJ and Baldwin RL 1991 Patterns of nutrient uptake by the mammary glands of lactating dairy cows. Journal of Dairy Science 74 3791-3799.
Miller WL and Eberhardt NL 1983 Structure and evolution of the growth hormone gene family. Endocrine
Reviews 4 97-130.
Miller WL, Martial JA and Baxter JD 1980 Molecular cloning of DNA complementary to bovine growth hormone mRNA. Journal of Biological Chemistry 255 7521-7524.
Min SH, MacKenzie DD, McCutcheon SN, Breier BH and Gluckman PD 1997 Comparative effects of recombinant ovine placental lactogen and bovine growth hormone on galactopoiesis in ewes. Journal of
Dairy Science 80 640-645.
Møller LN, Stidsen CE, Hartmann B and Holst JJ 2003 Somatostatin receptors (review). Biochimica et
Biophysica Acta 1616 1-84.
Montero M, Yon L, Kikuyama S, Dufour S and Vaudry H 2000 Molecular evolution of the growth hormone-releasing hormone/pituitary adenylate cyclase-activating polypeptide gene family. Functional implication in the regulation of growth hormone secretion. Journal of Molecular Endocrinology 25 157-168.
128
Mooney RA, Senn J, Cameron S, Inamdar N, Boivin LM, Shang Y and Furlanetto RW 2001 Suppressors of cytokine signaling-1 and -6 associate with and inhibit the insulin receptor. A potential mechanism for cytokine-mediated insulin resistance. Journal of Biological Chemistry 276 25889–25893.
Moore DD, Marks AR, Buckley DI, Kapler G, Payvar F and Goodman HM 1985 The first intron of the human growth hormone gene contains a binding site for glucocorticoid receptor. Proceedings of the National
Academy of Science U.S.A. 82 699-702.
Moretti C, Mencacci C, Frajese GV, Cerilli M and Frajese G 2002 Growth hormone-releasing hormone and pituitary adenylate cyclase-activating polypeptide in the reproductive system. Trends in Endocrinology and
Metabolism 13 428-435
Morrison CD, Daniel JA, Hampton JH, Buff PR, McShane TM, Thomas MG and Keisler DH 2003 Luteinizing hormone and growth hormone secretion in ewes infused intracerebroventricularly with neuropeptide Y. Domestic Animal Endocrinology 24 69–80.
Moutoussamy S, Renaudie F, Lago F, Kelly PA and Finidori J 1998 Grb10 identified as a potential regulator of growth hormone (GH) signaling by cloning of GH receptor target proteins. Journal of Biological
Chemistry. 273 15906-15912.
Mukhopadhyay SS, Wyszomierski SL, Gronostajski RM and Rosen JM 2001 Differential interactions of specific nuclear factor I isoforms with the glucocorticoid receptor and STAT5 in the cooperative regulation of WAP gene transcription. Molecular and Cellular Biology 21 6859-6869.
Müller EE, Locatelli V and Cocchi D 1999 Neuroendocrine control of growth hormone secretion. Physiological
Reviews 79 511-607.
Nagatani S, Zeng Y, Keisler DH, Foster DL and Jaffe CA 2000 Leptin regulates pulsatile luteinizing hormone and growth hormone secretion in the sheep. Endocrinology 141 3965-3975.
Neville MC, McFadden TB and Forsyth I 2002 Hormonal regulation of mammary differentiation and milk secretion. Journal of Mammary Gland Biology and Neoplasia 7 49-66.
Newby D, Gertler A and Vernon RG 2001 Effects of recombinant ovine leptin on in vitro lipolysis and lipogenesis in subcutaneous adipose tissue from lactating and nonlactating sheep. Journal of Animal Science 79 445-452.
Nielsen MO, Madsen TG and Hedeboe AM 2001 Regulation of mammary glucose uptake in goats: role of mammary gland supply, insulin, IGF-1 and synthetic capacity. Journal of Dairy Research 68 337-349.
Ofir R and Gootwine E 1997 Ovine growth hormone gene duplication - structural and evolutionary implications. Mammal Genome 8 770-772.
Ohta T 1993 Pattern of nucleotide substitutions in growth hormone-prolactin gene family: a paradigm for evolution by gene duplication. Genetics 134 1271-1276.
Orian JM, O'Mahoney JV and Brandon MR 1988 Cloning and sequencing of the ovine growth hormone gene. Nucleic Acids Research 16 9046.
Orita M, Suzuki Y, Sekiya T and Hayashi K 1989b Rapid and sensitive detection of point mutations and DNA polymorphisms using the polymerase chain reaction. Genomics 5 874-879.
Palomino T, Barettino D and Aranda A 1998 Role of GHF-1 in the regulation of the rat growth hormone gene promoter by thyroid hormone and retinoic acid receptors. Journal of Biological Chemistry 273 27541-27547.
Park KY and Roe JH 1996a Identification of a negative regulatory site in the upstream region of bovine growth hormone gene. Biochemical and Biophysical Research Communications 219 354-358.
Park KY and Roe JH 1996b Negative regulation of bovine growth hormone gene by YY1 binding to NRE's. Biochemical and Biophysical Research Communications 228 745-751.
� � �%"%�%��%�
129
Parmentier I, Portetelle D, Gengler N, Prandi A, Bertozzi C, Vleurick L, Gilson R and Renaville R 1999 Candidate gene markers associated with somatotropic axis and milk selection. Domestic Animal
Endocrinology 17 139-148.
Parsons YM, Cooper DW, Piper LR and Adams TE 1992 RFLPs at the ovine locus for growth hormone. Animal Genetics 23 571.
Peel C, Frank TJ and Bauman DE 1982 Lactational response to exogenous growth hormone and abomasal infusion of a glucose sodium caseinate mixture in high yielding dairy cows. Journal of Animal Science 112 1770-1778.
Pesole G, Liuni S, Grillo R, Licciulli F, Lariza A, Makaliwski W and Saccone C 2000 UTRdb and UTRsite: specialized databases of sequences and functional elements of 5' and 3' untranslated regions of eukatyotic mRNAs. Nucleic Acids Research 28 193-196.
Pfäffle R, Kim C, Otten B, Wit J-M, Eiholzer U, Heimann G and Parks J 1996 Pit-1: clinical aspects. Hormone Research 45 25-28.
Pfäffle R, Parks J, Brown M and Heimann G 1993 Pit-1 and pituitary function. Journal of Pediatric
Endocrinology 6 229-233.
Pfäffle RW, DiMattia GE, Parks JS, Brown MR, Wit JM, Jansen M, Vand der Nat H, van der Brande JL, Rosenfeld MG and Ingraham HA 1992 Mutation of the POU-specific domain of Pit-1 and hypopituitarism without pituitary hypoplasia. Science 257 1118-1121.
Plaut K, Ikeda M and Vonderhaar BK 1993 Role of growth hormone and insulin-like growth factor-I in mammary development. Endocrinology 133 1843-1848.
Politis I, Block E and Turner JD 1990 Effect of somatotropin on the plasminogen and plasmin system in the mammary gland: proposed mechanism of action for somatotropin on the mammary gland. Journal of Dairy
Science 73 1494-1499.
Pollott GE 2000 A Biological Approach to Lactation Curve Analysis for Milk Yield. Journal of Dairy Science 83 2448-2458.
Pollott GE 2002 Using biological model of lactation to reassess dairy recording and genetic evaluation. Proceeding of the 7th World Congress on Genetics Applied to Livestock Production. Montpellier, France. Communication 01-39.
Pollott GE and Gootwine E 2001 A genetic analysis of complete lactation milk production in Improved Awassi sheep. Livestock Production Science 71 37-47.
Pollott GE and Gootwine E 2004 Reproductive Performance and milk production of assaf sheep in an intensive management system. Journal of Dairy Science 87 3690-3703.
Purup S, Sejrsen K, Foldager J and Akers RM 1993 Effect of exogenous bovine growth hormone and ovariectomy on prepubertal mammary growth, serum hormones and acute in-vitro proliferative response of mammary explants from Holstein heifers. Journal of Endocrinology 139 19-26.
Radcliff RP, Lookingland KJ, Chapin LT and Tucker HA 2001 Pituitary adenylate cyclase-activating polypeptide induces secretion of growth hormone in cattle. Domestic Animal Endocrinology 21 187-196.
Ram PA and Waxman DJ 1997 Interaction of growth hormone-activated STATs with SH2-containing phosphotyrosine phosphatase SHP-1 and nuclear JAK2 tyrosine kinase. Journal of Biological Chemistry. 272 17694-17702.
Ram PA and Waxman DJ 1999 SOCS/CIS protein inhibition of growth hormone-stimulated STAT5 signaling by multiple mechanisms. Journal of Biological Chemistry. 274 35553-35561.
130
Ramos AM, Matos C, Bettencourt C, Pinheiro C and Rangel-Figueiredo T 2002 Influence of as1-casein, b-lactoglobulin and prolactin genotypes on milk production traits in two Portuguese sheep breeds. In: Proceedings of the 7th World Congress on Genetics Applied to Livestock Production, Montpellier, France.
Comunication 9-33.
Ramsay TG 2001 Porcine leptin alters insulin inhibition of lipolysis in porcine adipocytes in vitro. Journal of
Animal Science 79 653-657.
Raymond, M and Rousset, F 1995a An exact test for population differentiation. Evolution 49 1280-1283.
Raymond, M, and Rousset, F 1995b GENEPOP (version 1.2): population genetics software for exact tests and ecumenicism. Journal of Heredity 86 248-249.
Reist M, Erdin D, von Euw D, Tschuemperlin K, Leuenberger H, Delavaud C, Chilliard Y, Hammon HM, Kuenzi N and Blum JW 2003 Concentrate feeding strategy in lactating dairy cows: metabolic and endocrine changes with emphasis on leptin. Journal of Dairy Science 86 1690-1706.
Renaville R and Portetelle D 1998 Pit-1 gene polymorphism and trait selection in animals. European Patent Application (EP 0 821 070 A1).
Renaville R, Gengler N, Vrech E, Prandi A, Massart S, Corradini C, Bertozzi C, Mortiaux F, Burny A and Portetelle D 1997 Pit-1 gene polymorphism, milk yield, and conformation traits for Italian Holstein-Friesian bulls. Journal of Dairy Science 80 3431-3438.
Renaville R, Sneyers M, Falaki M, Prandi A, Massart S, Devolder A, Boonen F, Marchand E, Burny A and Portetelle D 1994 TaqI restriction fragment length polymorphism for bovinr growth hormone in breed selected for milk and/or meat. Journal of Animal Science 72 316 (Abstract).
Rendo F, Iriondo M, Jugo BM, Mazón LI, Aguirre A, Vicario A and Estonba A 2004 Tracking diversity and differentiation in six sheep breeds from the North Iberian Peninsula through DNA variation. Small Ruminant
Research 52 195-202.
Reynolds CK, Harmon DL and Cecava MJ 1994 Absorption and delivery of nutrients for milk protein synthesis by portal-drained viscera. Journal of Dairy Science 77 2787-2808.
Rhodes SJ and Rosenfeld MG 1996 Molecular involvement of the Pit-1 gene in anterior pituitary cell commitment. Journal of Animal Science 74 94-106.
Ribeiro JMBF 1999 Aptidão da Ovelha Serra da Estrela para a Ordenha Mecânica Influência do Tipo de Desmame na sua Capacidade Produtiva. Dissertação para prestação de provas de acesso à categoria de Investigador Auxiliar. Estação Zootécnica Nacional - Instituto Nacional de Investigação Agrária, Santarém.
Rodrigues CV, Guimaraes SE, Neto ED and Pinheiro LE 1998 Identification of a novel polymorphism in the promoter region of the bovine growth hormone gene. Animal Genetics 29 65-66.
Roh S, Clarke IJ, Xu R, Goding JW, Loneragan K and Chen C 1998 The in vitro effect of leptin on basal and growth hormone-releasing hormone-stimulated growth hormone secretion from the ovine pituitary gland. Neuroendocrinology 68 361-364.
Rose MT, Weekes TE and Rowlinson P 2005 Correlation of blood and milk components with the milk yield response to bovine somatotropin in dairy cows. Domestic Animal Endocrinology 28 296-307.
Rui L, Archer SF, Argetsinger LS and Carter-Su C 2000a Platelet-derived growth factor and lysophosphatidic acid inhibit growth hormone binding and signaling via a protein kinase C-dependent pathway. Journal of
Biological Chemistry. 275 2885-2892.
Rui L, Gunter DR, Herrington J and Carter-Su C 2000b Differential binding to and regulation of JAK2 by the SH2 domain and N-terminal region of SH2-bbeta. Molecular and Cellular Biology 20 3168-3177.
� � �%"%�%��%�
131
Rui L, Yuan M, Frantz D, Shoelson S and White MF 2002 SOCS-1 and SOCS-3 block insulin signaling by ubiquitin-mediated degradation of IRS1 and IRS2. Journal of Biological Chemistry 277 42394–42398.
Ruiz R, Oregui LM and Herrero M 2000 Comparison of Models for Describing the Lactation Curve of Latxa Sheep and an Analysis of Factors Affecting Milk Yield. Journal of Dairy Science 83 2709-2719.
Rupp R, Lagriffoul G, Astruc JM and Barillet F 2003 Genetic parameters for milk somatic cell scores and relationships with production traits in french lacaune dairy sheep. Journal of Dairy Science 86 1476-1481.
Sabour MP, Lin CY and Smith C 1997 Association of genetic variants of bovine growth hormone with milk production traits in Holstein cattle. Journal of Animal Breeding and Genetics 114 435-442.
Saleri R, Baratta M, Renaville R, Portetelle D, Coy DH, Giustina A and Tamanini C 1999 Effects of galanin infusion on GH secretion and GHRH-induced GH release in prepubertal male lambs. Small Ruminant
Research 33 231-237.
Sallam SMA, Nasser MEA and Yousef MI 2005 Effect of recombinant bovine somatotropin on sheep milk production, composition and some hemato-biochemical components. Small Ruminant Research 56 165-171.
Sami AJ, Wallis OC and Wallis M 1999 Production and characterisation of deletion mutants of ovine growth hormone. Journal of Molecular Endocrinology 23 97-106.
Sandles LD, Sun YX, D'Cruz AG, McDowell GH and Gooden JM 1988 Responses of lactating ewes to exogenous growth hormone: short- and long-term effects on productivity and tissue utilization of key metabolites. Australian Journal of Biological Science 41 357-370.
Sanna SR, Carta A and Casu S 2002 Genopype by environment interaction for milk yield in sarda dairy sheep. Journal of Animal Breeding and Genetics 119 190-199.
Santos IC, Marques MR, Belo CC and Cravador A 2004 Polymorphism analysis at the growth hormone gene in “Merino da Beira Baixa” ewes. Biotechnologie, Agronomie, Société et Environnement 8 40-41.
Sartin JL, Coleman ES and Steele B 1996 Interaction of cyclic AMP- and calcium-dependent mechanisms in the regulation of growth hormone-releasing hormone-stimulated growth hormone release from ovine pituitary cells. Domestic Animal Endocrinology 13 229-238.
Savage JJ, Yaden BC, Kiratipranon P and Rhodes SJ 2003 Transcriptional control during mammalian anterior pituitary development (review). Gene 319 1-19.
Schlee P, Graml R, Rottmann O and Pirchner F 1994a Influence of growth-hormone genotypes on breeding values of Simmental bulls. Journal of Animal Breeding and Genetics 111 253-256.
Schlee P, Graml R, Schallenberger E, Schams D, Rottmann O, Olbrich-Bludau A and Pirchner F 1994b Growth hormone and insulin-like growth factor I concentrations in bulls of various growth hormone genotypes. Theor.Appl.Genet. 88 497-500.
Scholl R, Walker A and Ballard LW 2001 Multiplex, Fluorescent Single-Strand Conformation Polymorphism Using Stepped Polymerase Chain Reaction Primers. Journal of Biomolecular Techniques 12 1-3.
Schwartz MW, Seeley RJ, Campfield LA, Burn P and Baskin DG 1996 Identification of targets of leptin action in rat hypothalamus. The Journal of Clinical Investigation 98 1101-1106.
Scully KM, Jacobson G, Jepsen K, Lunyak V, Viadiu H, Carrière C, Rose DW, Hooshmand F, Aggarwal AK and Rosenfeld MG 2000 Allosteric effects of Pit-1 DNA sites on long-term repression in cell type specification. Science 290 5494-1127.
Sechen SJ, Bauman DE, Tyrrell HF and Reynolds PJ 1989 Effect of somatotropin on kinetics of nonesterified fatty acids and partition of energy, carbon, and nitrogen in lactating dairy cows. Journal of Dairy Science 72 59-67.

132
Sejrsen K, Pedersen JO, Vestergaard M and Purup S 2001 Biological activity of bovine milk contribution of IGF-I and IGF binding proteins. Livestock Production Science 70 79-85.
Sejrsen K, Purup S, Vestergaard M and Foldager J 2000 High body weight gain and reduced bovine mammary growth: physiological basis and implications for milk yield potential. Domestic Animal Endocrinology 19 93-104.
Sejrsen K, Purup S, Vestergaard M, Weber MS and Knight CH 1999 Growth hormone and mammary development. Domestic Animal Endocrinology 17 117-129.
Shariflou MR, Moran C and Nicholas FW 2000 Association of the Leu127 variant of the bovine growth hormone (bGH) gene with increased yield of milk, fat, and protein in Australian Holstein-Friesians. Australian Journal
of Agricultural Research 51 515-522.
Shewchuk BM, Asa SL, Cooke NE and Liebhaber SA 1999 Pit-1 binding sites at the somatotrope-specific DNase I hypersensitive sites I, II of the human growth hormone locus control region are essential for in vivo hGH-N gene activation. Journal of Biological Chemistry 274 35725-35733.
Shintani M, Ogawa Y, Ebihara K, Aizawa-Abe M, Miyanaga F, Takaya K, Hayashi T, Inoue G, Hosoda K, Kojima M, Kangawa K and Nakao K 2001 Ghrelin, an endogenous growth hormone secretagogue, is a novel orexigenic peptide that antagonizes leptin action through the activation of hypothalamic neuropeptide Y/Y1 receptor pathway. Diabetes 50 227-232.
Silva CM, Lu H and Day RN 1996 Characterization and cloning of STAT5 from IM-9 cells and its activation by growth hormone. Molecular Endocrinology 10 508-518.
Sneyers M, Renaville R, Falaki M, Massart S, Devolder A, Boonen F, Marchand E, Prandi A, Burny A and Portetelle D 1994 TaqI restriction fragment length polymorphisms for growth hormone in bovine breeds and their association with quantitative traits. Growth Regulation 4 108-112.
Somers W, Ultsch M, de Vos AM and Kossiakoff AA 1994 The x-ray structure of a growth hormone prolactin receptor complex. Nature (London) 372 478–481
Sornson MW, Wu W, Dasen JS, Flynn SE, Norman DJ, O'Connell SM, Gukovsky I, Carrière C, Ryan AK, Miller AP, Zuo L, Gleiberman AS, Andersen B and Beamer WG 1996 Pituitary lineage determination by the Prophet of Pit-1 homeodomain factor defective in Ames dwarfism. Nature 384 327-333.
Spencer GS, Berry CJ and Bass JJ 1994 Neuroendocrine regulation of growth hormone secretion in sheep. VII. Effects of GABA. Regulatory Peptides 52 181-186.
Stancekova K, Vasicek D, Peskovicova D, Bulla J and Kubek A 1999 Effect of genetic variability of the porcine pituitary-specific transcription factor (Pit-1) on carcass traits in pigs. Animal Genetics 30 313-315.
Stelwagen K, Grieve DG, Walton JS, Ball JL and McBride BW 1993 Effect of prepartum bovine somatotropin in primigravid ewes on mammogenesis, milk production, and hormone concentrations. Journal of Dairy
Science 76 992-1001.
Stelwagen K, Politis I, White JH, Zavizion B, Prosser CG, Davis SR and Farr VC 1994 Effect of milking frequency and somatotropin on the activity of plasminogen activator, plasminogen, and plasmin in bovine milk. Journal of Dairy Science 77 3577-3583.
Stofega MR, Argetsinger LS, Wang H, Ullrich A and Carter-Su C 2000 Negative regulation of growth hormone receptor/JAK2 signaling by signal regulatory protein alpha. Journal of Biological Chemistry. 275 28222-28229.
Strous GJ and van Kerkhof P 2002 The ubiquitin/proteasome pathway and the regulation of growth hormone receptor availability. Molecular and Cellular Endocrinology 197 143-151.
� � �%"%�%��%�
133
Struthers RS, Gaddy-Kurten D and Vale WW 1992 Activin inhibits binding of transcription factor Pit-1 to the growth hormone promoter. Proceedings of the National Academy of Science U.S.A. 89 11451-11455.
Sugino T, Hasegawa Y, Kurose Y, Kojima M, Kangawa K and Terashima Y 2004 Effects of ghrelin on food intake and neuroendocrine function in sheep. Animal Reproduction Science 82-83 183-194.
Sun HS, Anderson LL, Yu T-P, Kim K-S, Klindt J and Tuggle CK 2002 Neonatal Meishan pigs show POU1F1 genotype effects on plasma GH and PRL concentration. Animal Reproduction Science 69 223-237.
Sun YX, Sinclair SE, Wynn PC and McDowell GH 1990 Immunization against somatotropin release inhibiting factor increases milk yield in ewes. Australian Journal of Agricultural Research 41 393-400.
Takahashi Y, Shirono H, Arisaka O, Takahashi K, Yagi T, Koga J, Kaji H, Okimura Y, Abe H, Tanaka T and Chihara K 1997 Biologically Inactive Growth Hormone Caused by an Amino Acid Substitution. The
Journal of Clinical Investigation 100 1159-1165.
Tansey WP and Catanzaro DF 1991 Sp1 and thyroid hormone receptor differentially activate expression of human growth hormone and chorionic somatomammotropin genes Journal of Biological Chemistry 266 9805-9813.
Taylor JF, Coutinho LL, Herring KL, Gallagher DS, Jr., Brenneman RA, Burney N, Sanders JO, Turner JW, Smith SB, Miller RK, Savell JW and Davis SK 1998 Candidate gene analysis of GH1 for effects on growth and carcass composition of cattle. Animal Genetics 29 194-201.
Theill LE and Karin M 1993 Transcriptional Control of GH Expression and Anterior Pituitary Development. Endocrine Reviews 14 670-689.
Thomas GB, Scott CJ, Cummins JT and Clarke IJ 1994 Adrenergic regulation of growth hormone secretion in the ewe. Domestic Animal Endocrinology 11 187-195.
Thomas MG, Gazal OS, Williams GL, Stanko RL and Keisler DH 1999 Injection of neuropeptide Y into the third cerebroventricle differentially influences pituitary secretion of luteinizing hormone and growth hormone in ovariectomized cows. Domestic Animal Endocrinology 16 159-169.
Tonner E, Barber MC, Allan GJ, Beattie J, Webster J, Whitelaw CB and Flint DJ 2002 Insulin-like growth factor binding protein-5 (IGFBP-5) induces premature cell death in the mammary glands of transgenic mice. Development 129 4547-4557.
Touraine P and Goffin V 2005 Physiologie de la prolactine. Endocrinologie 2 50-76.
Tucker HA 1985 Endocrine and neural control of the mammary gland. In: Lactation. Ed. by BL Larson p 39. Iowa State University Press, Ames.
Ultsch M and de Vos AM 1993 Crystals of human growth hormone-receptor complexes. Extracellular domains of the growth hormone and prolactin receptors and a hormone mutant designed to prevent receptor dimerization. Journal of Molecular Biology 231 1133-1136.
Unanian MM, Denise SK, Zhang HM and Ax RL 1994 Rapid communication: polymerase chain reaction-restriction fragment length polymorphism in the bovine growth hormone gene. Journal of Animal Science 72 2203.
Valinsky A, Shani M and Gootwine E 1990 Restriction fragment length polymorphism in sheep at the growth hormone locus is the result of variation in gene number. Animal Biotechnology 1 135-144.
Vallette-Kasic S, Pellegrini-Bouiller I, Sampieri F, Gunz G, Diaz A, Radovick S, Enjalbert A and Brue T 2001 Combined pituitary hormone deficiency due to the F135C human Pit-1 (pituitary-specific factor 1) gene mutation: functional and structural correlates. Molecular Endocrinology 15 411-420.
van der Eerden, Karperien M and Wit JM 2003 Systemic and local regulation of the growth plate. Endocrine
Reviews 24 782-801.
134
van Garderen E and Schalken JA 2002 Morphogenic and tumorigenic potentials of the mammary growth hormone/growth hormone receptor system (review). Molecular and Cellular Endocrinology 197 153-165.
van Kerkhof P and Strous GJ 2001 The ubiquitin-proteasome pathway regulates lysosomal degradation of the growth hormone receptor and its ligand. Biochemical Society Transactions 29 488-493.
VanderHeyden TC, Wojtkiewicz PW, Voss TC, Mangin TM, Harrelson Z, Ahlers KM, Phelps CJ and Hurley DL 2000 Mouse growth hormone transcription factor Zn-16: unique bipartite structure containing tandemly repeated zinc finger domains not reported in rat Zn-15. Molecular and Cellular Endocrinology 159 89-98
VanderKuur JA, Wang X, Zhang L, Campbell GS, Allevato G, Billestrup N, Norstedt G and Carter-Su C 1994 Domains of the growth hormone receptor required for association and activation of JAK2 tyrosine kinase. Journal of Biological Chemistry 269 21709-21717.
Velez JC and Donkin SS 2004 Bovine somatotropin increases hepatic phosphoenolpyruvate carboxykinase mRNA in lactating dairy cows. Journal of Dairy Science 87 1325-1335.
Verma S, Ghorpade A, Tiwari G, Das P and Garg LC 1999 cDNA cloning and sequence analysis of bubaline growth hormone. DNA sequence: the journal of DNA sequencing and mapping 10 101-103.
Vernon RG, Barber MC and Finley E 1991a Modulation of the activity of acetyl-CoA carboxylase and other lipogenic enzymes by growth hormone, insulin and dexamethasone in sheep adipose tissue and relationship to adaptations to lactation. Biochemestry Journal 274 ( Pt 2) 543-548.
Vernon RG, Doris R, Finley E, Houslay MD, Kilgour E and Linday-Watt S 1995 Effects of lactation on the signal transduction systems regulating lipolysis in sheep subcutaneous and omental adipose tissue. Biochemical Journal 308 291–296.
Vernon RG, Finley E and Watt PW 1991b Adenosine and the control of adrenergic regulation of adipose tissue lipolysis during lactation. Journal of Dairy Science 74 695-705.
Vestergaard M, Purup S, Henckel P, Tonner E, Flint DJ, Jensen LR and Sejrsen K 1995 Effects of growth hormone and ovariectomy on performance, serum hormones, insulin-like growth factor-binding proteins, and muscle fiber properties of prepubertal Friesian heifers. Journal of Animal Science 73 3574-3584.
Vetharaniam I, Davis SR, Soboleva TK, Shorten PR and Wake GC 2003 Modeling the interaction of milking frequency and nutrition on mammary gland growth and lactation. Journal of Dairy Science 86 1987-1996.
Vieira G, Jansen J and Ferrera N 2006 Environmental setting of the Serra da Estrela, Portugal: a short-note. Submitted to R. Bunce, D. Howard and T. Pinto Correio (Eds). Landscape ecology series. IALE UK. [http://www.fl.ul.pt/pessoais/gtvieira/ficheiros_download/environmental_setting_of_the_serra_da_estrela.pdf] in 2006/04/28.
Vignal A, Milan D, SanCristobal M and Eggen A 2002 A review on SNP and other types of molecular markers and their use in animal genetics. Genetic, Selection and Evolution 34 275-305.
Vize PD and Wells JR 1987 Isolation and characterization of the porcine growth hormone gene. Gene 55 339-344.
Voet D, Voet JG and Pratt CW 1999 Fundamentals of biochemistry. Ed. John Wiley & Sons, Inc. USA.
Vos P, Hogers R, Bleeker M, Reijans M, van de Lee T, Hornes M, Friters A, Pot J, Paleman J, Kuiper M and Zabeau M 1995 AFLP: a new technique for DNA fingerprinting. Nucleic Acids Research 23 4407-4414.
Vukasinovic N, Denise SK and Freeman AE 1999 Association of growth hormone loci with milk yield traits in Holstein bulls. Journal of Dairy Science 82 788-794.
� � �%"%�%��%�
135
Wakao H, Gouilleux F and Groner B 1994 Mammary gland factor (MGF) is a novel member of the cytokine regulated transcription factor gene family and confers the prolactin response. The EMBO Journal 13 2182-2191.
Wakao H, Schmitt-Ney M and Groner B 1992 Mammary gland-specific nuclear factor is present in lactating rodent and bovine mammary tissue and composed of a single polypeptide of 89 kDa. Journal of Biological
Chemistry 267 16365-16370.
Wallis M, Lioupis A and Wallis OC 1998 Duplicate growth hormone genes in sheep and goat. Journal of
Molecular Endocrinology 21 1-5.
Wang X, Darus CJ, Xu BC and Kopchick JJ 1996 Identification of growth hormone receptor (GHR) tyrosine residues required for GHR phosphorylation and JAK2 and STAT5 activation. Molecular Endocrinology 10 1249-1260.
Ward KA, Nancarrow CD, Byrne CR, Shanahan CM, Murray JD, Leish Z, Townrow C, Rigby NW, Wilson BW and Hunt CL 1990 The potential of transgenic animals for improved agricultural productivity. Revue scientifique et technique (International Office of Epizootics) 9 847-864.
Wartmann M, Cella N, Hofer P, Groner B, Liu X, Hennighausen L and Hynes NE 1996 Lactogenic Hormone Activation of Stat5 and Transcription of the β-Casein Gene in Mammary Epithelial Cells Is Independent of p42 ERK2 Mitogen-activated Protein Kinase Activity. Journal of Biological Chemistry 271 31863-31868.
Warwick JM, Wallis OC and Wallis M 1989 Cloning, sequence and expression in Escherichia coli of cDNA for ovine pregrowth hormone. Biochim Biophys Acta 1008 247–50.
Weber JL and May PE 1989 Abundant class of human DNA polymorphisms which can be typed using the polymerase chain reaction. American Journal of Human Genetics 44 388–396.
Wells JA 1996 Binding in the growth hormone receptor complex. Proceedings of the National Academy of
Science U.S.A. 93 1-6.
Wells JA and de Vos AM 1993 Structure and function of human growth hormone: implications for the hematopoietins. Annual review of biophysics and biomolecular structure 22 329-351.
Werner FAO, Durstewitz G, Habermann FA, Thaller G, Krämer W, Kollers S, Buitkamp J, Georges M, Brem G, Mosner J and Fries R 2004 Detection and characterization of SNPs useful for identity control and parentage testing in major European dairy breeds. Animal Genetics 35 44-49.
Werry TD, Sexton PM and Christopoulos A 2005 'Ins and outs' of seven-transmembrane receptor signalling to ERK. Trends in Endocrinology and Metabolism 16 26-33.
West CR, Lookingland KJ and Tucker HA 1997 Regulation of growth hormone-releasing hormone and somatostatin from perifused, bovine hypothalamic slices. II. Dopamine receptor regulation. Domestic Animal
Endocrinology 14 349-357
Westbrook SL, Chandler KD and McDowell GH 1993 Immunization of pregnant ewes against somatotropin release inhibiting factor increases growth of twin lambs. Australian Journal of Agricultural Research 44 229-238.
Williams GR, Harney JW, Moore DD, Larsen PR and Brent GA 1992 Differential capacity of wild type promoter elements for binding and trans-activation by retinoic acid and thyroid hormone receptors. Molecular Endocrinology 6 1527-1537.
Williams JG, Kubelik AR, Livak KJ, Rafalski JA and Tingey SV 1990 DNA polymorphisms amplified by arbitrary primers are useful as genetic markers. Nucleic Acids Research 18 6531–6535.
Willoughby JO, Chapman IM and Kapoor R 1993 Local hypothalamic adrenoceptor activation in rat: �1 inhibits and �2 stimulates growth hormone secretion. Neuroendocrinology 57 687–692.

136
Wimmers K, Murani E, Ponsuksili S, Yerle M and Schellander K 2002 Detection of quantitative trait loci for carcass traits in the pig by using AFLP. Mammalian Genome 13 206-210.
Woelfle J and Rotwein P 2004 In vivo regulation of growth hormone-stimulated gene transcription by STAT5b. Am.J Physiol Endocrinol Metab 286 E393-E401.
Woelfle J, Chia DJ, Massart-Schlesinger MB, Moyano P and Rotwein P 2005 Molecular physiology, pathology, and regulation of the growth hormone/insulin-like growth factor I system. Pediatric Nephrology 20 295-302.
Wortley KE, del Rincon JP, Murray JD, Garcia K, Lida K, Thorner MO and Sleeman MW 2005 Absence of ghrelin protects against early-onset obesity. The Journal of Clinical Investigation 115 3573-3578.
Woychik RP, Camper SA, Lyons RH, Horowitz S, Goodwin EC and Rottman FM 1982 Cloning and nucleotide sequencing of the bovine growth hormone gene. Nucleic Acids Research. 10 7197-7210.
Woychik RP, Lyons RH, Post L and Rottman FM 1984 Requirement for the 3' flanking region of the bovine growth hormone gene for accurate polyadenylylation. Proceedings of the National Academy of Sciences of the United States of America 81 3944-3948.
Xu BC, Wang X, Darus CJ and Kopchick JJ 1996 Growth hormone promotes the association of transcription factor STAT5 with the growth hormone receptor. Journal of Biological Chemistry 271 19768-19773.
Xu J, Ji S, Venable DY, Franklin JL and Messina JL 2005 Prolonged insulin treatment inhibits GH signaling via STAT3 and STAT1. Journal of Endocrinology 184 481-492.
Xu L, Lavinsky RM, Dasen JS, Flynn SE, Mclnerney EM, Mullen T, Heinzel T, Szeto D, Korzus E, Kurokawa R, Aggarwal AK, Rose DW, Glass CK and Rosenfeld MG 1998 Signal-specific co-activator domain requirements for Pit-1 activation. Nature 395 301-306.
Yamano Y, Abe M, Mikawa S, Kioka N, Manabe E, Sakai H, KomanoT, Utsumi K and Iritani A 1991 Structural analysis of repetitive DNA sequences in the goat growth hormone gene region. Agricultural and
Biological Chemistry 55 633-639.
Yamano Y, Oyabayashi K, Okuno M, Yato M, Kioka N, Manabe E, Hashi H, Sakai H, Komano T and Utsumi K 1988 Cloning and sequencing of cDNA that encodes goat growth hormone. FEBS Letters 228 301-304.
Yan M, Hernandez M, Xu R and Chen C 2004 Effect of GHRH and GHRP-2 treatment in vitro on GH secretion and levels of GH, pituitary transcription factor-1, GHRH-receptor, GH-secretagogue-receptor and somatostatin receptor mRNAs in ovine pituitary cells. European Journal of Endocrinology 150 235-242.
Yanagihara N, Utsunomiya K, Cheah TB, Hirano H, Kajiwara K, Hara K, Nakamura E, Toyohira Y, Uezono Y, Ueno S and Izumi F 2000 Characterization and functional role of leptin receptor in bovine adrenal medullary cells. Biochemical pharmacology 59 1141-1145.
Yang B-Y, Chan K-M, Lin C-M and Chen TT 1997. Characterization of rainbow trout (Oncorhynchus mykiss) growth hormone 1 gene and the promoter region of growth hormone 2 gene. Archives of Biochemistry and
Biophysics 340 359–368.
Yao J, Aggrey SE, Zadworny D, Hayes JF and Kuhnlein U 1996 Sequence variations in the bovine growth hormone gene characterized by single-strand conformation polymorphism (SSCP) analysis and their association with milk production traits in Holsteins. Genetics 144 1809-1816.
Yato M, Yamano Y, Oyabayashi K, Okuno M, Kioka N, Manabe E, Hashi H, Sakai H, Komano T and Utsumi K 1988 Nucleotide sequence of the growth hormone gene cDNA from goat Capra hircus L. (Tokara). Nucleic Acids Research 16 3578.

� � �%"%�%��%�
137
Yu T-P, Tuggle CK, Schimtz CB and Rothschild MF 1995 Association of PIT1 polymorphisms with growth and carcass traits in pigs. Journal of Animal Science 73 1282-1288.
Zhang HM, Brown DR, DeNise SK and Ax RL 1993 Rapid communication: polymerase chain reaction-restriction fragment length polymorphism analysis of the bovine somatotropin gene. Journal of Animal
Science 71 2276.
Zhao FQ, Kennelly JJ, Moseley WM and Tucker HA 1996a Regulation of the gene expression of glucose transporter in liver and kidney of lactating cows by bovine growth hormone and bovine growth hormone-releasing factor. Journal of Dairy Science 79 1537-1542.
Zhao FQ, Moseley WM, Tucker HA and Kennelly JJ 1996b Regulation of glucose transporter gene expression in mammary gland, muscle, and fat of lactating cows by administration of bovine growth hormone and bovine growth hormone-releasing factor. Journal of Animal Science 74 183-189.
Zhao X, Burton JH and McBride BW 1992 Lactation, health, and reproduction of dairy cows receiving daily injectable or sustained-release somatotropin. Journal of Dairy Science 75 3122-3130.
Zhvirblis GS, Gorbulev VG, Rubtsov PM, Karapetian RV and Zhuravlev IV 1987 [Genetic engineering of peptide hormones. I. Cloning and primary structure of cDNA of chicken growth hormone]. Molekuliarnaia
biologiia 21 1620-1624.

�
����������

140
���������....................................................................................................................... 139
Appendix 1 Questionnaire for dairy sheep farmers ................................................................ 141
Appendix 2 Flocks’ average milk data records in the lactations of the years 95/96 and96/97 (36 flocks and 2520 ewes) ................................................................................................................ 144
Appendix 3 GenBank accession number DQ238053 - the oGH gene inter-copy region ...... 145
Appendix 4 Putative transcription factors binding sites at the 5’ region of oGH gene ....... 148

141
Appendix 1 Questionnaire for dairy sheep farmers
QUESTIONNAIRE FOR DAIRY SHEEP FARMERS
Date ____/____/_______
FARMER: ________________________________________________________________ ANCOSE code __________________________ Address: ___________________________________________________________________ Place: __________________________________ Total area = ________________ ha Owned = ________________ ha Rented = ________________ ha SHEEP AND SHEEP PRODUCTS
Ewes Cheese Lambs weaned Primiparous Multiparous Maximum No. Mouth No. Age Weight Sheep
1) FARM HAND-LABOUR Who does the shepherding? _____________________________________________________ There are other workers? _______________________________________________________
When? What they do? _______________________________________________________ Shepherd _________________________________________________________________ Person(s) for milking ________________________________________________________ Person(s) for cheese making __________________________________________________ Other ____________________________________________________________________
2) PASTURES Do you have pastures?
Natural? Owned No � Yes � Area = ______ha
Rented No � Yes � Area = ______ha
Sown? Owned No � Yes � Area = ______ha
Rented No � Yes � Area = ______ha
Which crops do you seed? ______________________________________________________ Do you fertilize them? _________________________________________________________
When? __________________________________________________________________ With what? ______________________________________________________________
There is water for irrigation? Yes � No � Electricity Yes � No � Do you irrigate the cultures?
How? __________________________________________________________________

142
Which kind of vegetation do the ewes grass in? ______________________________________ Autumn _________________________________________________________________ Winter __________________________________________________________________ Spring___________________________________________________________________
Are they under tree cover pasture? Natural? No � Yes �
Sown? No � Yes �
Which are the dominant shrub species? ____________________________________________ Natural______________________________________________________________________ Sown _______________________________________________________________________ At which time do the ewes go to the pasture and when do they return?
Autumn _________________________________________________________________ Winter __________________________________________________________________ Spring___________________________________________________________________
How much time do the ewes spend till the pasture? __________________________________
Autumn _________________________________________________________________ Winter __________________________________________________________________ Spring___________________________________________________________________
Do you have pastures with fences or ewes grass all over the area?
Autumn _________________________________________________________________ Winter __________________________________________________________________ Spring___________________________________________________________________
Do the lactating ewes grass separately from the remaining flock?
Autumn _________________________________________________________________ Winter __________________________________________________________________ Spring___________________________________________________________________
Do the ewes grass the remains of other crops after harvesting? Which ones?
Autumn _________________________________________________________________ Winter __________________________________________________________________ Spring___________________________________________________________________
Do the ewes grass in communitary barren lands? Do you practice transhumance?
Autumn _________________________________________________________________ Winter __________________________________________________________________ Spring___________________________________________________________________

143
3) MILKING In what month do you start milking? ______________________________________________ In what month do you stop milking? ______________________________________________ Which is the month with higher milk production?____________________________________ Who milks the ewes? __________________________________________________________ How much time does it take? ___________________________________________________
Autumn _________________________________________________________________ Winter __________________________________________________________________ Spring __________________________________________________________________
At which time are the ewe milked? _______________________________________________ Autumn _________________________________________________________________ Winter __________________________________________________________________ Spring __________________________________________________________________
4) SUPPLEMENTARAY FEED Do you give any supplementary feed during milking? ___________ (How many? What kind?)
Autumn _______________________________________________________________ Winter ________________________________________________________________ Spring ________________________________________________________________
Do you give any supplementary feed in the pen? Hay
Which kind? ______________________________________________________________ How much do you give to each ewe?
Autumn _______________________________________________________________ Winter ________________________________________________________________ Spring ________________________________________________________________
Locally produced or purchased? _______________________________________________ Straw
Which kind? ______________________________________________________________ How much do you give to each ewe?
Autumn _______________________________________________________________ Winter ________________________________________________________________ Spring ________________________________________________________________
Locally produced or purchased? _______________________________________________ 4) MILK AND CHEESE What do you do with milk? _____________________________________________________ How many litres are usually necessary to make a cheese? _____________________________
Autumn _______________________________________________________________ Winter ________________________________________________________________ Spring ________________________________________________________________
How much does a cheese weigh? ________________________________________________ Autumn _______________________________________________________________ Winter ________________________________________________________________ Spring ________________________________________________________________
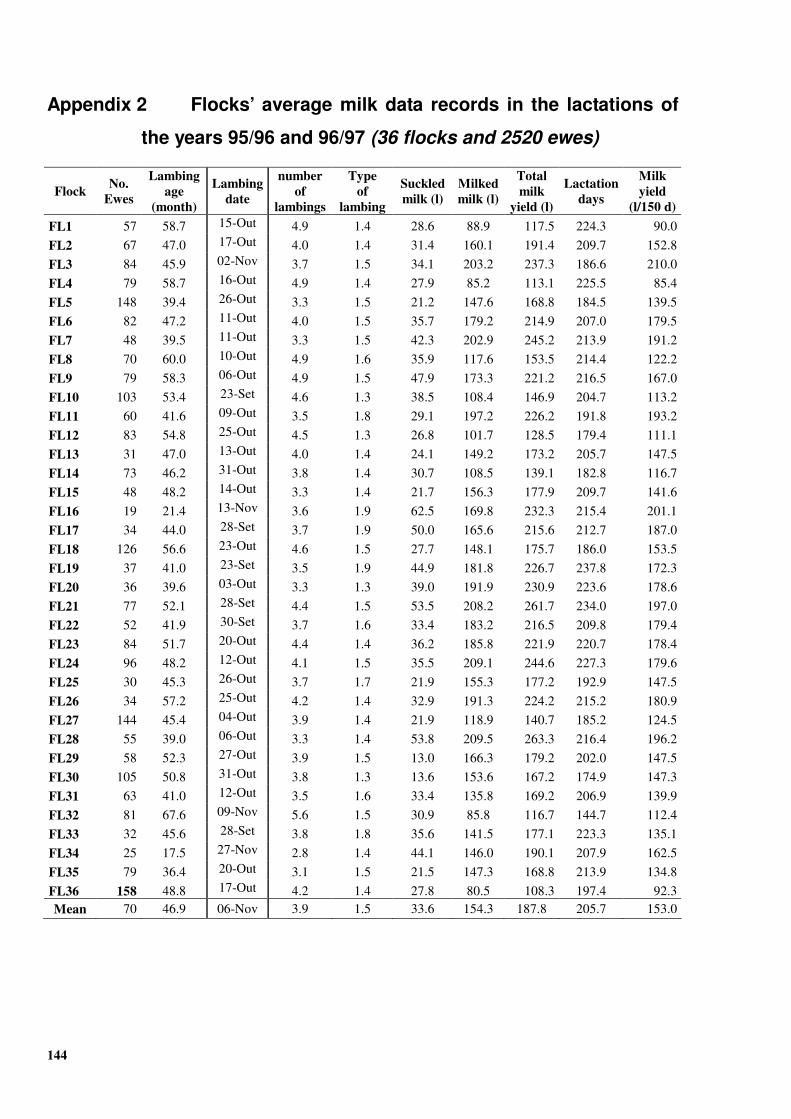
144
Appendix 2 Flocks’ average milk data records in the lactations of
the years 95/96 and 96/97 (36 flocks and 2520 ewes)
Flock No. Ewes
Lambing age
(month)
Lambing date
number of
lambings
Type of
lambing
Suckled milk (l)
Milked milk (l)
Total milk
yield (l)
Lactation days
Milk yield
(l/150 d) FL1 57 58.7 15-Out 4.9 1.4 28.6 88.9 117.5 224.3 90.0 FL2 67 47.0 17-Out 4.0 1.4 31.4 160.1 191.4 209.7 152.8 FL3 84 45.9 02-Nov 3.7 1.5 34.1 203.2 237.3 186.6 210.0 FL4 79 58.7 16-Out 4.9 1.4 27.9 85.2 113.1 225.5 85.4 FL5 148 39.4 26-Out 3.3 1.5 21.2 147.6 168.8 184.5 139.5 FL6 82 47.2 11-Out 4.0 1.5 35.7 179.2 214.9 207.0 179.5 FL7 48 39.5 11-Out 3.3 1.5 42.3 202.9 245.2 213.9 191.2 FL8 70 60.0 10-Out 4.9 1.6 35.9 117.6 153.5 214.4 122.2 FL9 79 58.3 06-Out 4.9 1.5 47.9 173.3 221.2 216.5 167.0 FL10 103 53.4 23-Set 4.6 1.3 38.5 108.4 146.9 204.7 113.2 FL11 60 41.6 09-Out 3.5 1.8 29.1 197.2 226.2 191.8 193.2 FL12 83 54.8 25-Out 4.5 1.3 26.8 101.7 128.5 179.4 111.1 FL13 31 47.0 13-Out 4.0 1.4 24.1 149.2 173.2 205.7 147.5 FL14 73 46.2 31-Out 3.8 1.4 30.7 108.5 139.1 182.8 116.7 FL15 48 48.2 14-Out 3.3 1.4 21.7 156.3 177.9 209.7 141.6 FL16 19 21.4 13-Nov 3.6 1.9 62.5 169.8 232.3 215.4 201.1 FL17 34 44.0 28-Set 3.7 1.9 50.0 165.6 215.6 212.7 187.0 FL18 126 56.6 23-Out 4.6 1.5 27.7 148.1 175.7 186.0 153.5 FL19 37 41.0 23-Set 3.5 1.9 44.9 181.8 226.7 237.8 172.3 FL20 36 39.6 03-Out 3.3 1.3 39.0 191.9 230.9 223.6 178.6 FL21 77 52.1 28-Set 4.4 1.5 53.5 208.2 261.7 234.0 197.0 FL22 52 41.9 30-Set 3.7 1.6 33.4 183.2 216.5 209.8 179.4 FL23 84 51.7 20-Out 4.4 1.4 36.2 185.8 221.9 220.7 178.4 FL24 96 48.2 12-Out 4.1 1.5 35.5 209.1 244.6 227.3 179.6 FL25 30 45.3 26-Out 3.7 1.7 21.9 155.3 177.2 192.9 147.5 FL26 34 57.2 25-Out 4.2 1.4 32.9 191.3 224.2 215.2 180.9 FL27 144 45.4 04-Out 3.9 1.4 21.9 118.9 140.7 185.2 124.5 FL28 55 39.0 06-Out 3.3 1.4 53.8 209.5 263.3 216.4 196.2 FL29 58 52.3 27-Out 3.9 1.5 13.0 166.3 179.2 202.0 147.5 FL30 105 50.8 31-Out 3.8 1.3 13.6 153.6 167.2 174.9 147.3 FL31 63 41.0 12-Out 3.5 1.6 33.4 135.8 169.2 206.9 139.9 FL32 81 67.6 09-Nov 5.6 1.5 30.9 85.8 116.7 144.7 112.4 FL33 32 45.6 28-Set 3.8 1.8 35.6 141.5 177.1 223.3 135.1 FL34 25 17.5 27-Nov 2.8 1.4 44.1 146.0 190.1 207.9 162.5 FL35 79 36.4 20-Out 3.1 1.5 21.5 147.3 168.8 213.9 134.8 FL36 158 48.8 17-Out 4.2 1.4 27.8 80.5 108.3 197.4 92.3 Mean 70 46.9 06-Nov 3.9 1.5 33.6 154.3 187.8 205.7 153.0
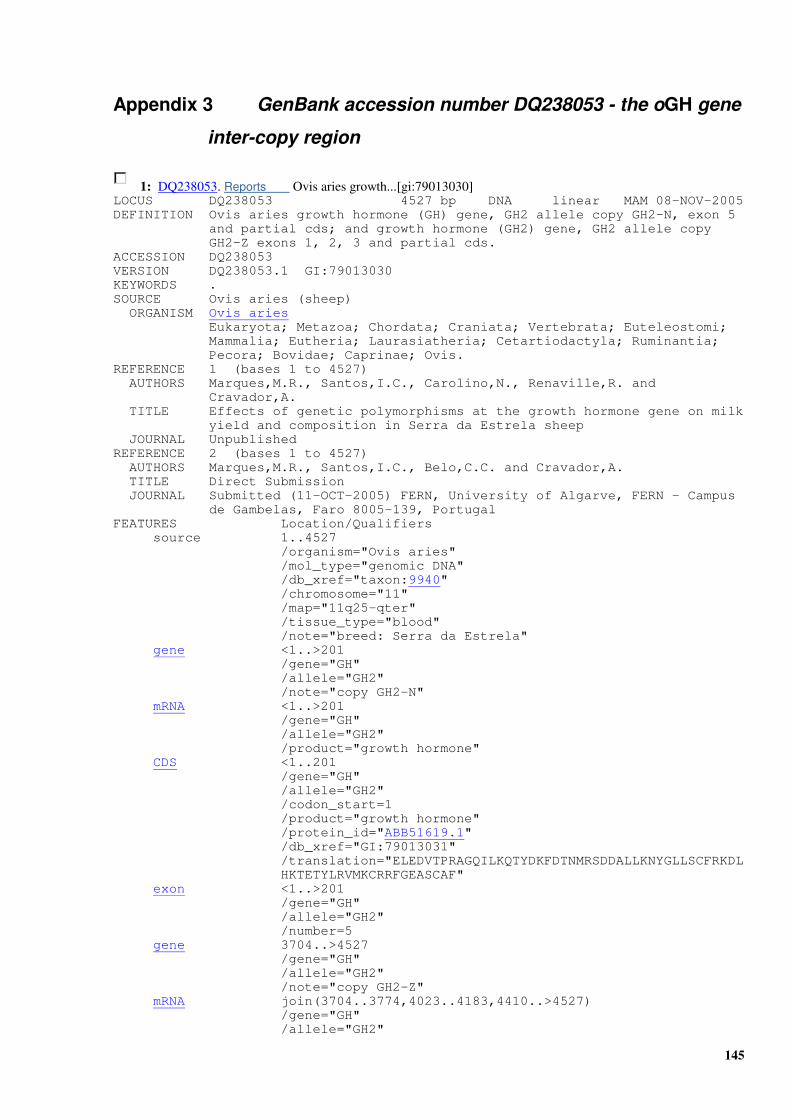
145
Appendix 3 GenBank accession number DQ238053 - the oGH gene
inter-copy region
1: DQ238053. Reports Ovis aries growth...[gi:79013030] LOCUS DQ238053 4527 bp DNA linear MAM 08-NOV-2005 DEFINITION Ovis aries growth hormone (GH) gene, GH2 allele copy GH2-N, exon 5 and partial cds; and growth hormone (GH2) gene, GH2 allele copy GH2-Z exons 1, 2, 3 and partial cds. ACCESSION DQ238053 VERSION DQ238053.1 GI:79013030 KEYWORDS . SOURCE Ovis aries (sheep) ORGANISM Ovis aries Eukaryota; Metazoa; Chordata; Craniata; Vertebrata; Euteleostomi; Mammalia; Eutheria; Laurasiatheria; Cetartiodactyla; Ruminantia; Pecora; Bovidae; Caprinae; Ovis. REFERENCE 1 (bases 1 to 4527) AUTHORS Marques,M.R., Santos,I.C., Carolino,N., Renaville,R. and Cravador,A. TITLE Effects of genetic polymorphisms at the growth hormone gene on milk yield and composition in Serra da Estrela sheep JOURNAL Unpublished REFERENCE 2 (bases 1 to 4527) AUTHORS Marques,M.R., Santos,I.C., Belo,C.C. and Cravador,A. TITLE Direct Submission JOURNAL Submitted (11-OCT-2005) FERN, University of Algarve, FERN - Campus de Gambelas, Faro 8005-139, Portugal FEATURES Location/Qualifiers source 1..4527 /organism="Ovis aries" /mol_type="genomic DNA" /db_xref="taxon:9940" /chromosome="11" /map="11q25-qter" /tissue_type="blood" /note="breed: Serra da Estrela" gene <1..>201 /gene="GH" /allele="GH2" /note="copy GH2-N" mRNA <1..>201 /gene="GH" /allele="GH2" /product="growth hormone" CDS <1..201 /gene="GH" /allele="GH2" /codon_start=1 /product="growth hormone" /protein_id="ABB51619.1" /db_xref="GI:79013031" /translation="ELEDVTPRAGQILKQTYDKFDTNMRSDDALLKNYGLLSCFRKDL HKTETYLRVMKCRRFGEASCAF" exon <1..>201 /gene="GH" /allele="GH2" /number=5 gene 3704..>4527 /gene="GH" /allele="GH2" /note="copy GH2-Z" mRNA join(3704..3774,4023..4183,4410..>4527) /gene="GH" /allele="GH2"

146
/product="growth hormone" exon 3704..3774 /gene="GH" /allele="GH2" /number=1 CDS join(3762..3774,4023..4183,4410..>4527) /gene="GH" /allele="GH2" /codon_start=1 /product="growth hormone" /protein_id="ABB51620.1" /db_xref="GI:79013032" /translation="MMAAGPRTSLLLAFTLLCLLWTQVVGAFPAMSLSRLFANAVLRA QHLHQLAADTFKEFERTYIPEGQRYSIQNTQVAFCFSETIPAPTSKNEAQQKS" exon 4023..4183 /gene="GH" /allele="GH2" /number=2 exon 4410..>4527 /gene="GH" /allele="GH2" /number=3 ORIGIN 1 gagctggaag atgttacccc ccgggctggg cagatcctca agcagaccta tgacaaattt 61 gacacaaaca tgcgcagtga tgatgcgctg ctcaagaact acggtctgct ctcctgcttc 121 cggaaggacc tgcacaagac ggagacgtac ctgagggtca tgaagtgtcg ccgcttcggg 181 gaggccagct gcgccttcta gttgccagcc atctgttgtt acccctcccc gtgccttcct 241 agaccctgga aggtgccact ccagtgccca ctgtcctttc ctaataaagc gaggaaattg 301 catcacattg tctgagtagg tgtcattcta ttctaggggg tggggtcagg caggacagcg 361 agggggagga ttgggaagac aatagcaggg gtgctgtggg ctctatgggt acccaggtgc 421 tgaataattg gcccggttcc tcctgggcca gaaagaagca ggcacatccc cttctctgtg 481 acacacccgg tcctcgcccc tggtccttag ttccaacccc actcatagga cactcacagc 541 tcaggagggc tctgccttca gtcccacccg ctaaggtgct tggagcggtt tctccttccc 601 tcatcagccc accaaaccga acctagcctc caagagtggg aagaaattta agcaagacag 661 gctatgaagt acagagggag agaaaatgcc tccaacatgt gaggaagtga tgagagaaag 721 cgtagaatta gttttgtgca gaaattttaa ggtgactaca cacttggccc aactaccctt 781 gggaaatgtg tgtgtgttag tcactcagct gtgtccagct ctttgtgacc ccacggactg 841 tggcctgcca ggctcctctg tccatgggat tctccaggca agaatactgg agggggttgc 901 cattccccag gggatcttcc caacccaagg atcaaacccg agtttcctgc attgcaggca 961 gattctttac tctctgagcc atcagggaag ccctgtggga aatgggaacc atgcaaaaat 1021 ggctttggga ccaattgaac cagaatgttt gggatctgaa ctgggtcaag agatgtggaa 1081 gagagattct aaatgcatgt gttcatgcta agttgcttca gtcgtgtccg actatttgca 1141 accccatgga ctgcagcccg ccaggctcct ctgtccatgg gattctccat tcaagaatac 1201 tggagtgagt ttccattcct cttccagggg atcttccgaa cccaggcatt gaaccagcgt 1261 ctcttatatc tcctgcactg acaggcgggt tctttaccac tagcgccacc tgggacccag 1321 ttctaagtga ggggttgcaa attcagtgcc aacaggtgcc aggcaggtta tatacataag 1381 tggcaagggc tgcatgtgaa gggagaaata gcaaccagcc cttagcctgc ttgtgaagga 1441 catagcacag aggggtagga accagggcag cctaaagtct caggccccag ctaaggatgc 1501 agcccaccta gccctgttac attgccttat cctgcattca ggactgcagg aggactttcc 1561 tggtggtcca gtggctgaga atccacatac caatgcaggg gacacgggtt caatccctga 1621 tctggaaaga ttccacatgc ctcagggcaa ctaagcctgt atatcacgac taccaaagcc 1681 ctcacaccca cagcctgtgc tgtgctacaa gagaagcccc tcagtgagaa gcctgctcac 1741 cacaactaga aagtagagta gcccctgctc gctgcaacta gagaaagccc tcttgcagca 1801 accaacccag cacagccaaa actaattaaa agacctcagg ggacttccct ggtggttcag 1861 catataaggc tctgtgcttc caatggaggg ggcccaggtt caacccctgg ttggagaact 1921 agatccctca tgctgaaatt aaagatccca agtgccacaa cctgactcag ccaaataaat 1981 aaattaaaaa aaaaacaaaa ctcagatgca gggctgccag accttctgac tcttcaagac 2041 agacagggta tccacacttt catgtaaaat caaatgttta aacattggca actaattcat 2101 attgaaacat tttaagggca aattttaacc caaacacatt tgctcttcaa gcagtcagtg 2161 agcaatctgt tattagagga atggattggg ataacttgga acaagggaaa gaatcagaaa 2221 gacctagact tgaacttgtg ctcaggaaga aattacttaa cctccccagg acccagtttg 2281 ctcacctaca aaatagagat aataatgtat tgccttataa ggcttgggtg aggagtaaat 2341 gaaatgaggt ctctaaagtg attgacacat tacggcaggt aagaagcttc agctattttt 2401 gcattgaact gtggagtgct ctgtgttttt ccaaaggaat tgaatcacat tctgcttccc 2461 taatggcagc ctgaatgttc tttctaaata cacttcaaag ggcagtttta aagttgtttt 2521 tagtcaccca agcaccttgg ctaagtaacc agtgatcgat aaattaatgc ttagatgttc 2581 aaagtaactc tattgtctgc taagttttgc tcataacttt attatttcta ctttactact 2641 cactttaaat tttcttcttt aaaagcctct attctttaag tggattttta gattactaac
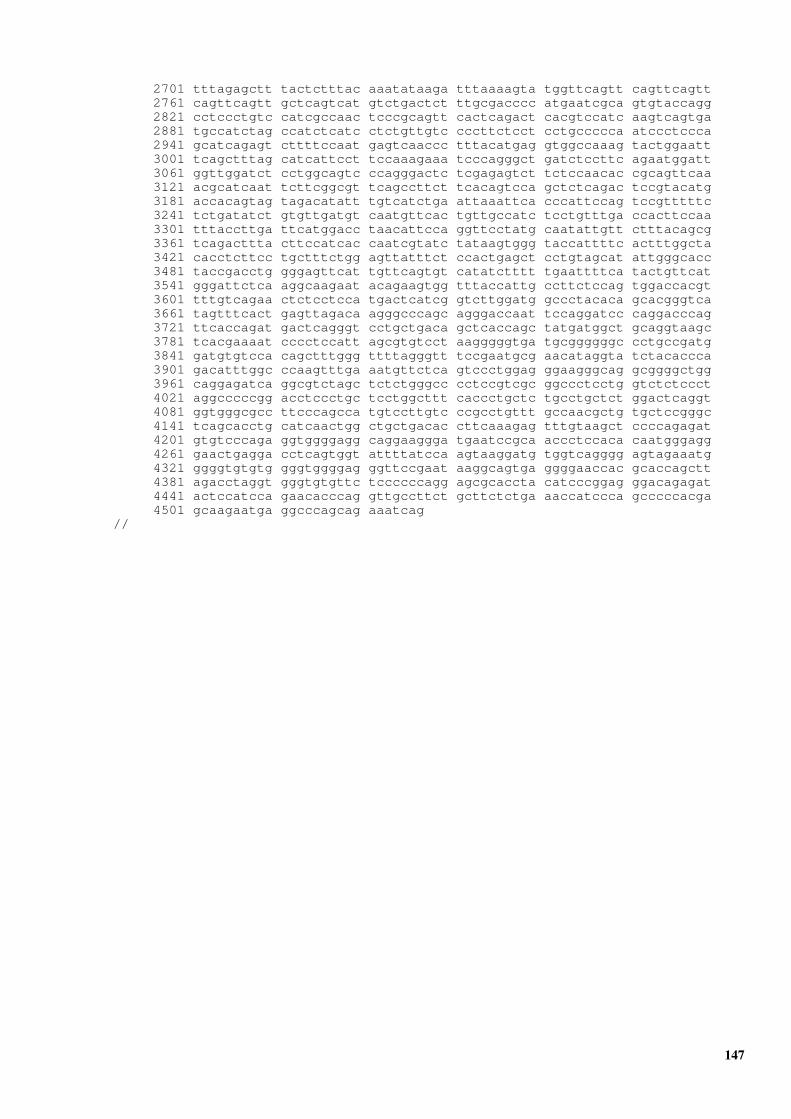
147
2701 tttagagctt tactctttac aaatataaga tttaaaagta tggttcagtt cagttcagtt 2761 cagttcagtt gctcagtcat gtctgactct ttgcgacccc atgaatcgca gtgtaccagg 2821 cctccctgtc catcgccaac tcccgcagtt cactcagact cacgtccatc aagtcagtga 2881 tgccatctag ccatctcatc ctctgttgtc cccttctcct cctgccccca atccctccca 2941 gcatcagagt cttttccaat gagtcaaccc tttacatgag gtggccaaag tactggaatt 3001 tcagctttag catcattcct tccaaagaaa tcccagggct gatctccttc agaatggatt 3061 ggttggatct cctggcagtc ccagggactc tcgagagtct tctccaacac cgcagttcaa 3121 acgcatcaat tcttcggcgt tcagccttct tcacagtcca gctctcagac tccgtacatg 3181 accacagtag tagacatatt tgtcatctga attaaattca cccattccag tccgtttttc 3241 tctgatatct gtgttgatgt caatgttcac tgttgccatc tcctgtttga ccacttccaa 3301 tttaccttga ttcatggacc taacattcca ggttcctatg caatattgtt ctttacagcg 3361 tcagacttta cttccatcac caatcgtatc tataagtggg taccattttc actttggcta 3421 cacctcttcc tgctttctgg agttatttct ccactgagct cctgtagcat attgggcacc 3481 taccgacctg gggagttcat tgttcagtgt catatctttt tgaattttca tactgttcat 3541 gggattctca aggcaagaat acagaagtgg tttaccattg ccttctccag tggaccacgt 3601 tttgtcagaa ctctcctcca tgactcatcg gtcttggatg gccctacaca gcacgggtca 3661 tagtttcact gagttagaca agggcccagc agggaccaat tccaggatcc caggacccag 3721 ttcaccagat gactcagggt cctgctgaca gctcaccagc tatgatggct gcaggtaagc 3781 tcacgaaaat cccctccatt agcgtgtcct aagggggtga tgcggggggc cctgccgatg 3841 gatgtgtcca cagctttggg ttttagggtt tccgaatgcg aacataggta tctacaccca 3901 gacatttggc ccaagtttga aatgttctca gtccctggag ggaagggcag gcggggctgg 3961 caggagatca ggcgtctagc tctctgggcc cctccgtcgc ggccctcctg gtctctccct 4021 aggcccccgg acctccctgc tcctggcttt caccctgctc tgcctgctct ggactcaggt 4081 ggtgggcgcc ttcccagcca tgtccttgtc ccgcctgttt gccaacgctg tgctccgggc 4141 tcagcacctg catcaactgg ctgctgacac cttcaaagag tttgtaagct ccccagagat 4201 gtgtcccaga ggtggggagg caggaaggga tgaatccgca accctccaca caatgggagg 4261 gaactgagga cctcagtggt attttatcca agtaaggatg tggtcagggg agtagaaatg 4321 ggggtgtgtg gggtggggag ggttccgaat aaggcagtga ggggaaccac gcaccagctt 4381 agacctaggt gggtgtgttc tccccccagg agcgcaccta catcccggag ggacagagat 4441 actccatcca gaacacccag gttgccttct gcttctctga aaccatccca gcccccacga 4501 gcaagaatga ggcccagcag aaatcag //
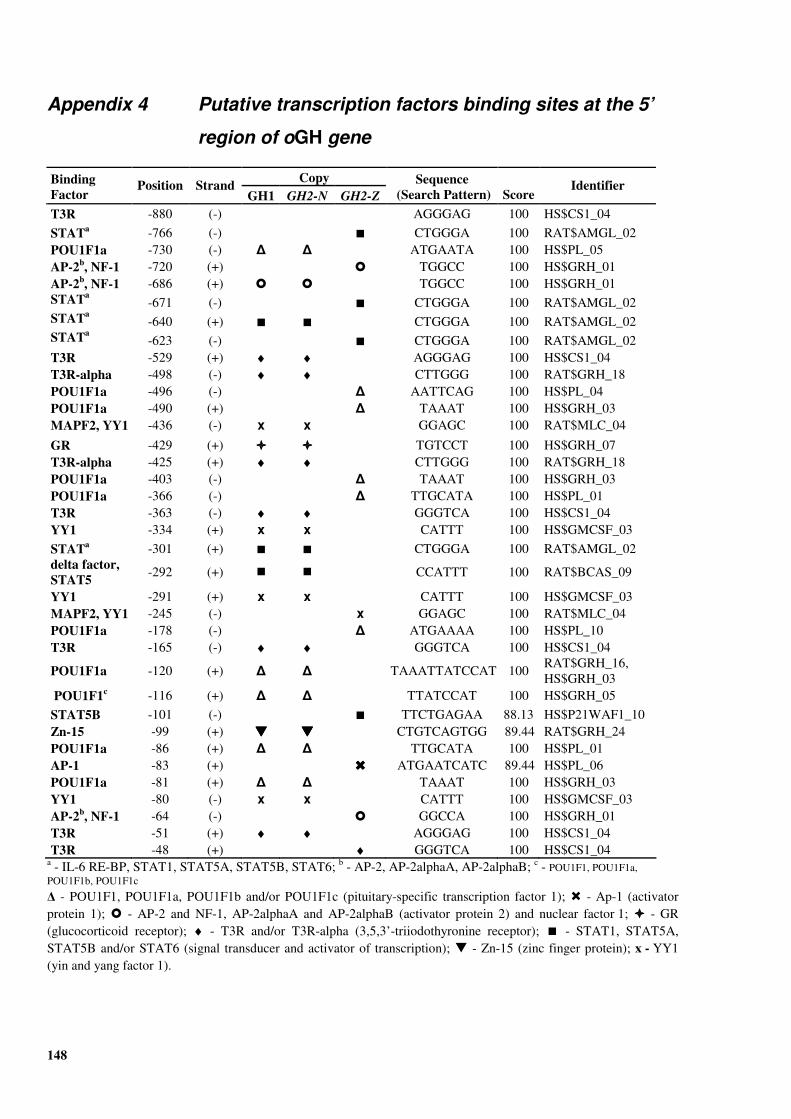
148
Appendix 4 Putative transcription factors binding sites at the 5’
region of oGH gene
Copy Binding Factor
Position Strand GH1 GH2-N GH2-Z
Sequence (Search Pattern)
Score
Identifier
T3R -880 (-) � AGGGAG 100 HS$CS1_04 STATa -766 (-) �� CTGGGA 100 RAT$AMGL_02 POU1F1a -730 (-) � � ATGAATA 100 HS$PL_05 AP-2b, NF-1 -720 (+) �� TGGCC 100 HS$GRH_01 AP-2b, NF-1 -686 (+) �� �� TGGCC 100 HS$GRH_01 STATa -671 (-) �� CTGGGA 100 RAT$AMGL_02 STATa -640 (+) �� �� CTGGGA 100 RAT$AMGL_02 STATa -623 (-) �� CTGGGA 100 RAT$AMGL_02 T3R -529 (+) ♦ ♦ AGGGAG 100 HS$CS1_04 T3R-alpha -498 (-) ♦ ♦ CTTGGG 100 RAT$GRH_18 POU1F1a -496 (-) � AATTCAG 100 HS$PL_04 POU1F1a -490 (+) � TAAAT 100 HS$GRH_03 MAPF2, YY1 -436 (-) x x GGAGC 100 RAT$MLC_04
GR -429 (+) �������� �������� TGTCCT 100 HS$GRH_07 T3R-alpha -425 (+) ♦ ♦ CTTGGG 100 RAT$GRH_18 POU1F1a -403 (-) � TAAAT 100 HS$GRH_03 POU1F1a -366 (-) � TTGCATA 100 HS$PL_01 T3R -363 (-) ♦ ♦ GGGTCA 100 HS$CS1_04 YY1 -334 (+) x x CATTT 100 HS$GMCSF_03 STATa -301 (+) �� �� CTGGGA 100 RAT$AMGL_02 delta factor, STAT5 -292 (+) �� �� CCATTT 100 RAT$BCAS_09
YY1 -291 (+) x x CATTT 100 HS$GMCSF_03 MAPF2, YY1 -245 (-) x GGAGC 100 RAT$MLC_04 POU1F1a -178 (-) � ATGAAAA 100 HS$PL_10 T3R -165 (-) ♦ ♦ GGGTCA 100 HS$CS1_04
POU1F1a -120 (+) � � TAAATTATCCAT 100 RAT$GRH_16, HS$GRH_03
POU1F1c -116 (+) � � TTATCCAT 100 HS$GRH_05 STAT5B -101 (-) �� TTCTGAGAA 88.13 HS$P21WAF1_10 Zn-15 -99 (+) �������� �������� CTGTCAGTGG 89.44 RAT$GRH_24 POU1F1a -86 (+) � � TTGCATA 100 HS$PL_01 AP-1 -83 (+) �������� ATGAATCATC 89.44 HS$PL_06 POU1F1a -81 (+) � � TAAAT 100 HS$GRH_03 YY1 -80 (-) x x CATTT 100 HS$GMCSF_03 AP-2b, NF-1 -64 (-) �� GGCCA 100 HS$GRH_01 T3R -51 (+) ♦ ♦ AGGGAG 100 HS$CS1_04 T3R -48 (+) ♦ GGGTCA 100 HS$CS1_04
a - IL-6 RE-BP, STAT1, STAT5A, STAT5B, STAT6; b - AP-2, AP-2alphaA, AP-2alphaB; c - POU1F1, POU1F1a, POU1F1b, POU1F1c
� - POU1F1, POU1F1a, POU1F1b and/or POU1F1c (pituitary-specific transcription factor 1); � - Ap-1 (activator protein 1); � - AP-2 and NF-1, AP-2alphaA and AP-2alphaB (activator protein 2) and nuclear factor 1; ���� - GR (glucocorticoid receptor); ♦ - T3R and/or T3R-alpha (3,5,3’-triiodothyronine receptor); � - STAT1, STAT5A, STAT5B and/or STAT6 (signal transducer and activator of transcription); � - Zn-15 (zinc finger protein); x - YY1 (yin and yang factor 1).