New Breed of Network Fault-Tolerant Voltage-Source-Converter HVDC Transmission System
Upload
independentCategory
view
1download
0
ARTICLE IN PRESS
0021-9290/$ - se
doi:10.1016/j.jb
�Correspond+39 011 319401
E-mail addr
Journal of Biomechanics 39 (2006) 302–311
www.elsevier.com/locate/jbiomech
www.JBiomech.com
Cross-sectional geometrical properties of distal radius and ulna inlarge, medium and toy breed dogs
Stefano Z.M. Brianzaa,�, Marco Deliseb, Maria Maddalena Ferrarisc, Patrizia D’Ameliod,Paolo Bottia
aDepartment of Animal Health, University of Parma, ItalybDepartment of Mechanics, Politecnico di Torino, Italy
cDepartment of Neuroradiology, UOA., CTO, Torino, ItalydDepartment of Internal Medicine, University of Torino, Italy
Accepted 15 November 2004
Abstract
Fractures of the distal radius and the ulna are the third most common fractures in dogs. Toy and miniature breeds have a
propensity to develop antebrachial fractures after falling or jumping. Most affect the distal third of both bones involving between
15% and 37% of the radial length. Larger dogs, instead, typically sustain hyperextension injuries to the carpus. The causative
mechanisms for this fracture prevalence in toy dogs are unknown. Breed-related changes in bone geometry and/or mineral density
have been suggested as possible etiologic factors. In a multifactorial study, the main etiological factors potentially responsible for
determining susceptibility to fractures in toy breeds are considered. The aim of this first study is to evaluate the geometric bone
features in different dog sizes. The cortical bone cross-sectional properties along the length of the right radius and the ulna of 28
dogs from three different size categories have been quantified by computerized tomographic scanning. Geometrical cross-sectional
parameters were measured and normalized to radial length to allow intergroup comparisons. Discriminant analysis was used to
classify the observations into different groups. Through statistical analysis of the normalized values, significant differences in cross-
sectional properties of different bone sizes were found. The results suggest that, when proportionally loaded, the antibrachii of toy
breed dogs are more susceptible to fracture than those of large breed dogs due to morphological differences.
r 2004 Elsevier Ltd. All rights reserved.
Keywords: Forearm fracture; Toy breed dogs; Bone geometrical properties; CT scan; Size of bone
1. Introduction
Fractures of the distal radius and the ulna are thethird most common fracture in the dog (Summer-Smithand Cawley, 1970). They represent approximatelybetween 8.5% and 17% of all fractures in dogs(Summer-Smith and Cawley, 1970; Lappin et al., 1983;Muir, 1997a). Toy and miniature breeds seem to have apropensity to develop these fractures due to minimaltrauma. In these dogs, most affect the distal third of
e front matter r 2004 Elsevier Ltd. All rights reserved.
iomech.2004.11.018
ing author. Corso Lepanto 8, 10134 Torino, Italy. Tel.:
5.
ess: [email protected] (S.Z.M. Brianza).
both bones involving from 15% to 37% of the radiallength (Muir, 1997a, b). Larger dogs typically sustainhyperextension injuries to the carpus after falling orjumping (Muir, 1997a, b). The causative mechanisms forthis fracture prevalence in toy dogs are unclear. Breed-related changes in bone geometry and/or mineral densityhave been suggested as possible etiologic factors (Muirand Markel, 1996). Geometrical parameters such ascross-sectional area (CSA), cross-sectional moments ofinertia (Iap; Iml; Ip), mean cortical thickness (mCT) andcortical thicknesses (Cmed; Clat; Cant; Cpost) affect themechanical behaviour of the bones. In previous studiesof the human forearm, geometrical parameters and bonemineral density significantly correlated with ex vivo

ARTICLE IN PRESS
Nomenclature
A bone diameter in medial-lateral directionB bone diameter in anterior-posterior direc-
tionCmed width of medial bone cortex along A
Clat width of lateral bone cortex along A
Cant width of anterior bone cortex along B
Cpost width of posterior bone cortex along B
H area of the inner ellipse (the medullarycavity) of the bone cross-section
S area of the outer ellipse of the bone cross-section
X 0;Y 0 coordinates of the cross-section’s centreof mass
X H ;Y H coordinates of the inner ellipse centreIml moment of inertia of the cross section
with respect to a medial-lateral axisIap moment of inertia of the cross section
with respect to an anterior-posterior axisIp polar moment of inertia of the cross
section with respect to the centre of massCSA cross-sectional area (outer area S�inner
area H)mCT mean cortical thicknessS=H outer/inner areas ratio
S.Z.M. Brianza et al. / Journal of Biomechanics 39 (2006) 302–311 303
failure load and with clinical stress fractures (Myerset al., 1991, 1993). In a multifactorial study, the mainetiological factors potentially responsible of determiningsusceptibility to fractures in toy breeds were considered.The aim of this first study was to evaluate the geometricbone features in different sizes of dogs to assess theirrole in susceptibility to distal antebrachial fractures.Geometrical characterization of the radius and the ulnabetween 20% and 50% of the radial distal–proximallength was performed in detail.
2. Materials and method
2.1. Experimental model
Twenty-eight right radii and ulnae were obtainedfrom dogs that had died naturally or were euthanizeddue to causes that did not interfere with the boneintegrity. There was no history of fractures, angulardeformities or lameness of the forelimbs. The boneswere collected and divided in three groups depending onthe mass of the dogs: the toy group (massp7 kg)included 17 bones, the medium group (mass 8–20 kg)included six bones, and the large group (massX21 kg)included five bones. The breeds included in the toygroup were: eight Minipoodles, two Chihuahuas, threePinschers, one Pomeranian, one Wippet, and twoYorkshires. The breeds included in the medium groupwere: one Dalmatian, one Siberian Husky, two non-purebreeds, one Pointer and one Breton. The breeds includedin the large group were: one Rottweiller, one Marem-man shepherd, one German shepherd and two Boxers.The characteristics of the three groups are shown inTable 1. The soft tissues were removed except for theinterosseous membrane, ligamentous, and capsulartissues which were preserved to maintain anatomicalalignment during the scans. The bones were thenwrapped in saline-soaked towels and frozen at �20 1C
until the measurements were taken. The bones weredefrosted at room temperature and were kept moist withsaline solution during evaluation.
2.2. X-ray computed tomography (CT)
The radii and ulnae, anatomically attached, wereanalysed by X-ray CT using standard software. Themachine was calibrated to the manufacturer’s instruc-tions. Machine (GE lightspeed plus, Wisconsin, USA)settings were 140 kV, 40mA, with time set at 1.4 s. Slicethickness was set to 1.25mm and interscan thicknesswas set to 1.25mm. Each forearm was positioned withthe mechanical axis of the radius parallel to the directionof the scan and perpendicular to the rays. Image matrixsize was 512� 512 pixels and with a field of view of12.0� 12.0 cm. Images were saved in JPEG andDICOM format.
2.3. Calculation of the geometrical properties
The length of each radius was calculated as thenumber of slices necessary to scan the entire bonemultiplied by the interscan thickness. The radial andulnar cross-sections were idealized as elliptical rings,with or without an eccentric hole depending on thepresence of the medullar cavity (Fig. 1). Measurementswere performed on a Pentium 4.2, 8GHz, computerusing the UTHSCSA ImageTool program (developed byWillcox and coll. at the University of Texas, HealthScience Center at San Antonio, TX and available fromthe Internet by anonymous FTP from maxrad6.uthsc-sa.edu).
The region from 20% to 50% of the distal–proximalradial length was investigated. For each cross-section ofradius and ulna included in this region (Fig. 2), a seriesof measurements were manually digitized on a JPEGimage carefully matched with the original CT DICOMimage: A; B; Cmed; Clat; Cant; Cpost (Fig. 1 and
ARTICLE IN PRESS
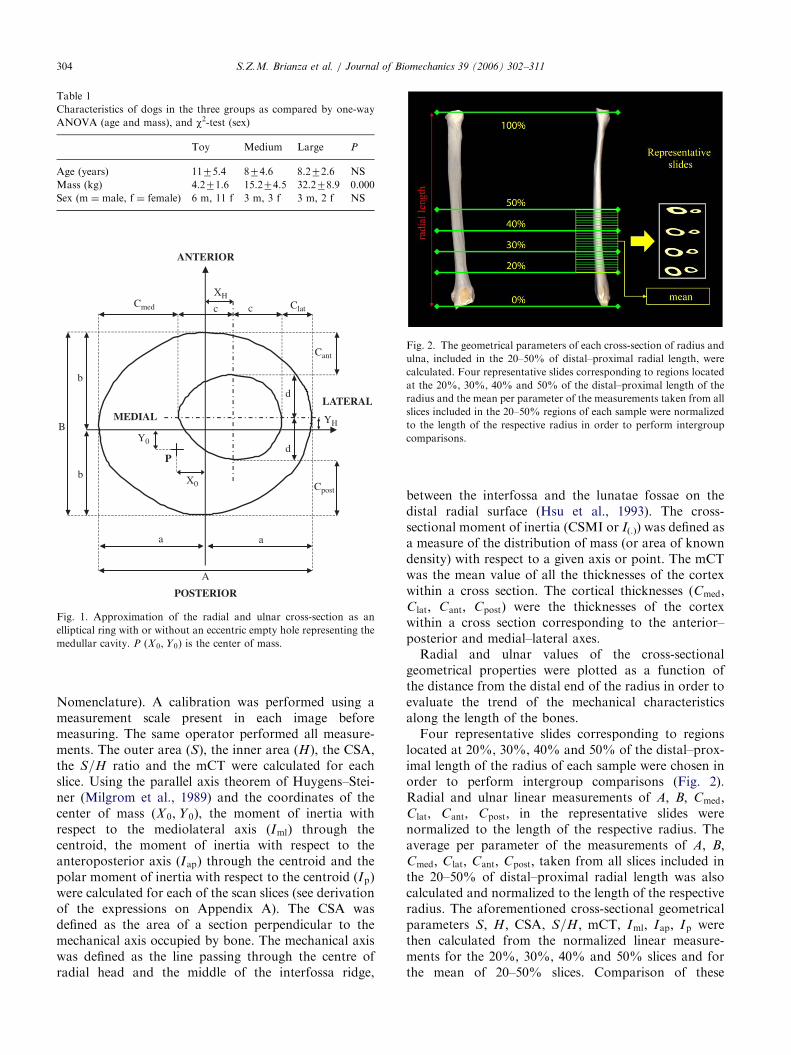
Table 1
Characteristics of dogs in the three groups as compared by one-way
ANOVA (age and mass), and w2-test (sex)
Toy Medium Large P
Age (years) 1175.4 874.6 8.272.6 NS
Mass (kg) 4.271.6 15.274.5 32.278.9 0.000
Sex (m ¼ male, f ¼ female) 6 m, 11 f 3 m, 3 f 3 m, 2 f NS
a a
b
b
Cmed c
POSTERIOR
MEDIAL
ANTERIOR
LATERAL
A
B Y0
X0
c
XH
YH
Clat
d
Cant
Cpost
P
d
Fig. 1. Approximation of the radial and ulnar cross-section as an
elliptical ring with or without an eccentric empty hole representing the
medullar cavity. P (X 0;Y 0) is the center of mass.
Fig. 2. The geometrical parameters of each cross-section of radius and
ulna, included in the 20–50% of distal–proximal radial length, were
calculated. Four representative slides corresponding to regions located
at the 20%, 30%, 40% and 50% of the distal–proximal length of the
radius and the mean per parameter of the measurements taken from all
slices included in the 20–50% regions of each sample were normalized
to the length of the respective radius in order to perform intergroup
comparisons.
S.Z.M. Brianza et al. / Journal of Biomechanics 39 (2006) 302–311304
Nomenclature). A calibration was performed using ameasurement scale present in each image beforemeasuring. The same operator performed all measure-ments. The outer area (S), the inner area (H), the CSA,the S=H ratio and the mCT were calculated for eachslice. Using the parallel axis theorem of Huygens–Stei-ner (Milgrom et al., 1989) and the coordinates of thecenter of mass (X 0;Y 0), the moment of inertia withrespect to the mediolateral axis (Iml) through thecentroid, the moment of inertia with respect to theanteroposterior axis (Iap) through the centroid and thepolar moment of inertia with respect to the centroid (Ip)were calculated for each of the scan slices (see derivationof the expressions on Appendix A). The CSA wasdefined as the area of a section perpendicular to themechanical axis occupied by bone. The mechanical axiswas defined as the line passing through the centre ofradial head and the middle of the interfossa ridge,
between the interfossa and the lunatae fossae on thedistal radial surface (Hsu et al., 1993). The cross-sectional moment of inertia (CSMI or I(.)) was defined asa measure of the distribution of mass (or area of knowndensity) with respect to a given axis or point. The mCTwas the mean value of all the thicknesses of the cortexwithin a cross section. The cortical thicknesses (Cmed;Clat; Cant; Cpost) were the thicknesses of the cortexwithin a cross section corresponding to the anterior–posterior and medial–lateral axes.
Radial and ulnar values of the cross-sectionalgeometrical properties were plotted as a function ofthe distance from the distal end of the radius in order toevaluate the trend of the mechanical characteristicsalong the length of the bones.
Four representative slides corresponding to regionslocated at 20%, 30%, 40% and 50% of the distal–prox-imal length of the radius of each sample were chosen inorder to perform intergroup comparisons (Fig. 2).Radial and ulnar linear measurements of A; B; Cmed;Clat; Cant; Cpost; in the representative slides werenormalized to the length of the respective radius. Theaverage per parameter of the measurements of A; B;Cmed; Clat; Cant; Cpost; taken from all slices included inthe 20–50% of distal–proximal radial length was alsocalculated and normalized to the length of the respectiveradius. The aforementioned cross-sectional geometricalparameters S; H ; CSA, S=H; mCT, Iml; Iap; Ip werethen calculated from the normalized linear measure-ments for the 20%, 30%, 40% and 50% slices and forthe mean of 20–50% slices. Comparison of these

ARTICLE IN PRESSS.Z.M. Brianza et al. / Journal of Biomechanics 39 (2006) 302–311 305
parameters between groups was performed using thesenormalized values.
2.4. Data analysis
Statistics were calculated with the Minitab Release13.20 statistical software. Radial and ulnar geometricalparameters were plotted as a function of the distancefrom the distal end of the radius and their trend wasevaluated. One-way analyses of variance were used tocompare the three groups for age and mass, while sexdistribution was compared by w2-test. The dimensionalvalues of each parameter inquired at 20%, 30%, 40%,50% of radial length were used to calculate the averageper group at each slice level (Tables 2 and 3). Theirnormalized values were used to perform intergroupcomparisons. To determine if differences betweengroups could be identified by the normalized cross-sectional geometrical parameters, multivariate discrimi-nant analysis was performed. Separate analyses wereperformed for each representative region and for themean calculations of the radius and ulna. The grouppredictors for the radius and ulna were: A; B; Cmed; Clat;Cant; Cpost; S; H; Iap; Iml; mCT, CSA. The grouppredictors for the radius also included S=H: Thisvariable was excluded from the ulnar analyses due tothe recurrent absence of a medullary cavity in the ulnas
Table 2
Radial mean values per group in the four regions: 20%, 30%, 40% and 50%
Radius Cmed Clat Cant Cpost S H
20% Toy Mean 2.78 2.91 2.11 1.97 34.93 2.8
SD 0.50 0.45 0.26 0.17 9.10 1.4
Medium Mean 2.79 2.98 2.49 2.35 115.05 37.0
SD 1.03 0.65 0.58 0.50 20.94 19.1
Large Mean 3.19 3.26 2.70 2.32 177.78 70.7
SD 1.19 0.41 0.65 0.40 31.95 30.0
30% Toy Mean 2.59 2.84 2.00 1.89 32.50 2.8
SD 0.45 0.57 0.07 0.15 9.71 2.0
Medium Mean 2.82 2.74 2.46 2.27 107.12 34.1
SD 0.62 0.26 0.16 0.22 14.50 10.7
Large Mean 3.30 3.58 2.88 2.61 158.58 52.8
SD 0.91 0.79 0.61 0.56 32.40 26.4
40% Toy Mean 2.70 2.62 1.90 1.89 32.29 3.2
SD 0.52 0.39 0.31 0.17 12.18 3.0
Medium Mean 3.10 2.85 2.20 2.19 104.13 33.5
SD 0.84 0.38 0.34 0.45 15.08 16.5
Large Mean 3.56 3.32 2.82 2.47 158.97 54.0
SD 0.73 0.49 0.45 0.55 34.51 22.9
50% Toy Mean 2.63 2.58 1.92 1.78 31.51 3.1
SD 0.58 0.43 0.26 0.17 11.68 2.7
Medium Mean 3.36 2.90 2.26 2.39 101.37 28.8
SD 0.86 0.48 0.48 0.35 7.23 12.6
Large Mean 3.97 3.54 2.85 2.57 157.40 49.0
SD 0.72 0.60 0.67 0.67 29.11 21.6
Cortices are expressed in mm; S ¼ outer area (mm2); H ¼ inner area or me
polar moments of inertia (mm4). S=H ¼ outer/inner areas ratio.
toy breeds. A separate ANOVA for each parameter ateach location was run. All the normalized parameterswere statistically analysed to show which geometricalproperties were significantly different among groups inthe radius and the ulna at 20%, 30%, 40% and 50% ofthe radial length and in their 20–50% average. Aparametric analysis was performed accounting forunequal sample size. Statistical tests were performedwith the significance set at pp0:05:
3. Results
No significant differences were found when the groupswere compared for sex and age (Table 1). Tables 2 and 3display the mean dimensional values per group for eachparameter investigated. Plotting the dimensional valuesof the parameters investigated showed no significantdiscontinuity in any graph (Fig. 3). The plots presentedprofiles consistent with the anatomical characteristics ofeach bone and had similar patterns in all the samples.The trends display continuity in the mechanical proper-ties of the bones along their length for all three groups ofdogs such that no areas of stress concentration wereindicated.
Depending on the region considered multivariatediscriminant analysis correctly identified the dog size
of distal–proximal radial length
Iml Iap Ip mCT CSA S=H
6 65.53 164.82 230.35 1.97 32.07 14.54
4 30.15 94.36 123.16 0.20 7.84 6.33
3 794.99 1391.70 2186.69 2.43 77.01 3.84
7 347.20 567.57 914.57 0.43 15.28 2.21
1 1439.49 3117.55 4557.04 2.66 107.07 2.97
5 448.70 906.83 1352.81 0.50 14.69 1.48
2 56.24 148.25 204.49 1.89 29.69 16.01
4 28.23 104.99 131.94 0.14 7.69 8.64
0 679.56 1211.77 1891.32 2.38 72.22 3.27
4 297.08 306.50 594.37 0.14 5.52 0.53
1 1236.82 2605.21 3842.04 2.86 105.78 3.86
8 446.96 942.29 1377.63 0.50 15.91 2.46
4 59.27 146.50 205.77 1.86 29.05 18.53
0 39.64 118.31 156.89 0.21 9.30 16.60
3 621.20 1168.18 1789.38 2.34 69.94 3.48
1 295.16 338.43 631.10 0.34 7.56 1.02
8 1290.26 2562.40 3852.66 2.90 104.89 3.35
2 555.70 949.08 1494.64 0.42 17.93 1.45
2 54.21 144.48 198.69 1.82 28.39 18.36
3 37.70 109.45 146.96 0.24 9.22 18.10
2 566.15 1169.27 1735.42 2.41 71.28 3.86
8 200.25 223.42 407.32 0.33 7.19 0.99
5 1231.26 2628.76 3860.02 2.94 108.35 3.74
3 452.00 799.23 1232.95 0.48 16.22 1.78
dullary cavity (mm2); Iml; Iap; Ip ¼ mediolateral, anteroposterior and

ARTICLE IN PRESS
Table 3
Ulnar mean values per group in the four regions: 20%, 30%, 40% and 50% of distal–proximal radial length
ULNA Cmed Clat Cant Cpost S H Iml Iap Ip mCT CSA
20% Toy Mean 1.87 2.00 1.86 1.80 14.17 0.39 18.03 18.50 36.53 1.41 13.78
SD 0.50 0.43 0.23 0.19 4.46 0.60 10.90 9.41 18.49 0.22 4.12
Medium Mean 1.59 1.97 1.80 1.76 37.88 9.46 126.46 120.94 247.41 1.65 28.42
SD 0.42 0.36 0.50 0.34 9.53 7.03 63.38 62.70 125.14 0.27 6.21
Large Mean 1.52 2.12 1.48 1.85 59.85 22.48 235.13 247.85 482.98 1.68 37.37
SD 0.35 0.44 0.46 0.46 7.64 9.34 56.00 42.52 91.01 0.30 4.13
30% Toy Mean 1.84 1.82 1.69 1.74 13.08 0.40 14.46 16.53 30.99 1.36 12.68
SD 0.24 0.18 0.22 0.25 4.45 0.58 9.42 9.09 18.46 0.20 3.98
Medium Mean 2.18 2.09 2.03 2.13 36.66 5.67 125.26 119.39 244.65 1.87 30.98
SD 0.36 0.30 0.32 0.30 9.63 2.88 63.68 72.06 130.30 0.18 7.06
Large Mean 2.00 2.05 1.82 2.22 54.48 14.89 211.25 227.19 438.44 1.90 39.60
SD 0.53 0.34 0.36 0.56 4.34 5.54 38.63 37.01 70.95 0.32 5.64
40% Toy Mean 1.88 1.92 1.70 1.70 14.56 0.57 18.04 21.57 39.61 1.41 13.99
SD 0.30 0.12 0.26 0.26 5.77 0.80 14.75 14.98 29.72 0.23 5.02
Medium Mean 2.24 2.21 2.19 1.96 44.07 8.19 168.75 182.88 351.63 1.94 35.89
SD 0.54 0.25 0.48 0.23 10.56 3.52 91.47 95.20 179.98 0.19 7.66
Large Mean 2.23 2.07 2.29 2.36 69.99 19.86 344.18 386.75 730.93 2.12 50.13
SD 0.61 0.36 0.40 0.44 12.59 9.00 80.52 162.81 241.05 0.35 8.84
50% Toy Mean 2.16 2.02 1.84 1.77 17.13 0.84 24.85 31.15 56.00 1.50 16.29
SD 0.26 0.20 0.28 0.25 7.39 1.06 24.02 22.09 45.87 0.26 6.36
Medium Mean 2.51 2.12 2.16 1.87 54.29 13.18 226.40 293.51 519.91 1.94 41.11
SD 0.54 0.39 0.39 0.59 11.37 4.48 114.13 143.99 223.58 0.30 8.87
Large Mean 2.90 2.33 2.50 2.23 94.00 28.92 546.01 764.07 1310.09 2.36 65.08
SD 0.60 0.28 0.43 0.27 18.49 13.83 138.49 326.35 453.68 0.28 7.35
Cortices are expressed in mm; S ¼ outer area (mm2); H ¼ inner area or medullary cavity (mm2); Iml; Iap; Ip ¼ mediolateral, anteroposterior and
polar moments of inertia (mm4). S=H ¼ outer/inner areas ratio.
S.Z.M. Brianza et al. / Journal of Biomechanics 39 (2006) 302–311306
from 77.8% to 92.6% of the samples in the radius andfrom 85.2% to 96.3% of samples in the ulna. Thenormalized geometric parameters investigated weregood predictors for classifying the observations intothree different groups (Table 4).
One-way analysis of variances of the normalizedvalues between the three groups showed significantdifferences in bone geometry (Tables 5 and 6). Thewidth of the four cortices Cmed; Clat; Cant; Cpost wassignificantly thicker in the toy group in every regioninvestigated except for the radial Cpost in the 50%region. In this group, the mCT was higher in the averagevalue (p ¼ 0:020), in the 30% (p ¼ 0:015) and the 40%(p ¼ 0:011) regions of the radius and in the 20%(p ¼ 0:012) and the 30% (p ¼ 0:044) regions of theulna. The toy group’s radial outer area (S) was alwayssignificantly smaller, except for the one located at 30%.In the ulna, only the mean outer area was significantlysmaller for the toy group (p ¼ 0:048). Toy group’s radialand ulnar inner areas (H) were significantly smaller thanthose of the other groups. While CSA was notsignificantly different in any of the radial or ulnarregions investigated, the radial outer/inner area ratio(S=H) was significantly higher in the toy group. Sincethe medullary cavity was absent in the ulna for some ofthe toy specimens, the S=H ratio was not evaluated for
this bone. In those regions where radial and ulnarmoments of inertia (Iml; Iap and Ip) were significantlydifferent, the toy group had significantly lower values.
4. Discussion
Differences in bone geometric and densitometricfeatures in different size of dogs have been suggestedas possible etiologic factors for distal antebrachialfractures in toy breeds (Muir and Markel, 1996; Muir,1997a, b). Bone geometry and bone mineral density arewell-recognized as important predictors of bone me-chanical properties (Augat et al., 1996; Einhorn, 1992;Louis et al., 1995; Muir and Markel, 1996; Myers et al.,1993; Hsu et al., 1993; Van Der Meulen et al., 2001). Inorder to evaluate the independent effects of geometry onthe mechanical behaviour of bones, a constant bonemineral density by area of 1mg/mm2 was used across allgroups. CT scans offer the opportunity to evaluate thecourse of different cross-sectional geometrical para-meters along a bone major axis.
Distal antebrachial fractures usually occur in a regionmostly composed of cortical bone. In order to avoid theradial and ulnar epiphyses, which are characterized bycancellous bone, we chose to investigate the region from

ARTICLE IN PRESS
0
500
1000
1500
2000
20 22 25 27 29 32 34 36 39 41 43 46 48 50
1.0
1.5
2.0
2.5
3.0
3.5
20 22 25 27 29 32 34 36 39 41 43 46 48 50
50
55
60
65
70
75
80
20 22 25 27 29 32 34 36 39 41 43 46 48 50
0
200
400
600
800
1000
20 22 25 27 29 32 34 36 39 41 43 46 48 50
0.0
0.5
1.0
1.5
2.0
2.5
3.0
20 22 25 27 29 32 34 36 39 41 43 46 48 50
20
30
40
50
60
20 22 25 27 29 32 34 36 39 41 43 46 48 50
0
100
200
300
400
19 22 25 27 30 32 35 38 40 43 45 48 51
1.0
1.5
2.0
2.5
3.0
3.5
19 22 25 27 30 32 35 38 40 43 45 48 51
20
25
30
35
40
45
50
19 22 25 27 30 32 35 38 40 43 45 48 51
0
10
20
30
40
50
19 22 25 27 30 32 35 38 40 43 45 48 51
0.0
0.5
1.0
1.5
2.0
2.5
3.0
19 22 25 27 30 32 35 38 40 43 45 48 51
0
5
10
15
20
19 22 25 27 30 32 35 38 40 43 45 48 51
010002000300040005000600070008000
20 22 24 26 28 29 31 33 35 37 39 41 42 44 46 48 50
1.0
1.5
2.0
2.5
3.0
3.5
20 22 24 26 28 29 31 33 35 37 39 41 42 44 46 48 50
80
90
100
110
120
130
20 22 24 26 28 29 31 33 35 37 39 41 42 44 46 48 50
0
500
1000
1500
2000
20 22 24 26 28 29 31 33 35 37 39 41 42 44 46 48 50
0.0
0.5
1.0
1.5
2.0
2.5
3.0
20 22 24 26 28 29 31 33 35 37 39 41 42 44 46 48 50
20
30
40
50
60
70
80
20 22 24 26 28 29 31 33 35 37 39 41 42 44 46 48 50
Radial moments of inertia (mm4) - Toy Radial moments of inertia (mm4) - Medium Radial moments of inertia (mm4) - Large
Mean radial cortical thickness (mm) -Toy Mean radial cortical thickness (mm) - Medium Mean radial cortical thickness (mm)-Large
Radial cross sectional area (mm2) - Toy Radial cross sectional area (mm2) - Medium Radial cross sectional area (mm2) -Large
Ulnar moments of inertia (mm4) -Toy Ulnar moments of inertia (mm4) - Medium Ulnar moments of inertia (mm4) - Large
Mean ulnar cortical thickness (mm)-Toy Mean ulnar cortical thickness (mm) - Medium Mean ulnar cortical thickness (mm) - Large
Ulnar cross sectional area (mm2) - Toy Ulnar cross sectional area (mm2) - Medium Ulnar cross sectional area (mm2) - Large
Fig. 3. Patterns of radial and ulnar moments of inertia, mean cortical thickness and cross-sectional area in a sample per group: a Minipoodles, a
Dalmatian and a German shepherd dog. Parameters are plotted as a function of the percent distance from the distal end of the radius. Polar moment
of inertia (Ip): thick line; anterior–posterior moment of inertia (Iap): thin line; medial–lateral moment of inertia (Iml): interrupted line.
S.Z.M. Brianza et al. / Journal of Biomechanics 39 (2006) 302–311 307
20% to 50% of the distal–proximal radial length.Antebrachial fractures in toy breeds are often atransverse, short oblique, or single butterfly pattern,configurations that suggest a combination of compres-sive and bending stresses (Muir and Markel, 1996).Amongst different parameters used to underline geome-trical differences, we chose to investigate cross sectionalarea and moments of inertia, because these parameters
are directly implicated in the behaviour of a boneexposed to compressive load and axial bending ortorquing. The general trends of the plots of theparameters investigated in the canine radius were foundto be comparable with the findings of a previous study inthe same region of the human radius (Hsu et al., 1993).The absence of significant discontinuity as indicated bythe general trends of the plots in Fig. 3, suggest a

ARTICLE IN PRESS
Table 4
Linear discriminant analysis: proportion correct in the four representative regions and for the 20–50% mean
Proportion correct 20% 30% 40% 50% Mean
Radius 0.926 0.778 0.889 0.926 0.926
Ulna 0.963 0.926 0.963 0.852 0.889
Discriminant function for radius and ulna, except S=H in ulna, was: Group ¼ A+B+Cmed+Clat+Cant+Cpost+S+H+Iap+Iml+mCT+
CSA+S/H.
Table 5
Radius: p-value of the significance of the ANOVA per group
Radius Cmed Clat Cant Cpost S H Iml Iap Ip mCT CSA S=H
Mean 0.003 0.000 0.015 0.005 0.004 0.000 0.001 0.038 0.040 0.020 0.641 0.001
20% 0.050 0.005 0.044 0.035 0.004 0.000 0.001 0.001 0.001 0.065 0.189 0.010
30% 0.002 0.001 0.015 0.008 0.058 0.000 0.034 0.066 0.070 0.015 0.638 0.001
40% 0.005 0.004 0.003 0.019 0.033 0.000 0.099 0.063 0.057 0.011 0.649 0.014
50% 0.016 0.007 0.025 0.052 0.003 0.000 0.009 0.037 0.019 0.152 0.435 0.032
Dimensional values were normalized to the radial length. Intergroup comparisons were performed in the four regions located at the 20%, 30%, 40%
and 50% of distal-proximal radial length and for the 20–50% normalized mean value.
Table 6
Ulna: p-value of the significance of the ANOVA per group
Ulna Cmed Clat Cant Cpost S H Iml Iap Ip mCT CSA
Mean 0.004 0.001 0.004 0.001 0.048 0.000 0.010 0.192 0.097 0.058 0.767
20% 0.001 0.002 0.001 0.001 0.227 0.000 0.614 0.136 0.587 0.012 0.230
30% 0.000 0.002 0.002 0.002 0.230 0.000 0.255 0.449 0.352 0.044 0.888
40% 0.008 0.000 0.034 0.005 0.059 0.000 0.014 0.028 0.017 0.146 0.688
50% 0.002 0.000 0.023 0.004 0.090 0.000 0.342 0.191 0.241 0.057 0.272
Dimensional values were normalized to the radial length. Intergroup comparisons were performed in the four regions located at the 20%, 30%, 40%
and 50% of distal–proximal radial length and for the 20–50% normalized mean value.
S.Z.M. Brianza et al. / Journal of Biomechanics 39 (2006) 302–311308
decreased risk of failure due to stress concentration.This data will support the assumption in future studiesinvolving mechanical testing that fracture locations arenot due to significant changes in morphology along thelength of the bone.
Discriminant analysis revealed that the normalizedgeometric parameters investigated were able to accuratelyidentify a bone originating from a toy, a medium or alarge group dog. Their bones have geometrical differencesthat allow classifying them into different groups.
The ANOVAs between the three groups confirmedthat smaller bones were not an exact reduction of largerbones (Fig. 4), highlighting which parameters weresignificantly different and allowing mechanical specula-tions. For example, considering similarly normalizedloading, the significantly lower values of toy moments ofinertia expose this breed to higher local stresses andeventual failure at lower peak loads. This can beexplained considering that stresses developed applyinga moment (M(.)) are determined by the general formula :s ¼M ð:Þy=I ð:Þ(MPa), where M(.) is the moment that
bends or torques the bone; y is the distance of theconsidered fibre from the axis of bending or torquing;I(.) is the moment of inertia of the section with respect tothat axis. According to this formula, for a given load,the smaller is the I(.), the larger are the stresses developedon the considered fibre.
The smaller dogs’ bone geometry has a disadvanta-geous arrangement with respect to larger dogs’: its CSAis settled closer to the centroid. Considering disjointedlythe two bones this carry that smaller dogs’ areadequately arranged to compressive loads but they areless competent for axial bending or torquing.
The geometrical differences highlighted suggest a firsthypothesis on genetic and environmental factors.Skeletal tissues in general, and bone in particular, areable to respond to functional influences in a manner thatleads to an optimal design for the prevailing functionalrequirement (Goodship and Cunningham, 2001).The architecture of bone from tissue level to that ofthe organ and system arises from two major inputfactors: inherited genetic information that accounts for
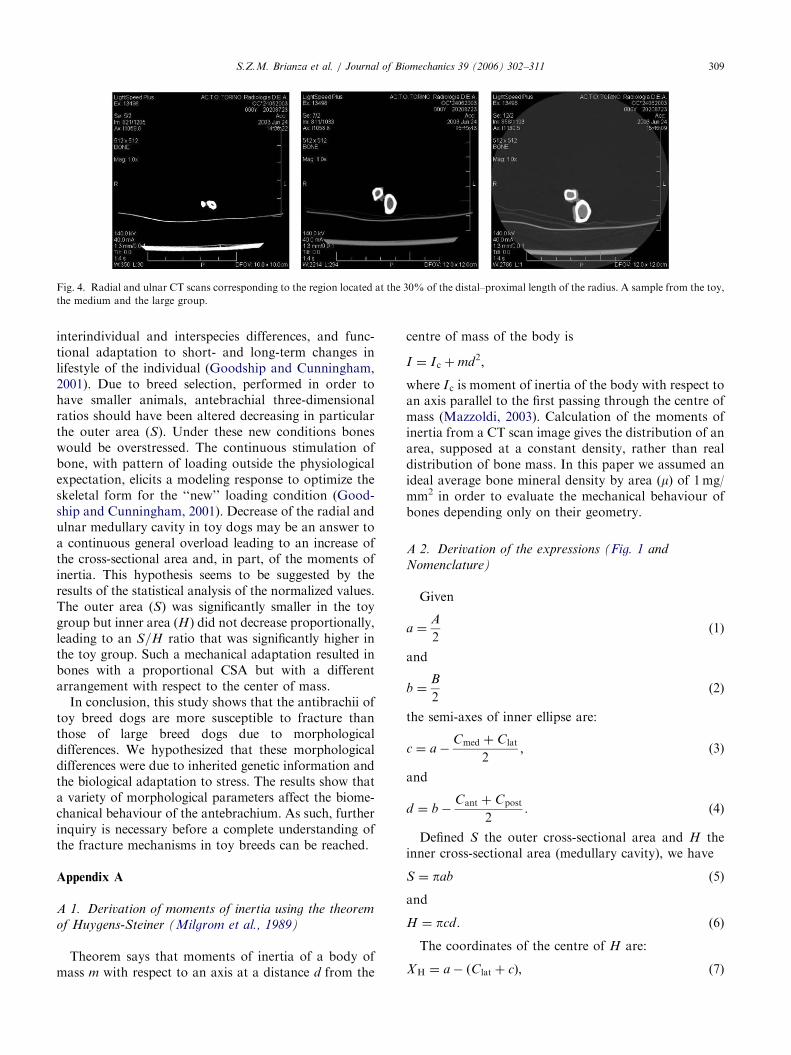
ARTICLE IN PRESS
Fig. 4. Radial and ulnar CT scans corresponding to the region located at the 30% of the distal–proximal length of the radius. A sample from the toy,
the medium and the large group.
S.Z.M. Brianza et al. / Journal of Biomechanics 39 (2006) 302–311 309
interindividual and interspecies differences, and func-tional adaptation to short- and long-term changes inlifestyle of the individual (Goodship and Cunningham,2001). Due to breed selection, performed in order tohave smaller animals, antebrachial three-dimensionalratios should have been altered decreasing in particularthe outer area (S). Under these new conditions boneswould be overstressed. The continuous stimulation ofbone, with pattern of loading outside the physiologicalexpectation, elicits a modeling response to optimize theskeletal form for the ‘‘new’’ loading condition (Good-ship and Cunningham, 2001). Decrease of the radial andulnar medullary cavity in toy dogs may be an answer toa continuous general overload leading to an increase ofthe cross-sectional area and, in part, of the moments ofinertia. This hypothesis seems to be suggested by theresults of the statistical analysis of the normalized values.The outer area (S) was significantly smaller in the toygroup but inner area (H) did not decrease proportionally,leading to an S=H ratio that was significantly higher inthe toy group. Such a mechanical adaptation resulted inbones with a proportional CSA but with a differentarrangement with respect to the center of mass.
In conclusion, this study shows that the antibrachii oftoy breed dogs are more susceptible to fracture thanthose of large breed dogs due to morphologicaldifferences. We hypothesized that these morphologicaldifferences were due to inherited genetic information andthe biological adaptation to stress. The results show thata variety of morphological parameters affect the biome-chanical behaviour of the antebrachium. As such, furtherinquiry is necessary before a complete understanding ofthe fracture mechanisms in toy breeds can be reached.
Appendix A
A 1. Derivation of moments of inertia using the theorem
of Huygens-Steiner (Milgrom et al., 1989)
Theorem says that moments of inertia of a body ofmass m with respect to an axis at a distance d from the
centre of mass of the body is
I ¼ I c þmd2;
where I c is moment of inertia of the body with respect toan axis parallel to the first passing through the centre ofmass (Mazzoldi, 2003). Calculation of the moments ofinertia from a CT scan image gives the distribution of anarea, supposed at a constant density, rather than realdistribution of bone mass. In this paper we assumed anideal average bone mineral density by area (m) of 1mg/mm2 in order to evaluate the mechanical behaviour ofbones depending only on their geometry.
A 2. Derivation of the expressions (Fig. 1 and
Nomenclature)
Given
a ¼A
2(1)
and
b ¼B
2(2)
the semi-axes of inner ellipse are:
c ¼ a�Cmed þ Clat
2; (3)
and
d ¼ b�Cant þ Cpost
2: (4)
Defined S the outer cross-sectional area and H theinner cross-sectional area (medullary cavity), we have
S ¼ pab (5)
and
H ¼ pcd : (6)
The coordinates of the centre of H are:
XH ¼ a� ðClat þ cÞ; (7)

ARTICLE IN PRESSS.Z.M. Brianza et al. / Journal of Biomechanics 39 (2006) 302–311310
YH ¼ b� ðCant þ dÞ; (8)
The cortical area is:ZD
dD ¼
ZS
dD�
ZH
dD ¼ ðS �HÞ (9)
and the coordinates of centre of mass are:
X 0 ¼1
ðS �HÞ
ZD
xdxdy
¼1
ðS �HÞ
ZS
xdxdy�
ZH
xdxdy
24
35; ð10Þ
Y 0 ¼1
ðS �HÞ
ZD
ydxdy
¼1
ðS �HÞ
ZS
ydxdy�
ZH
ydxdy
24
35; ð11Þ
butZS
xdxdy ¼ 0 (12)
andZS
y dxdy ¼ 0 (13)
because of the symmetries.The non-vanishing integrals are:
�
ZH
xdxdy ¼ X H
ZH
dxdy ¼ X HH (14)
and
�
ZH
ydxdy ¼ X H
ZH
dy xy ¼ Y HH : (15)
Taking into account Eqs. (7), (8) and (14) and (15),Eqs. (10) and (11) take the form:
X 0 ¼1
ðS �HÞð�HX H Þ
¼ �HX H
S �H
¼ �H
S �H½a� ðClat þ cÞ�; ð16Þ
Y 0 ¼1
ðS �HÞð�HY H Þ
¼ �HX H
S �H
¼ �H
S �H½b� ðCant þ dÞ�: ð17Þ
Considering the outer ellipse S only, the moment ofinertia with respect to the mediolateral axis is:
Ix ¼ mZZ
S
y2 dxdy ¼ mZb
�b
y2 dy
Zaffiffiffiffiffiffiffiffiffiffiffiffiffi1�y2=b2p
�affiffiffiffiffiffiffiffiffiffiffiffiffi1�y2=b2p
dx
¼ 4mZb
0
y2 dy
Zaffiffiffiffiffiffiffiffiffiffiffiffiffi1�y2=b2p
0
dx
¼ 4ma
Zb
0
y2
ffiffiffiffiffiffiffiffiffiffiffiffiffi1�
y2
b2
sdy
¼1
4mpab3: ð18Þ
The moment of inertia with respect to an axis, parallelto the previous one, passing through the center of mass(X 0;Y 0) can be easily found by means of the Huygens–Steiner theorem:
IrxðX 0;Y 0Þ ¼ Ix � mðpabÞY 20
¼1
4mðabpÞb2
� mðpabÞY 20
¼ mðabpÞb2
4þ Y 2
0
� �: ð19Þ
Applying the same concepts to the inner ellipse andsubtracting its contribution to the IrxðX 0;Y 0Þ we have:
IML ¼ pabb2
4þ Y 2
0
� �� pcd
d2
4þ ðY H � Y 0Þ
2
� �: (20)
Applying the same processes with respect to an axisparallel to the anteroposterior axis, passing through thecenter of mass ðX 0;Y 0Þ we have:
IAP ¼ paba2
4þ X 2
0
� �� pcd
c2
4þ ðX H � X 0Þ
2
� �: (21)
The polar moment of inertia with respect to the centreof mass ðX 0;Y 0Þ is the sum of the moment of inertiawith respect to ML axis and the moment of inertia withrespect to AP axis:
Ip ¼ IML þ IAP: (22)
mCT can be calculated as follows:
mCT ¼1
2p
ffiffiffiffiffiffiffiffiffiffiffiffiffiffiffiðCSAÞ3
Ip
s: (23)
References
Augat, P., Reeb, H., Claes, L.E., 1996. Prediction of fracture load at
different skeletal sites by geometric properties of the cortical shell.
Journal of Bone and Mineral Research 13 (9), 1356–1363.
Einhorn, T.A., 1992. Bone strength: the bottom line. Calcified Tissue
International 51, 333–339 Editorial.
ARTICLE IN PRESSS.Z.M. Brianza et al. / Journal of Biomechanics 39 (2006) 302–311 311
Goodship, A.E., Cunningham, J.L., 2001. In: Cowin, S.C. (Ed.),
Pathophysiology of functional adaptation of bone in remodelling
and repair in vivo. Bone Mechanics Handbook, CRC Press, Boca
Raton, FL (Chapter 26, page 17).
Hsu, E.S., Patwardhan, A.G., Meade, K.P., Light, T.R., Martin, R.M.,
1993. Cross-sectional geometrical properties and bone mineral contents
of the human radius and ulna. Journal of Biomechanics 26, 1307–1318.
Lappin, M.R., Aron, D.N., Herron, H.L., Malnati, G., 1983.
Fractures of the radius and ulna in the dog. Journal of the
American Animal Hospital Association 19, 643–650.
Louis, O., Boulpaep, F., Willnecker, J., Van den Winkel, P., Osteaux,
M., 1995. Cortical mineral content of the radius assessed by
peripheral QCT predicts compressive strength on biomechanical
testing. Bone 16 (3), 375–379.
Mazzoldi, P., Nigro, M., Voci, C., 2003. Dinamica Del Corpo Rigido.
In: EdiSES (Ed.), Elementi Di Fisica: Meccanica-Termodinamica.
EdiSES, Napoli, pp. 126–127.
Milgrom, C., Giladi, M., Simkin, A., et al., 1989. The area moment of
inertia of the tibia: a risk factor for stress fractures. Journal of
Biomechanics 22, 1243–1248.
Muir, P., 1997a. Distal antebrachial fracture in toy-breed dogs.
Compendium Continuing Education for the Practicing Veterinar-
ian 19 (2), 137–145.
Muir, P., 1997b. Distal antebrachial fracture in toy breeds of dogs.
Veterinary Surgery 26, 254–255.
Muir, P., Markel, M., 1996. Geometric variables and bone mineral
density as potential predictors for mechanical properties of the
radius of Greyhounds. AJVR 57, 1094–1097.
Myers, E.R., Sebeny, E.A., Hecker, A.T., Corcoran, T.A., Hipp, J.A.,
Greenspan, S.L., Hayes, W.C., 1991. Correlations between photon
absorption properties and failure load of the distal radius in vitro.
Calcified Tissue International 49, 292–297.
Myers, E.R., Hecker, A.T., Rooks, D.S., et al., 1993. Geometric
variables from DXA of the radius predict forearm fracture load in
vitro. Calcified Tissue International 52, 199–204.
Summer-Smith, G., Cawley, A.J., 1970. Non-union of fractures in the
dog. Journal of Small Animal Practice 11, 311–325.
Van Der Meulen, M.C.H., Jepsen, K.J., Mikic, B., 2001. Under-
standing bone strength: size isn’t everything. Bone 29 (2),
101–104.
Copyright © 2022 FDOKUMEN