L'impact des ''toy-packaging'' sur l'attitude des enfants âgés de ...
Upload
khangminh22Category
view
0download
0
NAVAL POSTGRADUATE
SCHOOL
MONTEREY, CALIFORNIA
THESIS
Approved for public release. Distribution is unlimited.
PUTTING THE LID ON THE DEVIL’S TOY BOX: HOW THE HOMELAND SECURITY ENTERPRISE CAN DECIDE WHICH EMERGING THREATS TO ADDRESS
by
Andrew J. Fox
March 2018
Thesis Advisor: Rodrigo Nieto-Gómez Co-Advisor: Kathleen Kiernan

THIS PAGE INTENTIONALLY LEFT BLANK

i
REPORT DOCUMENTATION PAGE Form Approved OMB No. 0704-0188
Public reporting burden for this collection of information is estimated to average 1 hour per response, including the time for reviewing instruction, searching existing data sources, gathering and maintaining the data needed, and completing and reviewing the collection of information. Send comments regarding this burden estimate or any other aspect of this collection of information, including suggestions for reducing this burden, to Washington headquarters Services, Directorate for Information Operations and Reports, 1215 Jefferson Davis Highway, Suite 1204, Arlington, VA 22202–4302, and to the Office of Management and Budget, Paperwork Reduction Project (0704–0188) Washington, DC 20503.
1. AGENCY USE ONLY (Leave blank)
2. REPORT DATE March 2018
3. REPORT TYPE AND DATES COVERED Master’s thesis
4. TITLE AND SUBTITLE PUTTING THE LID ON THE DEVIL’S TOY BOX: HOW THE HOMELAND SECURITY ENTERPRISE CAN DECIDE WHICH EMERGING THREATS TO ADDRESS
5. FUNDING NUMBERS
6. AUTHOR(S) Andrew J. Fox
7. PERFORMING ORGANIZATION NAME(S) AND ADDRESS(ES) Naval Postgraduate School Monterey, CA 93943–5000
8. PERFORMING ORGANIZATION REPORT NUMBER
9. SPONSORING /MONITORING AGENCY NAME(S) AND ADDRESS(ES)
N/A
10. SPONSORING / MONITORING AGENCY REPORT NUMBER
11. SUPPLEMENTARY NOTES The views expressed in this thesis are those of the author and do not reflect the official policy or position of the Department of Defense or the U.S. Government. IRB number ____N/A____.
12a. DISTRIBUTION / AVAILABILITY STATEMENT Approved for public release. Distribution is unlimited.
12b. DISTRIBUTION CODE
13. ABSTRACT Evolving developments in nanotechnology, materials science, and artificial intelligence are paving the
way for exponential growth in humanity’s abilities to create—and destroy. Emerging Promethean technologies will deliver capabilities to average persons that, until recently, have been relegated only to governments, militaries, and large research laboratories. The responsibilities of the homeland security enterprise can be divided between two mission sets: the systemic mission (responding to known threats) and the future-shock mission (preparing for highly uncertain threats from emerging technologies). The latter mission encompasses forecasting which emerging Promethean technologies are most likely to be actualized and then used by bad actors, and which have the direst plausible consequences. Pandora’s Spyglass, a decision-support tool for performing a “devil’s toy box” analysis, fuses best practices from a wide variety of predictive analytical techniques. It produces an ordinal list of most-destructive scenarios involving emerging Promethean technologies likely to come to market within a five- to ten-year window—a “to-do” list for counter-future-shock research and development. It is a ranking tool, not meant to serve as a budget justification or formulation tool; however, the procedure’s assumptions and variables can be validated so that it could legitimately serve that latter function. 14. SUBJECT TERMS Promethean technology, Promethean technologies, devil’s toy box analysis, homeland security systemic mission, homeland security future-shock mission, threat assessment, forecasting, Delphi technique, nominal group technique, red-teaming, futures studies, Technology Sequence Analysis, scenario analysis, brainstorming, prediction markets, prediction polls, wisdom of crowds, wisdom of the select crowd, science fiction mindset, Pandora’s Spyglass, Homeland Security Advanced Research Projects Agency, HSARPA, Defense Advanced Research Projects Agency, DARPA, Intelligence Advanced Research Projects Agency IARPA, Department of Homeland Security Science and Technology Directorate, DHS S&T
15. NUMBER OF PAGES
417
16. PRICE CODE
17. SECURITY CLASSIFICATION OF REPORT
Unclassified
18. SECURITY CLASSIFICATION OF THIS PAGE
Unclassified
19. SECURITY CLASSIFICATION OF ABSTRACT
Unclassified
20. LIMITATION OF ABSTRACT
UU
NSN 7540–01–280–5500 Standard Form 298 (Rev. 2-89) Prescribed by ANSI Std. 239–18

ii
THIS PAGE INTENTIONALLY LEFT BLANK

iii
Approved for public release. Distribution is unlimited.
PUTTING THE LID ON THE DEVIL’S TOY BOX: HOW THE HOMELAND SECURITY ENTERPRISE CAN DECIDE WHICH EMERGING THREATS TO
ADDRESS
Andrew J. Fox Management and Program Analyst, U.S. Immigration and Customs Enforcement Agency
B.A., Loyola University, 1986 M.P.A., Syracuse University, 1987
Submitted in partial fulfillment of the requirements for the degree of
MASTER OF ARTS IN SECURITY STUDIES (HOMELAND SECURITY AND DEFENSE)
from the
NAVAL POSTGRADUATE SCHOOL
March 2018
Approved by: Rodrigo Nieto-Gómez Thesis Advisor
Kathleen Kiernan Co-Advisor
Erik Dahl Associate Chair for Instruction Department of National Security Affairs

iv
THIS PAGE INTENTIONALLY LEFT BLANK

v
ABSTRACT
Evolving developments in nanotechnology, materials science, and artificial
intelligence are paving the way for exponential growth in humanity’s abilities to create—
and destroy. Emerging Promethean technologies will deliver capabilities to average
persons that, until recently, have been relegated only to governments, militaries, and large
research laboratories. The responsibilities of the homeland security enterprise can be
divided between two mission sets: the systemic mission (responding to known threats) and
the future-shock mission (preparing for highly uncertain threats from emerging
technologies). The latter mission encompasses forecasting which emerging Promethean
technologies are most likely to be actualized and then used by bad actors, and which have
the direst plausible consequences. Pandora’s Spyglass, a decision-support tool for
performing a “devil’s toy box” analysis, fuses best practices from a wide variety of
predictive analytical techniques. It produces an ordinal list of most-destructive scenarios
involving emerging Promethean technologies likely to come to market within a five- to
ten-year window—a “to-do” list for counter-future-shock research and development. It is
a ranking tool, not meant to serve as a budget justification or formulation tool; however,
the procedure’s assumptions and variables can be validated so that it could legitimately
serve that latter function.

vi
THIS PAGE INTENTIONALLY LEFT BLANK

vii
TABLE OF CONTENTS
I. INTRODUCTION..................................................................................................1 A. RESEARCH QUESTION .........................................................................1 B. A PARABLE...............................................................................................1 C. PROBLEM STATEMENT .......................................................................3 D. LITERATURE REVIEW .........................................................................2
1. The Challenges of Future Shock Threats for the Homeland Security Enterprise .....................................................3
2. Predictive Analysis Techniques 1: Elicitation of Expert Opinion (Delphi Technique / Nominal Group Technique (NGT) / Futures Studies) ...............................................................6
3. Predictive Analysis Techniques 2: Red-Teaming ........................8 4. Predictive Analysis Techniques 3: The “Wisdom of
Crowds” Techniques, Prediction/Futures Markets and Prediction Polls.............................................................................11
E. RESEARCH DESIGN .............................................................................13 F. THESIS ORGANIZATION ....................................................................16
II. BEGINNING THE WINNOWING PROCESS ................................................19 A. HOW TO KNOW THE DEVIL’S MIND? ............................................19 B. FUSE AND THE PROBLEM OF PROMETHEAN
TECHNOLOGIES ...................................................................................26
III. EXPERT ANALYSIS (1): THE DELPHI TECHNIQUE ................................43 A. DELPHI TECHNIQUE: INTRODUCTION ........................................43 B. DELPHI TECHNIQUE: METHODOLOGIES ....................................46 C. DELPHI TECHNIQUE: APPROPRIATE USES AND OTHER
BEST PRACTICES .................................................................................50 D. DELPHI TECHNIQUE: ADVANTAGES ............................................54 E. DELPHI TECHNIQUE: DISADVANTAGES ......................................56 F. DELPHI TECHNIQUE: MODIFIED FORMS ....................................62
IV. EXPERT ANALYSIS (2): THE NOMINAL GROUP TECHNIQUE ............67 A. NOMINAL GROUP TECHNIQUE: INTRODUCTION ....................67 B. NOMINAL GROUP TECHNIQUE: METHODOLOGY ...................68 C. NOMINAL GROUP TECHNIQUE: APPROPRIATE USES
AND OTHER BEST PRACTICES ........................................................69 D. NOMINAL GROUP TECHNIQUE: ADVANTAGES ........................73 E. NOMINAL GROUP TECHNIQUE: DISADVANTAGES ..................76

viii
F. NOMINAL GROUP TECHNIQUE: MODIFIED FORMS ................77 G. EVALUATIONS OF THE DELPHI TECHNIQUE
COMPARED WITH THE NOMINAL GROUP TECHNIQUE, STATICIZED GROUPS, UNSTRUCTURED DIRECT GROUP INTERACTION, AND OTHER FORMS OF STRUCTURED DIRECT GROUP INTERACTION .......................................................80
V. EXPERT ANALYSIS (3): FUTURES STUDIES/FORESIGHT STUDIES ..............................................................................................................85 A. FUTURES STUDIES: INTRODUCTION ............................................85 B. FUTURES STUDIES: METHODOLOGIES ........................................90 C. FUTURE STUDIES: METHODOLOGIES: TECHNOLOGY
SEQUENCE ANALYSIS ......................................................................101 D. FUTURES STUDIES: METHODOLOGIES: SCENARIO
ANALYSIS .............................................................................................104 E. FUTURES STUDIES: BEST PRACTICES ........................................110 F. HOW ACCURATE CAN EXPERT PROGNOSTICATION BE?
THE 1964 RAND CORPORATION STUDY OF FORECASTING TECHNOLOGICAL AND SOCIAL TRENDS (A CASE STUDY) ..................................................................................114
VI. RED TEAMING.................................................................................................123 A. RED TEAMING: INTRODUCTION ..................................................123 B. RED TEAMING: METHODOLOGIES..............................................127
1. Brainstorming Techniques ........................................................128 2. Techniques to Challenge Conventional Wisdom and
Groupthink .................................................................................129 3. Threat Matrix .............................................................................131
C. RED TEAMING: BEST PRACTICES ................................................133 D. RED TEAMING: DISADVANTAGES AND WAYS TO
OVERCOME THOSE PITFALLS ......................................................135
VII. WHO ARE THE EXPERTS? A CASE FOR THE INCLUSION OF SCIENCE FICTION WRITERS AS PART OF A “DEVIL’S TOY BOX” ANALYTICAL TEAM ..........................................................................143 A. THE CONCEPT OF EXPERTISE: BACKGROUND .......................143 B. EXPERTISE IN THE CONTEXT OF A “DEVIL’S TOY BOX”
ANALYSIS .............................................................................................145 C. ANOTHER SOURCE OF EXPERTISE: THE SCIENCE
FICTION MINDSET .............................................................................149

ix
1. The Constraints of Commercial Science Fiction as a Shaper of the Science Fiction Mindset: (Commercial Science Fiction = Future Technology + CONFLICT) ............150
2. Extrapolated or Novel Technology as an Element of the Science Fiction Mindset .............................................................152
3. Exciting Conflict that Appeals to Young Men as an Element of the Science Fiction Mindset ...................................154
4. Science Fiction Writers’ Focus on Rebels, Insurgents, Subversives, and Terrorists.......................................................155
5. Case Study: Eric Frank Russell’s Wasp ...................................157 6. The Intersection of the Science Fiction Mindset with
Homeland Security: The Career of Jerry E. Pournelle and the Formation of SIGMA, the Science Fiction Think Tank ............................................................................................162
VIII. THE WISDOM OF CROWDS: PREDICTION MARKETS, PREDICTION POLLS, THE WISDOM OF SELECT CROWDS, AND PREDICTIVE ANALYTICS ............................................................................169 A. PREDICTION MARKETS: UNDERLYING THEORIES AND
EARLY DEVELOPMENTS .................................................................169 B. PREDICTION MARKETS: DARPA’S POLICY ANALYSIS
MARKET................................................................................................171 C. PREDICTION MARKETS AND PREDICTION POLLS: THE
GOOD JUDGMENT PROJECT ..........................................................175 D. THE WISDOM OF SELECT CROWDS ............................................180 E. PREDICTION MARKETS AND PREDICTION POLLS:
SUGGESTED BEST PRACTICES ......................................................182 F. PREDICTION MARKETS AND PREDICTION POLLS:
POSSIBLE PITFALLS .........................................................................188 G. COMPARISONS OF PREDICTION MARKETS TO DELPHI,
NOMINAL GROUP TECHNIQUE, AND OTHER METHODS .....197 H. APPLICABILITY OF ELEMENTS OF PREDICTION
MARKETS AND PREDICTION POLLS TO A “DEVIL’S TOY BOX” ANALYTICAL PROCESS........................................................200
I. PREDICTIVE ANALYTICS ................................................................202
IX. PUTTING THE PIECES TOGETHER: PANDORA’S SPYGLASS ...........209 A. ASSUMPTIONS .....................................................................................209 B. APPLYING PANDORA’S SPYGLASS TO A “DEVIL’S TOY
BOX” ANALYSIS ..................................................................................216 C. PHASE ONE: ENVIRONMENTAL SCANNING .............................218 D. PHASE TWO: ASSEMBLE THE TEAM ...........................................220

x
E. PHASE THREE: BRAINSTORM SCENARIOS ...............................225 F. PHASE FOUR: RED TEAM THE SCENARIO STUBS ...................235 G. PHASE FIVE: RANK THE SCENARIO STUBS ..............................243 H. PHASE SIX: FLESH OUT THE “DEADLY DOZEN”
SCENARIOS ..........................................................................................262 I. PHASE SEVEN: RANK THE “DEADLY DOZEN”
SCENARIOS ..........................................................................................270 J. POTENTIAL CRITICISMS OF PANDORA’S SPYGLASS ............279 K. CONCLUSION—BUY THAT FIRE INSURANCE POLICY! ........294
APPENDIX A. IS HSARPA THE MOST APPROPRIATE FEDERAL AGENCY TO SPEARHEAD THE COUNTER-FUTURE SHOCK MISSION? ..........................................................................................................297 A. BUREAUCRACY AS A HINDRANCE TO THE COUNTER-
FUTURE SHOCK MISSION ...............................................................297 B. INTRODUCTION TO HSARPA .........................................................300 C. HSPARPA’S HISTORY OF CHANGING PROCEDURES FOR
IDENTIFYING, SELECTING, AND PRIORITIZING R&D PROJECTS .............................................................................................301
D. CRITICISM OF THE DHS S&T DIRECTORATE AND HSARPA .................................................................................................314
E. HSARPA R&D PROJECTS: SUPPORTING THE COUNTER-FUTURE-SHOCK MISSION OR THE SYSTEMIC MISSION? ....320
F. WHAT IS THE MOST APPROPRIATE HOME FOR A “DEVIL’S TOY BOX” ANALYTICAL EFFORT AND SUBSEQUENT R&D PROJECTS? .....................................................334
APPENDIX B. DRAWING PARALLELS BETWEEN TWO AUDIENCES—THE SCIENCE FICTION READERSHIP AND POTENTIAL MEMBERSHIPS OF TERROR GROUPS .....................................................345 A. SOCIOLOGICAL AND DEMOGRAPHIC DATA ON THE
SCIENCE FICTION READERSHIP ..................................................345 B. SOCIOLOGICAL AND DEMOGRAPHIC DATA ON
TERROR GROUP LEADERS AND FOLLOWERS .........................352 C. COMPARING DEMOGRAPHIC DATA ON THE SCIENCE
FICTION READERSHIP/FANDOM WITH THAT OF COHORTS OF TERROR GROUP LEADERS AND FOLLOWERS ........................................................................................359
D. CASE STUDY: AUM SHINRIKYO—A SCIENCE FICTION-BASED TERROR CULT THAT SOUGHT TO HASTEN THE APOCALYPSE THROUGH THE MALIGN USE OF ADVANCED TECHNOLOGIES .........................................................365

xi
LIST OF REFERENCES ..............................................................................................373
INITIAL DISTRIBUTION LIST .................................................................................389

xii
THIS PAGE INTENTIONALLY LEFT BLANK

xiii
LIST OF FIGURES
Figure 1. Example of Technology Sequence Analysis (Harvesting Robot) ............102
Figure 2. Original Structure of the DHS Science and Technology Directorate ......304
Figure 3. Revised DHS Science and Technology Directorate Structure .................306

xiv
THIS PAGE INTENTIONALLY LEFT BLANK

xv
LIST OF TABLES
Table 1. Comparison of Gene Splicing Kits and 3D Printing Tech on “Evil Genius” Questions .....................................................................................34
Table 2. Conditions of Predictability (per Rescher, 1998) ......................................91
Table 3. Accuracy of Predictions from 1984 Long-Range Forecasting Delphi Study ........................................................................................................116
Table 4. Statistical Breakdown of Accuracy of Predictions from 1984 Long-Range Forecasting Delphi Study .............................................................117
Table 5. Accuracy Rates of Various Experiments in Prediction of Social and Technological Events and Developments, Short-Term, Medium-Term, and Long-Term, Ranked (Ascendant) by Accuracy ......................119
Table 6. Generic Threat Matrix, Sandia National Laboratories .............................131
Table 7. Makeup of a Pandora’s Spyglass Analytical Team .................................223
Table 8. Approximate Duration of Pandora’s Spyglass Analytical Procedure ......280
Table 9. S&T Directorate Research and Development Funding, FYs 2010 - 2014..........................................................................................................318
Table 10. FY 2014 HSARPA Apex Division Projects, by Project Name, Type of Mission Supported, Novel Approach Score, Technical Feasibility Score, and Innovation Level ....................................................................323
Table 11. FY 2014 HSARPA Borders and Maritime Security Division Projects, by Project Name, Type of Mission Supported, Novel Approach Score, Technical Feasibility Score, and Innovation Level ......324
Table 12. FY 2014 HSARPA Chemical and Biological Defense Division Projects, by Project Name, Type of Mission Supported, Novel Approach Score, Technical Feasibility Score, and Innovation Level ......326
Table 13. FY 2014 HSARPA Cyber Security Division Projects, by Project Name, Type of Mission Supported, Novel Approach Score, Technical Feasibility Score, and Innovation Level ..................................328
Table 14. FY 2014 HSARPA Explosives Divisions Projects, by Project Name, Type of Mission Supported, Novel Approach Score, Technical Feasibility Score, and Innovation Level ..................................................330
xvi
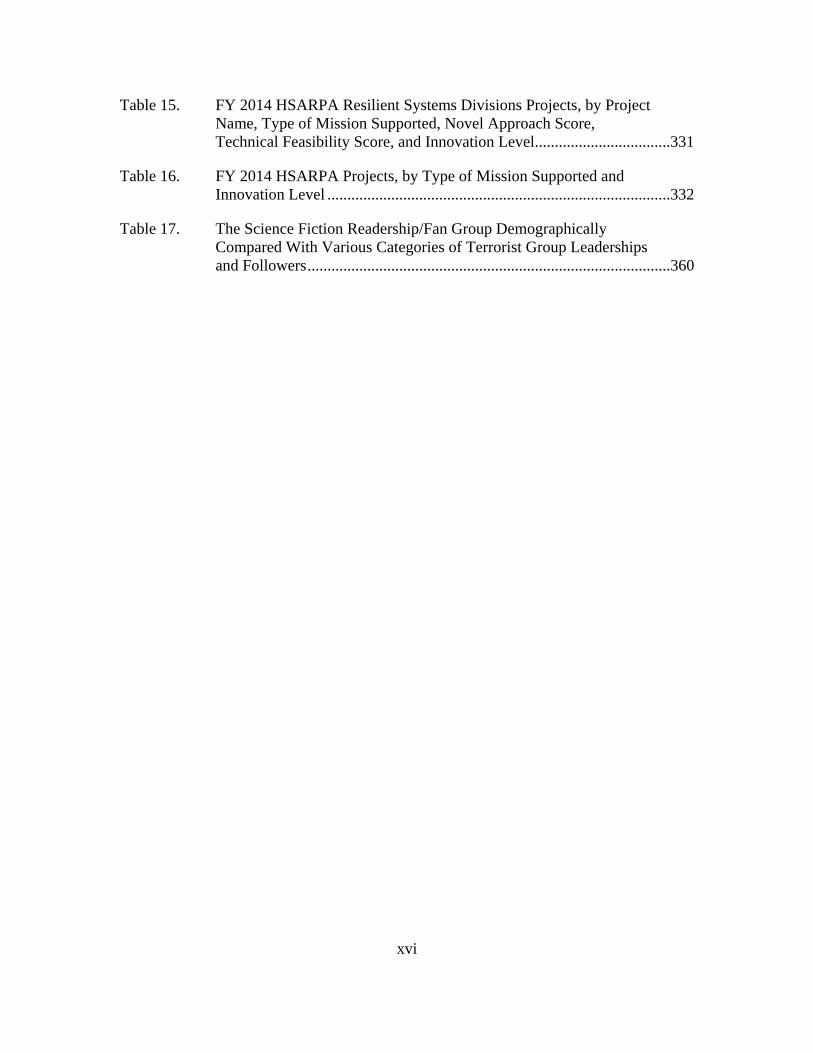
Table 15. FY 2014 HSARPA Resilient Systems Divisions Projects, by Project Name, Type of Mission Supported, Novel Approach Score, Technical Feasibility Score, and Innovation Level ..................................331
Table 16. FY 2014 HSARPA Projects, by Type of Mission Supported and Innovation Level ......................................................................................332
Table 17. The Science Fiction Readership/Fan Group Demographically Compared With Various Categories of Terrorist Group Leaderships and Followers ...........................................................................................360

xvii
LIST OF ACRONYMS AND ABBREVIATIONS
ACE Aggregative Contingent Estimation program AEER Air Entry and Exit Re-Engineering project ASCO Advanced Systems and Concepts Office BAA Broad Agency Announcement BEAP Border Enforcement Analytics Program BKC Bio-Defense Knowledge Center BMD Borders and Maritime Security Division BTC Bio-Threat Characterization CBD Chemical and Biological Defense Division CIPHER contradictions, inflections, practices, hacks, extremes, and rarities CNCI Comprehensive National Cybersecurity Initiative CONOPS Concept of Operations CRS Congressional Research Service CSAC Chemical Security Analysis Center CSS Coastal Surveillance System DARPA Defense Advanced Research Projects Agency DHS Department of Homeland Security DIA Defense Intelligence Agency DTRA Defense Threat Reduction Agency EFMN European Foresight Monitoring Network EXD Explosives Division FBI Federal Bureau of Investigation FEMA Federal Emergency Management Agency FFRDC Federally Funded Research and Development Center FUSE Foresight and Understanding from Scientific Exposition program GDP gross domestic product GLANSER Geospatial Location Accountability and Navigation System for
Emergency Responders GMO genetically modified organism GOTS government off-the-shelf HHM Hierarchical Holographic Modeling HIPS Homeland Innovative Prototypical Solutions HITS High Impact Technology Solutions HOST Homeland Open Security Technologies HSARPA Homeland Security Advanced Research Projects Agency

xviii
HSRE Human Systems Research and Engineering IAO Information Awareness Office IARPA Intelligence Advanced Research Projects Agency IC Intelligence Community IED improvised explosive device INGT improved nominal group technique IPT Integrated Product Team IQT In-Q-Tel MITI/METI Ministry of International Trade and Industry (Japan) NBAF National Bio and Agro-Defense Facility NGT nominal group technique NPPD National Protection and Programs Directorate PAM Policy Analysis Market PCS Process Control Systems PLO Palestine Liberation Organization R&D research and development RFRM Risk Filtering, Ranking, and Management ROI Return on Investment RSD Resilient Systems Division SAIC Science Applications International Corporation SBIR Small Business Innovative Research SCIF Sensitive Compartmented Information Facility SME subject matter expert S&T Science & Technology Directorate STTR Small Business Technology Transfer SUMMIT Standard Unified Modeling Mapping Integrated Toolkit SWAMP Software Assurance Marketplace SWOT Strengths, Weaknesses, Opportunities, and Threats T&E test and evaluation TITAN Targeted Innovative Technology Acceleration Network TOG Technology Oversight Group TSA Technology Sequence Analysis TTP Transition to Practice VSL value of a statistical life WMD weapon(s) of mass destruction

xix
EXECUTIVE SUMMARY
The pace of technological development and change is accelerating. Current and
near-term developments in nanotechnology, materials science, and machine learning and
artificial intelligence promise to pave the way for exponential growth in humanity’s
abilities to create—and destroy. Emerging Promethean technologies promise to deliver to
average persons of average financial means and average skills capabilities which, until the
present time, have been relegated only to national governments, well-funded military
establishments, and research laboratories employing hundreds of highly skilled scientists
and technicians. The implications of these developments (foreshadowed by the rapid
spread of consumer-grade 3D printing tech and CRISPR gene-editing tech) for the
homeland security enterprise are ominous.
Rodrigo Nieto-Gómez separates the responsibilities of the homeland security
enterprise into two mission sets: the systemic mission (preparing for and responding to
known threats of either a natural or man-made origin) and the future-shock mission
(preparing for highly uncertain or unknown threats from emerging technologies or
combinations of current and/or emerging technologies).1 He states that our existing
homeland security apparatus handles its systemic mission capably and effectively; due in
part to the nature of bureaucracy, a system evolved to apply standardized policies and
procedures to deal with known, incremental threats.2 He goes on, however, to point out
that the very qualities of homeland security bureaucracies that make them effective in
meeting their systemic mission make them ineffective in meeting their future-shock
mission.3
1 Rodrigo Nieto-Gómez, “Power of ‘the Few’: A Key Strategic Challenge for the Permanently
Disrupted High-Tech Homeland Security Environment,” Homeland Security Affairs 7, Article 18 (December 2011): 5–8. https://www.hsaj.org/articles/50.
2 Nieto-Gómez, “Power of ‘the Few’: A Key Strategic Challenge for the Permanently Disrupted High-Tech Homeland Security Environment,”
3 Nieto-Gómez, “Power of ‘the Few’: A Key Strategic Challenge for the Permanently Disrupted High-Tech Homeland Security Environment,” 13.

xx
In its counter-future-shock role, the homeland security enterprise must forecast
which, of an uncountable number of potential threats posed by innumerable combinations
and re-combinations of existing and cutting-edge technologies, potentially wielded by a
broad universe of malign actors, both known and unforeseen, are most likely to be
actualized and have the highest potentially dire consequences for the Nation’s security,
stability, and well-being. Acting within an environment of limited budgets, time, and
resources, and given the near-infinite number of potential future threats, how can the
homeland security enterprise effectively identify and select those research and
development projects best suited to carrying out the counter-future-shock role?
I suggest that the solution will be found through a “devil’s toy box” analysis. This
procedure begins with wide-scope environmental scanning—powered by computer
learning—of emerging Promethean technologies. It continues with brainstorming by a
varied team of experts of the direst consequences of each of those Promethean technologies
(or combinations of emerging technologies with existing technologies), then, with
application of red-teaming techniques and expert estimation of the likelihood of
Promethean technologies coming to market, the subsequent likelihood of the actualized
technologies being used for malign purposes, and the worst plausible consequences of
those malign uses. The varied team of experts uses a risk calculation based upon consensus
estimations arrived at through Delphi and nominal group technique processes to rank the
many scenario stubs generated and narrow the list down to the worst of the worst, the
“deadly dozen” scenarios. These “deadly dozen” are ranked in turn through an iterative
application of more robust analytical estimating techniques. The result is an ordinal list of
direst scenarios involving emerging Promethean technologies likely to come to market
within a five- to ten-year window—a “to-do” list for the homeland security enterprise’s
counter-future-shock research and development (R&D) program.
A. RESEARCH QUESTION
How can the homeland security enterprise best select future-shock threats upon
which to expend its limited research and development (R&D) resources?
xxi
B. METHOD AND DESIGN
I perform a Policy Options analysis, focusing on a review of existing knowledge. I
chose my various types of predictive analyses to analyze, either as alternative techniques
or sources of best practices for a fused procedure to support a “devil’s toy box” analysis,
based upon these procedures’ prominence in the literature, as well as a discussion with my
academic advisor. I selected the Homeland Security Advanced Research Projects Agency
(HSARPA) as my default governmental agency for analysis because it is the lead agency
identified by Congress for developing technological solutions to emerging threats to the
Homeland.
I perform a review of the literature on the various types of predictive analyses,
comparing the benefits and shortcomings of various techniques: the Delphi technique, the
nominal group technique (NGT), and futures studies, which may collectively be referred
to as techniques for elicitation of expert opinion; red-teaming techniques; and
prediction/futures markets (the wisdom of the crowd). Additionally, I address the question
of what types of experts should be included in the “devil’s toy box” analytical team,
examining the utility of including science fiction writers as members, due to their
acculturation to and facility with using what I term “the science fiction mindset.” I select
appropriate best practices from a variety of predictive analytical techniques and use them
to construct a fused procedure, which I term Pandora’s Spyglass.
C. CONCLUSION
The “science fiction mindset,” a mode of thinking that combines competitive
scanning of the emerging technological landscape and extrapolation of technology’s
evolving capabilities with a commercially-driven focus on exciting, destructive conflict, is
of especial utility to the homeland security enterprise in performing a “devil’s toy box”
analysis, and science fiction writers are a key part of a Pandora’s Spyglass analytical team.
Due to the science fiction mindset’s parallels with the motivations driving terrorists who
would seek to use Promethean technologies in innovative ways, having science fiction
writers as key members of the analytical team is the next best thing to having reformed
former terrorists as members.

xxii
Appropriate best practices for a “devil’s toy box” analysis are adapted from the
entire panoply of predictive analytics techniques developed since the end of World War II.
Pandora’s Spyglass, as envisioned, takes approximately six months, with a full-time, three-
to four-week face-to-face portion sandwiched between two distance portions, during which
participants would work part-time, an hour to 90 minutes per day. Pandora’s Spyglass is
intended to serve as a decision-support tool to facilitate the homeland security enterprise’s
identification and prioritization of emerging Promethean technology threats upon which to
focus limited R&D resources. In its basic form, it is a ranking tool, not meant to serve as a
budget justification or formulation tool; however, the procedure’s assumptions and
variables can be validated so that it could legitimately serve that latter function, if desired.
Regarding the question of which organization is best suited to make use of
Pandora’s Spyglass—which federal agency is best equipped, in terms of mission set,
organizational culture, and resources, to optimally implement a “devil’s toy box” analysis
and then use the findings generated to drive R&D efforts to counter-future-shock threats—
I consider six different scenarios. Four of these scenarios involve HSARPA and the
Department of Homeland Security Science and Technology (S&T) Directorate, and two of
the scenarios involve DHS contracting out the “devil’s toy box” analytical effort and
management of subsequent R&D projects to either the Intelligence Advanced Research
Projects Agency (IARPA) or the Defense Advanced Research Projects Agency (DARPA).
Ranking these six scenarios, I judge the most preferable one to be DHS contracting out
Pandora’s Spyglass to DARPA, with the next most preferable scenario being a
reformulated, “fresh sheet of paper” HSARPA, refocused on its original mission to support
the counter-future-shock mission, no longer under the S&T Directorate umbrella (in this
scenario, S&T would retain “old HSARPA” to perform R&D work to support the
homeland security systemic mission).

xxiii
ACKNOWLEDGMENTS
I dedicate this work to my wonderful wife, who has supported me both emotionally
and with her editing talents; to my family, who have put up with my extended absences
and work sessions over the past eighteen months; to my thesis advisers, Rodrigo Nieto-
Gomez and Kathleen Kiernan; to the marvelous faculty at CHDS; and to the responsible
parties in FEMA, DHS, and Congress, as well as the American public, who have supported
this worthy educational institution and my participation in it.

xxiv
THIS PAGE INTENTIONALLY LEFT BLANK

1
I. INTRODUCTION
A. RESEARCH QUESTION
How can the homeland security enterprise best select future-shock threats upon
which to expend its limited research and development (R&D) resources?
B. A PARABLE
The devil has a toy box. It contains many toys the devil likes very much. The devil
has his favorite play things, things he likes to play with again and again; however, he
frequently becomes bored with his old, familiar toys and goes looking for new things to
play with. His play, as befitting the devil, involves inciting fear, causing death and
destruction, and sowing mayhem and distrust wherever and whenever he chooses. So, in
addition to storing his old toys in the toy box, the devil also fills his toy box with smaller
boxes, inside of which gestate new toys, some of them very strange, indeed.
The devil’s victims do not like how the devil plays, nor do they like his toys. They
spend much time and effort thinking up ways to defend themselves and their loved ones
from the devil’s vicious play. But the toy box poses a problem. Occasionally the defenders
can see into the toy box, but not often. They can anticipate that the devil will most often
choose to play with his favorite toys. They have thought up ways to protect themselves
from those familiar toys, even though the devil still often wins his games through surprise
and craftiness.
But for the defenders, the most frightening thought regards those strange, new toys
gestating inside the smaller interior boxes. When the devil acquires brand-new toys, he will
use those new toys in ways the victims are not expecting; because the devil is a crafty
alchemist. He delights in taking ordinary things, seemingly harmless things, and combining
them into dangerous, deadly toys no one has seen before. These new toys, whose limits are
unknown, have the potential to be much more destructive than the devil’s old, familiar toys,
the ones to which the defenders have become accustomed.

2
In seeking to protect themselves and their loved ones, the defenders have a harder
job than their antagonist. The devil can get lucky just once and claim victory, whereas his
intended victims and their defenders must be lucky always. The latter must prepare
defenses against the new toys which will inevitably emerge at some point from the devil’s
toy box. But preparing such defenses takes considerable time, as well as considerable
resources. Should the defenders attempt to create shields against every possible new toy
the devil might make or reconfigure with his alchemy, they would spend every penny in
the treasury and never sleep, nor ever work on anything else. The defenders need to decide
which new toys are most likely to emerge from the devil’s toy box, and of those most likely
new toys, which will be the most dangerous.
The defenders need a crystal ball to guide their efforts, to tell them what they will
need to defend against five to ten years in the future, so they will have time to alert the
weapons-smiths at the forgery to create the proper shields. But crystal balls are expensive,
finicky, cumbersome to use, and unreliable. Worse, they often give wrong predictions and
lead their users down blind alleys. This is bad because, for one thing, it will waste the
weapons-smiths’ time, effort, and iron to produce a shield of little or no value, and for
another, having the weapons-smiths work on the wrong shield means they will be
unavailable to work on the right shield. Crystal balls seem almost useless. But the
alternatives to using a crystal ball are either trying to defend against every toy that might
possibly emerge from the devil’s toy box (impossible), or doing nothing, and, thus,
accepting the possibly terrible consequences of allowing the devil to try out any new toy
he fancies (unwise, and perhaps immoral).
As seemingly impractical as using a crystal ball appears to the defenders, the
alternatives seem worse. Like it or not, they’ll have to find one and use it as best they can.
Their challenge? To find a crystal ball that is not so expensive that procuring it will empty
the treasury, yet one that is not so arcane that only the most famed and powerful sorcerers
can use it. They need one that will give repeatable results over time, not just work according
to its own unpredictable whims. Perhaps most importantly, the defenders need a crystal
ball that they can calibrate and improve with use. It will not always be accurate, the
defenders realize—it will show, in its cloudy, obscured fashion, many futures which will

3
not come to pass. But the best that can be expected of this imperfect crystal ball is that it
will provide enough foresight that its cost and inconvenience are outweighed by whatever
destructive mischief the devil’s new toys would have wrought in the absence of any
forecasting at all.
C. PROBLEM STATEMENT
Rodrigo Nieto-Gómez separates the responsibilities of the homeland security
enterprise into two mission sets: the systemic mission (preparing for and responding to
known threats of either a natural or man-made origin) and the future-shock mission
(preparing for highly uncertain or unknown threats from emerging technologies or
combinations of current and/or emerging technologies).1 I refer to this latter mission as the
counter-future-shock mission, because the role of the homeland security enterprise is to
prevent future-shock events from occurring. In the terms of our parable, the systemic
mission represents the defense against the devil’s old, familiar toys, whereas the counter-
future-shock mission represents the attempt to prepare and deploy shields to protect against
the devil’s new, alchemized toys.
Existing Department of Homeland Security risk assessment doctrine appears to
focus primarily on threats from natural hazards and man-caused threats encompassing
known technological capabilities and modes of attack. A “devil’s toy box” analysis would
represent a supplement to this primarily systemic mission-focused risk assessment by
facilitating a consideration of the potential threats that could emanate from technological
capabilities not yet invented and from modes of attack not yet imagined by today’s
terrorists.
The Homeland Security Advanced Research Projects Agency (HSARPA), a unit of
the DHS Science and Technology Directorate, has the Congressionally mandated mission
of fostering revolutionary new technologies and methods to meet homeland security
missions. Based on its founding charter, HSARPA would appear to be the most appropriate
spearhead for the homeland security counter-future-shock mission; however, political and
1 Nieto-Gómez, “Power of ‘the Few,’” 5–8.

2
organizational pressures have funneled the majority of HSARPA’s research and
development (R&D) projects into near-term, moderate- or low-risk projects meant to
support the current needs of DHS’s operational agencies.5
In its counter-future-shock role, the homeland security enterprise must forecast
which of an uncountable number of potential threats posed by innumerable combinations
and re-combinations of existing and cutting-edge technologies, potentially wielded by a
broad universe of malign actors both known and unforeseen, are most likely to be
actualized and have the highest potentially dire consequences for the Nation’s security,
stability, and well-being. Acting within an environment of limited budgets, time, and
resources, and given the near-infinite number of potential future threats, how can the
homeland security enterprise effectively identify and select those R&D projects best suited
to carrying out the counter-future-shock role? Additionally, of the possible Federal
agencies that could serve as the technological spearhead of the homeland security counter-
future-shock mission, is HSARPA the most appropriate candidate, given the agency’s
troubled history and organizational culture?6 Or might another agency prove more
effective in this role?
D. LITERATURE REVIEW
This literature review covers the following topics. The challenges that future-shock
threats pose to the Nation’s homeland security are reviewed first. The review then provides
background regarding three sets of predictive analysis techniques: the Delphi technique,
the nominal group technique (NGT), and futures studies, which may collectively be
referred to as techniques for elicitation of expert opinion; red-teaming techniques; and
prediction/futures markets (the wisdom of the crowd).
5 Dana A. Shea, The DHS S&T Directorate: Selected Issues for Congress, CRS Report No. R43064
(Washington, DC: Congressional Research Service, April 14, 2014), 17, https://fas.org/sgp/crs/homesec/R43064.pdf.
6 Kristin L. Wyckoff, “Solving Homeland Security’s Wicked Problems: A Design Thinking Approach” (master’s thesis, Naval Postgraduate School, 2015), 38–39, https://calhoun.nps.edu/bitstream/handle/10945/47349/15Sep_Wyckoff_Kristin.pdf?sequence=3.

3
1. The Challenges of Future Shock Threats for the Homeland Security Enterprise
Numerous authors in the homeland security field have written about the
accelerating pace of technological change and the challenges posed by the chaotic
technology realm, combinatorial technologies, and “super-empowered angry guys” for the
homeland security enterprise. The risks to our Nation’s homeland security are increased by
what Dr. Ronald Lehman has termed strategic latency, defined as “a package of diverse
technologies that can be deployed quickly, often in new ways, with limited visibility that
could have decisive military and geopolitical implications.”7 He goes on to state that any
technology can be dual-use to the extent that it can be re-conceptualized to support
improvements in existing weaponry or to more effectively apply force against a target.8
The difficulty of defending against such developments in dual-use technology is
heightened by what he terms the “emergent behavior” of complex technology, or the
tendency for new technological capabilities to be used by adopters in ways unforeseen by
the original developers of those technologies.9
Rodrigo Nieto-Gómez, in his analysis of the strategic challenges faced by what he
terms “the permanently disrupted high-tech homeland security environment,” highlights
Bryan Arthur’s concept of “combinatorial evolution” of technology, wherein technologies
produce outputs that can be reconfigured and recombined in virtually endless combinations
for new purposes, like how chemists can create new molecules from more basic elements.
Nieto-Gómez postulates that this combinatorial evolution continually opens fresh
vulnerabilities within our technologically dependent society. He further states that small,
7 Michael Nacht, “What is Strategic Latency? An Introduction,” in Strategic Latency and World
Power: How Technology is Changing Our Concepts of Security, ed. Zachary Davis, Ronald Lehman, and Michael Nacht (Livermore: Lawrence Livermore National Laboratory Center for Global Security Research, eBook edition, 2014), 4. https://cgsr.llnl.gov/content/assets/docs/Strategic_Latency.pdf.
8 Ronald F. Lehman, “Unclear and Present Danger: The Strategic Implications of Latent, Dual-Use Science and Technology,” in Strategic Latency and World Power: How Technology is Changing Our Concepts of Security, ed. Zachary Davis, Ronald Lehman, and Michael Nacht (Livermore: Lawrence Livermore National Laboratory Center for Global Security Research, eBook edition, 2014), 5. https://cgsr.llnl.gov/content/assets/docs/Strategic_Latency.pdf.
9 Ibid., 18.

4
decentralized groups with the intent to disrupt that society—groups which he terms “the
few”—are better situated to recognize and exploit those vulnerabilities than large,
centralized, vertically-oriented organizations such as governments, law enforcement
agencies, and homeland defense departments.10 Nieto-Gómez’s notion of “the
permanently disrupted high-tech homeland security environment” is fully congruent with
Lehman’s concepts of strategic latency and emergent behavior, as those latter concepts
describe an environment of surprise and unpredictability.
Nieto-Gómez helpfully defines the homeland security mission as having two
components. The first is the systemic mission, which consists of prevention, mitigation,
and response to known threats, both natural and man-made (the former including
hurricanes, earthquakes, and floods, and the latter terror attacks on key infrastructure,
transportation, or national symbols using conventional weaponry such as explosives, guns,
knives, or vehicles). The second is the future-shock mission, which he characterizes as
“neutraliz(ing) disruptive—almost random—threats posed by the rapid pace of
technological evolution.”11 He states that our existing homeland security apparatus handles
its systemic mission capably and effectively, due in part to the nature of bureaucracy, a
system evolved to apply standardized policies and procedures to deal with known,
incremental threats.12 However, he goes on to point out that the very qualities of homeland
security bureaucracies that make them effective in meeting their systemic mission make
them ineffective in meeting their future-shock mission.13
Other observers have identified additional factors that work against the homeland
security apparatus’s achievement of its future-shock mission. Christopher Bellavita points
out an important factor: in the U.S., much political and economic weight is given to the
provision of services and equipment to the Nation’s first responders community, whereas
the role of prevention does not have a similarly weighty political and economic
10 Nieto-Gómez, “‘Power of ‘the Few,’” 5–8.
11 Ibid., 10.
12 Ibid., 11.
13 Ibid., 13.

5
constituency. He identifies three additional factors which hamper homeland security
institutions’ provision of effective threat prevention services. These are fear of new
behavior, fear of imagination, and fear of emergence.14 Coming from a non-homeland
security perspective, Helle Vibeke Carstensen and Christian Bason identify factors that
make the task of innovation difficult for traditional governmental bureaucracies. These
include organizational siloes of information within bureaucracies; heavy reliance on
standardized processes and procedures; reliance on linear development processes; lack of
effective performance evaluation; and the documented fact that public-sector agencies tend
to be more focused on improving internal policies and procedures than they are on
supplying innovative new services and improved outcomes to the public. Finally, the
authors point out that governmental bureaucracies’ optimization procedures are almost
entirely focused upon verification efforts (are we doing things right?) rather than validation
efforts (are we doing the right things?).15 Nieto-Gómez, Bellavita, and Carstensen and
Bason all agree that bureaucracies that were originally designed to carry out one set of
mission tasks (what Nieto-Gómez calls the systemic mission, which focuses on
standardization, repeatability, and reliability) are severely hampered by their governing
structures and organizational cultures when they attempt to pursue a very different set of
mission tasks (the counter-future-shock mission that focuses on innovation), tasks that
national governments have newly assigned to them.
In the following sections of this literature review, I briefly describe various types
of predictive analysis techniques developed since the end of World War II which may assist
the homeland security enterprise in identifying and prioritizing emerging future-shock
threats against which to develop countermeasures. I separate these techniques into three
sets. The first is what I call the expert analysis or elicitation of expert opinion set of
techniques; these include the Delphi process, nominal group technique (NGT), and futures
14 Christopher Bellavita, “What is Preventing Homeland Security?” Homeland Security Affairs 1
(June 2005), https://www.hsaj.org/articles/182.
15 Helle Vibeke Carstensen and Christian Bason, “Powering Collaborative Policy Innovation: Can Innovation Labs Help?” The Innovation Journal: The Public Sector Innovation Journal 17, no. 1 (2012): 3–5, https://www.innovation.cc/scholarly-style/christian_bason_v17i1a4.pdf.

6
studies. The second set is critical thinking techniques collectively known as red-teaming.
The third I refer to as “the wisdom of crowd” set of techniques, which includes
prediction/futures markets and prediction polls.
2. Predictive Analysis Techniques 1: Elicitation of Expert Opinion (Delphi Technique / Nominal Group Technique (NGT) / Futures Studies)
The process of winnowing down those emerging technologies that are most likely
to pose a significant threat to the Nation’s homeland security and are most likely to be
made use of by malign actors must begin with a more basic task: that of identifying which
emerging technologies have “legs” and are likely to be developed into producible,
marketable products that grant end-users significant or revolutionary new capabilities.
Homeland security managers could choose to use one or more of several decision-support
and predictive analysis techniques to assist with this process. The oldest of these are the
expert analysis techniques—the Delphi technique, the nominal group technique, and
futures studies.
Olaf Helmer provides a history, description, and critique of the Delphi technique, a
post-World War II analytical process for eliciting useful, accurate answers to complicated
questions from groups of experts.16 More recently, Philip E. Tetlock and Dan Gardner,
with their Superforecasting: The Art and Science of Prediction, have put some quantitative
meat on the bones of the Delphi theory. Working for the Intelligence Advanced Research
Projects Agency (IARPA), they conducted large-scale competitions between teams of
futures analysts to determine what factors differentiate more accurate predictors of events
six months to a year in the future from less accurate ones.17
The nominal group technique (NGT) is an alternative structured group interaction
process, created by Andrew H. Van de Ven and Andre L. Delbecq in 1968. They sought to
ameliorate some of the same problems associated with unstructured face-to-face group
16 Olaf Helmer, “Analysis of the Future: the Delphi Method” (Santa Monica, California: RAND
Corporation, March 1967), http://www.rand.org/content/dam/rand/pubs/papers/2008/P3558.pdf.
17 Philip E. Tetlock and Dan Gardner, Superforecasting: The Art and Science of Prediction (New York: Crown, 2015).

7
discussions with which the inventors of the Delphi technique had grappled, but without
entirely removing the social benefits participants accrue from face-to-face interactions.18
Slightly more than a decade later, William M. Fox identified several shortcomings of the
nominal group technique as originally constituted and suggested a number of refinements,
which he collectively termed the improved nominal group technique (INGT).19
Futures studies blossomed due to early optimism surrounding the use of the Delphi
technique to forecast future events. The RAND Corporation, the think tank that sponsored
the research that led to the development and first uses of the Delphi technique, published
some of the earliest papers reviewing the emerging field of futurism or futures studies, the
attempt to use predictive analytical techniques such as Delphi to extrapolate the
development of technology, as well as social, political, and environmental trends, to some
point in the future, perhaps a quarter-century or forty years out. Examples include The Year
2000 (1967), a summation of then-current speculations about the beginning of the new
millennium, and The Future as an Object of Research (1967), which focuses both on the
then-nascent Futures Industry and the problems of predictive methodologies.20 One of the
progenitors of futures studies is Alvin Toffler, whose best-selling Future Shock initiated
the field of cross-discipline futures studies in 1970.21 Toffler followed up on this work
with two sequels, and a flood of futures studies books, both scholarly and popular,
accompanied them, including the Club of Rome’s dour The Limits to Growth and its
philosophical opposite, Herman Kahn’s The Next 200 Years.22
18 Andre L. Delbecq, Andrew H. Van de Ven, and David H. Gustafson, Group Techniques for
Program Planning: A Guide to Nominal Group and Delphi Processes (Glenview, IL: Scott, Foresman, and Company, 1975), 7–9.
19 William M. Fox, “The Improved Nominal Group Technique (INGT),” Journal of Management Development 8, no. 1 (1989): 20–27, https://doi.org/10.1108/EUM0000000001331.
20 Brownlee Haydon, The Year 2000 (P-3571) (Santa Monica: the RAND Corporation, 1967); and N. Rescher, The Future as an Object of Research (P-3593) (Santa Monica: the RAND Corporation, 1967).
21 Alvin Toffler, Future Shock (New York: Random House, 1970).
22 Donella H. Meadows, Dennis Meadows, Jørgen Randers, and William W. Behrens III, The Limits to Growth (New York: Universe Books, 1972); Herman Kahn, The Next 200 Years (New York: Morrow, 1976).

8
Writers of science fiction have also come to play a role in advising governmental
agencies regarding what types of future threats may be lurking over the horizon. Arlan
Andrews, the founder of SIGMA, relates the history of this voluntary, non-profit
association of science fiction writers with backgrounds in the hard sciences, engineering,
or medicine. He explains why science fiction writers possess unique skills especially
applicable to the homeland security counter-future-shock mission.23
3. Predictive Analysis Techniques 2: Red-Teaming
A different sort of predictive analysis technique, this one focused on the near-term
decisions that might be made by one’s opponents—red-teaming, the systematic effort to
view one’s side’s weaknesses from an enemy’s viewpoint, also factoring in the enemy’s
hoped-for outcomes, and thus predicts that enemy’s most likely modes of attack—has roots
going all the way back to the Prussian Army general staff of the Napoleonic Era. That
organization, in the wake of severe defeats at Napoleon’s hands, innovated the Kriegspiele,
or war game, which could take the form of table top exercises, map exercises, general staff
rides, or full-fledged unit exercises in the field.24 Since the heyday of the Prussian Army
general staff, the use of red-teaming has spread well beyond military applications. Dr. Mark
Mateski asserts that red-teaming can be productively deployed by many types of
organizations that must cope with adversaries or competitors, in that it serves as an
analytical tool for avoiding rigidity and countering surprise.25
The U.S. Marine Corps defines red-teaming as “role-playing the adversary.”26
Major David F. Longbine of the U.S. Army describes the key roles of red-teaming as
23 Arlan Andrews, Sr., “SIGMA: Summing Up Speculation,” Analog Science Fiction & Fact 132, 9
(September 2012): 384–393.
24 Williamson Murray, War, Strategy, and Military Effectiveness (New York: Cambridge University Press, 2011), 142–143.
25 Mark Mateski, “Red-Teaming: A Short Introduction (1.0),” RedTeamJournal.com (June 2009), 1–7. http://redteamjournal.com/papers/A%20Short%20Introduction%20to%20Red%20Teaming%20(1dot0).pdf.
26 Major David F. Longbine, Red-Teaming: Past and Present (Fort Leavenworth, KS: School of Advanced Military Studies, United States Army Command and General Staff College, 2008), 6. http://indianstrategicknowledgeonline.com/web/2286.pdf.
9
challenging stale, outdated, or false thinking in an organization through filling the role of
“devil’s advocate” and strongly challenging what is accepted as “conventional wisdom,”
as well as providing a set of alternative analyses. Additionally, red-teaming provides
decision makers with alternative perspectives by describing the operational environment
as it might be seen through the eyes of allies and partners, adversaries, or other actors
within the environment.27 The U.S. Army has established a school at the University of
Foreign Military and Cultural Studies (UFMCS), located at Fort Leavenworth in Kansas,
to teach red-teaming techniques.28 Both the UFMCS’s Red Team Handbook and the U.K.
Ministry of Defence’s Red-Teaming Guide provide thorough descriptions of numerous
techniques and exercises for red-teaming analyses.29
Dr. Mark Mateski, in his Red-Teaming: A Short Introduction, provides nine
definitions of red-teaming from various military, government, and scholarly sources and
compares them. He points out that their common elements are bringing to the fore an
adversary’s or competitor’s point of view, and assisting decision makers to make the best
possible choices or to optimize systems.30 Mateski asserts that red-teaming is a type of
alternatives analysis whose function is to assist leaders in making good decisions by aiding
them in avoiding rigidity and countering surprise; red-teaming does this through drawing
on the benefits of a variety of alternative analysis techniques, including “key assumptions
checks; devil’s advocacy; Team A/Team B; red-cell exercises; contingency ‘what if’
analysis; high-impact/low-probability analysis; [and] scenario development.”31 The
27 Ibid., 81–5.
28 Armed Forces Journal, “A Better Way to Use Red Teams: How to Inject the Enemy’s View into the Planning Process,” Armed Forces Journal online, February 1, 2012, http://armedforcesjournal.com/a-better-way-to-use-red-teams/.
29 University of Foreign Military and Cultural Studies, Red Team Handbook (version 6.0) (Leavenworth, KS: University of Foreign Military and Cultural Studies, April 2012), http://www.au.af.mil/au/awc/awcgate/army/ufmcs_red_team_handbook_apr2012.pdf; United Kingdom Ministry of Defence Development, Concepts and Doctrine Center, Red-Teaming Guide (2nd Edition) (Swindon, Wiltshire, UK: The Development, Concepts and Doctrine Center, Shrivenham, Ministry of Defence, January 2013), https://www.gov.uk/government/publications/a-guide-to-red-teaming.
30 Mateski, Red-Teaming: A Short Introduction, 22–31.
31 Ibid., 1–7.

10
Defense Threat Reduction Agency’s “Evil Genius Study,” the results of which were
published in the April 2009 monograph, Thwarting an Evil Genius, is an example of
analytical red-teaming that has special relevance to the counter-future-shock mission. This
monograph poses a series of questions that could be used to help winnow down the universe
of potential future threat vectors.32
Michael J. Skroch of Sandia National Laboratories discusses an avenue for the
extension of red-teaming techniques beyond the limitations of human analysis: virtual red-
teaming through modeling and simulation. He asserts that, when it comes to red-teaming,
whereas human beings are effective in the realms of creativity and intuition, computers are
good at crunching numbers, dealing with complexity, and exhausting a range of potential
alternatives.33 Of the three realms, red-teaming methods are called upon to analyze for
strengths and vulnerabilities, the physical space, cyberspace, and the behavioral space;
computer simulations have strong advantages in the first two realms, when compared to
human analysts.34 Following up on Skrotch’s work, several computer programmers and
mathematicians have worked to create actual systems to perform virtual red-teaming,
including Yacov Y. Haimes and Barry M. Horowitz, with their Adaptive Two-Player
Hierarchical Holographic Modeling Game for counterterrorism intelligence analysis, and
Gerald G. Brown, Matthew Carlyle, Javier Salmerón, and R. Kevin Wood, who developed
a “Defend-Attack-Mitigate risk-minimization model” and a tri-level “Defender-Attacker-
32 Dallas Boyd Trevor Caskey, Kevin A. Ryan, Joshua Pollack, George W. Ullrich, James Scouras,
and Jonathan Fox., Thwarting an Evil Genius: Final Report (Washington, DC: Defense Threat Reduction Agency Advanced Systems and Concepts Office, April 13, 2009), https://fas.org/irp/agency/dod/dtra/thwart.pdf, 7.
33 Michael J. Skroch, Modeling and Simulation of Red-Teaming, Part 1: Why Red Team M&S? (SAND 2009-7215 J, Rev 3) (Albuquerque, NM: Sandia Corporation, November 2, 2009), 2–4, http://umbra.sandia.gov/pdfs/resources/redteam.pdf.
34 Ibid., 6.

11
Defender risk-minimization model,” which they applied to the problem of defending
various critical infrastructure systems against terror attacks.35
4. Predictive Analysis Techniques 3: The “Wisdom of Crowds” Techniques, Prediction/Futures Markets and Prediction Polls
James Surowiecki, with his book The Wisdom of Crowds: Why the Many Are
Smarter Than the Few and How Collective Wisdom Shapes Business, Economies, Societies
and Nations, has popularized the well-studied phenomenon that groups of people, when
their judgments are amalgamated, can often make more accurate predictions and
estimations than the best experts among them, working alone.36 Robin Hanson, a pioneer
in the modern use of market techniques to forecast political, social, and technological
developments and one of the primary creators of DARPA’s short-lived Policy Analysis
Market (PAM), has written extensively about the class of analytical tools to which PAM
belonged, combinatorial information markets. He has also detailed the story of PAM’s
development, its promise, and its abrupt termination due to political fallout. DARPA hired
Hanson and his team to design a predictive analysis system that would use financial
information feedback tools associated with stock and commodities markets—buying and
selling of shares, as well as holds and puts—to predict the likelihood of a wide range of
sociopolitical events around the world occurring within a specified period. PAM, as
designed, would rely upon the profit motive to incentivize participants in the informational
market to uncover the best information possible. At any given time, the system’s best
available prediction of the likelihood of a sociopolitical event occurring would be the
current price of that event’s option in the market; however, when some details of the
program were leaked to the media, immediate outrage ensued over experts “profiting” on
35 Yacov Y. Haimes and Barry M. Horowitz, “Adaptive Two-Player Hierarchical Holographic
Modeling Game for Counterterrorism Intelligence Analysis,” Journal of Homeland Security and Emergency Management 1, no. 3, art. 302 (June 2004), doi: https://doi.org/10.2202/1547-7355.1038; Gerald G. Brown, W. Matthew Carlyle, Javier Salmerón, and Kevin Wood, Analyzing the Vulnerability of Critical Infrastructure to Attack and Planning Defenses (Monterey, CA: Naval Postgraduate School, Operations Research Department, 2005), doi: 10.1287/educ.1053.0018.
36 James Surowiecki, The Wisdom of Crowds: Why the Many Are Smarter Than the Few and How Collective Wisdom Shapes Business, Economies, Societies and Nations (New York: Doubleday, 2004), 4–5.

12
the occurrence of events such as political assassinations or terror attacks, and the media
hullabaloo caused some national politicians to insist that funding for the program be
revoked.37
In a series of articles, Hanson addresses the concerns that were raised in the political
and media realms regarding PAM and suggests refinements to the project’s design, should
policy makers ever decide to reinstitute it. The pitfalls to avoid that he addresses include
the moral implications of a terrorism predictions market; terrorists’ potential manipulation
of such a market to generate profits; the replacement of well-trained professional analysts
with unproven amateurs; hiding prices; and decision selection bias. He suggests that future
enhancements could include the combination of a prediction market with red-teaming
techniques and the application of combinatorial methods of prediction.38 Robert E. Looney
further analyzes the arguments that were made against PAM.39 Despite PAM’s
cancellation prior to implementation, more recent commentators in the intelligence and
homeland security realms have proposed resurrecting the concept, saying it was euthanized
far too quickly and still holds great promise.40
More recently, in 2011 the Intelligence Advanced Research Projects Agency
(IARPA) sponsored a multi-year forecasting tournament called the Good Judgment
Project, which provided the first opportunity for a large-scale comparison of the accuracy
and efficacy of two crowd-sourcing predictive analysis techniques, prediction markets (the
37 Robin Hanson, “The Policy Analysis Market: A Thwarted Experiment in the Use of Prediction
Markets for Public Policy,” Innovations: Technology, Governance & Globalization 2 (Summer 2007): 73–88, doi: 10.1162/itgg.2007.2.3.73; Robin Hanson, Takashi Ishikida, and John Ledyard, An Experimental Test of Combinatorial Information Markets (Fairfax, Virginia: George Mason University Department of Economics, February 2005), http://mason.gmu.edu/~rhanson/testcomb.pdf.
38 Robin Hanson, “Designing Real Terrorism Futures,” Public Choice 128 (2006): 257–74, http://mason.gmu.edu/~rhanson/realterf.pdf.
39 Robert E. Looney, “DARPA’s Policy Analysis Market for Intelligence: Outside the Box or Off the Wall?” International Journal of Intelligence and CounterIntelligence 17 (2004): 405–19, http://www.au.af.mil/au/awc/awcgate/nps/pam/si_pam.pdf.
40 Colonel Brett D. Weigle, “Prediction Markets: Another Tool in the Intelligence Kitbag” (master’s thesis, U.S. Army War College, 2007); Brian A. Lozada, “The Emerging Technology of Predictive Analytics: Implications for Homeland Security,” Information Security Journal: A Global Perspective 23 (2014): 118–22, doi: pdf/10.1080/19393555.2014.972598.

13
Hanson model) and prediction polls.41 In prediction markets, traders use their best
knowledge to seek profits by buying and selling shares of contracts about potential future
events; the “wisdom of the crowd,” the crowd’s best estimation of the likelihood of the
future events occurring, can be immediately distilled at any given point in time from the
share price. Prediction polls do not rely upon probabilistic betting; rather, participants in
the polls offer their forecasts, either individually or as members of teams, and are permitted
to update their forecasts as often as they choose. Finally, they are given feedback on their
degree of accuracy.42
Research derived from the Good Judgment Project forecasting tournament formed
the basis for Philip E. Tetlock’s and Dan Gardner’s popular book, Superforecasting: The
Art and Science of Prediction.43 The widespread interest elicited by this book and the
academic articles from which the book was born indicate that, despite the setback delivered
to the use of prediction/futures markets in the public policy realm by the abrupt termination
of DARPA’s Policy Analysis Market, the “wisdom of the crowd” methods of forecasting
most likely have a future in the intelligence, defense, and homeland security realms.
E. RESEARCH DESIGN
I perform a Policy Options analysis, focusing on a review of existing knowledge
(per Eugene Bardach’s typography).44 I chose my various types of predictive analysis to
analyze, either as alternative techniques or sources of best practices for a fused procedure
to support a “devil’s toy box” analysis, based upon these procedures’ prominence in the
literature, as well as discussions with my academic advisor, Rodrigo Nieto-Gómez. I
selected the Homeland Security Advanced Research Projects Agency (HSARPA) as my
41 Pavel Atanasov, Phillip Rescober, Eric Stone, Samuel A. Swift, Emile Servan-Schreiber, Philip
Tetlock, Lyle Ungar, and Barbara Mellers, “Distilling the Wisdom of Crowds: Prediction Markets vs. Prediction Polls,” Management Science 63, no. 3 (April 2017):692–693, https://doi.org/10.1287/mnsc.2015.2374.
42 Ibid., 691.
43 Tetlock and Gardner, Superforecasting, 16–18.
44 Eugene Bardach, A Practical Guide for Policy Analysis (New York: Seven Bridges Press, 2000).

14
default governmental agency for analysis because it is the lead agency identified by
Congress for developing technological solutions to emerging threats to the homeland.
I perform a review of the literature on the various types of predictive analyses,
comparing the benefits and shortcomings of various techniques:
Delphi Technique / Nominal Group Technique / Futures Studies
Red-teaming techniques
Futures/Predictions Markets and Prediction Polls
A blended technique
In conducting my research, I primarily relied upon searches of the amalgamated
ProQuest databases regarding social sciences, management science, political science,
military, science and technology, computer science, humanities, and health management. I
also performed some searches using Google Scholar. My most frequently used search terms
included: “Delphi technique,” “nominal group technique,” “futurism,” “futures studies,”
“threat forecasting,” “red-teaming,” “wisdom of crowds,” “futures market,” “predictions
market,” “superforecasters,” “critique of Delphi,” “advantages of Delphi,” “disadvantages
of Delphi,” “critique of nominal group technique,” “advantages of nominal group
technique,” “disadvantages of nominal group technique,” “advantages of predictions
markets,” “disadvantages of predictions markets,” “Homeland Security Advanced
Research Projects Agency,” “HSARPA,” “HSARPA and DARPA,” and “HSARPA and
IARPA.” I selected additional research resources from the footnotes, end notes, and
bibliographies of sources I acquired through electronic database searches. In researching
HSARPA’s processes for selecting and prioritizing R&D projects and that agency’s
breakdown of FY 2014 projects, I relied primarily upon documents retrieved from the DHS
Science & Technology Directorate’s intranet. I also reviewed sources recommended to me
by one of my thesis advisors, Rodrigo Nieto-Gómez.
My success criteria upon which the various predictive analysis alternatives are
ranked include effectiveness (highest attainable likelihood of accurately forecasting future
threats), efficiency (time- and budget-effectiveness), and usability (a process not so

15
cumbersome that a modest-sized agency such as HSARPA would find it inappropriate to
undertake). My intention is to provide a process recommendation to the managers of
HSARPA (or another, more appropriate agency) for an effective, efficient, and usable
predictive analysis tool for them to use to guide their identification, selection, and
prioritization of R&D projects to support the homeland security counter-future-shock
mission. As part of my analysis, I address the question of what types of experts should be
included in the “devil’s toy box” analytical team, examining the utility of including science
fiction writers as members, due to their acculturation to and facility with using what I term
“the science fiction mindset.” I refer to my recommended process as Pandora’s Spyglass.
I analyze the question of whether HSARPA is the most appropriate agency to serve
as the R&D spearhead for the homeland security counter-future-shock mission. I perform
a Policy Options analysis, focusing on a review of policy history, per Eugene Bardach’s
typography.45 This analysis is based upon a review of Congressional and governmental
reports concerning HSARPA and the Department of Homeland Security Science &
Technology Directorate (DHS S&T), plus some internal DHS working and planning
documents, as well as historical analyses of DARPA (the Defense Advanced Research
Projects Agency) and IARPA (the Intelligence Advanced Research Projects Agency). In
addressing the question as to whether HSARPA, as historically and currently constituted,
is the most appropriate Federal agency to spearhead the homeland security counter-future-
shock mission, my analysis is more exploratory and tentative than the analysis underlying
the creation of my blended predictive analysis technique. An in-depth comparison of
resources, histories, and organizational cultures of HSARPA, DARPA, and IARPA is
beyond the scope of this thesis. My intention is to provide for an audience of Federal
homeland security leadership suggestive, exploratory analysis regarding whether
HSARPA is the most appropriate agency to serve as technological spearhead for the
homeland security counter-future-shock mission, or whether that responsibility might
better be given to a different federal organization, such as DARPA or IARPA.
45 Bardach, Practical Guide for Policy Analysis.

16
F. THESIS ORGANIZATION
Chapters II through VIII consider how our defenders may best calibrate their crystal
ball in their attempt to protect their people and vital institutions against whichever new toys
the devil may pull from his toy box. Chapter II introduces two tools that a homeland
security agency could use to begin winnowing down the massive universe of potential
future-shock threats: IARPA’s FUSE (Foresight and Understanding from Scientific
Exposition) Program and the guidelines from the Thwarting an Evil Genius study. Chapters
III through V provide background on the expert analysis or elicitation of expert opinion
techniques—the Delphi technique (Chapter III), the nominal group technique (Chapter IV),
and futures studies (Chapter V). Chapter VI explores red-teaming techniques.
Chapter VII takes up the question of what types of experts should be included in an
“devil’s toy box” analytical team. I build a case for the inclusion and centrality of science
fiction writers, due to their acculturation to and facility in using the “science fiction
mindset,” a mode of thinking that combines competitive scanning of the emerging
technological landscape and extrapolation of technology’s evolving capabilities with a
commercially-driven focus on exciting, destructive conflict. I offer the hypothesis that this
science fiction mindset is of special utility to the homeland security enterprise in deciding
on which emerging Promethean technologies to focus research and development resources,
because the mindset parallels the thinking of those terrorists who would seek to innovate
in their destructive activities with new Promethean tools. I hypothesize that having science
fiction writers as key members of the analytical team is the next best thing to having
reformed former terrorists as members. (Appendix B illustrates correlations between the
socioeconomic and educational backgrounds of science fiction fandom, from which much
of science fiction writers emerge, and of terror group leaders and followers, correlations
that support the inclusion of possessors of the science fiction mindset as key members of a
“devil’s toy box” analytical team. Appendix B also offers a case study of Aum Shinrikyo,
an apocalyptic cult that engaged in prototypical “devil’s toy box” attacks in Japan, also
illustrating the centrality of science fiction concepts and tropes to the cult’s eschatology
and goals.)

17
Chapter VIII examines techniques that do not rely upon expert opinion but instead
rely upon “the wisdom of the crowd,” including prediction/futures markets and prediction
polls. Chapters III–VI and Chapter VIII compare the strengths and disadvantages of each
of these “crystal ball” techniques in serving the counter-future-shock mission, building up
a list of best practices which I make use of in Chapter IX.
Chapter IX is the keystone chapter of this thesis, the chapter in which I develop my
recommended procedure for carrying out a “devil’s toy box” analysis, a procedure I call
Pandora’s Spyglass. I begin the chapter by stating up-front all the assumptions on which I
rely in designing Pandora’s Spyglass the way I have. I then make use of the best practices
I have culled from those predictive analytics procedures I reviewed in preceding chapters,
after justifying which best practices are applicable in the case of a “devil’s toy box”
analysis. Pandora’s Spyglass is an iterative process that begins with wide-scope
environmental scanning to determine the universe of emerging technologies with
Promethean potential that could come to market within a five- to ten-year timeframe, then
deploys a team of experts to develop abbreviated scenarios (scenario stubs) from the
identified universe of possible technological developments. The expert analytical team
then winnows down the large list of scenario stubs to a manageable list of a “deadly dozen”
scenarios, judged to be the worst of the worst in terms of maximum potential dire
consequences, as well as likelihood of Promethean technologies both coming to market
and being used for malign purposes. After the science fiction writer members of the team
flesh out these “deadly dozen” scenario stubs into detailed narratives, the “deadly dozen”
are then subjected to a more rigorous analysis so that the team can rank them in descending
order of risk (risk, in this case, equaling the consensus estimated dollar value of the
scenario’s consequences times the consensus estimated probability of the scenario
becoming actualized).
Pandora’s Spyglass, as envisioned, takes approximately six months, with a full-
time, three- to four-week face-to-face portion sandwiched between two distance portions,
during which participants would work part-time, an hour to 90 minutes per day. Pandora’s
Spyglass is intended to serve as a decision-support tool to facilitate the homeland security
enterprise’s identification and prioritization of emerging Promethean technology threats

18
upon which to focus limited R&D resources. It is not meant, as set forth in this chapter, to
serve as a budget justification or formulation tool, although I offer suggestions regarding
how the procedure’s assumptions and variables could be validated so that a Pandora’s
Spyglass analysis could legitimately serve that function. I also address potential criticisms
which might be leveled against the Pandora’s Spyglass procedure.
Appendix A addresses the question of which agency is best suited to make use of
Pandora’s Spyglass. Which federal agency is best equipped, in terms of mission set,
organizational culture, and resources, to best implement a “devil’s toy box” analysis such
as Pandora’s Spyglass, and then use the findings generated to drive R&D efforts intended
to deploy defensive measures against the future-shock threats identified in the “deadly
dozen” scenarios? This Appendix provides an in-depth examination of HSARPA’s
suitability for the counter-future-shock mission, based upon that agency’s history,
organizational culture, methods for identifying, selecting, and prioritizing projects, record
of Congressional oversight and criticism, and an analysis of the agency’s FY2014 portfolio
of R&D projects. I conclude Appendix A with a consideration of six different scenarios for
potential utilization of Pandora’s Spyglass, four of these scenarios involving HSARPA and
the DHS Science and Technology Directorate, and two of the scenarios involving DHS
contracting out the “devil’s toy box” analytical effort and management of subsequent R&D
projects to either IARPA or DARPA. I rank these six scenarios in ascending order of what
I judge to be suitability to support the homeland security enterprise’s counter-future-shock
mission, offering the qualification that such decisions will be based upon political,
budgetary, and organizational factors, perhaps more so than generalized suitability.

19
II. BEGINNING THE WINNOWING PROCESS
A. HOW TO KNOW THE DEVIL’S MIND?
In terms of our parable, the defenders would appear, at first glance, to have many
advantages over the devil. They are more numerous. They have access to more resources,
both money and material. They have the backing of virtually their entire society in their
work; however, the devil possesses one enormous advantage—that of holding the initiative.
The devil knows what is in his own mind. The defenders would give virtually anything to
possess even partial knowledge of the devil’s intentions. They expend vast sums from the
treasury and send thousands of agents into the field, employing thousands more that
monitor listening devices, all to catch the devil revealing his intentions or to gain that
information from his partners or supporters.
Sometimes the defenders get lucky. Sometimes they learn enough of the devil’s
intentions early enough that they can go on offense and upset the devil’s plans before those
plans come to deadly fruition. But the defenders know that no matter how many resources
they may sink into their surveillance and intelligence-gathering efforts, there will be times
when the devil and his toys will evade their best efforts. For those dreaded occasions,
defensive measures must already be in place to protect as many innocent lives as possible.
Yet the devil is an alchemist, a tinkerer, an inventor. To create his toys, he has all the
physical matter that man’s ingenuity has extracted from the earth for his raw materials.
Plus, he can reuse and repurpose the fruits of other persons’ benign genius for his own
malign ends, twisting those gifts of genius into dark variations undreamed of by their
original creators. To put the rancid icing on the poisoned cake, the devil can then use the
products of his alchemy, his shocking, surprising, deadly toys, at a time and place of his
choosing.
How can the defenders decide against which of a nearly infinite variety of potential
deadly toys to prepare defenses? Their money, time, and manpower are not inexhaustible;
and the devil counts upon that. The defenders must rely upon their imperfect crystal ball to
winnow down the possible universe of devil’s toys to those the devil is most likely to create

20
and those he will take the most delight in using. The most effective users of the crystal ball
will be those defenders who learn best to think the way the devil thinks.
The key to learning to think like the devil thinks?… Imagination.
*****
Perhaps the most famous and memorable quote from The Final Report of the
National Commission on Terrorist Attacks Upon the United States was its conclusion that,
of all the mistakes and missed opportunities made by the intelligence and law enforcement
sectors in the years and months leading up to the 9/11 attacks, “the most important failure
was one of imagination.”46 The planners and executors of the 9/11 attacks showed no
failure of imagination. Their judo-like use of Western civilization’s technologies—a mix
of large, commercial airliners, skyscraper office buildings, and implements as seemingly
innocuous as box cutters—has been described as a “hacking” of our high-tech society by
terrorist actors whose aggressions are “a deviant result of the innovation process that also
fuels progress inside our technologically dependent civilization.”47
Dr. Lehman’s concepts of strategic latency and emergent behavior, introduced
earlier, may be useful in analyzing the future-shock nature of the 9/11attacks.48 Prior to
the attacks on the World Trade Center and the Pentagon, the offensive capability of a box
cutter would have been considered limited and most assuredly tactical; a handheld
implement with a short blade measuring less than two inches, only enabling an attacker to
strike perhaps six inches beyond the reach of his arm, it would have been thought inferior
to such other bladed instruments as a Bowie knife or a broadsword, and certainly inferior
to projectile weapons such as throwing knives or crossbows. Yet the humble box cutter
possessed strategic latency which none of these supposedly more formidable weapons
encompassed. None of those other instruments were permitted to be carried on board a
46 The 9/11 Commission Report: Final Report of the National Commission on Terrorist Attacks Upon
the United States, Authorized Edition (New York: W. W. Norton & Company, 2004), Kindle edition, 9.
47 Rodrigo Nieto-Gómez, “Preventing the Next 9/10: The Homeland Security Challenges of Technological Evolution and Convergence in the Next Ten Years,” Homeland Security Affairs 7, no. 8 (September 2011).
48 Nacht, “Introduction,” Strategic Latency and World Power, 4; Lehman, “Unclear and Present Danger,” Strategic Latency and World Power, 5.

21
passenger aircraft by travelers at the time of the 9/11attacks. Box cutters, on the other hand,
were allowed. Limited in their deadliness, nonetheless box cutters were considered by
airplane attendants and passengers deadly enough in the hands of determined terrorists that
the humble tools compelled the attendants’ and passengers’ obedience. What had been
thought the most limited of tactical weapons—less dangerous, perhaps, than the sharp end
of a broken bottle—brought about the immediate deaths of nearly three thousand persons,
and, within a ten-year window, the deaths of tens of thousands more. Box cutters, when
guided by the minds and hands of the 9/11terrorists, directly ignited one war, the American
war against the Taliban and al Qaeda in Afghanistan, and indirectly ignited a second, the
American invasion of Iraq and the consequent counter-insurgency campaign. The strategic
aftershocks of that threatened use of a dozen box cutters are still rumbling around the world
and will likely continue to rumble and thunder for years to come.
The transportation system of large, commercial aircraft demonstrated both strategic
latency and emergent behavior on September 11, 2001. Commercial aircraft, in the
timespan of little more than half a century, evolved from piston engine-driven single-
passenger craft, weighing barely a couple hundred pounds and with a range of just a few
miles, to jet engine-driven behemoths weighing hundreds of tons, carrying several hundred
passengers across entire oceans. In the process of this evolution, the strategic latency of
passenger aircraft gathered force, as their speed, mass, and fuel load increased
tremendously. As was so dreadfully demonstrated on September 11, 2001, the destructive
power of a large passenger jetliner, when utilized as a missile, rivals that of the biggest
non-nuclear bombs in the U.S. arsenal. Apart from this strategic latency, the transportation
system of commercial passenger airliners also demonstrated unfortunate emergent
behavior on the day of the 9/11attacks. Decades of terror-related hijackings of commercial
passenger aircraft, from the 1970s through the turn of the millennium, had taught
governments, law enforcement agencies, the managers of commercial airlines, and
commercial passenger plane pilots that the safest response to terrorists’ demands on in-
flight aircraft, the response most likely to result in the survival and well-being of passengers
and crew, was to accede to the terrorists’ demands regarding control of the aircraft and its
heading. Protocols instructed pilots to land the aircraft at the location demanded by the

22
terrorists and then allow local law enforcement agencies to resolve the standoff. The
prevailing, guiding assumptions were that hijackers would issue negotiable demands and
that the longer the standoff persisted, the more likely it was that passengers would emerge
safely.49 Thus, decades of experience with aircraft hijackings resulted in the emergent
behavior of commercial passenger airlines willingly, although unwittingly, providing
guided missiles of enormous destructive power to terrorists who were willing to sacrifice
their own lives. The 9/11plotters were obviously aware of this emergent behavior, and they
took full advantage of this evolved protocol to achieve strategic surprise by behaving in a
way that previous airplane hijackers had not.
Dr. Lehman sets forth a series of hypotheses which offer a framework within which
to consider issues raised by the concept of strategic latency. He states them as follows:
(1) Weapons and technologies related to them are advancing and spreading widely, (2) lead times for exploitation by more actors are shrinking significantly, (3) intelligence information and awareness are fuzzy, (4) vulnerabilities exist that increase the risk of leveraged threats, (5) players with deadly motivations exploit latency, (6) challenges to timely response are significant, (7) norms and goals are unclear, (8) enforcement options may be unattractive or ineffective, (9) tipping points are approaching, and (10) consequences are strategic in that they alter international security relationships in important ways.50
All these hypotheses may be viewed as a restatement of key aspects of our parable
of the devil’s toy box—the devil is becoming more skilled at his alchemy; his increased
proficiency results in the production of new, deadly toys at a faster pace; and the defenders’
crystal ball is “fuzzy,” its reception of the devil’s in-progress or upcoming feats of
nefarious alchemy as indistinct and intermittent as that of an old-fashioned analog
television set when deprived of its antenna.
Zachary S. Davis asserts that the risks posed by strategic latency are both increased
and made harder to detect and predict by the fact that research, development, and
implementation of many key cutting-edge technologies are no longer under the control of
49 9/11 Commission Report, 84-85.
50 Lehman, “Unclear and Present Danger,” Strategic Latency and World Power, 6.

23
governments. He states that “(p)otentially world-changing technologies in biology, lasers,
nanotechnology, space, and computers are essentially ungoverned;” to this list of
strategically latent, dual-use technologies he adds breakthrough developments in advanced
materials science, robotics, and medicine.51 He characterizes the challenge posed to
national security by strategic latency as being twofold: “black swan” strikes, which may
either encompass innovative uses of older technologies or unforeseen, bolt-from-the-blue
uses of cutting-edge technologies; and threats that emerge so gradually and innocuously—
hidden in plain sight—that they may remain undetected by the homeland security
apparatus.52
The term “Promethean technology(ies),” as best as I can discern, was first
introduced by economist Nicolas Georgescu-Roegen in 1979 in the context of an article,
“Energy and Matter in Mankind’s Technological Circuit,” that discussed entropy and
sustainable technologies. Georgescu-Roegen listed two Promethean technologies, or
technologies that had granted mankind the ability to alter the environment; these were fire
and the heat engine.53 Technologist Ted G. Lewis uses the terms “Promethean fire” and
“Promethean challenge” to help explain the development of technology and the internet,
describing disruptive technologies such the railroads and the internet as “Promethean” in
the sense that they are powerful, yet dangerous, offering enormous new creative
capabilities to their users and yet also laden with latent dangers.54 However, regarding my
use of the term “Promethean technologies” throughout this thesis, I grant to it a meaning
more focused upon homeland security concerns than either Georgescu-Roegen’s or
51 Zachary S. Davis, “Ghosts in the Machine: Defense Against Strategic Latency,” in Strategic
Latency and World Power: How Technology is Changing Our Concepts of Security, ed. Zachary Davis, Ronald Lehman, and Michael Nacht (Livermore: Lawrence Livermore National Laboratory Center for Global Security Research, eBook edition, 2014), 22.
52 Ibid., 23.
53 Cutler J. Cleveland, “Biophysical Constraints to Economic Growth,” in Encyclopedia of Life Support Systems, ed. D. Al Gobaisi (Oxford, UK: EOLSS Publishers Co., 2003), 7, https://www.peakoil.net/files/biophysical%20constraints%20to%20economic%20growth%20by%20Cleveland.pdf.
54 Ted G. Lewis, “Cybersecurity: The Promethean Challenge” (classroom lecture, The Internet, Society, and Cyberconflict, Center for Homeland Defense and Security, Monterey, CA, October 16, 2017).

24
Lewis’s definitions: any technology which grants to its possessors, persons with average
resources, skills, abilities, and intelligence, capabilities that formerly had only been
available to governments, military establishments, or large resource laboratories (or
perhaps not even available to those institutions). Promethean technologies are those
technologies that combine elements of strategic latency and emergent behavior and thus
threaten to create situations of strategic surprise when directed against a population, critical
national infrastructure, significant national symbols, or the homeland security enterprise.
Just as Prometheus’s mythical gift of fire to man gave mankind powers which had formerly
been available only to the gods, so do modern Promethean technologies grant to ordinary
individuals and small groups capabilities formerly attainable only by large, well-funded
institutions.
The homeland security enterprise’s defensive role against potential malign uses of
established and emerging technologies is made even more complex by the fact that
strategically latent technologies do not exist in a vacuum; they can be combined to work
with one another in ways unforeseen by their developers. In terms of our parable, I speak
now of the devil’s skill in the art of alchemy. Nieto-Gómez postulates that the phenomenon
of combinatorial evolution of technology, as outlined by Bryan Arthur, continually opens
up fresh vulnerabilities within our technologically dependent society, in an ongoing,
unpredictable dynamic.55 He further asserts that, since not all malign innovations can be
predicted, two of the central dictates offered by the 9/11 Commission in their final report—
that intelligence agencies and the homeland security community must strive to always
“connect the dots” and that exercise of imagination must be bureaucratized, or made
routine within the intelligence and homeland security bureaucracies—are unachievable or,
at best, ineffectual.56
Should one possible interpretation of Nieto-Gómez’s assertions be accurate—that
he believes the innumerable varieties of the devil’s alchemical efforts, complexities
bestowed by technological systems’ inherent strategic latency, emergent behavior, and
55 Nieto-Gómez, “‘Power of ‘the Few,’” 5-8.
56 “Preventing the Next 9/10,” 4.

25
potential combinatorial evolution, render any crystal ball used by defenders ineffectual, or
that the defenders’ bureaucratic culture so cripples them that they are unable to make good
use of any crystal ball—I must disagree. This interpretation of Nieto-Gómez’s thinking
may be off the mark. I hope it is, for if this interpretation of his thinking reflects strategic
realities, the only possible response from the homeland security is a reactive one—waiting
for innovative strikes using Promethean technologies to hit, and then formulating defenses
based on what has been painfully learned. The aim of this thesis, however, is to suggest
that the homeland security enterprise can take a more proactive stance against the threats
of emerging Promethean technologies, if it chooses to.
My intention is certainly not to show that any forecasting method or combination
of methodologies is infallible, or anywhere near infallible. My objective is to suggest a
feasible method of “better than nothing” prognostication that combines the best features of
already tested methods, one that, I hope, can counteract some of those methods’
shortcomings. My goal is to take what has already been done in the field of prognostication
and make it incrementally better and more usable for its prospective customers, the
homeland security leaders most concerned with countering potential future-shock threats.
I hypothesize that a crystal ball sorts is attainable, imperfect though it may be, and that the
defenders’ bureaucratic culture (optimized for the homeland security enterprise’s systemic
mission and thus made non-optimal for the counter-future-shock mission) can be altered
and its deleterious aspects overcome, given enough will on the part of leadership and staff.
Insight into the devil’s thinking will not come all at once, in a burst of helpful
illumination. Insight, the reward of effective use of a crystal ball, will in this case be the
result of a deliberate process. To be most useful to the homeland security enterprise, this
process needs to be repeatable. It must not be haphazard, or the fortunate outcome of one
or a few especially gifted analysts making lucky stabs in the dark. Too much is at stake,
both the lives of innocents and precious resources that will be expended by the shield
makers in efforts to protect those lives, to rely purely on good fortune and lucky hunches.
The process of insight, as best as possible, must be routinized.
Where to begin? What is Step One of using a crystal ball? Does it have an “on”
switch?
26
B. FUSE AND THE PROBLEM OF PROMETHEAN TECHNOLOGIES
The first step in gaining insight into the devil’s intentions, in winnowing down
those emerging technologies that are most likely to pose a significant threat to the Nation’s
homeland security and are most likely to be used by malign actors, is this: identifying
which emerging Promethean technologies have “legs” and are likely to be developed into
producible, usable products that grant end-users significant or revolutionary new
capabilities. Fortunately for the homeland security enterprise, information technology can
act as a force multiplier, using algorithms to automatically sift through vast troves of
worldwide data and dig up those emerging technology “nuggets of gold” hidden within
gargantuan deposits of false leads. In 2011, the Intelligence Advanced Research Projects
Activity (IARPA), a branch of the Office of the Director of National Intelligence, launched
the Foresight and Understanding from Scientific Exposition (FUSE) Program; its goal was
to develop automated procedures for gathering, winnowing, and analyzing patterns of
technological emergence by continuously monitoring publicly available scientific, patent,
and technical literature from around the world.57 Program manager Dewey Murdick, in a
presentation delivered at the 2011 Graph Exploitation Symposium, defined the FUSE
Program’s goal as tracking technical emergence, “the process whereby innovative ideas,
capabilities, applications, and even entirely new fields of study arise, are tested, mature,
and if conditions are favorable, make a significant impact,” by “scan(ning) the horizon” on
the lookout for “the early signs of technical emergence” so as to enable the U.S. to “take
advantage of the resulting capabilities and applications” and “gain a significant competitive
edge.”58 Raytheon BBN Technologies was selected as the developer for FUSE and was
awarded $5.2M for the first phase and $1.7M for the second phase of development.59
57 “IARPA Launches New Program to Enable the Rapid Discovery of Emerging Technical
Capabilities,” Office of the Director of National Intelligence website, September 27, 2011, https://www.dni.gov/index.php/newsroom/press-releases-2011/327-iarpa-launches-new-program-to-enable-the-rapid-discovery-of-emerging-capabilities.
58 Dewey Murdick, “Foresight and Understanding from Scientific Exposition (FUSE)—Incisive Analysis Office” (PowerPoint presentation at the 2011 Graph Exploitation Symposium, August 9-10, 2011), 2.
59 “Raytheon BBN Technologies awarded additional funding to enable early awareness of emerging technology: Program to automate big data search, indexing and analysis,” PR Newswire, May 28, 2013.

27
A promising step, certainly. Yet for the shield-makers of the homeland security
enterprise, with their limited budgets, staffs, and resources, the process of winnowing down
the ranks of those emerging technologies that could become the terror tools of the future
would only begin with the use of a tool such as FUSE. As has already been noted, analyst
Zachary Davis has identified potentially world-changing developments in the fields of
biology, lasers, nanotechnology, space, computers, advanced materials science, robotics,
and medicine, with many of these developments proceeding essentially ungoverned by
governmental authorities or ruling standards bodies.60 To Davis’s list I can add other
technologies rising on the horizon—autonomous automobiles, the Internet of Things,
modular fission reactors, fusion power plants, commercial space travel, asteroid mining,
do-it-yourself genetic engineering, micro-drones, and bio-machine hybrids (cyborgs). The
users of my proposed analytical crystal ball must also consider the almost innumerable
ways these various technologies and their products (industrial, military, and consumer)
could be combined in unforeseen and malign fashions, fusions not anticipated by their
creators.
Therefore, a tool such as FUSE may be extremely helpful as an initial discovery
and sifting device, but use of FUSE, or its equivalent, falls far short of functioning as a
crystal ball on its own. Even sifting down two hundred elements the devil might opt to use
in his alchemy to merely twenty still leaves the necessity, for the defenders, of making
choices. To illustrate this point, let us consider just two emerging technologies that may
likely tempt the devil—computer-enabled, “home brew” genetic sequencing kits such as
CRISPR, and 3D printers. These two innovations have a basic quality in common: they are
Promethean in nature. Just as Prometheus stole fire from Zeus and gave it to mankind,
vastly increasing the power of formerly puny humanity, these new tools grant the ability to
accomplish technological feats formerly only achievable by large, complex institutions,
such as research universities, medical foundations, government labs, or manufacturing
firms, to ordinary individuals possessing little more than an enterprising spirit, a home
computer, and a few hundred dollars. Prometheus gave fire to all mankind, not just to a
60 Davis, “Ghosts in the Machine: Defense Against Strategic Latency,” in Strategic Latency and
World Power: How Technology is Changing Our Concepts of Security, 22–23.

28
vetted few. Some chose to use fire to cook their meals and to warm their hearths. Others
chose to use it for the smelting of metal into superior weapons, or for setting enemies’
towns ablaze. These Promethean tools are the sorts of force-multiplying implements that
can act to make the “super-empowered angry guys” mentioned earlier so super-
empowered.
I will first ponder CRISPR. Daniel M. Gerstein, an analyst at the RAND
Corporation and formerly the DHS Science and Technology acting under secretary and
deputy undersecretary, has written that
CRISPR differs from other proliferation threats. The novelty and importance of CRISPR is not that it can enable the genetic editing of a pathogen—tools for this have been available for decades. What CRISPR does is make the technology widely available, allowing even largely untrained people to manipulate the very essence of life. CRISPR-based kits go for less than $500 in some cases, with pathogen-specific kits—West Nile virus, human coronavirus 229E, human adenovirus 35, to name a few—offered up like so many choices at a grocery store. Companies selling these kits are certainly not keeping registries of buyers or attempting to control the technology beyond the intellectual property that has been invested. The kits come with operator manuals that have only minimal warnings about containing hazardous materials and being for laboratory use only.61
Gerstein’s article poses the question of whether the invention and distribution of
CRISPR has made the Biological Weapons Convention, an international treaty that
outlawed the development and use of biological weapons, obsolete. The treaty, written and
ratified in the early 1970s, emerged from the then-current paradigm of national
governments being the only institutions with the technical ability to develop and produce
biological weapons. Accordingly, the treaty’s provisions revolve around controls on
exports, non-proliferation regimes, and inspections of government labs and facilities.
CRISPR, by making capabilities formerly available only to government, military, or
academic labs easily accessible to the public for the price of a mid-range television set, has
made such provisions, if not obsolete, then certainly grossly inadequate to the present
situation. As Gerstein notes, “(t)raditional verification based on quotas for proscribed
61 Daniel M. Gerstein, “Can the Bioweapons Convention Survive Crispr?,” Bulletin of the Atomic
Scientists, July 25, 2016, http://thebulletin.org/can-bioweapons-convention-survive-crispr9679.
29
items, restrictions on use, and intrusive inspections is simply not an option for this new
technology; counting pathogens or conducting exhaustive inspections of biological
facilities is an infeasible and impractical way to monitor CRISPR usage and would not
increase confidence in compliance.” His suggestions for solutions are vague; he states that
scientists will need to be the primary defenders against the new dangers posed by CRISPR
and associated technologies and that they and their national governments will need to
invent new surveillance technologies to detect non-natural pathogens. He envisions an
altered, somewhat diminished role for the Biological Weapons Convention, seeing it as a
tool to pressure national governments into providing better training for scientists and lab
technicians and investing in new surveillance technologies.62
Providing additional insights on the potential dangers posed by gene editing
systems such as CRISPR, Eben Kirksey notes that synthetic lifeforms, or GMOs
(genetically modified organisms), routinely escape from government and commercial labs.
He shares the story of bioartist Adam Zaretsky, who, while working as a visiting professor
at San Francisco State University, accidentally released genetically modified fruit flies
from his lab, stirring controversy when he reported the incident. Later, to bring attention to
the issue of GMOs mistakenly released into the environment, he created his own GMOs
using CRISPR and purposefully released them into the wild. Kirksey points out that the
evolving biohacking movement, encompassing both bioartists and pranksters, has attracted
the attention of the FBI, resulting in a raid on the Buffalo, New York home of a founder of
the Critical Art Ensemble; agents clad in bio-hazard gear uncovered only harmless bacteria.
The homeland security enterprise should not count on this always being the case, however.
Also, given the private, surreptitious nature of the use of a home-based technology such as
CRISPR, should the FBI and other law enforcement agencies make a concerted effort to
crack down on potentially harmful uses of this tech and its equivalents, they will have their
hands full. Kirksey further writes that an Indiegogo campaign launched by an activist
seeking to “democratize science” raised $45K to provide $130 CRISPR kits for all takers;
the kits included donor bacterial DNA as well as full instructions for how to modify it. The
62 Ibid.

30
genie has escaped his bottle; in fact, he has pulverized his bottle and scattered its shards to
the four winds. Kirksey may be charmed by the glowing green bunny rabbit made
luminescent by jellyfish genes inserted into its DNA. But after describing such an adorable
creation, something the pet industry would love to market, he then focuses on the E. coli
bacteria, commonly available from biological supply companies, which had been worked
over by the bioartists of the Critical Art Ensemble. Had their intention not been to create
new forms of bio-art, but rather to indiscriminately sicken and kill, the gene splicers could
have inserted DNA from the more virulent strains of E. coli, which can cause severe
diarrhea, bleeding, fever, and sometimes death, into insects that commonly come into
contact with people, then set them loose.63
I’ll now turn to another Promethean tool, 3D printers. 3D printers, as the name
implies, compile 3D shapes and objects from patterns downloaded to the printer from
online schematics; devices currently available for home use utilize plastic as their building
material. Robert J. Bunker provides an overview of the rapid application of this new
technology to firearms. The first printed firearm, a single-shot plastic pistol known as the
Liberator, was created in 2013. Since then, the craft of 3D-printed firearms has progressed
rapidly, and the next anticipated breakthrough in 3D printing will be the substitution of
aluminum for plastic as a building material, which will allow for the printing of high-
powered, semi-automatic rifles, such as AK47s. The federal government forced the creator
of the Liberator 3D-printed gun schematics to remove those schematics from the Internet.
But just as pirated music, movies, and software have proliferated across the Internet despite
international bans, we can expect the same difficult-to-obstruct proliferation to occur
regarding online schematics for toys from the devil’s toy box, not limited to guns. Although
as of 2015, the date of the article’s writing, no known use of 3D-printed firearms had been
made by terror organizations, criminal cartels have shown an interest in the technology,
and Bunker postulates that it is likely terrorists have not made use of 3D printing to date
simply because it is so much more convenient for them at present to acquire conventional
firearms on the black market, or from government arsenals in poorly governed countries.
63 Eben Kirksey, “Who is Afraid of CRISPR Art?,” Somatosphere.net, March 19, 2016,
http://somatosphere.net/2016/03/who-is-afraid-of-crispr-art.html.

31
Bunker feels terrorists may become far more interested in 3D printing, however, once the
confluence between firearms and remote computerized controls facilitates remote-
controlled sniping weapons. A Texas commercial firm briefly marketed the Live-Shot
system in 2005, which allowed disabled hunters to fire pre-placed deer rifles from controls
on the Internet. Political revulsion against the idea of video-game-type hunting of deer
resulted in the product being banned, but there is no reason to expect such Internet-firearms
synergistic developments will not continue and improve. In 2013 and 2014, the Free Syrian
Army made battlefield use of remotely controlled sniper rifles to avoid counter-sniper fire.
Bunker foresees future terror applications of the 3D-printed firearm-Internet synergy in the
areas of remote sniping, virtual targeting presence (being able to remotely keep a weapon
aimed at a target under remote surveillance), and virtual combined arms (remotely carrying
out sophisticated, layered attacks involving both firearms and explosives).64 Regarding
terrorism on a potentially exponentially larger scale, the U.S. Defense Threat Reduction
Agency (DTRA) is sponsoring research through the Project on Advanced Systems and
Concepts for Countering WMD, a component of the Naval Postgraduate School’s Center
on Contemporary Studies, to determine the likelihood of currently available (as of 2016–
17) 3D printing technologies to subvert nuclear export ban regimes. The danger they
foresee is that these technologies may provide rogue regimes and terror organizations with
easy access to 3D-printed centrifuges and other technological implements required for the
nuclear fuel cycle.65
With these two Promethean technologies in mind, I’ll perform a simple analytical
experiment. Let’s postulate we are the managers of a homeland defense research and
development agency focused on countering future-shock threats. We have $20M to spend
on R&D for the upcoming fiscal year, and we must spend the entirety of that $20M on a
64 Robert J. Bunker, “Home Made, Printed, and Remote Controlled Firearms—Terrorism and
Insurgency Implications,” TRENDS Research & Advisory, Terrorism Futures Series, June 21, 2015, http://trendsinstitution.org/homemade-printed-and-remote-controlled-firearms-terrorism-and-insurgency-implications/.
65 Center on Contemporary Conflict, “Use of 3D Printing to Bypass Nuclear Export Controls” (Monterey, CA: Naval Postgraduate School, Center on Contemporary Conflict, CCC-PASCC Research in Progress Ripsheets, October 2016), http://hdl.handle.net/10945/50621.

32
single project; our two alternatives, the two future-shock threats we are considering
developing counters for, are genetic sequencing kits and 3D printers. How should we
decide between the two options? Where would we begin? What questions should we
initially ask?
Fortunately for us, the Defense Threat Reduction Agency has also focused on this
analytical challenge. The DTRA’s Advanced Systems and Concepts Office (DTRA
ASCO) worked with the Science Applications International Corporation (SAIC) from 2006
to 2009 on what came to be known as the “Evil Genius study,” the results of which were
published in the April 2009 monograph, Thwarting an Evil Genius.66 The genesis of this
study may be said to be found in the following observation:
[T]here are obvious limits to the imagination that prevent us from predicting which among the endless number of nightmare scenarios an intelligent terrorist will choose. … [T]he impulse to defend against every conceivable attack … can be self-defeating—we would simply spend ourselves to economic collapse. Nonetheless, a small number of attack scenarios, by their ease of execution and the magnitude of their effects, require extraordinary countermeasures.67
In selecting their “Evil Genius” scenarios, the authors stipulated that the scenarios
must combine tremendous negative impact with relative ease of execution. Additionally,
such attack modes must be plausible (in this context, I will define “plausible” as a project
that, in the view of a reasonable person, is achievable given the resources—time, material,
understanding, manpower, and funding—which can reasonably be expected to be
available), innovative (the authors assigned additional points for innovation for those
attacks that could likely catalyze cascading, second- and third-order consequences, by
pushing defenders into self-harmful overreactions), and inexpensive.68 The authors
contrasted their ten “Evil Genius” scenarios with the fifteen National Planning Scenarios
66 Dallas Boyd et al., Thwarting an Evil Genius: Final Report (Washington, DC: Defense Threat
Reduction Agency Advanced Systems and Concepts Office, April 13, 2009), https://fas.org/irp/agency/dod/dtra/thwart.pdf, 7.
67 Ibid., 9.
68 Ibid., 12-13.

33
identified by the Homeland Security Council in 2004. Twelve of the fifteen NPSs involved
man-caused disasters, with the other three being natural events. They suggested a
comparison of the two lists would be instructive for homeland security planners and would
indicate shortcomings in existing homeland security doctrine.69 For purposes of the study,
the authors grouped their notional attackers into three categories (while allowing that there
could be many others): jihadists, who value casualties and negative psychological impacts
above all other outcomes; nihilists, who may be fulfilling a desire to strike back at society
or financially enrich themselves, but who lack the jihadist’s desire for mass casualties; and
thrill seekers, who primarily seek notoriety but who will also place a high value on avoiding
capture.70
The “Evil Genius” risk tool divides the consequence of attacks into two
subcategories, prompt effects (which include casualties and physical damage) and human
response effects (second- and third-order effects, including psychological changes in the
general population, the responses of government to the attack, and economic impacts).71
The authors place great emphasis on the importance of the latter. They stress the necessities
to build a public culture of resilience and for government to avoid counterproductive, self-
defeating responses, pointing out that the bulk of a terror attack’s negative consequence
often falls within the realm of human response effects.72
Getting back to my thought experiment, in this instance I have presumed that FUSE,
or a comparable system, has identified two looming Promethean threats the homeland
security enterprise should consider countering. Yet the enterprise only has resources to
counter one of those threats. The “Evil Genius” study provides the intellectual foundation
for a set of opening questions that homeland security managers could use in making their
decision. These questions, as I have compiled them, include:
69 Ibid., 14-15.
70 Ibid., 24.
71 Ibid., 20.
72 Ibid., 28-30.

34
What are the prompt effects which could result from a malign use of the identified
technology/threat vector? What magnitude of consequences could result?
What are the human response effects that could result? What could be the
magnitude of consequences?
How accessible to potential malign actors are the products of the identified
emerging technology? How much technical skill or training would be required to use
them? How much manpower? How much planning?
How expensive are the products of the identified emerging technology? How
affordable are they for individual malign actors? For international terror groups?
Let us apply these questions to our two Promethean technologies and see how those
technologies stack up as potential toys in the devil’s toy box: see Table 1.
Table 1. Comparison of Gene Splicing Kits and 3D Printing Tech on “Evil Genius” Questions
“Evil Genius” Question
Gene Splicing Kits (CRISPR)
3D Printing Technologies
Prompt effects?
Spread of infectious diseases; could cause illnesses or deaths; if infectious agent is unknown to medical science, currently available antibiotics and cures might prove ineffective, leading to an uncontrollable outbreak, potentially an epidemic
Firearms made from plastics or other non-metals could be easier to sneak aboard passenger aircraft or other public transportation conveyances; targeted assassinations would require less manpower, potentially less skill if computer guidance is added to the remote weapon; could potentially allow rogue regimes and large transnational terror organizations to complete their nuclear fuel cycles and create atomic weapons

35
“Evil Genius” Question
Gene Splicing Kits (CRISPR)
3D Printing Technologies
Magnitude of consequences?
Potentially very great; could cause massive resource drain in medical and public health sectors; if epidemic results, could harm the economy
Most likely consequences (use of plastic firearms or remote-controlled firearms) are low to moderate on a societal scale; less likely consequences (fabrication of parts which allow the completion of a nuclear fuel cycle) are potentially extremely high
Human response effects?
Knowledge of and rumors of a new, unknown pathogen and a spreading outbreak could cause widespread panic, leading to large numbers of people avoiding public places, not going to work, pulling their children out of school, not going to stores
Human response effects in the case of the more likely consequences (use of plastic firearms or remote controlled firearms) would be low, because to the public, these home-brewed weapons would not represent a paradigm shift or even much of a noticeable change from the weaponry already used by criminals and terrorists; should, however, the tech be used to complete the nuclear fuel cycle, the human response effects could be very significant, as panic spreads over terrorists’ possible deployment of a deliverable nuclear weapon
Magnitude of consequences?
Potentially very great; widespread panic would adversely impact the economy, and large numbers of employees staying home from work could adversely impact other vital infrastructure sectors
In the case of mild human response effects, the magnitude of consequences would be low; in the case of very significant human response effects (panic over potential nuclear strikes), the public response could push the government and military into counter-productive overreactions
Accessibility to malign actors?
Highly accessible over the Internet
Highly accessible over the Internet

36
“Evil Genius” Question
Gene Splicing Kits (CRISPR)
3D Printing Technologies
How much technical skill & training required?
At present, at least an undergraduate-level background in biology is required to formulate and gene splice an entirely new pathogen; creating lesser, known pathogens using genetic material from sources such as e. coli requires less educational background
High levels of technical skill are required on the part of those individuals who upload schematics of various weapons or components to be printed, but virtually no technical skill is required for the end user who benefits from the former’s intellectual efforts; this calculus changes, of course, in the case of a vastly more sophisticated project, such as the creation of a nuclear fuel cycle and the assembly of a working nuclear weapon
How much manpower needed?
Minimal; equipment can be operated by a single individual
To fabricate relatively simple, man-carried weapons such as firearms, a lone individual can use a 3D printer
Affordable for transnational terror groups?
Yes Yes
Affordable for lone malign actors?
Yes Low-level 3D printers are currently affordable to many individuals; higher-level 3D printers which utilize aluminum or other metals as a feed stock are presently only affordable for businesses or wealthy individuals
From a first glance at our chart, were I an analyst working for our hypothetical
homeland security R&D operation, I would recommend programing the $20M towards
research projects to counter, defend against, and mitigate the impact of gene-splicing kits
such as CRISPR. My reasoning? The more likely usages of 3D printer technologies by
malign actors would not represent a paradigm shift or major change from the weaponry
already used by terror and criminal groups and bad actors. Rather, easier accessibility to a
variety of firearms of varying capability and the addition of remote-control features to
firearms represent incremental improvements to the devil’s toys. Human response effects

37
will likely be very low, if they are present at all; only law enforcement agents will take an
interest in where and how malign actors acquired or fabricated their firearms. To members
of the public, a gun is a gun is a gun. By way of contrast, gene-splicing kits such as
CRISPR, especially when combined with the sort of “Genetic Manipulation for Dummies”
guide provided by the “democratizing science” activist with his Indiegogo campaign, can
provide a paradigm-shifting new capability to individual malign actors or terror cells by
giving them access to biological weapons formerly only creatable by large, government-
or military-sponsored labs. Even failed attempts by malign actors to create a viable
biological weapon, if the attempt is publicized widely enough, could create very damaging
human response effects with high-magnitude consequences; fear of the unknown is a potent
inciter of panics. Apart from the activities of malign actors, homeland security and public
health sentinels need to be alert to the possibility of accidental release of malign biological
entities created with gene-splicing kits. Hobbyists may not intend to cause harm, but,
through carelessness or error, may produce harms no less significant than those caused by
persons acting with malign intent. This possibility does not exist (or exists to a greatly
decreased extent) for hobbyists’ use of 3D printers; printed firearms do not fly or crawl out
of hobbyists’ homes on their own.
If the use of 3D printer technology to create atomic weapons were to be judged a
higher likelihood than I have in Table 1, my resource allocation decision between the two
Promethean technologies would become far more difficult; however, as an analyst, I judge
the likelihood of malign actors using 3D printing technology to complete the nuclear fuel
cycle to be significantly lower than that of malign actors using gene-splicing kits to create
harmful biological agents. My reasoning is that biological expertise is more widely
distributed than nuclear weaponry expertise; “Genetic Manipulation for Dummies” guides
are more ubiquitous and produced by a larger group of potential authors than (presently
nominal) “Precision-Machined Parts to Complete the Nuclear Fuel Cycle for Dummies”
guides (i.e.: schematics to download to high-end 3D printers), which could be authored by
a far more limited number of specialized industrial and engineering sources. Such sources
have no economic incentive to put their proprietary schematics on the internet and enable
their own competition (unless they are doing so for ideological or mercenary reasons, such

38
as those of Dr. Khan, father of the Pakistani nuclear program, or of Russian nuclear
engineers who lost their employment and incomes after the dissolution of the Soviet
Union). Also, due to their relatively small population, such authors would be far easier for
homeland security and Intelligence Community (IC) agents to track down, compared to the
authors of gene-splicing how-to guides.
So, in this hypothetical instance of a binary resource allocation choice between two
Promethean technologies, use of the “Evil Genius” questions as an analytical and decision-
making guide seems, on its face, to be adequate; however, a reader would not be out of line
to ask: “But what if, rather than just two Promethean technologies, FUSE (or a system akin
to it) had identified twenty emerging technologies of concern? How useful would the ‘Evil
Genius’ questions, on their own, be for making resource allocation decisions in that
situation?”
In response, an analyst might be tempted to create a risk evaluation chart assigning
a different column to each of the “Evil Genius” questions and a different row to each of
the emerging Promethean technologies, assign color values (Green=Low;
Yellow=Moderate; Red=High) or numeric values (1=Low; 5=Moderate; 10=High) to the
various likelihoods of negative impacts and severities of consequences, perhaps put in
some weighting values to assign more significance to certain factors, run the numbers (or
colors), and call it a day. One could choose to allocate R&D funding to projects regarding
the three top-risk-scored technologies out of the twenty. Why go any further? The decision-
making process outlined above has the advantages of being simple, cheap, quick,
replicable, easily documentable, and can be performed by any analyst with a modicum of
intelligence and familiarity with the subject matter area. What’s not to like?
Well, let’s look at some of the assumptions I made as an analyst in the binary
resource allocation exercise above. Full disclosure: my professional background is in
acquisition and program management, IT procurement, supplemental nutrition program
management, personnel management, and writing science fiction and horror novels. When
it comes to science and technology, I am strictly a layman; the knowledge I possess in those
areas has come from research I have done for various novels and for my master’s degree
studies in homeland security. With this in mind, let’s reconsider the following assumptions

39
that guided my decision to select gene-splicing kits, rather than 3D printing, as the
Promethean technology more urgently requiring $20M in R&D funding for defense and
mitigation programs.
Regarding gene-splicing kits, I assumed that readily available, online
technical guidance would make it comparatively simple and easy for an
evil-intentioned layman or a careless hobbyist to produce harmful
genetically modified organisms that would be viable in the wild and could
cause illness, disease, and death for a large group of human victims. A
trained biologist or geneticist might very well make a far different and
better educated assumption than mine.
Regarding 3D printing technology, I based my risk assessment on just two
possible uses: a low-consequence use, the printing of firearms, and a high-
consequence use, the printing of precision-tooled parts required for the
completion of the nuclear fuel cycle. A different analyst, one with a more
potent imagination than mine or more of a military or intelligence
background, could likely vastly expand the list of possible uses beyond
just these two. In fact, now that I’ve put on my science fiction writer’s hat,
I realize that 3D printing tech could also “democratize” the availability of
weapons systems such as lasers, ground-to-air missiles (perhaps based on
modifications to commercially available hobbyist drones), electromagnetic
pulse devices, and devices that could turn off or disrupt medical
equipment implanted in patients, such as electronic pacemakers. Had I
thought of this before filling in my chart above, or had an analyst with a
better technical, military, or IC background filled it in instead of me, the
resulting risk scores could very well have gone the other way, favoring a
$20M expenditure to defend against the potential malign uses of 3D
printing, rather than gene-splicing kits.
Also, regarding 3D printing technology, I assumed a low likelihood that
detailed online schematics for nuclear fuel cycle and weapons components

40
would be available for malign actors to download to their printers’
memories. An analyst with better knowledge than mine, perhaps an IC
analyst who has familiarity with top secret intelligence regarding rogue
nuclear engineers, could very well make a far different assumption, which
in turn would flip the resource allocation decision I’ve outlined above.
So, with all these fresh caveats in mind, the notion of using the “Evil Genius”
questions to create a risk assessment chart, and then basing our resource allocation decision
purely on the outputs derived from this chart, now appears much less adequate than it did
before. These sorts of caveats become increasingly vexing as the number of Promethean
technologies under consideration grows and the consequences of making inaccurate or ill-
informed assumptions snowball.
Relying upon color-coded or ordinal, numeric ranking-based risk assessment charts
to guide resource allocation decision-making poses other problems that can skew the
effectiveness of the decision-making process. Douglas W. Hubbard, in his book The
Failure of Risk Management: Why It’s Broken and How to Fix It, describes the basic flaws
inherent in these types of tools.73 Regarding ordinal rankings (1–2–3, Low-Medium-High),
Hubbard’s biggest concern is the lack of precision in these rankings and what that lack of
precision can incorrectly imply. Say a risk analyst is attempting to assess the risks to an
airport terminal. As part of her risk assessment chart, she ranks the severity of possible
casualties. She decides that Low equals zero casualties, Medium equals 1–9 casualties, and
High equals 10 or more casualties. In this model, a change of just one casualty, from 9 to
10, changes the Casualty Severity ranking of a scenario from Medium to High. If the
analyst is calculating a combined risk score, Low may be assigned a 0, Medium a 1, and
High a 2. So, in terms of the risk score calculation, an 11% change in the casualty variable
(from 9 to 10) equates to a 100% change (from 1 to 2) in the number that is fed into the
combined risk score calculation. Hubbard divides the most commonly used risk scoring
73 Douglas W. Hubbard, “Worse Than Useless: The Most Popular Risk Assessment Method and Why
It Doesn’t Work,” in The Failure of Risk Management: Why It’s Broken and How to Fix It (Hoboken, New Jersey: John Wiley & Sons, 2009), 117–143.

41
methods into two categories, additive weighted scores and multiplicative risk matrices. He
states the following types of flaws apply to both methods: (1) skewing which results from
human cognitive distortions regarding perception of uncertainty and risk; (2) subjective,
differing interpretations of the definitions of ordinal scores (Low-Medium-High) among
users and observers of the risk matrices, despite attempts to thoroughly define what those
scores mean; and (3) errors induced by the very structure of the scoring schemes, as I have
illustrated above.74
So, were my hypothetical homeland security analyst trying to properly perform
R&D resource allocation among various emerging Promethean technologies, and he or she
made do merely with a risk assessment matrix developed from the “Evil Genius” questions,
that resource allocation decision would be hobbled by many limitations and flaws. These
include a lack of knowledge; unchallenged and possibly incorrect assumptions; potential
variables that are overlooked and not considered in the decision; and a flawed risk matrix
scoring scheme that can inaccurately magnify differences among variables. Not an ideal
situation, to say the least, especially not when hundreds, thousands, or possibly even
millions of lives may be affected by the decision.
Therefore, if we were to stop our crystal ball development program at this point,
users of our crystal ball would find it to be infused with octopus ink; those black clouds
would only occasionally recede enough for observers to see anything at all, and those
intermittently revealed visions would be hazy and untrustworthy. Making use of a tool such
as FUSE, then applying the “Evil Genius” questions as an analytical frame, are only two
initial steps. They do not represent the entirety of a predictive analysis procedure that can
effectively guide homeland security R&D efforts to counteract whatever evil toys may
burst out of the devil’s toy box. Our objective cannot be the fabrication of a perfect crystal
ball, for perfect knowledge of future events is not attainable; however, what we must strive
for is an improved crystal ball, with the flaws of analysts’ limited knowledge, incorrect
assumptions, ignored or overlooked variables, and analytical errors introduced by risk-
measurement schemes ameliorated as best we can manage.
74 Ibid., 122–123.

42
Fortunately for the homeland security enterprise and the public that relies upon it,
several sets of predictive analysis techniques have been developed since the end of World
War II that we can press into service in our effort to improve the clarity and accuracy of
our crystal ball. These techniques include expert analysis (the Delphi technique and the
nominal group technique, which are both formal procedures for eliciting the input of
subject matter experts, and futures studies/foresight studies, both a field of academic study
and a set of commercial and governmental processes that utilize various techniques of
eliciting expert input), red-teaming (formal analytical procedures designed to reveal and
counteract inaccurate preconceptions and to allow users to “see through the adversaries’
eyes”), and the use of a futures or predictions market or a prediction poll (benefiting from
the wisdom of the crowd). The next seven chapters will examine how these three types of
predictive analysis techniques might be used to improve our crystal ball; the strengths,
advantages and limitations of each technique; factors to be considered in selecting expert
analysts; and how elements of some or all the techniques might be used in conjunction by
homeland security analysts. The culmination of all this consideration comes in Chapter IX,
when I set forth my recommended procedure, one I have named Pandora’s Spyglass. My
examination of best practices derived from predictive analysis techniques starts with the
set of techniques designed to elicit and amalgamate expert opinion; the first I consider is
the Delphi technique.

43
III. EXPERT ANALYSIS (1): THE DELPHI TECHNIQUE
A. DELPHI TECHNIQUE: INTRODUCTION
Olaf Helmer, one of the inventors of the Delphi technique, had this to say in 1967:
“Fatalism… has become a fatality. The future is no longer viewed as unique, unforeseeable,
and inevitable; there are, instead, a multitude of possible futures, with associated
probabilities that can be estimated and, to some extent, manipulated.”75
The Delphi technique was created in the wake of history’s most cataclysmic
conflict, World War II. The cruel necessities of war have often served as an accelerator for
new technologies. The Crimean War saw the introduction of iron-armored floating
batteries for assaults on coastal fortresses. The American Civil War witnessed the first ship-
to-ship clashes between armored warships, the first use of a submarine and its spar torpedo
to sink an enemy warship, and the use of lighter-than-air observation platforms, balloons,
to allow military scouts to describe to their commanders, using wired telegraph machines,
the dispositions of enemy troops. The Russo-Japanese War introduced the widespread use
of locomotive torpedoes, machine guns, and trench warfare. The static trench warfare of
World War I necessitated the deployment of new weapons—poison gas, mechanized tanks,
and heavier-than-air aircraft—to break the stalemate. But arguably no conflict of the past
two centuries has done more to accelerate development and adoption of new technologies
than World War II. This conflict prompted the development of radar, sonar, analog
computers, and, perhaps most consequentially, nuclear weapons.76 The atomic devastation
of Hiroshima and Nagasaki led scientists and government leaders in the victorious Allied
nations to anxiously question what the accelerating wave of technological advances would
mean for the future of warfare, society, and humanity itself.
75 Olaf Helmer, Analysis of the Future: The Delphi Method (P-3558) (Santa Monica: the RAND
Corporation, March 1967), 2.
76 Alex Roland, “Chapter II: Land Warfare” and “Chapter III: Naval, Air, Space, and Modern Warfare” in War and Technology: A Very Short Introduction (New York: Oxford University Press, 2016), 7–83.

44
One field of literature, science fiction, had been exploring potential alternative
futures and extrapolating the development of both existing technology and imagined
technologies ever since Mary Shelley wrote Frankenstein, or the Modern Prometheus,
arguably the first modern tale of science fiction and the extrapolation of the consequences
of future technology, in 1818.77 In the shadow of the atom, academicians and political and
social scientists felt a need to predict potential future events and technological
developments in a more systematic way. This led to the development of the Delphi
technique, a systematized method for the elicitation of expert opinion, in the late 1940s.
The earliest notable use of the Delphi technique for defense or homeland security-related
prognostication took place in 1953, when, in a classified experiment not published in
unclassified form until 1962, Norman Dalkey and Olaf Helmer used the technique to elicit
the opinions of seven experts regarding likely outcomes of exchanges of nuclear weaponry
with the Soviet Union.78 Helmer notes that he helped develop the Delphi technique due to
the fact that projections into the future can very rarely be based entirely upon mathematical
models and instead, out of necessity, must be based upon the intuitive judgments of a
number of experts spread across a variety of disciplines. He states that political, social,
economic, and military leaders can either wait until such time as an adequate theory and
models have been developed to project future events, or they can “obtain the relevant
intuitive insights of experts and then use their judgments as systematically as possible.”79
He further notes that, prior to the development and use of the Delphi technique, the most
common method for the elicitation of expert opinion from a group of experts was a
roundtable discussion. He developed the Delphi technique to attempt to mitigate what he
saw as the roundtable discussion’s major shortcomings. These include pressure among
face-to-face interactors for a compromise between divergent or opposing positions, and the
undue influence of the participant(s) with the most prestige, the highest official level of
77 Brian W. Aldiss and David Wingrove, Trillion Year Spree: The History of Science Fiction (London:
Victor Gollancz Ltd, 1986), 36–44.
78 Juri Pill, “The Delphi Method: Substance, Context, a Critique and an Annotated Bibliography,” Socio-Economic Planning Sciences 5, no. 1 (February 1971): 58–59.
79 Helmer, Analysis of the Future, 4.

45
authority, or the most dominating or authoritarian personality. Other shortcomings of the
roundtable discussion include the possible unwillingness of participants who have already
publicly stated an opinion to back down on that opinion during a face-to-face interaction
with their peers, and what Helmer calls the “bandwagon effect,” or the tendency of
members of a group to alter their own stated opinions to better fit in with the majority’s
opinion.80
Andre Delbecq, Andrew Van de Ven, and David Gustafson define the Delphi
technique as “a method for the systematic solicitation and collection of judgements on a
topic through a set of carefully designed sequential questionnaires interspersed with
summarized information and feedback of opinions derived from earlier responses.”81
Norman Dalkey, along with Helmer, one of the technique’s pioneers, lists the three
essential elements of the Delphi technique as (a) anonymity (none of the participants are
aware of the others’ identities, and they do not engage in any face-to-face interactions, for
all communications from facilitators to participants are in the form of written
questionnaires); (b) formulated feedback (the provision to individual participants of
statistics of group responses); and (c) a finalized group statistical response resulting from
a series of rounds of surveys.82
A. Kaplan, a philosopher employed by the RAND Corporation, gave the Delphi
technique its name after the methodology was first used in an experimental setting, to test
whether it could be used to improve the accuracy of horse-race betting.83 (For those
devotees of the sport of kings who wish to know whether the Delphi method can, indeed,
fatten one’s wallet at the track, unfortunately, the results of this early experiment appear
80 Ibid., 7.
81 Andre Delbecq, Andrew Van de Ven, and David Gustafson, Group Techniques for Program Planning: A Guide to Nominal Group and Delphi Processes (Glenview, IL: Scott, Foresman and Company, 1975), 10.
82 Norman C. Dalkey, The Delphi Method: An Experimental Study of Group Opinion (RM-5888-PR) (Santa Monica: the RAND Corporation, 1969), 16–17, https://www.rand.org/pubs/research_memoranda/RM5888.readonline.html.
83 Fred Woudenberg, “An Evaluation of Delphi,” Technological Forecasting and Social Change 40 (1991): 131.

46
lost in the fogs of time. The only solid reference I have been able to find regarding this
experiment comes from Olaf Helmer, who reported in a 1963 RAND Corporation
monograph, The Systemic Use of Expert Judgment in Operations Research, that the
experiment, meant to determine the predictability of the winners of horse races based upon
statistically-derived consensus of handicappers’ predictions, was only chronicled in an
unpublished study carried out at RAND many years earlier.84 Helmer, perhaps in an
attempt to protect his own advantage as a bettor—I jest—does not reveal the unpublished
study’s results.) During the early 1950s, the U.S. Air Force sponsored one of the earliest
uses of the Delphi technique for systematic forecasting. The goal of the study was to draw
on the expertise of American military planners and scientists to determine, from the
imagined viewpoint of Soviet strategic planners, which U.S. industrial targets were most
vital to the sustainment of American military capabilities, and how many atomic bombs
the Soviets would be required to deploy to reduce U.S. outputs of munitions by various
percentages.85 Interestingly, this early, classified use of a Delphi procedure can also be
viewed as an exercise in red-teaming, of seeking to see one’s own vulnerabilities through
an adversary’s eyes (see Chapter VI for a description and discussion of red-teaming
techniques).
B. DELPHI TECHNIQUE: METHODOLOGIES
Different researchers have set forth varying methodologies for Delphi procedures.
Some of these variations in methodologies have stemmed from differing goals of the
Delphis; this thesis considers several forms of modified Delphis in a later section. This
section, however, describes alternate methodologies for what has come to be known as the
classic or conventional Delphi. According to John Murry, Jr; and James Hammons, in the
classic Delphi, the format originally developed at the RAND Corporation by Dalkey and
Helmer to facilitate the forecasting of how technological advancements may affect future
84 Olaf Helmer, The Systemic Use of Expert Judgment in Operations Research (P-2795) (Santa
Monica, CA: RAND Corporation, September 1963), 5, https://www.rand.org/content/dam/rand/pubs/papers/2008/P2795.pdf.
85 Gene Rowe and George Wright, “The Delphi Technique as a Forecasting Tool: Issues and Analysis,” International Journal of Forecasting 15 (1999): 354.

47
events, the first-round questionnaire is intended to prompt participants’ brainstorming
regarding the issue at hand by offering open-ended questions. The facilitator/researcher
uses the participants’ responses to this first questionnaire to prepare a more structured
questionnaire for the next round. This second-round questionnaire asks the panel members
to rank or rate the responses received from the open-ended round-one questionnaire, with
rankings or ratings posted using a Likert scale. Following receipt from all panelists of their
completed second-round questionnaires, the facilitator/researcher tabulates the results and
calculates statistics for each questionnaire item; such statistics typically include means,
standard deviations, and frequency distributions for each item. The third-round
questionnaire, as well as questionnaires for any subsequent rounds, includes this statistical
feedback for panelists to consider, sometimes in addition to comments that respondents
have made regarding items. Panelists are offered the opportunity to use this informative
feedback on the group’s prior responses to change their responses in the current
questionnaire from their earlier responses, if they so wish. The facilitator/researcher either
halts the Delphi procedure after a pre-determined number of rounds of questionnaires or
does so once group consensus or a stability of responses has been achieved.86
Kenneth Brooks (1979) describes eight steps for Delphi procedures as they are
typically carried out in the field of educational administration research:
1. Identify a panel of experts, with the optimal number being no more than
25.
2. Determine the willingness of the prospective panelists to participate,
making sure that eliminating some whose enthusiasm for the project seems
marginal does not remove all representation from a key demographic.
3. Gather input from the panelists, allowing for some open-ended input; also
ask for demographic data from each panelist.
86 John W. Murry, Jr; and James O. Hammons, “Delphi: A Versatile Methodology for Conducting
Qualitative Research,” The Review of Higher Education 18, no. 4 (Summer 1995): 423–425, doi: https://doi.org/10.1353/rhe.1995.0008.

48
4. Amalgamate the input from the panelists into a limited number of possible
future states (the basis of a second questionnaire). The researcher must
take special care that his or her biases or expectations do not play an
overriding role in compiling this second, more structured questionnaire.
5. The second questionnaire is sent to all the panelists, asking for their
reactions, which may consist of agreement/disagreement, rankings using a
scale, or modifying the questionnaire’s statements.
6. The researcher analyzes the feedback received from the second
questionnaire and prepares a third questionnaire, this one containing
summary statistics of the group’s responses, plus, for each panelist, a
reminder of his or her own response to each question or item. This third
questionnaire is sent to the panelists.
7. Each panelist is asked, in the context of the third questionnaire, to
reconsider his or her earlier responses in the light of the group’s
amalgamated responses. If the panelist decides to stick to their divergent
view, he or she is asked to provide a brief rationale to support this
decision.
8. The researcher repeats Step 6 with a fourth questionnaire, and the panelists
are asked to repeat Step 7. The process is repeated until a consensus is
reached or little or no movement of opinions/responses occurs between
rounds.87
In 1981, two years after Brooks’ formulation, S. Isaac and W. B. Michael compiled
their own list of steps to be undertaken in carrying out a Delphi procedure. Their steps are
essentially congruent with those laid out by Brooks, but with additional methodological
details added. They are as follows:
87 Kenneth W. Brooks, “Delphi Technique: Expanding Applications,” The North Central Association
Quarterly 53 (1979): 377–378.

49
9. Identify the panel. If the panel does not consist of an already existing,
intact group, the various publics whose interests and varying expertise are
to be represented must be representatively sampled. (Note: this latter
statement represents a methodological change from Brooks, as well as
from other researchers, who state that representative sampling is invalid
when one is seeking to compile a Delphi panel made up of experts.)
10. The facilitators prepare Questionnaire One, which asks each panelist to
offer his or her list of issues, concerns, or goals. Using these responses, the
facilitators then prepare Questionnaire Two, in which a summary of the
responses from Questionnaire One are presented in random order, along
with instructions for rating or ranking them.
11. Panelists rate or rank the items on Questionnaire Two.
12. The facilitators prepare Questionnaire Three, which is comprised of the
results from Questionnaire Two along with statistical summarization of
the group’s responses to each item. Panelists whose Questionnaire Two
responses differed substantially from the median response and who wish
to retain their deviating response on Questionnaire Three, rather than
change their response in accordance with the group median response, are
instructed to provide a written reason or explanation for this decision.
13. The facilitators prepare Questionnaire Four in the same fashion that they
prepared Questionnaire Three, building upon the responses from the
previous questionnaire.
14. Results from Questionnaire Four are summarized statistically and are
presented as the group’s final consensus, the results of the Delphi
procedure.88 (Note: this cut-off of the Delphi procedure at Questionnaire
88 S. Isaac and W. B. Michael, Handbook in Research and Evaluation (San Diego, CA: EdITS
Publishers, 1981), 115.

50
Four represents a change from Brooks’ methodology, which states the
procedure is to continue until consensus or stability is achieved.)
C. DELPHI TECHNIQUE: APPROPRIATE USES AND OTHER BEST PRACTICES
Harold Linstone and Murray Turoff have considered the issue of under which
circumstances use of the Delphi technique is to be preferred to the use of other techniques
for the elicitation of expert opinion. They suggest that Delphi is best when the problem
under consideration is not one that can be parsed using mathematical analytical techniques
or models, but instead requires subjective judgment of experts. Delphi is also advantageous
when the range of expertise that the researcher needs to call upon is broad and diverse, and
the experts in the various fields who need to be consulted have no history of prior
interactions. In terms of logistics, Delphi has much to recommend it when the number of
panelists required cannot be easily accommodated within an available physical meeting
space; or face-to-face interactions among them all would prove too cumbersome; or face-
to-face meetings would be too expensive or otherwise too inconvenient; or the researcher
wishes to supplement face-to-face meetings with an additional group communication
process. Regarding psycho-social issues, Delphi is the preferable technique in situations
wherein the experts the researcher wishes to engage have a history of severe disagreements,
such that face-to-face meetings might devolve into unproductive personal clashes; and/or
the researcher is especially concerned about the potentially outsized influence one or more
participants might wield in a face-to-face discussion.89 Regarding this thesis’s “devil’s toy
box” analysis, Linstone’s and Turoff’s stipulations regarding the need for experts’
subjective opinions and the need for a diverse field of experts definitely apply. Their
logistical concerns may also possibly apply, depending upon circumstances. Juri Pill offers
an observation regarding when use of the Delphi technique is appropriate that also applies
well to a “devil’s toy box” analysis: “It is the question of intuitive judgements, the
marshalling of subconscious processes, dredging of half-formed ideas from the group
89 Harold A. Linstone and Murray Turoff, eds., The Delphi Method: Techniques and Applications
(Reading, MA: Addison-Wesley Publishing Company, 1975), 4.

51
memory that Delphi is most useful (for) and as such, one cannot judge it on the same basis
as a concrete measurement.”90
Also, regarding the subject of the appropriateness of the Delphi technique, Kathy
Franklin and Jan Hart, in their 2006 survey of prior research on Delphi, point out that earlier
researchers have suggested that use of the Delphi method may be especially desirable when
any of the following situations apply:
1. The topic being considered consists of newly generated knowledge with
little or no historical background.
2. The study concerns rapidly evolving, changing events.
3. The subject(s) being studied involve(s) great complexity.
4. Researchers hope to gather collective knowledge from experts regarding
subjects not frequently explored.
5. Researchers hope to facilitate the surfacing of new ideas regarding a given
topic.
6. Researchers hope to gather information familiar to experts but so new and
timely that the information has not yet been published in the existing
literature on the subject.91
All Franklin’s and Hart’s stipulations can be said to apply to a “devil’s toy box”
analysis to a greater or lesser extent, depending upon the specific emerging, over-the-
horizon Promethean technological development in question, its level of strategic latency,
and its potential for combinatorial evolution in conjunction with existing technologies or
other emerging technologies.
90 Juri Pill, “The Delphi Method: Substance, Context, a Critique and an Annotated Bibliography,”
Socio-Economic Planning Sciences 5, no. 1 (February 1971): 62.
91 Kathy K. Franklin and Jan K. Hart, “Idea Generation and Exploration: Benefits and Limitations of the Policy Delphi Research Method,” Innovative Higher Education 31, no. 4 (January 2007): 238, doi: 10.1007/s10755-006-9022-8.

52
Several researchers have focused on identifying best practices for Delphi.
Regarding optimal panel size for a Delphi procedure, Murry’s and Hammons’ review of
prior studies finds mixed results. One study suggests a minimum size of 10 participants,
with no recommended upper limit. Another set of researchers suggest a maximum size of
30. Another researcher states that little improvement in accuracy of the results will be seen
once the panel size exceeds 25, and still another suggests that any increase in panel size
will result in the benefits of increased reliability of results and fewer errors.92 Regarding
the optimal number of rounds of questionnaires, B. R. Worthen and J. R. Sanders suggest
that, although Delphi procedures may continue past three rounds of questionnaires, “the
payoff usually begins to diminish quickly after the third round.”93 Regarding feedback
provided to participants between rounds of questionnaires, Gene Rowe and George Wright
discovered an interesting contrast between two types of feedback provided to Delphi
panelists, either statistical summaries of the group’s amalgamated responses or reasons
panelists provided for the answers they gave. Whereas panelists who received the latter
form of feedback changed their own answers less frequently in response than they did when
provided the former, when they did change their responses after receiving “reasons”
feedback, their altered responses were more likely to tend toward improved accuracy than
responses altered after receiving statistical summaries of the group’s answers.94
Other researchers on the efficacy of Delphi offer cautionary suggestions for the
technique’s utilizers. Franklin and Hart, who conducted a policy Delphi regarding the
future of web-based learning for metropolitan universities, note the vulnerability of Delphi
procedures to weaknesses in development of the initial questionnaire. With policy Delphis,
researchers base their initial questionnaire on exhaustive reviews of the existing literature.
The questionnaire is a summarization of current scholarly research and theories, intended
to give the Delphi panelists a framework for their thoughts on the research subject and a
92 Murry and Hammons, “Delphi: A Versatile Methodology,” 428.
93 B. R. Worthen and J. R. Sanders, Educational Evaluation: Alternative Approaches and Practical Guidelines (New York: Longman, 1987), 312.
94 Gene Rowe and George Wright, “The Delphi Technique as a Forecasting Tool: Issues and Analysis,” International Journal of Forecasting 15 (1999): 371.

53
common point of origin for their subsequent remarks; however, this key building block in
the Delphi methodology is subject to researcher bias and error. The researcher may not
capture the truly relevant issues at hand if those issues are currently emerging and have not
yet been reflected in the scholarly literature, or if scholars have not yet recognized the
significance of those issues approaching center stage from the wings. Franklin and Hart
suggest that the structure of the initial questionnaire can ameliorate this vulnerability by
inviting panelists to contribute qualitative input on subject matter with which they might
be uniquely cognizant; they also point out that this underscores the importance of recruiting
true experts in the field, those who are most likely to be aware of recent and emerging
developments. They state that issues missed in the first questionnaire of a Delphi procedure
are not easily recovered and addressed in later questionnaires, due to the technique’s
iterative nature from the second questionnaire onward.95
This process failure identified by Franklin and Hart may pose less of a danger for
the sort of “devil’s toy box” analysis considered in this thesis than it does for most policy
Delphis. This is because the procedure I compiled in this thesis, Pandora’s Spyglass, is
intended to have its initial questionnaire generated by a computer-intelligence-driven
analysis of worldwide technical literature and patent applications, performed by a software
package such as IARPA’s FUSE. No software program, not even one programmed to learn
through iteration, will be perfect at identifying all potentially relevant emerging, over-the-
horizon technological developments; however, a program such as FUSE should not be
susceptible to the types of human researcher bias and error discussed by Franklin and Hart.
H. A. Linstone and M. Turoff continue in this vein of suggesting cautionary advice.
They offer a list of five methodological and process mistakes that they observe have caused
Delphi procedures to come to an unsuccessful, dissatisfying conclusion. Their five “deadly
sins” include:
95 Franklin and Hart, “Idea Generation and Exploration,” 243.

54
1. The facilitators over-specify the structure of the Delphi study by imposing
their own outlooks and preconceptions onto the initial questionnaire,
rather than allowing open-ended feedback from panelists.
2. The facilitators assume that the Delphi process is capable of substituting
for all other communication between facilitators, the experts, and among
the experts themselves.
3. The facilitators do not provide questionnaire completion instructions that
are adequate to remove ambiguity about the evaluation scales and ensure
shared interpretation of those scales, and facilitators do a poor job of
summarizing the group’s responses.
4. The facilitators ignore or discard dissenting opinions, those responses that
are statistically significantly different from the median responses, thereby
leading those holding such dissenting opinions to abandon the Delphi
procedure. This results in an artificial consensus.
5. The facilitators fail to appreciate the magnitude of the tasks being given to
panelists and do not provide adequate recognition and other compensation
for the expert panelists’ time.96
D. DELPHI TECHNIQUE: ADVANTAGES
Helmer notes, in his 1967 review of several early uses of the Delphi technique for
prognostication tasks, that one of the most common outcomes of a use of Delphi is a
convergence of opinion towards a single judgment, evaluation, or forecast, or, in some
cases, a convergence around two separate, divergent estimations. He states that this latter
outcome should not be viewed as a failure of the Delphi technique to produce final
consensus, but rather as a successful clarification of the steps of reasoning that led to the
divergent opinions, an illustration that helps to provide improved insight into the intricacies
96 H. A. Linstone and M. Turoff, The Delphi Method: Techniques and Applications (Reading, MA:
Addison-Wesley Publishing Company, 1975), 6.

55
of an issue.97 Certainly, given the purposes of this thesis, a convergence of opinion around
two or even three emerging potential future-shock threats from a list of a dozen such threats
or more would represent a great benefit.
Dalkey lists many advantages of the Delphi technique. It is a relatively quick and
efficient way to elicit opinions from a group of experts. It is easier and less time-consuming
for participants to respond to Delphi questionnaires than it is for them to attend conferences
or write lengthy papers. A properly mounted Delphi exercise can be a stimulating,
motivating experience for the participants, given the statistical feedback provided to
participants following the various rounds, and participants tend to value the sense of
objectivity provided using a systematized procedure such as Delphi, rather than an
unstructured group exchange of opinions. Finally, and importantly, the Delphi technique’s
anonymity frees participants from whatever psychological or social inhibitions they might
face to expressing their true opinions in face-to-face encounters.98
Murry and Hammons, drawing on earlier research regarding the Delphi technique,
list additional advantages. Studies have suggested that decisions, forecasts, or estimations
made by groups through anonymous means that feature-controlled feedback tend to be
more accurate than the results of face-to-face meetings. Logistically, Delphi is a convenient
method for the elicitation of expert opinions when the experts are geographically dispersed.
In terms of outcomes, the results of Delphi procedures are the product of careful reasoning,
because the methodology directs panelists to offer written rationales explaining the bases
of their opinions and responses. Finally, Delphi procedures allow for the responses of
groups of panelists to be summarized statistically.99 Depending upon the composition of a
panel of experts assembled to conduct a “devil’s toy box” analysis, their other professional
commitments (in academia, homeland security agencies, or scientific research
establishments), and their level of geographic dispersion, the logistical advantage Murry
and Hammons refer to could prove consequential. I also suspect that participants being
97 Helmer, Analysis of the Future, 9.
98 Dalkey, The Delphi Method: An Experimental Study, 16–17.
99 Murry, Jr; and Hammons, “Delphi: A Versatile Methodology,” 426.

56
encouraged to back up their opinions with step-by-step reasoning and explanations will
tend to lead to more deeply considered input.
Ruth Beretta adds the following advantages to the positive side of the Delphi ledger.
Comparing the anonymity provided by the Delphi technique to a face-to-face committee
process, she suggests that a Delphi procedure ameliorates common drawbacks of face-to-
face committees. In a Delphi procedure, domineering personalities have less opportunity
to overwhelm the opinions of less forceful members, and panelists feel less pressure to
withhold their opinions until all relevant facts are known. The issue of less senior
participants being unwilling to contradict the opinions of more senior participants is elided.
Participants feel less pressure to remain committed to an already voiced opinion. Finally,
participants cloaked in anonymity feel freer to offer opinions they consider to be well
outside the mainstream; there is less fear of public ridicule.100 All these advantages would
come into play in a “devil’s toy box” analysis, but I think freeing participants from being
drowned out by louder or more authoritative, domineering voices might be the most
significant. The very nature of the act of attempting to forecast how emerging, over-the-
horizon technologies might be used for nefarious purposes by various groups of
malcontents and forces, or individuals, hostile to the U.S. calls for unconventional thinking,
prognostication that is “out of the box” (or “out of the devil’s toy box”). Any technique
that can reduce participants’ anxieties about becoming subject to the ridicule of their peers
adds value in such a situation.
E. DELPHI TECHNIQUE: DISADVANTAGES
The Delphi technique is not without its potential downsides, however. Murry and
Hammons, drawing on earlier research regarding the Delphi technique, raise several
drawbacks. Some of these drawbacks are psycho-social in nature and concern group
dynamics. The questions chosen by the facilitator/researcher may unduly influence the
panelists’ responses. Lack of face-to-face interactions may mean that the full expertise of
the participants is never completely drawn upon. Also, the remote, impersonal nature of
100 Ruth Beretta, “A Critical Review of the Delphi Technique,” Nurse Researcher 3, no. 4 (June
1996): 81.

57
the technique may contribute to a lack of motivation on the part of panelists, which can
lead to attrition of participants between rounds. Other shortcomings are more logistical in
nature. Depending upon the number of rounds of questionnaires in each Delphi procedure,
the time required for questionnaire preparation, disbursement, completion by panelists, and
statistical analysis could stretch to four or five months, making the technique inappropriate
for timely or urgently needed decision support. Ad-hoc administrative difficulties with the
questionnaires or the procedure cannot be easily dealt with, such as panelists’
misinterpretations of the meanings of questions or the goal of the exercise. Perhaps of
greatest consequence, the reliability of the results of any Delphi procedure is based largely
on the facilitator’s selection of experts; thus, the technique is vulnerable to less than optimal
selections of panelists.101 I would add this might include panelists chosen for convenience,
political reasons, or paper credentials, rather than true expertise.
Regarding Murry’s and Hammons’ group dynamics-related shortcomings, their
concern about the facilitator’s selection of the initial research question(s) may perhaps be
ameliorated by the fact that the initial step of a “devil’s toy box” analysis would be a
worldwide review of scientific papers and patent applications carried out by a machine
intelligence program such as FUSE, rather than a literature review carried out by the
researcher(s). The lack of participants’ motivation the technique’s remoteness may lead to
and the fact that communications between participants are severely limited (just to
statistical feedback of group responses and written statements of explanation and reasoning
regarding the opinions and ideas presented by other participants), which may result in an
incomplete elicitation of the participants’ expertise, are two complaints that are more
difficult to elide. These two criticisms are better addressed by a different but related
procedure, the nominal group technique, which is discussed in detail in Chapter IV and that
was developed, in part, as a response to these criticisms of Delphi. Regarding the logistical
concern of the length of time required for the deployment of the various rounds of Delphi
questionnaires, this shortcoming has been at least partly ameliorated by the advance of
communications technology. Electronic communications techniques such as email, Skype,
101 Murry, Jr; and Hammons, “Delphi: A Versatile Methodology,”426–427.

58
Google Docs, and others have eliminated the necessity of relying on slow, traditional mail
for the exchange of questionnaires. A Delphi procedure’s vulnerability to its researcher’s
choice of expert participants applies to any opinion solicitation technique that relies upon
the participation of a relatively limited number of experts. The old saying, “garbage in,
garbage out,” certainly applies here, and any utilizers of the Delphi technique need to be
mindful of the temptation to choose participants based on convenience rather than quality,
as well as their own cognitive blind-spots, which may lead them to overlook or improperly
eliminate potential participants or even whole categories of participants who could
significantly add to the Delphi analysis in question. I have much more to say regarding the
choice of experts in Chapter VII.
Juri Pill points out two shortcomings of the Delphi technique. The first is the
problem of scaling of responses. How can numeric values properly be assigned to opinions,
a methodology required to obtain a group consensus from a Delphi procedure?102 Some of
Pill’s concerns in this area are addressed by Douglas W. Hubbard in his book The Failure
of Risk Management: Why It’s Broken and How to Fix It.103 Hubbard’s thinking has
already been briefly discussed in Chapter II, and I consider his proposed solutions more
extensively in Chapter IX. The second shortcoming Pill highlights is the likelihood that,
given the Delphi technique’s methodology, the opinion(s) of the most knowledgeable
expert(s) on the panel regarding the issue at hand will likely be diluted by the opinions of
those less knowledgeable.104 To an extent, this shortcoming can be elided by a substitution
of aspects of the nominal group technique for steps of the Delphi technique, or a
combination of the two techniques, or an application of the “wisdom of select crowds”
method (explored in Chapter VIII), options I address in Chapter IX.
102 Juri Pill, “The Delphi Method: Substance, Context, a Critique and an Annotated Bibliography,”
Socio-Economic Planning Sciences 5, no. 1 (February 1971): 60.
103 Douglas W. Hubbard, “Worse Than Useless: The Most Popular Risk Assessment Method and Why It Doesn’t Work,” in The Failure of Risk Management: Why It’s Broken and How to Fix It (Hoboken, New Jersey: John Wiley & Sons, 2009), 117–143.
104 Pill, “The Delphi Method: Substance, Context,” 62.

59
Beretta, drawing upon the work of earlier researchers, adds additional negative
critiques of the Delphi method. Foremost among these is an absence of methodological
rigor, although she states that several of the Delphi technique’s defenders have pointed out
that Delphi is not intended for use as an instrument of scientific measurement. A closely
related criticism is Delphi’s absence of statistically rigorous sampling methodology,
although Beretta offers the caveat that when decision-making support requires the
elicitation of expert opinion, attempts at representative sampling are generally not called
for. From a methodological perspective, no agreement exists regarding the optimal size of
Delphi panels; very few studies demonstrate replicability of Delphi results from one panel
to another; and many of the studied Delphi procedures suffered from significant attrition
of participants between rounds, which raises questions regarding the validity of the final
results, since the panel of respondents to the final questionnaire is not the same as the panel
of respondents to the initial questionnaire. Other methodological criticisms include the fact
that each Delphi procedure’s facilitator/researcher decides the level of consensus required
for the procedure to come to an end, i.e.: no standard of consensus exists, and that different
facilitators/researchers are free to handle outlying opinions in different ways, thus
artificially shaping the group’s consensus. Beretta’s final methodological concern is that,
as in a postal questionnaire, the facilitator/researcher has no assurance that the person who
fills out the Delphi questionnaire is the person for whom the questionnaire was intended (a
busy administrator who had previously agreed to be a panelist might order his assistant to
fill out the questionnaire, for example).105
In my estimation, these misgivings concerning Delphi may be grouped under the
heading of lack of replicability/standardization. Beretta is concerned that different sets of
researchers, when making use of Delphi procedures in pursuit of their own projects, are
not necessarily using identical procedures, which makes methodological and statistical
comparisons of the resulting studies problematic. Although this is a valid concern for those
who wish to consider Delphi a tool of scientific research, this is not a concern of mine in
formulating an optimal procedure for a “devil’s toy box” analysis, since my goal is not
105 Beretta, “A Critical Review of the Delphi Technique,” 83–87.

60
replicable scientific research, but rather a less-inaccurate prognostication of the likelihoods
of certain malign, catastrophic events occurring. Bearing this in mind, I am free to “mix
and match” whatever variations of Delphi technique (or other methods of expert opinion
elicitation) I feel are most useful for the task at hand.
Catherine Powell agrees with Baretta’s concern regarding a lack of a clear, uniform
standard for consensus in Delphi procedures. She goes into greater detail regarding the
difficulties researchers who have used the technique have faced in defining when
consensus has been achieved. In her survey of research regarding standards Delphi
facilitators/researchers have used to define when consensus has been reached in a Delphi
procedure, Powell reports that the levels of consensus sought range from a simple majority
of the respondents (50% plus 1) to 100% agreement. Other facilitators/researchers suggest
that a Delphi procedure has achieved its consensus when the results achieve stability
between rounds of questionnaires.106 For my purposes, however, this flexibility in
applications of the Delphi technique is a feature, not a bug. Different iterations of a “devil’s
toy box” analysis could conceivably call for different levels of precision of forecasting,
and thus different standards for consensus. A short-range analysis, say for prognostications
of malign uses of technology likely to occur within the next 12 to 18 months, would
demand a higher level of precision and a higher standard of consensus. A longer-range
analysis, say one examining a time frame of five to ten years out, necessarily becomes
fuzzier, less precise. A wider range of opinion is to be expected, and thus a lower standard
of consensus should be applied, perhaps one that can coalesce around two, three, or four
dominant opinions.
Jon Landeta, in his review of prior research on the Delphi technique, adds the
following points to the lists of shortcomings already compiled by Helmer, Pill, Murry and
Hammons, and Beretta. Landeta’s concerns primarily regard psycho-social, group
dynamics issues. He states the anonymity and isolation of participants in Delphi procedures
rob those participants of the sorts of social benefits (comradery, positive reinforcement for
106 Catherine Powell, “The Delphi Technique: Myths and Realities,” Journal of Advanced Nursing 41,
no. 4 (February 2003): 379.

61
one’s contributions, and increased motivation derived from the group’s positive energy)
sometimes available through face-to-face interactions. He also suggests anonymity lessens
inhibitions against frivolous or irresponsible responses to questionnaire items. Finally, he
states the Delphi technique extracts a psychic cost on the participating experts, who are
asked to participate in a methodology about which many know little; who are directed to
answer the same questions more than once without having an understanding of why this is
necessary; who do not have the pleasure of interacting with their fellow experts, beyond
receiving other participants’ comments and sets of statistics on the group’s responses; and
who are often left with the feeling that they have contributed a good deal of time and
thought and have received little of value in return.107
To mitigate the psychic toll that participating in a Delphi procedure can exact from
the participating experts, Landeta recommends the following best practices. The institution
that sponsors the exercise should demonstrate visible, preferably enthusiastic support for
it, and this support should be emphasized to the participants to enhance participants’ senses
of pride in their involvement in a socially beneficial effort. The team that facilitates the
Delphi procedure should have a good working knowledge of the subject area being studied.
Expert participants should be selected, in part, in accordance with their high level of
motivation. The designers of the Delphi procedure should mentally put themselves in the
place of the participants and determine the number of questions per questionnaire and the
number of rounds accordingly, seeking to reduce the overall burden to the lowest level that
will still accommodate the needs of the study. The facilitators should thoroughly explain
the study’s methodology and goals to all participants before the Delphi procedure begins,
and they should conduct a pilot prior to the initiation of the actual Delphi procedure to
validate and calibrate the initial questionnaire. The facilitators should encourage
participants’ contributions of qualitative feedback to the questionnaire items and should
note when elements of qualitative feedback have resulted in shifts of the statistical
aggregate group response between rounds; this will grant the experts who contributed this
effective, significant feedback a greater sense of being a vital part of the study. Finally,
107 Jon Landeta, “Current Validity of the Delphi Method in Social Sciences,” Technological
Forecasting and Social Change 73 (2006): 469–470.

62
facilitators should send the study’s final results to all participants as soon as possible, along
with personalized letters of appreciation.108 I feel that all Landeta’s suggestions for
ameliorations have merit. Some of them come across as simple common sense or courtesy.
I should add that I would expect participants in a “devil’s toy box” analysis to exhibit a
relatively high level of commitment to the project, given that the organizers should take
pains to emphasize that the results of the analysis will lead to R&D efforts that may prevent
the deaths or injuries of dozens, hundreds, or even hundreds of thousands of innocent
persons, depending upon the capabilities of the emerging Promethean technologies.
F. DELPHI TECHNIQUE: MODIFIED FORMS
Facilitators and researchers have developed variants of the Delphi technique over
the years. The original form of Delphi, pioneered by Helmer and Dalkey at the RAND
Corporation in the late 1940s and early 1950s and already described, has been called the
conventional Delphi or the exploratory Delphi. One modified form, the normative Delphi,
also called a consensus Delphi, is not used for forecasting the likelihood of future events
or developments. Rather, it seeks to engage a group of experts in arriving at a shared
consensus concerning the desirability of a goal or agreeing upon the ranking of the
desirability of a set of potential goals. (An example of its use would be a group of city
administrators trying to decide between spending an equal amount of money on a new
community swimming pool, a new senior citizens’ activities center, or a multi-use
amphitheater in a local park.) A second modified form, the policy Delphi, also termed the
focus Delphi or the decision Delphi, abandons the conventional Delphi’s goal of achieving
consensus within the group of experts. Conversely, its goal is the elicitation of strongly
opposed views on a policy issue from a group of experts, seeking to generate divergent
opinions through a series of debates, each carried out within a round of Delphi
questionnaires.109
108 Ibid., 479–480.
109 Muhammad Imran Yousuf, “Using Experts’ Opinions Through Delphi Technique,” Practical Assessment, Research & Evaluation 12, no. 4 (May 2007): 2, http://pareonline.net/getvn.asp?v=12&n=4.

63
Helmer conducted experiments regarding possible benefits of a refinement to the
Delphi technique, that of introducing weighted opinions into the final tabulation of group
judgment, based upon participants’ self-assessments of their levels of expertise on the
questions at hand. He found that discarding the opinions of those participants who scored
themselves relatively low on expertise and basing the group’s consensus result only upon
the median value of responses from those participants who scored themselves relatively
high on expertise tended to result in higher accuracy. This was reflected in 68% of the 20
experiments he and his colleagues conducted.110 Helmer’s modification shares elements
in a common with a form of structured interaction called the Dictator or Best Member
procedure, wherein final group judgment is based upon that of the group’s selected
representative. Presumably, under this latter procedure, group members choose their “best
member” based upon his or her level of expertise. Helmer’s refinement relies, instead, on
participants’ subjective evaluations of their own expertise, but the result is essentially the
same—the discarding of opinions judged to be based upon lesser expertise.
Murry and Hammons conducted a modified Delphi procedure to elicit opinion on
the best management performance audit criteria for evaluating the effectiveness of
community college administrators. Their initial modification consisted of constructing the
first-round questionnaire with structured, rather than open-ended questions. They then
restricted sending the second-round questionnaire only to those panelists who had
completed the first-round questionnaire. They reminded each panelist in the second
questionnaire of his/her response to that same question during the first round by repeating
that earlier response, and they included a list of all comments made regarding each
questionnaire item, in addition to the standard statistical breakdowns. Finally, they
provided explicit instructions to panelists that they should either alter or reconfirm their
earlier responses based upon the comments provided by other panelists and the group’s
statistically amalgamated responses, and they encouraged panelists to provide additional
comments on each questionnaire item. Each of these first two rounds took approximately
60 days to complete. After their study, the two authors sent the 33 panelists a final report
110 Helmer, Analysis of the Future, 9–10.

64
explaining the study’s methodology and summarizing its results.111 In my judgment, the
last three of these four modifications seem like generally helpful best practices, designed
to hone the outcomes the Delphi technique was designed to elicit. The benefit of
constructing the initial questionnaire with structured, rather than open-ended, questions, on
the other hand, would seem to hinge on the purposes of the study. Under the “devil’s toy
box” analysis envisioned in this thesis, the basis for the first-round questionnaire would be
supplied by the output of a FUSE analysis or a comparable software-driven analysis of
worldwide scientific literature and patent applications, so the first-round questionnaire
would, in fact, be a structured one, or more structured than not.
Advances have occurred in adapting Delphi to computerized communications
technologies to overcome the time lags involved in mailing of questionnaires. In 1998, the
first software package to combine Delphi procedures with communications over the World
Wide Web, Professional Delphi Scan, was introduced in Finland. A third version of this
software, eDelfoi, was rolled out in 2008 and has been licensed by about 30 different
Finnish organizations. Approximately 300 studies have been conducted using a version of
this software. In 2004, DARPA contracted with Articulate Software, Inc., for the creation
of software that would allow for the use of Delphi procedures for the resolution of tactical
questions on the battlefield in real time. The software was designed to allow for either
synchronous or asynchronous input by participants. The DARPA-developed software is
open-source and is available to the public under the heading “Delphi Blue” at
http://sourceforge.net.112 Links to additional resources regarding the Real-Time Delphi
can be found at http://107.22.164.43/millennium/RTD-general.html.
* * * * *
The Delphi technique is not the only widely-used structured procedure for the
elicitation of expert opinion; Andrew H. Van de Ven and Andre L. Delbecq noted
111 Murry and Hammons, “Delphi: A Versatile Methodology,” 430–433.
112 Theodore J. Gordon, “The Real-Time Delphi Method,” in Futures Research Methodology Version 3.0, Jerome C. Glenn and Theodore J. Gordon, eds. (Washington, DC: The Millennium Project, American Council for the United Nations University, 2009), CD-ROM article 5, 1–2, http://107.22.164.43/millennium/RTD-method.pdf.

65
deficiencies regarding the design of the Delphi technique and set out to create a new
method to address those deficiencies. Their innovation, the nominal group technique, is the
next type of expert opinion elicitation method I will examine.

66
THIS PAGE INTENTIONALLY LEFT BLANK

67
IV. EXPERT ANALYSIS (2): THE NOMINAL GROUP TECHNIQUE
A. NOMINAL GROUP TECHNIQUE: INTRODUCTION
Andrew H. Van de Ven and Andre L. Delbecq created the nominal group technique
(NGT) in 1968. They intended to institute a structured procedure of group interaction that
would ensure the use of differing, appropriate processes for different phases of creative
thought and help to ensure balanced participation among the various participants. Like the
creators of the Delphi technique, they created a process to aggregate the group’s judgment
through mathematical voting procedures; however, Delbecq and Van de Ven note that
researchers of small group dynamics and group decision-making processes have found that,
whereas group interactions do not promote efficient and effective idea generation,
identification of problems, or elicitation of facts (the initial phase of the problem-solving
process), face-to-face discussion does promote improved evaluation, screening, and
synthesizing of ideas already generated (the latter portions of the problem-solving
process).113 With this in mind, they designed their NGT to remove face-to-face interactions
from the idea generation stage of analysis, where research showed it to be
counterproductive, but institute in-person social interactions in those stages of analysis
where such interactions add value. This addition of face-to-face interaction in appropriate
phases served to differentiate their technique from the older Delphi technique.
In their book Group Techniques for Program Planning, Delbecq and Van de Ven
make several comparisons between NGT and Delphi procedures. (Despite being the
originators of NGT, they do not act as partisans in favor of their own procedure; rather,
they point out the varying situations wherein one technique might be preferred to the other.)
They note a difference in task completion time burdens, pointing out that, for
panelists/participants, answering the Delphi questionnaires typically takes less time than
sitting through the silent idea generation, round-robin idea sharing, and structured group
idea evaluation phases of an NGT procedure; however, for the researchers/facilitators,
113 Delbecq, Van de Ven, and Gustafson, Group Techniques for Program Planning, 7–9.

68
more time is required to prepare and distribute Delphi questionnaires, analyze the results,
and then prepare individualized follow-up questionnaires to participants than it does to lead
an NGT procedure. They state that, based upon the number of questionnaire rounds
included, completing a Delphi procedure may take up to five months, whereas preparing
for, leading, and subsequently analyzing an NGT procedure typically takes about 88 man
hours of work time.114 However, they made this comparison in 1975, before the arrival of
email and other computerized communications technologies, when Delphi questionnaires
had to be sent to participants and returned to researchers through the U.S. Postal Service.
Today, a Delphi procedure can be accomplished in a fraction of the time it could in 1975,
given equally motivated participants. Thus, the overall time burden of a Delphi procedure,
including that required of both facilitators and participants, is likely a lot closer to that of a
nominal group technique procedure than was originally the case.
B. NOMINAL GROUP TECHNIQUE: METHODOLOGY
Delbecq and Van de Ven lay out the steps of an NGT procedure as follows:
1. The group’s members, 7–10 in number, while in the same room as the
other members, silently brainstorm ideas and write them down.
2. All the group’s ideas are then written on a flip chart by a recorder in the
following fashion. The ideas are presented one at a time, in round-robin
fashion, with each participant offering one of his or her ideas at a time. No
discussion occurs in this phase. The round-robin process continues until
all the members’ ideas have been written on the flip pad. (This portion of
the procedure gives the nominal group technique its name; the group is
considered “nominal” because, although the members are in one another’s
presence, there is only very limited communication between them.)
114 Ibid., 29–30.
69
3. Members discuss each recorded idea one at a time, asking for
clarifications when necessary and expressing their agreement or
disagreement, and offering supporting reasons.
4. Each member privately votes on the ideas, ranking or rating each. The
facilitator mathematically derives the group’s decision/consensus based
upon these private votes.115
C. NOMINAL GROUP TECHNIQUE: APPROPRIATE USES AND OTHER BEST PRACTICES
Bjørn Anderson and Tom Fagerhaug suggest that use of the nominal group
technique is appropriate when one of several situations exists. NGT is helpful in facilitating
productive analysis of root causes of a problem when team members are prone to blame
one another for the problem’s existence; the technique allows the participants to get past
bitter feelings based on clashing personalities. The technique is also very helpful in coaxing
ideas from valuable participants who might be too intimidated, cautious, or shy to present
their ideas within another format. NGT can help bring focus to groups whose previous
brainstorming sessions have resulted in overwhelming or chaotic lists of potential root
causes of the problem under consideration, or in situations when the group has decided the
problem may have multiple possible root causes and the members are stuck on how to
decide which potential root cause to analyze first.116
In presenting his Improved Nominal Group Technique (INGT), to be discussed in
a later section, William M. Fox states the procedure is designed for consideration,
evaluation, and consensus generation for a single purpose per procedure. The technique
should not be used for negotiations between opposed parties, for coordination of inter- or
intra-team efforts, or for routine dissemination of information. Furthermore,
115 Ibid., 8.
116 Bjørn Anderson and Tom Fagerhaug, “The Nominal Group Technique: Generating Possible Causes and Reaching Consensus,” Quality Progress 33, no. 2 (February 2000), 144.

70
researchers/facilitators should anticipate that INGT meetings will likely take 90 minutes to
three hours and should plan accordingly.117
Delbecq and Van de Ven suggest the following best practices for team leaders
facilitating NGT procedures. During the initial phase of a procedure, that of the group’s
silent generation of ideas, they state that the leader should present the study question to the
participants in writing, should disallow any queries from participants not related to process
matters, should model proper behavior by silently noting ideas him/herself, and should
discipline any participant who violates the group’s silence once idea generation has
begun.118 For the round-robin idea-recording phase, they suggest that the leader verbally
emphasize that presentation of ideas should be in brief statements, that any duplicative
ideas will be eliminated, but variations on a theme are both permitted and encouraged (they
term this “hitchhiking,” when the recording of one participant’s idea stimulates a related
idea from a different participant), and that each idea will be recorded serially, with enough
turns taken that each idea from each participant will be recorded on the flip chart. They
also state that leaders should record ideas in the participants’ own words, without
abbreviations, and that all pages from the flip chart should be displayed so that they can be
seen simultaneously.119
For the following step, that of serial clarification of each idea, they direct leaders
to emphasize that clarification is not limited to what the phrase representing an idea means,
but also can include questions about the reasoning process by which the contributor arrived
at the idea and the relative importance that contributor places on the idea; however, no
participant should feel compelled or obliged to clarify their contributed idea, should they
choose not to. The authors also caution that leaders should carefully pace the discussion so
117 William M. Fox, “The Improved Nominal Group Technique (INGT),” The Journal of
Management Development 8, no. 1 (1989), 25, https://doi.org/10.1108/EUM0000000001331.
118 Delbecq, Van de Ven, and Gustafson, Group Techniques for Program Planning, 45.
119 Ibid., 47–50.

71
that it does not become snagged on an item (depriving later items of adequate clarification
time) and that it does not descend into argumentation.120
The next step is participants’ individual, independent preliminary voting on the
ideas or items that the group has generated. The authors state that the leader determines the
number of ideas/items that participants will be asked to list in rank order of importance or
suitability (this could be five ideas/items or another number). The authors point out that
studies of decision-making behavior have indicated that individuals are typically capable
of accurately ranking or rating seven items, plus or minus two items (a range from five to
nine items). The leader should instruct participants to take five separate index cards (or
another number of cards if the number of ideas/items to be ranked is different) and clearly
mark on each both the number identifying the idea/item and a separate number indicating
that participant’s rank ordering of that idea/item, with higher numbers representing greater
importance or suitability. The leader then randomly shuffles the participants’ index cards
and records the votes on a flip chart in front of the entire group.121
The authors state that the NGT process may conclude with step 4, the preliminary
group vote; however, two optional steps may be added if the facilitators wish to pursue
additional precision for the group’s judgment. The first of these optional steps is a
discussion of the vote just held. The objective of this step is to explore possible reasons for
preliminary vote tallies appearing to be skewed: do participants have differing access to
information? Have various participants understood the ideas/items differently? Or do the
voting patterns accurately reflect differences in judgment, absent other confounding
factors? The authors instruct group leaders to explain to the group that the objective of this
step is clarification, not social pressure on any participants for a change of their votes, and
for group leaders to keep the discussions brief, to not give the ideas/items discussed undue
prominence in comparison with other ideas/items not requiring clarification.122 The second
optional step, step 6, is a final vote. This may be carried out in the same fashion as step 4,
120 Ibid., 52–53.
121 Ibid., 57–58.
122 Ibid., 62–63.

72
the preliminary vote; however, the authors strongly suggest that, in addition to ranking the
top five to nine ideas/items in order of importance or suitability, with higher numbers
representing increasing importance or suitability, the participants also rate each item on
importance on a scale of 1–10, with low numbers indicating low importance and higher
numbers indicating higher importance; this allows researchers to gain a better
understanding of the magnitude of preference differences between the prioritized
ideas/items. If used, this second round of voting, mathematically tabulated, represents the
group’s final consensus.123
Delbecq and Van de Ven also address situations wherein the researcher or
facilitator wishes to use NGT procedures with a group of more than nine participants, such
as when the viewpoints and opinions of a large advisory board or commission need to be
amalgamated. The authors stipulate that the large group (they envision groups of 30 to 40)
be split into separate NGT groups of nine participants or fewer. Each group has its own
facilitator; these facilitators lead their groups through steps 1 through 4 of the process, as
described above. The groups then adjourn for a break. During the break, the facilitators
convene to compare the preliminary lists. Duplicate ideas/items are merged, along with
their accompanying votes. This process leads to the assembly of a master list of prioritized
ideas/items. The facilitators then reconvene the members of all the groups into a single
assemblage. They instruct the amalgamated group to discuss and clarify each idea/item in
turn, in round-robin fashion, and then the results of the preliminary voting are discussed.
Once this is completed, a final vote is held, using the same ranking and rating procedures
described for step 6 above.124
Freya Vander Laenen emphasizes that the research question at the heart of an NGT
analysis must be concrete and avoid the pitfall being too general in nature, yet not be so
restrictive that it forecloses valuable brainstorming on the part of the participants. She
suggests that, given the tremendous importance of the initial question, facilitators pilot test
several alternative versions of their research question. She notes that, as with all techniques
123 Ibid., 63–66.
124 Ibid., 70–72.
73
that seek to elicit opinions and knowledge from experts, sampling of experts for an NGT
procedure is purposive, not random. She recommends that the expert participants (whose
expertise may simply consist of the fact that they are persons that have been impacted by
a problem, or who will be impacted by a decision that needs to be made) be chosen to allow
for input from a variety of differing perspectives. If the number of differing perspectives
(or elements of expertise) needed to be sampled exceeds the optimum number of
participants in an NGT session, she suggests multiple NGT sessions should be
conducted.125 Karen H. Dening et al. provide an example of this in their NGT study of
persons with dementia and their family care-takers regarding preferences for end-of-life
care. The researchers conducted three separate NGT sessions, one including persons with
dementia, the second with those persons’ family carers, and the third consisting of dementia
sufferer-caretakers’ dyads.126 Vander Laenen notes that, whereas Delbecq and Van de Ven
state the optimal number of participants for NGT sessions is between five and nine, other
researchers who have used the technique have achieved satisfactory results with groups
ranging from six to twelve in number.127
D. NOMINAL GROUP TECHNIQUE: ADVANTAGES
Delbecq and Van de Ven claim many advantages for their nominal group technique.
They state that having specified procedures for the accomplishment of each step means
there is little variability in behavior among either group leaders or participants in different
instances of NGT use, which should lead to consistency in decision making. They point
out that participants derive both social-emotional benefit and task-instrumental satisfaction
from NGT, as opposed to the Delphi technique, which isolates participants from one
another. NGT’s procedures of silent, independent idea generation, followed by round-robin
discussions of each idea in its turn, generally results in a relatively high number of unique
125 Freya Vander Laenen, “Not Just Another Focus Group: Making the Case for the Nominal Group
Technique in Criminology,” Crime Science 4, no. 5 (2015), 3, doi: 10.1186/s40163-014-0016-z.
126 Karen H. Dening, Louise Jones, and Elizabeth L. Sampson, “Preferences for End-of-Life Care: A Nominal Group Study of People with Dementia and Their Family Carers,” Palliative Medicine 27, no. 5 (2012), 410, doi: 10.1177/0269216312464094.
127 Vander Laenen, “Not Just Another Focus Group,” 3.

74
ideas generated. The technique encourages its participants to engage in proactive search
behavior for problem solutions. NGT processes have the advantage of enforcing a high
level of equality of participation among participants. Finally, they point out that evaluations
of NGT indicate that participants derive relatively high levels of perceived accomplishment
and closure from their participation, which also inspires increased interest in further
involvement in the problem-solving process.128 This latter observation is of importance in
any forecasting or problem-solving effort, such as the “devil’s toy box” challenge analyzed
in this thesis, which requires multiple steps or rounds and which may ask participants to
devote continuing time and effort over a period of weeks or months.
Carolyn Brahm and Brian H. Kleiner point out the psycho-social benefits that may
be derived from use of the nominal group technique. They note that NGT is often to be
preferred for group analyses involving judgmental decisions because research suggests the
technique is effective at reducing negative emotions such as hostility, resentment, and
interpersonal tension that might otherwise be generated by the discussion of controversial
issues and alternative choices. Additionally, it facilitates input from group members who
might otherwise self-censor their own ideas due to a desire to avoid causing intragroup
conflict or exacerbating such conflict.129 Freya Vander Laenen adds to the list of psycho-
social benefits of NGT by pointing out that it minimizes the power differential between
researchers/facilitators and participants by placing the primary burden of idea generation
on the participants. Additionally, participants in an NGT procedure are treated as subjects
rather than objects—sources of opinions and specialized expertise (even if that expertise is
only their subjective knowledge of their own situations or social milieus), rather than
simply sources of data. These two features of NGT give the procedure added utility in
generating consensus within a group whose members may experience conflict or feelings
of opposition, such as community police officers and members of a crime-prone
neighborhood.130 The psycho-social benefits that accrue to participants versus facilitators
128 Ibid., 33–34.
129 Carolyn Brahm and Brian H. Kleiner, “Advantages and Disadvantages of Group Decision-Making Approaches,” Team Performance Management 2, no. 1 (1996), 35.
130 Laenen, “Not Just Another Focus Group,” 2.

75
are meaningful to my “devil’s toy box” analysis. The facilitators will most likely be
bureaucrats at homeland security agencies, rather than subject matter experts. Given this
fact, far greater emphasis should be placed upon the opinions and knowledge of the
participants, as opposed to that of the facilitators.
William M. Fox, prior to laying out his own Improved Nominal Group Technique,
mentions the following positive attributes of the technique’s original formulation. Some of
his thinking mirrors that of Brahm, Kleiner, and Vander Laenen. He states the technique
encourages participants to expand upon one another’s ideas, a concept in group dynamics
known as “coat-tailing.” Additionally, NGT does not permit the facilitator or participants
to remove any of the ideas due to objections or hostile feedback, which adds to the
procedure’s aura of fairness and equality of power among the participants. Along the same
lines, NGT promotes a group focus on the quality of the ideas themselves, rather than the
comparative status of the ideas’ authors. The technique allows for new items to be added
to the ideas list at any time prior to voting, which accommodates “late bloomers.” It
conserves time and preserves positive group dynamics by limiting discussion to
clarification of the ideas and brief statements in favor of or against an idea, thus
sidestepping digressions, uninvited repetition of talking points, hard selling tactics, and
extended periods of argumentation. Finally, the technique avoids premature declaration of
group consensus by allowing for the renewal of discussion following the initial round of
voting, plus a second round of voting, whenever the results of the first round of voting
indicate that additional deliberation and individual consideration of the ideas at hand are
warranted.131 In Chapter VII of this thesis, I discuss the selection of expert participants.
For a truly thorough “devil’s toy box” analysis, participants will need to be selected from
a variety of disciplines, professions, and experiential backgrounds. The level of perceived
authority, prestige, and expertise will necessarily vary considerably among the different
participants (for example, a university professor of materials physics will likely enter a
team with a higher perceived status than that granted a science fiction writer). For a “devil’s
toy box” analytical team to function optimally, lower-status participants should not feel
131 Fox, “The Improved Nominal Group Technique,” 21.

76
cowed into relative silence by those of higher status, and all participants should feel equally
empowered and that their ideas will be judged on their own intrinsic quality, rather than
authors’ status upon entry into the group.
E. NOMINAL GROUP TECHNIQUE: DISADVANTAGES
Brahm and Kleiner note that the nominal group technique is designed to deal with
only one problem at a time, which limits its flexibility. They further state that its structure
deprives the technique of being able to accommodate consideration of related but separate
problems or controversies that participants might be inspired to raise in the context of NGT
discussions; such separate issues would need to be considered and analyzed at a later NGT
meeting. Finally, they suggest that the technique is limiting in that the participants must be
persons who are comfortable working within the fairly rigid structure called for by the
NGT.132 In the context of my envisioned “devil’s toy box” analysis, neither of these
shortcomings poses a major problem, as scheduling more than one analytical session will
likely be required in any case, simply due to the complexity of the issues under
consideration.
William M. Fox, in his article, “The Improved Nominal Group Technique (INGT),”
precedes his description of his improved technique with a discussion of what he sees as the
shortcomings of the technique’s original format as developed by Delbecq and Van de Ven.
Fox begins by pointing out that ideas are generated by participants only once the face-to-
face NGT process has begun. This robs participants of the opportunity to take more time
to deliberate pre-meeting and to examine appropriate literature and resources. Also, the
lack of pre-meeting familiarization with the questions to be addressed during the NGT
procedure does not allow for participants to suggest to researchers/moderators other
possible panelist candidates, whom the researchers have not considered, who might be able
to contribute valuable insights to the meeting. Fox points out that much time at the NGT
meeting itself could be saved if participants would be allowed to generate their lists of ideas
before the meeting, send them to the facilitator, and the facilitator would input them onto
132 Brahm and Kleiner, “Advantages and Disadvantages,” 35.

77
a flip chart prior to the meeting’s start, rather than spending time doing so during the
meeting. On the important issue of anonymity of idea generation, although the traditional
NGT’s processes do separate the ideas’ authors from the ideas themselves to an extent,
anonymization of the ideas is not complete, since participants can reconstruct in their minds
who was responsible for which ideas by noting the order of the ideas on the flip chart and
aligning this with the participants’ seating order. Since anonymization is not complete,
participants may still be inclined, if they are sitting at the same table with colleagues—or,
worse, supervisors—to avoid sharing controversial ideas or ideas that would reflect badly
on colleagues or bosses. Finally, Fox points out that the traditional NGT’s procedures make
holding a session with more than nine participants cumbersome; assembling an NGT group
with more than nine members risks alienating the participants by extending the intervals
between their contributions to tiresome lengths. This limitation on the number of
participants that can be accommodated may render the NGT impracticable for certain
research efforts.133 Of course, Fox does not leave off his analysis here. He proposes a set
of solutions to address the shortcomings he has identified.
F. NOMINAL GROUP TECHNIQUE: MODIFIED FORMS
Fox follows up this list of shortcomings of the original NGT procedure with a
description of what he calls the Improved Nominal Group Technique (INGT). Fox’s INGT
replaces traditional NGT’s round-robin, out-loud voicings of ideas to a shared group
transcriber with the following procedure. Participants, prior to the meeting, write each of
their ideas on a separate 3X5 note card. These cards are then shared with the meeting’s
facilitators ahead of time, allowing the facilitators to write the ideas on the flip charts prior
to the meeting, thus shortening the time required for the gathering. Also, the list of ideas is
shared with all participants prior to the meeting, which may generate additional ideas or
refinements of ideas. Participants are encouraged to bring these newer ideas with them on
3X5 note cards to the meeting, where they are given to a team of transcribers, who add the
additional ideas to the already prepared flip charts. The use of multiple transcribers also
shortens the amount of time required by an INGT session. This team of transcribers may
133 Fox, “Improved Nominal Group Technique,” 21–22.

78
also add more new ideas, those that occur to the participants at the gathering itself, to the
flip charts; participants, if so inclined, share additional 3X5 note cards with the facilitators
in an anonymous fashion.134 Fox suggests that the anonymity of ideas that participants
either bring to the gathering or that they generate at the meeting be assured by the
moderator, who shuffles the 3X5 notecards thoroughly before distributing them to the
multiple transcribers to be added to the already prepared flip charts.135 He states that his
INGT offers the significant process improvement of allowing sessions larger than the
maximum of nine set forth by Delbecq and Van de Ven; based on his experience, groups
as large as 20 can be accommodated by the INGT.136
Fox is not the only researcher who has suggested refinements to the original
nominal group technique. Dening et al., in their nominal group study of end-of-life
preferences of persons with dementia and their family care-givers, modify the traditional
NGT procedure by following the first round of idea discussion with a second round of idea
generation, and then adding a subsequent step of generating common themes from the ideas
previously generated in the two brainstorming rounds.137 S. Gaskin has adjusted the
original nominal group technique for situations wherein the initial round of voting suggests
that additional idea clarification and consideration are warranted to achieve consensus; for
example, when the initial voting results in votes clustering around two or more preferred
ideas or options. In such situations, Gaskin adds another round of discussion, followed by
a second round of voting/ranking.138 In fact, Gaskin’s suggestions are not so much
modifications of the original NGT process as they are restatements of Delbecq’s and Van
de Ven’s optional additional discussion and voting/ranking steps set forth in their book
Group Techniques for Program Planning.
134 Fox, “Improved Nominal Group Technique,” 23.
135 Ibid., 24.
136 Ibid., 23.
137 Dening, Jones, and Sampson, “Preferences for End-of-Life Care,” 410.
138 S. Gaskin, “A Guide to Nominal Group Technique (NGT) in Focus-Group Research,” Journal of Geography in Higher Education 27, no. 3, 341–347.

79
Considerable technical advances in communications have taken place since
Delbecq and Van de Ven created the nominal group technique in 1968. Vander Laenen
notes in her 2015 article that online variations of NGT are becoming increasingly popular
with researchers. In the synchronous form of online NGT, participants utilize various forms
of collaborative software to present their ideas and discuss them while online
simultaneously. Alternatively, online NGT sessions can be arranged for asynchronous
participation, wherein participants log in at their own convenience within a period of time
set by the researcher.139 She points out that, while these online forms of NGT extend the
technique’s utility and applicability by obviating the need for physical gathering and the
accompanying travel on the part of participants and by allowing for much larger numbers
of participants than a face-to-face session, certain advantages of face-to-face NGT sessions
are lost. The online discussions typically lack the non-verbal cues that add to clarifications
of ideas in face-to-face sessions and written-only communications are subject to
misinterpretations. Also, synchronous online discussions are subject to being dominated
by the fastest typists in the group, who can get their ideas on other participants’ screens the
quickest.140 Interestingly, whereas Delbecq and Van de Ven developed the nominal group
technique in part as a response to what they saw as shortcomings in the Delphi technique,
the asynchronous online form of NGT is virtually indistinguishable from online forms of
the Delphi technique. Technology and communications trends have caused the most
technically advanced versions of the two once-disparate techniques to merge. This is in
contradiction to the intentions of Delphi’s and NGT’s progenitors. They relied upon
differing perspectives and goals—Delphi creators wanted to entirely banish face-to-face
interactions between participants for a variety of reasons already discussed, and NGT
creators wanted to incorporate face-to-face interactions in the idea discussion and
refinement phase—in designing their separate techniques for the elicitation of expert
opinion. The siblings, separated in early childhood, have now been reunited, and their
parallel development during the intervening years has made distinguishing between them
a difficult discernment.
139 Vander Laenen, “Not Just Another Focus Group,” 4.
140 Ibid., 9.

80
G. EVALUATIONS OF THE DELPHI TECHNIQUE COMPARED WITH THE NOMINAL GROUP TECHNIQUE, STATICIZED GROUPS, UNSTRUCTURED DIRECT GROUP INTERACTION, AND OTHER FORMS OF STRUCTURED DIRECT GROUP INTERACTION
In 1991, Fred Woudenberg performed a meta-study of 17 earlier studies that
compared the accuracy of results accrued by the Delphi technique with that of results
accrued from staticized groups (participants who offered inputs entirely independently,
whose inputs then had means or medians calculated to determine centrality), unstructured,
direct interaction, and structured, direct interaction. Structured, direct interactions are
represented in this meta-study by the nominal group technique. Woudenberg finds these
studies, taken in aggregate, show Delphi to be slightly more accurate in its outcomes than
unstructured, direct interactions, but slightly less accurate than staticized groups. He sees
no difference in accuracy between Delphi and structured, direct interactions (the nominal
group technique). He cautions that all the 17 studies were performed in laboratory settings
and that all but a few did not use expert participants, which is the raison d’être for the
Delphi in the first place.141 Regarding the efficacy of iteration (successive rounds of
questionnaires) in improving the accuracy of Delphi forecasts, Woudenberg states that
prior studies show the great majority of improvement takes place between the initial and
second rounds of estimation (not counting the Delphi’s first questionnaire, if that initial
questionnaire is open-ended, as with the conventional Delphi). He also points out that
successive rounds of questionnaires appear to induce participants to shift their responses
toward the group’s median, but rarely shift that median itself.142 He ascribes this shift
toward the group’s median as due to pressures for conformity, which are exerted through
the statistical feedback regarding group response provided to the individual participants,
rather than an improvement in accuracy for the outlying panelists due to improved
information being made available to them.143 He states that Delphi procedures are very
effective at achieving consensus; however, consensus increases far more strongly than
141 Woudenberg, “An Evaluation of Delphi,” 131–135.
142 Ibid., 140.
143 Ibid., 141.

81
accuracy. He concludes that one of the primary justifications for the characteristic features
of the Delphi technique—that of preventing groupthink or the domination of expressed
group opinion by the loudest or most prestigious voices, presumably accomplished through
anonymity, avoidance of face-to-face interactions, and the remote, dispersed use of
questionnaires—is not borne out by the experimental evidence.144
Eight years later, in 1999, Gene Rowe and George Wright performed another meta-
study of the effectiveness of the Delphi technique versus staticized groups, interacting
groups, and other structured group procedures. They included a larger number of prior
studies in their meta-study than Woudenberg had, 27 to his 17.145 In examining the lists of
studies considered by Woudenberg and by Rowe and Wright, I found that the latters’ meta-
study includes nine studies also covered by the former meta-study; eight of the studies
considered by Woudenberg were not considered by Rowe and Wright; and 18 of the studies
considered by Rowe and Wright were not considered by Woudenberg.
Rowe’s and Wright’s findings differ from those of Woudenberg. Regarding the
accuracy of Delphi procedures versus that of statistized groups, their meta-study shows
that, of 14 studies permitting this comparison, Delphi procedures are shown to result in
higher accuracy than the results of statistized groups in 12 of the 14 studies, although five
of these studies showed the difference in accuracy failed to reach statistical significance.
In two of the studies, the Delphi proved more accurate under conditions but not under
others.146 Regarding Delphi’s accuracy versus that of unstructured, interacting groups, of
nine studies permitting this comparison, five showed a superiority for Delphi, one showed
a superiority for unstructured, interacting groups, two showed no difference in accuracy
between the two techniques, and one study showed a superiority for Delphi when almanac
type items were being predicted but a superiority for unstructured, interacting groups when
144 Ibid., 145–146.
145 Gene Rowe and George Wright, “The Delphi Technique as a Forecasting Tool: Issues and Analysis,” International Journal of Forecasting 15 (1999): 356.
146 Ibid., 364.

82
the object was forecasting.147 Their results for Delphi procedures versus other structured
group procedures were equivocal. Three studies indicated a superiority of the nominal
group technique over Delphi in terms of accuracy, quality, or number of ideas generated,
one showed Delphi to be superior regarding quality, and two showed no difference in
accuracy between the two procedures. Few differences were found in studies comparing
Delphi to other types of structured face-to-face interaction techniques such as the Dialectic
procedure (panelists are required to deliver arguments both in favor of and against their
own judgments), the Dictator or Best Member procedure (final group judgment is based
upon that of the group’s selected representative), groups whose interactions were based
upon Social Judgment Analysis, groups that were given rules on interactions prior to their
exchanges, and groups whose interactions followed the Problem Centered Leadership
model. Only one of these studies showed any of the non-nominal group technique
procedures to be superior to Delphi, and that was the Problem Centered Leadership
approach, wherein group leaders are provided training in facilitating positive exchanges
between panelists.148
Rowe and Wright echo the criticisms offered by Woudenberg of studies conducted
on the accuracy or quality of the Delphi technique. They point out that the great majority
of studies they examine have used as panelists either students or professionals from a single
discipline, rather than the diverse panel of experts envisioned by the developers of the
Delphi technique (and often selected by researchers using Delphi in the field). They write:
“Delphi, however, was ostensibly designed for use with experts, in cases where the variety
of relevant factors (economic, technical, etc.) ensures that individual panelists have only
limited knowledge and might benefit from communicating with others possessing different
information… This use of diverse experts is, however, rarely found in laboratory
situations… if varied information is not available to be shared, then what could possibly
be the benefit of any group-like aggregation over and above a statistical aggregation
147 Ibid., 365–366.
148 Ibid., 366–367.

83
procedure?”149 They further point out that “(t)he requirement of empirical social science
research to use simplification and reductionism to study highly complex phenomena seems
to be at the root of the problem, such that experimental Delphis have tended to use artificial
tasks (that may be easily validated), student subjects, and simple feedback in the place of
meaningful and coherent tasks, experts/professionals, and complex feedback.”150 They
offer the final criticism that students recruited into studies of the efficacy of the Delphi
technique lack the motivation and interest of experts serving on panels intended to solve
problems, create forecasts, or arrive at statements of consensus relating to their fields of
expertise.151 They conclude that Delphi procedures conducted to actually produce
forecasts or to support decision-making are, in all likelihood, more accurate and produce
results of higher quality than those Delphi procedures conducted in laboratory settings to
test the technique’s efficacy.152
Rowe’s and Wright’s critiques of these studies strike me as valid, their observations
that virtually none of the laboratory studies involved experts and that, in contrast to Delphi
procedures carried out in the field to help support important decisions or to forecast
potential events of some significance, the laboratory studies offered no real motivation for
participants to do their utmost—nothing was at stake. Despite the limitations of these
comparison studies, I find it of interest that the Delphi technique is often shown to be
superior in terms of accuracy to staticized groups and interacting, unstructured groups, and
either on par or somewhat inferior to the nominal group technique. Should the two best-
known, most frequently used procedures for the elicitation of expert opinion—the Delphi
technique and the nominal group technique—be shown to be roughly equivalent in their
effectiveness, or with a slight edge to the latter, then the choices to be made by the
facilitators of a “devil’s toy box” analysis regarding process come down to factors other
than predictive accuracy. These factors will likely include feasibility, timeliness, cost,
149 Ibid., 368.
150 Ibid., 369.
151 Ibid., 368.
152 Ibid., 373.

84
logistics, and the value the facilitators place upon face-to-face interactions between the
members of their panel of experts versus the relative sterilization from social effects offered
by remote anonymity.
* * * * *
In the 1960s, researchers and analysts, charged with a new sense of optimism
(driven in part by the early promise of expert forecasting techniques such as Delphi) that
future events in the technological, social, commercial, and political realms could be
successfully forecast and that the most desirable future states could be planned for and
implemented through systematized effort, developed a new field known variously as
futurism, future studies, or foresight studies. Not merely a field of academic study,
futurism/future studies/foresight studies also developed into an operational doctrine used
in both corporate environments and governments. Over subsequent decades, practitioners
of futures studies innovated new ways of prognosticating future events and trends, adding
to the potential tool kit available to a “devil’s toy box” analysis team. In Chapter V, I will
survey these approaches and techniques that futurists have added to the basket of available
predictive analysis tools.
85
V. EXPERT ANALYSIS (3): FUTURES STUDIES/FORESIGHT STUDIES
A. FUTURES STUDIES: INTRODUCTION
Dr. Roy Amara, President and Senior Research Fellow at the Institute for the Future
in Menlo Park, California, has this to say in speaking of his own work and that of his fellow
practitioners of futures studies. He states “our purpose is not to predict—much as we would
dearly like to do so. Rather, our primary purpose is to generate images and to analyze and
understand them so that we can act to increase the probability of producing futures that we
prefer.”153 He goes on to specify that the main objectives of futures studies are:
laying out paths of possibilities (the art of the ‘possible’);
examining in detail paths and the likelihood of their occurring (the science
of the ‘probable’);
expressing preferences for, and implementing, paths (the politics of the
‘preferable’).154
Thomas Saaty and Larry Boone, in their book Embracing the Future: Meeting the
Challenge of Our Changing World, echo some of Amara’s thoughts regarding the field of
future studies, or, as they refer to it, futurism. They begin by listing three assumptions held
in common by practitioners of futurism—that the future defies prediction; that the future
is in no way predetermined; and that the shape the future takes will be influenced by the
choices that individuals make.155 They go on to describe three different types of futurists:
Futurists of the possible tend to be mavericks, visionaries, sometimes geniuses, and sometimes madmen. They emphasize intuition and feeling in their thought processes. Futurists of the probable tend to be analytically
153 Roy Amara, “Views on Futures Research Methodology,” Futures 23 (July/August 1991), 647–
648.
154 Ibid., 646.
155 Thomas L. Saaty and Larry W. Boone, Embracing the Future: Meeting the Challenge of Our Changing World (New York: Praeger, 1990), 15.

86
oriented in one or more fields such as mathematics, statistics, or systems analysis. Futurists of the preferable tend to be political scientists; they emphasize specific issues such as nuclear power, women’s rights, or environmental concerns. Futurists of all categories are usually effective writers who can generate mass appeal.156
Nicholas Rescher, in his 1967 monograph The Future as an Object of Research,
notes that the decade of the 1960s had witnessed increasing interest in future studies. He
lists books published in that decade by French, German, and American authors, such as Art
of Conjecture by Bertrand de Jouvenel (1964), Der Wettlauf zum Jahre 2,000 by Fritz
Baade (1960), Inventing the Future by Dennis Gabor (1964), and Theodore Gordon’s
simply titled The Future (1965). He also points out that decade’s proliferating numbers of
governmental advisory commissions regarding forecasting future trends to help guide
public policy formulation, including the Futuribles association in France and, in the United
States, the Commission for the Year 2000, the National Planning Association, the National
Commission on Automation, Manpower, and Technological Progress, and Resources for
the Future. He singles out the early work of Alvin Toffler for praise, citing Toffler’s article
“The Future as a Way of Life” from the summer, 1965 edition of Horizon. He lumps these
phenomena together and christens them “The Futures Industry.”157
Various governments regularly engage in a form of futures studies called future-
oriented technology analysis, which consists of institutionalized efforts to forecast
disruptive, transformative technology developments. The United Kingdom, Singapore, and
the Netherlands all maintain horizon-scanning centers, and the European Parliament has
established a parliamentary technology assessment office, the Scientific Technology
Options Assessment Unit.158 In Japan, the Ministry of International Trade and Industry
(MITI/METI), in conjunction with the Science and Technology Agency, initiated a series
156 Ibid.
157 Nicholas Rescher, The Future as an Object of Research (Santa Monica: RAND Corporation, April 1967), 2–4, http://www.dtic.mil/dtic/tr/fulltext/u2/651425.pdf.
158 K. Matthias Weber, Jennifer Cassingena Harper, Totti Könnölä, and Vicente Carabias Barceló, “Coping with a Fast-Changing World: Towards New Systems of Future-Oriented Technology Analysis,” Science and Public Policy 39 (2012), 155–157, doi:10.1093/scipol/scs012.

87
of national Delphi forecasting studies beginning in 1969 and repeated every subsequent
five years. One example, the National Delphi study conducted in 1990–1991, attempted to
formulate a long-term forecast for Japanese society and the economy through 2010 by
examining 101 separate emerging technologies, their predicted emergence times, and their
potential impacts upon society and the economy. Japan’s national Delphis have tended to
encompass large numbers of participants; for example, 2,781 initial respondents in the
1990–1991 study, increasing to 4,220 first-round questionnaire respondents in the 1997
study. Considering the high value that Japanese society places on consultation and
inclusion, an important side-benefit of the National Delphi studies has been their
facilitation of communication between large groups of experts and the improved flow of
information.159 The Finnish Parliament’s Committee for the Future conducted a series of
policy Delphi surveys between 1997 and 2001. The surveys encompassed a forecasting
time envelope of 5–20 years and focused upon the genetic engineering of plants, new
technologies to assist teaching and learning, energy technology development,
gerontechnology, and new techniques for knowledge management.160 The European
Commission established the European Foresight Monitoring Network (EFMN) to monitor
European foresight studies, gather and distribute the information produced in the form of
an annual report, and determine key emerging issues in the areas of science and technology
policy.161 EFMN annual reports have focused on such disparate issues as developments in
cognitive science (2005), technological and medical advances regarding healthy aging
(2006), issues for Europe surrounding the emerging knowledge-based economy (2007),
and the future of European public health services (2008).162
159 Kerstin Cuhls, “Foresight with Delphi Surveys in Japan,” Technology Analysis & Strategic
Management 13, no. 4 (2001), 555–559, doi: 10.1080/09537320120095446.
160 Ahti Salo and Osmo Kuusi, “Parliamentary TA: Developments in Parliamentary Technology Assessment in Finland,” Science and Public Policy 28, no. 6 (December 2001), 453–456, doi: 032-3427/01/060453-12.
161 Maurits Butter, Felix Brandes, Michael Keenan, Rafael Popper, Susanne Giesecke, Sylvie Rijkers-Defrasne, Anette Braun, and Patrick Crehan, Final Report: Monitoring Foresight Activities in Europe and the Rest of the World (EUR 24043 EN) (Brussels, Belgium: European Foresight Monitoring Network, European Commission, Publications Office of the European Union, 2009), 7, doi: 10.2777/47260.
162 Ibid., 33–39.

88
The origins of both the Delphi technique and futurism/future studies as a field of
operational decision support and academic study may be said to flow from the same
wellspring, a monograph entitled The Prediction of Social and Technological Events. This
was first published by the RAND Corporation in 1949, then republished in January 1950
as an article in Public Opinion Quarterly. The monograph’s authors were A. Kaplan, an
Associate Professor of Philosophy at UCLA, A. L. Skogstad, an economist employed by
RAND, and M. A. Girshick, a Professor of Mathematics at Stanford. Kaplan et al. voiced
many of the same questions and concerns regarding experts and their prognostications that
have occupied practitioners of futures studies ever since. In dealing with questions germane
to the formulation of public policy, which require that assumptions be made about future
societal states and future trends, how good are experts’ prognostications? Who are the best
experts to listen to? How can their prognostications be improved? How can the
prognosticators avoid emotional, psycho-social, and political pressures to alter their
forecasts in ways favorable to their peers or superiors?163
In their attempt to address these questions, the authors performed an experiment in
forecasting whose design helped to establish the basic procedures of the classic Delphi
technique. The researchers recruited a group of 26 predictors, of whom 15 were
mathematicians or statisticians, four were economists or business administrators, one was
an office manager, one a secretary, and one a professional writer. Twenty-four of the 26
had a college education. These participants were asked to make predictions through the
method of answering questionnaires. The questions were divided between the social
sciences and natural sciences. Regarding the former, predictions to be made concerned
domestic and foreign political events and economic developments. For the latter, the
predictions were focused upon technological advancements and developments in physical
and life sciences. In total, participants were asked 123 questions. In response, they offered
3007 separate predictions, all in the form of rating the likelihood, on a scale of 0 to 100, of
an event occurring; for each question, the researchers offered four possible answers, and
the participants’ ratings for the four alternatives needed to add to 100 (for example,
163 A. Kaplan, A. L. Skogstad, and M. A. Girshick, “The Prediction of Social and Technological
Events,” Public Opinion Quarterly 14, no. 1 (January 1950), 93–96, https://doi.org/10.1086/266153.

89
participants were asked to predict which of four possible candidates would be nominated
as the Republican candidate in the next presidential election). The researchers issued the
participants a new questionnaire each week for 13 subsequent weeks, and in addition to
offering their likelihood ratings, participants were instructed to write down the reasoning
by which they made their determination. Each participant was allotted three hours in which
to complete a questionnaire. Each week, participants were broken out into three groups.
The members of the control group all answered their questionnaires independently.
Members of the second group were directed to discuss the questions with the other
members of their group prior to answering the questionnaires separately. Members of the
third group also discussed the questions, but they provided a single, consensus set of
answers to the researchers. The questions asked were all the sort for which definitive
answers could be obtained within the five month-long period of the study (i.e., the
Republican National Convention would take place prior to the researchers performing their
analysis, so the accuracy of the prognosticators’ answers could be determined).164 Thus,
this experiment may be viewed as an early precursor of the forecasting tournament
sponsored by the Intelligence Advanced Research Projects Agency (IARPA) beginning in
2011, which I will examine in detail in Chapter VIII.
Kaplan et al. cautioned that the experiment’s design and choice of participants
weighed against its replicability and pointed out that all participants were instructed to
answer all the questions, not merely those questions falling within the field for which they
could be considered an expert. Were such a restriction to have been made, matching experts
with those questions regarding which they would have the greatest prior knowledge, the
accuracy scores might have been higher. They also bemoaned the fact that time constraints
on the study’s completion required that only short-term prognostications could be
considered, those whose results could be determined within a five-month timeframe. With
these caveats in mind, the researchers derived some interesting, suggestive results. The
overall success rate for prediction was 52%. For those responses the participants judged
“guesses,” the success rate was 40%, whereas those answers for which the participants
164 Ibid., 96–97.
90
offered justifications saw a far higher success rate of 62%. Importantly for the future
development of the Delphi technique, the researchers compared the accuracy of their
various experimental cohorts, comparing these to the overall predictive success rate of
52%. On the low end, the worst-informed half of the respondents, answering
independently, scored at 50%. By way of comparison, the best-informed half of the
respondents scored at 56%; however, those results were bested by the cooperative group
(those participants who conferred with their peers and then answered independently) at
62%, and the joint group (those participants who conferred with their peers and offered a
consensus answer) at 67%, as well as by the mean prediction at 66% and the plurality
prediction at 68%. The outlier of all the participants, the single best-performing individual
predictor, scored at 71%.165 Olaf Helmer and Norman Dalkey obviously took these results
into account when designing the Delphi technique, noting the benefits of inter-participant
consultation and attempting to accrue those benefits while at the same time avoiding the
detrimental features of face-to-face interactions.
B. FUTURES STUDIES: METHODOLOGIES
The purpose of these sections concerning futures studies is not to offer a broad
overview of the field, nor to survey and profile the thinking of prominent futurists, nor to
examine the role of futurism in popular culture (such as the enormous success and influence
of Alvin Toffler’s book Future Shock with a non-specialist readership), nor to provide a
portrait of the field’s evolution since its initial gestation at the RAND Corporation in the late
1940s. Such topics, while of great interest, are outside the scope of this thesis. Rather, the
purpose of this consideration of the field of futures studies is to examine the analytical tools
commonly used by futurists and to determine whether any of those tools might be
advantageously added to the tool kit I intend to assemble for the members of a “devil’s toy
box” analytical team.
Nicolas Rescher, along with Olaf Helmer and Norman Dalkey one of the
philosophers employed by the RAND Corporation’s Mathematics Division in the 1950s and
165 Ibid., 103–109.

91
1960s and thus one of the pioneers of futures studies, identifies, in his 1967 monograph The
Future as an Object of Research, three types of what he terms predictive methodologies: “the
extrapolation of historical experience, the utilization of analytical models, and the use of
experts as forecasters.”166 He mostly dismisses extrapolation of historical experience as a
useful technique, stating that scientific progress involves so many breaks from past
technological methods that simple extrapolation leads to outlandish prognostications (my
own favorite in this realm is a prediction from the early 1900s that, given the projected
growth in the numbers of horse stabled in New York City, by mid-century the city’s streets
would be enveloped by a layer of horse dung ten feet deep!). He also states that, at the time
of the article’s writing, the processes of scientific invention and innovation, of the diffusion
of new technologies through society, and of resulting social change were too little understood
to permit the creation of useful analytical models incorporating these essential feeders of the
future. He concludes by opining that only the systematic use of experts as prognosticators
offers much in the way of utility in forecasting future trends.167
In a later work, his 1998 book Predicting the Future: An Introduction to the Theory
of Forecasting, Rescher offers the following, Table 2, illustrating when methods of
prediction are appropriate:
Table 2. Conditions of Predictability (per Rescher, 1998)168
The phenomena of domain are amenable to prediction by
provided that This domain has a structure of occurrence that
expert judgment is learnable (orderly)
trend extrapolation exhibits trend uniformity
pattern fitting exhibits stable temporal patterns
analogy maintains an actual (rather than merely apparent) analogy
indicators exhibits stable correlations
law inference is stably lawful (regular)
modeling has a fixed structural modus operandi
166 Rescher, Future as an Object of Research, 5.
167 Ibid., 5–7.
168 Nicholas Rescher, Predicting the Future: An Introduction to the Theory of Forecasting (Albany, NY: State University of New York Press, 1998), 111.

92
Given the natures of the various phenomena that would feed into a “devil’s toy box”
analysis—including, but not limited to, technological advances; technological diffusion;
interplay between technologies; social, political, and ideological trends in extremism and
extremist groups; evolution in homeland security practices and doctrines; and political will
to support changes in security-related laws and procedures—it would appear that few of
the formal techniques Rescher lists would be appropriate tools. These phenomena, for the
most part, are not orderly; they do not exhibit trend uniformity; they do not exhibit stable
temporal patterns, nor stable correlations; they are not stably lawful or have fixed structural
modus operandi. Given all this, Rescher’s stipulation that forecasters in the social and
political arenas need to muddle through with judgmental techniques, rather than formalized
inferential or sophisticated scientific methods, would seem to apply.
Saaty and Boone present a list of four possible ways in which to forecast the future,
which overlaps some with Rescher’s list and expands his list. Their first method is
acquiring the consensus of experts; the best-known method in this realm is the Delphi
technique. Their second method is the extrapolation of past trends, which they state is most
commonly used in fields amenable to quantitative analysis, such as projecting futures in
the demographic, environmental, and economic realms; they point out the basic pitfall to
this approach is that it does not allow for unprecedented events of great impact (such as the
assassination of an influential world leader, the crash of a major meteor into a populated
area, or the emergence of a new, virulent, highly contagious disease). Their third method
is historical analysis, of which they mention there are at least three subtypes, including
political analyses (such as those performed by Karl Marx in his writings), analyses of
problems with existing systems, and analyses that hypothesize major changes in existing
systems and extrapolate the effects of those changes into the future. Their fourth method is
“the systematic generation of alternative paths” using both quantitative and non-
quantitative modelling to generate alternative plausible futures.169 This fourth method is
scenario building and analysis.
169 Saaty and Boone, Embracing the Future, 22–24.

93
Roy Amara, in his survey of futures research methodologies, states that the
discipline’s original analytical tool kit, popular in the 1960s and 1970s, consisted of various
methods of simulations and gaming, cross-impact modelling, and Delphi studies.
Following what he describes as the heyday of Delphi in the 1960s and 1970s, practitioners
of futures studies moved on to structured workshops (which, judging from Amara’s brief
description, sound much like uses of the nominal group technique) and the widespread use
of scenarios for portraying potential alternate futures. He identifies the three primary
objectives of futurologists as exploring the possible, the probable, and the preferable. His
suggested methodologies for exploring the possible include all techniques that improve
imaging of future states, including brainstorming sessions, structured workshops, focus
groups, and one-on-one interviews of experts in various disciplines, as well as the panoply
of imaginative tools used by artists and writers. For exploring the probable, he suggests
tools that trace connections, such as flow charts, influence diagrams, matrices, and root-
and-branch structure diagrams. Finally, for exploring the preferable, he directs practitioners
to role-play various stakeholders and engage in the techniques of shared problem solving,
including negotiation and bargaining, conflict resolution techniques, and various forms of
mediation of competing interests.170
Earlier in this thesis, in Chapter II, I discuss Ronald Lehman’s concept of strategic
latency, the fact that virtually all technology can conceivably be dual-use, as effective in
causing harm or multiplying the force of existing weapons systems as it is in its intended,
benign civilian use. I also address Bryan Arthur’s concept of “combinatorial evolution” of
technology, wherein various separate technologies act like chemical elements that can be
reconfigured and recombined in virtually endless combinations for new purposes,
including purposes unforeseen by the technologies’ original developers, some of these
purposes at harsh variance to those developers’ intentions. Given the mind-boggling array
of potential variations, branchings, and recombinations of new and existing technologies,
the challenges for a “devil’s toy box” analyst team are daunting. One tool in the futurists’
tool kit that can assist our poor, bedeviled team of analysts in parsing these complications
170 Amara, “Futures Research Methodology,” 645–647.

94
of influence and interdependencies is the cross-impact matrix. Theodore J. Gordon defines
the cross-impact matrix method as “an experimental approach by which the probability of
each item in a forecasted set can be adjusted in view of judgments relating to potential
interactions of the forecasted items. … The systematic description of all potential modes
of interaction and the assessment of the possible strength of these interactions is vastly
complex but methodologically important, since these descriptions and metrics may provide
new insight into historical analysis and permit greater accuracy and precision in
forecasting.”171 Automated tools are available to perform the mathematical calculations
involved in the analysis of a cross-impact matrix, which incorporates both the direction of
change involved in the interaction between two variables and the strength of that change.
Gordon provides a set of seven steps for setting up a cross-impact matrix so that the
interactions between variables can be analyzed by a software program:
1. assessing the potential interactions (cross impacts) among individual events in a set of forecasts, in terms of:
a. direction, or mode, of the interaction,
b. strength of the interaction, and
c. time delay of the effect of one event on another
2. selecting an event at random and “deciding” its occurrence or nonoccurrence based on its assigned probability
3. adjusting the probability of the remaining events according to the interactions assessed as likely in Step 1
4. selecting another event from among those remaining and deciding it (using its new probability) as before
5. continuing this process until all events in the set have been decided
6.. ‘playing’ the matrix in this way many times so that the probabilities can be computed based on the percentage of times that an event occurs during these plays; and
171 Theodore J. Gordon, “The Current Methods of Futures Research,” in The Futurists, ed. Alvin
Toffler (New York: Random House, 1972), 180.

95
7. Changing the initial probability of one or more events and repeating Steps 2 to 6.172
Trudi Lang identifies three related futures studies methodologies for identifying
and analyzing emerging issues. These are environmental scanning, issues management,
and emerging issue analysis.173 Peter Schwartz, futurist and president of Global Business
Network, discusses environmental scanning in his 1991 book The Art of the Long View.
Schwartz lists the primary targets for information gathering, as part of an environmental
scanning process, to be developments in science and technology, perception-shaping
events (events that receive widespread coverage in the media and that move public opinion
in a new direction), new developments in music (music, with its impact upon the emotions,
can be a powerful driver of public sentiment, as well as a reflection of concerns bubbling
up in the larger society, as songwriters seek to connect to the zeitgeist), and what Schwartz
terms the fringes.174 Regarding the latter, Schwartz writes that “…new knowledge
develops at the fringes. People and organizations often organize knowledge concentrically,
with the most cherished, vital beliefs at the protected center. At the outer edge are the ideas
that the majority rejects. A little closer to the center are the fringes—areas not yet
legitimized but not utterly rejected by the center either. Innovation is the center’s weakness.
The structure, the power, and the institutional inertia all tend to inhibit innovative thinkers
and drive them to the fringes. At the social and intellectual fringes, thinkers are freer to let
their imaginations roam, but are still constrained by a sense of current reality.”175 As
examples of players on the fringes who ended up influencing the world in striking ways,
Schwartz lists Albert Einstein, Steve Jobs and Steve Wozniak, Ho Chi Minh, the creators
of the Gaia hypothesis, the visionary who first conceptualized nanotechnology, the radical
environmentalist group Earth First, researchers at Xerox’s Palo Alto Research Center, and
172 Ibid., 182.
173 Trudi Lang, “An Overview of Four Futures Methodologies” (unpublished research paper, last modified Fall, 1994), 1, http://citeseerx.ist.psu.edu/viewdoc/download?doi=10.1.1.455.1045&rep=rep1&type=pdf.
174174 Peter Schwartz, The Art of the Long View (New York: Doubleday, 1996), 62–73.
175 Ibid., 69.

96
telephone network “phone phreaks,” adventuresome hobbyist teenagers who were the
original computer hackers.176 P. T. Terry also created a model of environmental scanning,
one focused on the needs and concerns of a commercial company or corporation. The areas
he emphasizes for attention include market influences (encompassing customers, markets,
competitors, and suppliers), technical influences (encompassing the availability and quality
of raw materials, as well as the knowledge base concerning the company’s products and
production processes), social influences (values, prohibitions and constraints,
environmental concerns, religious beliefs, and trends in opinions and preferences in the
larger society of which the company is a part), and political/legislative influences
(regulations, laws, planned legislation or legislation in progress).177
Howard Chase, a pioneer of the issues management methodology and at one point
chairman of the Issues Management Association, offers the following definition of issues
management: “the capacity to understand, mobilize, coordinate, and direct all strategic and
policy planning functions, and all public affairs/public relations skills, toward achievement
of one objective: meaningful participation in creation of public policy that affects personal
and institutional destiny.”178 Lang points out that most practice of issues management as
a methodology occurs in the corporate environment, with a near-term focus, examining
issues likely to result in legislative activity within the next 18–36 months. Drawing on the
model set forth by Robert L. Heath and Richard A. Nelson in their 1986 book Issues
Management: Corporate Public Policymaking in an Information Society, she states that
the three concurrent activities of issues management are foresight, development of policies,
and advocacy for those policies. The six steps that support these activities are thoroughly
monitoring political and legislative activity to identify those emerging issues that will most
likely have an impact on the researcher’s sponsoring or employing organization;
prioritizing those emerging issues in terms of the significance of their likely impact;
176 Ibid., 69–73.
177 P. T. Terry, “Mechanisms for Environmental Scanning,” Long Range Planning 10, no. 3 (June 1977), 2–3.
178 Robert L. Heath and Richard A. Nelson, Issues Management: Corporate Public Policymaking in an Information Society (Beverly Hills, CA: Sage Publications, 1986), 20.

97
evaluating the prioritized issues in terms of their likely impacts upon the operations and
finances of the organization; formulating the organization’s official position on the
prioritized issues; based upon these official positions, formulating organizational strategies
in response to the issues; and, finally, carrying out this strategy.179
In contrast to the short-term focus of issues management, which concentrates upon
issues that have matured to the point when they appear ripe for legislative action within 18
to 36 months, the related methodology of emerging issues analysis seeks to identify and
analyze issues far earlier in their developmental cycle.180 Graham T. T. Molitor, a pioneer
of emerging issues analysis, writes that the envelope of time that extends from the earliest
emergence of a social issue on the fringes of society, such as in avant-garde or visionary
artistic works or the writings of members of minority or outcast groups, to a focus on that
issue by the popular mass media, to a scholarly consideration of the issue in academic
journals and conferences, may stretch from 35 to 85 years.181 In a later article, Molitor
refines his estimation of the timelines involved in the origins, formulation, and legislation
of social policy. He states the minimum amount of time required for this progression from
idea to legislation is 6–12 years, although his studies have shown that the time required can
extend to as much as 23–100 years.182 As the founder of Public Policy Forecasting, a
consulting firm specializing in emerging issues analysis, Molitor built his Molitor Multi-
Timeline Model to predict the timing of the introduction and passage of major public policy
legislation. Molitor notes that, in contrast with many of his fellow futurists, who tend to
focus on discontinuities, he focuses instead on historical continuities and repeating patterns
of societal evolution. His model is based upon G.K. Chesterton’s notion of the “prophetic
past,” the observation that history encompasses observable, identifiable patterns that are
179 Lang, “Four Futures Methodologies,” 12–13.
180 Ibid., 13.
181 Graham T. T. Molitor, “How to Anticipate Public-Policy Changes,” S.A.M Advanced Management Journal (Summer 1977), 6.
182 Graham T. T. Molitor, “Forty Year Effort to Ascertain How Public Policy Evolves,” Journal of Futures Studies 5, issue 1 (August 2000), 80.

98
repeated time and again, from society to society, heralded by leading indicators.183 He
states that changes in public policy are put into motion by approximately 25 discrete
“signatures of change,” as he calls them, which he has incorporated into his model.184 As
an example of these “signatures of change,” in his consulting practice, he looks to political
developments in the Scandinavian countries as precursors to later changes that will likely
take place in other European democracies, the United Kingdom, the United States, and
Canada; within the U.S., he considers New York, Massachusetts, and California as the
trend-setters that other American states almost inevitably follow within certain time
lags.185
In opposition to Rescher’s belief that forecasting in the social and political realms
cannot be reliably based upon formalized inferential or sophisticated scientific methods,
the Molitor Multi-Timeline Model incorporates elements of trend extrapolation, pattern
fitting, use of analogies, leading indicators, and modeling. Molitor claims a remarkable
reliability rate of 90% for use of his Multi-Timeline Model to predict the timing of what
he terms public policy resolutions (introduction and passage of legislation, etc.).186 Given
the vagaries of what constitutes “public policy resolutions,” however, I would need to see
his definitions of these outcomes, as well as his definitions of what constitutes success in
forecasting (what range of time—plus or minus six months from the date predicted by his
model?), to judge the meaningfulness of this claim. In his retrospective of his forty-year-
career as a futurist in the public policy realm, he provides no indication of, nor
consideration of, the potential for his model to be successfully adapted to a different realm
of analysis, other than the introduction and passage of public policy legislation—such as a
“devil’s toy box” analysis. Would G.K. Chesterton’s notion of the “prophetic past” apply
as well, or at all?
183 Ibid., 86.
184 Ibid., 80.
185 Ibid., 83.
186 Ibid., 81.

99
I suspect it might—in part. Technologists have created theoretical models to predict
the pace and extent of technology diffusion; psychologists and sociologists have developed
models of individual and group behavior; scholars in the homeland security field have
begun developing models of processes of radicalization and other models predicting the
rise and decline of extremist organizations. I feel such models, either adapted or
amalgamated to assist in predictions of malign uses of new technologies, could prove
useful for a “devil’s toy box” analysis. Perhaps their best use would be to remind the
analytical team members of the wide range of factors that need to be considered, so that
important elements do not get overlooked; however, I would lean towards using such a
model or models in conjunction with other techniques, which could act as a “reality check;”
too great a reliance on models of complex social phenomena, even on models that have
performed well in the past, can lead to embarrassing errors in prediction. The “prophetic
past” focuses analysts’ attention on continuities, which certainly have been seen throughout
history, but that lens on the future reveals only part of the picture. It is inadequate for the
forecasting of future discontinuities—the Great Awakenings, revolutions, and paradigm
shifts brought about by the actions of extraordinary individuals, new scientific discoveries,
or the sorts of low-probability, high-impact events that have been referred to as “black
swans.” Folkloric wisdom is generally based upon generations of hard-won experience; in
this context, the old saying that “the only constant is change” has resonance—not as a
blanket denial that history embodies continuities, but as a reminder that those continuities,
the reliable contract players of history, share the historical stage with the black swans,
history’s breakout star actors, emerging from obscurity to forever leave their mark.
Of interest for this thesis’s goal of providing a more effective tool kit for a “devil’s
toy box” analysis team, the European Foresight Monitoring Network (EFMN) conducted
a survey covering the period 2004–2008 regarding forecasting techniques used by
facilitators of foresight exercises around the world. Over this five-year period, the EFMN
analysts considered approximately 6000 foresight exercises.187 Their survey determined
187 Butter et al., Final Report: Monitoring Foresight Activities, 22.

100
that a wide range of methods were frequently used in combination within these exercises.
Methods popularly used included:
Cross-impact analysis (in conjunction with questionnaires/surveys and/or
brainstorming)
Brainstorming (in conjunction with futures workshops, Delphi surveys,
individual interviews, environmental scanning, and/or Strengths-
Weaknesses-Opportunities-Threats [SWOT] analysis)
Environmental scanning (in conjunction with individual interviews,
questionnaires/surveys, futures workshops, SWOT analysis, trend
extrapolation, and/or stakeholder mapping)
Stakeholder mapping (in conjunction with trend extrapolation, futures
workshops, SWOT analysis, brainstorming, and/or environmental
scanning)
Futures workshops (in conjunction with brainstorming)
Scenarios analysis (in conjunction with futures workshops)
Modelling and simulation (in conjunction with megatrend analysis and/or
trend extrapolation)
Delphi surveys (in conjunction with futures workshops, analysis of key
technologies, and/or brainstorming)
Expert panels (in conjunction with brainstorming and/or futures
workshops)
SWOT analysis (in conjunction with questionnaires/surveys, futures
workshops, and/or brainstorming)
Technology roadmapping (in conjunction with futures workshops and/or
key technologies analysis)

101
Trend extrapolations (in conjunction with scenario analysis, expert panels,
and/or literature reviews)
Many methods listed above are used in conjunction with scenario
analysis, literature reviews, and/or expert panels
The EFMN analysts determined that governments and agencies in regions tended
to prefer differing forecasting techniques or combinations of techniques.188 While my brief
overview of combinations of techniques listed above is not backed up by an analysis of the
comparative effectiveness of the various combinations (such an analysis could in itself be
the subject of a thesis or dissertation), its value for this thesis lies in its demonstration that
these techniques are very frequently used in combination and that national and regional
governments and non-governmental agencies have found value in using various forecasting
techniques in conjunction (otherwise, the EFMN analysts would not have observed such a
high frequency of combinations, as opposed to using techniques in isolation, over the five
years covered in their study). This characteristic catholic nature of governmental
practitioners of futures studies, the fact that so many do not cling exclusively to a single
preferred forecasting technique or even pair of techniques, certainly has implications for
the development of my own blended technique, Pandora’s Spyglass, for the conduct of a
“devil’s toy box” analysis.
C. FUTURE STUDIES: METHODOLOGIES: TECHNOLOGY SEQUENCE ANALYSIS
Technology Sequence Analysis (TSA) was first developed and utilized in the 1980s
as a way to formulate probabilistic forecasts of the amount of time it would take to develop
a technological system.189 Estimating the likelihood of a Promethean technology and its
enabling technologies reaching deployment or the market within a five- to ten-year time
window is a key activity of a Pandora’s Spyglass procedure, my proposed method for
188 Ibid., 26–27.
189 Theodore J. Gordon, “Technology Sequence Analysis,” in Futures Research Methodology Version 3.0, Jerome C. Glenn and Theodore J. Gordon, eds. (Washington, DC: The Millennium Project, American Council for the United Nations University, 2009), CD-ROM article 16, 1.

102
conducting a “devil’s toy box” analysis, which will be described in detail in Chapter IX.
For this reason, a brief examination of Technology Sequence Analysis is in order.
Technology Sequence Analysis is a form of path analysis that breaks down a system
into sub-systems and those sub-systems into individual components. Theodore J. Gordon
provides the following example of a harvesting robot, with simple Boolean logic laid out
in picture form:
Figure 1. Example of Technology Sequence Analysis (Harvesting Robot)190
OR
NODE
AND
NODE
On the left side of the figure, three alternate enabling technological sub-sub-
systems, any of which could enable the Ripeness Sensing sub-system, are shown. These
are called “OR nodes” because not all three of them need to be available for the Ripeness
190 Ibid., 3.

103
Sensing sub-system to work; only one of the three needs to be developed. Moving further
to the right of the figure, five critical sub-systems are listed, Guidance, Position Sensing,
Ripeness Sensing, Cleaning, and Packaging. All these sub-systems are required for the
overall system of the Harvesting Robot to work properly and carry out all its necessary
functions. So, each of these five critical sub-systems is termed “AND nodes,” since all
them must be present, and none of them can substitute for the others.
Technical experts provide their estimates of the likelihood of nodes within the
network being created by a certain date (an example might be, “Node XXY has a 65%
likelihood of being developed within five years”). Gordon explains that several hundred
nodes leading up to the completed system on the right might need to be included in a full
Technology Sequence Analysis diagram. He states that “(a) typical network may consist
of 600 to 800 nodes and 700 to 1,000 associated ‘and’ paths and ‘or’ paths,” and that some
charts become so complicated that special software must be used to simulate the Monte
Carlo simulations necessary to assign the ranges of probabilities opened up by the paths
involving alternate enabling technologies or components.191 Gordon then describes the
process of Technology Sequence Analysis in greater detail:
The process begins with the technologies at the left side of the matrix. Using a random number generator, the time of occurrence of each of the downstream technologies is determined. Suppose, for example, that a given path from one node to another is judged to have a 25 percent probability of taking three years, a 50 percent of taking five years, and a 75 percent of taking ten years or less. These estimates form a probability versus time curve. A random number between 0 and 100 is chosen; this number is used to enter the curve and produce a single estimate of the required time. If the node being considered is at an “and” point in the network, the latest date of the contributing technologies determines when the development occurs. Similarly, the earliest date of the possible technologies determines when an “or” node is assumed to occur. When this process is completed for all paths, a single scenario will result. In this scenario, the anticipated sequence of events is the path through the network; in turn, this path leads to an estimate of the time of availability of the end system.192
191 Ibid., 4.
192 Ibid., 5.

104
If the entire path from the most basic components on the left to the finished system
on the right consisted only of AND nodes, with no alternate OR nodes, Monte Carlo
simulations would not be necessary; rather, the sequence of contingent probabilities could
be calculated simply. In Gordon’s example from above, since the five critical sub-systems
are all AND nodes, if their estimated probabilities of being completed within five years are
Guidance (80% likelihood), Position Sensing (95% likelihood), Ripeness Sensing (78%
likelihood), Cleaning (93% likelihood), and Packaging (54%), the estimated probability of
a Harvesting Robot being completed within five years is the product of these dependent
probabilities, or about 30%—only if those critical sub-systems are not themselves
dependent upon enabling technologies, for which several alternative solutions are
available; however, since most notional technological systems may be actualized through
various alternate combinations of components or technical solutions for sub-systems,
Monte Carlo simulations are almost always necessary as a part of Technology Sequence
Analysis.
D. FUTURES STUDIES: METHODOLOGIES: SCENARIO ANALYSIS
I have chosen to give scenario analysis more extensive attention than I have
provided other futures studies methodologies discussed thus far because, of these
methodologies, scenario analysis, along with the Delphi technique, the nominal group
technique (NGT), and Technology Sequence Analysis, holds the greatest promise as a part
of the tool kit for a “devil’s toy box” analysis. Developments in technologies are only a
portion of what a “devil’s toy box” analytical team must consider. Equally as important are
the human motivations that drive the uses and misuses of those emerging technologies—
the religious, political, ideological, and emotional desire factors that could influence human
actors to seek to harm or threaten to harm their fellow men and women using new tools
and new strategies. These factors are better considered through a scenario analysis than
any of the more formalized techniques mentioned earlier.
Nicole Rijkens-Klomp and Patrick Van Der Duin, in their review of local and
national public foresight studies, define scenario analysis as “the systematic analysis of a

105
variety of uncertainties combined into distinctive stories about the future.”193 Amara
praises the use of scenarios as a form of descriptive, qualitative forecasting. He defines a
scenario as “nothing more than a description of an internally consistent, plausible future,”
one that does not make a claim to be a prediction.194 Herman Kahn and Anthony J. Wiener,
two futurists associated with RAND who made prolific use of the scenario analysis
technique in their writings, have this to say regarding the technique: “The scenario is suited
to dealing with events taken together—integrating several aspects of a situation more or
less simultaneously. Using a relatively extensive scenario, the analyst may be able to get a
feeling for events and the branching points dependent upon critical choices. These branches
can then be explored more or less systematically or the scenario itself can be used as a
context for discussion or as a ‘named’ possibility that can be referred to for various
purposes.”195 They go on to caution that “if a scenario is to seem plausible to analysts
and/or policy-makers it must, of course, relate at the outset to some reasonable version of
the present, and must correspond throughout to the way analysts and/or policy-makers are
likely to believe decision-makers are likely to behave. Since plausibility is a great virtue in
a scenario, one should, subject to other considerations, try to achieve it. But it is important
not to limit oneself to the most plausible, conventional, or probable situations and
behavior.” Since history is replete with surprises, “…we should expect to go on being
surprised.”196 Along those lines, they list as a key advantage of the scenario analysis
technique that it helps to “illuminate the interaction of psychological, social, economic,
cultural, political, and military factors, including the influence of individual political
personalities upon what otherwise might be abstract considerations, and they [scenario
193 Nicole Rijkens-Klomp and Patrick Van Der Duin, “Evaluating Local and National Public
Foresight Studies From a User Perspective,” Futures 59 (2014), 18, http://dx.doi.org/10.1016/j.futures.2014.01.010.
194 Roy Amara, “A Note on What We Have Learned About the Methods of Futures Planning,” Technological Forecasting and Social Change 36(1989), 44.
195 Herman Kahn and Anthony J. Wiener, “The Use of Scenarios,” in The Futurists, ed. Alvin Toffler (New York: Random House, 1972), 161.
196 Ibid., 163.

106
analyses] do so in a form that permits the comprehension of many such interacting elements
at once.”197
This last point is especially pertinent to my “devil’s toy box” analysis, which must
bring social, political, religious, and psychological elements into cognitive play to have
any success whatsoever. The mere existence and availability of a new technology that
offers the potential for malign uses are not enough, by themselves, to cause that technology
to be used for harm. Other questions must be asked to get a better notion of the likelihood
of such harmful use—are there aspects of the technology that make it especially appealing
to the adherents of an extremist ethnic, religious, or political group? Would use of the
technology fit within an extremist group’s ideology, worldview, and goals, or would using
the technology violate a taboo sacred to that group? What are the levels of skill and
technical expertise required to make effective, malign use of the technology, and are such
skill levels and expertise found among members of the extremist groups under
consideration? These are questions not easily framed within the other methodologies used
by futurists; however, they may easily be accommodated within the bounds of a detailed
scenario analysis.
A recent example of governmental scenario analysis in an American context is the
Federal Emergency Management Agency’s Strategic Foresight Initiative of 2010–2011,
which resulted in a monograph entitled Crisis Response and Disaster Resilience 2030:
Forging Strategic Action in an Age of Uncertainty. In attempting to project the sorts of
environments that may be faced by emergency response planners and operatives in 2030
and the needs of those future emergency responders, the Strategic Foresight Initiative
focused upon social and technological drivers, including technological innovations and
resulting societal dependencies. The Initiative also considered changing U.S.
demographics; environmental drivers, including potential climate changes; and economic
and political drivers, including the likelihood that future budgets made available for
government programs will be lower than present-day budgets. The Strategic Foresight
Initiative Scenario Workshop developed five different scenarios for the possible world of
197 Ibid., 161.

107
2030. These included “Quantum Leap” (the U.S. economy is strong and vibrant, but the
country is challenged by severe climactic changes and malign uses of new technology),
“Bet on the Wrong Horse” (the U.S. economy is lethargic, with frequent recessions; climate
change has stabilized, but federal and state governments are under constant fiscal pressure
made worse by a massive population migration from rural to urban areas), “Dragon vs.
Tiger” (following a depression, the U.S. economy has strongly rebounded, and the country
has fully modernized its infrastructure following a series of federal bailouts of state
governments, but foreign crises threaten, including the possibility of nuclear war breaking
out), “Treading Water” (a worst-case scenario, with the U.S. economy in its worst shape
since the Great Depression, worsening climate change, and social unrest caused by poverty,
dissention, and pandemics), and “Dude, Where’s My Sovereignty?” (the U.S. economy
chronically lags behind that of its competitors, climate events are severe, the federal
government is weak, and regions are influenced both by powerful state governments and
by foreign influences). Over a four-day period, 60 members of the emergency management
community, drawn from federal, state, and local agencies, were divided into five teams and
then immersed in one of the five scenarios, wherein they role-played their own roles as
they would be impacted by these varying imagined environments of 2030. The scenario
exercises resulted in a list of 15 common strategic needs, formulated in post-workshop
analysis sessions.198
Peter Schwartz, who has used scenario building and scenario analysis extensively
throughout his career as a futurist, offers the following eight steps for constructing
scenarios:
Step One—Identify the primary focal issue around which the scenario will
revolve. What challenges are faced by your organization or company?
What are the looming decisions that will need to be made? (For a “devil’s
198 Federal Emergency Management Agency, Crisis Response and Disaster Resilience 2030: Forging
Strategic Action in an Age of Uncertainty—Progress Report Highlighting the 2010—2011 Insights of the Strategic Foresight Initiative (Washington, DC: Federal Emergency Management Agency, 2012), 1–12, https://www.fema.gov/media-library-data/20130726-1816-25045-5167/sfi_report_13.jan.2012_final.docx.pdf.

108
toy box” analysis, this would be selecting one over-the-horizon technology
of concern, or a cluster of emerging and existing technologies which might
be combined in a new and malign way.)
Step Two—Identify the environment factors that will influence the
success or failure of your organization’s or company’s strategy. This could
include the availability of budgetary and material resources, the
capabilities of competitors, the regulatory environment, the overall
economic climate, and the political climate. (For a “devil’s toy box”
analysis, the team would want to consider whether the political climate
might contribute to the rise of new extremist groups or the rebirth of old
ones, and whether changes in the economy and in social acceptance of
technologies might be creating new societal vulnerabilities; for example,
the Internet-of-Things making household appliances, climate controls, and
security features vulnerable to hacking.)
Step Three—Identify those specific driving forces that will have a
significant impact on your organization or company. (For a “devil’s toy
box analysis, the team would explore whether any formerly exclusive and
expensive technologies of interest have recently become affordable for the
typical consumer or soon will become affordable, transforming restricted
technology formerly only available to well-funded scientists, universities,
or government or military agencies into Promethean technology. The team
could also research whether any new extremist groups are gaining traction
domestically or internationally, and what those groups’ goals might mean
for homeland security.)
Step Four—Rank key factors and driving forces on the criteria of the
strength of their relationship to the success or failure of your
organization’s or company’s strategy, and on the degree of uncertainty of
those key factors and driving forces. The aim in this step is to identify a

109
small group of factors and forces that are high on significance to
success/failure and on uncertainty.
Step Five—Select the logics of the scenarios by arraying the key factors
and driving forces that are high in both significance and uncertainty along
a spectrum (one axis), a matrix (two axes), or a volume (three axes). If you
chose three axes, you end up with eight possible scenarios, assuming each
separate scenario will be either high or low on each axis (High-High-High,
High-High-Low, High-Low-Low, High-Low-High, Low-Low-Low, Low-
Low-High, Low-High-High, or Low-High-Low). The number of possible
combinations would be extended if key factors and driving forces are
arrayed along more axes or Low-Moderate-High rather than just Low-
High. Do not assemble the scenarios mechanically, however. You want to
keep the number of scenarios manageable, so decide which ones make the
most sense in terms of internal consistency and plausibility. In the FEMA
Strategic Foresight Initiative exercise discussed earlier, the axes selected
by the analysts included the state of the U.S. economy, climate/weather,
the state of infrastructure, the health of states and localities, and major
threat vectors.
Step Six—Flesh out the selected scenarios. Create plots that realistically
bring the story forward from the present situation to the future situation
portrayed by the scenario. Decide whether any key personalities or leaders
might facilitate the progress from the present situation to the situation of
the scenario.
Step Seven—Determine the implications of the scenarios for your
organization or company. Will your organization thrive or wither in the
future world of the scenario? What are the implications of the scenario for
the success or failure of your organization’s strategy and goals?

110
Step Eight—Select leading indicators that will indicate that a scenario is
on its way to becoming actualized. These leading indicators will typically
consist of a movement in one of the key factors and driving forces
identified in Steps Three and Four. Then monitor those leading
indicators.199
E. FUTURES STUDIES: BEST PRACTICES
Scenario Analysis: Peter Schwartz offers the following suggestions regarding best
practices for scenario analysis. He cautions against identifying only three scenarios to work
with, as participants in the analysis will tend to identify the one in the middle as the most
likely scenario and then treat that scenario as a single-point forecast, which, in Schwartz’s
mind, defeats the whole purpose of scenario analysis. He suggests four scenarios as an
optimal number for a single session of scenario analysis, saying that five or more scenarios
tend to blur together in participants’ minds; however, the facilitators of FEMA’s Strategic
Foresight Initiative chose to use a range of five scenarios. Schwartz also strongly
recommends that facilitators avoid assigning probability figures to the different scenarios,
as this will tend to lead participants to pay their full attention only to that scenario with the
highest assigned probability. He further suggests that, in a group of four selected scenarios,
two be of equally high probability and the other two be what he terms “wild card”
scenarios, low-likelihood but high-impact. Interestingly, Schwartz focuses on the
importance of coming up with memorable, evocative names for each scenario. He points
out that well-named scenarios are more likely to attract the attention of upper management
and are more likely to be adopted into the organization’s collective memory and planning
culture. Regarding choosing members of the scenario analysis team, Schwartz recommends
that members of upper management be included, that a wide range of organizational units
and functions be represented on the team, and that members, overall, be selected for their
supple imaginations and their ability to work well with others in a team setting.200
199 Schwartz, Art of the Long View, 241–247.
200 Ibid., 247–248.

111
Identifying and Analyzing Emerging Issues: Trudy Lang compiled a list of
suggested best practices for the related activities of environmental scanning, issues
management, and emerging issue analysis, drawn from her own observations and those of
a range of futurists. She notes that the scanning team should be highly multi-disciplinary
in its composition, to allow for the broadest possible range of vision, and she echoes
Schwartz’s view of the importance of the support and participation of upper-level
managers. She suggests that the practice of scanning be routinized throughout the
organization, rather than limited just to the time periods of a formal scanning and
forecasting exercise or analysis, so that the participants become well-practiced in the
activity and learn how to better recognize their own personal biases in selecting those
signals they deem to be important. Additionally, she points out that an organization’s
environmental scanning practices tend to improve with time and that organizations develop
systems and processes that work well for them, but that often cannot be directly copied by
other organizations with success, due to those processes being interwoven with the
originating organization’s culture and personnel. Since different organizations will conduct
scanning activities differently and likely identify different signals of interest, Lang suggests
that organizations partner with one another and exchange their scanning reports on a
regular basis. Also, recognizing that scanning is an inherently subjective activity, she
strongly recommends that participants, when making their reports, clearly state up front
their values and preconceptions that have influenced their scanning process.201
Cognitive Biases in Forecasting: Nicholas Rescher points to many cognitive
biases that, if uncorrected for, tend to warp forecasts, resulting in false-positives, false-
negatives, and omissions. The first of these is the tendency of prognosticators to exaggerate
both the immanency and the scale of a predicted change or event—forecasters tend to pull
predicted events closer in time to the present and to grant them greater magnitude. Another
cognitive bias, which may be viewed in partial contradiction to the bias just mentioned
(human beings are not necessarily notable for their internal consistency), is conservatism,
or the tendency to assume that present conditions are more durable and lasting than they
201 Lang, “Four Futures Methodologies,” 16–17.

112
are, that the distinctive social, political, and economic features and patterns of the present
will persist into the future. A related cognitive bias is what Rescher terms wishful or fearful
thinking. Prognosticators tend to predict a future they prefer, either because they feel they
ought to express such an opinion or because they hope that making such a prediction of a
preferred future will increase the likelihood of that future becoming actualized. The flip
side of wishful thinking is fearful thinking, or the tendency of prognosticators to have
greater confidence in their expectation that what they most dread will come to pass.
Rescher adds to his list of cognitive biases errors in judgments of probabilities, classing
these as mistaken evaluations and mistaken combinations. As an example of the former, he
provides the example of a coin-tosser who predicts the next toss will result in a “heads”
because the last three flips have all resulted in “tails.” Regarding the error of mistaken
estimates of probabilistic combinations, Rescher points out the bettors (predictors) tend to
overestimate the chances of long-shots becoming actualized, which is an overestimation of
the likelihood of conjunctive events, while underestimating the likelihood of small-
probability/large-consequence events happening, which is an underestimation of
disjunctive events (as an example of the latter, he points out the repeated willingness of
town planners and homeowners to build homes and businesses in flood plains).202 Only by
recognizing such common human cognitive biases can members of a “devil’s toy box”
analytical team take such biases into account and attempt to adjust for such biases in their
predictions.
Putting the Pieces Together: Amy Webb, founder of the Future Today Institute,
offers in her popular 2016 book, The Signals are Talking, a road map to lead
prognosticators from environmental scanning to scenario development and refinement to
scenario analysis. Her steps alternate between what she calls “flaring” and “focusing,” the
former being a widening of vision to encompass as much information and as many
signaling indicators as possible, and the latter being a narrowing of vision to the specific
environmental factors most pertinent to one’s organization. Her six steps include:
202 Rescher, Predicting the Future, 218–222.

113
Flaring at the fringe—analysts are directed to brainstorm, consider many
alternative points of view, and seek out views outside the mainstream
(carry out Peter Schwartz’s environmental scanning described in an earlier
section).
Focusing to spot patterns—Webb uses the acronym CIPHER (which
stands for “contradictions, inflections, practices, hacks, extremes, and
rarities”) to suggest how an analyst should sift through the huge amount of
material gathered in the “flaring at the fringe” step to focus on the most
important signals, which are phenomena that correspond to the elements
of her acronym.
Flaring to ask the right questions—the analyst is directed to confront all
his or her own beliefs and biases and to brainstorm counter-arguments to
his or her own original assertions.
Focusing on the timing of trends—analysts must try to determine how far
along on their trajectories significant trends have progressed and when
they might be expected to produce major changes in society.
Flaring to brainstorm scenarios and their accompanying action
strategies—in this step, analysts produce their scenarios based upon
probable, plausible, and possible future states, determining likely
consequences for their organizations under the conditions described in
each scenario and developing strategies to mitigate or take advantage of
those scenario-based consequences.
Focusing to pressure-test (or red team) their chosen strategies—analysts
game-play their chosen strategies within the worlds of each scenario to
better understand the potential outcomes of taking these actions, to
brainstorm possible second-order and third-order consequences, and to

114
construct a well-reasoned prediction regarding whether taking the chosen
actions will lead to a desired future.203
F. HOW ACCURATE CAN EXPERT PROGNOSTICATION BE? THE 1964 RAND CORPORATION STUDY OF FORECASTING TECHNOLOGICAL AND SOCIAL TRENDS (A CASE STUDY)
Despite Roy Amara’s qualification, quoted at the beginning of the introductory
Section on futures studies, that prediction is not the objective of the futurist, the methods
of futurism/futures studies have been used in attempts to forecast the likelihood of future
events occurring within certain timeframes. Some of these studies were conducted decades
ago, which grants a present-day reviewer the benefit of being able to judge the accuracy or
inaccuracy of such studies’ predictions. In 1949, Kaplan and his associates at the RAND
Corporation, in testing the ability of their new technique to predict future social and
technological developments, felt compelled to limit themselves to considering only those
events whose occurrence could be verified within a five-month timeframe; however, fifteen
years later, their colleagues at RAND carried out a more ambitious study of the ability of
experts, when their opinions were amalgamated and honed by the Delphi technique, to
successfully predict a wide range of technological and social developments over a long-
term time envelope. Given our more than half a century of hindsight since that study, how
well did those experts perform?
In 1964, the RAND Corporation carried out an experimental use of the Delphi
technique to perform a long-range forecast of technological and social trends in six key
areas of inquiry. These areas included weapons systems; techniques of war prevention;
developments in space exploration, exploitation, and colonization; automation; population
control; and general scientific breakthroughs. Six Delphi procedures were conducted,
corresponding to the six areas of forecasting inquiry, and for each of six procedures,
facilitators recruited a separate set of experts. In total, the facilitators approached 150
experts, of whom 82 chose to respond to at least one Delphi questionnaire. Although the
203 Amy Webb, The Signals are Talking: Why Today’s Fringe is Tomorrow’s Mainstream (New
York: PublicAffairs, 2016), 264–266.

115
participants were instructed to only respond to those questionnaires relating to their field
of forecasting inquiry, all the questionnaires from all six areas of inquiry were shared with
all participants. Each panel of experts was asked to respond to four sequential Delphi
questionnaires, which were shared with the participants at two-month intervals,
approximately. Thus, 24 Delphi questionnaires were addressed in total, and the aggregate
group of 82 expert participants submitted 348 completed questionnaires.204
A few years later, in 1967, Brownlee Haydon wrote a monograph, The Year 2000,
which compiles and discusses two lists of the predictions produced by Gordon’s and
Helmer’s 1964 Delphi study, one for developments to have taken place by 1984 (20 years
out from the time of the study) and the second for developments to have taken place by
2000 (36 years out from the time of the study).205 As we are well past both 1984 and 2000
and thus have the benefit of hindsight, an examination of these lists of date-anchored
prognostications provides an illuminating opportunity to roughly gauge the accuracy of a
set of long-range forecasts produced by the Delphi method under the set of conditions for
which it was designed—those conditions including the recruitment of panels of
technological experts and the provision of sets of questions that are intellectually
challenging and that call directly upon the expertise of the participants, as opposed to a
laboratory setting using participants recruited for convenience, rather than expertise, and
posing questions of limited interest to the participants (see the earlier Section of this thesis
that summarizes Rowe’s and Wright’s criticisms of laboratory tests evaluating the accuracy
of predictions of Delphi procedures versus other opinion-elicitation techniques). The
following two Tables, Table 3 and Table 4, list the 1984 and 2000 predictions discussed
by Haydon and evaluate how accurate those predictions have proven.
204 T. J. Gordon and Olaf Helmer, Report on a Long-Range Forecasting Study (P-2982) (Santa
Monica, CA: RAND Corporation, September 1964), 2–6, https://www.rand.org/content/dam/rand/pubs/papers/2005/P2982.pdf.
205 Haydon, The Year 2000, 8.

116
Table 3. Accuracy of Predictions from 1984 Long-Range Forecasting Delphi Study

117
Table 4. Statistical Breakdown of Accuracy of Predictions from 1984 Long-Range Forecasting Delphi Study
Predictions Category Accurate Within + 5yrs
Accurate Outside + 5yrs
Inaccurate TOTALS
ScientificAdvances 3(21.4%) 5 (35.7%) 6 (42.9%) 14(100%)SpaceExploitation 1(12.5%) 1 (12.5%) 6 (75%) 8(100%)Weapons 1(33.3%) 1 (33.3%) 1 (33.3%) 3(100%)Population/Ecology 2(50%) 1 (25%) 1 (25%) 4(100%)Automation 2(66.6%) 1 (33.3%) 0 (0%) 3(100%)War/Politics 2(66.6%) 0 (0%) 1 (33.3%) 3(100%)
TOTALS 11(31.4%) 9 (25.7%) 15 (42.9%) 35(100%)
For purposes of analysis, I will lump together the “accurate within + 5 years” and
“accurate outside + 5 years” figures as “success” or “accuracy;” the success rate is seen to
be 57.1% for predictions made for 1984 (20-year window) and for 2000 (36-year window).
My reason for doing so is the nature of a “devil’s toy box” analysis. Given that the ultimate
purpose of such an analysis is to support the selection of research and development projects
that will likely take three to five years to bring countermeasures to operational fruition and
deployment, it does not matter that the analysis team predicts that a malign use of
technology will eventuate in five years, and then that threat does not actualize for nine
years. In terms of Table 4, “accurate outside + 5 years” still counts as a “win.” The
countermeasure would be in place and available when the anticipated threat finally makes
its nasty debut.
Most of the predictions categories have too few data points to allow for meaningful
comparison between them; however, the fact that the predictions category of space
exploitation stands out from both the other categories and from the overall results in terms
of its relatively high inaccuracy rate suggests a factor that bears consideration. The experts
were wrong in this area three-quarters of the time. This points to a key weakness in trend
extrapolation. Clearly, none of the assembled experts could foresee the dramatic shift in
political support for the manned space program following the completion of the successful
Apollo landings on the Moon. Apparently, all the respondents assumed that the massive
governmental effort that culminated in the Moon landings and America’s victory over the
Soviet Union in the Space Race would continue well into the future; however, a
combination of political, social, and economic shifts caused NASA to shrink to a shadow

118
of its former self less than a decade after the 1964 RAND forecasting study. The
intensification of the America’s involvement in the Vietnam War combined with the fiscal
consequences of Lyndon Johnson’s Great Society and its expansion of the welfare state to
produce high inflation and budgetary pressures, making NASA’s expensive manned space
program a tempting target for deficit hawks. The social movements of the 1960s—racial
equality, women’s rights, environmentalism, the drug culture, the anti-war movement, and
the self-actualization movement—resulted in a cultural shift, wherein an increasing portion
of voters questioned why America should be spending such enormous sums in space when
so many social problems needed to be solved on Earth. The Oil Shock of 1973 caused many
Americans to question the country’s national paradigms of continual economic and
technological progress, and the Watergate crisis of 1974 reduced many American’s faith
in the trustworthiness and competence of their federal government. These various shifts
and trends, all “black swans” from the perspectives of the prognosticators of 1964,
combined into a “perfect storm” for America’s manned space program. From 1973 on, the
best NASA could accomplish on its limited budgets and shrunken mission scope was to
cobble together a short-lived space laboratory, Sky Lab, from the left-over parts of the
Apollo Program, and launch its expensive and unreliable fleet of “space buses,” the Space
Shuttles, into low Earth orbits. The 1964 RAND prognosticators were not the only futurists
to fail to see the coming diminishment of America’s manned space program, however. Out
of the many dozens of science fiction writers active in the late 1960s and early 1970s, only
two foresaw NASA’s diminution. These were British author J. G. Ballard, who predicted
in numerous short stories that America would abandon space exploration due to boredom
(perhaps not too far from the truth), and American author Barry N. Malzberg, who wrote
that America’s national space program would be undone by a plague of astronaut mental
illnesses brought about by a combination of the harshness of the space environment and
NASA’s bureaucratic pathologies.
Robert H. Ament, a member of the Institute for the Future, performed an analysis
like mine of the 1964 RAND study five years after the study’s conclusion; his analysis
focused on the accuracy of the study’s short-term forecasts and was published in the March
1970 edition of the journal Futures. His primary finding was that, of the 22 events predicted

119
by the RAND study’s participants as having at least a 50% likelihood of occurring by 1970,
15 had occurred (68.2%), five had not (22.7%), and the occurrence of two events was
uncertain (9.1%).206 A comparison of the higher accuracy rate Ament found for the five-
years-out forecasts to the lower rate I determined for the 20–years-out and 36–years-out
forecasts makes intuitive sense; the closer a prognosticator is in time to a predicted future,
the better/weightier the available data is, since current data points will have less time to be
affected by change than they would in a longer-term prognostication.
To put these figures into perspective, in Table 5, I compare the 57.1% success rate
I have calculated for the 1984 and 2000 RAND 1964 Delphi study predictions (long-term)
and the 68.2% success rate Ament calculated for that study’s predictions within a five-year
envelope (medium-term) with the results Kaplan et al. reported from their 1949 study of
short-term (five-month envelope) predictions of social and technological developments:207
Table 5. Accuracy Rates of Various Experiments in Prediction of Social and Technological Events and Developments, Short-Term, Medium-Term, and
Long-Term, Ranked (Ascendant) by Accuracy
ExperimentalCohortType PredictionPeriodCovered
SuccessRate
1949 Kaplan, Worst‐informed predictors(bottomhalf)
Short‐term 50%
1949Kaplan,Independentgroup Short‐term 52%1949Kaplan,Allpredictors Short‐term 53%1949 Kaplan, Best‐informed predictors (tophalf)
Short‐term 56%
1964RANDDelphi Long‐term 57.1%1949 Kaplan, Cooperative group (predictorsconferred,thenmadeindependentestimates)
Short‐term 62%
1949Kaplan,Meanprediction Short‐term 66%1949Kaplan,Jointgroup(predictorsconferred,thendeliveredconsensusestimates)
Short‐term 67%
1949Kaplan,Pluralityprediction Short‐term 68%1964RANDDelphi Medium‐term 68.2%1949Kaplan,Bestindividualpredictor Short‐term 71%
206 Gordon, “The Current Methods of Futures Research,” 174.
207 Table figures for the 1949 Kaplan et al. study taken from Kaplan, Skogstad, and Girshick, “Prediction of Social and Technological Events,” 104.

120
My assumption is that accuracy of prediction becomes more and more difficult the
longer the time envelope is stretched, since knowledge currently held, even that held by
experts, becomes progressively less pertinent with the passage of time and the intervention
of fresh events. Given the relative levels of difficulty of their tasks, the improvement in
predictive accuracy associated with the participants in the 1964 Delphi study seems
notable. In making predictions within a five-year envelope, the 1964 Delphi participants
performed on par with the accuracy displayed by the most accurate group cohort of the
1949 Kaplan study, who only had to make predictions within a five-month envelope, one-
twelfth the length; and the accuracy rate for the 1964 Delphi participants on long-range
forecasts, those with a 20–year envelope and a 36–year envelope, was not too far behind
at 57.1%.
As mentioned above, an analytical team working a “devil’s toy box” analysis
should be operating within a forecasting envelope with a minimum of five years, the
approximate amount of time required for a HSARPA-type R&D project to reach fruition
and achieve deployment (HSARPA’s Homeland Innovative Prototypical Solutions, or
HIPS, projects, those with a moderate to high risk of failure, were expected to deliver
significant new capabilities in prototype form within two to five years).208 Achievement
of a prediction success rate of 68%, better than two-thirds accuracy, equivalent to the
medium-term (five-year envelope) success rate of the 1964 Delphi participants, would be
a laudable accomplishment for a “devil’s toy box” analysis team. Given the advances in
automated information-gathering, amalgamation, and analysis tools since 1964,
represented by innovations such as IARPA’s FUSE tool and recently deployed commercial
Big Data analysis tools (to be discussed in Chapter 9)—also taking into consideration
improvements in judgment quality over a standard Delphi procedure promised by my
amalgamation of “best-of-kind” features of existing forecasting techniques—a present-day
208 Department of Homeland Security, The Science and Technology Directorate’s Processes for
Selecting and Managing Research and Development Programs (OIG-08-85) (Washington, DC: U.S. Department of Homeland Security, Office of Inspector General, August 2008), 8, https://archive.org/details/241114-oig-08-85-the-science-and-technology.

121
“devil’s toy box” analysis team should be able to better the predictive performance of the
1964 Delphi group.
* * * * *
How can a “devil’s toy box” analytical team avoid or ameliorate the cognitive
biases in forecasting identified by Nicholas Rescher? How can such an analytical team
follow the dictates of Herman Kahn and Anthony J. Weiner to pay as much attention to
subjective human factors—the political, ideological, cultural, religious, and psychological
drivers that influence human actors to seek to harm or threaten to harm their fellow men
and women—as they do to trends in emerging technological capabilities and those
capabilities’ availability to members of the general populace? How can such a team follow
Peter Schwartz’s and Amy Webb’s recommendations to consider a broad range of
perspectives and “flare at the fringe” to capture ways of thinking outside the mainstream?
Red-teaming, a discipline originally developed for military organizations, offers a “devil’s
toy box” analysis team, an additional set of analytic tools, and cognitive correctors that are
useful for analyses of competitive situations involving attackers and defenders… such as
the ever-crafty devil and ever-bedeviled shield-makers who populate the parable at the
heart of this thesis.

122
THIS PAGE INTENTIONALLY LEFT BLANK

123
VI. RED TEAMING
A. RED TEAMING: INTRODUCTION
The concept of red-teaming has become central to U.S. military operations. In
Army doctrine, red teams are expected to provide alternative analysis (adding the “red view
of red” to traditional intelligence products’ “blue view of red”), decision support, and threat
emulation. The U.S. Army established a school at the University of Foreign Military and
Cultural Studies, located at Fort Leavenworth in Kansas, to teach red-teaming techniques.
When carrying out large-scale red-teaming operations and analysis, unified commands
may call upon red team members from a variety of sources, including the Defense
Intelligence Agency (DIA), the Navy Warfare Development Command, the Army Directed
Studies Office, the National Defense University, the various service academies, and the
Center for Strategic and International Studies, in addition to graduates of the University of
Foreign Military and Cultural Studies.209
Colonel Gregory Fontenot (U.S. Army, Retired), defines red-teaming as “a
structured and iterative process executed by trained, educated, and practiced team members
with access to relevant subject matter expertise” that “provides the commander with an
independent capability to continuously challenge OE [operational environment] concepts,
plans, and operations from partner and adversary perspectives … emphasiz(ing) technical
issue and vulnerability analysis, focusing on capabilities rather than the enemy’s potential
use of those capabilities … (and) provid(ing) a means to build intellectual constructs that
replicate how the enemy thinks.”210 He traces the practice’s origin to the kriegspeils
(wargames) instituted by the nineteenth century German army to train its officers.211 The
U.S. Marine Corps defines red-teaming as “role-playing the adversary.”212
209 Armed Forces Journal, “A Better Way to Use Red Teams.”
210 Gregory Fontenot, “Seeing Red: Creating a Red-Team Capability for the Blue Force,” Military Review 85, 5 (September–October 2005): 4-5.
211 Ibid., 5.
212 Longbine, Red Teaming: Past and Present, 6.

124
From a look at these definitions, the reader can see that red-teaming introduces
something new to the tool kit I have been seeking to assemble for a “devil’s toy box”
analysis team. The uses described so far for techniques such as Delphi, the nominal group
technique, and even futures studies techniques such as scenario analysis have tended to
regard the development of technology and its uses from a scientist’s, engineer’s, or
technologist’s point of view, asking such questions as, what are the antecedents of these
technologies? What are the physical and operational constraints of the technologies? What
are the likely diffusion curves throughout society? What aspects of society are likely to
portend greater acceptance for a technology or cause it to be rejected? The focus is on the
technological development and society’s reaction to that technological development, or the
relationship between society and a new technology; that relationship may be harmonious
and a source of societal happiness, or it may introduce unwelcome disruptions (oftentimes
both simultaneously). Red-teaming, however, focuses on conflict, the ever-shifting balance
between attackers and defenders. When analysts look at new technologies through a red-
teaming lens, they focus on the advantages or disadvantages that those new technologies
may offer to attackers and defenders within a sector of interest. The answers may not
always be straightforward, for the gifts of technology are often two-sided (or multi-sided).
For example, whereas the introduction of the Internet of Things offers security managers
of facilities new abilities to remotely control defensive features of the facilities for which
they are responsible, at the same time it brings new vulnerabilities stemming from the new
potential for attackers to remotely hack into control systems that they formerly would have
needed to directly physically access.
Also, the red-teaming lens encourages defenders to look at the sector of interest
through the eyes of potential attackers, taking the antagonists’ motivations, fears, and
strengths and weaknesses into account. Conversely, attackers are encouraged to look at the
sector through the eyes of the defenders. Questions that can be addressed include: why is
a target more attractive to a certain type of attacker than another? What makes a type of
weapon or mode of attack more attractive to a certain type of attacker? Given the cultural,
social, and psychological background of a certain type of attacker, how might a mode of
defense be adjusted or improved to take advantage of that attacker’s vulnerabilities, taboos,

125
or fears? (Bob Kane, creator of Batman, intuitively recognized this aspect of red-teaming.
In the Batman origin story from the November 1939, issue of Detective Comics, Kane has
Bruce Wayne mull to himself, “Criminals are a superstitious cowardly lot, so my disguise
must be able to strike terror into their hearts.” Just then, in one of the most famous
coincidences in popular culture, a bat flies through Wayne’s open window, inspiring him
to create and don his iconic costume.213 Thousands of Batman stories published or filmed
since 1939 have focused upon the great advantage Batman, who, unlike Superman or
Wonder Woman, lacks any superpowers, derives from his criminal enemies’ superstitious
fears, exploited by Batman’s ghastly uniform and aspect. Stepping outside of one’s
accustomed frame of reference allows for otherwise non-obvious insights to surface. Had
Bruce Wayne not been striving to see through the eyes of his antagonists, he would have
simply shooed the bat back through the window with a broom, or more likely yelled for his
butler Alfred to do it.)
Dr. Mark Mateski, in his Red Teaming: A Short Introduction, provides nine
definitions of red-teaming from various military, government, and scholarly sources. In
comparing them, he points out that their common elements are bringing to the fore an
adversary’s or competitor’s point of view, and they are assisting decision makers to make
the best possible choices or to optimize systems.214 Mateski asserts that red-teaming is a
type of alternative analysis whose function is to assist leaders in making good decisions by
aiding them in avoiding rigidity and countering surprise. He states that red-teaming does
this through drawing on the benefits of a variety of alternative analysis techniques,
including “key assumptions checks; devil’s advocacy; Team A/Team B; red cell exercises;
contingency ‘what if’ analysis; high-impact/low-probability analysis; [and] scenario
development.”215 He divides red-teaming activities into two categories, passive and active,
assigning each category two purposes. Passive red-teaming encompasses the purposes of
helping decision makers better understand—how adversaries think; how adversaries view
213 Bob Kane and Bill Finger, “The Batman Wars Against the Dirigible of Doom,” Detective Comics
no. 33 (November 1939).
214 Mateski, Red Teaming: A Short Introduction, 22-31.
215 Ibid., 1–7.

126
the defending organization; what sorts of biases and assumptions are held by the defending
organization—and better anticipate—adversaries’ potential courses of action; which of
defender’s vulnerabilities are most likely to be exploited; potential surprises to be avoided.
Active red-teaming encompasses the purposes of testing (probing/penetrating defender’s
systems or security; identifying vulnerabilities and determining how far those
vulnerabilities can be exploited; demonstrating adversaries’ likely moves and the
defender’s countermeasures interactively) and training (teaching defenders how potential
adversaries think and how those adversaries might operate; preparing defenders to deploy
effective countermeasures).216
Major David F. Longbine of the U.S. Army describes the key roles of red-teaming
as challenging stale, outdated, or false thinking in an organization through filling the role
of “devil’s advocate,” strongly challenging what is accepted as “conventional wisdom,”
plus providing a set of alternative analyses. Red-teaming grants decision makers with
alternative perspectives by describing the operational environment as it might be seen
through the eyes of allies and partners, adversaries, or other actors within the environment.
The goal of red-teaming, in his view, is to avoid common perceptual errors such as mirror
imaging (assuming that one’s adversaries or allies share one’s own motives, values, and
cultural concepts) and ethnocentrism (the belief in the superiority of one’s own culture),
which can lead a decision maker to underestimate an adversary’s skills, abilities, or
determination.217 Additionally, red-teaming helps decision makers avoid falling into the
pernicious trap of group think, wherein a group of experts, all sharing a similar world view
and coming from similar backgrounds, tend to reinforce one another’s viewpoints and
solidify a group sense that the right decisions are being made.218
216 Ibid., 40-41.
217 Longbine, Red Teaming: Past and Present, 8-15.
218 Ibid., 67.

127
B. RED TEAMING: METHODOLOGIES
The U.K. Ministry of Defence, in its Red Teaming Guide, divides red-teaming
activities into a framework with three phases—diagnostic, creative, and challenge—that
produce a final red team product. The diagnostic phase concentrates upon the identification
of flawed assumptions and gaps in existing knowledge. The creative phase emphasizes
brainstorming and various types of alternative analyses (that may include “what if?” and
alternative futures analyses, as well as outside-in thinking). The challenge phase seeks to
compare competing views, as well as challenge commonly held assumptions, and may
include the analytical techniques of devil’s advocacy, high impact/low probability analysis,
wargaming, or team A/team B analysis. Red teamers may move back and forth between
these three phases throughout the process.219
According to the University of Foreign Military and Cultural Studies’ Red Team
Handbook (version 6.0, April 2012), the key questions for a red team to ask themselves at
all stages of their operations and analyses include:
What if…? alternative analysis What are the objectives of…?
consideration of enemy, partner, and others on the battlefield
What about…? identification of gaps, seams, vulnerabilities
What are we missing…? identification of gaps, seams, vulnerabilities
What happens next…? identification of branches and sequels
What should we assess…? identification of measures of effectiveness
How can we assess…? How do we know success…? What worked and why? enables a learning organization What did not work and why?
avoid patterns of operations220
219 United Kingdom Ministry of Defence Development, Concepts and Doctrine Center, Red Teaming Guide, 3-1 – 3-7.
220 University of Foreign Military and Cultural Studies, Red Team Handbook (version 6.0), 10-11.

128
Additionally, the UFMCS’s Red Team Handbook describes numerous types of
structured analytical techniques that may be used during the process of red-teaming, several
of which are especially appropriate for a “devil’s toy box” analysis. All the following
techniques can be useful in answering the “Evil Genius” questions listed earlier. These
techniques may be separated into brainstorming techniques and techniques to challenge
conventional wisdom and group think. The results of these various analyses are then
summarized in a threat matrix.
1. Brainstorming Techniques
Pre-mortem Analysis: Developed by Dr. Gary Klein, this technique
involves red team members imagining a fiasco, then brainstorming all the
possible reasons as to why the catastrophic failure occurred.221
Indicators or Signposts of Change: Red teamers assemble a list of
significant, observable events that would indicate that a trend likely to
have an impact upon homeland security is occurring or about to occur.
They identify competing hypotheses or scenario, then separate out lists of
happenings, statements, or publications that would be expected for each to
occur, and regularly review the lists of indicators to see which of the
signifiers has experienced change or a shift in the direction predicted. The
team then decides upon the most likely hypothesis or scenario based upon
the number of indicators that have experienced the predicted change.222
High-Impact/Low-Probability Analysis: This is a brainstorming technique
that seeks to analyze events which the red team members consider highly
unlikely but which, should they occur, would result in catastrophic
consequences. Members are called upon to identify potential ways in
which the unlikely event could be actualized, possibly triggered as the
unforeseen second- or third-order consequence of another occurrence
221 Ibid., 163-165.
222 Ibid., 180-182.

129
(such as a natural disaster). They then identify mitigations that could be
undertaken to avert the catastrophe.223
Brainstorming: This is a structured method for eliciting unstructured,
uncensored analysis. It involves a divergent thinking phase (six steps for
the generation and collection of diverse, oftentimes conflicting ideas),
followed by a convergent thinking phase (six steps involving the
clustering of similar ideas, winnowing out of unreasonable outliers, and
coming to agreement on which ideas will require further analysis).224
Alternative Futures Analysis: This technique is especially useful when
examining a situation encompassing both many “known unknowns” and
“unknown unknowns.” Once a focal issue or threat vector is selected
through interviews with experts, varying sets of critical or uncertain
influencing forces are chosen to be placed on sets of axes, forming a series
of futures matrixes that can be used to analyze potential alternative
futures.225
2. Techniques to Challenge Conventional Wisdom and Groupthink
Analysis of Competing Hypotheses: Particularly effective when large
amounts of data must be considered, this method involves the red team
identifying all possible reasonable alternative hypotheses. They then
prepare a matrix of supporting evidence for each alternative hypothesis,
focusing on disproving as many hypotheses as possible, rather than
proving one true. Additionally, they analyze how sensitive various
hypotheses are to pieces of evidence (if an evidence node is removed, does
the hypothesis then become unreasonable?), as well as analyze what types
223 Ibid., 191-192.
224 Ibid., 195-198.
225 Ibid., 202-205.

130
of evidence not currently evident would need to be present for various
hypotheses to be proven true.226
Devil’s Advocacy: This technique allows a red team to challenge a
strongly held consensus view by constructing the strongest possible case
for a competing explanation, avoiding the pitfalls of groupthink and
confirmation bias. It involves two activities: disproving the strongly held
consensus view by uncovering evidence that was either faulty or ignored
in the original analysis and proving the assertion opposite to the consensus
view.227
Team A/Team B: This technique is suggested for occasions when two
factions of a red team each hold competing views of a problem. It involves
separating the team into two debating sub-teams, each of which assembles
evidence for its own hypothesis and then presents that evidence in an oral
debate format.228
Strengths, Weaknesses, Opportunities and Threats (SWOT) Analysis:
The team, after settling on a situation or threat vector to analyze, creates a
four-quadrant diagram (strengths, weaknesses, opportunities, and threats)
and brainstorms entries for each quadrant.229
Most of these exercises will be discussed in greater detail in Chapter 9, the chapter
in which I describe my fused predictive analytical technique, Pandora’s Spyglass. In that
chapter, I will explore adaptations of these exercises that make them more useful to a
“devil’s toy box” analysis.
226 Ibid., 184-186.
227 Ibid., 186-189.
228 Ibid., 189-191.
229 Ibid., 2010-212.

131
3. Threat Matrix
As shown in Table 6, Sandia National Laboratories published a report, entitled
Categorizing Threat: Building and Using a Generic Threat Matrix, which provides a
graphical tool for ranking potential threat vectors/malign actors on a scale that combines
seven measures of capability (divided between commitment and resources) into an overall,
comparative level of threat.
Table 6. Generic Threat Matrix, Sandia National Laboratories230
In this matrix, “Intensity” refers to the level of dedication to his cause that the
antagonist brings to an attack (is he willing to die for the cause, go to jail for the cause, or
merely suffer minor inconvenience?). “Stealth” refers to the ability of the antagonist to
keep his activities hidden. “Time” refers to the period required to plan, organize, supply,
and carry out an attack and to the amount of time an antagonist is willing to commit to such
230 David P. Duggan, Sherry R. Thomas, Cynthia K. K. Veitch, and Laura Woodard, Categorizing
Threat: Building and Using a Generic Threat Matrix (SAND2007-5791) (Albuquerque, NM: Sandia National Laboratories, September 2007), 23.

132
efforts. “Technical Personnel” refers to the number of subject matter experts (SMEs) who
are required to carry out an attack successfully and to the number of SMEs the antagonist
group can assemble on its behalf. “Cyber Knowledge” refers to the antagonist’s level of
expertise in computer systems, computer networks, and computer security. “Kinetic
Knowledge” refers to the antagonist’s level of expertise in the defender’s physical barriers
and the methods with which to defeat those (explosives, firearms, camouflage, etc.).
Finally, “Access” refers to an adversary’s level of accessibility to the target (if the target is
a military base, does the antagonist work there as a contractor?).231
Members of a “devil’s toy box” analysis team would likely want to modify this
generic threat matrix, since they need to be concerned not only with classifying the threat
level from a universe of potential hostile actors, but, more crucially for their purposes, also
with classifying the threat level from a universe of potential future technologies and
combinations of future (and existing) technologies. They might opt to keep the seven
measures of capability highlighted in the Sandia Laboratories generic threat matrix, but
add the following measures taken from the “Evil Genius” study discussed earlier: (a)
consequences of prompt effects that could result from a malign use of the identified
technology/threat vector; (b) consequences of human response effects; (c) ease of use of
the identified technology/threat vector; and (d) affordability of the identified
technology/threat vector for a selected antagonist group or malign actor. When
categorizing levels of threats, the following would indicate higher levels of threat: higher
consequences of prompt effects; higher consequences of human response effects; higher
level of ease of use; greater affordability.
I have already discussed, near the end of Chapter 2, “Beginning the Winnowing
Process,” some of Douglas W. Hubbard’s reservations regarding ordinal rankings used in
common forms of risk management matrixes, which he sets forth in detail in his book The
Failure of Risk Management: Why It’s Broken and How to Fix It. In Chapter 9, which
outlines my suggested blended technique for a “devil’s toy box” analysis, I will apply some
of Hubbard’s suggested correctives. In the meantime, regarding the Sandia National
231 Ibid.

133
Laboratories’ Generic Threat Matrix, I would caution that analysts should not rely upon a
tool of this sort to be determinative. They should not plug their “High-Medium-Low”
estimations into this chart (or even an expanded chart) and expect that it will then grind
away like some mechanical engine of decision and tell them which threats should be
granted highest priority for research and development attention. For now, this tool could
be most useful as a repository for the insights the analytical team has surfaced during its
red-teaming process. It can neatly summarize the team’s thinking at various stages, too, if
it is regularly updated throughout the process and successive iterations of the matrix are
retained; in this way, it can also help to preserve a record of the team’s work and the
evolutions in its collective consideration. A filled-out generic threat matrix can also serve
as a jumping-off point for additional analytical exercises using tools from the tool kit we
have been assembling, for the relative placement of various identified threats on the matrix
will very likely spark renewed discussions and debates among members of the analytical
team.
C. RED TEAMING: BEST PRACTICES
The editors of Red Team Journal list seven “musts” for a system of red-teaming
analysis to be effective within an organization. (1) The red team participants must acquire
an adequate understanding of the defensive technology, system, or method that is to be
tested. (2) The red team must acquire an adequate understanding of potential adversaries’
culture(s), motivations, likely technologies, and rules of engagement. (3) The red team
must apply red-teaming best practices during its simulated attack or probe. (4) The red
team must effectively communicate what they have learned to their customers. In turn,
those customers must (5) pay attention to what the red team is telling them, (6) understand
what is being communicated, and (7) be willing and authorized to act in response to the red
team’s findings. The Red Team Journal editors state that, should any of these factors not
be present, the red-teaming effort will not produce the desired results within the
organization.232
232 Red Team Journal, “Red Teaming Myth #5,” last modified February 23, 2016,
http://redteamjournal.com/2016/02/red-teaming-myth-5/.

134
The RAND Corporation suggests additional factors that should be kept in mind by
red teamers. Their monograph, Breaching the Fortress Wall: Understanding Terrorist
Efforts to Overcome Defensive Technologies, examines the continual dynamic of measure-
countermeasure, move-countermove that takes place between defending organizations
within the homeland security enterprise and their opponents, either individual
terrorists/criminals or terrorist organizations. The authors review the tactics and strategies
of four prominent terror groups or aggregations. They focus on Palestinian terror
organizations; Jemaah Islamiyah and its allies; the Liberation Tigers of Tamil Eelam; and
the Provisional Irish Republican Army. They identify four ways that these groups have
attempted to defeat defensive technologies or measures put into place by homeland security
organizations. These include altering operational practices, which might include
incorporating camouflage, deception, or forgery into their tactics; switching their own
chosen technologies (surveillance tools, communications systems, or weapons) to foil
defensive technologies; avoiding the defensive technology altogether by, for example,
changing the target or zone of attack; and, finally, directly attacking the defensive
technology. The authors assert that homeland security defensive systems should always be
designed with the likely reactions of opponents in mind. They suggest that these systems’
designers utilize red-teaming techniques to test the resilience of such systems, including
assessing potential adversaries’ information requirements (what attackers would need to
know to successfully defeat the system and how those attackers might acquire such
information) and attempting to foresee how attackers may adjust to the defensive system
and responsively change their own technologies and tactics. The authors further suggest
that in the realm of counterterrorism, flexible systems are of more value than inflexible
ones, for opponents’ countermoves may swiftly render a defensive system’s initial mode
of operation obsolete. They additionally suggest that defensive system designers take into
consideration the relative costs of the system they are designing and those of foreseeable
efforts to defeat that system. They point out that one goal of some terror groups is to drain
defenders’ ability and will to defend themselves by subjecting them to very high relative

135
expenditures. In other words, a billion-dollar system that can be defeated by a ten-
thousand-dollar countermeasure is not a wise expenditure of homeland security dollars.233
D. RED TEAMING: DISADVANTAGES AND WAYS TO OVERCOME THOSE PITFALLS
Red-teaming can be an expensive and time-consuming process. Defensive systems
may be potentially confronted by a multitude of different opponents who may field a wide
variety of opposing technologies and counter-methods. The facilitators of a “devil’s toy
box” analysis might not want to invest in gathering the various groups of subject matter
experts needed to analyze various technological threat vectors and employ those SMEs for
the extended periods of time required for thorough red-teaming efforts. How might the red-
teaming methodology be applied in a more cost- and time-effective fashion, given the wide
range of potential threats?
Michael J. Skroch of Sandia National Laboratories offers a potential answer: virtual
red-teaming through modeling and simulation. Skroch points out that human beings and
computers have differing relative advantages and strengths when it comes to red-teaming.
Whereas human beings are effective in the realms of creativity and intuition, computers
are good at crunching numbers, dealing with complexity, and exhausting a range of
potential alternatives.234 In parsing out these differences between human analysts and
computers, Skroch delineates three realms for which red-teaming methods are used to
highlight strengths and vulnerabilities: the physical space (defensive measures such as
walls, gates, fences, sensors, and weapons); the cyber space (computers and networks,
information systems, codes); and the behavioral space (the homeland security organization
being attacked, the political and cultural environments that organization inhabits, as well
as the policy and organizational restraints faced by the operators of the defensive system
233 Brian A. Jackson, Peter Chalk, R. Kim Cragin, Bruce Newsome, John V. Parachini, William
Rosenau, Erin M. Simpson, Melanie Sisson, and Donald Temple, Breaching the Fortress Wall: Understanding Terrorist Efforts to Overcome Defensive Technologies ( Santa Monica, CA: RAND Corporation, 2007), xviii-xxii, http://www.rand.org/content/dam/rand/pubs/monographs/2007/RAND_MG481.pdf.
234 Skroch, Modeling and Simulation of Red Teaming, 2-4.

136
and the employees and managers of the organization fielding the system).235 Skroch states
that red teams composed of human beings are superior when it comes to red-teaming the
behavioral space, whereas virtual red teams are superior at red-teaming the physical space,
due to the advantages offered by computer red team modeling and simulation. These
advantages include the ability of programmers to create a wide variety of attack modes
quickly and at relatively low cost; the ability of modeling and simulation systems to run
24/7; the ability to easily and cheaply capture all data; the ability to replicate past
environments and events; superior verification and validation [V&V] across multiple
simulations; and the fact that virtual red-teaming’s easily generated large numbers of
varying attack scenarios are extremely useful for sensitivity analysis. He suggests that,
when it comes to red-teaming the cyber space, neither human red teams nor virtual red
teams have a clear advantage over the other, since both bring valuable and unique strengths
to bear.236 Skroch concludes that virtual red teams should not be considered a replacement
for red teams composed of human beings, but rather a complement to them, providing a
cost-effective extension of the coverage of red-teaming analysis in the physical and cyber
realms.237
The DETER Cybersecurity Project offers the members of a “devil’s toy box”
analysis team a powerful, government-run tool for their use when they need to red team
emerging cyber threats. Initially established by the Department of Homeland Security and
the Space and Naval Warfare System Center as a “basic hardware-focused network security
testbed,” the DETER Cybersecurity Project has since evolved into a laboratory for
cybersecurity experimental science, which allows researchers to observe actual malware
products introduced from live environments, determine their properties through
observation, modeling, and simulation, and test various approaches for neutralizing them.
Prior to the establishment of the DETER Project in 2004, entrepreneurs and other actors
who sought to develop counter-malware products often fell short of their goals due to the
235 Ibid., 6. Skroch uses the term “cyber space” in this context, rather than the accepted usage
“cyberspace,” to match his use of the terms “physical space” and “behavioral space.”
236 Ibid., 5.
237 Ibid., 7.

137
lack of testing facilities. Since then, DETER has allowed for the development of much
more effective cybersecurity tools.238
Yacov Y. Haimes and Barry M. Horowitz of the University of Virginia, thinking
along the same lines as Sandia Laboratories’ Skroch, introduced in 2004 an Adaptive Two-
Player Hierarchical Holographic Modeling (HHM) Game for counterterrorism intelligence
analysis, “a repeatable, adaptive, and systemic process for tracking scenarios” meant to
model the actions of a blue team and a red team and quantify threats to and vulnerabilities
of a defensive system.239 HHM, further defined as “a structured approach to organizing a
team effort for performing a risk analysis,” addresses the following three questions: “What
can go wrong? What are the consequences? What is the likelihood?”240 The
methodological frameworks that form the basis of this technique of table top or computer-
simulated red-teaming are:
Hierarchical Holographic Modeling (HHM)—for scenario
structuring and risk identification,
Risk Filtering, Ranking, and Management (RFRM)—for adding
priorities to the generated scenarios and intelligence database,
Bayesian analysis—for corroboration and adding credibility to
intelligence, and
Building blocks of mathematical models and the centrality of state
variables—for identifying, in conjunction with the HHM, the
critical elements that are of interest to the terrorist networks.
These form the basis for collecting intelligence. Such knowledge
238 Terry Benzel, “The Science of Cyber Security Experimentation: The DETER Project” (paper
presented at 2011 Annual Computer Security Applications Conference, Orlando, Florida, December 5–9, 2011), https://www.acsac.org/2011/program/keynotes/benzel.pdf.
239 Yacov Y. Haimes and Barry M. Horowitz, “Adaptive Two-Player Hierarchical Holographic Modeling Game for Counterterrorism Intelligence Analysis,” Journal of Homeland Security and Emergency Management 1, no. 3, art. 302 (June 2004), i, doi: https://doi.org/10.2202/1547-7355.1038.
240 Ibid., 3.

138
can result in a priori likelihoods of attacks using specific classes
of weapons.241
Both the blue team and the red team perform Hierarchical Holographic Modeling
analyses on their own “side,” with levels of analysis including the following:
organizational, narrative, doctrinal, technological, and social.242 The authors outline the
game’s steps as:
1. Select classes of potential terrorist threats to be tracked
(e.g., meat poisoning, water poisoning, nuclear power-plant
attacks).
2. For each class conduct an HHM analysis … The results are
sets of attack elements; when combined in various ways,
these can be the basis for coherent attack scenarios. For
example, some elements could be (a) gain employment at
the target location, (b) steal weapon for an attack, and (c)
bribe an employee at the target location.
3. Combine elements into packages of potential attacks. For
each package, evaluate the consequences and likelihood, …
4. Rank the attacks and attack elements in order of concern,
…
5. For the highest-ranking attacks, evaluate the potential
observables that could result if a terrorist were to undertake
such a plan of action.
6. For the attack elements and combinations that provide the
most unusual observations, … consider setting up an
241 Ibid., 18.
242 Ibid., 6-7.

139
intelligence-collection capability; then evaluate actual
collections based on observing these elements in isolation
and in combination.
7. When defined thresholds of observation are exceeded, raise
the level of likelihood for the corresponding terrorist
attack.243
At the time of the article’s publication (June 2004), the authors were amid writing
a software program to permit gamers to use computers to conduct multiple sessions of
Hierarchical Holographic Modeling swiftly and inexpensively, allowing for successive
iterations of large numbers of attack and defense combinational scenarios.244
Haimes and Horowitz have not been the only computer scientists or systems
analysts to tackle the problem of countering terror attacks. In response to what they felt
were critical flaws in DHS’s 2006 exercise in bioterrorism risk assessment, which relied
upon subject matter experts (SMEs) and an eighteen-stage risk assessment tree to
determine probabilities of various potential bioterror attacks, Gerald G. Brown, Matthew
Carlyle, and R. Kevin Wood of the Naval Postgraduate School developed a “Defend-
Attack-Mitigate risk-minimization model” and a “tri-level ‘Defender-Attacker-Defender
risk-minimization model.’” Their contention was that, contrary to DHS’s Bioterrorism
Risk Assessment exercise, the likelihood that the attackers (terrorists deploying biological
weapons) would adjust their tactics in response to whatever defensive methods DHS
deployed could not be captured purely by statistical analysis. In their model, the defender
(blue team) develops its best mitigation/protection strategy against a mode of attack (the
example given is a biological agent attack, with the defender investing in a supply of
emergency vaccines). Then the attacker (red team) adjusts its plan of attack as best it can
to adapt to the defender’s countermeasures. In response, the defending blue team puts its
selected countermeasure(s) into play as effectively as it can. The authors assert that this
243 Ibid., 3–4.
244 Ibid., 15.

140
method of analysis allows homeland security intelligence analysts to focus on attacks of
the highest likelihood and highest lethality.245 Their model is laid out mathematically and
appears to me suitable for transposition to a computer software program; it has been
validated through more than a hundred assessments of vulnerability conducted by students
and instructors at the Naval Postgraduate School.246
In 2005, the same group of authors, joined by Javier Salmerón, applied earlier
versions of their bi-level programming models to the problem of protecting critical
infrastructure. They selected electric power grids, oil pipelines, the Washington, DC Metro
system, and the Los Angeles International Airport for their analysis.247 They drew the
following lessons from this series of simulations:
The attacker has the advantage. …
Some systems are naturally robust, while others are not. …
Hardening an infrastructure system from attack can be expensive. …
The data are out there, and if we can get them, anybody can. …
The answers are not always obvious. The most damaging coordinated attacks, or the most effective defenses, can be nonintuitive. …
Malicious, coordinated attacks can be much more damaging than random acts of nature. …
Reliability is not the answer. We must protect the most critical components in our infrastructure systems, rather than backing up the least reliable components. …
The right redundancy may be the answer. …
Secrecy and deception may be valuable. …
245 Gerald G. Brown, W. Matthew Carlyle, and R. Kevin Wood, “Optimizing Department of
Homeland Security Defense Investments: Applying Defender-Attacker (-Defender) Optimization to Terror Risk Assessment and Mitigation,” Appendix E of Department of Homeland Security Bioterrorist Risk Assessment: A Call for Change (Washington, DC: National Research Council, National Academies Press, 2008), E-1—E2.
246 Ibid., E-3.
247 Brown et al., Analyzing the Vulnerability of Critical Infrastructure, 110-117.

141
Worst-case analysis using optimization is key to a credible assessment of infrastructure vulnerability, and to reducing that vulnerability.248
The members of a “devil’s toy box” analysis will not have unlimited resources with
which to proceed. They will face limits on their staff size, their funding, their equipment,
and their time. They could potentially economize on those limited resources and maximize
their utility by using computerized modeling and simulation of red team-blue team
interactions. Certain types of future-shock threats presented by emerging technologies may
be more appropriate subjects for computerized modeling and simulation. Cyber attacks and
kinetic attacks whose success depends upon physical or software properties that can be
accurately mathematically modeled are the most appropriate for computerized modeling
and simulation. Conversely, threats whose outcomes depend heavily upon cultural and
emotional human factors—for example, an apocalyptic extremist religious group’s
willingness to use a new type of man-made biological agent in an attack—would be the
least appropriate. Additionally, the managers of a “devil’s toy box” analysis could hone the
products of human red-teaming analyses by performing sensitivity analyses of various key
factors, using massive numbers of base scenario iterations generated by a computer
program, getting “more bang for their buck.”
* * * * *
To sum up, red-teaming is not an optional part of a “devil’s toy box” analytical
effort. It is the heart of that effort. Technological implements do not use themselves and
attack office buildings, shopping malls, trains, aircraft, festive gatherings, religious
processions, or entire cities of their own volition (the issue of future artificial intelligence
systems going “rogue” aside). They are used by human beings with human motivations,
fears, hatreds, loyalties, honor codes, religious or ideological aspirations, and lusts, as well
as hunger for destruction and its accompanying glory or infamy. Only the analytical
frameworks provided by a thorough red-teaming process can provide members of a
“devil’s toy box” analysis team with those types of insights into the minds and hearts of
potential adversaries to be faced by the homeland security enterprise. Additionally, the
proponents of red-teaming recognize the range of personal cognitive fallibilities that
248 Ibid., 120-121.

142
analysts must consider when performing any sort of attacker-defender analysis (of which
a “devil’s toy box” analysis is certainly an example), such as groupthink, mirror imaging,
or the tendency to surrender to the lure of conventional wisdom, offering exercises that
help analysts overcome such cognitive biases.
Thus far, I have considered a range of techniques that can be used to amalgamate,
sift, hone, and rank the opinions or forecasts of experts and arrive at a group consensus, as
well as red-teaming techniques that can help those experts overcome their cognitive biases
and see matters through the eyes of their potential antagonists; however, one question I
have not yet addressed is this: for the purposes of a “devil’s toy box” analysis, just who are
the “experts”?

143
VII. WHO ARE THE EXPERTS? A CASE FOR THE INCLUSION OF SCIENCE FICTION WRITERS AS PART OF A “DEVIL’S TOY
BOX” ANALYTICAL TEAM
A. THE CONCEPT OF EXPERTISE: BACKGROUND
Delphi panels, nominal group technique procedures, and conclaves of futurists all
rely upon the participation of experts. What are experts? For the purposes of a “devil’s toy
box” analysis, experts may be persons possessing specialized knowledge, not typically
dispersed among the public, which can be of aid to the analytical task. Or they may be
individuals with life experience or personal knowledge that has specific bearing on the
analytical task, or persons who have benefitted from training that is necessary for the
completion of the analytical task.
Olaf Helmer points out the difficulties inherent in selecting the right experts for a
foresight exercise, defining those experts’ qualifications, and separating high performing
forecasters from low performing forecasters.249 Catherine Powell has surveyed the
literature regarding best practices for choice of expert panelists in Delphi procedures. She
reports that E. Rowe, Andre Delbecq et al., and M. K. Murphy et al. all agree upon the
importance of heterogeneity to the composition of an effective Delphi panel, and that
panels featuring participants having a wide variety of perspectives, backgrounds, and
specializations tend to produce higher quality results than those that are produced by more
homogenous panels. She also points out that most Delphi users she has surveyed agree
upon the importance of selecting experts having high levels of credibility with the Delphi
report’s target audience; otherwise, the report faces the danger of becoming “shelfware,”
never seriously read and considered by the decision-makers whose actions the report was
intended to guide.250
Her recommendations focus on diversity of perspectives and credibility with the
consumers of the group’s outputs. Powell’s emphasis on the importance of panelists’
249 Helmer, Analysis of the Future, 5.
250 Powell, “The Delphi Technique: Myths and Realities,” 379.

144
credibility with the final report’s intended target audience, to ensure buy-in of the report’s
recommendations at the highest levels of the organization, suggests that one best practice
would be to include in the analytical team persons who would be considered representative
of the sponsoring organization’s mission. For a law enforcement agency, this would mean
senior officers; for a homeland security agency, it would likely mean special agents, senior
analysts, and/or members of top management. Ideally, such “in-house” participants would
have a familiarity with red-teaming techniques, to also serve Powell’s other
recommendation, that diversity of perspectives be well accommodated and sought after.
The danger exists, however, that too large an “in-house” representation on a “devil’s toy
box” analytical team would lead to organizational group-think and counterproductive
steering of results in directions amenable to the sponsoring organization’s existing
initiatives and priorities. In other words, the old aphorism applies—when one’s only tool
is a hammer, every problem conveniently looks like a nail. Outside expertise must also be
sought to ensure diversity of perspectives, but that outside expertise also needs to be
credible to the sponsoring organization’s management.
Credibility is oftentimes based upon credentials, educational or experiential
background, or status within a group; however, it can also be based upon possession of
specialized or local knowledge that is not generally perceived by the public as expert
knowledge. For example, a Delphi panel having the goal of arriving at consensus regarding
crime reduction strategies in a Chicago neighborhood would benefit from having among
its members neighborhood residents who have been victims of crimes, and, if possible,
persons who have committed crimes in that neighborhood and then gone on to reform.
Such individuals would not typically be regarded as “experts,” but they are experts when
it comes to knowledge of conditions in their neighborhood and motivations underlying the
commission of crimes. A resident could speak to broken streetlights that make her feel
unsafe and businesses that attract unruly or threatening clienteles. The reformed criminal
could speak to the availability of a customer base desperate for illicit drugs, networks of
criminal activities (gambling, prostitution, protection rackets) embedded in the
neighborhood, gang rivalries, and the most advantageous locales from which to ambush

145
victims. Such input, while not recognized as “expert input” by those who place heavy
emphasis on professional credentials, would be invaluable for this Delphi panel.
B. EXPERTISE IN THE CONTEXT OF A “DEVIL’S TOY BOX” ANALYSIS
What sorts of experts with which types of backgrounds would be most useful for a
“devil’s toy box” analysis? What areas of expertise are required? An answer that
immediately comes to mind is persons who are expert in the scientific or technical fields
relevant to the over-the-horizon Promethean technologies initially flagged by a system such
as IARPA’s FUSE. The facilitators of a “devil’s toy box” analysis would want to include
geneticists to judge emerging gene-splicing technologies; explosives and firearms experts
to judge emerging 3–D printing technologies; robotics, machine intelligence, and radio
spectrum communications experts to judge emerging automation technologies; and
cybersecurity experts to judge the vulnerabilities of new personal medical implant
technologies connected to the Internet of Things. Uber hopes to test its planned Uber
Elevate service, “ride sharing in the air,” in the Dallas-Fort Worth and Los Angeles markets
by 2020 and get approved for inter-city flying taxi rides by 2023.251 An evaluation of the
security vulnerabilities of this gargantuan expansion of civil aviation at low altitudes would
require experts in civil aviation, air traffic control systems, and guarding aviation assets
from terror attacks. Regarding all such emerging technologies, experts in appropriate fields
would be called upon to help predict the levels of training, technical expertise, and support
that would-be malign exploiters of such innovations would require five years down the
line, and to extrapolate the outer boundaries of their potential destructiveness.
Yet a focus on the future development of technologies is not enough. A gun, by
itself, does not murder. Nor will an automated laser rifle, a micro-drone carrying a payload
of poison, or a software worm written to turn off Internet-connected pacemakers. Each of
these tools, to contribute to a killing or an act of destruction or disruption, must be used or
set into motion by a human actor. Human actors choose the various attack options—mode,
251 Eric Auchard, “Uber in Deal with NASA to Build Flying Taxi Air Control Software,” Reuters
website, November 8, 2017, https://www.reuters.com/article/us-portugal-websummit-uber/uber-in-deal-with-nasa-to-build-flying-taxi-air-control-software-idUSKBN1D81AE.

146
time, place, and target; indeed, the choice of whether to engage in destructive or murderous
activity at all, rather than expressing negative emotion in a different, less violent fashion.
Ideally, a “devil’s toy box” analytical team will include experts on the human motivations
that lead to decisions to engage in acts of terror, as well as the desires, aspirations, fears,
hatreds, taboos, loyalties, rivalries, social or religious traditions, and cultural imperatives
that shape the behaviors and goals of terrorists.
Which emerging Promethean technologies will prove especially attractive to which
terror groups? Conversely, which technologies will be shunned by certain terror groups as
anathema to aspects of their practices or ideology? Looking through a different lens, which
technologies may prove irresistible to young home hobbyists but lead to unintended
accidents with huge negative consequences for the surrounding community? Regarding the
first question, a terror group or individual terrorist whose ideology centers around hatred
and loathing of dark-skinned peoples and Jews would very likely be tremendously attracted
to a gene-splicing technology that allows for the creation of pathogens tailored to be deadly
to victims with substantial African genetic heritage or Ashkenazic Jewish genetic heritage.
Regarding the second question, a notional fundamentalist Jewish terror group in Israel,
whose goal is to “cleanse” all Jerusalem of Arab residents and “rededicate” it for Jewish
use, would likely not want to use a weapon of mass destruction that would cause physical
obliteration of the sacred spaces or render those spaces uninhabitable (through radiation
contamination, for example); its members would seek a weapon that would cause the
deaths or flight of Arab residents in Jerusalem but spare the physical surroundings.
Regarding the third question, that of new technologies that might lead to accidental
deaths or major disruptions, fans of bleeding-edge immersive, massively multiplayer
online gaming will likely swarm, like moths around a tiki torch, toward a gaming system
that combines shareable virtual reality environments with direct neural connections (either
wired or wireless) into players’ brains. Conceivably, groups of irresponsible (but not
murderous) teenagers or individual teens could intend to “prank” one of their fellow players
with a psychological/physiological shock through the mode of the shared network, only to
see this “prank” result in the unintended neurological impairment or death of their target(s).
Milder forms of Internet-facilitating pranking and targeted revenge/disruption that have
147
entered common parlance include doxxing, or the intentional release of a targeted
individual’s phone number(s), email address(es), IP address(es), and other identifying
information in the hopes of facilitating widespread harassment; and swatting, the making
of false claims of a person committing a serious crime to trigger a zealous law enforcement
response, such as the dispatch of a SWAT squadron to the target’s home. These forms of
pranking sometimes also result in consequences more severe and lasting than the pranksters
may have originally intended. The speculative scenario I mention above is nothing more
than an extrapolation of the contemporary phenomenon of social media-based bullying,
which sometimes induces its victims to attempt or successfully commit suicide. Face-to-
face bullying between young people has taken place since the time of the founding of the
first social units in prehistoric times; the invention of online social media extended the
reach of bullying from school or public environments into a victim’s own home. Similarly,
irresponsible teens’ pranks leading to injuries or deaths are not a new phenomenon. What
the technology described above would accomplish would be to extend the reach of such
terrible accidents from any point in the world to any other point, with no geographical
limits or boundaries, and facilitate such accidents occurring between pranksters and victims
who will likely never know one another’s true identities. Such extended range will vastly
complicate the efforts of local law enforcement agencies, schools, social service agencies,
religious and pastoral organizations, and families to prevent, stem, or punish such
destructive behavior.
The attacks on the Twin Towers and the Pentagon in 2001 by a cadre of al Qaeda
suicide terrorists spurred the development of terrorism studies and homeland security
studies as academic fields of interest. Early attempts by analysts and researchers to explain
the behavior of terror groups and individual terrorists either focused on individuals’
psychopathology as a motivator, or recycled Cold War-era analytical frames derived from
political science and international relations, such as the Rational Choice/Rational Actor
Model, to parse out the motivations of terror organizations and to try to predict those
groups’ future operations.252 More recently, some academics in the field of terrorism
252 David Brannan, Kristin Darken, and Anders Strindberg, A Practitioner’s Way Forward: Terrorism
Analysis (Salinas, California: Agile Press, 2014), 28–33.

148
studies have adopted a sociological model developed in the 1970s, Social Identity Theory,
to provide a more effective set of analytical frames through which to compare and contrast
varying terror groups across different societies and time periods, and to better understand
why superficially similar groups sometimes compete or clash rather than cooperate, or why
groups with identical goals and overlapping constituencies will sometimes opt to operate
in very different fashions.253 Social Identity Theory is centered upon four analytical
markers derived from studies of traditional Eastern Mediterranean societies. These are the
centrality of relationships between patrons and their clients; a focus upon desired attributes
and resources as limited goods; social interactions being shaped by a common desire to
accrue honor and to avoid shame; and both interpersonal and inter-group interactions
following a challenge-and-response model.254 Terrorism analysts practiced in the use of
Social Identity Theory as an analytical framework could serve as useful additions to a
“devil’s toy box” analytical team. Their mode of analysis could provide greater insight into
why terror organizations may be especially attracted to emerging Promethean technologies,
and thus why the analytical team should consider certain technologies as more likely to be
used in malign ways than others. More so than the scientific and technical experts
embedded in the notional analytical team, terror analysts using a Social Identity Theory
framework could further one of the principle goals of red-teaming—that of “seeing a
situation through the enemy’s eyes.”
An ideal addition to a “devil’s toy box” analytical team would be a person who
combines the horizon scanning habits of a futurist or a technology forecaster with the
conflict- and mayhem-inclined mindset of a terrorist. Such an individual would be able to
speak not only to the feasibility of use of a Promethean technology for malign purposes,
but also to the human, emotional factors that prompt such use—the symbolic, religious,
and psychological attractants inherent within certain technologies and how and why those
attractants appeal to persons of a terroristic bent. These notional ideal team members exist.
They are called science fiction writers.
253 Ibid., 40–49.
254 Ibid., 65.

149
C. ANOTHER SOURCE OF EXPERTISE: THE SCIENCE FICTION MINDSET
Thus far, virtually all researchers into the efficacy of various forecasting methods
have emphasized the importance, for the success of a forecasting effort, of a diversity of
outlooks, backgrounds, and analytical frameworks. What other analytical framework might
be especially helpful in determining the intersections between emerging Promethean
technologies and the motivations, aspirations, and goals of human actors who seek to cause
mayhem, disruption, and terror? I propose that the mode of creative extrapolation of
scientific and social possibilities inculcated in writers of commercial science fiction is
especially useful for a “devil’s toy box” analysis.
The science fiction mindset is not a random trait based upon personal characteristics
inherent in the science fiction writer. This mindset arises from modes of thinking, planning,
plotting, and writing that are inculcated into science fiction writers by the demands of their
marketplace. These modes of imagining, extrapolating, planning, and plotting what are
essentially futurist scenarios centered around conflict between persons (or in the case of
aliens, beings) with intelligible and compelling motivations allow science fiction writers
insight into, in the terms of this thesis’s central parable, the devil’s mindset—his desires,
his preferred goals, and which of his many, many gestating toys he will tend to favor.
Having a mix of science fiction writers on a “devil’s toy box” analytical team is the next
best thing to having as members former terrorists who brainstormed new weaponry and
new modes of attack for their terror groups.
While a great deal has been written about the socio-economic backgrounds of
terrorists and the possible psychological, sociological, and even physiological factors that
may contribute to terroristic behavior, few academicians have focused their attentions on
parallel studies of science fiction writers or the science fiction readership they serve. Some
socio-economic surveys have been performed of the latter, and a handful of scholars have
attempted more in-depth study, but much of what is known about science fiction writers
and the science fiction readership is based upon literary memoirs and reminiscences. Thus,
while I base my attempt to illuminate parallels between terror group leaders and members
and the science fiction readership on existing studies and analyses, I also make use of more

150
subjective materials. In part, I base my postulation of the similarities between the two
groups, which underlies my insight regarding the utility of the science fiction writer’s
mindset to a “devil’s toy box” analysis, on my own personal experience as both a lifelong
reader of science fiction and as a writer of commercially published science fiction. Since
1994, I have written 17 novels, most them science fiction, fantasy, or horror, along with a
similar number of short stories. Of the novels, three have been published by commercial
publishers, and I have self-published several others through the Amazon Kindle and
CreateSpace platforms. I have worked with a succession of literary agents since 2001, who
have submitted all my books to a wide variety of commercial publishing houses. Both my
successes and my disappointments from this part-time career/full-time avocation over the
past twenty-five years, when added to my collegial relationships with numerous fellow
science fiction writers, have taught me a great deal about the needs and proclivities of the
commercial marketplace for science fiction, that market being made up of acquiring
editors, writers, and readers and fans.
1. The Constraints of Commercial Science Fiction as a Shaper of the Science Fiction Mindset: (Commercial Science Fiction = Future Technology + CONFLICT)
Many persons with only a passing familiarity with the science fiction field have
assumed that the primary goal of writers of science fiction is to successfully predict future
developments in science and technology, to serve as literary crystal balls. This impression
was furthered by the accurate prognostications of two of the science fiction field’s earliest
and most prominent writers, Jules Verne and H. G. Wells. The former predicted electricity-
powered submarines (Twenty Thousand Leagues Under the Sea), manned flight to the
Moon (From the Earth to the Moon), and round-the-world travel by air (Around the World
in Eighty Days). The latter foresaw the development of armored tanks (“The Land
Ironclads”), genetic engineering of animals (The Island of Dr. Moreau), and nuclear
weaponry (The World Set Free). Also, during the decades leading up to the First World
War, Robert Louis Stevenson foresaw the use of powerful psychotropic drugs to radically
alter a person’s personality and behavior, with his very popular The Strange Case of Dr.
Jekyll and Mr. Hyde, whose story has been widely disseminated by multiple film versions.

151
Additionally, the founder of science fiction as a commercial genre of American fiction,
Hugo Gernsback, original editor of the pulp fiction magazine Amazing Stories, intended
that one of the goals of his periodical, first published in 1926, would be to accurately predict
future technological developments for its readership. Yet as John Clute and Peter Nicholls,
editors of the authoritative The Encyclopedia of Science Fiction, point out, the record of
science fiction writers as accurate soothsayers is decidedly mixed. Since the first
publication of Amazing Stories, the most consequential scientific prediction by a major
writer of commercial science fiction has been Arthur C. Clarke’s 1945 article about the
potential for communications satellites, and perhaps the most amusing has been Robert
Heinlein’s accurate prognostication of the invention of the water bed. Clute and Nicolls
point out that many science fiction writers have never set out to predict what will happen;
instead, they predict, then dramatically envision, what could potentially happen, either to
warn their readers about possible dire developments in the future or, less frequently, to
provide a beacon to an attractive possible future.255
So, if science fiction writers have not demonstrated a widely shared talent for
accurately predicting future technological developments, what do they have to offer a
“devil’s toy box” analysis? Their most valuable contribution would be their mindset,
inculcated in them by a career spent chasing opportunities to sell stories and novels to a
type of readership—a mindset that combines conflict-seeking (within the realm of
storytelling) with continual horizon-scanning in search of innovative technological
extrapolations upon which to base their fictions.
Conflict lies at the heart of any story or novel. Absent conflict (which can be
between persons, between a protagonist and society, or conflicting impulses within a
protagonist), a story or novel is no more than a character sketch, a philosophical or
sociological essay, or an excursion into speculative psychology. Although a relative
handful of science fiction stories and novels have been accepted into the literary canon as
works of literary art, and science fiction has made inroads in recent decades into the
255 Peter Nicholls, “Prediction,” in The Encyclopedia of Science Fiction, second edition, ed. John
Clute and Peter Nicholls (New York: St. Martin’s Press, 1995), 957–958.

152
academy as an object of study, science fiction is primarily a commercial genre of fiction,
subject to the same marketplace pressures and influences as other popular fiction genres,
such as romances, mysteries, suspense thrillers, and Westerns. If acquiring editors do not
judge a story or novel as having the potential to earn a profit, they will not buy the piece,
no matter how much they may personally like it. (Exceptions to this marketplace rule exist
for media that are not primarily profit-driven, such as academic publications, subsidized
publishing, self-publishing, or agenda-focused publishing).
2. Extrapolated or Novel Technology as an Element of the Science Fiction Mindset
The science fiction field has traditionally been an iterative one, like jazz music and
Modernist painting, wherein subsequent writers build upon the concepts and tropes
developed by earlier writers. In the science fiction genre (as opposed to the related
commercial genres of fantasy and horror, which rely more heavily on repeated, well-worn
tropes and effects), freshness of approach to the material is highly sought after. Writers
who can provide fresh, novel approaches are highly thought of by their colleagues (and
often the recipients of prestigious awards) and are lauded by discriminating readers. Some
(not all) acquiring editors in the science fiction field seek freshness and novelty and will
immediately reject what they perceive as the “same-old, same-old” story (unless that
“same-old, same-old” story is written by a highly marketable author with a huge built-in
readership, but that is a subject for a different thesis). Thus, science fiction writers, or at
least those who write what is called “hard science fiction,” which is science fiction based
in supportable, plausible extrapolations of science and technology (“hard sf” is defined by
Allen Steele as “imaginative literature that uses either established or carefully extrapolated
science as its backbone”256), compete with one another to offer fresh takes on rigorous
extrapolations of evolving science and technology, often cutting-edge or highly notional.
In terms familiar to Social Identity Theory practitioners, publishing billets are a
limited good. Less than two dozen commercial science fiction magazine markets, those
that pay at least 5 cents per word, exist as of 2017, as well as a limited number of science
256 Allen Steele, “Hard Again,” New York Review of Science Fiction, June 1992, 1–4.

153
fiction novel publishing imprints that have a limited number of publication slots each year.
Also, “hard sf” is always in danger of getting pushed aside by the commercially more
popular science-fantasy, “soft sf,” science fiction romance, and fantasy stories and books,
which sell in far greater numbers than most anything classified as “hard sf.” The
competitive pressures of commercial science fiction publishing thus push writers of more
technology-oriented science fiction to offer “hot takes” on plausible extrapolations of
current or foreseen developments in science and technology AND to present those
extrapolations in the form of exciting conflicts that induce readers (most especially
acquiring editors) to swiftly turn the pages. The commercial market trains a successful
writer of “hard sf” (someone who is able to make, if not a comfortable living, at least some
level of steady income from his or her writing work) to continually scan available sources
for new information on scientific and technical developments with story potential; to
furiously extrapolate the potential implications (both good and bad implications, but the
latter typically make for better, more exciting plots) of said developments before a
competitor writes the same or similar extrapolation, sells it to one of the limited number of
acquiring editors, and renders the more tardy author’s work unmarketable; and to
extrapolate the scientific or technical development in the most thrilling, reader-engaging
way possible, meaning ramping up the levels of conflict inherent in the work’s plot,
characters, settings, and themes.
In short, the successful writer of “hard science fiction” has been trained to regularly
and extensively exercise a mindset of special value to a “devil’s toy box” analysis. These
authors, to sell their work often enough to produce even a modest income, must continually
ask themselves:
What are the NEWEST developments in science and technology?
What developments are anticipated in the foreseeable future?
What are theorists of science speculating about as possibilities?
What might happen because of these developments in science and
technology?

154
What is likely to happen? What might plausibly happen?
What trends currently exist in science and technology and societal
adjustments to science and technology? What would happen if those
trends were extrapolated into the future and greatly exaggerated?
What are the possible social impacts of these trends and developments?
Political implications? Cultural implications? Religious implications?
Psychological impacts? Impacts on behaviors? Impacts on health and
longevity? Impacts on the physical environment?
What are the scariest things that might result?
What are the most interesting, exciting conflicts that might arise because
of these potential, extrapolated trends and developments in science and
technology?
3. Exciting Conflict that Appeals to Young Men as an Element of the Science Fiction Mindset
Throughout much of its existence as a genre of popular fiction, science fiction has
been marketed as reading material for teenage boys and young men of approximately
college age. It is for good reason that a saying common within the field cynically states
that “the Golden Age of Science Fiction is 14.”257 (Varying versions of the epigram peg
the Golden Age as 12.) With this primary audience in mind, authors of science fiction who
hope to have a commercially remunerative career have traditionally loaded up their stories
and novels with plenty of conflict, oftentimes the sorts of conflict of most interest to
teenage boys and young men. These include stories of future military conflicts, invasions
by alien beings, or underground rebel movements using new technologies or social
doctrines. Stories about the exploration and conquering of new frontiers, primarily outer
space, have always been popular with boys. Another set of story possibilities with proven
appeal to the target audience is the acquisition of vast new personal capabilities, such as
257 Peter Nicholls, “Golden Age of SF,” in The Encyclopedia of Science Fiction, 506.

155
machine-enhanced intelligence or physical strength and dexterity; similar improvements
provided through genetic engineering; or the development of esoteric abilities such as
telepathy or telekinesis. Since many science fiction writers, writers of “hard sf,” write their
works with this audience in mind—not only out of careerist motives, but because many
them were readers and fans themselves prior to beginning their professional writing
careers, and most writers write what they themselves want to read—an examination of this
readership should prove illuminating. This is especially true to the extent that such data
and observations allow for parallels to be drawn with another audience of interest to
“devil’s toy box” analysts: potential followers and acolytes whom terror leaders attempt to
recruit.
Looked at from a certain vantage point, both science fiction writers and terror group
leaders are purveyors of dreams and fantasies for similar audiences of young men.
Appendix B of this thesis, “Drawing Parallels Between Two Audiences—The Science
Fiction Readership and Potential Memberships of Terror Groups,” illustrates that science
fiction writers and terror group leaders are pitching their adventuresome, testosterone-laden
“products” to intriguingly similar audiences, young men having very similar educational
and socio-economic backgrounds and some of the same emotional and social needs. This
kindred nature of the two audiences being served suggests that science fiction writers with
their science fiction mindset can offer valuable insights into the mindsets of technophile
terror leaders and followers. (Appendix B includes a case study of Aum Shinrikyo, an
apocalyptic terror cult whose leader was a science fiction devotee and who based portions
of his cult’s end-of-days scenario on Isaac Asimov’s classic science fiction trilogy, the
Foundation novels. He successfully recruited dozens of Japanese scientists, technologists,
and graduate students of the sciences to develop doomsday weapons for the cult, which
resulted in the use of a weapon of mass destruction in the Tokyo subway system in 1995.)
4. Science Fiction Writers’ Focus on Rebels, Insurgents, Subversives, and Terrorists
Of value to the customers of the outputs of a “devil’s toy box” analysis, science
fiction writers, seeking to service an audience composed of young men who oftentimes
view themselves as an oppressed, overlooked, certainly unappreciated “secret elite,”

156
frequently focus on insurgents and rebels as their heroes (thus flattering their reading
audiences and providing them with the power fantasies they crave). H. G. Wells may have
begun this trend with his The War of the Worlds, the second half of which centers on the
actions of isolated resisters against a successful invasion of Great Britain by colonizing
Martians and their irresistible war tripods. Popular writers Robert Heinlein, A. E. van Vogt,
Fritz Leiber, and L. Ron Hubbard, during what has been termed the Golden Age of Science
Fiction (1938 to 1946, corresponding with the most innovative period of editor John W.
Campbell Jr.’s helming of Astounding Science-Fiction), often wrote about future
insurgencies against various types of political or religious tyrannies. Emblematic works of
this type during this period include Heinlein’s Sixth Column and Revolt in 2100, van Vogt’s
Slan, The Weapons Shops of Isher, and The Weapon Makers, Leiber’s Gather, Darkness!,
and Hubbard’s Final Blackout.
The sub-genre of science fiction called cyberpunk, popularly launched by William
Gibson’s innovative novel Neuromancer (1984), became the dominant sub-genre within
the field during the 1980s and part of the 1990s and remains popular and influential to the
present day, both in written and filmed forms. Cyberpunk fiction focuses, as the
portmanteau suggests, on both “cyber”—the impact on individuals and their societies of
computer networks, highly advanced information technologies, machine intelligence, and
the fusion of computers/machines with human biology—and “punk”—resistance to
authority, convention, control, and The Establishment. In cyberpunk stories, novels, and
films, hackers are the heroes, and they struggle against oppressive, authoritarian constructs,
either governmental or corporate (or a malign fusion of both). Their struggles, often highly
romanticized, take place in both the physical realm and realms of virtual reality and
cyberspace. The cyberpunk movement within science fiction was praised in some quarters
as having restored a missing element of swagger, avant-gardism, romanticism, fashion
sensibility, and sexiness to science fiction, qualities that, according to some critics, had
been missing in the field’s products since the work of the New Wave cohort of writers in
the 1960s, then a leading part of the counterculture. Writers associated with the cyberpunk
movement include Gibson, Bruce Sterling (the movement’s primary propagandist/writer
of manifestos), Greg Bear, Elizabeth Hand, and Jack Womack. Key early cyberpunk films

157
include Blade Runner (1982, based on Philip K. Dick’s novel Do Androids Dream of
Electric Sheep?) and David Cronenberg’s Videodrome (1982).258 The cyberpunk work that
has arguably enjoyed the greatest mass popularity and cultural impact is The Matrix (1999)
film trilogy, which prominently features the cyberpunk tropes of humanity enslaved by
technology (in this case, literally—intelligent machines have subjected humanity to virtual
reality suspended animation in which individuals unknowingly serve as biological batteries
to power their machine oppressors); a charismatic group of heroes, possessed of otherwise
hidden knowledge (they have taken the Red Pill, which allows them to perceive that what
they thought to be reality is merely virtual reality, the Matrix), serving as the vanguard of
a revolution; a long-prophesized, technocratic messiah (Neo); dynamic conflicts within
cyberspace; and vertiginously shifting, seemingly psychedelic environments. Recent films
and television productions, including a sequel to Blade Runner, Blade Runner 2049 (2017),
which was nominated for five Academy Awards, and a 2018 Netflix series based upon
Richard K. Morgan’s popular 2002 cyberpunk mystery-thriller Altered Carbon, illustrate
the continuing relevance and popular appeal of the sub-genre.259
5. Case Study: Eric Frank Russell’s Wasp
An extraordinary example of the results achievable through the science fiction
mindset is Eric Frank Russell’s novel Wasp, first published in 1957. This astoundingly
prescient work—not predictive of future technologies, but rather of doctrine, strategy, and
tactics—serves as a fictionalized how-to manual for a low-resource, low-personnel
insurgency or terror campaign. Russell’s accomplishment is especially noteworthy because
he wrote Wasp near the beginning of the Algerian War between the Algerian National
Liberation Front (FLN) and France (1954–62), but prior to the Viet Cong’s insurgency
against the government of South Vietnam and its American allies in the 1960s, Palestinian
258 Peter Nicholls, “Cyberpunk,” in The Encyclopedia of Science Fiction, 288–290.
259 “Blade Runner 2049,” BoxOfficeMojo, accessed February 12, 2018, http://www.boxofficemojo.com/movies/?id=bladerunnersequel.htm; Sam Machkovech, “Altered Carbon Somehow Nails the Sci-fi Book-to-TV Landing on Netflix,” ArsTechnica, February 11, 2018, https://arstechnica.com/gaming/2018/02/altered-carbon-somehow-nails-the-sci-fi-book-to-tv-landing-on-netflix/.

158
terror campaigns against Israel beginning in the late 1960s, various leftist and Maoist terror
campaigns in the U.S; and Europe in the late 1960s and 1970s, the Liberation Tigers of
Tamil Eelam’s insurgency in Sri Lanka as of the mid-1970s, leftist insurgencies and terror
campaigns in Latin America in the 1980s, and the current wave of Islamist terror, arguably
begun with the 1979 Iranian Revolution and the subsequent rise of both Hezbollah and an
array of Sunni terror organizations. Russell likely drew upon accounts of the French
Resistance during World War II and the anti-Nazi partisans in Eastern Europe in working
out his fictional terror campaign, but he used his science fiction-trained imagination to
extrapolate new tactics that would allow a single individual with no actual followers to
appear to be the secret leader of an insurgency of hundreds or thousands of operatives.
Best-selling British author Terry Pratchett, in a back-cover blurb for a reprinting of
Russell’s book in 2000, writes, “I’d have given anything to have written Wasp. I can’t
imagine a funnier terrorists’ handbook.”260
The central conceit of the novel is that, like a tiny, half-ounce wasp that flies
through the window of a car loaded with passengers, stings the driver, and causes the
destruction of a two-ton automobile and the deaths of five human beings, each of whom
outweighs the wasp by orders of magnitude, a single secret operative, with tactics that make
him seem far more numerous and powerful than he actually is, can goad the government
and military forces of an entire world into ruinous overreactions and tie down a force of
thousands of police and soldiers. The book’s protagonist is James Mowry, an Earthman
who was born and raised in Masham, capitol city of Diracta, home-world of the Sirian
Combine. Mowry is recruited by the special operations division of the Terran defense
forces, which have been engaged in a long interstellar war with the Sirian Combine. They
want Mowry as their operative because of his Sirian language skills and knowledge of
Sirian culture and his presumed ability, following plastic surgery procedures to make him
appear Sirian, to infiltrate a Sirian planet al. though the Terrans are in some ways
technically superior in their war-making capabilities to the Sirians, the Sirians outnumber
the Terrans by twelve-to-one; the Terran qualitative edge is cancelled out by the Sirian
260 Terry Pratchett, back cover material for Wasp, by Eric Frank Russell (London: Victor Gollancz,
2000).

159
quantitative advantage. The Terran defense forces hope to overcome this stalemate through
a campaign of sabotage, subversion, propaganda, recruitment of local criminals, and what
a present-day reader would recognize as carefully targeted acts of terror. Mowry agrees to
becoming involved, and a stealthy spacecraft inserts him in a backwoods area of Jaimec,
the ninety-fourth planet of the Sirian Combine, along with a large cache of supplies and
equipment, which Mowry hides in a secluded cave. He uses the cave as his base of
operations as he travels between various cities on Jaimec, sowing confusion, misdirection,
targeted murders, and terror.
In several ways, Mowry’s tactics have him acting like a pufferfish, a small,
vulnerable creature that, when threatened by a predator, expands to many times its normal
size, using intimidation—the implication of offensive and defensive capabilities far more
than what it possesses—to make actual physical combat unnecessary. The initial tactic
Mowry deploys is very simple, yet extremely effective in spreading a sense of unease and
apprehension both among Jaimec’s population and its law enforcement cadres. He uses a
machine in his cave hideout to print up hundreds of stickers with slogans that purport to be
messages from an indigenous insurgent group opposed to the Sirian involvement in the war
with Terra and highly dismissive of claimed Sirian successes in the war. These stickers are
designed to be applied to glass surfaces; while affixed to glass, chemicals in the sticker
etch the printed slogan into the glass, making removal of the slogan impossible, short of
replacing the entire pane. Mowry surreptitiously affixes these stickers to phone booths,
restaurant windows, storefronts, and the windows of public facilities. The resulting effects
are twofold: not only does Mowry spread fear that a widespread underground organization
exists that is in opposition to the war, but the fact that owners of buildings and businesses
are unable to remove the slogans from their properties, at least not quickly or easily, spreads
suspicion among the populace and law enforcement that these owners are supporters or
even members of this organization. Mowry’s use of this “sticker campaign” can be viewed
as a precursor of today’s Islamist terrorists’ use of the Internet, in part, to make it appear
that their support, reach, and capabilities are greater, perhaps, than they truly are. On the
Internet, no one knows you’re a dog; equally, no one knows a group of a dozen active
malcontents is not actually a force of hundreds or thousands.

160
Mowry focuses his initial terror campaign on high-ranking officers of the Kaitempi,
the Sirian secret police who are his chief foes. After he manages to insinuate himself with
a mid-ranking Kaitempi, killing him, and stealing his credentials, including a list of fellow
Kaitempi officers, Mowry hires a trio of local criminals and murderers to assassinate a
more prominent Kaitempi officer, not telling his hirelings the identity of the man they are
to kill. Simultaneously, he mails hundreds of threatening notes to other top-ranking
Kaitempi, signed only with the name of his imaginary insurgent organization, Dirac
Angestun Gesept (the Sirian Freedom Party), which personally threatens each of them with
assassination. He also mails copies of the letters to members of the Sirian media and
government so that his terror message will be disseminated even more widely. Mowry
knows that his few hirelings will not succeed in killing more than a handful of Kaitempi
leaders, at most. But he also intuits that this mail-facilitated information-terror campaign
(in our times, much more efficiently carried out through the medium of the Internet) will
cause the Kaitempi to “circle the wagons” and assign a goodly portion of their manpower
to protecting their own leaders, rather than searching for Mowry and his imaginary
followers. He ratchets up this terror campaign by mailing fake but realistic-looking bombs
through the mail to Sirian governmental leaders, each with a message warning that the
phony bomb they just opened could just have easily been a genuine one, and that if two of
the working versions of these bombs were to be brought together in a public square,
hundreds could be killed at once. Mowry operates off the assumption that fake bombs are
more effective for his purposes than genuine bombs; explosive killings of government
officials would be covered up in the media by the security forces but warning of the type
Mowry sends will be spoken of throughout the governmental and security spheres,
spreading terror through personal networks. Taking advantage of only four targeted
murders (the victim of one being an unreliable hireling who had tried squealing to the
Kaitempi), plus claiming credit for killings carried out by the Sirian security forces, Mowry
is able to provoke his foes into declaring restrictive regimes of martial law in Jaimec’s
largest cities and drawing military forces away from the primary campaign against the
Terrans.

161
The climax of Mowry’s “wasp” campaign of terror involves Jaimec’s merchant
fleet, a key piece of Sirian infrastructure that allows for transport of both military and
civilian goods across the primarily ocean-covered planet. Mowry deploys a small fleet of
inexpensive, small, automated sea craft that travel just beneath the surface and randomly
extend periscope-like devices above the waves, thus (to surface observers) appearing to be
enemy submarines. He then infiltrates Jaimec’s largest commercial harbor and attaches a
mine to the side of a merchant ship, timing its explosion to occur when the vessel is out on
the open sea, so that it will appear the ship has been attacked by a submarine. Mowry
reasons that this will result in vast military forces being deployed to hunt enemy
submarines, which are Mowry’s cheap, harmless drones. Similarly, in the present day, one
can envision terrorists provoking huge expenditures of manpower and resources from
America’s or Europe’s homeland security institutions simply by flying a few drones into
the airspace of stadiums packed for championship athletic contests and then bragging on
the Internet that they had done so; the drones need not even be armed to provoke such a
reaction.
Although no evidence exists that I am aware of that the leaders of the Palestinian
Liberation Organization ever read Wasp, the PLO of the late 1960s and early 1970s carried
out a Wasp-like campaign with such near similarities to Mowry’s tactics on Jaimec that
Eric Frank Russell seemingly could have written their operations manual. Just as Mowry
monopolized the attention of Jaimec’s governmental and security leadership by threatening
a key transportation system, so did the PLO gain the world’s headlines by threatening the
viability of commercial aviation with their campaign of hijacking passenger airliners. Just
as Mowry made his imaginary organization seem far, far larger and more consequential
than it truly was through a handful of carefully chosen and targeted assassinations, so did
the PLO succeed in forcing their cause to the center of the international community’s
agenda by assassinating a handful of Israeli athletes at the 1972 Summer Olympics in
Munich, Germany; a few years later, PLO Chairman Yassir Arafat was invited to address
the United Nations General Assembly regarding the Palestinian situation, achieving a
legitimacy few world leaders would have anticipated him and his cause achieving prior to
the massacre at the Olympics. The PLO, however, was (and remains) an actual organization

162
with a leadership structure and cadres of armed operatives. What Russell foresaw with
Wasp was a more advanced terror apparatus—a virtual terror organization consisting of a
single operative, a limited supply of physical assets, and imagined impressions and
expectations of potency spread person-to-person through interpersonal, governmental, and
media networks, a terror organization whose primary weapons are the psychology of fear
and the power of suggestion, rather than capabilities to inflict physical harm and
destruction. The science fiction mindset contributed to Russell’s development of this
concept of a virtual terror organization. A commercial writer seeking to sell his novel in
competition against other commercial science fiction writers, he envisioned a thrilling story
of a highly resourceful and daring individual pitting himself against overwhelming
numbers and daunting odds of survival, both subliminally flattering his readership (male
social pariahs who believed/hoped they possessed unappreciated inherent qualities and
skills the world would someday value) and impressing his acquiring editors with fresh,
inventive takes on both technology (espionage technology, drones, and personal disguise)
and military tactics.
6. The Intersection of the Science Fiction Mindset with Homeland Security: The Career of Jerry E. Pournelle and the Formation of SIGMA, the Science Fiction Think Tank
The career of the late Dr. Jerry E. Pournelle (he passed away due to heart failure in
2017 at the age of 84) exemplifies the fertile intersection, rife with potential, of the science
fiction mindset with the needs of the U.S. military and homeland defense communities. Dr.
Pournelle (he earned a Ph.D. in political science) was a well-known, best-selling science
fiction writer whose first novel, Red Heroin, appeared under a pseudonym in 1969. His
best-known and most-read books are his collaborations with fellow science fiction writer
Larry Niven, including The Mote in God’s Eye (1975), Lucifer’s Hammer (1977), and
Footfall (1986), among others. He also wrote a popular monthly column for the computer
industry magazine Byte, which he continued after the column’s demise as a series of
frequent blog posts on the technology industry, science fiction, and politics. Less well-
known is Pournelle’s lengthy and consequential involvement with the aerospace and
defense industries and with the evolution of strategic concepts that contributed to

163
America’s victory in the Cold War and its global military dominance during the subsequent
two decades. Following service in the U.S. Army during the Korean War, Pournelle took
advantage of the G.I. Bill to acquire several degrees at the University of Washington, after
which he went to work for aerospace giant Boeing. Among his many projects at Boeing
was a study of the heat tolerances of the space suits Boeing’s engineers were fabricating
for NASA and the tolerances of the men who would be wearing them. Regarding this
segment of his career, Pournelle is known to have joked to prolific fellow science fiction
writer Robert Heinlein that at Boeing, Pournelle wrote far more science fiction than
Heinlein ever managed, only his did not require any character development.261
Yet Pournelle’s most influential book, in terms of its impact upon the world’s
military balance of power, written in collaboration with Dr. Stefan T. Possony and Col.
Francis X. Kane, remains virtually unknown outside the small world of military colleges,
the Pentagon’s strategic planning offices, and military contractors. This is The Strategy of
Technology, written between 1968 and 1970, a time when, as Pournelle notes in his Preface
to the book’s 1997 electronic edition, many U.S. strategists and political scientists,
influenced by American setbacks in Vietnam and elsewhere around the world, feared that
the United States was losing the Cold War to the Soviet Union and that our best option
would be to vigorously pursue Henry Kissinger’s preferred path of strategic détente and
make the best situation possible from our gradual retreat and decline. The book was used
as a textbook at the U.S. Service Academies for many years and was also on offer for a
time as a text at the Air War College and National Defense University. The Strategy of
Technology is notable for its recognition of the nature of inexorable technological progress
as seen from a military vantage, as well as its description of how technology could be used
as a decisive force multiplier, allowing for the United States to overcome the Soviet
Union’s advantages of a preponderance of military manpower, armor, aircraft, and other
equipment through a decisive qualitative edge that would allow for strategic surprise. It
laid down the conceptual framework that led the administration of President Ronald
261 Neil Genzlingersept, “Jerry Pournelle, Science Fiction Novelist and Computer Guides, Dies at
84,” New York Times website, September 15, 2017, https://www.nytimes.com/2017/09/15/obituaries/jerry-pournelle-science-fiction-novelist-and-computer-guide-dies-at-84.html.

164
Reagan to pursue the Strategic Defense Initiative, a move that proved a factor in the
bloodless defeat of the Soviet Union in the Cold War. Its influence also helped pave the
way for U.S. development of stealth technology, electronically networked weapons
systems, and the revolution in battlefield command and control systems, all which
contributed to the dramatic U.S. victory in the first Iraq War and to the subsequent two
decades of U.S. military superiority over its geopolitical rivals.262
Later in his career, Pournelle would become a member of SIGMA, the science
fiction think tank founded by science fiction writer and environmental engineer Arlan
Andrews in 1992 to provide the insights of the science fiction community to U.S. defense,
intelligence, and homeland security institutions. In 1992, Andrews, a member of the
American Society of Mechanical Engineers, was serving as a White House Fellow and
staffer in the White House Science Office when he witnessed his boss, Dr. Alan Bromley,
President H. W. Bush’s Science Advisor, suffer humiliating laughter from a room full of
scientists and bureaucrats for mentioning that virtual reality could potentially become an
important aspect of future computer systems. This followed close on the heels of Andrews
witnessing another forward-looking scientist, Dr. Joe Bordogna, the National Science
Foundation’s Deputy Director for Engineering, being made the butt of jokes from his
National Science Foundation colleagues for suggesting that a decade hence,
nanotechnologies and micromachines would become prominent on the scientific horizon.
In response to these experiences, which indicated a crippling lack of imagination within
the federal science establishment, Andrews founded SIGMA, whose membership he
initially limited to science fiction writers with doctorate degrees in science or engineering,
or medical degrees, to not provoke giggles from the federal partners with whom they hoped
to work as pro bono consultants. SIGMA’s founding manifesto summed up Andrews’s
complaints and aspirations: “The Future is too important to be left to the futurists. I have
heard more appropriate and realistic forecasts of technology and the future at any given
science fiction convention than in all the forecasting meetings I have attended here in
Washington, D.C., … (W)e science fiction writers have spent our literary careers exploring
262 Stefan T. Possony, Jerry E. Pournelle, and Francis X. Kane, The Strategy of Technology (self-
published electronic edition, last revised 1997), https://www.jerrypournelle.com/slowchange/Strat.html.

165
the future, we owe it to the rest of humanity to come back and report on what’s out
there.”263
Andrews’s initial recruits for SIGMA included fellow science fiction authors Doug
Beason, who also served as an Air Force Lieutenant Colonel assigned to the President’s
Office of Science and Technology Policy, Dr. Charles Sheffield, Dr. Yoji Kondo (who
wrote SF under the pen name Eric Kotani), Dr. David Brin, Dr. Gregory Benford, Dr.
Stanley Schmidt (then editor of Analog Science Fiction & Fact), Dr. Robert Forward, Dr.
Geoff Landis, and Greg Bear. Although in its early years, SIGMA’s efforts to engage with
the government as a group were rebuffed, individual members managed to brainstorm
educational technology ideas for DARPA, deliver a lecture to a standing-room only
audience at Sandia National Laboratories, and serve as paid consultants; also, Andrews
contributed an endorsement of nanotechnology to the April 1993 edition of The President’s
Report to Congress on Science and Technology (a response, perhaps, to the humiliation he
had seen heaped upon his colleague Dr. Bordogna). The organization’s first formal
interaction with a sector of the federal government occurred in 1999, when the group
offered a day and a half long discussion seminar to the Sandia National Laboratories’
Advanced Concepts Group entitled “Future National Threats.” However, it was not until
nearly eight years later, in May 2007, that the group held its second formal interaction with
the federal government, this time an invitation of six of SIGMA’s members to participate
in the Department of Homeland Security Science & Technology East Coast Stakeholders’
Conference. SIGMA member Dr. Jerry Pournelle chilled the audience by leading them in
a discussion of what sorts of mitigations the government should have ready to roll out in
response to an attack on the United States that left the country’s twenty largest cities
devastated and all communications systems inoperable. Other SIGMA participants offered
DHS S&T officials ideas regarding post-disaster resilient communications and how DHS
might best deploy the cell phone-installed chemical/biological agent detectors that S&T
teams were developing.264
263 Andrews, Sr., “SIGMA: Summing Up Speculation,” 39–40.
264 Ibid., 40–41.

166
SIGMA’s participation in this event led to a flattering interview of SIGMA
members by a reporter from DoD, which opened the gates for other federal agencies to
invite SIGMA members to advise them regarding potential future developments in fields
as diverse as demography, sociology, computer science, politics, communications, and
culture. Clients for SIGMA’s no-cost consultations, lectures, and panel or round-table
discussions have included the U.S. Army’s Tech 2025 Conference (also called the “Mad
Scientist” conference), the North Atlantic Treaty Organization’s NATO 2030 conference,
other conferences sponsored by DHS S&T, the Joint Services Small Arms Program, and
the 2012 Global Competitiveness Forum.265
As of December 2017, SIGMA was comprised of 43 members, including most of
the original nine recruited by Arlan Andrews. Members are no longer required to have a
doctoral degree in science or engineering or a medical degree, although a professional
background in the sciences or engineering is highly valued within the group. Current
members who have achieved notable success in the science fiction field (some of science
fiction’s most popular living authors) include Dr. Catherine Asaro, John Barnes, Greg
Bear, Dr. Gregory Benford, Dr. Ben Bova, Alan Dean Foster, Kathleen Goonan, Joe
Haldeman, Nancy Kress, Dr. Geoffrey A. Landis, Larry Niven, Elizabeth Moon, Dr.
Stanley Schmidt, Bruce Sterling, Steve Sterling, Michael Swanwick, and Walter Jon
Williams.266 According to the SIGMA Forum website:
With sufficient notice, SIGMA can provide a panel of distinguished science fiction authors with real-world expertise ranging over physics, astrophysics, nuclear science, advanced weaponry, engineering, nanotechnology, biomedicine, human factors and a common element of practical futurism. Other members can be recruited as needed; a large pool of potential SIGMAns exists within the professional science fiction community. SIGMA members have each committed to consult with Federal authorities for taskings on vital national issues for several days, for travel and lodging
265 Ibid., 41–43.
266 “SIGMA Members,” SIGMA Forum website, accessed December 22, 2017, http://www.sigmaforum.org/?page_id=117; http://www.sigmaforum.org/?page_id=125; http://www.sigmaforum.org/?page_id=134; http://www.sigmaforum.org/?page_id=140.

167
expenses only. For extended effort or research, compensation may be based on individual contracts, as appropriate.267
Thus, the homeland security enterprise has already benefitted from a Proof of
Concept for the involvement of science fiction writers having professional backgrounds in
science and technology for brainstorming and advisory efforts. The work of SIGMA
collectively and the work of its members independently, prominent among them the late
Dr. Jerry Pournelle, should help break down any remaining resistance on the part of
homeland security professionals to incorporating science fiction writers, with their vital
science fiction mindset, into a “devil’s toy box” analytical venture.
* * * * *
Each of the forecasting methods considered to this point has assumed the
participation of experts as prognosticators; however, not all forecasting methods in use
today operate from the premise of expert participation. Relying upon eighteenth century
economist Adam Smith’s notion of the “invisible hand” that guides markets to the most
efficient outcomes, and the more recent “dumb agent theory” of economics, which states
that intelligent markets arise from the trading decisions of even “dumb,” or relatively
uninformed, traders, forecasting methods such as prediction markets and prediction polls
eschew the notion of the desirability of restricting participation to experts. Going even a
step further, predictive analytics largely pushes human analytical effort to the side, relying
on sophisticated algorithms and computing power to find correlations in massive sets of
seemingly random data to create forecasts. In the following chapter, I will consider whether
any of these techniques may be of use to a “devil’s toy box” analytical effort.
267 Ibid., http://www.sigmaforum.org/?page_id=107.

168
THIS PAGE INTENTIONALLY LEFT BLANK

169
VIII. THE WISDOM OF CROWDS: PREDICTION MARKETS, PREDICTION POLLS, THE WISDOM OF SELECT CROWDS, AND
PREDICTIVE ANALYTICS
A. PREDICTION MARKETS: UNDERLYING THEORIES AND EARLY DEVELOPMENTS
In 1948, British economist Friedrich Hayek published his elaboration on earlier
economist Adam Smith’s notion of the “invisible hand,” the amalgamation of tendencies
that guide unregulated markets in goods and services such that the averaged welfare of all
participants is increased. Hayek called this his Efficient-Market theory, which stipulates
that markets act to aggregate otherwise separate bits of knowledge concerning the
environment within which a market operates and the forces acting upon that market, and
that they do so through the mechanism of prices. The market, by amalgamating vast
amounts of scattered pieces of information, can be collectively far more intelligent than
any of its individual participants are. A little less than half a century earlier, in 1906, the
British statistician Francis Galton made use of an already existing betting game to
demonstrate in striking fashion the existence of the collective intelligence of a crowd of
ordinary persons (non-experts and non-specialists). Approximately 800 persons
participated in a betting game wherein they were asked to guess the weight of an ox; betters
placed their names and best guess of the beast’s weight on a slip of paper, and the person
who came closest to the animal’s actual weight would win a prize. Galton borrowed the
800 slips of paper and averaged all the guesses. This average varied from the ox’s actual
weight by less than one percent.268 Similarly, in 1968, Dr. John Craven of the U.S. Navy’s
Special Projects Division was assigned to head up the search for the Navy’s missing
nuclear submarine, the U.S.S Scorpion. Craven gathered a team composed of submarine
officers, salvage specialists, and scientists, then organized an internal prediction market for
them to participate in. Eventually, the Scorpion was discovered to be resting 220 yards
from where Craven’s team predicted it would be found.269
268 Weigle, Prediction Markets, 5.
269 Ibid., 7.

170
Michael Abramowicz, Professor of Law at George Washington University, is more
in accord with Dr. Craven than with Galton regarding the most appropriate participants in
a prediction market, clearly preferring expert or specialist participants. He describes
prediction markets as
a tool for aggregating the views of people who many have used sophisticated methodologies, such as the tools of econometrics, to make individual estimates. Prediction markets provide financial incentives for the best-situated individuals to apply the best available tools to predictive problems, and to test the depth of conviction of those who have done detailed analyses themselves, as well as those who have studied the work and reputations of such expert analysts. Thus, they can effectively identify a consensus position.270
In 1988, researchers at the University of Iowa obtained a legal exemption from
federal and state laws banning gambling to set up the Iowa Electronic Markets, a pioneering
attempt to appropriate market principles for a futures market to predict elections outcomes.
The Iowa Electronic Markets offer contracts regarding federal elections, selected state and
foreign country elections, and various types of economic events, such as decisions made
by the Federal Reserve Open Market Committee. Although the researchers’ agreement
with the Commodities Futures Trading Commission limited accounts to $500 and only
allows academics to participate in buying and selling futures contracts regarding economic
events, members of the public have been allowed to participate in the elections markets.
Trade prices must fall within a range of $0.00 to $1.00 and reflect predicted probabilities
between 0% and 100% (for example, a trade valued at $.45 means that the trader has a 45%
confidence level/expectation that a candidate will win the election). The elections markets
have performed as well as or slightly better than averages taken of major national elections
polls, with error rates tending to fall between 1.37% and 3.44%.271
Inspired by the success of the Iowa Electronic Markets, Robin Hanson, an early
Silicon Valley researcher into artificial intelligence and the design of the World Wide Web,
270 Michael Abramowicz, “The Politics of Prediction,” Innovations: Technology, Governance &
Globalization 2 (Summer 2007): 90.
271 Ibid., 11–12.

171
originated the concept of “idea futures,” wherein market principles could be harnessed to
predict a wide range of political, social, and technological outcomes. Working with Mark
James and Sean Morgan, Hanson developed the Foresight Exchange in 1994, the world’s
first web-based betting market, which elided U.S. anti-gambling laws by using play money
(which could be exchanged for prizes) rather than real money.272
B. PREDICTION MARKETS: DARPA’S POLICY ANALYSIS MARKET
Michael Foster, program manager for the quantum computing research program
sponsored by the National Science Foundation, learned of Hanson’s “idea futures”
experiments and the work of the Iowa Electronic Markets and convinced colleagues at
DARPA that their agency should fund research into how prediction markets could
potentially be used to guide public policy decision-making.273 DARPA viewed the “dumb
agent theory” (markets are collectively “smart” even when their participants may be
individually “dumb”) regarding markets’ powers to uncover previously hidden information
as a possible solution to the counterproductive siloing of vital information, within the
various agencies of America’s intelligence community. Many observers had suggested that
siloing of information in the months leading up to the 9/11terror attacks had abetted the
terrorists’ movements in and out of the United States. DARPA’s managers believed a
prediction market could serve as an aggregation mechanism capable of bypassing
bureaucratic and political obstacles to information sharing.274 In May 2001, DARPA
requested proposals under the project heading “Electronic Market-Based Decision
Support.” DARPA awarded two companies, Neoteric Technologies and Net Exchange, the
initial two small business independent research grants. Robin Hanson, then a professor at
George Mason University in Virginia, was subcontracted to perform research work as a
system architect for Net Exchange, whose project came to be known as the “Policy
Analysis Market,” or PAM.275 Hanson describes the goals of the Policy Analysis Market
272 Hanson, “The Policy Analysis Market: A Thwarted Experiment,” 76.
273 Ibid., 75.
274 Looney, “DARPA’s Policy Analysis Market,” 411.
275 Hanson, “The Policy Analysis Market:A Thwarted Experiment,” 75.

172
as having been “to forecast military and political instability around the world, how U.S.
policies would affect such instability, and how such instability would influence U.S; and
global aggregates of interest, such as growth rates or oil prices.”276 When PAM’s designers
discovered the high prices that The Economist Magazine’s Economists Intelligence Unit
would charge Net Exchange to determine what levels of instability actually developed in
each nation of interest, the designers economized by focusing their attention exclusively
on eight key nations of the Middle East.277 The eight nations selected for analysis were
Turkey, Syria, Israel, Saudi Arabia, Iraq, Iran, Jordan, and Egypt.278
The initial test period was scheduled to extend for two years. Every three months,
participants would engage in trading activities to determine prices (probabilities) regarding
five parameters for each of the eight nations, to include U.S. financial involvement in each,
U.S. military activity in each, that nation’s economic growth, level of political instability,
and its own military’s activities. In addition, traders would predict expected values for
economic indicators such as world trade and U.S. Gross Domestic Product (GDP) and
security indicators such as aggregate Western casualties from terror events and total U.S.
military casualties. Participants would also be permitted to trade futures on future events
occurring within the eight nations of interest, and buyers and sellers would be allowed to
exchange money placed on bundled, contingent predictions, what Hanson terms
combinatorial market trades. Net Exchange’s original plan for PAM was to run the
prediction market with a pool of participants drawn from the full range of federal
intelligence agencies, with “winnings,” rather than being granted directly to traders, instead
being distributed to fund those winning traders’ agencies’ research projects; however,
federal laws erected too many barriers against conditional transfers of funds between
federal agencies. That idea was dropped, and Net Exchange attempted to recruit a single
large agency whose analysts could serve as traders. They found no takers, and so they were
forced into the fallback position of running a market open to the public, being able to do
276 Ibid., 77.
277 Ibid.
278 Looney, “DARPA’s Policy Analysis Market,” 407.

173
so because serving as agents of the Department of Defense shielded the company from
anti-gambling laws. The designers laid out a schedule wherein PAM would begin test
operations with a hundred test traders on September 1, 2003, each tester being given $100
with which to trade. Full operations were scheduled to begin on January 1, 2004 with a
thousand initial traders. This was actually a nominal schedule, since Congress had earlier
introduced significant financial uncertainty by cancelling all current funding for DARPA’s
Information Awareness Office (IAO), under which the Policy Analysis Market operated,
due to political concerns with privacy issues regarding another of IAO’s projects, the Total
Information Awareness project (formerly called the Terrorism Information Awareness
project).279
Regarding the fate of the Policy Analysis Market and the overarching FutureMAP
project (Future Markets Applied to Prediction, the renamed Electronic Market-Based
Decision Support project), worse was soon to come. In the midst of the overheated political
environment caused by the debate over the 2003 invasion of Iraq and the justifications for
the invasion provided by the George W. Bush administration, Democratic Senators Byron
Dorgan and Ron Wyden held a joint press conference on July 28, 2003 to denounce
DARPA’s FutureMAP project as a “terror market” that would allow members of the public
to bet on the likelihood of terror attacks.280 To bolster this assertion, the senators referred
to one of the DARPA webpages, which explained how the Policy Analysis Market worked.
This page listed various miscellaneous events whose probabilities participants would be
able to make trades against; these events included the king of Jordan being deposed or
overthrown, a North Korean missile strike, and whether Palestinian Authority Chairman
Yassir Arafat would be assassinated within a timeframe. The senators strove to make the
FutureMAP project appear more “Strangelove-ian” by highlighting the fact that former
Admiral John Poindexter, a Reagan Administration figure infamously connected with the
Iran-Contra scandal of the 1980s, had been appointed supervisor of the project. Dorgan and
Wyden had chosen to present their press conference at a time when DARPA’s public
279 Hanson, “The Policy Analysis Market: A Thwarted Experiment,” 77–79.
280 Ibid., 79.

174
relations manager was out of the office and unreachable, thus depriving that agency of a
chance to offer a timely and informed response to the senators’ allegations.281 The highly
emotional tone of their press release is epitomized by this quote: “Spending millions of
dollars on some kind of fantasy league terror game is absurd and, frankly, ought to make
every American angry. What on Earth were they thinking?”282
The following day, approximately fifty negative articles appeared in the Nation’s
press regarding FutureMAP. The Washington Post declared that the project reflected the
Bush Administration’s extreme, “near religious” belief in the applicability of market-based
solutions to all problems and chided the administration for seeking a dubious short-cut to
knowledge that could only be gained through painstaking intelligence work. Joseph
Stiglitz, a Nobel Prize-winning economist, in an editorial written for the Los Angeles
Times ridiculed the notion that an operation such as the Policy Analysis Market could
successfully unearth information regarding terrorist activity that had not earlier come to
the attention of the CIA or FBI. He also stated that anonymous markets would be subject
to manipulation by malign parties, and non-anonymous markets would fail to attract
participants holding the desired information. On July 29, 2003, the day after Dorgan’s and
Wyden’s press conference, Deputy Secretary of Defense Paul Wolfowitz announced to the
Senate Foreign Relations Committee that the FutureMAP program had been terminated.
This decision had been made without any input being solicited from the Policy Analysis
Market project team regarding the truth of the allegations and whether the project could be
adjusted to make it more politically palatable.283
Hanson has pointed out that, based upon his analysis of approximately 500 articles
written about FutureMAP and/or the Policy Analysis Market, those written by more
281 Robin Hanson, The Informed Press Favored the Policy Analysis Market (Fairfax, VA: Department
of Economics, George Mason University, August 8, 2005), 2, http://mason.gmu.edu/~rhanson/PAMpress.pdf.
282 Senators Ron Wyden and Byron Dorgan, “Wyden, Dorgan Call for Immediate Halt to Tax-Funded ‘Terror Market’ Scheme,” (press release, Washington, DC: Offices of Senators Ron Wyden and Byron Dorgan, July 28, 2003), http://wyden.senate.gov/media/2003/print/print_07282003_terrormarket.html.
283 Hanson, “The Policy Analysis Market: A Thwarted Experiment,” 79–82.
175
informed analysts, who took time to contemplate the economic theories the program was
based upon and to accurately describe the program’s intended purposes, tended to be more
favorable to the program than those writers who reacted from a less-informed stance.284
As an illustration of this, Charles Seife, a writer for Science, wrote admiringly in an August
3, 2003 article that the designers of FutureMAP had attempted to “essentially creat[e] a
social-science supercomputer out of flesh rather than silicon.”285 Yet the damage had
already been done.
C. PREDICTION MARKETS AND PREDICTION POLLS: THE GOOD JUDGMENT PROJECT
However, the potential promise of prediction markets for improving intelligence
forecasts of significant world events proved too alluring for the subject to be permanently
consigned to the garbage heap of failed governmental initiatives. Beginning in 2011, the
Aggregative Contingent Estimation (ACE) program of IARPA, the Intelligence Advanced
Research Projects Activity, sponsored a four-year-long forecasting tournament that sought
to substitute numerical estimates of probability for the vague, qualitative estimates that had
predominated in intelligence estimates to that point. Slippery words such as “May”
“could,” “might,” and “maybe” had been found to imply vastly different levels of
probability when expressed by different intelligence analysts; studies had shown that such
hedging words could indicate an implied probability of occurrence as low as 0.08 for some
forecasters and as high as a 0.59 probability of occurrence to other forecasters, a range of
variations that rendered the hedging words typically found in intelligence estimates
essentially meaningless. Within the constraints of such qualitatively-based estimates,
individual intelligence analysts could not be scored on their accuracy, for the definition of
accuracy was elastic, due to the elasticity of the hedging words upon which the forecasts
were based (“I only said that the U.S. sending arms to the Ukrainians might provoke a
hostile Russian response to the U.S., not that it would”). Since analysts could not be scored
284 Hanson, The Informed Press Favored the Policy Analysis Market, 14.
285 Charles Seife, “´Terrorism Futures’ Could Have a Future, Experts Say,” Science, August 8, 2003, 749.

176
or ranked on accuracy, any efforts to train them for improved accuracy would be futile, due
to the inability to measure improvements (or any change) in their performance over time,
rendering feedback impossible.286
The IARPA forecasting tournament, originally encompassing five teams, each from
a different university, sought to elicit quantitative probability predictions for a wide range
of sociopolitical, military, and economic events that were resolvable—which would either
occur or not occur within a stipulated time. Forecasters’ accuracy was measured using Brier
scores, wherein events that occur are coded as 1 and events that do not occur are coded as
0, and the Brier score is calculated as the sum of squared errors between what occurs and
the probability forecast. To provide an example, a participant might predict a 70% chance
that the fourth quarter growth rate in U.S. gross domestic product (GDP) would be 3.0%
or higher (and accordingly, the chance that the growth rate would be less than 3.0% would
be predicted as 30%). Actual GDP growth rate is later seen to be only 2.5%. This
participant’s Brier score would be calculated as (0.7–0)2 + (0.3–1)2 = 0.833. The best
possible Brier score is 0, representing perfect forecasting ability, and the worst possible
score is 2, representing complete failure at forecasting. Had the participant predicted the
reverse set of probabilities, that there was only a 30% chance of GDP growth hitting or
exceeding 3% and a 70% chance that growth would fall short of 3%, the Brier score would
be calculated as (0.3–0)2 + (0.7–1)2 = .18. This would represent a large improvement in the
Brier score, and, more importantly, a measurable improvement that would allow for
individual accountability and learning.287
Only one of the five university teams, dubbed the Good Judgment Project,
continued beyond the end of the second year of the tournament; its members’ accuracy
proved so superior to that of the members of the other four teams that the managers of
IARPA’s Aggregative Contingent Estimation project deemed it unnecessary for the other
four teams to continue their participation. During the first three years of the tournament,
286 Philip E. Tetlock, Barbara A. Mellers, and J. Peter Scoblic, “Bringing Probability Judgments in
Policy Debates Via Forecasting Tournaments,” Science 355 (February 3, 2017), 481, doi: 10.1126/science.aal3147.
287 Ibid.

177
encompassing predictions of future events that could be determined to have actualized or
not by the end of the fourth year of the study, the Aggregative Contingent Estimation
project presented the Good Judgment Project participants with 344 different forecasting
questions, which were responded to by 2,860 GJP respondents, for a total of 494,552
forecasts. Good Judgement Project facilitators recruited their 2,860 participants through
science blogs, research centers, professional societies, alumni associations, and through
word-of-mouth referrals. Participants received minimal financial compensation. For those
who lasted at least one full year of the competition and submitted at least 25 forecasts, the
facilitators provided $150; for those who made it through years 2 and 3 and who continued
providing at least 25 forecasts per year, payments of $250 were provided at the end of each
of those years. Participants could also collect $100 bonuses for continuing from one year’s
efforts to the next. Researchers observed that participants tended to devote at least two
hours per week on research to support their forecasts while engaged in the tournament,
while some devoted more than ten hours per week to research. Prior to making their initial
forecasts, participants engaged in two hours of psychological testing and training on
compensating for biases in forecasting. This training focused upon various techniques
through which individual forecasters could benefit from “the wisdom of the crowd” (their
fellow team members); suggested use of statistical methods for amalgamating forecasts;
overviews of the relative frequencies of events actualizing that were similar to those that
would be forecast; and instruction regarding the dangers of forecasting overconfidence, on
the one hand, and an excess of caution, on the other.288
During the second and third years of the forecasting tournament, the facilitators of
the Good Judgment Project randomly assigned their forecasters to participate in either
prediction markets or prediction polls (also called competitive forecasting), to allow for
comparisons to be made regarding the benefits to be derived from each method. Prior
laboratory experiments, far smaller in scale than the Good Judgment Project, had indicated
288 Don A. Moore, Samuel A. Swift, Angela Minster, Barbara Mellers, Lyle Ungar, Philip Tetlock,
Heather H. J. Yang, and Elizabeth R. Tenney, “Confidence Calibration in a Multiyear Geopolitical Forecasting Competition,” Management Science, Articles in Advance (August 22, 2016): 2–4, https://doi.org/10.1287/mnsc.2016.2525.

178
that the two methods achieved approximately equal levels of forecasting accuracy. During
the two years covered in this phase of the Aggregative Contingent Estimation project, the
facilitators chose a continuous double auction design for their prediction market, wherein
traders who place bids, or buy orders, are matched with traders who place sell orders;
trades, which set prices for contracts, take place when the highest buying price on offer is
equal to or higher than the lowest selling price. No actual money exchanged hands during
this part of the ACE study; simulated currency was used, instead. Prediction polls differ
from election polls or policy preference polls in that participants offer a numerical
probabilistic likelihood forecast of an event occurring, in lieu of informing a pollster of
how they intend to vote in an upcoming election or whether they agree or disagree with a
policy prescription. In the prediction polls used in this study, forecasters could update their
forecasts as often as they wished, forecasters were given feedback on their performance
using the Brier scoring system I earlier described, and the forecasters were placed in a state
of competition with one another regarding accuracy. The Good Judgment Project utilized
two forms of prediction polls: polls of individuals, wherein all the participants competed
individually against one another, and team poll competitions, wherein teams of
approximately 15 members were encouraged to pool their information, discuss competing
rationales for differing forecasts, and offer social encouragement to one another. For the
team polls competitions, each team’s numerical probabilistic forecast was devised as the
mean of the team members’ individual forecasts. The Good Judgment Project facilitators
refined these mean forecasts through two methods: exponential discounting, wherein more
recent forecasts are given heavier weighting than older forecasts, and through granting
heavier weighting to those forecasts by participants whose prior forecasting records had
shown them to be more accurate than the mean.289 The researchers determined that
individual participants’ forecasting skill level could be established through their
participation in a “seeding poll” of 20–25 questions.290 In both the prediction market and
289 Pavel Atanasov, Phillip Rescober, Eric Stone, Samuel A. Swift, Emile Servan-Schreiber, Philip
Tetlock, Lyle Ungar, and Barbara Mellers, “Distilling the Wisdom of Crowds: Prediction Markets vs. Prediction Polls,” Management Science 63, no. 3 (March 2017): 693–695, https://doi.org/10.1287/mnsc.2015.2374.
290 Ibid., 704.

179
the two types of prediction polls, participants, while mostly of advanced educational
background (having at least a bachelor’s degree) and at least somewhat informed on the
subjects for which they were entering forecasts, could not be considered subject matter
experts, mainly due to the great range of differing subjects and specialties (economics,
geopolitics, national and local politics, military campaigns, and social developments)
covered by the questions posed by IARPA.291
The results seen by the Good Judgment Project were as follows. Regarding
accuracy, simple mean results of the team prediction polls outperformed the results of
prediction markets, which in turn outperformed simple mean results of the individual
prediction polls. Furthermore, when the researchers refined the amalgamation algorithm
using increased weightings for the most recent predictions, increased weightings for
forecasts offered by participants with the best prior records of forecasting accuracy, and
recalibration to account for excess caution of forecasts (under confidence), the team
prediction polls outperformed prediction markets by significant margins, and the
independent prediction polls mostly tied for accuracy with the prediction markets.
Regarding the correlation of participants’ self-confidence levels with their accuracy, the
researchers found that prediction markets reflect systematic under confidence, like
prediction polls when results are aggregated; prediction poll results at the individual, non-
aggregated level were seen to be slightly overconfident. The researchers hypothesize that
the lesser accuracy seen by participants in prediction markets versus prediction polls may
have been due to the former’s lack of a sophisticated, strategic knowledge of the workings
of markets and how to best prevail in such a setting. The researchers also speculate that
team prediction polls offer superior inducements to share information among participants
than do prediction markets; in the latter environment, the competition is viewed by
participants as a zero-sum game, wherein one trader loses when another gains, whereas in
the former environment, improvements spread among some or all team members result in
an improved result for the team overall. Team prediction polls offer a bit of “the best of
both worlds”—intra-team cooperation, pooling of information, and social encouragement,
291 Ibid., 693.

180
combined with inter-team competition. Finally, the researchers point out that the advantage
offered by a team prediction poll over a prediction market is especially large when the
number of available participants is relatively small, as markets can suffer from “thin market
syndrome,” or an inability to set prices, when the number of traders is so low that not all
possible trades accrue a willing buyer and seller.292 Impressively, the most accurate results
achieved by the Good Judgment Project outperformed, by about a 30% margin, a prediction
market whose participants were all subject matter experts in their fields, intelligence
analysts drawn from across the U.S. intelligence community who had access to classified
information, whereas the Good Judgment Project participants did not.293
D. THE WISDOM OF SELECT CROWDS
Albert E. Mannes, Jack B. Soll, and Richard P. Larrick have suggested an
alternative to prediction markets and prediction polls, what they have termed the select-
crowd strategy. In a select-crowd forecasting procedure, participants are ranked in terms
of forecasting ability using an available indicator of ability (such as performance on recent
forecasts), and the group’s amalgamated output is the average of the inputs of the top five
ranked participants. The researchers contrast the select-crowd strategy with what they call
the whole-crowd strategy (the averaged or otherwise amalgamated opinions of all the
members of a crowd, such as in a prediction poll) and with what they term the best-member
strategy (participants on a forecasting team or panel select the opinion of the single member
they collectively judge to be the best or most accurate as the group’s consensus opinion;
the basis of the group’s selection of their best-member representative may be that person’s
credentials, status in an organization, or expressed confidence). They point out that in
varying types of environments, one of these three strategies will lead to the best or most
accurate outputs. For example, in an environment in which participants’ forecasting
abilities vary widely and unambiguous indicators of those abilities are readily available,
the best-member strategy tends to perform the best. Contrarily, in an environment
292 Ibid., 703–704.
293 Tetlock et al., “Bringing Probability Judgments in Policy Debates Via Forecasting Tournaments,” 482.

181
distinguished by small differences in forecasting ability and frequent bracketing (i.e.:
participants’ forecasting errors show an approximately equal likelihood of being either
above or below the true value by approximately equal amounts), the whole-crowd strategy
is preferable. The difficulty in selecting the appropriate procedure comes in determining
what type of environment applies in each situation. Given this indeterminacy of
environments, the researchers indicate that the select-crowd strategy is the most robust,
due to the fact that in two types of environments (a low bracketing/low dispersion in
expertise environment and a high bracketing/high dispersion in expertise environment), the
select-crowd strategy is optimal, and in the other two types of environments (a low
bracketing/high dispersion in expertise environment and a high bracketing/low dispersion
in expertise environment), the select-crowd strategy is second best out of three strategies
that might be chosen.294
As part of their experiments, Mannes et al. tested varying numbers of most highly
ranked participants to serve as part of their select-crowd strategy. They found that,
depending on the type of environment, select crowds varying in size between three and
eight in number could be optimal, but that in situations where the type of environment is
unknown, selecting five high-ranking judges serves as a “best compromise” optimal
number. They found that only short histories of prior forecasting performance (one to five
prior forecasts, with the higher number being preferred for environments of high dispersion
of levels of expertise) are required to productively rank participants by ability. This is due
to their findings that in a situation of high dispersion of expertise, minimal testing is all
that is required to differentiate between participants, whereas in a situation of low
dispersion of expertise, when all participants are approximately equal in their ability, no
amount of testing would reveal significant differences.295
The authors illustrate that in previous research regarding how acceptable/plausible
various types of judgment aggregation are to recipients of the aggregated judgments, the
294 Albert E. Mannes, Jack B. Soll, and Richard P. Larrick, “The Wisdom of Select Crowds,” Journal
of Personality and Social Psychology 107, no. 2 (2014): 277–279, doi: 10.1037/a0036677.
295 Ibid., 281–286.

182
best-member strategy was consistently shown to have the highest popular appeal and
acceptance, whereas the whole-crowd strategy rated considerably lower, due to the typical
person’s suspicion that averaging all responses, those provided by experts and non-experts
alike, counterproductively dilutes the input provided by experts and results in a less
accurate amalgamated output. Mannes et al. performed a trio of experiments that indicated
that observers find the select-crowd strategy to have strong appeal when compared to the
other two strategies, since it allows them to combine their instinctive, intuitive preference
for a best-member strategy with an effective hedge against the possibility that they have
improperly chosen the best-skilled participant (based on available social cues such as
credentials or status in a group). The authors point out that the primary significance of the
high acceptability/plausibility of the select-crowd strategy is to be found in the reactions
of upper management to forecasting reports conducted by lower-level staffers. If bosses
tend to be dismissive of forecasts based on the whole-crowd strategy, and the best-member
strategy is only optimal in one of four environment types, then the select-crowd strategy
combines the best of all possible worlds—acceptance from higher management and highest
or second-best accuracy of the three possible strategies in virtually any environment.296
Most interestingly in the context of this thesis’s overview of the development and
evolution of forecasting techniques over the past seventy years, the select-crowd strategy
presented by Mannes et al. as a refinement of the prediction poll technique has, in some
ways, circled back to the early roots of forecasting as a field of academic study and
corporate/governmental use. This refinement of “the wisdom of the crowd” philosophy, a
philosophy that initially disregarded the input of selected experts in favor of the
amalgamation of widely dispersed bits of knowledge held by non-experts, looks a good bit
like a Delphi panel.
E. PREDICTION MARKETS AND PREDICTION POLLS: SUGGESTED BEST PRACTICES
Training: Philip Tetlock, author of Superforecasting: The Art and Science of
Prediction, and his fellow researchers with the Good Judgment Project have expressed
296 Ibid., 286–292.

183
gratified surprise at the longevity of the beneficial effects of the initial, brief training
sessions they provided for participants. These trainings’ subject matter included reducing
overconfidence in predictions, avoiding common cognitive biases, and using Bayesian
statistical methods to refine or change their forecasts over time as new information
becomes available. They found that the benefits of the training regarding avoiding the
pitfalls of overconfidence, stuck with the participants throughout entire forecasting years.
They hypothesize that the regular feedback on performance that participants were given
helped to “cement” in their minds what they had learned from their training.297
Additionally, the researchers found that training in group dynamics was helpful for those
participants assigned to work on team prediction polls, specifically training in how to
question one another’s assumptions and reasoning in a clear, logical, non-emotional
fashion—i.e.: “how to disagree without being disagreeable.”298 They compared the
benefits of scenario training (teaching participants to envision a broad range of possible
futures, how to use decision trees, and how to avoid biases in forecasting such as fabricating
incoherent scenarios, overpredicting patterns of change, or assigning probabilities that
exceed a sum of 100% to a range of mutually exclusive and comprehensive outcomes) with
those of probability training (the use of Bayesian statistical methods as mentioned above).
The researchers found that the benefits of probability training outweighed those of scenario
training, but the provision of scenario training resulted in higher levels of forecasting
accuracy by its recipients than the accuracy shown by participants who received no training
at all.299
Prior to Tetlock et al.’s work on the Good Judgment Project, George Wright and a
team of researchers in the United Kingdom conducted a study on the connections between
forecasters’ self-estimated level of expertise, their understanding of the workings of
297 Moore et al., “Confidence Calibration in a Multiyear Geopolitical Forecasting Competition,” 10.
298 Tetlock et al., “Bringing Probability Judgments in Policy Debates Via Forecasting Tournaments,” 482.
299 Barbara Mellers, Lyle Ungar, Jonathan Baron, Jaime Ramos, Burcu Gurcay, Katrina Fincher, Sydney E. Scott, Don Moore, Pavel Atanasov, Samuel A. Swift, Terry Murray, Eric Stone, and Philip E. Tetlock, “Psychological Strategies for Winning a Geopolitical Forecasting Tournament,” Psychological Science 25, no. 5 (March 2014): 1107–1109, doi: 10.1177/0956797614524255.

184
probability estimations, and their calibration/accuracy in their forecasts. Although their
experiment showed only a weak correlation between forecasters’ coherence (their
knowledge of and ability to apply mathematical probability axioms) and their accuracy on
forecasting tasks, the researchers recommended that providing training in the laws of
probability to forecasters prior to their making their predictions would likely provide some
improvement to their performance, for those forecasting tasks involving compound
probabilities (the probability of both A and B occurring) or contingent probabilities (the
probability of A occurring once B has already occurred, or the probability of A occurring
once B has not occurred).300
Teaming and Stratifying: During the first year of the IARPA forecasting
tournament, the Good Judgment Project researchers found that having participants work
collaboratively, on team prediction polls, resulted in more accurate forecasts than having
the participants work separately. During the second year of the tournament, the researchers
discovered that forecasting accuracy could be boosted even further by grouping the best
forecasters, those whom the researchers dubbed “superforecasters,” together on the same
team. The elite super forecaster teams far out-performed all the other groupings, as well as
individual forecasters and prediction markets. From these results, they postulated that
forecasting is a learned skill and that the learning of this skill is accelerated when the very
best performers are directed to collaborate with one another.301
Selection of Forecasters for Cognitive Style and Abilities: Researchers found that
those participants whom they classified as superforecasters scored at least one standard
deviation higher on measures of fluid intelligence than the general population; these
measures included the Cognitive Reflection Test, the Shipley-2 Abstraction Test, and the
Raven’s Advanced Progressive Matrices. Superforecasters also scored higher than the
300 George Wright, Gene Rowe, Fergus Bolger, and John Gammack, “Coherence, Calibration, and
Expertise in Judgmental Probability Forecasting,” Organizational Behavior and Human Decision Processes 57 (1994): 22–23.
301 Barbara Mellers, Eric Stone, Terry Murray, Angela Minster, Nick Rohrbaugh, Michael Bishop, Eva Chen, Joshua Baker, Yuan Hou, Michael Horowitz, Lyle Ungar, and Philip Tetlock, “Identifying and Cultivating Superforecasters as a Method of Improving Probabilistic Predictions,” Perspectives on Psychological Science 10, no. 3 (2015): 269, doi: 10.1177/1745691615577794.
185
general population on tests of knowledge of both domestic and foreign political affairs, as
well as on the Shipley-2 Vocabulary Test. Researchers found that superforecasters scored
high on measures of competitiveness and displayed high levels of desire for intellectual
challenges. Their enjoyment of the problem-solving process was reflected by their high
scores on the Need for Cognition scale. The researchers stress that one of their most
important findings regarding the cognitive style of superforecasters was a high level of
open-mindedness, a willingness to change one’s views in response to fresh information and
reasoned arguments from peers.302 The superforecasters tended to be more likely than the
general population to hold to a secular, science-centered worldview, to “treat their beliefs
more as testable hypotheses and less as sacred possessions—and to be warier of
overinterpreting coincidences by attributing them to supernatural mechanisms such as
fate.”303 Superforecasters put more emphasis on the value of deliberate practice for
improvement of forecasting accuracy than did their less-accomplished peers. Within the
milieu of the team prediction polls, they updated their forecasts more frequently than any
other cohort of participants, and this frequency of belief-updating was determined by
researchers to be the strongest correlator of accuracy. Finally, within the context of intra-
group interactions, the researchers found that superforecasters were more willing than
others to dig into the knowledge and opinions of their teammates, asking more questions
of them, on average, than did the less accomplished participants.304
Selection of Forecasters for Diversity of Opinion, Background, and Knowledge:
The Wisdom of Crowds author James Surowiecki emphasizes that one of the requirements
for a crowd to be collectively smart is that it be diverse, containing a diversity of opinions,
backgrounds, and localized or specialized knowledge. He states that, on average, better
decisions will be made by a cognitively diverse crowd than by two or three very intelligent
experts. He supports this by pointing out that expertise tends to be very narrow, whereas
complex decisions are broad in their contributive factors; expertise in one area is rarely
302 Ibid., 273.
303 Ibid.
304 Ibid., 277.

186
transferrable to another area (expertise is not fungible); studies have shown that experts’
forecasts are neither internally consistent (regarding different forecasts made by the same
expert forecaster) nor consistent across a given area of expertise (experts within the same
field often disagree, even on very technical matters relating to their field); and expert
forecasters working independently have an overall poor record of accuracy.305
Weighting Forecasters’ Contributions by Their Self-Estimated Levels of
Expertise and Confidence: Mannes et al., in their research regarding the select-crowd
strategy, examined the validity of various alternative cues to forecasting expertise, other
than the results of past performance on forecasting tasks. They found that participants’ self-
evaluations of confidence could serve as a valid and reliable alternative judgment factor
for facilitators to use in selecting the five preferred participants from a crowd, then
averaging those five participants’ inputs as the group’s output. Based on their experiments,
they found that selecting five participants based on those participants’ self-evaluations of
confidence resulted in group average forecasting outputs about as accurate as those derived
from a select-crowd made up of participants chosen by facilitators based on five past
forecasts. They suggest that using self-evaluated confidence as an alternative selection cue
is especially appropriate in situations where the forecasting task involves an unprecedented
or unique event, such as the anticipated remaining tenure for a foreign dictator.306 Clearly,
this latter stipulation applies in the instance of a “devil’s toy box” analysis, which, by its
nature, attempts to forecast unprecedented and mostly unique events involving
technological innovations.
George Wright and his team of researchers in the United Kingdom conducted an
experiment that indicated that forecasters’ levels of self-reported expertise prove to be a
reliable predictor of subsequent accuracy on forecasting tasks. They recruited 35 students
attending Bristol Polytechnic to complete a forecasting questionnaire that encompassed
272 statements regarding the upcoming World Snooker Championships. The questionnaire
items were all expressed in binary answer form (Yes/No; Will/Will Not). Slightly less than
305 Surowiecki, The Wisdom of Crowds, 31–33.
306 Mannes et al., “The Wisdom of Select Crowds,” 295.

187
half of the questions were conditional, questions about players’ predicted performances
that were contingent upon other players’ prior accomplishments. Before they answered any
questions, participants were asked to rate, on a 7–point scale (with “1” indicating very
knowledgeable and “7” indicating no knowledge whatsoever), their level of prior
knowledge, or expertise, regarding the game of snooker. The participants were also
directed to rate each individual question regarding how difficult to answer they perceived
that question to be, also on a 7–point scale (with “1” indicating extremely easy and “7”
indicating extremely difficult). The researchers found that the participants who rated
themselves as being more expert proved to be less overconfident, better calibrated, and
likely to achieve higher accuracy scores than those participants who self-rated as less
expert.307 They contrast their finding of a strong correlation between self-rated expertise
and subsequent forecasting performance with findings of earlier studies that found no
correlation between socially-defined expertise (the aura of expertise granted an individual
due to their position within an organization, their educational background, membership in
professional associations, or other social factors) and forecasting performance.308 The
implication of their research for a “devil’s toy box” analysis is that expert participants will
need to be selected more for self-reported expertise than for paper credentials, or that the
responses of those participants who rate themselves as more knowledgeable and more
confident about the subject matter of a question should somehow be weighted more heavily
than those respondents who rate themselves as less knowledgeable and confident, when the
results for that question are amalgamated.
Optimal Number of Forecasters for a Prediction Pool: Ville A. Satopää and his
fellow researchers, performing a study connected with IARPA’s forecasting tournament,
found that although aggregated accuracy of forecasts showed continual improvement as
the number of forecasts aggregated increased, the majority of the improvement in accuracy
occurred as the number of forecasters increased from 10 to 20, with the bulk of
improvement having been obtained when the number of forecasters reached 20, and only
307 Wright et al., “Coherence, Calibration, and Expertise in Judgmental Probability Forecasting,” 8–
10.
308 Ibid., 21.

188
small increases in accuracy seen as more forecasters were added. Additional moderate
improvements tapered off significantly after the number of forecasters reached 40.309
Accountability: David R. Mandel and Alan Barnes, in their study of the accuracy
of 1,514 forecasts provided by the Socio-Cognitive Systems Section of the Defense
Research and Development Canada agency, hone in on the importance of a sense of
personal accountability to improving individual forecasters’ accuracy. They point out that
a sense of the social, organizational, and personal/professional costs of getting an important
forecast wrong, accentuated by the necessity to present one’s forecasts to multiple,
skeptical audiences, leads to reduced overconfidence on the part of forecasters, more
thorough processing of information, and a deeper understanding and appreciation of the
various determinants contributing to one’s forecasting choices and decisions. Additionally,
a higher sense of accountability leads to reduced over attribution bias, or the tendency to
attribute more weight to a factor’s causality effects than is warranted.310
F. PREDICTION MARKETS AND PREDICTION POLLS: POSSIBLE PITFALLS
Robert E. Looney, in his evaluation of DARPA’s FutureMAP project as a potential
intelligence and counter-terrorism tool that may have been abandoned by the Department
of Defense too soon, examines several criticisms that were leveled against the program
when Senators Dorgan and Wyden brought it to public light. Robin Hanson, one of PAM’s
designers, has also written extensively regarding the criticisms aimed at his project and has
attempted to respond to them. I will focus on those criticisms that could be leveled against
a use of prediction markets for the purposes of a “devil’s toy box” analysis.
The problem of insider information: Could a system such as the Policy Analysis
Market provide would-be terrorists with an incentive to purchase large numbers of shares
309 Ville A. Satopää, Jonathan Baron, Dean P. Foster, Barbara A. Mellers, Philip E. Tetlock, and Lyle
H. Ungar, “Combining Multiple Probability Predictions Using a Simple Logit Model,” International Journal of Forecasting 30 (2014): 351, doi: 10.1016/j.ijforecast.2013.09.009.
310 David R. Mandel and Alan Barnes, “Accuracy of Forecasts in Strategic Intelligence,” Proceedings of the National Academy of Sciences (PNAS) of the United States of America 111, no. 30 (July 29, 2014): 10988, doi: 10.1073/pnas.1406138111.

189
in a futures contract for a terror event, so they could then profit when they carry out the
act? Intelligence analysts have speculated that Saddam Hussein profited from investing in
oil futures prior to his invasion of Kuwait, which drove up prices, and others have observed
that the stock market declined substantially following the 2001 attacks on the World Trade
Center and Pentagon, leading to speculations that al-Qaeda profited by shorting the market;
however, Looney points out that the small size of trades permitted under PAM’s operating
rules would have made it extremely unlikely that any terrorist could substantially profit by
betting on the impact of his own destructive acts.311 Similar rules governing the use of a
prediction market for a “devil’s toy box” analysis could also minimize the likelihood of
insider information being used for nefarious purposes. Also, given the very specialized
nature of a “devil’s toy box” analysis versus the more generalist analyses envisioned under
PAM, it is highly likely that facilitators would limit participation to vetted experts in
various scientific, military, sociological, homeland security, and literary disciplines,
greatly lessening the potential for participation by terror operatives who would seek to
amass trading profits from their own destructive actions. Robin Hanson points out that,
rather than fearing that would-be terrorists might try to profit from betting on their own
activities, we should welcome such behavior. After all, he says, law enforcement agents
would be delighted if they could pay a would-be bank robber $10 for that robber to tell
them which bank he and his gang had selected to rob next.312 He additionally observes
that, regarding attempts to manipulate a market by spreading rumors or falsified
information, participants who deliberately lie are another sort of “noise trader,” which
Hanson defines as someone who trades based upon mental mistakes, insufficient
information, or emotional reasoning. The opportunity to bet against “noise traders” and
make a profit is one of the prime motivators for more informed and rational traders to
participate in a market, thus increasing a market’s overall precision. Therefore, Hanson
views “noise traders” as a plus, rather than a detriment, to market functioning.313
311 Looney, “DARPA’s Policy Analysis Market,” 412–413.
312 Hanson, “Designing Real Terrorism Futures,” 269.
313 Robin Hanson, Foul Play in Information Markets (Fairfax, VA: Department of Economics, George Mason University, 2004): 5–6, http://mason.gmu.edu/~rhanson/foulplay.pdf .

190
Changes in futures prices may be driven in the short-term by emotional reactions
and the herd instinct: Looney points out that the market efficiency theories underlying the
FutureMAP project were dominant in the 1970s but since then have lost much of their
luster in economics due to the emergence of newer behavioral theories. Chief among these
is the observation that “dumb,” or emotional, agents May in fact, lead to dumb or emotional
markets, at least in the short-term.314 He provides an example of this phenomenon in
action. Following the 1986 space shuttle Challenger disaster, the stock market uncovered
hidden information far faster than NASA’s scientists who were investigating the cause of
the explosion. Securities traders punished the stock price of the contractor (the Morton
Thiokol Company, one of four primary space shuttle contractors) who had manufactured
the faulty part far sooner than the official investigative panel of experts was able to
determine the technical cause of the failure following the Challenger’s launch; however,
several years later, when a second space shuttle, the Columbia, was also destroyed by a
catastrophic failure, the market once again punished the Morton Thiokol Company—
actually, the company’s new owner, Alliant Techsystems, Inc.—even though the
investigation eventually determined that the Columbia disaster had nothing to do with
components manufactured by Alliant. Looney ascribes this premature, inaccurate judgment
of the market to emotional reactions based upon memories of the earlier event.315 This is
a criticism that applies to the “smart markets, dumb agents” theory in general and so could
be leveled against any use of a prediction market. Looney suggests that this potential
deficiency of prediction markets used for government intelligence purposes could be
countered by limiting participation is such markets to government intelligence analysts
within a multi-agency setting, perhaps with the additional participation of selected outside
businessmen and academics.316
Michael Abramowicz points out another, closely related pitfall public participation
in prediction markets, the cognitive-distorting impact of the availability heuristic. This is
314 Looney, “DARPA’s Policy Analysis Market,” 413.
315 Ibid., 410–411.
316 Ibid., 416.

191
the tendency of individuals to place greater emphasis on events with which they have
greater and/or more recent familiarity; they tend to express greater fear of, and predict a
higher likelihood for, the type(s) of events recently publicized in the media and/or
discussed within their circles of friends, relatives, neighbors, and coworkers.317 This
tendency, in essence, makes “dumb agents” even “dumber” and ends up distorting
collective predictions. The availability heuristic phenomenon is especially relevant to the
use of any prediction market that is open to public participation for a “devil’s toy box”
analysis. This heuristic could either benefit or disadvantage such an analysis, depending on
whether would-be terrorists select their Promethean technologies based upon media “hype”
or not. Conceivably, both the public participants in a “devil’s toy box” analysis prediction
poll and would-be terrorists could react in the same fashion to popular media hyping
emerging, over-the-horizon technologies—the predictors acting on the availability
heuristic to increase their forecasts of the likelihood of hyped technologies being used for
nefarious purposes, and would-be terrorists being attracted to those same technologies by
all the hype and attention; however, it is just as conceivable that predictors and would-be
terrorists would act in opposite ways, with the predictors reacting to the availability
heuristic as noted above, but the would-be terrorists avoiding “hyped” technologies
because of a fear that homeland security and law enforcement agencies would be more
likely to prepare countermeasures against those technologies.
Government actions, taken in response to information unveiled by a prediction
market, would cause the predicted event to become far less likely and would thus
prevent any pay-offs on the trades that resulted from the original information: This
is the “self-negating” prophecy issue, which I will discuss in greater detail in Chapter 9.
Looney provides the example of a prediction market indicating a rising probability of the
assassination of a foreign leader; in response, the U.S. government passes along this
information to the foreign government, whose security forces then raise their level of
precautionary security measures, preventing the assassination, but also preventing any pay-
off to the traders who had predicted the threat in the first place. Looney responds to this
317 Abramowicz, “The Politics of Prediction,” 90–91.

192
criticism by stating that the sorts of contracts that the Policy Analysis Market intended to
offer to traders would not encompass the sorts of events or developments that are
vulnerable to swift, decisive government interventions or manipulations, and for those
trades that could be affected by government intervention, the problem of self-negating
prophecy could be addressed through conditional datives (payouts that take into account
how government action on or beyond a certain date has altered events).318
By continuously revealing prices on contracts for events or developments, and
thus the government’s best available estimates of the likelihoods of those events or
developments, a prediction market would provide intelligence to terrorists regarding
what the government knows and what the government anticipates regarding those
terrorists’ activities: Hanson recognizes this potential problem of a prediction market
aiding terrorists’ planning, and he states that this problem can be sidestepped by hiding the
most problematic or delicate pricing information from the public. He points out that in
existing markets, traders have learned to deal with the reality of not knowing what the
market price will be once their trade is entered into the system, due to the delay between
their making their trade known and their trade becoming effective, and the market price
moving in the meantime. The markets have adopted conditional or limited trades to deal
with this situation, whereby traders can protect themselves against sudden, drastic swings
in prices between the time they commit to a trade and the time that trade is made
effectual.319
In the context of a “devil’s toy box” analysis, however, informing would-be
terrorists of the government’s degree of knowledge of their intentions regarding use of a
Promethean technology is a feature, not a bug (this will be discussed further in the
“Assumptions” Section of Chapter 9). This is because the primary goal of the homeland
security enterprise’s development of countermeasures against Promethean technologies is
not to deploy those countermeasures against actual attempted uses of such technologies by
malign actors, but rather to deter malign actors from ever planning to use those Promethean
318 Looney, “DARPA’s Policy Analysis Market,” 414.
319 Hanson, “Designing Real Terrorism Futures,” 270.

193
technologies in the first place. Operating under the assumption that it will never be
possible, short of all-encompassing, population-wide mind control by the government, for
the homeland security enterprise to prevent all malign actors from acting upon destructive
or murderous impulses, the task of the defenders must always be to nudge malign actors
towards less consequential and deadly techniques by closing off avenues—or by
promulgating the widespread assumption that they have already closed off or will soon
close off avenues—to deadlier, more consequential instrumentalities. In other words, better
a knife attack than the release of a CRISPR-created, virulent biological poison in a subway
station. Better one or two deaths, however, regrettable, rather than hundreds.
Prediction markets are limited in that “futures contracts can be written only for
events that are explicitly anticipated:”320 Looney does not refute this criticism, but rather
pushes it off to the side by stating that the Policy Analysis Market would not have offered
contracts on highly unique events of terrorism, such as a pair of jetliners being hijacked to
be rammed into the World Trade Center towers.321 Yet in the context of a “devil’s toy
box” analysis, this criticism of the use of a prediction market has great validity. Let’s take
the example of an attempt to use a prediction market to determine the probability of a
CRISPR-type genetic manipulation kit being used to cause a mass casualty event. All sorts
of definitional problems come to the fore, since pay-offs would be based upon such
definitions. What level of proof would be required to show that a CRISPR-type kit had
been used to produce the malign biological entity that caused the casualties? Such
biological entities could have several different origins, including government or university
labs that the terrorist infiltrated or from which he stole material. Proof of the origin of the
biological entity might take many months or years to uncover, and such proof might never
come to light. Furthermore, what constitutes a “mass casualty event”? A hundred
casualties? Five hundred? How many of those casualties must lead to deaths for a contract
to be paid against? Are economic losses that are secondary or tertiary to the immediate
injuries and deaths to be counted in any way as fulfilling the prediction? What about deaths
320 Looney, “DARPA’s Policy Analysis Market,” 415.
321 Ibid.

194
that take a long time to occur? What sort of time limit would be applied? Only deaths that
occur within a year of the initial attack? One could fill pages with potential conditional
stipulations that might be required for a pay-off. In my opinion, this is a significant
drawback to using prediction markets for forecasting hard-to-define-ahead-of-time events
and developments. As Charles Polk, the president of the Net Exchange company, has
stated, “Nobody’s going to trade in bushels of corn if you can’t define what a bushel of
corn is.”322
Robin Hanson and his colleagues have shown that combinatorial markets can be
deployed that take such combinations of eventualities in account; however, allowing
participants to trade on such large numbers of potential combinations (billions, in some
instances) can lead to a thin market problem—too few participants trading against
combinations to set prices for those combinations.323 Hanson states this problem is most
acute in the case of a traditional double auction market design; this is because when a
simple double auction is used, each asset must attract many traders, due to the fact that
traders will not make offers that are not likely to be quickly accepted, and thus double
auctions require several times as many active traders as the number of assets available for
trade.324 Hanson and his fellow PAM researchers developed a combinatorial market maker
to address this problem. Their experiments indicated that six traders could set 255 different
prices for independent combinatorial predictions in a period of only three minutes. Still, he
indicates that just storing the number of potential combinations on a computer would
require enormous computing power and storage, as well as software programs still to be
developed.325
Prediction markets are online gambling parlors: This is a moral criticism of
prediction markets, not a logistical or conceptual criticism. In some religious communities
and among some individuals, gambling is considering sinful. Additionally, Robin Hanson
322 Seife, “‘Terrorism Futures’ Could Have a Future, Experts Say,” 749.
323 Hanson, “Designing Real Terrorism Futures,” 265.
324 Hanson et al., An Experimental Test of Combinatorial Information Markets, 2.
325 Hanson, “Designing Real Terrorism Futures,” 265–267.

195
suggests that the visceral outcry against the Policy Analysis Market among certain
politicians and the press was based upon a moral taboo having been crossed—the program
had transgressed against the moral intuition that “none of us should intend to benefit when
some of them hurt some of us.”326 Responding the “gambling parlor” objection, Looney
points out that the Policy Analysis Market was granted special legal status through
regulatory allowances granted by the Internal Revenue Service and the Securities and
Exchange Commission. He further points out that, in essence, all speculation in any market
is a form of gambling, and American society has come to accept (and legalize) many forms
of speculation over the last hundred and fifty years, some of them extremely complex.327
Hanson observes that all forms of stocks and commodities trading and arbitrage, including
stock trading, life and property insurance, and stocks and commodities futures and options,
were at one time considered illegal gambling, and the relevant industries needed to invest
enormous public relations efforts over many decades to convince the public to accept such
transactions as legitimate.328
Prediction markets will be unable to do a better job of revealing terror-related
information than the agents and intelligence analysts of our existing intelligence
agencies and so are superfluous: Looney points out that the Policy Analysis Market was
not created with the intention of predicting or forecasting likelihoods of terrorism events.
Rather, PAM was meant to focus on broader issues of economic and social import, the
types of events and developments that could broadly impact foreign nations and thus have
significant effects on American foreign and domestic policy. Looney states that, in the
broader social and economic realms, a considerable amount of valuable information
escapes American intelligence analysts, simply due to the overwhelming volume of such
information and the difficulties individual analysts have in discriminating between signal
and noise. He suggests that a system such as PAM would be a relatively low-cost, effective
mechanism for surfacing such useful information that otherwise might get lost or
326 Ibid., 261.
327 Looney, “DARPA’s Policy Analysis Market for Intelligence,” 415.
328 Hanson, “The Policy Analysis Market: A Thwarted Experiment,” 84.

196
overlooked.329 Robin Hanson responds to a related criticism that was leveled against the
Policy Analysis Market, which was that PAM sought to replace professional intelligence
analysts with a loose network of amateurs. Hanson states that this criticism misrepresents
the purpose of PAM, which was not to replace existing intelligence arrangements, but to
supplement them. He feels that existing intelligence-gathering systems have not extracted
anywhere near the maximum amount of useful information from amateur observers of
events, and a mechanism such as PAM could more effectively and efficiently gather
information from the pool of amateur informants. He further states that PAM-type
mechanisms could provide a new and more efficient forum within which the numerous
agencies of the intelligence community could merge their intelligence estimates into
consensus products.330
The ultimate payoffs for participants in prediction markets or prediction polls
can only be granted once the predicted event(s) has either occurred or not occurred
and can be verified: Hanson has pointed out this basic requirement for the operation of
prediction markets—they may only involve predictions of events that are capable of being
verified after their occurrence or non-occurrence.331 This presents a perhaps
insurmountable obstacle to the use of prediction polls in , and perhaps to prediction markets
as well, for the purposes of a “devil’s toy box” analysis. The goal of such an analysis is to
guide decision-making on the best allocation of research and development resources to
various emerging, over-the-horizon, future-shock threats in a timeframe of an estimated
five years before such threats would most likely become actualized. In other words, the
decision must be made about half a decade earlier than the predictors expect the threat will
materialize. Participants in the Good Judgment Project were predicting events that would
either occur or not occur within a year’s time. Since the project extended over a three-year
period, rewards for accuracy of predictions could be distributed within the project’s
timeframe. I assume that (and this will be discussed at greater length in my Section on
329 Looney, “DARPA’s Policy Analysis Market,” 415.
330 Hanson, “The Policy Analysis Market: A Thwarted Experiment,” 82.
331 Robin Hanson, “Decision Markets,” IEEE Intelligent Systems 14, no. 3 (May/June 1999): 16–19.
197
“Assumptions” in Chapter 9) any “devil’s toy box” analysis will be conducted in support
of resource allocations based upon the federal government’s annual appropriations cycle;
such analyses would be affected on an annual basis to ascertain which research and
development projects would be included in the budget request for the next upcoming
budget cycle. Thus, if a prediction poll were to be utilized to support this effort, participants
would need to continue to participate in the prediction poll over five successive cycles
before most of their predictions could be validated and associated rewards distributed. This
very lengthy separation between prediction effort and reward would, in my opinion, negate
the motivational effects of group competition and group awards observed by the
moderators of the Good Judgment Project. With such beneficial motivational effects
neutralized, the cost-benefit ratio of setting up and maintaining ongoing prediction polls or
markets presumably sinks into negative territory.
G. COMPARISONS OF PREDICTION MARKETS TO DELPHI, NOMINAL GROUP TECHNIQUE, AND OTHER METHODS
Kesten C. Green, J. Scott Armstrong, and Andreas Graefe, in their 2007 review of
the scholarly literature regarding the Delphi technique and prediction markets, summarize
points in favor of and against use of each method for generating aggregations of forecasts.
Overall, in weighing the various advantages and disadvantages, they come out mostly in
favor of Delphi. In prediction markets’ favor, they note that prediction markets can be run
continuously and thus generate continuously updated results, whereas Delphi panels are
typically one-time affairs, resulting in a single set of data points, although conducting
several separate rounds of questionnaires does generate changing results that may reflect
changing external circumstances (national or world events, for example). They also note
that, in an unrestricted prediction market, with no barriers to involvement, individuals are
motivated to participate by potential profit if they feel they have unique or better
information upon which to base their bids, whereas the facilitators of Delphi panels may
face difficulties in recruiting a suitably expert and diverse set of panelists.332
332 Kesten C. Green, J. Scott Armstrong, and Andreas Graefe, “Methods to Elicit Forecasts from
Groups: Delphi and Prediction Markets Compared,” Foresight, no. 8 (2007): 4, http://repository.upenn.edu/marketing_papers/157.

198
On the other hand, they point out that the Delphi technique may be used to address
a wider range of problems and decisions, since, unlike the case regarding prediction
markets, the outcome of the future event in question does not need to be ascertained to
arrange for payouts to market participants. They note the difficulty of formulating contracts
for certain types of questions to be addressed through prediction markets. They observe
that the Delphi technique allows for transparent exchanges of information between
participants and thus allows for learning. Furthermore, Delphi panels, unlike participation
markets, are generally immune to cascades, or situations in which certain traders react
strongly to what they perceive as new information being indicated by price shifts in the
market, and their strong reactions are then reacted to and mirrored by other traders, in a
process like falling dominoes. Also, Delphi panels generally can be quite effective with
between five and 20 expert participants, whereas prediction markets require far higher
numbers of participants to function effectively, or else the markets are confronted with the
thin market problem, wherein sellers for contracts are unable to hook up with buyers and
trades fail to occur, resulting in prices not being set. They also reiterate some of the
potential problems I have already discussed regarding prediction markets, including the
perceived moral inappropriateness of certain types of contracts involving violent acts and
deaths, the need, on the part of market participants, for a fairly sophisticated understanding
of how markets work and how traders profit, and the possible vulnerability of prediction
markets to speculative attacks by traders intending to cash in on their own malign behaviors
or those of persons known to them.333
Andreas Graefe and J. Scott Armstrong later followed up this literature review with
a 2011 experiment comparing performance on a quantitative judgment task among 227
participants assigned to either traditional face-to-face meetings, Delphi panels, nominal
group technique panels, or prediction markets. The participants were divided into 11
groups per method, for a total of 44 groups under comparison. The assigned task consisted
of participants providing numerical percentage estimates of likelihood for ten factual
333 Ibid., 4–5.

199
questions.334 The participants were all University of Pennsylvania students. In addition to
a $10 show-up fee, participants were offered small financial inducements for superior
predictive performance, ranging from $15 to $50 per group for face-to-face meeting,
Delphi, and nominal groups, and between $4 and $6 pay-offs per trade to individuals
participating in the prediction markets.335
The researchers found that overall differences in accuracy between the four
methods did not rise to the level of statistical significance. Some differences were seen
between methods on the level of individual questions, however, the study found that Delphi
panels were never less accurate on their predictions than the nominal group technique
panels, and Delphi panels outperformed face-to-face meetings on two out of ten questions.
Few differences were seen in performance between nominal groups and face-to-face
meetings. The researchers were surprised to find that prediction markets failed to
outperform face-to-face meetings on any of the questions and under-performed them on
three questions. They observe that in their experimental design, participants drew upon the
same pools of knowledge, so information exchanges would have little value, compared to
real-world problem-solving and decision-support situations, wherein exchanges of
disparate information can be of great added value. From this, they speculate that the
structured methods studied may not have displayed as much of an improvement over face-
to-face meetings and staticized individual results as those methods would in an
environment where exchanges of information result in accretions of new and useful
knowledge within the forecasting groups. Regarding participants’ levels of satisfaction
with the four methods, participants expressed a clear preference for those methods that
involved the most social interaction (face-to-face meetings and nominal groups). They
indicated that they found participating in prediction markets the most complex and least
334 Andreas Graefe and J. Scott Armstrong, “Comparing Face-to-Face Meetings, Nominal Groups,
Delphi and Prediction Markets on an Estimation Task,” International Journal of Forecasting 27 (2011): 183, doi: 10.1016/j.ijforecast.2010.05.004.
335 Ibid., 187.

200
satisfying; however, the researchers did not observe that high levels of satisfaction with
participation correlated with improved accuracy of forecasts.336
H. APPLICABILITY OF ELEMENTS OF PREDICTION MARKETS AND PREDICTION POLLS TO A “DEVIL’S TOY BOX” ANALYTICAL PROCESS
Regarding their potential applicability within the context of a “devil’s toy box”
analysis, I feel that the key shortcoming of both prediction markets and prediction polls is
the fact that the events and developments to be predicted by participants will not be seen
to actualize/non-actualize until long after the participants’ forecasts have been
amalgamated into a recommendation. Given that the goal of a “devil’s toy box” analysis is
to recommend which emerging Promethean technologies most require countermeasures
against them to be prepared, and the research, development, testing, and fielding of such
countermeasures is estimated to take approximately five years, the forecasters participating
in a “devil’s toy box” analysis will be looking ahead to potential developments five years
down the line. Thus, payouts in a prediction poll or a prediction market could not be
distributed until years after the conclusion of the initial analysis. For those participants in
a prediction poll, the performance feedback so essential for learning and improvement
could not be provided in a timely fashion. For those participants in a prediction market, not
only would the final pay-out on contracts be extended several years beyond the necessary
operating period of the market, but the vast range of possible combinations of technologies,
targets, and types of assailants would likely result in a severe thin market problem. Also,
as has been previously discussed, several researchers have pointed out the great difficulty
involved in formulating contracts for types of events. The farther away from a binary
“yes/no, will/will not” outcome a future event or development is seen to be, the more
difficult it becomes for the facilitators of a prediction market to formulate an applicable
contract.
However, researchers in the areas of prediction markets and prediction polls have
spotlighted various best practices that could potentially be applied within the context of a
336 Ibid., 193–194.

201
“devil’s toy box” analysis. In training of participants prior to their engagement in
forecasting exercises is both feasible and desirable. Various researchers have discovered
the usefulness of providing training in the areas of the statistics of probabilities, the
cognitive biases involved in prediction, productive group dynamics, avoiding the pitfalls
of overconfidence, and effective use of future scenarios. Potential participants could be
screened using measures of open-mindedness, an important predictor of forecasting
accuracy. All the researchers I encountered in my readings in this area stressed the
importance of diversity of backgrounds, knowledge, and opinions among participants for
any sort of “wisdom of the crowd” approach to work properly. I have already addressed
this issue in Chapter 7, “Who Are the Experts?” I have suggested that the ideal panel of
participants for a “devil’s toy box” analysis would include scientists and technologists
familiar with the basic principles involved in the emerging Promethean technologies under
consideration, managers who are centrally involved with the research and development
program to be utilized, persons who have studied the social and cultural dynamics of terror
and insurgent groups and the motivations of those groups’ supporters, and science fiction
writers whose work has focused on malign uses of future technology, unintended harmful
consequences of future technology, or social, political, or economic developments that lead
to societal conflict.
Two groups of researchers have suggested factors that could be usefully applied as
weighting factors for participants’ input into a “devil’s toy box” analysis. Tetlock et al. of
the Good Judgment Project, in seeking ways to stratify their participants by forecasting
skill level prior to those individuals’ participation in prediction polls, found that they could
determine participants’ forecasting skill level through involvement in a “seeding poll” of
20–25 questions.337 Such a “seeding poll” could be used prior to a “devil’s toy box”
analysis, with the stipulation that facilitators select questions that can be resolved in a two-
week to one-month time envelope (so that the initiation of the analysis process would not
be unduly delayed; resolution of these seeding questions could take place concurrently with
the participants’ involvement in the “devil’s toy box” analysis, with the results of the
337 Atanasov et al., “Distilling the Wisdom of Crowds,” 704.

202
seeding poll being used only when the facilitators are calculating and weighing the
participants’ inputs after the panelists’ involvement). Wright et al. found that participants
who rated themselves as being more expert proved to be less overconfident, better
calibrated, and likely to achieve higher accuracy scores than those who self-rated lower.338
Presumably, participants’ self-rated levels of expertise will vary from question to question,
depending upon that question’s subject matter and level of difficulty. (A biologist might
feel very confident answering a question about future developments in genetic engineering
but much less confident answering a question about future developments in home
metallurgy kits.) Should self-rated expertise be used as a weighting factor, participants
should be directed to rate their own expertise separately for each question posed. Thus,
Participant A’s responses would be weighed differently by the facilitators on Questions 1,
2, 3, etc., depending upon Participant A’s self-ratings of expertise and confidence.
Unfortunately, I see no way to apply either the profit motive inherent in prediction
markets or the team competition motivation of prediction polls to a “devil’s toy box”
analysis, for the reason already stated, that the outcomes of participants’ forecasts will not
be actualized until years after their group recommendations are made; however, this is not
to say that participants in such an analysis will lack for motivation. Facilitators should
continuously stress to panelists the importance their work holds for national security.
Participants should be encouraged to imagine the additional security benefits that will
accrue to the United States because of their efforts, as well as the potentially catastrophic
consequences for their own communities, friends, and families should the ultimate products
of their “devil’s toy box” analysis fail to deter, counter, or mitigate future malign uses of
emerging Promethean technologies.
I. PREDICTIVE ANALYTICS
Vast increases in computational power and decreases in the costs associated with
that computational power since the beginning of the twenty-first century have driven the
development and widespread use of a new type of forecasting technique, predictive
338 Wright et al., “Coherence, Calibration, and Expertise in Judgmental Probability Forecasting,” 8–
10.

203
analytics. Predictive analytics take the “wisdom of the crowd” concept to a new level; not
only are expert inputs not sought as the basis for forecasts, but intentional human
intellectual discernment is not brought into play at all. Rather, the “footprints” and
“fingerprints” left behind by individuals’ past decisions and behaviors are used to predict
current patterns and future occurrences. Predictive analytics are the up-to-date, data-driven
version of G.K. Chesterton’s “prophetic past.”
Individuals’ use of smartphones and computers, for online browsing, shopping,
physical navigating/positioning, social media, and other activities, results in a vast trove of
data detailing both individual and group behaviors online. This data, when combined with
data regarding offline behaviors and occurrences that are input into computer databases,
can become the basis for remarkably detailed and precise forecasts of present and future
behavior when analyzed by computer algorithms, either parametric or non-parametric. The
basis for such forecasts is the observation that people tend to be creatures of habit in many
aspects of their daily lives. Predictive analytics are used by commercial companies to
foresee trends regarding consumer purchases, the uses to which consumers put the products
they buy, and other forms of consumer behavior that have a bearing on companies’
planning for future product development, production, pricing, and marketing. Police forces
and other homeland security agencies have also productively used predictive analytics,
following their insight that criminals act, in many ways, just like consumers do—creatures
of habit who tend to prefer conducting their “business” with familiar associates or in
familiar surroundings and neighborhoods, often sticking to the same standard operating
procedures.339 Thus, in an attempt to deter or proactively respond to many types of crimes
that are characterized by continuities or habits in criminal behavior (such as drug dealing,
burglaries, automobile thefts, and vandalism, for example), police forces, by making use
of predictive analytics, can distribute their personnel and resources in an informed fashion
to those neighborhoods most afflicted with such crimes.
Seen in this light, predictive analytics offer their greatest usefulness to those
members of the homeland security enterprise engaged in that enterprise’s systemic mission,
339 Lozada, “The Emerging Technology of Predictive Analytics,” 119–120.

204
what Rodrigo Nieto-Gómez has described as preparing for and responding to known threats
of either a natural or man-made origin; however, a “devil’s toy box” analysis seeks to
grapple with potential future-shock threats, the malign co-mingling of emerging
Promethean technologies with bad actors who intend to use the new capabilities provided
by those technologies in creative, innovative fashions. Some emerging Promethean
technologies may be used by bad actors simply to add greater convenience and operational
secrecy to existing, familiar attack modes. An example of this would be using 3D printers
to home manufacture firearms or bomb parts, rather than taking the risks of purchasing
such implements on the black market, using fronts to legitimately purchase such items, or
stealing them. Other bad actors, however, may be inspired by the new capabilities made
possible by emerging Promethean technologies to plan radically new modes of attack,
breaks from past terroristic behavior—discontinuities rather than continuities. Predictive
analytics, by focusing on the continuities revealed within masses of amalgamated data, are
significantly less useful to those agents of the homeland security enterprise who focus on
the discontinuities of the counter-future-shock mission than those focused on the
continuities of the systemic mission.
This is not to say, however, that predictive analytics play no role in a “devil’s toy
box” analysis. In fact, they play a key role. I have already discussed how IARPA’s
Foresight and Understanding from Scientific Exposition (FUSE) Program, or a similar tool
that facilitates systematic horizon scanning for technical emergence (several similar
systems are now available commercially, as will be discussed in Chapter 9), could be used
to perform the initial step of a “devil’s toy box” analysis, that of identifying those emerging
technologies that are most likely to be developed into products available to consumers,
consumers other than governments or large corporations with deep pockets. FUSE and its
commercially available equivalents are predictive analytics tools. Rather than being used
to predict consumers’ buying behavior or criminal activity, however, they are used to
forecast which larval technologies are most likely to end up in consumers’ hands in product
form within a given time, based upon past and current patterns of the interplay between
basic research, applied research, product development research, patent applications, and
commercialization of new products. Just as with consumers’ purchasing behavior and
205
criminals’ illegal activities, enormous quantities of data are available regarding scientific
research activities worldwide, patent applications, and product development activities, and
these predictive analytics software packages enable timely sifting, correlating, and the
drawing of patterns.
* * * * *
In preparation for the fabrication of a crystal ball for use with a “devil’s toy box”
analysis, we have conducted a sweeping examination of forecasting methods that are
currently in use, covering a span of seventy years. We began with the Delphi technique,
birthed shortly after the close of World War Two, a conflict during which triumphs of
systems analysis had led to the invention and war-winning deployment of radar, sonar,
precision bomb sights, computers, and atomic weaponry, resulting in enormous social and
scientific prestige for experts who could claim the mantle of scientific legitimacy. The
Delphi technique was intended to provide a systematic, replicable method for the
amalgamation of expert opinions on a given question and for the establishment of
consensus among those opinions, a consensus presumably freed from the distortions caused
by social pressures and groupthink but still benefiting from the exchange of information
between panelists. Experimental research into the efficacy of use of the Delphi technique
for forecasting indicated deficiencies inherent to the technique, and so a group of social
scientists developed a related but alternative technique, the nominal group technique,
meant to correct Delphi’s perceived shortcomings. Confidence in the capability of expert
analysis as harnessed by the Delphi technique, the nominal group technique, and related
methods led to the establishment of a new field of the social sciences, futures studies.
Practitioners of future studies, working in the service of governments, think tanks,
universities, or commercial companies, expanded the range of forecasting tools that could
be used by groups of experts in various fields, introducing the use of trend extrapolation,
scenario analysis, cross impact analysis, and modeling and simulation. Concurrently,
Western militaries were developing and expanding training methods first used by the
Prussian Army in the nineteenth century into the doctrine of red-teaming, a set of exercises
meant both to allow military commanders to “see through the enemy’s eyes” and to counter
various cognitive biases that are counterproductive to effective forecasting efforts. The
techniques of red-teaming have been found to be applicable to realms beyond that of

206
military planning; they can help hone the efforts of participants involved in a “devil’s toy
box” analysis by allowing those participants greater insight into “the devil’s mindset.” The
development of Efficient-Market or “dumb agents, smart markets” theory in the post-
WWII period, combined with the deployment of electronic communications networks in
the 1980s, led to renewed interest in an idea first put forth by pioneering economist Adam
Smith in the eighteenth century, that of “the wisdom of the crowd.” Various attempts to
adapt the techniques of stock, commodities, and futures markets to types of forecasting
other than price forecasting led to the creation of prediction markets and prediction polls,
both of which have been tested by the American intelligence community for use in
predicting economic, social, and military developments worldwide (although not without
some political setbacks). These methods represent a turning away by some forecasters from
a reliance on the input of experts. The leading edge of this trend is represented by the field
of predictive analytics, a new set of computerized tools centered on machine learning and
pattern recognition facilitated by Moore’s Law and the resultant vast increases in
computational power, combined with lowered costs. Predictive analytics remove
instrumental human judgments nearly entirely from the equation, drawing patterns and
resultant predictions from massive quantities of data regarding past behaviors and events,
correlated by time and location.
Even as a notional, conceptual, imaginary device, a crystal ball is a complex
technology. This is true for a crystal ball/spy glass that will be required to accomplish the
tasks inherent in a “devil’s toy box” analysis—seeing what will be inside the devil’s toy
box five years into the future; determining which of those future toys are capable of causing
the greatest harm; predicting which future toys the devil is most likely to select for use;
and supporting a decision regarding which of the potentially numberless toy gestation
boxes within the devil’s toy box most need to be sealed shut.
I have performed my due diligence as a fabricator of crystal balls. As an apprentice,
I have sat at the feet of past and current master crystal ball makers, observing their methods,
evaluating the strengths and weaknesses of those methods as they relate to a “devil’s toy
box” analysis, and gathering a tool kit of what, judged by either experimental or real-world
experience, are regarded as best practices regarding the use of various types of crystal balls.

207
My next step? I will seek to fuse together the best practices from the full range of
forecasting techniques that are most suitable for a “devil’s toy box” analysis.
A glass blower about to fabricate a crystal ball does not work in a vacuum—
literally. He assumes the known physical qualities of sand, heat, and glass will hold, that
he is working within Earth’s gravity and atmosphere, and that his workshop is maintained
at a temperature that lies within the human comfort zone. If that glass blower were to
operate in a workshop located in an orbiting space station, he would need to start from a
different set of assumptions; molten glass will behave differently in conditions of null
gravity than it will in a glass blowing workshop at the edge of New Orleans’ French
Quarter. Prior to picking up my metaphorical blow torch and glass-blowing straw, before
I can fuse the pieces I have gathered thus far into a new whole, I first need to lay out all the
assumptions upon which I will base my prospective “devil’s toy box” analysis.

208
THIS PAGE IS LEFT INTENTIONALLY BLANK

209
IX. PUTTING THE PIECES TOGETHER: PANDORA’S SPYGLASS
A. ASSUMPTIONS
When constructing a methodology for an analysis, the designer must work from a
foundation of assumptions. Therefore, before unveiling the blueprints of my proposed
methodology, I need to list those assumptions that have guided the choices I have made. A
different designer working from a different set of assumptions would come up with a
different set of blueprints (as would I, were I working from a different set of assumptions).
What follows are the foundations of my thinking, upon which I hope to erect a sturdy,
useful edifice of methodology. I believe these assumptions to be reasonable, but any of
them are open to challenge. Changing any of the following assumptions would likely
necessitate a change in the subsequent methodology.
Assumption 1: Defenders within the homeland security enterprise will not be able
to prevent every attack by malign actors. Intelligence of the enemies’ intentions can never
be complete. Defensive measures can never be made infallible. Despite the defenders’ best
efforts, their antagonists will still be able to achieve surprise on occasion. So, some attacks
will succeed, at least in part. Realistically, the job of the homeland security enterprise is
not to prevent all possible attacks. In an environment of limited resources and capabilities,
the best the homeland security enterprise can hope to achieve is to seek to deter those
attacks with the most onerous consequences, or, should such attacks not be deterred, to
seek to counter those attacks, or, should such attacks not be successfully countered, to seek
to best mitigate the effects of those attacks on the Nation. In rank order of preference, the
defenders’ goals are to deter, to counter, or to mitigate.
Assumption 2: The purpose of a “devil’s toy box” analysis is not to predict which
over-the-horizon malign technologies will be used to harm America, nor when. Such is the
job of the intelligence agencies. Rather, the purpose of the analysis we have been
discussing is to decide which doorways to destruction most urgently need to be closed, then
to support decisions leading to actions to bar those doorways. In the terms of our parable,
the devil’s toy box contains many smaller gestational boxes, each of which contains a

210
different malign toy, growing toward possible effectiveness and deployment. In seeking to
peer inside the larger toy box before the malign toys are selected for the devil’s use, the
defenders want to know which of the interior gestational boxes most urgently need to have
their lids sealed, since the defenders realize they will not have time to seal the lids of all
them before the devil reaches inside to make his selection.
In arenas of forecasting other than a “devil’s toy box” analysis, the following
prevails—the higher the percentage of forecast events or developments that come to pass,
the greater the forecasters’ success. Within the arena of a “devil’s toy box” analysis,
however, witnessing previously forecasted events or developments become actualized
represents failure, not success. Unlike the goal of IARPA’s forecasting tournament and the
Good Judgment Project, which is to determine techniques to improve the sharpness and
accuracy of forecasts of worldwide political and social events, with such events being
considered independently of one another, the goal of a “devil’s toy box” analysis is for a
team of experts to rank a universe of potential future-shock threats relative to one another.
Likelihood of actualization is only one factor that needs to be considered. In an
environment characterized by a nearly infinite combination of over-the-horizon malign
technologies, existing malign technologies, and groups and individuals with motivations
to inflict harm, and these near-infinite combinations confronted by a homeland security
establishment with limited resources, staff, and time, the most imperative task is to decide
which doorways to destruction most urgently need to be closed, which gestational boxes
most need to have their lids sealed.
Assumption 3: Most, but not all, groups that seek to harm America are made up of
rational actors or are individuals who are rational actors. The rational actors will tend to be
the most dangerous, because they are most capable of teamwork, extensive planning, and
maintaining operational security and secrecy. Rational actors are capable of being
deterred. The threat of incarceration or death may not deter the most committed, not those
for whom death in the service of their cause is a good to be ardently sought after; however,
a high likelihood of failure to achieve their goal through a strike modality will tend to either
redirect them to use a different strike modality or to wait until a more fortuitous time arises.
This is because, just like defenders, attackers have limited resources (personnel, equipment,
211
funding, and time), and, just like the defenders, the rational actors among the attackers will
not want to unnecessarily waste any of those limited resources.
Irrational actors are far less deterrable, if they are deterrable at all; however, they
will tend to exhibit less self-control than rational actors and will act more impulsively.
They are far more likely than rational actors to boast of their malign intentions to friends,
relatives, or anonymous crowds on the Internet, and thus are more likely to appear on the
radars of law enforcement authorities. The irrational actors will tend to be shunned by most
groups because of their unpredictability, unreliability, and potential for breaking
operational secrecy. Being less likely to extensively plan and being more impulsive than
rational actors (not true in all individual cases, but I am assuming this in true in most cases),
they are far less likely to seek to use innovative, future-shock attack modalities and are
more likely to pursue imitative attacks using conventional weapons; however, should a
Promethean technology with great malign potential emerge that is easy-to-use,
inexpensive, and widely available, and thus, due to high convenience, more likely to be
used by irrational lone actors, such factors should be taken very seriously into account by
a “devil’s toy box” analysis team, who should elevate that Promethean technology to the
top of their list for R&D attention.
Assumption 4: The members of a “devil’s toy box” analytical team and the
universe of groups and individuals who seek to harm America will have a dynamic,
interactive relationship. That is, the actions of one group will influence the decisions and
actions of the other. The extent to which this dynamic relationship exists in the “real world”
would need to be studied. But my decision-support methodology design assumes that
efforts made by a “devil’s toy box” analytical team to promulgate defensive measures
against a threat modality will result in a reactive shift by potential attackers away from that
threat modality to a different modality less well defended against. In other words, a forecast
made by a “devil’s toy box” analytical team is expected (and hoped) to have a “self-denying
prophecy” effect.
This is the deterrence effect discussed in Assumption 3 above. For deterrence to
work, the antagonist must be aware of the defenders’ efforts. To quote Peter Sellers’s Dr.
Strangelove at the climax of the classic dark comedy Dr. Strangelove, or How I Learned

212
to Stop Worrying and Love the Bomb, when he is informed by the Soviet ambassador that
the accidental dropping of an atomic bomb on Russian territory by an American bomber
crew will result in the automatic triggering of a hitherto secret doomsday device, meant by
the Russians to be the ultimate deterrent, he shouts in a confounded voice, “Of course, the
whole point of a Doomsday Machine is lost, if you keep it a secret!”340
The Israeli experience with terrorism this century is instructive in this regard.
Following their loss of hundreds of civilians to Palestinian suicide bombers crossing into
Israeli territory from the West Bank during the Second Intifada, the Israelis erected a very
visible separation barrier between their population centers and the West Bank. In more
recent years, Palestinian terror operatives have been forced by the success of the separation
barrier at keeping Palestinians from the West Bank from infiltrating into Israel proper to
resort to a far less effective form of terrorism, encouraging Arabs who reside within Israel
to attack Israeli Jews with whatever weapons are immediately at hand, such as knives or
vehicles. While still capable of causing deaths and disruption, this newer generation of
Palestinian terrorists causes far fewer deaths or injuries per incident than the suicide
bombers of the Second Intifada. By successfully deterring the skilled bomb makers and
terror infiltrators from the West Bank, and by doing so with a well-known defensive system
that discourages those bomb makers and infiltrators from attempting new operations, the
Israelis have channeled Palestinian terrorism into much less destructive modalities than
formerly.341
With the goal of deterrence in mind, the “devil’s toy box” analytical team will
operate under a different set of secrecy constraints than gatherers of conventional
intelligence. The latter seek to keep their sources and methods confidential, to not “tip off”
their targets before those targets can be arrested or killed. They do not want their
antagonists to know what the defenders know. Conversely, members of a “devil’s toy box”
340 Dr. Strangelove, or How I Learned to Stop Worrying and Love the Bomb, directed by Stanley
Kubrick (1964: Los Angeles, CA: Sony Pictures Home Entertainment, 2001), DVD.
341 Simon Perry, Robert Apel, Graeme R. Newman, and Ronald V. Clarke, “The Situational Prevention of Terrorism: An Evaluation of the Israeli West Bank Barrier” (original paper, Journal of Quantitative Criminology, June 20, 2016), 19–20, doi 10.1007/s10940-016-9309-6.

213
analysis team will want potential antagonists to know or to believe that effective
countermeasures are being developed to negate dangerous Promethean technologies.
Whereas the technical specifications of countermeasures being designed, tested, and
deployed should be kept confidential, general information about the government’s R&D
efforts should be widely promulgated in the news media, those media that cover
government procurement operations and government support for science and technology.
To do otherwise would be to ignore Dr. Strangelove’s wise counsel!
Assumption 5: Here I am assuming that the instrumental R&D agency sponsoring
the “devil’s toy box” analysis will not take the results of the analysis—an ordinal ranking
of the relative risks posed by a range of emerging, over-the-horizon technology threats—
and decide that even the highest-ranked threats do not merit R&D attention. I am assuming
that the decision-makers at the instrumental agency will not use some arbitrary threshold
of threat- or risk-score below that they will not commit R&D funding. Rather, I assume
that a budget, one intended for application to R&D projects intended to counter future-
shock threats as a generic threat category, has already been appropriated by Congress and
programmed by the sponsoring agency. The purpose of the Pandora’s Spyglass analysis
(as construed in this chapter) is not to justify a funding level; rather, it is to guide how
already appropriated funds will spent—to suggest which potential projects should receive
any level of funding at all, and to act as a decision-making support tool regarding allocating
funding among potential projects. An alternative assumption, but one that fits the Pandora’s
Spyglass model just as well, is that the instrumental agency will have already committed
itself to applying R&D resources to a certain number or top percentage of the highest
ranked threats, perhaps with the list of threats to receive attention expanding with increased
availability of funding.
I can easily imagine, however, the temptation that might exist for the heads of a
sponsoring agency to run a Pandora’s Spyglass analysis prior to the appropriation and
allocation of any funding for counter-future-shock R&D programs, to justify a budget
request or the inclusion of a line-item in the President’s Budget Request. Such a use of
Pandora’s Spyglass would be roughly equivalent to forecasting efforts carried out by
commercial firms, predictive analyses that ask questions such as “What level of investment

214
in my physical plant can be justified, given this range of anticipated demand for the
resulting product and this range of estimated profit per unit?” Or “If I spend one million
dollars on equipment and another million dollars on the annual lease for a building in which
to house it, what are the chances of my at least breaking even during my first year of
operation, given this range of anticipated demand for my new product and this range of
estimated profit per unit, assuming the maximum number of units I can produce in one year
with this equipment is 3 million?” These forecasting, or risk assessment, questions are
meant to help managers of commercial firms avoid losing money by overspending on cost
inputs. Ideally, the estimated ranges of such variables as profit per unit, demand for the
product, up-time percentage for the equipment, etc., are based upon either actual
observations of identical measures in prior projects or observations of closely-correlated
measures in prior projects. Highly desirable, too, are efforts at validating the forecasting
models, either by comparing forecasted values to actual values once those values become
actualized and then gauging measures of fit and adjusting the models, as necessary, or by
backward-fitting, trying to apply the models to earlier events with known actual values and
asking, “If I had applied this model to this set of variables in this earlier event prior to the
event being actualized, how well would the model have predicted the values that actually
occurred?”
Therefore, I would caution any agency heads who might consider running a
Pandora’s Spyglass analysis to justify a budget request that they have the procedure’s
facilitators first carry out the difficult task of trying to validate the forecasting assumptions,
selections of variables, and weightings of variables that I will lay out in the following
sections of this chapter. I am working under the assumption that Pandora’s Spyglass will
be used to narrow down and then rank a set of possible, plausible catastrophic uses of
emerging Promethean technologies relative to one another. The goal is to rank the possible,
plausible catastrophic uses in descending order of risk, risk being defined in this case as
“the estimated likelihood of a Promethean technology not only coming to market but also
being used for a malign purpose, multiplied by the dollar value of the worst possible
consequences.” In the case of the underlying assumptions having not been validated, the
accuracy of these risk forecasts may individually be wide of the mark; however, for the

215
purpose I have just outlined, assuming that the forecasting participants use a consistent set
of assumptions across their forecasting and estimation efforts applied to different scenarios,
the errors in accuracy, whether due to over-confidence, under-confidence, or some other
factor, should be mostly consistent and will not affect an ordinal ranking of scenarios. In
other words, if all the mistakes made in forecasting are made in the same direction for each
scenario being judged, the relative placements of these scenarios on a ranked list of risk (as
defined above) will not change from a situation in which perfect knowledge of the impacts
of various variables and their interactions and a complete lack of cognitive distortions
apply.
Validation of the underlying assumptions of the Pandora’s Spyglass analytical
procedure is made very difficult by the nature of the analysis itself—a judgment of the
consequences and likelihoods of types of events that have not yet occurred. To date,
virtually all terror attacks have used well-known, conventional technologies, such as
firearms, explosives, or vehicular attacks. For the most part, the use of emerging
Promethean technologies for catastrophic ends is a notional threat. The closest example we
have of the type of attack envisioned in a Pandora’s Spyglass analysis is the attack by Aum
Shinrikyo acolytes on the Tokyo subway system using sarin (please refer to the final
Section of Appendix B for a full description of this event). This attack could be
retroactively subjected to a Pandora’s Spyglass analysis to test the procedure’s assumptions
and variables. Also, even though terror attacks carried out with conventional weapons are
not exact analogues of a “devil’s toy box” attack, they are similar enough, in many ways,
to be retroactively put to a Pandora’s Spyglass analysis to validate most of the variables
(those not directly concerned with the likelihood of emerging Promethean tools being
successfully developed and coming to market). After all, most of the variables I have
assigned as limiting factors on the probability of a Promethean technology coming to
market AND then being used for malign purposes are adapted from Sandia National
Laboratories’ Generic Threat Matrix, previously discussed in Section B of Chapter 6,
which was developed with conventional terror attacks in mind. Facilitators or researchers
who wish to use Pandora’s Spyglass for more precise risk analysis in support of budget
requests to counter specific emerging Promethean technology threats could validate most

216
elements of the procedure by running retroactive analyses comparing actual terror attacks
that were carried out successfully with those that were planned but failed to be carried out
with the intended malign impacts. When the results of these analyses of past attacks are
staticised, which of the limiting factors was most consequential in distinguishing between
successful attacks and failed attacks? Which limiting factors were consequential than
others?
Apart from validating the variables in the process, another way that agency
managers who wish to use Pandora’s Spyglass to justify budget requests to counter specific
emerging Promethean technology threats would be to apply a type of sensitivity analysis
to the results. In their executive summary of the results of the Pandora’s Spyglass analysis
used as a budget request justification, managers should state that the probability figure for
likelihood of a Promethean technology not only coming to market but also being used to
promulgate worst-case scenario consequences is probably inaccurate; however, they
should then indicate how low the probability figure would need to be lowered to make the
risk figure, expressed in dollar terms, equivalent to the budget line item being requested
(in other words, how unlikely would the potential catastrophe need to be to make the budget
amount requested fail a cost-benefit analysis?). The difference between the probability
figure needed to make the budget request a waste of money from a risk avoidance
perspective and the probability figure calculated by a panel of experts will likely in itself
prove to be a powerful justification for the budget requested.
B. APPLYING PANDORA’S SPYGLASS TO A “DEVIL’S TOY BOX” ANALYSIS
Before walking through the steps of what I call the Pandora’s Spyglass method of
carrying out a “devil’s toy box” analysis, let me turn for just a moment back to our parable,
to which I have added a character from classical Greek mythology, Pandora. In the classical
story of Pandora’s box (which may be considered a direct sequel to the Prometheus story),
Zeus, king of the gods, is wroth with humanity for its having accepted Prometheus’ illicit
gift of fire and for then having tricked Zeus into accepting a sacrifice of inferior meat. To
secure his revenge on both mankind and the family of Prometheus, Zeus has Hephaistos
create a woman of irresistible beauty, Pandora, who combines the graces of a goddess with

217
a backstabbing and deceitful nature. This is the alluring but dangerous creature that Zeus
sends to Prometheus’s brother on Earth as a bride, supposedly as a gift. Zeus includes an
additional wedding present, an alluring box held shut by a large padlock. Pandora cannot
resist her curiosity. She finds a way to open the box, and all the previously unknown ills
and evils of Earthly existence fly out, defying Pandora’s frantic attempts to recapture them
and bedeviling mankind ever since.342
In terms of the parable I set forth at the beginning of this thesis, I will make Pandora,
with her inexhaustible curiosity, a member of the team of defenders. Welcome to the team,
Pandora! Her fellow defenders have come up with a not-so-reliable crystal ball, whose best
images of what will transpire in the future are fuzzy and indistinct, but still instructive.
From those images within the crystal ball, Pandora and her teammates can see that, at some
point in the future, the devil will fling open his malign toy box, which contains many
smaller boxes—almost too many to count—and that these smaller boxes will begin
popping open and releasing the dreadful toys that have been incubating inside. Pandora
and her teammates see that these smaller boxes inside the big toy box will not open all at
once, but in a random, unpredictable sequence. They also see that they will have time to
seal shut only some of those smaller boxes, not all them, before they can pop open. Despite
their best efforts, they will be unable to trap the terrible contents of all the interior boxes
inside their incubators.
Pandora is intensely curious about what is inside each of those interior boxes. But,
unlike the Pandora of the classical story, she channels the energy of her inexhaustible
curiosity into beneficial action. She wants so much to know what is inside each of the
boxes, but she also knows that if she opens their lids to peek inside, she will release the
malign toys within to wreak havoc in the world. So, she invents a fabulous spyglass that
allows a viewer to see through walls, allowing her to assuage her irresistible curiosity
without opening the lids of the boxes. Just as with the crystal ball, the images that Pandora’s
spyglass allows a viewer to see are fuzzy and indistinct, but they are also very suggestive
342 N. S. Gill, “The Meaning of Pandora’s Box,” ThoughtCo, last modified August 26, 2017,
https://www.thoughtco.com/what-was-pandoras-box-118577.

218
and illuminating. When they train Pandora’s spyglass on the devil’s toy box, the defenders
can see through the outer wall the big toy box and then through the walls of the interior
boxes with their gestating toys. They are then able to note to themselves which of those
many, many interior boxes hold the worst, most destructive toys, the ones most likely to
delight the devil. Those are the boxes they vow to seal shut during the highly dangerous
assault on the devil’s toy box. Realizing that the defenders’ best efforts at sealing shut even
just a portion of the interior gestational boxes, those holding the most dangerous toys, will
not result in complete success, the shield makers among the defenders dedicate their labors
to creating specialized shields against each of those toys deemed the most dangerous… all
the while praying that those shields will never need to be used.
C. PHASE ONE: ENVIRONMENTAL SCANNING
To the great benefit of the facilitators of a Pandora’s Spyglass analysis, recent
advancements in machine learning and big data analysis have made the process of
environmental scanning for emerging, over-the-horizon technologies, technologies with
Promethean potential, and emerging extremist groups far more efficient and
comprehensive than before. In Chapter 2, I have already mentioned IARPA’s FUSE, the
Foresight and Understanding from Scientific Exposition Program, an automated tool for
tracking technical emergence that was developed beginning in 2011. Subsequent iterations
of FUSE should be available to the Pandora’s Spyglass analysis facilitators as a GOTS
(government off-the-shelf) product, assuming the facilitators are employees of a federal
agency such as DHS. Alternatively, since the time FUSE was created, at least one
commercial firm has developed a comparable product. This is Quid, a software platform
developed specifically to facilitate technology scouting by government agencies. From the
Quid.com website:
Quid is a platform that searches, analyzes and visualizes the world’s collective intelligence to help answer strategic questions. Quid is a web-based platform that leverages proprietary algorithms to read millions of text-based documents for fast insight by visualizing relationships in the underlying language. … The platform can analyze public and private company data, news and blog articles, patent data, academic research as well as myriad custom text-based datasets. … Quid leverages natural language processing algorithms to analyze large text-based datasets and

219
automatically extracts relevant metadata. The software employs unsupervised machine learning to automatically compare and identify semantic similarities between documents. … Government stakeholders utilize Quid to identify near (6–12 months), medium range (1 - 5 years), and extended (5–10 years) technology scouting trends. Leveraging Quid’s integrated datasets consisting of news/blogs (2,000,000 news articles indexed in near real time daily), companies (information on 1,800,000 companies - including funding and M&A data), and patents (worldwide patents both applied for and granted dating back to the mid-1960s), augmented with custom data integration including academic papers, government tech scouts can analyze thousands of data points to understand evolution and emergence of certain technologies and postulate about future development.343
Should they opt to use Quid, facilitators would want to take time to thoroughly
familiarize themselves with the product and its reporting options, and then should focus on
the platform’s outputs regarding medium range (1–5 years) and extended range (5–10
years) emerging technology trends. Although the facilitators would be wise to not rely
entirely upon Quid (or a comparable platform) for establishing the “universe” of emerging
technologies and potential Promethean technologies, the product’s ability to mine news
and blog articles, company data, worldwide patents, and academic papers at scale eclipses
any human team’s ability to examine and sift through such gargantuan amounts of material;
however, the possibility exists that specialists in various technical fields may be aware of
embryonic developments that have not yet surfaced in patent applications, academic
papers, or companies’ R&D reports. Thus, the facilitators would be wise, once they have
assembled their team, to solicit additional input regarding the “universe” of emerging
technologies and potential Promethean technologies from team members. This will be
addressed further in the following sections.
Another commercial firm, Recorded Future, facilitates data mining from Dark Web
sources to allow for scouting of emerging behaviors of criminal, terror, and extremist
groups. From the Recorded Future corporate website: “Recorded Future arms threat
analysts, security operators, and incident responders to rapidly connect the dots and reveal
343 “What is Quid?” and “Use for Government Technology Scouting,” Quid website, accessed August
10, 2017, https://quid.com/.

220
unknown threats. Our patented technology automatically collects and analyzes threat
intelligence from technical, open, and dark web sources to provide invaluable context for
faster human analysis…”344 The Recorded Future platform mines data from over 750,000
sources encompassing more than 20 billion different data points; these sources include the
open World Wide Web, social media sites, the Deep Web, and Dark Websites. The firm
employs its own team of intelligence analysts who continuously locate new onion sites on
the Dark Web. These analysts develop data dictionaries that allow clients to develop
searches that are both highly targeted and that cast a wide net.345 The facilitators of a
Pandora’s Spyglass analysis, having previously used a platform such as FUSE or Quid to
surface over-the-horizon, emerging technologies with Promethean potential, should work
with Recorded Future’s analysts (or their counterparts at another service or firm) to have
social media, Deep Web, and Dark Web searches performed using terms of interest related
to the identified emerging technologies, to determine whether malign elements (terror
groups, extremist groups, criminal organizations, or lone wolves) are already fixating upon
and brainstorming future uses of emerging technologies. The facilitators should
additionally use Recorded Future and its analytical team (or a similar product/firm) to
identify those malign elements, including organizations or ideologies, which are
responsible for increasing levels of “chatter,” indicating that they are on the rise, attracting
new adherents and generating increasing levels of enthusiasm and commitment.
D. PHASE TWO: ASSEMBLE THE TEAM
Step One—Recruit Team Members: Based upon the results of their
environmental scanning efforts, the facilitators of a Pandora’s Spyglass analysis should
strive to recruit for their team technical experts and researchers who have collectively
worked within all the fields from which emerge the identified over-the-horizon
technologies with Promethean potential. They should make sure to “cover the map” as best
as possible, keeping in mind financial and logistical constraints, as the analytical effort will
encompass a three- to four- week face-to-face portion that will incur support costs such as
344 Recorded Future corporate website, accessed August 10, 2017, https://www.recordedfuture.com/.
345 Ibid., accessed February 5, 2018, https://www.recordedfuture.com/services/.

221
travel and per diem. Relying upon guidelines for panel sizes put forth by researchers who
have sought to optimize Delphi procedures, nominal group technique procedures, and
wisdom of the crowd procedures (summarized below), I suggest that the facilitators aim to
assemble a team of 25–40 participants. I provide my recommended proportions of the
makeup of various members of the team in Table 7. Should these constraints prove unable
to accommodate enough technical experts to cover all the areas of technical subject matter
expertise indicated by the environmental scanning phase, the facilitators may opt to expand
the size of the team by recruiting additional technical expert members for the latter remote
portions of the analysis, the assignation of estimated consequence and probability scores
to scenarios, which will be based upon consensus Delphi panels. The same environmental
scanning procedures that surfaced over-the-horizon technologies with Promethean
potential should also present facilitators with lists of researchers and technologists who
have applied for applicable patents and academics who have published papers in the fields
of interest. The facilitators would be well advised to use such lists as the basis for their
recruitment effort, additionally relying upon the recommendations of such identified
persons, should they themselves be unavailable to serve, regarding colleagues who would
be available and willing to join the Pandora’s Spyglass analytical team. Recruitment
efforts, no matter the mode(s) of communication used, should include a full description of
the purpose and goals of a “devil’s toy box” analysis; in all stages of the analytical effort,
facilitators should take the time to explain the effort’s methodology to participants (per
Landeta, 2006).
To ensure institutional support (again, per Landeta, 2006) from the organization
sponsoring the Pandora’s Spyglass analytical effort, the facilitators should include as
participants representatives from upper management, persons I will refer to as homeland
security institutional insiders. Their inclusion will greatly facilitate the “selling” of the
analytical effort and its resulting recommended R&D projects to the powers-that-be and
will help counter trepidation on the part of institutional management that the Pandora’s
Spyglass analytical effort is too “far out,” too disconnected from reality, or superfluous to
the sponsoring organization’s primary mission set. Another category of experts from which
the facilitators should seek to recruit members is terror group analysts. The environmental

222
scanning phase may have indicated that certain types of groups are growing in prominence
and influence, and that these groups are expressing interest in pursuing technically or
operationally innovative modes of attack. In such cases, the facilitators will want to try to
recruit researchers who have studied these groups. The facilitators may reach out to the
management of the Center for Homeland Defense and Security at the Naval Postgraduate
School for assistance with identifying and recruiting suitable experts of this type.
Finally, as I have discussed in Chapter 7, the facilitators need to include members
who engage in regular use of the science fiction mindset—writers of hard science fiction.
The most efficient way for facilitators to recruit such members would be to reach out to
SIGMA, the science fiction think tank, and its director, Arlan Andrews. This group, whose
mission is to assist homeland security, defense, and intelligence agencies with
conceptualizing future vulnerabilities, threats, and opportunities stemming from
technological advancements, would consider participation in a “devil’s toy box” analysis
to fall squarely within its reason for being. Should SIGMA prove unable to provide from
within its own membership an adequate number of science fiction writers to the facilitators
(perhaps due to preexisting commitments to other organizations), its leadership and
members, being familiar with the science fiction community, will be able to provide
referrals to other suitable writers. The number of science fiction writers that will need to
be included in the team depends upon the team’s overall size and the number of scenarios
that will be fully fleshed out (as described in an upcoming section). During the scenario
fleshing-out phase, the science fiction writer members of the team will serve as the lead
scenario writers; each scenario writing sub-team will consist of a scenario lead (a science
fiction writer), who will be supported by between one and three technical experts
(depending on how many emerging technologies are encompassed within the scenario) and
at least one non-technical expert, either a terror group expert or an institutional homeland
security insider. Depending upon the overall size of the analytical team, each sub-team may
be assigned two scenarios to work on, or possibly three. Facilitators should base the
scenario assignment load per sub-team on the number of science fiction writers available.
For example, if the overall team contains five science fiction writers, since the top 12
“deadly dozen” scenarios will require fleshing out, three of the sub-teams would be

223
assigned two scenarios to flesh out and two of the sub-teams would be assigned three. Since
12 scenarios will need to be fleshed out, the ideal number of science fiction writers on the
team would be six, so that each sub-team could be assigned two scenarios.
Other rules of thumb can be adapted from those researchers who have sought to
optimize various forecasting procedures. Regarding nominal group technique panels, the
inventors of the technique recommend that primary panels number 7–10 members, while a
consolidated NGT panel may number up to 40 members (per Delbecq, Van de Ven, and
Gustafson, 1975). William Fox, the creator of the Improved Nominal Group Technique,
states that, with his procedural adjustments in place, panels may productively be sized up
to 20 members (per W. Fox, 1989). Regarding Delphi panels, researchers have
recommended that panel sizes do not exceed 30 members (per Murry and Hammons, 1995).
The facilitators of the Good Judgment Project state that, in terms of the wisdom of crowd’s
effect, there is no need to increase the number of forecasters beyond 20, since the bulk of
the improvement in accuracy from increasing crowd size comes from increasing the
number of participants from 10 to 20 and any improvements are minimal after that (per
Satopää, Baron, Foster, Mellers, Tetlock, and Ungar, 2014). The Pandora’s Spyglass
analytical effort will encompass both a face-to-face portion that will make use of the
modified nominal group technique and two remote portions that will make use of Delphi
procedures. Thus, a reasonable rule of thumb would be to aim for a team size of 25–40
members (see Table 7).
Table 7. Makeup of a Pandora’s Spyglass Analytical Team
Overall Team Size: 25–40 members (may be expanded during the remote Delphi portion)
Technical Experts Between 50% and 60% (this portion may be expanded during the remote Delphi portion if the initial team did not adequately cover all the areas of technical subject matter expertise indicated by the environmental scanning phase)
Science Fiction Writers Between 20% and 25% (ideally 6)
Mix of Terror Group Analysts and Homeland Security Institutional Insiders
Between 20% and 25%

224
Step Two—Administer a Forecasting Pre-Test: Once the members of the
analytical team have been recruited, but prior to their physically being brought together for
the face-to-face portion of the Pandora’s Spyglass analysis, members should be presented
with a forecasting skills pre-test, the results of which will be used to weigh individual
responses during the latter remote portions of the analysis, the assignation of estimated
consequence and probability scores to the “deadly dozen” scenarios, which will be based
upon consensus Delphi panels. Some researchers suggest that a prior history of just five
forecasts is needed to establish a performance history to use as a differentiator (per Mannes,
Soll, and Larrick, 2014), whereas other researchers state that a forecasting pre-test of 20–
25 forecasts is necessary to establish a performance differentiator (per Atanasov, Rescober,
Stone, Swift, Servan-Schreiber, Tetlock, Ungar, and Mellers, 2017). I suggest that
facilitators “split the difference” and assign a pre-test of 12–15 forecasts, all regarding
events that will be actualized prior to the latter remote portions of the Pandora’s Spyglass
analytical effort, when the facilitators will be required to assign weights to individual
members’ assignation of estimated consequence and probability scores to the “deadly
dozen” scenarios and will need to calculate Brier scores for each member, scores that
indicate comparative levels of accuracy in forecasting. The pre-test may consist of
questions regarding any event that will become actualized within the required time and that
can be predictively responded to in a binary, yes/no fashion, with participants being asked
to respond how confident they are in their answers by stating they believe there is a XX%
chance of that answer being correct. Examples might include questions such as: “Will
Candidate X achieve the nomination of Party Y for the upcoming Iowa gubernatorial
election?” “Will the closing Dow Jones Industrial Average equal or exceed 25,000 points
on date XX-XX-XXXX?” “Will General Motors sell more than 4,000 Malibu sedans
during the month of XX-XXXX?” “Will the opening weekend theatrical gross ticket sales
of soon-to-be-released film Revenge of the Fast and Furious Jedi exceed $80 million?” For
each question, the respondents would offer a Yes or a No, along with a statement, “There
is a XX% chance this answer will prove correct.”
Along with the 12–15 questions of the pre-test, facilitators should share written,
audio, or video links to brief training sessions for participants regarding reducing

225
overconfidence in predictions, self-calibrating their predictions, avoiding common
cognitive biases, and using Bayesian statistical methods (starting with a hypothesis of
probability and then updating this hypothesis as new data becomes available, allowing for
continuous refinement of forecasts) (per Tetlock, Superforecasting, 2015), as well as on
the laws of probability, including compound and contingent probabilities (per Wright,
Rowe, Bolger, and Gammack, 1994). Participants should be instructed to read, listen to, or
watch the training materials prior to their answering the pre-test questions and submitting
their answers electronically to the facilitators. These same topics will be covered in greater
depth during the face-to-face portion of the analytical effort, so that participants will have
opportunities to ask questions regarding the materials and to discuss any implications that
arise.
E. PHASE THREE: BRAINSTORM SCENARIOS
Phase Three of the Pandora’s Spyglass analytical effort, that of brainstorming
scenarios, is split between the initial remote portion of the analysis and the middle, face-
to-face portion. The analytic effort is separated into a face-to-face portion sandwiched
between two remote portions, to avail the analysis’s customers of the benefits of both the
nominal group technique and the Delphi technique. The choice to split the brainstorming
process between a remote environment, in which participants work individually, and a
face-to-face environment, where participants interact as they work, is based upon
Delbecq’s and Van de Ven’s analysis of the work of prior researchers of small group
dynamics and group decision-making processes, who found that individual work is better
suited to certain phases of the brainstorming and problem-solving process and group
interaction is better suited to other phases. Specifically, individual work is preferred to
group interaction during the phases of idea generation, identification of problems, and the
elicitation of facts (the initial phase of the problem-solving process, during which group
interaction may actually prove counterproductive), whereas face-to-face discussion is
better at promoting improved evaluation, screening, and synthesizing of ideas already
generated (the latter portions of the problem-solving process) (per Delbecq, Van de Ven,
and Gustafson, 1975).

226
Step One—Push Out the Results of Environmental Scanning: Facilitators
should share the reports generated by the environmental scanning activities with
participants (depending on the lengthiness of these reports, some reformatting or
summarization may prove necessary); however, some participants may have specialized
knowledge to add to the generated lists of over-the-horizon technologies with Promethean
potential and of rising extremist or terror groups. As mentioned in the Section on the
environmental scanning phase, certain team members may be aware of embryonic
developments that have not yet surfaced in the public or semi-public sources accessible to
the software platforms that mine big data. Solicit their input, and then share their input as
an addendum to all participants.
Step Two—Distribute Questions to Promote Brainstorming: At this stage, the
objective is not to solicit fully developed scenarios from participants regarding the various
emerging technologies with Promethean potential that have been identified. Rather, at this
point in the process, when divergent thinking needs to be encouraged, facilitators should
instruct participants to provide “stub” scenarios, brief, one-paragraph descriptions of
potential outcomes that would result from the dispersion, marketing, adoption, and
potentially malign use of the technologies. Per Schwartz and his The Art of the Long View,
encourage participants to brainstorm at least four “stub” scenarios that play out of each of
the identified technologies or combinations of technologies. For each of the technologies
or combinations of technologies they are assigned, suggest that participants aim to
brainstorm two scenarios that they judge to be high-likelihood, high-probability scenarios
and two that they consider wild-card, black swan, low-likelihood/high-impact scenarios
(per Schwartz, 1996). Four scenarios from each participant per technology or combination
of technologies would be ideal, but participants should not feel forced to come up with four
for each if they are unable to, nor should they be discouraged from providing more than
four if they are feeling especially inspired or creative.
The facilitators should seek to avoid, however, overwhelming the analysis with far
too many scenario stubs to be considered, sorted, and either discarded or subjected to
further development. The numbers can quickly grow daunting; if the team consists of 30
members, and the environmental scanning process identifies 10 strands of technological

227
development with malign Promethean potential, and each participant is encouraged to
provide at least four scenario stubs for each technology considered, this would result in a
minimum of 1,200 scenario stubs! Rather, facilitators should distribute the identified
emerging technologies among the participants so that each team member has at least one
from which to create a minimum of four scenario stubs. Facilitators should strive, as best
as possible, to match the identified emerging technologies with the technical experts in
those fields; emerging technologies may be randomly distributed to the remaining team
members. Depending upon the number of emerging technologies that need to be assigned,
if this number is fewer than the number of team members, more than one participant will
be assigned a technology; conversely, if the number of emerging technologies is greater
than the number of team members, some or all the participants will be assigned more than
one technology from which to brainstorm scenario stubs. Since this stage of the analysis
emphasizes divergent thinking, the facilitators do not want to inadvertently foreclose the
development of divergent scenarios connected to technologies by assigning technologies
to team members only, and disallowing inputs regarding those technologies from other
team members who might have equally creative ideas (or more highly creative and
insightful ideas) regarding potential scenarios. Therefore, all participants should be
supplied with the full list of emerging technologies with Promethean implications and told
that, although they are primarily responsible for generating scenario stubs for just one
technology that they are assigned (or two, or three), they are free to volunteer scenario
stubs for other technologies on the list, as well, should they choose to. This should result
in a more manageable number of scenario stubs. For the sake of illustration, let us assume
that the team consists of 30 members, and the number of identified emerging technologies
equals the number of members, 30. Each participant is told to generate four scenarios for
the one technology they are assigned. Half the team members, 15, opt to also generate four
scenarios for one additional technology on the list (or to provide two scenario stubs apiece
for each of two additional technologies). This would result in an amalgamation of 180
scenario stubs that the team will be responsible for sorting and sifting through; still a large
number, but much more manageable than 1,200!

228
Facilitators should provide the following lists of questions to participants to assist
with their brainstorming of scenario stubs. These are not questions for participants to
answer and submit; facilitators should explain that these are questions meant to prompt
creative thinking and the use of imagination. Facilitators would be wise to provide a brief
explanation of the differences between creative thinking and critical thinking. This is the
phase for creative thinking, and participants should be advised to put critical thinking aside
for the moment, although they will be called upon to use their critical thinking skills in
later phases. The following “Evil Genius” questions provide a good starting place to jump-
start creative thinking about scenarios:
What are the prompt effects that could result from a malign use of the
identified technology/threat vector? What magnitude of consequences
could result? (Explain prompt effects.)
What are the human response effects that could result? What could be the
magnitude of consequences? (Explain human response effects.)
How accessible to potential malign actors are the products of the
identified emerging technology? How much technical skill or training
would be required to use them? How much manpower? How much
planning?
How expensive are the products of the identified emerging technology?
How affordable are they for individual malign actors? For international
terror groups?
Encourage participants to think through these questions from the vantage
points of the three categories of malefactors identified in the Thwarting an
Evil Genius study: jihadists, nihilists, and thrill seekers; briefly identify the
goals and inhibitions inherent to each group (per Boyd et al., 2009). I
would suggest adding the following three categories of malefactors to the
list: leftwing terrorists, rightwing terrorists, and adherents of apocalyptic
cults.

229
In addition to the “Evil Genius” questions, the facilitators should provide to the
participants the following list of “science fiction mindset” questions:
What trends currently exist in science and technology and societal
adjustments to science and technology? What would happen if those
trends were extrapolated into the future and greatly exaggerated?
What are the possible social impacts of these trends and developments?
Political implications? Cultural implications? Religious implications?
Psychological impacts? Impacts on behaviors? Impacts on health and
longevity? Impacts on the physical environment?
What are the scariest things that might result?
What are the most interesting, exciting conflicts that might arise because
of these potential, extrapolated trends and developments in science and
technology?
What precursor developments are required for the technologies to be used
in malign ways to produce conflict? (In plotting terms, what is the “back
story” of the conflict, the steps that led to the malign use of the
technology?)
What new vulnerabilities in society, infrastructure, and individuals’ lives
might be created by these emerging technologies? In what ways do these
emerging technologies make society more fragile, less resilient? What new
threats could result from those vulnerabilities?
Facilitators should emphasize to participants that they should avoid self-censoring
in this phase. At this stage of the analysis, there are no “bad,” “stupid,” or “crazy” ideas.
Participants should allow their imaginations to run free and follow their imaginations
wherever they may lead. Facilitators should also emphasize that all scenario stubs will be
submitted on an anonymous basis. The facilitators will not identify the scenarios’
originators when they distribute the list of generated scenario stubs, and the originators will

230
not be required to identify themselves during the face-to-face portion of the analysis, unless
they choose to do so to clarify certain points about the scenario or to answer questions
about the thinking that fed into the creation of that scenario. Thus, no participants should
fear being stigmatized for submitting “wild” or “far-out” scenario stubs.
At this point, per William Fox and his Improved Nominal Group Technique, the
facilitators will gather together all the scenario stubs created by the participants and
remotely disseminate the full list of stubs to the entire group. Facilitators should inform the
participants that they may choose to submit additional scenario stubs if their reading of the
consolidated list results in further brainstorming. If additional scenario stubs are submitted,
the facilitators should re-disseminate the full list, identifying those new scenario stubs that
have been added. Facilitators should at this point inform the participants that they will
continue to have the opportunity to submit any additional scenario stubs they wish, either
remotely or in person at the face-to-face session, up until the first day of the in-residence
meeting of the full group (per W. Fox, 1989).
Step Three—Train the Science Fiction Writer Members of the Team in Small
Group Processes and Optimally Facilitating Small Group Interactions: The science fiction
writer members of the team will serve as the facilitators of the fleshing-out of the “deadly
dozen” scenarios, and they will also serve as the lead writers for the 12 fleshed-out
scenarios. Although they will have all had copious experience with the latter task, many, if
not most, of them will not have had experience leading small groups. The facilitators of
the overall effort should bring the science fiction writer members of the team in to the face-
to-face meeting location a day earlier than the other members. They should provide the
science fiction writers with a three- to four-hour training on small group processes and
behaviors. This training should include ways to discourage counterproductive group
behaviors such as non-productive argumentation, repetitious restatements of the same
inputs by participants, withdrawal of the less-confident or assertive members from offering
input, and domination of the group by one or two of the loudest or most aggressive
members; and ways to get the best, most productive interactions out of the participants.
The main goal of the training session will be to teach the science fiction writers how to

231
allow for disagreement without it becoming disagreeable. (The facilitators of the overall
Pandora’s Spyglass effort should have gone through this training themselves previously.)
Step Four—Bring the Participants Together for the Face-to-Face Portion of the
Analysis and Begin with an Emphasis on Personal Accountability and the Importance of
the Mission: Now the face-to-face portion of the Pandora’s Spyglass analysis begins. David
Mandel and Alan Barnes, in their study of the accuracy and effectiveness of national
security forecasts, found that positive outcomes were increased for those forecasters who
were encouraged to accept personal accountability for their forecasts (per Mandel and
Barnes, 2014). The facilitators, at the outset of the face-to-face portion, should emphasize
the importance of the Pandora’s Spyglass analysis for the Nation’s future safety and the
personal well-being of its citizens and the participants’ own families, neighbors, and
friends. They should fully explain how the participants’ input will guide that R&D projects
get funded and which future malign uses of emerging technologies may be averted by the
outputs of those projects. Facilitators should share with the assembled group the parables
of the devil’s toy box and Pandora’s spyglass to spur group discussion of the unique
challenges inherent in this type of forecasting effort and future threat analysis.
Prior to having all the participants introduce themselves and describe their
professional and personal backgrounds, facilitators should share the fact that virtually all
researchers who have studied the effectiveness of various forecasting methods, both those
methods that rely upon the elicitation of expert opinion and those that rely upon the wisdom
of crowds, emphasize the importance of gathering a diverse set of participants. Also,
facilitators should provide a brief overview of the usefulness of the science fiction mindset
to a “devil’s toy box” analysis, to help convince those participants who may be initially
skeptical of the inclusion of science fiction writers on the team of the latter’s legitimacy as
members.
Jon Landeta, in his consideration of the current relevance of the Delphi method,
emphasizes the importance of facilitators fully explaining the methodology to participants
(per Landeta, 2006). This is a good rule of thumb for the facilitators of Pandora’s Spyglass
to follow. During the lengthy face-to-face, in-person portion of the analysis, participants
will make continuous, extensive use of consensus Delphi procedures and nominal group

232
technique procedures. In the introductory session that kicks off the in-person portion of the
analysis, facilitators should take time to explain these procedures and the rationales behind
them, and then respond to any questions participants may pose. Participants should not be
told to “just trust the process.” They should receive explanations of the theories behind the
techniques and the laboratory and field evaluations of these analytical processes.
Step Five—Apply Convergent Thinking to the Scenario Stubs: The University
of Foreign Military and Cultural Studies’ Red Team Handbook recommends that the final
stage of a brainstorming effort be to apply convergent thinking to the brainstormed ideas
by having the team remove duplicate ideas and group the most similar ideas together, and
that they do this in a way that is visible to the entire team (per UFMCS Red Team
Handbook, 2012). The facilitators should edit down each scenario stub to its basic
elements, such that each can be printed on a large sticky note, the type that can be stuck
onto a surface, removed, and placed again without losing its adhesiveness; ideally, each
note should be about the size of one-quarter of a standard-size sheet of paper, or about 5.5”
by 4.25.” Let us assume the group situation posited in Step Two of this phase: 180 scenario
stubs generated by 30 team members. Having the full team initially sort the full list of 180
scenario stubs would be cumbersome, ineffective, and time-consuming, since it would be
very difficult for individual team members to try to sort such a lengthy list of items.
Facilitators should ameliorate this difficulty by following this procedure:
1. Divide the full team into five sub-teams of six members apiece. Similarly,
randomly divide the 180 scenario stubs into five sets, each set having 36
scenario stubs which that sub-team will sort. Assign a facilitator to each of
the sub-teams.
2. Provide each sub-team with its own work/discussion space, either a
separate room or widely dispersed parts of a large common room (perhaps
split up by temporary divider panels). Additionally, provide each sub-team
with two portable, large easel boards, both big enough to accommodate all
36-scenario stub sticky notes without overlapping.

233
3. The facilitator should use a method of random assignment of order of
turns to the members of the sub-team. The person assigned the first turn
silently goes to the easel board holding all 36 sticky notes and moves any
or all the sticky notes to the second, initially empty easel board, grouping
scenario stubs that are either duplicates, are strongly similar, or share
features that would allow them to be logically combined into a larger
scenario. The participant may opt to move all the sticky notes, some of
them, or none.
4. Each of the other participants, one at time, is given the opportunity to
question why the currently active team member chose to move a sticky
note in the way he/she did. The questioning participants may pose only
one query at a time. The active team member is not obligated to provide
his/her reasoning if he/she does not wish to do so. The rounds of questions
continue until no non-active participants have any more questions to pose.
These procedures follow guidance laid out by the creators of the Nominal
Group Technique (per Delbecq, Van de Ven, and Gustafson, 1975).
5. Instructions 3 and 4 are followed for each member of the sub-team. Team
members are not limited to only one turn at the easel boards. Turns will
continue until no member of the sub-team wishes to move any of the
sticky notes any further; this state of play represents the sub-team’s
consensus. If the sub-team deadlocks regarding the placement of any of
the sticky notes—if successive rounds, after all members have had two
chances, result only in sticky notes going back and forth between previous
placements—the facilitator will put those sticky notes of contention aside
from the grouped sticky notes and will make this lack of consensus known
to the full team when it reconvenes.
6. Each sub-team brings its easel board holding the sorted scenario stub
sticky notes back into the shared discussion/work space (in the current
example, five easel boards would be placed side by side in a single room,

234
viewable by the entire team). The shared space should include a large
display board, most likely wall mounted, big enough to hold all 180-
scenario stub sticky notes without overlap and with enough spare space to
allow for separation of grouped items. The members of each of the sub-
teams select a single representative who will serve as their sorter during
this consolidation round. Just as in instruction 3 above, the facilitators use
a method of random assignment of order of turns to the representatives
from sub-team. The person assigned the first turn silently goes to the easel
boards holding all 180 sticky notes and moves them to the large display
board. The active sorter should be told it is strongly preferable that already
sorted groups of sticky notes be moved as groups, which may be
consolidated with other groups of sticky notes with which there is
overlap/duplication, which has strongly similar elements, or that share
features that would allow them to be logically combined into a larger
scenario; however, active sorters are not forbidden to move individual
sticky notes from one previously assigned grouping to a different
grouping, if they can articulate to themselves, and potentially to the full
team, why they are making this change. The active sorter should also
consider which of the existing groups the “contentious” sticky notes, not
assigned to any groups in the earlier stages, should be assigned to;
however, the active sorter may choose to leave the “contentious” sticky
notes as outliers, off on their own, but they still need to be moved to the
large display board. The first active sorter needs to move all the 180 sticky
notes from the individual easels onto the large display board, even if
he/she decides to leave the pre-assigned groupings exactly as they were on
the individual easels and chooses not to amalgamate any of the pre-
assigned groupings with one another.
7. Just as with instruction 4 above, each of the members of the full team, one
at time, is given the opportunity to question why the active sorter chose to
move a group of sticky notes (or any individual sticky note) in the way

235
he/she did. The questioners may ask only one question at a time. The
active sorter is not obligated to provide his/her reasoning if he/she does
not wish to do so. The rounds of questions continue until no team
members have any more questions to pose.
8. As with instruction 5 above, instructions 6 and 7 are followed for each of
the sub-teams’ representatives. These representatives are not limited to
only one turn at the display board. Turns will continue until no
representative wishes to move any of the sticky notes any further; this
state of play represents the full team’s consensus. If the representatives
deadlock regarding the placement of any of the sticky notes—if successive
rounds, after all representatives have had two chances, result only in sticky
notes or groups of sticky notes going back and forth between previous
placements—the facilitators will print out duplicates of the sticky notes in
contention and will place these duplicate sticky notes within each one of
the groupings that the various sub-team representatives have indicated
through their lack of consensus.
9. The facilitators will take photographs of the final groupings of the sticky
notes on the display board. While the remaining team members are on
break or are done for the day, the facilitators will then work with the
science fiction writer members of the team to amalgamate each grouped
set of scenario stubs into consolidated scenario stubs, removing duplicate
ideas and arranging the non-duplicative elements into logical progressions.
Ideally, this process will have narrowed down the original number of
scenario stubs (180 in this example) to a more manageable number,
perhaps between a third and one-half the original number (in this case,
somewhere between 60 and 90 scenario stubs).
F. PHASE FOUR: RED TEAM THE SCENARIO STUBS
Phase Four of the Pandora’s Spyglass analysis, that of red-teaming the consolidated
scenario stubs, takes place entirely during the face-to-face portion of the process. This

236
phase not only assists the participants with their critical thinking during the following phase
of winnowing the scenario stubs into a smaller list (the “deadly dozen”), it also provides
them with practice at applying critical thinking and red-teaming skills generally, skills they
will need during the forthcoming phase of fleshing out the selected “deadly dozen” scenario
stubs.
Step One—Introduce the Concept of Red-Teaming to the Full Group and
Provide Training on Avoiding Cognitive Biases: Using introductory material from either
(or both) the University of Foreign Military and Cultural Studies’ Red Team Handbook or
the United Kingdom Development, Concepts and Doctrines Center’s Red Teaming Guide,
introduce the full team to basic concepts of red-teaming, its major goals, the goals of
learning to see situations from multiple vantage points (those of the defender, the
attacker/antagonist, and key allies) and learning about common cognitive biases that affect
decision making and how to avoid or ameliorate these biases. Discuss the varied
characteristics (goals, motivations, taboos and boundaries, and typical educational and
socioeconomic backgrounds) of various types of terrorists—jihadists, nihilists, and thrill
seekers (per Boyd et al., Thwarting an Evil Genius, 2009), and right-wing terrorists, left-
wing terrorists, and members of apocalyptic cults (per Hudson, The Sociology and
Psychology of Terrorism, 1999)—focusing on the characteristics that tend to make
members of the various categories distinctive and different from the others. Review the
cognitive distortions training given earlier to participants during the remote portion of the
analytical effort, going into more detail and allowing for questions and discussion. Teach
participants to avoid the pitfalls of mirror imaging (imagining that an opponent’s desires,
goals, limitations, and moral taboos are the same as yours and those of people raised in
your own society and culture) and ethnocentrism (assuming the superiority of your own
culture) (per Longbine, 2008). Train participants to consider the cognitive distortion caused
by the availability heuristic, or the tendency for people to assign higher levels of risk and
consequence to the types of malign events with which they have the greatest familiarity, or
those recently highlighted in the news media (per Abramowicz, 2007). Other examples of
cognitive biases that participants should be familiarized with and taught to countermand
include anchoring, status quo bias, confirmation bias, sunk-cost bias, the framing trap, the
237
halo effect, the narrative fallacy, and self-fulfilling prophecy bias; The Applied Critical
Thinking Handbook, the latest version of University of Foreign Military and Cultural
Studies’ Red Team Handbook, contains information on all these.346 Nicholas Rescher also
provides a useful overview of the cognitive biases most applicable to forecasting efforts in
his book Predicting the Future: an Introduction to the Theory of Forecasting (per Rescher,
1998).
Step Two—Divide the Full Team into Groups of Four: At the start of each day
spent in this phase, the facilitators will randomly assign participants to groups of four. Each
group will be responsible for red-teaming randomly assigned scenario stubs. If the size of
the full team is not divisible by four (such as our working example, a team of 30), an
adequate number of facilitators will act as participants to fill out the group that otherwise
comes up short (in the current example, there would be eight groups of four, with two
facilitators taking on the role of participants). Existing groups break up at the end of a
working day, and new, randomly assigned groups are formed at the beginning of the next
working day. Facilitators should try, as best as is practicable, to ensure that each team
member serves on groups with fellow team members with whom they have not previously
worked in this phase; this will help familiarize each team member with as many of his/her
fellows as possible.
Step Three—Randomly Assign a Scenario Stub to Each Group to Red Team;
Also Assign Each Group a Red Teaming Method to Use: At the beginning of each day
worked in this phase, facilitators assign each of the working groups one of the following
seven red-teaming techniques to use in critically examining each of the scenario stubs that
group will be responsible for red-teaming that day. Facilitators (a different one is assigned
to assist each of the groups) will spend fifteen minutes explaining to a group its assigned
red-teaming technique and will answer any questions regarding how the technique is to be
346 University of Foreign Military and Cultural Studies Center for Applied Critical Thinking, The
Applied Critical Thinking Handbook (formerly the Red Team Handbook) (version 8.1), (Leavenworth, KS: University of Foreign Military and Cultural Studies, September 2016), 101-102, http://usacac.army.mil/sites/default/files/documents/ufmcs/The_Applied_Critical_Thinking_Handbook_v8.1.pdf.

238
used. These facilitators will also briefly check in with the working groups to which they
are assigned, to make sure any difficulties or questions that arise during the red-teaming
process are addressed. If there are more groups than there are red-teaming techniques, more
than one group will be assigned the same red-teaming technique, and the red-teaming
technique that gets “double coverage” will change from day to day. One goal of this phase
is to familiarize as many team members with the use of as many different red-teaming
techniques as possible. The red-teaming techniques include:
Team A/Team B: The group separates itself into two debating sub-teams
comprised of two members apiece. One sub-team will argue that the
scenario stub will become actualized, and the other will argue that the
scenario stub will never actualize. Each sub-team assembles evidence for
its own hypothesis and then presents that evidence in an oral debate
format. The two sub-teams spend the first five minutes brainstorming
evidence for their hypotheses. Then each group is given five minutes for a
first-round oral presentation to the other. This is followed by five minutes
for sub-teams to come up with rebuttals of the other sub-team’s evidence.
Then there is a second round of oral presentations, five minutes apiece for
each sub-team. This is followed by three minutes for the sub-teams to
assemble closing arguments. Each sub-team takes two minutes to present a
closing argument. The last eight minutes of the red-teaming procedure are
given over to an open discussion period, during which group members
may offer their opinions regarding the strengths of the arguments
presented, and time to make notes for the presentation on the debate and
the points it raised to the entire team. (Adapted from UFMCS Red Team
Handbook, 2012)
Strengths, Weaknesses, Opportunities and Threats (SWOT) Analysis:
The group separates itself into two sub-teams comprised of two members
apiece. Each sub-team, based upon the scenario stub, creates a four-
quadrant diagram (strengths, weaknesses, opportunities, and threats) and
brainstorms entries for each quadrant. One sub-team does so from the

239
viewpoint of attackers using the Promethean technology to cause mayhem,
and the other sub-team does so from the viewpoint of homeland security
defenders. After each sub-team has spent 30 minutes preparing their
SWOT analysis, they spend the last 15 minutes of the session comparing
their notes with one another and preparing a brief presentation for the
entire team. (Adapted from UFMCS Red Team Handbook, 2012)
Devil’s Advocacy: The group spends the first ten minutes of the session
deciding upon the member’s shared conventional wisdom regarding the
scenario stub, the most widely-held and strongly-held consensus view.
They then spend the next 30 minutes constructing the strongest possible
case for a competing explanation that contradicts the consensus view,
striving to disprove the consensus view by uncovering evidence that was
either faulty or ignored in the original analysis and proving the assertion
opposite to the consensus view. The group spends the last five minutes of
the session preparing a brief presentation for the entire team. (Adapted
from UFMCS Red Team Handbook, 2012)
Measure-Countermeasure, Move-Countermove: This exercise is meant
to explore the secondary and tertiary impacts of malign uses of emerging
Promethean technologies. The group plays this in rounds, each round
taking ten minutes. At the beginning of the first round, the group “plays”
the attackers and decides upon the use of the Promethean technology, per
the scenario stub. Then the group brainstorms what might be the
prompt/primary, secondary, and tertiary effects of this attack, including
impacts upon the economy, vital infrastructure, politics, social
psychology, and individual liberties. At the beginning of the second round,
the group “plays” the defenders and decides upon what would be the most
likely countermove or countermeasure that the homeland security
enterprise would put into place in response to the attack. Then the group
brainstorms what might be the prompt/primary, secondary, and tertiary

240
effects of putting this defense into place, focusing on impacts in the same
areas mentioned above. At the beginning of the third round, the group
shifts back to “playing” the attackers, brainstorming how the attackers
would most likely respond to the defenders’ initial countermove(s), and
otherwise replicating the same processes as were followed in the first
round. In the fourth and final round, the group once again “plays” the
defenders. The group spends the final five minutes of the session
preparing a brief presentation for the entire team. (Adapted from Brian A.
Jackson et al., Breaching the Fortress Wall: Understanding Terrorist
Efforts to Overcome Defensive Technologies, 2007)
Alternative Futures Analysis: At the beginning of the exercise, the group
will spend eight minutes deciding which two sets of influencing forces
they wish to apply to the scenario stub. Two sets of critical or uncertain
influencing forces are chosen to be placed on sets of axes, forming a
matrix of two forces at varying combinations of strength or intensity,
facilitating analysis of four potential alternative futures (in more elaborate
and longer Alternative Futures exercises, as many as four or five axes
might be selected, resulting in an expanded number of combinations of
forces at varying combinations of strength or intensity). For example, the
two axes chosen might be economic health (recessionary economic
climate vs. vigorous economic growth) and environmental stability (a
period of violent weather events and drought versus a period of climate
stability). In this example, the group would consider four quadrants and
how the scenario stub being played out within each of those quadrants
would impact that scenario; the four quadrants would be (a) recessionary
economic climate/severe weather events; (b) recessionary economic
climate/environmental climate stability; (c) vigorous economic
growth/severe weather events; and (d) vigorous economic
growth/environmental climate stability. A different example would be if
the two axes chosen were domestic political stability (severe domestic

241
political conflict and violence vs. stable, cooperative domestic political
environment) and international political stability (numerous international
conflicts and high instability vs. relative peace and international stability).
In this second example, the four quadrants would be (a) severe domestic
political conflict and violence/numerous international conflicts and high
instability; (b) severe domestic political conflict and violence/relative
peace and international stability; (c) stable, cooperative domestic political
environment/numerous international conflicts and high instability; and (d)
stable, cooperative domestic political environment/relative peace and
international stability. Whichever set of axes the group chooses, the group
will spend eight minutes per quadrant brainstorming how the scenario stub
playing out within that quadrant would impact the use and consequence of
the Promethean technology. Would the likelihood of use of the
Promethean technology be increased or decreased by the quadrant’s
characteristics? Would the likelihood of malign use be increased or
decreased? Would the resulting severity of a malign use be increased or
decreased? Would the defenders’ tasks be made difficult by the quadrant’s
characteristics? The group spends the final five minutes of the session
preparing a brief presentation for the entire team. (Adapted from UFMCS
Red Team Handbook, 2012)
Analysis of Competing Hypotheses: The group spends the first five to
ten minutes of this exercise identifying three or four plausible or
compelling hypotheses relating to the scenario stub (possible examples
might include, “Use of the Promethean technology in a malign way will
result in a severe curtailment of civil liberties in the United States,” or,
“Repeated use of the Promethean technology in a malign way will result in
a U.S. economic recession, due to increased fear surrounding use of the
Internet and a growing reluctance by members of the public to engage in
economic activities online”). The various hypotheses may conflict with
one another. Depending upon the number of competing hypotheses to be

242
dissected, the group will spend between seven and ten minutes on each
one. For each hypothesis, two members brainstorm a matrix of supporting
evidence for that hypothesis and factors that would need to be present for
the hypothesis to come true, and two members brainstorm a matrix of
disproving evidence and factors whose presence would make it highly
likely for the hypothesis to be false. If time allows, members analyze how
sensitive various hypotheses are to pieces of evidence or supporting or
negating factors (if an evidence node or factor is removed, does the
hypothesis then become unreasonable?). The group spends the final five
minutes of the session preparing a brief presentation for the entire team.
(Adapted from UFMCS Red Team Handbook, 2012)
Through the Terrorist’s Eyes: The group spends the first fifteen minutes
of this exercise “trying on the shoes” of various types of terrorists—
jihadists, nihilists, or thrill seekers (per Boyd et al., Thwarting an Evil
Genius, 2009), or right-wing terrorists, left-wing terrorists, or members of
apocalyptic cults (per Hudson, The Sociology and Psychology of
Terrorism, 1999)—and discussing which groups and what types of
adherents/sympathizers would be most likely, or less likely, to seek to use
the type of Promethean technology embedded in the scenario stub, and
various reasons why. The group decides upon one category of terrorist
whose viewpoint will be adopted for the remainder of the exercise. Then
the group spends 25 minutes filling in Sandia National Laboratories’
Generic Threat Matrix, keeping in mind the type of terrorist or terror
organization selected for analysis. The group will assign ratings of High,
Medium, or Low to matrix categories including (a) intensity (level of
dedication to his cause that the antagonist brings to an attack); (b) stealth
(ability of the antagonist to keep his activities hidden); (c) time (period
required to plan, organize, supply, and carry out an attack); (d) technical
personnel (number of subject matter experts who are required to carry out
an attack successfully); (e) cyber knowledge (antagonist’s level of
243
expertise in computer systems, computer networks, and computer
security); (f) kinetic knowledge (antagonist’s level of expertise regarding
the defender’s physical barriers and the methods with which to defeat
those); and (g) access (adversary’s level of accessibility to the target). The
group spends the final five minutes of the session preparing a brief
presentation for the entire team. (Adapted from David P. Duggan et al.,
Categorizing Threat: Building and Using a Generic Threat Matrix, 2007)
Step Four—Red Team Each Scenario Stub, Then Present Results to Entire
Team and Allow for Questions: Each group (in our current example, eight in number)
red teams one randomly assigned scenario stub, spending 45 minutes on its red-teaming
exercise. Then all the groups reconvene for a plenary session. Each group takes five
minutes to present a summary of its findings to the assembled team, and each presentation
is followed by up to ten minutes of questions. Facilitators should compile notes of the
groups’ findings regarding each scenario stub, as well as clarifications provided and
answers to questions posed; they will distribute these notes in conjunction with a list of all
the scenario stubs to the participants, prior to the participants’ ranking of the scenario stubs.
In our current example, red-teaming sessions of eight scenario stubs, complete with
sharing of results and questions and answers, takes about 165 minutes or 2.75 hours (45
minutes for the red-teaming exercises themselves, 40 minutes for eight presentations, and
80 minutes for eight Q&A sessions). With breaks and a 45–minute lunch, three such
sessions could be accomplished in a work day, for a total of 24 scenario stubs red teamed
per day. In our current example, which envisions an initial set of between 60 and 90
scenario stubs, red-teaming all them would take either three or four work days.
G. PHASE FIVE: RANK THE SCENARIO STUBS
This phase takes place entirely during the face-to-face portion of the process. The
goal of Phase Five is for the participants to collectively rank, in ordinal fashion, the
scenario stubs in terms of severity of potential consequence and likelihood of being
actualized. The desired output is a “deadly dozen” of scenario stubs, those 12 scenarios
that participants, in the terms of this thesis’s central parable, have judged to be the very

244
worst of the gestating toys that may eventually spring forth from the devil’s toy box. During
this phase, due both to the relatively large number of scenario stubs to be ranked and to the
participants’ relative lack of familiarity with the scenarios (the participants will become far
more familiarized with the “deadly dozen” scenarios, since those will be fully fleshed out),
the facilitators will not ask participants to judge themselves on their levels of expertise and
confidence in their ability to answer questions, and the facilitators will not use the results
of the forecasting pre-test to weigh responses or to assist with eliminating lower-scoring
participants’ responses from the amalgamated results. Such statistical refinements will be
used in a later phase, when the participants are ranking the Dirty Dozen scenarios, but in
this phase, I believe application of such refinements would be nonproductive.
I do not recommend that each participant individually attempt to rank all the
scenario stubs in ordinal fashion, due to the large number of stubs to be considered.
Research has shown that individual judges are typically capable of productively ordering
no more than nine items or ideas at one time (per Delbecq, Van de Ven, and Gustafson,
1975). Instead, I suggest use of the consensus Delphi technique, described in Section F of
Chapter 4 of this thesis, in this phase to facilitate participants arriving at collective
judgments of the scenario stubs’ potential consequences and likelihoods of being
actualized.
Many online tools have been developed to facilitate Delphi procedures. As of the
time of this writing, such tools include the Delphi Learning Package for Moodle, which
can either be installed as a module in the Moodle group communications software package
or as a stand-alone module (https://sourceforge.net/projects/delphilearningpackage4moodle/?
source=directory); the Mesydel package, developed at the University of Liège (https://
mesydel.com/en#vision); Delphi Decision Aid, developed by J. Scott Armstrong with
financial backing from the International Institute of Forecasters and the Ehrenberg-Bass
Institute at the University of South Australia (http://armstrong.wharton.upenn.edu/delphi2/);
Delphi Blue, an open source, Java/JSP version of the Delphi technique, originally
developed by DARPA (https://sourceforge.net/projects/delphiblue/); and Calibrum, a
commercial product that allows users to select different variations of the Delphi technique
(https://calibrum.com/). Additionally, online polling software such as SurveyMonkey

245
(https://www.surveymonkey.com/mp/online-polls/) or Sli.do (http://www.slido.com/) can be
adapted by facilitators to quicken the pace and ease the administration of consensus Delphi
procedures. (Please be aware that, due to the swift pace of software development and the
rise and fall software firms and open source development efforts, these links may no longer
be functional by the time these instructions are accessed, and the software packages
mentioned above may have been superseded by other products.)
A very large number of consensus Delphi procedures will need to be conducted
during this phase, given the high quantity of scenario stubs that need to be rated and the
fact that participants will rate each scenario stub nine times—once on severity of
consequence, once on the likelihood of the emerging Promethean technology being
developed and marketed within a five- to ten-year window, six times on six different
limiting or retarding factors that influence the likelihood of the come-to-market
Promethean technology being used to promulgate the catastrophic outcome(s) envisioned
(potential retarding factors influencing the likelihood of the scenario being actualized), and
once on overall probability of the scenario’s being actualized. To not lengthen the face-to-
face portion of Pandora’s Spyglass inordinately, facilitators should randomly divide the
full team into two half-teams at the beginning of each work day spent in this phase. Each
scenario stub will be rated by half the full team, and each participant will be tasked with
rating half the scenario stubs. Research regarding the wisdom of crowds suggests the bulk
of improvement in accuracy of forecasting through increasing the size of the crowd comes
when crowd size is increased from 10 participants to 20 (per Satopää et al., 2014). Since
the Pandora’s Spyglass team will be made up of between 25 and 40 members, dividing the
full team into two halves will not substantially reduce the quality or accuracy of the
estimates provided. Dividing the team into two halves, with each half performing its
consensus Delphi procedures simultaneously in two separate rooms, will decrease the time
that needs to be spent in this phase by fifty percent, an appreciable time savings.
Step One—Facilitators Provide Participants with List of Scenario Stubs: All
participants receive a complete list of the scenario stubs. A summary of the results of the
red-teaming exercise and answers or clarifications that resulted from Q&A sessions is
included with each stub description.
246
Step Two—Participants Rate Each Scenario Stub Regarding Severity of
Potential Consequences: Rather than using a numeric scale (1–10 or 1–100, etc.) for
severity of potential consequences, participants should be instructed to consider severity in
dollar terms. This will help them distance themselves from emotional reactions when
contemplating the relative weights of various malign consequences (for example, due to
our human sympathies, many participants’ snap judgments will tend to assign a higher
severity of consequences score to the violent deaths of a group of ten victims than to an
event that shuts down the Nation’s airports for three days straight, even though the
economic cost to the Nation is far higher for the second event than for the first). Although
the assignment of a dollar value to a human life may strike some participants as cold-
blooded or even offensive, for the purposes of the current analysis, it is necessary. Various
estimates of the dollar value of the life of an American have been calculated by different
insurance companies and governmental institutions; for use with the current analysis,
selection of any of these would be acceptable. The U.S. Department of Transportation
utilizes a value of a statistical life (VSL) of $4.4 million for its cost-benefit analyses of
proposed new traffic safety regulations.347 For ease of calculations by participants, I
suggest rounding this figure down to a VSL of an even $4 million.
Participants should be instructed to also consider the dollar values of secondary and
tertiary consequences. Some of these secondary and tertiary consequences May like the
prompt, primary consequences, involve loss of human life, injuries, or illnesses, but many
will have effects more of economic impact, such as losses to local, regional, or the National
economy. Since participants may feel overwhelmed by this task, facilitators should tell
them that these are “back of the envelope” estimates, and that no participants are expected
to perform as professional econometricians, certainly not in the limited time provided and
with the limited data available. For the first round of the consensus Delphi to collectively
decide severity of potential consequences, participants should be allotted 20 minutes to
calculate an economic estimate of the primary, secondary, and tertiary impacts they see
arising from the scenario stub. They should also be encouraged to provide brief statements
347 John Mueller and Mark G. Stewart, Terror, Security, and Money: Balancing the Risks, Benefits,
and Costs of Homeland Security (New York: Oxford University Press, 2011), 56.

247
of why they settled on their dollar figure, providing their rationales and a bullet-type list of
the factors they considered. Participants should be assured that their responses will be
anonymous, as they will enter both their dollar value estimates and their brief rationales
through a software package that allows for anonymous online polling and/or Delphi
procedures.
Facilitators should take a moment to urge participants, prior to their beginning their
rating procedures in this step and future steps, to be consistent with their assumptions from
scenario to scenario. In other words, if a participant judges that a secondary impact of both
Scenario C and Scenario F is that the Nation’s airports all get shut down for one week to
allow for additional security measures to be put into place, that participant should assign
the same dollar magnitude of cost to the economy for this secondary impact for both
scenarios (such as $20 billion). So long as individual judges remain consistent with their
assumptions from evaluation to evaluation, any errors they may make in estimating costs
will be uniformly applied across their range of ratings for scenarios and will thus not affect
their ordinal rankings of those scenarios. Facilitators should instruct participants to build
for themselves a personal “assumptions dictionary,” either in a Word file or an Excel file,
adding to it as they come up with fresh assumptions to apply. This will allow judges to go
back to assumptions they have made use of earlier and reuse them, allowing for both
consistency and for increased speed and convenience of judging. These collected
“assumptions dictionaries” will also provide facilitators with a valuable source of data
should they, at some point, opt to attempt a validation of the variables contained within
Pandora’s Spyglass, or for researchers who wish to examine correlations between
individual participants’ sets of assumptions and their forecasting scores (results of the
forecasting pre-test) or self-ratings of confidence/expertise on questions.
For the second round of the consensus Delphi, each participant should be
electronically provided with the following pieces or sets of information: (a) their own
previously submitted dollar value estimate; (b) the full team’s median dollar value estimate
(a mean or average should not be used in this instance, due to the likelihood of outliers
pulling the mean up or down); (c) additional summary statistics, including standard
deviation, mean, mode, and minimum and maximum values; and (c) a list of the rationales

248
anonymously submitted by the full team. Participants should be allotted 15 minutes to
consider these materials and to reassess their initial dollar value estimate. They may opt to
either stick with their initial estimate or adjust their estimate based upon the materials they
have read. Again, all responses to the second round of the consensus Delphi are submitted
anonymously. During this second round, participants are not asked to submit rationales for
either sticking with their initial estimate or changing that estimate.
The facilitators calculate the median dollar value of the full team’s estimates from
the second round. This median value is the consensus value for this scenario stub. The
facilitators share the consensus value with the participants. In the interest of conserving
time, discussion is not permitted. Then this process is repeated for each of the remaining
scenario stubs in turn. The facilitators should schedule stretching, snacks, and bathroom
breaks, as appropriate.
Step Three—Participants Receive Refresher Training in the Laws of
Probability and How to Calculate Probabilities: At this point, the facilitators should
provide a more in-depth version of the training they provided in an on-line format back
during Phase Two. This training session, between two and three hours, should include
material on the laws of probability, including compound and contingent probabilities (per
Wright, Rowe, Bolger, and Gammack, 1994) and on how to use Bayesian statistical
methods to refine or change probability estimates in response to new information (per
Tetlock, Superforecasting, 2015). Douglas W. Hubbard provides a helpful set of calibration
tests and answers that may be included as part of this session (per Hubbard, Appendix, The
Failure of Risk Management, 2009). Facilitators should allow adequate time throughout
for questions and clarifications.
Step Four—Participants Rate Each Scenario Stub Regarding the Likelihood
of Its Becoming Actualized: At the beginning of this step, which is broken out into
multiple sub-steps, facilitators should instruct participants that when they estimate the
probability of a scenario stub becoming actualized, they will consider not only the
likelihood of the key enabling technologies reaching market within the next five to ten
years, which is the independent base probability, but also the magnitude of the following
six probability limiting or retarding factors that influence the likelihood of the come-to-

249
market Promethean technology being used for malign purposes. These limiting or retarding
factors are: (a) affordability of anticipated acquisition cost of the Promethean technology
or its enabling components in five to ten years’ time; (c) appeal of the Promethean
technology to the various types of terrorists and terror groups (jihadists, nihilists, thrill
seekers, rightwing terrorists, leftwing terrorists, and acolytes of apocalyptic cults)
compared with alternative modes of attack; (d) logistical complexity—the amount of time
required to plan, organize, supply, and carry out an attack using the Promethean technology
and the number of personnel required; (e) the level of cyber knowledge or other
scientific/technical expertise required to make malign use of the Promethean
technology,(i.e.,) the level of expertise in computer systems, computer networks, and
computer security required, or in chemistry, biology, physics, or engineering; (f) the level
of kinetic knowledge required to carry out a successful attack using the Promethean
technology,(i.e.,) the level of expertise regarding the defender’s physical barriers and the
methods with which to defeat those; and (g) the level of access an attacker requires to a
target to successfully carry out an attack using the Promethean technology. The team will
collectively rate on a Low-High scale each of these probability limiting factors in turn,
working one scenario stub at a time.
The likelihood of the key enabling technologies reaching market within the next
five to ten years is the independent base probability. The probability figure calculated for
this measure also represents the highest possible probability of the Promethean technology
not only coming to market but also being used to promulgate the catastrophic consequences
envisioned in the scenario. In other words, if the team calculates that the likelihood of
Promethean Technology X coming to market within a five- to ten-year window is 45%, the
ceiling, or the absolute maximum, probability of Technology X being used for the malign
purpose envisioned in the scenario in question is 45%. The highest value (which represents
the lowest retarding effect) that can be assigned by the team to any or all the probability
limiting factors is 1.00 or 100%. If all six probability limiting factors are assigned scores
of 1.00 or 100%, the likelihood of Technology X being used for the malign purpose
envisioned in the scenario would be 45%, the same probability estimated for Technology
X coming to market within a five- to ten-year window. As their name implies, the

250
probability limiting factors act to drive the probability of malign use of an actualized
Promethean technology lower. The stronger the limiting factors are judged to be, the more
they will tend to drive the probability of malign use downward. The probability limiting
factors, expressed as percentages, are stronger in their impact the lower their percentages
are estimated to be (i.e.: a probability limiting factor of .25 or 25% is stronger in its impact
of lowering the likelihood of an actualized Promethean technology being used for a malign
purpose than a probability limiting factor of .75 or 75%, since the limiting factors are
applied through multiplication). Each of the probability limiting factors is judged by team
members on a scale ranging between 0 and 1, inclusive of 1, with a score just above 0
representing the highest limiting or retarding impact of that factor and a score of 1
representing a complete absence of limiting or retarding impact. (I have chosen to not allow
a score of 0 for a probability limiting factor because this would imply an infinite retarding
power for that factor, rendering the malign use of an actualized Promethean technology an
impossibility, rather than extremely, extremely unlikely; and I assume that once a
technology is invented, there is always at least some level of likelihood, no matter how
small, that it will be used for destructive purposes.)
Scores get converted into percentages. By not assigning participants a three-point,
five-point, or ten-point scale to use, but rather allowing them to choose any decimal
(percentage) figure between 0 and 1, inclusive of 1, I avoid several problems that Douglas
W. Hubbard has identified with such scales when used for evaluation of risks. These
problems include range compression, presumption of regular intervals, the tendency of a
large proportion of respondents to select either 3 or 4 as their responses when offered a
five-point scale, and the fact that different respondents interpret qualitative descriptions
associated with a five-point (or three-point, or ten-point) scale differently.348 I do include
qualitative descriptions of various ranges of possible responses, but only as a guide for
participants.
Regarding likelihood of the key enabling technologies reaching market within the
next five to ten years, since this is the independent base probability that will be used in
348 Hubbard, The Failure of Risk Management, 122–134.

251
calculating the likelihood of a Promethean technology not only coming to market but also
being used for malign purposes, participants will assign a probability score of any number
between 0% (no possibility of the enabling technologies being developed within the next
five to ten years and the Promethean technology being brought to market) and 100%
(certainty that the enabling technologies will be developed within the next five to ten years
and the Promethean technology will be brought to market). Facilitators should provide the
participants with following adjectival scale to help guide their selection of a probability
score: Impossible = probability of 0%; Extremely Unlikely = probability between 0% and
19%; Unlikely = probability between 20% and 44%; About Equally Unlikely as Likely =
probability between 45% and 54%; Likely = probability between 55% and 79%; Extremely
Likely = probability between 80% and 100%; Certain = probability of 100%. The same
consensus Delphi procedure as described in Step Two above is followed, but participants
are given 15 minutes to make their first round estimate and to submit supporting rationales,
and ten minutes during the second round to review their fellow team members’ rationales,
the mean of the full team’s responses (rather than the median value), and the additional
summary statistics, and then consider whether to stick with their original estimate or to
adjust their estimate based on the information reviewed. The facilitators calculate the mean
value of the full team’s estimates from the second round. This mean value is the consensus
value for the likelihood of the key enabling technologies reaching market for this scenario
stub. The facilitators share the consensus value with the participants. In the interest of
conserving time, discussion is not permitted.
For the first scenario stub, the participants use the same consensus Delphi procedure
for each of the six probability limiting factors that influence the likelihood of the come-to-
market Promethean technology being used for malign purposes. The only change is that
participants are given five minutes to make their first-round estimate and to submit
supporting rationales, and five minutes during the second round to review their fellow team
members’ rationales, the mean of the full team’s responses, and the additional summary
statistics, and then consider whether to stick with their original estimate or to adjust their
estimate based on the information reviewed. Rating scales for the six probability limiting
factors are provided below. Once again, please be reminded that qualitative descriptions

252
are to be used by participants merely as guides in their selection of values between 0 and
1, inclusive of 1. Facilitators should provide participants with the full set of guidelines in
writing (or pixels) for participants’ reference.
Also, facilitators should provide this instruction regarding the scoring of probability
limiting/retarding factors: “You will judge the strength of each probability
limiting/retarding factor individually for each scenario, in isolation from consideration of
any of the other limiting/retarding factors. As you are judging each factor, do so under the
presumption that it is the sole retarding factor impacting the likelihood of a developed
technology being used for the malign purpose envisioned in the scenario. If you feel this
factor makes it virtually impossible that the developed technology will be used for the
malign purpose envisioned, score the factor close to 0. If you feel this factor exerts very
little or no retarding influence on the likelihood of the use of the developed technology for
the malign purpose envisioned—that you can pretty much say that if the technology exists,
it will be used for this destructive purpose, so the probability of the technology coming to
market AND being used for the malign purpose is the same as the probability of the
technology coming to market—score this factor close to 1.0 (hardly any retarding
influence) or score it 1.0 (no retarding influence at all). If you feel the influence of the
limiting/retarding factor falls somewhere between these two extremes, please use the
provided descriptions as a guide to your rating.”
Affordability of anticipated acquisition cost of the Promethean technology or its
enabling components five to ten years in the future:
0–.19 = Highly Unaffordable, Save for Well-Funded Organizations ($200 thousand or
more)
.2–.49 = Mostly Unaffordable, Save for Well-Funded Organizations (between $50
thousand and $200 thousand)
.5–.79 = Affordable for Organizations, Mostly Unaffordable for Individuals (between $10
thousand and $50 thousand)
.8–.94 = Somewhat Affordable for Individuals (between $1000 and $10 thousand)
.95–1.0 = Highly Affordable for Individuals (less than $1000)

253
(If the scenario involves use of the technology by an individual, the participant
should score the Affordability retardant more strongly, (i.e.,) numerically lower, than if the
scenario involves use of the technology by an organization. If a team member estimates
that the acquisition cost falls near one of the extremes of a suggested dollar range, that team
member should select a fractional value close to the top or bottom of the suggested range.
This stipulation applies to all the remaining limiting factors, as well.)
Appeal of the Promethean technology to the various types of terrorists and terror
groups, compared with alternative modes of attack:
0–.19 = Extremely Unappealing (use of the technology conflicts with the attacker’s
religious precepts, morality, or ideology AND/OR attacker judges that use of the technology
promises much lower likelihood of success than use of alternate attack modes AND/OR use of the
technology will very likely bring condemnation from the attacker’s allies and potential supporters
AND/OR use of the technology will very likely incite a powerfully disproportionate punitive
response from a nation state or coalition of nation states… the technology is judged to be “too hot
to handle” and/or “more trouble than it is worth”)
.2–.79 = Unappealing (attacker judges use of the technology promises at least some
marginal decrease in likelihood of success than use of alternate attack modes AND/OR use of the
technology is more likely than not to bring condemnation from the attacker’s allies and potential
supporters AND/OR use of the technology is more likely than not to incite new punitive measures
of increased severity from targeted nation state(s) and powerful enemies, representing a risk that
the attacker’s use of the technology will retard the attacker’s goals more than the use advances
those goals)
.8–.89 = Neither Especially Unappealing or Especially Appealing (attacker judges that use
of the technology suffers no significant disadvantages or offers no significant advantages when
compared with alternate modes of attack; choice to use technology over alternate modes of attack
most likely due to availability or convenience rather than any real preference)
.9–.94 = Appealing (attacker judges use of the technology promises at least some marginal
increase in likelihood of success than use of alternate attack modes AND/OR use of the technology
is more likely than not to bring approbation from the attacker’s allies and potential supporters
AND/OR attacker judges use of the technology will reduce the morale and will to resist of target
nation state(s) and powerful enemies and advance the attacker’s goals)

254
.95–1.0 = Extremely Appealing (use of the technology is an excellent fit with the attacker’s
religious precepts, driving narrative, or ideology AND/OR attacker judges use of the technology
promises much higher likelihood of success than use of alternate attack modes AND/OR use of the
technology will very likely bring great approbation from the attacker’s allies and potential
supporters AND/OR attacker judges use of the technology will very likely significantly cow and
intimidate target nation state(s) and powerful enemies and significantly advance the attacker’s
goals)
Logistical Complexity—time required to plan, organize, supply, and carry out an
attack using the Promethean technology and the number of personnel required:
>0–.19 = Very High Complexity (three years or more; 50 personnel or more)
.2–.39 = High Complexity (one to three years; 20–50 personnel)
.4–.69 = Medium Complexity (two months to one year; 10–20 personnel)
.7–.94 = Low Complexity (two weeks to two months; 3–10 personnel)
.95–1.0 = Very Low Complexity (days to two weeks; 1–2 personnel)
Level of cyber knowledge or other scientific/technical expertise required:
>0–.19 = Very High (post-graduate level skills and expertise needed, and/or five years or
more of professional experience in the field)
.2–.49 = High (baccalaureate level skills and expertise needed, and/or three years or more
of professional experience in the field)
.5–.69 = Moderate (associate’s level or certificate program level skills and expertise
needed, and/or one year or more of professional experience in the field)
.7–.94 = Low (skills and expertise can be easily acquired and absorbed through books or
Internet research, and/or three months or more of professional experience in the field)
.95–1.0 = Very Low (no special skills or expertise are required, nor is any work experience
in the field; Promethean technology is consumer-grade and comes with instructions that the average
user can follow, with assistance, if needed)
Level of kinetic knowledge required:

255
>0–.19 = Very High (to carry out a successful strike, attackers must penetrate or bypass
highly sophisticated defensive systems WITH multiple layers of defense, including both automated
or passive defenses AND manned defenses)
.2–.39 = High (to carry out a successful strike, attackers must penetrate or bypass a
sophisticated defensive system OR multiple layers of defense, including automated or passive
defenses and/or manned defenses)
.4–.79 = Moderate (to carry out a strike, attackers must penetrate or bypass ordinary,
unsophisticated barriers such as might be found at a special event or a school, which might include
fences, walls, locked entrances, bollards or traffic barriers, or areas with restricted access, AND
avoid detection by law enforcement or security guards assigned to protect the site)
.8–.94 = Low (to carry out a successful strike, attackers must penetrate or bypass ordinary,
unsophisticated barriers such as a fence, a wall, and/or locked entrances, and avoid detection by
patrolling law enforcement not specifically assigned to the site of the attack)
.95–1.0 = Very Low (to carry out a successful strike, attackers must access a space
normally open to the public with no restrictions, that is not normally patrolled by law enforcement
or security guards)
Level of access an attacker requires:
>0–.29 = Very High (to carry out a successful strike, attackers need to become vetted
employees or contractors of an institution that uses vigorous background checks in its hiring
process and requires at least a public trust clearance level, or its equivalent AND significant
surveillance is necessary)
.3–.79 = High (to carry out a successful strike, attackers need to be vetted visitors, getting
permission to access a facility from a security staff AND having to pass through a metal detector
and have one’s belongings be searched or electronically scanned, OR significant surveillance is
necessary)
.8–.89 = Moderate (to carry out a successful strike, attackers need to enter a facility with
no restrictions on entrance, without raising suspicions from employees, security guards, or other
visitors, AND moderate surveillance is necessary)

256
.9–.94 = Low (to carry out a successful strike, attackers do not need to enter a facility or
site but only require physical proximity, such as from a street or sidewalk; moderate surveillance
may be necessary)
.95–1.0 = Very Low (attackers can carry out a strike remotely, from a secure base of
operations, and do not require any access or proximity to the site of the attack)
Only after team members have performed consensus Delphi procedures for the
independent base probability and all six probability limiting factors for a scenario stub will
they then estimate the probability of that scenario becoming actualized. Facilitators provide
participants with 20 minutes for this procedure. They should provide participants with the
following examples of ways that the six probability limiting factors may be used in
conjunction with the independent base probability to estimate a probability of malign use.
Additionally, they should provide participants with the group’s amalgamated mean for the
independent base probability and for each of the six probability limiting factors, the
participants’ own second round scores for the independent base probability and each of the
six probability limiting factors, and summary statistics for each of the seven calculated
figures.
I do not recommend that facilitators provide participants with a mathematical
formula that assigns weights to the various probability limiting/retarding factors and
mechanically outputs an overall probability figure. My primary reason for not
recommending this is that terror attacks are highly individualistic events, each driven by
the psychology of the group’s leaders and followers or that of the individual terrorist; local
environmental factors; and chance. Any such model the facilitators might come up with
could only be validated by examining many diverse terror attacks and working backwards,
trying to estimate as best as possible what the levels of the various probability factors were
prior to attacks being carried out. I suspect that models constructed and validated in this
fashion would only be valid for a combination of terror group/category of terrorist, attack
mode, type of target, and environment of target (overall levels of security precautions; level
of governmental corruption; local weather and terrain; density of population; etc.). A model
judged to have very high validity, or measure of fit, for one such combination might have
next to no validity for other combinations, and thus a staggering number of varying models
257
would need to be constructed and validated to cover all possible combinations… that
defeats the purpose of modeling, that of simplifying predictions by providing
standardization; however, my supposition in this regard can be tested and validated, to an
extent. I will speak more about this in a later section.
My reservations about facilitators providing participants with a recommended or
assigned model must not be misconstrued to imply that participants should be forbidden
from creating and using their own models. Participants act as judges, and formulating their
own models, with the six probability limiting/retarding factors weighted individualistically
(or not assigned any weights at all), is itself a judgment activity, just as vital to the
estimation process as the assigning of the base probability figure for the Promethean
technology coming to market within a five- to ten-year window.
The simplest method for making use of the six probability limiting factors would
be for a participant to weight them all equally and calculate a simple mean of their scores.
(The limiting factor scores are averaged, rather than being multiplied together, because
probability limiting factor scores are not themselves contingent probabilities,(i.e.,) this is
not a situation of, “In order for Z to occur, W AND X AND Y all need to occur, and the
probability of W is 50%, the probability of X is 70%, and the probability of Y is 65%, so
the probability of Z occurring is 50% x 70% x 65% = 22.75%”). An example of this simple
model is provided below.
Scenario Stub XYZ
Likelihood of Reaching Market (independent base probability) = 74%
Affordability = .92
Appeal = .96
Logistical Complexity = .82
Cyber Knowledge/Scientific-Technical Expertise = .66
Kinetic Knowledge = .94
Access = 1.0

258
In this example, the probability score of the Promethean technology not only
coming to market but also being used for malign purposes would be .74 x ((.92 + .96 + .82
+ .66 + .94 + 1.00) / 6) = .65 or 65%. In this instance, none of the retarding factors had a
very strong effect, with the highest strength limiting factor being Cyber
Knowledge/Scientific-Technical Expertise. (Please note that the probability score of the
Promethean technology coming to market AND being used for malign purposes never
exceeds the independent base probability of the enabling technologies coming to market,
no matter what the weighting of the probability limiting factors may be.)
Should participants decide to create a weighted formula using the six probability
limiting factors, they should first decide which factors are more important than others and
arrange them in order of descending importance. For the example above, the selected order
might be (1) Appeal (“if the attackers are not emotionally motivated to use the technology
rather than alternative modes of attack, none of the remaining factors matter”); (2) Cyber
Knowledge/Scientific-Technical Expertise; (3) Logistical Complexity; (4) Affordability;
(5) Kinetic Knowledge; and (6) Access. Then participants should select one of the factors
to use as a “base value” against which to weight the others. Is there a factor that should be
weighted twice as heavily as another? If so, assign the latter factor a weight of “1” and
assign the former a weight of “2,” then work from there, gauging the weights of the
remaining factors relative to the weights assigned to those two factors. I provide an
example below:
Scenario Stub XYZ (Weighted Example)
Likelihood of Reaching Market (independent base probability, no weighting) = 74%
Appeal: (raw score = .96) (weight = 4)
Cyber Knowledge/Scientific-Technical Expertise: (raw score = .66) (weight = 2)
Logistical Complexity: (raw score = .82) (weight = 2)
Affordability: (raw score = .92) (weight = 1)
Kinetic Knowledge: (raw score = .94) (weight = .5 )
Access: (raw score = 100%) (weight = .5)

259
In this example, my two “base values” are Appeal and Affordability; the former is
judged to be four times as important as the latter. Both Cyber Knowledge/Scientific-
Technical Expertise and Logistical Complexity are judged to be half as important as Appeal
and twice as important as Affordability. Both Kinetic Knowledge and Access are judged
to be half as important as Affordability. The following formula shows how to calculate the
weighted mean of the example above. The denominator (in this example, 10) is the sum of
all the six weights.
.74 x (((.96 x 4) + (.66 x 2) + (.82 x 2) + (.92 x 1) + (.94 x .5) + (1.00 x .5)) / 10) = .64 or 64%
Now let’s have a look at the same example, but with different estimates for some
of the retarding/limiting factors. Let’s say that both Logistical Complexity and
Affordability are significantly retarding factors, rather than having hardly any limiting
effects at all. Logistical Complexity, formerly scored at .82, is now scored at .12, and
Affordability, formerly scored at .92, is now scored at .21.
Scenario Stub XYZ (Alternate Weighted Example)
Likelihood of Reaching Market (independent base probability, no weighting) = 74%
Appeal: (raw score = .96) (weight = 4)
Cyber Knowledge/Scientific-Technical Expertise: (raw score = .66) (weight = 2)
Logistical Complexity: (raw score = .12) (weight = 2)
Affordability: (raw score = .21) (weight = 1)
Kinetic Knowledge: (raw score = .94) (weight = .5 )
Access: (raw score = 100%) (weight = .5)
.74 x (((.96 x 4) + (.66 x 2) + (.12 x 2) + (.21 x 1) + (.94 x .5) + (1.00 x .5)) / 10) = .49 or 49%
With the retarding power of two of the probability limiting factors significantly
increased, even for two variables that are not weighted the most heavily, the probability of
malign use of the Promethean technology declines by more than a third of its earlier value,
from 74% to 49%.

260
Whatever weights participants opt to assign to the six probability-limiting/retarding
factors, facilitators should encourage participants to play with their weightings in a
spreadsheet, so that they can see how altering weights affects the overall probability of
malign use. This will help participants decide whether the formula they have created passes
the “smell test” of plausibility. Alternatively, participants may opt to consider the group’s
aggregated means of the six probability limiting factors separately and individually,
without any weighting at all, to guide their intuitive judgment of probability of the scenario
described in the stub becoming actualized. Whatever method is used, participants should
perform a “gut check” regarding whether the probability result they end up with seems
reasonable, based upon the information they have absorbed thus far regarding the scenario
in question. If their gut tells them the result is not reasonable, they should reexamine the
assumptions they have made in coming up with that result and alter those assumptions, if
necessary.
The final, consensus probability score of a scenario stub becoming actualized, of
the Promethean technology not only coming to market but also being used in a malign
fashion per the scenario, is the mean of the group’s overall probability scores. Once the
facilitators calculate this probability value, they share the consensus value with the group.
Then the group moves on to performing the same set of consensus Delphi procedures for
rating probability for the next scenario stub, and so on, until participants have ascertained
consensus probability ratings for all the scenario stubs.
Step Five—Facilitators Calculate Estimated Risk Levels for Each Scenario
Stub: Estimated risk levels are all expressed in dollar terms, to allow for easy ranking and
comparisons. The formula for risk in this instance is:
Risk = (Consensus Estimated Dollar Value of Scenario’s Consequences) x
(Consensus Estimated Probability of the Scenario Becoming Actualized)
Facilitators then provide participants with a list of all the scenario stubs ranked in
descending order of risk, with the risk formula figures provided for each. They inform
participants that only the 12 scenario stubs at the top of the risk estimation list will be
further worked on and fleshed out into full scenarios for a final ranking process.

261
Step Six—Finalizing Determination of the “Deadly Dozen” Scenarios: At this
point in the process, some participants, when exposed to the ranked list of all the scenario
stubs, may feel that vital elements of threat scenarios are being discarded by the cut-off
that leaves only the top twelve. Facilitators should ask whether any participants feel this
way, allowing participants to indicate this through anonymous electronic means. Should
any participants express such reservations with the preliminary “deadly dozen” list of
scenario stubs, the full group will then follow a nominal group technique process to arrive
at a consensus resolution of a revised list.
Facilitators should inform the group that the preferred option for incorporating
scenario stubs or elements of scenario stubs that are ranked below the “deadly dozen” is to
combine the excluded elements with one of the top twelve scenario stubs, should such
amalgamations be logical, in that the newly incorporated elements are congruent and
complementary with the elements in the top-ranked scenario stub. The preferred outcome
is that the list of scenarios to be fleshed out should remain at 12, in the interests of
expediting the analytical effort; however, should the group decide this outcome is
impractical yet still want to include certain scenario stubs excluded in the preliminary list,
the group, using NGT processes, may opt to expand the list of scenario stubs to be further
worked with from a “deadly dozen” to a “threatening thirteen,” a “frightening fourteen,”
or a “ferocious fifteen.”
Following the nominal group technique procedure, any participants who wish to
may anonymously electronically submit their ideas for amalgamation of a lower ranking
scenario stub with one of the top twelve, or for adding a lower ranking scenario stub to the
list of “survivors.” Submitting participants should also provide a brief rationale supporting
their suggested change. Facilitators should allot ten minutes for this part of the procedure,
if called for. Then the round-robin questions and answers session begins. One suggestion
is considered at a time. One participant speaks at a time, asking one question or making
one observation regarding the suggestion, or offering a reason to support or disagree with
the suggestion. Facilitators should instruct participants to keep their round-robin inputs
brief and to the point. The suggestion’s contributor, anonymous until now, may opt to
respond or may decline to answer. After a full round of Q&A, the facilitators should ask

262
whether another round is needed. The facilitators then ask for anonymous Yes/No
electronic votes. Round-robin Q&A and follow-on voting takes place first for
amalgamation suggestions. If an amalgamation suggestion is voted YES by the group and
that amalgamation integrates a lower ranking scenario stub into one of the top twelve, no
round-robin Q&A or follow-on voting is done for a suggestion that this same lower ranking
scenario stub be separately added to the list of top twelve scenarios. Round-robin Q&A
sessions and follow-on voting are carried out last for suggestions to add additional scenario
stubs to the list of “survivors.”
H. PHASE SIX: FLESH OUT THE “DEADLY DOZEN” SCENARIOS
Phase Six of the Pandora’s Spyglass analysis, that of expanding the “deadly dozen”
scenario stubs into full-fledged scenarios, is the last phase that takes place during the face-
to-face portion of the process. Our bedraggled participants are begging to go home! But I
have saved perhaps the best, most fun part of the face-to-face portion of Pandora’s Spyglass
for last. Participants get to apply the scenario development and red-teaming skills they have
learned thus far in a creative, interactive fashion. Earlier, in my chapter examining Futures
Studies/Foresight Studies, I discussed the work of Amy Webb, author of the book The
Signals are Talking, in which she offers a procedural road map for prognostication, whose
six steps alternate between what she terms “flaring” and “focusing.” “Flaring” is a
widening of vision to encompass as much information and as many signaling indicators as
possible, while “focusing” is a narrowing of vision to the most pertinent environmental
factors impacting one’s organization. Pandora’s Spyglass also alternates between sets of
flaring phases and sets of focusing phases. Phase One, Environmental Scanning, Phase
Two, Assembling the Team, and Phase Three, Brainstorm Scenarios, are all flaring phases
that seek to cast a wide net to gather disparate knowledge, insights, and opinions. The end
of Phase Three, which involves grouping and amalgamating of similar or related scenario
stubs, shifts the team’s efforts into focusing. Focusing continues into the next phase, Phase
Four, Red Team the Scenario Stubs, during which team members apply various critical
thinking exercises to the assembled scenario stubs. Focusing grows sharper in Phase Five,
Rank the Scenario Stubs, during which participants individually calculate estimates of
dollar values of consequences and estimate probabilities of scenario stubs becoming

263
actualized, then use consensus Delphi and nominal group technique procedures to arrive at
team consensus risk scores for each scenario stub, and finally rank the scenario stubs in
order of those risk scores, discarding all but the “deadly dozen,” those with the top-ranked
risk scores; however, in Phase Six, the remaining scenario stubs are expanded into full-
blown scenarios, a flaring activity that adds detail, depth, richness, and relatability to each
of the “deadly dozen.” This will allow for more in-depth and sophisticated forecasting and
ranking procedures than have been employed thus far, for when Pandora’s Spyglass shifts
back to its focusing phases.
Step One—Divide the Full Team into Scenario Expansion Sub-Teams:
Facilitators should aim to assemble half as many sub-teams as there are surviving scenario
stubs, so that each sub-team will be responsible for fleshing out two scenarios. Sub-teams
do not have to all consist of the same number of members; however, facilitators need to
assign a science fiction writer as the lead scenario writer/scenario expansion facilitator, and
they should also strive to match team subject matter experts (scientific, technical,
academic, or homeland security practitioners) with appropriate scenarios (match biologists
with scenarios involving gene manipulation, for example).
Step Two—Select the Three Key Axes of Driving Environmental Forces Most
Significant to Facilitating Malign Uses of the Scenario’s Promethean Technology:
Sub-team leads (all science fiction writers) need to emphasize to their teammates that the
primary goal of Phase Six is to promulgate the worst-case scenario out of each stub
addressed. In fleshing out each scenario, participants, when choosing between alternative,
branching plot lines (“what happens next?”), should aim to pave the path that leads to the
most catastrophic outcomes. Make it as bad as possible! Remember, the goal of a “devil’s
toy box” analysis is not to judge which of the many, many gestating toys are most likely to
jump out of the box first, but rather to decide which of those gestating toys are the most
terrible in their potential impacts, and thus the most important to devise a shield against (or
seal up inside the box). Participants, in devising worst-case scenarios, should strive for
plausibility, but a “devil’s toy box” analysis does not call for devising probable futures.
Peter Schwartz, in his book The Art of the Long View, describes selecting key axes
of driving environmental forces as one of the essential steps of developing scenarios of

264
various plausible futures (per Schwartz, 1996). The traditional view of scenario analysis is
that it is not a tool for making predictions, but rather for gaming a variety of plausible
futures and exploring how different decisions made in various sectors might shift the
unfolding pathways of those futures. In this phase of Pandora’s Spyglass, however,
participants select key axes of driving environmental forces with a different purpose in
mind—they try to judge, within a volume (three axes), which combination of points along
the three intersecting axes results in the worst-case scenario for use of the Promethean
technology under consideration, so that this most malign combination of points along the
three axes can be used as the scenario’s enabling background. This most malign
combination should be plausible and internally consistent, but it need not be probable.
Earlier, in Step Three of Phase Four (Red Team the Scenario Stubs), one of the red-
teaming exercise techniques participants might be assigned was Alternative Futures
Analysis, in which participants selected two sets of critical or uncertain influencing forces
to be placed on sets of axes, forming a matrix containing four quadrants of combinations
of forces having various strengths or intensities. The participants then brainstormed how
the scenario playing out within each of these quadrants would impact the scenario. The
difference between this earlier phase and the current step is that, rather than two axes of
influencing forces, participants are now to consider three axes of influencing forces. Rather
than four quadrants, participants consider eight possible combinations, if the choice along
each axis is restricted to Low and High (possible combinations include High-High-High,
High-High-Low, High-Low-Low, High-Low-High, Low-Low-Low, Low-Low-High,
Low-High-High, or Low-High-Low).
First, the sub-team lead facilitates brainstorming of different influencing forces to
possibly assign to the three axes. Since the time frame being considered is the next five to
ten years, participants should keep this time frame in mind, considering that trends that are
apparent or are emerging in the present may continue into that near-term future (or may
not, if the participants collectively decide to insert a black swan into the scenario’s
timeline). Then the sub-team decides which three influencing forces are most relevant to
the use or non-use of the Promethean technology at the heart of the scenario. Health of the
economy? Level of political unrest? Activity level of Terror Group X? Level of conflict in

265
the Middle East? In Asia? Rate of societal diffusion and adoption of the Internet of Things?
The sub-team lead, working with the assistance of a facilitator, creates a volume of eight
possible combinations of the three influencing forces at either Low Strength/Intensity or
High Strength/Intensity. Then the sub-team members vote on which of the eight possible
combinations is most conducive to catastrophic malign use of the Promethean technology
under consideration. This “backdrop” of influencing forces is then used to help guide the
development of the full scenario.
Since the sub-teams are relatively small face-to-face groups, I encourage the sub-
team leads to use nominal group technique procedures during this phase. I suggest that
voting on the most malign combination be undertaken in this fashion: participants take five
minutes to anonymously select their top three choices, with first choice receiving three
points, second choice two points, and third choice one point. Facilitators sum the points
received by each alternative combination, with the combination receiving the most points
being the sub-team’s consensus choice. Sub-team leads should strive to have their team
complete the entirety of Step Two, including the round-robin discussion session, within an
hour.
Step Three—Apply “Through the Terrorist’s Eyes” Exercise to the Scenario:
Earlier, in Step Three of Phase Four (Red Team the Scenario Stubs), participants applied a
variety of different red-teaming exercises to the scenario stubs. In that step, each scenario
stub was matched with only one of the exercises. Now that the team has narrowed down
the list of scenario stubs to a “deadly dozen,” the surviving scenario stubs benefit from
applications of each of the exercises that are appropriate for the fleshing out process.
In this application of Through the Terrorist’s Eyes, participants aim to select the
terror group or category of terrorist (to reiterate, the list includes jihadists, nihilists, thrill
seekers, rightwing terrorists, leftwing terrorists, and acolytes of apocalyptic cults) that they
judge to have the greatest affinity for the Promethean technology under consideration, as
well as the group or category of terrorist that is most likely to make the worst-possible,
most catastrophic use of the Promethean technology. Once again, the goal is to formulate
the worst-case scenario. In working this exercise, participants should build upon the results
of the previous exercise, Alternative Futures Analysis, making use of the “backdrop”

266
previously developed to add detail and verisimilitude to this look “through the terrorist’s
eyes.” This will be the case for all subsequent exercises carried out during this phase. Each
exercise adds a new layer to the scenario. At this stage of Pandora’s Spyglass, participants
benefit from having had prior exposure to and experience using the red-teaming exercises,
which should serve to make the sessions during the current phase more productive (and, I
hope, more enjoyable for the team as a whole). Sub-team leads should ensure that the full
“library” for this scenario, all the products produced by the team for the scenario stub in
all earlier phases and steps, is available for members of the sub-team to refer to, either in
electronic or hard-copy form (preferably both, to accommodate differing working styles).
Again, I recommend that the sub-team leads use nominal group technique
procedures to facilitate discussions and deciding upon the terror group or category of
terrorist to feature in this scenario. I suggest that voting on the featured terrorist(s) be
undertaken in this fashion: participants take three minutes to anonymously select their top
two choices, with first choice receiving two points and second choice one point. Facilitators
sum the points received by each, with the option receiving the most points being the sub-
team’s consensus choice for the scenario’s protagonist from that point forward. Sub-team
leads should strive to have their team complete the entirety of Step Three, including the
round-robin discussion session, within an hour.
Step Four—Brainstorm Precursors: What events or developments lead up to the
malign use of the Promethean technology? What needs to happen for the worst-case
scenario to actualize? What are world leaders doing in the months and years leading up to
the worst-case use of the technology? What are technology and business leaders doing?
Based upon the materials collected and created so far by the sub-team, do any wars occur
during the five- to ten-year period leading up to the worst-case use of the Promethean
technology? Do any revolutions occur? Any insurgencies or terror campaigns? Have there
been any major environmental disasters that have significantly impacted the world of the
scenario? Are people’s standards of living rising or falling? What social changes take place
in the five to ten years leading up to the catastrophic use of the technology?
I advise use of nominal group technique processes during this step. The sub-team
leads should decide which brainstormed precursors enjoy consensus support following the

267
round-robin idea submission round and the round-robin discussion round, and which
brainstormed precursors have less than unanimous support and so require voting. Sub-team
leads should strive to have their team complete the entirety of Step Four within an hour.
Step Five—Apply Strengths, Weaknesses, Opportunities and Threats (SWOT)
Analysis to the Scenario: In this application of SWOT analysis (see Step Three of Phase
Four for details on how to carry out the analysis), the full sub-team performs the analysis
together, first for the attackers, then for the defenders. I advise use of nominal group
technique processes during this step. The sub-team leads should decide which brainstormed
additions to the various quadrants enjoy consensus support following the round-robin idea
submission round and the round-robin discussion round and may be added as elements to
the scenario. Those suggestions that have less than unanimous support will require a voting
procedure. Sub-team leads should strive to have their team complete the entirety of Step
Five within an hour.
Step Six—Apply “Measure-Countermeasure, Move-Countermove” Exercise
to the Scenario: Please refer to Step Three of Phase Four for details on how to carry out
this exercise. Participants should decide in this step whether defenders benefit from any
form of useful intelligence prior to the attack using the Promethean technology, or whether
they are taken completely by surprise. The purpose of using this exercise during this phase
is to thoroughly brainstorm the prompt/primary, secondary, and tertiary consequences of
both the catastrophic attack and of countermeasures put into place by the defenders, either
in anticipation of the attack or in response to the attack having taken place. Once again, I
highly encourage participants to brainstorm the worst primary, secondary, and tertiary
effects they can imagine to incorporate within the scenario (within the bounds of
plausibility and while retaining the scenario’s internal logical consistency, (i.e.,) do not
have two events or consequences occur within the same period that contradict one another).
I advise use of nominal group technique processes during this step. The sub-team
leads should decide which brainstormed consequences enjoy consensus support following
the round-robin idea submission round and the round-robin discussion round and may be
added as elements to the scenario. Those suggestions that have less than unanimous support

268
will require a voting procedure. Sub-team leads should strive to have their team complete
the entirety of Step Six within an hour.
Step Seven—Sub-Teams Present Their Scenarios to the Full Group for
Feedback and Critique: The full group reconvenes after each sub-team has completed
Steps Two through Six for one of their assigned scenarios. The facilitators randomly assign
the order for sub-teams to present their scenarios and respond to questions or comments.
The sub-team leads take eight to ten minutes to summarize for the assembled group the
results of their team’s fleshing out exercises. Then, following nominal group technique
procedures, the full group (minus the members of the sub-team) engages in two or three
rounds of round-robin questioning/commenting, with each speaker offering a single
question or comment per round. Facilitators should instruct participants that they need to
keep their questions and comments succinct and to the point. Either sub-team leads, or sub-
team members, may speak in response; they should also keep their responses brief and to
the point, avoiding extended digressions. Each scenario receives an hour’s attention from
the full group in this step. Each sub-team lead should take notes regarding comments made
about their scenario and the question-and-answer exchanges.
Step Eight—Sub-Teams Reconvene to Decide Whether to Adjust Their
Scenario in Response to the Full Group’s Feedback: This is the last step of this phase
which takes place during the face-to-face portion of Pandora’s Spyglass. The sub-team
leads reconvene their teams and use nominal group technique procedures to perform a
round-robin discussion of the feedback received from the full group, and to then decide
whether the sub-team wishes to make any changes to their scenario based this feedback (or
in response to any new ideas generated by the feedback). Leads should aim to have this
step take between an hour and 90 minutes per scenario. The sub-team members finalize
their scenario prior to departing the face-to-face portion of the analysis and sending their
science fiction writer team lead back home to polish the scenario and write it up in a
compelling, dramatic fashion. Before departing, the sub-teams repeat Steps Two through
Eight for their second assigned scenario.
I would like to offer some general suggestions that apply to the entire face-to-face,
in-person portion of Pandora’s Spyglass. This is a lengthy and arduous process; many

269
participants will be far from home and families and will likely still need to contend with
issues arising from their normal jobs and activities; however, done right and with the proper
spirit, this should also be a fun and stimulating process. Participants get to spend several
weeks getting to know a cohort of very interesting people, many of whom come from
professional backgrounds quite different from their own, and they can develop new critical
thinking skills and to think deeply about issues important to the Nation and to their own
communities. Many will find themselves stretching their minds in ways new and unfamiliar
to them. Facilitators should take every opportunity to foster the growth of team spirit and
to remind participants of the goal of Pandora’s Spyglass—a safer, more secure America,
one less vulnerable to being blindsided by strategic surprise. Ideally, facilitators will
encourage team members to share meals and trips to local watering holes after the work
days and will suggest shared activities for evenings and weekends, such as nature hikes,
bowling, excursions to historical or cultural sites, roasting marshmallows around a
campfire, shopping trips, or karaoke (that last activity is sure to help bond a team together).
If participants are interested and the authors are willing, perhaps some or all the science
fiction writer team members could offer live readings of a selection of their work as after-
dinner entertainment.
I would also suggest that facilitators break up the long series of nominal group
technique and consensus Delphi procedures with occasional sessions of forecasting
calibration exercises, between one and three times a week. Douglas W. Hubbard offers
several such exercises in Chapter Six and the Appendix of his book, The Failure of Risk
Management, and with minimal effort, the facilitators could come up with additional
exercises (or find them online). To add an element of fun, facilitators could divide the
group up into teams and have them compete to see which team’s members can become
fully calibrated the quickest (offering some sort of minor prize to the winners, such as
sweets or pins featuring the sponsoring agency’s logo, would be a nice touch). Apart from
breaking up the monotony, these exercises will help participants better understand the
nature of probabilities and will help train them to avoid either over- or under-confidence
when making forecasts.

270
Step Nine—Lead Scenario Writers Prepare 15–20 Page Scenario Narratives
with One-Page Executive Summaries: This step represents the beginning of the second
distance portion of Pandora’s Spyglass. The science fiction writers who have served as
sub-team leads may take up to a week to write scenario narratives of approximately 15–20
pages in length, complete with a one-page executive summary. The writers should strive
to make their narrative vivid, relatable, and emotionally compelling, while keeping within
the constraints and plot points collectively established by their team members. They should
select memorable names for each scenario. Writers should keep in mind that these
narratives will live multiple “lives,” serving varying purposes. The narratives will provide
the basis for the remaining phases and steps of the Pandora’s Spyglass analysis, of course;
however, they will also likely be used as “sales tools” that agency administrators can use
with members of Congress and appropriations committees to request funding for counter-
future-shock R&D projects or to explain the purpose of the counter-future-shock R&D
program. If funding is provided, the narratives will likely be included with Request for
Proposal packages, or other acquisition solicitation packages, to inform potential offerors
(federal research labs, academic labs or consortiums, commercial R&D firms, tech
entrepreneurs, etc.) of requirements. In this way, the narratives will also serve as recruiting
tools, potentially attracting some of the Nation’s best minds to work on some of the
Nation’s most challenging problems.
I. PHASE SEVEN: RANK THE “DEADLY DOZEN” SCENARIOS
All steps of Phase Seven take place within the second distance portion of Pandora’s
Spyglass. The purpose of Phase Seven is to rank the “deadly dozen” scenarios in terms of
awfulness, sticking with the formula of risk equaling the likelihood of actualization of the
malign use multiplied by the dollar value of the worst possible consequences. The reason
for ranking individual scenarios within the already prioritized “deadly dozen” group is that
in any given funding cycle, it is quite possible that not enough funding will be provided to
initiate R&D programs to counter all twelve scenarios. So, the “deadly dozen” must
themselves be prioritized, in order that whatever funding is made available gets applied to
the “worst of the worst.”

271
Step One—Apply Technology Sequence Analysis to Estimate the Likelihoods
of the Promethean Technologies Reaching Market Within a Five to Ten Year
Window: I described the process of Technology Sequence Analysis (TSA) earlier, in
Section C of Chapter 5. This step can be carried out concurrently with Step Nine of Phase
Six, since the team’s technical experts are engaged in this step and the team’s science
fiction writers are engaged Step Nine of Phase Six (two separate groups of team members),
and the polished scenario narratives are not necessary for the team’s technical experts and
their confederates to begin the process of Technology Sequence Analysis on the twelve
Promethean technologies or combinations of technologies notionally being put to
catastrophic purposes.
Facilitators should be cognizant of the fact that it is likely the technical experts who
are already members of the team will not be able to accomplish this step on their own, or
at least not in a timely enough fashion. For any complex technology, or system-of-systems,
Technology Sequence Analysis is a lengthy, involved process that encompasses hundreds
of estimates of the likelihoods of individual components being available within a five- to
ten-year period (the time window of interest for a Pandora’s Spyglass analysis). Facilitators
should have, prior to this point in the process, made arrangements to either temporarily
expand the team with an additional cadre of technical experts sufficient to carry out
Technology Sequence Analysis on all twelve of the “deadly dozen” technologies, or have
a contract prepared with an outside consulting firm that specializes in such analyses (the
preferred arrangement in such a case would be to have the consulting firm’s expert
employees work in conjunction with the team’s technical experts in performing the TSAs).
The process may be expedited if more than one of the “deadly dozen” scenarios shares the
same Promethean technology, or if two or more Promethean technologies share
components, or if numbers of the components or sub-systems necessary for a Promethean
technology have already been developed. Since the emerging Promethean technologies
were identified through an environmental scanning process that focused on patent
applications, scientific and technical papers, company reports, and open source journalism
regarding tech developments, it is unlikely that most or many of the Promethean

272
technologies requiring Technology Sequence Analysis will be “clean sheet of paper”
efforts for which all enabling components must be developed from scratch.
My rough, back-of-the-envelope estimate of the time to complete Technology
Sequence Analyses on the “deadly dozen” Promethean technologies, assuming contracting
or partnering arrangements are already in place and that all the analyses will be worked
concurrently, is eight to ten weeks. The results of the TSAs for each of the “deadly dozen”
scenario technologies will be used by the Pandora’s Spyglass facilitators as the independent
base probabilities, the likelihood of the Promethean technologies reaching market within
the next five to ten years. Team members (aside from the technical experts working the
TSAs) will not be asked to estimate these base probabilities in this phase, but they will still
be required to assign scores to the six probability-limiting/retarding factors, as well as
estimate the dollar values for plausible, worst-case scenario consequences (primary,
secondary, and tertiary). Fortunately, the results of the Technology Sequence Analyses will
not be needed by facilitators until the scenario narratives have been written and the team
members have arrived at consensus estimates for the six probability limiting factors and
for dollar value of consequences, so the Technology Sequence Analysis step can be carried
out concurrently with Step Nine of the previous phase and Steps Two and Three of this
phase.
Step Two—Participants Estimate the Severity of Potential Consequences for
Each of the “Deadly Dozen” Scenarios: This step is carried out after participants
receiving copies of the polished scenario narratives, but it can be performed concurrently
with the Technology Sequence Analysis (Step One). Consensus Delphi procedures should
be used for this step. Since participants will not be sharing a space (or even a time zone, in
all likelihood), facilitators will need to establish a window of time in which participants
may electronically submit their first round estimate, and another, later window in which
participants may electronically retrieve the group’s median estimate, other summary
statistics of the group’s inputs, rationales from other (anonymous) group members, and a
reminder of what their own estimate was, and then submit their second round estimate,
either sticking with their original estimate or adjusting it (either way, providing a
justification for their decision). All the stipulations that apply to Phase Five, Step Two

273
apply to this step, except for the earlier step’s more strict time limits. Given that the
duration of the second distance period is mainly dependent upon the length of the
Technology Sequence Analysis (Step One of Phase Seven), facilitators may be generous
with the allowable time windows embodied in this step. I recommend giving participants
a half-day’s window for their first-round submission and another half-day’s window for
their second-round submission. Facilitators should make the individual participants’
“assumptions dictionaries” electronically available to those participants, so the latter may
opt to continue adding to them or to refer to their earlier assumptions, in the interest of
keeping assumptions consistent across scenarios being judged.
The main difference for participants in this step from the similar Phase Five, Step
Two, apart from different time constraints, is that facilitators ask participants to rank their
own level of confidence/self-perceived expertise regarding each individual estimate or
ranking submitted. Facilitators should instruct participants to use the following ranking
scale (participants may either choose to select an integer value or a decimal value between
integers or between 0 and 1 on the low end): 1 = Very Low Confidence/No Sense of
Expertise Regarding This Question; 2 = Low Confidence/Minimal Sense of Expertise
Regarding This Question; 3 = Moderate Confidence/My Level of Expertise Regarding This
Question is Probably About Average; 4 = High Confidence/Higher-Than-Average
Expertise Regarding This Question; 5 = Very High Confidence/Very Strong Sense of
Expertise Regarding This Question.
At this point in the process, facilitators will also calculate Brier scores for the
participants’ forecasting skills pre-tests, the pre-tests team members took back in Phase
Two, Step Two. (The facilitators should have selected forecasting questions for which
answers would be actualized by this point in the procedure, so that individual participants’
levels of accuracy in forecasting can be compared.) As a reminder, Brier scores are
calculated in the following fashion. Events that occur are coded as 1 and events that do not
occur are coded as 0; the Brier score is the sum of squared errors between what actually

274
occurs and the probability forecast.349 To provide an example, a participant might have, as
part of his or her pre-test, predicted a 70% chance that the Best Actor Award at the Oscars
would be won by Sterling Silver (and accordingly, the chance an actor other than Sterling
Silver would win the Best Actor Oscar was predicted as 30%); however, in a surprising
upset, Thomas Tomas walked away with the golden trophy. This participant’s Brier score
for this question would be calculated as (0.7–0)2 + (0.3–1)2 = 0.833. The best possible Brier
score is 0, representing perfect forecasting ability, and the worst possible score is 2,
representing complete failure at forecasting. Had the participant predicted the reverse set
of probabilities, that there was only a 30% chance of Sterling Silver winning the Oscar and
a 70% chance that a different actor would win, the Brier score would be calculated as (0.3–
0)2 + (0.7–1)2 = .18. Being much closer to 0 (the best possible score), this latter answer
would represent a large improvement in the Brier score for that question.
As part of the process for this step and for the following step, facilitators will
calculate a Power Score for each participant for each estimate given. The Power Score is
simply calculated using this formula:
Power Score = (Self-Assessed Confidence/Expertise Rating) - ((Mean Brier Score
from All Pre-Test Questions) x 2.5)
(The Power Score may be a negative number. The lowest possible Power Score is
-5 and the highest possible score is 5. If a participant scores the lowest on Self-Assessed
Confidence/Expertise, 0, but the highest on Adjusted Mean Brier Score, 0, their Power
Score would be 0. If a participant scores the highest on Self-Assessed
Confidence/Expertise, 5, but the lowest on Adjusted Mean Brier Score, 5, their Power
Score would be 0.) For each set of estimates submitted in the first round of this step and of
the following step, facilitators will disregard the inputs from all participants whose Power
Score falls below the median Power Score. This means that, in a team of 30 members, 14
members would have their estimates put aside for a rating or estimating question, and the
team’s median (or mean, for Step 3) consensus figure for both the first and second rounds
349 Tetlock et al., “Bringing Probability Judgments in Policy Debates Via Forecasting Tournaments,”
481.

275
would be calculated using only the inputs from the remaining 16 members whose Power
Scores equal or exceed the median Power Score. Additionally, when facilitators provide
team members’ rationales that support those members’ estimates to the full team at the
beginning of the second round of questioning, they should only include those rationales
from members whose Power Score equals or exceeds the median Power Score.
This use of a form of calibration of participants, through a combination of
forecasting performance calibration and self-evaluation calibration, allows the Pandora’s
Spyglass procedure to avoid one of the main criticisms that Douglas W. Hubbard (whose
book, The Failure of Risk Management: Why It’s Broken and How to Fix It, I discuss in
Section B of Chapter 2) levels against common practices of risk management and threat
assessment: that the participating subject matter experts are rarely, if ever, subjected to a
calibration process.350 The reduction in this phase of the “active” participants, those whose
responses will be factored into the group’s consensus answers, to only those participants
whose forecasting performance and self-assessed expertise are at or above the median
meets the recommendations set forth by the authors of “The Wisdom of Select Crowds”
(per Mannes, Soll, and Larrick, 2014). Yet this reduction is not so great that it shrinks the
“active” crowd below what Satopää, Baron, Foster, Mellers, Tetlock, and Ungar consider
the “sweet spot” for the wisdom of crowds, several forecasters between 10 and 20, wherein
the addition of more participants to the crowd grants the bulk of marginal improvement in
forecasting accuracy (per Satopää et al., 2014). One more advantage of this reduction in
“active” participants to only those who meet or exceed the median Power Score is the
amelioration of what Juri Pill considers one of the chief shortcomings of Delphi
procedures, that they tend to “water down” the inputs of the most expert participants by
averaging them with the inputs of less expert participants (per Pill, 1971).
Facilitators should not inform participants that those whose Power Scores fall
below the group’s median will have their inputs discarded in both the first and second
rounds. Rather, participants should be told simply that the results of the forecasting pre-
test and of participants’ self-evaluations of confidence/expertise will be used as weighting
350 Hubbard, The Failure of Risk Management, 178–179.

276
factors in this step and the following step. My reasons for this recommendation, which runs
partially counter to my earlier recommendation that facilitators continuously inform
participants of the Pandora’s Spyglass methodology as it evolves throughout the process,
are two-fold. For participants’ self-evaluations of confidence/expertise to be of any value,
they must be honest self-evaluations. I fear that participants might be incentivized to “plus-
up” their self-evaluations out of a desire to have their input included, if they feel that being
honest significantly raises the chances of their input being discarded. My other concern is
that when participants honestly rate themselves low on confidence/expertise regarding a
question, they will then lose motivation to apply their best effort to the estimation or rating
task at hand, assuming that their input will not matter—yet the possibility exists that their
Mean Brier Score from the pre-test will be strong enough to offset their low
confidence/expertise self-rating and put them at or above the group’s median Power Score.
The facilitators calculate the median dollar value of the “active” team’s estimates
from the second round (those participants whose Power Scores are at or above the group’s
median Power Score). This median dollar value is the consensus value for this “deadly
dozen” scenario. The facilitators share the consensus value with the participants. Then this
step’s process is repeated for each of the remaining scenarios in turn. Participants and
facilitators should be able to complete this step for one “deadly dozen” scenario per work
day.
Step Three—Participants Determine Consensus Values for Each of the Six
Probability Factors that Influence the Likelihoods of the Come-to-Market
Promethean Technologies Being Used for Malign Purposes: This step is carried out
after Phase Seven, Step Two but can be performed concurrently with the Technology
Sequence Analysis (Phase Seven, Step One). Consensus Delphi procedures should be used
for this step. Since participants will not be sharing a space and will very likely be back at
their regular jobs or activities, facilitators will need to establish a window of time in which
participants may electronically submit their first round estimate, and another, later window
in which participants may electronically retrieve the group’s mean estimate, other summary
statistics of the group’s inputs, rationales from other (anonymous) group members, and a
reminder of what their own estimate was, and then submit their second round estimate,

277
either sticking with their original estimate or adjusting it (either way, providing a
justification for their decision). All the stipulations that apply to Phase Five, Step Four
apply to this step, except for the earlier step’s more strict time limits. I recommend giving
participants a two-hour window for their first-round submission per limiting factor per
scenario and another two-hour window for their second-round submission. All the Power
Score procedures described for Phase Seven, Step Two apply to this step, as well
(participants are told to self-evaluate themselves on confidence/expertise for their first-
round response only for each limiting factor for each scenario, etc.).
The facilitators calculate the mean rating for the probability limiting factor under
review from the “active” team’s ratings from the second round (those participants whose
Power Scores are at or above the group’s median Power Score). This mean rating is the
consensus value for this probability limiting factor for this “deadly dozen” scenario. The
facilitators share the consensus value with the participants. Then this step’s process is
repeated for each of the remaining probability limiting factors for that scenario, prior to all
six probability limiting factors being estimated for each of the remaining scenarios in turn.
Participants and facilitators should be able to complete this sub-step for one “deadly dozen”
scenario per 24 hours, or three work days per scenario.
Only after team members have performed consensus Delphi procedures for all six
probability limiting factors for each of the “deadly dozen” scenarios stub will they then
estimate the probability of that scenario becoming actualized. At this point in the process,
facilitators will share with participants the base probabilities for each of the scenarios,
which are the results of the Technology Sequence Analyses; these provide the best
estimates of the likelihood of the Promethean technologies in question coming to market
within a five- to ten-year window. Participants should be instructed to use these results of
the Technology Sequence Analyses, rather than trying to estimate base probabilities on
their own. All the stipulations described for Phase Five, Step Four regarding participants’
creating models (or not) of the relative impacts of the probability limiting/retarding factors
apply to this sub-step. Stipulations regarding Power Scores also apply. Facilitators should
provide participants with a two-hour response window for the first-round submission and
a two-hour response window for the second-round submission. As was done in Phase Five,

278
Step Four, facilitators should provide participants with examples of ways that the six
probability limiting factors may be used in conjunction with the independent base
probability to estimate a probability of malign use. Additionally, they should provide
participants with the group’s consensus, amalgamated mean for each of the six probability
limiting factors, the participants’ own second round scores for each of the six probability
limiting factors, and summary statistics for each of the six calculated figures. Participants
and facilitators should be able to complete this sub-step for one “deadly dozen” scenario
in four hours, or one-half work day per scenario, for a total of six work days for this sub-
step.
Step Four—Facilitators Calculate Estimated Risk Levels for Each “Deadly
Dozen” Scenario and Rank Them in Descending Order of Risk: Estimated risk levels
are all expressed in dollar terms, to allow for easy ranking and comparisons. The formula
for risk is:
Risk = (Consensus Estimated Dollar Value of Scenario’s Consequences) x
(Consensus Estimated Probability of the Scenario Becoming Actualized)
Facilitators share with participants the list of scenarios ranked in descending order
of risk, with the risk formula figures provided for each.
Step Five—Facilitators Prepare a Pandora’s Spyglass Analytical Report
Including Scenario Narratives, in Ranked Order of Descending Estimated Risk, of
the “Deadly Dozen” Scenarios: Fortunately for the facilitators, by this point in the
process, much of the material they will need to prepare a report for the sponsors of the
Pandora’s Spyglass analysis has already been written or tabulated. Far from being a “black
box” procedure, Pandora’s Spyglass is entirely transparent, and the nature of the procedure
leads to its participants and facilitators fully documenting their methods and assumptions
as the process is unfolding. Any manager who wishes to question from whence outputs
came can trace a trail of artifacts that describe which decisions were made by participants
and why; the same applies to researchers who wish to refine the procedure or adapt it or
elements of it for other purposes.

279
Facilitators should share copies of their final report with the participants and
welcome their feedback. Collecting participants’ feedback regarding participants’ level of
satisfaction with the process and any suggestions for process improvements should not be
neglected, since performing Pandora’s Spyglass analyses should be an iterative process,
not a “one-and-done” event. Ideally, if the sponsoring agency’s confidentiality
requirements allow for it, facilitators will keep former participants informed of the progress
of various R&D projects initiated by the Pandora’s Spyglass analysis, perhaps distributing
a periodic newsletter highlighting significant project milestones. This will help “close the
circle” for participants and give them a sense of satisfaction that their months of hard
thinking and hard work have led to concrete actions to “seal the boxes shut” that hold the
very worst of the devil’s many gestating toys.
Showing appreciation to the participants and doing what can be done to keep them
in the loop regarding the results of their shared analysis should not be an afterthought but,
rather, should be baked into the process. Not only because it is the considerate thing to do,
but also because, with Pandora’s Spyglass being an iterative analysis, the facilitators may
need to call upon former participants again a couple of years down the line, and the odds
of getting them back on-board will rise if those persons can look back upon their earlier
experiences with fondness, pride in their shared service, and a sense of accomplishment.
J. POTENTIAL CRITICISMS OF PANDORA’S SPYGLASS
It Takes Too Long for a Prospectively Annual Process: Pandora’s Spyglass, in
the example followed in this chapter (30 core team members; environmental scanning
surfaces 30 emerging, over-the-horizon Promethean technologies with potential for malign
use; core team initially brainstorms 180 scenario stubs), takes approximately six months
from end to end. The estimated duration of each phase of the procedure, and of each step
within each phase, is tabulated in Table 8. The first distance portion takes eight weeks; the
face-to-face portion takes three to four weeks; and the second distance portion takes 14
weeks. Participants and facilitators, working together, are engaged for 17 to 18 weeks, and
the facilitators work on their own for an additional eight weeks.

280
Table 8. Approximate Duration of Pandora’s Spyglass Analytical Procedure
Phase Step PlannedDuration
DistanceorFace‐to‐FacePortion?
SequentialorConcurrent?
PHASEONE:ENVIRONMENTALSCANNING
One TwoWeeks 1st Distance Sequential
PHASETWO:ASSEMBLETHETEAM
One—RecruitTeamMembers
FourWeeks 1st Distance Sequential
Two—AdministeraForecastingPre‐Test
OneDay 1st Distance Sequential
PHASETHREE:BRAINSTORMSCENARIOS
One—PushOuttheResultsofEnvironmentalScanning
OneDay 1st Distance ConcurrentwithStepTwo
Two—DistributeQuestionstoPromoteBrainstorming
TwoWeeks 1st Distance ConcurrentwithStepsOneandThree
Three—TraintheScienceFictionWriterMembersoftheTeaminSmallGroupProcessesandOptimallyFacilitatingSmallGroupInteractions
HalfDay Face‐to‐Face ConcurrentwithStepTwo
Four—BringtheParticipantsTogetherfortheFace‐to‐FacePortionoftheAnalysisandBeginwithanEmphasisonPersonalAccountabilityandtheImportanceoftheMission
HalfDay Face‐to‐Face Sequential
Five—ApplyConvergentThinkingtotheScenarioStubs
HalfDay Face‐to‐Face Sequential
PHASEFOUR:REDTEAMTHESCENARIOSTUBS
One—IntroducetheConceptofRed‐TeamingtotheFullGroupandProvideTrainingonAvoidingCognitiveBiases
HalfDay Face‐to‐Face Sequential
Two—DividetheFullTeamintoGroupsofFour
10minutes(repeatedatthebeginningofeachworkdayspentinPhaseFour)
Face‐to‐Face Sequential(facilitatorsassisteightteamsconcurrently)

281
Phase Step PlannedDuration
DistanceorFace‐to‐FacePortion?
SequentialorConcurrent?
Three—RandomlyAssignaScenarioStubtoEachGrouptoRedTeam;AssignEachGroupaRedTeamingMethodtoUse
20minutes(repeatedatthebeginningofeachworkdayspentinPhaseFour)
Face‐to‐Face Sequential(facilitatorsassisteightteamsconcurrently)
Four—RedTeamEachScenarioStub,ThenPresentResultstoEntireTeamandAllowforQuestions
ThreetoFourDays Face‐to‐Face Sequential
PHASEFIVE:RANKTHESCENARIOSTUBS
One—FacilitatorsProvideParticipantswithListofScenarioStubs
FiveMinutes Face‐to‐Face Sequential
Two—ParticipantsRateEachScenarioStubRegardingSeverityofPotentialConsequences
2.5to3.75Days(20–30hours;40minutesperscenariostub;eachhalf‐teamresponsiblefor30–45stubs)
Face‐to‐Face Sequential
Three—ParticipantsReceiveRefresherTrainingintheLawsofProbabilityandHowtoCalculateProbabilities
ThreeHours Face‐to‐Face Sequential
Four—ParticipantsRateEachScenarioStubRegardingtheLikelihoodofItsBecomingActualized
FourtoSixDays(ratingeachstubtakes1.75hours;eachhalf‐teamcanratefourstubsperworkday;eachhalf‐teamresponsiblefor30–45stubs)
Face‐to‐Face Sequential
Five—FacilitatorsCalculateEstimatedRiskLevelsforEachScenarioStub
30Minutes Face‐to‐Face Sequential
Six—FinalizingDeterminationofthe“DeadlyDozen”Scenarios
TwoHours Face‐to‐Face Sequential

282
Phase Step PlannedDuration
DistanceorFace‐to‐FacePortion?
SequentialorConcurrent?
PHASESIX:FLESHOUTTHE“DEADLYDOZEN”SCENARIOS
One—DividetheFullTeamintoScenarioExpansionSub‐Teams
10Minutes Face‐to‐Face Sequential
Two—SelecttheThreeKeyAxesofDrivingEnvironmentalForcesMostSignificanttoFacilitatingMalignUsesoftheScenario’sPrometheanTechnology
TwoHours(processtakesonehourperscenario;sixteamsperformthisstepfortwoscenariosapiece)
Face‐to‐Face Sequential(however,sixteamsareworkingconcurrently,evaluatingtwoscenariosapiece)
Three—Apply“ThroughtheTerrorist’sEyes”ExercisetotheScenario
TwoHours(processtakesonehourperscenario;sixteamsperformthisstepfortwoscenariosapiece)
Face‐to‐Face Sequential(however,sixteamsareworkingconcurrently,evaluatingtwoscenariosapiece)
Four—BrainstormPrecursors
TwoHours (processtakesonehourperscenario;sixteamsperformthisstepfortwoscenariosapiece)
Face‐to‐Face Sequential(however,sixteamsareworkingconcurrently,evaluatingtwoscenariosapiece)
Five—ApplyStrengths,Weaknesses,OpportunitiesandThreats(SWOT)AnalysistotheScenario
TwoHours(processtakesonehourperscenario;sixteamsperformthisstepfortwoscenariosapiece)
Face‐to‐Face Sequential(however,sixteamsareworkingconcurrently,evaluatingtwoscenariosapiece)
Six—Apply“Measure‐Countermeasure,Move‐Countermove”ExercisetotheScenario
TwoHours(processtakesonehourperscenario;sixteamsperformthisstepfortwoscenariosapiece)
Face‐to‐Face Sequential(however,sixteamsareworkingconcurrently,evaluatingtwoscenariosapiece)
Seven—Sub‐TeamsPresentTheirScenariostotheFullGroupforFeedbackandCritique
12Hours,or1.5Days(processtakesonehourperscenario)
Face‐to‐Face Sequential
Eight—Sub‐TeamsReconvenetoDecideWhethertoAdjustTheirScenarioinResponsetotheFullGroup’sFeedback
TwotoThreeHours(betweenanhourand1.5hoursperscenario,witheachsub‐teamassessingtwoscenarios)
Face‐to‐Face Sequential(however,sixteamsareworkingconcurrently,evaluatingtwoscenariosapiece)

283
Phase Step PlannedDuration
DistanceorFace‐to‐FacePortion?
SequentialorConcurrent?
Nine—LeadScenarioWritersPrepare15–20PageScenarioNarrativeswithOne‐PageExecutiveSummaries
OneWeek 2nd Distance Sequential(however,sixsub‐teamleadsareworkingconcurrently,writinguptwoscenariosapiece)
PHASESEVEN:RANKTHE“DEADLYDOZEN”SCENARIOS
One—ApplyTechnologySequenceAnalysistoEstimatetheLikelihoodsofthePrometheanTechnologiesReachingMarketWithinaFivetoTenYearWindow
EighttoTenWeeks 2nd Distance ConcurrentwithPhaseSix,StepNineandwithPhaseSeven,StepsTwoandThree
Two—ParticipantsEstimatetheSeverityofPotentialConsequencesforEachofthe“DeadlyDozen”Scenarios
12Days(about2.5Weeks)
2nd Distance Sequential(butconcurrentwithPhaseSeven,StepOne)
Three—ParticipantsDetermineConsensusValuesforEachoftheSixProbabilityFactorsthatInfluencetheLikelihoodsoftheCome‐to‐MarketPrometheanTechnologiesBeingUsedforMalignPurposes
42Days(about8.5Weeks)
2nd Distance Sequential(butconcurrentwithPhaseSeven,StepOne)
Four—FacilitatorsCalculateEstimatedRiskLevelsforEach“DeadlyDozen”ScenarioandRankTheminDescendingOrderofRisk
OneHour 2nd Distance Sequential

284
Phase Step PlannedDuration
DistanceorFace‐to‐FacePortion?
SequentialorConcurrent?
Five—FacilitatorsPrepareaPandora’sSpyglassAnalyticalReportIncludingScenarioNarratives,inRankedOrderofDescendingRiskEstimate,ofthe“DeadlyDozen”Scenarios
TwoWeeks 2nd Distance Sequential
Durationof1stDistancePortion
EightWeeks,OneDay
(1st DistancePortion,FacilitatorsOnly)
(SixWeeks)
(1st DistancePortion,FacilitatorsandParticipants)
(TwoWeeks,OneDay)
DurationofFace‐to‐FacePortion
14.5to19WorkDays(ThreetoFourWeeks)
Durationof2ndDistancePortion
14Weeks
(2nd DistancePortion,FacilitatorsandParticipants)
(12Weeks)
(2nd DistancePortion,FacilitatorsOnly)
(2Weeks)
DurationofEntirePandora’sSpyglassProcedure
25Weeksto26Weeks
(EntireProcedure,FacilitatorsandParticipants)
(17to18Weeks)
(EntireProcedure,FacilitatorsOnly)
(EightWeeks)
In defense of the procedure, I must point out that participants’ full-time, face-to-
face portion of their involvement lasts only three to four weeks, in the middle of the
analysis. For the remainder of the 17 to 18 weeks of their involvement, they participate on
a part-time basis from their homes or normal work locations, with daily inputs likely to
take between 45 minutes and an hour (or less). Not that a four-week commitment of time
is inconsequential, for a working professional who presumably already has a full-time job,

285
but critics of this aspect of Pandora’s Spyglass should not look at the entire procedure’s
six-month timeframe and assume that all the participants will be required to devote all their
working hours during this timeframe to the procedure.
One of my assumptions is that the Pandora’s Spyglass procedure will be used to
support an annual R&D project selection cycle. One possible way to make the procedure’s
length less onerous for the sponsoring organization would be to schedule Pandora’s
Spyglass to be performed every two years, rather than every year, with half the “deadly
dozen” scenarios having their R&D projects initiated in the first year and the remaining
half having their R&D projects initiated in the second year. The length of time required for
the second distance portion of the procedure could be squeezed down by a couple of weeks
if the time windows for the remote consensus Delphi procedures are halved; however,
reducing the time required for the consensus Delphis to less than the time required for the
Technology Sequence Analyses would not result in any time savings, so that needs to be
kept in mind.
Federal Hiring Processes are Cumbersome and Lengthy, and Agencies Would
Face Logistical Difficulties Hiring Short-Term Employees and Consultants: This
concern may be assuaged in a couple of different ways. Several different federal agencies,
such as the Census Bureau and the Federal Emergency Management Agency (FEMA),
have secured authority to hire temporary employees or short-term, emergency surge
employees. Or the sponsoring agency could pursue the alternate route of contracting with
an outside consulting firm to perform the Pandora’s Spyglass analysis, leaving it up to a
private firm to acquire temporary facilitators and consultants, with the stipulation that the
sponsoring agency have the right to designate some of its internal managers and subject
matter experts as participants.
Pandora’s Spyglass Lacks Statistical Rigor; Its Variables Have Not Been
Validated; No Model is Supplied for the Respective Intensities of How Each of the
Probability Limiting Factors Affects the Base Probability in Each Scenario: Observers
who would level these criticisms misconstrue the purpose of a Pandora’s Spyglass
procedure. As described in this chapter, Pandora’s Spyglass is not a conventional risk
assessment or threat assessment tool, nor is it meant to be used for a cost-benefit analysis

286
to support a budget request for a R&D project(s). It assumes that a budget has already been
allocated for as-yet unselected R&D projects intended to counter future-shock threats in
the homeland security arena, and it is intended to guide decision makers in identifying the
worst possible plausible threats that emanate from over-the-horizon, emerging Promethean
technologies, then guide those decision makers in ranking those plausible threats so that
whatever R&D funding that is available can be best allocated. I formulated the Pandora’s
Spyglass procedure primarily to assist the homeland security R&D enterprise in winnowing
down the potentially vast number of scenarios involving emerging Promethean
technologies, either used singly or in combination with other emerging or established
technologies, to a manageable group of scenarios that represent the worst of the worst,
encompassing the direst, severe consequences that may plausibly occur. To abet this goal,
I recommend that the Pandora’s Spyglass participants stretch their scenarios to the limits
of dire plausibility, that in estimating the dollar value of consequences, they disregard the
possibilities of attacks being misfires or only partially successful. In terms of the bell-
shaped curve of normal distribution of possible outcomes, I ask participants, in estimating
consequences, to essentially ignore 95% of the distribution and concentrate upon what
might lurk beneath the tapering tail at the right side of the curve, representing the most
severe 5% of the distribution.
However, if additional validation steps are taken, the Pandora’s Spyglass procedure
could be re-purposed to support budget formulations. The first of these validation steps
would be for cost estimators to examine each of the consequences listed in each of the
“deadly dozen” scenarios—loss of life, costs of medical care, loss of property, loss of
productivity, prompt impacts on economic activity, delayed impacts on economic activity,
costs of remediation and defensive measures instituted in response to the attack, secondary
and tertiary costs stemming from those remediation and defensive measures, etc.—to
assign a range of possible values to each cost category, and to then use Monte Carlo
simulations to establish a range of potential total costs falling within a 90% confidence
level. This differs from the basic Pandora’s Spyglass procedure in that the latter directs
participants to assume the worst plausible case for all consequences, pushing the total cost

287
estimate of consequences far out to the right-hand tail of a probability curve of potential
costs.
The second essential validation step would be to use back testing to establish a “best
fit” model of the relative weightings of the six probability-limiting/retarding factors as they
apply to the base probability of the Promethean technology being brought to market within
a five- to ten-year window, resulting in the probability of that technology being used for
the malign purpose envisioned in a scenario. A reader might ask, “How can somebody use
back testing to validate a model for a kind of event that has not happened yet?” Douglas
W. Hubbard cautions against what he calls the Mount St. Helens Fallacy, the notion that
any level of dissimilarity between systems or events makes comparisons between the two
systems or events unworkable and without value. He describes the cognitive blind spot of
geologists, specialists in the behavior of volcanoes, during the months leading up the
catastrophic lateral eruption of Mount St. Helens in May of 1980. These geologists
observed the development of a magma bulge on the volcano’s north side, a magma bulge
that grew increasingly unstable. Such a development had been observed to cause other
volcanoes to laterally erupt, or spew a magma stream sideways, rather than out the
volcano’s top rim. Yet these geologists held to the notion that each volcano was a unique
system, subject to local geological conditions, and Mount St. Helens had never been
observed to laterally erupt before. Thus, the observing geologists did not consider the
possibility of this very dangerous event occurring, even though the increasingly dire
evidence that it would occur was staring them in the face.351
Thus, even though Pandora’s Spyglass is meant to analyze potential future events
of an unprecedented nature—catastrophic malign uses of technologies that have not been
invented yet—the notional events being imagined and examined are not entirely
unprecedented. I venture a suggestion later in this Section that both the 9/11attacks and the
Aum Shinrikyo sarin attack on the Tokyo subway system can be considered as rough
analogues to a “devil’s toy box” attack. If one is willing to venture a bit farther afield and
consider more distant analogues, one has a huge number of earlier events with which one
351 Hubbard, The Failure of Risk Management, 180–181.

288
could back test various models of the Pandora’s Spyglass probability limiting factors—
successful and unsuccessful terror attacks using conventional technologies and modes of
attack. In carrying out a Pandora’s Spyglass analysis, participants, in Step Three of Phase
Seven, offer their notional models of the relative weightings of the six probability limiting
factors. Various databases can be accessed that describe the sequences of events and
operational and environmental factors associated with samplings of both successful and
unsuccessful terror attacks. A researcher could retroactively apply each of the notional
models that emerge from a standard Pandora’s Spyglass analysis of the probability limiting
factors to a large sample of both successful and unsuccessful terror attacks and in that way
determine which of the models best correlates with the success or failure of an attack. Each
of the notional models would represent a separate hypothesis, and the researcher would test
each hypothesis by applying it, in turn, to actual events and seeing how well the model fits,
eventually selecting the model that displays the best fit across the sample of actual events.
This would require a great amount of work, but it could be done. Then the validated model
of the weightings of the six probability limiting factors could be applied to the base
probability of the Promethean technology of interest coming to market within the five- to
ten-year window, already calculated through a Technology Sequence Analysis. Finally, the
probability of the Promethean technology being used for the malign purpose envisioned in
the “deadly dozen” scenario could be multiplied with each of the consequence dollar values
estimated through a Monte Carlo procedure to formulate a range of possible risk levels for
that scenario. Doing the same for all 12 scenarios would establish a broader possible range
of risk levels.
It Spends Money and Resources Seeking to Counter a Bunch of Notional
Threats That May Never Materialize: This criticism strikes at the very ground
underlying the rationale for any sort of a “devil’s toy box” analysis. What is the bang for
the buck? In the case of a “devil’s toy box” analysis in general or Pandora’s Spyglass in
specific, the bang for the buck is the absence of a bang. How can the absence of something
be quantified? It can, perhaps not as precisely or with the level of confidence a user would
prefer; but more on that in a moment. The fact that this criticism so easily comes to mind
indicates why the homeland security enterprise has consistently prioritized its systemic

289
mission over its counter-future-shock mission, and why the Homeland Security Advanced
Research Projects Agency (HSARPA), despite having been founded in 2003 as the
Department of Homeland Security’s counterpart to the Department of Defense’s highly
successful DARPA, has devoted most of its resources to low- or moderate-risk, moderate-
benefit R&D projects meant to assist in DHS’s systemic mission set, not its counter-future-
shock mission set (please refer to Appendix A for a thorough discussion of this issue). It is
human nature to focus on already actualized issues or pressing problems and threats, to the
detriment of expending resources countering longer-term, more distant or uncertain threats,
even if the latter are of far higher potential consequence than the former. If a homeowner’s
roof is leaking and it is raining outside, with more rain projected for the coming week, and
the leak is right over the homeowner’s bed, that homeowner is going to be a lot more
concerned about hiring a contractor to patch the hole in his roof than he is about researching
and purchasing a fire insurance policy—even though a leak, by itself, may only cause, at
worst, a couple of thousand dollars’ worth of damage to the homeowner’s property and
belongings, whereas a fire could destroy everything he owns, potentially costing him
hundreds of thousands of dollars.
Think of Pandora’s Spyglass and the R&D projects it facilitates as that fire
insurance policy. So how much should the insurance policy cost? How much is the policy
worth? One way to estimate its worth is to use analogy, to look at the costs of the primary,
secondary, and tertiary impacts and consequences of an attack roughly comparable to one
of the envisioned “deadly dozen” scenarios. One such event would be the 9/11terror
attacks. These attacks did not make use of any Promethean technologies; rather, the
attacker re-purposed existing, tried-and-true technologies and combined them in a new
mode of attack, one that linked five-dollar box cutters with fuel-laden jumbo jets to create
a new system of highly destructive guided missiles. Setting up this attack cost al Qaeda
somewhere less than half a million dollars. The costs to the United States? Primary costs
include the loss of about 3,000 lives (valued at about $4 million apiece), the loss of the
World Trade Center towers and surrounding properties, the cost of repairs to the Pentagon,
the costs of three destroyed jet liners, and the costs of all the fire-fighting and police
equipment destroyed when the Twin Towers collapsed. Secondary costs include the health

290
care costs incurred by all the persons who were injured but not killed in the attacks,
including those who suffered delayed health impacts due to inhalation of the toxic dust
resulting from the Twin Towers’ collapse; the direct costs of the war in Afghanistan; a
portion of the direct costs of the war in Iraq (which was justified, in part, by the assertion
that, following the 9/11attacks, the United States could no longer tolerate a hostile regime
potentially sharing weapons of mass destruction with terror groups); the costs of the large-
scale federal government reorganization that created the Department of Homeland
Security; the costs of the twelve-year hunt for bin Laden; the costs of armoring cockpit
doors on all passenger aircraft; the costs of additional security measures at the Nation’s
airports; the costs of shutting down all air traffic for several days following the attacks; the
costs of the economic recession that followed the attacks; the costs to the travel, tourism,
and convention industries of potential customers who opted to avoid air travel following
the attacks; and, however, they might be quantified, the psychological and emotional costs
of the fear of future terrorism inspired by the attacks. Tertiary costs include the value of
the lives of American servicemen and servicewomen lost to the fighting in Afghanistan,
along with the value of the lives of Central Intelligence Agency agents, diplomats, and
contractors lost; the value of a portion of the lives of Americans lost during the Iraq War
and its long aftermath; the decades-long health cost expenditures for those Americans
injured in those two conflicts; the reduction, however, quantifiable, in Americans’ civil
liberties and quality of life (Americans have had to adjust to an overall increase in
government surveillance of the population, and the ease and quality of travel by air has
been significantly degraded, possibly permanently); the cost of interest payments that have
been and will be made for additional government debt incurred because of increased
military and homeland security spending attributable to a reaction to the attacks; and the
opportunity costs of investments and expenditures not made because they were displaced
by increased national spending on homeland security efforts and military campaigns and
by increased national debt. (This should not be considered a complete list of costs, by any
means.) Add it all up, and the Return on Investment (ROI) al Qaeda saw on its less than
half-a-million-dollar investment is staggering—the costs to the United States run into the

291
trillions of dollars, and if lost opportunity costs are added to the total, perhaps into the tens
of trillions of dollars.
A similar tabulation of the costs of the consequences of the Aum Shinrikyo sarin
attack on the Tokyo subway system could be performed. That attack, unlike the
9/11attacks, fell far short of its destructive potential, due to the cult’s primitive, ineffective
delivery system for the sarin, but even so, the attackers managed to kill dozens and sicken
or injure thousands, and the secondary and tertiary costs of the attack to the Japanese
government and Japanese society far outpaced the primary costs. Yet, due to its partial
failure to meet its instigators’ goals and its falling well short of its lethal potential, the Aum
Shinrikyo attack as it played out, if imagined as one of the Pandora’s Spyglass scenario
stubs, would be discarded by the participants midway through the process, not surviving
the culling to be chosen as one of the “deadly dozen” scenarios.
For the sake of argument, let us say the 9/11attacks and the Aum Shinrikyo subway
attack are two rough analogues for the sort of catastrophic attacks using Promethean
technologies envisioned by a Pandora’s Spyglass analysis. Just two events are not a lot to
work with, but the fact that there have been two since the dawn of the modern era of
terrorism in the late 1960s allows me to calculate an estimate of an annual chance of
occurrence for a “devil’s toy box” attack, the sort of attack that falls within the rubric of
the homeland security enterprise’s counter-future-shock mission. The modern era of
terrorism has lasted 50 years thus far. Two “devil’s toy box” attacks in a 50–year span
equates to a 4% chance of such an occurrence per year. I’ll conservatively estimate the cost
of such an attack, notionally averaging the consequences of the 9/11attacks and the lower-
consequence Aum Shinrikyo attack (Japan did not enter any wars or a recession because
of the latter), at $1 trillion. Four percent times $1 trillion equals an annual risk level of $40
billion. Is this the amount that should be spent annually by the homeland security enterprise
on counter-future-shock R&D? Or would it be more accurate to narrow the timespan under
consideration? Perhaps to the span of time between the present and the earlier of al Qaeda’s
formation in 1988 and Aum Shinrikyo’s turn to terrorism in 1990? Taking this tack would
narrow our timespan to 30 years, rather than fifty. In this case, two occurrences of a “devil’s
toy box” attack in a 30–year span equates to a 6.7% chance of such an occurrence per year.

292
One trillion dollars times 6.7% equals an annual risk level of $67 billion. Is this the amount
that should be spent annually by the homeland security enterprise on counter-future-shock
R&D efforts? (For point of comparison, as will be seen in Appendix A, the average
allocation annually budgeted for the entirety of the DHS Science and Technology
Directorate’s R&D efforts during the half-decade from FY2010 to FY2014 was $445
million, or about 1.1% of the lower of the two annual risk levels calculated above—and
only a small portion of that funding was devoted to what could be characterized as counter-
future-shock R&D expenditures.) Alternatively, budget formulators could perform a series
of sensitivity analyses, asking themselves how much they would be willing to spend on an
annual basis to avert an attack having combined consequences valued at $1 trillion (or $2
trillion, or some other amount, up to the full tabulation of primary, secondary, and tertiary
costs associated with the 9/11attacks) with a range of annual likelihoods of occurrence
(perhaps ranging from .5% likelihood per year to 10% likelihood per year).
Another method for estimating the value of a “devil’s toy box” insurance policy—
what should be spent annually to ensure “the absence of the bang”—would be to perform
a detailed cost analysis of the consequences set forth in each of the “deadly dozen”
scenarios, average the results of the dollar totals for each of the scenarios, and then apply
one of the annual likelihood of occurrence figures formulated above, such as 4% or 6.7%.
The most rigorous method of estimating the value of our notional insurance policy would
be to apply the validation procedures I describe in my response to the third criticism of
Pandora’s Spyglass listed above, and only then use the Pandora’s Spyglass outputs to
support budget formulation efforts.
A final response to the criticism that a “devil’s toy box” analysis and subsequent
R&D efforts waste money and resources in attempting to counter threats that are notional
and may never materialize is what I would call the DARPA comeback. The most famous
and consequential DARPA project to date, the invention of ARPANet, the ancestor of
today’s Internet, was initiated, depending on which version of the tale you believe, either
to create a resilient communications network that could not be knocked out by a limited
nuclear strike or to create a reliable, durable system for the exchange of academic materials
between research centers (or both, perhaps). ARPANet and its descendants have, indeed,

293
been used to reliably transmit academic materials between research centers; however, they
have never had to be used to maintain military and government communications in the
event of a nuclear strike (and thank the good Lord this notional capability of ARPANet has
never been tested under real-world operational conditions). Does this mean DARPA’s and
the Nation’s investment in ARPANet was a waste of money and resources? Well, before
you jump to conclusions, kindly recall that little matter of ARPANet’s unforeseen positive
spinoff effect—the transformation of America’s and much of the world’s economies, the
creation of new industries, many trillions of dollars in economic activity, new modes of
working, recreating, and interacting, and an acceleration of technological progress such as
humanity had never previously experienced. Not a bad spinoff effect, that.
Ah, you might say, but the impact of ARPANet was an incredibly lucky fluke, a
one-in-a-million freak occurrence; it is delusional to expect any pie-in-the-sky R&D
project with roots in a Pandora’s Spyglass analysis to have anywhere even a minute fraction
of the unintended positive impact that ARPANet has garnered. To this I would have to say,
do not be so quick to completely dismiss this possibility. Nicholas Dew, working for the
DARPA Adaptive Execution Office, performed research in 2011 to analyze the outcomes
of 113 DARPA-sponsored R&D projects. Twelve of these resulted in systems or products
that were deployed to components of the U.S. military. Another 20 succeeded in
transitioning major elements into Programs of Record, (i.e.,) the originally envisioned
system or product was not deployed to warfighters, but significant elements or components
found their way into systems or products that did end up in service members’ hands. Of
the remaining projects, 47 resulted in no further development, deployments, or integration
with other systems. These proved to be dead ends, essentially; high-risk, high-benefit
projects that resulted in no benefits (that’s why they’re high-risk); however, 34 of the no-
direct-benefit-to-the-military projects resulted in productive transitions to civilian
technology initiatives.352 In other words, just over 30% of the DARPA projects considered
352 Nicholas Dew, “Technology transfer metrics at DARPA” (classroom lecture, Strategic Planning
and Budgeting for Homeland Security, Center for Homeland Defense and Security, Monterey, CA, June 14, 2017).

294
in this study did not benefit the military by providing useful fresh capabilities (their
intended purpose), but still enjoyed positive spinoff effects in the civilian realm.
Considering the high-risk, highly speculative and cutting-edge nature of DARPA’s
sponsored projects, this must be considered a pretty darned good batting average for
unintended positive spinoff effects.
(Given the not-insignificant likelihood that the R&D projects initiated by Pandora’s
Spyglass will have unforeseen, positive spinoff effects in the civilian economy, our
notional fire insurance policy can be seen to have one attractive feature of a whole life
insurance policy. The policy’s owner gets to “have his cake and eat it, too”—he gets the
risk protection benefit of the policy, which he hopes he will never need to use, along with
some investment income, as well.)
The issue of DARPA projects resulting in unintended positive spinoff effects for
the civilian economy aside, the highest goal of the U.S. military is that it never need use its
impressive arsenal of weaponry for war-fighting purposes, because the existence of that
arsenal has deterred the aggressive actions of would-be assailants. In my view, the goal of
the homeland security enterprise regarding its notional arsenal of shields designed to
counter future-shock attacks should be the same.
K. CONCLUSION—BUY THAT FIRE INSURANCE POLICY!
The pace of technological development and change is accelerating. Current and
near-term developments in nanotechnology, materials science, and machine learning and
artificial intelligence promise to bring the impact of Moore’s Law to realms of technology
far beyond computer chip manufacturing, paving the way for exponential growth in
humanity’s abilities to create—and destroy. Emerging Promethean technologies promise
to deliver to average persons, of average financial means and average skills, capabilities
which until the present time have been relegated only to national governments, well-funded
military establishments, and research laboratories employing hundreds of highly skilled
scientists and technicians. Prometheus’s most significant gift to humanity, the gift of fire,
has always offered both life-enhancing capabilities—providing recipients with the ability
to cook food, heat homes in wintertime, shape bronze, iron, and other metals, and catalyze

295
chemical reactions that enable the creation of life-saving medicines—and life-
extinguishing capabilities… such as the potential to lay waste to entire cities in a single
afternoon.
The history of technology reflects this dual nature of Prometheus’s gift. The
requirements of warfare have always driven technological development, from the time of
the earliest bronze swords and shields and the invention of the chariot to the present day.
Yet until very recently, the keys to the devil’s toy box have been exclusively in the hands
of governments. Governments have interests, territory, wealth, and assets to protect.
Competing governments have always had the ability to hold each other’s interests,
territories, wealth, and assets hostage to destruction or confiscation through use of force,
and thus often deter one another from acts of aggression, although miscalculations result
in wars. The big change we are faced with at present is the emerging ability of individuals
or small groups to wield destructive powers equivalent to those formerly exercised only by
governments. These individuals and small groups are not bound by concerns for territory
or assets, as governments are. They typically have no distinctive territory that can be
surveilled by electronic or human means, to detect the development of new capabilities of
destruction. They are not the size of war elephants, crowned with gaudy armor and
platforms for archers; they are the size of microbes, and like virulent bacteria or viruses,
they can hide virtually anywhere, while still preparing to strike.
Pandora’s Spyglass is a tool to assist the homeland security enterprise in “thinking
about the unthinkable” (to name-check the title of futurist Herman Kahn’s somewhat
infamous 1962 book that applied game theory to the notion of fighting and winning a
nuclear war). It seeks to effectively harness and consolidate expert opinion for the task of
identifying and ranking the worst-case plausible malign uses of emerging Promethean
technologies, so that the homeland security enterprise can prepare itself and the Nation for
the worst notional threats that may actualize five to ten years down the road. It does so by
adapting best practices from the full range of forecasting techniques that have been
developed since the end of World War II. It is not meant to justify budget formulation, not
in its basic form. But if key elements and variables of the procedure are validated through

296
processes I have described, Pandora’s Spyglass can be adapted to the purpose of justifying
budget requests, if desired.
The devil is hard at work on his marvelous, terrifying toys. The shield-makers must
work just as hard, if not harder, and certainly smarter. The devil holds the initiative; the
shield-makers cannot forge shields to protect against the nearly infinite variety of terrible
toys that could potentially spring forth from the devil’s toy box. Yet by making use of
Pandora’s Spyglass, the shield-makers can peer inside the devil’s toy box and through the
walls of the multitude of smaller boxes sitting within, to catch glimpses—foggy, unclear,
flickering glimpses, to be sure—of the toys gestating inside those interior boxes. Then the
shield-makers can apply their powers of judgment and discernment to deciding which of
those interior boxes most need to be sealed shut, which ones contain the most awful, most
destructive toys, the worst of the worst. Or, if those most baneful boxes cannot be sealed
shut in time, the shield-makers at least will not be cripplingly surprised by the terrible toys
that emerge, for they will have had time to forge the appropriate shields with which to
protect the innocent.

297
APPENDIX A. IS HSARPA THE MOST APPROPRIATE FEDERAL AGENCY TO SPEARHEAD THE COUNTER-FUTURE SHOCK
MISSION?
A. BUREAUCRACY AS A HINDRANCE TO THE COUNTER-FUTURE SHOCK MISSION
Rodrigo Nieto-Gómez, in analyzing the differences between the homeland security
enterprise’s systemic mission and its counter-future-shock mission, states that the
enterprise handles the former with aplomb. The nature of the bureaucratic form of
organizational design, he asserts, partially accounts for this. Bureaucracy is a system
evolved to apply standardized policies and procedures to deal with known, incremental
threats; “(b)ureaucracies are good organizations for managing iterative processes that are
subject to continuous improvement loops and must be executed every time in the same way
… (t)hey are the best solution to the problem of maintaining the same level of quality in a
repetitive process.”353 However, these very qualities of homeland security bureaucracies
tend to make them ineffective in meeting their future-shock mission. Nieto-Gómez explains
that “disruptive and unpredictable threats posed by the recombining nature of new
technologies cannot be confronted by incremental methodologies. They are outside of the
feedback loop … the bureaucracy might get as good as it can possibly be and still miss the
next threat precisely because it has learned to be very efficient in its normal operation, thus
resisting any change outside its sustaining processes.”354
Other observers have also focused on the ways in which traditional bureaucratic
organization structures and allegiance to powerful constituencies hinder the homeland
security apparatus’s achievement of its future-shock mission. Christopher Bellavita notes
that in the U.S., the homeland security enterprise’s most politically powerful internal
constituency is the Nation’s first responders’ community, which lobbies for funding for
response equipment essential for the systemic mission. Contrarily, the role of prevention
lacks a similarly influential political and economic constituency. He then identifies three
353 Nieto-Gómez, “‘Power of ‘the Few,’” 11.
354 Ibid., 13.

298
additional factors that hamper homeland security institutions’ provision of effective threat
prevention services. The first of these is the fear of new behavior. He contrasts public safety
leadership’s familiarity and comfort with response behaviors and with their lack of
familiarity and lack of confidence regarding prevention activities, prevention activities
focused on terrorism, which he states is a new role for public safety agencies, thrust upon
them in the wake of the 9/11 attacks. The second factor is the fear of imagination. He
suggests as an example the creation of the Department of Homeland Security, an
amalgamation of 22 existing agencies with little or no redefinition or coordination of their
traditional mission sets. A further example is the political establishment’s ill-conceived
rejection of the Defense Advanced Research Project Agency’s Policy Analysis Market
initiative, an effort to utilize a prediction market to forecast political developments in the
Middle East that could have strategic implications for the defense and homeland security
of the United States. The third factor he cites is the fear of emergence, which Bellavita
defines as reluctance on the part of centralized federal homeland security authorities to let
go of total control of policy and procedures and allow fresh thinking to emerge from the
bottom up, from law enforcement partners at the state, local and tribal levels.355
Coming from a non-homeland security-centric perspective, Helle Vibeke
Carstensen and Christian Bason, in their review of the history of Denmark’s MindLab, a
government-sponsored innovation incubator, identify factors that make the task of
innovation difficult for traditional governmental bureaucracies. They point out that much
research has determined that public sector agencies tend to be more focused on
improvements to their internal policies and procedures than they are on supplying
innovative new services and improved outcomes to the public. The regulation of processes
and standard operating procedures that are characteristic of governmental bureaucracies
tend to lessen the potential for innovation and creativity. They point to the prevalence of
organizational siloes within public bureaucracies, which lead to a reluctance to share
information and expertise between different organizational units. Other limiting factors
include a lack of formal procedures within governmental bodies for conducting the process
355 Bellavita, “What is Preventing Homeland Security?”

299
of innovation, a heavy reliance upon linear project processes, and a lack of effective
performance evaluation procedures, most of which focus upon the faults found within past
performance and few of which focus on how improvements can be made for future
endeavors. Finally, the authors point out that governmental bureaucracies’ improvement
procedures are almost entirely focused upon verification efforts (are we doing things
right?) rather than validation efforts (are we doing the right things?).356
To summarize, observers have noted that public bureaucracies are often ill-suited
to either engage in innovation or to counter malign innovations because (1) bureaucracies
are designed to control and standardize processes, a mindset and mission set that works
against the exercise of creativity; (2) to optimize their functioning, bureaucracies engage
in incremental, linear continuous improvement processes that are not conducive to
innovation; (3) bureaucracies tend to focus on “doing things right” at the expense of “doing
the right things;” and (4) political environments within public bureaucracies tend to
disincentivize sharing of information and innovative processes between siloed operational
units. Additional factors that apply to public bureaucracies within the homeland security
enterprise include: (5) a political and economic environment that favors the provision of
equipment and services to the first responders community, rather than equipment and
services intended to support prevention efforts; (6) homeland security leadership is more
familiar and comfortable with response activities rather than prevention activities; and (7)
federal homeland security agencies are reluctant to relinquish control and incorporate
innovative ideas from law enforcement and security partners at the state, local, and tribal
levels.
The following observations regarding the origin, development, internal processes,
and political criticisms of the Homeland Security Advanced Research Projects Agency,
HSARPA, should be viewed with these observations regarding the strengths and
limitations of traditional bureaucracy in mind. It seems to me that many of the difficulties,
certainly the internal difficulties, that HSARPA has encountered in its attempts to
accommodate the homeland security enterprise’s counter-future-shock mission are likely
356 Vibeke Carstensen and Bason, “Powering Collaborative Policy Innovation,” 3–5.

300
attributable to the agency’s inability to break out of the traditional government bureaucracy
mold, in contrast to the Defense Advanced Research Projects Agency’s (DARPA’s)
marked success, due to deliberate design, in escaping the tentacles of traditional
bureaucratic structures.
B. INTRODUCTION TO HSARPA
On the surface, HSARPA is ideally positioned to address the homeland security
counter-future-shock mission. Its founding rationale, set forth in the months following the
9/11 surprise attacks, was to foster high-risk, high-benefit projects of potential
revolutionary impact in meeting rapidly evolving threats to homeland security. It was
placed within the Science and Technology (S&T) Directorate, which itself was a freshly-
created, key element of the newly organized Department of Homeland Security,
organizationally close to the Secretary. HSARPA was deliberately modeled after DARPA,
the Federal Government’s most illustrious and successful technology incubator, origin of
such transformative technologies as the Internet and military stealth applications, and it
was allotted many of the same acquisition and organizational partnership freedoms and
flexibilities that have benefited DARPA’s efforts.
Yet, to date, HSARPA has seemingly fallen short of the vision its Congressional
parents had for it. The following sections explore the likely reasons for this. They include
frequently shifting organizational roles within the S&T Directorate, as well as uncodified
and inconsistent procedures for identifying, selecting, and prioritizing R&D projects. A
history of Congressional criticism, micromanagement, and budget cuts has certainly been
a factor in HSARPA’s flailings; these Congressional interventions, rather than getting
HSARPA back on course, have likely contributed to a counterproductive internal culture
of risk avoidance and quick, easily identifiable payoffs (the exact opposite of the culture
required by an agency whose founding rationale was revolutionary change). Finally, the
S&T Directorate, rather than emphasizing that HSARPA’s crucial mission is to facilitate
DHS’s counter-future-shock efforts, has assigned to HSARPA over the years a portfolio of
R&D projects predominately consisting of incremental improvements to existing
technologies that address current, rather than future, homeland security needs. In other

301
words (per Nieto-Gómez’s “The Power of ‘the Few’”), HSARPA has been directed to
support the systemic mission, rather than the counter-future-shock mission.
C. HSPARPA’S HISTORY OF CHANGING PROCEDURES FOR IDENTIFYING, SELECTING, AND PRIORITIZING R&D PROJECTS
HSARPA was one of the brand-new organizational units created by the 2003
Homeland Security Act (many of the constituent elements of the new Department of
Homeland Security were pre-existing agencies amalgamated from other parts of the federal
government). As originally constituted, HSARPA’s primary role was to manage the
Acceleration Fund for Research and Development of Homeland Security Technologies.
The George W. Bush administration requested $350 million for the Acceleration fund for
FY2004; this represented nearly half the $803 million requested in FY2004 for the entire
S&T Directorate. HSARPA’s concept of operations, that of awarding merit-reviewed
grants, contracts, or cooperative agreements with outside R&D organizations (to include
private companies, university research centers, and federally funded laboratories), was
modeled after that of the illustrious DARPA.357 Daniel Morgan, performing an analysis
for the Congressional Research Service (CRS) in June 2003, noted that the Homeland
Security Act assigned the Director of HSARPA responsibilities for DHS’s basic and
applied research, test and evaluation (T&E), and both accelerated prototyping and field
deployment, yet did not provide guidance regarding the proper balance between these
functions. Morgan expressed concern that the Department’s immediate operational needs
would drive HSARPA’s R&D efforts at the expense of necessary, but less immediately
relevant basic research.358 As subsequent events have borne out, Morgan’s trepidations
were more prescient than not.
Shortly after the establishment of the S&T Directorate, HSARPA’s first Deputy
Director, Jane Alexander, prepared a PowerPoint presentation for public release entitled
357 Daniel Morgan, Research and Development in the Department of Homeland Security, CRS Report
No. RL31941 (Washington, DC: Congressional Research Service, June 20, 2003), 2-10, http://research.policyarchive.org/1741.pdf.
358 Ibid., 17.

302
“HSARPA—How We Intend to Do Business.” It described for the commercial and
university-based R&D community the new agency’s solicitations and proposals process.
At a high level, it described the work flow of the agency’s program managers as “Planning
=> Solicitation => Contract => Execution.” Alexander listed the following among her
anticipated drivers for identification of projects for solicitation and for subsequent selection
of proposals for funding. These drivers included fundability; overall risk; the maturity of
the proposed technology; the anticipated time before fielding; the technology’s concept of
operations (CONOPS); whether the technology was proprietary in nature; and how the
proposed technology related to similar technologies either deployed by or under
development by the Departments of Defense and Energy. Alexander listed several flexible
acquisition instruments that HSARPA could choose to utilize, including standard
government contracts, cooperative agreements, grants, and Other Transaction Authority
(OTA). Contracts could be solely sourced, limited, or fully competitive. Engagement with
the vendor community could take the form of pre-solicitation discussions, unsolicited white
papers, Statements of Work for Comment, Requests for Proposals, or Broad Agency
Announcements (BAAs).359 Interestingly, this early outreach document makes no mention
of any intentions on HSARPA’s part to align their technology acquisition and development
work with the operational needs of the Department of Homeland Security, or to help the
department to meet future threats and challenges. Project selection criteria appear to have
been based more upon project feasibility than alignment with the DHS mission. This either
may be explained by the presentation’s focus on purely acquisition-related issues, or it may
reflect HSARPA’s possible initial emphasis, which was more “blue sky,” “let’s throw it
against the wall and see what sticks,” and less focused on a mission-support role than the
agency’s later emphasis.
A DHS Inspector General’s report on the S&T Directorate, published in August
2008, described the Directorate’s processes for selecting and prioritizing its R&D projects.
Prior to Admiral Jay Cohen’s appointment as the Directorate’s Under Secretary in 2006,
the Directorate’s Plans, Programs, and Budgets office was solely responsible for
359 Jane Alexander, HSARPA – How We Intend to Do Business (Washington, DC: DHS Science and
Technology Directorate, November 17, 2003), accessed on the DHS Intranet.

303
identifying, selecting, and assigning funding for R&D projects. That office then assigned
projects to one of three executing organizational elements, among them HSARPA. The
office’s decisions regarding which of the three organizational elements to assign various
projects were determined, not by the nature of the projects themselves, but rather by the
type of partner organization that would conduct the R&D activities. These were either
university Centers of Excellence, private companies, national laboratories, or federally
funded research and development centers (FFRDCs). Since the Homeland Security Act had
tasked HSARPA with initiating and managing R&D projects that were revolutionary in
scope and potential, and had also stipulated that HSARPA pursue contracting arrangements
with both public and private entities, the Plans, Programs, and Budgets office assigned the
management of all projects intended for private firms to HSARPA, whether or not the
projects could be considered “revolutionary” in scope and potential impact.360 This rather
confused state of affairs may represent the point of origin of what I would term HSARPA’s
on-going “identity crisis,” as an agency with Advanced Research in its name, but which
oversees projects that are oftentimes merely incremental in scope, representing valuable
but limited advances in existing homeland security-related technology. This mission-
altering decision was made with bureaucratic needs in mind, not out of consideration for
what should have been HSARPA’s unique mission within DHS.
The Inspector General’s report included the following diagram that represents the
S&T Directorate’s structure prior to its reworking by Under Secretary Cohen in 2006:
360 Department of Homeland Security, The Science and Technology Directorate’s Processes, 3.

304
Figure 2. Original Structure of the DHS Science and Technology Directorate361
The PP&B office utilized an Integrated Product Team (IPT) to generate ideas for
R&D projects, which the leadership of the PP&B office then prioritized. Membership in
this Integrated Product Team was limited to PP&B staff and the heads of the three technical
offices, with no representation from any of DHS’s operational components, a fact singled
out for criticism by the Inspector General’s report. Following the PP&B office’s
prioritization of projects, an S&T Directorate Internal Review Board then selected which
projects would be green-lighted and would receive funding.362
Under Secretary Cohen attempted to better align the S&T Directorate’s R&D
portfolio with DHS’s operational priorities by creating six technical divisions in his 2006
reorganization of the Directorate, with each division focusing on a different priority of the
homeland security enterprise. These technical divisions included Borders and Maritime
Security; Chemical/Biological; Command, Control, and Interoperability; Explosives;
361 Ibid., 5.
362 Ibid., 13-14.

305
Human Factors; and Infrastructure and Geophysical.363 Under the new structure, HSARPA
became one of three portfolio divisions that provided programmatic direction to R&D
projects being executed by the various technical divisions. HSARPA was assigned
programmatic responsibility for what was called the innovation portfolio. This portfolio
encompassed Homeland Innovative Prototypical Solutions (HIPS), these being projects
with a moderate to high risk of failure that were expected to deliver significant new
capabilities in prototype form within two to five years; High Impact Technology Solutions
(HITS), defined as projects with a high risk of failure but very significant potential benefit
that were planned to deliver a proof of concept demonstration within a one to three year
envelope; and the Small Business Technology Transfer (STTR) and Small Business
Innovative Research (SBIR) programs.364 Once more, HSARPA’s counter-future-shock
mission was being diluted by R&D projects devoted to the systemic mission. Only the High
Impact Technology Solutions projects could be described as counter-future-shock in
nature; the Homeland Innovative Prototypical Solutions projects were intended to deliver
incremental technological improvements for systemic mission tasks, and the Small
Business projects were defined by the nature of the contractor and associated socio-
economic acquisition goals, not the nature of the project.
These various categories of HSARPA projects could fall within any of the six
technical divisions, as can be seen in the following chart representing the revised S&T
Directorate organizational structure:
363 Ibid., 7.
364 Ibid., 8.

306
Figure 3. Revised DHS Science and Technology Directorate Structure365
Although the Inspector General’s report tended to regard the revised organizational
structure as an improvement to what had preceded it, it did not exempt the S&T Directorate
and HSARPA from criticism, some of which was specific to the Directorate’s and
HSARPA’s processes (or lack thereof) for selecting and prioritizing projects. The report
singled out projects falling within the basic research portfolio, as well as Homeland
Innovative Prototypical Solutions and High Impact Technology Solutions projects, for
suffering from a lack of standardized, consistent procedures for identifying and prioritizing
their R&D efforts. The Integrated Project Teams that suggested projects failed to
consistently solicit input from DHS’s operational components, and this failure to include
potential future field users in the selection process often resulted in a lack of buy-in from
the field when the S&T Directorate eventually attempted to transition their products to end
users. Of interest, some interviewed staffers expressed the opinion that numerous projects
had been selected and funded due to their being of interest to one of the National research
365 Ibid., 7.

307
laboratories, rather than their potential usefulness to DHS and the overall homeland
security enterprise.366 The IG report noted the deluge of unsolicited project proposals the
S&T Directorate received from the private sector, which had prompted the establishment
of an Office of Concepts and Ideas, under the purview of the Transition portfolio. The
report offered praise for the Transition portfolio’s procedures for selecting and prioritizing
projects, which it noted were clear, objective, and consistent; however, the report criticized
this aspect of the Innovation portfolio’s management, stating that its project selection was
the sole responsibility of the Under Secretary, who had failed to establish a consistent,
repeatable procedure.367
As of FY2007, the selection of Basic Research projects was based upon the
following set of steps. First, R&D ideas were generated by the university Centers of
Excellence, the National research laboratories, private sector companies, the technical
divisions’ Integrated Project Teams, DHS components, and interagency working groups.
The resulting ideas were then prioritized and assigned funding by the Technical Division’s
Section Chief and Division Director. For Homeland Innovative Prototypical Solutions and
High Impact Technology Solutions projects, R&D ideas were generated by academia,
private companies, DHS senior leadership, the heads of DHS component agencies, the
Innovation Division Director, and the Under Secretary for S&T. The latter was then solely
responsible for prioritizing and assigning funding to projects.368
The selection process for Homeland Innovative Prototypical Solutions and High
Impact Technology Solutions projects was altered because of the recommendations of the
2008 Inspector General’s report. In his response to the report, Under Secretary Cohen noted
that in the months following the Inspector General’s staff’s interviews with S&T
Directorate staff, he had established a formal process for identification and prioritization
of Homeland Innovative Prototypical Solutions and High Impact Technology Solutions
projects. Under the new, formal process, the Director of Innovation/HSARPA would solicit
366 Ibid., 13-14.
367 Ibid., 18-19.
368 Ibid., 27-28.

308
suggestions from the academic, homeland security, and private industry communities, then
make a report to the S&T Corporate Board on proposals received. The Board would have
an opportunity to make additions to the list of proposed projects, after which the Director
of Innovation would brief the Under Secretary and Deputy Under Secretary for S&T, and
the former would propose projects to the DHS Technology Oversight Group (TOG). This
Oversight Group’s voting members included the DHS Deputy Secretary, the Under
Secretary for Management, and the Under Secretary of the DHS National Protection and
Programs Directorate (NPPD); its advisory, non-voting members included the S&T Under
Secretary, the DHS Chief Financial Officer, and the heads of the DHS operational
components.369
In his March 26, 2009 testimony before the House Committee on Appropriations,
Subcommittee on Homeland Security, Acting S&T Under Secretary Bradley Buswell
reported that the Homeland Innovative Prototypical Solutions/High Impact Technology
Solutions project identification and selection process outlined above had continued, with a
significant addition, the advisory involvement of thirteen Capstone Integrated Project
Teams. These teams’ duties included soliciting information and project suggestions from
DHS operational components, homeland security end users/practitioners, and private
industry partners. The thirteen Capstone Integrated Project Teams were divided by
homeland security functional areas. These included Biological/Agricultural Defense,
Border Security, Cargo Security, Chemical Defense, Counter Improvised Explosive
Devices (IED), Cyber Security, First Responder Support, Incident Management,
Infrastructure Protection, Maritime Security, People Screening, and Transportation
Security.370
369 Ibid., 41-42.
370 Department of Homeland Security, DHS: Testimony of Acting Under Secretary Bradley I. Buswell, Science and Technology Directorate, before the House Committee on Appropriations, Subcommittee on Homeland Security, “Science and Technology Research and Transitioning Products” (Washington, DC: Department of Homeland Security Documents, Federal Information & News Dispatch, Inc., March 26, 2009).
309
Reorganizations continued at the S&T Directorate and HSARPA. A 2010
reorganization sorted the S&T components into four divisions: the Homeland Security
Advanced Research Projects Agency (HSARPA), encompassing six technical divisions,
along with the Special Projects Office for classified R&D projects; the Support to the
Homeland Security Enterprise and First Responders Group, having responsibility for
transfers of technologies to first responders and ensuring compatibility and
interoperability; the Acquisition Support and Operational Analysis Division, responsible
for oversight of the requirements generation process, as well as establishing test and
evaluation policy; and the Research and Development Partnerships Division, which
interfaced with the S&T Directorate’s external partners in the federal government and
academia.371 As of FY2014, HSARPA’s six technical divisions had been reduced to five:
the Borders and Maritime Security Division (BMD), the Chemical and Biological Defense
Division (CBD), and the Explosives Division (EXD), which were all carry-overs from the
FY2007 organization chart; the Resilient Systems Division (RSD), which appears to have
replaced the old Infrastructure and Geophysical technical division; and the new Cyber
Security Division.372
This division of the entirety of the S&T Directorate’s portfolio between HSARPA
and the Support to the Homeland Security Enterprise and First Responders Group
represented a significant change for HSARPA—an expansion of the latter’s scope of
responsibilities and a dilution of its founding mandate. Under the FY2007 reorganization
instituted by then Under Secretary Cohen, although HSARPA’s management and advisory
responsibilities extended throughout all six of the technical divisions, those responsibilities
were limited only to those sorts of projects that could be construed as meeting HSARPA’s
“revolutionary, game-changing” mandate from Congress—the Homeland Innovative
Prototypical Solutions and High Impact Technology Solutions projects (along with projects
associated with the two small business technology and research programs). Even this
371 Shea, The DHS S&T Directorate: Selected Issues for Congress, 3.
372 Department of Homeland Security, Science and Technology Directorate Review 2014 (Washington, DC: U.S. Department of Homeland Security Science and Technology Directorate, 2014), 89, accessed on the DHS Intranet.

310
connection to the “revolutionary, game-changing” mandate was somewhat tenuous, given
the inclusion of the systemic mission-supporting Homeland Innovative Prototypical
Solutions projects. All other projects were overseen by either the Basic Research Portfolio
Division or the Transition Portfolio Division; however, within the more recent
organizational structure, any project that does not directly benefit the first responders’
community lands within HSARPA’s wheel house. In an upcoming section, I will show that
only a small minority (26%) of the 92 projects falling under HSARPA’s umbrella as of
FY2014 could be characterized as supporting a homeland security counter-future-shock
mission, and only four projects were both novel in conception and technically challenging,
the sort of projects that would be expected to make up the majority of an “Advanced
Research” R&D organization. If anything, it appears that between FY2007 and FY2014,
HSARPA moved farther away from its Congressionally mandated mission of fostering
innovative, revolutionary technology to meet and deter rapidly evolving threats to
homeland security.
As of FY2014, the S&T Directorate organized a process to identify its Visionary
Goals that would drive its 2015–2019 Strategic Plan. This process consisted of (a) internal
brainstorming sessions involving S&T staff; (b) an online crowdsourcing portal to solicit
and ingest ideas from outside the Directorate; and (c) a cross-referencing of the identified
ideas against DHS’s policy doctrines and mission priorities.373 The online crowdsourcing
portal was used by 1,298 respondents from the homeland security operational community,
the homeland security industrial base, academia, and the public, who collectively posted a
total of 138 ideas and 308 comments.374 The resulting Visionary Goals included:
Screening at Speed: Security that Matches the Pace of Life
A Trusted Cyber Future: Protecting Privacy, Commerce, and Community
373 Science and Technology Directorate, Strategic Plan 2015–2019 (Washington, DC: Department of
Homeland Security, April 2015), 12, accessed on the DHS Intranet.
374 Ibid., 15.

311
Enable the Decision Maker: Actionable Information at the Speed of Thought
Responder of the Future: Protected, Connected, and Fully Aware
Resilient Communities: Disaster-proofing Society375
How truly “visionary” these goals are may be judged by the reader, but to this
observer, they seem to all focus heavily upon the homeland security systemic mission—its
response to known threats or habitual risks—rather than upon the counter-future-shock
mission. This may be explained by the “visioneering” process itself, which relied heavily
upon the homeland security enterprise’s insiders: governmental and industry professionals
who are primarily incentivized to respond to current or near-term operational needs. Also,
it appears that DHS has attempted to combine under a single umbrella two different types
of R&D organizations, those focused on the systemic mission and those focused on the
“blue sky,” counter-future-shock mission, in contrast with the Department of Defense,
which separates them. Under the Department of Defense structure, each service has its own
dedicated R&D component to service the needs of that component’s systemic mission, but
DARPA, which serves the counter-future-shock mission, stands apart from all these. DHS
may have opted to pursue a contrary path due to budgetary restrictions; the total R&D
budgetary pie Congress has chosen to grant to DHS is a tiny fraction of that assigned to the
Department of Defense, and DHS may have decided to put all its R&D “eggs” into one
basket to avoid slicing a small pie into pieces too thin to be viable on their own. It may
have done so due to bureaucratic self-interest and the tendency toward “empire building;”
perhaps the S&T Directorate leadership has successfully lobbied DHS to retain all the
agency’s R&D functions under their purview. Alternatively, the decision may have been
due to the internal logic of traditional bureaucratic processes (an overriding focus on “doing
things right” at the expense of “doing the right things”), or due to bureaucratic drift and a
failure of DHS leadership to remember HSARPA’s founding mandate to be DHS’s
DARPA. Whatever the case may be, HSARPA can no longer be said to be focusing on the
375 Ibid., 16–17.

312
pursuit of “revolutionary, game-changing” technological developments—if ever that was
the case.
The Department of Homeland Security appears to have recognized, at least to an
extent, that HSARPA has strayed from this original mission and has recently attempted to
rectify this. The S&T Directorate utilized new authority granted under the America
COMPETES Act to establish in March 2015 the InnoPrize Program to administer prize
competitions intended to foster innovative solutions to homeland security challenges.376
The InnoPrize Program provides HSARPA with an additional acquisition arrow in its
quiver, a method of open-ended solicitation and challenge-based financial remuneration
(far different from typically burdensome and slow forms of governmental contracting,
which can be intimidating and off-putting to small businesses with no prior federal
contracting experience), which may prove especially appealing to America’s technology
entrepreneurs. As of FY2017, the Directorate intended to make use of the following R&D
solicitation and acquisition vehicles: Applied Research/Technology Development
Solicitations, Small Business Innovation Research, and Long-Range Broad Agency
Announcements.377 The Directorate’s 2015–2019 Strategic Plan describes a new initiative,
the Targeted Innovative Technology Acceleration Network (TITAN), which aims to utilize
a suite of collaborative tools to actively engage the wide community of technology
innovators and coordinate the efforts of a host of homeland security technology innovation
actors into a more cohesive set of projects.378 At first blush, this appears to be a promising
development; however, a glance at the list of players shows “all the usual suspects”
(national laboratories, academia, private industry, the old Small Business Innovative
376 “Frequently Asked Questions: The America COMPETES Act and DHS Prize Authority,” U.S.
Department of Homeland Security website, accessed March 12, 2017, https://www.dhs.gov/frequently-asked-questions; “How will this prize authority be implemented in the Department?” U.S. Department of Homeland Security website, accessed March 12, 2017, https://www.dhs.gov/frequently-asked-questions ; “Department of Homeland Security,” Challenge.gov website, “More Information” section, accessed March 12, 2017, https://www.challenge.gov/agency/department-of-homeland-security/.
377 Calvin J. Bowman, “A DHS Skunkworks Project: Defining and Addressing Homeland Security Grand Challenges” (master’s thesis, Naval Postgraduate School, 2016), 50.
378 Science and Technology Directorate, Strategic Plan 2015-2019, 24.

313
Research program, etc.), with prize authority being TITAN’s only innovation to preexisting
S&T solicitation and award processes. Disappointingly, TITAN appears to be little more
than a “rebranding” or reshuffling of teaming arrangements and linkages that have long
existed within the S&T Directorate, yet another example (in the tradition of the S&T
Directorate’s frequent reorganizations) of government bureaucracy’s focus on “doing
things right” at the expense of “doing the right thing.”
Perhaps of more promise than TITAN in meeting the challenges of the homeland
security counter-future-shock mission, in January 2015, the S&T Directorate launched
what it calls its DHS National Conversation on Homeland Security Technology. This is
intended to foster “a dialogue between the public as well the Nation’s first responders,
industry representatives, academia, and government officials to shape the future of
homeland security technology;” the initiative means to accomplish this through “dialogues
to address different areas of need in the research and development community: responder
of the future; enabling the decision maker; screening at speed; a trusted cyber future; and
resilient communities. Members of the public are encouraged to join the discussion online
via the S&T Collaboration Community or by attending virtual or in-person events.”379
Additional research will be required to learn how frequently this public access portal has
been used, and what uses the S&T Directorate has made of the feedback it has received.
The predecessor to the National Conversation, S&T’s crowdsourcing portal, resulted in
five Visionary Goals that were much more focused on the homeland security systemic
mission than its counter-future-shock mission. Only time will tell whether the National
Conversation produces the same “mold-sustaining” rather than “mold-breaking” results.
As the preceding overview makes apparent, HSARPA has experienced (and
presumably suffered from) a lack of stability during its less than a decade and a half of
existence. The prime culprits have been the agency’s shifting roles and authorities within
the larger S&T Directorate structure and HSARPA’s oftentimes uncodified, non-
379 “DHS S&T Launches National Conversation on Homeland Security Technology,” U.S.
Department of Homeland Security website, January 13, 2015, accessed February 16, 2017, https://www.dhs.gov/science-and-technology/news/2015/01/13/dhs-st-launches-national-conversation-homeland-security.

314
repeatable, and continually evolving processes for identifying, selecting, and prioritizing
its projects. Frequent changes in the S&T Directorate’s top management and organizational
structure have, likely, focused a great deal of HSARPA’s program managers’ and staffers’
attention on responding to internal organizational changes and pressures, rather than
deciding what sorts of projects could best benefit the homeland security enterprise and then
shepherding the products of those projects to their ultimate transitioning to the field. A
series of internal and external reviews of the S&T Directorate and HSARPA, containing
these critiques and others, has resulted in a history of consistent criticism and
micromanagement from Congress. This, in turn, has quite possibly resulted in a negative
feedback loop for HSARPA—Congressional criticism (codified in negative reports and
budget cuts) led to management and organizational structure changes, perhaps hastily
implemented, which led to anxiety, distraction, and lessened morale on the part of
HSARPA’s staff, which led to decreased focus on the agency’s core mission, which led to
fewer products being transitioned to the field, or to the projects that are transitioned being
less than what the field (or Congress) had hoped for, which led to more Congressional
criticism… and so on. The next Section provides an overview of this cycle.
D. CRITICISM OF THE DHS S&T DIRECTORATE AND HSARPA
Following the implementation of the Homeland Security Act in 2003, Congress’s
initial high hopes for the S&T Directorate were apparently frustrated quickly. A June 2006
Senate report included this lament: “the [c]ommittee is extremely disappointed with the
way S&T is being managed. … This component is a rudderless ship without a clear way to
get back on course.”380 Two months later, Admiral Jay Cohen took over as the new Under
Secretary for the S&T Directorate. That same month, Rep. Tom Davis, serving as
Chairman of the House Committee on Government Reform, requested that the DHS Office
of the Inspector General conduct a review of HSARPA’s processes for identifying,
selecting, and prioritizing its R&D projects.381 Many the Inspector General’s criticisms of
380 S. Rept. 109-273 – Department of Homeland Security Appropriations Bill, 2007, 109th Cong. 2
(2006), https://www.congress.gov/109/crpt/srpt273/CRPT-109srpt273.pdf.
381 Department of Homeland Security, The Science and Technology Directorate’s Processes, 3.

315
the Directorate were discussed in the previous section. A significant criticism focused on
the lack of clear, consistent, repeatable selection, prioritization, and funding procedures for
Homeland Innovative Prototypical Solutions and High Impact Technology Solutions
projects, which had led to at least the appearance of possible impropriety. Under Secretary
Cohen, solely responsible for the selection and funding of these projects, had accepted
R&D project ideas from contacts at his former employer, the Office of Naval Research.
Although the Inspector General did not find evidence of wrongdoing, his report labeled
this lack of defined procedures a significant management shortcoming and advised the
Under Secretary to both relinquish selection authority of Homeland Innovative
Prototypical Solutions and High Impact Technology Solutions projects to the Director of
Innovation/HSARPA and to ensure that formal procedures would be established.382
As of 2007, the S&T Directorate included an Office of Innovation, which sponsored
HomeWorks, a relatively low-funded homeland security skunk works that pursued projects
such as Cell-All, an effort to develop sensors for commercial cell phones that could detect
dangerous biological, chemical, or radiation hazards. HSARPA’s Homeland Innovative
Prototypical Solutions and High Impact Technology Solutions projects fell within the
purview of the Office of Innovation; the former aimed to product prototypes of innovative
homeland security technology solutions within two to five years, whereas the latter pursued
longer-term, more speculative technology plays, of which perhaps only half would
ultimately lead to products that could be fielded within the homeland security. These more
speculative High Impact Technology Solutions projects were only funded for $8 million in
FY2008, or approximately one percent of the S&T Directorate’s budget. Even this early in
the S&T Directorate’s existence, it was suffering from the heat of Congressional criticism;
between FY2007 and FY2008, the overall DHS budget increased by 8.4 percent, whereas
the S&T Directorate’s budget decreased by 18 percent, which followed a decrease of 35
percent the previous fiscal year. This indicates that, whereas Congress remained generally
supportive of homeland security efforts, the legislature wanted to invest in projects and
activities with immediate benefits, rather than those with a more uncertain, longer-term
382 Ibid., 30-31.

316
horizon. The chairman of the Emerging Threats, Cyber Security and Science and
Technology Subcommittee of the House Homeland Security Committee, Rep. Kim
Langevin (D-R.I.), was quoted as saying that he preferred funding immediate cybersecurity
needs over the longer-term R&D efforts pursued by HomeWorks and HSARPA’s
Homeland Innovative Prototypical Solutions and High Impact Technology Solutions
portfolios.383
On March 8, 2007, Jay M. Cohen, the Under Secretary of the S&T Directorate,
appeared before Rep. Langevin’s committee to address the committee’s concerns with the
Directorate. Cohen promised to focus his Directorate’s efforts on what he termed the “four
Bs—bombs, borders, bugs and business.” In other words, in response to political pressure,
he would focus S&T’s R&D efforts on the systemic mission, at the expense of the counter-
future-shock mission. He touted a new organizational structure for the Directorate, which
had been put in place in September of 2006 and that had reduced business expenses by 50
percent, and a Capstone Integrated Product Team Process to better identify DHS’s most
pressing needs and more swiftly transition technology products to the field. He stated that
his Capstone Integrated Project Teams’ structure was based upon twelve mission priorities:
“Information Sharing/Management; Cyber Security; People Screening; Border Security;
Chemical/Biological Defense; Maritime Security; Explosive Prevention; Cargo Security;
Infrastructure Protection; and Incident Management (includes first responder
interoperability).”384
Dr. Tara O’Toole succeeded Jay Cohen as the Under Secretary of S&T in
November 2009. A November 2011 Congressional hearing, “Science and Technology on
a Budget: Finding Smarter Approaches to Spur Innovation, Impose Discipline, Drive Job
Creation, and Strengthen Homeland Security,” featured members of the Subcommittee on
383 Alan Joch, “Homeland Security’s High-Tech Gamble,” Federal Computer Week, November 12,
2007, 17–23.
384 Hon. Jay M. Cohen, Under Secretary, Science and Technology Directorate, U.S. Department of Homeland Security, Before the U.S. House of Representatives, Appropriations Committee, Subcommittee on Homeland Security, House, 110th Cong. 2 (2007), https://science.house.gov/sites/republicans.science.house.gov/files/documents/hearings/30807_cohen.pdf.

317
Cybersecurity, Infrastructure Protection, and Security Technologies of the Committee on
Homeland Security expressing measured approval of Dr. O’Toole’s changes; however,
they also expressed dissatisfaction with the Directorate’s lack of internal controls over its
projects, lack of defined procedures for prioritizing its projects, and DHS’s lack of strategic
planning for its full portfolio of R&D efforts across all its components (although they noted
that the S&T Directorate was approaching the end of its first five-year strategic plan and
was about to begin work on its second).385 It seems worth noting that the committee’s
focus was on “doing things right” (and less expensively than before), rather than “doing
the right things.”
The S&T Directorate suffered a 56% reduction in budgetary allocation for research
and development activities between FY2010 and FY2012.386 This most likely reflected
Congress’s lack of confidence in the Directorate, its processes, products, and leadership.
The Directorate’s number of R&D projects shrank from more than 250 in FY2010 to 75 in
FY2012, and the cuts forced S&T leadership to funnel resources away from lower priority
areas such as borders, resilience, and maritime security in favor of projects meant to aid
efforts in the areas of aviation security, first responders’ needs, cybersecurity, and
biodefense; however, as of FY2014, the Directorate had recovered financially; its R&D
funding had reached approximate parity with its FY2011 allocation, and the number of
projects grew once more to over 100.387 See Table 9.
385 Science and Technology on a Budget: Finding Smarter Approaches to Spur Innovation, Impose
Discipline, Drive Job Creation, and Strengthen Homeland Security – Hearing Before the Subcommittee on Cybersecurity, Infrastructure Protection, and Security Technologies of the Committee on Homeland Security, House, 112th Cong. 1 (2011), https://archive.org/details/gov.gpo.fdsys.CHRG-112hhrg74533.
386 Department of Homeland Security, Science and Technology Directorate Review 2014, 13.
387 Ibid.

318
Table 9. S&T Directorate Research and Development Funding, FYs 2010 - 2014388
FiscalYear Funding(inThousands)
FY2010 $598,473
FY2011 $459,689
FY2012 $265,783
FY2013 $431,846
FY2014 $467,000
An April 2014 report by the Congressional Research Service identified a range of
issues of concern with the S&T Directorate and made some pointed observations regarding
HSARPA. It stated that, despite HSARPA’s originating mandate (mirroring DARPA’s
mission in the Department of Defense realm) to foster revolutionary technologies in the
homeland security sphere, much of HSARPA’s efforts have been conventional,
incremental R&D work of only moderate risk. Secretary Cohen’s reforms, resulting in the
Homeland Innovative Prototypical Solutions and High Impact Technology Solutions
projects, had steered HSARPA somewhat back toward its original rationale, yet the
relatively minute funding available for these projects never allowed for results approaching
those of DARPA’s famed successes. The 2010 reorganization once more pushed HSARPA
towards a portfolio of moderate-risk, conventional R&D, and in subsequent fiscal years,
HSARPA had taken on an increasing number of closely related projects, which has served
to narrow its focus to a handful of threat vectors.389 The report also addressed the
deleterious impact of uncertain and programmatically restricted funding through
Continuing Resolutions on the R&D process. Additionally, it subtly pointed out the
mismatch between Congress’s desire for DARPA-like results and its aversion to risk. High-
risk, high-reward R&D of the type practiced by DARPA “requires an increased and
388 Ibid., 12.
389 Shea, The DHS S&T Directorate: Selected Issues for Congress, 17.

319
sustained financial commitment… [i]n the current fiscal environment, congressional policy
makers may find it difficult to provide such an increased and sustained financial
commitment.”390
Congressional impatience and dissatisfaction with the S&T Directorate were
reflected in the language and intent of H.R.3578, the DHS Science and Technology Reform
and Improvement Act of 2015. The proposed bill directed DHS, among other stipulations,
to “establish a process to define, identify, prioritize, fund, and task its basic and applied
homeland security research and development activities,” to establish procedures for regular
portfolio reviews and Integrated Project Teams (IPTs) to ensure that Departmental
objectives are being supported by the R&D portfolio, and to ensure that the Directorate
formulate and regularly update a five-year plan for its activities. The bill passed the House
but died in Senate committee.391 An observer might express surprise to learn that, a dozen
years after the S&T Directorate’s founding, its Congressional overseers would find it
necessary to stipulate such basic managerial best practices as a defined, standardized
process to select and prioritize projects, utilize Integrated Project Teams, and conduct
periodic portfolio reviews. The recommendation regarding the use of Integrated Project
Teams is surprising, due to the S&T Directorate’s proud reporting to Congress as recently
as March 2009 of the benefits of its Capstone Integrated Project Teams process.392 The
language of the proposed reform bill indicates that this process had been abandoned at
some point.
In her 2015 master’s thesis, “Solving Homeland Security’s Wicked Problems: A
Design Thinking Approach,” Kristin Wyckoff contrasted the project management
approaches of DARPA, Denmark’s MindLab, and the S&T Directorate. She laid out the
following criticisms of the latter. The S&T Directorate predominately relied upon use of
traditional federal government contracting approaches, which resulted in lengthy periods
390 Ibid., 20.
391 “H.R.3578 - DHS Science and Technology Reform and Improvement Act of 2015,” Congress.gov, accessed on February 2, 2017, https://www.congress.gov/bill/114th-congress/house-bill/3578.
392 Department of Homeland Security, Testimony of Acting Under Secretary Bradley I. Buswell.

320
needed for project requirements definition, acquisition of R&D services, and transitioning
efforts.393 The Directorate placed heavy reliance on a linear systems engineering R&D
approach, appropriate for incremental improvements to existing technologies, but not well
suited for truly innovative work.394 It focused on individual performance incentives rather
than team or unit performance incentives, and it failed to incentivize collaboration.395
Perhaps most detrimental to HSARPA’s Congressionally mandated mission of producing
revolutionary, game-changing innovations, Wyckoff identified a pervasive culture of risk
avoidance and seeking “quick wins,” which she asserted had taken root in the S&T
Directorate due to its history of repeated, severe Congressional criticism and resultant
budget cuts.396
The following Section fleshes out these criticisms by examining more closely the
composition of HSARPA’s R&D portfolio (as of FY2014) and judging how much of that
portfolio can be ascertained as being high-reward, high-risk, versus incremental and
moderate risk. In other words, how truly does the Homeland Defense Advance Research
Programs Agency reflect its own name, and how well is it balancing the roles of supporting
both the systemic mission and the counter-future-shock mission?
E. HSARPA R&D PROJECTS: SUPPORTING THE COUNTER-FUTURE-SHOCK MISSION OR THE SYSTEMIC MISSION?
The Science and Technology Directorate Review 2014 provides the following
overview of HSARPA’s mission, methods, and partnerships:
HSARPA is evolving to focus on applied technology development and integration into component operations. Its divisions strive to understand and to define operational context by conducting systems analyses of current missions, systems, and processes, and ultimately to identify operational gaps where S&T can have the greatest impact on operating efficiency and increasing capability. HSARPA then employs the concept of technology foraging (“tech foraging”), working with its partners and In-Q-Tel (IQT)—
393 Wyckoff, “Solving Homeland Security’s Wicked Problems,” 13.
394 Ibid., 38.
395 Ibid., 64.
396 Ibid., 38-39.

321
an independent, strategic investment firm—to identify potential solutions already being researched or developed by external partners. HSARPA’s end goal is to transition products to the field for operational use.397
Prior to the initiation of fresh R&D projects, S&T Directorate program managers
were required to engage in technology foraging, an institutionalized market research
process intended to eliminate redundancies by identifying new technological
advancements undertaken by the Directorate’s existing network of technology partners or
by potential future partners.398 Technology foraging efforts were ongoing in the areas of
automated pollen recognition, biometrics, cargo conveyance security devices, chemical sampling, climate change adaptation, eGovernment portals, Federal Emergency Management Agency projects, flood mitigation for substations, fuel cells, geocoding, infrastructure protection projects, insider threats, metric insights, missile deflection, mobile device management, NoSQL databases, ozone widget framework, photo ballistics, Platfora/Datameer competitors, portable Sensitive Compartmented Information Facility (SCIF), robotic systems and camera integration, sensors for small unmanned aerial systems, social media analytics, social media tools for federal communication, Tensator information and competitors, text analytics, undergrounding cables, (and) video recovery.399
As was noted in an earlier section, as of FY 2014, HSARPA’s R&D projects were
divided among five mission-based divisions:
Borders and Maritime Security Division (BMD)—Prevent contraband, criminals, and terrorists from entering the United States, while permitting the lawful flow of commerce and visitors.
Chemical and Biological Defense Division (CBD)—Detect, protect against, respond to, and recover from potential biological or chemical events.
Cyber Security Division (CSD)—Create a safe, secure, and resilient cyber environment.
397 Department of Homeland Security, Science and Technology Directorate Review 2014, 25.
398 Ibid., 62.
399 Ibid., 89.

322
Explosives Division (EXD)—Detect, prevent, and mitigate explosives attacks against people and infrastructure.
Resilient Systems Division (RSD)—Enhance resilience to prevent and protect against threats, mitigate hazards, respond to disasters, and expedite recovery.400
Additional HSARPA R&D efforts were categorized as Apex projects, described
as “high-priority, high-value, rapid delivery project(s) focused on a DHS component’s
unique mission and capability needs.”401 This category of projects was initiated in 2011 to
allow for the promulgation of R&D projects requested by the head of a DHS operational
agency. The S&T Directorate would then commit, not only to fostering the R&D process,
but also to working collaboratively with field operatives within the sponsoring DHS
component to ensure a successful transition of the newly developed technologies.402
The 2014 Review provides lists of the R&D projects assigned to each of these five
divisions, and I have made use of these lists to compose Table 10.403 I use the list of
FY2014 projects for analysis because this list is the most recent list of projects available to
me for which S&T Directorate employees have assigned scored analytical variables such
as Novel Approach Score, Technical Feasibility Score, and Innovation Level. My goal is
to ascertain whether the projects support homeland security’s systemic mission (preventing
or responding to known threats) or whether they might serve the counter-future-shock
mission (aiding prevention and response efforts against threats from cutting-edge or
repurposed technologies, used maliciously, and previously unencountered by the homeland
security enterprise). I have assigned projects to one mission or the other depending on my
judgments of the project descriptions. Evaluations of individual projects’ level of Novel
Approach, Technical Feasibility, and Innovation Level, where available, have been taken
400 Ibid.
401 Ibid., 26.
402 Shea, The DHS S&T Directorate: Selected Issues for Congress, 12.
403 Lists of HSARPA projects, broken out by division, are found in Department of Homeland Security, Science and Technology Directorate Review 2014, 26-37. A handful of projects in each division were highlighted with descriptions, which assisted me in making determinations on whether those projects are intended to support the system mission, the counter-future-shock mission, or possibly both.

323
from the 2014 DHS S&T Portfolio Review Final Analysis: Briefing Document for S&T
Leadership and reflect the judgment of the authors of that document. See Tables 10 through
16.
Table 10. FY 2014 HSARPA Apex Division Projects, by Project Name, Type of Mission Supported, Novel Approach Score, Technical Feasibility Score,
and Innovation Level
Division Project Name Systemic/ Future Shock
N
ovel A
pproach404
(7‐8=Fresh Perspective;
9–10=R
evolutionary)
Technical Feasibility405
(1‐2=V
ery Difficult;
3‐4=D
ifficult)
Innovation Level
(Novel/Tech Difficult;
Incremental/Tech
Feasible)
Apex Air Entry and Exit Re‐Engineering Project (AEER)
Systemic N/A406 N/A N/A
Border Enforcement Analytics Program (BEAP)
Systemic N/A N/A N/A
404 Novel Approach scoring definitions are taken from Department of Homeland Security, 2014 DHS
S&T Portfolio Review Final Analysis: Briefing Document for S&T Leadership (Washington, DC: U.S. Department of Homeland Security Science and Technology Directorate, May 2015), 27, accessed on the DHS Intranet (do not release without prior approval from the Department of Homeland Security). Project scores are taken from pages 43-53.
405 Technical Feasibility scoring definition is taken from Department of Homeland Security, 2014 DHS S&T Portfolio Review Final Analysis, 22. Project scores are taken from pages 43-53.
406 “N/A” means Not Available; this project was not analyzed as part of the portfolio review included in the 2014 DHS S&T Portfolio Review Final Analysis.

324
Table 11. FY 2014 HSARPA Borders and Maritime Security Division Projects, by Project Name, Type of Mission Supported, Novel Approach Score,
Technical Feasibility Score, and Innovation Level
Division
Project Name Systemic/ Future Shock
N
ovel A
pproach
(7‐8=Fresh Perspective;
9–10=R
evolutionary)
Technical Feasibility
(1‐2=V
ery Difficult;
3‐4=D
ifficult)
Innovation Level
(Novel/Tech Difficult;
Incremental/Tech
Feasible)
Borders and Maritime Security
Cargo Container Security ‐Central Examination Stations (CES)/In‐Bond
Systemic 5 9 Incremental / Tech Feasible
Cargo Container Security ‐Maritime Cargo Security Pilot
Systemic 5 9 Incremental / Tech Feasible
Cargo Container Security ‐Secure Hybrid Composite Container
Systemic 5 9 Incremental / Tech Feasible
Cargo Validation ‐ Currency Detection
Systemic 7 8 Novel / Tech Feasible
Cargo Validation ‐ Pollen Forensics
Systemic 7 8 Novel / Tech Feasible
Land/Sea Cargo Screening ‐ Mid‐Level Energy Scanning System Upgrade
Systemic 4 9 Incremental / Tech Feasible
Air Based Technologies ‐ Airborne Sensors for Wide Area Surveillance
Systemic / Future Shock
4 7 Incremental / Tech Feasible
Air Based Technologies ‐ Robotic Aircraft for Public Safety
Systemic / Future Shock
4 7 Incremental / Tech Feasible
Ground Based Technologies ‐ Buried Tripwire
Systemic 4 5 Incremental / Tech Feasible
Ground Based Technologies ‐ Canada‐US Sensor Sharing Pilot
Systemic 4 5 Incremental / Tech Feasible

325
Division
Project Name Systemic/ Future Shock
N
ovel A
pproach
(7‐8=Fresh Perspective;
9–10=R
evolutionary)
Technical Feasibility
(1‐2=V
ery Difficult;
3‐4=D
ifficult)
Innovation Level
(Novel/Tech Difficult;
Incremental/Tech
Feasible)
Ground Based Technologies ‐ Mobile Surveillance System Upgrade (MSS‐U)
Systemic 4 5 Incremental / Tech Feasible
Ground Based Technologies ‐ Slash CameraPole
Systemic 4 5 Incremental / Tech Feasible
Ground Based Technologies ‐ Unattended Ground Sensors
Systemic 4 5 Incremental / Tech Feasible
Rapid Response Prototyping
Systemic N/A N/A N/A
Small Dark Aircraft Systemic N/A N/A N/A
Tunnel Detection and Surveillance ‐ Tunnel Activity Monitoring
Systemic 7 5 Novel / Tech Feasible
Tunnel Detection and Surveillance ‐ Tunnel Detection
Systemic 7 5 Novel / Tech Feasible
Coastal Surveillance System (CSS)
Systemic 4 9 Incremental / Tech Feasible
Detection of People in Water
Systemic 4 9 Incremental / Tech Feasible

326
Table 12. FY 2014 HSARPA Chemical and Biological Defense Division Projects, by Project Name, Type of Mission Supported, Novel Approach
Score, Technical Feasibility Score, and Innovation Level
Division Project Name Systemic/ Future Shock
N
ovel A
pproach
(7‐8=Fresh Perspective;
9–10=R
evolutionary)
Technical Feasibility
(1‐2=V
ery Difficult;
3‐4=D
ifficult)
Innovation Level
(Novel/Tech Difficult;
Incremental/Tech
Feasible)
Chemical and Biological Defense
Adaptive Facility Protection (Bio and Chem)
Systemic N/A N/A N/A
Agricultural Screening Tools Systemic N/A N/A N/A
Bioassays Systemic 5 6 Incremental / Tech Feasible
Bio‐Defense Knowledge Center (BKC)
Systemic N/A N/A N/A
Bio‐Forensics Operations (NBFAC)
Systemic N/A N/A N/A
Bio‐Forensics Research and Development
Systemic 4 4 Incremental / Tech Difficult
Bio Terrorism Risk Assessment
Systemic 4 4 Incremental / Tech Difficult
Bio‐Threat Characterization (BTC)
Systemic 3 4 Incremental / Tech Difficult
Chem‐Bio Event Characterization
Systemic N/A N/A N/A
Chemical Forensics and Attribution (FAP)
Systemic 5 4 Incremental / Tech Difficult
Chemical Forensics Project Systemic N/A N/A N/A
Chemical Security Analysis Center (CSAC)
Systemic N/A N/A N/A
Detect‐to‐Protect Bio‐Aerosol Detection Systems
Systemic N/A N/A N/A
Enhanced Passive Surveillance
Systemic N/A N/A N/A
Foreign Animal Disease Modeling
Systemic N/A N/A N/A
Foreign Animal Disease Vaccines and Diagnostics
Systemic 5 4 Incremental / Tech Difficult

327
Division Project Name Systemic/ Future Shock
N
ovel A
pproach
(7‐8=Fresh Perspective;
9–10=R
evolutionary)
Technical Feasibility
(1‐2=V
ery Difficult;
3‐4=D
ifficult)
Innovation Level
(Novel/Tech Difficult;
Incremental/Tech
Feasible)
Integrated Consortium of Laboratory Networks
Systemic N/A N/A N/A
Integrated Terrorism Risk Assessment
Systemic 4 3 Incremental / Tech Difficult
Livestock Decontamination, Disposal, and Depopulation (3D)
Systemic 4 10 Incremental / Tech Feasible
Multi‐Application Multiplex Technology Platform
Systemic N/A N/A N/A
National Bio and Agro‐Defense Facility (NBAF) Agro Defense and Research Assessment
Systemic N/A N/A N/A
Next Gen Bio Detection Systemic N/A N/A N/A
Operational Tools for Response and Restoration
Systemic N/A N/A N/A
Rapid Diagnostic Capability Systemic N/A N/A N/A
Underground Transport Restoration
Systemic N/A N/A N/A
Viable Bioparticle Capture Systemic N/A N/A N/A

328
Table 13. FY 2014 HSARPA Cyber Security Division Projects, by Project Name, Type of Mission Supported, Novel Approach Score, Technical
Feasibility Score, and Innovation Level
Division Project Name Systemic/ Future Shock
N
ovel A
pproach
(7‐8=Fresh Perspective;
9–10=R
evolutionary)
Technical Feasibility
(1‐2=V
ery Difficult;
3‐4=D
ifficult)
Innovation Level
(Novel/Tech Difficult;
Incremental/Tech
Feasible)
Cyber Security
Comprehensive National Cybersecurity Initiative (CNCI) Cyber Economic Incentives
Future Shock
5 4 Incremental / Tech Difficult
CNCI Leap Ahead Technologies
Future Shock
N/A N/A N/A
CNCI Moving Target Defense Future Shock
8 4 Novel / Tech Difficult
CNCI Tailored Trustworthy Spaces
Future Shock
N/A N/A N/A
CNCI Transition to Practice (TTP)
Future Shock
5 7 Incremental / Tech Feasible
Cybersecurity Assessment and Evaluation
Systemic / Future Shock
N/A N/A N/A
Cybersecurity Competitions Systemic / Future Shock
8 10 Novel / Tech Feasible
Cybersecurity Forensics Systemic / Future Shock
3 4 Incremental / Tech Difficult
Data Privacy Technologies Systemic / Future Shock
N/A N/A N/A
Enterprise‐Level Security Metrics and Usability
Systemic / Future Shock
N/A N/A N/A
Experimental Research Testbed
Future Shock
N/A N/A N/A
Experiments and Pilots Future Shock
N/A N/A N/A
Homeland Open Security Technologies (HOST)
Systemic / Future Shock
4 7 Incremental / Tech Feasible

329
Division Project Name Systemic/ Future Shock
N
ovel A
pproach
(7‐8=Fresh Perspective;
9–10=R
evolutionary)
Technical Feasibility
(1‐2=V
ery Difficult;
3‐4=D
ifficult)
Innovation Level
(Novel/Tech Difficult;
Incremental/Tech
Feasible)
Identity Management Systemic / Future Shock
4 6 Incremental / Tech Feasible
Internet Measurement and Attack Modeling
Systemic / Future Shock
5 7 Incremental / Tech Feasible
Process Control Systems (PCS) Security
Systemic / Future Shock
N/A N/A N/A
Research Data Repository Systemic / Future Shock
N/A N/A N/A
Secure Protocols Systemic / Future Shock
5 8 Incremental / Tech Feasible
Security for Cloud‐Based Systems
Systemic / Future Shock
6 6 Incremental / Tech Feasible
Software Assurance Marketplace (SWAMP)
Systemic / Future Shock
4 4 Incremental / Tech Difficult
Software Quality Assurance Systemic / Future Shock
N/A N/A N/A

330
Table 14. FY 2014 HSARPA Explosives Divisions Projects, by Project Name, Type of Mission Supported, Novel Approach Score, Technical Feasibility
Score, and Innovation Level
Division Project Name Systemic/ Future Shock
N
ovel A
pproach
(7‐8=Fresh Perspective;
9–10=R
evolutionary)
Technical Feasibility
(1‐2=V
ery Difficult;
3‐4=D
ifficult)
Innovation Level
(Novel/Tech Difficult;
Incremental/Tech
Feasible)
Explosives Air Cargo Systemic 5 6 Incremental / Tech Feasible
Aircraft Vulnerability Tests
Systemic 4 9 Incremental / Tech Feasible
Algorithm and Analysis of Raw Images
Systemic N/A N/A N/A
Canine Explosives Detection
Systemic 6 6 Incremental / Tech Feasible
Checked Baggage Systemic 6 7 Incremental / Tech Feasible
Eye Safe Trace Detection
Systemic N/A N/A N/A
Homemade Explosives Characterization
Systemic 5 4 Incremental / Tech Difficult
Integrated Passenger Screening System
Systemic 7 4 Novel / Tech Difficult
Mass Transit Systemic 7 2 Novel / Tech Difficult
Next Generation Passenger Checkpoint
Systemic 7 3 Novel / Tech Difficult

331
Table 15. FY 2014 HSARPA Resilient Systems Divisions Projects, by Project Name, Type of Mission Supported, Novel Approach Score, Technical
Feasibility Score, and Innovation Level
Division Project Name Systemic/ Future Shock
N
ovel A
pproach
(7‐8=Fresh Perspective;
9–10=R
evolutionary)
Technical Feasibility
(1‐2=V
ery Difficult;
3‐4=D
ifficult)
Innovation Level
(Novel/Tech Difficult;
Incremental/Tech
Feasible)
Resilient Systems
Actionable Indicators and Countermeasures
Systemic / Future Shock
1 10 Incremental / Tech Feasible
Advanced Incident Management Enterprise System
Systemic N/A N/A N/A
Blast Analysis of Complex Structures
Systemic N/A N/A N/A
Drinking Water Resilience Systemic N/A N/A N/A
Geospatial Location Accountability and Navigation System for Emergency Responders (GLANSER)
Systemic N/A N/A N/A
Human Systems Research and Engineering (HSRE)
Systemic N/A N/A N/A
Non‐Cooperative Biometrics Systemic 5 8 Incremental / Tech Feasible
Overhead Imagery Data Systemic 4 8 Incremental / Tech Feasible
Passive Methods for Precision Behavioral Screening
Systemic N/A N/A N/A
Rapid DNA Systemic 6 8 Incremental / Tech Feasible
Resilient Electric Grid Systemic 4 5 Incremental / Tech Feasible
Resilient Tunnel Project Systemic 4 5 Incremental / Tech Feasible
Risk‐Based Resource Deployment Decision Aid Prediction Project
Systemic 6 7 Incremental / Tech Feasible
Standard Unified Modeling Mapping Integrated Toolkit (SUMMIT)
Systemic 4 9 Incremental / Tech Feasible

332
Table 16. FY 2014 HSARPA Projects, by Type of Mission Supported and Innovation Level
Mission Type Supported
Number of Projects
Incremental / Tech Feasible
Incremental / Tech Difficult
Novel / Tech Feasible
Novel / Tech Difficult
Systemic 68 (74%) 24 7 4 3
Counter‐Future Shock
7 (8%) 1 1 ‐‐ 1
Systemic / Counter‐Future Shock
17(18%) 8 2 1 ‐‐
Totals 92 (100%) 33 10 5 4
This FY 2014 snapshot of the HSARPA R&D project portfolio presents a far more
conservative cast than one might expect for an innovation incubator with “Advanced
Research” as part of its name, whose founding Congressional mandate is centered on the
development and implementation of revolutionary technology. Of the 92 projects listed,
only 24 (26%) can be said (in my estimation) to support counter-future-shock mission. Of
the 52 HSARPA projects assessed during the FY 2014 portfolio review within the 2014
DHS S&T Portfolio Review Final Analysis: Briefing Document for S&T Leadership, only
4 (8% of these 52) were of the type—novel in conception and technically challenging—
which might be expected to make up the majority of a “revolutionary” “Advanced
Research” organization. Contrary-wise, 33 (63% of these 52) of the projects were
incremental in their conception and technically feasible; and of these 33, 24 supported the
systemic mission. One might ask whether these latter projects and their like belong under
the umbrella of HSARPA, or whether they would more realistically belong in one of the
S&T Directorate’s other portfolios.
An earlier Section described the process initiated by the S&T Directorate to identify
its five Visionary Goals that would drive much of its R&D effort from FY2015 to FY2019.
The Directorate’s Apex programs are those R&D efforts that most closely adhere to the
five Visionary Goals. As of FY2015, eight Apex programs were underway: Screening at
Speed; Real-Time Biological Threat Awareness; Next Generation First Responder;
Relational Adaptive Process of Information and Display; Cybersecurity in Critical

333
Infrastructure; Border Situational Awareness; Border Enforcement Analytics; and Air
Entry and Exit Reengineering.407 Virtually all these Apex programs are intended as
responses to known, existing threats and risks. These include air travel security (Screening
at Speed; Air Entry and Exit Reengineering), border control and security (Border
Situational Awareness; Border Enforcement Analytics), biohazards and terror attacks using
biological agents (Real-Time Biological Threat Awareness), cyber attacks (Cybersecurity
in Critical Infrastructure), community determination of flood hazards and risks from other
potential natural disasters (Relational Adaptive Process of Information and Display, or
RAPID408), and the needs of first responders who engage with natural or man-made
disasters (Next Generation First Responder). This seems to represent, once again, the S&T
Directorate’s and HSARPA’s ongoing focus on the systemic mission at the expense of
preparing for the counter-future-shock mission.
To sum up, all the criticisms leveled at HSARPA by Congress, Inspector General’s
reports, and outside observers appear to be valid. Both HSARPA and its parent
organization, the S&T Directorate, have been negatively impacted by factors both internal
and external. These have included poor internal controls of R&D projects, a history of a
lack of clear, repeatable processes for identifying, selecting, and prioritizing projects,
frequent changes in leadership, wildly vacillating funding levels, and funding by
Continuing Resolutions, which limits the initiation of new projects and places severe limits
on how appropriated funds can be spent. HSARPA has made gradual progress over the
years in formulating and adhering to repeatable procedures for identifying, selecting, and
prioritizing projects, and the organization appears to have made progress in gathering and
incorporating feedback, inputs, and collaboration from DHS operational components and
R&D partners in industry, academia, and federal laboratories. Yet the adoption of these
procedures, as part of a series of S&T Directorate reorganizations, has served to focus
HSARPA’s program managers almost entirely on supporting the homeland security
systemic mission, with very little effort being expended on the equally vital counter-future-
407 Science and Technology Directorate, Strategic Plan 2015-2019, 19.
408 Ibid., 48.

334
shock mission. This is not to say that HSARPA’s sponsored projects are not carrying out
vital, important work—they are. Saying the counter-future-shock mission is suffering in
comparison with the systemic mission in no way denigrates the importance of the latter.
What I have been emphasizing, though, is that the homeland security enterprise currently
has no other element other than HSARPA to focus on the counter-future-shock mission.
So, if HSARPA is not doing that, then no organization in homeland security is; and, given
the magnitude of potential threats lurking over the horizon, that is a frightening thought.
As the federal government’s designated “tip of the spear” for counter-future-shock
technology incubation in the homeland security realm, HSARPA appears to have abdicated
its unique role. Can this agency be made to realign with its founding mandate? HSARPA’s
Congressional “parents” anticipated that their “baby” would grow up to become the
homeland security equivalent of DARPA. Can elements of the DARPA model be
effectively applied to HSARPA to shift the latter’s focus to more high-reward, high-risk
R&D efforts meant to protect against evolving, future threats? Or is the homeland security
sphere of responsibilities too fundamentally different from that of the Department of
Defense for the DARPA model to be transposed to HSARPA? Pursuing answers to these
expansive questions is outside the scope of this thesis; however, in the next Section I will
set forth those questions I feel must be answered to determine the best home for a “devil’s
toy box” analytical effort and the R&D projects such an analytical effort would support.
F. WHAT IS THE MOST APPROPRIATE HOME FOR A “DEVIL’S TOY BOX” ANALYTICAL EFFORT AND SUBSEQUENT R&D PROJECTS?
In my estimation, six potential “homes” for a “devil’s toy box” analytical effort
may be considered as alternatives. These alternatives are:
HSARPA as-is: No changes are made to HSARPA’s organizational
structure to accommodate a “devil’s toy box” analytical effort and
subsequent R&D efforts to support the counter-future-shock mission. A
“devil’s toy box” analysis is assigned to existing or newly hired staff as a
new effort.

335
“Refocused” HSARPA: The S&T Directorate removes R&D efforts that
support the systemic mission from HSARPA and reassigns them to
another organizational unit, freeing the existing HSARPA to concentrate
on fostering R&D that supports the counter-future-shock mission.
“Mini-ARPA”: The S&T Directorate leaves all R&D projects currently
assigned to HSARPA in place but creates a “mini-ARPA” (mini Advanced
Research Projects Activity) inside the existing HSARPA and gives its
managers autonomy from existing lines of bureaucratic control, freeing
them to concentrate entirely on the counter-future-shock mission.
“New” HSARPA: The existing HSARPA, “old” HSARPA, officially (de
jure) becomes what it has essentially evolved into over the past decade (de
facto)—DHS’s R&D wing to support its systemic mission efforts, its
counterpart to the Army’s, Navy’s, Air Force’s, and Marines’ dedicated
R&D units. In parallel, DHS establishes a “new” HSARPA, not under the
same S&T Directorate umbrella as “old” HSARPA, as its counterpart to
the Defense Advanced Research Projects Agency (DARPA). “New”
HSARPA is a mostly autonomous agency that will focus exclusively on
high-risk, high-benefit programs to support the counter-future-shock
mission in the homeland defense realm. Its placement in the DHS
organizational structure parallels the placement of DARPA in the
Department of Defense organizational structure.
Subcontract with DARPA: The S&T Directorate, recognizing DARPA’s
history of success with the types of high-risk, high-benefit projects likely
to emerge from a “devil’s toy box” analytical effort, subcontracts with
DARPA to have the latter organization perform the analytical effort and to
manage subsequent R&D projects.
Subcontract with the Intelligence Advanced Research Projects Agency
(IARPA): The S&T Directorate, recognizing IARPA’s successful history

336
of fostering projects focused on technological forecasting, such as FUSE
and the Aggregative Contingent Estimation (ACE) program/Good
Judgment Project, subcontracts with IARPA to have the latter organization
perform an ongoing “devil’s toy box” analytical effort and to manage
subsequent R&D projects.
I will consider each of these alternatives, their advantages and disadvantages, in
ascending order, beginning with the alternative I feel is least promising (#6) to that which
I feel is most promising (#1) for achieving the goals of a “devil’s toy box” analysis. I offer
these rankings with the following caveats. One, I have never worked within HSARPA, the
S&T Directorate, IARPA, or DARPA; my knowledge of their organizational cultures is
that of an outsider, based upon Congressional hearings, Inspector General’s reports, and
scholarly articles. Two, I based my analysis of HSARPA’s set of projects on those which
were active during FY2014, the most recent fiscal year for which I was able to obtain
relatively complete data regarding project descriptions and internal rankings of those
projects regarding novel approach and technical feasibility, and I recognize the possibility
that, in the three fiscal years that have elapsed since FY2014, the mix of HSARPA-
managed projects may have changed.
#6: HSARPA as-is. This, in my view, is the least promising of all the alternative
homes for a “devil’s toy box” analysis. The history of HSARPA, thoroughly covered in
previous sections of Appendix A, illustrates the powerful pull of the systemic mission set’s
needs over the counter-future-shock mission set’s needs within the S&T Directorate.
Existing organizational imperatives, the drag of bureaucratic habits and existing mindsets,
and prevailing political interests within the Department of Homeland Security and the
larger homeland security enterprise, all which favor more immediate, pressing needs of the
first responders community, would likely mean that inserting a “devil’s toy box” analytical
project into “HSARPA as-is” would result in low buy-in of the analytical effort by top
HSARPA and S&T Directorate management, or low prioritization of the resulting R&D
projects, or perhaps even co-optation of the analytical effort by top management so that the
analysis leans towards support of the systemic mission set rather than the counter-future-
shock mission set. Another factor that must be considered is the history of a low level of

337
Congressional confidence in the work of the S&T Directorate and HSARPA, reflected in
funding reductions or unpredictable funding levels, as well as in the results of
Congressional hearings and resulting bills intended to reform HSARPA and the S&T
Directorate. While a “devil’s toy box” analytical effort would be relatively low-cost on its
own, the resulting R&D projects would require appreciable new funding or
reallocations/reprogramming of existing appropriations. It is an open question whether
Congress would allocate additional funds for a new R&D initiative to an agency for which
they have expressed low confidence, absent significant reforms. I believe the funding
spigot would remain squeezed shut in such an instance.
#5: “Mini-ARPA.” The main strike against this option (creating a mini Advanced
Research Projects Activity inside the existing HSARPA) is that it has already been tried
within HSARPA and has failed, or at least only served to temporarily refocus a portion of
HSARPA’s R&D efforts on high-risk, high-benefit projects for a few fiscal years, before
the agency returned to its overwhelming emphasis on projects that benefit the systemic
mission. As described earlier in Appendix A, in FY2007, S&T Directorate Under Secretary
Jay Cohen rebalanced HSARPA’s R&D portfolio, seeking a more even mix between low-
or moderate-risk, moderate-benefit projects (the Homeland Innovative Prototypical
Solutions) and high-risk, high-benefit projects (the High Impact Technology Solutions),
favoring the latter with his establishment of the Office of Innovation and its HomeWorks
portfolio. Yet in FY2010, Cohen’s successor, Dr. Tara O’Toole, undid all this rebalancing
with another HSARPA reorganization, which placed virtually all the S&T Directorate’s
low- or moderate-risk, moderate-benefit projects to support the systemic mission under
HSARPA’ s management. Even before O’Toole’s arrival on the scene, Cohen was already
backing away from his own reforms due to criticism and pressure from Congress, to whom
he reported that he would refocus the S&T Directorate’s efforts on what he called the four
‘Bs’—borders, bombs, bugs, and business. These developments illustrate the pervasive
influence of supporters of the systemic mission set over the counter-future-shock mission
set within the Department of Homeland Security. They also show how Congress is apt to
be of two or more minds (sometimes contradictory) regarding an issue—in this case,
having created HSARPA to focus on the counter-future-shock mission for DHS, yet also

338
severely criticizing that organization and its parent for not adequately supporting the
systemic mission. Although history is not destiny, absent a significant culture change in
the S&T Directorate or a major, enduring political push from Congress and the
administration, trying what has been tried in the past will likely result in a similar outcome
to that already seen.
#4: Subcontract with the Intelligence Advanced Research Projects Agency
(IARPA). As noted earlier, IARPA has sponsored several major R&D projects related to
technological emergence and improving forecasting efforts, which would appear to make
it a hospitable organizational setting for a “devil’s toy box” analytical effort; however, the
goals and mission sets of the intelligence community and the homeland defense community
may be too divergent to allow for a successful “hand-off” of the management of homeland
security’s counter-future-shock mission’s R&D effort to a branch of the intelligence
community. The primary divergences involve timeframes of interest and goals/outcomes
of R&D efforts. The intelligence community is primarily concerned with discovering
situations and events that are occurring in the present or within an actionable timeframe,
this being the very near-term future to a year. This was reflected in IARPA’s Aggregative
Contingent Estimation (ACE) program’s focus on forecasting events and developments
that would actualize within a six-month to one-year timeframe. Contrarily, as I have
suggested in earlier chapters, homeland security’s counter-future-shock efforts should
focus on potential malign events that would occur five years in the future or farther out.
This mismatch in timeframes of focus need not be disqualifying, but it needs to be taken
into consideration as a contributing factor in divergence of organizational cultures between
the two potential partners. Equally important, a divergence of goals exists between the
intelligence community’s R&D efforts and those of the homeland security community. The
former primarily seeks improvements in the collection of information; intelligence
components seek to improve their capabilities to provide timely and accurate information
to law enforcement or national defense components, which will use the information to
better counter adversaries’ aggressions. In contrast, while the homeland security
enterprise’s R&D efforts may sometimes focus on improvements in collection of
information, they have historically focused far more upon facilitating efforts to more

339
effectively prevent, respond to, or mitigate malign events, whether caused by nature or by
human adversaries. This focus better aligns with the R&D focus of the Department of
Defense, which also tends toward a longer timeframe, trying to anticipate and counter (or,
better still, surpass) whatever new capabilities potential adversaries may develop in the
next five to twenty years.
#3: “Refocused” HSARPA. This option envisions a “back-to-basics” HSARPA,
one refocused on its founding mission of facilitating high-risk, high-reward R&D projects.
HSARPA would remain under the S&T Directorate umbrella, but all its current low- to
moderate-risk, medium-reward projects, those that support the systemic mission, would be
removed from HSARPA and assigned to a new S&T Directorate subcomponent, which
would act as DHS’s version of the Army’s, Navy’s, Marine Corps’, and Air Force’s “in-
house” R&D establishments. The potential pitfall with this option lies with Nieto-Gómez’s,
Bellavita’s, and Carstensen’s and Bason’s critiques of traditional bureaucracies that are
assigned the tasks of innovation, cited in the first Section of Appendix A. Traditional
bureaucracies do not do innovation well. HSARPA’s current managers have presumably
grown accustomed to primarily supporting the homeland security enterprise’s systemic
mission. In this role, they have presumably developed a different mindset and array of
bureaucratic procedures than the mindset and practices best suited for facilitating the blue-
sky, innovative work that would proceed from a “devil’s toy box” analytical effort. This is
not to say that “old dogs” cannot learn “new tricks,” nor that a refocused HSARPA could
not recruit managers with more of a blue-sky mindset (perhaps veterans of some of
DARPA’s projects). Also, decisively refocusing HSARPA on its originating mission
would help “inoculate” the agency from pressures, organizational and political, to fall back
into its past habit of primarily supporting the systemic mission set. A decisive “re-
branding” of HSARPA, one portrayed as a major executive branch initiative, could help
overcome Congressional reluctance to assign the agency increased appropriations, by
addressing past criticisms; however, Congressional wariness of the S&T Directorate could
still be a factor in resource allocation, although presumably less than with options #6
(HSARPA as-is) and #5 (“mini-ARPA”).

340
#2: “New” HSARPA. Of all the alternative options for housing a “devil’s toy box”
analytical effort and its subsequent R&D projects within the Department of Homeland
Security, I feel the option that holds the most promise of success is that of a “new”
HSARPA, a newly-formed organizational unit with DHS that is no longer under the S&T
Directorate’s umbrella, but that reports directly to the Secretary of DHS. This would
parallel the organizational placement of DARPA within the Department of Defense. A
“fresh sheet of paper” HSARPA would address many, perhaps most, of the criticisms that
can be lodged against options #6 (HSARPA as-is), #5 (“mini-ARPA”), and #3 (“refocused”
HSARPA). The creators of this new agency could recruit program and project managers
with experience in other innovation incubator organizations and could roll out the agency
with a fresh organizational culture not bound by traditional bureaucratic constraints and
incentives. The S&T Directorate would retain its “old” HSARPA, presumably to be
renamed with a title better suited to its mission of supporting the homeland security
enterprise’s systemic mission set. The creation of a “new” HSARPA would require passage
of legislation by Congress, and the political effort involved in this legislative push should
translate into parallel support for adequate appropriations to support the new Congressional
initiative. On the downside, any solution that relies upon the passage of Congressional
legislation comes with increased risk and uncertainty inherent in the political process.
#1: Subcontract with DARPA. As noted earlier, HSARPA was deliberately
modeled after the Defense Advanced Research Projects Agency (DARPA), the federal
government’s most illustrious and successful technology incubator, origin of such
transformative technologies as the Internet and military stealth applications, and was
initially allotted many of the same acquisition and organizational partnership freedoms and
flexibilities that have benefited DARPA’s efforts.409 DARPA enjoys tremendous prestige
in Congress and is widely viewed as one of the federal government’s most effective
investment instruments, having been the source of multiple innovations that have not
merely elevated the capabilities of the U.S. armed forces above those of potential
adversaries in the decades since the 1980s, but that have also served to transform the U.S.
409 Morgan, Research and Development in the Department of Homeland Security, 2-10.

341
civilian economy and infuse it with fresh dynamism. An adage states, “if you want
something to get done, give it to a busy person,” i.e.: someone who is in the habit of
working hard and getting things done. DARPA has a long and successful track record of
facilitating the types of blue-sky, high-risk, high-reward R&D projects that would result
from a “devil’s toy box” analysis. Moreover, a “devil’s toy box” analytical effort, staffed
by a mix of scientists, technologists, terrorism analysts, and science fiction writers, would
not be an “alien element” within DARPA’s organizational culture. Better still, the
budgetary resources that have traditionally been granted to DHS for R&D could be
considered a rounding error when compared with the resources assigned to the Department
of Defense in general and to DARPA in specific. (A direct comparison cannot be made,
due to DARPA’s involvement in classified, “black box” projects whose budgets are not
accessible to the public; however, DARPA’s budget for its roughly 200 R&D programs is
estimated to be about $3 billion annually.410 As shown above, in FY2014, the budget for
the entire S&T Directorate, of which HSARPA is only a part, was less than half a billion
dollars.) Since many of the R&D projects that would be initiated by a “devil’s toy box”
analytical effort would likely be dual-use in nature, having applicability to the needs of
both DHS and the Department of Defense, it is possible that DHS’s financial contribution
to a shared R&D effort could be viewed as “seed money,” dollars that would be matched
several times over by Department of Defense R&D funds. If so, this would result in a far
larger pot of money for “devil’s toy box” R&D than would be available if this effort were
to be entirely contained with DHS.
What are the downsides of this otherwise promising alternative? Although
HSARPA’s mission aligns with DARPA’s better than it does with IARPA’s, the homeland
security counter-future-shock R&D effort does not align precisely with the Department of
Defense blue-sky R&D effort. DARPA’s mission is to counter strategic surprise by
creating strategic surprise; its activities focus on incubating new offensive and defensive
capabilities for the U.S. military that force potential opponents to expend time, money, and
410 Regina E. Dugan and Kaigham J. Gabriel, “‘Special Forces’ Innovation: How DARPA Attacks
Problems,” Harvard Business Review (HBR Reprint R1310C), October 2013, 76.

342
resources on countering American innovations.411 This means that DARPA project
managers have the initiative in selecting their R&D projects; they are “playing offense”
and can set the rules of the competition, following the advice of the old adage, “the best
defense is a good offense.” However, the mission of the homeland security enterprise is
essentially protective, defensive, and reactive. In most confrontations with homeland
security, the enemy holds the initiative—the devil gets to choose which toy he will select
from his toy box next and where and when he will play with it. The “devil’s toy box”
analytical effort described in this thesis is quite different, as a mechanism for identifying,
selecting, and prioritizing R&D projects, than the procedure used by DARPA, which has
generally been to encourage potential partner vendors (government and private sector
research labs, universities, large technology companies, start-up tech firms) to pitch blue-
sky ideas to DARPA managers, as though they are entrepreneurs pitching investment in a
high-tech start up to a venture capital firm. Regina E. Dugan and Kaigham J. Gabriel, at
one point the director and deputy director, respectively, of DARPA, define DARPA’s two
modes of identifying and selecting projects as follows: “One is to recognize that a scientific
field has emerged or reached an inflection point, and that it can solve, often in a new way,
a practical problem of importance. … The second way to identify projects is to uncover an
emerging user need the existing technologies cannot address. … A (DARPA) project
portfolio should include a healthy balance of both kinds of initiatives—projects that are
focused on new possibilities created by scientific advances and projects that are focused
on solving long-standing problems through new scientific development.”412 If it were to
be described along the same lines, a notional HSARPA’s counter-future-shock mission,
focused on pursuing priorities identified by a “devil’s toy box” analysis, would be projects
that are focused on new possibilities for adversaries’ malign actions created by scientific
advances. On the other hand, “projects that are focused on solving long-standing problems
through new scientific development” (emphasis added) are projects that, by definition,
support the systemic mission and thus are outside the scope of a “devil’s toy box” analysis.
411 Ibid., 77.
412 Ibid., 78–79.

343
However, this is not to say that considerable overlap does not exist between the
notional HSARPA counter-future-shock mission set and the DARPA mission set; the latter
is simply broader and more inclusive. Prior to the creation of the Department of Homeland
Security and the S&T Directorate in 2003, many projects that might well be imagined to
fall within HSARPA’s basket were shepherded by DARPA. Despite DARPA’s oft-stated
mission to avoid strategic surprise by creating strategic surprise—a mission devoted to the
offense—the agency’s most significant legacy thus far, ARPANet, which evolved into the
Internet, was essentially a defensive initiative, equally as useful in conception for homeland
defense organizations as it was for the armed forces. A resilient communications network,
stocked with redundant capabilities, is certainly essential to preserving the military’s
offensive capabilities in the aftermath of a nuclear strike, but it is just as essential to
preserving both the military’s command and control functions needed for force
preservation and the emergency response and mitigation capabilities of the homeland
security enterprise. ARPANet was very much a dual-use technology, of equal value to the
military and to the homeland security enterprise. That its originally unforeseen role in
fostering commerce has perhaps eclipsed its original mission set has been a happy accident
of history.
I have offered my judgments regarding the best-fit placement for an ongoing
“devil’s toy box” analytical effort. Ultimately, however, the decision that will guide that
placement, indeed, whether such a placement will occur at all, will hinge upon political
factors, and perhaps upon the level of personal commitment that can be mustered by key
individuals in government agencies. With enough push and commitment by key
individuals, organizational culture can be changed, and initiatives foreign to an
organization’s traditional culture can be made to take root. I have judged that the path of
least resistance for fostering a productive “devil’s toy box” analytical effort would be for
DHS to subcontract out the work to DARPA. “Easiest” path does not imply “only” path,
however. My judgment should not be taken to imply that leaders with a fresh overarching
concept for HSARPA and the determination to thoroughly evangelize that concept could
not be successful in their efforts to dedicate that agency to intensive, routine use of

344
Pandora’s Spy Glass, to focusing the agency’s vision upon seeing through the multiple
walls of the devil’s toy box to the innovative deviltries incubating within.

345
APPENDIX B. DRAWING PARALLELS BETWEEN TWO AUDIENCES—THE SCIENCE FICTION READERSHIP AND
POTENTIAL MEMBERSHIPS OF TERROR GROUPS
A. SOCIOLOGICAL AND DEMOGRAPHIC DATA ON THE SCIENCE FICTION READERSHIP
Types of teenage boys and young men are especially drawn to science fiction as a
source of recreation, whether that be reading science fiction stories and novels, watching
science fiction films, role-playing science fiction board games, reading superhero comics
or graphic novels (superheroes and super-powers are a subset of science fiction), playing
science fiction-themed video games, or dressing up as science fiction characters at
conventions. The stereotypical science fiction fan (short for “fanatic”) is a teenage boy, or
young man in his twenties, who is socially awkward, timid about approaching the opposite
sex, of above-average intelligence, un-athletic, and often bullied or denigrated by his peers.
An anthropological excursion to a science fiction or comic book convention would bear
out that this sometimes mocking, sometimes affectionate stereotype is often reflected in
reality (I spent my adolescence and young adulthood fitting the stereotype to a tee),
although conventions that focus primarily on written science fiction tend to skew a good
bit older in their attendees nowadays than conventions that focus more heavily on films,
television, video gaming, comics, or cos-play (these latter still attract many attendees in
their teens and twenties).
Linda Fleming notes in her 1977 consideration of the American science fiction
subculture that, since the origins of commercial science fiction in the cheap, widely
distributed pulp magazines of the 1920s and 1930s and newspaper comic strips of the
1930s, the general population has tended to look down upon science fiction material as
“That Buck Rogers Stuff,” and that this derisive dismissal of science fiction produced a
strong sense of in-group/out-group thinking among its fans, a sense that science fiction
readers and fans are a distinct subculture, a group apart, residents of a literary “ghetto.”
This socio-psychological reaction to various types of shunning resulted in the creation,

346
over decades, of a genuine science fiction fan culture, with its own in-group lingo, social
behaviors, traditions, and history passed down from one generation of fans to the next.413
One unique aspect of science fiction as a commercial genre of literature is that
many, if not most, of its writers entered the field through the portal of science fiction
fandom and retain contacts with fans and readers after the writers have become
professionals. A perusal of the published memoirs or online reminiscences of prominent
writers will uncover many accounts of youthful involvement in science fiction fan clubs,
writing or editing fanzines (amateur publications), attending conventions, and other social
activities centered around science fiction. Linda Fleming notes that ever since the
beginnings of organized science fiction fandom in the late 1920s, “the fans of one
generation have provided authors and editors for the next,” and the most intensively active
fans, those who publish fanzines and organize or regularly attend conventions, tend to fill
the ranks of the field’s professionals, becoming authors, editors, publishers, academic
scholars of the field, memorabilia collectors and sellers, or illustrators.414 Award-winning
science fiction writer Roger Zelazny pointed out in 1975 that “science fiction is unique in
possessing a fandom and a convention system that make for personal contacts between
authors and readers, a situation that may be of peculiar significance. … The psychological
process involved in this should be given some consideration as an influence on the
field.”415 Writers do not merely write for those whom they perceive to be their paying
audiences (or their editors); they also write to entertain and satisfy themselves, writing the
sorts of books they themselves enjoy reading. Thus, a bit of demographic background on
the science fiction readership would cast light on both the writers of science fiction and the
audience they seek to serve.
Albert Berger conducted a survey of the 3,400 attendees of the World Science
Fiction convention, held in September 1973. He distributed 3,000 questionnaires, of which
413 Linda Fleming, “The American SF Subculture,” Science-Fiction Studies 4, no. 3 (November
1977): 264–265.
414 Ibid., 264–268.
415 Roger Zelazny, “Forum: Some Science Fiction Parameters: A Biased View,” Galaxy 36 (July 1975): 11.

347
282, or about 8%, were returned. He found that 78% (rounded) of his respondents reported
that they had begun intensive reading of science fiction between the ages of 9 and 15, with
another 5% having begun before the age of 9. Males made up 65% of his respondents and
females 35%. This gender balance skewed less heavily male than earlier surveys,
conducted between 1949 and 1975 by science fiction magazines of their readerships, which
Berger cites for comparison; these surveys ranged from a low of 71% male to a high of
95% male. Berger notes that the age breakdown of his respondents most likely skewed
older than the overall science fiction readership, due to the costs of convention
membership, lodging, and travel to Toronto (as with most large science fiction conventions
held in North America, many of the attendees reside in the United States). Even so, the
bulk of his respondents fell into the lower age categories, with 36% being between 18 and
25 and 41% being between 25 and 35 (8% were between 13 and 17). Seventy-one percent
reported being single (either never married, divorced, widowed, or co-habitating) and 29%
reported being married. The respondents were a highly-educated group; 53% percent
reported either a bachelors or a graduate degree, and another 24% reported having
completed at least some college education. Nearly half of those who reported a college
degree or attendance at college stated their major field of study to be the physical or
biological sciences.416 In the early 1980s, Locus Magazine, a monthly “semi-prozine” that
serves as the unofficial newspaper of the science fiction and fantasy community, did an in-
depth survey of nearly a thousand of their readers (who tend to be the most committed of
science fiction fans, or science fiction professionals—writers, editors, illustrators,
acquiring librarians, publishers—seeking to keep current with news and developments in
their field). The survey results indicated that most respondents made their initial deep
commitment to science fiction reading between the ages of 10 and 14, following an initial
“gateway” exposure to science fiction concepts, in less sophisticated forms, in comic
books, movies, or television shows. Many respondents reported that, around the age of 12,
they entered into a period of intensive reading of science fiction that lasted anywhere from
several months to years, in the latter case typically ending upon graduation from high
416 Albert I. Berger, “Science-Fiction Fans in Socio-Economic Perspective: Factors in the Social
Consciousness of a Genre,” Science Fiction Studies 4, no. 3 (November 1977): 232–238.

348
school. Thereafter, intensive reading of science fiction (up to several books per week)
declined to more occasional, recreational reading of the material.417 (As anecdotal backing
for the results of this survey, my own pattern of science fiction readership followed this
template nearly exactly. My earliest exposure to science fiction was to Japanese monster
movies and Planet of the Apes films as a young child, which was followed by voracious
reading of science fiction from the ages of 12 to 17. This period also included my earliest
attempts to write and sell science fiction stories, my publication with friends of a fanzine,
and my attendance at conventions, including BosCon II, the 1980 World Science Fiction
Convention. My reading of science fiction declined by at least two-thirds when I entered
college and was required to read a far broader range of materials, including non-science
fiction literature, but I never abandoned science fiction as recreational reading and have
continued reading it, in various forms, into my fifties.)
Publishers Weekly solicited the Gallup organization to survey the buyers of science
fiction books in 1987. The resulting survey found that the gender breakdown of science
fiction book consumers was 60% male and 40% female, and that 65% of these consumers
were under the age of 35, with 67% having attended college (compared with only 60% of
the overall book-buying market).418 The survey did not break out science fiction books
from fantasy, media tie-in, or sword-and-sorcery books.
Locus Magazine, mentioned earlier, conducts an annual survey of its readers.
Although not representative of the science fiction readership (readers of Locus skew
towards professionals involved in the field, aspiring writers looking for market
information, and heavily involved fans seeking news about writers, new books and
magazines, and upcoming or recent conventions), the long-term annual nature of the Locus
polls allows for a view of the evolving nature of the readership over a period of decades.
Over the eight-year period from 1971 to 1979, an average of 81% of respondents to the
poll were male, versus an average of 19% female. Over the eleven-year period from 2006
417 Peter Graham, “The Golden Age of Science Fiction is Twelve,” in Age of Wonders: Exploring the
World of Science Fiction, ed. David G. Hartwell (New York: Tom Doherty Associates, 1996), 18–20.
418 Leonard Wood, “Who Buys Science Fiction?” Publishers Weekly, November 4, 1988, 41.

349
to 2016, an average of 62% of respondents were male and 38% were female, showing clear
growth in the female percentage of Locus readership, reflecting the concurrent growth in
the numbers of women writers and editors in the field. Even so, the gender breakdown is
not much different from that of the 1987 Publishers Weekly survey and still indicates a
predominately male audience. The median age of the Locus readership has climbed steadily
over past decades. In 1971, it was 24 years; in 1979, 28; in 2006, 42; and as of 2016, the
median age had reached 46; however, this change comes with a caveat—in 1971, Locus
Magazine was one of very few regular sources of information on the science fiction field
(the other sources being book reviews and an occasional page on upcoming or past
conventions in one of the “big three” science fiction magazines, Astounding/Analog, The
Magazine of Fantasy and Science Fiction, and Galaxy, whose status as one of the “big
three” was lost to Isaac Asimov’s Science Fiction Magazine in the mid-1970s), so even
young fans would have been motivated to subscribe; whereas in 2016, media sources,
especially no-cost Internet sources, for information on the science fiction field are both
numerous and widely available, and only a more specialized audience, those seeking timely
information on market conditions and opportunities,(i.e.,) working or aspiring
professionals, needs to pay for Locus’s coverage. In 1979, 77% of respondents were college
graduates, 30% with advanced degrees. In 2016, these figures had climbed even higher,
with 86% being college graduates and 44% having advanced degrees. In 1979, 36% of
respondents reported being married; in 2016, reflecting the older average age of
respondents, 58% reported being married. In 1979, 51% of respondents reported buying
six or more hardcover science fiction books per year, and 29% reported buying six or more
paperback science fiction books per month. As of 2016, the corresponding figures had risen
to 58% for hardbacks (five or more purchased per year) and fallen to only 7% for
paperbacks (five or more per month), with the fall-off in paperback purchases being
recouped by purchases of eBooks (which had not been available, of course, in 1979). In
1979, 68% of respondents reported having attended at least one science fiction convention,
with 40% reporting having attended a World Science Fiction Convention. As of 2016, the
corresponding figures had risen to 75% (at least one SF convention) and 44% (a World
Science Fiction Convention), most likely reflecting both the larger number of conventions

350
held in the U.S. in 2016 as opposed to 1979 and the increased household incomes, on
average (and thus more money available for optional, leisure spending), of respondents.419
Taken altogether, these various surveys and observations point to a science fiction
readership that is predominately male, highly educated, frequent book purchasers, and
whose members enter their fascination with science fiction in early adolescence,
experience intense interest in the field (characterized by voracious reading habits) for
periods ranging from a few months to half a dozen years or more, and who then retain a
less intense yet loyal interest in the field into adulthood. Involvement in fandom inculcates
an in-group/out-group dynamic, and fannish traditions are passed down from one
generation to the next, with the current generation’s fans providing a “feeder team”
population from that emerges the next generation’s science fiction professionals. Earlier
cohorts of this readership may have skewed younger and less likely to be married than
current cohorts, although this shift may be overstated by the demographics of the Locus
Magazine readership. Science fiction writers, unique among popular fiction writers, benefit
from a high familiarity and close association with their audience, due both to the fact that,
likely, those writers were somewhat recently fans themselves and that most working writers
frequently attend science fiction conventions and interact directly with fans and/or
correspond with readers.
In responding to the perceived (and remembered) psychological needs of this
audience, science fiction writers have often focused on power fantasies. These plots center
around variously deprived or socially disadvantaged (but intrinsically superior)
protagonists who manage, primarily through their own intelligence, cunning, and grit, to
achieve the prominence that their intrinsic (but previously unrecognized or ignored)
superiority merits. Alternatively, or concurrently, the protagonist manages to win the heart
of the previously dismissive girl/scientist’s daughter/beautiful alien princess. Or our hero
achieves a satisfying revenge on his tormentors (some plots manage to incorporate all three
power fantasies—a trifecta!). An especially popular subtype of the science fiction power
419 Locus, “1979 Locus Survey,” Locus 12, no. 10 (November 1979): 8–9; Locus, “2016 Locus
Survey Results,” Locus 77, no. 3 (September 2016): 66–68.

351
fantasy involves the protagonist(s) discovering special powers or abilities, hitherto
unsuspected, which emerge suddenly at the onset of adolescence. These newly emerged
powers or abilities allow the downtrodden protagonist(s) to achieve the types of success he
(usually a he, although recent decades have seen more science fiction writers focusing on
heroines as protagonists) has always wanted most, whether that be the establishment of a
new, improved social order (with the previously despised/denigrated protagonist on top),
successful escape from persecution or imprisonment/slavery, a life of heroism and public
admiration, or even ascension to the status of messiah who redeems/perfects the world.
Early exemplars of this type of power fantasy plot in science fiction, featuring hidden
supermen or genetic mutants, include A. E. van Vogt’s Slan (a series of magazine stories
published in novel form in 1946), Henry Kuttner’s and C. L. Moore’s Mutant (a series of
magazine stories published in novel form in 1953 under the pseudonym Lewis Padgett),
and Wilmar H. Shiras’s Children of the Atom (also 1953). Later classics of this sub-genre
include Alfred Bester’s The Stars My Destination (1957, previously published as Tiger!
Tiger! in 1956), whose protagonist is cruelly abandoned to die in space, but who discovers
that this trauma elicits the emergence of world-changing teleportation abilities that allow
him to achieve revenge on his enemies, and Robert Heinlein’s best-selling Stranger in a
Strange Land (1961), whose protagonist is raised on Mars, develops incredible mental and
physical powers, is brought to Earth as a curiosity, and gathers a mass following before
being persecuted and killed, but is then regarded by his followers as a messiah.420
This sub-genre of science fiction has achieved mass cultural penetration and
popularity through the vehicle of Marvel Comics’ X-Men franchise, in both its comic book
and movie manifestations (not to mention the video games and the proliferation of
merchandise, in collectible “action figures”—dolls for boys). The X-Men are all genetic
mutants, whose special, “X-tra” powers manifest during adolescence; they are heroes who
serve as the protectors for and advocates of Earth’s persecuted mutant minority. Creators
Stan Lee and Jack Kirby, as well as subsequent writers, artists, and screenwriters, have
used the X-Men’s experiences as a metaphor for racial, ethnic, and religious persecution
420 Brian Stableford, “Mutants,” in The Encyclopedia of Science Fiction, 847; Brian Stableford,
“Superman,” in The Encyclopedia of Science Fiction, 1180–1183.

352
and social and political discrimination.421 Many plots revolve around the struggle between
the X-Men, who seek benign co-existence between mutants and homo sapiens, and the
Brotherhood of Evil Mutants, founded by mutant villain/antihero Magneto (who, nearly
twenty years after his introduction in 1963, was revealed to be a survivor of the Nazi
Holocaust), which seeks to overthrow the dominion of ordinary humans and achieve world
mastery. The Brotherhood is often described as a mutant terrorist group, the mutant
equivalent of Stokely Carmichael’s Black Panthers, versus the X-Men’s more moderate
Martin Luther King acolytes.
B. SOCIOLOGICAL AND DEMOGRAPHIC DATA ON TERROR GROUP LEADERS AND FOLLOWERS
As the prior Section indicates, many science fiction writers cater primarily to an
audience of socially maladjusted, sexually frustrated, often resentful young men, offering
them power fantasies as balms for psychological wounds resulting from rejection, bullying,
shyness, social ostracism, and general inability to achieve the success they feel is their due.
Who caters to a somewhat similar audience of young men? The founders and organizers
of terror groups.
An impressionist view of familiar terror groups tends to back up this observation.
Politically-oriented, national liberation-focused terror groups (such as the Palestine
Liberation Organization prior to the Oslo Accords, or the Tamil Tigers) offer opportunities
to achieve honor and heroism, as well as redress from perceived persecution, humiliation,
and lack of political agency, for young men belonging to ethnic, racial, or cultural groups
that lack a state of their own. Islamicist terror groups (such as al Qaeda, Islamic State, or
Hamas) offer their followers redress from what they perceive as centuries of unjust
humiliation of Muslims by unbelievers, opportunities to achieve holy martyrdom
climaxing in ascension to Heaven and the welcoming arms of 72 beautiful virgins, and the
satisfactions of adventure, danger, revenge, and domination. Apocalyptic religious terror
cults such as Aum Shrinrikyo offer their followers the emotional satisfaction of believing
themselves members of a blessed elect, superior to all non-select, non-believers and
421 Rob Hansen, “X-Men,” in The Encyclopedia of Science Fiction, 1355.

353
entitled to enact violence upon them to hasten the End of Days. Violent Christian Identity
groups provide their followers the emotional enticement of being welcomed into a realm
of secret, esoteric knowledge, the knowledge that the world is, Manichean-style, divided
between the forces of Good and the forces of Evil, the former being the White Race, who
are the true Tribes of Israel, and the latter being the false, usurping, present-day Jews and
their minions, the Mud Peoples, whose vile influence must be combatted if the White Race
is to survive annihilation. In the view of the members of these groups, they are the heroes
of their stories, not the villains they are considered by most outsiders. Their stories, with a
few changes in settings and technology, could conceivably be published as conventional
science fiction adventure novels. The behaviors of terror acolytes certainly differ
enormously in degree from those of science fiction fans, but how different in kind are their
preferred fantasies, emotionally and motivationally, from those of diehard fans (again,
short for “fanatics”) of the X-Men and their ilk?
Do the available demographic data on terror group organizers and their followers
bear out these impressionistic observations of similarities between this population and the
most intense sector of the science fiction readership, those readers for whom science fiction
authors target their stories and novels? To an extent, yes, it does. Since the 1970s and the
rise of terrorism as a contemporary phenomenon of pressing urgency, academics and
researchers of various stripes (political scientists, psychologists, sociologists, and conflict
specialists) have attempted to assemble descriptive typologies of terror groups and
terrorists. They have attempted to apply explanatory theories from their various disciplines
to terrorists’ behavior, in hopes of formulating instruments that might allow for predictions
of involvement in terror activities by individuals or communities, and, as an underpinning
to these more ambitious efforts, to simply collect demographic data on those involved in
terror. A report prepared by the Federal Research Division of the Library of Congress in
1999, The Sociology and Psychology of Terrorism: Who Becomes a Terrorist and Why?,
cautions that most efforts by scholars to create a profile of the “typical” terrorist have
achieved mixed success, at best, due to the wide variations in motivations that may lead to
politically- or religiously-inspired violence or threats of violence against non-military
targets, and variations in the sociocultural environments from which such motivations

354
arise. The authors of the report, which summarizes prior work on the categorization of
terror and terrorists and theories regarding the drivers of terrorism, state that there may be
as many differences between members of the broad fraternity of terrorism as there are
similarities. Yet this cautionary note has not stemmed the efforts of researchers to ferret
out those similarities.422 The Library of Congress study details a pioneering profile
compiled in 1977 by Charles A. Russell and Bowman H. Miller, which was based upon the
socioeconomic backgrounds of 350 terror group leaders and followers who were active
between 1966 and 1976. The individuals studied included terrorists from eighteen terror
groups in Argentina, Brazil, Germany, Iran, Northern Ireland, Italy, Japan, the Palestinian
Territories, Spain, Turkey, and Uruguay, a comprehensive sampling of terror groups active
during that decade. Russell’s and Bowman’s profile showed the terror operative to most
typically be a single male (males made up 80% of those sampled) between the ages of 20
and 25 (with followers of Palestinian, Japanese, and German terror groups tending toward
the younger end of this overall age cohort), predominately middle or upper-middle class,
with either a university degree or some college education. Leaders and older members often
came from highly prestigious professions, such as university professors, doctors, lawyers,
bankers, journalists, engineers, and even mid-ranking government bureaucrats.423
Several researchers have attempted to facilitate the task of creating terrorist profiles
by focusing on subsets, national, ideological, religious, or temporal, of the terrorist
population and describing one subset at a time, then, in some instances, comparing various
subsets. In 1990, Jeffrey S. Handler used socioeconomic data provided by the Federal
Bureau of Investigation (FBI) regarding 280 persons known to have been involved in terror
activities or terror groups in the 1960s or 1970s to develop profiles of leftwing and
rightwing American terrorists from those decades (for the purposes of his analysis, Handler
decided to not include members of nationalist/separatist groups, such as terrorists focused
422 Rex A. Hudson, The Sociology and Psychology of Terrorism: Who Becomes a Terrorist and Why?
(Washington, DC: Federal Research Division, Library of Congress, September 1999): 43.
423 Ibid., 46–52.

355
on Puerto Rican independence).424 Handler found that the gender balance differed
significantly between rightwing and leftwing groups. Although the FBI survey indicated
that the majority of all surveyed terrorists were male, the rightwing groups skewed far more
heavily male (88.8%) than the leftwing groups (53.8% male), which Handler hypothesizes
was due to feminism being a leftwing ideology, making leftwing causes more attractive to
Western women, versus rightwing ideology that emphasizes traditional gender roles, with
females subordinate.425 Regarding educational achievement, within leftwing groups, both
leaders and followers tended to be highly educated, with about three-quarters of both
cohorts having attended undergraduate or graduate school, whereas within rightwing
groups, slightly more than half of the leadership cadre had attended undergraduate or
graduate school, as opposed to less than six percent of the followership.426 Regarding
socioeconomic status, Handler found that most rightwing terrorists tended to come from
middle- or lower-class backgrounds, whereas leftwing terrorists tended to emerge from
middle- or upper-class backgrounds.427 Thomas Strentz, a Special Agent assigned to the
Behavioral Science Instruction and Research Unit of the FBI Academy, performed a
similar profiling analysis in 1988, although he broadened his field of 1960s and 1970s
terrorists to include Europeans and Asians, not just Americans, and he also included Middle
Eastern terrorists of the 1980s. He found that the leftwing terrorists of the 1960s and 1970s
tended to be highly educated members of the middle or upper-middle class, many of them
having been recruited into a terror group during their college attendance, with leadership
and membership split between males and females, and leaders tending to be 25–40 years
of age and followers 20–25 years of age.428 Strentz’s profiles of the leaderships and
followers of rightwing terrorist groups closely track Handler’s. Leaders were males, middle
424 Jeffrey S. Handler, “Socioeconomic Profile of an American Terrorist: 1960s and 1970s,”
Terrorism 13, no. 3 (1990): 200–203.
425 Ibid., 203–204.
426 Ibid., 205.
427 Ibid., 211.
428 Thomas Strentz, “A Terrorist Psychosocial Profile: Past and Present,” 57 FBI Law Enforcement Bulletin 13 (Quantico, VA: FBI Academy Behavioral Science Instruction and Research Unit, April 1988), 15.

356
class, aged 35 to 50, with some college education, and followers were males, lower or
lower-middle class, aged 20–50, with limited formal education. Both cadres belonged to
their communities’ predominant ethnic and religious groupings, and both tended toward a
subjective experience of social or economic failure/setback.429 Strentz’s profile of Middle
Eastern terror groups focused on leftwing or nationalist groups, predating (apart from
Hezbollah in Lebanon) the emergence of Islamicism as a motivating factor and suicide
terrorism as a primary tactic. Within these groups, leaders were male, middle class, aged
30–45, with a college education, while followers were male, lower class and from a large
family of 9–15 children, aged 17–25, and poorly educated or illiterate.430
Jeff Victoroff, writing in 2005, offers a useful summary of demographic
characteristics of various terrorist groups that have been gathered in studies carried out
since the work of Russell and Miller, Handler, and Strentz. N. Hassan’s 2001 study of
approximately 250 members of Hamas or Islamic Jihad, covering the 1996–1999 period,
found these members’ ages to be between 18 and 38 and that many were middle class in
origin. A 2003 study by A. Pedahzur, A. Perliger, and L. Weinberg of 80 Palestinian suicide
bombers found the terrorists’ mean age to be 24.5 years and their mean socioeconomic
status (on a 10-point scale, with 10 being highest) to be 5.97, or in the upper half. M.
Sageman’s 2004 study of 102 Salafi terrorists hailing from either Indonesia, Morocco,
Algeria, France, Egypt, or Saudi Arabia found their median age at their entrance to their
terror group to be 25.69 years, with 55% of them coming from middle class backgrounds
and 18% from upper class backgrounds; also, 71% had at least some college education,
and 43% were professionals (this study is biased towards the leaders of these groups, rather
than the followers).431
Various psychological, sociological, and political science theories have been
advanced in attempts to explain why certain individuals resort to terrorism at certain times
429 Ibid., 18–19.
430 Ibid., 18.
431 Jeff Victoroff, “The Mind of the Terrorist: A Review and Critique of Psychological Approaches,” Journal of Conflict Resolution 49, no. 1 (February 2005): 8–9.

357
and under certain conditions. Some of these theories have suggestive overlaps with the
socio-psychological portrait of the typical science fiction reader/fan that I have pieced
together from personal knowledge, surveys, and the observations of other writers and
analysts. Narcissism theory suggests that terrorism may be a psychological reaction to
narcissistic ego injuries, primarily experiences of humiliation, rejection, or abandonment,
that result in episodes of narcissistic rage. Several observers of terrorist group followers
suggest that many are “timid, emotionally damaged adolescents,” rather than aggressive,
dominating psychopaths.432 The formulators of Humiliation-Revenge theory offer a
similar explanation, focusing, in , on repeated cycles of oppression, humiliation, and
reaction in the Arab world.433 Novelty-seeking theory suggests that terrorism especially
appeals to those individuals with powerful needs for stimulation and attendant risk-seeking
behaviors, since it embeds the individual in a web of dangerous, often thrilling activities
far outside the mainstream of normal social interactions. Researchers in this area suggest
that the high percentage of terror group followers whose ages fall within adolescence or
young adulthood is due to developmental phenomena of those ages, during which novelty-
seeking, sexual frustrations, and attraction to risk-taking are typically at their height.434
Jeff Victoroff, in his review of these and other theories of terroristic behavior, offers the
following critique of the Rational Choice theory of terrorism, or that terrorism is a rational,
logical mechanism chosen by actors to accomplish various political, social, or religious
goals. He states that emotional peculiarities and strong passions often overcome rational
choice, that
the lure of bravado and romance of risk, the self-destructive urge for “success” in likely failure with or without the utility of martyrdom, the Svengali-like influence of charismatic leaders on either side whose followers march in maladaptive columns, the power of rage to better reason, the blindness of ambition, the illogic of spite, or the frenzy of revenge all may contribute to the stochastic occurrence of surprising scenarios. … (R)ational choice theories cannot predict idiosyncratic responses. Policy recommendations that predict deterrence of terrorist acts are only as
432 Ibid., 23–24.
433 Ibid., 29.
434 Ibid., 28.

358
valuable as their capacity to anticipate the extraordinary variability and adaptability of humans.435
James Dingley, in his 1997 essay “The Terrorist—Developing a Profile,” refers
extensively to historian L. O’Boyle’s postulation of “The Problem of an Excess of
Educated Men in Western Europe, 1800–1850,” which O’Boyle formulated to try to
explain the sociopolitical unrest and revolutions that characterized parts of the first half of
the nineteenth century in Europe. O’Boyle points out that the transition from an agrarian
to an industrial society required ambitious young men to seek more formal education to
prosper and enter the newly expanded middle class, yet various European economies and
societies did not always offer adequate opportunities for this new mass of educated young
men to achieve gainful employment in their fields, which led to widespread dissatisfaction
and frustration with existing social orders.436 Dingley builds upon O’Boyle’s work to put
forth his “overeducated and underemployed” theory of terrorism causation. He points out
that, just as O’Boyle’s nineteenth century revolutionaries were predominately highly-
educated professionals in non-technical, non-scientific fields (those trained professionals
with scientific or technical skills were more highly in demand in nineteenth century
industrial economies than those with backgrounds in the liberal arts), so do demographic
surveys of twentieth century terrorists (those of Russell and Miller) show that college-
educated terrorists are predominately those with degrees in the social sciences or
humanities. What Dingley terms anarcho-ideological terrorists (akin to Handler’s and
Strentz’s leftwing terrorists) are overeducated, underemployed would-be cosmopolitans
who want to change their societies to replace a frustrating, unfulfilling social order with a
new order that will properly reward and recognize the talents of persons like themselves.
Those whom Dingley terms nationalist terrorists, or modern-day Luddites (having much
overlap with Handler’s and Strentz’s rightwing terrorists), are social conservatives who are
overeducated in skills and trades that are being made obsolete by the march of modernity,
and thus rendered under- or unemployed by the modernizing of their society’s economy.
435 Ibid., 16–17.
436 James Dingley, “The Terrorist – Developing a Profile,” International Journal of Risk, Security and Crime Prevention 2, no. 1 (January 1997): 29.

359
They wish to restore traditional economic arrangements (often agrarian-based) and
traditional social, cultural, and religious mores, or set up barriers to further changes they
feel are threatening their familiar home environments.437 Dingley’s “overeducated and
underemployed” theory dovetails with Narcissism theory and Humiliation-Revenge theory
by bringing sociological factors to bear on psychological states. Frustrated hopes and
aspirations (in leftwing, anarcho-ideological instances, expectations that one’s years of
higher education will lead to fulfilling careers and lives in an increasingly cosmopolitan
society; in rightwing, nationalist instances, expectations that one’s training and education
in traditional occupations and/or in a traditional language/religion/culture will result in a
satisfying life akin to that lived by one’s parents or grandparents) lead to frustration with
the existing social structure, or to fear of and anger towards undesired
social/cultural/economic changes. This frustration/humiliation/narcissistic wound leads, in
turn, to acts of violence meant to either achieve or restore the desired social/economic
equilibrium.
C. COMPARING DEMOGRAPHIC DATA ON THE SCIENCE FICTION READERSHIP/FANDOM WITH THAT OF COHORTS OF TERROR GROUP LEADERS AND FOLLOWERS
Based upon the studies just synopsized, I have assembled a rough comparison of
the demographic and psycho-social profiles of the science fiction readership and various
categories of terrorist group leaderships and followers (see Table 17):
437 Ibid., 32–34.

360
Table 17. The Science Fiction Readership/Fan Group Demographically Compared With Various Categories of Terrorist Group Leaderships and
Followers
Social
Category
GenderTypicalAgeRange
SocialClass
HighestEducational
LevelAchieved
MotivationsForBelonging
ScienceFictionReadership/Fans
Majoritymale
Mostferventinvolvementbetween12and17years;readershipusuallydeclinesduringcollegeyearsbutmaypickupduringadulthood
Middleorupper‐middleclass
Veryhighlyeducated;virtuallyallachieveundergraduatedegree,manyalsoachievingadvanceddegrees
Socialostracismby“mainstream”peersresultinginseekingalternativesocialcircle;strongsenseofin‐group/out‐groupdynamic;desireforentertainment,novelty‐seeking;balmfornarcissisticwoundstobefoundinpowerfantasiesonofferinmanySFstoriesandnovels;intellectualstimulation;freedomtoengageinunusualbehaviorsinsocialsettings(costuming,discussionsoffar‐outconcepts,fanzinepublications,beinganerd/geekintheopen);aspirationtobecomeasciencefictionprofessional(writer,editor,artist,collector,screenwriter)
Terrorists,General,1966–76(RussellandMiller)
Mostlymale
20–25years Middleorupper‐middleclass
Collegeeducated,withmanyleadershavingaprofessionalbackground
DesiretoreplacerepressivegovernmentwithMarxist‐Leniniststate;desireforpoliticalindependence,autonomy,ortheestablishmentofanewethno‐nationalentity;desiretoachieverevengeonIsraelortoexpelJewsfromtheHolyLand

361
Social
Category
GenderTypicalAgeRange
SocialClass
HighestEducational
LevelAchieved
MotivationsForBelonging
LeftwingTerroristLeaders,1960s&1970s(Handler/Strentz)
Male&female
25–40years(Strentz)
Middleorupper‐middleclass
Collegeeducated,manywithadvanceddegrees
DesiretocreateMarxist‐Leninist“utopia;”desiretooverturnexistingsocialorderthatdoesnotadequatelyrecognizeandrewardthem,andreplacewithanewsocialorderwhichwill;feminists’desireforamoregender‐equitablesociety
LeftwingTerroristFollowers,1960s&1970s(Handler/Strentz)
Male&female
20–25years(Strentz)
Middleorupper‐middleclass
Collegeeducated DesiretocreateMarxist‐Leninist“utopia;”desiretooverturnexistingsocialorderwhichdoesnotadequatelyrecognizeandrewardthem,andreplacewithanewsocialorderwhichwill;thrill‐seeking;feminists’desireforamoregender‐equitablesociety
RightwingTerroristLeaders,1960s&1970s(Handler/Strentz)
Male 35–50years(Strentz)
Middleclass(Handler);middleorlower‐middleclass(Strentz)
Justoverfiftypercentwithsomecollegeeducation
Desiretopreserveorrestoretraditionalracial/ethnic/genderprivilegesandtocounterperceivedthreatsfromracial/ethnic/religiousminorities;desiretoavengeperceivedsocialoreconomicsetbackorfailure;desiretoreturntoaperceived“better”past
RightwingTerroristFollowers,1960s&1970s(Handler/Strentz)
Male 20–50+years(Strentz)
Middle,lower‐middle,orworkingclass
Virtuallynonewithcollegeeducation;mostgradeschoolonly
Desiretopreserveorrestoretraditionalracial/ethnic/genderprivilegesandtocounterperceivedthreatsfromracial/ethnic/religiousminorities;desiretoavengeperceivedsocialoreconomicsetbackorfailure;desiretoreturntoaperceived“better”past;fetishizationofweaponsandviolence

362
Social
Category
GenderTypicalAgeRange
SocialClass
HighestEducational
LevelAchieved
MotivationsForBelonging
Leftist/NationalistMiddleEasternTerroristLeaders,1980s(Strentz)
Male 30–45years Middleclass Collegeeducated Desiretoachieveownnation‐state;desiretoreplacerepressivegovernmentwithMarxist‐Leniniststate;desiretoachieverevengeonIsraelortoexpelJewsfromtheHolyLand
Leftist/NationalistMiddleEasternTerroristFollowers,1980s(Strentz)
Male 17–25years Lowerclass Poorlyeducated,illiterate
Desiretoachieveownnation‐state;desiretoachieverevengeonIsraelortoexpelJewsfromtheHolyLand
IslamistTerrorists,1990s&2000s(Hassan/Pedahzur,Perliger,andWeinberg)
Mostlymale
18–38years(Hassan);mean24.5years(others)
Mostlymiddleclass(Hassan);meanSESof5.97on10ptscale(10beinghighest)
Notstated;presumablyatleastsomewithcollegedegrees
DesiretorestoretraditionallyIslamicsocieties;desiretoachieverevengeonIsraelortoexpelJewsfromtheHolyLand;desiretoavengeperceivedhumiliationsfromtheWest
IslamistTerroristLeaders,1990s&2000s(Sageman)
Male Mean25.69years
Mostlymiddleorupperclass
Anecdotally,manywithcollegeeducations(alQaeda9/11plotters,forexample)
DesiretorestoretraditionallyIslamicsocietiesorthehistoricCaliphate;desiretoavengeperceivedhumiliationsfromtheWest
The cohort of science fiction readers/fans may thus be said to be demographically
congruent with the majority of terror cohorts studied in terms of male gender, age of
initiation into the group, age of highest intensity of involvement, or age when surveyed (for
science fiction readers/fans, adolescence to young adulthood; for most terror cohorts, late
adolescence to young adulthood, with leaders tending to be 5–10 years older than
followers), social class (middle or upper-middle class), and educational attainment (science
fiction readers/fans and leftwing terrorist leaders of the 1960s and 1970s achieving the
highest levels of formal education, many members of these two cohorts completing
advanced degrees, but the majority of the other cohorts, with a few exceptions, having at
least some college education). The cohort of science fiction readers/fans bears the greatest
similarity in demographic traits to leftwing terrorist leaders and followers of the 1960s and

363
1970s and leftist/nationalist Middle Eastern terrorist leaders of the 1980s, with a somewhat
reduced similarity to rightwing terrorist leaders of the 1960s and 1970s. This cohort bears
less similarity to Islamist terrorists of the 1990s and 2000s, and the least similarity to the
leftist/nationalist Middle Eastern terrorist followers of the 1980s. Theoretical
psychological motivations of narcissistic injury and response, a Humiliation-Revenge
cycle, and novelty-seeking appear to have salience for both the science fiction
readership/fan cohort and the majority of the terrorist cohorts, with the key difference being
how each cohort or set of cohorts acts upon those motivations. Nearly all science fiction
readers/fans, if they act upon those motivations at all, do so in the realm of fiction and the
imagination, making use of the products of science fiction (stories, novels, films, TV
shows, comic books, video games, role-playing games, and cosplay/costuming activities)
to fantasize that they, or a fictional character with whom they identify, are avenging a
humiliation; addressing a narcissistic wound caused by rejection, abandonment, or lack of
deserved recognition; proving to the world that they are special, talented, and worthy of
leadership, wealth, fame, and sexual gratification; or are capable of changing the world to
make it more fair, equitable, just, righteous, or pure (or perhaps just less boring). Members
of terrorist cohorts may also engage in these fantasizing activities, but they go beyond
fantasizing to what was once called “propaganda of the deed,” actual acts of violence or
threats of violence against non-combatants, meant to spread fear and intimidation and to
influence public opinion or political events.
This difference may possibly be due to psychological traits that members of
terrorist cohorts do not share with science fiction readers/fans, perhaps a propensity
towards violence, a lack of an ability to empathize with the suffering of their victims,
heightened impulsiveness and aggression, reduced impulse control, or traumatic
developmental events (such as an early loss of a parent or estrangement from a parent).
Alternatively, it may be that members of terrorist cohorts are more likely than science
fiction readers/fans to be among the ranks of Dingley’s “overeducated and
underemployed,” and that once science fiction readers/fans join the ranks of the
“overeducated and underemployed,” they become more likely to become involved in
radical politics and/or terrorism. Of course, the differences between how science fiction

364
readers/fans and the varying terrorist cohorts respond to shared motivations may be due to
“all the above.” Jeff Victoroff believes “(t)errorist behavior is probably always determined
by a combination of innate factors, biological factors, early developmental factors,
cognitive factors, temperament, environmental influences, and group dynamics… The
degree to which each of these factors contributes to a given event probably varies between
individual terrorists, between individual groups, and between types of groups.”438
Presumably, not all terrorist cohorts will be equally likely to select the products of
future-shock, Promethean technologies for their terroristic assaults. The various terrorist
cohorts previously described may be roughly divided into those that are future-oriented
(leftwing groups; those nationalist/separatist groups that are not trying to recreate an
idealized past; Dingley’s anarcho-ideological terrorists) and those that are past-oriented
(rightwing groups; Islamists; Dingley’s nationalist-Luddites). Future-oriented terrorists
share their temporal orientation with science fiction readers/fans, and the latter are more
demographically like the future-oriented terrorist cohorts than they are to past-oriented
cohorts. Future-oriented terrorists are more likely than others to be intrigued by emerging,
over-the-horizon technologies and how those technologies could be used to serve their
ends. Past-oriented terrorists, due to their conservative nature and outlook, are less likely
to seek out innovative, emerging technologies for their use and more likely to resort to
tried-and-true implements of destruction. Thus, when engaging in a “devil’s toy box”
analysis, the analytical team would be wise to focus primarily on the threats, capabilities,
and emergence of cohorts of future-oriented terrorists.
One cohort of future-oriented terrorists that has not yet been discussed is
millenarian terrorists, those terror groups and individual terrorists who look ahead to a
coming religious End-of-Days event (a messianic arrival, reckoning with the wicked, and
deliverance of the just), or a future socio-political catastrophe that only the elect will
survive. One such millenarian cult/terror group with especial relevance to the psycho-
motivational overlap between the science fiction readership/fandom and future-oriented
terrorist cohorts is Japan’s Aum Shinrikyo.
438 Victoroff, “The Mind of the Terrorist,” 34.

365
D. CASE STUDY: AUM SHINRIKYO—A SCIENCE FICTION-BASED TERROR CULT THAT SOUGHT TO HASTEN THE APOCALYPSE THROUGH THE MALIGN USE OF ADVANCED TECHNOLOGIES
On March 20, 1995, Japan was shocked by a coordinated sarin gas attack carried
out on the crowded Tokyo subway system. Had the formulation of sarin used been more
potent, or the delivery system more effective, thousands of deaths could have resulted,
rather than the 11 fatalities, dozens of serious injuries, and several thousand more minor
injuries and illnesses that did ensue from the attacks on the densely-packed subway cars.
The perpetrators were five members of the Aum Shinrikyo cult, whose charismatic leader,
Shoko Asahara (real name: Chizuo Matsumoto), had predicted a coming apocalypse that
would destroy much of Japan, an apocalypse that the increasingly paranoid and
psychopathic cult leader, bitterly disappointed by the failure of his organization to achieve
legitimate election to Japan’s government, had decided to precipitate himself. His acolytes,
eager to see Asahara’s prophecies come true, worked to actualize those dire predictions.439
Asahara’s background reads as though it were a novel written by a twentieth
century Charles Dickens. Victim of infantile glaucoma, he lost the use of one eye and had
only partial vision in the other. His poor parents sent him to a government-run school for
the blind, where, due to his limited but invaluable remaining sight, he came to exercise
great informal authority over the totally blind students. Using both his physical advantage
over his fellow students and his bullying, authoritarian personality, he convinced them to
pay him for guiding them and for providing other services, earning several thousand dollars
that way prior to his graduation from high school. Upon opening an acupuncture clinic, he
quickly became a successful businessman, albeit one known for his megalomaniac
ambitions of becoming Japan’s prime minister (or even the supreme overlord of a kingdom
entirely populated by robots); however, this business, like another that followed, was
derailed by Asahara’s proclivities for fighting and for becoming involved in scams and
crime. He took the National college entrance exams and failed. Around that time, he taught
himself Chinese and immersed himself in study of Eastern religions and the political
philosophy of Mao Zedong. In 1984 he founded a yoga center, Aum, Inc., and within a few
439 Hudson, The Sociology and Psychology of Terrorism, 133–139.

366
years the center had attracted three thousand followers. This success encouraged Asahara
to begin portraying himself as a holy man. He embarked on a spiritual odyssey through the
Himalayas and returned to his followers, now claiming to have achieved spiritual bliss and
to have developed extraordinary mystical abilities. In 1987, he renamed his network of
yoga centers, which had previously been secular in their orientation, Aum Supreme Truth,
or Aum Shinri Kyo, and reoriented them to focus on him as the center of a personality cult.
The newly developed organization, Aum Shinrikyo, adopted trappings and conceptual
underpinnings from several sources that would be familiar to science fiction fans—
Japanese anime (animated films and television shows), computer games, cyberpunk and
fiction, Isaac Asimov’s classic series of science fiction novels from the 1940s, the
Foundation trilogy. Asimov’s series, highly influential on subsequent science fiction that
dealt with interplanetary empires, focuses on Hari Seldon, a mathematician who discovers
the new science of psychohistory, which allows for accurate forecasts of future events.
Seldon foresees a coming apocalypse that will result in the fall humanity. To preserve
civilization from this disaster, he forms a secret society, the Foundation, which combines
scientific and religious precepts, and recruits the greatest minds of his time to become its
founding cadre of scientist-priests. He intends for the Foundation to go underground during
the ravages of the civilizational disaster and to then rise from the ruins and lead mankind
in rebuilding and perfecting its societies. Asahara saw himself as a real-life Hari Seldon.
Like Seldon, he claimed the ability to see the future, and his Aum Shinrikyo mirrored the
Foundation in that it sought to recruit Japan’s (and later Russia’s) finest scientific minds,
acquire advanced technological resources and capabilities, and prepare for a coming
apocalypse, from whose ashes it would arise as a world-dominating authority.440
A person with no knowledge of the history of Aum Shinrikyo might well scoff at
Asahara’s ambition to attract large numbers of scientists and technologists to a cult of
personality based on an esoteric mishmash of Buddhism, Hinduism, Taoism, tantric yoga,
science fiction, and Maoism. Are not scientists highly intelligent persons dedicated to
rationality, the study of observable phenomena, and the scientific method? Yet the
440 Ibid., 134–136.

367
backgrounds of Asahara’s most prominent disciples, those who killed for him or who
developed his weapons of mass destruction programs, are studded with impressive
educational achievements in science and technology fields. Seiichi Endo, who served as
Aum’s minister of health and welfare, had carried out genetic engineering experiments in
his biology graduate course of study at Kyoto University. Given control of Aum’s biolab,
he researched biowar uses of botulism and Ebola virus, and Asahara assigned him the task
of creating the sarin nerve gas that was used in the March 20, 1995 Tokyo subway attack.
Kiyohide Hayakawa, Aum’s second in command, held a MS degree in environmental
planning; he sought assistance in Russia for the sect’s development of seismological and
nuclear weaponry. Dr. Ikuo Hayashi, a respected physician before joining Aum, had
graduated from one of Japan’s top medical schools; as Asahara’s minister of healing, he
twisted medical science to extract funds from recruits or to punish members suspected of
disloyalty, using drugs and electroshock treatments to erase memories or to torture and kill.
Fumihiro Joyu, Aum’s foreign affairs minister, had acquired a graduate degree in
telecommunications and studied artificial intelligence, but quit his position at the Japanese
Space Development Agency to become more involved in Asahara’s sect; he was the man
primarily responsible for recruiting Aum’s Russian followers. Hideo Murai, Asahara’s
science and technology minister, studied astrophysics and computer programming at Osaka
University’s Physics Department before performing R&D work at Kobe Steel. He was
attracted to Aum Shinrikyo after reading one of Asahara’s books. He developed several
pseudoscience inventions that sold widely to sect followers and netted Asahara millions of
dollars, including an Astral Teleporter and an electroshock cap called the Perfect Salvation
Initiation hat. His unsuccessful attempts at militarizing advanced technology for the cult
included his effort to create a botulinus toxin, along with microwave-, laser-, and nuclear-
based weaponry. He was the mastermind behind the Tokyo subway attack. Masami
Tsuchiya, who served as the leader of Asahara’s chem-warfare team, had been enrolled in
Tsukuba University’s doctoral program in chemistry and organic physics, one of the most
prestigious STEM programs in the country, where his professors described him as brilliant
and he researched methods for altering molecular structure through applications of light.
Tsuchiya traveled to Russia to study Russian biowarfare techniques and created Aum’s

368
stockpile of sarin gas based on a Russian formula. He also developed a supply of VX
chemical warfare agent for the sect.441
The chemical and biological weapons these men developed for Aum Shinrikyo
were not used only for the Tokyo subway attack. In April 1990, following the sect’s
humiliating repudiation in Japan’s parliamentary elections, Asahara directed his bio-chem-
warfare team to spray poisonous botulin on the grounds of the U.S. naval base located in
Yokosuka, home of the Navy’s Seventh Fleet. The botulin turned out to have been
defectively produced; only this happenstance prevented massive deaths among U.S.
military personnel.442 On June 27, 1994, Hideo Murai spearheaded a sarin gas attack on
the home and neighborhood of a judge who had ruled against Aum Shinrikyo. This resulted
in seven fatalities and more than 150 non-fatal poisonings. It was a “practice run” for the
Tokyo subway attack.443
Researchers who have studied the Aum Shinrikyo cult have suggested that Japan’s
rigid cultural expectations of its young people, that they will excel academically and then
devote their lives to the furtherance of the economic prospects of the corporation that hires
them, leads to a desire on the part of some young people to rebel against the dictates of
their parents, peer group, and society at large. They also suggest that Japanese culture’s
focus on the well-being of the community and of economic collectives such as
corporations, as opposed to the self-actualization and spiritual growth of individual
Japanese, may have made the counter-cultural aspects of Asahara’s cult—its fusion of
many different world religious traditions, its elevation of “low culture” products such as
anime and science fiction, the claims of its founder and leader to vast supernatural powers,
and its promise to its followers that they would be members of a select group that would
survive an upcoming apocalypse—especially attractive to young, educated, alienated
Japanese wanting to rebel against social conformity.444
441 Ibid., 141–151.
442 Ibid., 136–137.
443 Ibid., 138.
444 Ibid., 133–135.

369
Yet I feel it would be a mistake to intellectually cordon off Aum Shinrikyo and its
like as a peculiarly Japanese phenomenon, which can only arise within the context of the
culture, constraints, and pressures of life in Japan. Prior to the Tokyo subway attack, Aum
Shinrikyo’s leadership claimed to have 30,000 followers in Russia, as opposed to 10,000
acolytes in Japan itself.445 Russian society differs enormously from that of Japan. One
explanation for the involvement of so many Russians in the exotic, foreign cult of Aum
Shinrikyo in the early 1990s could be Dingley’s “overeducated and underemployed” thesis.
Russia, prior to the dissolution of the Soviet Union in 1991, was a highly educated society,
boasting many talented, well-trained scientists and engineers, many of whom had worked
in the defense and space sectors. Upon the abolition of communism and a tumultuous
transition to an at least partially market-based economic system (marked by much
cronyism), the Russian economy greatly contracted, and funding for national defense, the
space program, and all associated R&D efforts was slashed. This economic contraction put
many Russian scientists and engineers out of work, cut their salaries, or rendered their
continued employment tenuous, as well as dashed the career hopes of tens of thousands of
Russian students then in the STEM higher education pipeline. Dingley’s theory suggests
that being “overeducated and underemployed” raised the propensity of Russians to find a
malignly countercultural group such as Aum Shinrikyo perversely attractive, both for the
opportunities it provided for them to “strike back” at a society that had hurt and
disappointed them and for the ego-soothing balm it provided by telling them they were
members of an elect.
Critics of the notion that an Aum Shinrikyo-like organization might take root in the
United States can point to the fact that the cult’s effort to recruit American acolytes in the
early 1990s failed miserably, succeeding only in winning a few dozen followers in the area
of New York City.446 They may also point to the FBI’s enviable record of success in
infiltrating and dismantling or minimizing various groups of violent extremists, including
leftwing and Marxist terror groups in the 1960s and 1970s and rightwing, racist terror
445 Ibid., 133.
446 Ibid., 137.

370
groups during those and subsequent decades. Yet a powerful, wealthy, and influential
American analog to Aum Shinrikyo has existed since the 1950s: The Church of
Scientology, founded by science fiction writer L. Ron Hubbard. Had Hubbard, an Asahara-
like figure in many ways, been more interested in forcing an apocalypse than in amassing
wealth and infiltrating the motion picture industry, his Scientologists might now be better
known for use of weapons of mass destruction than for the action films and romantic
misadventures of famed acolyte Tom Cruise. Also, current trends in the U.S. economy and
society may give increasing salience to Dingley’s “overeducated and underemployed”
thesis in the American context. A 2014 study conducted by Jaison R. Abel and Richard
Deitz, economists employed by the Federal Reserve Bank of New York, found that rates
of underemployment for both college graduates as a whole (those aged 22–65 and
possessing at least a bachelor’s degree) and for recent college graduates (those aged 22–27
and possessing at least a bachelor’s degree) rose steadily from 2003 to 2014, with the rate
for graduates as a whole being 34% in 2014 and the rate for recent graduates in that year
being 46%. Abel and Dietz define “underemployment” for college graduates as working in
a job/occupation for which fewer than half the occupants hold at least a bachelor’s
degree.447 Advances in machine learning, artificial intelligence, and robotics stand to make
unemployment and underemployment worse for college graduates. In March 2017, global
advisory firm PwC, as part of its UK Economic Outlook report, estimated the shares of
employment in various sectors in Great Britain that will be at risk of being replaced by
automation by the early 2030s. For administrative and support services, they pegged that
figure at 37.4%; for professional, scientific, and technical jobs, 25.6%; for public
administration and defense jobs, 32.1%; for information and communications jobs, 27.3%;
and for financial and insurance jobs, 32.2%. The report’s overall figure for jobs at risk from
automation, including blue collar and manufacturing jobs, was estimated to be 30%, and
the report’s author estimated that a somewhat larger overall percentage of jobs in the
447 Jaison R. Abel and Richard Deitz, “Are the Job Prospects of Recent College Graduates
Improving?” Liberty Street Economics blog of the Federal Reserve Bank of New York, September 4, 2014, http://libertystreeteconomics.newyorkfed.org/2014/09/are-the-job-prospects-of-recent-college-graduates-improving.html#.Vko9H6SYVgo.

371
United States was at risk of abolishment due to automation than in the U.K.448 Fred Destin,
a former general partner at Accel and currently organizing his own venture capital fund,
goes more dire in his June 2017 prediction, estimating that advances in machine
intelligence and automation will eventually obliterate up to 70% of white-collar jobs, with
employees of law and insurance firms being most harshly impacted.449
American college graduates aspiring for white collar careers stand to be
increasingly squeezed from several directions. Not only will advances in automation likely
mean they will be increasingly under- or unemployed, but they are and will likely continue
to be burdened by sizable college loans, which are non-dischargeable under U.S.
bankruptcy laws. As of 2017, approximately 70% of college graduates exited school
carrying student debt. More than $1.4 trillion in student loans is owed by approximately
44 million Americans, 60% of whom do not expect to be able to finish paying off their
loans until sometime in their forties. A study of graduates of Wisconsin colleges and
universities indicated that graduates take 19.7 years to finish paying off loans undertaken
for a bachelor’s degree and 23 years to finish paying for loans undertaken for a graduate
degree.450
Taken together, these trends suggest that the “overeducated and underemployed”
phenomenon stands to grow worse, not better. Japanese police were relatively fortunate in
the early 1990s in that Aum Shinrikyo operated under the twentieth century paradigm for
developing advanced weaponry: the cult needed to operate its own bio-lab and acquire
components from a network of legitimate suppliers, sometimes through illegal and
clandestine means, such as inserting followers into key companies or recruiting insiders,
448 “Up to 30% of Existing UK Jobs Could be Impacted by Automation by Early 2030s, But This
Should be Offset by Job Gains Elsewhere in Economy,” PwC website and blog, March 24, 2017, http://pwc.blogs.com/press_room/2017/03/up-to-30-of-existing-uk-jobs-could-be-impacted-by-automation-by-early-2030s-but-this-should-be-offse.html.
449 Shona Ghosh, “One of Europe’s Most Influential Investors Gave a Brutal Example of How AI Could Wipe Out White-Collar Jobs,” Business Insider website, June 13, 2017, http://www.businessinsider.com/fred-destin-artificial-intelligence-will-wipe-out-white-collar-jobs-2017-6.
450 Abigail Hess, “This is the Age Most Americans Pay Off Their Student Loans,” CNBC.com website, July 3, 2017, https://www.cnbc.com/2017/07/03/this-is-the-age-most-americans-pay-off-their-student-loans.html.

372
or by setting up front corporations to buy sensitive materials; and sometimes through legal
means, such as purchasing companies outright.451 All these activities required the cult to
engage with the outside physical world and created paper trails, potential leads for
investigators to follow; however, future Aum Shinrikyos will likely be more virtual than
physical in nature, more likely to gather in cyberspace than in a yoga ashram. Imagine
thousands of outraged, frustrated, “overeducated and underemployed” acolytes of a future
apocalyptic cult using Promethean technologies to download schematics for weapons of
mass destruction and to manufacture those implements of death in the shelter of their own
homes, freed from the necessities of working in a lab, acquiring components from outside
firms and organizations, or traveling to foreign lands to gain expertise. Contemplating this,
you may begin to recognize the scope of the challenges to be faced by homeland security
and law enforcement institutions in coming years.
451 Hudson, The Sociology and Psychology of Terrorism, 137.

373
LIST OF REFERENCES
Abramowicz, Michael. “The Politics of Prediction.” Innovations: Technology, Governance & Globalization 2 (Summer 2007): 89–96.
Aldiss, Brian W., and David Wingrove. Trillion Year Spree: The History of Science Fiction. London: Victor Gollancz Ltd, 1986.
Alexander, Jane. HSARPA—How We Intend to Do Business. Washington, DC: U.S. Department of Homeland Security Science and Technology Directorate, November 17, 2003. Accessed on the DHS Intranet.
Amara, Roy. “A Note on What We Have Learned About the Methods of Futures Planning.” Technological Forecasting and Social Change 36 (1989): 43–47.
———. “Views on Futures Research Methodology.” Futures 23 (July/August 1991): 645–49.
Anderson, Bjørn, and Tom Fagerhaug. “The Nominal Group Technique: Generating Possible Causes and Reaching Consensus.” Quality Progress 33, no. 2 (February 2000): 144.
Andrews, Sr., Arlan. “SIGMA: Summing Up Speculation.” Analog Science Fiction & Fact 132, no. 9 (September 2012): 38–43.
Armed Forces Journal. “A Better Way to Use Red Teams: How to Inject the Enemy’s View into the Planning Process.” Armed Forces Journal (February 1, 2012). http://armedforcesjournal.com/a-better-way-to-use-red-teams/.
Atanasov, Pavel, Phillip Rescober, Eric Stone, Samuel A. Swift, Emile Servan-Schreiber, Philip Tetlock, Lyle Ungar, and Barbara Mellers. “Distilling the Wisdom of Crowds: Prediction Markets vs. Prediction Polls.” Management Science 63, no. 3 (March 2017): 691–706. https://doi.org/10.1287/mnsc.2015.2374.
Bardach, Eugene. A Practical Guide for Policy Analysis. New York: Seven Bridges Press, 2000.
Bellavita, Christopher. “What is Preventing Homeland Security?” Homeland Security Affairs 1 (Summer 2005). https://www.hsaj.org/articles/182.
Benzel, Terry. “The Science of Cyber Security Experimentation: The DETER Project.” Paper presented at 2011 Annual Computer Security Applications Conference, Orlando, Florida, December 5–9, 2011. https://www.acsac.org/2011/program/keynotes/benzel.pdf.

374
Beretta, Ruth. “A Critical Review of the Delphi Technique.” Nurse Researcher 3, no. 4 (June 1996): 79–89.
Berger, Albert I. “Science-Fiction Fans in Socio-Economic Perspective: Factors in the Social Consciousness of a Genre.” Science Fiction Studies 4, no. 3 (November 1977): 232–46.
Bonvillian, William B. “The New Model Innovation Agencies: An Overview.” Science and Public Policy 41 (2014): 425–37.
Bougen, Philip D; and Pat O’Malley. “Bureaucracy, Imagination and U.S. Domestic Security Policy.” Security Journal 22 (2009): 101–18.
Bowman, Calvin J. “A DHS Skunkworks Project: Defining and Addressing Homeland Security Grand Challenges.” Master’s thesis, Naval Postgraduate School, 2016.
Boyd, Dallas, Trevor Caskey, Kevin A. Ryan, Joshua Pollack, George W. Ullrich, James Scouras, and Jonathan Fox. “Thwarting an Evil Genius: Final Report.” Washington, DC: Defense Threat Reduction Agency Advanced Systems and Concepts Office, April 13, 2009. https://fas.org/irp/agency/dod/dtra/thwart.pdf .
Brahm, Carolyn, and Brian H. Kleiner. “Advantages and Disadvantages of Group Decision-Making Approaches.” Team Performance Management 2, no. 1 (1996): 30–35.
Brannan, David, Kristin Darken, and Anders Strindberg. A Practitioner’s Way Forward: Terrorism Analysis. Salinas, California: Agile Press, 2014.
Brooks, Kenneth W. “Delphi Technique: Expanding Applications.” The North Central Association Quarterly 53 (1979): 377–85.
Brown, Gerald G., W. Matthew Carlyle, and R. Kevin Wood. “Optimizing Department of Homeland Security Defense Investments: Applying Defender-Attacker (-Defender) Optimization to Terror Risk Assessment and Mitigation.” Appendix E of National Research Council, 2008, Department of Homeland Security Bioterrorist Risk Assessment: A Call for Change. Washington, DC: National Academies Press, 2008.
———. Analyzing the Vulnerability of Critical Infrastructure to Attack and Planning Defenses. Monterey, CA: Naval Postgraduate School, Operations Research Department, 2005. doi: 10.1287/educ.1053.0018.
Bunker, Robert J. “Home Made, Printed, and Remote-Controlled Firearms—Terrorism and Insurgency Implications.” TRENDS Research & Advisory, Terrorism Futures Series (June 21, 2015). http://trendsinstitution.org/homemade-printed-and-remote-controlled-firearms-terrorism-and-insurgency-implications/.

375
Butter, Maurits, Felix Brandes, Michael Keenan, Rafael Popper, Susanne Giesecke, Sylvie Rijkers-Defrasne, Anette Braun, and Patrick Crehan. Final Report: Monitoring Foresight Activities in Europe and the Rest of the World (EUR 24043 EN). Brussels, Belgium: European Foresight Monitoring Network, European Commission, Publications Office of the European Union, 2009). doi: 10.2777/47260.
Carstensen, Helle Vibeke and Christian Bason. “Powering Collaborative Policy Innovation: Can Innovation Labs Help?” The Innovation Journal: The Public Sector Innovation Journal 17, no. 1 (2012): article 4.
Carter, Jennifer. “Evaluating and Optimizing Government Research Project Portfolios.” PhD diss., University of Maryland University College, 2009.
Center on Contemporary Conflict. Use of 3D Printing to Bypass Nuclear Export Controls. Monterey, CA: Naval Postgraduate School, Center on Contemporary Conflict, CCC-PASCC Research in Progress Ripsheets, October 2016. http://hdl.handle.net/10945/50621.
Cortese, Amy. “Suddenly, Uncle Sam Wants to Bankroll You.” New York Times, December 30, 2001.
Cuhls, Kerstin. “Foresight with Delphi Surveys in Japan.” Technology Analysis & Strategic Management 13, no. 4 (2001): 555–69. doi: 10.1080/09537320120095446.
Dalkey, Norman C. The Delphi Method: An Experimental Study of Group Opinion (RM-5888–PR). Santa Monica, CA: RAND Corporation, 1969. https://www.rand.org/pubs/research_memoranda/RM5888.readonline.html.
Dawson, Jim. “Science Fiction Writers Bring Creativity to DHS.” Physics Today, August 2007, 32–33.
Delbecq, Andre L., Andrew H. Van de Ven, and David H. Gustafson. Group Techniques for Program Planning: A Guide to Nominal Group and Delphi Processes. Glenview, IL: Scott, Foresman and Company, 1975.
Dening, Karen H., Louise Jones, and Elizabeth L. Sampson. “Preferences for End-of-Life Care: A Nominal Group Study of People with Dementia and Their Family Carers.” Palliative Medicine 27, no. 5 (2012): 409–17. doi: 10.1177/0269216312464094.
Dingley, James. “The Terrorist—Developing a Profile.” International Journal of Risk, Security and Crime Prevention 2, no. 1 (January 1997): 25–37.

376
Dugan, Regina E; and Kaigham J. Gabriel. “´Special Forces’ Innovation: How DARPA Attacks Problems.” Harvard Business Review (HBR Reprint R1310C). October 2013.
Duggan, David P., Sherry R. Thomas, Cynthia K. K. Veitch, and Laura Woodard. Categorizing Threat: Building and Using a Generic Threat Matrix (SAND2007–5791). Albuquerque, NM: Sandia National Laboratories, September 2007.
Federal Emergency Management Agency. Crisis Response and Disaster Resilience 2030: Forging Strategic Action in an Age of Uncertainty—Progress Report Highlighting the 2010–2011 Insights of the Strategic Foresight Initiative. Washington, DC: Federal Emergency Management Agency, 2012. https://www.fema.gov/media-library-data/20130726–1816–25045–5167/sfi_report_13.jan.2012_final.docx.pdf.
Fleming, Linda. “The American SF Subculture.” Science-Fiction Studies 4, no. 3 (November 1977): 263–71.
Fontenot, Gregory. “Seeing Red: Creating a Red-Team Capability for the Blue Force.” Military Review 85, no. 5 (September-October 2005): 4–8.
Fox, Tom. “Advice on Leading High-Risk Projects in Government.” Washington Post—Blogs, July 20, 2016.
Fox, William M. “The Improved Nominal Group Technique (INGT).” Journal of Management Development 8, no. 1 (1989): 20–27. https://doi.org/10.1108/EUM0000000001331.
Franklin, Kathy K., and Jan K. Hart. “Idea Generation and Exploration: Benefits and Limitations of the Policy Delphi Research Method.” Innovative Higher Education 31, no. 4 (January 2007): 237–46. doi: 10.1007/s10755–006–9022–8.
Gaskin, S. “A Guide to Nominal Group Technique (NGT) in Focus-Group Research.” Journal of Geography in Higher Education 27, no. 3 (2003): 341–347.
Geers, Kenneth. “Live Fire Exercise: Preparing for Cyber War.” Journal of Homeland Security and Emergency Management 7, no. 1 (2010). doi: https://doi.org/10.2202/1547–7355.1780.
Genzlingersept, Neil. “Jerry Pournelle, Science Fiction Novelist and Computer Guides, Dies at 84.” New York Times. Last modified September 15, 2017. https://www.nytimes.com/2017/09/15/obituaries/jerry-pournelle-science-fiction-novelist-and-computer-guide-dies-at-84.html.
Gerstein, Daniel M. “Can the Bioweapons Convention survive CRISPR?” Bulletin of the Atomic Scientists, July 25, 2016. http://thebulletin.org/can-bioweapons-convention-survive-CRISPR9679.

377
Gordon, Theodore J. “The Real-Time Delphi Method.” In Futures Research Methodology Version 3.0, edited by Jerome C. Glenn and Theodore J. Gordon. Washington, DC: The Millennium Project, American Council for the United Nations University, 2009. CD-ROM article 5. http://107.22.164.43/millennium/RTD-method.pdf.
Gordon, Theodore J., and Olaf Helmer. Report on a Long-Range Forecasting Study (P-2982). Santa Monica, CA: RAND Corporation, September 1964. https://www.rand.org/content/dam/rand/pubs/papers/2005/P2982.pdf.
Graefe, Andreas, and J. Scott Armstrong. “Comparing Face-to-Face Meetings, Nominal Groups, Delphi and Prediction Markets on an Estimation Task.” International Journal of Forecasting 27 (2011): 183–195. doi: 10.1016/j.ijforecast.2010.05.004.
Grant, Slater. “Mind-reading Dogs? Martyr Antibiotics? Futuristic Writers Offer Ideas to Fight Terrorism, Homeland Security Asks for Wild Ideas from Those Who Predicted GPS and the Internet.” St. Louis Post-Dispatch, May 25, 2007.
Green, Kesten C., J. Scott Armstrong, and Andreas Graefe. “Methods to Elicit Forecasts from Groups: Delphi and Prediction Markets Compared.” Foresight, no. 8 (2007): 1–6. http://repository.upenn.edu/marketing_papers/157.
Grela, Michal, Kamil Kulesza, Marta Zagórowska, and Piotr Ziolo. “Crowdsourcing and Defence, in the Age of Big Data.” Paper presented at the Institute of Mathematics and its Applications (IMA) Conference on Mathematics in Defence (sic), Oxford, UK, November 2015. https://cdn.ima.org.uk/wp/wp-content/uploads/2015/11/Crowdsourcing-and-Defence-in-the-age-of-Big-Data.pdf.
Haimes, Yacov Y; and Barry M. Horowitz. “Adaptive Two-Player Hierarchical Holographic Modeling Game for Counterterrorism Intelligence Analysis.” Journal of Homeland Security and Emergency Management 1, no. 3 (June 2004): article 302. doi: https://doi.org/10.2202/1547–7355.1038.
Handler, Jeffrey S. “Socioeconomic Profile of an American Terrorist: 1960s and 1970s.” Terrorism 13, no. 3 (1990): 195–213.
Hanson, Robin. “Decision Markets.” IEEE Intelligent Systems 14, no. 3 (May/June 1999): 16–19.
———. “Designing Real Terrorism Futures.” Public Choice 128 (2006): 257–74. http://mason.gmu.edu/~rhanson/realterf.pdf.
———. Foul Play in Information Markets. Fairfax, VA: Department of Economics, George Mason University, 2004. http://mason.gmu.edu/~rhanson/foulplay.pdf.

378
———. The Informed Press Favored the Policy Analysis Market. Fairfax, VA: Department of Economics, George Mason University, August 8, 2005. http://mason.gmu.edu/~rhanson/PAMpress.pdf.
———. “The Policy Analysis Market: A Thwarted Experiment in the Use of Prediction Markets for Public Policy.” Innovations: Technology, Governance & Globalization 2 (Summer 2007): 73–88.
Hanson, Robin, Takashi Ishikida, and John Ledyard. An Experimental Test of Combinatorial Information Markets. Fairfax, VA: Department of Economics, George Mason University, February 2005. http://mason.gmu.edu/~rhanson/testcomb.pdf.
Graham, Peter. “The Golden Age of Science Fiction is Twelve.” In Age of Wonders: Exploring the World of Science Fiction, edited by David G. Hartwell. New York: Tom Doherty Associates, 1996): 13–43.
Haydon, Brownlee. The Year 2000 (P-3571). Santa Monica, CA: RAND Corporation, 1967.
Heath, Robert L., and Richard A. Nelson. Issues Management: Corporate Public Policymaking in an Information Society. Beverly Hills, CA: Sage Publications, 1986.
Helmer, Olaf. Analysis of the Future: the Delphi Method (P-3558). Santa Monica, CA: RAND Corporation, March 1967. http://www.rand.org/content/dam/rand/pubs/papers/2008/P3558.pdf.
———. The Systemic Use of Expert Judgment in Operations Research (P-2795). Santa Monica, CA: RAND Corporation, September 1963. https://www.rand.org/content/dam/rand/pubs/papers/2008/P2795.pdf.
Hubbard, Douglas W. The Failure of Risk Management: Why It’s Broken and How to Fix It. Hoboken, NJ: John Wiley & Sons, 2009.
Hudson, Rex A. The Sociology and Psychology of Terrorism: Who Becomes a Terrorist and Why? Washington, DC: Federal Research Division, Library of Congress, September 1999.
Isaac, S., and W. B. Michael. Handbook in Research and Evaluation. San Diego, CA: EdITS Publishers, 1981.

379
Jackson, Brian A., Peter Chalk, R. Kim Cragin, Bruce Newsome, John V. Parachini, William Rosenau, Erin M. Simpson, Melanie Sisson, and Donald Temple. Breaching the Fortress Wall: Understanding Terrorist Efforts to Overcome Defensive Technologies. Santa Monica, CA: RAND Corporation, 2007. http://www.rand.org/content/dam/rand/pubs/monographs/2007/RAND_MG481.pdf.
Jackson, Brian A; and David R. Frelinger. Emerging Threats and Security Planning: How Should We Decide What Hypothetical Threats to Worry About? Santa Monica, CA: RAND Corporation, 2009. https://www.rand.org/content/dam/rand/pubs/occasional_papers/2009/RAND_OP256.pdf.
Joch, Alan. “Homeland Security’s High-Tech Gamble.” Federal Computer Week, November 12, 2007. https://fcw.com/Articles/2007/11/08/Homeland-Security146s-hightech-gamble.aspx.
———. “Is There a Future for Futures Trading?” Federal Computer Week, August 30, 2004. https://fcw.com/Articles/2004/08/30/Is-there-a-future-for-futures-trading.aspx.
Kahn, Herman. The Next 200 Years. New York: Morrow, 1976.
Kaplan, A., A. L. Skogstad, and M. A. Girshick. “The Prediction of Social and Technological Events.” Public Opinion Quarterly 14, no. 1 (January 1950): 93–110. https://doi.org/10.1086/266153.
Kappes, Melanie S., Margreth Keiler, Kirsten von Elverfeldt, and Thomas Glade. “Challenges of Analyzing Multi-Hazard Risk: A Review.” Natural Hazards 64 (2012): 1925–58.
Kayyem, Juliette N. “The Homeland Security Muddle.” The American Prospect 14, 10 (November 2003): 46–8.
Kirksey, Eben. “Who is Afraid of CRISPR Art?” Somatosphere, March 19, 2016. http://somatosphere.net/2016/03/who-is-afraid-of-CRISPR-art.html.
Kolliarakis, Georgios. “Politics, Security Technologies, and Civil Society: The Missing Links.” OpenDemocracy, October 29, 2015. https://www.opendemocracy.net/wfd/georgios-kolliarakis/politics-security-technologies-and-civil-society-missing-links.

380
Kuzmin, Joyce and Mark Gauthier. “Raytheon BBN Technologies Awarded Additional Funding to Enable Early Awareness of Emerging Technology: Program to Automate Big Data Search, Indexing and Analysis.” PR Newswire, May 28, 2013. http://www.prnewswire.com/news-releases/raytheon-bbn-technologies-awarded-additional-funding-to-enable-early-awareness-of-emerging-technology-209151691.html.
Landeta, Jon. “Current Validity of the Delphi Method in Social Sciences.” Technological Forecasting and Social Change 73 (2006): 467–82.
Lang, Trudi. “An Overview of Four Futures Methodologies.” Unpublished research paper, last modified Fall, 1994, http://citeseerx.ist.psu.edu/viewdoc/download?doi=10.1.1.455.1045&rep=rep1&type=pdf.
Lehman, Ronald F. “Unclear and Present Danger: The Strategic Implications of Latent, Dual-Use Science and Technology.” In Strategic Latency and World Power: How Technology is Changing Our Concepts of Security, edited by Zachary Davis, Ronald Lehman, and Michael Nacht. Livermore: Lawrence Livermore National Laboratory Center for Global Security Research, 2014. eBook edition, 5–21.
Li, Ye. “Online Information Markets and the Unintended Consequences of Internet Gambling Legislation.” U.S.-China Law Review 11 (2014): 1587–1608.
Linstone, Harold A., and Murray Turoff, editors. The Delphi Method: Techniques and Applications. Reading, MA: Addison-Wesley Publishing Company, 1975.
Locus. “1979 Locus Survey.” Locus 12, no. 10 (November 1979): 8–9.
———. “2016 Locus Survey Results.” Locus 77, no. 3 (September 2016): 66–68.
Longbine, Major David F. Red Teaming: Past and Present. Fort Leavenworth, KS: School of Advanced Military Studies, United States Army Command and General Staff College, 2008. http://indianstrategicknowledgeonline.com/web/2286.pdf.
Looney, Robert E. “DARPA’s Policy Analysis Market for Intelligence: Outside the Box or Off the Wall?” International Journal of Intelligence and CounterIntelligence 17 (2004): 405–19. http://www.au.af.mil/au/awc/awcgate/nps/pam/si_pam.pdf.
Lozada, Brian A. “The Emerging Technology of Predictive Analytics: Implications for Homeland Security.” Information Security Journal: A Global Perspective 23 (2014): 118–22. doi: pdf/10.1080/19393555.2014.972598.
Mandel, David R., and Alan Barnes. “Accuracy of Forecasts in Strategic Intelligence.” Proceedings of the National Academy of Sciences (PNAS) of the United States of America 111, no. 30 (July 29, 2014): 10984–9. doi: 10.1073/pnas.1406138111.

381
Mandel, Susan. “The Future of Threat Predictions.” Security Management, November 2008, 22–23. https://sm.asisonline.org/Pages/The-Future-of-Threat-Predictions.aspx.
Mannes, Albert E., Jack B. Soll, and Richard P. Larrick. “The Wisdom of Select Crowds.” Journal of Personality and Social Psychology 107, no. 2 (2014): 276–99. doi: 10.1037/a0036677.
Mateski, Mark. Red Teaming: A Short Introduction (1.0). RedTeamJournal.com, June 2009. http://redteamjournal.com/papers/A%20Short%20Introduction%20to%20Red%20Teaming%20(1dot0).pdf.
McCarthy, Ryan P. “Information Markets as Games of Chance.” University of Pennsylvania Law Review 155 (2007): 749–776.
Meadows, Donella H., Dennis Meadows, Jørgen Randers, and William W. Behrens III. The Limits to Growth. New York: Universe Books, 1972.
Mellers, Barbara, Eric Stone, Terry Murray, Angela Minster, Nick Rohrbaugh, Michael Bishop, Eva Chen, Joshua Baker, Yuan Hou, Michael Horowitz, Lyle Ungar, and Philip Tetlock. “Identifying and Cultivating Superforecasters as a Method of Improving Probabilistic Predictions.” Perspectives on Psychological Science 10, no. 3 (2015): 267–81. doi: 10.1177/1745691615577794.
Mellers, Barbara, Lyle Ungar, Jonathan Baron, Jaime Ramos, Burcu Gurcay, Katrina Fincher, Sydney E. Scott, Don Moore, Pavel Atanasov, Samuel A. Swift, Terry Murray, Eric Stone, and Philip E. Tetlock. “Psychological Strategies for Winning a Geopolitical Forecasting Tournament.” Psychological Science 25, no. 5 (March 2014): 1106–15. doi: 10.1177/0956797614524255.
Molitor, Graham T. T. “Forty Year Effort to Ascertain How Public Policy Evolves.” Journal of Futures Studies 5, issue 1 (August 2000): 79–86.
———. “How to Anticipate Public-Policy Changes.” S.A.M Advanced Management Journal (Summer 1977): 4–13. http://www.metafuture.org/articlesbycolleagues/graham%20mollitor/Molitor%20how%20to%20anticipate%20public-policy%20changes.pdf
Moore, Don A., Samuel A. Swift, Angela Minster, Barbara Mellers, Lyle Ungar, Philip Tetlock, Heather H. J. Yang, and Elizabeth R. Tenney. “Confidence Calibration in a Multiyear Geopolitical Forecasting Competition.” Management Science, Articles in Advance (August 22, 2016): 1–15. https://doi.org/10.1287/mnsc.2016.2525.

382
Morgan, Daniel. Research and Development in the Department of Homeland Security. CRS Report No. RL31941. Washington, DC: Congressional Research Service, June 20, 2003. http://research.policyarchive.org/1741.pdf.
Morning Edition. “Profile: DARPA Plan for Futures Market for Predicting Political Events and Terrorist Acts Gets Scrapped.” National Public Radio’s Morning Edition, aired July 30, 2003.
Mueller, John and Mark G. Stewart. Terror, Security, and Money: Balancing the Risks, Benefits, and Costs of Homeland Security. New York: Oxford University Press, 2011.
Murdick, Dewey. “Foresight and Understanding from Scientific Exposition (FUSE): Incisive Analysis Office.” Paper delivered at the 2011 Graph Exploitation Symposium, Lexington, MA, August 9–10, 2011. https://events.ll.mit.edu/graphex/sites/default/files/Day%202_1400_Murdick.pdf.
———. Portfolio Analysis & Review (PAR): FY16 PAR Close Out, FY17 PAR Introduction. Washington, DC: U.S. Department of Homeland Security Science and Technology Directorate, September 20, 2016. For Official Use Only document accessed on the DHS Intranet.
Murry, Jr., John W., and James O. Hammons. “Delphi: A Versatile Methodology for Conducting Qualitative Research.” The Review of Higher Education 18, no. 4 (Summer 1995): 423–36. doi: https://doi.org/10.1353/rhe.1995.0008.
Nacht, Michael. “What is Strategic Latency? an Introduction.” In Strategic Latency and World Power: How Technology is Changing Our Concepts of Security, edited by Zachary Davis, Ronald Lehman, and Michael Nacht. Livermore: Lawrence Livermore National Laboratory Center for Global Security Research, 2014. eBook edition, 4.
Nettles, A. Bentley. “The President Has No Clothes: The Case for Broader Application of Red Teaming within Homeland Security.” Master’s thesis, Naval Postgraduate School, June 2010.
Nicholls, Peter. “Prediction.” In The Encyclopedia of Science Fiction, edited by John Clute and Peter Nicholls, 957–58. 2nd ed. New York: St. Martin’s Press, 1995.
Nieto-Gómez, Rodrigo. “Power of ‘the Few’: A Key Strategic Challenge for the Permanently Disrupted High-Tech Homeland Security Environment.” Homeland Security Affairs 7, no. 18 (December 2011). https://www.hsaj.org/articles/50.
———. “Preventing the Next 9/10: The Homeland Security Challenges of Technological Evolution and Convergence in the Next Ten Years.” Homeland Security Affairs 7, no. 8 (September 2011).
383
Office of the Director of National Intelligence. “IARPA Launches New Program to Enable the Rapid Discovery of Emerging Technical Capabilities.” Washington, DC: Office of the Director of National Intelligence, September 27, 2011. https://www.dni.gov/index.php/newsroom/press-releases-2011/327–iarpa-launches-new-program-to-enable-the-rapid-discovery-of-emerging-capabilities.
Pandey, Pankaj and Einar Arthur Snekkenes. “Applicability of Prediction Markets in Information Security Risk Management.” Paper presented at the 25th International Workshop on Database and Expert Systems Applications, Munich, Germany, 2014. Conference Publishing Services (doi: 10.1109/DEXA.2014.66).
———. “Design and Performance Aspects of Information Security Prediction Markets for Risk Management.” Proceedings of the 12th International Conference on Security and Cryptography (SECRYPT-2015) (Science and Technology Publications, Ltd., 2015): 273–84.
Perry, Simon, Robert Apel, Graeme R. Newman, and Ronald V. Clarke. “The Situational Prevention of Terrorism: An Evaluation of the Israeli West Bank Barrier.” Original paper, Journal of Quantitative Criminology, June 20, 2016. doi 10.1007/s10940–016–9309–6.
Pill, Juri. “The Delphi Method: Substance, Context, a Critique and an Annotated Bibliography.” Socio-Economic Planning Sciences 5, no. 1 (February 1971): 57–71.
Possony, Stefan T., Jerry E. Pournelle, and Francis X. Kane. The Strategy of Technology. Self-published electronic edition, last modified 1997. https://www.jerrypournelle.com/slowchange/Strat.html.
Powell, Catherine. “The Delphi Technique: Myths and Realities.” Journal of Advanced Nursing 41, no. 4 (February 2003): 376–382.
Rescher, Nicolas. Predicting the Future: An Introduction to the Theory of Forecasting. Albany, NY: State University of New York Press, 1998.
———. The Future as an Object of Research. Santa Monica, CA: RAND Corporation, April 1967. http://www.dtic.mil/dtic/tr/fulltext/u2/651425.pdf.
Richey, Mason. “Thoughts on the Theory and Practice of Speculative Markets qua Event Predictors.” Essays in Philosophy, 6, 1 (2005): article 26.
Rijkens-Klomp, Nicole, and Patrick Van Der Duin. “Evaluating Local and National Public Foresight Studies From a User Perspective.” Futures 59 (2014): 18–26. http://dx.doi.org/10.1016/j.futures.2014.01.010.
Roland, Alex. War and Technology: A Very Short Introduction. New York: Oxford University Press, 2016.

384
Rowe, Gene, and George Wright. “The Delphi Technique as a Forecasting Tool: Issues and Analysis.” International Journal of Forecasting 15 (1999): 353–375.
Russell, Eric Frank. Wasp. London: Victor Gollancz, 2000.
Saaty, Thomas L., and Larry W. Boone. Embracing the Future: Meeting the Challenge of Our Changing World. New York: Praeger, 1990).
Sackman, H. Delphi Assessment: Expert Opinion, Forecasting, and Group Process (R-1283–PR). Santa Monica, CA: RAND Corporation, April 1974. http://www.rand.org/content/dam/rand/pubs/reports/2006/R1283.pdf.
Salo, Ahti, and Osmo Kuusi. “Parliamentary TA: Developments in Parliamentary Technology Assessment in Finland.” Science and Public Policy 28, no. 6 (December 2001): 453–64. doi: 032–3427/01/060453–12.
Satopää, Ville A., Jonathan Baron, Dean P. Foster, Barbara A. Mellers, Philip E. Tetlock, and Lyle H. Ungar. “Combining Multiple Probability Predictions Using a Simple Logit Model.” International Journal of Forecasting 30 (2014): 344–56. doi: 10.1016/j.ijforecast.2013.09.009.
Schwartz, Peter. The Art of the Long View. New York: Doubleday, 1996.
Seife, Charles. “´Terrorism Futures’ Could Have a Future, Experts Say.” Science, August 8, 2003.
Shea, Dana A. The DHS S&T Directorate: Selected Issues for Congress. CRS Report No. R43064. Washington, DC: Congressional Research Service, April 14, 2014. https://fas.org/sgp/crs/homesec/R43064.pdf.
Skroch, Michael J. Modeling and Simulation of Red Teaming, Part 1: Why Red Team M&S? (SAND 2009–7215 J, Rev 3). Albuquerque, NM: Sandia Corporation, November 2, 2009. http://umbra.sandia.gov/pdfs/resources/redteam.pdf.
Steele, Allen. “Hard Again.” New York Review of Science Fiction, June 1992, 1–4.
Strentz, Thomas. “A Terrorist Psychosocial Profile: Past and Present.” 57 FBI Law Enforcement Bulletin 13. Quantico, VA: FBI Academy Behavioral Science Instruction and Research Unit, April 1988. 13–19.
Surowiecki, James. The Wisdom of Crowds: Why the Many Are Smarter Than the Few and How Collective Wisdom Shapes Business, Economies, Societies and Nations. New York: Doubleday, 2004.
Terry, P. T. “Mechanisms for Environmental Scanning.” Long Range Planning 10, no. 3 (June 1977): 2–9. doi: 10.1016/0024–6301(77)90079–6.

385
Tetlock, Philip and Dan Gardner. “Keeping the Forecasters’ Eyes on the Ball.” Daily Telegraph, October 31, 2015.
———. Superforecasting: The Art and Science of Prediction. New York: Crown, 2015.
Tetlock, Philip E., Barbara A. Mellers, and J. Peter Scoblic. “Bringing Probability Judgments in Policy Debates Via Forecasting Tournaments.” Science 355 (February 3, 2017): 481–3. doi: 10.1126/science.aal3147.
The 9/11 Commission Report: Final Report of the National Commission on Terrorist Attacks Upon the United States, Authorized Edition. New York: W. W. Norton & Company, 2004. Kindle.
Toffler, Alvin. Future Shock. New York: Random House, 1970.
———, editor. The Futurists. New York: Random House, 1972.
Tziralis, Georgios and Ilias Tatsiopoulos. “Prediction Markets: An Extended Literature Review.” The Journal of Prediction Markets 1 (2007): 75–91.
United Kingdom Development, Concepts and Doctrine Center. Red Teaming Guide (2nd Edition). Swindon, Wiltshire, UK: The Development, Concepts and Doctrine Center, Shrivenham, Ministry of Defense, January 2013). https://www.gov.uk/government/publications/a-guide-to-red-teaming.
University of Foreign Military and Cultural Studies. Red Team Handbook (version 6.0). Leavenworth, KS: University of Foreign Military and Cultural Studies, April 2012. http://www.au.af.mil/au/awc/awcgate/army/ufmcs_red_team_handbook_apr2012.pdf.
University of Foreign Military and Cultural Studies Center for Applied Critical Thinking. The Applied Critical Thinking Handbook (formerly the Red Team Handbook) (version 8.1). Leavenworth, KS: University of Foreign Military and Cultural Studies, September 2016. http://usacac.army.mil/sites/default/files/documents/ufmcs/The_Applied_Critical_Thinking_Handbook_v8.1.pdf.
U.S. Department of Homeland Security Office of Inspector General. The Science and Technology Directorate’s Processes for Selecting and Managing Research and Development Programs. OIG-08–85. Washington, DC: U.S. Department of Homeland Security, Office of Inspector General, August 2008. https://archive.org/details/241114–oig-08–85–the-science-and-technology.

386
U.S. Department of Homeland Security Science and Technology Directorate. 2011 S&T Portfolio Review Agenda with Program Manager Names. Washington, DC: U.S. Department of Homeland Security Science and Technology Directorate, February 2011. For Official Use Only document accessed on the DHS Intranet.
———. 2013 DHS S&T Portfolio Review: S&T Project Briefing Workbook. Washington, DC: U.S. Department of Homeland Security Science and Technology Directorate, September 2003. For Official Use Only document accessed on the DHS Intranet.
———. 2014 DHS S&T Portfolio Review Final Analysis: Briefing Document for S&T Leadership. Washington, DC: U.S. Department of Homeland Security Science and Technology Directorate, May 2015. For Official Use Only document accessed on the DHS Intranet.
———. Science and Technology Directorate Review 2014. Washington, DC: U.S. Department of Homeland Security Science and Technology Directorate, 2014. Accessed on the DHS Intranet.
———. Science and Technology Directorate Strategic Plan 2015–2019. Washington, DC: U.S. Department of Homeland Security Science and Technology Directorate, 2014. Accessed on the DHS Intranet.
———. Science & Technology Strategy to Make the Nation Safer. Washington, DC: U.S. Department of Homeland Security Science and Technology Directorate, June 2007. Accessed on the DHS Intranet.
Vander Laenen, Freya. “Not Just Another Focus Group: Making the Case for the Nominal Group Technique in Criminology.” Crime Science 4, no. 5 (2015): 1–12. doi: 10.1186/s40163–014–0016–z.
Victoroff, Jeff. “The Mind of the Terrorist: A Review and Critique of Psychological Approaches.” Journal of Conflict Resolution 49, no. 1 (February 2005): 3–42.
Webb, Amy. The Signals Are Talking: Why Today’s Fringe Is Tomorrow’s Mainstream. Philadelphia, PA: PublicAffairs/Perseus Books, 2016.
Weber, K. Matthias, Jennifer Cassingena Harper, Totti Könnölä, and Vicente Carabias Barceló. “Coping with a Fast-changing World: Towards New Systems of Future-oriented Technology Analysis.” Science and Public Policy 39 (March 11, 2012): 153–65.
Weigle, Colonel Brett D. “Prediction Markets: Another Tool in the Intelligence Kitbag.” Master’s thesis, U.S. Army War College, 2007.
Wolfers, Justin and Eric Zitzewitz. “Five Open Questions about Prediction Markets” (NBER Working Paper 12060). Washington, DC: National Bureau of Economic Research, February 2006. doi: 10.3386/w12060.

387
Wood, Leonard. “Who Buys Science Fiction?” Publishers Weekly. November 4, 1988.
Worthen, B. R., and J. R. Sanders. Educational Evaluation: Alternative Approaches and Practical Guidelines. New York: Longman, 1987.
Woudenberg, Fred. “An Evaluation of Delphi.” Technological Forecasting and Social Change 40 (1991): 131–50.
Wright, George, Gene Rowe, Fergus Bolger, and John Gammack. “Coherence, Calibration, and Expertise in Judgmental Probability Forecasting.” Organizational Behavior and Human Decision Processes 57 (1994): 1–25.
Wyckoff, Kristin L. “Solving Homeland Security’s Wicked Problems: A Design Thinking Approach.” Master’s thesis, Naval Postgraduate School, 2015.
Wyden, Senator Ron, and Senator Byron Dorgan. “Wyden, Dorgan Call for Immediate Halt to Tax-Funded ‘Terror Market’ Scheme.” Press release. Washington, DC: Offices of Senators Ron Wyden and Byron Dorgan, July 28, 2003. http://wyden.senate.gov/media/2003/print/print_07282003_terrormarket.html.
Yousuf, Muhammad Imran. “Using Experts’ Opinions Through Delphi Technique.” Practical Assessment, Research & Evaluation 12, no. 4 (May 2007): 1–8. http://pareonline.net/getvn.asp?v=12&n=4.
Zelazny, Roger. “Forum: Some Science Fiction Parameters: A Biased View.” Galaxy 36 (July 1975): 6–11.
Zverina, Jan. “SDSC Announces ‘Center of Excellence’ for Predictive Analytics.” UC San Diego News Center, April 17, 2012. http://ucsdnews.ucsd.edu/pressrelease/sdsc_announces_center_of_excellence_for_predictive_analytics.

388
THIS PAGE IS LEFT INTENTIONALLY BLANK

389
INITIAL DISTRIBUTION LIST
1. Defense Technical Information Center Ft. Belvoir, Virginia 2. Dudley Knox Library Naval Postgraduate School Monterey, California
Copyright © 2022 FDOKUMEN