
Marketing research and integrated marketing communication ...
Upload
khangminh22Category
view
0download
0
This is a special edition of an established title widely used by colleges and universities throughout the world. Pearson published this exclusive edition for the benefit of students outside the United States and Canada. If you purchased this book within the United States or Canada, you should be aware that it has been imported without the approval of the Publisher or Author.
Pearson Global Edition
GlobAl edITIon
For these Global editions, the editorial team at Pearson has collaborated with educators across the world to address a wide range of subjects and requirements, equipping students with the best possible learning tools. This Global edition preserves the cutting-edge approach and pedagogy of the original, but also features alterations, customization, and adaptation from the north American version.
GlobAl edITIon
Marketing Research
Marketing ResearcheIGHTH edITIon
Alvin C. Burns • Ann Veeck • Ronald F. BushG
lob
Al
edIT
Ion
Burns • Veeck • BusheIG
HT
H
edIT
Ion
Burns_08_1292153261_Final.indd 1 18/08/16 6:54 AM

1. Features to make reading more interesting
FEATURE DESCRIPTION BENEFIT
Opening vignettes Each chapter begins with a short description of a marketing research company’s features or an organization’s services such how firms deal with survey data quality.
Previews the material in the textbook by showing you how it is used in marketing research
Current insights from indus-try professionals
“War stories” and recommendations from seasoned practitioners of marketing research
Illustrates how the technique or theory should be applied or gives some hints on ways to use it effectively
Global Applications Examples of global marketing research in action Fosters awareness that over one-half of marketing research is per-formed in international markets
Ethical Considerations Situations that show how ethical marketing researchers behave using the actual code of marketing research standards adopted by the Marketing Research Association
Reveals that marketing researchers are aware of ethical dilemmas and seek to act honorably
Practical Applications “Nuts and bolts” examples of how marketing research is performed and features new techniques such as neuromarketing
Gives a “learning by seeing” perspective on real-world marketing research practice
Digital Marketing Research Applications
Information is provided on how technology is impacting marketing research both as a source of information and the creation of new products designed to cultivate the information
You will see how new innovations create opportunities for mar-keting research firms to add new services designed to provide information created by the new information sources
2. Features to help you study for exams
FEATURE DESCRIPTION BENEFIT
Chapter objectives Bulleted items listing the major topics and issues addressed in the chapter
Alerts you to the major topics that you should recall after reading the chapter
Marginal notes One-sentence summaries of key concepts Reminds you of the central point of the material in that section
Chapter summaries Summaries of the key points in the chapter Reminds you of the chapter highlights
Key terms Important terms defined within the chapter and listed at the end of the chapter.
Helps you assess your knowledge of the chapter material and review key topics
Review questions Assessment questions to challenge your understanding of the theories and topics covered within the chapter
Assists you in learning whether you know what you need to know about the major topics presented in the chapter
Companion website The student resources on this website include chapter outlines, case study hints, online tests, and PowerPoint slides
Offers online pre- and post-tests, PowerPoint files, case study hints, and SPSS tutorials and datasets
3. Elements that help you apply the knowledge you’ve gained
FEATURE DESCRIPTION BENEFIT
End-of-chapter cases Case studies that ask you to apply the material you’ve learned in the chapter
Helps you learn how to use the material that sometimes must be customized for a particular marketing research case
Synthesize Your Learning Exercises that ask you to apply and integrate material from across three to four chapters
• Overcomes the “silo effect” of studying chapters in isolation• Enhances learning by showing you how topics and concepts are
related across chapters
Integrated Case A case study running throughout the book which you study through end-of-chapter exercises
• Simulates a real-world marketing research project running across most of the steps in the marketing research process
• Shows you the execution of an entire marketing research project
Integration of IBM SPSS Statistics Version 23
The most widely adopted statistical analysis program in the world, with annotated screenshots and output, plus step-by-step “how to do it” instructions
Teaches you the statistical analysis program that is the standard of the marketing research industry.
Online SPSS datasets SPSS data sets for cases in the textbook, including the integrated case at www.pearsonglobaleditions.com/Burns
• Offers easy access to SPSS datasets that you can use without worrying about set-up or clean-up
• Provides good models for SPSS datasets
SPSS student assistant Stand-alone modules with animation and annotated screen shots to show you how to use many SPSS features at www.pearsonglobaleditions.com/Burns
Handy reference for many SPSS functions and features, including statistical analyses
A BriEF GuidE to GEttinG thE Most FroM this Book
Burns_08_1292153261_IFC_Final.indd 1 18/08/16 6:57 AM

E I G H T H E D I T I O NG L O B A L E D I T I O N
MARKETING RESEARCH
A01_BURN3261_08_GE_FM.indd 1A01_BURN3261_08_GE_FM.indd 1 30/08/16 1:29 pm30/08/16 1:29 pm

A01_MISH4182_11_GE_FM.indd 6 10/06/15 11:46 am
This page intentionally left blank

Alvin C. Burns Louisiana State University
Ann Veeck Western Michigan University
Ronald F. Bush University of West Florida
MARKETING RESEARCH
E I G H T H E D I T I O N G L O B A L E D I T I O N
Harlow, England • London • New York • Boston • San Francisco • Toronto • Sydney • Dubai • Singapore • Hong Kong
Tokyo • Seoul • Taipei • New Delhi • Cape Town • Sao Paulo • Mexico City • Madrid • Amsterdam • Munich • Paris • Milan
A01_BURN3261_08_GE_FM.indd 3A01_BURN3261_08_GE_FM.indd 3 06/09/16 1:21 PM06/09/16 1:21 PM

Vice President, Business Publishing: Donna Battista
Editor-in-Chief: Stephanie Wall
Editor-in-Chief: Ashley Dodge
Senior Sponsoring Editor: Neeraj Bhalla
Editorial Assistant: Eric Santucci
Managing Editor, Global Edition: Steven Jackson
Associate Acquisitions Editor, Global Edition: Ishita Sinha
Vice President, Product Marketing: Maggie
Moylan
Director of Marketing, Digital Services and Products: Jeanette Koskinas
Field Marketing Manager: Lenny Ann Raper
Product Marketing Assistant: Jessica Quazza
Team Lead, Program Management: Ashley Santora
Team Lead, Project Management: Jeff Holcomb
Project Manager: Becca Groves
Project Manager, Global Edition: Sudipto Roy
Senior Manufacturing Controller, Global Edition: Trudy Kimber
Media Production Manager, Global Edition: Vikram Kumar
Operations Specialist: Carol Melville
Creative Director: Blair Brown
Art Director: Janet Slowik
Vice President, Director of Digital Strategy and Assessment: Paul Gentile
Manager of Learning Applications: Paul DeLuca
Full-Service Project Management, Composition and Design: Cenveo ® Publisher Services
Cover Image: BestPhotoStudio/Shutterstock
Microsoft and/or its respective suppliers make no representations about the suitability of the information contained in the documents and related
graphics published as part of the services for any purpose. All such documents and related graphics are provided “as is” without warranty of
any kind. Microsoft and/or its respective suppliers hereby disclaim all warranties and conditions with regard to this information, including all
warranties and conditions of merchantability, whether express, implied or statutory, fitness for a particular purpose, title and non-infringement.
In no event shall Microsoft and/or its respective suppliers be liable for any special, indirect or consequential damages or any damages whatsoever
resulting from loss of use, data or profits, whether in an action of contract, negligence or other tortious action, arising out of or in connection with
the use or performance of information available from the services.
The documents and related graphics contained herein could include technical inaccuracies or typographical errors. Changes are periodically
added to the information herein. Microsoft and/or its respective suppliers may make improvements and/or changes in the product(s) and/or the
program(s) described herein at any time. Partial screen shots may be viewed in full within the software version specified.
Microsoft ® and Windows ® are registered trademarks of the Microsoft Corporation in the U.S.A. and other countries. This book is not sponsored or
endorsed by or affiliated with the Microsoft Corporation.
IBM, the IBM logo, ibm.com, and SPSS are trademarks or registered trademarks of International Business Machines Corporation,registered
in many jurisdictions worldwide. Other product and service names might be trademarks of IBM or other companies. A current list of IBM
trademarks is available on the Web at “IBM Copyright and trademark information” at www.ibm.com/legal/copytrade.shtml.
Acknowledgments of third-party content appear on the appropriate page within the text.
Pearson Education Limited
Edinburgh Gate
Harlow
Essex CM20 2JE
England
and Associated Companies throughout the world
Visit us on the World Wide Web at: www.pearsonglobaleditions.com
© Pearson Education Limited 2017
The rights of Alvin C. Burns, Ann Veeck, and Ronald F. Bush to be identified as the authors of this work have been asserted by them in
accordance with the Copyright, Designs and Patents Act 1988.
Authorized adaptation from the United States edition, entitled Marketing Research, 8th Edition, ISBN 978-0-13-416740-4 by Alvin C. Burns, Ann Veeck, and Ronald F. Bush, published by Pearson Education © 2017.
All rights reserved. No part of this publication may be reproduced, stored in a retrieval system, or transmitted in any form or by any means,
electronic, mechanical, photocopying, recording or otherwise, without either the prior written permission of the publisher or a license permitting
restricted copying in the United Kingdom issued by the Copyright Licensing Agency Ltd, Saffron House, 6–10 Kirby Street, London EC1N 8TS.
All trademarks used herein are the property of their respective owners. The use of any trademark in this text does not vest in the author or publisher any
trademark ownership rights in such trademarks, nor does the use of such trademarks imply any affiliation with or endorsement of this book by such owners.
ISBN 10: 1-29-215326-1 ISBN 13: 978-1-292-15326-1
British Library Cataloguing-in-Publication Data A catalogue record for this book is available from the British Library
10 9 8 7 6 5 4 3 2 1
Typeset in Times LT Pro by Cenveo Publishing Services
Printed and bound by Vivar in Malaysia
A01_BURN3261_08_GE_FM.indd 4A01_BURN3261_08_GE_FM.indd 4 30/08/16 1:29 pm30/08/16 1:29 pm

Only we know how much our spouses, Jeanne, Greg, and Libbo, have sacrificed during the times we have devoted to this book. We are fortunate in that, for all of us, our spouses are our best friends and smiling supporters.
Al Burns, Louisiana State University
Ann Veeck, Western Michigan University
Ron Bush, University of West Florida
A01_BURN3261_08_GE_FM.indd 5A01_BURN3261_08_GE_FM.indd 5 30/08/16 1:29 pm30/08/16 1:29 pm

Preface 21
Chapter 1 Introduction to Marketing Research 32
Chapter 2 The Marketing Research Industry 48
Chapter 3 The Marketing Research Process and Defining the Problem and Research Objectives 66
Chapter 4 Research Design 90
Chapter 5 Secondary Data and Packaged Information 114
Chapter 6 Qualitative Research Techniques 142
Chapter 7 Evaluating Survey Data Collection Methods 170
Chapter 8 Understanding Measurement, Developing Questions, and Designing the Questionnaire 204
Chapter 9 Selecting the Sample 236
Chapter 10 Determining the Size of a Sample 262
Chapter 11 Dealing with Fieldwork and Data Quality Issues 288
Chapter 12 Using Descriptive Analysis, Performing Population Estimates, and Testing Hypotheses 314
Chapter 13 Implementing Basic Differences Tests 350
Chapter 14 Making Use of Associations Tests 376
Chapter 15 Understanding Regression Analysis Basics 406
Chapter 16 The Research Report 432
Endnotes 461
Name Index 477
Subject Index 481
Brief Contents
6
A01_BURN3261_08_GE_FM.indd 6A01_BURN3261_08_GE_FM.indd 6 30/08/16 1:29 pm30/08/16 1:29 pm

Preface 21
Chapter 1 Introduction to Marketing Research 32 1- 1 Marketing Research Is Part of Marketing 34
The Philosophy of the Marketing Concept Guides Managers’ Decisions 36 The “Right” Marketing Strategy 36
1- 2 What Is Marketing Research? 37 Is It Market ing Research or Market Research? 37 The Function of Marketing Research 37
1- 3 What Are the Uses of Marketing Research? 38 Identifying Market Opportunities and Problems 38 Generating, Refining, and Evaluating Potential Marketing Actions 38
Selecting Target Markets 39 Product Research 39 Pricing Research 39 Promotion Research 39 Distribution Research 39
Monitoring Marketing Performance 40 Improving Marketing as a Process 40 Marketing Research Is Sometimes Wrong 41
1- 4 The Marketing Information System 41 Components of an MIS 42
Internal Reports System 42 Marketing Intelligence System 42 Marketing Decision Support System (DSS) 42 Marketing Research System 43
Summary 44 • Key Terms 45 • Review Questions/Applications 45 Case 1. 1 Anderson Construction 46 Case 1. 2 Integrated Case: Auto Concepts 46
Chapter 2 The Marketing Research Industry 48 2- 1 Evolution of an Industry 50
Earliest Known Studies 50 Why Did the Industry Grow? 50 The 20th Century Led to a “Mature Industry” 51
2- 2 Who Conducts Marketing Research? 51 Client-Side Marketing Research 51 Supply-Side Marketing Research 53
2- 3 The Industry Structure 53 Firm Size by Revenue 53 Types of Firms and Their Specialties 54 Industry Performance 54
Contents
7
A01_BURN3261_08_GE_FM.indd 7A01_BURN3261_08_GE_FM.indd 7 30/08/16 1:29 pm30/08/16 1:29 pm

8 CONTENTS
2- 4 Challenges to the Marketing Research Industry 56 New and Evolving Sources of Data and Methods 56 Effective Communication of Results 58 Need for Talented and Skilled Employees 58
2- 5 Industry Initiatives 58 Industry Performance Initiatives 58
Best Practices 58 Maintaining Public Credibility of Research 58 Monitoring Industry Trends 59 Improving Ethical Conduct 59 Certification of Qualified Research Professionals 60 Continuing Education 61
2- 6 A Career in Marketing Research 62 Where You’ve Been and Where You’re Headed! 63
Summary 63 • Key Terms 63 • Review Questions/Applications 64 Case 2. 1 Heritage Research Associates 64
Chapter 3 The Marketing Research Process and Defining the Problem and Research Objectives 66 3- 1 The Marketing Research Process 67
The 11-Step Process 67 Caveats to a Step-by-Step Process 68
Why 11 Steps? 68 Not All Studies Use All 11 Steps 69 Steps Are Not Always Followed in Order 69
Introducing “Where We Are” 69 Step 1: Establish the Need for Marketing Research 69
The Information Is Already Available 70 The Timing Is Wrong to Conduct Marketing Research 70 Costs Outweigh the Value of Marketing Research 71
Step 2: Define the Problem 71 Step 3: Establish Research Objectives 71 Step 4: Determine Research Design 72 Step 5: Identify Information Types and Sources 72 Step 6: Determine Methods of Accessing Data 72 Step 7: Design Data Collection Forms 72 Step 8: Determine the Sample Plan and Size 73 Step 9: Collect Data 73 Step 10: Analyze Data 73 Step 11: Prepare and Present the Final Research Report 74
3- 2 Defining the Problem 74 1. Recognize the Problem 75
Failure to Meet an Objective 75 Identification of an Opportunity 75
2. Understand the Background of the Problem 76 Conduct a Situation Analysis 76 Clarify the Symptoms 77 Determine the Probable Causes of the Symptom 77 Determine Alternative Decisions 78
A01_BURN3261_08_GE_FM.indd 8A01_BURN3261_08_GE_FM.indd 8 30/08/16 1:29 pm30/08/16 1:29 pm

CONTENTS 9
3. Determine What Decisions Need to Be Made 78 Specify Decision Alternatives 78 Weigh the Alternatives 78
4. Identify What Additional Information Is Needed 79 Inventory the Current Information State 79 Identify the Information Gaps 79
5. Formulate the Problem Statement 80
3- 3 Research Objectives 80 Using Hypotheses 81 Defining Constructs 81
What Is the Unit of Measurement? 82 What Is the Proper Frame of Reference? 83
3- 4 Action Standards 83 Impediments to Problem Definition 84
3- 5 The Marketing Research Proposal 85 Elements of the Proposal 85 Ethical Issues and the Research Proposal 86
Summary 86 • Key Terms 87 • Review Questions/Applications 87 Case 3. 1 Golf Technologies, Inc. 88 Case 3. 2 Integrated Case: Auto Concepts 89
Chapter 4 Research Design 90 4- 1 Research Design 92
Why Is Knowledge of Research Design Important? 92
4- 2 Three Types of Research Designs 93 Research Design: A Caution 94
4- 3 Exploratory Research 94 Uses of Exploratory Research 95
Gain Background Information 95 Define Terms 95 Clarify Problems and Hypotheses 95 Establish Research Priorities 96
Methods of Conducting Exploratory Research 96 Secondary Data Analysis 96 Experience Surveys 96 Case Analysis 96 Focus Groups 98
4- 4 Descriptive Research 98 Classification of Descriptive Research Studies 99
4- 5 Causal Research 102 Experiments 102 Experimental Design 103
Before-After with Control Group 104 How Valid Are Experiments? 105 Types of Experiments 106
4- 6 Test Marketing 107 Types of Test Markets 107
Standard Test Market 107 Controlled Test Markets 107
A01_BURN3261_08_GE_FM.indd 9A01_BURN3261_08_GE_FM.indd 9 30/08/16 1:29 pm30/08/16 1:29 pm

10 CONTENTS
Electronic Test Markets 108 Simulated Test Markets 109
Selecting Test-Market Cities 109 Pros and Cons of Test Marketing 109
Summary 110 • Key Terms 111 • Review Questions/Applications 111 Case 4. 1 Memos from a Researcher 112
Chapter 5 Secondary Data and Packaged Information 114 5- 1 Big Data 116 5- 2 Primary Versus Secondary Data 116
Uses of Secondary Data 118
5- 3 Classification of Secondary Data 119 Internal Secondary Data 119 External Secondary Data 120
Published Sources 122 Official Statistics 123 Data Aggregators 124
5- 4 Advantages and Disadvantages of Secondary Data 124 Advantages of Secondary Data 124 Disadvantages of Secondary Data 124
Incompatible Reporting Units 124 Mismatched Measurement Units 124 Unusable Class Definitions 125 Outdated Data 125
5- 5 Evaluating Secondary Data 125 What Was the Purpose of the Study? 125 Who Collected the Information? 126 What Information Was Collected? 126 How Was the Information Obtained? 126 How Consistent Is the Information with Other Information? 128
5- 6 The American Community Survey 128 5- 7 What Is Packaged Information? 129
Syndicated Data 129 Packaged Services 131
5- 8 Advantages and Disadvantages of Packaged Information 132
Syndicated Data 132 Packaged Services 132
5- 9 Applications of Packaged Information 132 Measuring Consumer Attitudes and Opinions 133 Market Segmentation 133 Monitoring Media Usage and Promotion Effectiveness 133 Market Tracking Studies 134
5- 10 Social Media Data 134 Types of Information 134
Reviews 135 Tips 135 New Uses 135 Competitor News 135
Advantages and Disadvantages of Social Media Data 135 Tools to Monitor Social Media 136
A01_BURN3261_08_GE_FM.indd 10A01_BURN3261_08_GE_FM.indd 10 30/08/16 1:29 pm30/08/16 1:29 pm

CONTENTS 11
5- 11 Internet of Things 136 Summary 138 • Key Terms 139 • Review Questions/Applications 139 Case 5. 1 The Men’s Market for Athleisure 140
Chapter 6 Qualitative Research Techniques 142 6- 1 Quantitative, Qualitative, and Mixed Methods Research 143 6- 2 Observation Techniques 146
Types of Observation 146 Direct Versus Indirect 146 Covert Versus Overt 147 Structured Versus Unstructured 147 In Situ Versus Invented 147
Appropriate Conditions for the Use of Observation 147 Advantages of Observational Data 148 Limitations of Observational Data 148
6- 3 Focus Groups 149 How Focus Groups Work 150 Online Focus Groups 151 Advantages of Focus Groups 151 Disadvantages of Focus Groups 152 When Should Focus Groups Be Used? 152 When Should Focus Groups Not Be Used? 152 Some Objectives of Focus Groups 152 Operational Aspects of Traditional Focus Groups 153
How Many People Should Be in a Focus Group? 153 Who Should Be in the Focus Group? 153 How Many Focus Groups Should Be Conducted? 154 How Should Focus Group Participants Be Recruited and Selected? 154 Where Should a Focus Group Meet? 154 When Should the Moderator Become Involved in the Research Project? 155 How Are Focus Group Results Reported and Used? 155 What Other Benefits Do Focus Groups Offer? 155
6- 4 Ethnographic Research 156 Mobile Ethnography 156 Netnography 157
6- 5 Marketing Research Online Communities 158 6- 6 Other Qualitative Research Techniques 159
In-Depth Interviews 159 Protocol Analysis 160 Projective Techniques 161
Word-Association Test 161 Sentence-Completion Test 161 Picture Test 162 Cartoon or Balloon Test 162 Role-Playing Activity 162
Neuromarketing 163 Neuroimaging 163
A01_BURN3261_08_GE_FM.indd 11A01_BURN3261_08_GE_FM.indd 11 30/08/16 1:29 pm30/08/16 1:29 pm

12 CONTENTS
Eye Tracking 164 Facial Coding 164 The Controversy 164
Still More Qualitative Techniques 164
Summary 166 • Key Terms 167 • Review Questions/Applications 167 Case 6. 1 The College Experience 168 Case 6. 2 Integrated Case: Auto Concepts 169
Chapter 7 Evaluating Survey Data Collection Methods 170 7- 1 Advantages of Surveys 172 7- 2 Modes of Data Collection 174
Data Collection and Impact of Technology 174 Person-Administered Surveys 175
Advantages of Person-Administered Surveys 175 Disadvantages of Person-Administered Surveys 176
Computer-Assisted Surveys 177 Advantages of Computer-Assisted Surveys 177 Disadvantages of Computer-Assisted Surveys 177
Self-Administered Surveys 178 Advantages of Self-Administered Surveys 178 Disadvantages of Self-Administered Surveys 178
Computer-Administered Surveys 179 Advantages of Computer-Administered Surveys 179 Disadvantage of Computer-Administered Surveys 180
Mixed-Mode Surveys 180 Advantage of Mixed-Mode Surveys 180 Disadvantages of Mixed-Mode Surveys 180
7- 3 Descriptions of Data Collection Methods 181 Person-Administered/Computer-Assisted Interviews 182
In-Home Surveys 182 Mall-Intercept Surveys 183 In-Office Surveys 184 Telephone Surveys 184
Computer-Administered Interviews 188 Fully Automated Survey 188 Online Surveys 189
Self-Administered Surveys 191 Group Self-Administered Survey 191 Drop-Off Survey 191 Mail Survey 192
7- 4 Working with a Panel Company 193 Advantages of Using a Panel Company 194 Disadvantages of Using a Panel Company 194 Top Panel Companies 195
7- 5 Choice of the Survey Method 196 How Fast Is the Data Collection? 197 How Much Does the Data Collection Cost? 197 How Good Is the Data Quality? 197 Other Considerations 198
A01_BURN3261_08_GE_FM.indd 12A01_BURN3261_08_GE_FM.indd 12 30/08/16 1:29 pm30/08/16 1:29 pm

Summary 199 • Key Terms 200 • Review Questions/Applications 200 Case 7. 1 Machu Picchu National Park Survey 201 Case 7. 2 Advantage Research, Inc. 202
Chapter 8 Understanding Measurement, Developing Questions, and Designing the Questionnaire 204 8- 1 Basic Measurement Concepts 205 8- 2 Types of Measures 206
Nominal Measures 206 Ordinal Measures 207 Scale Measures 207
8- 3 Interval Scales Commonly Used in Marketing Research 209 The Likert Scale 209 The Semantic Differential Scale 210 The Stapel Scale 212 Two Issues with Interval Scales Used in Marketing Research 213 The Scale Should Fit the Construct 214
8- 4 Reliability and Validity of Measurements 215 8- 5 Designing a Questionnaire 216
The Questionnaire Design Process 216
8- 6 Developing Questions 217 Four Dos of Question Wording 218
The Question Should Be Focused on a Single Issue or Topic 218 The Question Should Be Brief 218 The Question Should Be Grammatically Simple 218 The Question Should Be Crystal Clear 219
Four Do Not’s of Question Wording 219 Do Not “Lead” the Respondent to a Particular Answer 219 Do Not Use “Loaded” Wording or Phrasing 220 Do Not Use a “Double-Barreled” Question 220 Do Not Use Words That Overstate the Case 220
8- 7 Questionnaire Organization 222 The Introduction 223
Who is Doing the Survey? 223 What is the Survey About? 223 How did You Pick Me? 223 Motivate Me to Participate 223 Am I Qualified to Take Part? 224
Question Flow 224
8- 8 Computer-Assisted Questionnaire Design 227 Question Creation 227 Skip and Display Logic 228 Data Collection and Creation of Data Files 228 Ready-Made Respondents 228 Data Analysis, Graphs, and Downloading Data 228
8- 9 Finalize the Questionnaire 229 Coding the Questionnaire 229 Pretesting the Questionnaire 230
Summary 232 • Key Terms 232 • Review Questions/Applications 233
CONTENTS 13
A01_BURN3261_08_GE_FM.indd 13A01_BURN3261_08_GE_FM.indd 13 30/08/16 1:29 pm30/08/16 1:29 pm

Case 8. 1 Extreme Exposure Rock Climbing Center Faces The Krag 234 Case 8. 2 Integrated Case: Auto Concepts 235
Chapter 9 Selecting the Sample 236 9- 1 Basic Concepts in Samples and Sampling 238
Population 238 Census 238 Sample and Sample Unit 239 Sample Frame and Sample Frame Error 239 Sampling Error 240
9- 2 Reasons for Taking a Sample 240 9- 3 Probability Versus Nonprobability Sampling Methods 241 9- 4 Probability Sampling Methods 242
Simple Random Sampling 242 Systematic Sampling 245 Cluster Sampling 248 Stratified Sampling 250
9- 5 Nonprobability Sampling Methods 253 Convenience Samples 253 Purposive Samples 255 Chain Referral Samples 256 Quota Samples 256
9- 6 Online Sampling Techniques 256 Online Panel Samples 257 River Samples 257 Email List Samples 257
9- 7 Developing a Sample Plan 257 Summary 258 • Key Terms 258 • Review Questions/Applications 259 Case 9. 1 Peaceful Valley Subdivision: Trouble in Suburbia 260 Case 9. 2 Jet’s Pets 261
Chapter 10 Determining the Size of a Sample 262 10- 1 Sample Size Axioms 265 10- 2 The Confidence Interval Method of Determining Sample Size 265
Sample Size and Accuracy 266 p and q: The Concept of Variability 267 The Concept of a Confidence Interval 269 How Population Size ( N ) Affects Sample Size 271
10- 3 The Sample Size Formula 271 Determining Sample Size via the Confidence Interval Formula 271
Variability: p × q 272 Acceptable Margin of Sample Error: e 272 Level of Confidence: z 272
10- 4 Practical Considerations in Sample Size Determination 274
How to Estimate Variability in the Population 275 How to Determine the Amount of Acceptable Sample Error 275
14 CONTENTS
A01_BURN3261_08_GE_FM.indd 14A01_BURN3261_08_GE_FM.indd 14 05/09/16 10:55 AM05/09/16 10:55 AM

CONTENTS 15
How to Decide on the Level of Confidence 275 How to Balance Sample Size with the Cost of Data Collection 276
10- 5 Other Methods of Sample Size Determination 276 Arbitrary “Percent Rule of Thumb” Sample Size 277 Conventional Sample Size Specification 278 Statistical Analysis Requirements Sample Size Specification 278 Cost Basis of Sample Size Specification 279
10- 6 Three Special Sample Size Determination Situations 280 Sampling from Small Populations 280 Sample Size Using Nonprobability Sampling 281 Sampling from Panels 283
Summary 283 • Key Terms 284 • Review Questions/Applications 284 Case 10. 1 Target: Deciding on the Number of Telephone Numbers 286 Case 10. 2 Scope Mouthwash 287
Chapter 11 Dealing with Fieldwork and Data Quality Issues 288 11- 1 Data Collection and Nonsampling Error 289 11- 2 Possible Errors in Field Data Collection 290
Intentional Fieldworker Errors 290 Unintentional Fieldworker Errors 291 Intentional Respondent Errors 293 Unintentional Respondent Errors 293
11- 3 Field Data Collection Quality Controls 296 Control of Intentional Fieldworker Error 296 Control of Unintentional Fieldworker Error 297 Control of Intentional Respondent Error 298 Control of Unintentional Respondent Error 299 Final Comment on the Control of Data Collection Errors 299
11- 4 Nonresponse Error 300 Refusals to Participate in the Survey 301 Break-offs During the Interview 301 Refusals to Answer Specific Questions (Item Omission) 301 What Is a Completed Interview? 301 Measuring Response Rate in Surveys 302
11- 5 How Panel Companies Control Error 304 11- 6 Dataset, Coding Data, and the Data Code Book 305 11- 7 Data Quality Issues 306
What to Look for in Raw Data Inspection 307 Incomplete Response 307 Nonresponses to Specific Questions (Item Omissions) 307 Yea- or Nay-Saying Patterns 307 Middle-of-the-Road Patterns 308 Other Data Quality Problems 308 How to Handle Data Quality Issues 308
Summary 310 • Key Terms 310 • Review Questions/Applications 310 Case 11. 1 Skunk Juice 311 Case 11. 2 Sony Televisions Ultra HD TV Survey 312
A01_BURN3261_08_GE_FM.indd 15A01_BURN3261_08_GE_FM.indd 15 30/08/16 1:29 pm30/08/16 1:29 pm

Chapter 12 Using Descriptive Analysis, Performing Population Estimates, and Testing Hypotheses 314 12- 1 Types of Statistical Analyses Used in Marketing Research 317
Descriptive Analysis 317 Inference Analysis 318 Difference Analysis 318 Association Analysis 318 Relationships Analysis 318
12- 2 Understanding Descriptive Analysis 319 Measures of Central Tendency: Summarizing the “Typical” Respondent 319
Mode 319 Median 319 Mean 320
Measures of Variability: Relating the Diversity of Respondents 320 Frequency and Percentage Distribution 320 Range 321 Standard Deviation 321
12- 3 When to Use a Particular Descriptive Measure 322 12- 4 The Auto Concepts Survey: Obtaining Descriptive Statistics with SPSS 323
Integrated Case 323 Use SPSS to Open Up and Use the Auto Concepts Dataset 324 Obtaining a Frequency Distribution and the Mode with SPSS 325 Finding the Median with SPSS 326 Finding the Mean, Range, and Standard Deviation with SPSS 327
12- 5 Reporting Descriptive Statistics to Clients 329 Reporting Scale Data (Ratio and Interval Scales) 329 Reporting Nominal or Categorical Data 330
12- 6 Statistical Inference: Sample Statistics and Population Parameters 331 12- 7 Parameter Estimation: Estimating the Population Percent or Mean 332
Sample Statistic 333 Standard Error 333 Confidence Intervals 335 How to Interpret an Estimated Population Mean or Percentage Range 336
12- 8 The Auto Concepts Survey: How to Obtain and Use a Confidence Interval for a Mean with SPSS 337 12- 9 Reporting Confidence Intervals to Clients 338 12- 10 Hypothesis Tests 340
Test of the Hypothesized Population Parameter Value 340 Auto Concepts: How to Use SPSS to Test a Hypothesis for a Mean 342
12- 11 Reporting Hypothesis Tests to Clients 344 Summary 345 • Key Terms 345 • Review Questions/Applications 345 Case 12. 1 L’Experience Félicité Restaurant Survey Descriptive and Inference Analysis 346 Case 12. 2 Integrated Case: Auto Concepts Descriptive and Inference Analysis 348
16 CONTENTS
A01_BURN3261_08_GE_FM.indd 16A01_BURN3261_08_GE_FM.indd 16 30/08/16 1:29 pm30/08/16 1:29 pm

Chapter 13 Implementing Basic Differences Tests 350 13- 1 Why Differences Are Important 351 13- 2 Small Sample Sizes: The Use of a t Test or a z Test and How SPSS Eliminates the Worry 354 13- 3 Testing for Significant Differences Between Two Groups 355
Differences Between Percentages with Two Groups (Independent Samples) 355 How to Use SPSS for Differences Between Percentages of Two Groups 358 Differences Between Means with Two Groups (Independent Samples) 358
Integrated Case: The Auto Concepts Survey: How to Perform an Independent Sample 360 13- 4 Testing for Significant Differences in Means Among More Than Two Groups: Analysis of Variance 364
Basics of Analysis of Variance 364 Post Hoc Tests: Detect Statistically Significant Differences Among Group Means 366
Integrated Case: Auto Concepts: How to Run Analysis of Variance on SPSS 366
Interpreting ANOVA (Analysis of Variance) 369
13- 5 Reporting Group Differences Tests to Clients 369 13- 6 Differences Between Two Means Within the Same Sample (Paired Sample) 369 Integrated Case: The Auto Concepts Survey: How to Perform a Paired Samples t test 371 13- 7 Null Hypotheses for Differences Tests Summary 372 Summary 373 • Key Terms 373 • Review Questions/Applications 373 Case 13. 1 L’Experience Félicité Restaurant Survey Differences Analysis 375 Case 13. 2 Integrated Case: The Auto Concepts Survey Differences Analysis 375
Chapter 14 Making Use of Associations Tests 376 14- 1 Types of Relationships Between Two Variables 378
Linear and Curvilinear Relationships 378 Monotonic Relationships 379 Nonmonotonic Relationships 380
14- 2 Characterizing Relationships Between Variables 380 Presence 380 Direction (or Pattern) 380 Strength of Association 381
14- 3 Correlation Coefficients and Covariation 382 Rules of Thumb for Correlation Strength 382 The Correlation Sign: The Direction of the Relationship 383 Graphing Covariation Using Scatter Diagrams 383
14- 4 The Pearson Product Moment Correlation Coefficient 384 Integrated Case: Auto Concepts: How to Obtain Pearson Product Moment Correlation(s) with SPSS 387 14- 5 Reporting Correlation Findings to Clients 389
CONTENTS 17
A01_BURN3261_08_GE_FM.indd 17A01_BURN3261_08_GE_FM.indd 17 30/08/16 1:29 pm30/08/16 1:29 pm

14- 6 Cross-Tabulations 389 Cross-Tabulation Analysis 390 Types of Frequencies and Percentages in a Cross-Tabulation Table 390
14- 7 Chi-Square Analysis 393 Observed and Expected Frequencies 393 The Computed x 2 Value 394 The Chi-Square Distribution 394 How to Interpret a Chi-Square Result 396
Integrated Case: Auto Concepts: Analyzing Cross-Tabulations for Significant Associations by Performing Chi-Square Analysis with SPSS 398 14- 8 Reporting Cross-Tabulation Findings to Clients 400 14- 9 Special Considerations in Association Procedures 400 Summary 402 • Key Terms 402 • Review Questions/Applications 403 Case 14. 1 L’Experience Félicité Restaurant Survey Associative Analysis 404 Case 14. 2 Integrated Case: The Auto Concepts Survey Associative Analysis 405
Chapter 15 Understanding Regression Analysis Basics 406 15- 1 Bivariate Linear Regression Analysis 407
Basic Concepts in Regression Analysis 408 Independent and Dependent Variables 408 Computing the Slope and the Intercept 408
How to Improve a Regression Analysis Finding 408
15- 2 Multiple Regression Analysis 410 An Underlying Conceptual Model 410 Multiple Regression Analysis Described 412
Basic Assumptions in Multiple Regression 412
Integrated Case: Auto Concepts: How to Run and Interpret Multiple Regression Analysis on SPSS 415
“Trimming” the Regression for Significant Findings 416 Special Uses of Multiple Regression Analysis 417
Using a “Dummy” Independent Variable 417 Using Standardized Betas to Compare the Importance of Independent Variables 418 Using Multiple Regression as a Screening Device 418 Interpreting the Findings of Multiple Regression Analysis 419
15- 3 Stepwise Multiple Regression 422 How to Do Stepwise Multiple Regression with SPSS 422 Step-by-Step Summary of How to Perform Multiple Regression Analysis 422
15- 4 Warnings Regarding Multiple Regression Analysis 423 15- 5 Reporting Regression Findings to Clients 425 Summary 428 • Key Terms 428 • Review Questions/Applications 428 Case 15. 1 L’Experience Félicité Restaurant Survey Regression Analysis 430 Case 15. 2 Integrated Case: Auto Concepts Segmentation Analysis 430
18 CONTENTS
A01_BURN3261_08_GE_FM.indd 18A01_BURN3261_08_GE_FM.indd 18 30/08/16 1:29 pm30/08/16 1:29 pm

Chapter 16 The Research Report 432 16- 1 The Importance of the Marketing Research Report 435
Improving the Efficiency of Report Writing 435
16- 2 Know Your Audience 435 16- 3 Avoid Plagiarism! 436 16- 4 Elements of the Report 437
Front Matter 437 Title Page 438 Letter of Authorization 438 Letter/Memo of Transmittal 439 Table of Contents 440 List of Illustrations 441 Abstract/Executive Summary 441
Body 442 Introduction 442 Research Objectives 442 Method 442 Method or Methodology? 442 Results 443 Limitations 443 Conclusions and Recommendations 443
End Matter 444
16- 5 Guidelines and Principles for the Written Report 444 Headings and Subheadings 444 Visuals 444 Style 445
16- 6 Using Visuals: Tables and Figures 446 Tables 446 Pie Charts 446 Bar Charts 449 Line Graphs 449 Flow Diagrams 451
16- 7 Producing an Appropriate Visual 451 16- 8 Presenting Your Research Orally 452 16- 9 Alternative Ways to Present Findings 452
Videos 454 Infographics 455
16- 10 Disseminating Results Throughout an Organization 455 Dashboards 455
Summary 456 • Key Terms 457 • Review Questions/Applications 457 Case 16. 1 Integrated Case: Auto Concepts: Report Writing 458 Case 16. 2 Integrated Case: Auto Concepts: Making a PowerPoint Presentation 459
Endnotes 461 Name Index 477 Subject Index 481
CONTENTS 19
A01_BURN3261_08_GE_FM.indd 19A01_BURN3261_08_GE_FM.indd 19 30/08/16 1:29 pm30/08/16 1:29 pm

A01_MISH4182_11_GE_FM.indd 6 10/06/15 11:46 am
This page intentionally left blank

What’s New and What’s Tried and True in the Eighth Edition?
■ New! Ann Veeck, Co-author. The eighth edition of Marketing Research heralds a sig-
nificant change in authors. For the past seven editions, this textbook has been authored
by Al Burns and Ron Bush. Ron shifted into retirement soon after the seventh edition
was published, and Ann Veeck came aboard. Ann has impeccable credentials, includ-
ing a Master of Marketing Research degree from the Terry College of Business at the
University of Georgia. Ann has taught marketing research and used Burns and Bush
textbook editions for a number of years. Ann’s contributions appear throughout the
eighth edition and especially in coverage of the marketing research industry, the market-
ing research process and problem definition, research design, secondary and packaged
information, and qualitative research techniques. Ann is also on top of digital market-
ing research and big data analytics. Those adopters who have used previous editions
of Marketing Research will nevertheless recognize coverage and contributions by Ron
Bush and, while Ron is not an active writer of the eighth edition, we have retained his
name as co-author for this reason. So the eighth edition of Marketing Research marks
the transition of Burns and Bush to Burns, Veeck, and Bush, with the expectation that
the ninth edition will be Burns and Veeck.
Benefit: As a longtime user of Marketing Research and an accomplished teacher of
countless marketing research students, Ann’s contributions continue the tradition of
intuitive and immediately understandable coverage of this subject matter.
■ New! Big Changes in the Industry, Subtle Shifts in the Textbook. Those of us in the
marketing research business cannot help but notice the huge changes taking place. Big
data and marketing analytics have arrived; social media marketing research practices
are on the scene; qualitative research has become much more common; technological
innovations happen daily; panels have become the way of surveys; data visualization,
infographics, and dashboards are the preferred presentation vehicles. As seasoned
marketing educators and perceptive textbook authors, we are well aware that instruc-
tors intensely dislike dramatic changes in new editions of textbooks they have used for
some time. So, we have addressed the big changes in marketing research not with a
major rewriting of the tried-and-true coverage in prior editions but with a more evolu-
tionary approach by adding new sections, composing Marketing Research Insights as
illustrations, and recasting some chapter sections to be consistent with current practice.
We advise the adopters of the eighth edition to do as we do. When teaching marketing
research to our own students, we use the text book coverage as a springboard to current
practices and examples that we glean by keeping up with Quirk’s Marketing Research Review , GreenBook , and other marketing research industry news sources.
Benefit: Adopters of the eighth edition will notice the modernization of coverage,
but they will not be shocked or inconvenienced by huge changes in organization,
topic coverage, and flow of material in the text book .
■ New! Digital Marketing Research. We firmly believe that new technologies, princi-
pally computer-based innovations, are profoundly changing the practice of marketing
research, and while we termed it social media marketing research and mobile marketing research in our previous edition, those terms do not completely capture what is happen-
ing. So, we have opted to use digital marketing research as our catchphrase, which we
21
Preface to Marketing Research, Eighth Edition
A01_BURN3261_08_GE_FM.indd 21A01_BURN3261_08_GE_FM.indd 21 30/08/16 1:29 pm30/08/16 1:29 pm

22 PREFACE
believe subsumes social media marketing and mobile marketing research, all techno-
logical shifts such as the huge popularity of online panels, the growth of Internet-based
qualitative techniques, infographics, and so on. Thus, many of these are highlighted by
Digital Marketing Research Applications in Marketing Research Insights throughout the
book . Under the umbrella of digital media, many references will pertain exclusively to
the subcategory of social media data (as in the section in Chapter 5 on social media as a
form of secondary research) and will be labeled as such.
Benefit: Students have the latest information on industry practices regarding technol-
ogy’s impacts on marketing research. Students will be able to appreciate how rapidly
changing and evolutionary is the contemporary practice of marketing research.
■ New! Big Data. In the era of “big data,” students need to be aware of traditional sources
of data as well as exciting new sources. Chapter 5 , Secondary Data and Packaged In-
formation, now begins with an introductory section on big data that defines the phrase
and explains why the multiplying types and volume of data are met with both anticipa-
tion and apprehension by marketing research professionals. One of these increasingly
important sources of data is the user-generated data (UGD) that can be mined from social
media websites ; an extensive section on the use, as well as the strengths and weaknesses,
of social media data has been added to Chapter 5 . Another form of secondary digital data
that is becoming increasingly useful is the Internet of Things (IoT) , and a section on the
future potential of these sources of “passive data” now concludes Chapter 5 .
Benefit: Students will have a better understanding of the current and potential use
of emerging sources of data and how they can develop skills to be well equipped for
careers in the marketing research industry.
■ New! Updated Marketing Research Practical and Global Insights. Marketing
Research Insights—short illustrations and descriptions of marketing research practices—
have been an integral part of Marketing Research from the first edition. In addition to
the new Digital Marketing Research Insight element, we have retained those that have
evolved over previous editions. Namely, Practical Marketing Research Insights and
Global Marketing Research Insights appear in every chapter with fresh examples. These
inserts help to illustrate concepts we discuss in the text or to introduce students to some
unique application being used in practice. All of these are new and reflect current issues
and practices in the industry.
Benefit: Students are introduced to real-world applications in the marketing research
industry. By focusing on four categories, students see how current issues that are
important to the industry are being addressed by today’s practitioners.
■ New! Marketing Research Company Vignettes. In past editions of Marketing Re-search , we leveraged the relationships we have developed in the industry by inviting
key players to contribute a thumbnail company description or comment on a particular
marketing research topic at the beginning of each chapter. With the eighth edition,
all company vignettes are fresh. However, we opted, for the most part, to invite only
the most innovative marketing research companies to contribute. Thus, we issued an
invitation to companies identified in the Top 50 Most Innovative Supplier Companies in Marketing Research in the 2015 GreenBook Research Industry Trends Report. Several
responded with thumbnail descriptions, photos of the CEO or other company principal,
and company logo. With each one, curious students are encouraged to visit the com-
pany’s website. Because most of these companies are innovative and cutting edge, they
do not fit the “mold” of chapter coverage as did companies in past editions. Instead,
instructors should treat these company vignettes as interesting success stories about
contemporary marketing research practices.
Benefit: Students get more than an academic perspective of marketing research.
They benefit from reading about (and seeing, if they visit the websites) innovative
marketing research practitioners solving real problems.
A01_BURN3261_08_GE_FM.indd 22A01_BURN3261_08_GE_FM.indd 22 30/08/16 1:29 pm30/08/16 1:29 pm

PREFACE 23
■ New! New End-of-Chapter Cases. In many chapters, we provide new cases to reflect
much of the current material in this eighth edition. We strive to make the cases interest-
ing to the students and illustrate real-world applications. We have developed new short
cases that are fictitious but written with a goal of stimulating students’ interest and
curiosity.
Benefit: Students can apply concepts they have just learned in the chapter to a real-
world setting. This allows students to see how valuable the information they have
learned is in a practical example.
■ Tried and True! Retained Organization and Shorter Length. With the previous edi-
tion, we responded to adopters’ desires for a more concise approach. We reduced the
number of chapters to 16 instead of the 20 or more chapters you’ll see in many texts.
We accomplished this aim by combining some chapters and streamlining the material.
For example, we combined the chapters on steps in the research process and determin-
ing the problem into one chapter. This streamlined approach keeps the focus on the
core lessons to be learned. Because this organization and shorter list of chapters proved
successful both in terms of sales and adopters’ comments, we have retained this format
in the eighth edition.
Benefit: The book is better synchronized with a 15- or 16-week semester. Students
now have a comprehensive learning experience in a more manageable package.
■ Tried and True! Annotated Integration IBM® SPSS® Statistics software (“SPSS”) 23.0. This eighth edition is fully integrated with SPSS 23.0. We started this
integration in 1995, and we enhance the integration of SPSS by offering your students
step-by-step screen captures that help them learn the keystrokes in SPSS. This allows
you to spend more time teaching what the analysis technique is, when to use it, and
how to interpret it. Illustrated keystrokes for the latest edition of SPSS are presented
in this text with clear, easy-to-follow instructions.
Benefit: Students learn the latest version of SPSS, considered to be the “gold stand-
ard” among marketing researchers. By following our step-by-step screen captures,
students will see the necessary menu operations and learn how to read SPSS output.
Just by reading this book , they can learn a great deal about SPSS by “seeing” it oper-
ate before they get to a computer to practice.
■ Tried and True! Guidelines on Reporting Statistical Analyses to Clients. We have
noticed that after teaching our students to properly conduct a statistical analysis using
SPSS, they have trouble when it comes to writing down what they have done. In our
sixth edition, we added an element that would address this problem. We believe it is a
significant improvement, and we have retained and streamlined it in the eighth edition.
In our data analysis chapters, we include information on how to write up the findings
for the client. We offer easy-to-follow guidelines and examples.
Benefit: Most books teach data analysis. Students reading this book will benefit by
not only knowing how to perform data analysis but also how to report what they find.
This should make students better research report writers.
■ Tried and True (but tweaked)! Integrated Case. Through our own teaching, we have
found that an integrated case is an excellent teaching tool. One case example that de-
velops over the semester allows students to see the linkages that exist in the real world
all the way from formulating the problem through data analysis. Our integrated case
follows a marketing research company project from start to finish. To freshen the inte-
grated case, we changed the client company from Global Motors to Auto Concepts and
modernized the automobile models being researched. The case focuses on a manager
who must determine the type of automobiles the auto market will demand in the future.
Students using this case will learn how to examine attitudes and opinions (for example,
attitudes about global warming) that may influence consumer choice, how to determine
the most preferred models, and how to identify market segment differences between the
A01_BURN3261_08_GE_FM.indd 23A01_BURN3261_08_GE_FM.indd 23 30/08/16 1:29 pm30/08/16 1:29 pm

24 PREFACE
different models. Students are shown how SPSS tools can aid them in analyzing case
data to make important decisions. The dataset is streamlined with fewer variables, and
the “integrated” aspect has been cut back to nine end-of-chapter cases rather than one in
every chapter. Of course, the dataset is used extensively in analysis chapters so students
can replicate the examples and practice.
Benefit: The Auto Concepts integrated case offers the benefit of allowing stu-
dents to examine the critical steps in a marketing research project and to more
easily see how data are used to help managers choose from among decision
alternatives.
■ Tried and True! Inclusion of Code of Ethics Passages as Ethical Marketing Research Insights. A fourth Marketing Research Insight is entitled Ethical Considera-
tion, which also harkens back to our text book ’s inception. In our previous edition, we
decided to treat the topic of ethics the way it is treated in the industry, so we included
excerpts from the Code of Marketing Research Standards as presented by the Market-
ing Research Association (MRA). We have long had a good relationship with the MRA,
which has given us permission to present excerpts from the current standards. We
continue this approach with the eighth edition. We understand that a text book cannot
teach someone to be ethical. Rather, we tie together issues of ethical sensitivity in the
conduct of marketing research practices described in each chapter by specific reference
to ethical code passages.
Benefit: Students are introduced to areas of ethical sensitivity in the practice of mar-
keting research using the actual codes/standards that practitioners use. As a result,
students should have knowledge of potential “ethical dangers,” whether as a future
buyer or supplier of research.
■ Tried and True! YouTube Examples. Current thinking on how millennial students
approach their education emphasizes the importance of social media and Internet-based
learning. With the previous edition, we experimented by searching for and including
YouTube video references, and we have continued this learning resource in the eighth
edition. YouTube references in the text provide useful insights ranging from problem
definition to statistical analysis to report writing.
Benefit: For students who like video learning, our YouTube references provide dif-
ferent perspectives and how-to insights on topics covered in the text.
■ Tried and True! Active Learning Challenges. We innovated in the sixth edition with
the inclusion of short exercises embedded at strategic points in each chapter where stu-
dents are tasked with using the concept(s) they have just learned to experiment with or
apply to some illustrative situation. We believe these exercises serve to solidify learning
on the relevant concepts, and we have retained these Active Learning features in the
eighth edition.
Benefit: Active learning allows students to practice or apply some concept or
technique they have just read about. Learning is facilitated by reading and then
“doing.”
■ Tried and True! Synthesize Your Learning. We have also retained this feature from
the sixth edition to help students synthesize the knowledge they have gained across
several chapters. The exercises require students to go back to previous chapters and in-
tegrate material into answers for the exercise. The Synthesize Your Learning exercises
are found at the end of sets of three or so chapters with the goal of showing how topics
covered in these chapters work together to solve a marketing research case exercise.
Benefit: This feature allows students to integrate material that is learned in “chunks”
to see how the material is related. Students benefit by learning how integrated the
marketing research process really is.
A01_BURN3261_08_GE_FM.indd 24A01_BURN3261_08_GE_FM.indd 24 30/08/16 1:29 pm30/08/16 1:29 pm

PREFACE 25
The Intended Market for This Book When we fi rst conceptualized this text book in the early 1990s, we wanted to write it for
undergraduate students who were taking marketing research for the fi rst time. We saw other
texts that were trying to be “all things to all people.” Even though they were positioned as
research texts for undergraduates, much of the material was advanced, and instructors either
never used them or endured struggling students when covering these topics. This eighth edi-
tion, like its seven predecessors, was written specifi cally for undergraduate students who need
a solid, basic understanding of marketing research. With so many marketing research tools
that are easily accessible today, it is better to foster savvy do-it-yourself (DIY) generalists
than to spawn marginally prepared technique specialists.
However, as is the case with all things marketing, our customers, both students and
instructor-adopters, have changed. As we ourselves strive for perfection in our own edu-
cational pedagogies, so have we constantly sought to revise Marketing Research toward
satisfying the requirements for success with (now) millennial student learners. With every
edition, we have conscientiously tried to think about how to improve the presentations in
the text so as to be intuitively understandable to the mainstream undergraduate student.
Early editions of this text book sought to equip marketing students with tools to be eff ective
clients of marketing research services providers. Today the need is to provide marketing
students with a basic knowledge of good marketing research practice that they will prob-
ably attempt to execute themselves. That is, we are now teaching the DIY generation of
marketing research students.
Our Approach Given our intended market, throughout all eight editions we strived to provide instructors
with a book designed for undergraduates who wanted to know the “nuts and bolts” of mar-
keting research. For example, our chapter on measurement teaches students the basic ques-
tion formats, the scales of measurement, the primary uses of each type of scale, and the
common methods used to measure popular constructs. It does not dwell on diff erent forms
of reliability and validity or the method used to develop valid and reliable multi-item scales.
In our analysis chapters, we cover the basic “bread-and-butter” statistical procedures used to
analyze data, but we do not cover multivariate techniques or nonparametric statistics in the
book itself.
Our approach and writing style have probably been the two main reasons the book has
been the market leader for well over two decades. Student evaluations indicate that we de-
liver on our intent to write at the level that people studying marketing research for the fi rst
time understand. We hope your teaching evaluations regarding the text will arrive at the same
appraisal.
Recommended Prerequisites To prepare for this course, we feel students should have taken an introductory course in mar-
keting. We assume students know what we mean when we talk about marketing strategy and
the elements of the marketing mix. Students having had an introduction to marketing course
will better appreciate the role that marketing research plays in helping managers make better
marketing decisions. We also recommend that students take an introductory statistics course
prior to taking this course. It helps for them to know concepts such as the area under the normal
curve, z scores, and the basics of statistical testing, including interpretation of p values. How-
ever, since we both have taught for many years, we are well aware that many students will not
recall many of these concepts and, where necessary, we provide some review of these basics.
A01_BURN3261_08_GE_FM.indd 25A01_BURN3261_08_GE_FM.indd 25 30/08/16 1:29 pm30/08/16 1:29 pm

26 PREFACE
AACSB Guidelines The Association to Advance Collegiate Schools of Business–International (AACSB), our
accreditation society, infl uences us a great deal. We strive to keep current with AACSB’s
recommendations and guidelines, such as including material that will aid in your course as-
sessment eff orts, covering ethical issues, and pointing out global applications.
We include a number of items that should help in assessing your students’ understanding
of the course content. Each chapter begins with learning objectives. Embedded in each chap-
ter are Active Learning exercises that allow students to apply the knowledge just acquired
to some real-world resource. Synthesize Your Learning exercises in this edition require
that students revisit chapters to integrate their knowledge from those chapters. For our test
bank, Pearson has adopted guidelines established by AACSB. We discuss this in a following
section.
Other Features in the Eighth Edition
■ Online Link to Careers in Marketing Research. Some students will be interested in
marketing research as a career. Beginning with the sixth edition and continued for the
eighth, we provide an online Careers link. This gives us the opportunity to post new
happenings in the industry as they occur. Students will find descriptions of positions,
salary information, educational requirements, and links to actual position openings.
There are some excellent master’s programs in marketing research. Our Careers link
also provides information on these programs. Go to http://www.pearsonglobaleditions.com/Burns and click on the link for the Companion Website for Marketing Research ,
eighth edition. When you open any chapter, you will see the list of links in the left
margin. Click on “Careers.”
Benefit: Students have the most up-to-date information about careers.
■ Advanced Data Analysis Modules. Even undergraduate students taking their first course
in marketing research may need some knowledge of statistical analyses other than those
we have provided in the text. Many times these issues arise as a result of a particular
need associated with a real-world class project. We wanted to make some of these
techniques available to you online, so we have written several additional data analysis
modules. The emphasis in these modules is on explaining the basics of the analysis and
when it is appropriate. We also provide an example. Topics covered are the following:
■ When to Use Nonparametric Tests
■ Nonparametric: Chi-square Goodness-of-Fit Test
■ Nonparametric: Mann-Whitney U Test
■ Nonparametric: Wilcoxon Test
■ Nonparametric: Kruskal-Wallis H Test
■ When to Use Multivariate Techniques
■ Factor Analysis
■ Cluster Analysis
■ Conjoint Analysis
Students can access the modules by going to the text book website and opening up
any chapter. They will see a link to “Online Data Analysis Modules.”
■ Datasets. We offer datasets associated with our cases that can be downloaded. Of
course, we provide the dataset for our integrated case, Auto Concepts. We also offer the
L’Experience Félicité (formerly Hobbit’s Choice) dataset for professors who wish to
use this case. These datasets and the chapter locations of the relevant data analysis cases
are as follows:
■ Auto Concepts (Auto Concepts.sav)—integrated case dataset used in Chapters
12 – 16
A01_BURN3261_08_GE_FM.indd 26A01_BURN3261_08_GE_FM.indd 26 30/08/16 1:29 pm30/08/16 1:29 pm

PREFACE 27
■ Auto Concepts Recoded (Auto Concepts.Recoded.sav)—integrated case dataset
with ordinal demographic variables recoded using midpoints of ranges to convert
these variables to scales to be used as independent variables in multiple regression
analysis
■ L’Experience Félicité Restaurant (L’Experience.sav)— dataset for end-of-chapter
cases used in Chapters 12 – 15 .
To access these datasets, go to http://www.pearsonglobaleditions.com/Burns and click
on the link for the Companion Website for Marketing Research , eighth edition. When
you open any chapter, see the list of links in the left margin and click on “SPSS Student
Downloads.”
Instructor Resources At the Instructor Resource Center, www.pearsonglobaleditions.com/Burns , instructors can
easily register to gain access to a variety of instructor resources available with this text in
downloadable format. If assistance is needed, our dedicated technical support team is ready
to help with the media supplements that accompany this text. Visit http://support.pearson
.com/getsupport for answers to frequently asked questions and toll-free user support phone
numbers.
The following supplements are available with this text:
■ Instructor’s Resource Manual
■ Test Bank
■ TestGen® Computerized Test Bank
■ PowerPoint Presentation
■ Student Companion Website
Student Supplements SPSS Student Assistant. With previous editions, we created the SPSS Student Assistant,
a stand-alone tutorial that teaches students how to use and interpret SPSS. The SPSS
Student Assistant may be downloaded from the Companion Website. Installation on a
personal computer is simple, and the SPSS Student Assistant will reside there for easy,
immediate access. The videos show cursor movements and resulting SPSS operations and
output. There is a test for each Student Assistant session so that students may assess how
well they have learned the material.
Go to http://www.pearsonglobaleditions.com/Burns and click on the link for the
Companion Website for Marketing Research , eighth edition. When you open any chapter,
see the list of links in the left margin and click on “SPSS Student Downloads” for more
information.
Acknowledgments Many people were involved in putting this eighth edition together. We are fortunate to have
Pearson as our publisher. Over the years, we have been impressed with the professional-
ism and dedication of the people at Pearson and the people we worked with on this edi-
tion were no exception. We wish to thank our Senior Sponsoring Editor, Neeraj Bhalla, for
his support and leadership. We have worked with Becca Richter Groves, Senior Production
Project Manager, on several past editions, and we are grateful for her responsiveness and
effi ciency. This has been another successful collaboration with the Pearson team and we look
forward to many more editions!
A01_BURN3261_08_GE_FM.indd 27A01_BURN3261_08_GE_FM.indd 27 30/08/16 1:29 pm30/08/16 1:29 pm

28 PREFACE
We have benefi ted from the input of Heather Donofrio, Ph.D., Business Communica-
tions, for several editions. Heather helped us keep the reporting, writing, and presentation
chapter current. Ashley Roberts has worked behind the scenes for us on two previous editions.
Parts of this eighth edition benefi ted greatly from the work of Ali Russo. We are fortunate to
have these bright and enthusiastic people working with us.
We devote a major eff ort toward developing and maintaining relationships with our
colleagues who practice marketing research. Their knowledge and insights are interwoven
throughout these pages. Many of these people have been our friends for many years, and we
appreciate their contributions. Professionals who contributed signifi cantly to one or more of
our eight editions include the following:
David Almy, CEO, Marketing Research
Association
Eduardo Carqueja, NPolls
Kristen Darby, COO, Marketing Research
Association
Andrea Fisher, Burke, Inc.
Raleigh Floyd, Nielsen
Chris Forbes, Research Reporter
Steven H. Gittelman, President and CEO,
Mktg., Inc.
Erika Harriford-McLaren, Strategic and
Corporate Communications Manager,
ESOMAR
Lauren Hersch, Client Relationship
Manager, IBISWorld
Kees de Jong, Vice Chairman of the
Board, Survey Sampling International
Frankie Johnson, Research Arts
Shari Johnson, Business Librarian,
University of West Florida
Jackie Lorch, Vice President, Global
Knowledge Development, Survey
Sampling International
Ramana Madupalli, Director, Master of
Marketing Research Program, Southern
Illinois University–Edwardsville
Jeff Minier, Co-President, GfK Kynetec
Leonard Murphy, Editor-in-Chief,
GreenBook
William D. Neal, Founder and Senior
Partner, SDR Consulting
Darren Mark Noyce, Founder and
Managing Director, SKOPOS Market
Insight
Kartik Pashupati, Research Manager,
Research Now
Anne Pettit, Vice President, Conversition
Henry Schafer, Executive Vice President,
The Q Scores Company
Jessica Smith, Vice President, Offl ine
Client Services, Survey Sampling
International
Eelco Snip, Market Intelligence Analyst,
ESOMAR
Doss Struse, Managing Partner,
Defi nitive Insights
Naoufel Testaouni, Mirametrix
Liz Tanner, Communications Director,
Qualtrics Labs, Inc.
Leslie Townsend, President and Founder,
Kinesis
Sima Vasa, Partner and CEO, Paradigm
Sample
Mike Webster, Senior Vice President,
Research Solutions, Burke, Inc.
Brendan Wycks, Executive Director,
Marketing Research and Intelligence
Association
Of course, we owe a debt of gratitude to our colleagues in academia who provide reviews
of our work. Among the reviewers for the eighth edition were the following:
Linda Coleman, Salem State University
Michael Pepe, Siena College
Feng Shen, St. Joseph University
Minakshi Trivedi, State University at
Buff alo
A01_BURN3261_08_GE_FM.indd 28A01_BURN3261_08_GE_FM.indd 28 30/08/16 1:29 pm30/08/16 1:29 pm

PREFACE 29
We also thank those who reviewed the previous seven editions of this book. Many of their
suggestions and insights are still incorporated in this edition.
Manoj Agarwal, Binghamton University
Linda Anglin, Mankato State University
Silva Balasubramanian, Southern Illinois
University
Ron Beall, San Francisco State
University
Jacqueline J. Brown, University of
Nevada, Las Vegas
Joseph D. Brown, Ball State University
Nancy Bush, Wingate University
E. Wayne Chandler, Eastern Illinois
University
Tung-Zong Chang, Metropolitan State
University
Kathryn Cort, North Carolina A&T State
University
Thomas Cossee, University of Richmond
B. Andrew Cudmore, Florida Institute of
Technology
Joshua Fogel, Brooklyn College
Yancy Edwards, University of South
Florida
Eric Freeman, Concordia University
Anthony R. Fruzzetti, Johnson & Wales
University
Stanley Garfunkel, Queensborough
Community College
Corbett Gaulden Jr., University of Texas
of the Permian Basin
Ronald Goldsmith, Florida State
University
Ashok Gupta, Ohio University
Perry Haan, Tiffi n University
Douglas Hausknecht, University of Akron
Stacey Hills, Utah State University
M. Huneke, University of Iowa
Ben Judd, University of New Haven
Karl Kampschroeder, St. Mary’s
University
James Leigh, Texas A&M University
Aron Levin, Northern Kentucky
University
Bryan Lilly, University of Wisconsin
Joann Lindrud, Mankato State University
Subhash Lonial, University of Louisville
Gary McCain, Boise State University
Sumaria Mohan-Neill, Roosevelt
University
Thomas O’Conner, University of New
Orleans
V. Padmanabhan, Stanford University
Diane Parente, State University of New
York, Fredonia
Jean Powers, Ivy Tech Community
College
James A. Roberts, Baylor University
Angelina M. Russell, West Virginia
University of Technology
Joel Saegert, University of Texas at San
Antonio
Don Sciglimpaglia, San Diego State
University
Srivatsa Seshadri, University of Nebraska
at Kearney
Terri Shaff er, Southeastern Louisiana
University
Birud Sindhav, University of Nebraska at
Omaha
Bruce L. Stern, Portland State University
John H. Summey, Southern Illinois
University
Scott Swain, Boston University
Nicolaos E. Synodinos, University of
Hawaii
Peter K. Tat, University of Memphis
William Thomas, University of South
Carolina
Paul Thornton, Wesley College
Jeff W. Totten, Southeastern Louisiana
State University
R. Keith Tudor, Kennesaw State
University
Steve Vitucci, University of Central Texas
Bernard Weidenaar, Dordt College
A01_BURN3261_08_GE_FM.indd 29A01_BURN3261_08_GE_FM.indd 29 30/08/16 1:29 pm30/08/16 1:29 pm

30 PREFACE
Carrie White, West Liberty State College
Beverly Wright, East Carolina
University
Bonghee Yoo, Hofstra University
Eric Yorkston, Neeley School of
Business, Texas Christian University
Charles J. Yoos II, Fort Lewis College
Heiko de B. Wijnholds, Virginia
Commonwealth University
Xin Zhao, University of Utah
Zahir Quraeshi, Western Michigan
University
Tom Mahaff ey, St. Francis Xavier
University
Finally, we wish to thank our spouses, Jeanne, Greg, and Libbo, respectively. Our spouses
sacrifi ce much in order to allow us to work on our book. We are fortunate in that, for all three
of us, our spouses are our best friends and smiling supporters.
Al Burns,
Louisiana State University
Ann Veeck,
Western Michigan University
Ron Bush,
University of West Florida
Contributors
Nina von Arx-Steiner, University of
Applied Sciences and Arts, Northwestern
Switzerland FHNW
Nils Magne Larsen, UIT—The Arctic
University of Norway
Oh Yoke Moi, Taylor’s University
Valdimar Sigurdsson, Reykjavik
University
Jon Sutherland
Diane Sutherland
G. Swathy
Pearson would like to thank the following people for their work on the Global Edition:
Reviewers
Per Bergfors, Copenhagen Business
School
Richard Beswick, SBS Swiss Business
School
Amro Maher, Qatar University
Milena S. Nikolova, American University
in Bulgaria
Hamed Shamma, The American
University in Cairo
A01_BURN3261_08_GE_FM.indd 30A01_BURN3261_08_GE_FM.indd 30 08/09/16 11:14 am08/09/16 11:14 am

Alvin C. Burns, Professor of Marketing, is the former Ourso Distinguished Chair of Marketing/
Chairperson of Marketing in the E. J. Ourso College of Business Administration at Louisi-
ana State University. He received his doctorate in marketing from Indiana University and an
M.B.A. from the University of Tennessee. Al has taught undergraduate and master’s courses
as well as doctoral seminars in marketing research for over 40 years. During this time, he has
supervised a great many marketing research projects conducted for business-to-consumer,
business-to-business, and not-for-profi t organizations. His articles have appeared in the Jour-nal of Marketing Research , Journal of Business Research , Journal of Advertising Research ,
and others. He is a Fellow in the Association for Business Simulation and Experiential Learn-
ing. He resides in Baton Rouge, Louisiana, with his wife, Jeanne.
Ann Veeck is Professor of Marketing at Western Michigan University. She received her
Ph.D. in business, with a major in marketing and a minor in statistics, from Louisiana State
University and her Master of Marketing Research degree from the University of Georgia. She
has taught marketing research and related courses to thousands of undergraduate and M.B.A.
students for over 17 years—using this marketing research text, of course. The main focus
of her research is family and food consumption patterns in developing nations with an em-
phasis on China. She has also published extensively on best learning practices in marketing.
She received the Haworth College of Business Teaching Award in 2013 and a national award
for innovative teaching from the Marketing Management Association in 2012. Ann lives in
Kalamazoo, Michigan, with her husband, Gregory Veeck.
Ronald F. Bush is Distinguished University Professor of Marketing, Emeritus, at the Univer-
sity of West Florida. He received his B.S. and M.A. from the University of Alabama and his
Ph.D. from Arizona State University. With over 40 years of experience in marketing research,
Professor Bush worked on research projects with fi rms ranging from small businesses to the
world’s largest multinationals. He served as an expert witness in trials involving research
methods, often testifying on the appropriateness of research reports. His research is published
in leading journals, including the Journal of Marketing, Journal of Marketing Research, Jour-nal of Advertising Research, Journal of Retailing, and Journal of Business, among others. In
1993, he was named a Fellow by the Society for Marketing Advances. Ron retired in 2013,
and he and his wife, Libbo, live on the Gulf of Mexico, although they may be anywhere in
North America on an Air Stream trip.
31
About the Authors
A01_BURN3261_08_GE_FM.indd 31A01_BURN3261_08_GE_FM.indd 31 30/08/16 1:29 pm30/08/16 1:29 pm

LEARNING OBJECTIVES In this chapter you will learn:
1- 1 What the relationship of marketing research to marketing, the marketing concept, and marketing strategy is
1- 2 How to defi ne marketing research
1- 3 The function and uses of marketing research
1- 4 How to describe a marketing information system (MIS) and understand why marketing research occupies a place in an MIS
Quirk’s Marketing Research Media: Welcome to the World of Marketing Research!
I started at Quirk’s just about the time the Inter-
net started changing all of our lives forever
and it has been fascinating to see the market-
ing research industry react and adapt to all
things online. Once traditional in-person focus
groups and telephone and mail-based surveys
were the gold standards. At fi rst, the hue and
cry was all about the Web-based methods’
lack of statistical validity. While wrestling with
that issue, the industry also struggled might-
ily to adopt old-style paper-and-pencil-based
approaches to the digital age.
But one look at the array of tools available to researchers today
will show you that the struggle was worth it. Thanks to the smartphone,
myriad forms of in-the-moment research are now possible, from mobile
ethnography to location-based surveys, giving marketers and research-
ers access to new and different types of insights.
Despite the outside impression of researchers as rule-following
introverts, obsessed with getting the numbers to line up just so, the
industry is full of smart, creative, and innovative people. So while big
data and do-it-yourself research tools loom as two formidable threats
to the traditional marketing researcher’s job, the same adaptable, entre-
preneurial spirit that enabled the transition from the pre-Internet days
to the smartphone era will help current and future research profession-
als to keep delivering the insights to drive their organizations’ strategic
decisions.
1 Introduction to Marketing Research
Joe Rydholm is editor
of Quirk’s Marketing
Research Media.
M01_BURN3261_08_GE_C01.indd 32M01_BURN3261_08_GE_C01.indd 32 27/08/16 4:14 pm27/08/16 4:14 pm
33
About Quirk’s In the decades before he founded and began publishing Quirk’s Marketing
Research Review in 1986, Tom Quirk worked on all sides of the marketing research
process as a corporate or client-side researcher and later as a research company
executive. A fi rm believer in the merits of marketing research, he found himself
regularly having to educate potential users of marketing research services on the
value of investigating consumer wants, needs, and opinions and the various tech-
niques that could be used to do so. Ever the entrepreneur, and seeing the need for a publi-
cation that would promote the use, understanding, and value of marketing research across
all industries, he created Quirk’s Marketing Research Review , a monthly trade magazine for
marketing research clients and the vendors that partner with them.
Armed with a newly minted B.A. in journalism from the University of Minnesota,
I interviewed with Tom in the summer of 1988 to become the magazine’s second-ever
editor-in-chief. I was impressed by his enthusiasm for marketing research and, perhaps more
importantly, by his insistence that the articles in Quirk’s , while generally aiming to promote
the value of research, should be as objective, informative, and practical as possible. His aim
was to show the many ways marketing research could be used and to give readers real-world,
concrete examples of how the methods could be applied.
In the nearly 30 years since then, the staff and I have used Tom’s words as a guide. From
its beginnings as a monthly magazine, Quirk’s Media now offers a feature-packed website and
curates and produces marketing research–related content in a variety of forms, from e-news-
letters to blogs and Webinars—all free of charge to qualifi ed marketing research and insights
professionals.
—Joe Rydholm
Source: Text and photos courtesy of Joe Rydholm and Quirk’s Marketing Research Media.
Events in recent years have brought many changes to the world of business. As
Joe Rydholm points out, these changes have profoundly influenced the marketing
research industry. These are exciting times in marketing research! Globalization has
added real meaning to the phrase “the business world.” Digital and other technological
innovations have allowed us to realize the promises of the “information age” in a few short
years. New technologies continue to change the competitive landscape with much greater
frequency than ever before. Digital media have expanded at unprecedented rates. Wide-
spread adoption of mobile devices and apps provides consumers with information 24 hours
a day. Many objects used by people collect and send information on an ongoing basis,
creating the Internet of Things (IoT). Significantly, consumers have the power, through
these online innovations, to create their own information, developing consumer-generated
feedback in real time.
Visit Quirk’s Marketing Research
Media at www.quirks.com
Marketing research provides managers with new information to help them make decisions.
M01_BURN3261_08_GE_C01.indd 33M01_BURN3261_08_GE_C01.indd 33 17/08/16 3:26 pm17/08/16 3:26 pm

34 CHAPTER 1 • INTRODUCTION TO MARKETING RESEARCH
This new era of big data and digital media not only
challenges managers to keep pace but also to under-
stand and respond to a changing world economy. Entire
countries grapple with solvency. Political revolution has
changed much of the world, and continued unrest threat-
ens more change. 1 Businesses must anticipate what
these changes will mean for their markets and capital-
ize on economic growth where it is occurring. Managers
must determine what products to make or what services
to off er, which methods of advertising are most eff ective,
which prices will help their fi rm realize its target return
on investment (ROI), and which distribution system will
add the greatest value to the supply chain.
This is where marketing research becomes impor-
tant. Marketing research is the process of gathering
information to make better decisions. This book will
help you learn the process of marketing research so that
you will better understand how to use marketing research
to develop actionable insights as you aim to manage in a
world of unprecedented change.
1- 1 Marketing Research Is Part of Marketing To fully appreciate the role of marketing research, it is helpful to understand its role in and
relationship to marketing. What is marketing ? A short defi nition is “meeting needs profi t-
ably.” 2 When Apple designed the iPad, it met a growing need among those seeking greater
computer portability in a tablet format. Amazon has been successful in creating the fi rst gen-
eration of online book readers with its Kindle tablets. 3
The American Marketing Association off ers a more detailed defi nition:
Marketing is the activity, set of institutions, and processes for creating, communicating,
delivering, and exchanging off erings that have value for customers, clients, partners,
and society at large. 4
Over recent years marketing thought has evolved to a service-centered view that (a) identifi es
core competencies, (b) identifi es potential customers who can benefi t from these core competen-
cies, (c) cultivates relationships with these customers by creating value that meets their specifi c
needs, and (d) collects feedback from the market, learns from the feedback, and improves the
values off ered to the public. Note that this view of marketing implies that fi rms must be more
than customer oriented (making and selling what fi rms think customers want and need). In addi-
tion, they must collaborate with and learn from customers, adapting to their changing needs.
A second implication is that fi rms do not view products as separate from services. “Is General
Motors really marketing a service, which just happens to include a by-product called a car ?” 5
Our objective here is not to discuss how marketing thought is evolving but to emphasize
a crucial point: To practice marketing, marketing decision makers need to make decisions.
What are our core competencies? How can we use these core competencies to create value for
our consumers? Who are our consumers and how can we collaborate with them? Managers
have always needed information to make better decisions. In our opinion, to practice market-
ing well in today’s environment requires access to more and better information. As you will
learn, marketing research provides information to decision makers.
The diff usion of digital media has created a culture that nurtures consumer collaboration.
One important collaboration method is crowdsourcing. Crowdsourcing is the practice of obtain-
ing services or ideas by asking for assistance from a large group of people, generally online
The marketing research industry is changing rapidly.
The American Marketing Association defi nes marketing as the activity, set of institutions, and processes for creating, communicating, delivering, and exchanging offerings that have value for customers, clients, partners, and society at large.
Modern marketing thought holds that fi rms should collaborate with and learn from consumers.
Crowdsourcing is the practice of obtaining services or ideas by asking for assistance from large groups of people, generally online communities.
© P
eshk
ova/
Shu
tter
stoc
k
M01_BURN3261_08_GE_C01.indd 34M01_BURN3261_08_GE_C01.indd 34 17/08/16 3:26 pm17/08/16 3:26 pm

1-1 MARKETING RESEARCH IS PART OF MARKETING 35
communities. Crowdsourcing via digital media is one of many new tools for marketing research.
Marketing Research Insight 1. 1 explains how the Danish toy company Lego uses crowdsourcing.
When fi rms make the right decisions, they produce products and services that their target
markets perceive as having value. That value translates into sales, profi ts, and a positive ROI.
However, we see many failures in the marketplace. Consultants Joan Schneider and Julie Hall
state that they regularly hear from entrepreneurs and brand managers who believe they have
come up with a revolutionary product. But Schneider and Hall state that these entrepreneurs
almost never have done the research to confi rm their grand expectations. 6 As an example, the
fi rm Cell Zones thought it had the answer to cell phone privacy in libraries, restaurants, and so
on by creating soundproof booths for private cell phone use. Had the company done the right
research and noticed that people were using their new smartphones to text rather than talk,
managers may have realized that talking in private was not a pressing need for consumers.
In many examples of failed products and services, managers could have avoided the asso-
ciated losses if they had conducted proper marketing research. Many product extensions—
taking a successful brand and attaching it to a diff erent product—have also failed. Examples
include McPizza, Colgate food entrees, BIC underwear, Coors spring water, and Harley-
Davidson perfume. Negative reactions from consumers were responsible for removing the
Ken doll’s earring and taking Burger King Satisfries off the market. 7, 8 Could these failures
have been avoided with better research information?
See “10 Worst Product Flops” at www.youtube.com . Consider
how these mistakes might have been prevented through improved marketing research methods.
Lego Crowdsources to Develop New Concepts Lego is known throughout the world for the passion it inspires in consumers of all ages for its sets of building blocks. The Dan-ish toymaker does not have offi cial statistics of the demograph-ics of its users, but the company estimates that up to half of the revenue at its stores may come from adult users, or AFoLs (Adult Fans of Lego).
To capitalize on the enthusiasm of its fans, Lego has cre-ated a web platform called “Lego Ideas,” where consumers can post ideas for new concepts (see https://ideas.lego.com/ ). On this site, users post photos and descriptions of Lego proj-ects they have built. If the concept receives 10,000 supporters within 365 days, it automatically qualifi es for a review by the company’s Lego Review Board. The website’s clear and detailed rules for submitting a project ensure that only the best ideas are posted. For example, concepts involving torture, smoking, rac-ism, or politics are prohibited.
If a concept makes it all the way through to production, the creator receives 1% of profi ts, fi ve copies of the Lego set, and credit for being the creator. Consumer-inspired Lego sets that have made it all the way to store shelves include the Mini-Big Bang Theory and the Lego Bird Project. Lego Minecraft is one of the Lego Ideas that has been particularly successful,
leading to the production of multiple versions of Minecraft sets.
Lego Ideas is part of a broader social media strategy the company pursues that includes Facebook, Instagram, Twitter, LinkedIn, and other platforms. Lego’s strategy is clearly work-ing. Based on revenue and profi ts, Lego became the biggest toymaker in the world in 2014, surpassing Mattel.
MARKETING RESEARCH INSIGHT 1. 1 Digital Marketing Research
Lego uses crowdsourcing to develop new product concepts.
© T
pfel
ler/
Shu
tter
stoc
k
Source: Grauel, T. (2014, November 28). Lego build adult fan base. USA Today. Retrieved from http://www.usatoday.com/story/news/nation/2014/11/28/lego-builds-adult-fan-base/19637025/, accessed August 24, 2015. Hansegard, J. (2015, February 25). Lego’s plan to fi nd the next big hit: Crowdsource it. Wall Street Journal. Retrieved from http://blogs.wsj.com/digits/2015/02/25/legos-plan-to-fi nd-the-next-big-hit-crowdsource-it/tab/print/, accessed August 25, 2015. Dann, K., and Jenkin M. (2015, July 23). Back from the brink: Five successful rebrands and why they worked. The Guardian. Retrieved from http://www.theguardian.com/small-business-network/2015/jul/23/fi ve-successful-rebrands-why-worked, accessed August 25, 2015. Petroff, A. (2014, September 4). Lego becomes world’s biggest toymaker. CNNMoney. Retreived from http://money.cnn.com/2014/09/04/news/companies/lego-biggest-toymaker/, accessed August 24, 2015.
Learn how Lego products go from the idea phase to the
shelves with help from con-sumers. Search “Lego Ideas Third Product Review 2014 Results” on www.youtube.com .
M01_BURN3261_08_GE_C01.indd 35M01_BURN3261_08_GE_C01.indd 35 17/08/16 3:26 pm17/08/16 3:26 pm

36 CHAPTER 1 • INTRODUCTION TO MARKETING RESEARCH
THE PHILOSOPHY OF THE MARKETING CONCEPT GUIDES MANAGERS’ DECISIONS A philosophy may be thought of as a system of values or principles by which you live. Your
values or principles are important because they dictate what you do each day. This is why
philosophies are so important; your philosophy aff ects your day-to-day decisions. For exam-
ple, you may have a philosophy similar to this: “I believe that higher education is important
because it will provide the knowledge and understanding I will need in the world to enable me
to enjoy the standard of living I desire.” Assuming this does refl ect your philosophy regarding
higher education, consider what you do from day to day. You are going to class, listening to
your professors, taking notes, reading this book , and preparing for tests. If you did not share
the philosophy we just described, you would likely be doing something entirely diff erent.
The same connection between philosophy and action holds true for business managers.
One of the most important philosophies managers have is that which determines how they
view their company’s role in terms of what it provides the market. Some managers have a
philosophy that “we make and sell product X.” A quick review of marketing history will tell
us this philosophy is known as a product orientation . Another philosophy, known as sales orientation , is illustrated by the following statement: “To be successful we must set high sales
quotas and sell, sell, sell!” 9 Managers who guide their companies by either of these philoso-
phies may guide them right out of business. A much more eff ective philosophy—the market-
ing concept—is defi ned here by prominent marketing professor Philip Kotler:
The marketing concept is a business philosophy that holds that the key to achieving
organizational goals consists of the company being more eff ective than competitors in
creating, delivering, and communicating customer value to its chosen target markets. 10
For many years, business leaders have recognized that this is the “right” philosophy.
Although the term marketing concept is often used interchangeably with other terms, such
as “ customer orientation ” or “ market-driven ,” the key point is that this philosophy puts the
consumer fi rst. 12
What does all this mean? It means that having the right philosophy is an important fi rst
step in being successful. However, appreciating the importance of satisfying consumer wants
and needs is not enough. Firms must also put together the “right” strategy.
THE “RIGHT” MARKETING STRATEGY Strategy is another name for planning. Firms have strategies in many areas other than market-
ing. Financial strategy, production strategy, and technology strategy, for example, may be key
components of a fi rm’s overall strategic plan. Here, we focus on marketing strategy. How do
we defi ne marketing strategy?
A marketing strategy consists of selecting a segment of the market as the company’s
target market and designing the proper “mix” of product/service, price, promotion, and
distribution system to meet the wants and needs of the consumers within the target market.
Because we have adopted the marketing concept, we cannot come up with just any strat-
egy. We have to develop the “right” strategy—the strategy that allows our fi rm to truly meet
the wants and needs of the consumers within the market segment we have chosen. Think of the
many questions we now must answer: What is the market, and how do we segment it? What
are the wants and needs of each segment, and what is the size of each segment? Who are our
competitors, and how are they already meeting the wants and needs of consumers? Which
segment(s) should we target? Which product or service will best suit the target market? What
is the best price? Which promotional method will be the most effi cient? How should we distrib-
ute the product/service? All these questions must be answered to develop the “right” strategy.
To make the right decisions, managers must have objective, accurate, and timely information .
The marketing concept is a business philosophy that holds that the key to achieving organizational goals consists of the company being more effective than competitors in creating, delivering, and communicating customer value to its chosen target markets. 11
A marketing strategy consists of selecting a segment of the market as the company’s target market and designing the proper “mix” of product/service, price, promotion, and distribution system to meet the wants and needs of the consumers within the target market.
See consultants Schneider and Hall at www.youtube.
com . Search “Lessons from New Product Launches—Cell Zone to iPad.”
M01_BURN3261_08_GE_C01.indd 36M01_BURN3261_08_GE_C01.indd 36 17/08/16 3:26 pm17/08/16 3:26 pm

1-2 WHAT IS MARKETING RESEARCH? 37
It is equally important to understand that today’s strategy may not work tomorrow
because, as we noted at the beginning of this chapter, there is unprecedented change going
on in the business environment. What new strategies will be needed in tomorrow’s world? As
environments change, business decisions must be revised on an ongoing basis to produce the
right strategy for the new environment.
To practice marketing, to implement the marketing concept, and to make the decisions
necessary to create the right marketing strategy, managers need information. Now you should
see how marketing research is part of marketing; marketing research supplies managers with
the information to help them make better decisions.
1- 2 What Is Marketing Research? Now that we have established that managers need information to carry out the marketing pro-
cess, we need to defi ne marketing research.
Marketing research is the process of designing, gathering, analyzing, and reporting
information that may be used to solve a specifi c marketing problem.
Thus, marketing research is defi ned as a process that reports information that can be used
to solve a marketing problem, such as determining price or identifying the most eff ective
advertising media. The focus then is on a process that results in information that will be used to
make decisions. Notice also that our defi nition refers to information that may be used to solve a
specifi c marketing problem. We will underscore the importance of specifi city later in this chap-
ter. Ours is not the only defi nition of marketing research. The American Marketing Association
(AMA) formed a committee several years ago to establish a defi nition of marketing research:
Marketing research is the function that links the consumer, customer, and public to
the marketer through information—information used to identify and defi ne marketing
opportunities and problems; generate, refi ne, and evaluate marketing actions; monitor
marketing performance; and improve the understanding of marketing as a process. 13
Each of these defi nitions is correct. Our defi nition is shorter and illustrates the process
of marketing research. The AMA’s defi nition is longer because it elaborates on the function
as well as the uses of marketing research. In following sections, we will talk more about the
function and uses of marketing research.
IS IT MARKET ING RESEARCH OR MARKET RESEARCH? Some people diff erentiate between market ing research and market research. Marketing
research is defi ned the way we and the AMA have defi ned it in previous paragraphs. In fact,
the Marketing Research Association (MRA) defi nes this term similarly as a process used by
businesses to collect, analyze, and interpret information used to make sound business deci-
sions and successfully manage the business. In comparison, some defi ne mark et research as
a subset of market ing research, using this term to refer to applying marketing research to a
specifi c market area. The MRA defi nes market research as a process used to defi ne the size,
location, and/or makeup of the market for a product or service. 14 Having made this distinc-
tion, we recognize that many practitioners, publications, organizations serving the industry,
and academics use the two terms interchangeably.
THE FUNCTION OF MARKETING RESEARCH The AMA defi nition states that the function of marketing research is to link the consumer
to the marketer by providing information that can be used in making marketing decisions.
Note that the AMA defi nition distinguishes between consumers and customers . The commit-
tee intended this diff erentiation between retail (or B2C) consumers and business (or B2B)
Marketing research is the process of designing, gathering, analyzing, and reporting information that may be used to solve a specifi c marketing problem.
While the terms marketing research and market research are sometimes used interchangeably, market research refers to applying marketing research to a specifi c market.
The function of marketing research is to link the consumer to the marketer.
M01_BURN3261_08_GE_C01.indd 37M01_BURN3261_08_GE_C01.indd 37 17/08/16 3:26 pm17/08/16 3:26 pm

38 CHAPTER 1 • INTRODUCTION TO MARKETING RESEARCH
customers. Some believe that having the link to the con-
sumer by marketing research is more important today
than ever. Having that link with consumers is crucial if
fi rms are to provide them with the value they expect in
the marketplace. Thanks to globalization, online shop-
ping, and social media, consumers today have more
choices, more information, and more power to speak to
others in the market than ever before.
1- 3 What Are the Uses of Marketing Research? The AMA defi nition also spells out the diff erent uses
of marketing research. The three uses are (1) identify-
ing market opportunities and problems, (2) generating,
refi ning, and evaluating potential market actions, and
(3) monitoring marketing performance. We explain each
of these further in the following sections.
IDENTIFYING MARKET OPPORTUNITIES AND PROBLEMS The fi rst of these uses is the identifi cation of market opportunities and problems. It is not
easy to determine what opportunities are in the market. Although we can think of new
product or service ideas, which ones are actually feasible? Which ideas can we accom-
plish, and which will mostly likely generate a good ROI? Often, after someone has found
an opportunity by creating a highly successful product or service, managers ask, “Why
didn’t we see that opportunity?” Some marketing research studies are designed to fi nd out
what consumers’ problems are and to assess the suitability of diff erent proposed meth-
ods of resolving those problems. High gasoline prices and concerns about fossil emissions
bothered consumers, so Toyota developed the Prius. Consumers wanted increasingly large
TV screens to hang on their walls, so Samsung developed an ultra-thin, LED, large-screen
TV. Consumers who did not have cable wanted to be able to buy HBO, so HBO developed
HBO Now.
You would think that managers would always know what their problems are. Why would
problem identifi cation be a use of marketing research? Problems are not always easy to iden-
tify. Managers are more likely to always know the symptoms (sales are down, market share is
falling), but determining the cause of the symptoms sometimes requires research. The identi-
fi cation of opportunities and problems is discussed in Chapter 3 .
GENERATING, REFINING, AND EVALUATING POTENTIAL MARKETING ACTIONS Marketing research can also be used to generate, refi ne, and evaluate a potential marketing
action. Here “actions” may be thought of as strategies, campaigns, programs, or tactics. Gen-
eral Mills acquired Annie’s Homegrown, an organic food company, in 2014 to meet a grow-
ing demand by consumers to have access to organic and natural foods. “Actions” of General
Mills included generating the basic strategy to meet consumers’ growing desire for organic
foods, refi ning the Annie’s brand by identifying ways to promote Annie’s established products
and develop new products that are consistent with the brand culture, and evaluating plans to
market and grow the Annie’s brand. Management can use marketing research to make better
decisions for any and all of these actions.
We can think of “actions” as strategies, and strategies involve selecting a target mar-
ket and designing a marketing mix to satisfy the wants and needs of that target market.
Marketers use research to determine the value that consumers
perceive in products.
© R
ober
t K
nesc
hke/
Shu
tter
stoc
k
M01_BURN3261_08_GE_C01.indd 38M01_BURN3261_08_GE_C01.indd 38 17/08/16 3:26 pm17/08/16 3:26 pm

1-3 WHAT ARE THE USES OF MARKETING RESEARCH? 39
Marketing research is conducted in a variety of areas, including determining target mar-
kets and conducting product research, pricing research, promotion research, and distribution
research.
Selecting Target Markets A great deal of marketing research is conducted to determine
the size of various market segments. Not only are managers interested in knowing the size of
the market segment that wants an all-electric vehicle but also they want to know if that seg-
ment is growing or shrinking and how well competitors are fulfi lling the wants and needs of
that segment. If research shows that a signifi cantly large segment of the market has identifi -
able needs, the segment is growing; if its needs are either not being met or being met poorly
by competition, this segment becomes an ideal candidate for a target market. Now the com-
pany must determine how well its core competencies will allow it to satisfy that segment’s
demand . Nissan very likely looked at the automobile market segments in terms of the number
of miles driven in a day (we will consider this factor in Chapter 5 on secondary data) . The
company must have found a sizable segment that drives under 90 miles a day, because that is
the range of its all-electric car, the Leaf.
Product Research Successful companies are constantly looking for new products and ser-
vices. They know the lesson of the product life cycle: Products will eventually die. As a result,
they must have a process in place to identify and test new products. Testing may begin with
idea generation and continues with concept tests that allow fi rms to quickly and inexpensively
get consumers’ reactions to the concept of a proposed new product. Research studies are con-
ducted on the proposed brand names and package designs of products before commercializa-
tion. Maritz Research conducts a New Vehicle Customer Study . The company has collected
data over several years, and in recent years it has studied hybrids. Its market analysts know
why drivers purchase hybrids, what makes them satisfi ed, what their expectations are for gas
mileage and preferences for alternative fuels. 15
Pricing Research When a revolutionary new product is created, marketers use research
to determine the “value” consumers perceive in the new product. When cable TV was intro-
duced, research was conducted to give the early cable providers some clue as to what people
would be willing to pay for clear reception and a few additional channels. When cellular
phones were introduced, much research was conducted to see what people would be willing
to pay for (what was then) a revolutionary “portable” telephone. Marketing research is also
conducted to determine how consumers will react to diff erent types of pricing tactics such as
“buy one, get one free” versus a “one-half-off ” price off er. Using qualitative research in the
form of asking potential buyers a series of open-ended questions—a qualitative research tech-
nique called “purchase story research”—a researcher found that the way a fi rm categorized its
products negatively aff ected how B2B buyers had to use their purchase accounts. When items
were recategorized, sales went up. 16
Promotion Research As fi rms spend dollars on promotion, they want to know how eff ec-
tive those expenditures are for the advertising, sales force, publicity/PR, and promotional
off ers. Firms also conduct research on the eff ectiveness of diff erent media. Is online advertis-
ing more cost-eff ective than traditional media such as TV, radio, newspaper, and magazine
advertising? As an example of promotion research, Chobani launched a campaign, called
“The Break You Make,” in 2015 to increase awareness of the Chobani Flip, an afternoon
snack yogurt. Research determined that the promotion was very successful, with sales of
Chobani Flip up 300% over the previous year. As a result Chobani extended and expanded the
campaign. 17
Distribution Research What are the best channels to get our product to consumers? Where
are the best dealers for our product, and how can we evaluate the service they provide? How
satisfi ed are our dealers? Are our dealers motivated? Should we use multichannel distribution?
M01_BURN3261_08_GE_C01.indd 39M01_BURN3261_08_GE_C01.indd 39 17/08/16 3:26 pm17/08/16 3:26 pm

40 CHAPTER 1 • INTRODUCTION TO MARKETING RESEARCH
How many distributors should we have? These
are but a few of the crucial questions managers
may answer through marketing research.
MONITORING MARKETING PERFORMANCE Control is a basic function of management.
To assess performance on some variables,
marketing research is often used. Sales infor-
mation by SKU (stock-keeping unit) and by
type of distribution, for example, is often
gathered through tracking data collected at
point-of-sale terminals as consumer pack-
aged goods are scanned in grocery stores,
mass merchandisers, and convenience stores.
Scanner data allow managers to monitor their
brands’ sales as well as sales of competitors—
and thus to monitor their market shares as well.
Firms use marketing research to monitor other
variables such as their employees’ and cus-
tomers’ satisfaction levels. For example, the
research fi rm MSR Group conducted a rolling
tracking study measuring drivers of bank cus-
tomer satisfaction. The nationwide study allows banks to identify factors that determine
advocates and loyal, at-risk, and critical customer relationships. 18 Research fi rms such as
the Nielsen Corporation and IRI monitor the performance of products in supermarkets and
other retail outlets. They track how many units of these products are sold, through which
chains, at what retail price, and so on. You will learn more about tracking studies in Chap-
ter 5 . Tracking social media, which has grown quickly the world over, is another means of
monitoring market performance. Research fi rms have developed services that monitor what
people are saying about companies, brands, and competitors.
IMPROVING MARKETING AS A PROCESS Improving our understanding of the marketing process entails conducting research to expand
our knowledge of marketing. Typical of such basic research would be attempts to defi ne and
classify marketing phenomena and to develop theories that describe, explain, and predict
marketing phenomena. Marketing professors at colleges and universities and other not-for-
profi t organizations, such as the Marketing Science Institute, often conduct basic research and
publish their results in journals such as the Journal of Marketing Research or the Journal of Marketing .
The aim of basic research is to expand our knowledge rather than to solve a specifi c
problem. For example, research published in the Journal of Marketing Research may inves-
tigate the psychological process consumers go through in deciding how long to wait for a
service to be provided. This research is not conducted for any specifi c company problem but
rather to increase our understanding of how to satisfy consumers of services. 19 However, this
basic research could be valuable to AT&T if the company were conducting an analysis of
consumer reactions to diff erent wait times in its stores, which may be a specifi c problem fac-
ing AT&T. Research conducted to solve specifi c problems is called applied research , which
represents the vast majority of marketing research studies. For the most part, marketing
research fi rms are conducting research to solve a specifi c problem facing a company. We will
revisit the idea that marketing research solves specifi c problems a little later in this chapter.
Marketing research is used to monitor marketing performance.
Applied research is research that is conducted to solve specifi c problems.
Basic research is research that is conducted to expand knowledge rather than to solve a specifi c problem.
© 1
23rf
M01_BURN3261_08_GE_C01.indd 40M01_BURN3261_08_GE_C01.indd 40 17/08/16 3:26 pm17/08/16 3:26 pm

1-4 THE MARKETING INFORMATION SYSTEM 41
MARKETING RESEARCH IS SOMETIMES WRONG Marketing research does not always provide manage-
ment with the right answer. General Motors, for exam-
ple, did research on what was to become the minivan—a
small van that would be suitable for families—but the
research did not convince the carmaker to produce a van.
Shortly thereafter, Chrysler introduced the Dodge Cara-
van and Plymouth Voyager minivans, which turned out
to be among the most successful models in automotive
history. 20 A beer ad in the United Kingdom was deemed
by marketing research to be inadequate, but manage-
ment disagreed. When the ad ran, it was very success-
ful. 21 The marketing research on the pilot of Seinfeld
indicated the TV show would be a fl op. Six months later,
a manager questioned the accuracy of the research and
gave the show another try. Seinfeld became one of the most successful shows in television
history. 22 When Duncan Hines introduced its line of soft cookies, marketing research studies
showed that 80% of customers who tried Soft Batch cookies stated they would buy them in
the future. They didn’t. 23
Anyone who observes the marketplace will see products and services introduced and
then taken off the market because they do not live up to expectations. Some of these failures
are brought to market without any research, which increases their probability of failure.
However, as we have learned, even when products are brought to market with the benefi t
of marketing research, the predictions are not always accurate, but this does not mean that
marketing research is not useful. Remember, most marketing research studies are trying
to understand and predict consumer behavior, which is a diffi cult task. The fact that the
marketing research industry has been around for many years and is growing means that it
has passed the toughest of all tests to prove its worth—the test of the marketplace. If the
industry did not provide value, it would cease to exist. For each of the failed examples cited
previously, there are tens of thousands of success stories supporting the use of marketing
research.
1- 4 The Marketing Information System Managers have recognized the importance of information as an asset to be managed for many
years. The advent of computer technology in the 1960s allowed the dream of information
management to become a reality. During the decades since, sophisticated management infor-
mation systems have evolved that attempt to put the right information at the right time in
the right format into the hands of those who must make decisions. Management information
systems typically have subsystems to provide the information necessary for a functional area
within an organization. Such subsystems are the accounting information system, fi nancial
information system, production information system, human resources information system,
and marketing information system. Thus far, we have presented marketing research as if it
were the only source of information. This is not the case, as you will understand by reading
this section on marketing information systems.
Marketing decision makers have a number of sources of information available to them.
We can understand these diff erent information sources by examining the components of the
marketing information system (MIS) . An MIS is a structure consisting of people, equip-
ment, and procedures to gather, sort, analyze, evaluate, and distribute needed, timely, and
accurate information to marketing decision makers. 24 The role of the MIS is to determine
decision makers’ information needs, acquire the needed information, and distribute that
Marketing research is sometimes wrong.
Marketing research is not always correct. In the classic
1980’s movie Big , Tom Hanks’s character gives a toy company the insight it really needed—a kid’s perspective ! Go to www.youtube.com and enter “Tom Hanks in BIG ‘I Don’t Get It’ by Therototube.”
An MIS is a structure consisting of people, equipment, and procedures to gather, sort, analyze, evaluate, and distribute needed, timely, and accurate information to marketing decision makers. 25
© K
aren
Roa
ch/S
hutt
erst
ock
M01_BURN3261_08_GE_C01.indd 41M01_BURN3261_08_GE_C01.indd 41 17/08/16 3:26 pm17/08/16 3:26 pm

42 CHAPTER 1 • INTRODUCTION TO MARKETING RESEARCH
information to the decision makers in a form and at a time when they can use it for decision
making. This sounds very much like what we have been saying about marketing research—
providing information to aid in decision making. Learning the components of an MIS will
help to establish some distinctions.
COMPONENTS OF AN MIS As noted previously, the MIS is designed to assess managers’ information needs, to gather
this information, and to distribute the information to the marketing managers who need to
make decisions. Information is gathered and analyzed by the four subsystems of the MIS:
internal reports, marketing intelligence, marketing decision support, and marketing research.
We discuss each of these subsystems next.
Internal Reports System Much information is generated in normal, daily transactions.
When you make a purchase at a grocery store, management has a record of the SKUs you
purchased, payment method, coupons or special promotions used, store location, and day of
week and time of day. When that same grocery store orders supplies of foods, it has a pur-
chase requisition and a shipping invoice from the supplier fi rm that ships the goods. Once
all these forms of data are gathered, they serve as a source of information for managers. The
internal reports system gathers information generated within a fi rm, including orders, bill-
ing, receivables, inventory levels, stockouts, and so on. In many cases, the internal reports
system is called the accounting information system. Although this system produces fi nancial
statements (balance sheets and income statements, etc.) that generally contain insuffi cient
detail for many marketing decisions, the internal reports system is a source of extreme detail
on both revenues and costs that can be invaluable in making decisions. Other information
is also collected, such as inventory records, sales calls records, and orders. A good internal
reports system can tell a manager a great deal of information about what has happened in the
past. When information is needed from sources outside the fi rm, marketing researchers must
call on other MIS components.
Marketing Intelligence System The marketing intelligence system is defi ned as a set
of procedures and sources used by managers to obtain everyday information about pertinent
developments in the environment. Consequently, the intelligence system focuses on bringing
in information generated outside the fi rm. Such systems include both informal and formal
information-gathering procedures. Informal information-gathering procedures involve activi-
ties such as scanning newspapers, magazines, and trade publications. Staff members assigned
the specifi c task of looking for anything that seems pertinent to the company or industry
may conduct formal information-gathering activities. They then edit and disseminate this
information to the appropriate members or company departments. Formerly known as “clip-
ping bureaus” (because they clipped relevant newspaper articles for clients), several online
information service companies, such as Lexis-Nexis, provide marketing intelligence. To use
its service a fi rm would enter key terms into search forms provided online by Lexis-Nexis.
Information containing the search terms appears on the subscriber’s computer screen as often
as several times a day. By clicking on an article title, subscribers can view a full-text version
of the article. In this way, marketing intelligence goes on continuously and searches a broad
range of information sources to bring pertinent information to decision makers.
Marketing Decision Support System (DSS) The third component of an MIS is the
decision support system. A marketing decision support system (DSS) is defi ned as col-
lected data that may be accessed and analyzed using tools and techniques that assist managers
in decision making. Once companies collect large amounts of information, they store this
information in huge databases that, when accessed with decision-making tools and techniques
(such as break-even analysis, regression models, and linear programming), allow companies
The internal reports system gathers information generated within a fi rm, including orders, billing, receivables, inventory levels, stockouts, and so on.
The marketing intelligence system is defi ned as a set of procedures and sources used by managers to obtain everyday information about pertinent developments in the environment.
A marketing decision support system (DSS) is defi ned as collected data that may be accessed and analyzed using tools and techniques that assist managers in decision making.
M01_BURN3261_08_GE_C01.indd 42M01_BURN3261_08_GE_C01.indd 42 17/08/16 3:26 pm17/08/16 3:26 pm

1-4 THE MARKETING INFORMATION SYSTEM 43
to ask “what if” questions. Answers to these questions are then immediately available for
decision making. For example, salespersons complete daily activity reports showing custom-
ers they called on during the day and orders written. These reports are uploaded to the com-
pany databases routinely. A sales manager can access these reports and, using spreadsheet
analysis, he or she can quickly determine which salespersons are at, above, or below quota for
that day of the month.
Marketing Research System Marketing research, which we have already discussed
and defi ned, is the fourth component of an MIS. Now that you have been introduced to the
three other components of an MIS, we are ready to address a new question: If marketing
research and an MIS are both designed to provide information for decision makers, how are
the two diff erent? In answering this question, we must see how marketing research diff ers
from the other three MIS components.
Active Learning
Use Google Alerts to Create Your Own Intelligence System
You can create your own intelligence system through Google, which offers a free service called Google Alerts ( https://www.google.com/alerts ). By entering key words, you will receive emails from Google Alerts whenever something appears with those key words. You can spec-ify searching everything that appears on the Internet or limit results to search only blogs, videos, or books. What value would this be to you? If you have a paper to write for the end of term, this service will allow you to gather information all term as it occurs. Or, if you have an interview coming up, you may want to track the latest information about the company or industry. You will receive email results daily.
Marketing research can help retailers understand consumers’ demand for delivery or pick-up services .
© G
lend
a/S
hutt
erst
ock
M01_BURN3261_08_GE_C01.indd 43M01_BURN3261_08_GE_C01.indd 43 17/08/16 3:26 pm17/08/16 3:26 pm

44 CHAPTER 1 • INTRODUCTION TO MARKETING RESEARCH
First, the marketing research system gathers information not gathered by the other MIS
component subsystems: Marketing research studies are conducted for a specifi c situation fac-
ing the company. It is unlikely that other components of an MIS have generated the particu-
lar information needed for the specifi c situation. When Walmart was designing Walmart To
Go, the retailer’s online service that off ers delivery or pick-up services in select markets,
management had several service options available to off er customers. Could managers get
information about what today’s shopper will most prefer from the internal reports system?
No. Could they get useful information from their intelligence system? No. Could they get
information from their DSS? Not really. Marketing research can provide information to help
Walmart understand what grocery delivery and pick-up services will be most appealing to
today’s consumers.
To consider another example, when People magazine wants to know which of three cover
stories it should use for this week’s publication, can its managers obtain that information from
internal reports? No. From the intelligence system or the DSS? No. Filling this information
gap is how marketing research plays a unique role in a fi rm’s total information system. By
providing information for a specifi c problem, marketing research provides information not
provided by other components of the MIS. This is why marketing research studies are some-
times referred to as “ad hoc studies.” Ad hoc is Latin for “with respect to a specifi c purpose.”
(Recall that earlier in the chapter when we defi ned marketing research, we said we would
revisit the word specifi c . Now you see why we used that word in our defi nition.)
A fi nal characteristic of marketing research diff erentiates it from the other MIS compo-
nents. Although this diff erence does not justify the existence of marketing research in the MIS,
it is notable. Marketing research projects, unlike the other components, are not continuous—
they have a beginning and an end. This is why marketing research studies are sometimes
referred to as “projects.” The other components are available for use on an ongoing basis.
However, marketing research projects are launched only when there is a justifi able need for
information that is not available from internal reports, intelligence, or the DSS.
Summary
Globalization and digital innovations have dramatically
changed the pace of change in the business world. Yet
managers must still make decisions, and the role of mar-
keting research is to provide information to help managers
make better decisions. Because marketing research is part
of marketing, to understand marketing research, we must
understand the role it plays in marketing. The American
Marketing Association (AMA) defi nes marketing as the
activity, set of institutions, and processes for creating, com-
municating, delivering, and exchanging off erings that have
value for customers, clients, partners, and society at large.
There are new frameworks for understanding marketing.
Advances in social media have increased the opportunities
for marketers to “listen” to their consumers and even to col-
laborate with them. Firms are creating products, such as
Adobe Social Analytics and Hootsuite, allowing managers
to fi nd out what consumers are saying about them on social
media and helping those fi rms collaborate with their cus-
tomers using social media. Marketers must “hear the voice
of the consumer” to determine how to create, communicate,
and deliver value that will result in long-lasting relation-
ships with customers. Some fi rms “listen” to their custom-
ers and have success; others do not and experience product
and service failures. There are many examples of product
failures including Life-Savers sodas, Colgate food entrees,
and Frito-Lay lemonade. In all these cases managers might
have made better decisions with better information.
Because philosophies guide our day-to-day decisions,
marketers should follow the philosophy known as the mar-keting concept . The marketing concept states that the key to
business success lies in being more eff ective than competi-
tors in creating, delivering, and communicating customer
value to chosen target markets. Companies whose philoso-
phy focuses on products and selling eff orts do not tend to
stay around long. If a fi rm’s management follows the mar-
keting concept philosophy, it develops the “right” strate-
gies, or plans, to provide consumers with value. In short, to
practice marketing as we have described it, managers need
information to determine wants and needs and to design
marketing strategies that will satisfy customers in selected
The marketing research system gathers information for a specifi c situation facing the company.
M01_BURN3261_08_GE_C01.indd 44M01_BURN3261_08_GE_C01.indd 44 17/08/16 3:26 pm17/08/16 3:26 pm

REVIEW QUESTIONS/APPLICATIONS 45
target markets. Furthermore, environmental changes mean
that marketers must constantly collect information to moni-
tor customers, markets, and competition.
One defi nition of marketing research is that it is the
process of designing, gathering, analyzing, and reporting
information that may be used to solve a specifi c problem.
The AMA defi nes marketing research as the function
that links the consumer, customer, and public to the mar-
keter through information—information used to identify
and defi ne marketing opportunities and problems; gen-
erate, refi ne, and evaluate marketing actions; monitor
marketing performance; and improve the understanding
of marketing as a process. Some diff erentiate between
market ing research and market research. Marketing
research is the broader of the two names and refers to
the process of gathering, analyzing, and reporting infor-
mation for decision-making purposes. Market research
refers to applying marketing research to a specifi c mar-
ket. However, in practice, the two names are often used
interchangeably.
To link the consumer to the marketer by providing
information to use in making marketing decisions is the
function of marketing research. The uses of marketing
research are to (1) identify and defi ne marketing oppor-
tunities and problems; (2) generate, refi ne, and evaluate
marketing actions; (3) monitor marketing performance;
and (4) improve our understanding of marketing. Most
marketing research that is conducted to solve specifi c
problems is considered to be applied research. A lim-
ited number of marketing research studies conducted to
expand the limits of our knowledge would be considered
basic research.
If marketing research provides information to make
marketing decisions, why should we also have a marketing
information system (MIS)? Actually, marketing research
is part of an MIS. Marketing research is only one of four
subsystems making up an MIS. Other subsystems include
internal reports, marketing intelligence, and decision sup-
port systems. Marketing research gathers information not
available through the other subsystems. Marketing research
provides information for the specifi c problem at hand. Mar-
keting research is conducted on a project basis and has a
beginning and end. The other MIS components operate
continuously, 24/7.
Key Terms
Marketing (p. 34 )
Crowdsourcing (p. 34 )
Marketing concept (p. 36 )
Marketing strategy (p. 36 )
Marketing research (p. 37 )
Market research (p. 37 )
Function of marketing research
(p. 37 )
Basic research (p. 40 )
Applied research (p. 40 )
Marketing information system (MIS)
(p. 41 )
Internal reports system (p. 42 )
Marketing intelligence system
(p. 42 )
Marketing decision support system
(DSS) (p. 42 )
Marketing research system (p. 44 )
Review Questions/Applications
1- 1. What is marketing? What is the relationship of mar-
keting research to marketing?
1- 2. Why is it important for decision makers to have phi-
losophies? What is the marketing concept and what
is its relationship to marketing research?
1- 3. What is a marketing strategy, and why is marketing
research important to strategy makers?
1- 4. Defi ne marketing research. What is the diff erence
between marketing research and market research?
1- 5. What is the function of marketing research?
1- 6. Name four major uses of marketing research. Provide
one example of each of the uses.
1- 7. Which use of marketing research is considered basic
research?
1- 8. Give your own example to illustrate a marketing
research study that may be used in (a) improving
marketing as a process, (b) monitoring marketing per-
formance, (c) generating potential marketing actions,
and (d) identifying market opportunities and problems.
1- 9. How would you distinguish between product and
market-driven orientation? Which approach is more
likely to be infl uenced by market research and why?
1- 10. Distinguish among MIS (marketing information sys-
tem), marketing research, and DSS (decision support
system).
1- 11. Why must modern marketers collaborate and learn
from their consumers? What has increased the oppor-
tunities for marketers to collaborate with them?
1- 12. Go online and search for leading marketing research
companies. Look through their websites and blog
sections. Identify and give examples of some case
studies of their work mentioned on the blog.
M01_BURN3261_08_GE_C01.indd 45M01_BURN3261_08_GE_C01.indd 45 17/08/16 3:26 pm17/08/16 3:26 pm

46 CHAPTER 1 • INTRODUCTION TO MARKETING RESEARCH
1- 13. A business is planning to expand internationally.
They intend to gradually replace the existing arrange-
ments and set up new offi ces and channels with dis-
tributors in the international market. Suggest what
information the company’s management would need
to take these decisions. How can they gather and
evaluate the necessary information? Will the infor-
mation needs change from country to country?
1- 14. In the following situations, what component of the
marketing information system would a manager use
to fi nd the necessary information?
a. A manager of an electric utilities fi rm hears a
friend at lunch talk about a new breakthrough in
solar panel technology she read about in a science
publication.
b. A manager wants to know how many units of
three diff erent products in the company sold dur-
ing each month for the past three years.
c. A manager wants to estimate the contribution to
company return on investment earned by 10 dif-
ferent products in the company product line.
d. A manager is considering producing a new type
of health food. He would like to know if consum-
ers are likely to purchase the new food, at which
meal they would most likely eat the food, and
how they would prefer the food to be packaged.
CASE 1. 1
Anderson Construction
Larry Anderson is president of Anderson Construction. The
fi rm had been in business for almost fi ve years when the
housing industry crashed with the Wall Street debacle of
2008. Although Anderson had quickly become profi table
in the building business, it was a time when nearly every-
one in construction was making profi ts, as the industry had
been overinfl ated by a boom based on banking fees rather
than real demand. To make a reputation, the company had
invested heavily in the selection of a superior construction
crew. Larry had followed a strategy of hiring only person-
nel with high levels of training and experience. This had
given him the ability to be versatile. His well-experienced
staff of employees gave him the ability to take on a variety
of construction projects. By 2012, Anderson was one of the
few fi rms left in town. Most construction fi rms had gone
out of business trying to wait out the housing bust. Ander-
son had remained afl oat with a few good employees and
very limited demand among a few individuals who were
interested in building custom homes. Because Larry had
invested in his personnel with better pay and continuous
training, he had many former employees who stayed in
touch with him. These employees were eager to go back
to work for Anderson and were biding their time in one or
more part-time jobs.
Larry was not accustomed to doing marketing research.
Starting his business at the time of an artifi cial building
boom, he had what seemed like an endless supply of job
opportunities on which to bid. The only research Larry had
conducted during those formative years was exploration to
fi nd key personnel and to keep up with building materials
and building code changes. Now, as Larry had only two
custom-home jobs in the queue, he began to worry about
how he could fi nd more work for his construction crews.
He wondered if marketing research would be of any help.
1. Explain why you think Larry should or should not look
into doing marketing research.
2. In thinking about the components of a marketing infor-
mation system, which components would you suggest
Larry use and why?
CASE 1. 2 INTEGRATED CASE
Auto Concepts
Nick Thomas is the CEO of Auto Concepts, a new divi-
sion of one of the largest U.S. automobile manufacturers
with multiple divisions representing several auto and truck
brands. This company has been slowly losing market share
to other competitors. Auto Concepts was created to develop
totally new models that are more in tune with today’s
changing automobile market. A primary consideration in
this development eff ort is the U.S. Department of Energy’s
Clean Cities Initiative that advocates the use of alternative
automobile fuels such as propane, natural gas, biodiesel,
electric, hybrid, and/or ethanol. At the same time, man-
agement believes that the Internet of Things (IoT) with its
M01_BURN3261_08_GE_C01.indd 46M01_BURN3261_08_GE_C01.indd 46 17/08/16 3:26 pm17/08/16 3:26 pm

capabilities of safe mobile connections, self- or assisted-
driving, infotainment, on-board diagnostics, and more will
be a prominent part of future vehicles.
Nick Thomas knows he must come up with some in-
novations in automobile design and engineering, but he
is not certain in which direction he should guide his divi-
sion. Nick realizes that he needs to fi nd out what consum-
ers’ attitudes are toward fuel prices and global warming.
This knowledge will help him determine a direction for the
company in terms of automobile design. Nick also needs
more data on consumer preferences. Will they want to stay
with today’s standard compacts or hybrids, or might they
be interested in radically diff erent models that promise
much higher fuel economies?
1. In the development of new automobile models, which
of the following should Nick be primarily concerned
with and why?
a. Engineering and production feasibility
b. The brand image of his division’s parent U.S. auto-
mobile manufacturer
c. Technological innovation
d. Consumer preferences
2. Should Nick use marketing research?
REVIEW QUESTIONS/APPLICATIONS 47
M01_BURN3261_08_GE_C01.indd 47M01_BURN3261_08_GE_C01.indd 47 17/08/16 3:26 pm17/08/16 3:26 pm

LEARNING OBJECTIVES In this chapter you will learn:
2- 1 A brief history of the marketing research industry
2- 2 The different types of marketing research fi rms
2- 3 The industry structure of marketing research
2- 4 New challenges to the marketing research industry
2- 5 The areas of ethical sensitivity in the marketing research process and industry initiatives for self-improvement
2- 6 How to investigate careers in the marketing research industry
University of Georgia Terry College of Business: The Master of Marketing Research Program
Fast-changing customer needs have caused
companies to realize they must constantly
be in touch with their customers. Further,
the explosion of available consumer data
has led businesses to develop and improve
their capabilities to turn data into business
actions. Businesses turn to the marketing
research function, sometimes called con-
sumer insights, to accomplish these goals.
Consequently, those in the marketing
research profession fi nd that it is rewarding
and fascinating as well as highly valued.
In the current business environment, U.S.
News & World Report reports that the Bureau
of Labor Statistics predicts a 31.6% employ-
ment increase between 2012 and 2022
resulting in 131,500 new marketing research
job openings.
The University of Georgia’s (UGA) Terry College of Business wel-
comed its fi rst Master of Marketing Research (MMR) class in 1980.
The MMR program was the fi rst of its kind in the United States and is
internationally regarded as the standard of comparison for such pro-
grams. Acknowledging the need for high-caliber marketing research-
ers, UGA faculty and leading marketing professionals have joined forces
to develop a curriculum to prepare students for careers in marketing
research. The coursework is designed to provide students with technical
skills as well as an understanding of strategic marketing issues from both
the client and supplier sides of the industry.
2 The Marketing Research Industry
Charlotte Mason,
Marketing Department
Head and MMR
Program Director;
C. Herman and
Mary Virginia Terry
Chair of Business
Administration;
Director, Coca-Cola
Center for Marketing
Studies
M02_BURN3261_08_GE_C02.indd 48M02_BURN3261_08_GE_C02.indd 48 27/08/16 4:28 pm27/08/16 4:28 pm

49
The industry has evolved with the ever-changing digital
revolution, and the MMR program curriculum has evolved
accordingly. Career opportunities today are practically limit-
less. Long-term prospects for MMRs are exceptional. Newly
graduated MMRs move quickly into project manager, senior
analyst, and marketing research or consumer insight man-
ager roles. Many MMR alumni are now directors of consumer
insights and analytics at client fi rms or senior vice presidents
at suppliers and agencies.
Terry’s MMR students surpass high entrance require-
ments and are immersed in a rigorous academic program
including hands-on use of the same analytic tools and
research methods used in the industry. The ultimate goal is
to apply these methods to gain insights that guide business
decisions. In addition to research methods, the MMR pro-
gram emphasizes business applications to identify appropri-
ate marketing strategy and tactics.
The MMR program gives students an understanding of data acquisition issues, analytic
tools, and skills required for insight extraction and dissemination. MMR students learn how
to design marketing research projects focused on specifi c business problems, analyze data
using sophisticated statistical methods, prepare and present high-impact reports, and serve
as market intelligence consultants to managers. The program maintains ties with many part-
ner corporations who, as advisory board members, guide program content for standards and
relevance. The program is structured to encompass the tools and techniques, business acu-
men, and “soft” skills necessary to succeed in the industry.
Terry MMR graduates are characterized by their industry knowledge and practical experi-
ence. A sense of collaboration is instilled in MMR students through numerous team projects.
This prepares students to succeed in team environments. As a result, MMR graduates are
highly sought by both marketing research suppliers and marketing research departments of
major corporations. The program essentially has a 100% placement record. With 600 MMR
alumni, the program’s graduates hold many leadership positions in the marketing research/
consumer insights industry. Many alumni maintain close ties to the program, providing a valu-
able network for themselves and new graduates. It’s no wonder that the Terry College MMR
program remains the leader in marketing research education.
—Charlotte Mason
Source: Text and Images by permission, University of Georgia Terry College of Business: The Master of Marketing Research Program.
The Terry College of Business, located in Athens, Georgia,
recently completed the fi rst phase of its new Business
Learning Community. Correll Hall houses all graduate
programs. For more information, visit terry.uga.edu/mmr .
M02_BURN3261_08_GE_C02.indd 49M02_BURN3261_08_GE_C02.indd 49 27/08/16 4:28 pm27/08/16 4:28 pm
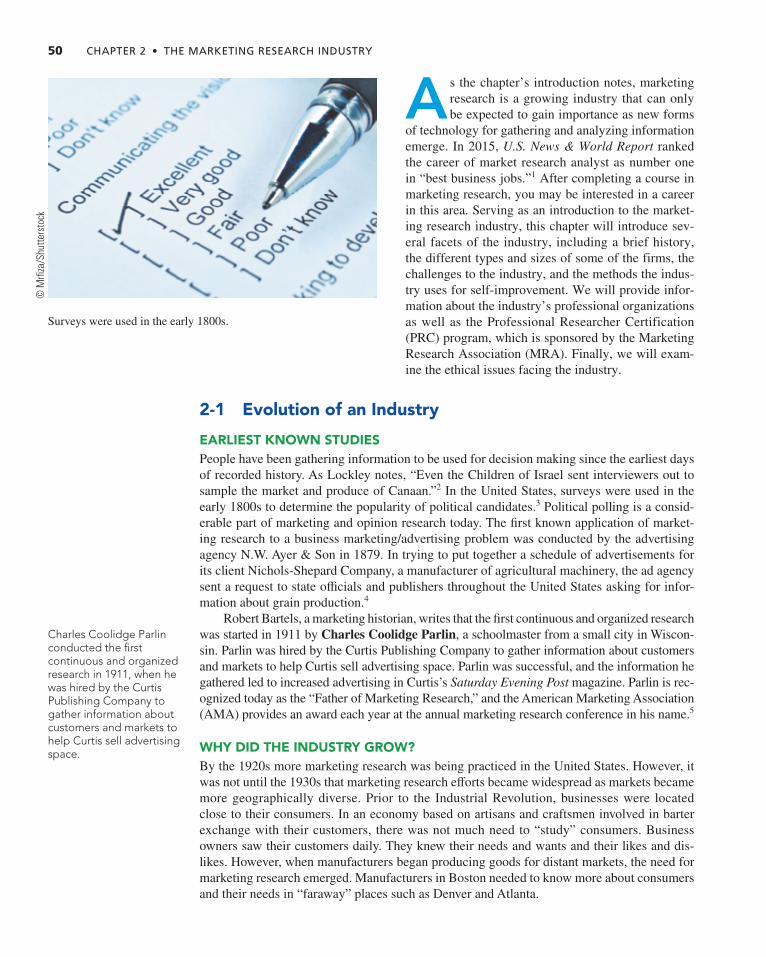
50 CHAPTER 2 • THE MARKETING RESEARCH INDUSTRY
A s the chapter’s introduction notes, marketing
research is a growing industry that can only
be expected to gain importance as new forms
of technology for gathering and analyzing information
emerge. In 2015, U.S. News & World Report ranked
the career of market research analyst as number one
in “best business jobs.” 1 After completing a course in
marketing research, you may be interested in a career
in this area. Serving as an introduction to the market-
ing research industry, this chapter will introduce sev-
eral facets of the industry, including a brief history,
the different types and sizes of some of the firms, the
challenges to the industry, and the methods the indus-
try uses for self-improvement. We will provide infor-
mation about the industry’s professional organizations
as well as the Professional Researcher Certification
(PRC) program, which is sponsored by the Marketing
Research Association (MRA). Finally, we will exam-
ine the ethical issues facing the industry.
2- 1 Evolution of an Industry
EARLIEST KNOWN STUDIES People have been gathering information to be used for decision making since the earliest days
of recorded history. As Lockley notes, “Even the Children of Israel sent interviewers out to
sample the market and produce of Canaan.” 2 In the United States, surveys were used in the
early 1800s to determine the popularity of political candidates. 3 Political polling is a consid-
erable part of marketing and opinion research today. The fi rst known application of market-
ing research to a business marketing/advertising problem was conducted by the advertising
agency N.W. Ayer & Son in 1879. In trying to put together a schedule of advertisements for
its client Nichols-Shepard Company, a manufacturer of agricultural machinery, the ad agency
sent a request to state offi cials and publishers throughout the United States asking for infor-
mation about grain production. 4
Robert Bartels, a marketing historian, writes that the fi rst continuous and organized research
was started in 1911 by Charles Coolidge Parlin , a schoolmaster from a small city in Wiscon-
sin. Parlin was hired by the Curtis Publishing Company to gather information about customers
and markets to help Curtis sell advertising space. Parlin was successful, and the information he
gathered led to increased advertising in Curtis’s Saturday Evening Post magazine. Parlin is rec-
ognized today as the “Father of Marketing Research,” and the American Marketing Association
(AMA) provides an award each year at the annual marketing research conference in his name. 5
WHY DID THE INDUSTRY GROW? By the 1920s more marketing research was being practiced in the United States. However, it
was not until the 1930s that marketing research eff orts became widespread as markets became
more geographically diverse. Prior to the Industrial Revolution, businesses were located
close to their consumers. In an economy based on artisans and craftsmen involved in barter
exchange with their customers, there was not much need to “study” consumers. Business
owners saw their customers daily. They knew their needs and wants and their likes and dis-
likes. However, when manufacturers began producing goods for distant markets, the need for
marketing research emerged. Manufacturers in Boston needed to know more about consumers
and their needs in “faraway” places such as Denver and Atlanta.
Surveys were used in the early 1800s.
Charles Coolidge Parlin conducted the fi rst continuous and organized research in 1911, when he was hired by the Curtis Publishing Company to gather information about customers and markets to help Curtis sell advertising space.
© M
rfi z
a/S
hutt
erst
ock
M02_BURN3261_08_GE_C02.indd 50M02_BURN3261_08_GE_C02.indd 50 27/08/16 4:28 pm27/08/16 4:28 pm

2-2 WHO CONDUCTS MARKETING RESEARCH? 51
THE 20TH CENTURY LED TO A “MATURE INDUSTRY” The 1900s saw the marketing research industry evolve. Researcher A. C. Nielsen started his
fi rm in 1923. The Nielsen Company remains a prominent fi rm in the industry. In the 1930s
colleges began to teach courses in marketing research, and George Gallup was designing
surveys that could predict presidential elections. During the 1940s, Alfred Politz introduced
statistical theory for sampling in marketing research. 6 Also during the 1940s, Robert Merton
introduced focus groups, which today represent a large part of what is known as qualitative marketing research .
Computers revolutionized the industry in the 1950s. 7 Marketing research in the middle
of the 20th century was dominated by small fi rms. 8 By the late 1950s and 1960s, marketing
research was seen as indispensable for companies to track consumption changes in increas-
ingly expanding markets. During this time, many client companies added marketing research
departments and the number of supply-side companies also increased greatly. The develop-
ment of computer technology in the 1970s led to the automation of data management and
analysis for larger fi rms. In the 1980s, the innovation of personal computers brought comput-
ing technologies to companies of all sizes. The introduction of data automation to the market-
ing research industry led to the ability to gather and analyze data at much faster speeds.
In the 1990s and the 2000s, increased globalization and the growth of the Internet led to
further dramatic changes in the marketing research industry. Marketing research supply-side
fi rms established branches all over the globe, leading to mergers and acquisitions in the indus-
try. As a result, a period of consolidation of companies took place, which has only recently
begun leveling off . Meanwhile, the wide availability and convenience of the Internet trans-
formed all phases of the research process, from data collection to analysis to reporting. Online
surveys became the predominant form of questionnaire administration.
The marketing industry has continued to grow and mature. Today the industry includes a
number of publicly held fi rms, as well as several professional organizations and a certifi cation
program. Later in this chapter, we will discuss the role of professional organizations and sum-
marize the dynamics of industry revenues.
2- 2 Who Conducts Marketing Research?
CLIENT-SIDE MARKETING RESEARCH Any company seeking to understand its customers, distributors, competitors, or the environ-
ments in which they operate may conduct marketing research. Research that is conducted
within an organization is called client-side research . Larger fi rms, such as those found in
the Fortune 500 , typically have a formal department devoted to marketing research. These
departments may appear in organizational charts under a variety of names, such as consumer
insights, but they serve the basic function of providing information to decision makers. Indus-
tries that tend to rely heavily on marketing research departments include consumer packaged
goods (CPG), technology, advertising, banking and fi nance, pharmaceuticals and health care,
automobile manufacturing, and retailing. Large fi rms that are recognized for having innova-
tive approaches to marketing research include Procter & Gamble, Google, Unilever, General
Mills, and Coca-Cola. 9
Medium-sized and smaller fi rms may assign one or more people to be responsible for
marketing research. In these cases, the individual or team may actually conduct some of the
research, but often their responsibilities lie in helping others in the fi rm know when to do
research and in fi nding the right supplier fi rm to help conduct marketing research.
Do-it-yourself (DIY) research , which has been called the “democratization” of mar-
keting research, is considered one of the most important emerging trends for client-side
marketing research departments. 10 DIY marketing research has been facilitated by online
access to secondary data and better knowledge of data analysis software such as SPSS.
Client-side research is research that is conducted within an organization.
DIY marketing research, or do-it-yourself marketing research, refers to fi rms conducting their own marketing research.
M02_BURN3261_08_GE_C02.indd 51M02_BURN3261_08_GE_C02.indd 51 27/08/16 4:28 pm27/08/16 4:28 pm

52 CHAPTER 2 • THE MARKETING RESEARCH INDUSTRY
DIY research can provide the information needed to solve the user’s problem in a cost-
eff ective way. An increasing number of tools are being developed for fi rms to conduct their
own marketing research. Examples of DIY marketing research tools are online survey plat-
forms (such as Qualtrics and SurveyMonkey), statistical analysis tools (such as SPSS, SAS,
and R), social media monitoring tools (such as Hootsuite [see Chapter 5 ] ), and data analy-
sis and visualization dashboards (such as those off ered by Burke and Tableau). Marketing
Research Insight 2. 1 introduces the Digital Dashboard, by Burke, Inc., as an example of
online data tools.
Moving Beyond the Traditional Research Report: Digital Dashboard from Burke, Inc. Burke, Inc., has devel-oped an online reporting tool that allows clients to access and create reports that are updated in near real time as data are col-lected in the field. The Digital Dashboard ® is a web-based application that can be accessed worldwide
and enables users to create custom views of their data as well as access predefi ned reports. The fl exibility of this application
allows users to analyze data themselves to help them make bet-ter decisions and ensure that everyone involved in the research project can interact with the data. Traditionally, the client did not see any data until all data were collected and analyzed and the fi nal written report was prepared. Additionally, the tradi-tional printed research report was not interactive. The manager who needed to examine the data differently than reported had to make a special request and wait for further processing. In many cases, the manager would forgo the additional work. The Digital Dashboard is an evolution in reporting that removes the barriers to further analyzing data that are present in tradi-tional reporting methods. Like a driver monitoring a vehicle’s
MARKETING RESEARCH INSIGHT 2. 1 Digital Marketing Research
Michael Webster, Senior Vice
President, Research Solutions
FIGURE 2. 1 Digital Dashboard
M02_BURN3261_08_GE_C02.indd 52M02_BURN3261_08_GE_C02.indd 52 27/08/16 4:28 pm27/08/16 4:28 pm

2-3 THE INDUSTRY STRUCTURE 53
Visit Burke, Inc., at www.burke.com .
dashboard for important information, clients using the Digital Dashboard can monitor the entire research project and input custom changes to make sure project results take them to the right destination—making the correct decision.
The Digital Dashboard is comprised of modules that allow the user to interact with data in multiple ways. The Report Builder module enables a user to create multiple charts and tables by following a guided wizard and to analyze and display data in the most meaningful way. These custom reports can then be shared with other users in the organization. Once shared, a user can continue to work with the report to meet specifi c needs. The Catalog Builder module enables a user to view respondent-level data. The user takes advantage of the same guided wizard available in the Report Builder to create views in this module as well. Data can be exported or scheduled to be delivered at regu-lar intervals by email from this portion of the tool. The Project Background module provides a place for the client to communi-cate important details about the project and offer guidelines for interpreting the results. The Digital Dashboard can be used for online surveys as well as other data collection modes, such as telephone and mail surveys and mall-intercept surveys.
Mike Webster has played a leading role in bringing Burke Interactive to the forefront of Internet research. A key devel-oper of Burke’s Digital Dashboard, Webster has designed online reporting solutions for leading-edge clients in a wide variety of industries, including information technology, telecommuni-cations, fi nancial services, and consumer goods. He serves as Burke’s resident expert on data collection and online reporting software, working with a variety of languages and platforms. His title is Senior Vice President, Research Solutions.
Source: Text and photos courtesy of Michael Webster, Burke, inc.
While DIY has its place, business owners and managers often do not have the time or
expertise to feel confi dent about using DIY for important issues and will hire marketing
research professionals to assist them with their information needs.
SUPPLY-SIDE MARKETING RESEARCH Research that is conducted by an outside fi rm to fulfi ll a company’s marketing research
needs is called supply-side research . A fi rm that is engaged in supply-side marketing
research is often referred to as an agency , or simply as a supplier . These fi rms specialize
in marketing research and off er their services to buyers needing information to make more
informed decisions. In most cases, client-side marketing researchers also purchase research
from marketing research suppliers. General Motors, for example, while conducting research
on electric cars, may hire a research fi rm in California to provide feedback from consumers
who test-drive prototype cars. Large and small fi rms, for-profi t and not-for-profi t organi-
zations, and government and educational institutions purchase research information from
suppliers.
2- 3 The Industry Structure
FIRM SIZE BY REVENUE Every year the American Marketing Association (AMA) publishes two reports on the mar-
keting research industry on its website and in the publication Marketing News. The AMA Gold Global Top 50 (formerly the Honomichl Global Top 25 ) report ranks the top marketing
research fi rms in the world by revenue earned. These fi rms include proprietorships as well
as international corporations with tens of thousands of employees. Table 2. 1 lists the top 10
revenue-producing fi rms from the 2015 AMA Gold Global Top 50 report.
As Table 2. 1 indicates, a few fi rms dominate the industry in terms of size based on
employees and revenues. The 26th fi rm in the report has revenues under $100 million. Still,
there is extreme competition in the industry. Certainly, the larger fi rms have advantages, but
many small fi rms develop new approaches and techniques and rely on talented personnel to
Supply-side marketing research is research that is conducted by an outside fi rm hired to fulfi ll a company’s marketing research needs. A supplier fi rm may be referred to as an agency or simply as a supplier.
To view the AMA Gold Global Top 50 and the AMA Gold Top 50 reports, go to the AMA website at www.ama.org and search “Top 50.”
M02_BURN3261_08_GE_C02.indd 53M02_BURN3261_08_GE_C02.indd 53 27/08/16 4:28 pm27/08/16 4:28 pm

54 CHAPTER 2 • THE MARKETING RESEARCH INDUSTRY
be competitive with larger fi rms. The AMA also publishes the AMA Gold Top 50, listing suc-
cessful U.S. marketing research fi rms (report available on the AMA website and published in
Marketing News ).
TYPES OF FIRMS AND THEIR SPECIALTIES Firms in the research industry can be classifi ed into two main categories: full-service and
limited service fi rms. Full-service supplier fi rms have the capability to conduct the entire
marketing research project for buyer fi rms. Full-service fi rms off er clients a broad range of
services; they often defi ne the problem, specify the research design,
collect and analyze the data, and prepare the fi nal written report. Typ-
ically, these are larger fi rms with the expertise and necessary facilities
to conduct a wide variety of research that may range from qualitative
studies to large international surveys to modeling eff ects of a pro-
posed marketing mix. Most of the research fi rms found in the AMA Global 25 and AMA Top 50 are full-service fi rms.
Limited-service supplier fi rms specialize in one or, at most, a
few marketing research activities. Firms can specialize in marketing
research services such as online communities, questionnaire devel-
opment and pretesting, data collection, or data analysis. Some fi rms
specialize in specifi c market demographic segments such as senior
citizens or Hispanics. Other fi rms specialize in diff erent types of
industries, such as airline, sports, or pharmaceuticals.
Major types of marketing research services are listed in Table 2. 2 .
However, industry resources are available that provide a better
understanding of the many diff erent types of research fi rms and their
specialties. Three professional organization that publish these list-
ings are GreenBook , MRA’s, Blue Book , and Quirk’s, as showcased
in the Active Learning Exercise, “Using the Marketing Research
Directories.”
INDUSTRY PERFORMANCE How well has the marketing research industry performed in terms
of revenues? ESOMAR, an international association of research
TABLE 2. 1 The Top 10 Global Marketing Research Firms
Rank Company Headquarters Website Employees Global Revenues
1 Nielsen Holdings N.V. New York Nielsen.com 42,000 $5,888,100,000
2 Kantar London Kantar.com 23,400 $3,389,200,000
3 IMS Health Inc. Danbury, CT IMSHealth.com 15,000 $2,544,000,000
4 Ipsos S.A. Paris Ipsos-NA.com 16,530 $2,276,600,000
5 GfK SE Nuremberg GfK.com 13,380 $1,985,200,000
6 IRI Chicago IRIWorldwide.com 4,547 $845,400,000
7 Westat Inc. Rockville, MD Westat.com 2,011 $582,500,000
8 dunnhumby Ltd. London dunnhumby.com 1,000 $462,000,000
9 INTAGE Group Tokyo Intage.co.jp 2,283 $402,000,000
10 Wood MacKenize Edinburgh WoodMac.com 957 $360,700,000
Source: Bowers, D. (2015, August). 2015 AMA Global Top 25 Research Report. Marketing News , pp. 35 – 75 . See original article for complete details on revenues and other information. Reprinted with permission.
Full-service supplier fi rms conduct a large variety
of research.
Full-service supplier fi rms have the capability to conduct the entire marketing research project for buyer fi rms.
Limited-service supplier fi rms specialize in one or, at most, a few marketing research activities.
© k
Rie
/Shu
tter
stoc
k
M02_BURN3261_08_GE_C02.indd 54M02_BURN3261_08_GE_C02.indd 54 05/09/16 11:59 AM05/09/16 11:59 AM

2-3 THE INDUSTRY STRUCTURE 55
professionals, estimates worldwide revenues for the marketing research industry at more than
$43 billion. 11 The AMA Gold Report states that the top 50 marketing research fi rms in the
world brought in more than $28 billion in 2014. 12 According to the AMA report, the top
50 fi rms showed a healthy growth in revenues of 10.6% from 2013 to 2014. In 2014, the larg-
est marketing research fi rm in the world by far was Nielsen Inc., with its $6.3 billion revenue
accounting for over one-fourth (26.4%) of the top 50 fi rms’ revenue. The report also showed
a 7.9% increase in employees. 13
The marketing research industry relies on derived demand. As client fi rms develop new
products, expand into new markets, examine new opportunities, and develop and evaluate
new promotional campaigns, they need information to guide their decisions. As the world
economy continues to improve, client fi rms’ businesses will grow and so will the revenues and
profi ts of the marketing research fi rms that support them.
The largest marketing research companies are truly international. The top fi ve companies
each have offi ces or subsidiaries in at least 70 diff erent nations. 14 Nielsen, the largest fi rm, has
over 40,000 employees in more than 100 countries. Revenues vary around the world. North
America has the largest market share (43%), followed by Europe (37%) and Asia Pacifi c.
To learn about a fi rm that special-izes in eye tracking, go to
www.youtube.com and type in “benefi ts of eye tracking.”
TABLE 2. 2 Major Types of Marketing Research Services
Type Description Example Firms
Syndicated Data Services Analyze the trends and consumer behavior
within an industry and sold to many companies
The Nielsen Co., SymphonyIRI Group,
Arbitron
Packaged Services Use a proprietary process to conduct a service
such as test marketing or measuring customer
or employee satisfaction
GfK, Video Research LTD, Burke, Inc.
Online Research Specialists Provide client services associated with measur-
ing online consumer behavior and measure-
ment or online data collection
Comscore, Inc., Harris Interactive, Knowledge
Networks, Toluna, Mindfi eld Internet Panels,
FocusVision
Customized Services Provide services customized to individual
clients’ needs
All of the major fi rms can do this. Some
examples include Burke, Inc., Kantar,
Ipsos SA, Synovate, Maritz
Industry or Market Segment Specialists
Specialize in a particular industry or a market
segment
IMS Health, Inc., Westat Inc., Latin Facts, Inc.,
Olson Research Group, Inc.
Technique Specialty
a. Eye Tracking
b. Mobile Research
c. Sampling
d. Neuroimaging
e. Market Segmentation
f. Social Media Monitoring
g. Field Services
Track eye movement to determine better
package designs, advertising copy, etc.
Conduct research using mobile devices such
as iPads or smartphones
Use diff erent sampling methods to draw sam-
ples to suit client’s research objectives
Observe brain activity as consumers are
exposed to stimuli such as packages or ads
Determine fi rms’ target markets, locate these
consumers, and determine other characteris-
tics of these consumers such as media habits
Monitor for relevant buzz over the social
media and attach meaning for companies and
their brands
Collect data using a variety of methods:
telephone, online, person to person, mall
intercept
The PreTesting Company
Kinesis Survey Technologies,
Cint+Mobile, NPolls
SSI, uSamp, Research Now, Peanut Labs
Neurofocus (Nielsen), Sands
ESRI, Nielsen Claritas
Decooda, Conversition
MktgInc., Readex Research, I/H/R Research
Group, Focus Market Research, Irwin,
Fieldwork, Schlesinger Associates
M02_BURN3261_08_GE_C02.indd 55M02_BURN3261_08_GE_C02.indd 55 27/08/16 4:28 pm27/08/16 4:28 pm

56 CHAPTER 2 • THE MARKETING RESEARCH INDUSTRY
The fastest-growing regions of the world for marketing research are Africa and the Middle
East. The fi ve largest markets by country are United States (42%), United Kingdom (12%),
Germany (8%), France (6%), and China (4%). 15
2- 4 Challenges to the Marketing Research Industry With the fast speed of technological change, the marketing research industry is currently fac-
ing a number of important challenges. Three of those challenges include new and evolving
sources of data and methodologies, the eff ective communication of results, and the need for
talented and skilled employees. Each of these challenges will be discussed in the following
paragraphs.
NEW AND EVOLVING SOURCES OF DATA AND METHODS After many years of relative stability in marketing research methods, the industry is undergo-
ing great change due to new sources of data and technology. Traditional methods of research
Active Learning
Using the Marketing Research Directories
Three major sources of online information can allow you to explore the many different types of research firms that operate worldwide.
GreenBook ( www.greenbook.org ). Many years ago the New York AMA chapter pub-lished a directory of marketing research firms in a book with a green cover. Now known as GreenBook , it remains a key resource of industry information. This website allows you to search for marketing research firms in several different ways. A number of specialties are listed, and you can also search by country, state, or metro area. Under “Market Research Specialties,” you can search under “Business Issues,” “Research Solutions,” “Industries & Demographics,” “Related Services & Software,” or “International Expertise.” These submenus list the many types of research and research firms in the industry. Click on a category that interests you to see the information available on each firm.
Blue Book ( www.bluebook.org ). Blue Book is a marketing research services and focus groups directory provided by the Marketing Research Association (MRA). The website allows you to search marketing research companies by state, by type of data collection, and by several differ-ent types of specialties. Spending some time to explore this website will allow you to gain an appreciation for the types of firms in the industry.
Quirk’s Researcher SourceBook ™ ( www.quirks.com ). Quirk’s Marketing Research Media publishes an online directory that provides access to research firms from more than 7,000 loca-tions. At the website, click “Directories” in the menu bar. You can then search for marketing research companies by geographical area, specialty, or type of industry.
By the time you finish this exercise, you will see that marketing research companies are involved in many areas, including mystery shopping, mock trial juries, behavioral econom-ics, airport interviews, crowdsourcing, taste tests, copy testing, new product concept testing, competitor analysis, focus groups, brainstorming research, site selection, political polling, and in-store interviewing.
M02_BURN3261_08_GE_C02.indd 56M02_BURN3261_08_GE_C02.indd 56 27/08/16 4:28 pm27/08/16 4:28 pm

2-4 CHALLENGES TO THE MARKETING RESEARCH INDUSTRY 57
included mail and telephone surveys to gather opinions and intentions. Next, syndicated data,
focus groups and a host of other qualitative techniques, mall-intercept surveying, and mar-
keting mix/brand equity modeling were added to the mix. In the 1990s, electronic surveys
brought about signifi cant change, with online panels becoming a primary source of data. And
in recent years, passive data , or data that are gathered without overt questioning or other types
of interactions with consumers, have become a new and valuable source of information (see
Chapter 5 ) . 16
The new sources of data have created challenges for marketing research companies that
want to take advantage of new technology. In a 2015 survey of marketing researchers by
GreenBook , over half of respondents (56%) stated that methodologies are one of the biggest
challenges that they face. 17 Data sources, such as social media websites, the Internet of Things
(IoT), and new kinds of syndicated data, have the potential to provide valuable insights. How-
ever, the methodologies necessary to analyze the data are not easy to develop and learn. Some
researchers believe that the marketing research industry has been adapting to new opportuni-
ties too slowly. 18 Older and established marketing research companies fi nd it diffi cult to keep
abreast of new technologies, and new, upstart marketing research companies cannot always
deliver the insights that they promise. The industry must evolve or die. 19 Marketing Research
Insight 2. 2 outlines the diff erent types of social media websites and the types of consumer
research that they provide. Chapters 5 and 6 will report on types of quantitative and qualitative
data and the methodologies needed to examine these data.
Types of Social Media That Provide Sources of User-Generated Content Social media websites are an important source of consumer information. Following is a list of types of social media websites.
1. Blogs —Dated, online journal entries, usually focused on a particular topic. Examples: Blogger, WordPress
2. Microblogs —Short posts commenting on the user’s activities. Examples: Twitter, Weibo, Tumblr
3. Video Sharing Networks —Websites or apps that allow the sharing of the user’s videos online. Examples: YouTube, Vine, Vimeo
4. Photo Sharing Sites —Websites or apps that allow the sharing of the user’s photos online. Examples: Instagram, Flickr
5. Social Networks —Websites that enable users to con-nect by creating personal information profi les, inviting friends and colleagues to access those profi les, and send-ing and receiving emails and instant messages. Examples: Facebook, WeChat
6. Professional Networks —Websites that enable users to connect by creating professional information profi les, inviting business colleagues to access those profi les, and sending and receiving emails and instant messages. Example: LinkedIn
7. Product and Service Review Sites: Websites that allow consumers to talk about and review their experiences
with a product or service. Examples: Yelp, Amazon, Angie’s List
8. Web-Based Communities and Forums: Communities created online, often focused around a particular inter-est, whose members interact with each other online. Examples: Gala Online, College Confi dential
9. News Sharing Sites —Websites that allow users to post and discuss news items. Examples: Digg, Reddit
MARKETING RESEARCH INSIGHT 2. 2 Digital Marketing Research
There are many diff erent types of social media.
© S
yda
Prod
ucti
ons/
Shu
tter
stoc
k
M02_BURN3261_08_GE_C02.indd 57M02_BURN3261_08_GE_C02.indd 57 27/08/16 4:28 pm27/08/16 4:28 pm

58 CHAPTER 2 • THE MARKETING RESEARCH INDUSTRY
EFFECTIVE COMMUNICATION OF RESULTS With the multiple new types of data and methods now in use, marketing researchers not only
need to be skilled at gathering and analyzing data but also at communicating results eff ectively.
Marketing researchers sometimes feel that they are not treated with respect by managers. 20
At the same time, marketing research clients often complain that researchers are not knowl-
edgeable about their businesses. 21 In a 2015 survey by Quirk’s, fully half of marketing research
clients stated that they have had trouble with research suppliers who “did not take time to
understand our business.” 22 A need exists for marketing researchers who can dig deeper into
data and who can deliver strategic insights with their results. 23
In addition, there is an increasing demand that marketing researchers provide simple
and straightforward reports that “tell a story” rather than give their clients lengthy, complex
documents. Researchers are asked to present their results in unambiguous, understandable,
easy-to-grasp reports. 24 Increasingly, researchers use “storytelling” techniques, along with
pictures, videos, animations, and other visual and aural techniques, to deliver their results in
compelling ways that will be remembered by management. Chapter 16 will discuss methods
for presenting written and oral reports.
NEED FOR TALENTED AND SKILLED EMPLOYEES Another challenge for the marketing industry is employing qualifi ed individuals. As sug-
gested by the fi rst two challenges to the marketing industry, a 2015 survey by GreenBook
notes a need for individuals who can combine tech savviness and analytical skills with the
ability to synthesize data and communicate results in a compelling way. At the same time,
the survey points to the need for people who have a good foundational understanding of the
basics of research. 25 Some established marketing researchers complain that younger employ-
ees have not been trained in basic statistics and methodologies. 26 Only 4% of the members of
ESOMAR, a global marketing research trade organization, are less than 30 years old versus
39% who are over 50 years old. 27 According to ESOMAR, very few people plan a career in
marketing research while in college, but once they fi nd themselves in that industry they are
very satisfi ed. 28
2- 5 Industry Initiatives The marketing research industry has been proactive in terms of self-improvement, largely
through industry initiatives, extensive continuing education programs, and certifi cation.
INDUSTRY PERFORMANCE INITIATIVES Led by some active professional associations, several initiatives have been undertaken to
improve industry performance. We summarize a few of these in the following paragraphs.
Best Practices The move toward Total Quality Management in the 1990s spawned an
increase in companies’ awareness of methods leading to improvement. One such method was
spelling out best practices to help companies set benchmarks for performance in key areas.
Many of the professional organizations serving the marketing research industry have a pro-
gram of best practices. The MRA, for example, publishes best practices regarding issues such
as privacy, calling cell phones, and online surveying. 29
Maintaining Public Credibility of Research Researchers are concerned about the
general public’s trust of research information. Public disgust with telemarketing and politi-
cal telemarketing known as “push polling” 30 is often inappropriately directed at marketing
researchers. Several industry initiatives are directed at keeping the public informed about the
value of research, the appropriateness of research methods, and the ethics the industry uses in
collecting research information. The industry has fought to make sugging — or the practice of
Sugging, or “selling under the guise of research,” is illegal. Frugging, or “fund raising under the guise of research,” is unethical but not yet illegal.
M02_BURN3261_08_GE_C02.indd 58M02_BURN3261_08_GE_C02.indd 58 27/08/16 4:28 pm27/08/16 4:28 pm

2-5 INDUSTRY INITIATIVES 59
“selling under the guise of research”—illegal. Telemarketers used sugging for years to entice
the public into taking what they thought was an opinion survey but actually was a lead-in for
a sales pitch. Though not illegal, the industry has fought the use of enticing unknowing con-
sumers into taking a survey when the real intent is to raise funds. This practice is known as
frugging , for “fund raising under the guise of research.”
The Council of American Survey Research Organizations (CASRO) off ers an online
guide, “What Survey Participants Need to Know,” to provide the public with information
about the conduct and use of survey research. 31 The Transparency Initiative was launched in
2014 by the American Association for Public Opinion Research (AAPOR) to encourage the
routine disclosure of methods used in research information that is released to the public. 32 As
you will learn by taking this course, surveys can be conducted so that they deliberately lead to
biased responses. It is important for the marketing research industry to discourage the practice
of conducting biased surveys.
In 2003 the National Do Not Call Registry was established that allows U.S. residents
to register their telephone numbers to be protected from receiving unsolicited telemarketing
calls. Note, however, that unsolicited phone calls for the purpose of conducting surveys are
exempt from the restrictions imposed by the Do Not Call Registry. In other words, researchers
conducting surveys can still legally call U.S. residents.
Monitoring Industry Trends For many years, GreenBook has monitored trends in the
industry. Published annually as the GreenBook Research Industry Trends (GRIT) report, data
are provided to the industry in terms of what techniques are being used as well as what drives
their use. The report provides insights by contrasting supplier (marketing research fi rms)
views on issues with buyer (client) views. The report examines perceived threats and atti-
tudes toward changes in the industry, forecasts revenues, and profi les innovations. ESOMAR
publishes an annual Global Market Research report that includes many measures of industry
performance.
Improving Ethical Conduct The professional associations serving the marketing research
industry have all established rules, standards, or codes of ethical conduct. These associa-
tions have been proactive in maintaining and updating these standards. For example, when
the Internet made possible online surveys, the industry moved to adopt standards govern-
ing conduct in this area. Most industry codes of ethics are for the purpose of self-regulating
professionals’ behavior. In some cases associations may impose penalties, including censure,
suspension, or expulsion. Certifi ed professionals may lose their certifi cation if they are found
to have violated the granting association’s standards. Each organization has its own standards,
although some associations coordinate these codes of conduct. There are diff erences in the
codes but also some commonalities among the major associations. Some of the most impor-
tant marketing research codes are listed as follows:
I. Fair Dealings with Respondents
a. Respondents should understand that they may elect to not participate in a research
request. Participation is always voluntary and respondents should understand they
have the right to withdraw or refuse to cooperate at any stage during the study.
b. Respondent confi dentiality must be maintained. Respondent identity should not be
revealed without proper authorization.
c. Respondents will be treated professionally. Should respondents be required to use a
product or service, researchers will ensure that the product/service will be safe and
fi t for intended use and labeled in accordance with all laws and regulations.
d. Respondents will not be given dishonest statements to secure their cooperation,
and researchers will honor any promises made to respondents given to secure their
cooperation.
e. Special provisions are required for doing research on minors (under 18 years of age).
The Transparency Initiative is a program by the AAPOR to encourage the routine disclosure of methods used in research that is released to the public.
Calling U.S. residents to conduct surveys is exempt from the Do Not Call Registry.
M02_BURN3261_08_GE_C02.indd 59M02_BURN3261_08_GE_C02.indd 59 27/08/16 4:28 pm27/08/16 4:28 pm

60 CHAPTER 2 • THE MARKETING RESEARCH INDUSTRY
II. Fair Dealings with Clients and Subcontractors
a. All information obtained from clients shall remain confi dential.
b. All research will be carried out according to the agreement with the client.
c. Client identity will not be revealed without proper authorization.
d. Secondary research will not be presented to the client as primary research.
e. Research results are the sole property of the client and will never be shared with
other clients.
f. Researchers will not collect information for more than one client at the same time
without explicit permission from the clients involved.
g. Clients will be provided the opportunity to monitor studies in progress to ensure
research integrity.
h. Researchers will not ask subcontractors to engage in any activity that does not
adhere to professional codes, applicable laws, or regulations.
III. Maintaining Research Integrity
a. Data will never be falsifi ed or omitted.
b. Research results will be reported accurately and honestly.
c. Researchers will not misrepresent the impact of the sampling method and its impact
on sample data.
IV. Concern for Society
a. Research released for public information will contain information to ensure trans-
parency (i.e., disclosure of method of data collection, the sample frame, sample
method, sample size, and margin of error, if appropriate).
b. Researchers will not abuse public confi dence in research (e.g., no push polling).
c. Researchers will not represent a nonresearch activity (e.g., sales eff ort, debt collec-
tion) to be research for the purpose of gaining respondent cooperation.
You may want to see the entire standards of ethical conduct of some of these associations:
AAPOR ( www.aapor.org ): Go to Standards & Ethics.
MRA ( www.marketingresearch.org ): MRA Code of Marketing Research Standards.
CASRO ( www.casro.org ): Go to Resources, then The CASRO Code.
MRIA ( www.mria-arim.ca ): Go to Standards.
ESOMAR ( www.esomar.org ): Go to Knowledge and Standards.
MRS ( www.mrs.org.uk ): Go to Standards.
We will examine ethical issues in this book by highlighting a particular standard from
the MRA’s “Code of Marketing Research Standards” where it applies to the subject matter
discussed in each chapter . This text also presents Marketing Research Insights, Ethical Con-siderations, such as Marketing Research Insight 2. 3, which discusses the ethics of retailers
using in-store video cameras to track customers.
Beyond the general standards, an issue that may pose an ethical problem for research-
ers is working on a project in which the outcome may not be in the best interests of society.
Imagine, for example, that a client asks a researcher to help identify advertising messages that
are persuasive in getting young teens to try their fi rst cigarette. Or a fi rm might be asked to
develop eff ective promotions to encourage children to eat more candy. The decisions research-
ers must make are sometimes diffi cult. This quandary is rarely discussed professionally.
Certifi cation of Qualifi ed Research Professionals Certifi cation programs assure that
certifi ed individuals have passed some standard(s) of performance. Certifi cation programs in
accounting (CPA) and fi nance (CFA) and other professional areas in business have been in place
for many years and give clients confi dence in the credibility of those certifi ed professionals.
M02_BURN3261_08_GE_C02.indd 60M02_BURN3261_08_GE_C02.indd 60 27/08/16 4:28 pm27/08/16 4:28 pm

2-5 INDUSTRY INITIATIVES 61
In the United States, professionals may earn the Professional Researcher Certifi cation (PRC) . You can read about the PRC in Marketing Research Insight 2. 4. In Canada, the
designation of Certifi ed Marketing Research Professional (CMRP) is granted through
the MRIA.
Continuing Education The marketing research industry does an exceptional job of provid-
ing conferences, workshops, courses, webinars, and many other forms of continuing educa-
tion for industry professionals. All of the professional organizations listed off er programs
designed to keep members up-to-date on skills needed in the industry. The Burke Institute, a
division of Burke, Inc., has been providing high-quality training seminars since 1975. You can
see the seminars the institute off ers professionals at www.burkeinstitute.com .
The MRIA in Canada certifi es researchers through the Certifi ed Marketing Research Professional (CMRP) program. Read about the qualifi cations for this program at www.mria-arim.ca . Go to the link for Institute for Professional Development/Certifi cation.
Video Surveillance Research: New Insights and the Ethics Involved Monitoring and measuring “actual” consumer behavior has gained a more prominent role in marketing research in the retail industry lately. A key driving force is new or improved technol-ogy that opens up numerous opportunities to study consumer behavior in a store environment. Traffi c counters, handheld shopping systems, beacons, radio frequency identifi cation (RFID) tags, infrared sensing devices, and high-resolution video surveil-lance cameras are all examples of this technology. The value of the new technology lies in its ability to constantly deliver more accurate and non-disruptive accounts of how consumers behave in a store and how they react to marketing stimuli. By studying consumer activity (where customers go, their paths, their inter-actions with the store shelves, etc.), retailers can detect problems with store layouts, signage, product organization, and so on.
Since data from surveillance cameras gives retailers insights that are relevant for optimizing their store layout and merchan-dising approach, it is easy to see why many retailers are using video cameras to track and capture every detail about the cus-tomers in their store. However, this has raised ethical concerns. Many have expressed concerns about the increasing use of sur-veillance cameras in public places, especially when such use is concealed or when people being monitored cannot opt out. The European Society for Opinion and Marketing Research (ESO-MAR), which has developed an international code for market and social research, advises market researchers to inform respondents of their intentions, except for instances where these techniques are openly used in a public place and where obtaining informed consent from individuals is beyond the bounds of possibility. Nor-way has specifi cally included the use of video surveillance cam-eras in its Personal Data Act, which categorizes any data acquired from the use of video cameras as a form of personal information.
It does not matter whether the data is recorded, stored, or just streamed in real time, as the individual’s face can be used to identify her or him and disclose personal information.
In most cases, authorities accept video surveillance as a theft-preventing measure. In European legislation, the legality of using video surveillance technology for other purposes is contingent on whether the data is important in terms of the performance of a task carried out in public interest. A legitimate cause might be that the results lead to ways to improve a customer’s shop-ping experience. It would, for instance, be in the customer’s own interest to spend less time navigating and searching for products.
Do more rewarding consumer experiences outweigh the ethical concerns? What do you think?
MARKETING RESEARCH INSIGHT 2. 3 Ethical Consideration
Certain retailers use in-store cameras to track consumer
behavior .
Sources: Kirkup, M. and Carrigan, M. (2000). Video surveillance research in retailing: Ethical issues. International Journal of Retail and Distribution Management, 28(11), 470–480; Burke, R. (2005). Retail shoppability: A measure of the world’s best stores. Indiana University. Retrieved from www.kelley.iu.edu/CERR/fi les/shoppability.pdf; Williams, J. (2013, August 1). In-store cameras: From security aids to sales tools. INSEAD Knowledge. Retrieved from http://knowledge.insead.edu/innovation/technology-manufacturing/in-store-cameras-from-security-aids-to-sales-tools-2559; ESOMAR (2009), Passive Data Collection, Observation, and Recording, pp. 1–20; European Data Protection Supervisor (2010, March 17). The EDPS Video-Surveillance Guidelines. Retrieved from https://secure.edps.europa.eu/EDPSWEB/webdav/shared/Documents/Supervision/Guidelines/10-03-17_Video-surveillance_Guidelines_EN.pdf; Datatilsynet. (2015, January 10). Retrieved from https://www.datatilsynet.no/English/Regulations/Personal-Data-Act-/#Chapter 7.
© P
hoto
nCat
cher
/Shu
tter
stoc
k
M02_BURN3261_08_GE_C02.indd 61M02_BURN3261_08_GE_C02.indd 61 05/09/16 11:14 AM05/09/16 11:14 AM

62 CHAPTER 2 • THE MARKETING RESEARCH INDUSTRY
2- 6 A Career in Marketing Research You may be interested in exploring a career in marketing research. A recent study by
ESOMAR of young researchers found that new recruits to the marketing industry are over-
whelmingly happy in their jobs. The young researchers described their jobs as “empowering”
and “meaningful” and noted that “you get to make a diff erence.” 33
IBIS World predicts that the number of employees in the marketing research industry will
expand at an average annual rate of 2.1% through 2020, with wages predicted to increase at an
average annual rate of 2.5%. 34 The research industry workforce is expected to grow at an aver-
age annual rate of 2.1% to 154,250 employees. Similarly, total industry wages are expected to
increase at an annualized rate of 2.5% to $7.3 billion over the same period.
Following graduation, some students go directly into a marketing research job with a
bachelor’s degree in marketing, statistics, business analytics, computer science, psychology,
sociology, or another related fi eld. Some marketing research jobs, particularly those in client-
side companies, require a graduate degree for new employees who have no direct experi-
ence in the fi eld. There are some excellent master’s degree programs in marketing research.
One of those master’s program is the University of Georgia’s Master of Marketing Research
(MMR) program, which is profi led in the introduction to the chapter. You can fi nd more infor-
mation about programs that off er degrees in marketing research on the Quirk’s Marketing
Research Media website. Quirk’s maintains a directory of colleges and universities that off er
certifi cates, concentrations, programs, or degrees in marketing research. Quirk’s website also
provides an active job-posting service that allows you to explore the types and locations of
current job openings in marketing research.
Professional Researcher Certifi cation Responding to a need to establish a credentialing program in the industry, several organizations, led by the Marketing Research Association, established a certification program for marketing researchers. The process took several years, and the program started in February 2005. The Professional Researcher Certifi cation program (PRC) is designed to recog-nize the qualifi cations and expertise of marketing and opinion research professionals. The goal of PRC is to encourage high standards within the survey profession to raise competency, establish an objective measure of an individual’s knowledge and profi ciency, and encourage professional development. Achieving and maintaining PRC validates the knowledge of the market research industry and puts researchers in a select group of like-minded professionals. It’s a visible badge of dis-tinction, demonstrating professional skill, commitment, and dedication.
Requirements for Professional Researcher Certifi cation
• A minimum of three years of industry experience in the marketing research industry
• 12 hours of PRC-approved training within the last two years • Passing the PRC exam
• Renewal of the PRC requires 20 hours in PRC-approved training (18 in research; 2 in legal). Certifi cations must be renewed every two years.
MARKETING RESEARCH INSIGHT 2. 4 Practical Application
You can read more about the PRC at www.marketingresearch.org/certifi cation . Source: Marketing Research Association, by permission.
M02_BURN3261_08_GE_C02.indd 62M02_BURN3261_08_GE_C02.indd 62 27/08/16 4:28 pm27/08/16 4:28 pm

KEY TERMS 63
WHERE YOU'VE BEEN AND WHERE YOU'RE HEADED! This concludes our two introductory chapters
on marketing research. In Chapter 1 you learned
how marketing research is defi ned and how it
fi ts into a fi rm’s marketing information systems.
This chapter provided an overview of the market-
ing research industry. Now you should be famil-
iar with the types and numbers of fi rms and the
professional organizations that serve the industry.
You’ve learned about issues facing the industry
as well as the ethical issues that face all mar-
keting researchers. Now, you are ready to learn
about the 11-step process that characterizes mar-
keting research. That process and its fi rst steps
are discussed in Chapter 3 . Each of the remain-
ing chapters addresses additional steps in the
process.
There are many diff erent directions you can take with your degree, such
as going straight into the marketing research industry or going on to earn
a master’s degree in marketing research.
Summary
Gathering information dates back to the earliest days of
recorded history. Surveys were used for politics in the
United States in the early 1800s. The fi rst known applica-
tion of research to a business/marketing/advertising prob-
lem was conducted by an ad agency in 1879, and the fi rst
continuous, organized research was started in 1911 by
Charles Coolidge Parlin. The industry began to grow in the
early 1900s as the Industrial Revolution separated busi-
ness owners from customers. Many developments occurred
during the 20th century that allowed marketing research to
evolve into a mature industry.
Marketing research may be divided into client-side
research and supply-side research. Client-side research is mar-
keting research that is conducted within and for a fi rm (such
as research that is conducted by a marketing research depart-
ment within a manufacturing fi rm) . Supply-side research is
research that is conducted by an outside fi rm to fulfi ll a com-
pany’s marketing research needs. Firms that conduct supply-
side marketing research are also called agencies , or simply
suppliers. The industry is characterized by a few large fi rms
and many small fi rms. The largest fi rms have revenues in
the billions of dollars. Firms are classifi ed as full-service or
limited-service supplier fi rms. Several online directories are
available to help clients locate marketing research fi rms.
The marketing research industry had total revenues of
$43 billion in 2014. North America led the global market
with the largest share of revenues (43%) by region, and the
United States led all countries. Some of the fastest growth
rates are in the Middle East and Africa.
Challenges facing the marketing research industry
include keeping up with the many new sources of data and
types of methods that have emerged in recent years. Other
challenges include eff ectively communicating research
results and hiring talented and skillful employees. The
industry strives for self-improvement via eff orts to identify
and disseminate best practices, maintain public credibil-
ity of research, monitor trends, improve ethical conduct of
members, support programs to certify professionals, and
off er education programs. The marketing research indus-
try off ers excellent careers for recent college graduates.
Key Terms
Charles Coolidge Parlin (p. 50 )
Client-side research (p. 51 )
Do-it-yourself (DIY) research (p. 51 )
Supply-side research (p. 53 )
Supplier (p. 53 )
Agency (p. 53 )
Full-service supplier fi rms (p. 54 )
Limited-service supplier fi rms (p. 54 )
Sugging (p. 58 )
Frugging (p. 59 )
Transparency Initiative (p. 59 )
National Do Not Call Registry (p. 59 )
AAPOR (p. 60 )
MRA (p. 60 )
CASRO (p. 60 )
MRIA (p. 60 )
ESOMAR (p. 60 )
MRS (p. 60 )
Professional Researcher
Certifi cation (PRC) (p. 61 )
M02_BURN3261_08_GE_C02.indd 63M02_BURN3261_08_GE_C02.indd 63 27/08/16 4:28 pm27/08/16 4:28 pm

64 CHAPTER 2 • THE MARKETING RESEARCH INDUSTRY
Review Questions/Applications
2- 1. Who is known as the “Father of Marketing Research”
and why?
2- 2. Why did marketing research expand by the 1930s?
2- 3. What was the technology that revolutionized market
research in the 1950s?
2- 4. Defi ne client-side research .
2- 5. What are some advantages and disadvantages of DIY
research?
2- 6. Who are the buyers who purchase research informa-
tion from suppliers?
2- 7. What is common to most of the top-rated marketing
research agencies in the world?
2- 8. Describe limited-service supplier fi rms.
2- 9. Explain the meaning of the statement that the “mar-
keting research industry thrives off derived demand.”
2- 10. What began to drastically change the marketing
research industry in the 1990s? Why?
2- 11. Why is employing qualifi ed individuals a challenge
for the marketing industry?
2- 12. Is it ethical for retailers to use video cameras in
their stores to study the behavior of their customers?
Explain.
2- 13. Most marketing industry codes of ethics are for the
purpose of self-regulation. What are the penalties that
can be imposed in case these codes are breached?
2- 14. Outline the marketing research co de for maintaining research integrity.
2- 15. Explain how market researchers can ensure that their
research is in the interest of society.
2- 16. What is the PRC, and what is it designed to do?
CASE 2. 1
Heritage Research Associates
Tim Colley and John Williams had not been in business
long as Heritage Research Associates, a small marketing
research fi rm they started in their hometown. They were
barely making ends meet by taking on very small accounts
such as start-up retailers. Their marketing research expe-
rience was limited, but they knew the basics. Since they
had not taken any specialized training beyond a college
course in marketing research, they decided to join the
Marketing Research Association. Tim explained, “We can
tell clients we have the necessary credentials to be mem-
bers of the most notable marketing research organization
in North America.” The partners thought this was a good
way to persuade clients they knew what they were doing.
They added the MRA logo to their promotional materials
along with the line “Heritage is a Certifi ed Member of the
MRA.” They used their limited funds to promote Heritage
Research Associates and even took out a quarter-page ad in
a national business magazine.
A phone call early one morning marked a real oppor-
tunity for Heritage. The potential client represented his or-
ganization as a “privately funded foundation that promoted
business rights and the maintenance of a laissez faire pro-
business environment.” They were interested in Heritage
doing some research that would disprove some university-
sponsored research fi ndings that had been in the news. The
fi ndings were unfavorable toward one of their prominent
member industries. The caller stated, “Our patrons are
upset that such erroneous information is being fed to the
American people, and we are quite prepared to fund ad-
ditional research to clarify the facts. In fact, we are willing
to fund several studies if we get the results we are looking
for. Are you up to it?” Tim and John assured the caller that
the foundation could be certain that Heritage Research As-
sociates could deliver quality, objective research that would
clear up any misconceptions in the minds of the public. The
call ended with a promise to send the biased university re-
search reports immediately. A second call was set up to fol-
low in three days.
In the follow-up call the potential client got more spe-
cifi c. His foundation had hired some independent scientists
who were willing to testify that certain environmental con-
ditions were not being caused by the concerned industry
group. “We have had little problem in getting three scien-
tists, with doctoral degrees from well-known universities,
to make statements affi rming that fi rms in one of our major
industry groups are not doing any signifi cant harm to our
environment.” The client went on to say, “What we want
now is a study from an independent research fi rm, such
as Heritage, to report attitudes of consumers in terms of
whether they are in favor of more industry regulation. We
are willing to fund a small pilot study and, if we fi nd Heri-
tage is capable of delivering objective data, we are ready
to sign on for a series of perhaps a dozen studies. Further-
more, we are well fi nanced, and I am quite certain we can
meet your bid to do this work.” The caller went on to ask for
a proposal that would outline methods to select the survey
M02_BURN3261_08_GE_C02.indd 64M02_BURN3261_08_GE_C02.indd 64 05/09/16 11:15 AM05/09/16 11:15 AM

REVIEW QUESTIONS/APPLICATIONS 65
sample, research questions, and a sample analysis, includ-
ing how Heritage would word the report. “Remember, we
want this to be an independently prepared project using all
your abilities to craft an objective research study,” the client
stated. Tim and John agreed to deliver a proposal within
10 working days.
Tim and John were thrilled that this opportunity had
fallen to them. “Did you hear what he said in terms of
‘being certain to accept our bid’?” John exclaimed. “He’s
telling us he is going to pay whatever we ask. This isn’t a
penny-pinching client.”
Tim said, “Just a minute, though. He’s talking about
the studies after the pilot study. What if they don’t like the
fi rst study? We won’t ever get to the big accounts.”
John agreed. “We’ve got to design a study they will
like so we can get the additional work at a premium. This
could set our little fi rm off in a totally new direction!”
“This can make us the most talked-about research fi rm
in the world!” Tim said.
1. Do you think it is ethical to use membership in an
association that doesn’t require any demonstration of
expertise to lead customers into thinking the member-
ship conveys some automatic claim of competency?
2. Consult the MRA Code of Marketing Research
Standards. Is the answer to question 1 covered?
Explain.
3. What problems do you see in the future for Tim and
John and Heritage Research Associates? Do you think
they are likely to become the “most talked-about
research fi rm in the world”?
4. Consult the MRA Code of Marketing Research Stan-
dards. Are there any standards that back up your
answers to question 3?
M02_BURN3261_08_GE_C02.indd 65M02_BURN3261_08_GE_C02.indd 65 27/08/16 4:28 pm27/08/16 4:28 pm

LEARNING OBJECTIVES In this chapter you will learn:
3- 1 The steps of the marketing research process
3- 2 The importance and process of defi ning the problem
3- 3 How to formulate research objectives
3- 4 What an action standard is and why it can be helpful
3- 5 The components of the marketing research proposal
“WHERE WE ARE”
1 Establish the need for marketing
research.
2 Defi ne the problem.
3 Establish research objectives.
4 Determine research design.
5 Identify information types and
sources.
6 Determine methods of accessing
data.
7 Design data collection forms.
8 Determine the sample plan and size.
9 Collect data.
10 Analyze data.
11 Prepare and present the fi nal
research report.
General Mills: A Well-Defined Problem Is Half the Solution
It is an adage as old as scientifi c inquiry: A
well-defi ned problem is half the solution.
In Global Consumer Insights at General
Mills, we partner with professionals in mar-
keting, advertising, product development,
and beyond to inform smart, consumer-fi rst
decisions. At times, the problems business
partners bring us are vague, broad, diffi -
cult to tackle, and—all too often—urgent.
The need for quick answers can entice us to
jump into research design and execution so
hastily that the results we get back will not
really help answer the true question.
Instead, having the discipline to dig
into the true business problem, including
what has already been learned, explored, or
decided, helps us as researchers to create a
meaningful series of learning objectives and research questions. A good
rule of thumb in the research design phase is “go slow to go fast.” It is
worth spending time in the beginning gaining clarity and alignment on
the true problem and questions in order to facilitate meaningful learning
that ultimately illuminates the path forward and enables better, faster
decisions.
To illustrate, let’s use the example of a recent consulting engage-
ment our central Global Consumer Insights team took on with business
partners on our Snacks team. They wanted help deciding where to focus
next in building a pipeline of new products for a top-priority brand. The
business team knew the consumer they were focused on and the brand
was a given, but the possible product categories for innovation were
3 The Marketing Research Process and Defi ning the Problem and Research Objectives
Carrie Breisach is
a Global Consumer
Insights Manager at
General Mills, Inc. Ms.
Breisach has an M.B.A.
from the University of
Wisconsin-Madison
and has 10 years of
experience in the
marketing research fi eld.
▶
▶▶
M03_BURN3261_08_GE_C03.indd 66M03_BURN3261_08_GE_C03.indd 66 27/08/16 4:39 pm27/08/16 4:39 pm

67
nearly limitless. Should they create a new granola bar? A new cookie?
New fruit snacks? New yogurt? What would be the next biggest oppor-
tunity for the brand?
Rather than jumping straight into “problem-solving mode,” our
central consulting team fi rst reviewed the intake brief, a standardized
template that captures the background, objective, key stakeholders,
time line, and existing knowledge. The consulting team then set up a
scoping meeting with the client team to talk through the brief and have
conversations to clarify the scope, intended outcome, success criteria, and any other issues
that might impact the project design. The consulting team then worked with internal subject
matter experts to design the optimal research and learning plan, which they shared with the
business team for feedback and alignment before starting the project.
In this example and so many others, the Global Consumer Insights team acted not just as
research designers and executors but also as expert partners who can help a business team
gain clarity on the real business issue and question that will unlock opportunity. In so doing,
we were able to design an approach to help the team identify a robust pipeline of new prod-
uct ideas to explore and further develop.
—Carrie Breisach
Source: Text and photos courtesy of Carrie Breisach and General Mills, Inc.
There are many facets to what we call marketing research, with many different research
choices: forecasting models that predict sales of new products, measures of customer
satisfaction, online communities to discover consumers’ concerns, mobile surveys, and
experiments to determine the most eye-catching package design, to name just a few examples.
Researchers choose from many seemingly disorganized sets of alternative approaches in tack-
ling a research project. Fortunately, there is a process, and understanding and adhering to that
process will provide researchers with direction.
This chapter introduces the steps of the research process and then focuses on the fi rst
three steps in the process: establishing the need for marketing research, defi ning the problem,
and developing research objectives. The chapter concludes with a discussion of the docu-
ment that is usually prepared after the problem statement and research objectives have been
defi ned: the marketing research proposal.
3- 1 The Marketing Research Process
THE 11-STEP PROCESS We, among many, believe the marketing research process should be viewed as a series of
steps. Knowledge of these steps provides a road map for planning a research project. The
value in characterizing research projects in terms of successive steps is twofold. First, the
steps give researchers and others an overview of the process. Second, they provide a pro-
cedure in the sense that a researcher knows what tasks to complete and in what order.
Visit General Mills at www.generalmills.com .
M03_BURN3261_08_GE_C03.indd 67M03_BURN3261_08_GE_C03.indd 67 27/08/16 4:39 pm27/08/16 4:39 pm

68 CHAPTER 3 • THE MARKETING RESEARCH PROCESS AND DEFINING THE PROBLEM AND RESEARCH OBJECTIVES
Our introduction to these steps also provides a preview of what is in store for you in upcoming
chapters of this book.
We identify the 11 steps in the marketing research process in Figure 3. 1 : 1 (1) establish
the need for marketing research, (2) defi ne the problem, (3) establish research objectives,
(4) determine research design, (5) identify information types and sources, (6) determine meth-
ods of accessing data, (7) design data collection forms, (8) determine the sample plan and
size, (9) collect data, (10) analyze data, and (11) prepare and present the fi nal research report.
We will discuss each of these steps in the following section. As we summarize each step, we
will briefl y introduce vocabulary that is associated with the text. Those vocabulary words will
be placed in italics to signal that we will defi ne those words in more detail in later chapters in
the text. But prior to introducing the steps, we should fi rst consider some cautions associated
with using a step-by-step approach to the process of marketing research.
CAVEATS TO A STEP-BY-STEP PROCESS
Why 11 Steps? There is nothing sacred about 11 steps. Although we conceptualize the
research process as entailing 11 steps, others may present it in fewer or more steps. For exam-
ple, the process could be distilled into three steps: defi ning the problem, collecting and ana-
lyzing data, and presenting the results. We think this short list oversimplifi es the research
process. On the other hand, the research process could be set out in 20 or more steps. In our
opinion, this provides more detail than is needed. Eleven steps set out the process explic-
itly without being overly detailed. But you should know that everyone does not present the
research process in the same way we present it here.
Step 1: Establish the need for marketing research
Step 2: Define the problem
Step 3: Establish research objectives
Step 4: Determine research design
Step 5: Identify information types and sources
Step 6: Determine methods of accessing data
Step 7: Design data collection forms
Step 8: Determine the sample plan and size
Step 11: Prepare and present the final research report
Step 9: Collect data
Step 10: Analyze data
FIGURE 3. 1 11 Steps in the Marketing Research Process
M03_BURN3261_08_GE_C03.indd 68M03_BURN3261_08_GE_C03.indd 68 27/08/16 4:39 pm27/08/16 4:39 pm

3-1 THE MARKETING RESEARCH PROCESS 69
Not All Studies Use All 11 Steps A second caution is
that not all studies follow all 11 steps. Sometimes, for exam-
ple, a review of secondary research alone may allow the
researcher to achieve the research objectives. Our 11 steps
assume that the research process examines secondary data
and continues on to collect primary data.
Steps Are Not Always Followed in Order Our third
and fi nal caution is that most research projects do not follow
an orderly, step-by-step process. In fact, the steps are often
interrelated. Sometimes, after beginning to gather data, it may
be determined that the research objectives should be changed.
Researchers do not move like robots from one step to the
next. Rather, as they move through the process, they make
decisions on how to proceed in the future, which may involve
going back and revisiting a previous step.
INTRODUCING “WHERE WE ARE” Understanding the steps in the marketing research process
establishes a foundation for learning to conduct marketing
research. Knowledge of these steps helps researchers deal
with the complex issues that arise in marketing research. We
will examine some of those complexities in this text. To provide an aid in dealing with the rest
of the course material, we introduce a new section at the beginning of every chapter, begin-
ning with Chapter 4 , called “Where We Are.” As seen in Figure 3. 2 , this feature lists the 11
steps. The step that is presented in the current chapter you are reading will be highlighted.
This way, even as you get immersed in the necessary details of marketing research, “Where
We Are” is there to show you where the material you are reading fi ts into the overall frame-
work of marketing research.
Now, let’s look at our fi rst step!
STEP 1: ESTABLISH THE NEED FOR MARKETING RESEARCH When managers must make decisions and they have inadequate information, this signals
the need for marketing research. Not all decisions will require marketing research. Because
research takes time and costs money, managers must weigh the value that may possibly be
derived from conducting marketing research and having the information at hand with the cost
of obtaining that information. Fortunately, most situations do not require research because,
if they did, managers would be mired down in research instead of making timely decisions.
A company’s philosophy about the importance of research will be refl ected in its policy
regarding the use of marketing research. Managers must make a decision about the role they
wish marketing research to play in their organization. Some managers simply do not believe
in investing time and money conducting research, and they have a policy of not conduct-
ing marketing research. However, even the best decision makers cannot make good deci-
sions without good information, and to rely solely on intuition in today’s complex and rapidly
changing marketplace is risky business.
Company policy regarding marketing research may also show a preference for the type
of research management prefers. Some managers use focus groups extensively, some use
online communities, and others rely on quantitative studies based on large samples. Some
prefer to conduct most research in house; others prefer to hire marketing research suppliers
to conduct most research. For a profi le of a marketing research company that has devel-
oped an innovative solution for buying marketing research services, see Marketing Research
Insight 3. 1.
1
2345
6
78
91011
Establish the need for marketing
research.
Define the problem.
Establish research objectives.
Determine research design.
Identify information types
and sources.
Determine methods of accessing
data.
Design data collection forms.
Determine the sample plan and
size.
Collect data.
Analyze data.
Prepare and present the final
research report.
FIGURE 3. 2 “Where We Are”
At the beginning of every chapter, beginning with Chapter 4 , the “Where We Are” feature lists the 11 steps of the marketing research process and highlights the step presented in each chapter .
The need for marketing research arises when managers must make decisions and they have inadequate information.
M03_BURN3261_08_GE_C03.indd 69M03_BURN3261_08_GE_C03.indd 69 27/08/16 4:39 pm27/08/16 4:39 pm

70 CHAPTER 3 • THE MARKETING RESEARCH PROCESS AND DEFINING THE PROBLEM AND RESEARCH OBJECTIVES
Sometimes problems arise for which marketing research is not the best solution. The
following sections describe four circumstances that indicate research is not the best option.
The Information Is Already Available Managers make many decisions. For routine
decisions, most managers have the experience to act without any additional information.
Remember, in well-established fi rms, managers have been intimately involved with their mar-
kets for many years. For many decisions, managers can rely on their base of acquired knowl-
edge. When decisions require additional information, the fi rm may already have the necessary
information. Prior to conducting research, managers should always ask: Do we already have
the information? Other components of the marketing intelligence system (MIS) may be able
to supply the data. Can the needed information be obtained from the internal reports system
or from the decision support system (DSS)? All of these systems are ongoing sources of infor-
mation. Marketing managers can quickly and inexpensively (low variable cost) access this
information. Coca-Cola, for example, has an extensive database as part of its DSS. Managers
at the large soft drink fi rm have ready access to data needed to forecast the eff ect on sales
if they vary levels of ingredients in their products. When information is not available, the
researcher should consider conducting marketing research .
The Timing Is Wrong to Conduct Marketing Research In cases when managers
decide they need marketing research, time is critical. Consequently, time often plays a criti-
cal role in making the decision to use marketing research. Even though online research has
sped up the marketing research process considerably, circumstances may dictate there is
simply not enough time to conduct marketing research. As an example, let’s assume that an
auto manufacturer introduces a hydrogen engine that runs on water, and sales of the car are
ZappiStore Provides a Self-Service Platform for Buying Research Services ZappiStore is the online research provider that is chang-ing the way that companies are accessing insight. Businesses need to be increasingly respon-sive to shifts in the market and to the demand of ever tighter deadlines, but market research often fails to keep pace. Zappi-Store provides an automated, self-service platform for buying high-quality research services—at lightning-fast speed and low cost.
ZappiStore’s revolutionary system offers truly agile insight; no briefs and no proposals mean that you can test early and test often at key instances in the production process. The com-pany has partnered with the world’s leading research agencies to offer off-the-shelf products targeted at business issues from new product development, to package testing, creative testing, or social media monitoring.
Source: Courtesy Ryan Barry.
MARKETING RESEARCH INSIGHT 3. 1 Practical Application
Ryan Barry is Senior
Vice President,
ZappiStore.
Visit Zappistore at www.zappistore.com .
Cou
rtes
y of
Zap
piS
tore
Cou
rtes
y of
Zap
piS
tore
M03_BURN3261_08_GE_C03.indd 70M03_BURN3261_08_GE_C03.indd 70 27/08/16 4:39 pm27/08/16 4:39 pm

3-1 THE MARKETING RESEARCH PROCESS 71
unprecedented in the history of this mode of transportation. Do other auto fi rms need to do
marketing research to “see” what the market preferences are? Less dramatic examples include
a new package design, new fl avor, or new ingredient that causes breakthroughs in sales and
market shares. Competitive fi rms need to react quickly.
Time may also be a factor for products that are nearing the end of their life cycle. When
products have been around for many years and are reaching the decline stage of their life
cycle, it may be too late for research to produce valuable results.
Costs Outweigh the Value of Marketing Research Marketing research should be
seen as an investment. Managers should always consider the cost of research and the value
they expect to receive from conducting it. Although costs are readily estimated, it is much
more diffi cult to estimate the value research is likely to add. Sometimes it is obvious that the
value of research is not worth the costs. One researcher reported that he advised his client, a
pie manufacturer, not to pursue conducting research on understanding consumer pie buying
in convenience stores. Why? The researcher had discovered that only 1% of pie sales were
coming through convenience stores. 2
Some recent work has attempted to generate heuristics to help determine the value of
research. In a collaborative study by Quirk’s Marketing Research Review, Research Innova-tion, and ROI, Inc., 11 methods were developed to determine the return on investment in
research. Some commonalities among the methods were the following:
a. All methods of measuring the value of research should explicitly link the research
results to business impacts. In other words, a research study should not just conclude
that alternative A produces more consumer satisfaction. Rather, the increase in con-
sumer satisfaction should be linked to an impact such as greater customer retention or
higher market share.
b. All methods of measuring the value of research should demonstrate that something
happened as a result of the research that would not have happened otherwise and quan-
tify the fi nancial value of that diff erence. Or the metrics should demonstrate that risk
was mitigated and quantify the fi nancial value of that risk reduction . 3
Although it is diffi cult to quantify value, some progress is being made among researchers
to do a better job of helping clients evaluate research. If a researcher can show the sales vol-
ume impact for every 1% increase in consumer awareness, the researcher is in a much better
position to help the client determine if research on awareness levels of new package designs is
worth the cost. 4 Once a decision is made that research is needed, managers (and researchers)
must properly defi ne the problem and the research objectives.
STEP 2: DEFINE THE PROBLEM Once a fi rm decides to conduct marketing research, the second step is to defi ne the problem.
This is the most important step, because if the problem is incorrectly defi ned, all that follows
is wasted eff ort. Marketing research should only be conducted when fi rms need to make a
decision and do not have the information available to guide decision making. At this stage,
a problem statement should be developed that summarizes the problem succinctly. A later
section of this chapter addresses issues that should be considered to properly develop the
problem statement.
STEP 3: ESTABLISH RESEARCH OBJECTIVES Research objectives tell the researcher exactly what information needs to be gathered and ana-
lyzed to allow managers to make decisions related to a problem. Research objectives need to
be very clear, since they will determine the methods used and the content of the measurement
instrument. We will revisit research objectives in greater detail later in this chapter.
M03_BURN3261_08_GE_C03.indd 71M03_BURN3261_08_GE_C03.indd 71 27/08/16 4:39 pm27/08/16 4:39 pm

72 CHAPTER 3 • THE MARKETING RESEARCH PROCESS AND DEFINING THE PROBLEM AND RESEARCH OBJECTIVES
STEP 4: DETERMINE RESEARCH DESIGN The next step involves determining the research design. By research design we are referring to
the research approach used to meet the research objectives. Three widely recognized research
designs are exploratory , descriptive, and causal. Exploratory research , as the name implies, is
a form of casual, informal research that is undertaken to learn more about the research prob-
lem, learn terms and defi nitions, or identify research priorities. Often exploratory research
is conducted early on to help clients determine the research objectives . Descriptive research
refers to research that describes the phenomena of interest. Many surveys are undertaken to
describe things: level of awareness of advertising, intentions to buy a new product, satisfaction
level with service, and so on. The fi nal type of research approach is causal research design.
Causal studies attempt to uncover what factor or factors cause some event. Will a change in
the package size of our detergent cause a change in sales? Causal studies are achieved from
a class of studies we call experiments. You will learn about these three research designs and
when it is appropriate to use each in Chapter 4 .
STEP 5: IDENTIFY INFORMATION TYPES AND SOURCES Because research provides information to help solve problems, researchers must identify
the types and sources of information they will use in step 5. Two types of information are
primary (information collected specifi cally for the problem at hand) and secondary (informa-
tion already collected).
Secondary information should always be sought fi rst, since it is much cheaper and
faster to collect than primary information and is sometimes superior to information that an
individual fi rm is able to collect on its own. Much second-
ary information is available in published sources in the library
and/or online and is either free or available for a small fee.
Sometimes research companies collect information and make
it available to all those willing to pay a subscription. This
type of information is referred to as syndicated data ; Nielsen
Media Research’s TV ratings, which report the numbers of
persons who watch diff erent TV programs, are an example
of syndicated data. Secondary information is discussed fur-
ther in Chapter 5 . However, sometimes secondary data are not
available or are inadequate, outdated, or insuffi cient. In those
situations, primary data must be collected. Beginning with
Chapter 6 , the rest of this book covers how to gather, analyze,
and report primary data.
STEP 6: DETERMINE METHODS OF ACCESSING DATA Data may be accessed through a variety of methods. Although
secondary data are relatively easy to obtain, accessing primary
data is much more complex. Some data are collected through
observation of consumers. Some data are collected by moni-
toring information available online. Other data might be col-
lected using surveys. Often multiple methods, called mixed
methods, are used to acquire data. Data collection methods
will be covered in detail in Chapter 7 .
STEP 7: DESIGN DATA COLLECTION FORMS Step 7 involves designing the form for data collection. If we
communicate with respondents (ask them questions), the form Data can be collected by observing customers.
© B
lueO
rang
e S
tudi
o/S
hutt
erst
ock
M03_BURN3261_08_GE_C03.indd 72M03_BURN3261_08_GE_C03.indd 72 27/08/16 4:39 pm27/08/16 4:39 pm

3-1 THE MARKETING RESEARCH PROCESS 73
is called a questionnaire . If we ask questions in a focus group, the form is called a focus group guide . In either case, great care must be given to design the form properly. This is one
of the most important steps of the research process, since the quality of the data collection
form determines the quality of the data gathered with that form. Questions must be phrased
properly to generate answers that satisfy the research objectives and therefore can be used
to solve the problem. The questions must be clear and unbiased. Care must also be taken to
design the questionnaire to reduce refusals to answer questions and to get as much informa-
tion as desired from respondents. Software is available to assist researchers in creating sur-
veys, such as Qualtrics and SurveyMonkey. Most of these programs allow users to post the
surveys online and, with a subscription service, the data are automatically downloaded into
software such as Excel or SPSS as respondents complete the surveys. You will learn about
preparing a questionnaire in Chapter 8 .
STEP 8: DETERMINE THE SAMPLE PLAN AND SIZE In many cases, marketing research studies are undertaken to learn about populations by tak-
ing a sample of that population. A population consists of the entire group about which the
researcher wishes to make inferences based on information provided by the sample data. A
population could be “all department stores within the greater Portland, Oregon, area,” or it
could be “college students enrolled in the College of Business at XYZ College.” Populations
should be defi ned by the research objectives. A sample is a subset of the population. Sample plans describe how each sample element, or unit, is to be drawn from the total population. The
objectives of the research and the nature of the sample frame (list of the population elements
or units) determine which sample plan is to be used. The type of sample plan used determines
to what extent the sample is representative of the population.
As you will learn in Chapter 9 , sample plans have become more complex as the best
methods of communicating with people have changed. For example, not many years ago,
about 96% of all U.S. households could be reached through a traditional land-line telephone.
Today that number has dropped signifi cantly. Researchers must use diff erent methods to reach
people who use cell phones exclusively.
Another issue is sample size . How many elements of the population should be used to
make up the sample? The size of the sample determines how accurately your sample results
refl ect values in the population. In Chapter 9 you will learn how to determine the optimal
sample size. Several marketing research companies, such as the fi rm Survey Sampling Inter-
national, specialize in helping fi rms with the sampling process.
STEP 9: COLLECT DATA In Chapter 11 you will learn what issues to consider in collecting data in the fi eld to ensure
the highest possible data quality. Errors in collecting data may be attributed to fi eldworkers
or to respondents, and they may be intentional or unintentional. Researchers should know
the sources of these errors and implement controls to minimize them. For example, fi eld-workers , the people who are collecting the data, may cheat and make up data they report as
having come from a respondent. Researchers aim to minimize this possibility by undertaking
a control referred to as validation . Validation means that 10% (the industry standard) of all
respondents in a marketing research study are randomly selected, re-contacted, and asked if
they indeed took part in the study. Companies that specialize in data collection are referred to
as fi eld services fi rms .
STEP 10: ANALYZE DATA Marketing researchers transfer data from the data collection forms and enter the data into
software packages that aid them in analyzing the data. In Chapter 12 you will learn how
to manage quantitative data and how to conduct data analysis using IBM SPSS, the data
Field services fi rms are companies that specialize in data collection.
M03_BURN3261_08_GE_C03.indd 73M03_BURN3261_08_GE_C03.indd 73 27/08/16 4:39 pm27/08/16 4:39 pm

74 CHAPTER 3 • THE MARKETING RESEARCH PROCESS AND DEFINING THE PROBLEM AND RESEARCH OBJECTIVES
analysis software you will be learning with this book. Also in Chapter 12 , you will learn
basic descriptive statistics and how to generalize values you generate from your sample data
to the population. In Chapter 13 you will learn how to test for diff erences between groups.
For example, are there diff erences in intention to buy a new brand between diff erent groups?
Determining relationships among variables are covered in Chapter 14 . In Chapter 15 you
will learn how regression analysis is used to predict a variable given what is known about
other variables. The objective of data analysis is to use statistical tools to present data in a
form that fulfi lls the research objectives. If the research objective is to determine if there are
diff erences in intention to purchase a new product between four levels of income groups,
data analysis would be used to determine if there are any diff erences in intention to purchase
among the income groups in the sample and to determine if these diff erences actually exist in
the population.
STEP 11: PREPARE AND PRESENT THE FINAL RESEARCH REPORT The fi nal step in the research process is preparing and presenting the marketing research
report. The report is essential because it is often the client’s only record of the research
project. In most cases, marketing research fi rms prepare a written research report and
also make an oral presentation to the client and staff . Traditionally, marketing researchers
follow a fairly standard report-writing format. However, an emerging trend in marketing
research is to present data using innovative methods that are more interactive. Regardless
of reporting method, the most important criterion for reporting results is that it clearly
communicates the research fi ndings to the client. Methods for reporting results will be
detailed in Chapter 16 .
We’ve just outlined and briefl y discussed the steps in the marketing research process. If
the researcher and client exercise care, the research process will produce information that can
be used to resolve the problem. The “Where We Are” feature at the beginning of each chapter
will help you appreciate marketing research as a process as you delve into the details of each
step. We have already discussed step 1 in the marketing research process in the preceding sec-
tion. In the following sections, we will examine steps 2 and 3.
3- 2 Defi ning the Problem Defi ning the problem properly is the most important step in the marketing research process.
The success of a marketing research project depends on properly pinpointing a problem to
formulate the problem statement . We can properly follow all of the marketing research steps
after defi ning the problem and get the correct answers, only to realize that we have been ask-
ing the wrong questions all along. If the problem is defi ned incorrectly, the rest of the steps in
the research process will be fundamentally fl awed. All of the time and money spent conduct-
ing the marketing research will be wasted.
When we refer to “the problem,” our focus is on a situation that a manager or client is
facing. Problems are situations calling for managers to make choices among decision alterna-
tives. When managers make decisions, they do so to solve a problem. Sometimes these deci-
sions are so routine and easily made based on past experience that we don’t think of them as
“problems.” Nevertheless, choices must be made, and the manager must make the decisions.
Managers must choose among alternatives to select new products, choose among advertising
copy alternatives, determine the price of their products or services, and select dealers.
The marketing research process begins when a managerial problem or opportunity exists
that demands action, but there is not enough information to know how to respond to the prob-
lem. This sets into motion a series of tasks that ultimately leads to establishing research objec-
tives. As Figure 3. 3 displays, there are fi ve tasks to defi ning a marketing research problem.
Each task is detailed in the following sections.
Defi ning the problem properly is the most important step in the marketing research process.
Problems are situations calling for managers to make choices among alternatives.
M03_BURN3261_08_GE_C03.indd 74M03_BURN3261_08_GE_C03.indd 74 27/08/16 4:39 pm27/08/16 4:39 pm

3-2 DEFINING THE PROBLEM 75
1. RECOGNIZE THE PROBLEM A manager encounters a problem when he or she encoun-
ters a situation that is negative or potentially positive for the
organization. These two sources of problems can be stated
as the failure to meet an objective or the identifi cation of an
opportunity.
Failure to Meet an Objective We may recognize we
have a problem when there is a gap between what was sup-
posed to happen and what did happen—or when we fail to
meet an objective. 5 For example, a retailer may experience
a decrease in sales over previous periods, a website begins
losing traffi c, or an advertising campaign does not reach
its expected level of awareness. That gap signifi es what we
normally think of when we use the term problem . We must
now determine what course of action to take to close the
gap between the objective and actual performance.
Identifi cation of an Opportunity The second source
of a problem is not often immediately recognized as a
problem. An opportunity represents what might happen;
the problem arises when an opportunity is lost—when
there is a gap between what did happen and what could
have happened. This situation represents a failure to real-
ize a “favorable circumstance or chance for progress or
advancement.” 6 For example, a new use for a product
is identifi ed on social media, or those in a target market
would like to have a service delivered to their doors. For
our purposes, a marketing opportunity is defi ned as a
potentially favorable circumstance in which a company can
perform successfully. Google, for example, has millions of
people using its services daily. There are many opportu-
nities for Google to take advantage of this ready market.
Google managers must make decisions about whether and
how to take advantage of these opportunities.
Both of these situations—failure to meet an objective and identification of an
opportunity—have the same consequence for managers: They must make decisions. Hence,
we have what was defi ned earlier as a “problem.” It is diffi cult to overstate the importance of
recognizing a problem. Managers who do not recognize problems will not be in management
for very long. Managers must be knowledgeable about objectives and performance. They
should be setting objectives and have systems in place to monitor performance. This is sound
management practice.
A function of an internal reports system, part of the fi rm’s MIS (see Chapter 1 ) , is to
provide alerts when problems are emerging. Systems are now available to identify problems
at an early point in time. For example, store-level versions of these systems alert managers to
potential problems such as stockouts, which often double when stores run promotions. Other
alerts make managers aware of promotions that are cannibalizing other products or indicate
which geographical regions are responding or not responding to promotions. Early identifi ca-
tion of problems can lead to managerial changes that can greatly improve bottom-line profi ts. 7
How do managers recognize when they have an opportunity? There is much variabil-
ity among fi rms in terms of ability to identify opportunities. Some fi rms have departments
and formal procedures to ensure that opportunities are found and evaluated. These fi rms tend
Recognize the Problem
• Is it failure to meet an objective or identification of an opportunity?
• Conduct a situation analysis• Clarify the symptoms• Determine the probable causes of the symptoms• Determine alternative decisions
• Specify decision alternatives• Weigh the alternatives
• Inventory the current information state• Identify the information gaps
• Develop a concise description of the problem
Understand the Background of the
Problem
Determine What Decisions Need to
Be Made
Identify What Additional
Information Is Needed
Formulate the Problem
Statement
FIGURE 3. 3 Process for Defi ning a Problem
A marketing opportunity is a potentially favorable circumstance in which a company can perform successfully.
M03_BURN3261_08_GE_C03.indd 75M03_BURN3261_08_GE_C03.indd 75 27/08/16 4:39 pm27/08/16 4:39 pm

76 CHAPTER 3 • THE MARKETING RESEARCH PROCESS AND DEFINING THE PROBLEM AND RESEARCH OBJECTIVES
to rely on innovations to renew their life
cycles and keep them competitive. Other
fi rms empower their sales force and other
front-line employees to identify problems. 8
Other companies only look at opportunities
when they seem to “fall in their laps.” When
that happens, it may be too late; a competi-
tor may already have an insurmountable
head start. To capitalize on opportunities,
companies must be proactive.
2. UNDERSTAND THE BACKGROUND OF THE PROBLEM Sometimes managers call researchers when
they sense something is wrong and they
need help in diagnosing the situation. Man-
agers may be aware of symptoms , which
are changes in the level of some key moni-
tor that measures the achievement of an objective (e.g., our measure of customer satisfaction
has fallen 10% in each of the past two months). But that does not mean that the manager
knows what the problem is. As a result, managers may not be sure what decision they should
make, if any.
Other times managers have defi ned what they think the problem is and the decision that
must be made to resolve it. In either scenario, the researcher has an obligation to be sure that
the problem is defi ned correctly. This is particularly true when the researcher is called in by a
manager who already has defi ned a problem in very specifi c terms. Researchers provide value
at this point in the process by supplying a fresh view, unhindered by biases of recent events,
trends, or infl uences that may have dominated the managers’ decision-making process. It is
important that researchers not simply be “order-takers” but instead use their experience and
knowledge to advise managers on how to approach the problem. 9
To understand the background of a problem, the researcher must conduct a situation anal-
ysis, clarify the symptoms of the problem, and determine the probable causes of the symptom.
Each of these processes will be explained in the next sections.
Conduct a Situation Analysis As a fi rst step to understanding the background of a problem,
researchers should conduct a preliminary investigation called a situation analysis. A situation analysis is a form of exploratory research undertaken to gather background information and data
that may be helpful in properly defi ning the problem decision. A situation analysis may reveal,
for example, that the symptom of declining sales is more likely due to a problem with losing
distributors than with ad copy. Researchers have a responsibility to ensure they are addressing
the right problem, even when the problem has been previously defi ned by management.
A situation analysis may begin with the researcher learning about the industry, the com-
petitors, key products or services, markets, market segments, and so on. The researcher should
start with the industry to determine if any symptoms, to be identifi ed later, are associated
with the entire industry or only with the client fi rm. The researcher should then move to the
company itself: its history, performance, products/services, unique competencies, marketing
plans, customers, and major competitors.
The primary method of conducting a situation analysis is to review both internal and
external secondary data . Other methods include conducting experience surveys (discussions
with knowledgeable persons inside and outside the fi rm), case analysis (examples of for-
mer, similar situations), pilot studies (mini-studies that may reveal problem areas), and focus groups (small groups discussing topics such as the company’s products or services).
The MIS can alert managers to potential problems such as stockouts.
A symptom is a change in the level of a key monitor that measures the achievement of an objective or a perceived change in the behavior of a market factor that indicates an emerging opportunity.
For advice from Murphy Research on the initial steps of
a new project, go to www.youtube.com and enter “4 Questions to Ask Before You Start a New Marketing Research Project.”
A situation analysis is a form of exploratory research undertaken to gather background information and data pertinent to the problem area that may be helpful in properly defi ning the problem decision.
© M
icha
elju
ng/S
hutt
erst
ock
M03_BURN3261_08_GE_C03.indd 76M03_BURN3261_08_GE_C03.indd 76 27/08/16 4:39 pm27/08/16 4:39 pm

3-2 DEFINING THE PROBLEM 77
Clarify the Symptoms When diagnosing a problem, symptoms are sometimes confused
with problems. The role of a symptom is to alert management to a problem—that is, there is
a gap between what should be happening and what is happening. A symptom may also be a
perceived change in the behavior of some market factor that implies an emerging opportunity.
Researchers and managers must be careful to avoid confusing symptoms with problems.
To illustrate, consider the classic statement: “We have a problem—we are losing money.” The
problem is not that “we are losing money.” Rather, the problem may be found among all those
factors that cause us to lose (or make) money. The manager, with help from the researcher,
must identify all those possible causes to fi nd the right problem(s). The managers must be
aware that the symptoms are not the problem but are “signals” that alert us to a problem. As an
example, when sales of portable radios, tape players, and TVs took off in the 1980s through
the popular Sony series of Walkman and Watchman products, this should have served as a
symptom that there was a basic market need for portability. Today that need has resulted in
high demand for portability in terms of the many mobile devices available. In short, symptoms
are not problems; their role is to function as a signal to alert managers to recognize problems.
The researcher should clarify the symptoms early in the research process. Are the symp-
toms identifi ed properly? Companies vary greatly in terms of defi ning their objectives, moni-
toring their results, and taking corrective action. Does the company have an adequate system
in place to identify symptoms? Are there other symptoms not identifi ed? What are they? Are
they accurate measures of performance? Are they reported in a timely fashion? Is there ade-
quate screening of the environment to pick up on opportunities?
Next, researchers need to assess the symptoms themselves. Can the symptoms be verifi ed
by other factors that are identifi ed in the situation analysis? Are the symptoms one of a kind?
Are they likely to appear again? You are beginning to realize, no doubt, that the researcher
acts much like a detective. It is the researcher’s role to explore and to question with the aim of
properly defi ning the problem. Once the researcher has validated the symptoms, he or she is
now ready to examine their causes.
Determine the Probable Causes of the Symptom When the manager and researcher
are in agreement about which symptom or symptoms are in need of attention, it is time to
determine what could possibly cause the symptoms. There is usually some cause or causes for
the change. Profi ts do not go down by themselves. Sales do not drop without customers doing
something diff erently from what they have done in the past. Satisfaction scores do not drop
without some underlying cause.
At this stage it is important to determine as many causes as possible. If only a partial
list of causes is made, it is possible that the real cause will be overlooked, leading ultimately
to an incorrect decision. To help visualize this process, let’s look at an example of an apart-
ment complex near your university. Let’s assume management has been alerted to symptoms
that show the occupancy rate declining from 100% to 80% over the last three semesters.
After discussion with the researcher, all possible causes may be grouped in the following
categories: (1) competitors’ actions, which drew prospective residents away; (2) changes
in the consumers (student target population); (3) something about the apartment complex
itself; and (4) general environmental factors. The researcher should discuss all these possible
causes with management. There may be several possibilities within each of these categories.
For example:
1. Competitors might be reducing rents or “lowering price” by providing free services such
as cable TV.
2. The number of students at the university may be declining.
3. The apartment building may not have been adequately maintained or might appear to be
“aging” on the outside.
4. Financial aid may have decreased on campus, so that students are less able to aff ord
off -campus housing.
M03_BURN3261_08_GE_C03.indd 77M03_BURN3261_08_GE_C03.indd 77 27/08/16 4:39 pm27/08/16 4:39 pm

78 CHAPTER 3 • THE MARKETING RESEARCH PROCESS AND DEFINING THE PROBLEM AND RESEARCH OBJECTIVES
The situation analysis should have identifi ed these possible causes. After listing all pos-
sible causes under each one of the previously identifi ed broad categories, the researcher and
manager should narrow down the possible causes to a small set of probable causes, defi ned
as the most likely factors giving rise to the symptom(s). In our apartment example, we can
assume that the manager and researcher have eliminated many causes for the symptom. For
example, there has been no change in fi nancial aid, student enrollment is up, and the apartment
building’s appearance is on a par with, or even better than, competitors’ apartments. After
evaluating all the other possible causes, assume the researcher and manager have reduced the
probable cause down to the competitors off ering tenants free cable TV. Notice that something
very important has happened: Management now has a decision to make!
Determine Alternative Decisions An important task in defi ning the problem is to deter-
mine what decisions managers need to make as a result of the problem. When the problem
has been defi ned by management and the researcher has conducted a situation analysis, the
researcher must make a decision as to whether the problem is defi ned correctly. If, according
to the researcher, the problem is confi rmed, we now need to determine what decision alterna-
tives the manager needs to consider.
3. DETERMINE WHAT DECISIONS NEED TO BE MADE The determination that the probable cause of the symptom is competitors off ering free cable
TV creates a decision for management. We see that we are now ready to specify the decision
to be made. Management must decide what to do to win back market share, and as decisions
consist of decision alternatives, managers must specify the decision alternatives.
Specify Decision Alternatives Essentially, possible decision alternatives are all market-
ing action that the manager thinks may resolve the problem. Common examples are price
changes, product modifi cation or improvement, promotion of any kind, and adjustments in
channels of distribution. During this phase, the researcher’s marketing education and knowl-
edge come into play fully. Often the manager and researcher brainstorm possible decision
alternatives that may serve as solutions. It is important for the manager to specify as many as
possible of the decision alternatives that might address the probable cause of the symptom.
As Semon notes, “Unless the entire range of potential solutions is considered, chances of cor-
rectly defi ning the research problem are poor.” 10
Returning to our apartment complex example, assume the manager examines all types
of decisions. One alternative is to off er what the other apartments are off ering: free TV cable
services. A second alternative is to try to gain a competitive advantage by off ering free TV
cable services plus wireless Internet. A third alternative is to continue as is without off ering
free services. Now the decision alternatives become clear. But what are the consequences of
each particular decision alternative?
Weigh the Alternatives Consequences are the results of marketing actions. To evaluate
decision alternatives, we must speculate as to the consequences of selecting each alterna-
tive. What are the most likely consequences we can anticipate with each decision alternative?
Will the decision alternatives aff ect sales? Product recognition? Market share? Note that we
are anticipating a consequence. If we know the consequence, there is no need for marketing
research. Assuming that we don’t know the consequence, research on each alternative under
consideration will help determine which decision alternative is the best choice.
Returning to our apartment complex example, it would seem reasonable for the manager
to speculate that if free cable TV is made available for each apartment, the consequence of
this alternative would be occupancy rates that are more than enough to off set the cost of pro-
viding the service. But we must ask: How certain is the manager that this will occur? Hasn’t
the manager made an assumption that providing free basic cable services will create a greater
demand for the apartment complex?
Decision alternatives are all marketing action that the manager thinks may resolve the problem.
Consequences are the results of marketing actions.
M03_BURN3261_08_GE_C03.indd 78M03_BURN3261_08_GE_C03.indd 78 27/08/16 4:39 pm27/08/16 4:39 pm

3-2 DEFINING THE PROBLEM 79
Decision makers make assumptions when they assign consequences to decision alterna-
tives. Assumptions are assertions that certain conditions exist or that certain reactions will
take place if the considered alternatives are implemented. Assumptions deserve researcher
attention because they are the glue that holds the decision process together. Given a symp-
tom, the manager assumes certain causes are at fault. The manager further assumes that,
by taking corrective actions (alternatives), the problem will be resolved and the symptoms
will disappear. In our apartment complex example, the manager’s assumption is that free
cable TV will be a strong enough incentive to cause occupancy to increase at the apartment
complex during the next academic year. Another assumption is that this demand will be so
much greater than the demand for apartments without these services that the increase in the
demand will more than off set the additional cost of providing cable. As we can see from
Figure 3. 3 , our next step is to determine if we have adequate information on hand to make
these assumptions. If we do not feel that information is adequate to support these assump-
tions, we will likely need new information. The new information will be gathered by con-
ducting marketing research!
If the manager is completely certain that he or she has adequate information to support
the assumptions, there is no need for research and the decision may be made. The problem
may now be resolved by simply choosing the correct decision alternative. In this case we do
not need marketing research, do we? However, if a researcher questions a manager about his
or her beliefs regarding the consequences of certain proposed alternatives, it may turn out that
the manager is not really as certain as he or she fi rst seemed to be. It is imperative, therefore,
that the manager’s assumptions be analyzed for validity.
4. IDENTIFY WHAT ADDITIONAL INFORMATION IS NEEDED The next task in properly defi ning the problem is to identify if additional information is
needed. The researcher must assess the existing information state , which is the quantity
and quality of evidence a manager possesses for each of his or her assumptions. During
this assessment, the researcher should ask questions about the current information state
and determine the desired information state. Conceptually, the researcher seeks to iden-
tify information gaps , which are discrepancies between the current information level
and the desired level of information at which the manager feels comfortable resolving
the problem at hand. Ultimately, information gaps are the basis for establishing research
objectives.
Inventory the Current Information State An important question that should be asked
at this stage is if the information already exists to make a decision. Recall from “Step 1:
Establish the need for marketing research” that marketing research is only conducted when
managers do not have the information they need to choose among decision alternatives. Thus,
in defi ning the problem, managers must fi rst determine what decisions they must make. Then
they must ask if they have adequate information already available to make the decision. Man-
agers should not conduct marketing research just “to know something,” because marketing
research takes time and money to conduct.
Identify the Information Gaps Now let’s go back to the apartment complex situation
and think about information gaps. Let’s assume the manager feels quite confi dent about the
accuracy of the information that competitors are off ering free cable TV because they advertise
this new feature and announce it with signs outside their apartment complexes. The researcher
continues to test assumptions by asking: “How do you know that students will care about
access to cable TV?” The manager responds: “Because there are great movies on these chan-
nels. My wife and I watch a movie almost every night.”
“But, you don’t have to study at night, and you are not involved in campus activities and a
fraternity or sorority, are you? Plus students have access to television and movie programming
Assumptions are assertions that certain conditions exist or that certain reactions will take place if the considered alternatives are implemented.
Information gaps are discrepancies between the current information level and the desired level of information at which the manager feels comfortable resolving the problem at hand.
Information state is the quantity and quality of evidence a manager possesses for each of his or her assumptions.
M03_BURN3261_08_GE_C03.indd 79M03_BURN3261_08_GE_C03.indd 79 27/08/16 4:39 pm27/08/16 4:39 pm

80 CHAPTER 3 • THE MARKETING RESEARCH PROCESS AND DEFINING THE PROBLEM AND RESEARCH OBJECTIVES
from sources other than cable TV,” the researcher counters. “How do you know that college
students will want the cable?”
“I really don’t know. I haven’t even asked any of my own tenants how many of them
subscribe to cable,” the manager admits.
“Would knowing that information help you make the decision?” the researcher asks. “If
none of them subscribe to cable, is it because they don’t like cable TV or because they can’t
aff ord it? Or maybe they have access to Netfl ix or Amazon Prime and just watch fi lms and TV
shows on their computers.”
By now the manager realizes that his “certainty” has turned into high “uncertainty.”
He has an information gap, and he needs more information to close this gap to make the
right decision. This situation is not unusual. Like the apartment manager, many people make
assumptions and are satisfi ed with those assumptions until they start asking hard questions.
However, when the decision is important, it’s wise to make the right decision alternative
choice to solve that problem. In our example, the researcher has convinced the manager he
needs more information to make sure his assumptions are correct. Now he needs to determine
what information is needed to close the information gap.
5. FORMULATE THE PROBLEM STATEMENT Having gone through all of the tasks previously outlined, the researcher should be ready
for the fi nal phase of problem defi nition: developing a problem statement. The problem statement is a concise description of the problem or opportunity that management is fac-
ing that requires research to make a decision. The following are examples of problem
statements:
■ An apartment manager wants to increase the proportion of apartment occupancies per
year at his apartment complex. ■ A snack manufacturer seeks to increase sales by offering biodegradable packaging. ■ An app developer hopes to increase downloads of her app. ■ A retailer wants to understand the consequences of an increase in sales by baby boom-
ers and a decrease in sales by millennials during the past 12 months.
Having defi ned a problem, the next step is to determine exactly what information is
needed to solve the problem.
3- 3 Research Objectives After establishing the need for marketing research and defi ning the problem, the third step
of the marketing research process is to establish research objectives. What is a research
objective? A research objective is a goal-oriented statement or question that specifi es what
information is needed to solve a problem. Research objectives should be clear, specifi c, and
actionable. In other words, given the limitations of time, money, and technology, the research
objectives should be obtainable through marketing research. The number of research objec-
tives can be highly variable, depending on the problem statement, but a rule of thumb is
to have three to six research objectives per research project. The research objectives can be
formulated in terms of statements or questions, but they should be structurally consistent (all
statements or all questions). Research objectives should specify from whom the information
should be gathered and exactly what information is needed.
For example, suppose the American Red Cross has identifi ed as an opportunity the poten-
tial to have more college students donate blood each year to increase the available blood sup-
ply. The problem statement of the American Red Cross would be as follows:
The American Red Cross wishes to increase the number of American university
students who donate blood each year.
The problem statement is a concise description of the problem or opportunity that management is facing that requires research to make a decision.
A research objective is a goal-oriented statement or question that specifi es what information is needed to solve a problem.
M03_BURN3261_08_GE_C03.indd 80M03_BURN3261_08_GE_C03.indd 80 27/08/16 4:39 pm27/08/16 4:39 pm

3-3 RESEARCH OBJECTIVES 81
The research objectives might be identifi ed as follows:
■ To determine what college students see as the benefits of donating blood. ■ To determine what college students see as the obstacles to donating blood. ■ To identify the incentives that would encourage students to donate blood. ■ To distinguish the types of promotions that are most likely to attract college students. ■ To identify how the information defined from the previous statements varies accord-
ing to the characteristics of college students, including gender, class standing, type of
university attending, domestic versus international student, and geographical region.
See Table 3. 1 for a list of the same research objectives formulated as statements or questions.
USING HYPOTHESES To guide the process of developing research objectives, research analysts sometimes propose
hypotheses. Hypotheses are statements that are taken as true for the purposes of argument or
investigation. In making assumptions about the consequences of decision alternatives, man-
agers are making hypotheses. For example, a successful restaurant owner uses a hypothesis
that he must use X amount of food in an entrée to please his customers. This restaurant owner
bases his decisions on the validity of this hypothesis; he makes sure a certain quantity of food
is served on every plate regardless of the menu choice. Businesspeople make decisions every
day based on statements they believe to be true. They need to have confi dence that their most
important decisions are based on valid hypotheses. This is similar to our previous discussions
about assumptions . Sometimes the manager makes a specifi c statement (an assumption) and
wants to know if there is evidence to support the statement. In the instances in which a state-
ment is made, we may use the term hypothesis to describe this “statement thought to be true
for purposes of a marketing research investigation.” 11
DEFINING CONSTRUCTS An important part of developing research objectives is determining what type of information
should be measured. When multiple characteristics are used to measure a concept, it is called
a construct. A construct is an abstract idea or concept composed of a set of attitudes or behav-
iors that are thought to be related.
TABLE 3. 1 Formulating Research Objectives as Statements or Questions
Problem Statement: The American Red Cross wishes to increase the number of American university students who donate blood each year.
Formulating Research Objectives as Statements Formulating Research Objectives as Questions
To determine what college students see as the benefi ts of
donating blood
What do college students see as the benefi ts of donating blood?
To determine what college students see as the obstacles to
donating blood
What do college students see as the obstacles to donating blood?
To identify the incentives that would encourage students to
donate blood
What incentives would encourage students to donate blood?
To distinguish the types of promotions that are most likely to
attract college students
What types of promotions are most likely to attract college
students?
To identify how the information defi ned from the previous state-
ments varies according to the characteristics of college students,
including gender, class standing, type of university attending,
domestic versus international student, and geographical region.
How does the information defi ned from the previous questions
vary according to the characteristics of college students,
including gender, class standing, type of university attending,
domestic versus international student, and geographical region?
Hypotheses are statements that are taken as true for the purposes of argument or investigation.
A construct is an abstract idea or concept composed of a set of attitudes or behaviors that are thought to be related.
M03_BURN3261_08_GE_C03.indd 81M03_BURN3261_08_GE_C03.indd 81 27/08/16 4:39 pm27/08/16 4:39 pm

82 CHAPTER 3 • THE MARKETING RESEARCH PROCESS AND DEFINING THE PROBLEM AND RESEARCH OBJECTIVES
Consider an example of managers faced with a decision involving four ads. They need to
choose the best ad. But what is “best”? It is hard to write a research objective without defi ning
this type of criterion. What information will tell us which ad is best? Is it the ad that is most
memorable? Most relevant? Most believable? Least likely to be misinterpreted? Most likable?
Most likely to produce a favorable attitude? Most likely to produce an intention to buy the
advertised product? 12 These questions represent the diff erent types of information we could
collect; each is a separate construct. The following constructs have been mentioned: memory,
relevance, believability, understandability, likability, attitude, and intention to purchase.
For example, marketers refer to the specifi c instances of someone buying the same brand
9 out of 10 times as a construct referred to as “brand loyalty.” Sometimes marketing research-
ers call the constructs they study variables . Variables are elements of a construct that can be
measured or quantifi ed. They are referred to as variables because they can take on diff erent
values—that is, they can vary. 13 (Constants do not vary.) A construct provides us with a men-
tal concept that represents real-world phenomena. When a consumer sees an ad for a product
and states, “I am going to buy that new product X,” marketers would label this phenomenon
as the construct called “intention to buy.” Marketers use a number of constructs to refer to
phenomena that occur in the marketplace. Marketing researchers are constantly thinking of
constructs as they go through the problem defi nition process. Once they know the constructs
to be measured, they can determine the proper way to measure that construct, which we dis-
cuss in the next section.
It is imperative to measure the right construct. Can you state the construct we have sug-
gested to measure in the research objective for our apartment complex research project? We
could call it “likelihood to rent,” which is similar to “intention to rent.” To illustrate why the
selection of the right construct is important, let’s assume we asked a sample of students to tell
us what TV channels they currently “most prefer” to watch. Note that we would be measuring
the construct “current preferences for TV channels.” Can we make a decision based on this
information? No, we can’t, because students have only reported what they prefer to watch
from what is currently available to them. Those who do not have access to cable, such as
those being considered in our decision, will not list them, so we have no basis for making a
decision as to how many students prefer them. Therefore, we can’t make a decision because
we measured the wrong construct. We really want to know if the presence of cable will aff ect
their likelihood to rent our apartment.
What Is the Unit of Measurement? Marketing researchers fi nd constructs helpful
because, once it is determined that a specifi c construct is applicable to the problem, there are
customary ways of operationalizing , or measuring, these constructs. The research objective
should defi ne how the construct being evaluated is actually measured. These defi nitions are
referred to as operational defi nitions . An operational defi nition defi nes a construct, such as
intention to buy or satisfaction, in terms of the operations to be carried out for the construct to
be measured empirically. 14
For example, let’s take the construct “intention to buy.” (This is essentially the same as
our “likelihood to rent” example.) This construct should represent a person’s likelihood to
purchase or patronize a particular good or service, such as renting an apartment. Because few
people know with 100% certainty that they will, or will not, purchase something, we measure
this construct using a scaled response format—that is, a scale ranging from 1 to 5, 1 to 7, or
1 to 10. (We are not concerned about the number of scale units here; we are just illustrating
that we should measure this construct using a scale of numbers, each representing a diff er-
ent likelihood.) This knowledge becomes useful in properly formulating research objectives.
Researchers can access sources of information that provide them with operational defi nitions
needed to measure many constructs. 15
What is critical in the formulation of research objectives is that the proper unit of mea-
surement be used for the construct. To answer what is “proper” we could ask: What unit of
Variables are elements of a construct that can be measured or quantifi ed.
M03_BURN3261_08_GE_C03.indd 82M03_BURN3261_08_GE_C03.indd 82 27/08/16 4:39 pm27/08/16 4:39 pm

3-4 ACTION STANDARDS 83
measurement will allow the manager to choose among decision alternatives? Let’s suppose
that the researcher and manager have agreed to make a decision based on a statistically sig-
nifi cant diff erence between the mean likelihood to rent apartments with free cable TV versus
free wireless Internet. By measuring likelihood to rent on a 1–5 scale for both apartments with
free cable TV and Internet, we can calculate the mean score for each type of service. We can
then determine if there is a signifi cant diff erence between the two means. This should give
us the basis for choosing between the two alternatives. What if we had decided to measure
“likelihood to rent” by asking students: If you have a choice between two similar apartments and one off ers free cable (provide list of channels) and the other off ers free wireless Internet, which would you rent? Certainly we could do this, but asking the question this way will not
allow us to calculate the means we said we needed to make our decision. Whatever unit of
measurement is used, the researcher and manager must agree on it before defi ning the research
objectives to ensure that the choice among alternatives can be made after the research project.
What Is the Proper Frame of Reference? Often we use jargon , terminology associ-
ated with a particular fi eld. Researchers realize that, when they are formulating their research
objectives, the information requested of respondents must be worded using the respondent’s frame of reference . A pharmaceutical manager who is about to initiate a marketing research
project with physicians as respondents thinks of a particular drug in terms of dosage, form,
diff erentiating characteristics from the nearest competitor, and so on. On the other hand, the
physicians from whom the research must gather information think fi rst in terms of a patient’s
symptoms, disease severity, possible interaction with other drugs, willingness to comply with
treatment, and so on. The pharmaceutical manager must think of the information needed in
terms of the respondent-physicians’ frame of reference, not his or her own.
If we apply this concept to our apartment complex example, we could say that television
companies often speak of “basic,” “advanced basic,” and “premium” channels. Consumers
do not think of TV channels in these same terms. Consumers know channels by their names,
such as ESPN, CBS, Golf, SHOWTIME, Adult Swim, or HBO. This is why it is important in
our example to provide consumers with the actual channels provided so that they can make an
informed decision without having to guess what channels they might have with an apartment
that comes equipped with free TV cable.
3- 4 Action Standards We started this discussion by addressing diff erent sources of problems (failure to meet objec-
tives and opportunities) and the systems needed to recognize those problems. We then looked
at problem defi nition and stated that problems must be couched in terms of decisions, and
decisions must be couched in the form of decision alternatives. We addressed two diff erent
routes the researcher might take in defi ning the decision alternatives. We then discussed how
decision alternatives contain assumptions and how managers may be uncertain about these
assumptions. Uncertainty of assumptions creates information gaps, and research seeks to fi ll
those gaps. The research objective specifi es exactly what information the researcher must
collect to fi ll the information gaps. Once this information is provided, the manager should be
able to choose among the decision alternatives. But exactly how will that decision be made?
What must the information look like for a certain alternative to be selected over others? This
is the subject of the next section.
We’ve seen how the problem defi nition and research objectives development process pro-
ceeds using our apartment complex example. Next, it may be useful to determine an action
standard. An action standard is the predesignation of some quantity of a measured attribute
or characteristic that must be achieved for a predetermined action to take place. The purpose
of the action standard is to defi ne what action will be taken given the results of the research
fi ndings. 16 In other words, by specifying the action standard, managers will know, once they
An action standard is the predesignation of some quantity of a measured attribute or characteristic that must be achieved for a predetermined action to take place.
M03_BURN3261_08_GE_C03.indd 83M03_BURN3261_08_GE_C03.indd 83 27/08/16 4:39 pm27/08/16 4:39 pm

84 CHAPTER 3 • THE MARKETING RESEARCH PROCESS AND DEFINING THE PROBLEM AND RESEARCH OBJECTIVES
receive the information collected by the researcher, which decision alternative to select. In our
apartment complex case, we have determined that one research objective should be to collect
information that measures the likelihood that students will rent an apartment that off ers free cable TV in comparison to other alternatives . Recall that we stated in our research objective
that we would measure the construct “likelihood to rent” on a 5-point scale ranging from 1 =
Very Unlikely to Rent to 5 = Very Likely to Rent. When we get our research results, how do
we know whether to select from our three decision alternatives: (1) off er free basic cable TV,
(2) off er free wireless Internet, or (3) do not off er either service?
From the research, we will derive three means: one for basic TV cable, one for free wire-
less Internet, and one for an apartment off ering neither service. Recall that we are asking
respondents to choose an apartment based on the provision of the three service options, with
the assumption that all other factors are equal. Let’s think about the three means and create
a situation in which it is easy to make the decision: The wireless Internet mean is 4.8 (high
likelihood) and the basic cable and no service are each 1.0 (very low likelihood), and the
diff erence between these two means is statistically signifi cant. Clearly, we should select the
wireless Internet decision alternative.
The manager and researcher should try to determine, prior to collecting the data, at which
point they would still make this decision. Let’s assume they decide that if the wireless Internet
mean is above 3.5 and is statistically diff erent from a lower mean for TV cable or no service,
they will still go with the decision alternative of wireless Internet. In other words, they believe
that with any mean of 3.5 or above and with a mean for cable signifi cantly (statistically)
lower, the demand will be high enough to warrant the extra expense of providing the wire-
less service. A possible action standard that would warrant choosing neither would be that all
means are below 2.0.
Action standards entail making important decisions before you collect information, and
they serve as clear guidelines for action once the data have been collected. Ron Tatham, for-
mer CEO of Burke, Inc., stated: “Without action standards, managers will often say ‘The
results of the research are interesting. I learned a lot about the market but I am not sure what
to do next.’” 17
IMPEDIMENTS TO PROBLEM DEFINITION As you can now appreciate, the process of defi ning the problem and research objectives is not
simple. It takes time and serious interaction between clients and researchers. This creates a
problem because clients are accustomed to dealing with outside suppliers effi ciently, making
certain not to divulge proprietary information. Some managers, accustomed to dealing with
consultants, understand the necessity for serious communications with researchers. However,
many managers fall short of appreciating the necessity of frank and detailed discussions dur-
ing the marketing research process. Research projects have the greatest likelihood for suc-
cess when the managers and researchers are in close communication throughout the research
process.
Chet Kane refers to this problem in noting that managers often commission marketing
research projects without being involved with them. He states that managers should not only
be involved in designing the research but also should actually go out into the fi eld and listen to
some of the consumer responses fi rsthand. Had managers been more involved in the research
involving “clear” products, they would have known that the positive fi ndings of research for
these products (clear beer, clear mouthwash, and clear cola) were based on the novelty or
“fad” of the clear products. Had the managers been more involved with the research process,
they might not have launched these new products, which failed in the marketplace. 18
Often, to be eff ective, the marketing research process is slow. To repeat the statement of
Carrie Breisach of General Mills from the introduction to this chapter: It is worth spending time in the beginning gaining clarity and alignment on the true problem and questions in order to facilitate meaningful learning that ultimately illuminates the path forward and enables
M03_BURN3261_08_GE_C03.indd 84M03_BURN3261_08_GE_C03.indd 84 27/08/16 4:39 pm27/08/16 4:39 pm

3-5 THE MARKETING RESEARCH PROPOSAL 85
better, faster decisions. Managers often are
unaware of the need to work closely with the
researcher, and this causes diffi culties in iden-
tifying the real problem. Veteran researchers
are well aware of this situation, and it is up
to them to properly inform managers of their
expected role and the importance of this ini-
tial step in the research process.
3- 5 The Marketing Research Proposal At some point early in the marketing research
process, a contract is prepared. The market-ing research proposal is the contract that
documents what the marketing researcher
pledges to deliver as a result of the market-
ing research process. When a client fi rst con-
tacts a marketing research supplier to conduct
research, the client will generally request a proposal prior to agreeing to work with the fi rm in
a process called an invitation to bid (ITB) or request for proposal (RFP) . Often a client will
request proposals from several suppliers before deciding which fi rm the client would prefer to
hire to conduct the research. To ensure that their suppliers off er competitive prices and good
quality, some companies even require that their managers acquire at least three bids prior to
hiring a marketing research supplier. As such it is very important that the proposal be profes-
sional looking, well written, and comprehensive.
The proposal should very clearly defi ne the problem and state the research objectives to
be sure that the managerial client and the research fi rm are in agreement about the goals of
the projects. Generally, the more details that the supplier can provide related to the problem
background and the proposed methods for conducting the research, the more knowledgeable
and capable the researcher will appear.
Even client-side marketing researchers who are planning to conduct research on
behalf of their own companies are often required to submit proposals prior to conduct-
ing research. Their managers want to ensure that their money and their employees’ time
will be well spent before agreeing to a marketing research project. Sometimes the pool of
money available for marketing research is limited and the marketing research department
must compete on a company-wide level with other worthy projects to have their research
projects funded.
ELEMENTS OF THE PROPOSAL Following are the elements of the marketing research proposal and the types of questions that
are answered through the proposal:
1. Statement of the problem. What is the overall problem that will be addressed? What are
the decision alternatives that will be assessed through the research?
2. The research objectives. What information will be collected?
3. The research method. What methods will be used to conduct the research? Will the
research be exploratory, descriptive, or causal? Will the research be qualitative, quanti-
tative, or mixed method? What are the population, sample frame, sample size, sample
method, incidence rate, and response rate? What will the measurement instrument look
like? What methods will be used to analyze the data? Which, if any, subcontractors will
be used for what services?
Proposals should be professional looking, well written, and comprehensive .
The marketing research proposal is the contract that documents what the marketing researcher pledges to deliver as a result of the marketing research process.
Invitations to bid (ITBs) or requests for proposals (RFPs) are often used in the marketing research process. These are routinely used in all business sectors when a fi rm desires supplier fi rms to present proposals or bids.
© S
teph
en C
obur
n/S
hutt
erst
ock
M03_BURN3261_08_GE_C03.indd 85M03_BURN3261_08_GE_C03.indd 85 27/08/16 4:39 pm27/08/16 4:39 pm

86 CHAPTER 3 • THE MARKETING RESEARCH PROCESS AND DEFINING THE PROBLEM AND RESEARCH OBJECTIVES
4. Statement of deliverables. How and when will the research results be communicated?
A written report? An oral presentation? Will there be meetings with clients to discuss
implementation issues?
5. Cost. What are the expenses for the project? Which expenses are paid in advance and on
what dates? Which subcontractors are to be paid directly by the client?
6. Timetable. On what dates will the diff erent stages of the research project be completed?
ETHICAL ISSUES AND THE RESEARCH PROPOSAL The marketing research proposal process is an area where clients and researchers should
be sensitive to ethical issues. Clients should not expect marketing research fi rms to provide
value-added services prior to signing a contract. They should not provide one research com-
pany’s proposal to other research fi rms for the purpose of competitive bidding. The research
proposal, which may include many hours of work and contain details of proposed methods
and cost structures, should be viewed as proprietary information. 19
Some specifi c codes from the standards of the Marketing Research Association deal with
issues related to the proposal:
Section A: All Marketing Research Association Members agree that they:
18. Work must be performed as specifi ed in the agreement with the client.
19. … maintain trusted relationships with clients and research sponsors by keeping con-
fi dential all sensitive or proprietary research techniques, methodologies and business
information. Maintain the confi dential identity of clients and research sponsors.
(MRA CODE OF MARKETING RESEARCH STANDARDS http://www.mra-net.
org/resources/documents/expanded_code.pdf, page 7)
Summary
Although there is great variability in marketing research
projects, there are enough commonalities among these
projects to enable us to characterize them in terms of
steps of the research process. The value in characterizing
research projects in terms of successive steps is that (1) the
steps give researchers and other parties an overview of the
entire research process, and (2) they provide a procedure in
the sense that a researcher, by referring to the steps, knows
what tasks to consider and in what order. The steps are
(1) establish the need for marketing research, (2) defi ne the
problem, (3) establish research objectives, (4) determine
research design, (5) identify information types and sources,
(6) determine methods of accessing data, (7) design data
collection forms, (8) determine sample plan and size,
(9) collect data, (10) analyze data, and (11) prepare and
present the fi nal research report.
The fi rst step is determining the need to conduct mar-
keting research. Can the needed information be obtained
from the internal reports system? From the marketing intel-
ligence system? From the decision support system? If these
ongoing sources of information do not supply the needed
data, marketing research may be needed. Sometimes the
need to respond quickly to competition means there isn’t
time to conduct marketing research. Though placing a
dollar fi gure on value is diffi cult, value can be estimated,
and a more informed decision may be made justifying or
not justifying marketing research.
Problems are situations calling for managers to make
choices among alternatives. Research objectives state spe-
cifi cally what information the researcher must produce so
that the manager can choose the correct alternative to solve
the problem. Figure 3. 3 depicts a process that may be used
for defi ning the problem. There are two sources of prob-
lems. “Failure to meet an objective” arises when there is
a gap between what was supposed to happen and what did
happen. “Opportunity” refers to problems that arise when
there is a gap between what did happen and what could have
happened. Managers recognize problems either through
monitoring control systems (in the case of failure to meet
an objective) or through opportunity identifi cation systems.
Symptoms are changes in the level of some key
monitor that measures the achievement of an objective.
Symptoms alert managers to both types of problems. The
researcher is responsible for ensuring that management
has properly defi ned the problem even in cases when
management has already defi ned the problem through
invitations to bid or requests for proposals. In many cases,
a situation analysis is required to help defi ne the problem.
M03_BURN3261_08_GE_C03.indd 86M03_BURN3261_08_GE_C03.indd 86 27/08/16 4:39 pm27/08/16 4:39 pm

REVIEW QUESTIONS/APPLICATIONS 87
When defi ning the problem, researchers must validate
the symptoms that alerted management to the problem to
ensure the symptoms are correctly reporting what they por-
tend to report. Researchers should work with managers to
determine all possible causes for the symptoms.
Researchers should work with managers to reduce
all possible causes down to probable causes. The selec-
tion of a probable cause creates the decision. The decision
itself must specify alternatives that may be used to elimi-
nate the symptom. Researchers must work with managers
to clearly state the decision alternatives and to determine
the consequences of each alternative. Researchers should
assess the assumptions managers have made in determin-
ing the consequences of each alternative. If the manager is
certain about the assumptions made, a decision alternative
may be selected without any further research. However, in
most cases, managers are uncertain about their assump-
tions. Lack of suffi cient information creates an informa-
tion gap, which serves as the basis for establishing research
objectives. Sometimes hypotheses are stated to help to
guide the development of the research objective.
A research objective is a goal-oriented statement or
question that specifi es what information is needed to solve
a problem. Research objectives should be clear, specifi c,
and actionable.
Action standards refer to the predesignation of some
quantity of a measured attribute or characteristic that must
be achieved for a research objective for a predetermined
action to take place. Problem definition is sometimes
impeded because managers fail to change their normal
behavior of dealing with outside suppliers in an effi cient
manner during problem-solving situations.
Marketing research proposals are formal documents
prepared by the researcher serving the functions of stat-
ing the problem, specifying research objectives, detailing
the research method, stating the deliverables and costs, and
specifying a timetable. There are ethical issues involved in
submitting and evaluating a research proposal.
Key Terms
11 steps in the marketing research
process (p. 68 )
Field services fi rms (p. 73 )
Problems (p. 74 )
Marketing opportunity (p. 75 )
Symptoms (p. 76 )
Situation analysis (p. 76 )
Decision alternatives (p. 78 )
Consequences (p. 78 )
Assumptions (p. 79 )
Information state (p. 79 )
Information gaps (p. 79 )
Problem statement (p. 80 )
Research objective (p. 80 )
Hypotheses (p. 81 )
Construct (p. 81 )
Variables (p. 82 )
Operational defi nition (p. 82 )
Action standard (p. 83 )
Marketing research proposal (p. 85 )
Invitation to bid (ITB) (p. 85 )
Request for proposal (RFP) (p. 85 )
Review Questions/Applications
3- 1. What are the steps in the marketing research
process?
3- 2. Are all 11 steps in the marketing research process
used at all times? Why or why not?
3- 3. Use an example to illustrate that the steps in the
marketing research process are not always taken in
sequence.
3- 4. Explain why fi rms may not have a need for market-
ing research.
3- 5. Why is defi ning the problem the most important step
in the marketing research process?
3- 6. Discuss why defi ning the problem is really stating
the decision alternatives.
3- 7. Explain why research objectives diff er from the defi -
nition of the problem.
3- 8. What is meant by the problem ?
3- 9. What is the research objective?
3- 10. What are the two sources of marketing problems?
3- 11. Explain how managers should recognize they have a
problem.
3- 12. What is the role of symptoms in problem recognition?
3- 13. What is the role of the researcher when management
has already defi ned the problem?
3- 14. What is a situation analysis, and when would it likely
be used in defi ning the problem?
3- 15. What is the role of the researcher when management
has not already defi ned the problem?
3- 16. In what respect do researchers act much like
detectives?
3- 17. What is the diff erence between “all possible causes”
and “probable causes”?
3- 18. What is meant by consequences of the decision
alternatives?
M03_BURN3261_08_GE_C03.indd 87M03_BURN3261_08_GE_C03.indd 87 27/08/16 4:39 pm27/08/16 4:39 pm

88 CHAPTER 3 • THE MARKETING RESEARCH PROCESS AND DEFINING THE PROBLEM AND RESEARCH OBJECTIVES
3- 19. Explain why it is importance for managers to make
assumptions in the process of defi ning a research
problem.
3- 20. Explain the information state when there are infor-
mation gaps.
3- 21. What is needed to close information gaps?
3- 22. What is the role of a hypothesis in defi ning the problem?
3- 23. What are some relevant factors in determining
research objectives?
3- 24. What role do constructs play in the problem defi ni-
tion/research objectives process?
3- 25. What is an operational defi nition, and where would it
likely be used?
3- 26. What is an action standard?
3- 27. Discuss how a researcher and a manager can foster a
good working relationship in the process of defi ning
the research problem and objectives.
3- 28. What are the elements of the marketing research
proposal?
3- 29. Search the Internet for marketing research firms.
Choose one of them. What is the range of services
off ered by it? What information does it require from
potential clients in order to determine costs and times-
cales of research projects?
3- 30. Formulate a problem statement and research objec-
tives for the following situations:
a. A Chinese manufacturer wants to investigate
whether or not Chinese nationals would be eff ec-
tive sales representatives in the European market.
b. A Japanese sushi chain wants to see if menu prices
should be broadly equivalent to home prices for
their new South Korean outlets.
c. A software manufacturer wants to gauge customer
reaction to automated updates initiated without
customer authorization.
d. An Indian tea cultivator wants to fi nd out how to sell
his premium tea blends directly to the UK market.
3- 31. Use the Internet to look for templates and other aids
that would help in creating a marketing research pro-
posal. Analyze and assess fi ve of them. In your view,
are these standardized formats suitable for most
instances? Do they contain all the elements required
to create a successful research proposal? Explain
how you would individualize the templates.
3- 32. Observe a business in your community. Examine what
it does, what products or services it provides, how it
prices and promotes its products or services, and other
aspects of the business. If you managed the business,
would you have conducted research to determine the
fi rm’s products, design, features, prices, promotion,
and so on? If you decide you would not have con-
ducted marketing research in a given area, explain why.
CASE 3. 1
Golf Technologies, Inc.
Golf Technologies, Inc. (GTI) relies on high-level scientifi c
testing to design golf clubs that provide larger “sweet spots,”
resulting in fewer missed hits and maximum yardage. In the
last year, GTI discovered a technical breakthrough in club
design. Its newest clubs, for the same level of energy, hit the
golf ball longer than any existing clubs on the market. CEO
Harvey Pennick is very excited about this breakthrough and
believes these clubs will create a new level of excitement and
enthusiasm among players. Pennick is well aware that many
club manufacturers tout “new scientifi c breakthroughs” with
each year’s new model clubs. He also knows that consum-
ers have become fairly immune to these claims. He believes
he must do something diff erent to convince potential buyers
that the newest GTI clubs actually do have a larger sweet
spot and really do hit the ball farther. Armed with objective
tests that prove these claims, Pennick and his marketing staff
believe they need a highly credible golfer to be used in their
promotional materials (TV ads, magazine ads, infomercials,
and special event promotions). The credibility of the mes-
sage in GTI’s promotions will be critical if golfers are to
really believe their claim of a breakthrough in club design.
Pennick’s staff presents the two golfers whom they
believe are the best known: Rory McIlroy and Bubba
Watson. Both golfers are considered among the best in
the world and have very high name recognition. However,
both these golfers have exclusive contracts with other club
manufacturers. Both contracts have buyout clauses so, if
GTI is to hire either one of them, it will be expensive to
buy out the existing contract and to off er enough money
to attract one of these world-class golfers to be GTI’s new
spokesperson.
1. Assuming Pennick agrees with his staff on the choice
of McIlroy or Watson, what now is Pennick’s decision
in terms of decision alternatives?
2. Assuming Pennick is not confi dent in his assumptions
about the consequences of the outcomes associated
with your decision alternative, what should Pennick
consider doing?
3. If Pennick decides to conduct marketing research, write
the research objective.
M03_BURN3261_08_GE_C03.indd 88M03_BURN3261_08_GE_C03.indd 88 27/08/16 4:39 pm27/08/16 4:39 pm

REVIEW QUESTIONS/APPLICATIONS 89
CASE 3. 2 INTEGRATED CASE
Auto Concepts
Recall back in Case 1.2 that Nick Thomas, CEO of Auto
Concepts, a new division of a large automobile manu-
facturer, has been slowly losing market share to other
competitors. Auto Concepts was created to reclaim the
manufacturer’s highly competitive level in the auto indus-
try by developing new models that are more competitive in
today’s new car market.
Auto Concepts now has fi ve diff erent models that are
feasible in terms of engineering and production. Nick has
assigned tentative model names to them.
1. “Super Cycle,” one-seat all electric, mpg-e rating 125;
estimated MSRP (manufacturer’s suggested retail
price) $30,000; range 200 miles.
2. “Runabout Sport,” two-seat all electric, mpg-e 99; esti-
mated MSRP $35,000; range 150 miles.
3. “Runabout Hatchback,” two-seat gasoline hybrid,
mpg-e 50; runs on battery for 50 miles and then
switches to gas engine; estimated MSRP $35,000;
range 250 miles.
4. “Economy Hybrid,” four-seat diesel hybrid, mpg-e 75;
runs on battery for 75 miles and then switches to effi -
cient diesel engine; estimated MSRP $38,000; range
300 miles.
5. “Economy Standard,” fi ve-seat economy standard gaso-
line, mpg 36; runs on gasoline with computer control
for maximum effi ciency; estimated MSRP $37,000;
range 350 miles.
Note: mpg-e is a measure of the average distance trav-
eled per unit of energy used. It is the U.S. Environmental
Protection Agency’s measure of effi ciency when alternative
fuels (e.g., electricity) are used. It allows for a comparison
of new energy propulsion with the fuel effi ciency.
Nick knows no single model will have universal appeal
to a huge market. Rather, diff erent models will appeal to
market segments, and Auto Concepts will be sharing those
segments with other able competitors that are working just
as hard to develop car models that satisfy consumer needs
in those segments. In other words, Auto Concepts wants
to reach target markets for the models it produces without
wasting promotional dollars on those who aren’t interested
in the model. For example, if the company decides to pro-
duce a particular model, a decision must be made in terms
of choosing among media types (TV, radio, magazine,
newspaper, social media) in which to promote the product.
Nick would like to know each market segment’s media hab-
its. Which TV show types do most people in each market
prefer? Radio genres? Magazine types? Sections of local
newspapers? Also, the marketing department has moved to
spending large sums of the budget on online promotions.
Nick wants to know which market segments he can reach
through blogs, content communities such as YouTube,
social network sites such as Facebook, and online games
and virtual worlds.
Knowing that consumers like a particular medium is
not enough. For example, Nick may learn that the target
market for a particular model prefers one magazine type
over another, but there are many choices of magazines
within that type. Knowledge of the demographic profi les
of the target market segments can be helpful in selecting
one newspaper, one magazine, or one social medium for
a selected market. Because all media provide information
to potential advertisers on the demographics they reach,
Auto Concepts should have a demographic profi le of each
market segment it attempts to target. To make the most
of that information, the carmaker needs information on
the demographics of those who most desire each model:
gender, age, size of hometown or city, marital status,
number of people in family, education, income, and
dwelling type.
In terms of positioning the cars, Nick knows fuel
economy will be the key motivator. In addition, he wants
to know if appealing to consumers’ concerns for global
warming will have an impact on sales. Auto Concepts is
making a major eff ort to reduce carbon emissions by mov-
ing to more effi cient propulsion systems; should that eff ort
be a prominent part of its positioning statement in promo-
tions and, if so, for which models? Nick gets a lot of mixed
information in the general information environment about
global warming. He wants to know what consumers think
about two issues: (1) Are consumers worried about global
warming? (2) Do they believe gasoline emissions contrib-
ute to global warming?
Finally, there is the Internet of Things factor: What in-
novations do consumers expect and desire on their autos
of the future? Do they wish for self- and/or assisted driv-
ing, types of infotainment, dashboard diagnostic features,
or other smartphone driving aids?
Assume that Nick Thomas decides to conduct market-
ing research and that the marketing researcher agrees with
the problems stated in this case.
1. State the problems.
2. Write the research objective for one of the problems
defi ned in your answer to the fi rst question.
M03_BURN3261_08_GE_C03.indd 89M03_BURN3261_08_GE_C03.indd 89 27/08/16 4:39 pm27/08/16 4:39 pm

▶
LEARNING OBJECTIVES In this chapter you will learn:
4- 1 What research design is and why it is important
4- 2 The three major types of research design: exploratory, descriptive, and causal
4- 3 How exploratory research design helps the researcher gain understanding of a problem
4- 4 The fundamental questions addressed by descriptive research and the different types of descriptive research
4- 5 What is meant by causal research and to describe types of experimental research designs
4- 6 The different types of test marketing and how to select test-market cities
“WHERE WE ARE”
1 Establish the need for marketing
research.
2 Defi ne the problem.
3 Establish research objectives.
4 Determine research design.
5 Identify information types and sources.
6 Determine methods of accessing data.
7 Design data collection forms.
8 Determine the sample plan and size.
9 Collect data.
10 Analyze data.
11 Prepare and present the fi nal research
report.
Designing Research to Develop Great Ideas
Founded in Munich, Ger-
many (1989), Happy Think-
ing People is one of the
world’s leading indepen-
dent qualitative marketing
research and consulting
companies. With offices in
Berlin, Munich, Paris, Zürich,
and Mumbai employing
over 100 people, we have
over 25 years of in-depth
experience in understand-
ing people across the globe
and in helping our clients to
build relationships between
brands, products, services, and their customers that lead to business
success.
We have provided qualitative research training for ESOMAR and
BVM (the German Market Research Association) for over 15 years. In
2013 we were voted “Best in Class in Analysis” by the German Associa-
tion of Market Researchers.
Happy Thinking People works for a wide range of clients and cat-
egories, focusing on four main areas: exploring markets, creating con-
cepts, evaluating ideas, and brand consulting.
Exploring markets is about understanding people in the contexts,
places, and situations in which they make their decisions. We have a
range of innovative tools working across the blurring boundaries of
online and offl ine from Brazil to Shanghai, from mobile ethnographies
and online communities to behavioral semiotics.
4 Research Design
Sven Arn, Managing Director and
Partner, Happy Thinking People.
M04_BURN3261_08_GE_C04.indd 90M04_BURN3261_08_GE_C04.indd 90 27/08/16 5:37 pm27/08/16 5:37 pm

91
Our concept develop-
ment embraces the prin-
ciples of co-creation but
doesn’t leave everything to
the consumer. While being
fi rmly anchored in directional
insight, our experience and
know-how pinpoint where to
follow and where to disrupt
consumer expectations. We
have a strong portfolio of pro-
prietary techniques involving
storytelling and story chang-
ing, creative exercises, role
playing, war games, and sce-
nario building.
We approach idea evalu-
ation to refl ect the complexity
of human decision making—
without making results confus-
ing. Our recommendations
are always founded in understanding consumer reactions rather than just refl ecting what
people say.
Our brand consulting offer covers all the stages of the strategic process from insight
identifi cation through innovation, portfolio planning, and positioning to brand development.
In summary, “Happy Thinking” is the state that we believe leads to great ideas. We also
believe that it makes sound business sense to involve consumers and our clients in an engag-
ing discourse that encourages visionary thinking to develop ideas that make a real difference
in people’s lives.
—Sven Arn
Source: Text and photos courtesy of Sven Arn, Managing Director & Partner, Happy Thinking People.
Once the problem has been defined and the research objectives have been established,
the next step in the marketing research process is determining the research design. In
this chapter, you will be introduced to three basic types of research design: explor-
atory, descriptive, and causal. Each serves a different purpose and relies on different methods.
Each has its own set of advantages and disadvantages. Knowing the basic options for research
design can assist a researcher in making appropriate decisions in advance of conducting a
research project.
Visit Happy Thinking People at www.happythinkingpeople.com .
M04_BURN3261_08_GE_C04.indd 91M04_BURN3261_08_GE_C04.indd 91 27/08/16 5:37 pm27/08/16 5:37 pm

92 CHAPTER 4 • RESEARCH DESIGN
4- 1 Research Design Marketing research studies are carried
out in many diff erent ways. Some proj-
ects are food-tasting experiments held in
kitchen-like labs; others are focus groups,
ethnographic research, or large, nation-
ally representative sample surveys. Some
research objectives require only research,
whereas others may require thousands
of personal interviews. Researchers may
observe consumers in convenience stores
or conduct two-hour, in-depth, personal
interviews in respondents’ homes.
Each type of study has certain advan-
tages and disadvantages, and one method
may be more appropriate for a given
research problem than another. How
do marketing researchers decide which
method is the most appropriate? After
becoming familiar with the problem and
research objectives, researchers select a research design , which is a master plan that specifi es
the methods that will be used to collect and analyze the information needed for a research
project.
WHY IS KNOWLEDGE OF RESEARCH DESIGN IMPORTANT? Knowledge of research design is important in developing an appropriate study to approach
a problem or opportunity. David Singleton of Zyman Marketing Group, Inc., believes that
good research design is the fi rst rule of good research. 1 Why would a practitioner make such
a statement? There are reasons to justify the signifi cance placed on research design. First, we
need to understand that even though every problem and research objective may seem unique,
there are usually enough similarities among problems and objectives to allow us to make
some decisions in advance about the best research design to use to resolve the problem. This
means we can group or classify seemingly diverse types of research projects well enough to
predetermine the most appropriate research design.
Early on in the research process, as the problem and research objectives are forming,
researchers can begin to plan which research design will be most appropriate. What allows
researchers to do this is the fact that basic research designs available to them can be success-
fully matched to a range of problems and research objectives. Once the researcher knows the
basic research design, a series of advance decisions may be made to form a framework for
the development of the research project. The research design for the project calls for detailing
what steps will be necessary for the completion of a successful project.
For example, if a researcher knows that an exploratory research design is called for, he or
she can start thinking of the diff erent ways to carry out exploratory research given the unique
characteristics of the particular project. A series of focus groups may be needed. Who will
participate in the focus groups? How many focus groups will be conducted? What questions
will be asked of focus group participants? What should be the outcomes of the focus groups?
The research design will lay out these details. Or perhaps the researcher determines that a
causal research design is needed. This sets the researcher off in a completely diff erent direc-
tion of thinking about appropriate experimental designs. In this way, identifying the most
appropriate basic research design and the characteristics of the design serves the researcher in
the same way that a blueprint might serve a builder.
A research design is a master plan that specifi es the methods that will be used to
collect and analyze the information needed for a research project.
© N
otar
YES
/Shu
tter
stoc
k
M04_BURN3261_08_GE_C04.indd 92M04_BURN3261_08_GE_C04.indd 92 27/08/16 5:37 pm27/08/16 5:37 pm

4-2 THREE TYPES OF RESEARCH DESIGNS 93
Knowledge of the needed research design allows advance planning so that the project
may be conducted in less time and typically at a cost savings due to effi ciencies gained in
preplanning. Think about taking a long trip. If you have the ability to preplan, you can save
yourself time and money. It works the same way in a research project. At this stage, research-
ers may also face ethical issues related to the research design. Some common ethical consid-
erations are presented in Marketing Research Insight 4. 1 .
4- 2 Three Types of Research Designs Research designs are classifi ed into three traditional categories: exploratory, descriptive, and
causal. The choice of the most appropriate design depends largely on the objectives of the
research. Three common objectives are (1) to gain background information and to develop
hypotheses, (2) to measure the state of a variable of interest (for example, level of brand loy-
alty), or (3) to test hypotheses that specify the relationships between two or more variables
(for example, level of advertising and brand loyalty).
Planning the Research Design: Areas of Ethical Sensitivity In most cases professionals know more about their fi elds than the clients who hire them. In fact, this knowledge is the reason we hire professionals. However, that imbalance of knowledge can cause serious ethical issues. In the market-ing research industry, these issues may arise in the potential for researchers to take advantage of clients in the research design process.
Recommending a Costlier Design Than Needed Some research designs are simple, effi cient, and much less costly than others. Exploratory research, for example, has these characteristics. A researcher could recommend a much more involved research design that takes more time and increases the cost to the client. Why would a researcher do this? If a researcher’s fee is based on a percentage of costs of the proj-ect, then there is a built-in incentive to boost those costs. Or, if the researcher has an interest in a subcontracting research fi rm, there is an incentive to use the services of that fi rm whether needed or not. An egregious example of this ethical lapse is a researcher presenting secondary data as primary data collected by the researcher. The Marketing Research Association’s (MRA’s) Code of Marketing Research Standards, Section II 21, states that researchers “will, when conducting secondary research, inform clients of the source of secondary research and not misrepresent it as primary data.”
Designing a Study in Which Data Are Collected for Multiple Clients A researcher could save data collection costs by collecting data for multiple clients at the same time. The MRA’s Code of Marketing Research Standards, Section II 22, states that researcher must “be granted prior approval, if all
or part of the work on a project is to be combined or syndicated with work for other clients, or if the same is to be subcontracted to another entity outside the researcher’s organization.”
Using Information Obtained for a Client in Another Research Project A researcher could design a research project so that a component of the project that refl ects work already conducted and paid for by a previous client is pre-sented as original work for the present client. The MRA’s Code of Marketing Research Standards, Section II 24, provides that researchers “will ensure that research conducted is the prop-erty of the commissioning party or client(s). At no time may such research be shared with other entities without the express written permission of the original client(s).”
Over- or Underestimating Data Collection Costs As you will learn, data collection costs are strongly infl uenced by the incidence rate (the percentage of the population pos-sessing the characteristics required to participate in a study). Incidence rates are high if the research design calls for inter-viewing “any adult over age 18.” Incidence rates are low if the study requires “males, over 65, who take statin drugs but still have high cholesterol counts.” The lower the incidence rate, the more persons are required to be contacted to fi nd someone who qualifi es for the study. As a result, low incidence rate stud-ies can be very costly. The MRA’s Code of Marketing Research Standards, Section II 34, states that researchers “will calculate research metrics such as incidence, performance measurements such as response rates, error measurements such as sample margin of error, and other formulas according to commonly accepted industry practices.”
MARKETING RESEARCH INSIGHT 4. 1 Ethical Consideration
M04_BURN3261_08_GE_C04.indd 93M04_BURN3261_08_GE_C04.indd 93 27/08/16 5:37 pm27/08/16 5:37 pm

94 CHAPTER 4 • RESEARCH DESIGN
The choice of research design also depends on how much we already know about the
problem and research objective. The less we know, the more likely it is that we should use
exploratory research. Causal research, on the other hand, should only be used when we know
a fair amount about the problem and we are looking for causal relationships among variables
associated with the problem or research objectives. By reading this chapter you will better
understand how diff erent research objectives are best handled by the various research designs. 2
RESEARCH DESIGN: A CAUTION Before discussing the three types of research design, a warning may be in order against think-
ing of research design solely in a step-by-step fashion. The order in which the designs are
presented in this chapter—that is, exploratory, descriptive, and causal—is not necessarily
the order in which these designs should be carried out. In some cases, it may be perfectly
legitimate to begin with any one of the three designs and to use only that one design. In many
cases, however, research is an iterative process: By conducting one research project, we learn
that we may need additional research, which may result in using multiple research designs.
We could very well fi nd, for example, that after conducting descriptive research, we need to
go back and conduct exploratory research.
4- 3 Exploratory Research Exploratory research is unstructured, informal research that is undertaken to gain back-
ground information about the general nature of the research problem. By unstructured, we
mean that exploratory research does not have a predetermined set of procedures. Rather,
Exploratory research is unstructured, informal research that is undertaken to gain background information about the general nature of the research problem.
Wrongfully Gaining Respondent Cooperation to Reduce Costs A researcher could design a project in which respondent cooperation could be greatly increased by making promises to potential respondents without any intention of ful-fi lling those promises. The MRA’s Code of Marketing Research Standards, Section I 8, requires that researchers will “make fac-tually correct statements to secure cooperation, including for database/sample development, and honor all promises made to respondents including but not limited to the use of data.”
Misrepresenting Sampling Methods Research design will include determining the appropriate sampling plan and sample size. Researchers should not use a sample plan that does not allow achievement of the research objectives of the study. Researchers should inform clients as to how the sample plan will result in a representative sample. Likewise, research-ers should inform the client of the effect of sample size on the study’s accuracy. Some sample plans are more costly than others, and more sample size means greater costs to clients. The MRA’s Code of Marketing Research Standards, Section II 30, requires that researchers “offer guidance to clients as to the appropriateness of the methodology being employed and sample selected to the fullest extent possible on each project.”
Adherence to ethical standards applies to many aspects of designing a research project, which is why the MRA and other professional associations develop and maintain codes of ethics and standards of conduct. Professionals who understand and comply with these standards serve their clients’ interests fairly
and responsibly. Fortunately, 99% of marketing researchers are extremely ethical and follow their association’s guidelines. The free market has a wonderful way of ensuring that those who aren’t ethical do not stay around for long!
We strongly recommend that you visit the websites of the professional organizations identifi ed in Chapter 2 and read their codes of conduct. The MRA posts its standards at http://www.marketingresearch.org (click the link to Standards).
Designing a research project may involve many ethically
sensitive areas. Researchers learn how to treat clients
ethically by being familiar with their association’s codes and
standards.
© M
ehm
et D
ilsiz
/Shu
tter
stoc
k
M04_BURN3261_08_GE_C04.indd 94M04_BURN3261_08_GE_C04.indd 94 27/08/16 5:37 pm27/08/16 5:37 pm

4-3 EXPLORATORY RESEARCH 95
the nature of the research changes as the researcher gains information. It is informal in
that there is no formal set of objectives, sample plan, or questionnaire. Often small, non-
representative samples are used in exploratory research. Other, more formal, research
designs are used to test hypotheses or measure the reaction of one variable to a change in
another variable. Yet exploratory research can be accomplished by simply reading a maga-
zine or even by observing a situation. Ray Kroc, the milkshake machine salesman who
created McDonald’s, observed that restaurants in San Bernardino, California, run by the
McDonald brothers were so busy they burned up more milkshake machines than any of
his other customers. Kroc took that exploratory observation and turned it into the world-
famous fast-food chain. In another example, two eighth graders, Julianne Goldmark and
Emily Matson, admired the hair accessories worn by characters on the television show
Gossip Girl but were unable to fi nd similar products in stores that were aff ordable. The
duo began creating and selling their own hair accessories. They now have a business called
Emi-Jay that makes about $10 million a year. 3 Exploratory research is fl exible in that it allows the researcher to investigate whatever
sources he or she identifi es and to the extent he or she feels is necessary to gain an understand-
ing of the problem at hand. For example, a Wendy’s franchisee went through his restaurant’s
cash register receipts, which were stamped with dates and times. He observed that weekday
afternoons between 2:00 and 4:30 p.m. were his slack periods. He then initiated a mobile
campaign for a free order of French fries during this time on weekdays. Traffi c and sales went
up. A University of West Virginia grad, Tom Petrini, attended a conference on sustainability.
He noticed almost none of the attendees were drinking water from the reusable containers
provided. When he asked them why, they told him there was no place to clean and refi ll the
bottles. The company he started, Evive Station, provides free stainless steel containers and
follow-up sterilization and refi lling. 4
Exploratory research is usually conducted when the researcher does not know much
about the problem and needs additional information or desires new or more recent informa-
tion. Often exploratory research is conducted at the outset of research projects. Chapter 3
discussed the use of a situation analysis to help clarify the problem. A situation analysis is a
form of exploratory research.
USES OF EXPLORATORY RESEARCH Exploratory research is used in a number of situations: to gain background information, to
defi ne terms, to clarify problems and hypotheses, and to establish research priorities.
Gain Background Information When very little is known about the problem or when
the problem has not been clearly formulated, exploratory research may be used to gain the
needed background information. Even the most experienced researchers often undertake some
exploratory research to gain current, relevant background information. Exploratory research
can off er breakthrough ideas and fresh insights that lead to strategic knowledge.
Defi ne Terms Exploratory research helps to defi ne terms and concepts. By conducting
exploratory research to defi ne a question such as “What is satisfaction with service quality?”
the researcher quickly learns that “satisfaction with service quality” is composed of several
dimensions—tangibles, reliability, responsiveness, assurance, and empathy. Not only would
exploratory research identify the dimensions of satisfaction with service quality, but it could
also demonstrate how these components may be measured. 5
Clarify Problems and Hypotheses Exploratory research allows the researcher to defi ne
the problem more precisely and to generate hypotheses for the upcoming study. For example,
exploratory research on measuring bank image reveals the issue of diff erent groups of bank
customers. Banks have three types of customers: retail customers, commercial customers, and
other banks for which services are performed for fees. This information is useful in clarifying
To see exploratory research in action, go to www.
youtube.com and enter “brand exploratory research Giants game.” An example of “man-on-the-street” interviews is shown.
Exploratory research is used to gain background information, to defi ne terms, to clarify problems and hypotheses, and to establish research priorities.
M04_BURN3261_08_GE_C04.indd 95M04_BURN3261_08_GE_C04.indd 95 27/08/16 5:37 pm27/08/16 5:37 pm

96 CHAPTER 4 • RESEARCH DESIGN
the problem of the measurement of bank image because it raises the issue of identifying for
which customer group bank image should be measured.
Exploratory research can also be benefi cial in the formulation of hypotheses, which are
statements describing the speculated relationships among two or more variables. Formally
stating hypotheses prior to conducting a research study helps to ensure that the proper vari-
ables are measured. Once a study has been completed, it may be too late to state which
hypotheses are desirable to test.
Establish Research Priorities Exploratory research can help a fi rm prioritize research
topics. For example, examining user-generated feedback on review websites, such as Engad-
get or Yelp, may tell management where to devote attention. Business-to-business organiza-
tions often fi nd interviews with salespeople helpful sources of future product and service
concepts to pursue.
METHODS OF CONDUCTING EXPLORATORY RESEARCH A variety of methods is available to conduct exploratory research. We will cover some of
these in the section of this chapter that deals with qualitative research since the methods over-
lap. In this section we briefl y discuss some commonly used methods for conducting explor-
atory research: secondary data analysis, experience surveys, and case analysis. Other methods
common to both exploratory research and qualitative research are discussed in Chapter 6 .
Secondary Data Analysis The process of searching for and interpreting existing informa-
tion relevant to the research topic is called secondary data analysis . Analyzing secondary data
is almost always an important part of a marketing research project. Secondary information
is widespread and readily available. Thanks to the Internet and today’s sophisticated search
engines such as Google, you can conduct a search for secondary information on virtually
any topic quickly and effi ciently. The Internet and your library off er access to large amounts
of secondary data, which include information found on websites and in books, journals,
magazines, special reports, bulletins, and newsletters. An analysis of secondary data is often
the core of exploratory research. 6 A search of secondary data or information may come in
many forms. Many executives subscribe to journals or trade publications for their particular
industry. By reviewing these publications, they are constantly doing a form of exploratory
research—looking for trends, innovations, information about current or potential customers
and competitors, the general economy, and so on. As Marketing Research Insight 4. 2 outlines,
social media websites can be an excellent source of data for exploratory research. We devote
part of Chapter 5 to analyzing secondary data and some of its sources. Experience Surveys Experience surveys refer to gathering information from those
thought to be knowledgeable on the issues relevant to the research problem. This technique is
also known as the key-informant technique . In the technology fi eld, a lead-user survey is
used to acquire information from lead users of a new technology. 7 A manufacturer of a new
building material that provides greater insulation at less cost may call a dozen contractors,
describe the new material, and ask them how likely they would be to consider using it on
their next building. In other examples, nurses might be interviewed about the needs of hos-
pital patients, and elementary teachers might be surveyed to gather information about types
of products that might be developed to help children learn. Experience surveys diff er from
surveys conducted as part of descriptive research in that there is usually no formal attempt to
ensure that the survey results are representative of any defi ned group of subjects. Neverthe-
less, useful information can be gathered by this method of exploratory research.
Case Analysis A review of available information about one or more former situations to
gain understanding of a current research problem with similar characteristics is called a case analysis . Research situations typically have at least some similarities to a past situation. 8
For some examples of secondary data often used in marketing research, see www.secondarydata.com , a website developed by Decision Analyst, Inc.
Experience surveys refer to gathering information from those thought to be knowledgeable on the issues relevant to the research problem. Experience surveys may also be called key-informant or lead-user surveys .
A case analysis is a review of available information about one or more former situations to gain understanding of a current research problem with similar characteristics.
M04_BURN3261_08_GE_C04.indd 96M04_BURN3261_08_GE_C04.indd 96 27/08/16 5:37 pm27/08/16 5:37 pm

4-3 EXPLORATORY RESEARCH 97
Exploring Social Media Data Social media websites are a powerful source of data for exploratory research. By providing access to the unfettered opinions of consumers, social media platforms offer an instant way to gain background information for a problem, to defi ne terms, to clarify problems and hypotheses, and to establish research priorities. Many companies are aware of the value of using social media websites to gain marketing insights, but there is so much information out there. How can analysts use social media data to acquire strong and actionable insights from consumers? Following are the steps for analyzing social media data.
Step 1: Develop a Problem Defi nition and Research Objectives As stated in Chapter 3 , developing focused research objectives is a vital step in the research process. This guideline holds par-ticularly true for social media analysis, where a clear direction is needed to make sense of the copious amount of data. Limiting the focus to a defi ned topic and specifi c objectives will make the analysis more manageable. Still, to take full advantage of social media data analysis, the research objectives should also allow for an element of discovery. The data may lead to unexpected places.
Step 2: Identify Key Search Terms The identifi cation of the proper key search terms is a crucial step to the successful analysis of social media data. The pro-cess is often an iterative process, with broader searches being followed by searches using combinations of terms or newly discovered synonyms or tangential phrases. Obvious terms to start a search include the product’s brand name, competitors’ brand names, and the product class. More exploratory analy-ses might investigate activities, events, and emotions related to a brand.
Step 3: Identify Social Media Data Sources Identifi cation of the most useful data sources is another important step to social media data analysis. Online tools, such as TweetDeck and Scout Labs, can aid in this process. Still, these tools can miss some important types of social media platforms. Finding the most current and germane websites is a moving target, since social media–oriented data sources ebb and flow in popularity. Although this makes the task of identifying the best websites from which to gather data more diffi cult, it also means that new forms of exciting and relevant user-generated feedback are emerg-ing on an ongoing basis and can be uncovered with a bit of persistence.
Knowing the best data sources to use is a very important step
in social media data analysis.
Step 4: Organize Data Some of the most important user-generated data will not nec-essarily be in the form of text. Photos, videos, artwork, litera-ture, and other forms of data might provide new insights into product feedback. As a result, organization of the data should be fl exible and allow for diverse forms of media. A number of commercial services (for example, HootSuite and Radian6) and software (for example, NVivo) are available to assist in this process, as well as free online tools (such as SocialMention and Google Alerts). Or researchers can take more of a do-it-yourself approach to organizing data to ensure versatility and comprehensiveness.
Step 5: Analyze Data Once the social media data have been gathered and orga-nized, the data should be analyzed. First, the researchers should review the data thoroughly. As with all research, insightful analysis depends on a comprehensive knowledge and under-standing of the data. Second, the analysts should begin identi-fying key themes that emerge from the fi ndings—for example, key beliefs, ideas, concepts, defi nitions, or behaviors. The data should then be compared and categorized.
Step 6: Present Findings Following analysis of the data, the fi ndings will be presented in an oral and written presentation, using concrete examples and illustrations. Here is where social media data really stand out. Quotes can be presented from Twitter, reviews, and blogs. Pho-tos found online can illustrate exactly where, when, and how
MARKETING RESEARCH INSIGHT 4. 2 Digital Marketing Research
© C
hanp
ipat
/Shu
tter
stoc
k
M04_BURN3261_08_GE_C04.indd 97M04_BURN3261_08_GE_C04.indd 97 27/08/16 5:37 pm27/08/16 5:37 pm

98 CHAPTER 4 • RESEARCH DESIGN
Even when the research problem deals with a radically new product, some similar past experi-
ences may be observed. For example, when Apple introduced the iPad, this new device may
have seemed revolutionary. However, Apple could refer to its experience with introducing
the iPhone in 2007 when planning the strategy for introducing its new tablet. Then, as Apple
introduced successive versions of the iPad, the company could examine the cases of the intro-
ductions of previous versions of the iPad to learn from mistakes and successes at the product
introduction stage. Case analysis can be a particularly useful technique for developing strategies to prevent
and manage crises, since, by defi nition, crises occur on rare occasions. For example, an inci-
dent of adulterated milk in China in 2008 that led to the death of six infants and the illness
of hundreds of thousands of other babies has been studied to prevent other disasters from
occurring through supply chain management. 9 The 2009–2010 recall of Toyota automobiles
with acceleration pedals that were susceptible to sticking has been examined to develop best
practices for companies to communicate product failures to their customers. 10
Focus Groups Focus groups are small groups brought together and guided by a modera-
tor through an unstructured, spontaneous discussion for the purpose of gaining information
relevant to the research problem. (We cover focus groups extensively in Chapter 6 .) Focus
groups are one of the most widely used exploratory techniques to gain greater understanding
of a current problem or to develop preliminary knowledge to guide in the design of descrip-
tive or causal research. For example, in 2015 a series of focus groups was conducted by the
National Football League (NFL) in St. Louis, Oakland, and San Diego as part of a wider study
to determine how fans would react to losing the professional football team that is currently
based in their cities. 11
To conclude, exploratory research in some form should be used in almost every research
project. Why? First, exploratory research, particularly secondary data analysis, can be con-
ducted effi ciently through online and library resources. Second, compared to collecting pri-
mary data, exploratory research is inexpensive. Finally, exploratory research can often provide
information that meets the research objectives or can assist in gathering current information
necessary to conduct either a descriptive or causal design. Therefore, few researchers embark
on a research project without fi rst beginning with exploratory research.
4- 4 Descriptive Research Descriptive research is undertaken to describe answers to questions of who, what, where,
when, and how. When we wish to know who our customers are, what brands they buy and in
what quantities, where they buy the brands, when they shop, and how they found out about our
a consumer is using a product or service. Consumer-produced videos can demonstrate perceived advantages and disadvan-tages of products.
Step 7: Outline Limitations When using social media data, it is as important as with other research methods to outline the limitations of the research. Explicitly stating the problems and gaps encountered when gathering and analyzing the data will help to provide a more complete understanding of the fi ndings.
Step 8: Strategize As with all research, the fi nal and most important step of the analysis is to use the fi nding to develop research-based, action-able recommendations related to the research objectives. Then, based on the project’s results, the next stage of research should be planned.
Source : Veeck, A. (2013, October). Beyond monitoring: Analyzing the con-tent of social media data. Quirk’s Marketing Research Review, 74–77.
Descriptive research is undertaken to collect data to examine the characteristics of consumers and/or markets.
M04_BURN3261_08_GE_C04.indd 98M04_BURN3261_08_GE_C04.indd 98 27/08/16 5:37 pm27/08/16 5:37 pm

4-4 DESCRIPTIVE RESEARCH 99
products, we turn to descriptive research. Descriptive research is also desirable when we wish
to project a study’s fi ndings to a larger population. If a descriptive study’s sample is represen-
tative, the fi ndings may be used to predict some variable of interest such as sales.
CLASSIFICATION OF DESCRIPTIVE RESEARCH STUDIES Two basic types of descriptive research studies are available to the marketing researcher:
cross-sectional and longitudinal. Cross-sectional studies measure units from a sample of the
population of interest at only one point in time. A study measuring your attitude toward add-
ing a required internship course to your degree program, for example, would be a cross-sec-
tional study. Your attitude toward the topic is measured at one point in time . Cross-sectional
studies are prevalent in marketing research, outnumbering longitudinal studies and causal
studies. Because cross-sectional studies are one-time measurements, they can be described as
“snapshots” of the population. As an example, many magazines survey a sample of their subscribers and ask them ques-
tions such as their age, occupation, income, and educational level. These sample data, taken at
one point in time, are used to describe the readership of the magazine in terms of demograph-
ics. Cross-sectional studies normally are designed to represent the population of interest and
employ fairly large sample sizes, so many cross-sectional studies are referred to as sample surveys .
Sample surveys are cross-sectional studies whose samples are drawn in such a way as to
be representative of a specifi c population. Prior to important elections, many sample surveys
ask likely voters: “If the election were held today, which candidate would you vote for?” Such
survey results are often featured in the news because they attract a lot of attention. The survey
samples are drawn so that the news media may report that the results are representative of the
U.S. population and that the results are accurate within a certain margin of error (very fre-
quently + or −3%). To be able to report on the accuracy of sample surveys, researchers must
plan exactly how the population will be sampled and how many people will be surveyed. You
will learn about diff erent methods of conducting samples and how to calculate margin of error
in Chapters 9 and 10 . Longitudinal studies repeatedly measure the same sample units of a population over
a period of time. Because longitudinal studies involve multiple measurements, they can be
described as “movies” of the population. Longitudinal studies are employed by most of the
largest companies that use marketing research. To ensure the success of the longitudinal
study, researchers must have access to the same members of a sample, called a panel, so as to
take repeated measurements. Panels are samples of respondents who have agreed to provide
information or answer questions at regular intervals. Maintaining a representative panel of
respondents is a major undertaking. Several commercial marketing research fi rms develop and maintain consumer panels for
use in longitudinal studies. Typically, these fi rms attempt to select a sample that is representa-
tive of some population. Firms such as IRI and Nielsen have maintained panels consisting of
hundreds of thousands of households for many years. In many cases these companies recruit
panel members so that the demographic characteristics of the panel are proportionate to the
demographic characteristics found in the total population according to Census Bureau sta-
tistics. Sometimes these panels will be balanced demographically not only to represent the
United States but also to allow representation of various geographical regions. In this way,
a client who wishes to get information from a panel of households in the Northwest can be
assured that the panel is demographically matched to the total population in the states making
up the northwestern region. Many companies maintain panels to target market segments such
as “dog owners” or “kids.” Paradigm Sample off ers a panel of 18- to 34-year-old mobile users
through its IdeaShifters panel. B2B panels are also available allowing researchers to target
populations such as building contractors, supermarket owners, physicians, lawyers, university
professors, or government workers.
Cross-sectional studies measure units from a sample of the population at one point in time.
Sample surveys are cross-sectional studies whose samples are designed in such a way as to be representative of a specifi c population at a pre-determined margin of error.
Longitudinal studies repeatedly measure the same sample units of a population over a period of time.
Panels are samples of respondents who have agreed to provide information or answer questions at regular intervals.
M04_BURN3261_08_GE_C04.indd 99M04_BURN3261_08_GE_C04.indd 99 27/08/16 5:37 pm27/08/16 5:37 pm

100 CHAPTER 4 • RESEARCH DESIGN
There are two types of panels: continuous panels and discontinuous panels. Continuous panels ask panel members the same questions on each panel measurement. Discontinuous panels vary questions from one panel measurement to the next. 12 Continuous panel examples
include many of the syndicated data panels that ask panel members to record their purchases
using diaries or scanners. The essential point is that panel members are asked to record the
same type of information (for example, grocery store purchases) on an ongoing basis. Discontinuous panels are sometimes referred to as omnibus panels . ( Omnibus means
“including or covering many things or classes.”) They may be used for a variety of purposes,
and the information collected by a discontinuous panel varies from one panel measurement
to the next. How longitudinal data are applied depends on the type of panel used to collect
the data. Essentially, the discontinuous panel’s primary usefulness is that it represents a large
group—people, stores, or some other entity—and its members are agreeable to providing
marketing research information. Discontinuous panels, like continuous panels, are also demo-
graphically matched to some larger entity, implying representativeness as well. Therefore, a
marketer wanting to know how a large number of consumers, matched demographically to the
total U.S. population, feel about two diff erent product concepts may elect to utilize the ser-
vices of an omnibus panel. The advantage of discontinuous (omnibus) panels is that they rep-
resent a group of persons who have made themselves available for research. In this way, then,
discontinuous panels represent existing samples of consumers that may be quickly accessed
for a wide variety of purposes. The continuous panel is used quite diff erently. Usually, fi rms are interested in using data
from continuous panels because they can gain insights into changes in consumers’ attitudes
and behaviors. For example, data from continuous panels can show how members of the panel
switch brands from one time period to the next. Studies examining the extent to which con-
sumers are loyal to one brand versus buying diff erent brands are known as brand-switching studies . Such studies can be invaluable to brand managers because cross-sectional studies
that show changes in market shares between several brands can be misleading. We will illus-
trate this in Tables 4. 1 and 4. 2. Table 4. 1 shows the results of two separate surveys conducted
Continuous panels are samples of respondents who agree to answer the same questions at periodic intervals.
Discontinuous panels vary questions from one panel measurement to the next.
Discontinuous panels, or omnibus panels, are samples of respondents who answer different questions on a regular basis over a period of time.
Active Learning
Omnibus Surveys
Let’s learn more about omnibus surveys! Go to www.greenbook.org . At the top left, locate “Greenbook Directory.” Under “Research Services,” select the drop-down menu, and then scroll down and click “Omnibus Surveys.” Besides “consumers,” what other types of samples may be accessed using omnibus surveys? Go to some of the firms and read what they have to say about omnibus surveys. How long does it take them to get results back to clients?
Brand-switching studies are studies that examine the extent that consumers are loyal to one brand.
TABLE 4. 1 Results of Two Cross-Sectional Studies “Which Brand of Chocolate Chip Cookie Did You Most Recently Purchase?”
Brand Cross-Sectional Survey 1 Cross-Sectional Survey 2
Famous Amos 100 75
Pepperidge Farm 200 200
Nabisco 200 225
Total Families 500 500
M04_BURN3261_08_GE_C04.indd 100M04_BURN3261_08_GE_C04.indd 100 27/08/16 5:37 pm27/08/16 5:37 pm

4-4 DESCRIPTIVE RESEARCH 101
six months apart. Let’s assume you are the brand manager for Famous Amos chocolate chip
cookies. We can see that both studies surveyed 500 families who were purchasers of chocolate
chip cookies. In survey 1 Famous Amos had 100 families, and the other two brands had 200
and 200 respectively. (Please note these numbers are for illustration only; they do not refl ect
the true market shares of these brands.) What can we learn as the brand manager from one
cross-sectional study? We now know that we are about 20% of the market and that our two
competitors have about equal shares, each about 40% of the market. Now, let’s look at another
sample of 500 other families six months later as shown in cross-sectional survey 2. What can
we learn? First, we see that Famous Amos’s share has dropped! A brand manager should be
very concerned about a drop in market share. Who is the culprit? If we compare the two cross-
sectional studies, we see that Pepperidge Farm stayed the same at 200 families, but Nabisco
climbed to 225 families. It would be quite natural to assume that Nabisco was eroding the
brand share of Famous Amos. In this case, the Famous Amos brand manager would start
examining Nabisco’s marketing mix during the last few months. Has the competitor changed
package design? Has it stepped up its promotion? Is it providing retailers with incentives? Now, let us take a look at a longitudinal study with two waves of measurements, again
six months apart. We will assume that the results (total families purchasing each brand) are
exactly the same as we have in our two cross-sectional studies. But what will be diff erent is
how each family changed. Remember, with a continuous panel in a longitudinal study we ask
the same family the same question with each administration, or wave, of the study. Look at
the results in Table 4. 2.
Notice that the totals for Wave 1 (green) and Wave 2 (blue) are exactly the same as the
totals for the two cross-sectional studies shown in Table 4. 1. However, the value of longi-
tudinal data is refl ected in the tan area inside of Table 4. 2. Of the 100 families who bought
Famous Amos cookies in Wave 1, 50 of them stayed with Famous Amos in Wave 2. Another
50 families switched to Pepperidge Farm. None of the Famous Amos families switched to
Nabisco. Of the 200 Pepperidge Farm families in Wave 1, 25 switched to Famous Amos,
150 stayed with Pepperidge Farm, and 25 switched to Nabisco. Finally, of the 200 Nabisco
families in Wave 1, all 200 of them stayed with Nabisco in Wave 2. This shows us how com-
petition is aff ecting our brand. Pepperidge Farm, not Nabisco, is interacting with our Famous
Amos cookie brand. More detailed data allow us to arrive at a more valid conclusion than we
reached by fi rst only considering the cross-sectional studies. As this example illustrates, the
value of longitudinal information using continuous panels is that it allows brand managers to
explore the dynamics among competing brands. Another use of longitudinal data is that of market tracking. Tracking studies are stud-
ies that involve the monitoring of the same variables of interest—such as market share or
unit sales—over time. By tracking sales by SKU over time, managers can learn a great deal
about what is happening in the marketplace. We discuss tracking studies in more depth in
Chapter 5 .
TABLE 4. 2 Results of Two Waves of a Longitudinal Study “Which Brand of Chocolate Chip Cookie Did You Most Recently Purchase?”
Wave 1 Brand Wave 2 Brand
Famous Amos Pepperidge Farm Nabisco Totals, Wave 1
Famous Amos 50 50 0 100
Pepperidge Farm 25 150 25 200
Nabisco 0 0 200 200
Totals, Wave 2 75 200 225
Market-tracking studies are studies that monitor the same variables of interest over time.
M04_BURN3261_08_GE_C04.indd 101M04_BURN3261_08_GE_C04.indd 101 27/08/16 5:37 pm27/08/16 5:37 pm

102 CHAPTER 4 • RESEARCH DESIGN
4- 5 Causal Research Causal research is used to measure causality in relationships, such as “if x , then y .” Causality
is a condition in which one or more variables aff ect one or more other variables. When con-
ducting causal research, “if–then” statements become our way of manipulating variables of
interest. For example, if the thermostat is lowered, then the air will get cooler. If I drive
my automobile at lower speeds, then my gasoline mileage will increase. If I spend more on
advertising, then sales will rise. Marketing managers are always trying to determine what will
cause a change in consumer satisfaction, a gain in market share, an increase in website visits,
or an increase in sales. Prior to launching its new aspartame-free diet soda in 2015, PepsiCo conducted two
years of research, including testing involving thousands of consumers, and was confi dent
that its formula would be accepted by consumers. 13 Nevertheless, shortly after the introduc-
tion of the formula, the ratio of negative to positive comments on social media about the new
Diet Pepsi was worse than is usually found with new products. 14 Understanding what causes
consumers to behave as they do is extremely diffi cult. Nevertheless, there is a high payoff in
the marketplace for even partially understanding causal relationships. Causal relationships are
examined through the use of experiments, which are special types of studies.
EXPERIMENTS An experiment is a type of study in which one or more independent variables are manip-
ulated to see how one or more dependent variables are aff ected, while also controlling
the eff ects of additional extraneous variables. Independent variables are variables over
which the researcher has control and wishes to manipulate. Broadly speaking, you can
think of the 4 Ps (product, price, promotion, and place) as independent variables. Some
examples of independent variables are level of advertising expenditure, type of advertis-
ing appeal (humor, prestige), display location, placement of website ads, method of com-
pensating salespersons, price, and type of product. Dependent variables , on the other
hand, are variables that are measured in response to changes in independent variables.
Common dependent variables include sales, market share, customer satisfaction, sales
force turnover, time spent on site, unique net profi ts, and RONW (return on net worth).
Certainly, marketers are interested in managing these variables. Because managers can-
not change these variables directly, they attempt to change them through the manipulation
of independent variables. To the extent that marketers can establish causal relationships
between independent and dependent variables, they can enjoy some success in infl uenc-
ing the dependent variables. Consider an analogy familiar to students: If you want to
change your GPA (dependent variable), you must change certain independent variables
such as amount of time devoted to study, class attendance, devotion to reading your text,
and listening habits in the lecture hall. Extraneous variables are all of the variables other than the independent variables that
may have an eff ect on the dependent variable. To illustrate, let’s say you and your friend
wanted to know if brand of gasoline (independent variable) aff ected gas mileage in automo-
biles (dependent variable). Your “experiment” consists of each of you fi lling up your two cars,
one with Brand A, the other with Brand B. At the end of the week, you learn that Brand A
achieved 18.6 miles per gallon and Brand B achieved 26.8 miles per gallon. Does Brand B
cause better gas mileage than Brand A? Or could the diff erence in the dependent variable (gas
mileage) be due to factors other than gasoline brand (independent variable)? Let’s take a look
at what these extraneous variables may be: (1) One car is an SUV, and the other is a small
compact. (2) One car was driven mainly on the highway, and the other was driven in the city
in heavy traffi c. (3) One car has properly infl ated tires, whereas the other car does not. All
these extraneous variables could have aff ected the dependent variable in addition to the brand
of gas used.
Causal research is used to measure causality in relationships, such as “if x , then y .”
Causality is a relationship in which one or more variables affect one or more other variables.
An experiment is a type of study in which one or more independent variables are manipulated to see how one or more dependent variables are affected, while also controlling the effects of additional extraneous variables.
Independent variables are variables over which the researcher has control and wishes to manipulate to measure the effect on the dependent variable.
Extraneous variables are all of the variables other than the independent variables that may have an effect on the dependent variable.
Dependent variables are variables that are measured in response to changes in independent variables.
M04_BURN3261_08_GE_C04.indd 102M04_BURN3261_08_GE_C04.indd 102 27/08/16 5:37 pm27/08/16 5:37 pm

4-5 CAUSAL RESEARCH 103
Let’s look at another example. Imag-
ine that a restaurant chain conducts an
experiment to determine the eff ect of sup-
plying nutritional information on menu
items (independent variable) on restaurant
sales (dependent variable). 15 Management
has a record of restaurant sales without
menu-supplied nutritional information
and then changes the menus (manipulates
the independent variable) to include the
nutritional information and measures sales
once again. The experiment is conducted
in one of the chain’s restaurants. Assume
sales increased. Does this mean that if the
chain changes the menu information, then
sales will increase in all its restaurants?
Might other extraneous variables have
aff ected sales? Could the following two
variables have affected the restaurant’s
sales? (1) The restaurant selected for the
experiment is located in a high-income
area in California known for health spas and workout gyms; and (2) just prior to changing the
menus, the FDA announced a study that caloric content for the same type of food had wide
variation depending on the restaurant (coff ee ranges in calories from 80 to 800 per cup; ham-
burgers range from 250 to over 1,000). Yes, the clientele for the restaurant selected for the experiment could be unique, and a
new, highly publicized study about nutritional information from a respected source, the FDA,
could certainly have had an eff ect on the acceptance of the new menu information. In fact, it
could have helped create “buzz” or positive WOM (word-of-mouth) infl uence. Both of these
possible infl uences are likely extraneous variables that have an eff ect on the dependent vari-
able but are not defi ned as independent variables. As this example illustrates, it is diffi cult to
isolate the eff ects of independent variables on dependent variables without controlling for the
eff ects of the extraneous variables. Unfortunately, it is not easy to establish causal relation-
ships, but it can be done. In the following section, we will see how the design of an experi-
ment allows us to assess causality.
EXPERIMENTAL DESIGN An experimental design is a procedure for devising an experimental setting so that a change
in a dependent variable may be attributed solely to the change in an independent variable. In
other words, experimental designs are procedures that allow experimenters to control for the
eff ects on a dependent variable by any extraneous variable. In this way, the experimenter is
assured that any change in the dependent variable was due only to the change in the indepen-
dent variable. Let’s look at how experimental designs work. First, we list the symbols of experimental
design:
O = The measurement of a dependent variable
X = The manipulation, or change, of an independent variable
R = Random assignment of subjects (e.g., consumers, stores) to experimental and control
groups
E = Experimental eff ect—that is, the change in the dependent variable due to the
independent variable
An example of an experiment is examining if listing nutritional information on
menu items aff ects restaurant sales.
An experimental design is a procedure for devising an experimental setting so that a change in a dependent variable may be attributed solely to the change in an independent variable.
© L
ight
spri
ng/S
hutt
erst
ock
M04_BURN3261_08_GE_C04.indd 103M04_BURN3261_08_GE_C04.indd 103 27/08/16 5:37 pm27/08/16 5:37 pm

104 CHAPTER 4 • RESEARCH DESIGN
When a measurement of the dependent variable is taken prior to changing the indepen-
dent variable, the measurement is sometimes called a pretest . When a measurement of the
dependent variable is taken after changing the independent variable, the measurement is
sometimes called a posttest . Control of extraneous variables is typically achieved by the use of a second group of
subjects, known as a control group. By control group , we mean a group whose subjects
have not been exposed to the change in the independent variable. The experimental group ,
on the other hand, is the group that has been exposed to a change in the independent variable.
We shall use the following experimental design to illustrate the importance of the control
group.
Before-After with Control Group The before-after with control group design may
be achieved by randomly dividing subjects of the experiment into two groups: the control
group and the experimental group. If we assume that our restaurant chain has 100 restau-
rants spread around the country, we could easily randomly divide them into two groups of
50 restaurants each. Management already has a pretest measurement of the dependent vari-
able on both groups by virtue of knowing sales volume prior to changing the menus. Next,
the independent variable, adding the nutritional information to the menus, is changed only in
the experimental group (50 restaurants). Finally, after some time period, posttest measure-
ments are taken of the dependent variable in both groups of restaurants. This design may be
diagrammed as follows:
Experimental group (R) O1 X O2
Control group (R) O3 O4
where
E = ( O 2 − O 1 ) − ( O 4 − O 3 ).
By randomly ( R ) dividing our 100 restaurants into two groups—50 in the experimental
group and 50 in the control group—the groups should be equivalent. That is, both groups
should be as similar as possible, each group having an equal number of restaurants in high-
income, middle-income, and low-income areas, and an equal number of restaurants in locales
favoring exercising and nutrition concerns. The average age of the restaurants should be
equivalent, the average square footage should be equivalent, the average number of employees
should be equivalent, and the average sales should be equivalent. In other words, randomiza-
tion should yield two groups of restaurants that are equivalent in all respects. An experimenter
should take whatever steps are necessary to meet this condition if he or she uses this design.
There are other methods for gaining equivalency besides randomization. Matching on criteria
thought to be important, for example, would aid in establishing equivalent groups. When ran-
domization or matching on relevant criteria does not achieve equivalent groups, more com-
plex experimental designs should be used. 16
Looking back at our design, the R indicates that we have randomly divided our restau-
rants into two equal groups—one a control group, the other an experimental group. We also
see that pretest measurements of our dependent variable, restaurant sales, were recorded for
both groups of restaurants, as noted by O 1 and O 3 . Next, we see by the X symbol that only in
the experimental group of restaurants were the menus changed to add the nutritional informa-
tion for the menu items. Finally, posttest measurements of the dependent variable were taken
at the same time in both groups of restaurants, as noted by O 2 and O 4 .
Now, what information can we gather from this experiment? First, we know that ( O 2 − O 1 )
tells us how much change occurred in our dependent variable during the time of the experi-
ment. But was this diff erence due solely to our independent variable, X ? No, ( O 2 − O 1 ) tells
us how many dollars in sales may be attributed to (1) the change in menu information and
(2) other extraneous variables, such as the FDA publicizing the wide variation in nutritional
A pretest is a measurement of the dependent variable that is taken prior to changing the independent variable.
A posttest is a measurement of the dependent variable that is taken after changing the independent variable.
A control group is a group whose subjects have not been exposed to the change in the independent variable.
An experimental group is a group that has been exposed to a change in the independent variable.
M04_BURN3261_08_GE_C04.indd 104M04_BURN3261_08_GE_C04.indd 104 27/08/16 5:37 pm27/08/16 5:37 pm

4-5 CAUSAL RESEARCH 105
values obtained in restaurant meals or just that more people decided to eat in restaurants dur-
ing this time interval. Now, let us look at what is measured by the diff erences in sales among
our control restaurants ( O 4 − O 3 ). Because it cannot account for changes in restaurant sales
due to a change in menu information (the menus were not changed), then any diff erences in
sales as measured by ( O 4 − O 3 ) must be due to the infl uence of all extraneous variables on res-
taurant sales. Therefore, the diff erence between the experimental group and the control group,
( O 2 − O 1 ) − ( O 4 − O 3 ), results in a measure of E , the “experimental eff ect.”
We now know that if we change menu information, then restaurant sales will change by
an amount equal to E . We have, by using a proper experimental design, made some progress
at arriving at causality. However, we should point out here, though we have established cau-
sality, it did not come without cost and complexity. Notice our experiment went from chang-
ing menus in 1 restaurant to 50 restaurants, and our total experiment involved 100 restaurants!
Often organizations use A/B testing to determine which of two or more alternatives
involved in marketing a product is better, such as two pricing levels, two types of packaging,
or two diff erent brand names. A/B testing is testing two alternatives (A and B) to see which
one performs better. A/B testing is often used to compare website designs to determine which
design is more eff ective. Website traffi c can be split between design A and design B, with an
important measure, such as sales or repeat visitors, compared between the two websites to
determine which design is superior. As we noted earlier, there are many other experimental designs, and of course, there are
almost limitless applications of experimental designs to marketing problems. Although we
have demonstrated how valuable experimentation can be in providing knowledge, we should
not accept all experiments as being valid. How we assess the validity of experiments is the
subject of our next section.
HOW VALID ARE EXPERIMENTS? How can we assess the validity of an experiment? An experiment is valid if (1) the observed
change in the dependent variable is, in fact, due to the independent variable, and (2) the results
of the experiment apply to the “real world” outside the experimental setting. 17 Two forms of
validity are used to assess the validity of an experiment: internal and external.
Internal validity is the extent to which a researcher can be certain that a change in the
dependent variable is actually due to the independent variable. This is another way of asking
if the proper experimental design was used and if it was implemented correctly. To illustrate
an experiment that lacks internal validity, let us return to our change in menu information
example. Recall that we took the eff ort to expand our restaurants to 100 and randomly divided
them into two groups to ensure that the experimental group and control group were, in fact,
equivalent. What would happen if the researcher did not ensure the equivalency of the groups?
Our experimental eff ect, E , could be due to the diff erences in the two groups (e.g., one group
of restaurants was located in areas with clientele sensitive to nutrition). This diff erence in the
groups, then, would represent an extraneous variable that had been left uncontrolled. Such
an experiment would lack internal validity because it could not be said that the change in the
dependent variable was due solely to the change in the independent variable. Experiments
lacking internal validity have little value because they produce misleading results. External validity refers to the extent that the relationship observed between the indepen-
dent and dependent variables during the experiment is generalizable to the “real world.” 18 In
other words, can the results of the experiment be applied to all the restaurants in the chain?
There are several threats to external validity. How representative is the sample of test units? Is
this sample really representative of the population? Additionally, there exist many examples
of the incorrect selection of sample units for testing purposes. For example, some execu-
tives, headquartered in large cities in cold winter climates, have been known to conduct
“experiments” in warmer, tropical climes during the winter. Although the experiments they
A/B testing is testing two alternatives (A and B) to see which one performs better.
Internal validity in an experimental study is the extent to which the researcher is certain that a change in a dependent variable is actually due to the independent variable.
External validity refers to the extent to which a researcher can be certain that a relationship observed between independent and dependent variables during an experiment would occur under real-world conditions.
M04_BURN3261_08_GE_C04.indd 105M04_BURN3261_08_GE_C04.indd 105 27/08/16 5:37 pm27/08/16 5:37 pm

106 CHAPTER 4 • RESEARCH DESIGN
conduct may be internally valid, it is doubtful that the results will be generalizable to the total
population. Another threat to external validity is the artifi ciality of the experimental setting itself.
To control as many variables as possible, some experimental settings are far removed
from real-world conditions. 19 If an experiment is so contrived that it produces behav-
ior that would not likely be found in the real world, then the experiment lacks external
validity.
TYPES OF EXPERIMENTS We can classify experiments into two broad classes: laboratory and fi eld. Laboratory experiments are those in which one or more independent variables are manipulated and
measures of the dependent variable are taken in a contrived, artifi cial setting for the pur-
pose of controlling the many possible extraneous variables that may aff ect the dependent
variable. To illustrate, let us consider a study whereby subjects are invited to a theater and shown
test ads, copy A or copy B, spliced into a TV pilot program. Why would a marketer want to
use such an artifi cial laboratory setting? Such a setting is used to control for variables that
could aff ect the purchase of products other than those in the test ads. By bringing consumers
into an artifi cial laboratory setting, the experimenter is able to control many extraneous vari-
ables. For example, you have learned why it is important to have equivalent groups (the same
kind of people watching copy A as those watching copy B commercials) in an experiment.
By inviting preselected consumers to the TV pilot showing in a theater, the experimenter can
match (on selected demographics) the consumers who view copy A with those who view
copy B, thus ensuring that the two groups are equal. By having the consumers walk into an
adjoining “store,” the experimenter easily controls other factors such as the time between
exposure to the ad copy and shopping, as well as the consumers being exposed to other
advertising by competitive brands. As you have already learned, any one of these factors, left
uncontrolled, could have an impact on the dependent variable. By controlling for these and
other variables, the experimenter can be assured that any changes in the dependent variable
were due solely to diff erences in the independent variable, ad copy A and ad copy B. Labo-
ratory experiments, then, are desirable when the intent of the experiment is to achieve high
levels of internal validity.
There are advantages to laboratory experiments. First, they allow the researcher to
control for the eff ects of extraneous variables. Second, compared to fi eld experiments, lab
experiments may be conducted quickly and with less expense. The disadvantage of laboratory
experiments is the lack of a natural setting and, therefore, the concern that the fi ndings do not
generalize to the real world.
Field experiments are those in which the independent variables are manipulated and the
measurements of the dependent variable are made on test units in their natural setting. Many
marketing experiments are conducted in natural settings, such as in supermarkets, malls, retail
stores, and consumers’ homes. Let us assume that a marketing manager conducts a laboratory
experiment to test the diff erences between ad copy A, the company’s existing ad copy, and
new ad copy B. The results of the laboratory experiment indicate that copy B is far superior
to the company’s present ad copy A. But, before spending the money to use the new copy, the
manager wants to know if ad copy B will really create increased sales in the real world. She
elects to actually run the new ad copy in Erie, Pennsylvania, a city noted as being representa-
tive of the average characteristics of the U.S. population. By conducting this study in the fi eld,
the marketing manager will have greater confi dence that the results of the study will actually
hold up in other real-world settings. Note, however, that even if an experiment is conducted in
a naturalistic fi eld setting to enhance external validity, the experiment is invalid if it does not
also have internal validity.
Laboratory experiments are those in which one or more independent variables are manipulated and measures of the dependent variable are taken in an artifi cial setting for the purpose of controlling all extraneous variables that may affect the dependent variable.
Field experiments are those in which the independent variables are manipulated and the measurements of the dependent variable are taken in their natural setting.
M04_BURN3261_08_GE_C04.indd 106M04_BURN3261_08_GE_C04.indd 106 27/08/16 5:37 pm27/08/16 5:37 pm

4-6 TEST MARKETING 107
The primary advantage of the fi eld experiment is that of conducting the study in a nat-
uralistic setting, thus increasing the likelihood that the study’s fi ndings will also hold true
in the real world. Field experiments, however, are expensive and time consuming. Also, the
experimenter must always be alert to the impact of extraneous variables, which are diffi cult to
control in the natural settings of fi eld experimentation.
The example we just cited of using Erie, Pennsylvania, for a fi eld experiment would be
called a “test market.” Much of the experimentation in marketing, conducted as fi eld experi-
ments, is known as test marketing, which is discussed in the following section.
4- 6 Test Marketing Test marketing is the phrase commonly used to indicate an experiment, study, or test that is
conducted in a fi eld setting. Companies may use one or several test-market cities, which are
selected geographical areas in which to conduct the test. There are two broad classes of uses
of test markets: (1) to test the sales potential for a new product or service, and (2) to test varia-
tions in the marketing mix for a product or service. 20
Although test markets are very expensive and time consuming, the costs of introduc-
ing a new product on a national or regional basis routinely amount to millions of dollars.
The costs of the test market are then justifi ed if the results of the test market can improve
a product’s chances of success. Sometimes the test market identifi es a failure early on and
saves the company huge losses. Other times a product tests well in a test market and then is
introduced more widely. For example, Taco Bell tested a food item called a Quesalupa—a
cross between a quesadilla and a chalupa—for two months in 2015 in 36 Toledo-area stores.
The Quesalupa tested well in Toledo, so Taco Bell made the decision to launch the product
nationally. 21
Test markets are conducted not only to measure sales potential for a new product but
also to measure consumer and dealer reactions to other marketing-mix variables. A fi rm
may use only department stores to distribute the product in one test-market city and only
specialty stores in another test-market city to gain some information on the best way to dis-
tribute the product. Companies can also test media usage, pricing, sales promotions, and so
on through test markets. Products and services in both the consumer (B2C) and industrial
(B2B) markets may be test marketed. Marketing Research Insight 4. 3 describes the work-
ings of a B2C test market in Germany.
TYPES OF TEST MARKETS Test markets can be classifi ed into four types: standard, controlled, electronic, and simu-
lated. 22 Each is detailed in the following sections.
Standard Test Market The standard test market is one in which the fi rm tests the prod-
uct or marketing-mix variables through the company’s normal distribution channels. A dis-
advantage of this type of test market is that competitors are immediately aware of the new
product or service. However, standard test markets are good indicators as to how the product
will actually perform because they are conducted in real settings.
Controlled Test Markets Controlled test markets are conducted by outside research
fi rms that guarantee distribution of the product through prespecifi ed types and numbers of
distributors. Companies specializing in providing this service provide dollar incentives for
distributors to provide them with guaranteed shelf space. Controlled test markets off er an
alternative to the company that wishes to gain fast access to a distribution system set up for
test-market purposes. The disadvantage is that this distribution network may or may not prop-
erly represent the fi rm’s actual distribution system.
Test marketing is conducting an experiment or study in a fi eld setting to evaluate a new product or service or other elements of the marketing mix.
A standard test market is one in which the fi rm tests the product or marketing-mix variables through the company’s normal distribution channels.
A controlled test market is one that is conducted by outside research fi rms that guarantee distribution of the product through prespecifi ed types and numbers of distributors.
Test markets are classifi ed into four types: standard, controlled, electronic, and simulated.
M04_BURN3261_08_GE_C04.indd 107M04_BURN3261_08_GE_C04.indd 107 27/08/16 5:37 pm27/08/16 5:37 pm

108 CHAPTER 4 • RESEARCH DESIGN
Looking over the Average German Consumer’s Shoulder The Average German Consumer Hassloch, Germany, has been a permanent product test mar-ket for GfK, a marketing research institute, since 1986. Has-sloch is considered to be representative of Germany in terms of its age distribution, population structure, buying power, and so on. Its geographic location allows it to have a unique combination of rural and urban lifestyles. All this makes the village an ideal market to test new products and to take important marketing decisions that are relevant for the entire German market.
The Mechanics Seven supermarkets are involved in this project. Out of the total of 12,400 households, 3,400 are part of the panel and have been given a household card that has a chip. There are no questionnaires involved, and people taking part only use their smartcards at the time of check-out as every purchase is recorded. The 10 to 15 products that are tested in the select supermarkets are not disclosed. These products are placed on the shelves along with the rest of the supermarket’s product range as a measure to make sure that the shopping conditions are genuine. GfK uses a system called GfK BehaviorScan to record this shopping behavior. In addition, GfK tests advertising by showing special television commercials to 2,500 households. By comparing the purchasing behavior of the participants and the control group, which consists of those who are exposed to the usual advertisements, GfK tries to determine whether the advertising campaign is working or not.
The Impact These tests have helped companies to gauge the sales potential of new products. Products like Pringles potato crisps, Dove soap, and Fairy Ultra dishwasher have been successfully tested and have worked in the German market. There are also tests that involve other elements of the marketing mix. For example, SO1, a mar-keting consulting company based in Berlin, tested a new type of discount coupon program to understand its effect on consumers’ purchase behavior. The aim was to be able to offer discounts based on the shopping behavior of each consumer. Procter & Gamble tested two different TV commercials for their Always Ultra pads, and one of the commercials helped in doubling the sales fi gures.
MARKETING RESEARCH INSIGHT 4. 3 Practical Application
Electronic Test Markets Electronic test markets are those in which a panel of consum-
ers has agreed to carry identifi cation cards that each consumer presents when buying goods
and services. These tests are conducted only in a small number of cities in which local retail-
ers have agreed to participate. The advantage of the card is that as consumers buy (or do not
buy) the test product, demographic information on the consumers is automatically recorded.
In some cases, fi rms off ering electronic test markets may also have the ability to link media
viewing habits to panel members as well. In this way, fi rms using the electronic test market
also know how diff erent elements of the promotional mix aff ect purchases of the new product.
Obviously, the electronic test market off ers speed, greater confi dentiality, and less cost than
standard and controlled test markets. However, the disadvantage is that the test market is one
more step removed from the real market. 23
An electronic test market is one in which a panel of consumers has agreed to carry identifi cation cards that each consumer presents when buying goods and services.
© S
hare
shot
s/S
hutt
erst
ock
GfK tests new products in Hassloch to see if they will work
in the German market.
Sources: Weichert, U. (2015, May 11). Jeder hat seinen Preis. Technology Review. Retrieved from http://www.heise.de/tr/artikel/Jeder-hat-seinen-Preis-2599605.html; Die Welt. (2015, February 17). Neue Produkte auf dem Testmarkt in der Provinz. Retrieved from http://www.welt.de/regionales/rheinland-pfalz-saarland/article137525493/Neue-Produkte-auf-dem-Testmarkt-in-der-Provinz.html; Waldherr, G. (2014, February). Das ist Deutschland. Brandeins Wirtschaftsmagazin. Retrieved from http://www.brandeins.de/archiv/2014/werbung/das-ist-deutschland/; Braun, C. (2015, December). Goethe-Institute. Retrieved from https://www.goethe.de/en/kul/mol/20677297.html.
M04_BURN3261_08_GE_C04.indd 108M04_BURN3261_08_GE_C04.indd 108 05/09/16 11:25 AM05/09/16 11:25 AM

4-6 TEST MARKETING 109
Simulated Test Markets Simulated test markets (STMs) are those in which a limited
amount of data on consumer response to a new product is fed into a model containing
certain assumptions regarding planned marketing programs, which generates likely prod-
uct sales volume. 24 There are many advantages to STMs. They are much faster and only
cost 5% to 10% of the cost of a standard test market. STMs are confi dential; competitors
are less likely to know about the test. The primary disadvantage is that STMs are not as
accurate as full-scale test markets, as they are dependent on the assumptions built into the
models. 25
SELECTING TEST-MARKET CITIES Three criteria are useful for selecting test-market cities: representativeness , degree of isolation , and ability to control distribution and promotion . Because one of the
major reasons for conducting a test market is to achieve external validity, the test-market
city should be representative of the marketing territory in which the product will ulti-
mately be distributed. Consequently, a great deal of eff ort is expended to locate the “ideal”
city in terms of comparability with characteristics of the total U.S. (or any national) popu-
lation. The “ideal” city is, of course, the city whose demographic characteristics most
closely match the desired total market. For instance, R. J. Reynolds chose Chattanooga,
Tennessee, to test-market its Eclipse “smokeless” cigarette because Chattanooga has a
higher proportion of smokers than most cities, and R. J. Reynolds needed to test Eclipse
with smokers. 26 The ability to control distribution and promotion depends on a number of factors.
Are distributors in the city available and willing to cooperate? If not, is a controlled-test-
market service company available for the city? Will the media in the city have the facilities to
accommodate your test-market needs? At what costs? All of these factors must be considered
before selecting the test city. Fortunately, because city governments often consider it desir-
able to have test markets conducted in their city because it brings in additional revenues, they
and local media typically provide a great deal of information about their city to prospective
test marketers.
PROS AND CONS OF TEST MARKETING The advantages of test marketing are straightforward. Testing product acceptability and
marketing-mix variables in a fi eld setting provides the best information possible to the deci-
sion maker prior to actually going into full-scale marketing of the product. Test marketing
allows for the most accurate method of forecasting future sales, and it allows fi rms the oppor-
tunity to pretest marketing-mix variables. On the downside, fi rst, test markets do not yield
infallible results. Second, competitors may intentionally try to sabotage test markets. For
example, fi rms may fl ood a test market with sales promotions if they know a competitor is test-
marketing a product. 27 Another problem with test markets is their cost. The costs of test mar-
kets involving several test cities and various forms of promotion can be extremely expensive.
Third, test markets bring about exposure of the product to the competition. Competitors get
the opportunity to examine product prototypes and to see the planned marketing strategy for
the new product via the test market.
Finally, test markets may create ethical problems. Companies routinely report test-mar-
keting results to the press, which allows them access to premarket publicity. But are negatives
found in the test market always reported, or do we hear only the good news? Companies eager
to get good publicity may select test-market cities that they feel will return favorable results.
Perhaps the company already has a strong brand and market power in the market. Is this
method of getting publicity ethical? There have been eff orts to make reporting of test markets
more candid. 28
A simulated test market (STM) is one in which a limited amount of data on consumer response to a new product is fed into a model containing certain assumptions regarding planned marketing programs, which generates likely product sales volume.
To learn about McDonald’s long process for testing
products, go to www.youtube.com and type in “McDonald’s Test Kitchen: Where Fast Food Is Born.”
Three criteria useful for selecting test-market cities are representativeness, degree of isolation, and ability to control distribution and promotion.
M04_BURN3261_08_GE_C04.indd 109M04_BURN3261_08_GE_C04.indd 109 27/08/16 5:37 pm27/08/16 5:37 pm

110 CHAPTER 4 • RESEARCH DESIGN
Research design refers to a master plan that specifi es
the methods that will be used to collect and analyze the
information needed for a research project. There are three
general types of research designs: exploratory, descrip-
tive, and causal. The signifi cance of studying research
design is that, by matching the research objective with
the appropriate research design, a host of research deci-
sions may be predetermined. Therefore, a research
design serves as a “blueprint” for researchers. Research
designs are not carried out in a particular order; in fact,
some projects may require only one form of research.
But research is often an iterative process in which initial
research indicates the need for additional studies, often
of a diff erent design.
Researchers are often much more knowledgeable
of the marketing research process than managers. This
imbalance of knowledge, which is not unique to mar-
keting research, may lead to serious ethical issues.
Ethical codes and standards developed by professional
organizations prohibit such practices as designing
research that is much more complex and expensive than
needed.
Selecting the appropriate research design depends,
to a large extent, on the research objectives and existing
information about the problem. If very little is known,
exploratory research is appropriate. Exploratory research
is unstructured, informal research undertaken to gain
background information; it is helpful for more clearly
defi ning the research problem. Exploratory research is
used in a number of situations: to obtain background
information, to defi ne terms, to clarify problems and
hypotheses, and to establish research priorities. Review-
ing existing literature, surveying individuals knowledge-
able in the area to be investigated, relying on former
similar case situations, and conducting focus groups are
methods of conducting exploratory research. Explor-
atory research should almost always be used because
it is fast and inexpensive; sometimes it resolves the
research objective or is helpful in carrying out descrip-
tive or causal research.
If concepts and terms are already known and the
research objective is to describe and measure phenom-
ena, then descriptive research is appropriate. Descriptive
research is undertaken to measure the characteristics of
consumers and/or markets and answers the questions of
who, what, where, when, and how. Descriptive studies
may be conducted at one point in time (cross-sectional
study), or several measurements may be made on the
same sample at diff erent points in time (longitudinal
study). Longitudinal studies are often conducted using
panels. Panels represent sample units who have agreed to
answer questions at periodic intervals. Continuous panels
are longitudinal studies in which sample units are asked
the same questions repeatedly. Brand-switching tables
may be prepared based on data from continuous panels.
Market-tracking studies may be conducted using data
from continuous panels.
The second type of panel used in longitudinal
research is the discontinuous panel. Discontinuous pan-
els, sometimes called omnibus panels, are those in which
the sample units are asked diff erent questions each time
they are surveyed. The main advantage of the discontinu-
ous panel is that research fi rms have a large sample of
persons who are willing to answer whatever questions
they are asked.
Causal research is used to measure cause-and-effect
relationships such as “if x , then y .” Causal relation-
ships may be discovered only through special studies
called experiments. Experiments allow us to determine
the effects of a variable, known as an independent vari-
able, on another variable, known as a dependent vari-
able. Experimental designs are necessary to ensure that
the effect we observe in our dependent variable is due
to our independent variable and not to other variables
known as extraneous variables. The validity of experi-
ments may be assessed by examining internal validity
and external validity. Laboratory experiments are par-
ticularly useful for achieving internal validity, whereas
field experiments are better suited for achieving exter-
nal validity.
Test marketing is a form of fi eld experimentation.
Various types of test markets exist (standard, controlled,
electronic, and simulated). Although test markets garner
much useful information, they are expensive and not infal-
lible. Test-market cities are selected on the basis of their
representativeness, isolation, and the degree to which mar-
ket variables such as distribution and promotion may be
controlled.
Summary
M04_BURN3261_08_GE_C04.indd 110M04_BURN3261_08_GE_C04.indd 110 27/08/16 5:37 pm27/08/16 5:37 pm

REVIEW QUESTIONS/APPLICATIONS 111
Key Terms
Research design (p. 92 )
Exploratory research (p. 94 )
Experience surveys (p. 96 )
Key-informant technique (p. 96 )
Lead-user survey (p. 96 )
Case analysis (p. 96 )
Descriptive research (p. 98 )
Cross-sectional studies (p. 99 )
Sample surveys (p. 99 )
Longitudinal studies (p. 99 )
Panels (p. 99 )
Continuous panels (p. 100 )
Discontinuous panels (p. 100 )
Omnibus panels (p. 100 )
Brand-switching studies (p. 100 )
Causal research (p. 102 )
Causality (p. 102 )
Experiment (p. 102 )
Independent variables (p. 102 )
Dependent variables (p. 102 )
Extraneous variables (p. 102 )
Experimental design (p. 103 )
Pretest (p. 104 )
Posttest (p. 104 )
Control group (p. 104 )
Experimental group (p. 104 )
Before-after with control
group (p. 104 )
A/B testing (p. 105 )
Internal validity (p. 105 )
External validity (p. 105 )
Laboratory experiments (p. 106 )
Field experiments (p. 106 )
Test marketing (p. 107 )
Standard test market (p. 107 )
Controlled test markets (p. 107 )
Electronic test markets (p. 108 )
Simulated test markets (STMs)
(p. 109 )
Representativeness (p. 109 )
Degree of isolation (p. 109 )
Ability to control distribution and
promotion (p. 109 )
Review Questions/Applications
4- 1. What is research design?
4- 2. Explain why it is important for marketing researchers
to be knowledgeable of research design.
4- 3. Discuss how research design can lead to ethically
sensitive situations.
4- 4. When might an organization use exploratory
research?
4- 5. In which type of research design would a lead-user
survey be used?
4- 6. Why do sample surveys have predetermined margins
of error?
4- 7. In what situation would a continuous panel be more
suitable than a discontinuous panel? In what situa-
tion would a discontinuous panel be more suitable
than a continuous panel?
4- 8. What type of panel is an omnibus panel?
4- 9. Explain why studies of the “if–then” variety are con-
sidered to be causal studies.
4- 10. Defi ne each of the following types of variables and
give an example of each in an experiment designed
to determine the eff ects of an advertising campaign:
independent, dependent, extraneous, control group,
and experimental group.
4- 11. Explain the two types of validity in experimentation
and also explain why diff erent types of experiments
are better suited for addressing one type of validity
versus another.
4- 12. Distinguish among the various types of test
marketing.
4- 13. A newly established noodle house has suff ered low
sales lately. The owner of the noodle house wants to
conduct research to collect information that will help
him solve the problem at hand and design a work-
able strategy. Explain how the three types of research
designs can be used in this case.
4- 14. Can you identify research problems that might be
addressed through a search of social media websites?
What type of research design would you recommend
for these problems?
4- 15. Design an experiment. Select an independent vari-
able and a dependent variable. What are some pos-
sible extraneous variables that may cause problems?
Explain how you would control for the eff ects these
variables may have on your dependent variable. Is
your experiment a valid one?
4- 16. Nan-Clean is a newly developed cleaning liquid for
milk bottles that uses special enzymes to remove
dirt eff ectively. Nan-Clean has been positioned as
a product that is made of natural ingredients and is
thus a more eff ective cleaning liquid than the other
competing brand in the market. Design an experi-
ment that compares Nan-Clean to the leading brand
M04_BURN3261_08_GE_C04.indd 111M04_BURN3261_08_GE_C04.indd 111 27/08/16 5:37 pm27/08/16 5:37 pm

112 CHAPTER 4 • RESEARCH DESIGN
to determine which brand consumers consider more
eff ective. Explain how the experiment can be con-
ducted and assess its validity.
4- 17. Artia Hunt is the CEO of a successful chain of
coffee shops in the Midwest. Ms. Hunt would
like to add a small selection of pastries to the cur-
rent food off erings at her coff ee shops. You have
been hired to conduct an exploratory study using
social media sources to develop an initial list of
the types of pastries that should be considered for
this new initiative. Based on Marketing Research
Insight 4. 2 , outline the steps you will use to conduct
this project and present the results of your research to
Ms. Hunt.
4- 18. Active-Ingredients, a company supplying baking ingredients to major hypermarkets, is facing intense competition from many local and foreign brands. Active-Ingredients is thinking of using a television set as a point-of-sale (POS) display at selected hyper-markets to advertise the diff erent ingredients they are selling and demonstrate diff erent ways of baking using their ingredients. Design an experiment that determines whether the installation of the televi-sion set next to the advertised products increases the
sales of Active-Ingredients’ products in the selected hypermarkets. Identify and diagram the experiment. Explain how the experiment is to be conducted and assess the validity of the experiment.
4- 19. SplitScreen is a marketing research company that
tests television advertisements. SplitScreen has
an agreement with a cable television company in
a medium-sized city in Iowa. The cable company
can send up to four diff erent television ads simul-
taneously to diff erent households. SplitScreen also
has agreements with three of the largest grocery
store chains, which will provide scanner data to
SplitScreen. About 25% of the residents have
SplitScreen scan cards that are scanned when
items are bought at the grocery store and that allow
SplitScreen to identify who bought which grocery
products. For allowing SplitScreen access to their
television hookups and their grocery-purchase
information, residents receive bonus points that
can be used to buy products in a special points cat-
alog. Identify and diagram an experimental design
possible using the SplitScreen system. Assess
the internal and external validity of SplitScreen’s
system.
CASE 4. 1
Memos from a Researcher 29 John Daniel, a researcher at Georgia Metro Research, made
the following notes about several of his clients to you, a
newly hired trainee who has just graduated from college:
Client A is a consumer packaged goods manufacturer
with a well-established brand name. The client has focused
on manufacturing and distribution for years while the mar-
keting program has been set on “auto pilot.” All had worked
fi ne, though there was a hint of emerging problems when,
in the preceding year, market share had fallen slightly.
Now, our client has just reviewed the current market share
report and notices that over the previous 12 months, the
company’s share has gradually eroded 15%. When market
share falls, clients are eager to learn why and to take cor-
rective action. In these situations we know immediately the
problem is that we don’t know what the problem is. There
are many possible causes for this slippage. We need to de-
termine the research design needed.
Second, Client B is a manufacturer of several baked
goods products sold in grocery stores throughout the coun-
try. Marketing is divided into fi ve regional divisions in the
United States. The fi ve divisions have had total autonomy
over their advertising, though all of them have used TV ad-
vertising almost exclusively. Each division has tried several
diff erent TV ad campaigns; some were thought to be suc-
cessful and others not as successful, but no one had ever
formally evaluated the ad expenditures. A new marketing
VP now wants to evaluate the advertising. She’s interested
in knowing not only the sales of the client’s products sold
during the diff erent campaigns but also what happened to
sales of competitors’ brands. In this case, the client needs
us to describe sales by SKU in the client’s product cate-
gory for each TV market and for each time period associ-
ated with each ad campaign. What research design do you
recommend?
M04_BURN3261_08_GE_C04.indd 112M04_BURN3261_08_GE_C04.indd 112 27/08/16 5:37 pm27/08/16 5:37 pm

REVIEW QUESTIONS/APPLICATIONS 113
Finally, Client C is in a very competitive category
with equal market share of the top three brands. Our cli-
ent is convinced that it has changed every marketing-mix
variable possible except for package design. Since the
three competitive brands are typically displayed side-
by-side, Client C wants us to determine what factors of
package design (e.g., size, shape, color, texture) cause an
increase in awareness, preference for, and intention to
buy the brand. What do you recommend for the appropri-
ate research design?
1. Describe what research design you would recommend
for each client.
2. For each research design you selected for the three cli-
ents, discuss why you believe your choice of design is
the correct choice.
M04_BURN3261_08_GE_C04.indd 113M04_BURN3261_08_GE_C04.indd 113 27/08/16 5:37 pm27/08/16 5:37 pm

▶
LEARNING OBJECTIVES In this chapter you will learn: 5- 1 The meaning of the term big data 5- 2 The differences between primary and
secondary data 5- 3 The different classifi cations of secondary
data, including internal and external databases
5- 4 The advantages and disadvantages of secondary data
5- 5 How to evaluate secondary data 5- 6 How to use the U.S. Census Bureau’s
American Community Survey 5- 7 What packaged information is and the
differences between syndicated data and packaged services
5- 8 The advantages and disadvantages of packaged information
5- 9 The applications of packaged information
5- 10 The uses of social media data and their advantages and disadvantages
5- 11 What the Internet of Things is and its future potential
“WHERE WE ARE”
1 Establish the need for marketing research.
2 Defi ne the problem.
3 Establish research objectives.
4 Determine research design.
5 Identify information types and sources.
6 Determine methods of accessing data.
7 Design data collection forms.
8 Determine the sample plan and size.
9 Collect data.
10 Analyze data.
11 Prepare and present the fi nal research
report.
Hootsuite: Social Media Monitoring: Your Biggest Missed Opportunity?
People are talking about busi-
nesses online right now. It
could be in a positive way or
a negative way, or they could
just have a question. Regard-
less of how or why it hap-
pens, with social media you
have an opportunity to listen,
learn, and engage in those
conversations.
Social media monitoring
(also known as social listen-
ing) is all about gaining unique
insight into customers, competitors, and industry infl uencers. By moni-
toring what people are saying on social media about business and the
issues that affect it, fi rms can build a better relationship with their cus-
tomers, get a leg up on their competitors, and improve their ROI.
Three Ways to Get the Most Out of Social Media Monitoring
1. ACQUIRE CUSTOMER KNOWLEDGE
A great way to obtain qualitative information about customers is through
social media monitoring. Here are the kinds of insights you can gain by
listening to customers on social media:
■ The prevailing sentiment around brands and products
■ The features or products customers are looking for from
companies
■ How to solve customers’ problems
5 Secondary Data and Packaged Information
Kristina Cisnero, Online Strategist,
Hootsuite.
M05_BURN3261_08_GE_C05.indd 114M05_BURN3261_08_GE_C05.indd 114 27/08/16 5:52 pm27/08/16 5:52 pm

115
To get started on monitoring social media, you will need to have a social media
monitoring tool. Once you’re all set up, some examples of social media moni-
toring tactics you can use include the following:
■ Monitor anyone mentioning a company’s Twitter handle
■ Create search streams for Twitter, Facebook, Google+, and Instagram
to listen to people mentioning companies with positive or negative
words or hashtags
■ Start listening to customers (or future customers)
2. GAIN A COMPETITIVE ADVANTAGE
Social media monitoring can also give you key information on competitors. This kind of intel
will allow you to make strategic business decisions to always stay ahead of the competition.
To listen to what people are saying about competitors, use the tactics described earlier,
but replace a business name with competitors’ names as well as any of their product names.
Social media marketing isn’t all about promoting products. By solving people’s problems
before anyone else can, fi rms can gain new customers and also show current customers that
they’re there to help.
3. MONITOR BUSINESS INFLUENCERS
Most businesspeople who are savvy about using social media know it’s important to listen to
what customers and competitors are saying, but there’s one group many leave out of their
social media strategies: infl uencers. For businesses to be innovative and stay ahead of the
curve, it is also important to listen to what thought leaders in their industry are saying.
Tools like the Hootsuite Syndicator can be used to follow infl uential executives, bloggers,
and analysts on Twitter, Facebook, LinkedIn, and Google+ and see what they are posting on
their websites. By doing this, companies can predict trends in their industry, position their
company as an innovator, and improve their business.
—Kristina Cisnero
Source: Text and photos courtesy of Kristina Cisnero and Hootsuite.
Visit Hootsuite at www.hootsuite.com .
Amajor reason that marketing research has never been a more exciting field is the new
types of data that are now available for analysis. Grouped under the umbrella term
big data , information is available from more sources than ever before—from govern-
ment statistics to sensor data to tracking studies. As Kristina Cisnero from Hootsuite points
out in the introduction, social media platforms are replete with insights about consumers and
businesses.
You live in a world where secondary data are readily available and easily accessed. This
chapter explores how secondary data are used, how we classify diff erent types of data, what
advantages and disadvantages such information sources off er, and where marketing research-
ers can fi nd signifi cant sources of secondary data. In addition, we introduce another type of
M05_BURN3261_08_GE_C05.indd 115M05_BURN3261_08_GE_C05.indd 115 27/08/16 5:52 pm27/08/16 5:52 pm

116 CHAPTER 5 • SECONDARY DATA AND PACKAGED INFORMATION
information we call packaged information and examine its applications in marketing research.
We end with a discussion of two powerful forms of digital data: social media data and the
Internet of Things. The types of data and tools associated with managing data are changing
quickly, and the more you keep abreast of these changes, the better equipped you will be to
succeed in any professional position. As this chapter suggests, researchers who can combine
data management and analysis skills with marketing knowledge are in great demand.
5- 1 Big Data Big data can be defi ned simply as large amounts of data from multiple sources. The term
big data has been popularized in recent years in response to the numerous types and huge
amounts of data to which companies now have access in real time. The phrase is often used
to indicate alarm and apprehension about the enormous—and multiplying—amounts of data
that are being created on an ongoing basis. 1 The Wall Street Journal estimates that in the
1950s, the insurance company John Hancock Mutual Life was one of the top storehouses of
information, with a total of about 600 megabytes of data. Compare this to the 2010s, during
which Facebook stores an estimated 100 additional petabytes daily. 2 The 2014 GreenBook
Research Industry Trends Report (GRIT) survey found that managing big data is the number-
one issue facing the marketing research industry. 3
Sources of data can originate from many places, including from companies, sensors,
retailers, trade organizations, governments, publishers, and social media. These data take
many forms, both qualitative and quantitative, including text, photos, videos, business trans-
actions, research data, and many other types of data. There is simply too much data available
for any one company to exhaustively gather, store, analyze, and report. Decisions must be
made about what data to collect and how to analyze the data to fi nd trends, patterns, and
relationships among data from multiple sources. The advent of big data has created great chal-
lenges for marketing researchers. Eff ective use of multiple sources of data requires having the
resources and talent available to retrieve, store, integrate, analyze, and report the data.
Access to big data also creates great opportunities. Proper management of big data
has the potential to increase productivity for companies signifi cantly. To illustrate, Market-
ing Research Insight 5. 1 focuses on how the tennis industry is using analysis of big data to
improve match performance and spectator experience.
Given the large amounts of data available, researchers need to be strategic about their
use. The optimal use of big data begins by following the research steps outlined in Chapter 3 .
First, researchers must be sure that the problem statement and research objectives have been
carefully defi ned. You should never begin a data analysis project without knowing what the
ultimate goals are. Next, researchers must decide what data are needed to solve the problem
and reach the objective. And, fi nally, researchers must determine if they need to collect the
data themselves or if the data already exist. Secondary data that already exist and have been
gathered by somebody else are the focus of this chapter. The following section will clarify the
diff erences between primary and secondary data.
5- 2 Primary Versus Secondary Data Data needed for marketing management decisions can be grouped into two types: primary and
secondary. Primary data refers to information that is developed or gathered by the researcher
specifi cally for the research project at hand. Secondary data have previously been gathered
by someone other than the researcher and/or for some other purpose than the research project
at hand. In this chapter we discuss secondary data in a form we call packaged information.
After this chapter, much of the remainder of this text is devoted to teaching you how to collect
and analyze primary data.
Big data refers to large amounts of data from multiple sources.
Primary data refer to information that is developed or gathered by the researcher specifi cally for the research project at hand.
Secondary data have previously been gathered by someone other than the researcher and/or for some other purpose than the research project at hand.
M05_BURN3261_08_GE_C05.indd 116M05_BURN3261_08_GE_C05.indd 116 27/08/16 5:52 pm27/08/16 5:52 pm

5-2 PRIMARY VERSUS SECONDARY DATA 117
Big Data Shapes Tennis Tennis has been a bastion of tradition for many centuries. Tra-ditionalists view it as a one-on-one game in which coaches should not be allowed to intervene during a match. The player’s approach and coach’s approach have traditionally been guided by experience rather than data. However, in the last few years, bodies governing the sport of tennis have been re-evaluating this view. They have started adopting data analytics tools by using state-of-the-art equipment to make tennis matches more competitive and the spectator experience more exciting.
Women’s Tennis Association and SAP In 2015, SAP and the Women’s Tennis Association (WTA) revo-lutionized on-court coaching possibilities by giving coaches a tablet that provides real-time data and which can be used to analyze the player’s performance during a live match. The tablets can display real-time data from the offi cial electronic scoring system as well as “Hawk-Eye,” a ball-tracking system that is used in over 80 tennis tournaments worldwide. With this technology in hand, coaches can base their instructions on performance data like serve direction, shot placement, and techniques used by the opponent. Players are allowed to use the data during practice, helping them to further develop their performance and game strategies for future matches.
Wimbledon and IBM The Championships, Wimbledon—the oldest and most pres-tigious Grand Slam tennis tournament in the world—utilizes data analytics in order to increase its fan base and fan com-munity engagement. The IBM SlamTracker provides real-time match statistics and in-depth analysis of the game to the spec-tators. Users around the world can access this on Wimbledon’s offi cial website, where they are provided with real-time match
data in a highly visual and compact style. What also appeals to the fans is that the system provides predictions on how the matches will develop by digging into eight years of Grand Slam’s historical data.
Wimbledon also uses IBM Streams, which is a tool that compares live match data with each player’s previous record at Wimbledon and automatically notifi es the content team of the All England Lawn Tennis and Croquet Club (AELTC), the orga-nizer of the Grand Slam tennis tournament, whenever a new record is set or is about to be set. This allows Wimbledon offi cials to break news faster than ever before, improve the broadcasting content, and drive greater fan engagement. Furthermore, the AELTC’s team monitors social media conversations and tailors the content on its website and social media accordingly in order to improve the experience of its fan base across the world.
MARKETING RESEARCH INSIGHT 5. 1 Practical Application
Wimbledon uses big data to make matches more competitive
and to improve spectator experience.
Sources: Perrotta, T. (2015, August 4). Tennis gets hip to this whole “stats” thing. Wall Street Journal. Retrieved from http://www.wsj.com/articles/tennis-gets-hip-to-this-whole-stats-thing-1438715814; SAP News (2014, October 21). SAP and WTA transform women’s tennis with new on-court coaching technology platform. Retrieved from http://news.sap.com/sap-and-wta-transform-womens-tennis-new-court-coaching-technology-platform/; Tabbitt, S. (2013, October 31). It’s an ace: IBM SlamTracker lights up Wimbledon. The Telegraph. Retrieved from http://www.telegraph.co.uk/sponsored/sport/rugby-trytracker/10410268/slamtracker-wimbledon-tennis.html; IBM (2016, January 11). Wimbledon 2015, Real-time analytics helps share the moments that matter with tennis fans worldwide. Retrieved from http://www-03.ibm.com/software/businesscasestudies/bn/en/corp?synkey=X289813W52111E44; Baldwin, C. (2014, June 17). Wimbledon to analyse social interactions at tennis championship. Computer Weekly. Retrieved from http://www.computerweekly.com/news/2240222797/Wimbledon-to-analyse-social-interactions-during-tennis-championship .
As commercial fi rms, government agencies, or community service organizations conduct
surveys, record transactions, or conduct business activities, they are creating a written record
of these activities. When consumers register their automobiles, interact on social media plat-
forms, make a purchase in a store, or search for a product online, this information is stored. If
the information is made available for other purposes, it becomes secondary data. The sources
of secondary data have grown greatly in recent years.
© d
otsh
ock/
Shu
tter
stoc
k
M05_BURN3261_08_GE_C05.indd 117M05_BURN3261_08_GE_C05.indd 117 30/08/16 4:07 pm30/08/16 4:07 pm

118 CHAPTER 5 • SECONDARY DATA AND PACKAGED INFORMATION
USES OF SECONDARY DATA There are so many uses of secondary data that it is rare for a marketing research project to be
conducted without including some of this information. Certain projects may be based exclu-
sively on secondary data. The applications of secondary data range from predicting broad
changes in a region’s “way of life” to specifi c applications, such as selecting a street address
location for a new car wash. Suggested applications for secondary data include forecasting
economic trends analyzing the competition, choosing international markets to enter, under-
standing consumer concerns during a crisis situation, and many others. Secondary data might
provide marketers with the information about demographics that they need to help forecast
the size of the market in a newly proposed market territory.
A researcher may use secondary data to determine the population and growth rate in
almost any geographical area. Government agencies often use secondary data to guide pub-
lic policy decisions. For example, the Department of Education needs to know how many
fi ve-year-olds will enter the public school system each year. Health care planners need
to know how many senior citizens will be eligible for Medicare during the next decade.
Sometimes secondary data can be used to evaluate market performance. For example, since
gasoline and fuel taxes collected per gallon are available in public records, petroleum mar-
keters can easily determine the volume of fuels consumed in a county, thus making market
share calculations easy and reliable. Articles are written on virtually every topic, and this
storehouse of secondary data is available to marketers who want to understand a topic more
thoroughly.
A wealth of secondary data is available concerning the lifestyles and purchasing habits of
demographic groups. Because the people in these demographic groups tend to make similar
purchases and have similar attitudes, they have been scrutinized by marketers. For example,
one important means of analyzing people is by age. Age groups include the Baby Boomers
(born between 1946 and 1964 4 ), Generation X (born between about 1965 and 1979), and the
Millennials or Generation Y (born between about 1977 and 1994). Born in 1995 or later, those
in Generation Z are already having a large impact on the market, not only through their own
technologically savvy habits but also through their infl uence on their families’ meals, clothes,
and electronic and entertainment purchases. 5 The demographic “grandparents” represents
one-fourth of the U.S. population and spends about $55 billion a year on their grandchildren. 6
Secondary data also may be used to assess how a geographical area is changing. Figure 5. 1
shows the number of inhabitants of Colorado Springs, Colorado, and population changes in
the city from the 2000 Census to the 2010 Census. Notice that, while the population has
increased in all age brackets, the largest increase is in the age group 55–74.
0%0–5 6–19 20–34 35–54 55–74 75+
20,000
40,000
100,000
60,000
120,000
Population by Age: Colorado Springs, Colorado
2000 2010
FIGURE 5. 1 Census Data May Be Used to Assess Changes in Age Distribution for a Market
Source: Created by Ali Russo with data from the 2010 Census.gov website.
M05_BURN3261_08_GE_C05.indd 118M05_BURN3261_08_GE_C05.indd 118 27/08/16 5:52 pm27/08/16 5:52 pm

5-3 CLASSIFICATION OF SECONDARY DATA 119
5- 3 Classifi cation of Secondary Data
INTERNAL SECONDARY DATA Secondary data may be broadly classifi ed as either internal or external. Internal secondary data
are data that have been collected within a fi rm. Such data include sales records, purchase req-
uisitions, invoices, and complaints. Obviously, a good marketing researcher always determines
what internal information is already available. You may recall from Chapter 1 that we referred to
internal data analysis as being part of the internal reports system of a fi rm’s marketing informa-
tion system (MIS). Today a major source of internal data is databases that contain information
on customers, sales, suppliers, and any other facet of business a fi rm may wish to track.
Before we discuss internal and external databases, we should understand that a database
refers to a collection of data and information describing items of interest. 7 Each unit of infor-
mation in a database is called a record . A record could represent a customer, a supplier, a
competitive fi rm, a product, or an individual inventory item, for example. Records are com-
posed of subcomponents of information called fi elds . As an example, a company with a cus-
tomer database would have records representing each customer. Typical fi elds in a customer
database record would include name, address, telephone number, email address, products pur-
chased, dates of purchases, locations where purchased, warranty information, and any other
information the company considered useful.
Internal databases are databases consisting of information gathered by a company,
typically during the normal course of business transactions. Marketing managers normally
develop internal databases about customers, but databases may be kept on any topic of inter-
est, such as products, members of the sales force, inventory, maintenance, and supplier fi rms.
Companies gather information about customers when they inquire about a product or service,
make a purchase, or have a product serviced. Companies use their internal databases for pur-
poses of direct marketing and to strengthen relationships with customers, which is referred to
as customer relationship management (CRM) . 8 Internal databases can be quite large, and dealing with the vast quantities of data they contain
can pose a problem. Data mining is the name for software that helps managers to make sense
out of seemingly senseless masses of information contained in databases. 9 Micromarketing
refers to using a diff erentiated marketing mix for specifi c customer segments, sometimes fi ne-
tuned for the individual shopper. 10 Databases and data mining make micromarketing possible.
An example is the pop-up ad you may see online after searching for a product.
While databases can be quite large and complex, even the simple databases in small busi-
nesses can be invaluable. Kotler and Keller describe fi ve ways that companies use their databases:
1. To identify prospects , such as sorting through replies to company ads to identify
customers who can be targeted with more information
2. To decide which customers should receive a particular off er , such as sending a
cross-selling suggestion two weeks after a sale
3. To deepen customer loyalty by remembering customer preferences and sending
appropriately customized materials refl ecting those preferences
4. To reactivate customer purchases , such as automatically sending out a birthday card
5. To avoid serious customer mistakes , such as charging a fee to one of the fi rm’s larg-
est customers. 11
Databases can tell managers which products are selling, report inventory levels, and pro-
fi le customers by SKU. Coupled with geodemographic information systems (GIS), databases
can provide maps indicating ZIP codes in which the most profi table and least profi table cus-
tomers reside. Internal databases, built with information collected during the normal course of
business, can provide invaluable insights for managers.
What companies do with information collected for their internal databases can present
ethical concerns. Should your credit card company share the information on what types of
Internal secondary data are data that have been collected within a fi rm.
A database refers to a collection of data and information describing items of interest.
Internal databases consist of information gathered by a company, typically during the normal course of business transactions.
Data mining software helps managers make sense out of seemingly senseless masses of information contained in databases.
Micromarketing employs a differentiated marketing mix for specifi c customer segments, sometimes fi ne-tuned for the individual shopper.
M05_BURN3261_08_GE_C05.indd 119M05_BURN3261_08_GE_C05.indd 119 27/08/16 5:52 pm27/08/16 5:52 pm

120 CHAPTER 5 • SECONDARY DATA AND PACKAGED INFORMATION
goods and services you bought with anyone who wants to buy that information? Should your
Internet service provider be able to store information on which Internet sites you visit? As
more consumers have grown aware of these privacy issues, more companies have adopted
privacy policies. 12 Marketing Research Insight 5. 2 illustrates how collecting data on consum-
ers can raise ethical concerns.
EXTERNAL SECONDARY DATA External data are data obtained from outside the fi rm. Knowing where to fi nd information
is a valued skill in the workplace. In the following sections we will introduce some sources
of secondary data, but we barely scratch the surface in terms of introducing you to secondary
data sources that will be benefi cial to you in your career. Take the opportunity you have in
college to develop this skill. Your university librarians can be a great resource. Table 5. 1 lists
Your Supermarket Is Spying on You Tesco, one of the biggest supermarket retailers in the United Kingdom, has a well-developed customer loyalty card—Club-card. Customers can accumulate one point for every pound that they spend; effectively it is a 1% discount. However, these deals are sent to customers in the form of personalized offers based on their previous purchases. Periodically, Tesco offers extra points if customers buy certain brands or product catego-ries. The cards are also used to attract infrequent customers back to the stores.
The value of the card for the supermarket goes far beyo nd rewarding customers. Each time a card is swiped or scanned, it helps the supermarket to collect information about the shop-ping habits of the customer. How do supermarkets analyze transactional behavior and use it to drive sales? The answer is RFV (recency, frequency, and value) analysis. This approach is used to group customers according to scores that are given to each of them on the basis of how often they shop, how many individual items they purchase each time, and how much they spend. This approach to market segmentation provides a framework that helps the supermarket to analyze consumer behavior.
While the reward side of the equation benefi ts the cus-tomer, the other side is all about RFV analysis and using that information to direct marketing efforts towards certain custom-ers at personalized levels. Customers are segmented by age, gender, and other criteria and can be identifi ed by their rela-tionship with certain clusters or types of products that they buy
on a regular basis. This way, someone who buys pasta will be given offers on pasta sauce and, someone who buys a cat litter box will be given offers on cat food.
Shopping preferences are also tracked. The store identifi es customers who pick almost the same basket of goods each time they shop. Some customers might only be attracted to special offers and would buy discounted products in bulk. Another group might only buy luxury brands and never purchase own-label products. Tesco uses this understanding to provide per-sonalized offers and “tempts” each group with relevant mixes of coupons and bonus point deals.
If a customer does not have a loyalty card, the supermarket can still track him or her when a card payment is made. Super-markets, in any case, supplement their own data collection with government data and credit reports. By using this broad range of data, supermarkets are able to make informed decisions and devise workable operational and marketing strategies. The data is used to better understand consumer needs and assist super-markets in deciding store locations, placement of advertise-ments, which brands to offer, and how much to stock.
Tesco is one of a number of marketers who are refi ning their ability to micromarket, targeting each consumer with pro-motional materials customized for them specifi cally. Ostensibly, this could make the customer’s shopping experience better, but are these practices of collecting data about customers without their consent ethical?
Source: Davis, G. (2013, July). Analysis: Loyalty cards—How retailers are using the data. Retail Week. Retrieved from http://www.retail-week.com/sectors/grocery/analysis-loyalty-cards-how-retailers-are-using-the-data/5050868.fullarticle; Hobbs, T. (2015, October 9). Is Tesco clubcard still relevant? Marketing Week. Retrieved from https://www.marketingweek.com/2015/10/09/is-tesco-clubcard-still-relevant/; Ferguson, F. (2013, June 8). How supermarkets get your data—and what they do with it. The Guardian. Retrieved from http://www.theguardian.com/money/2013/jun/08/supermarkets-get-your-data.
MARKETING RESEARCH INSIGHT 5. 2 Practical Application
External data are data obtained from outside the fi rm.
M05_BURN3261_08_GE_C05.indd 120M05_BURN3261_08_GE_C05.indd 120 05/09/16 11:32 AM05/09/16 11:32 AM

5-3 CLASSIFICATION OF SECONDARY DATA 121
TABLE 5. 1 Secondary Information Sources for Marketing
I. Business Source Directories Encyclopedia of Business Information Sources (Gale, Cengage Learning)—Published annually, this resource indexes almost
11,000 sources of business, fi nance, and industrial subjects.
BRASS Business Guides (BRASS, RUSA, American Library Association)—Maintained and updated by business information
professionals at research universities, these online guides provide links and information for sources on an array of business
topics including a list of the Outstanding Business Reference Sources awarded annually by the American Library Association.
Directory of Business Information Sources (Grey House Publishing ) —Published annually and containing almost 24,000
entries, this resource indexes thousands of associations, publications, trade shows, databases, and websites.
II. Articles
ABI/Inform Complete (ProQuest)—Comprehensive collection of other ABI/Inform products (Global, Trade and Industry,
Dateline, and Archive). There are over 2,200 full-text scholarly journals along with thousands of business titles in trade
publications, news outlets, and reports from publishers like Business Monitor International, Economic Intelligence Unit, First
Research, and the Wall Street Journal .
Business Abstracts with Full Text (H.W. Wilson, Ebsco)—Over 450 full-text business publications including many top peer-
reviewed journals.
Business Collection (Gale, Cengage Learning)—Over 2,900 full-text business publications including 390 peer-reviewed
journals, news sources, and reports from publishers like Economic Intelligence Unit and AII Data Processing. There are
also Business Insights products from Gale that include the article content in addition to reports and company and industry
information.
Business Source Complete (Ebsco)—Expansion of Ebsco’s Business Source Premier. Nearly 2,000 full-text scholarly
journals including Harvard Business Review . Also includes trade publications, news outlets, and reports from publishers like
Marketline, Barnes Reports, Bernstein, and CountryWatch.
Factiva (Dow Jones)—Full-text articles from thousands of major news sources including Dow Jones, Reuters, Financial Times ,
Bloomberg, and the Wall Street Journal .
LexisNexis Academic (LexisNexis, Reed Elsevier)—Thousands of news article sources and access to reports from Hoovers,
Business Monitor International, Morningstar, and Standard & Poor’s.
III. Dictionaries and Encyclopedias Brands and Their Companies (Gale, Cengage Learning)—Published annually, this directory provides company, product, and
industry information for active and inactive brands from public and private companies.
Dictionary of Advertising and Marketing Concepts by Arthur Asa Berger (Left Coast Press, 2013)—Over 100 entries and
essays on concepts, theories, and key people in marketing.
A Dictionary of Marketing by Charles Doyle (Oxford University Press, 2011)—Over 2,600 entries on modern and historic
marketing concepts along with appendixes, notably including a time line of marketing.
Encyclopedia of Global Brands, 2nd Ed . (St. James Press, 2013)—Update of the Encyclopedia of Consumer Brands (St.
James Press, 2005) with 269 entries on major global brands including an overview of each brand’s history, performance, key
competitors, industry analysis, and prospects.
Encyclopedia of Major Marketing Strategies (Gale, Cengage Learning, 2013)—This third volume is the continuation of the
Encyclopedia of Major Marketing Campaigns series and contains detailed entries for 100 marketing campaigns in the early
2010s.
Wiley International Encyclopedia of Marketing (Wiley, 2011)—This six-volume set contains 360 entries in the areas of
marketing strategy, marketing research, consumer behavior, advertising and integrated communication, product innovation and
management, and international marketing.
IV. Marketing Directories Advertising Redbooks (Red Books, LLC)—Formerly published as the Advertising Redbooks series, this database provides
a directory by company or agency of advertising campaigns, including budgets by media type. There is also a live listing of
marketing job prospects, movement of key people in the industry, and campaigns available for bid.
Complete Television, Radio & Cable Industry Directory (Grey House Publishing)—This annual directory, formerly published
as the Broadcasting and Cable Yearbook (ProQuest), has entries on television, cable, and radio outlets in the United States and
Canada along with rankings of top markets and programs.
(continues)
M05_BURN3261_08_GE_C05.indd 121M05_BURN3261_08_GE_C05.indd 121 27/08/16 5:52 pm27/08/16 5:52 pm

122 CHAPTER 5 • SECONDARY DATA AND PACKAGED INFORMATION
TABLE 5. 1 Secondary Information Sources for Marketing
GreenBook (New York AMA Communication Services, Inc.)—An online directory of marketing research companies.
Advertising & Branding Industry Market Research (Plunkett)—Published as an annual almanac and available in print, ebook,
or online, this source contains an industry analysis and profi le of about 400 top companies in advertising.
Standard Rate and Data Service (Kantar Media SRDS)—This database is a directory of outlets for digital media, consumer
and business magazines, direct marketing, newspapers, radios, and TV and cable. Local outlets are searchable by DMA.
Entries include pricing, consumer analysis, and circulation. An additional section, Local Market Audience Analyst, contains
Experian Simmons lifestyle and Nielson PRIZM segment information by DMA.
V. Statistics and Reports
American Consumers Series (New Strategist Press)—A series of books with in-depth consumer spending, demographic, and
lifestyle statistical analysis.
DemographicsNow (Gale, Cengage Learning)—Allows for tabular and GIS mapping of demographic, consumer expenditure,
Experian Simmons consumer study, and Experian Mosaic lifestyle segmentation data. Additionally includes a directory for
people with income and household value information, a directory of small businesses with revenue, asset, and employment
data, and business site prospecting statistical tools.
eMarketer (eMarketer)—Research on online marketing trends and emerging technology. Free daily newsletter provides
highlights from recent reports.
LexisNexis Academic (LexisNexis, Reed Elsevier)—Company Dossier search has a directory of public and private companies
including small businesses with employment, revenue, and asset data. The database also indexes thousands of domestic and
foreign news sources.
Market Share Reporter (Gale)—Published annually, this report aggregates market share data and revenue fi gures for brands,
companies, and services from industry sources.
Mediamark MRI + (GFK Mediamark Research and Intelligence)—This survey of 25,000 U.S. households gives indexes for
consumer demographics, brand decisions, media use, and lifestyle behaviors.
Mintel Reports (Mintel Group)—Market research reports by industry published periodically and available for the United States
and globally. Additional reports include demographic segment analysis and reports on cultural trends.
Nielson (Nielson Company)—Measures consumer media use and purchasing decisions on an individual level. PRIZM,
P$YCLE, and ConneXions segmentation splits customers into target groups and details consumer and lifestyle decisions,
fi nancial behavior, and technology use typical of the group. Data available on a global level.
Passport GMID (Euromonitor International)—Formerly the Global Market Information Database, this source provides
industry, consumer, and company trend and market share analysis available globally.
Reference USA (Infogroup)—Directory of businesses, including small businesses, and people and households with income,
household value, and lifestyle information.
Simmons OneView (Experian)—Formerly Choices3, this database provides full access to Simmons consumer survey data
covering lifestyle, media habits, and category and brand choices.
Simply Map (Geographic Research, Inc.)—Statistical mapping tool with offi cial data. Add-ons include D&B company
databases, Experian Simmons, Nielson, EASI, and Mediamark MRI data.
Statista (Statista)—Private and offi cial statistics available in general-interest areas with a strong focus on company and industry
sources. Statistics searchable as individual tables as well as collections of topical reports. Data available on domestic and
global levels.
Courtesy of LuMarie Guth, Business Librarian, Western Michigan University.
(continued)
many of the major sources that are most useful in marketing research. Most of these resources
are online, although some are also available in print. Your university library may provide
access to many of these sources.
The following sections introduce three sources of external data: (1) published sources ,
(2) offi cial data , and (3) data aggregators.
Published Sources Published sources are those sources of information that are prepared
for public distribution and are normally found in libraries and online. Trade and professional
Three sources of external data are (1) published sources , (2) offi cial data , and (3) data aggregators.
M05_BURN3261_08_GE_C05.indd 122M05_BURN3261_08_GE_C05.indd 122 27/08/16 5:52 pm27/08/16 5:52 pm

5-3 CLASSIFICATION OF SECONDARY DATA 123
associations publish information to meet the needs of specifi c industries, such as the food
industry (e.g., the National Grocer’s Association [NGA]) and the professional cleaning indus-
try (e.g., the Worldwide Cleaning Industry Association [ISSA]). As detailed in Chapter 2 , the
marketing research industry has a number of associations that regularly print periodicals and
annual reports, including Quirk’s, ESOMAR, and GreenBook . A number of business jour-
nals, magazines, and newspapers, such as the Wall Street Journal , the Economist , Bloomberg Businessweek , Fortune , and Forbes , are available online, in libraries, and in stores. Academic
journals, including the Journal of Marketing Research , the Journal of Business Research ,
the Journal of International Business , the Journal of Consumer Research , and the Journal of Macromarketing , publish evidence-based research studies related to marketing. Books with
helpful information related to best practices in the research industry are published frequently.
Many marketing research fi rms publish secondary information in the form of books, newslet-
ters, white papers, special reports, magazines, or journals. Marketing research fi rms may post
white papers on many topics on their websites. For example, see www.burke.com and under
the “About” tab go to “Literature Library” to see reports on topics such as industry trends and
best practices in research methodology.
Offi cial Statistics Offi cial statistics contain information published by public organiza-
tions, including government institutions and international organizations. Offi cial statistics are
both qualitative and quantitative and include information related to demographics, economic
development, education, consumption patterns, health, education, the environment, and many
other topics. Many international organizations off er statistics for free online, including the
World Health Organization (WHO), the Organization for Economic Co-operation and Devel-
opment (OECD), the World Bank, and the International Monetary Fund. Almost every coun-
try in the world gathers offi cial statistics, generally using rigorous methods, and most make
them available to the public. As one example, the National Bureau of Statistics of China pub-
lishes nationwide data annually on numerous topics, such as basic demographics by county
and city, education levels, access to water, appliance penetration, and many other factors.
China’s national statistics are available online for every year since 1996 in both Chinese and
English ( www.stats.gov.cn ).
Since the passage of the Open Data Policy in 2013, the United States, by federal law,
makes all data collected by the government “open by default,” except for personal informa-
tion or data related to national security. The website www.data.gov includes almost 200,000
datasets from 170 organizations. Free public data have been organized or merged to produce
profi table companies (e.g., Garmin and Zillow) and apps (e.g., Citymapper). 13
Published sources are those sources of information that are prepared for public distribution by trade associations, professional organizations, companies, and other entities and can be found in libraries and online.
The U.S. Open Data Policy makes all data collected by the government “open by default,” except for personal information or data related to national security.
Active Learning
Use data.gov to Explore U.S. Official Statistics
Investigate all the free data that are collected by U.S. government agencies and now are avail-able by law due to the U.S. Open Data Policy. Go to www.data.gov . The website states on its opening page: “Here you will find data, tools, and resources to conduct research, develop web and mobile applications, design data visualizations, and more.” 14 Note the number of topics represented, including agriculture, business, consumer, manufacturing, and many oth-ers. Click on “consumer” and then “apps.” You will see the many apps that have been devel-oped using these freely available data. Type “family” in the search box and note the many available datasets related to “family.” This is just a small representation of the large number and wide variety of datasets available. Although these data are in and of themselves interest-ing, the main challenge for marketing professionals is to seek out relationships among these data that provide new insights.
Offi cial statistics are information published by public organizations, including governments and international organizations.
M05_BURN3261_08_GE_C05.indd 123M05_BURN3261_08_GE_C05.indd 123 27/08/16 5:52 pm27/08/16 5:52 pm

124 CHAPTER 5 • SECONDARY DATA AND PACKAGED INFORMATION
In a later section, we will provide a more in-depth introduction to one source of U.S. offi -
cial statistics, the American Community Survey. We have chosen the American Community
Survey because it is an excellent example of the rich resources of information that are avail-
able online for free.
Data Aggregators Data aggregators are services or vendors that organize and package
information on focused topics. Some of these services are available free of charge, but most
are available from commercial sources. Examples of these services are IBISWorld, Factiva,
Ebsco, and ProQuest. Business databases make up a signifi cant proportion of these services.
Most of the data sources in Table 5. 1 could be called data aggregators. Your university library
probably provides you with free access to many data aggregators.
5- 4 Advantages and Disadvantages of Secondary Data
ADVANTAGES OF SECONDARY DATA The advantages of secondary data are, for the most part, readily apparent. There are fi ve main
advantages of using secondary data: (1) Secondary data can be obtained quickly; (2) com-
pared to collecting primary data, secondary data are inexpensive; (3) for almost any applica-
tion, some secondary data are readily available; (4) secondary data may enhance primary data
by providing a current look at issues, trends, yardsticks of performance, and so on that may
aff ect the type of primary data that should be collected; and (5) secondary data may be all that
are needed to achieve the research objective. For example, a supermarket chain marketing
manager wants to allocate TV ad dollars to the 12 markets in which the chain owns super-
markets. A quick review of secondary data shows that retail sales of food are available by TV
market area. Allocating the TV budget based on the percentage of food sales in a given market
would be an excellent way to solve the manager’s problem and satisfy the research objective.
DISADVANTAGES OF SECONDARY DATA Although the advantages of secondary data almost always justify a search of this informa-
tion, there are caveats associated with secondary data. Five of the problems associated with
secondary data include incompatible reporting units, mismatch of the units of measurement,
diff ering defi nitions used to classify the data, timeliness of the secondary data, and lack of
information needed to assess the credibility of the data reported. These problems exist because
secondary data have not been collected specifi cally to address the problem at hand but have
been collected for some other purpose.
Incompatible Reporting Units Secondary data are provided in reporting units, such as,
in the case of area units, county, city, metro area, state, region, ZIP code, and other statisti-
cal areas. A researcher’s use of secondary data often depends on whether the reporting unit
matches the researcher’s need. For example, a researcher wishing to evaluate market areas for
the purpose of consideration for expansion may be pleased with data reported at the county
level. A great deal of secondary data is available at the county level. But what if another
marketer wishes to evaluate a two-mile area around a street address that is proposed as a site
location for a retail store? County data would hardly be adequate. Another marketer wishes to
know the demographic makeup of each ZIP code in a major city in order to determine which
ZIP codes to target for a direct-mail campaign. Again, county data would be inappropriate.
Although inappropriate reporting units are often problems in using secondary data, more and
more data are available today in multiple reporting units, such as data at the more refi ned
ZIP + 4 level.
Mismatched Measurement Units Sometimes secondary data are reported in measure-
ment units that do not match the measurement unit the researcher needs. For example, a
Data aggregators are services or vendors that organize and package information on focused topics.
The advantages of secondary data are that secondary data can be obtained quickly and inexpensively, are usually available, enhance primary data collection, and can sometimes achieve the research objective.
For more information about the Open Data Policy, go to
www.youtube.com and enter “Open Data Changes Lives.”
M05_BURN3261_08_GE_C05.indd 124M05_BURN3261_08_GE_C05.indd 124 27/08/16 5:52 pm27/08/16 5:52 pm

5-5 EVALUATING SECONDARY DATA 125
researcher may wish to compare the average income of households in urban areas in Turkey
and China. If income is reported in one nation as annual income after taxes and in the other
nation as monthly income before taxes, household income will be very diffi cult to compare.
Unusable Class Defi nitions The class defi nitions of the reported data may not be usable
to a researcher. Secondary data are often reported by breaking a variable into diff erent classes
and reporting the frequency of occurrence in each class. For example, suppose a source of
secondary data reports the variable of household income in three classes. The fi rst class
reports the percentage of households with income from $20,000 to $34,999, and the third
class reports the percentage of households with incomes of $50,000 and over. For most stud-
ies, these classifi cations are applicable. However, imagine you are a manufacturer of high-end
plumbing fi xtures looking to expand the number of distributorships. You have learned that
your dealers are most successful in geographical areas with average household incomes above
$80,000. You need another source of information since the available source of secondary data
only reports household incomes of $50,000 and over. What would a researcher do in this situ-
ation? Typically, if you keep looking, you can fi nd what you need. There may be other sources
of secondary data in other categories.
Outdated Data Sometimes a marketing researcher will fi nd information reported with the
desired unit of measurement and the proper classifi cations; however, the data may be outdated
and no longer reliable. Some secondary data are published only once. However, even for sec-
ondary data published at regular intervals, the time that has passed since the last publication
can be a problem when applying the data to a current problem. The researcher must assess the
usefulness of the available data.
5- 5 Evaluating Secondary Data The advice that you can’t believe everything you read holds true for marketing research. You
must carefully assess the quality and validity of secondary data in deciding whether to use it
as a basis for making decisions. Caution is especially in order with Internet sources because
few quality standards are applied to most Internet sites. To determine the reliability of second-
ary information, marketing researchers must evaluate it. If the information is not available
to examine the reliability of the data, the source cannot be trusted. Trustworthy sources will
almost always have comprehensive details related to the methods used to collect their data.
The following sections off er fi ve questions that are useful in evaluating secondary data.
WHAT WAS THE PURPOSE OF THE STUDY? Studies are conducted for a purpose, and sometimes readers do not know the true purpose.
Some studies are conducted to “prove” some position or to advance the special interest of
those conducting the study. In the 1980s environmentalists became concerned over the grow-
ing mountains of disposable plastic diapers that had all but replaced cloth diapers. More than
a dozen state legislatures were considering various bans, taxes, and even warning labels on
disposable diapers. Then “research studies” were produced whose “purpose” was to evaluate
the environmental eff ects of disposable versus cloth diapers. The “new” research purported
to “prove” that cloth diapers, by adding detergent by-products to the water table, were more
harmful to the environment than the ever-lasting plastic disposables. Soon after several of
these studies were made available to legislators, the movement against disposables was dead.
However, further scrutiny might have called these fi ndings into question. Procter & Gamble,
which owned the lion’s share of the market for disposable diapers, commissioned the consult-
ing fi rm of Arthur D. Little, Inc., to conduct one of the studies. Another study that favored
disposables was conducted by Franklin Associates, whose research showed disposables were
not any more harmful than cloth diapers. But who sponsored this study? The American Paper
Five of the problems associated with secondary data include incompatible reporting units, mismatch of the units of measurement, differing defi nitions used to classify the data, timeliness of the secondary data, and lack of information needed to assess data credibility.
M05_BURN3261_08_GE_C05.indd 125M05_BURN3261_08_GE_C05.indd 125 27/08/16 5:52 pm27/08/16 5:52 pm

126 CHAPTER 5 • SECONDARY DATA AND PACKAGED INFORMATION
Institute, an organization with major interests in disposable diapers. Not all “scientifi c” stud-
ies touted in this debate supported the use of disposable diapers. A 1988 study characterized
disposable diapers as “garbage” contributing to massive buildups of waste that were all but
impervious to deterioration. Who sponsored this study? The cloth diaper industry! 15
Another example of the need to consider the source of data involves a “study” reported
by the news media citing the terrible condition of roads and bridges in the United States. Who
sponsored the study? An organization representing road and bridge construction companies.
It may well be that the study was objective and accurate. However, users of secondary infor-
mation should be well aware of the true purpose of the study and evaluate the information
accordingly.
WHO COLLECTED THE INFORMATION? Even when you are convinced that there is no bias in the purpose of the study, you should
question the competence of the organization that collected the information. Organizations
diff er in terms of the resources they command and their quality control. How can you evalu-
ate the competency of the organization that collected the data? First, ask others who have
more experience in a given industry. Typically, credible organizations are well known in those
industries for which they conduct studies. Second, examine the report itself. Competent fi rms
almost always provide carefully written and detailed explanations of the procedures and meth-
ods used in collecting the information cited in the report. Third, contact previous clients of
the fi rm. Have they been satisfi ed with the quality of the work performed by the organization?
Be wary of using information just because it is available on the Internet. The “informa-
tion superhighway” is a rich source of all sorts of information but, as we have noted previ-
ously, the objectivity and reliability of all these data are not guaranteed. An emerging trend is
the crowdsourcing of data. For example, one interesting application of crowdsourcing is the
collection of geographic data, as highlighted in Marketing Research Insight 5. 3 . Although
crowdsourcing can actually improve the quality of some types of data, in other cases crowd-
sourced data can be unreliable. Again, always check carefully what methods were used to
collect data.
WHAT INFORMATION WAS COLLECTED? Many studies are available on topics such as economic impact, market potential, and feasibil-
ity. But what exactly was measured in these studies that constitute impact, potential, or fea-
sibility? Studies may claim to provide information on a specifi c subject but, in fact, measure
something quite diff erent. Consider the example of two studies off ering diff ering results on
the number of businesses in each county as a basis for projecting sales for a B2B service. A
key question in evaluating the diff ering data was how the number of businesses was measured.
In one report, each existing business location counted as a business, resulting in a high count,
as one business may have had a dozen distribution outlets. Another report counted only the
business and not its outlets. This resulted in a low count of “number of businesses.” Is this
distinction important? It may or may not be, depending on how the study’s user intends to use
the information. B2B service providers would need to assess if their service could be sold to
each individual distribution outlet or only to the parent company. The important point is that
users should discover exactly what information was collected!
HOW WAS THE INFORMATION OBTAINED? You should be aware of the methods used to obtain information reported in secondary sources.
What was the sample? How large was the sample? What was the response rate? Was the infor-
mation validated? As you will learn throughout this book , there are many alternative ways of
collecting primary data, and each may have an impact on the information collected. Remem-
ber that, even though you are evaluating secondary data, this information was gathered as
M05_BURN3261_08_GE_C05.indd 126M05_BURN3261_08_GE_C05.indd 126 27/08/16 5:52 pm27/08/16 5:52 pm

5-5 EVALUATING SECONDARY DATA 127
Crowdsourcing Geographic Knowledge Crowdsourcing is a business model in which products or ser-vices are developed by soliciting contributions from a large group of people rather than from traditional employees or sup-pliers. Crowdsourcing typically integrates the efforts of many self-identifi ed volunteers or part-time workers. Each contribu-tor, acting on his or her own initiative, contributes to a small piece that can be synthesized into a larger whole to achieve a greater result.
Crowdsourcing is different from outsourcing in that a task is accomplished by an undefi ned public rather than being com-missioned from a specifi c, named group or an established busi-ness supply chain. Compared to the traditional business model, signifi cant changes, such as reduced costs, accelerated speed, unexpected/surprising innovations, more fl exibility/scalability, and enhanced diversity/public participation, have been docu-mented using crowdsourcing. There is also a general consensus among marketing researchers that crowdsourcing is an effec-tive marketing tool because consumers are much more prone to use certain products or services when they are involved in the development of those products or services.
One interesting area for the application of crowdsourcing is the production of geographic knowledge via volunteered geo-graphic information (VGI). VGI refers to geographic information acquired and made available to others through the voluntary activity of individuals or groups with the intent of providing information about the geographic world. The growth of VGI in the past 10 years is a result of several related technologi-cal advances and scientifi c practices, such as web 2.0, geoweb, spatial media, neogeography, citizen science, crowdsourcing, and open science.
VGI can be used to augment existing geospatial databases of various kinds. The OpenStreetMap (OSM) is perhaps the best example of geospatial framework data collected by volunteers. OSM is a collaborative global effort to produce a detailed, full-coverage digital map of the world’s road networks (and some other features) through voluntary effort. Volunteers use global positioning systems (GPS) and satellite imagery to capture the locations of transportation infrastructure and topographic features. Once compiled, these data are available to the pub-lic as maps that can be viewed online and downloaded. The open access to these data stands in stark contrast to the lim-ited accessibility and high costs of geographic data from many national mapping agencies and corporations.
The OSM data production approach has proved to be valu-able. For instance, OSM volunteers leapt into action in the
aftermath of the earthquake in Haiti to create the maps and digital geographic information needed to plan the response and recovery. Informal gatherings of volunteers were held in many places, at which digital geographic information was compiled from available online sources. Within days a detailed, open, free digital map was available that was quickly adopted by relief agencies.
One of the most exciting aspects of VGI is the ability to pro-duce data on any theme or phenomena of interest, including information that has not previously been recorded. An emerg-ing source of VGI may exist due to the increasing popularity of Apple iHealth, Google Fit, Jawbone UP, and other products that produce personal health data (such as heart rate, calories, and weight) that are geo-tagged. Although these types of data are private, they could become a gold mine for health-related research if consumers are willing to forgo privacy concerns to share their personal data.
—Courtesy of Dr. Daniel Sui
About Daniel Sui Dr. Daniel Sui is an Arts and Sciences Distinguished Profes-sor and Professor of Geography at the Ohio State University. Dr. Sui’s 2012 book Crowdsourcing Geographic Knowledge: Volunteered Geographic Information in Theory and Practice (co-edited with Sarah Elwood and Michael Goodchild) provides a comprehensive overview of the phenomenon of VGI.
MARKETING RESEARCH INSIGHT 5. 3 Digital Marketing Research
Dr. Daniel Sui, Arts and Sciences Distinguished Professor and
Professor of Geography at the Ohio State University.
M05_BURN3261_08_GE_C05.indd 127M05_BURN3261_08_GE_C05.indd 127 27/08/16 5:52 pm27/08/16 5:52 pm

128 CHAPTER 5 • SECONDARY DATA AND PACKAGED INFORMATION
primary data by some organization. Therefore, the alternative ways of gathering the data had
an impact on the nature and quality of the data. It is not always easy to fi nd out how the sec-
ondary data were gathered. However, as noted previously, most reputable organizations that
provide secondary data also provide detailed information on their data collection methods.
HOW CONSISTENT IS THE INFORMATION WITH OTHER INFORMATION? In some cases, the same secondary data are reported by multiple independent organizations,
which provides an excellent way to evaluate secondary data sources. Ideally, if two or more
independent organizations report the same data, you can have greater confi dence in the valid-
ity and reliability of the data. Demographic data for metropolitan areas (MAs), counties, and
most municipalities are widely available from more than one source. If you are evaluating a
survey that is supposedly representative of a given geographic area, you may want to compare
the characteristics of the sample of the survey with the demographic data available on the
population. If you know that, based on U.S. census data, a city’s population is 45% male and
55% female and a survey that is supposed to be representative of that city reports a sample of
46% males and 54% females, then you can be more confi dent in the survey data.
It is rare that two organizations will report exactly the same results. In assessing diff er-
ing data, the magnitude of the diff erences is a good place to start. If all independent sources
report very large diff erences of the same variable, then you may not have much confi dence in
any of the data. You should look carefully at what information was collected and how it was
collected for each reporting source.
5- 6 The American Community Survey As an example of offi cial statistics that are available for free, we will take a closer look at the
American Community Survey (ACS), an off shoot of the American Census. The administra-
tion of the census of the U.S. population began in 1790. Prior to 1940, all U.S. residents had
to answer all the questions the census used. In 1940, the long form—a longer questionnaire
that goes out to only a sample of respondents—was introduced as a way to collect more data
more rapidly and without increasing the burden of all respondents. By 2000, the long form
went to one in six housing units. As a result, much of the census data are based on statistical
sampling. 16
The 2010 U.S. Census departed from tradition and only collected data using the short
form. This was done in an eff ort to get more accurate counts, and we now know that the
2010 Census was very accurate. 17 The short form asks only for name, sex, age, date of birth,
race, ethnicity, relationship, and housing tenure. Data from the long form are still needed
but are now collected through the American Community Survey . For many years the census
has been the backbone of secondary data in the United States. Marketers use the informa-
tion in many ways, and marketing research fi rms have developed many products to aid in
the use of census data. You can learn more about the 2010 Census at the offi cial website:
http://2010.census.gov .
The American Community Survey (ACS) may represent the most signifi cant change
in the availability of secondary data to be used for marketing research purposes in several
decades. The U.S. Census Bureau created the ACS in 1996 to collect economic, social, demo-
graphic, and housing information as part of the Decennial Census Program. The survey is
designed to help update Decennial Census data by collecting information on a small per-
centage of the population in all counties, American Indian Areas, Alaska Native Areas, and
Hawaiian Home Lands on a rotating basis using a sample. The main advantage is that the ACS
provides data annually instead of once every 10 years. Since these data have the U.S. Census
Bureau’s “high marks” for reliable data and will be current, the ACS is a major secondary data
resource for marketing researchers.
M05_BURN3261_08_GE_C05.indd 128M05_BURN3261_08_GE_C05.indd 128 27/08/16 5:52 pm27/08/16 5:52 pm

5-7 WHAT IS PACKAGED INFORMATION? 129
In addition to providing new data each year, the ACS off ers a measure of accuracy of the
yearly estimates. To do this, the ACS relies on a sampling plan that involves surveying about
3 million Americans every year. Because a sample is used, data are reported with a margin of
error, which is an estimate of the accuracy of the data. (You will learn about margin of error
in Chapter 10 .) For an example of how to use the ACS, see Marketing Research Insight 5. 4 .
5- 7 What Is Packaged Information? We are now ready to turn to a special form of secondary data. Packaged information is a
type of secondary data in which the data collected and/or the process of collecting the data are
prepackaged for all users. There are two broad classes of packaged information: syndicated
data and packaged services.
SYNDICATED DATA Syndicated data are a form of external secondary data that are supplied from a common
database to subscribers for a service fee. Syndicated data are collected in a standard format
and made available to all subscribers. Such information is typically detailed information that
is valuable to fi rms in a given industry and is not available in libraries. Firms supplying syn-
dicated data follow standard research formats that enable them to collect the same data over
time. These fi rms provide specialized routine information needed by a given industry in the
form of ready-to-use packaged data to subscribing fi rms.
As an example of syndicated data, Marketing Evaluations, Inc., off ers several Q Scores
services. The Q Score is the measure of the familiarity and appeal of performers in categories
The 2010 U.S. Census departed from tradition and collected a limited amount of data using a
short form.
Packaged information is a type of secondary data in which the data collected and/or the process of collecting the data are prepackaged for all users.
Two broad classes of packaged information are syndicated data and packaged services.
Syndicated data are a form of external data that are supplied from a common database to subscribers for a service fee.
© S
usan
Mon
tgom
ery/
Shu
tter
stoc
k
M05_BURN3261_08_GE_C05.indd 129M05_BURN3261_08_GE_C05.indd 129 27/08/16 5:52 pm27/08/16 5:52 pm

130 CHAPTER 5 • SECONDARY DATA AND PACKAGED INFORMATION
Using the American Community Survey The purpose of this exercise is to introduce the American Com-munity Survey (ACS) and the American Factfi nder, which is the tool used for searching data collected by the ACS.
Global Motors is considering adding a car model to its product mix that will be totally electric. Buyers will never have to buy gasoline. The cost to operate this vehicle will be about $0.02 per mile versus about $0.12 per mile for a gasoline vehi-cle. Global knows some manufacturers have an all-electric car, such as the Nissan Leaf. However, designers and managers at Global Motors believe they can gain a competitive advantage over these vehicles by building a car surface made of solar pan-els. Unlike other competitive vehicles that charge only when plugged into an electrical outlet, a car with a solar panel “skin” can absorb additional energy as long as the sun is out. This innovation is signifi cant for another reason: If electric car own-ers charge their vehicles with electricity from a coal-powered electric plant (which powers the dominant percentage of U.S. power plants), the greenhouse gas emissions are still 0.8 pound per mile driven. While this is better than the 1 pound per mile for gasoline-powered emissions, it means the gas-free vehicles are far from “emission free.” 18 A solar panel skin would help reduce the gas emissions, and the Global car would not only have greater range but also come closer to being a truly emission-free vehicle. However, the range of electric cars is still a major concern even with the ability of a constant charge using the solar panels. While the solar panels will help, they cannot keep up with the energy needed to propel the car even on a very sunny day. It is estimated that the range of this new car will
be 125 miles, an improvement over other purely electric cars with a range of 60 to 100 miles.
Before proceeding with design, Global managers want to know if this car can be used for the bulk of commuter travel to and from work each day and still have suffi cient range to run errands. If the majority of workers commute under 30 minutes each way, then the new car would have adequate range to get owners to and from work and run a few errands. Before going further with the concept of the new vehicle, secondary data may be assessed to answer the question, “What is the mean travel time, one way, for Americans to travel to work?” By retrieving ACS data via American Factfi nder, managers quickly learn that the average time, in minutes, driven by Americans to work is 25.3. This is suffi cient for them to continue with devel-opment plans for the new car.
After several months of concept testing using focus groups, a prototype vehicle is developed. The prototype meets all engi-neering and design expectations. Cost estimates for full-scale production put the cost of the car above a typical compact sedan, but the major selling point is that this price tag would be offset by reduced operating costs. Global would like to test-market 20 vehicles in a metropolitan statistical area (MSA) selected based, in part, on the percentage of the MSA’s popu-lation that commutes less than 30 minutes. You can conduct this research yourself by using the following steps to access ACS data to evaluate the MSA of Jacksonville, Florida, on this criterion.
1. Go to www.census.gov and select the “Data” menu. 2. From the “Data Tools and Apps” menu, select American
Factfi nder and then “Advanced Search.” 3. Select “Show Me All” and then “Topics.” 4. In the dialog box that appears, select “People,” then
“Employment,” and then “Commuting (journey to work).” It should appear as one of “Your Selections.”
5. To select the Jacksonville, Florida, MSA, go to “Geographies” and select Metro/Micro statistical areas and scroll down until you fi nd Jacksonville, Florida. Select “Jacksonville” and then “Add to Your Selection.” Once you add this geography, close the dialog box and view the tables. Again, you will notice that you have several available to you.
6. Select the top table and fi nd information about the “Travel Time to Work.” Does Jacksonville, Florida, qualify for the test market based on this criterion?
MARKETING RESEARCH INSIGHT 5. 4 Practical Application
The ACS provides data on commuting times for Americans.
© C
hris
tian
Del
bert
/Shu
tter
stoc
k
M05_BURN3261_08_GE_C05.indd 130M05_BURN3261_08_GE_C05.indd 130 27/08/16 5:52 pm27/08/16 5:52 pm

5-7 WHAT IS PACKAGED INFORMATION? 131
such as actors, actresses, authors, athletes, and sportscasters. This information is used by
companies to help them choose the most appropriate spokesperson for their company and by
producers for casting television shows and movies. Performer Q is the service for ratings of
approximately 1,800 performers. Data are available by demographic groups, and the company
off ers trends for many more personalities going back to 1964. 19 Meryl Streep and Tom Hanks,
for example, are performers who maintain high Q Scores . The company even maintains rat-
ings of deceased performers called Dead Q. 20 Data for performers studied are the same and
are bought as a package by subscribers who typically include advertisers, TV and movie pro-
duction companies, licensing companies, and talent and public relations companies. Data are
collected two times a year for all performers based on a sample of nearly 2,000 persons. The
Marketing Evaluations, Inc., site at www.qscores.com has information about the diff erent Q
Score studies that are available.
Another example of syndicated data is the Nielsen Ratings service, which measures TV
audience size and viewer demographics for TV programs. 21 This information is packaged and
made available to subscribers who typically include advertisers, ad agencies, TV production
companies, networks, and cable companies. Nielsen’s website, at www.nielsen.com , posts
free, up-to-date Top 10 lists of TV programs, as well as other products, such as books, music,
and video games.
As another example, Nielsen Audio (formerly Arbitron) supplies syndicated data on the
number and types of listeners to the various radio stations in each radio market. This package
of information helps advertising fi rms reach their target markets; it also helps radio stations
defi ne audience characteristics by providing an objective, independent measure of the size
and characteristics of their audiences. With syndicated data, both the process of collecting and
analyzing the data and the data themselves are not varied for the client. 22 Each subscriber buys
the same “book” for each radio market.
PACKAGED SERVICES The term packaged services refers to a prepackaged marketing research process that is used
to generate information for a particular user. Unlike syndicated data, the data from a packaged
service will diff er for each client. Packaged services rarely provide clients with the same data.
Rather, it is the process they are marketing. For example, a packaged service may measure
customer satisfaction. Instead of a client fi rm trying to “reinvent the wheel” by developing its
own process for measuring customer satisfaction, it may elect to use a packaged service to
accomplish this aim. This is also true for several other marketing research services, such as
test marketing, naming new brands, pricing a new product, or using mystery shoppers.
Esri’s Tapestry Segmentation is such a service that uses a ready-made, prepackaged pro-
cess to profi le residential neighborhoods. This information is purchased by clients with the
aim of better understanding who their customers are, where they are located, how to fi nd
them, and how to reach them. While the data will diff er for each client, Esri’s process for
generating the data is the same for all clients. 23
Packaged services refers to a prepackaged marketing research process that is used to generate information for a particular user.
Active Learning
Use Esri’s Tapestry Segmentation to Learn About Your Neighborhood
Go to www.esri.com and click on the link to Products. Under “See All Products,” you will find “Products A-Z.” There you will find the website for the Tapestry Segmentation program, which has categorized every ZIP code according to the prevalence of one or more of the 65 different consumer types. Find out about your neighborhood by entering your own ZIP code. Does the description fit your perceptions of the types of people in your neighborhood?
M05_BURN3261_08_GE_C05.indd 131M05_BURN3261_08_GE_C05.indd 131 27/08/16 5:52 pm27/08/16 5:52 pm

132 CHAPTER 5 • SECONDARY DATA AND PACKAGED INFORMATION
5- 8 Advantages and Disadvantages of Packaged Information
SYNDICATED DATA One of the key advantages of syndicated data is shared costs . Many client fi rms may subscribe
to the information; thus, the cost of the service is greatly reduced to any one subscriber fi rm.
Second, because syndicated data fi rms specialize in the collection of standard data and because
their long-term viability depends on the validity of the data, the quality of the data collected is
typically very high. One fi nal advantage of syndicated data is that the information is normally
disseminated very quickly to subscribers; the more current the data, the greater their usefulness.
A primary disadvantage of syndicated data is that buyers have little control over what
information is collected. Are the units of measurement correct? Are the geographical reporting
units appropriate? A second disadvantage is that buyer fi rms often must commit to long-term
contracts when buying syndicated data. Finally, there is no strategic information advantage
in purchasing syndicated data because all competitors have access to the same information.
However, in many industries, fi rms would suff er a serious strategic disadvantage by not pur-
chasing the information. In addition, how well a fi rm uses information is as important as what
information a fi rm can access.
PACKAGED SERVICES The key advantage of using a packaged service is taking advantage of the experience of the
research fi rm off ering the service. Imagine a fi rm setting out to conduct a test market for the
very fi rst time. It would take the fi rm several months to gain the confi dence needed to conduct
the test market properly. Taking advantage of others’ experiences with the process is a good
way to minimize potential mistakes in carrying out the research process. When a fi rm off ers a
packaged service, it has spent a great deal of time and eff ort in ensuring the process eff ectively
delivers the information needed. In other words, it has worked out all the “bugs.” A second
advantage is the reduced cost of the research. Because the supplier fi rm conducts the service
for many clients on a regular basis, the procedure is effi cient and far less costly than if the
buyer fi rm tried to conduct the service itself. A third advantage is the speed of the research
service. The effi ciency gained by conducting the service over and over translates into reduced
turnaround time from start to fi nish of a research project. A fourth advantage is the ability to
obtain benchmarks for comparison. A fi rm that off ers a packaged service can use its experi-
ence to provide measures obtained from previous research to allow direct comparisons and
make sense of results. For example, Nielsen BASES, a product concept testing service, claims
that its 35+ years of experience involving 200,000 product concepts allows the fi rm to predict
the probability of launching a new product successfully very accurately. These are all reasons
why client fi rms are interested in packaged services, and because of these advantages, many
marketing research fi rms off er packaged services.
One disadvantage of using packaged services is the inability to customize aspects of a
project. Second, the company providing the packaged service may not know the idiosyncra-
sies of a particular industry; therefore, there is a greater burden on the client to ensure that
the packaged service fi ts the intended situation. Client fi rms, being fully aware of the idio-
syncrasies of their markets, need to be familiar with the service provided, including what data
are collected on which population, how the data are collected, and how the data are reported
before they purchase the service.
5- 9 Applications of Packaged Information Packaged information is useful in many marketing research decisions, such as measuring
consumer attitudes and opinions, defi ning market segments, monitoring media usage and pro-
motion eff ectiveness, and conducting market tracking studies. In the following section we
illustrate these applications with examples of fi rms that provide the service.
Advantages of syndicated data are shared costs, high-quality data, and speed with which data are collected and made available for decision making.
Disadvantages of syndicated data are that there is little control over the data collected, buyers must commit to long-term contracts, and competitors have access to the same information.
Advantages of packaged services are the experience of the fi rm offering the service, reduced cost, and increased speed of conducting the service.
Disadvantages of packaged services are the inability to customize services and the service fi rm not being knowledgeable about the client’s industry.
M05_BURN3261_08_GE_C05.indd 132M05_BURN3261_08_GE_C05.indd 132 27/08/16 5:52 pm27/08/16 5:52 pm

5-9 APPLICATIONS OF PACKAGED INFORMATION 133
MEASURING CONSUMER ATTITUDES AND OPINIONS Marketers are always interested in consumer attitudes and opinions. At one time, the Ameri-
can public frowned on buying on credit. That attitude has certainly changed, as credit card
ownership surged beginning in the 1970s. Marketers are interested in consumers’ attitudes
toward private brands versus national brands, the quality of products made in America and
elsewhere, and claims of health benefi ts. Defense contractors are interested in the public’s
attitude toward war. Universities are interested in consumers’ attitudes about the value of
higher education. Manufacturers are interested in prevailing attitudes about pollution and gov-
ernment regulation. Research fi rms supply packaged services that measure and report atti-
tudes and opinions on these issues and many more. Gallup, one of the oldest of these fi rms,
has been tracking attitudes and opinions and monitoring changes for many decades.
MARKET SEGMENTATION There are several marketing research fi rms that off er a packaged service of providing cli-
ent fi rms with sophisticated methods of identifying members of their target market, locating
these members, and providing information that will help develop promotional materials to
effi ciently reach these target markets. At the base of many of these services is geodemograph-
ics linking marketing information, such as consumer demographics, to specifi c geographical
locations (latitude and longitude coordinates). Geodemographics is the term used to describe
the classifi cation of geographic areas in terms of the socioeconomic characteristics of their
inhabitants. Aided by computer programs called geodemographic information systems (GIS),
geodemographers can access huge databases and construct profi les of consumers residing
in geographic areas determined by the geodemographer. Instead of being confi ned to fi xed
geographic reporting units such as a city, county, or state, geodemographers can produce this
information for geographic areas thought to be relevant for a given marketing application.
MONITORING MEDIA USAGE AND PROMOTION EFFECTIVENESS We have already mentioned the Nielsen Ratings for measuring TV audiences and Nielsen
Audio (formerly Arbritron) for measuring radio listenership. Another example is measur-
ing print media promotional impact. When promotional materials are placed in a newspaper,
direct-mail piece, website, or magazine or on the package itself, marketers want to know what
gets consumers’ attention and what they think of the message. Packaged services are available
to monitor the eff ectiveness of print media promotional messages. To measure reaction to
print media, the SKOPOS service RepliKator allows consumers to electronically fl ip through
the pages of a magazine or other printed material to resemble as closely as possible reading
through a magazine. Then SKOPOS can measure what the reader recalled from having read
the magazine. The marketing research supplier BrainJuicer specializes in measuring emotions
evoked by advertising with its “Emotion-in-Action score.”
Geodemographics is the term used to describe the classifi cation of geographic areas in terms of the socioeconomic characteristics of their inhabitants.
Active Learning
Use BrainJuicer to Explore Emotional Reactions to Advertising
In 2014 and 2015, BrainJuicer was named the most innovative marketing research supplier in the world by industry peers. 24 To explore why, go to BrainJuicer’s website at http://www.brainjuicer.com . Select the “Feel More” menu. Here you will find the top-ranked global advertising for the year in what BrainJuicer calls the Emotion-in-Action score. You can read on this page how BrainJuicer arrives at this score. Do you respond emotionally to the adver-tising that is ranked at the top for the year?
M05_BURN3261_08_GE_C05.indd 133M05_BURN3261_08_GE_C05.indd 133 27/08/16 5:52 pm27/08/16 5:52 pm

134 CHAPTER 5 • SECONDARY DATA AND PACKAGED INFORMATION
MARKET TRACKING STUDIES Nielsen is the leader in the industry in terms of analysis of
consumer purchase behavior. Nielsen tracking studies are
longitudinal studies that monitor a variable such as sales or
market share over time. Nielsen has two diff erent methods
of tracking the movement of goods at the retail level. First,
consumers participating in a large panel group use a wand
supplied by Nielsen to swipe the UPC barcode on goods
they bring home. Data are uploaded to a Nielsen database.
Second, Nielsen has agreements with many retailers to
purchase data as products are scanned at checkout. The
company augments these methods with in-store auditors to
ensure they have a sample of stores that are representative.
These methods give Nielsen the ability to off er a packaged
service of key information to marketing managers. They
can purchase tracking data for their category and get up-
to-date information about what brands are selling at which
retailers at the SKU level, and they can learn what their competitors are selling, which is key
strategic information.
5- 10 Social Media Data One of the fastest-growing areas of marketing research involves the organization and analysis
of social media data. A 2014 survey of marketing professionals found that almost half (46%)
of marketing professionals currently analyze social media data and another one-third (31%)
are considering using social media data in the future. 25 Social media data , also termed user-generated content (UGC) , are any information that is created by users of online systems
and intended to be shared with others. Social media data may be considered a form of sec-
ondary data, since it is information that does not originate as a result of a marketing research
project. In Chapter 6 , we will discuss two additional forms of online research methods that
can be considered primary data: marketing research online communities and online focus
groups.
Social media information can take a number of forms, including photos, videos, com-
ments, reviews, tweets, podcasts, pins, posts, ratings, emojis, likes, and blogs. As detailed in
Marketing Research Insight 2. 1 ( Chapter 2 ), various types of social media platforms are host
to this information, including blogs, microblogs, video-sharing networks, photo-sharing sites,
social networks, professional networks, product and service review sites, web-based com-
munities and forums, and news-sharing sites. Social media monitoring , also known as social media listening , involves actively gathering, organizing, and analyzing social media data to
gain consumer insights. The timing of social media monitoring can vary. It may be focused
on one period to solve a particular problem, conducted at regular intervals (for example, quar-
terly or annually), or be conducted on an ongoing basis.
TYPES OF INFORMATION As Kristina Cisnero of Hootsuite states in the introduction, there are numerous types of infor-
mation generated on social media that can be useful to businesses. For example, companies
may learn through the Internet that their customers in diff erent regions are using their prod-
ucts diff erently, leading to new advertising campaigns or product extensions. When Vegemite
sales dropped in Australia, Kraft investigated social media websites to explore consumers’
relationships with the yeast-based spread. Kraft learned from the social media platforms that
Companies can purchase tracking data for particular categories
of products and get up-to-date information about what brands
are selling at which retailers at the SKU level.
Tracking studies are longitudinal studies that monitor a variable such as sales or market share over time.
Social media data, also termed user-generated content (UGC), are any information that is created by users of online systems and intended to be shared with others.
Social media monitoring, or social media listening, involves actively gathering, organizing, and analyzing social media data to gain consumer insights.
© F
lori
n op
rea/
Shu
tter
stoc
k
M05_BURN3261_08_GE_C05.indd 134M05_BURN3261_08_GE_C05.indd 134 27/08/16 5:52 pm27/08/16 5:52 pm

5-10 SOCIAL MEDIA DATA 135
Australians were incorporating Vegemite in unusual food combinations according to their
cultural backgrounds. This led to a successful ad campaign called “How do you have your
Vegemite?” In addition, Kraft discovered that some Australians were mixing Vegemite with
cream cheese. The result was a new popular product called Cheesybite. 26
The following sections list some of the user-generated types of information that can be
found on social media.
Reviews Consumers provide reviews for products and services on retailer (e.g., Banana
Republic) and product or service specialty (e.g., Yelp) websites. These reviews off er context
for internal data, such as sales and returns. Reviews can provide retailers and manufacturers
early warnings and diagnoses of problems and successes. The consumers’ comments also
provide free promotion for the products and services that are reviewed, although this type of
publicity may be unwanted when the reviews are not favorable.
Tips Often consumers use social media websites to share product- or service-related infor-
mation with other consumers, such as troubleshooting information on products (e.g., solving
software bugs), product demonstrations (e.g., showing products in action), pointers (e.g., best
rooms to request in hotels), and warnings (e.g., don’t buy this toy for larger dogs). Consumers
also use social media to openly provide suggestions for companies. These can include ideas
for new concepts and suggestions for improvements and additional features.
New Uses Consumers often share new uses for products, potentially leading to new ways
to promote products. Examples might include new ways to use a food product in a recipe or
unexpected uses for an appliance.
Competitor News Social media sites also provide a way to monitor perceptions of com-
petitors’ products, allowing direct comparisons of similar products and aff ording early warn-
ings of advances in the industry.
ADVANTAGES AND DISADVANTAGES OF SOCIAL MEDIA DATA Social media have a number of strengths as a source of marketing research data. First, and
perhaps most important, is their currency. Social media can provide fast, immediate, up-to-
the-minute feedback on any of the 4 Ps associated with a brand. Second, it is relatively inex-
pensive to access the data, although expertise is needed to organize and analyze the data
properly. Third, social media data represent the unprompted, unfi ltered, and authentic voice
of the consumer. As such, social media sources can lead to new understandings that might not
emerge through other types of research. Fourth, social media platforms provide one of the
best means to trace trends and track big themes—that is, fears and aspirations—that infl uence
consumers.
The use of social media data for marketing research also has quite a few disadvantages.
First, the social media commenters may not represent a brand’s target audience and, conse-
quently, provide misleading feedback. Similarly, the most vocal consumers—whether advo-
cates or critics of a brand—may have a more active voice and distort the conversation. Next,
the demographic and geographic information of the consumers may not be identifi able or may
be falsifi ed, limiting its usefulness. In addition, some types of products, such as electronics
and hotels, are more likely to be reviewed online, and some, particularly local products or
low-penetration products, may not have a social media presence at all. Also, despite mea-
sures taken to prevent fraud by established websites, social media review websites can be
subject to manipulation, whereby some reviews may be posted by individuals with ulterior
motives. Finally, and most frustratingly, much of the material on social media is shallow, use-
less, off ensive, or irrelevant. This means that a lot of content must be sifted through to fi nd
useful information.
M05_BURN3261_08_GE_C05.indd 135M05_BURN3261_08_GE_C05.indd 135 27/08/16 5:52 pm27/08/16 5:52 pm

136 CHAPTER 5 • SECONDARY DATA AND PACKAGED INFORMATION
TOOLS TO MONITOR SOCIAL MEDIA A number of full-service research companies, such as Nielsen and Lieberman Research
Worldwide, off er social media monitoring as a packaged service. Some research suppliers
specialize in social media monitoring, including DigitalMR and Face. Some client companies,
such as Meijer, the hypermarket chain, and Procter & Gamble, conduct much of their own
social media listening. Companies and organizations that highly value social media data, such
as Dell, the Red Cross, and Gatorade, set up “command centers,” with multiple screens to
monitor social media activity on an ongoing basis. Social media command centers can also be
set up on a temporary basis to deal with a crisis or special event, such as the command center
the National Football League set up for the 2015 Super Bowl in Phoenix, Arizona.
A number of tools and technology, some free or partially free and others with a price,
have been created to aid in the monitoring of social media or web analytics. Examples include
Radian6, Google Analytics, and Social Mention. Some companies, including Hootsuite and
Sprout Social, off er social media dashboards with which to monitor multiple social media
websites on one screen. Many of these services off er key metrics and summary information,
such as word counts, volume, key words, and top infl uencers. For example, Social Mention,
a social media search engine, provides a measure of sentiment , or the ratio of positive to
negative comments posted about products and brands on the web. Still, no tool to aggregate
social media data can replace the in-depth analysis of content that can be conducted by mar-
keting research analysts who have a deep understanding of a brand, product, or company. See
Marketing Research Insight 4. 2 ( Chapter 4 ) for an outline of the steps to use to analyze social
media data.
5- 11 Internet of Things An important emerging source of big data is called the Internet of Things (IoT) and is
defi ned as the network of physical objects embedded with software or sensors that allow them
to gather and send data. It is important to be aware of this data source because many research
professionals believe that, as Kristin Luck, president of Decipher Market Research, stated,
IoT “will radically transform our industry from relying heavily on primary data, to truly inte-
grating passively collected secondary data.” 27 In the future, it is believed that there will be
more things providing data than people. 28 The Internet of Things will give people—and mar-
keting researchers—greater access to computer intelligence through passive data. Passive data are defi ned as information that is collected without overt consumer activity.
A major category of objects that is part of the IoT, wearables , or wearable technology ,
are clothing or accessories that are equipped with computer technology or sensors that allow
the collection and sharing of data. Wearables include smartglasses (e.g., Google Glass), fi t-
ness trackers (e.g., Fitbit), and smart watches (e.g., Apple Watch). In 2015 Ralph Lauren
launched a “smart shirt,” called the PoloTech, which is embedded with sensors to read vital
signs like breathing and heart rate, stress level, and calories burned and will stream that infor-
mation to an app. Next, the company is planning smart ties and smart suits. 29 Wearables turn
people into walking, talking trails of data, all of which can be aggregated and analyzed with
the proper technology and knowledge. These data can be particularly valuable to the health
and the fi tness industries, but information provided by wearables can be useful for any com-
pany that is tracking human behavior.
As more objects have sensors and the ability to share information, the information that is
generated, along with the marketing research applications, will surely multiply. For example,
if sensors were embedded throughout a store, data could automatically be collected related to
the number of people who walked by the store, number of people who came into the store,
number of people who bought something, aisles that people walked through, objects that
Sentiment is the ratio of positive to negative comments posted about products and brands on the web.
The Internet of Things (IoT) is defi ned as the network of physical objects embedded with software or sensors that allow them to gather and distribute data.
Passive data are information that is collected without overt consumer activity.
Wearables, or wearable technology, are clothing or accessories that are equipped with computer technology or sensors that allow the collection and sharing of data.
To see an example of a social media command center, go to
www.youtube.com and enter “Introducing Dell’s Social Media Command Center.”
M05_BURN3261_08_GE_C05.indd 136M05_BURN3261_08_GE_C05.indd 136 27/08/16 5:52 pm27/08/16 5:52 pm

5-11 INTERNET OF THINGS 137
people picked up, and many other types of information. Analysis of the data could be used
to improve decision making related to retail layouts, stocking, pricing, promotional displays,
and much more.
The Internet of Things off ers real promise for greater automation of marketing research
and exciting applications for the future. At the same time, the IoT raises concerns related to
privacy and security that will need to be addressed. In addition, since the data from the IoT
generally lack context, pairing passive data with qualitative data will be important. The topic
of the next chapter is qualitative data.
For further information about the IoT, go to www.youtube.com
and enter “Data Security and the Internet of Things Deloitte University Press.”
Synthesize Your Learning
This exercise will require you to take into consideration concepts and material from the fol-lowing chapters:
Chapter 1 Introduction to Marketing Research Chapter 2 The Marketing Research Industry Chapter 3 The Marketing Research Process and Defining the Problem and
Research Objectives Chapter 4 Research Design Chapter 5 Secondary Data and Packaged Information
Drill Bits, Inc.
Bob Douglass owns a machine shop. Most of his work is local business, as machine shop work is labor intensive, and it is difficult to obtain large-quantity orders. Bob is consider-ing branching out. For many years he has observed a couple of local manufacturers whose processes require them to make highly precise drills in metal. For example, the engine block cylinders they produce must be extremely precise for the engines to run at the required com-pression standards. To make such a precise drill, the drill bits can be used only a few times before they lose their original specifications. Then these expensive drill bits must be thrown away. Bob’s customers have complained about this for years, and Bob has been working on a process to refurbish these throwaway bits back to their original specifications.
Finally, Bob has perfected this process. His local customers try out the refurbished bits and are ecstatic with the results. They can now get double the life or even more out of a drill bit. Bob knows his machine shop will soon be very busy from two local customers. To expand his business to accommodate a large volume of refurbishment business, he knows he will have to invest a large sum of money in expanding the building and the machinery needed for the process. But he has no idea of the volume of business to expect.
1. Looking back at Chapter 1 , how would you describe the purpose of marketing research in terms of Bob’s situation?
2. If Bob is interested in finding a marketing research firm in his state, describe how he might find marketing research firms by states using information contained in Chapter 2 .
3. In Chapter 3 we discussed what the “problem” really is. What is Bob’s problem?
4. If Bob just wants to know how many firms make engine blocks in the United States, what type of research design would best describe this activity?
5. What secondary source of information would Bob want to seek to achieve the goal stated in question 4?
M05_BURN3261_08_GE_C05.indd 137M05_BURN3261_08_GE_C05.indd 137 27/08/16 5:52 pm27/08/16 5:52 pm

138 CHAPTER 5 • SECONDARY DATA AND PACKAGED INFORMATION
Summary
Big data can be defi ned simply as large amounts of data
from multiple sources. The term has been popularized in
recent years in response to the numerous types and huge
amounts of data to which companies now have access in
real time. These data represent both opportunities and
challenges.
Data may be grouped into two categories: primary and
secondary. Primary data are gathered specifi cally for the
research project at hand. Secondary data have been pre-
viously gathered for some other purpose. There are many
uses of secondary data in marketing research, and some-
times secondary data are all that is needed to achieve the
research objectives.
Secondary data may be internal, previously gathered
within the fi rm for some other purpose. Examples include
data collected and stored from sales receipts, such as types,
quantities, and prices of goods or services purchased;
customer names; delivery addresses; shipping dates; and
salespeople making the sales. Data stored in electronic
databases may be used for database marketing. Companies
use information recorded in internal databases for purposes
of direct marketing and to strengthen relationships with
customers. The latter is a process known as customer rela-
tionship management (CRM).
External data are obtained from sources outside the
fi rm. These data sources may be classifi ed as (1) published
sources, (2) offi cial statistics, and (3) data aggregators.
There are diff erent types of published secondary data, such
as trade association publications, periodicals, academic
journals, books, marketing research company publications,
and more. Offi cial statistics are information collected by
government organizations and international organizations.
The United States by law makes all data collected by gov-
ernment “open by default,” except for personal information
or data related to national security. Data aggregators are
services or vendors that organize and package information
on focused topics.
Secondary data have the advantages of being quickly
gathered, readily available, and relatively inexpensive; they
may add helpful insights should primary data be needed,
and sometimes secondary data are all that is needed to
achieve the research objective. Disadvantages are that the
data are often reported in incompatible reporting units,
measurement units do not match researchers’ needs, class
defi nitions are incompatible with the researchers’ needs,
and secondary data may be outdated. Evaluation of second-
ary data is important; researchers must ask certain ques-
tions to ensure the integrity of the information they use.
The American Community Survey (ACS) is an exam-
ple of free public data useful for researchers. The ACS
makes U.S. data available on an annual basis instead of the
10-year interval required in the past to update census data.
The ACS may represent the most signifi cant change in sev-
eral decades in the availability of secondary data to be used
for marketing research purposes.
Packaged information is a type of secondary data in
which the data collected and/or the process of collecting
the data is the same for all users. There are two classes of
packaged information. Syndicated data are collected in
a standard format and made available to all subscribing
users. Packaged services off er a standardized marketing
research process that is used to generate information for a
particular user.
Syndicated data have the advantages of shared
costs of obtaining the data among all those subscrib-
ing to the service, high data quality, and the speed with
which data are collected and distributed to subscribers.
Disadvantages are that buyers cannot control what data
are collected, must commit to long-term contracts, and
gain no strategic information advantage in buying syn-
dicated data because the information is available to all
competitors.
Packaged services have the advantage of use of the
supplier fi rm’s expertise in the area, reduced costs, speed,
and benchmarks for comparisons. The disadvantages of
packaged services are that the process may not be eas-
ily customized and the supplier fi rm may not know the
idiosyncrasies of the industry in which the client fi rm
operates.
Four major areas in which packaged information
sources may be applied are measuring consumers’ attitudes
and opinions, defi ning market segments, monitoring media
usage and promotion eff ectiveness, and conducting market-
tracking studies.
One of the fastest-growing areas of marketing research
involves the organization and analysis of social media data.
Social media data, also termed user-generated content (UGC) , is any information that is created by users of online
systems and intended to be shared with others. Social
media data provide many important forms of information
including reviews, tips, new product uses, and competitor
news.
An important emerging source of marketing research
data is the Internet of Things (IoT), defi ned as the network
of physical objects embedded with software or sensors
that allow them to gather and send data. A major category
M05_BURN3261_08_GE_C05.indd 138M05_BURN3261_08_GE_C05.indd 138 27/08/16 5:52 pm27/08/16 5:52 pm

REVIEW QUESTIONS/APPLICATIONS 139
Key Terms
Big data (p. 116 )
Primary data (p. 116 )
Secondary data (p. 116 )
Internal secondary data (p. 119 )
Database (p. 119 )
Record (p. 119 )
Fields (p. 119 )
Internal databases (p. 119 )
Customer relationship management
(CRM) (p. 119 )
Data mining (p. 119 )
Micromarketing (p. 119 )
External data (p. 120 )
Published sources (p. 122 )
Offi cial statistics (p. 123 )
Open Data Policy (p. 123 )
Data aggregators (p. 124 )
American Community Survey
(ACS) (p. 128 )
Packaged information (p. 129 )
Syndicated data (p. 129 )
Packaged services (p. 131 )
Geodemographics (p. 133 )
Tracking studies (p. 134 )
Social media data (p. 134 )
User-generated content (UGC)
(p. 134 )
Social media monitoring (p. 134 )
Social media listening (p. 134 )
Sentiment (p. 136 )
Internet of Things (IoT) (p. 136 )
Passive data (p. 136 )
Wearables (p. 136 )
Wearable technology (p. 136 )
Review Questions/Applications
5- 1. What are big data, and why do they represent both an
opportunity and a challenge?
5- 2. What should be kept in mind before beginning data
analysis?
5- 3. What are secondary data, and how do they diff er
from primary data?
5- 4. Describe some uses of secondary data.
5- 5. Describe the classifi cations of secondary data.
5- 6. What is a database, and what are the components of a
database?
5- 7. Describe the diff erent ways in which companies use
their database.
5- 8. What is meant by CRM?
5- 9. How are databases useful for managers?
5- 10. Give an example of a company that uses micromar-
keting and explain how.
5- 11. Do you think Tesco’s use of its database information
in Marketing Research Insight 5.2 is ethical? Explain
your answer.
5- 12. Briefl y explain the three diff erent types of external
data discussed in the chapter.
5- 13. Name three sources of secondary data available to
you through your school library.
5- 14. What are the fi ve advantages of secondary data?
5- 15. Discuss the disadvantages of secondary data.
5- 16. Which disadvantage of secondary data is resolved by
geodemographics and why?
5- 17. How would you go about evaluating secondary data?
Why is evaluation important?
5- 18. Describe the ACS in terms of the advantage it off ers
as well as how to retrieve data.
5- 19. What is meant by packaged information?
5- 20. What is syndicated data? Give an example of a com-
pany that supplies syndicated data and describe the
information it provides.
5- 21. What are packaged services? Give an example of
a company that supplies a packaged service and
describe the type of information it provides.
5- 22. Esri ’s market segmentation service, Tapestry
Segmentation, would be classifi ed as which type of
packaged information? Why?
5- 23. What are the advantages and disadvantages of syndi-
cated data?
5- 24. What is the key diff erence between syndicated data
and packaged services?
5- 25. How can packaged information help in strategic mar-
keting decisions?
5- 26. Give examples of four types of user-generated infor-
mation that can be found on social media.
of objects that are part of the IoT are wearables, or wear-
able technology, which are clothing or accessories that are
equipped with computer technology or sensors that allow
the collection and sharing of data. As more objects become
equipped with sensors, the marketing research applications
for the data will multiply.
M05_BURN3261_08_GE_C05.indd 139M05_BURN3261_08_GE_C05.indd 139 27/08/16 5:52 pm27/08/16 5:52 pm
140 CHAPTER 5 • SECONDARY DATA AND PACKAGED INFORMATION
5- 27. What are the advantages and disadvantages of social
media.
5- 28. What is the Internet of Things?
5- 29. Access your library’s online databases. Describe how
your library helps categorize the many databases to guide
in your selection of sources appropriate for business.
5- 30. Go online to your library’s website. Can you locate a
database that would be a good choice to fi nd publica-
tions such as journal articles, trade publications, or
newspapers? What are they?
5- 31. Tracking studies are off ered by many market research
companies, and several use sophisticated software
systems to carry them out. Research the typical areas
examined in a tracking study. What value do such
studies off er the client?
5- 32. Refer back to Marketing Research Insight 5. 4 . Would
Jacksonville, Florida, actually meet the criterion to
be a test market? Cite the information on which you
base your decision.
5- 33. In the chapter we used an example of going to the
Esri Tapestry Segmentation website for an Active
Learning exercise. Go to those instructions. Enter
your residence ZIP code and describe the inhabitants
in terms of one or more of the consumer types avail-
able in the software.
5- 34. Social media monitoring involves actively gather-
ing, organizing, and analyzing social media data to
learn about brands, products, and services. Choose
a well-known brand in your own country or region
and monitor social media sites at regular intervals
over the next 24 hours to gain consumer insights.
Comment on your fi ndings.
5- 35. How can companies use passive data collected from
wearabl e technology?
CASE 5. 1
The Men’s Market for Athleisure 30
Founded in 1998, Lululemon Athletica, the Canada-
based maker of stylish, upscale workout clothes, had
grown very quickly. A pioneer of the “athleisure” trend
for women—that is, wearing casual clothing outside of
the gym—Lululemon had been best known for its yoga
pants. Lululemon had a thriving online business, as well
as physical stores in the United States, Canada, Japan, and
Australia. Although Lululemon’s core strength had been its
women’s clothing, the company also sold men’s clothing.
Lululemon’s sales had grown rapidly, but the com-
pany faced some important challenges. First, other ac-
tivewear companies, such as Nike Inc. and Under Armour
Inc., had begun to directly compete with Lululemon in
the athleisure market. Also, Lululemon had diffi culty
recovering from a 2013 controversy, in which the com-
pany had to recall a large number of black yoga pants
because their fabric was too transparent. Chip Wilson,
CEO of Lululemon, compounded the problem by off er-
ing the explanation that “frankly some women’s bodies
just don’t actually work for it.” Mr. Wilson resigned from
Lululemon, and the company continued to grow under
new leadership.
Lululemon has been pursuing the strategy of grow-
ing its male market. Despite Lululemon’s association with
women’s clothing, men’s clothing has had strong profi ts
and some loyal customers. Your task is to consider what
secondary sources can be used to examine Lululemon’s
current strength and potential in the men’s athleisure mar-
ket. Should Lululemon invest more resources into its men’s
market?
1. What internal secondary sources does Lululemon
already have that the company could use to gain
insights on its men’s market? Be sure to consider sup-
plier records, retail store records, website information,
and sales force records.
2. Which external published sources and data
aggregators have useful information about
Lululemon’s current position and the potential for
the men’s athleisure market? In your investigation,
include the following:
a. Business publications (e.g., New York Times, Wall Street Journal, Forbes, Economist , etc.)
b. Trade and professional association information (e.g.,
athleticbusiness.com , wewear.org , etc.)
c. Academic journals (search using your library’s data-
base of business journals)
d. Industry information (check your library’s sources,
such as those found in Table 5. 1)
3. Where does Lululemon currently have men’s only
stores? Use the American Community Survey to iden-
tify a promising metropolitan statistical area (MSA) for
Lululemon to locate its next men’s only store. Justify
your decision.
M05_BURN3261_08_GE_C05.indd 140M05_BURN3261_08_GE_C05.indd 140 05/09/16 11:34 AM05/09/16 11:34 AM

REVIEW QUESTIONS/APPLICATIONS 141
4. Conduct an investigation of social media to examine
user-generated content related to Lululemon.
a. What are the trending topics on social media related
to Lululemon? (Use a free social media aggregator,
such as Addictomatic or Twazzup, to investigate.)
b. What is the sentiment of the comments related
to Lululemon? Compare the sentiment ratio of
Lululemon to two of its competitors. What does
that mean?
c. What other sources of user-generated content can
you fi nd on social media? Do consumer percep-
tions appear to be supportive of sale of Lululemon’s
men’s clothing? Explain.
5. Integrate your information from the preceding ques-
tions to determine whether or not Lululemon should
invest more heavily in its men’s market. Justify your
response using information from your search of sec-
ondary data.
Sources : Beilfuss, L. (2015, September 10). Lululemon sales rise, gross margin declines. Wall Street Journal. Retrieved from http://www.
wsj.com/articles/lululemon-quarterly-profi t-slips-but-retailer-raises-full-year-guidance-1441882373 ; Petro, G. (2015, September 16).
Lululemon, Nike and the rise of “Athleisure.” Forbes . Retrieved from http://www.forbes.com/sites/gregpetro/2015/09/16/lululemon-
nike-and-the-rise-of-athleisure/ ; Wallace, A. (2015, February 2). New York Times. Retrieved from http://www.nytimes.com/2015/02/08/
magazine/lululemons-guru-is-moving-on.html?_r=0 .
M05_BURN3261_08_GE_C05.indd 141M05_BURN3261_08_GE_C05.indd 141 27/08/16 5:52 pm27/08/16 5:52 pm

▶
LEARNING OBJECTIVES In this chapter you will learn:
6- 1 The differences between quantitative and qualitative research techniques
6- 2 The pros and cons of using observation as a means of gathering data
6- 3 What focus groups are and how they are conducted and analyzed
6- 4 What enthnographic research is and its strengths and weaknesses
6- 5 To learn how marketing research online communities (MROCs) are used
6- 6 Other qualitative methods used by marketing researchers, including in-depth interviews, protocol analysis, projective techniques, and neuromarketing
“WHERE WE ARE”
1 Establish the need for marketing
research.
2 Defi ne the problem.
3 Establish research objectives.
4 Determine research design.
5 Identify information types and sources.
6 Determine methods of accessing data.
7 Design data collection forms.
8 Determine sample plan and size.
9 Collect data.
10 Analyze data.
11 Prepare and present the fi nal research
report.
MTV: How MTV Uses Online Panels to Research Its Youth Audience
For over 30 years, MTV has continued
to innovate for every new generation of
youth—developing cutting-edge con-
tent from series to award shows to digi-
tal shorts to social media postings. It’s
crucial that MTV stays tapped into the
psychographics and behaviors of youth
today. And because of the impact of
technology, youth culture is changing faster than ever. In fact, MTV’s
research shows that 84% of 20- to 24-year-olds agree that “teens today
seem so different than when I was a teen.” So MTV relies heavily on its
research and insights team, MTV Insights, to keep constantly connected
with this rapidly changing demographic.
One of the key methodologies MTV Insights employs to speak to its
teen and 20-something audience on a daily basis is online panels. These
panels are run via “Facebook Groups” and fi lled with a hand-selected
group of articulate and culturally connected youth from across the coun-
try. On any given day, MTV will be posing questions to its panels about
topics ranging from high school cliques to Tinder dating to start-up cul-
ture. And the panelists also proactively share trending topics from their
social feeds, happenings from their high school and college campuses,
and insight into their personal lives.
I fi nd online panels to be the most valuable of all of our research
methodologies. We establish relationships with our panelists and they
feel committed to keeping us on top of trends and helping us under-
stand their generation. It’s a mutually benefi cial arrangement for the
panelists—they are compensated and also have a great experience
to add to their resume. But their sense of commitment goes beyond
the compensation. They genuinely like to help and be heard. I also
6 Qualitative Research Techniques
Alison Hillhouse, Vice
President of Insights, MTV.
M06_BURN3261_08_GE_C06.indd 142M06_BURN3261_08_GE_C06.indd 142 29/08/16 11:41 am29/08/16 11:41 am

143
frequently Facebook-message back and forth with several of the panelists. I call them my
“high school best friends,” as I truly feel like I know them and can depend on them.
The insights the panelists share feed into several research outputs that the MTV
Insights team produces and shares with all of MTV—multimedia PowerPoint presenta-
tions, weekly newsletters, and video compilations of kids talking about their lives (panel-
ists are asked to upload video responses of them talking about particular subjects). Once,
MTV Insights took over a fl oor at MTV and created a multimedia exhibit called “High
School Hallways” to bring the research to life, complete with a high school bedroom,
party room, and social-media-detox tent. Sometimes fi ndings from this research directly feed
into show ideas, but mostly they are absorbed by MTV staff to help them develop a holisti-
cally better understanding of the people in the audience, what’s important to them, and the
kind of content they might be interested in consuming.
—Alison Hillhouse
Source: Text and photos courtesy Alison Hillhouse and MTV Networks.
Even as collecting many forms of quantitative data has become more automated and less
expensive (see Chapter 5 ) , qualitative research methods have retained their vitality in
the marketing research industry. This is because qualitative research methods provide
the context necessary to understand people’s actions, opinions, and emotions. As you will
learn, qualitative research delivers insights that are not found in quantitative research.
This chapter discusses how to distinguish between qualitative and quantitative research
as well as the various methods used in conducting qualitative research. Each qualitative
method has its place in the marketing research process, and each has its unique advantages
and disadvantages as well. Because focus groups remain the most popular qualitative market-
ing research technique, an in-depth discussion of them is included. We begin with a discus-
sion of quantitative, qualitative, and mixed methods research.
6- 1 Quantitative, Qualitative, and Mixed Methods Research The means of data collection during the research process can be
classifi ed into two broad categories: quantitative and qualitative.
There are many diff erences between these two methods, and it is
necessary to understand their special characteristics to make the
right selection. To start, we briefl y defi ne these two approaches,
and then we describe mixed methods research.
Quantitative research is the traditional mainstay of the
research industry, and it is sometimes referred to as “survey
research.” For our purposes, quantitative research is defi ned
as research involving the administration of a set of structured ques-
tions with predetermined response options to a large number of
respondents. When you think of quantitative research, you might
envision a company that has a panel whose members complete
Visit MTV at http://www.
MTV.com .
The means of data collection during the research process can be classifi ed into two broad categories: quantitative and qualitative.
Online surveys are a form of quantitative research.
Quantitative research is defi ned as research involving the administration of a set of structured questions with predetermined response options to a large number of respondents.
© P
aul M
agui
re/S
hutt
erst
ock
M06_BURN3261_08_GE_C06.indd 143M06_BURN3261_08_GE_C06.indd 143 17/08/16 3:51 pm17/08/16 3:51 pm

144 CHAPTER 6 • QUALITATIVE RESEARCH TECHNIQUES
an online survey. That is, quantitative research often involves a sizable representative sample
of the population and a formalized procedure for gathering data. The purpose of quantitative
research is specifi c, and this research is used when the manager and researcher have agreed
on the precise information that is needed. Data format and sources are clear and well defi ned,
and the compilation and formatting of the data gathered follow an orderly procedure that is
largely numerical in nature.
Qualitative research , in contrast, involves collecting, analyzing, and interpreting
unstructured data by observing what people do and say. Observations and statements are free-
form or nonstandardized because questions and observations are open ended. Qualitative data
can be categorized, but such data are not usually quantifi ed. For example, if you asked fi ve
people to express their opinions on a topic such as gun control or promoting alcoholic bever-
ages to college students, you would probably get fi ve diff erent statements. But after study-
ing each response, you could characterize each one as “positive,” “negative,” or “neutral.”
This translation step would not be necessary if you instructed them to choose predetermined
responses such as “yes” or “no.” Any study that is conducted using an observational tech-
nique or unstructured questioning can be classifi ed as qualitative research, which is becoming
increasingly popular in a number of research situations. 1
Why would you want to use such a “soft” approach? Often marketing researchers fi nd
that a large-scale survey is inappropriate. For instance, Procter & Gamble may be interested
in improving its Ultra Tide laundry detergent, so it invites a group of age 30- to 45-year-old
women to brainstorm how Ultra Tide could perform better or how its packaging could be
improved or to discuss other features of the detergent. These ideas may have been the ori-
gins of Tide PODS or Tide To Go. Listening to the market in this way can generate excellent
packaging, product design, or product positioning ideas. As another example, if the P&G
marketing group were developing a special end-of-aisle display for Tide, it might want to test
one version in an actual supermarket environment. It could place one in a Safeway grocery
store in a San Francisco suburb and videotape shoppers as they encountered the display. The
videos would then be reviewed to determine what types of responses occurred. For instance,
did shoppers stop there? Did they read the copy on the display? Did they pick up the dis-
played product and look at it? Qualitative research techniques aff ord rich insight into con-
sumer behavior. 2 An example of a company that makes extensive use of qualitative marketing
research is the global home furnishings company Ikea (see Marketing Research Insight 6. 1 ).
Our goal in this chapter is to emphasize the value of qualitative research techniques and
the ability of qualitative research and quantitative research to work hand in hand. Although
there are proponents of both qualitative and quantitative research, the majority of market-
ing researchers have adopted mixed methods research , also known as pluralistic or hybrid
research. A 2015 survey of marketing research professionals found that more than two-thirds
(69%) of marketing researchers use a combination of quantitative and qualitative research
techniques, adopting their methods to the project at hand. 3 Mixed methods research is
defi ned as the combination of qualitative and quantitative research methods with the aim of
gaining the advantages of both. It is often said that quantitative data provide the “what,” and
qualitative data provide the “why.”
Mixed methods research can take a variety of forms. Traditionally, exploratory qualita-
tive techniques precede quantitative techniques. For example, in-depth interviews of selected
dealers or a series of focus group discussions with customers might be used to understand
how a product or service is perceived in comparison to competitors. An observational study
could be used to learn how customers use the product. These activities often help crystallize
the problem or otherwise highlight factors and considerations that might be overlooked if the
researcher had rushed into a full-scale survey.
The qualitative phase can serve as a foundation for the quantitative phase of the research
project because it provides the researcher with fi rsthand knowledge of the research problem.
Armed with this knowledge, the researcher’s design and execution of the quantitative phase
Qualitative research involves collecting, analyzing, and interpreting data by observing what people do and say.
Mixed methods research is defi ned as the combination of qualitative and quantitative research methods with the aim of gaining the advantages of both.
Qualitative research techniques afford rich insight into consumer behavior.
M06_BURN3261_08_GE_C06.indd 144M06_BURN3261_08_GE_C06.indd 144 17/08/16 3:51 pm17/08/16 3:51 pm

6-1 QUANTITATIVE, QUALITATIVE, AND MIXED METHODS RESEARCH 145
are invariably superior to what they might have been without the qualitative phase. As an
example, The Arizona Republic newspaper has used online focus groups for brainstorming,
and the outcomes of these sessions are then used to devise online surveys. Through this mixed
methods approach, the Showtime network investigated the diff erent lifestyle types of viewers
of its Nurse Jackie show: those who watch on demand, those who prefer to watch live, those
who use DVRs, and those who use a combination of the viewing platforms. 4 The on-demand
and DVR viewers really valued the ability to pause, rewind, and re-experience; the live watch-
ers eagerly anticipated the premiere shows; the DVR users had constraints and needed the
convenience of recorded episodes; and the combination viewers had complicated schedules
and used whatever platform worked that week.
In others cases, a qualitative phase is applied after a quantitative study to help the
researcher understand the fi ndings in the quantitative phase. 5 For example, after getting the
results of a survey, a company might convene focus groups to gain a greater understanding of
Ikea Uses Qualitative Research to Develop New Markets Ikea, the Swedish home furnishings company, makes extensive use of multiple forms of qualitative research, including obser-vation and ethnography. As Ikea has expanded around the world, the company has conducted careful marketing research to understand the cultural nuances of its many markets. Before opening its fi rst store in South Korea in 2014, Ikea studied the market for six years. Fortune magazine claims that “research is at the heart of Ikea’s expansion.”
Ikea uses observational research to understand consumers’ experiences in their homes. In one exploration of how people use sofas, Ikea set up cameras in homes in Stockholm, Milan, New York, and Shenzhen, China. Among other fi ndings, Ikea discovered that many people in Shenzhen sit on the fl oor, using the sofa as a backrest.
Ikea also makes extensive use of ethnographic techniques, with the New Yorker magazine calling Ikea “some of the world’s foremost anthropologists of home life.” Ikea employees con-duct thousands of visits per year to consumers’ homes to exam-ine in what ways people are satisfi ed and frustrated with their furnishings.
In addition to visiting and monitoring homes, Ikea has pur-chased an apartment in Malmö, Sweden, to use as a “living lab.” Ikea chose a smaller apartment, because the homes in Ikea’s pri-mary markets—emerging markets and large cities such as San Francisco and Boston—are getting smaller. Ikea invites families of diverse sizes and characteristics to live in the apartment for a couple of weeks at a time. The families are paid about $US 600 to participate in the project and given an iPad with an app that can be used to record their impressions. Among the products
being tested in this apartment are moveable walls and sliding power sockets.
A recent addition to Ikea’s research department is an “inno-vation center” in Copenhagen, Denmark, called Space 10. Ikea invites innovators, including professors, students, artists, and designers, to Space 10 to collaborate on ideas.
Based on marketing research insights, Ikea produces about 2,000 new products and redesigns a year. Because of the careful research, it can take Ikea many years to design products. Among the products that Ikea has planned for the future is an electric bike.
MARKETING RESEARCH INSIGHT 6. 1 Global Application
Ethnographic research can involve observing consumers
in their own homes.
Sources: Collins, L. (2011, October 3). House perfect: Is the IKEA ethos comfy or creepy? New Yorker . Retrieved from http://www.newyorker.com/magazine/2011/10/03/house-perfect ; Hansegard, J. (2015, September 29). IKEA Tests Movable Walls for Cramped Homes. Wall Street Journal . Retrieved from http://www.wsj.com/articles/ikea-tests-movable-walls-for-cramped-homes-14www43546181 ; Kowitt, B. (2015, March 15). How Ikea took over the world . Fortune . Retrieved from http://fortune.com/ikea-world-domination/ ; Rhodes, M. (2015, November 24). The innovation lab: Where Ikea will get its next idea. The Wired . Retrieved from http://www.wired.com/2015/11/the-innovation-lab-where-ikea-will-get-its-next-big-idea/ .
© M
erzz
ie/S
hutt
erst
ock
M06_BURN3261_08_GE_C06.indd 145M06_BURN3261_08_GE_C06.indd 145 17/08/16 3:51 pm17/08/16 3:51 pm

146 CHAPTER 6 • QUALITATIVE RESEARCH TECHNIQUES
the survey fi ndings. In another example, following a consumer segmentation study, research-
ers might then use in-depth interviews to develop rich profi les of each segment.
Qualitative and quantitative research can also be conducted simultaneously. For exam-
ple, to test three new fl avors of pastries, a baked goods company organized a series of focus
groups across the United States. For each fl avor, the focus group participants were asked to
fi rst privately taste and rate the fl avor of the pastry on a number of characteristics and then
discuss their reactions with other focus group participants. This method allowed the company
to obtain independent ratings of their product concepts, supplemented with more details on
how the participants arrived at their ratings. In addition, by monitoring the interactions among
the focus group members, the company could observe how perceptions of the pastry fl avors
might be aff ected by social settings.
6- 2 Observation Techniques We begin our description of qualitative research techniques with observation methods , which
are techniques in which phenomena of interest involving people, objects, and/or activities are
systematically observed and documented. As we describe each observation technique, you
will see that each is unique in how it obtains observations.
TYPES OF OBSERVATION At fi rst glance, it may seem that observation studies can occur without any structure; however,
it is important to adhere to a plan so that the observations are consistent and comparisons
or generalizations can be made without worrying about any conditions of the observation
method that might confound the fi ndings. There are four general ways of making observations:
(1) direct versus indirect, (2) overt versus covert, (3) structured versus unstructured, and (4) in
situ versus invented.
Direct Versus Indirect Observation methods might be classifi ed as direct versus indi-
rect according to whether or not the phenomena is being observed in real time. Observ-
ing behavior as it occurs is called direct observation . 6 For example, if we are interested
in fi nding out how much shoppers squeeze tomatoes to assess their freshness, we can
observe people actually picking up the tomatoes. Direct observation has been used by
Kellogg’s to understand breakfast rituals, by a Swiss chocolate maker to study the behav-
ior of “chocoholics,” and by the U.S. Post Offi ce’s advertising agency to come up with the
advertising slogan “We Deliver.” 7 It has also been used by General Mills to understand
how children eat breakfast, leading to the launch of Go-Gurt, a midmorning snack for
schoolchildren. 8
Some behaviors, such as past actions, cannot be directly observed. In those cases, we
must rely on indirect observation , which involves observing the eff ects or results of the
behavior rather than the behavior itself. Types of indirect observations include archives and
physical traces.
Archives are secondary sources, such as historical records, that can be applied to the
present problem. These sources contain a wealth of information and should not be overlooked
or underestimated. Many types of archives exist. For example, records of sales calls may be
inspected to determine how often salespeople make cold calls. Physical traces are tangible
evidence of some past event. For example, we might turn to “garbology” (observing the trash
of subjects being studied) as a way of fi nding out how much recycling of plastic milk bottles
occurs. A soft drink company might do a litter audit to assess how much impact its alumi-
num cans have on the countryside. A fast-food company such as Wendy’s might measure the
amount of graffi ti on buildings located adjacent to prospective location sites as a means of
estimating the crime potential for each site. 9
Four general ways of organizing observations are (1) direct versus indirect, (2) covert versus overt, (3) structured versus unstructured, and (4) in situ versus invented.
Observation methods are techniques in which phenomena of interest involving people, objects, and/or activities are systematically observed and documented.
Observing behavior as it occurs is called direct observation.
With indirect observation, the researcher observes the effects or results of the behavior rather than the behavior itself. Types of indirect observations include archives and physical traces.
M06_BURN3261_08_GE_C06.indd 146M06_BURN3261_08_GE_C06.indd 146 17/08/16 3:51 pm17/08/16 3:51 pm

6-2 OBSERVATION TECHNIQUES 147
Covert Versus Overt Covert versus overt observation refers to the degree with which
subjects are aware that their behavior is being observed. With covert observation , the subject
is unaware that he or she is being observed. An example is a “mystery shopper” who is hired
by a retail store chain to record and report on sales clerks’ assistance and courtesy. One-way
mirrors and hidden cameras are a few of the other ways used to prevent subjects from becom-
ing aware that they are being observed. The aim of this approach is to observe typical behav-
iors; if the subjects were aware they were being watched, they might change their behavior,
resulting in observations of atypical behavior. If you were a store clerk, how would you act
if the department manager told you he would be watching you for the next hour? You would
probably be on your best behavior for those 60 minutes. Covert observation has proved illu-
minating in studies of parents and children shopping together in supermarkets. 10 With direct
questions, parents might feel compelled to say that their children are always on their best
behavior while shopping.
Sometimes it is impossible for the respondent to be unaware that someone is watching.
Examples of overt observation , all of which require the subjects’ knowledge, include labora-
tory settings, recordings of sales calls, People Meters (Nielsen Media Research’s device that
is attached to a television set to record when and to what station a set is tuned), and Nielsen
Audio’s Personal Portable Meter. Because people might be infl uenced by knowing they are
being observed, it is wise to always minimize the presence of the observer to the maximum
extent possible.
Structured Versus Unstructured Structured versus unstructured observation refers to
the degree to which the phenomena to be observed are predetermined. When using struc-tured observation techniques, the researcher identifi es beforehand exactly which behaviors
are to be observed and recorded. All other behaviors are “ignored.” Often a checklist or a
standardized observation form is used to isolate the observer’s attention to specifi c factors.
These highly structured observations typically require a minimum of eff ort on the part of the
observer.
Unstructured observation places no restriction on what the observer notes. All behavior
in the episode under study is monitored. The observer watches the situation and records what
he or she deems interesting or relevant. Of course, the observer is thoroughly briefed on the
area of general concern. This type of observation is often used in exploratory research. For
example, Black & Decker might send someone to observe carpenters working at various job
sites as a means of better understanding how the tools are used and to help generate ideas as
to how to design the tools for increased safety.
In Situ Versus Invented In situ versus invented observation refers to the extent that behav-
ior is observed in its natural environment versus in an artifi cial, or invented, environment.
With in situ observation , the researcher observes the behavior exactly as it happens in a natu-
ral environment. For instance, a motion-sensitive camera might be placed in people’s kitchens
to observe the behavior of family members as they inspect the contents of their refrigerator,
prepare breakfast, unpack groceries, and conduct the many other routine activities that occur
in kitchens. Mystery shopping is done in situ. Midas improved its service quality by having
customers make videos of themselves as they made car service appointments. 11
Invented observation occurs when the researcher creates a simulated environment in
order to improve understanding of a phenomenon. For example, a researcher might ask people
to make a video as they try out a new toilet bowl cleaner. Whirlpool has test kitchens at its
headquarters, in which researchers observe volunteers conducting kitchen-related tasks as a
means to improve the performance of Whirlpool appliances. 12
APPROPRIATE CONDITIONS FOR THE USE OF OBSERVATION Certain conditions must be met before a researcher can successfully use observation as a
marketing research tool. First, the event must occur during a relatively short time interval, and
When the respondent knows he or she is being observed, this form of research is known as overt observation.
With covert observation, the subject is unaware that he or she is being observed.
The researcher identifi es beforehand which behaviors are to be observed and recorded in structured observation.
In using unstructured observation, there are no predetermined restrictions on what the observer records.
With in situ observation, the researcher observes the behavior exactly as it happens in a natural environment.
Invented observation occurs when the researcher creates a simulated environment in order to improve understanding of a phenomenon.
M06_BURN3261_08_GE_C06.indd 147M06_BURN3261_08_GE_C06.indd 147 17/08/16 3:51 pm17/08/16 3:51 pm

148 CHAPTER 6 • QUALITATIVE RESEARCH TECHNIQUES
the observed behavior must occur in a public setting. In addition, observation is typically used
when the possibility of faulty recall rules out collecting information by asking the subject.
Short time interval means that the event must begin and end within a reasonably short
time span. Examples include a shopping trip in a supermarket, waiting in a teller line at a
bank, purchasing a clothing item, or observing children as they watch a television program.
Some decision-making processes can take a long time (for example, buying a home), and it
would be unrealistic to observe the entire process. As a result, observational research is usu-
ally limited to scrutinizing activities that can be completed in a relatively short time or to
observing certain phases of those activities with a longer time span.
Public behavior refers to behavior that occurs in a setting the researcher can readily
observe. Actions such as personal hygiene procedures or private worship are not public activi-
ties and therefore are not suitable for observational studies such as those described here.
Faulty recall occurs when actions or activities are so repetitive or automatic that the
observed person cannot recall specifi cs about the behavior under question. For example, peo-
ple cannot recall accurately how many times they looked at their wristwatch while waiting
in a long line to buy a ticket to a best-selling movie or which brands of cookies they looked
at while grocery shopping. Observation is necessary under circumstances of faulty recall to
fully understand the behavior at hand. Faulty recall is one of the reasons that companies have
experimented for many years with mechanical devices to observe these behaviors. 13
ADVANTAGES OF OBSERVATIONAL DATA Observation of humans in their natural context is the approach that has been used by anthro-
pologists for more than 100 years and is an accepted method of conducting marketing
research. 14 Typically, the subjects of observational research are unaware they are being stud-
ied. Because of this, they react in a natural manner, giving the researcher insight into actual,
not reported, behaviors. As previously noted, observational research methods also mean that
there is no chance for recall error. The subjects are not asked what they remember about a
certain action. Instead, they are observed while engaged in the act. In some cases, observa-
tion may be the only way to obtain accurate information. For instance, children who cannot
yet verbally express their opinion of a new toy will do so by simply playing or not playing
with the toy. Retail marketers commonly gather marketing intelligence about competitors and
about their own employees’ behaviors by hiring the services of mystery shoppers who pose
as customers but who are actually trained observers. 15 Of course, mystery shopping should be
conducted in an ethical manner, as described in the MRA code of ethics excerpt in Marketing
Research Insight 6. 2 . In some situations, data can be obtained with better accuracy and less
cost by using observational methods as opposed to other means. For example, counts of in-
store traffi c can often be made by means of observational techniques more accurately and
less expensively than by using survey techniques. Also, mixed methods researchers will use
observation techniques to supplement and complement other techniques. 16
LIMITATIONS OF OBSERVATIONAL DATA The limitations of observation refl ect the limitations of qualitative research in general. With
direct observation, typically only small numbers of subjects are studied and usually under
special circumstances, so their representativeness is a concern. 17 This factor, plus the subjec-
tive interpretation required to explain the observed behavior, usually forces the researcher to
consider his or her conclusions to be tentative. Certainly, the greatest drawback of all obser-
vational methods is the researcher’s inability to pry beneath the behavior observed and to
interrogate the person on motives, attitudes, and all of the other unseen aspects of why what
was observed took place.
Only when these feelings are relatively unimportant or are readily inferred from the behav-
ior is it appropriate to use observational research methods. For example, facial expression
Observational research has the advantage of seeing what consumers actually do instead of relying on their self-report of what they think they do.
The major disadvantages of observational research are the generally small sample size, which may not be representative of the population, and the inability to determine consumers’ motives, attitudes, and intentions.
M06_BURN3261_08_GE_C06.indd 148M06_BURN3261_08_GE_C06.indd 148 17/08/16 3:51 pm17/08/16 3:51 pm
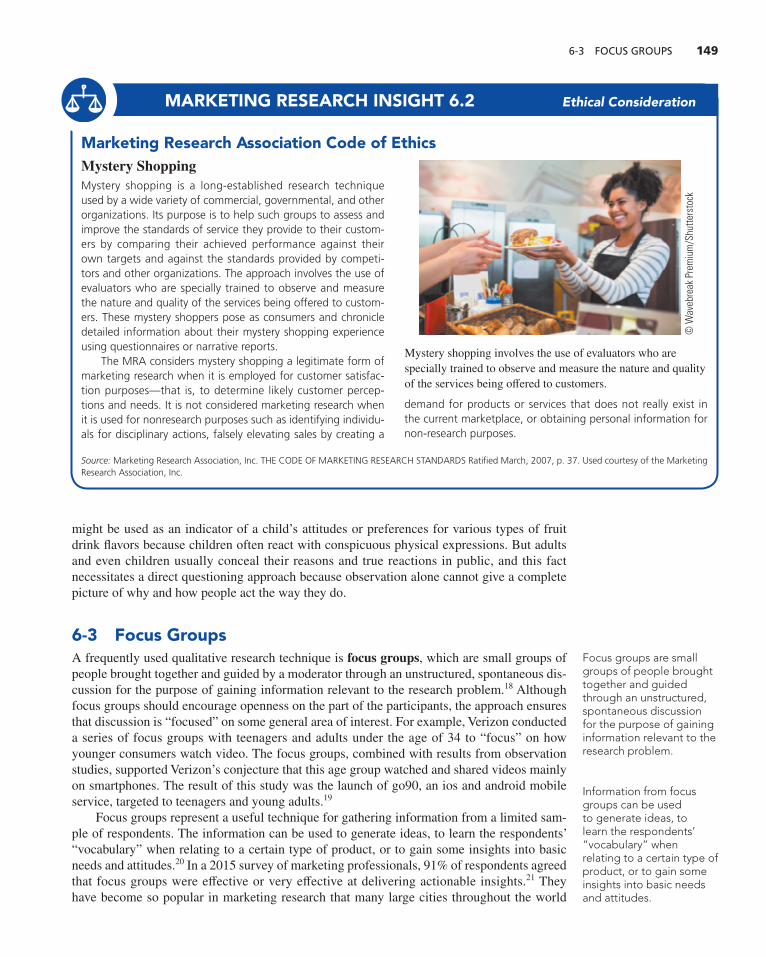
6-3 FOCUS GROUPS 149
might be used as an indicator of a child’s attitudes or preferences for various types of fruit
drink fl avors because children often react with conspicuous physical expressions. But adults
and even children usually conceal their reasons and true reactions in public, and this fact
necessitates a direct questioning approach because observation alone cannot give a complete
picture of why and how people act the way they do.
6- 3 Focus Groups A frequently used qualitative research technique is focus groups , which are small groups of
people brought together and guided by a moderator through an unstructured, spontaneous dis-
cussion for the purpose of gaining information relevant to the research problem. 18 Although
focus groups should encourage openness on the part of the participants, the approach ensures
that discussion is “focused” on some general area of interest. For example, Verizon conducted
a series of focus groups with teenagers and adults under the age of 34 to “focus” on how
younger consumers watch video. The focus groups, combined with results from observation
studies, supported Verizon’s conjecture that this age group watched and shared videos mainly
on smartphones. The result of this study was the launch of go90, an ios and android mobile
service, targeted to teenagers and young adults. 19
Focus groups represent a useful technique for gathering information from a limited sam-
ple of respondents. The information can be used to generate ideas, to learn the respondents’
“vocabulary” when relating to a certain type of product, or to gain some insights into basic
needs and attitudes. 20 In a 2015 survey of marketing professionals, 91% of respondents agreed
that focus groups were eff ective or very eff ective at delivering actionable insights. 21 They
have become so popular in marketing research that many large cities throughout the world
Focus groups are small groups of people brought together and guided through an unstructured, spontaneous discussion for the purpose of gaining information relevant to the research problem.
Information from focus groups can be used to generate ideas, to learn the respondents’ “vocabulary” when relating to a certain type of product, or to gain some insights into basic needs and attitudes.
Marketing Research Association Code of Ethics Mystery Shopping Mystery shopping is a long-established research technique used by a wide variety of commercial, governmental, and other organizations. Its purpose is to help such groups to assess and improve the standards of service they provide to their custom-ers by comparing their achieved performance against their own targets and against the standards provided by competi-tors and other organizations. The approach involves the use of evaluators who are specially trained to observe and measure the nature and quality of the services being offered to custom-ers. These mystery shoppers pose as consumers and chronicle detailed information about their mystery shopping experience using questionnaires or narrative reports.
The MRA considers mystery shopping a legitimate form of marketing research when it is employed for customer satisfac-tion purposes—that is, to determine likely customer percep-tions and needs. It is not considered marketing research when it is used for nonresearch purposes such as identifying individu-als for disciplinary actions, falsely elevating sales by creating a
demand for products or services that does not really exist in the current marketplace, or obtaining personal information for non-research purposes.
MARKETING RESEARCH INSIGHT 6. 2 Ethical Consideration
Mystery shopping involves the use of evaluators who are
specially trained to observe and measure the nature and quality
of the services being off ered to customers .
© W
aveb
reak
Pre
miu
m/S
hutt
erst
ock
Source: Marketing Research Association, Inc. THE CODE OF MARKETING RESEARCH STANDARDS Ratifi ed March, 2007, p. 37. Used courtesy of the Marketing Research Association, Inc.
M06_BURN3261_08_GE_C06.indd 149M06_BURN3261_08_GE_C06.indd 149 05/09/16 11:54 AM05/09/16 11:54 AM

150 CHAPTER 6 • QUALITATIVE RESEARCH TECHNIQUES
have companies that specialize in performing focus group research. You will most certainly
encounter focus group research if you become a practicing marketing manager. Focus groups
are an invaluable means of regaining contact with customers when marketers have lost touch,
and they are helpful in learning about new customer groups.
HOW FOCUS GROUPS WORK In a traditional focus group, a small group of people (about 6 to 12 persons) are brought
together in a dedicated room, with a one-way mirror for client viewing, for about two hours.
Focus group participants are guided by moderators . The training and background of the
moderator are extremely important for the success of the focus group. 22 Focus group modera-
tors are responsible for creating an atmosphere that is conducive to openness, yet they must
make certain the participants do not stray too far from the central focus of the study. Good
moderators have excellent observation, interpersonal, and communication skills to recognize
and overcome threats to a productive group discussion. They must be able to tactfully encour-
age quieter participants to open up and give their opinions, while making sure that no one
participant dominates the group. They are prepared, experienced, and armed with a detailed
list of topics to be discussed. 23 It is also helpful if focus group moderators can eliminate any
preconceptions on discussion topics from their minds. The best moderators are experienced,
enthusiastic, prepared, involved, energetic, and open-minded. 24 With an incompetent modera-
tor, the focus group can become a disaster.
Focus group company principals are sometimes referred to as qualitative research con-
sultants (QRCs). The QRC prepares a focus group report that summarizes the information
provided by the focus group participants relative to the research questions. Two factors are
crucial when analyzing the data. First, some sense must be made by translating the statements
of participants into categories or themes and then reporting the degree of consensus apparent
in the focus groups. 25 Second, the demographic and buyer behavior characteristics of focus
group participants should be judged against the target market profi le to assess to what degree
the groups represent the target market.
The focus group report refl ects the qualitative aspect of this research method. It lists all
themes that have become apparent, and it notes any diversity of opinions or thoughts expressed
by the participants. It will also have numerous verbatim excerpts provided as evidence. 26
In fact, some reports include complete transcripts or video recordings of the focus group
Focus group participants’ comments are encouraged and guided by moderators.
Active Learning
Learn More About Qualitative Research
Go to the Qualitative Research Consultants Association website ( www.qrca.org ). Click on “About Qual Research” to access the “When to Use Qualitative Research” page. Now let’s consider the example of recommendations made by a university’s faculty senate to the admin-istration. For each of these recommendations, indicate whether qualitative research should be used to evaluate students’ opinions. What are the pros and cons of using this form of research in each case?
1. Require all students to park at a central parking lot two miles from campus and take shuttle buses to campus.
2. Increase tuition by 10%. 3. Schedule classes on Monday/Wednesday or Tuesday/Thursday, leaving Friday for
student organization meetings and group project work. 4. Require students to take at least 18 hours of course work during summer school. 5. Require every student to purchase and bring an iPad to class.
M06_BURN3261_08_GE_C06.indd 150M06_BURN3261_08_GE_C06.indd 150 17/08/16 3:51 pm17/08/16 3:51 pm

6-3 FOCUS GROUPS 151
discussion. This information is then used as the basis for further research studies or even for
more focus groups. If the information is used for subsequent focus groups, the client uses
the fi rst group as a learning experience, making any adjustments to the discussion topics as
needed to improve the research objectives. Although focus groups may be the only type of
research used to tackle a marketing problem or question, they are also used as a beginning
point for quantitative research eff orts; that is, a focus group phase may be used to gain a feel
for a specifi c survey that will ultimately generate standardized information from a representa-
tive sample.
ONLINE FOCUS GROUPS The online focus group is a contemporary focus
group in which respondents communicate via an
Internet forum, which clients can observe. Typically,
online focus groups allow the participants the con-
venience of being seated at their own computers,
while the moderator operates out of his or her offi ce.
The online focus group is “virtual” in that it com-
municates electronically and does not have face-to-
face contact. For example, FocusVision Worldwide
( http://www.focusvision.com ) has an online focus
group system using webcams and voice communi-
cation that connect the moderator and focus group
members in real time while clients can observe and
send chat messages to the moderator during the
discussion if they wish. Online focus groups have
the following advantages over traditional focus
groups: (1) no physical setup is necessary, (2) tran-
scripts are captured on fi le in real time, (3) participants can be in widely separated geo-
graphic locations, (4) participants are comfortable in their home or offi ce environments, and
(5) the moderator can exchange private messages with individual participants. Innovative
approaches are possible, as some researchers combine online with telephone communica-
tions for maximum eff ectiveness. 27 Nonetheless, there are some disadvantages to online
focus groups: (1) observation of participants’ body language is not possible, (2) participants
cannot physically inspect products or taste food items, and (3) participants can lose interest
or become distracted. 28
A variation of the online focus group is conducted in a traditional setting, but the cli-
ent watches online. For example, Focus Pointe Global ( http://www.focuspointeglobal.com ),
which operates facilities in 18 cities in the United States, off ers clients the ability to view
focus groups online using streaming video. The focus group is conducted at a traditional
focus group facility with the participants seated with the moderator. This type of online focus
group allows several members of the client fi rm to observe the focus group at their own loca-
tion. This saves the client fi rm travel expense and time. While they will not replace traditional
focus groups, online focus groups off er a viable research method. 29
ADVANTAGES OF FOCUS GROUPS The four major advantages of focus groups are that (1) they generate fresh ideas;
(2) they allow clients to observe their participants; (3) they may be directed at under-
standing a wide variety of issues, such as reactions to a new food product, brand logo, or
television ad; and (4) they allow fairly easy access to special respondent groups, such as
lawyers or doctors (whereas it may be very diffi cult to fi nd a representative sample of these
groups).
Respondents to an online focus group communicate via the Internet, and clients may observe the virtual chat.
Online focus group participants are in relaxed surroundings, but they
can become bored or distracted.
© S
potm
atik
Ltd
/Shu
tter
stoc
k
M06_BURN3261_08_GE_C06.indd 151M06_BURN3261_08_GE_C06.indd 151 17/08/16 3:51 pm17/08/16 3:51 pm

152 CHAPTER 6 • QUALITATIVE RESEARCH TECHNIQUES
DISADVANTAGES OF FOCUS GROUPS There are three major disadvantages to focus groups: (1) They do not constitute representative
samples; therefore, caution must be exercised in generalizing fi ndings; (2) success is greatly
dependent on the ability of the moderator; and (3) it is sometimes diffi cult to interpret the
results of focus groups (the moderator’s report is based on a subjective evaluation of partici-
pants’ statements and interactions).
WHEN SHOULD FOCUS GROUPS BE USED? When the research objective is to explore or describe rather than predict, focus groups may be
an alternative. They work well for the following situations: A company wants to know “how
to speak” to its market; what language and terms do its customers use? What are some new
ideas for an ad campaign? Will a new service we are developing have appeal to customers,
and how can we improve it? How can we better package our product? 30 In all these cases,
focus groups can describe the terms customers use; their reactions and ideas for ads; the rea-
sons why service, product, or package features are appealing; and suggestions for improving
the company’s delivery of benefi ts. Refer to the following section, “Some Objectives of Focus
Groups,” for elaboration on when focus groups are particularly useful.
WHEN SHOULD FOCUS GROUPS NOT BE USED? Because focus groups are based on a small number of persons who are not representative of
some larger population, care must be exercised in using focus groups. If the research objec-
tive is to predict, focus groups should not be used. For example, if we show 12 persons in a
focus group a new product prototype and 6 say they will buy it, it is not defensible to predict
that 50% of the population will buy it. Likewise, if the research will dictate a major, expensive
decision, the company should not rely solely on the use of focus groups. If a high-stakes deci-
sion is at hand, research that is representative of some population and that has some known
margin of error (quantitative research) should be used.
SOME OBJECTIVES OF FOCUS GROUPS There are four main objectives of focus groups: (1) to generate ideas; (2) to understand con-
sumer vocabulary; (3) to reveal consumer needs, motives, perceptions, and attitudes about
products or services; and (4) to understand fi ndings from quantitative studies.
Focus groups generate ideas for managers to consider. Krispy Kreme has conducted
focus groups to help design new product choices and stores. If managers consistently hear that
their customers prefer their doughnuts but go elsewhere for gourmet coff ees, this gives Krispy
Kreme management ideas for changing their product mix to include gourmet coff ee. Mothers
talking about the diffi culties of strapping children in car restraint seats give designers of these
products ideas. Consumers discussing the diffi culties of moving furniture give rise to innova-
tions in furniture designed for portability.
To understand consumer vocabulary entails using a focus group to stay abreast of the
words and phrases consumers use when describing products to improve communications
about those products or services. Such information may help in advertising copy design or in
the preparation of an instruction pamphlet. This knowledge refi nes research problem defi ni-
tions and also helps structure questions for use in later quantitative research.
The third objective—to reveal consumer needs, motives, perceptions, and attitudes
about products or services—involves using a focus group to refresh the marketing team’s
understanding of what customers really feel or think about a product or service. Alter-
natively, managers may need early customer reactions to changes being considered in
products or services. 31 Focus groups are commonly used during the exploratory phase of
research. 32 This application is useful in generating objectives to be addressed by subse-
quent research.
M06_BURN3261_08_GE_C06.indd 152M06_BURN3261_08_GE_C06.indd 152 17/08/16 3:51 pm17/08/16 3:51 pm

6-3 FOCUS GROUPS 153
Finally, to understand fi ndings from quantitative studies requires using focus groups to
better comprehend data gathered from other surveys. Sometimes a focus group can reveal
why the fi ndings came out a particular way. For example, a bank image survey showed that a
particular branch consistently received lower scores on “employee friendliness.” Focus group
research identifi ed the problem as being several frontline employees who were so concerned
with effi ciency that they appeared to be unfriendly. The bank revised its training program to
remedy the problem.
Warner-Lambert is one company that has successfully used focus groups to accomplish
all four of these objectives. Its consumer health products group, which markets over-the-
counter health and beauty products as well as nonprescription drugs, uses focus groups exten-
sively. 33 In fact, Warner-Lambert uses a combination of qualitative research techniques to gain
background information, to reveal needs and attitudes related to health and beauty products,
and to stimulate brainstorming new ideas. Focus groups have been useful in understanding
basic shifts in consumer lifestyles, values, and purchase patterns.
OPERATIONAL ASPECTS OF TRADITIONAL FOCUS GROUPS Before a traditional focus group is conducted, certain operational questions should be
addressed. It is important to decide how many people should take part in a focus group, who
they should be, how they will be selected and recruited, and where they should meet. General
guidelines exist for answering these questions. A discussion of each follows.
How Many People Should Be in a Focus Group? According to standard industry
practice, the optimal size of a traditional focus group is 6 to 12 people. A small group (fewer
than six participants) is not likely to generate the energy and group dynamics necessary for a
truly benefi cial focus group session. A small group will often result in awkward silences and
force the moderator to take too active a role in the discussion just to keep the discussion alive.
Similarly, a group with more than a dozen participants may prove too large to be conducive to
a natural discussion. As a focus group becomes larger in size, it tends to become fragmented.
Those participating may become frustrated by the inherent digressions and side comments.
Conversations may break out among two or three participants while another is talking. This
situation places the moderator in the role of disciplinarian, in which he or she is constantly
calling for quiet or order rather than focusing the discussion on the issues at hand.
Unfortunately, it is often diffi cult to predict the exact number of people who will attend
the focus group interview. Ten may agree to participate, and only 4 may show up; 14 may
be invited in hopes that 8 will show up, and all 14 may arrive. Of course, if this occurs, the
researcher faces a judgment call as to whether or not to send some home. There is no guar-
anteed method to ensure a successful participation ratio. Incentives (which will be discussed
later) are helpful but defi nitely not a certain way of gaining acceptance. Although 6 to 12
is the ideal focus group size, because of the uncertainty of participation, focus groups with
fewer than 6 or more than 12 do take place.
Who Should Be in the Focus Group? It is generally believed that the best focus groups
are composed of participants who share homogeneous characteristics. This requirement is
sometimes automatically satisfi ed by the researcher’s need to have particular types of people
in the focus group. For instance, the focus group may be comprised of executives who use sat-
ellite phones, building contractors who specialize in building homes over $500,000 in value,
or salespeople who are experiencing some common customer service diffi culty. With con-
sumer products, the focus group’s common trait may just be that everyone buys salsa.
The need for similar demographic or other relevant characteristics in focus group mem-
bers is accentuated by the fact that participants are typically strangers. In most cases, they are
not friends or even casual acquaintances, and many people feel intimidated or at least hesitant
to voice their opinions and suggestions to a group of strangers. But participants typically feel
The optimal size of a focus group is 6 to 12 people.
Ideally, focus group members should be homogeneous.
M06_BURN3261_08_GE_C06.indd 153M06_BURN3261_08_GE_C06.indd 153 17/08/16 3:51 pm17/08/16 3:51 pm

154 CHAPTER 6 • QUALITATIVE RESEARCH TECHNIQUES
more comfortable once they realize they have similarities such as their age (they may all be in
their early 30s), job situations (they may all be junior executives), family composition (they
may all have preschool children), purchase experiences (they may all have bought a new car
in the past year), or even leisure pursuits (they may all play tennis). Furthermore, by con-
ducting a group that is as homogeneous as possible with respect to demographics and other
characteristics, the researcher is assured that diff erences in these variables will be less likely
to confuse the issue being discussed.
How Many Focus Groups Should Be Conducted? The answer to how many focus
groups should be conducted is always “more than one.” Because each focus group tends to
have its own personality, fi ndings should never be based off a single focus group. Technically
speaking, the rule is to hold as many focus groups as it takes to reach a saturation point in
terms of gaining new information. In reality, however, focus groups take a great deal of plan-
ning, and it is hard to know in advance exactly how many to conduct. Generally speaking,
three to four focus groups are conducted for small projects, and nine to twelve focus groups
are conducted for large projects. For example, if Kraft Cracker Barrel Cheese was testing
ideas for a new advertising campaign via focus groups, the Cracker Barrel brand team might
conduct a total of nine focus groups: three each involving heavy users, light users, and non-
users of Cracker Barrel cheese in the cities of Boston, Chicago, and San Diego.
How Should Focus Group Participants Be Recruited and Selected? As you can
guess, the selection of focus group participants is determined largely by the purpose of the
focus group. For instance, if the purpose is to generate new ideas on GPS system improve-
ments, the participants must be consumers who own a GPS system. If the focus group is
intended to elicit building contractors’ reactions to a new type of central air-conditioning unit,
it will be necessary to recruit building contractors. It is not unusual for companies to provide
customer lists or for focus group recruiters to work from secured lists of potential participants.
For instance, with building contractors, the list might come from the local Yellow Pages or
a building contractor trade association membership roster. In any case, it is necessary to ini-
tially contact prospective participants by telephone to qualify them and then to solicit their
cooperation in the focus group. Occasionally, a focus group company may recruit by request-
ing shoppers in a mall to participate, but this approach is rare.
As we noted earlier, “no-shows” are a problem with focus groups, and researchers have
at least two strategies to entice prospective participants. Incentives are used to encourage
recruits to participate in focus groups. These incentives range from monetary compensation
for the participant’s time to free products or gift certifi cates. Many focus group companies
use callbacks, email, or text messages during the day immediately prior to the focus group to
remind prospective participants they have agreed to take part. If one prospective participant
indicates that some confl ict has arisen and he or she cannot be there, it is then possible to
recruit a replacement. Neither approach works perfectly, as we indicated earlier, and anticipat-
ing how many participants will show up is always a concern. Some focus group companies
have a policy of overrecruiting, and others have lists of people they can rely on to participate,
given that they fi t the qualifi cations.
Where Should a Focus Group Meet? Since the focus group discussion will generally
last 90 minutes to two hours, it is important that the physical arrangement of the group be
comfortable and conducive to group discussion. Focus groups ideally are conducted in large
rooms set up in a format suitable given the research objective. In some cases, in which it is
important to have face-to-face interaction, a round table format would be ideal. Other formats
are more suitable for tasting foods or beverages or for viewing video. The overriding consid-
eration is that the moderator has good eye contact with every participant. 34
Focus groups are held in a variety of settings. An advertising company conference room,
a moderator’s home, a respondent’s home, the client’s offi ce, hotels, and meeting rooms at
Selection of focus group members is determined by the purpose of the focus group.
More than one focus group should always be conducted.
M06_BURN3261_08_GE_C06.indd 154M06_BURN3261_08_GE_C06.indd 154 17/08/16 3:51 pm17/08/16 3:51 pm

6-3 FOCUS GROUPS 155
churches are all locations in which focus groups can
be held. Aside from a seating arrangement in which
participants can all see one another, the second critical
requirement in selecting a meeting place is to fi nd one
quiet enough to permit an intelligible audiotaping of the
sessions. Marketing research fi rms with focus group
facilities similar to those we described at the beginning
of this section off er ideal settings for focus groups since
they are specifi cally set up for focused discussions, with
recording equipment that is ready to be used and one-
way mirrors through which brand teams can observe
focus groups in progress.
When Should the Moderator Become Involved in the Research Project? Moderators should not
be viewed as robots needed to lead a discussion who
may be hired at the last minute to run the focus groups.
The focus group’s success depends on the participants’
involvement in the discussion and in their understanding of what is being asked of them. Pro-
ductive involvement is largely a result of the moderator’s eff ectiveness, which in turn is depen-
dent on his or her understanding of the purpose and objectives of the interview. Unless the
moderator understands what information the researcher is after and why, he or she will not be
able to phrase questions eff ectively. It is good policy to have the moderator contribute to the
development of the project’s goals to guide the discussion topics. By aiding in the formation
of the topics (questions), he or she will be familiar with them and will be better prepared to
conduct the group. It is important when formulating questions that they be organized into a
logical sequence and that the moderator follow this sequence to the furthest extent possible.
The moderator’s introductory remarks are infl uential; they set the tone for the session. All sub-
sequent questions should be prefaced with a clear explanation of how the participants should
respond, for example, how they really feel personally, not how they think they should feel. This
allows the moderator to establish a rapport with participants and to lay the groundwork for the
interview’s structure.
How Are Focus Group Results Reported and Used? As we noted earlier, focus groups
report some of the subtle and obscure features of the relationships among consumers and
products, advertising, and sales eff orts. They furnish qualitative data on matters such as con-
sumer language; emotional and behavioral reactions to advertising; lifestyle; relationships; the
product category and specifi c brand; and unconscious consumer motivations relative to prod-
uct design, packaging, promotion, or any other facet of the marketing program under study.
However, focus group results are qualitative and not perfectly representative of the general
population.
What Other Benefi ts Do Focus Groups Offer? The focus group approach is fi rmly
entrenched in the marketing research world as a mainstay technique. Because they are of rea-
sonable total cost when compared with large-scale quantitative surveys involving a thousand
or more respondents, adaptable to managers’ concerns, and capable of yielding immedi-
ate results, focus groups are an appealing qualitative research method. Moreover, face-to-
face focus groups are becoming common worldwide, and online focus groups are boosting
the popularity of focus groups with new capabilities. 35 They are a unique research method
because they permit marketing managers to see and hear the market. Managers become so
engrossed in their everyday problems and crises that they fi nd it refreshing to see their cus-
tomers in person. It is common for marketing managers to come away from a focus group
session observation stimulated and energized to respond to the market’s desires.
Focus group facilities often have one-way mirrors through which a
brand team can observe focus groups in progress.
To learn how NOT to conduct focus groups, go to www.
youtube.com and search for “The #1 Focus Group Moderator in the World.”
© M
arm
aduk
e S
t. J
ohn/
Ala
my
Sto
ck P
hoto
M06_BURN3261_08_GE_C06.indd 155M06_BURN3261_08_GE_C06.indd 155 17/08/16 3:51 pm17/08/16 3:51 pm

156 CHAPTER 6 • QUALITATIVE RESEARCH TECHNIQUES
6- 4 Ethnographic Research Ethnographic research , an approach borrowed from anthropology, is defi ned as a detailed,
descriptive study of a group and its behavior, characteristics, and culture. 36 Ethno refers to
people, and graphy refers to a fi eld of study. Ethnographic research is used in marketing to
gain a deeper and more comprehensive understanding of the consumer and consumer behav-
ior by studying the behavior where it occurs for prolonged periods. Ethnography is particu-
larly eff ective for studying trends, personal habits, lifestyle factors, and the eff ect of social
and cultural context on consumption behavior. Ethnography uses several diff erent types of
research, including immersion, participant observation, and informal and ongoing in-depth
interviewing. Ethnographers pay close attention to words, metaphors, symbols, and stories
people use to explain their lives and communicate with one another. 37
Marketers increasingly use ethnography to study consumer behavior, such as how
people act when buying cars or in restaurants, or how people change when they become
parents. 38 Kellogg’s regularly uses ethnographic techniques to study breakfast and snack-
ing behavior, particularly in developing nations, such as South Africa, India, and Mexico.
According to Mike Mickunas, vice president of global insights and planning at Kellogg’s,
the company gets its top leaders involved in the ethnographic studies. Mickunas states, “It’s
something when your CEO comes into your business meeting in Mumbai and is looking at a
portfolio plan and can ask questions based on his direct experience of sitting across the table
from a mom over breakfast.” 39 Many marketing research companies and client-side market-
ing research departments regularly hire employees trained in ethnography. Some marketing
research companies, such as Context-Based Research Group and Housecalls, Inc., specialize
in ethnography.
One popular form of ethnographic research is called the shopalong . Just as it sounds,
shopalongs are a type of research in which a researcher accompanies a shopper (with permis-
sion) on a shopping trip and observes and records the shopper’s activities. The researcher gen-
erally audiotapes, videotapes, or takes photos of the shopper as he or she does the shopping.
The participant is often interviewed prior to or after conducting the shopping activity.
Here are other examples of ethnographic marketing research provided by the Qualitative
Research Consultants Association: 40
■ Observing mothers at home making dinner for the household ■ Observing what men eat at breakfast and why ■ Walking with seniors in their walking groups and listening to them discuss their hopes,
fears, worries, health, and family/friends ■ Watching people use a product they have been given days ago to find out how it fit into
their routine (test product or a competitive product) ■ Observing the “before and after” of someone taking a medication and how it makes or
does not make a difference in that person’s life
MOBILE ETHNOGRAPHY A type of ethnography that has emerged as smartphone ownership has risen is mobile ethnog-raphy . Mobile ethnography is a type of marketing research in which respondents document
their own experiences through their mobile phones. Mobile ethnography is sometimes called
mobile qualitative, or simply mobile qual. With mobile ethnography, researchers recruit
respondents to record their own activities and emotions, using their phones to take photos
and videos accompanied by audio explanations. For example, respondents might be asked to
document their own participation in milestone events, such as celebrations or funerals, or in
more mundane activities such as making breakfast or taking the dog for a walk. Mobile eth-
nography can be especially useful for documenting private behavior, such as waking up in the
morning or administrating medical treatments.
Ethnographic research is a term borrowed from anthropology to describe a detailed, descriptive study of a group and its behavior, characteristics, culture, and so on.
Shopalongs are a type of research in which a researcher accompanies a shopper (with permission) on a shopping trip and observes and records the shopper’s activities.
Learn about ethnographic research by going to www.youtube.
com and searching for “Sports Fan Ethnography.”
Mobile ethnography is a type of marketing research in which respondents document their own experiences through their mobile phones.
M06_BURN3261_08_GE_C06.indd 156M06_BURN3261_08_GE_C06.indd 156 17/08/16 3:51 pm17/08/16 3:51 pm

6-4 ETHNOGRAPHIC RESEARCH 157
The advantage of mobile ethnography is that it can uncover authentic behavior and feel-
ings that a researcher might miss, with respondents viewed as the experts of their own lives.
A limitation is that respondents are often not aware of their own habitual or unconscious behav-
ior as they interact with products and services. As a result, they might miss important insights
that a trained researcher would notice. This has led some researchers to say that, while mobile
methods are valuable, they cannot legitimately be called ethnography. 41 A number of mobile
apps—some free and some for a price—have been developed that provide tools to assist with
mobile ethnography, including MyServiceFellow, QualBoard, Field Notes, and MyInsights.
Marketing Research Insight 6. 3 provides some examples of how mobile ethnography is used.
NETNOGRAPHY Netnography (InterNET plus ethNOGRAPHY) is the name for the ethnographic study of
online activities. Coined by Robert Kozinets, netnography is used to examine the online inter-
actions of individuals and communities on the Internet, as well as the relationships between
Applications of Mobile Ethnography As smartphone ownership has risen, mobile ethnography has become an increasingly prevalent form of marketing research. Fol-lowing are three examples of studies using mobile ethnography.
Entertaining at Home Kraft Foods paired with the marketing research company BrainJuicer to explore consumers’ emotional relationship with food. BrainJuicer recruited a diverse group of 150 U.S. partici-pants who agreed to host and document a self-catered event. Respondents were asked to use their smartphones to tell the story of their event, including shopping, planning, prepping, holding the actual event, and cleaning up. The research team felt that allowing the respondents to document their own event brought to life both the stress and reward that accom-pany entertaining. Based on the videos, pictures, and texts that resulted from this project, Kraft uncovered 16 themes related to entertaining, leading to new ideas for product innovation.
Touring Museums A team of tourism researchers wished to understand the experi-ence of Generation Y consumers in museums. Using an app designed for mobile ethnography, MyServiceFellow, participants were asked to rate and provide comments on their experiences as they toured the National Museum of Australia in Canberra. The participants refl ected on a number of experiences in their tour, from parking, to interactions with the staff, to their overall museum experience. The fi ndings highlighted problems, such as confusing signs in the parking area, and positive elements, which included the helpfulness of the museum staff.
Caring for Hair Procter & Gamble teamed up with the research company Rev-elation to examine hair care among U.S. Latinos. Revelation recruited 20 Latinos to perform a series of exercises over a three-day period, using their smartphones to provide text and images. The activities were designed to increase knowledge of the respondents’ ideas of health and beauty. The results allowed P&G to gain a richer understanding of the defi nition of healthy hair, providing insights for its product development department.
MARKETING RESEARCH INSIGHT 6. 3 Digital Marketing Research
Mobile ethnography can uncover authentic behavior and
feelings that a researcher might miss, with the participants
viewed as the experts of their own lives.
Sources: Appleton, E. (2014, April 3). Mobile qualitative—How does it fi t in the research toolkit? GreenBook. Retrieved from http://www.greenbookblog.org/2014/04/03/mobile-qualitative-how-does-it-fi t-in-the-research-toolkit/ ; Hunt, A. (2014, December). Mobile ethnography let Kraft capture the highs and lows of party planning and hosting. Quirk’s Marketing Research Review , 28 (12), 30–33; Muskat, M., Muskat, B., Zehrer, A., & Johns, R. (2013, September). Generation Y: Evaluating services experiences through mobile ethnography. Tourism Review , 68 (3), 55–71.
Netnography is the name for the ethnographic study of online activities.
© G
aret
h B
oden
/Pea
rson
Edu
cati
on
M06_BURN3261_08_GE_C06.indd 157M06_BURN3261_08_GE_C06.indd 157 17/08/16 3:51 pm17/08/16 3:51 pm

158 CHAPTER 6 • QUALITATIVE RESEARCH TECHNIQUES
people and electronics. 42 Netnography can be applied to the study of user-generated content
on social media (see Chapter 5 ) . Netnographic studies have been used to examine how con-
sumers share style ideas on a Swedish fashion blog 43 and how individuals get support for
health-related goals through social media sites. 44
6- 5 Marketing Research Online Communities A popular and growing trend in marketing research is the use of marketing research online com-munities to gain insights, with about half of marketing research professionals in a 2014 survey
claiming that their fi rm has used this research technique. 45 Marketing research online communi-ties (MROCs), also called online panels, are groups of respondents that are brought together online
to interact, provide opinions and ideas, and complete tasks. Online communities are inexpensive
and fl exible, allowing a wide variety of data to be collected, including posts, photos, and videos.
Online communities can complete a number of tasks, including responding to open-ended ques-
tions, providing product and advertising feedback, keeping journals, and taking mini-polls using
computers, tablets, or mobile phones. Creative tasks can be assigned to online communities, such
as asking members for ideas for a name for a product or requesting recipes that incorporate a food
product as an ingredient. Participants are often asked to share photos or videos of themselves inter-
acting with products or services. Online communities are particularly eff ective for gaining insights
from millennials and Generation Z, since younger consumers are the most avid users of social
media. 46 An example is the online community maintained by MTV to gain insights into the views
of teenagers and young adults, as described by Alison Hillhouse in the introduction to this chapter.
Participants in marketing research online communities are selected according to their demo-
graphics or interests. Project communities are recruited for a short-term project, while ongoing
communities can remain intact for months or even years. Communities should be small enough
to encourage interactivity among members but large enough that suffi cient feedback is produced.
Community sizes vary greatly, but communities often have between 50 and 300 members.
Like focus groups, marketing research online communities have moderators to manage the
conversations. Moderators strive to get truthful, authentic responses from members while main-
taining a positive environment. Since the strength of online communities comes from collaboration
among members, moderators attempt to generate peer-to-peer interactions in the communities.
Some online communities are focused on a single brand, while others discuss a variety
of brands. Among the many brands that have used online communities to help shape their
message are Dannon Activia yogurt and National Car Rental. Some companies, such as MTV,
create their own brand-centered communities. More commonly, companies contract with
marketing research suppliers to host the communities. Among the many marketing research
companies that host online communities are CSpace, MarketVision, and C+R Research. Some
marketing research companies have apps to support activities of their online communities
and allow community members to post material easily to their mobile devices. For example,
Gongos Research has an app called iCommunities for its members to use.
In one example of the use of online communities, the marketing research fi rm Communi-
space collaborated with the Advertising Research Foundation to examine consumers’ uncon-
scious shopping behavior. Among other activities, community members were asked to participate
in a mobile ethnography activity, in which they were instructed to document anything they saw or
experienced that might aff ect their perceptions of three types of products: grocery products, auto-
mobiles, and mobile devices. The community members uploaded photos and videos that were
also automatically tagged geographically by the app. Insights gained by this research project were
that consumers continue to be heavily infl uenced by advertising and that having fi rsthand experi-
ence with a product is invaluable for getting consumers to ultimately purchase the product. 47
The advantages of marketing research online communities are that they are relatively inex-
pensive and can be assembled quickly. They can accommodate multimedia responses, including
images, audio recordings, and video recordings. They allow unique perspectives of consumers’
lives by providing live examples of how social infl uences work and allowing researchers a greater
Marketing research online communities (MROCs) are groups of people that are brought together online to interact, provide ideas and opinions, and complete tasks.
M06_BURN3261_08_GE_C06.indd 158M06_BURN3261_08_GE_C06.indd 158 17/08/16 3:51 pm17/08/16 3:51 pm

6-6 OTHER QUALITATIVE RESEARCH TECHNIQUES 159
understanding of community dynamics. They are convenient for the participants, since they can
participate in the online activities when they have time and where they are comfortable. Online
communities can provide longitudinal data through long-standing community members. Alterna-
tively, online communities can be convened for a few weeks to participate in a focused project.
Online communities are only appropriate for populations that are online constantly, since
the best members respond to queries promptly. Because of this there is a real danger that com-
munity members do not represent the population of interest well. In addition, it is diffi cult
to keep community members motivated over extended periods of time and members drop
out frequently. In contrast to focus groups, moderators cannot ensure that every community
member participates. In addition, due to the anonymity provided by online communities, there
is no way that moderators can ascertain if community members are being honest. Another
disadvantage of online communities is the large amount of data that they generate. It is often
diffi cult for managers to keep up on a regular basis with the posts. 49 The data produced by
online communities should be organized and reported on a regular basis—else, why bother?
To summarize important diff erences in the three methods, Table 6. 1 compares traditional
focus groups, online focus groups, and marketing research online communities on a number
of factors.
6- 6 Other Qualitative Research Techniques Along with observation techniques, focus groups, ethnographic techniques, and online com-
munities, there are many other qualitative research techniques available to marketing research-
ers. Other such methods include in-depth interviews, protocol analysis, various projective
techniques, and neuromarketing.
IN-DEPTH INTERVIEWS An in-depth interview , commonly referred to as an IDI, is defi ned as a set of probing questions
posed one-on-one to a subject by a trained interviewer to gain an idea of what the respondent
thinks about something or why he or she behaves in a certain way. It is sometimes conducted
TABLE 6. 1 Comparisons of Traditional Focus Groups, Online Focus Groups, and Marketing Research Online Communities (MROCs) 48
In-Person Focus Groups Online Focus Groups MROCs
Interactivity among participants √ √ √
Real-time client viewing √ √ √
High-quality viewing experience √
Full view of body language/facial expressions √
High-quality audio-video recording √
Video accessibility (e.g., archiving, clipping, replay) √
Reduced travel for clients √ √
Reduced travel for moderators √ √
Regional diversity of participants √ √
Communication through computer, tablet, or smartphone √ √
Longitudinal perspective allowed √
Opinion and insights shared anywhere √
Multiple segments can be represented simultaneously
and compared
√
Flexible timing √
An in-depth interview, commonly referred to as an IDI, is defi ned as a set of probing questions posed one-on-one to a respondent by a trained interviewer to gain an idea of what the respondent thinks about something or why he or she behaves in a certain way.
M06_BURN3261_08_GE_C06.indd 159M06_BURN3261_08_GE_C06.indd 159 17/08/16 3:51 pm17/08/16 3:51 pm

160 CHAPTER 6 • QUALITATIVE RESEARCH TECHNIQUES
in the respondent’s home or possibly at a central interviewing location, such as a mall-intercept
facility, where several respondents can be interviewed in depth in a relatively short time.
The objective of in-depth interviews is to obtain unrestricted comments or opinions and to
ask questions that will help the marketing researcher better understand the various dimensions
of these opinions as well as the reasons for them. Of primary importance is the compilation of
the data into a summary report to identify common themes. New concepts, designs, advertis-
ing, and promotional messages can arise from this method. 50 Compared to focus groups, IDIs
are better at investigating complex interrelationships, needs, and motivations for purchasing
behaviors. 51 When IDIs are conducted over the telephone, they are referred to as tele-depth interviews (TDIs) . Some companies use the Internet as a way to display visuals, in which case
the approach is referred to as Web-TDI . 52
There are advantages and disadvantages to in-depth interviewing. Interviewers have the
ability to probe by asking many additional questions based on a participant’s responses. This
enables the research technique to generate rich, deep responses. In-depth responses may be
more revealing in some research situations than responses to predetermined, yes–no questions
typical of a structured survey. If used properly, IDIs can off er great insight into consumer
behavior. 53, 54 However, this advantage also leads to the major disadvantage of in-depth inter-
viewing, which is the lack of structure in the process. Unless interviewers are well trained, the
results may be too varied to give suffi cient insight into the problem. IDIs are especially useful
when the researcher wants to understand decision making on the individual level, details about
how products are used, or the emotional and sometimes private aspects of consumers’ lives. 55, 56
In-depth interviews should be conducted by a trained fi eldworker who is equipped with a
list of topics or open-ended questions. The interviewee is not provided a list of set responses
and then instructed to select one from the list. Rather, the interviewee is encouraged to respond
in his or her own words, and the interviewer is trained in asking probing questions such as
“Why is that so?” “Can you elaborate on your point?” and “Would you give me some specifi c
reasons?” These questions are not intended to tap subconscious motivations; rather, they sim-
ply ask about conscious reasons to help the researcher form a better picture of the respondent’s
thoughts. The interviewer may record responses or take detailed notes. Although it is typical
to conduct face-to-face IDIs, they can be done over the telephone when interviewees are geo-
graphically dispersed. 57 In-depth interviews are versatile, but they require careful planning,
training, and preparation. 58
Laddering is a technique used in in-depth interviews in an attempt to discover how
product attributes are associated with desired consumer values. Essentially, values that are
important to consumers are determined, such as “good health.” Next, researchers determine
which routes consumers take to achieve their values, such as exercising, eating certain foods,
reducing stress, and so on. Finally, researchers attempt to determine which specifi c product
attributes are used as a means of achieving the end result that is the desired value. Through in-
depth interviews researchers may learn that low-sodium foods or “white meats” are instrumen-
tal in achieving “good health.” 59 The term laddering comes from the notion that the researcher
is trying to establish the linkages, or steps, leading from product attributes to values.
The summary report for the in-depth interview will look very similar to one written for
a focus group study; that is, the analyst looks for common themes across several in-depth
interview transcripts, and these are noted in the report. Verbatim responses are included in
the report to support the analyst’s conclusions, and any signifi cant diff erences of opinion that
are found in the respondents’ comments are noted as well. Again, it is vital to use an analyst
who is trained and experienced in interpreting the qualitative data gathered during in-depth
interviews.
PROTOCOL ANALYSIS Protocol analysis involves placing a person in a decision-making situation and asking him or
her to verbalize everything he or she considers when making a decision. This special-purpose
Laddering is a technique used in in-depth interviews in an attempt to discover how product attributes are associated with desired consumer values.
Protocol analysis places people in a decision-making situation and asks them to verbalize everything they considered.
M06_BURN3261_08_GE_C06.indd 160M06_BURN3261_08_GE_C06.indd 160 17/08/16 3:51 pm17/08/16 3:51 pm

6-6 OTHER QUALITATIVE RESEARCH TECHNIQUES 161
qualitative research technique has been developed to peek into the consumer’s decision-
making processes. Often an audio recorder is used to maintain a permanent record of the
person’s thinking. After several people have provided protocols, the researcher reviews them
and looks for commonalities, such as evaluative criteria used, number of brands considered,
types and sources of information used, and so forth.
PROJECTIVE TECHNIQUES Projective techniques involve situations in which participants are placed in (projected into)
simulated activities in the hopes that they will divulge things about themselves that they might
not reveal under direct questioning. Projective techniques are appropriate in situations in
which the researcher is convinced that respondents will be unable or unwilling to relate their
true opinions. Such situations may include socially undesirable behaviors such as smoking or
road rage, illegal practices such as betting on football games, or sensitive behavior such as
using deodorant or dieting.
Five common projective techniques are used by marketers: the word-association test, the
sentence completion test, the picture test, the cartoon or balloon test, and role-playing activity.
A discussion of each follows.
Word-Association Test A word-association test involves reading words to a respondent
who then answers with the fi rst word that comes to mind. These tests may contain over 100
words and usually combine neutral words with words being tested in ads or words involv-
ing product names or services. The researcher then looks for hidden meanings or associations
between responses and the words being tested on the original list. This approach is used to
uncover people’s real feelings about these products or services, brand names, or ad copy. The
time taken to respond, called “response latency,” and/or the respondents’ physical reactions
may be measured and used to make inferences. For example, if the response latency to the word
“duo” is long, it may mean that people do not have an immediate association with the word.
Decision Analyst, Inc., uses word-association tests in its battery of qualitative online
research services. Anywhere from 50 to 75 words are given to online respondents as stimuli.
Respondents then type the fi rst word, association, or image that comes to mind. Sample sizes
are typically 100 to 200 persons, and the entire process lasts about 30 minutes. Decision Ana-
lyst states that this projective technique is helpful in determining awareness or exploring the
imagery or other associations that are linked to brands. 60
Sentence-Completion Test With a sentence-completion test , respondents are given
incomplete sentences and asked to complete them in their own words. The researcher then
inspects these sentences to identify themes or concepts. The notion here is that respondents
will reveal something about themselves in their responses. For example, suppose that Lipton
is interested in expanding its hot bagged tea market to teenagers. A researcher might recruit
high school students and instruct them to complete the following sentences:
Someone who drinks hot tea is _______________________________________________ .
Hot tea is good to drink when ________________________________________________ .
Making hot tea is __________________________________________________________ .
My friends think tea is ______________________________________________________ .
The researcher examines the written responses and attempts to identify central themes. For
instance, the theme identifi ed for the fi rst sentence might be “healthy,” which would sig-
nify that hot tea is perceived as a beverage for those who are health conscious. The theme
for the second sentence might be “it’s cold outside,” indicating that tea is perceived as a
cold-weather drink, whereas the theme for the third sentence may turn out to be “messy,”
denoting the students’ reaction to using a tea bag. Finally, the last sentence theme might be
“okay,” suggesting there are no peer pressures working to cause high school students to avoid
Projective techniques involve situations in which participants are placed in (projected into) simulated activities in the hopes that they will divulge things about themselves that they might not reveal under direct questioning.
A word-association test involves reading words to a respondent who then answers with the fi rst word that comes to mind.
With a sentence-completion test, respondents are given incomplete sentences and asked to complete them in their own words. The researcher then inspects these sentences to identify themes or concepts.
M06_BURN3261_08_GE_C06.indd 161M06_BURN3261_08_GE_C06.indd 161 17/08/16 3:51 pm17/08/16 3:51 pm

162 CHAPTER 6 • QUALITATIVE RESEARCH TECHNIQUES
drinking tea. Given this information, Lipton might deduce that there is room to capitalize on
the hot-tea market with teens.
Picture Test With a picture test , sometimes called a “thematic apperception test,” a pic-
ture is provided to participants, who are instructed to describe their reactions by writing a
short story about the picture. The researcher analyzes the content of these stories to ascertain
feelings, reactions, or concerns generated by the picture. Such tests are useful when test-
ing pictures being considered for use in brochures and print advertisements and on product
packaging. For example, a test advertisement might depict a man holding a baby, and the
ad headline might say, “Ford includes driver and passenger air bags as standard equipment
because you love your family.” A picture test may well divulge something about the picture
that is especially negative or distasteful. Perhaps unmarried male respondents cannot relate
to the ad because they do not have children and have not experienced strong feelings for chil-
dren. On the other hand, it may turn out that the picture has a much more neutral tone than
Ford’s advertising agency intended. It may be that the picture does not generate feelings of
concern and safety for the family in married respondents with young children. In any case,
without the use of a picture test, it would be diffi cult to determine the audience’s reactions.
Cartoon or Balloon Test With a balloon test , a line drawing with an empty “balloon”
above the head of one of the actors is provided to subjects who are instructed to write in the
balloon what the actor is saying or thinking. The researcher then inspects these thoughts to
fi nd out how subjects feel about the situation described in the cartoon. For example, when
shown a line drawing of a situation in which one of the characters is making the statement,
“Ford Explorers are on sale with a discount of $4,000 and 0% interest for 48 months,” the par-
ticipant is asked how the other character in the drawing would respond. Feelings and reactions
of the respondents are judged based on their answers.
Role-Playing Activity With role playing , participants are asked to pretend they are a “third
person,” such as a friend or neighbor, and to describe how they would act in a certain situation
or to a specifi c statement. By reviewing their comments, the researcher can spot latent reactions,
positive or negative, conjured up by the situation. It is believed that some of the respondents’ true
feelings and beliefs will be revealed by this method because they can pretend to be another indi-
vidual. For example, if Ray-Ban is developing a new “Astronaut” sunglasses model with supe-
rior ultraviolet-light fi ltration, space-age styling, and a cost of about $200, role playing might
be used to fathom consumers’ initial reactions. In this use of role playing, respondents could be
asked to assume the role of a friend or close workmate and to indicate what they would say to
a third person when they learned that their friend had purchased a pair of Astronaut sunglasses.
If consumers felt the Astronaut model was overpriced, this feeling would quickly surface. On
the other hand, if the space-age construction and styling were consistent with these consumers’
lifestyles and product desires, this fact would be divulged in the role-playing comments.
These projective techniques were adapted from psychology by marketing researchers
many years ago. They remain in use today, although some marketing researchers have devel-
oped new projective techniques, many of which are proprietary. Table 6. 2 provides informa-
tion on fi ve such projective techniques that were developed and are used by Talking Business
( http://www.TalkingBusiness.net ), a qualitative research fi rm that specializes in innovative
research and strategic brand development.
As with in-depth interviews, all of these projective techniques require highly qualifi ed
professionals to interpret the results. This increases the cost per respondent compared with
other survey methods. Projective techniques can be used in combination with focus groups or
in-depth interviews. In one study, researchers wanted to know how young people aged 18 to
24 in the United Kingdom felt about the UK Conservative Party. The researchers conducted
eight focus groups with young adults from three places in the United Kingdom, combin-
ing focus group discussions with projective techniques that included picture associations and
With a picture test, a picture is provided to participants who are instructed to describe their reactions by writing a short story about the picture.
With a balloon test, a line drawing with an empty “balloon” above the head of one of the actors is provided to respondents, who are instructed to write in the balloon what the actor is saying or thinking.
With role playing, participants are asked to pretend they are a “third person,” such as a friend or neighbor, and to describe how they would act in a certain situation or to a specifi c statement.
M06_BURN3261_08_GE_C06.indd 162M06_BURN3261_08_GE_C06.indd 162 17/08/16 3:51 pm17/08/16 3:51 pm

6-6 OTHER QUALITATIVE RESEARCH TECHNIQUES 163
sentence-completion techniques. Adding the projective techniques to the focus groups gave
the researchers insight into the deep-seated feeling of the young adults. 62
NEUROMARKETING Neuromarketing , also called physiological measurement or consumer neuroscience, involves
the study of an individual’s involuntary responses to marketing stimuli, including eye move-
ment, heart rate, skin conductance, breathing, brain activity (using functional magnetic reso-
nance imaging [fMRI]), and brain waves (electroencephalography [EEG]). The notion behind
neuromarketing research is that physiological reactions cannot be consciously controlled, so
they possibly reveal reactions that the individual is unaware of or unwilling to divulge. Prac-
titioners claim that these methods can reveal people’s emotions and intensity of opinions in
ways that would not be possible with other types of research methods.
A number of marketing research companies specialize in neuromarketing, such as Neuro-
sense and BrainJuicer. Many of the largest full-service marketing research companies, includ-
ing Nielsen, Kantar, and Ipsos, have neuromarketing research among their specialties. Some
of the many client companies that have used neuromarketing to measure consumers’ emotions
are Campbell Soup, Procter & Gamble, Google, Disney, and Frito-Lay. 63, 64 We will briefl y
discuss three techniques that are used in neuromarketing research: neuroimaging, eye track-
ing, and facial analysis.
Neuroimaging Neuroimaging , or viewing brain activity, may aid marketing researchers
to better understand consumers’ unconscious emotions. By using neuroimaging and under-
standing the neuroscience behind it, marketing researchers hope to more accurately posit
what consumers really want (which can be diff erent from what they say they want), what
appeals to them, and what drives them to buy. For example, one neuroimaging experiment
using fMRI found that when participants were made to feel rejected in a computer game
they experienced greater activation in the same brain region associated with physical pain. 65
Electroencephalography (EEG), or the measure of electrical activity in the brain, is
also used to measure consumers’ responses to products and advertising. The development
of inexpensive, portable, easy-to-use technology has made EEG more accessible for mar-
keting research. In one example, the Canadian public communications and media com-
pany Rogers Communication collaborated with the company Brainsights to examine how
TABLE 6. 2 Projective Techniques That Can Be Used with Focus Groups 61
Technique Name Description Application
Sort Me Up Respondents are given products (or cards with
product names) and asked to sort them into
groups and then to provide a descriptive name
for each group
Reveals competitive sets of products and brands
Off ers segmentation implications
Shows how consumers perceive products and
brands
Sort Me Straight For each attribute, respondents rank cards with
brand names from most to least
Identifi es how the target brand performs on
specifi c attributes with respect to competing brands
Picture This, Picture That Respondents are given several pictures that
represent a wide range of emotions and asked
to select pictures that represent specifi c brand/
category/situations
Reveals images and emotions that are associated
with specifi c brand/category/situations
Color My World Respondents are given several color swatches
(paint chips) and asked to select color(s) that
represent specifi c brand/category/situations
Off ers insight into positive and negative imagery
and associations for specifi c brand/category/
situations
Dot, Dot, Dot Respondents are given 10 dot-shaped stickers
or tokens and asked to allocate them across
fl avors, brands, advertisements, etc.
Provides a relative ranking for each of the
alternatives; follow-up probing reveals why
certain alternatives are favored
Neuromarketing is the study of an individual’s involuntary responses to marketing stimuli, including eye movement, heart rate, skin conductance, breathing, and brain activity.
Neuroimaging is viewing activity in the brain to better understand consumers’ unconscious emotions.
M06_BURN3261_08_GE_C06.indd 163M06_BURN3261_08_GE_C06.indd 163 17/08/16 3:51 pm17/08/16 3:51 pm

164 CHAPTER 6 • QUALITATIVE RESEARCH TECHNIQUES
consumers respond to its hockey programming. Rogers recruited and paid volunteers to
wear headgear that measured their brain activity as they watched hockey in bars.
Eye Tracking Eye tracking is a technique for measuring eye positions and eye movement.
Which part of an ad “catches the consumer’s eye?” Where do shoppers look fi rst when they
walk into a supermarket aisle? Eye tracking is helpful for measuring usage of computer games,
interactive television, software, and mobile devices. For example, AT&T has begun to use eye
tracking coupled with in-depth interviewing to understand how customers interact with its
customer service website. 66 Eye tracking is also useful in analyzing how consumers process
advertisements. 67 In addition, eye tracking is often paired with virtual stores for researchers to
examine the most eff ective ways to display products. Mobile eye tracking (using eye-tracking
glasses) is used to measure eye movement in natural environments such as in stores or at home.
Facial Coding Facial coding is a system that is used to measure universal expressions of
emotions, such as happiness, sadness, fear, and surprise, by their appearance on people’s faces.
Trained “coders” follow a procedure in which they code multiple facial muscles of consumers,
based on video recordings of the consumers observing predetermined material. The equipment
used in facial coding is inexpensive, since only a computer on which participants can watch
content and an internal or external video camera to record the participants are needed. Facial
coding is most frequently used to measure responses to products and to advertising. In one
experiment, facial coding was used to measure the facial expressions of college students as they
observed 13 Super Bowl television advertisements involving automobiles. The results indi-
cated that facial expressions can be a stronger indicator of future sales than survey responses. 68
The Controversy The use of neuromarketing can be controversial. Political campaigns have
come under criticism for using neuromarketing techniques to shape their promotions. Never-
theless, according to the New York Times , neuromarketing methods have been used in political
campaigns in a number of countries on at least three continents. For example, during his 2012
campaign, Mexican president Enrique Peña Nieto used a number of neuromarketing experi-
ments to develop his message. The use of neuromarketing in political campaigns in the United
States remains more limited, perhaps because of the stigma attached to these methods. 69
The two main criticisms of neuromarketing are somewhat contradictory. The fi rst is that
the methods are used to manipulate consumers, while the second is that neuromarketing is
“pseudoscience” and is not actually eff ective. Neuromarketing techniques are evolving rap-
idly and, for the most part, best practices have yet to be established for their use. While some
researchers remain skeptical that neuromarketing methods are superior to less expensive and
invasive methods of research, a limited amount of recent research has demonstrated that neu-
romarketing can be superior to traditional methods for some purposes. 70 Wearable technol-
ogy, such as Google Glass and Apple Watch, may add to the credibility of neuromarketing
by measuring consumers’ responses to marketing stimuli under more natural conditions. The
company Innerscope Research, owned by Nielsen, has developed a wearable belt that can mea-
sure emotional responses as consumers take part in their everyday activities. With the price of
some of the technology used in neuromarketing decreasing rapidly, it has been predicted that
testing advertising using these techniques could become standard for some larger companies in
the future. 71 Altogether, the fi eld of neuromarketing is changing quickly and merits watching.
STILL MORE QUALITATIVE TECHNIQUES While this chapter highlights the most commonly used types of qualitative methods in the mar-
keting research industry, a number of additional qualitative techniques can be used. An inter-
national nonprofi t organization, Qualitative Research Consultants Association (QRCA), was
created in 1983 to promote and advance excellence in qualitative research. Information about
traditional and leading-edge qualitative techniques can be found on QRCA’s website ( http://
www.qrca.org ). More information about QRCA can be found in Marketing Research Insight 6. 4 .
Eye tracking is a technique for measuring eye positions and eye movement.
Facial coding is a system that is used to measure universal expressions of emotions, such as happiness, sadness, fear, and surprise, by their appearance on people’s faces.
M06_BURN3261_08_GE_C06.indd 164M06_BURN3261_08_GE_C06.indd 164 17/08/16 3:51 pm17/08/16 3:51 pm

6-6 OTHER QUALITATIVE RESEARCH TECHNIQUES 165
Synthesize Your Learning
This exercise will require you to take into consideration concepts and material from the fol-lowing chapters:
Chapter 5 Secondary Data and Packaged Information Chapter 6 Qualitative Research Techniques
Lucy Betcher had worked as a consultant for the Small Business Administration for a number of years. Her old high school classmates and their spouses gather at least once a year to renew friendships. Judy Doyle, Mike Fuller, Adele Smith, Nancy Egolf, Joy Greer, and Jackie Reynolds had different careers and several were retiring. At their last reunion, Jackie men-tioned to Lucy that she was interested in doing something else after retiring from teaching. Adele overheard this conversation and said she was interested in trying something new as well. Could Lucy, with all her years of helping others get started in business, assist her friends?
The next morning, while sitting on Todd and Joy’s comfortable balcony overlooking boats in a canal, Lucy asked the entire group: “Jackie and Adele are interested in getting into some sort of business opportunity. Do any of you have any thoughts on this?”
Having spent a successful career in pharmaceutical sales, Mike said, “There are opportuni-ties for services for senior citizens in terms of prescription drug management and administration.”
Qualitative Research Consultants Association (QRCA) Cultivates Excellence in Qualitative Research
Since 1983, the Qualitative Research Consultants Associa-tion (QRCA) has cultivated excel-lence in qualitative research. For everyone involved in the practice and use of qualitative research, QRCA keeps qualitative at peak performance for today and tomor-row. QRCA brings together the best people and resources in qualitative, at the leading edge of both traditional and new meth-odologies, with the following features:
• The strongest qualitative resources • Access to the latest methods, ideas, and expert innovators • Leading-edge wisdom and experience • A unique, warm culture of open learning, shared knowl-
edge, and welcoming access
QRCA members are those involved in the design, implementa-tion, and analysis of qualitative research around the globe. Qualita-tive research is changing dramatically and quickly with new tools, platforms, and technology. QRCA helps member practitioners understand and integrate new ideas into their practice, makes sure their skills are powerful and current, and provides the expertise and fresh thinking their clients seek. QRCA members share leading-edge
wisdom and experience via con-ferences, local programs at nearly 20 chapters across North America plus innovative virtual programs for our international members, Qcast webinars, special-interest groups (including Ethnography, Online Quali-tative, Pharma/Health Care, Social Media Research, Latino Research, Creativity + Innovation, and Young Professionals), the member-only forum, and publications.
For those who are just entering the world of qualitative research, QRCA offers Young Professional Grants and Global Schol-arships to encourage enthusiastic new qualitative research con-sultants to join the association. For those who use and purchase qualitative research services, QRCA and its members are the best resource in qualitative, keeping them at the leading edge of both traditional and new methodologies. Because they rely on research partners’ expertise and fresh thinking to advise them on the best way to utilize research, research users can feel confi dent they are getting the best when they work with QRCA and its members—benefi ting from the strongest resources and access to the latest methods, ideas, and expert innovators. QRCA members’ leading-edge wisdom and experience are available to research users and buyers via select presentations, webinars, and publications and demonstrated in the work they do for their clients.
MARKETING RESEARCH INSIGHT 6. 4 Practical Application
Shannon Thompson,
Executive Director,
QRCA.
Find out more about
QRCA at http://www.
qrca.org .
Source: Courtesy Shannon Thompson, QRCA
M06_BURN3261_08_GE_C06.indd 165M06_BURN3261_08_GE_C06.indd 165 17/08/16 3:51 pm17/08/16 3:51 pm

166 CHAPTER 6 • QUALITATIVE RESEARCH TECHNIQUES
Summary
This chapter described the various qualitative research
techniques used by marketing researchers. Quantitative
research uses predetermined structured questions with
predetermined structured response options. It is also nor-
mally characterized by the use of large samples. Qualita-
tive research is much less structured than quantitative
approaches. Qualitative research involves collecting, ana-
lyzing, and interpreting data by observing what people do
or say. The observations and statements are in an unstruc-
tured, nonstandardized form. The advantage of qualitative
research is that it allows researchers to gather deeper, richer
information from respondents. Mixed methods research
involves using both qualitative and quantitative research
methods.
Observation is a qualitative research technique in
which researchers observe what consumers do rather than
communicate with them. Observational techniques can be
direct or indirect, covert or overt, structured or unstruc-
tured, and in situ or invented. Circumstances most suited
to observational studies involve a (1) short time interval,
(2) public behavior, and (3) the likelihood of faulty recall
if respondents are asked about previous experiences. The
primary advantage of observation is that researchers record
what respondents actually do instead of relying on their
recall of what they think they do. The limitations of obser-
vation studies are that they often rely on small samples, so
representativeness is a concern. Another disadvantage is the
subjective interpretation required to explain the behavior
observed. Researchers do not know consumers’ motives,
attitudes, or intentions.
Focus groups, or moderated small-group discussions,
are a popular form of qualitative research. The major
task of the moderator is to ensure freewheeling and open
communication that stays focused on the research topic.
Traditional focus groups use about 6 to 12 persons in a
dedicated room, with a one-way mirror for client viewing.
Recent innovations in contemporary focus groups include
online focus groups in which clients may observe from
Mike noted that many older people still in their homes or living in retirement centers had diffi-culty keeping track of getting their prescriptions filled and taking their medications on schedule.
“It’s a real problem when people get to be 85 and over,” Mike said. “I see a growing need for a personal service that would provide this type of care.”
Nancy and Judy talked about a unique coffee shop they had patronized. Not only was the staff knowledgeable about different types of coffees and helpful in guiding customers to sample different flavors, but the shop also sold a variety of coffee makers and tea makers and books on coffee and teas. However, what they really liked was the atmosphere. Instead of the placid and contemplative ambience that most coffee shops offer, this shop featured different “learning” exhibits where you could interact and discover something new. The topics changed weekly—local history, coffee making, art, music, and readings by authors.
The two women were fascinated with the shop and had talked to the owner about fran-chising the concept so they could each start one in their hometowns in Pennsylvania and New York. The owner told them he had several successful franchises operating. The biggest chal-lenge the prospective coffee shop owners would face initially would be in finding a location that would attract the clientele who would embrace the product and atmosphere and return regularly. The owner obviously couldn’t help them make those decisions in their hometowns, so they would need help finding the best locations there.
1. Looking back at Chapter 5 , what secondary data could identify the number of persons in different age groups in each CBSA?
2. Based on what you learned in Chapter 5 , identify a packaged services firm that would be helpful in locating a successful coffee shop in different locales. Assume that since the cof-fee shop owner has several successful coffee shops, the owner has a database of current customer information.
3. In considering either the prescription service or the coffee shop venture, what qualitative research techniques would you now recommend that the prospective business owners use? Why would you recommend these qualitative techniques?
M06_BURN3261_08_GE_C06.indd 166M06_BURN3261_08_GE_C06.indd 166 17/08/16 3:51 pm17/08/16 3:51 pm
REVIEW QUESTIONS/APPLICATIONS 167
a distant location via video streaming over the Internet.
Another form of online focus group allows people to par-
ticipate from their homes or any remote location where they
observe and respond to other participants via chat rooms.
Focus groups have the following advantages: (1) They gen-
erate fresh ideas; (2) they allow clients to observe their par-
ticipants; and (3) they may be directed at understanding a
wide variety of issues. Disadvantages include lack of rep-
resentativeness, subjective evaluation of the meaning of the
discussions, and high costs per participant. Focus groups
should be used when there is a need to describe marketing
phenomena. They should not be used when there is a need
to predict a phenomenon such as projecting sales for a new
product evaluated by a focus group. Four main objectives
of focus groups are to generate ideas; to understand con-
sumer vocabulary; to reveal consumer needs, motives, per-
ceptions, and attitudes on products or services; and to better
understand fi ndings from quantitative studies.
To convene a focus group, marketing researchers
should have 6 to 12 participants sharing similar charac-
teristics and should come up with a plan for potential “no
shows.” Focus group facilities exist in most major cities, but
any large room with a central table can be used. The moder-
ator’s role is key to a successful focus group, and he or she
should become involved early on in the research project.
Ethnographic research, an approach borrowed from
anthropology, is defi ned as a detailed, descriptive study
of a group and its behavior, characteristics, and culture.
Ethnographic research involves observing consumers in
near-natural settings to monitor their behaviors, relations
with others, and emotions. Smartphone ownership has led to
mobile ethnography, a type of marketing research in which
respondents document their own experiences through their
own mobile phones. Another variation of ethnography is
netnography, in which online activities are studied.
In recent years, marketing research online commu-
nities have become a popular form of research, in which
groups of targeted populations are brought together online
to interact, provide opinions and ideas, and complete tasks.
Online communities are inexpensive and fl exible, allowing
a wide variety of data to be collected, including posts, pho-
tos, and videos.
Another qualitative technique involves in-depth inter-
views (IDIs) to examine consumer motivations and hidden
concerns. Protocol analysis induces participants to “think
aloud” so the researcher can map the decision-making
process a consumer uses in making a purchase decision.
Projective techniques, such as word association, sentence
completion, or role playing, are also useful in unearthing
motivations, beliefs, and attitudes that subjects may not be
able to express well verbally.
Neuromarketing is the study of an individual’s invol-
untary responses to marketing stimuli. Types of neuro-
marketing include neuroimaging, eye tracking, and facial
coding. Neuromarketing is an emerging fi eld that may off er
additional qualitative insights into consumer behavior.
Key Terms
Quantitative research (p. 143 )
Qualitative research (p. 144 )
Mixed methods research (p. 144 )
Observation methods (p. 146 )
Direct observation (p. 146 )
Indirect observation (p. 146 )
Archives (p. 146 )
Physical traces (p. 146 )
Covert observation (p. 147 )
Overt observation (p. 147 )
Structured observation (p. 147 )
Unstructured observation (p. 147 )
In situ observation (p. 147 )
Invented observation (p. 147 )
Focus groups (p. 149 )
Moderators (p. 150 )
Focus group report (p. 150 )
Online focus group (p. 151 )
Ethnographic research (p. 156 )
Shopalong (p. 156 )
Mobile ethnography (p. 156 )
Netnography (p. 157 )
Marketing research online
communities (p. 158 )
In-depth interview (p. 159 )
Laddering (p. 160 )
Protocol analysis (p. 160 )
Projective techniques (p. 161 )
Word-association test (p. 161 )
Sentence-completion test (p. 161 )
Picture test (p. 162 )
Balloon test (p. 162 )
Role playing (p. 162 )
Neuromarketing (p. 163 )
Neuroimaging (p. 163 )
Eye tracking (p. 164 )
Facial coding (p. 164 )
Review Questions/Applications
6- 1. Define quantitative research. Define qualitative
research. List the diff erences between these two
research methods. What is mixed methods research?
6- 2. What is meant by an “observation technique”? What
is observed, and why is it recorded?
6- 3. Indicate why covert observation would be appropri-
ate for a study on how parents discipline their chil-
dren when dining out.
6- 4. Describe a traditional focus group.
6- 5. Describe two formats of online focus groups.
M06_BURN3261_08_GE_C06.indd 167M06_BURN3261_08_GE_C06.indd 167 17/08/16 3:51 pm17/08/16 3:51 pm

168 CHAPTER 6 • QUALITATIVE RESEARCH TECHNIQUES
CASE 6. 1
The College Experience
This case was provided by Professor Daniel Purdy, Lecturer, and Professor Wendy Wilhelm, Professor of Marketing, both of Western Washington University.
The College of Business at Western Washington University
is a full-service business school at a midsized regional uni-
versity. The College of Business specializes in undergradu-
ate business education with selected graduate programs.
While the college emphasizes mostly professional educa-
tion, it does so within a liberal arts context. Business majors
range from standards such as accounting, marketing, and
fi nance to more unique off erings, such as the highly success-
ful manufacturing and supply chain management degree.
The college is committed to a student-centered style of
education that emphasizes the students not as customers but
as equal stakeholders in the process of education. As part of
its commitment to involving the students as true partners,
the college has recently begun the process of conducting
focus groups of undergraduate and graduate students. The
objective of these focus groups is to identify negative and
positive attitudes about the college and develop new ideas
to improve the college.
The following is an excerpt from the transcript of the
fi rst undergraduate focus group. This group included 14
students with the following makeup: 50% male and 50%
female; 93% work part time or more, and 7% do not work;
6- 6. Describe at least three diff erent uses of focus groups.
6- 7. How are focus group participants recruited, and what
is a common problem associated with this recruitment?
6- 8. Should the members of a focus group be similar or
dissimilar? Why?
6- 9. Describe what a focus group setting looks like and
how a focus group would take place in such a setting.
6- 10. What are the qualities that are essential in order to
eff ectively moderate a focus group discussion? Why
are these qualities important?
6- 11. Indicate how a focus group moderator should handle
each of the following cases: (a) A participant is loud
and dominates the conversation; (b) a participant is
obviously suff ering from a cold and goes into cough-
ing fi ts every few minutes; (c) two participants who,
it turns out, are acquaintances persist in a private
conversation about their children; and (d) the only
minority representative participant in the focus group
looks uncomfortable with the group and fails to make
any comments.
6- 12. What should be included in a report that summarizes
the fi ndings of a focus group?
6- 13. Indicate the advantages and disadvantages of client
interaction in the design and execution of a focus
group study.
6- 14. What is ethnographic research? Discuss how a mar-
keting researcher could get into an ethically sensitive
situation using the technique.
6- 15. How is neuromarketing helpful in market research
studies? 6- 16. How does laddering as a technique help in qualitative
research?
6- 17. Why are projective techniques used? Name any three
commonly used projective techniques.
6- 18. Describe (a) sentence-completion, (b) word-
association, and (c) balloon test. Create one of each
of these that might be used to test the reactions of
parents whose children are bed wetters to absorbent
underpants that their children would wear under their
nightclothes.
6- 19. What is facial coding? How would you present to a
potential client the advantages of this technique?
6- 20. Associated Grocery Stores (AGS) has always used
paper bags for sacking groceries in its chain of retail
supermarkets. Management has noticed that some
competitors are off ering reusable bags to their cus-
tomers. AGS management isn’t certain just how
strongly consumers in its markets feel about having
to bring the reusable bags every time they visit the
supermarket. Select two projective techniques. First,
defend your use of a projective technique. Second,
describe in detail how your two chosen techniques
would be applied to this research problem.
6- 21. Your university is considering letting an apartment
management company build an apartment complex on
campus. To save money, the company proposes to build
a common cooking area for every four apartments.
This area would be equipped with an oven, stove-top
burners, microwave oven, sink, food preparation area,
garbage disposal, and individual mini-refrigerators
with locks on them for each apartment. Two students
would live in each apartment, so eight students would
use the common cooking area. You volunteer to con-
duct focus groups with students to determine their
reactions to this concept and to brainstorm suggestions
for improvements. Prepare the topics list you would
have as a guide in your role as moderator.
M06_BURN3261_08_GE_C06.indd 168M06_BURN3261_08_GE_C06.indd 168 17/08/16 3:51 pm17/08/16 3:51 pm

REVIEW QUESTIONS/APPLICATIONS 169
and 29% management majors, and other majors no more
than 15% each.
Moderator: So what do you guys think are some ways
that the college (not the university) can be improved?
Jeff : I really like the fact that professors are accessible
and willing to help, and a lot of them let us call them by
their fi rst name. Something that I think could be better
is that we don’t spend enough time learning how to do
things but instead professors spend too much time talking
about theory.
Sarah: Yeah, I agree totally. It seems like most of the time
we aren’t learning practical skills but just talking about
what we “should” do, not really learning how to do it.
Moderator: Interesting points. How would you suggest
the college try to increase the amount of practical learning?
Todd: It would really be cool if we could do more real-life
professional work in our classes. Things like skill-based
projects that focus on doing what we would really do in
our profession.
Tim: I think we should all have to do a mandatory intern-
ship as part of our major. Right now, some majors let you
do it as an elective, but they are really hard to fi nd and get.
Moderator: Good ideas. Are there other things you think
we could improve?
Rhonda: I agree that the professors try really hard to be
open to students, but the advising is really not very good.
I don’t know how to fi x it, but I know my advisor is pretty
much useless.
Ariel: I know, I know. It is so frustrating sometimes. I go
to my advisor and she tells me to just fi ll in my degree
planning sheet and she’ll sign it. It’s like they don’t even
know what I should be taking or why.
Jon: My advisor is kind of funny. He just tells me that he
doesn’t really know that much about classes he doesn’t teach
and my guess is as good as his. At least he’s honest anyway.
Moderator: Ok, so the advising you are getting from the
faculty leaves a little to be desired. What do you guys do
to fi gure out how to plan your degrees if your advisors
aren’t helping much?
Sarah: I just ask my friends who are further along in the
major than I am.
Mark: Yeah, me too. In the Student Marketing Associa-
tion we all give each other advice on what professors are
good, what classes go good together, which have prerequi-
sites and stuff like that. It would be cool if we could have
something like that for the whole college.
Moderator: Do you think the college could be improved
if we developed some sort of peer-advising program?
Using these excerpts as representative of the entire
focus group transcript, answer the following questions:
1. Do you think focus groups were the appropriate research
method in this case, given the research objectives? What
other type(s) of research might provide useful data?
2. Evaluate the questions posed by the moderator in light
of the research objectives/question: (a) Are any of them
leading or biased in any way? (b) Can you think of any
additional questions that could or should be included?
3. Examine the fi ndings. How is the college perceived?
What are its apparent strengths and weaknesses?
4. Can we generalize these fi ndings to all of the college’s
students? Why or why not?
Text: By permission, Mr. Daniel Purdy and Dr. Wendy
Wilhelm, Western Washington University.
CASE 6. 2 INTEGRATED CASE
Auto Concepts
Nick Thomas, CEO of Auto Concepts, has begun formulat-
ing some concepts in terms of the types of car models to
pursue to bring his parent company product line back to
life. He has been using a cross-functional approach to new
product development involving fi nance, production, R&D,
marketing, and advertising in his planning. Ashley Roberts,
from advertising, is discussing some of the general plans
for the new car models with Nick. He tells Ashley that Auto
Concepts needs more marketing research information about
customer preferences for diff erent types of cars. One model
being considered is a small, almost scooter-like car. Other
models are larger but still much smaller than “traditional”
cars to obtain suitable mpg ratings. Ashley knows this
information is crucial for eff ective advertising strategy and
tactics. She wonders if the customers who prefer the new,
smaller models possess diff erent sets of salient values. Per-
haps those who prefer the scooter-like model would value
excitement and entertainment in their lives while those
expressing a preference for the larger-sized, high-mpg
models would place a higher priority on social recognition
versus harmony with the environment or some other value.
If diff erences are found, the ad strategy can alter the values
emphasized in the ad’s visuals and copy to suit the model
of the car being promoted (e.g., depicting an exciting life,
thrill of the drive, or sense of accomplishment or recogni-
tion of contributing to environmental problems, and so on).
What technique identifi ed in this chapter would help
Ashley Roberts with this advertising task? Why?
M06_BURN3261_08_GE_C06.indd 169M06_BURN3261_08_GE_C06.indd 169 17/08/16 3:51 pm17/08/16 3:51 pm

▶
LEARNING OBJECTIVES In this chapter you will learn:
7- 1 What the advantages of surveys such as standardization, ease of administration, and so forth are
7- 2 The various modes of survey administration based on whether or not an interviewer or a computer is present
7- 3 Descriptions of nine different methods of data collection
7- 4 How marketing researchers work with panel companies to collect data
7- 5 Various considerations to ponder when selecting a specifi c method of data collection
“WHERE WE ARE”
1 Establish the need for marketing
research.
2 Defi ne the problem.
3 Establish research objectives.
4 Determine research design.
5 Identify information types and
sources.
6 Determine methods of accessing data.
7 Design data collection forms.
8 Determine the sample plan and size.
9 Collect data.
10 Analyze data.
11 Prepare and present the fi nal
research report.
Schlesinger Associates
Schlesinger Associates is a leading interna-
tional data collection company that prides itself
on providing high-quality recruitment and proj-
ect management services for any qualitative or
quantitative marketing research methodology.
Schlesinger has an ongoing commitment to
providing a broad range of research solutions
to meet developing needs and to explore new
solutions to support better research insights
for its clients in rapidly changing marketplaces.
Key methodologies the company provides
include focus groups, in-depth interviews, ethnographic studies, online
and mobile surveys, and online qualitative solutions, such as webcam-
enabled focus groups, discussion boards, and online communities. In
addition, Schlesinger offers leading-edge research labs that can harness
behavioral and emotional measures technology to add value to research.
These labs include usability labs, facial coding labs, eye-tracking labs,
EEG neuromarketing labs, and biometric labs. Specializing in health care,
consumer, business-to-business, and IT research services, Schlesinger’s
extensive, profi led, and stringently verifi ed panel, together with varied
recruitment methods, allows for highly engaged pools of research par-
ticipants across a variety of target audiences, be they geographic, demo-
graphic, psychographic, or behavioral. Schlesinger Associates has offi ces
in key U.S. markets that host high-specifi cation focus group facilities, top
rated in the world by the Impulse Survey of Focus Group Facilities.
Over the last decade, Schlesinger has successfully acquired leading
data collection companies in Europe: The Research House in London,
ConsuMed Research & Passerelles in Paris, and Schmiedl Marktfor-
schung in Berlin, Frankfurt, and Munich. The company’s Global Solutions
team, together with strategic global partnerships, allows researchers to
7 Evaluating Survey Data Collection Methods
Steve Schlesinger,
CEO, Schlesinger
Associates
M07_BURN3261_08_GE_C07.indd 170M07_BURN3261_08_GE_C07.indd 170 29/08/16 12:04 pm29/08/16 12:04 pm

171
take the pulse of markets worldwide. Advisors by Schlesinger
is Schlesinger’s most recent initiative. This service connects
knowledge seekers with vetted world-class thought leaders
and then facilitates one-on-one consultations and advisory
boards. Scientists, clinicians, managed care executives, health
care payers, and administrators are just some of the types of
experts available to clients including consulting fi rms, market research fi rms, and fi nancial
service fi rms. Schlesinger also provides complementary services, such as transcription, trans-
lation, interpretation, and note-taking, to complete its turnkey data collection solution. In
2016 Schlesinger Associates marked 50 years of passion, partnership, and innovation. The
company has grown rapidly from a turnover of $100,000 in 1966 to over $100 million today.
CEO Steve Schlesinger attributes the success of the company to a very powerful business
and leadership relationship with his partner and joint owner Mike Sullivan, president of the
company, and the support of a talented and dynamic senior leadership group. The leadership
believes deeply in its core values of quality, service excellence, and partnership set out by the
company’s founder Sarah Schlesinger. These remain the guiding principles for all employees,
underpinning the company’s mission and vision equally for its client services as for its corpo-
rate and social responsibilities. Steve Schlesinger commented, “The daily driving force of our
company vision is ’People Passion & Purpose’ : recruiting, developing, and communicating
with our People for success. Feeling real Passion for our relationships and what we do. Having
clear Purpose through management by objectives at all levels, disciplined performance mea-
sures, calculated risk taking, dusted with a strong belief in the ’art of possibility.’” Schlesinger
Associates has strong marketing research industry links with a long history of its people being
committed to and being honored for volunteer work for associations and other initiatives
that improve market research today and shape tomorrow. Schlesinger’s marketing and client
development strategy is focused on in-person industry events and in-person client relation-
ships. Sponsorship of education and event attendance programs enables young researchers
to be immersed in industry activity and to learn to develop a voice early in their careers.
Source: Text and photos courtesy of Steve Schlesinger and SchlesingerAssociates.
Visit Schlesinger Associates at www.SchlesingerAssociates
.com
As you are learning in this course and as apparent in our Schlesinger Associates
opening vignette, there are many different ways of conducting marketing research
studies. In previous chapters, we discussed different forms of research, such as
focus groups, experiments, and surveys. There are many ways of gathering information
among these various types of studies. In this chapter, our attention is on surveys. A surveyinvolves interviews with a large number of respondents using a predesigned question-
naire. 1 Communication is necessary to learn what respondents are thinking—their opinions,
preferences, or planned intentions. Large numbers of respondents may be required to col-
lect a large enough sample of important subgroups or to ensure that the study accurately
Surveys involve interviews with a large number of respondents using a predesigned questionnaire.
M07_BURN3261_08_GE_C07.indd 171M07_BURN3261_08_GE_C07.indd 171 16/08/16 10:55 am16/08/16 10:55 am

172 CHAPTER 7 • EVALUATING SURVEY DATA COLLECTION METHODS
represents some larger population. In this chapter we focus on the various methods used to
collect data for surveys.
Historically, survey data collection has been largely driven by technology. The earliest
technology was paper based in the form of personal interviews or mail surveys using printed
questionnaires. This mode of data collection was displaced when nationwide calling became
aff ordable, which occurred when competition was introduced into the telecommunications
networks and drove long-distance rates down. Telephone-based data collection, in turn, pro-
vided impetus to automated dialers and the emergence of computers, which created CATI
(computer-assisted telephone interviewing). CATI systems greatly improved the productiv-
ity of telephone interviewers through automated dialing, tracking performance statistics that
could be reported back to management, and enabling the programming of skip patterns and
other logic. Telephone surveys have been largely supplanted by Internet-based or online sur-
veys that aff ord a host of effi ciencies. The newest and currently most popular form of data
collection is the use of panels, which are immense groups of potential respondents who are
recruited and compensated by companies that provide access to them for a fee. Such panel
companies, normally online, guarantee researchers access to practically any identifi ed popula-
tion with maximum speed and minimal data collection errors.
This chapter begins with a short discussion on why surveys are popular and advantageous.
Next, it describes basic survey modes: (1) person-administered surveys, (2) computer-assisted
surveys, (3) computer-administered surveys, (4) self-administered surveys, and (5) mixed-
mode, sometimes called “hybrid,” surveys. While online surveys are extremely popular, it is
important that you understand the uses and nuances of alternative data collection methods
because each survey is unique and online data collection may not always be the best method.
Accordingly, we discuss the advantages and disadvantages of each of these modes and
present the various alternative methods of collecting data within each of three basic data col-
lection modes. For example, person-administered surveys may be conducted through mall
intercepts or by telephone. Finally, we discuss factors a market researcher should consider
when deciding which data collection method to use.
7- 1 Advantages of Surveys Compared to observation or other qualitative methods, survey methods allow the collection
of signifi cant amounts of data in a systematic, economical, and effi cient manner, and they
typically involve large sample sizes. There are fi ve advantages of using survey methods:
(1) standardization, (2) ease of administration, (3) ability to tap the “unseen,” (4) suitability to
tabulation and statistical analysis, and (5) sensitivity to subgroup diff erences (see Table 7. 1 ).
TABLE 7. 1 Five Advantages of Surveys
Advantage Description
Provides standardization All respondents react to questions worded identically and presented in the same order. Response
options (scales) are the same, too.
Is easy to administer Interviewers read questions to respondents and record their answers quickly and easily. In many
cases, the respondents read and respond to the questionnaires themselves.
Gets “beneath the surface” While not as detailed as in-depth interviews or focus groups, it is common to ask questions about
motives, circumstances, sequences of events, or mental deliberations, none of which are available
in observation studies.
Is easy to analyze Standardization and computer processing allow for quick tallies, cross tabulations, and other
statistical analyses despite large sample sizes.
Reveals subgroup diff erences Respondents can be divided into segments or subgroups (e.g., users vs. nonusers or age-groups) for
comparisons in the search for meaningful diff erences.
Key advantages of surveys include standardization, ease of administration, ability to tap the “unseen,” suitability to tabulation and statistical analysis, and sensitivity to subgroup differences.
M07_BURN3261_08_GE_C07.indd 172M07_BURN3261_08_GE_C07.indd 172 16/08/16 10:55 am16/08/16 10:55 am

7-1 ADVANTAGES OF SURVEYS 173
Active Learning
Experience the Advantages of Surveys
To experience the advantages of surveys firsthand, administer the following survey to four friends, two males and two females. You can either (1) copy the questions on paper and hand them to each friend or (2) read each question and record the answers of each friend sepa-rately. However, in the second option, you should keep each friend’s answers separate from the others.
1. Did you watch television last night? ________ Yes ________ No
2. (If yes) For about how many hours did you watch television last night? ________ Less than 1 ________ Between 1 and 2 ________ Between 2 and 4 ________ More than 4
3. Why do you usually watch television? (Select only one.) ________ Entertainment (variety, humor, sports, talk) ________ Education (science, news, documentary, cooking) ________ Escape (science fi ction, reality, fantasy) ________ Excitement (action, drama, travel)
4. What is your gender? ________ Male ________ Female
Now that you have administered the survey, let’s consider each advantage.
Standardization. How have the response options for questions 2 and 3 standardized the survey? In other words, what answers might have come about if you did not give your respon-dents these specific response categories from which to pick?
Ease of Analysis. What percent of your friends who took part in the survey watched televi-sion last night? What percent of them watched TV for four or more hours? To answer these questions, how long did it take for you to tabulate the findings? Also, since the respondents checked off or voiced the answers, how did this make your analysis task easy?
Ease of Administration. How difficult was it for you to administer the survey? One way to answer this is to estimate how long it took for each respondent, on average, to complete the survey.
Get Beneath the Surface. Do your friends watch television mostly for entertainment, educa-tion, escape, or excitement? Tabulate the answers to question 3 to find out. Notice that with a single question you have discovered the reasons, or motivations, for your friends’ television viewing.
Subgroup Differences. Do the two males differ from the two females? Do separate per-centage tabulations for each gender and compare the percentages. In a matter of a few minutes, you can spot whether or not differences exist in the subgroups and what the dif-ferences are.
M07_BURN3261_08_GE_C07.indd 173M07_BURN3261_08_GE_C07.indd 173 16/08/16 10:55 am16/08/16 10:55 am

174 CHAPTER 7 • EVALUATING SURVEY DATA COLLECTION METHODS
7- 2 Modes of Data Collection DATA COLLECTION AND IMPACT OF TECHNOLOGY As we noted at the beginning of this chapter, the data collection step in the marketing
research process has undergone great changes due to technology. Actually, there are two
reasons for the most recent change. First, in the past two decades, there has been a dra-
matic decline in the willingness of the general public to take part in surveys and, second,
computer and telecommunications technology has advanced signifi cantly and opened new,
effi cient ways for marketing researchers to collect data. With respect to declining survey
response rates, Roger Tourangeau 2 has identifi ed the major reasons for this trend. The fac-
tors underlying a growing unwillingness in the U.S. public to take part in surveys are the
common use of “gatekeepers,” such as answering machines, caller ID, and call blocking;
reduced amounts of free time; decline in the public’s engagement with important issues;
rising percentage of foreign-born Americans who are not fl uent in English; and increases
in the number of elderly who have comprehension and expression diffi culties. There is also
a growing desire for privacy among Americans. Indeed, the declining cooperation rates
are being experienced worldwide, not just in the United States. These rising nonresponse
rates have caused marketing researchers to rethink the use of traditional data collection
methods.
Coincidentally, technology has opened doors to new data collection methods, although
it has not solved the nonresponse problem. Two primary reasons for the technology push
are the rising costs of traditional data collection such as CATI and consumers’ adoption
of new communication systems. 3 The cost of doing research has increased along with the
rising prices of energy, personnel, and support functions. To remain competitive and, in
some cases, to remain in business, marketing research companies have sought out data
collection cost-saving alternatives of many types. At the same time, consumers have inte-
grated personal, tablet, and other mobile computers into their lives, and large segments of
the population have adopted mobile communication systems. To stay relevant, marketing
research companies have necessarily adapted to these new communication systems.
The rise of technology and the rapid adoption of sophisticated personal communi-
cation systems by consumers underlie a troublesome data collection dilemma faced by
marketing researchers all over the globe. As you will soon learn, changes due to techno-
logical advances are making the data collection process faster, simpler, more secure, and
even less expensive. Nonetheless, the response rate—the percentage of the individuals
who are asked to participate in a survey who actually take part in that survey—is low
and declining yearly. 4 At the same time, a “squeeze” is apparent in the rising percent-
age of noncontacts, or the percentage of those individuals
who researchers attempt to contact to ask to take part in a
survey who cannot be reached. The problem is especially
significant with telephone interviewing, as telephone
users have effectively blocked marketing research-
ers with caller ID, answering devices, and the like.
Online participants have comparable means of avoiding
surveys.
Data collection method trends are readily seen in
Figure 7. 1 , which presents recent levels of use of online,
CATI (telephone), paper-and-pencil, and computer-assisted
personal interviewing. The figure presents the findings
of surveys of the marketing research industry worldwide
conducted annually for the past several years. 5 The fi gure
shows the dramatic rise in online surveys and the concur-
rent decline in CATI (telephone) and paper-and-pencil
0%
10%
20%
2006 2007 2008 2009 2010
Online
2011 2012 2013 2014
40%
30%
50%
60%
Data Collection Trends
CATI Paper CAPI
FIGURE 7. 1 Recent Data Collection Trends
Computer technology has dramatically changed data collection in recent years.
M07_BURN3261_08_GE_C07.indd 174M07_BURN3261_08_GE_C07.indd 174 16/08/16 10:55 am16/08/16 10:55 am

7-2 MODES OF DATA COLLECTION 175
surveys along with a modest increase in computer-assisted personal interviews. Thus, the
impact of computer technology is readily apparent in Figure 7. 1 .
Despite the impression of Figure 7. 1 that online surveys are eclipsing all other meth-
ods, data collection is currently a blend of traditional, or low-technology, methods and
contemporary, or high-technology, approaches. As noted in Table 7. 2 , the four possible
types of data collection are characterized by (1) whether an interviewer is used and (2)
whether computer technology is employed. Thus, data collection can be person adminis-
tered, computer assisted, computer administered, or self-administered. We will describe
each form of administration in detail. Each data collection mode has special advantages and
disadvantages that we describe in general before discussing the various types of surveys
found within each category. Plus, each form is evolving and being reinvented with technol-
ogy. 6 Specifi c advantages and disadvantages on these various types are discussed later in
the chapter.
PERSON-ADMINISTERED SURVEYS In a person-administered survey , an interviewer reads questions, either face-to-face or over
the telephone, to the respondent and records his or her answers without the use of a computer.
This was the primary administration mode for many years. However, its popularity fell off
as costs increased and as computer technology advanced. Nevertheless, person-administered
surveys are still used, and we describe the advantages and disadvantages associated with these
surveys next.
Advantages of Person-Administered Surveys Person-administered surveys have four
unique advantages: They off er feedback, rapport, quality control, and adaptability. 7 The pres-
ence of an interviewer allows for on-the-spot instructions and helps respondents to stay on
task.
1. Feedback Interviewers often respond to direct questions from respondents during an
interview. Sometimes respondents do not understand the instructions, they may not hear the
question clearly, or they might become distracted during the interview. A human interviewer
may be allowed to adjust his or her questions according to verbal or nonverbal cues. When a
respondent begins to fi dget or look bored, the interviewer can say, “I have only a few more
questions.” Or if a respondent makes a comment, the interviewer may jot it down as a side
note to the researcher.
2. Rapport Some people distrust surveys in general, or they may have some suspicions
about the survey at hand. It is often helpful to have another human being present to develop
some rapport with the respondent early on in the questioning process. A person can create
trust and understanding that nonpersonal forms of data collection cannot achieve.
TABLE 7. 2 Data Collection and Computer Technology
No Computer Computer
Interviewer Person administered
Interviewer reads questions and
records the answers on paper.
Computer assisted
Interviewer reads the questions and uses
computer technology to record the answers
and/or otherwise assist in the interview.
No interviewer Self-administered
Respondent reads the questions on a
page and responds by writing on the
questionnaire.
Computer administered
Computer communicates the questions
and records the respondent’s answers.
Personal interviewers can build rapport with respondents who are initially distrustful or suspicious.
In a person-administered survey, an interviewer reads questions, either face-to-face or over the telephone, to the respondent and records his or her answers without the use of a computer.
M07_BURN3261_08_GE_C07.indd 175M07_BURN3261_08_GE_C07.indd 175 16/08/16 10:55 am16/08/16 10:55 am

176 CHAPTER 7 • EVALUATING SURVEY DATA COLLECTION METHODS
3. Quality Control An interviewer some-
times must select certain types of respondents
based on gender, age, or some other distin-
guishing characteristic. Personal interviewers
may be used to ensure that respondents are
selected correctly. Using a personal interviewer
ensures that every question will be asked of the
respondent. Additionally, some researchers feel
that respondents are more likely to be truthful
when they respond face-to-face.
4. Adaptability Personal interviewers
can adapt to respondent diff erences. It is not
unusual, for instance, to fi nd an elderly person
or a very young person who must be initially
helped step-by-step through the answering pro-
cess to understand how to respond to questions.
Interviewers are trained to ensure that they do
not alter the meaning of a question by inter-
preting the question to a respondent. In fact,
interviewers should follow precise rules on how to adapt to diff erent situations presented by
respondents.
Disadvantages of Person-Administered Surveys The drawbacks to using human
interviewers are human error, slowness, cost, and interview evaluation.
1. Humans Make Errors Human interviewers may ask questions out of sequence, or they
may change the wording of a question, which may change the meaning of the question alto-
gether. Humans can make mistakes recording the information provided by the respondent.
Human interviewers may make any number of errors when they become fatigued or bored
from repetition.
While not an “error” in the sense we are discussing, another danger of using personal
interviewers is the potential for “cheating,” such as trying to steer survey participants to certain
responses or purposefully recording answers that do not refl ect the participants’ responses.
2. Slow Speed Collecting data using human interviewers is slower than other modes
because of necessary sequential interviewing. Although pictures, videos, and graphics can be
handled by personal interviewers, they cannot accommodate them as quickly as, say, comput-
ers. Sometimes personal interviewers simply record respondents’ answers using pencil and
paper, which necessitates a separate data-input step to build a computer data fi le. For this
reason, increasing numbers of data collection companies have shifted to the use of laptop
computers that immediately add the responses to a data fi le.
3. High Cost Naturally, the use of a face-to-face interviewer is more expensive than, say,
mailing the questionnaire to respondents. Typically, personal interviewers are highly trained
and skilled, which explains the expense factor. Of course, a telephone personal interviewer is
less expensive, but this method is still more costly than mail or online surveys.
4. Fear of Interview Evaluation Another disadvantage of person-administered surveys
is that the presence of another person may create apprehension, 8 called interview evaluation ,
among certain respondents. Interview evaluation may occur when another person is involved
in the interviewing process and some respondents are apprehensive that they are answer-
ing “correctly.” Even when responding to questions from a perfect stranger, some people
become anxious about the possible reaction of the interviewer to their answers. They may be
Personal interviewers can adapt to differences in respondents, but they must be careful not to alter the meaning of a question.
Without a personal interviewer, a respondent may fail to understand survey
questions.
The disadvantages of person-administered surveys are human error, slow data collection, high cost, and interview evaluation apprehension among respondents.
Interview evaluation occurs when the interviewer’s presence creates anxieties in respondents that may cause them to alter their normal responses.
© R
inec
a/S
hutt
erst
ock
M07_BURN3261_08_GE_C07.indd 176M07_BURN3261_08_GE_C07.indd 176 16/08/16 10:55 am16/08/16 10:55 am

7-2 MODES OF DATA COLLECTION 177
concerned as to how the interviewer evaluates their responses, especially on personal topics,
such as personal hygiene, political opinions, fi nancial matters, and age. The presence of a
human interviewer may cause survey respondents to answer diff erently than they would in
a nonpersonal data collection mode. Some respondents, for example, try to please the inter-
viewer by saying what they think the interviewer wants to hear.
COMPUTER-ASSISTED SURVEYS Computer technology represents an attractive, effi cient, and fl exible option with respect to
survey mode, and new developments occur almost every day. While person-administered sur-
veys were the industry mainstay, computer-assisted survey methods have grown to a dominant
position in developed countries. In this mode, a telephone interviewer may read questions and
record answers on a computer screen, or a personal interviewer may use a tablet computer as
an aid in administering a survey. In a computer-assisted survey , the interviewer basically
verbalizes the questions while relying to some degree on computer technology to facilitate
the interview work. Here the computer accommodates the interview process by, for example,
showing the questions to read, allowing storage of the answers, or, perhaps, even demonstrat-
ing some product feature with a video or pictures. Computer technology assists the inter-
viewer by making the interview process more effi cient and eff ective. As you would expect,
computer-assisted surveys have many advantages and a few disadvantages.
Advantages of Computer-Assisted Surveys There are variations of computer-assisted
surveys. The interviewer may be calling on a phone or interacting with respondents face-to-
face. The computer may provide and record all questions and answers, say on a pad or tablet,
or it may be used to cryptically record answers. Regardless of which variation is considered,
at least four advantages of computer-assisted surveys are evident: speed; relatively error-free
interviews; use of pictures, audiovisuals, and graphics; and immediate capture of data. Of
course, because a trained interviewer is present, computer-assisted data collection automati-
cally garners the benefi ts of person-administered data collection.
1. Speed Perhaps the greatest single advantage of computer-assisted data collection is its
ability to gather survey data very quickly. The computer-assisted approach is much faster than
the purely human interview approach. A computer does not become fatigued or bored, and it
does not make human errors. The speed factor translates into cost savings.
2. Relatively Error-Free Interviews Properly programmed, the computer-assisted
approach guarantees zero computer errors, although it cannot prevent interviewer errors,
such as inadvertently skipping questions, asking inappropriate questions based on previous
responses, misunderstanding how to pose questions, or recording the wrong answer.
3. Use of Pictures, Audiovisuals, and Graphics Computer graphics can be integrated
into questions as they are viewed on a computer screen. Rather than having an interviewer
pull out a picture of a new type of window air conditioner, for instance, computer graphics can
show it from a 360-degree perspective. High-quality video may be programmed so that the
respondent can see the product in use or can be shown a wide range of audiovisual displays.
4. Immediate Capture of Data Usually responses are captured at the same time they are
entered into the computer. At the end of the interviewer’s day, he or she typically transmits the
respondents’ data to the central offi ce, or it may be done in real time via wireless communica-
tion. With computer-assisted telephone interviews, responses are stored immediately because
a central computer system is used.
Disadvantages of Computer-Assisted Surveys The primary disadvantages of computer-
assisted surveys are that they require some level of technical skill and setup costs may be
signifi cant.
Technology plays a support role in the interviewer’s work in a computer-assisted survey.
Computer-assisted surveys are fast, error free, capable of using pictures or graphics, able to capture data in real time.
The immediate capture of data by computer-administered surveys is an important advantage of this data collection mode.
M07_BURN3261_08_GE_C07.indd 177M07_BURN3261_08_GE_C07.indd 177 16/08/16 10:55 am16/08/16 10:55 am

178 CHAPTER 7 • EVALUATING SURVEY DATA COLLECTION METHODS
1. Technical Skills May Be Required A wide range of computer-assisted methods is avail-
able to marketing researchers. While the simplest options require minimal technical skills and
even interviewers with low-level computer skills can master them quickly, more sophisticated
versions (such as CATI, to be described later) require considerable programming skill to mas-
ter the computer interfaces.
2. Setup Costs Can Be High While computer technology can result in increases in pro-
ductivity, there can be high setup costs associated with getting some of these systems in place
and operational. Computer-assisted systems, such as electronic notebooks or tablets, incur
initial purchase costs. With the most sophisticated computer-assisted survey types, program-
ming and debugging must take place with each survey. Depending on what type of computer-
assisted survey is under consideration, these costs, including the associated time factor, can
render computer-assisted delivery systems for surveys somewhat less attractive relative to
other data collection options.
SELF-ADMINISTERED SURVEYS In a self-administered survey , the respondent completes the survey on his or her own with
no agent—human or computer—administering the interview. 9 We are referring to the proto-
typical “paper-and-pencil” survey here where the respondent reads the questions and responds
directly on the questionnaire. Normally, the respondent goes at his or her own pace, and often
he or she selects the place and time to complete the survey. He or she also may decide when
the questionnaire will be returned. In other words, responding to the questions is entirely
under the control of the respondent.
Advantages of Self-Administered Surveys Self-administered surveys have three
important advantages: reduced cost, respondent control, and reduced interview evaluation
apprehension.
1. Reduced Cost Eliminating the need for an interviewer or an administering device such as
a computer program can result in signifi cant cost savings.
2. Respondent Control Respondents can control the pace at which they respond, so they
may not feel rushed. Ideally, a respondent should be relaxed while responding, and a self-
administered survey may eff ect this relaxed state.
3. Reduced Interview Evaluation Apprehension As we noted earlier, some respon-
dents feel apprehensive when answering questions, or the topic may be sensitive, such as
gambling, 10 smoking, or personal hygiene. The self-administered approach takes the adminis-
trator, whether human or computer, out of the picture, and respondents may feel more at ease.
Disadvantages of Self-Administered Surveys The disadvantages of self-administered
surveys are respondent control, lack of monitoring, and high questionnaire requirements.
1. Respondent Control Because self-administration places control of the survey in the
hands of the prospective respondent, this type of survey is subject to the possibilities that
respondents will not complete the survey, will answer questions erroneously, will not respond
in a timely manner, or will refuse to return the survey.
2. Lack of Monitoring With self-administered surveys, there is no opportunity for the
researcher to monitor or interact with the respondent during the course of the interview. A
monitor can off er explanations and encourage the respondent to continue. But with a self-
administered survey, respondents who do not understand the meaning of a word or who are
confused about how to answer a question may answer improperly or become frustrated and
refuse to answer at all.
Disadvantages of computer-assisted data collection are the requirement of technical skills and high setup costs.
In a self-administered survey, the respondent completes the survey on his or her own; no human or computer agent administers the interview.
Self-administered surveys have three important advantages: reduced cost, respondent control, and no interview evaluation apprehension.
The disadvantages of self-administered surveys are respondent control, lack of monitoring, and high questionnaire requirements.
M07_BURN3261_08_GE_C07.indd 178M07_BURN3261_08_GE_C07.indd 178 16/08/16 10:55 am16/08/16 10:55 am

7-2 MODES OF DATA COLLECTION 179
3. High Questionnaire Requirements Because of the absence of the interviewer or an
internal computer check system, the burden of respondent understanding falls on the ques-
tionnaire itself. Not only must it have perfectly clear instructions, examples, and reminders
throughout, the questionnaire must also entice the respondents to participate and encourage
them to continue answering until all questions are complete. Questionnaire design is impor-
tant regardless of the data collection mode. However, with self-administered surveys, clearly
the questionnaire must be thoroughly reviewed and accurate before data collection begins.
You will learn more about designing questionnaires in Chapter 9 .
COMPUTER-ADMINISTERED SURVEYS In a computer-administered survey , a computer plays an integral role in posing the ques-
tions and recording respondents’ answers. The prototypical computer-administered survey
is an online survey in which respondents are directed to a website that houses the question-
naire. Amazingly sophisticated web-based questionnaire design systems can easily qualify
respondents, skip questions that should not be asked based on previous answers, include ran-
domly administered stimuli, use quota systems for sample sizes, display a range of graphics
and audiovisuals, and accomplish a large variety of tasks in place of a human interviewer.
Computer-administered surveys are not bound to the Internet, as they can be adapted for
telephone delivery, called “interactive voice response” (IVR) surveys that use prerecorded or
computer voice and allow respondents to answer questions either verbally or with a phone
keypad.
Advantages of Computer-Administered Surveys As just noted, computer-administered
surveys provide a wide variety of user-friendly features; they can be relatively inexpensive,
and most respondents are quite comfortable with most computer-administered survey topics.
1. Many User-Friendly Features A great many online questionnaire design systems are
available, and the large majority of them are easy to program as long as the user has mod-
est computer skills. So, for the researcher, many have built-in question libraries, simple
skip logic, and copy-and-paste features. They easily accommodate graphics and video snip-
pets of almost any type. Some have respondent-interactive features such as drag-and-drop,
sliding scales, constant sum scales, graphic rating scales, and more. Most have annotated
screen capture and/or video help systems. Many are linked to online panel companies so
the researcher can access practically any typical respondent group almost immediately (for
a price). They host the online questionnaires, collect the data, off er simple statistical and
graphical analyses, and aff ord downloads of the data into multiple formats such as Excel
or SPSS. On the respondent side, computer-administered surveys are easy, effi cient, and
sometimes fun. 11
2. Relatively Inexpensive Many of these systems are designed for the DIY (do-it-yourself)
marketing researcher, so they have free trial versions and graduated pricing systems that make
them aff ordable. Of course, the most sophisticated systems are expensive, although not on a
per-survey basis for marketing research companies that perform many surveys annually.
3. Reduction of Interview Evaluation Concern in Respondents Concerns among
respondents that they should give the “right” or “desirable” answers tend to diminish when
they interact with a computer. 12 In such cases, some researchers believe that respondents will
provide more truthful answers to potentially sensitive topics. A related emerging advantage
of online surveys is that when they are coupled with opt-in or “permission marketing,” they
have high response rates. That is, where a panel or database of a fi rm’s customers has agreed
to respond to online survey requests from a research fi rm or the company, studies have shown
that respondents are more cooperative and more actively involved in the survey, and response
inducements such as prenotifi cations and personalization are unnecessary. 13
With self-administered surveys, the questionnaire must be especially thorough and accurate to minimize respondent errors.
Computer-administered surveys are user friendly, inexpensive, and not threatening to respondents.
M07_BURN3261_08_GE_C07.indd 179M07_BURN3261_08_GE_C07.indd 179 16/08/16 10:55 am16/08/16 10:55 am

180 CHAPTER 7 • EVALUATING SURVEY DATA COLLECTION METHODS
Disadvantage of Computer-Administered Surveys Require Computer-Literate and Internet-Connected Respondents Whereas the
fi rst requirement is a low hurdle, there are instances where respondents do not qualify—for
example, some children, senior citizens, or disadvantaged socioeconomic groups. Many for-
eign countries have low computer and Internet penetration levels that discourage the use of
computer-administered surveys.
MIXED-MODE SURVEYS Mixed-mode surveys , sometimes referred to as hybrid surveys , use multiple data collection
modes. It has become increasingly popular to use mixed-mode surveys in recent years. Part
of this popularity is due to the increasing use of online survey research. As more and more
respondents have access to the Internet, online surveys, a form of computer-administered sur-
veys, are often combined with some other method, such as telephone surveying, a form of
person-administered surveying. Another reason for the popularity of mixed-mode surveys is
the realization by marketing researchers that respondents should be treated like customers. 14
Basically, this realization translates into the need to match the data collection mode with
respondent preferences insofar as possible to foster respondent goodwill 15 and maximize the
quality of data collected. 16
With a mixed-mode approach, a researcher may use two or more survey data collection
modes to access a representative sample, 17 or modes may be used in tandem, such as use of
the Internet to solicit respondents who agree to a face-to-face interview. 18 Some companies
are experimenting with multiple mobile media modes to match up with mobile consumers
who use social media. 19 Also, as in the case of eBay’s use of hybrid research, 20 these surveys
may facilitate the use of both quantitative and qualitative techniques to do “deep dives” into
understanding the buyer–seller trust relationship.
Advantage of Mixed-Mode Surveys Multiple Avenues to Achieve Data Collection Goal The main benefi t of mixed-mode
surveys is that researchers can take advantage of each of the various modes to achieve their
data collection goals. Generally, mixed-mode surveys aff ord better coverage of the popula-
tion, result in somewhat higher response rates, sometimes shorten questionnaire lengths, and
may lessen total survey costs. 21
Disadvantages of Mixed-Mode Surveys There are two primary disadvantages of using
hybrid data collection modes.
1. The Survey Mode May Affect Response One reason for researchers’ past reluctance
to use mixed modes for gathering data is concern that the mode used may aff ect responses
given by consumers. 22 Will consumers responding to an in-home interview with a personal
interviewer respond diff erently than those responding to an impersonal, online survey? This
disparity has been shown in comparing an online survey to a telephone survey 23 and for web
versus mail surveys. 24 Studies have been conducted to assess diff erences between data col-
lection methods in mixed-mode applications. 25 The results of studies addressing the question
of survey mode eff ects on respondents are not entirely consistent, so our warning is that the
researcher must assess diff erences in data collected to determine if the data collection mode
explains any disparities.
2. Additional Complexity Multiple modes add to the complexities of data collection. 26
For example, if you are conducting a survey online and by telephone, the wording of the
instructions must be diff erent to accommodate those reading instructions they themselves
are to follow (for online respondents) versus a telephone interviewer reading the instructions
to the respondent. Further, data from the two sources will need to be integrated into a single
Mixed-mode surveys, sometimes referred to as hybrid surveys, use multiple data collection modes.
The advantage of mixed-mode surveys is that researchers can take advantage of each of the various modes to achieve their data collection goals.
A disadvantage of the mixed-mode survey is that the researcher must assess the effects the mode may have on response data.
Multiple modes add to the complexities of data collection such as differences in instructions and integration of data from different sources.
M07_BURN3261_08_GE_C07.indd 180M07_BURN3261_08_GE_C07.indd 180 16/08/16 10:55 am16/08/16 10:55 am

7-3 DESCRIPTIONS OF DATA COLLECTION METHODS 181
dataset, so much care must be taken to ensure data are compatible. Even within a particu-
lar data collection method, there can be a mixture of diff erent types of information, which
increases the complexity of marketing research.
7- 3 Descriptions of Data Collection Methods Now that you have an understanding of the pros and cons of person-administered, self-
administered, computer-assisted, and computer-administered surveys, we can describe the
various interviewing techniques used in each mode. Not including mixed-mode surveys, sev-
eral data collection methods are used by marketing researchers ( Table 7. 3 ):
Person-administered/computer-assisted (when a computer is used to facilitate) surveys:
1. In-home survey
2. Mall-intercept survey
3. In-offi ce survey
4. Telephone survey
Computer-administered surveys:
5. Fully automated survey
6. Online survey
Self-administered surveys:
7. Group self-administered survey
8. Drop-off survey
9. Mail survey
Before we describe the various ways of performing a survey, we want to inform you that
the Marketing Research Association (MRA) Code of Ethics explicitly addresses ethical stan-
dards for all and specifi c forms of surveys. When you read the MRA Code excerpts included
TABLE 7. 3 Various Ways to Gather Data
Data Collection Method Description
In-home interview The interviewer conducts the interview in the respondent’s home. Appointments may be made
ahead by telephone.
Mall-intercept interview Shoppers in a mall are approached and asked to take part in the survey. Questions may be asked
in the mall or in the mall-intercept company’s facilities located in the mall.
In-offi ce interview The interviewer makes an appointment with business executives or managers to conduct the
interview at the respondent’s place of work.
Telephone interview Interviewers work in a data collection company’s offi ce using cubicles or work areas for each
interviewer, usually reading questions on a computer monitor. Often the supervisor has the
ability to “listen in” to interviews and to check that they are being conducted correctly.
Fully automated interview A computer is programmed to administer the questions. Respondents interact with the computer
and enter in their own answers by using a keyboard, by touching the screen, or by using some
other means.
Online survey Respondents answer a questionnaire that resides on the Internet.
Group self-administered survey Respondents take the survey in a group context. Each respondent works individually, but they
meet as a group, which allows the researcher to economize.
Drop-off survey Questionnaires are left with the respondent to fi ll out. The administrator may return at a later
time to pick up the completed questionnaire, or it may be mailed in.
Mail survey Questionnaires are mailed to prospective respondents, who are asked to fi ll them out and return
them by mail.
M07_BURN3261_08_GE_C07.indd 181M07_BURN3261_08_GE_C07.indd 181 16/08/16 10:55 am16/08/16 10:55 am

182 CHAPTER 7 • EVALUATING SURVEY DATA COLLECTION METHODS
in Marketing Research Insight 7. 1 , you will see that the code has standards for the profes-
sional treatment of respondents, the requirement for detailed instructions of interviewers, the
prohibition on using a respondent for multiple surveys at the same time, and the requirement
to obey laws of various types regarding the recruitment of Internet respondents.
PERSON-ADMINISTERED/COMPUTER-ASSISTED INTERVIEWS To recap, person-administered interviews use human interviewers who may rely on computer
assistance in which case the interviewer is computer-assisted. The critical feature is that a
human is conducting the interview. There are four common variations of person-administered/
computer-assisted interviews, and their diff erences are based largely on the location of the
interview. These methods include the in-home interview, the mall-intercept interview, the in-
offi ce interview, and the telephone interview.
In-Home Surveys As the name implies, an in-home survey is conducted by an interviewer
who enters the home of the respondent. In-home interviews take longer to recruit participants,
and researchers must travel to and from respondents’ homes. Therefore, the cost per interview
To learn more about conducting a survey, go to www.youtube.
com and search for “Quantitative Surveying Methods.”
Marketing Research Association Code of Ethics: Respondent Participation 1. Treat respondents with respect and in a professional
manner.
2. Protect the rights of respondents, including the right to refuse to participate in part or all of the research process. Researchers must respect the bounds of cooperation set by respondents, who control the parameters under which information is given. In practice, this means all of the following:
• Respondent agreement to participate in research must be obtained upfront, rather than after the fact.
• Consent must be granted freely, without coercion.• Consent may be withdrawn by the respondent at any
point during the contact.• Consent must be granted expressly for participation in
any subsequent studies.• An explicit opt-out request for any future contact or
participation at any point during the process will be honored.
• All reasonable precautions are taken so that respondents are in no way adversely affected as a result of their participation in a marketing research project.
25. Provide detailed written or verbal study instructions to those engaged in the data collection process. Accurate data can be obtained only when all parties to the research process are committed to quality. Principal inves-tigators must ensure that staff involved in sampling, fi eld-work, data processing, analysis and other facets of a study receive appropriate, detailed instructions so that operations are completed as planned. Documentation should be created
and preserved at every step of a project so that subsequent investigators can understand and replicate study fi ndings.
5. Proactively or upon request identify by name the research organization collecting data.
16. Take special care and adhere to applicable law when conducting research across state and national borders and with vulnerable populations, including but not limited to children. Specifi c laws and regulations govern research among these groups, and it is incumbent upon marketing researchers to ensure compliance obligations for all vulnerable popu-lations are met, regardless of any specifi c interviewing method or response technology in use.
Research among children requires knowledge and adherence to unique precautions that apply to all respon-dents under the age of majority, i.e. minors.Other vulnerable groups include but are not limited to:
• Elderly/aged persons• Cognitively impaired persons• Prisoners• Patients or others with medical issues
25. Provide detailed written or verbal study instructions to those engaged in the data collection process.Accurate data can be obtained only when all parties to the research process are committed to quality. Principal inves-tigators must ensure that staff involved in sampling, fi eld-work, data processing, analysis and other facets of a study receive appropriate, detailed instructions so that operations are completed as planned. Documentation should be created and preserved at every step of a project so that subsequent investigators can understand and replicate study fi ndings.
MARKETING RESEARCH INSIGHT 7. 1 Ethical Consideration
In-home interviews are used when the survey requires respondents to see, read, touch, use, or interact with a product prototype and when the researcher believes the security and comfort of respondents’ homes are important in affecting the quality of the data collected.
M07_BURN3261_08_GE_C07.indd 182M07_BURN3261_08_GE_C07.indd 182 16/08/16 10:55 am16/08/16 10:55 am

7-3 DESCRIPTIONS OF DATA COLLECTION METHODS 183
is relatively high. Two factors justify the high cost of in-home interviews. First, the market-
ing researcher must believe that personal contact is essential to the success of the interview.
Second, the researcher must be convinced that the in-home environment is conducive to the
questioning process. In-home interviews are useful when the research objective requires a
respondent’s physical presence to see, read, touch, use, or interact with the research object,
such as a product prototype. In addition, the researcher may believe that the security and com-
fort of respondents’ homes are important elements aff ecting the quality of the data collected.
For example, the Yankelovich Youth MONITOR conducts in-home interviews of children
who are age 6 and older so that both parents and children are comfortable with the interview-
ing process. 27 Computer-assisted personal interviews aff ord effi ciencies and benefi ts. 28 How-
ever, programming and testing are necessary for success. 29 Some research objectives require the respondents’ physical presence to interact with the
research object. A company develops a new type of countertop toaster oven that is designed to
remain perfectly clean. However, to get the benefi t of clean cooking, it must be set up according
to diff erent cooking applications (pizza versus bacon, for example), and the throwaway “grease-
catch foil” must be placed correctly at the bottom of the unit to work properly. Will consum-
ers be able to follow the setup instructions? This is an example of a study that would require
researchers to conduct surveys in respondents’ home kitchens. Researchers would observe as
respondents open the box, unwrap and assemble the device, read the directions, and cook a meal.
All of this may take an hour or more. Again, respondents may not be willing to travel somewhere
and spend an hour on a research project. They may be more likely to do this in their own home.
Mall-Intercept Surveys Although the in-home interview has important advantages, it has
the signifi cant disadvantage of cost. The expense of in-home interviewer travel is high, even
for local surveys. Patterned after “man-on-the-street” interviews pioneered by opinion-polling
companies and other high-traffi c surveys conducted in settings where crowds of pedestrians
pass by, the mall-intercept survey is one in which the respondent is encountered and ques-
tioned while he or she is visiting a shopping mall. A mall-intercept company generally has
offi ces in a large shopping mall, usually one that draws from a regional rather than a local
market area. Typically, the interview company negotiates exclusive rights to do interviews in
the mall and, thus, forces all marketing research companies that wish to do mall intercepts in
that area to use that interview company’s services. In any case, the travel costs are eliminated
because respondents incur the costs themselves
by traveling to the mall. Mall-intercept interview-
ing has acquired a major role as a survey method
because of its ease of implementation 30 and is avail-
able in many countries. 31 Shoppers are intercepted
in the pedestrian traffi c areas of shopping malls and
either interviewed on the spot or asked to move to a
permanent interviewing facility located in the mall
offi ce. Although some malls do not allow market-
ing research interviewing because they view it as a
nuisance to shoppers, many permit mall-intercept
interviews and may rely on these data themselves to
fi ne-tune their own marketing programs. Mall-inter-
cept companies are adopting high-tech approaches,
such as iPads and other mobile devices, and they are
experimenting with kiosks to attract respondents. 32
In addition to low cost, mall interviews have
many of the benefi ts associated with in-home inter-
viewing. As we noted earlier, the most important
advantage is the presence of an interviewer who
can interact with the respondent. 33 However, a few
In-home interviews facilitate interviewer–interviewee rapport.
Mall-intercept interviews are conducted in large shopping malls, and they are less expensive per interview than are in-home interviews.
The representativeness of mall interview samples is always an issue.
© S
yda
Prod
ucti
ons/
123R
F
M07_BURN3261_08_GE_C07.indd 183M07_BURN3261_08_GE_C07.indd 183 16/08/16 10:55 am16/08/16 10:55 am

184 CHAPTER 7 • EVALUATING SURVEY DATA COLLECTION METHODS
drawbacks are specifi cally associated with mall interviewing. First, sample representativeness
is an issue, for most malls draw from a relatively small area in close proximity to their location.
If researchers are looking for a representative sample of some larger area, such as the county
or MSA, they should be wary of using the mall intercept. Some people shop at malls more fre-
quently than others and therefore have a greater chance of being interviewed. 34 Recent growth of
nonmall retailing concepts, such as catalogs and stand-alone discounters such as Walmart and, of
course, online vendors such as Amazon, mean that more mall visitors are recreational shoppers
rather than convenience-oriented shoppers, resulting in the need to scrutinize mall-intercept sam-
ples as to what consumer groups they actually represent. Also, many shoppers refuse to take part
in mall interviews for various reasons. Nevertheless, special selection procedures called quotas ,
which are described in Chapter 9 , may be used to counter the problem of nonrepresentativeness.
A second shortcoming of mall-intercept interviewing is that a shopping mall does not
have a comfortable home environment that is conducive to rapport and close attention to
details. The respondents may feel uncomfortable because passersby stare at them; they may
be pressed for time or otherwise preoccupied by various distractions outside the research-
er’s control. These factors may adversely aff ect the quality of the interview. Some interview
companies attempt to counter this problem by taking respondents to special interview rooms
located in the interview company’s mall offi ces. This procedure minimizes distractions and
encourages respondents to be more relaxed. Some mall interviewing facilities have kitchens
and rooms with one-way mirrors.
In-Offi ce Surveys Although the in-home and mall-intercept interview methods are appro-
priate for a wide variety of consumer goods, marketing research conducted in the B2B or
organizational market typically requires interviews with business executives, purchasing
agents, engineers, or other managers. Normally, in-offi ce surveys take place in person while
the respondent is in his or her offi ce or perhaps in a company lounge area. Interviewing
businesspeople face-to-face has essentially the same advantages and drawbacks as in-home
consumer interviewing. For example, if Knoll, Inc., wants information regarding user pref-
erences for diff erent adjustment features that might be off ered in an ergonomic offi ce chair
designed for business executives, it would make sense to interview prospective users or pur-
chasers of these chairs. It would also be logical that these people would be interviewed at their
places of business.
As you might imagine, in-offi ce personal interviews incur relatively high costs. Those
executives qualifi ed to give opinions on a specifi c topic or individuals who would be involved
in product purchase decisions must fi rst be located. Sometimes names can be obtained from
sources such as industry directories or trade association membership lists. More frequently,
screening must be conducted over the telephone by calling a particular company that is believed
to have executives of the type needed. However, locating those people within a large organiza-
tion may be time consuming. Once a qualifi ed person is located, the next step is to persuade that
person to agree to an interview and then set up a time for the interview. This may require a siz-
able incentive. Finally, an interviewer must go to the particular place at the appointed time. Even
with appointments, long waits are sometimes encountered, and cancellations are not uncommon
because businesspersons’ schedules sometimes shift unexpectedly. Added to these cost factors is
the fact that interviewers who specialize in businesspeople interviews are more costly in general
because of their specialized knowledge and abilities. They have to navigate around gatekeep-
ers such as secretaries, learn technical jargon, and be conversant on product features when the
respondent asks pointed questions or even criticizes questions as they are posed to him or her.
Technology, naturally, is impacting personal interviewing with the emergence of web interview-
ing systems or Internet conversation systems such as Skype that eliminate most of the logistical
aspects of personal interviews at home, in the offi ce, or even with groups.
Telephone Surveys As we have mentioned previously, the need for a face-to-face inter-
view is often predicated on the necessity of the respondent’s physical inspection of a product,
In-offi ce interviews are conducted at executives’ or managers’ places of work because they are the most suitable locations.
In-offi ce personal interviews incur costs because of diffi culties in accessing qualifi ed respondents.
M07_BURN3261_08_GE_C07.indd 184M07_BURN3261_08_GE_C07.indd 184 16/08/16 10:55 am16/08/16 10:55 am

7-3 DESCRIPTIONS OF DATA COLLECTION METHODS 185
advertisement, or packaging sample. On the other hand, it may be vital that the interviewer
watch the respondent to ensure that correct procedures are followed or otherwise to verify
something about the respondent or his or her reactions. However, if physical contact is not
necessary, telephone interviewing is an attractive option. There are a number of advantages as
well as disadvantages associated with telephone interviewing. 35
The advantages of telephone interviewing are many, and they explain why phone sur-
veys are common in marketing surveys. First, the telephone is a relatively inexpensive way
to collect survey data. Telephone charges are much lower than the cost of a face-to-face
interview. A second advantage of the telephone interview is that it has the potential to yield
a high-quality sample. If the researcher employs random dialing procedures and proper call-
back measures, the telephone approach may produce a better sample than any other sur-
vey procedure. A third important advantage is that telephone surveys have quick turnaround
times. Most telephone interviews are of short duration anyway, but a good interviewer may
complete several interviews per hour. Conceivably, a study could have the data collection
phase executed in a few days with telephone interviews. In fact, in the political polling
industry in which real-time information on voter opinions is essential, it is not unusual to
have national telephone polls completed in a single night. However, a signifi cant percentage
of households are dropping wire-line phone service in favor of mobile phones. This trend
is more prevalent in younger populations, so researchers are gravitating to mobile device
administration of surveys. Unfortunately, the telephone survey approach has several shortcomings. First, the respon-
dent cannot be shown anything or physically interact with the research object. This shortcom-
ing ordinarily eliminates the telephone survey as an alternative in situations requiring that the
respondent view product prototypes, advertisements, packages, or anything else. A second dis-
advantage is that the telephone interview does not permit the interviewer to make the various
judgments and evaluations that can be made by the in-person interviewer. For example, judg-
ments regarding respondent income based on a respondent’s home and other outward signs of
economic status cannot be made. Similarly, the telephone does not allow for the observation of
body language and facial expressions, nor does it permit eye contact. On the other hand, some
may argue that the lack of face-to-face contact is helpful. Self-disclosure studies have indicated
that respondents provide more information in personal interviews, except when the topics are
threatening or potentially embarrassing. Questions on alcohol consumption, contraceptive
methods, racial issues, or income tax reporting will probably generate more valid responses
when asked in the relative anonymity of the telephone than when administered face-to-face.
A review article concluded that, compared to face-to-face interviews, telephone interviews
elicit more suspicion and less cooperation, generate more “no opinions” and socially desirable
answers, and foster more dissatisfaction with long interviews. 36
A third disadvantage of the telephone interview is that marketing researchers are more
limited in the quantity and types of information they can obtain. Very long interviews are
inappropriate for the telephone, as are questions with lengthy lists of response options that
respondents will have diffi culty remembering when they are read over the telephone. Respon-
dents short on patience may hang up during interviews, or they may utter short and convenient
responses just to speed up the interview. Obviously, the telephone is a poor choice for con-
ducting an interview with many open-ended questions where respondents make comments or
give statements, as the interviewer will have great diffi culty recording these remarks. The fi nal—and perhaps and most signifi cant—problem with telephone surveys is the
growing threat to its existence as a result of increased noncooperation by the public. This situ-
ation is compounded by consumers’ use of answering machines, caller recognition, and call-
blocking devices. Another diffi culty is that legitimate telephone interviewers must contend
with the negative impression people have of telemarketers. Despite their shortcomings and declining response rates, telephone surveys remain some-
what popular. In fact, when monetary incentives, assurance that it is not a sales call, and a
Advantages of telephone interviews are cost, quality, and speed.
The telephone is a poor choice for conducting a survey with many open-ended questions.
Telephone interviewers must contend with the negative impression people have of telemarketers.
M07_BURN3261_08_GE_C07.indd 185M07_BURN3261_08_GE_C07.indd 185 16/08/16 10:55 am16/08/16 10:55 am

186 CHAPTER 7 • EVALUATING SURVEY DATA COLLECTION METHODS
promise of a short survey are involved, response rates are quite good, according to one study
conducted in New Zealand. 37
Central location telephone surveying involves a fi eld data collection company hous-
ing a multitude of telephone lines at one location from which interviewers make calls. Usu-
ally, interviewers have separate enclosed work spaces and lightweight headsets that free both
hands so they can record responses. Everything is done from this central location. Obviously,
there are many advantages to operating from a central location. For example, resources are
pooled, and interviewers can handle multiple surveys, such as calling plant managers in the
afternoon and households in the evening hours. The reasons accounting for the prominence
of the central location phone interview are effi ciency and control. Effi ciency is gained when
everything is performed at a single location and further acquired by the benefi t that multiple
telephone surveys can be conducted simultaneously. Perhaps the most important advantage of central location interviewing is quality con-
trol. Recruitment and training are performed uniformly at this location. Interviewers can be
oriented to the equipment, study the questionnaire and its instructions, and practice the inter-
view among themselves over their phone lines. Also, the actual interviewing process can be
monitored. Most telephone interviewing facilities have monitoring equipment that permits
a supervisor to listen in on an interview as it is being conducted. Interviewers who are not
doing the interview properly can be spotted and the necessary corrective action taken. Ordi-
narily, each interviewer will be monitored at least once per shift, 38 but the supervisor may
focus attention on newly hired interviewers to ensure they are doing their work correctly.
The fact that interviewers never know when the supervisor will listen in tends to ensure more
diligence. Also, completed questionnaires are checked on the spot as a further quality control
check. Interviewers can be immediately informed of any defi ciencies in fi lling out the ques-
tionnaire. Finally, there is control over interviewers’ schedules. That is, interviewers report
in and out and work regular hours, even if they are evening hours, and make calls during the
time periods stipulated by the researcher as appropriate interviewing times.
The most advanced central location telephone interview companies operate with
computer-assisted telephone interviews (CATI) . Although each system is unique and new
developments occur regularly, we can describe a typical setup. Each interviewer is equipped
with a hands-free headset and is seated in front of a computer screen that is driven by the com-
pany’s computer system. Often the computer dials the prospective respondent’s telephone auto-
matically, and the computer screen provides the interviewer with the introductory comments.
As the interview progresses, the interviewer moves through the questions by pressing a key or a
series of keys on the keyboard. Some systems use light pens or pressure-sensitive screens. The questions and possible responses appear on the screen one at a time. The interviewer
reads the questions to the respondent and enters the response codes, and the computer moves
on to the next appropriate question. For example, an interviewer might ask if the respondent
owns a dog. If the answer is “yes,” there could appear a series of questions regarding what
type of dog food the dog owner buys. If the answer is “no,” these questions would be inappro-
priate. Instead, the computer program skips to the next appropriate question, which might be
“Do you own a cat?” In other words, the computer eliminates the human error potential that
would exist if this survey were done in non-CATI interviewing. The human interviewer is just
the “voice” of the computer, but because telephone communication is used, the respondent
usually does not have any clue that a computer is involved. With CATI, the computer can be used to customize questions. For example, in the early
part of a long interview, the interviewer might ask a respondent the years, makes, and models
of all cars he or she owns. Later interview questions might focus on each vehicle. The question
might come up on the interviewer’s screen as follows: “You said you own a Lexus. Who in
your family drives this car most often?” Other questions about this car and others owned would
appear in similar fashion. Similarly, most CATI systems do not permit users to enter an “impos-
sible” answer. For example, if a question has three possible answers with codes A, B, and C and
the interviewer enters a D by mistake, the computer will refuse the answer until an acceptable
With CATI, the interviewer reads the questions on a computer screen and enters respondents’ answers directly into the computer program.
With CATI, the interviewer is the “voice” of the computer.
Most CATI systems are programmed to reject wrong answers.
Central location interviewing is the current telephone survey standard because it affords effi cient control of interviewers.
M07_BURN3261_08_GE_C07.indd 186M07_BURN3261_08_GE_C07.indd 186 16/08/16 10:55 am16/08/16 10:55 am

7-3 DESCRIPTIONS OF DATA COLLECTION METHODS 187
code is entered. If a combination or pattern of answers is impossible, the computer will not
accept an answer, or it may alert the interviewer to the inconsistency and move to a series of
questions that will resolve the discrepancy. Finally, data are entered directly into a computer fi le
as the interviewing is completed, so tabulations may be run at any point in the study. The many
advantages and quick turnaround of CATI and CAPI (computer-assisted personal interviewing)
make them mainstay data collection methods for many syndicated omnibus survey services. 39, 40 As you are learning, computer-assisted interviews vary by the method of delivery, mean-
ing with or without an interviewer and, if an interviewer is present, by face-to-face or tele-
phone administration. Read Marketing Research Insight 7. 2 to fi nd out how CASI, CAPI, and
CATI diff er in response quality.
Which Computer-Assisted Interview Is Best: CASI, CAPI, or CATI? As has been pointed out repeatedly in this chapter on data collection, computer technology has become the marketing researcher’s best friend and is heavily relied upon. There are, however, various fl avors or varieties of computer integration or support for interviews. There are three popular options:
• Computer-Assisted Self Interviewing (CASI)—the respon-dent answers questions without any human interviewer or assistance such as an online survey.
• Computer-Assisted Personal Interviewing (CAPI)—an interviewer administers the questions and records the respondent’s verbal responses in a face-to face context with the aid of a computer, such as a laptop or tablet that takes the place of “hard copy” and receives and stores the respondent’s answers.
• Computer-Assisted Telephone Interviewing (CATI)—an interviewer administers the questions and records the respondent’s verbal responses over the telephone with the aid of a computer, such as a laptop or tablet that takes the place of “hard copy” and receives and stores the respondent’s answers.
Although these three computer-assisted data collection methods are similar, there are some intuitive differences among them. For example, CASI facilitates privacy and anonymity because there is no human present or on the telephone line. Thus, one would expect CASI respondents to be more honest and open. Stated differently, the presence of someone to hear and record the respondent’s answers may cause some respon-dents to underreport or downplay their answers to questions that touch on personal or emotional topics, such as sexual behaviors, use of drugs, alcohol consumption, risky behaviors, and the like. Answering questions about even less personal and emotional issues can also be affected, such as attending religious services, reading newspapers daily, watching certain television shows, making efforts to conserve resources, and purchasing premium or luxury brands. Moreover, because respondents move through the survey at their own pace, they may feel less pressured to respond quickly, particularly with
open-ended questions where they compose a written comment or response. If there are graphics or visuals, respondents do not feel compelled to give an answer quickly to an interviewer who is waiting for it, so they may take more time to study, absorb, or process these visuals.
Researchers 41 investigated how CASI, CAPI, and CATI infl u-enced survey responses. They created three data collection situations, one for each type of computer-assisted interview-ing, and administered each one to matched samples of respon-dents. Although the study compared a number of difference measures of response behavior, it was found that for CAPI and CATI, both requiring the face-to-face or voice presence, respectively, of an interviewer, CAPI obtained better responses than did CATI some of the time. CASI, with no interviewer pres-ent, generally performed better than CAPI or CATI in obtaining “better” responses most of the time.
The fi ndings of this study suggest that in general CASI is a better choice than CAPI or CATI, and CAPI is probably better than CATI, when any or a combination of the following topics is being researched:
• Socially undesirable personal behavior such as sexual activity, drug use, or driving violations
• Socially desirable behaviors such as not watching soap operas, watching news reports daily, managing fi nances
• Obtaining truthful extreme answers or obtaining fewer “no opinion” responses
• Obtaining truthful “don’t know” answers • Reading or studying visuals such as advertisements or the like • Obtaining truthful opinions on politically charged topics
Is CASI always better? Consider that this study used respon-dents who were provided by a panel company. In other words, these were “seasoned” respondents who had experiences with online and other surveys, so they all probably had very high comfort levels with surveys in general. Less experienced respon-dents, meaning the general public, who have lower comfort levels with surveys will probably exhibit more interview appre-hension when interviewers are present.
MARKETING RESEARCH INSIGHT 7. 2 Digital Marketing Research
M07_BURN3261_08_GE_C07.indd 187M07_BURN3261_08_GE_C07.indd 187 16/08/16 10:55 am16/08/16 10:55 am

188 CHAPTER 7 • EVALUATING SURVEY DATA COLLECTION METHODS
COMPUTER-ADMINISTERED INTERVIEWS As we have pointed out, computer technology has had a very signifi cant impact on survey
data collection. While new forms are constantly evolving, we will describe two variations of
computer-administered interview systems. In one, a “synthetic” human interviewer is used,
meaning that the questions are prerecorded or a computer “voice” is generated. Thus, it may
sound as if a human interviewer is doing the questioning, but it is really a machine. Second,
as you saw in Figure 7. 1 , the Internet-based interview has charged to the forefront of survey
techniques, and we describe online surveys in this section as well.
Fully Automated Survey Some companies have developed fully automated surveys , in
which the survey is administered by a computer but not online. With one such system, a computer
dials a phone number, and a recording is used to introduce the survey. The respondent then uses
the push buttons on his or her telephone to make responses, thereby interacting directly with the
computer. In the research industry, this approach is known as completely automated telephone survey (CATS) . CATS has been successfully employed for customer satisfaction studies, service
quality monitoring, Election Day polls, product/warranty registration, and even in-home product
tests with consumers who have been given a prototype of a new product. 42 When CATS is used
with telephone communication, and the respondent verbalizes responses that are interpreted by
the computer, the method is sometimes called IVR, for interactive voice response.
Active Learning
Setting Up Controls for a Telephone Interview
For this Active Learning exercise, assume your marketing research course requires team proj-ects and your team decides to research why students at your university chose to attend it. Your five-member team will conduct telephone interviews of 200 students selected at random from your university’s student directory, with each team member responsible for completing 40 interviews by calling from his or her apartment or dorm room. You have volunteered to supervise the telephone interviewing. You have read about the tight controls in effect with central telephone interview companies, and you realize that quality assurance procedures should be in place with your student team member telephone interviewers. To satisfy each of the following telephone quality issues, what procedure would you propose to use?
Quality Assurance Procedure Write Your Proposed Procedures Here
The student team member interviewers should call the right students at the proper times of the day.
They must conduct the interviews correctly by read-ing the instructions and “skipping” questions as required by the respondent’s answers.
The 40 interviews should be conducted on schedule.
Interviewers should be instructed on how to handle “no answers” and answering machines.
A mechanism should be in place to detect bogus interview data in case some interviewers decide to submit false results.
You may want to review the descriptions of how central location telephone surveys are conducted to see if your answers to these questions about your team research project are con-sistent with standard practices in marketing research described in this chapter. After you com-plete this exercise, write about how control of telephone interviews would be easier if done in a central location telephone facility.
To see how to set up a completely automated telephone
system, go to www.youtube.com and search for “Learn About PrecisionPolling.com .”
M07_BURN3261_08_GE_C07.indd 188M07_BURN3261_08_GE_C07.indd 188 16/08/16 10:55 am16/08/16 10:55 am

7-3 DESCRIPTIONS OF DATA COLLECTION METHODS 189
In another system, the respondent sits or stands in front of the computer unit and reads
the instructions from the screen. Each question and its various response options appear on the
screen, and the respondent answers by pressing a key or touching the screen. For example, the
respondent may be asked to rate how satisfi ed, on a scale of 1 to 10 (where 1 is very unsatis-
fi ed and 10 is very satisfi ed), he or she was the last time he or she used a travel agency to plan
a family vacation. The instructions would instruct the respondent to press the key with the
number appropriate to his or her degree of satisfaction. The respondent might press a 2 or a
7, depending on his or her experience and expectations. However, if the respondent presses 0
or a letter key, the computer could be programmed to beep, indicating that the response was
inappropriate, and instruct the respondent to make another entry.
All of the advantages of computer-driven interviewing are found in this approach. In
addition, the interviewer expense or extra cost of human voice communication capability
for the computer is eliminated. Because respondents’ answers are saved in a fi le during the
interview itself, tabulation can take place on a daily basis, and it is a simple matter for the
researcher to access the survey’s data at practically any time. 43
Online Surveys The Internet-based questionnaire in which the respondent answers
questions online has become the industry standard for surveys in virtually all high-Internet-
penetration countries. Internet-based online surveys are fast, easy, and inexpensive. 44 The
questionnaires accommodate all of the standard question formats, and they are very fl exible,
including the ability to present pictures, diagrams, or displays to respondents. Smartphone
versions of online surveys are evolving. 45 Internet-based or web surveys have earned varying
levels of popularity around the world, but online surveys do require some technical skills and
have unique practical challenges such as scrolling pages and appearance. 46
Read Marketing Research Insight 7. 3 to learn how researchers investigated how the
“cool” aspects of fashions are motivators for college students who purchase trendy clothes by
using an online data collection method.
Online data collection has profoundly changed the marketing research landscape, 47 particu-
larly in the case of online panels. 48 For instance, using such a panel, a company could conduct
“episodic” research of customer satisfaction instead of one large study per year, facilitating “con-
tinuous market intelligence” through a survey posted permanently on the web and modifi ed as
the company’s strategies are implemented. Company managers can click up tabulated customer
reactions on a daily basis. 49 Some researchers refer to this advantage of online surveys as real-time research . 50 Regardless, the speed, convenience, and
fl exibility of online surveys make them very attrac-
tive in all cases. 51 One serendipitous aspect of online
surveys is that because the researcher can monitor
survey response progress on a continual basis, it is
possible to spot problems with the survey and to
make adjustments to correct these problems. Returning to the topic at hand, the online sur-
vey is no cure-all for a marketing researcher’s data
collection woes, as the marketing research indus-
try quickly learned that its honeymoon with Inter-
net surveys was short. Their novelty soon wore
off , and Internet surveys quickly began exhibiting
symptoms of low cooperation rates that dimin-
ish the quality of telephone and mail surveys.
Marketing researchers were quick to realize that
online surveys presented design challenges and
opportunities related to fostering cooperation in
potential respondents.
If you want to learn how to do an online survey using Google Docs,
go to www.youtube.com and search for “Create a Free Online Survey Using Google Docs (Free Online Survey Tool).”
Online surveys allow respondents to participate while in relaxed and
comfortable surroundings.
Online surveys have important advantages of speed and low cost plus real-time access of data; however, there are drawbacks of sample representativeness, respondent validation, and diffi culty in asking probing types of questions.
© W
aveb
reak
med
ia/S
hutt
erst
ock
M07_BURN3261_08_GE_C07.indd 189M07_BURN3261_08_GE_C07.indd 189 16/08/16 10:55 am16/08/16 10:55 am

190 CHAPTER 7 • EVALUATING SURVEY DATA COLLECTION METHODS
Web Survey Reveals College Students’ Motivations for “Cool” Clothing College students, often referred to as Generation Yers, are very different consumers as compared to their parents or other demographic consumer segments. In particular, Gen Yers have substantially greater purchasing power, which they spend on purchases such as music, movies, food, and television. They are also “into” clothing and strong brands. Consequently, Gen Yers patronize high-end department stores and specialty cloth-ing stores. They think nothing of paying premium prices for fashion items that are “cool.”
Marketing researchers 52 studying the fashion adoption of Gen Yers identifi ed the following fi ve different types of “coolness” that motivate their purchases of innovative clothing.
• Singular cool—unique, novel, and exclusive • Personal cool—expression of individuality and identity • Aesthetic cool—fl attering color, cut, and/or style • Functional cool—affordable and/or comfortable • Quality cool—good construction and longevity
These researchers constructed a long questionnaire deal-ing with measures of these fi ve kinds of coolness, demo-graphic factors, and fashion adoption. They specifically wanted to survey college students because of their fashion consciousness and open-mindedness toward innovative prod-ucts. They mulled over the data collection method alterna-tives and realized that in-home personal interviews were not
feasible because they would need to send interviewers to dorm rooms, apartments, sororities, and fraternity houses. Telephone interviews were impractical because of the long survey, and mail surveying was defi nitely out of the question. So, in order to fi t in with the high-technology comfort zones of college students, they created an online survey. Instructors of 11 different courses at a major U.S. university notifi ed their students of the survey and provided access details. A sizeable sample of college students completed the survey in a mat-ter of a few days, and the sample’s demographic profi le (age, gender, ethnic group, etc.) approximated that of the university as a whole.
Of course, the researchers were aware that fashion adop-tion is not uniform across all college students, so they sepa-rated the sample into high- and low-income groups. It was discovered that the clothing fashion adoption of low-income college students is driven by three types of coolness: the per-ceived high quality of the item, the uniqueness of the item, and the color, cut, or style. High-income college students have somewhat different motivations, as it was discovered that they also purchase new fashion due to uniqueness and color, cut, or style; however, they are motivated as well by expression of their personality or individuality. An interesting difference is that high-income college students are negatively motivated by functionality, meaning that they adopt new fashions even if they are high priced, uncomfortable, and not totally functional.
MARKETING RESEARCH INSIGHT 7. 3 Practical Application
Active Learning
Learn About Online Marketing Research Software Systems
Several companies have developed online questionnaire design and hosting systems. A quick search using Google will likely turn up 20 or more competitors. Practically all of these companies allow you to use their systems on a trial basis. Select one and download or otherwise gain access to the online survey system. Now answer each of the following questions:
1. How do you create the following question and answers on this system: Have you purchased something at a Best Buy store in the past month? Yes No
2. What is skip logic, and how does it work on this system if you want the respondents who did purchase something at Best Buy to indicate whether they bought a 3-D HDTV?
3. Is the system user friendly? Why or why not? 4. What feature best demonstrates that this system is using sophisticated computer and/or
Internet technology?
M07_BURN3261_08_GE_C07.indd 190M07_BURN3261_08_GE_C07.indd 190 16/08/16 10:55 am16/08/16 10:55 am

7-3 DESCRIPTIONS OF DATA COLLECTION METHODS 191
SELF-ADMINISTERED SURVEYS Recall that a self-administered survey is one in which the respondent is in control, often decid-
ing when to take the survey, where to take it, and how much time and attention to devote to it.
With a self-administered survey, the respondent always decides what questions he or she will
or will not answer. That is, the respondent fi lls in answers to a static copy of the questionnaire,
which is what we have referred to as a paper-and-pencil questionnaire in previous descrip-
tions. Probably the most popular type of self-administered survey is the mail survey; however,
researchers may consider two other variations from time to time: the group self-administered
survey and the drop-off survey.
Before continuing, let’s address why Internet-based interviews are not categorized as
self-administered. They do not fall into this category because the sophistication of Inter-
net-based questionnaire design software does not allow respondents to avoid answering key
questions. For example, the program may be set up to remind a respondent that a certain
question was not answered. This prompt continues until the respondent answers the ques-
tion. In addition, online questionnaire systems usually have skip logic, meaning that ques-
tions that are not appropriate to ask based on previous answers (e.g., Do you own a car? If
no, do not ask questions about the car; if yes, do ask questions about the car) are not seen by
the respondent. Some online questionnaire systems have display logic meaning that certain
questions are asked, or displayed, only if answers to prior questions trigger them. For exam-
ple, “yes” answers to “Have you ordered take-out in the past 30 days?” and “Did you pick
it up at a drive-through window?” would trigger the display of questions about satisfaction
with take-out and drive-through window service. Because we consider the ability of Internet
surveys to stop respondents from “opting out” of questions and skip and display logic to be
signifi cant quality control features, we have not included Internet-based interviews in the
self-administered group.
Group Self-Administered Survey Basically, a group self-administered survey entails
administering a questionnaire to respondents in groups rather than individually for conve-
nience and to gain economies of scale. For example, 20 or 30 people might be recruited
to view a TV program sprinkled with test commercials. All respondents would be seated
in a viewing room facility, and a video would run on a large television projection screen.
Then they would be given a questionnaire to fi ll out regarding their recall of test ads, their
reactions to the ads, and so on. As you would suspect, it is handled in a group context pri-
marily to reduce costs and to provide the ability to interview a large number of people in
a short time. Variations for group self-administered surveys are limitless. Students can be administered
surveys in their classes; church groups can be administered surveys during meetings; and
social clubs and organizations, company employees, movie theater patrons, and other groups
can be administered surveys during meetings, work, or leisure time. Often the researcher will
compensate the group with a monetary payment as a means of recruiting the support of the
group’s leaders. In all of these cases, each respondent works through the questionnaire at his
or her own pace. Granted, a survey administrator may be present, so there is some opportunity
for interaction concerning instructions or how to respond, but the group context often discour-
ages the respondents from asking all but the most pressing questions.
Drop-Off Survey Another variation of the self-administered survey is the drop-off survey ,
sometimes called “drop and collect,” in which the survey representative approaches a pro-
spective respondent, introduces the general purpose of the survey to the prospect, and leaves
it with the respondent to fi ll out on his or her own. Essentially, the objective is to gain the
prospective respondent’s cooperation. The respondent is told that the questionnaire is self-
explanatory and that it will be left with him or her to fi ll out at leisure. Perhaps the repre-
sentative will return to pick up the questionnaire at a certain time, or the respondent may be
Group self-administered surveys economize in time and money because a group of respondents participates simultaneously.
Drop-off surveys must be self-explanatory because they are left with the respondents, who fi ll them out without assistance.
M07_BURN3261_08_GE_C07.indd 191M07_BURN3261_08_GE_C07.indd 191 16/08/16 10:55 am16/08/16 10:55 am

192 CHAPTER 7 • EVALUATING SURVEY DATA COLLECTION METHODS
instructed to complete and return it by prepaid mail. Normally, the representative will return
on the same day or the next day to pick up the completed questionnaire. In this way, a repre-
sentative can cover a number of residential areas or business locations in a single day with an
initial drop-off pass and a later pick-up pass. Drop-off surveys are especially appropriate for
local market research undertakings in which travel is necessary but limited. They have been
reported to have quick turnaround, high response rates, minimal interviewer infl uence on
answers, and good control over how respondents are selected; plus, they are inexpensive. 53
Studies have shown the drop-off survey improves response rates with business or organiza-
tional respondents. 54 Variations of the drop-off method include handing out the surveys to people at their
places of work, asking them to fi ll them out at home, and then to return them the next day.
Some hotel chains have questionnaires in their rooms with an invitation to fi ll them out and
turn them in at the desk on checkout. Restaurants sometimes ask customers to fi ll out short
questionnaires before they leave. Stores sometimes have short surveys on customer demo-
graphics, media habits, purchase intentions, or other information that customers are asked to
fi ll out at home and return on their next shopping trip. A gift certifi cate drawing may even be
used as an incentive to participate. As you can see, the term drop-off can be stretched to cover
any situation in which the prospective respondent encounters the survey as though it were
“dropped off ” by a research representative.
Mail Survey A mail survey is one in which the questions are mailed to prospective
respondents who are asked to fi ll them out and return them to the researcher by mail. 55 Part
of its attractiveness stems from its self-administered aspect: There are no interviewers to
recruit, train, monitor, and compensate. Similarly, mailing lists are readily available from
companies that specialize in this business, and it is possible to access specifi c groups of
target respondents. For example, it is possible to obtain a list of physicians specializing in
family practice who operate clinics in cities larger than 500,000 people. Also, one may opt
to purchase computer fi les, printed labels, or even labeled envelopes from these companies.
In fact, some list companies will even provide insertion and mailing services. A number of
companies sell mailing lists, and most, if not all, have online purchase options. On a per-
mailed respondent basis, mail surveys are inexpensive. But mail surveys incur all of the
problems associated with not having an interviewer present that were discussed earlier in
this chapter. Despite the fact that the mail survey was once described as “powerful, eff ective, and effi -
cient” 56 by the American Statistical Association, this research vehicle is plagued by two major
problems. The fi rst is nonresponse , which refers to questionnaires that are not returned. The
second is self-selection bias , which means that those who do respond are probably diff erent
from those who do not fi ll out the questionnaire and return it; therefore, the sample gained
through this method is nonrepresentative of the general population. Research shows that self-
selected respondents can be more interested and involved in the study topic. 57 To be sure, the
mail survey is not the only survey method that suff ers from nonresponse and self-selection
bias. 58 Failure to respond is found in all types of surveys, and marketing researchers must be
constantly alert to the possibilities that their fi nal samples are somehow diff erent from the
original set of potential respondents because of some systematic tendency or latent pattern
of response. Whatever the survey mode used, those who respond may be more involved with
the product, they may have more education, they may be more or less dissatisfi ed, or they
may even be more opinionated in general than the target population of concern. 59 Mail survey
researchers have tried a wide range of tactics and incentives to increase the response rate, but
no huge increases have occurred. Marketing Research Insight 7. 4 describes how a mail delivery and return method was
used to survey a very special target population, namely, South African safari hunters. Under
the circumstances of the project, a mail approach did result in a successful survey.
Mail surveys suffer from nonresponse and self-selection bias.
Self-selection bias means respondents who return surveys by mail may differ from the original sample.
M07_BURN3261_08_GE_C07.indd 192M07_BURN3261_08_GE_C07.indd 192 16/08/16 10:55 am16/08/16 10:55 am

7-4 WORKING WITH A PANEL COMPANY 193
7- 4 Working with a Panel Company As we have noted numerous times, the marketing research industry is plagued with almost
universal reluctance in the population to take part in surveys. This situation means that no
matter what data collection method is used, sample size targets and sample composition
requirements are exceedingly diffi cult to attain. For instance, if 5,000 random telephone calls
are made, perhaps only 5% will result in completed surveys, or if a like number of email
How to Survey South African Safari Hunters Sometimes a marketing researcher is asked to study unusual topics, as was the case with a recent survey conducted in South Africa. Actually, the survey did not take place in South Africa, but it concerned individuals who had visited that country in the past few years for the specifi c purpose of big game hunt-ing. The following is a description 60 of the phenomenon under investigation.
Even though the hunting safari occurs mainly on pri-vately owned game ranches, it is regulated by a well-organized game ranching and professional hunting industry. A hunting outfi tter typically provides all the services required by the visiting hunter. These include the arrangement of the hunt, obtaining the necessary hunting permits, dealing with landowners, and see-ing to written agreements regarding trophy fees, daily rates, and the species and sex of game offered. Other services relate to ground transportation, accommoda-tion, domestic air charters, actual hunting, and prepara-tion, packaging, and shipping of trophies. The outfi tter is assisted by trained professional hunters (individuals who have attended a registered professional hunting school, passed the theoretical and practical examinations set by the relevant Provincial Nature Conservation Authorities, and possess the specifi ed knowledge, abilities, skills, and experience. The latter includes at least sixty days experi-ence hunting dangerous game). Hunters can choose a package from a selection of safaris. The fi nal cost of the safari is negotiated and depends on the availability of the hunting area, dates and species, the status of the booking sheet, and the reputation of the outfi tter and/or professional hunter. These negotiations can take up to 18 months, with the typical big-game hunter paying over US$100,000 for a 21-day hunting experience. This fi gure excludes costs for additional guests, such as observers or family members, who accompany the hunter.
As one would imagine, safari hunters are a very unusual set of individuals, and conducting a survey with this population poses challenges not found with most other populations. For one, these individuals can live practically in anywhere in the world. Personal interviews are not feasible for this reason. Mall-intercept surveys and group-based data collection are likewise
impractical. Safari hunters are obviously very wealthy, and they undoubtedly guard their personal privacy tenaciously. They are very unlikely to take part in any survey regardless of the data collection method employed.
However, as can be seen in the preceding description, several forms of paperwork, such as permits, contracts, and agreements, identify and include contact information for safari hunters. Unfortunately, the country of South Africa and the professional hunting industry maintain strict confi dentiality of all such information. To access this population, the researchers turned to a “professional facilitator” who agreed to act as an intermediary for the survey. The facilitator agreed to distribute about 2,000 survey packages to hunters who had participated in a South African safari in past years. The researchers then designed a paper-and-pencil questionnaire with a postage-paid reply envelope and necessarily used a mail survey for the data collection. The response rate was about 13%, which is typical of mail surveys, but 19% of the returned questionnaires were found to have a substantial number of unanswered questions, which is also a typical and unfortunate characteristic of mail sur-veys that are self-administered. Nonetheless, the researchers con-sidered the survey to be a success. Most likely, the professional facilitator’s solicitation caught the attention of the respondents and convinced them of the importance and seriousness of the survey, plus the overall positive experience of the safari certainly caused some of the professional hunters to complete the survey.
The typical South African safari hunter is from the United States (76%), male (98%), between 40 and 69 years old (83%), highly educated with high income, and an experienced hunter. Safari hunting is closely related to the hunter’s personal values of conservation, understanding nature, escape, and heritage. It is also somewhat related to gaining the admiration of others for hunting trophies, and it is closely related to the hunter’s need for excitement, adventure, sport, and challenge. Finally, safari hunters enjoy the opportunities their safaris afford for learning about others, meeting other hunters, and meeting new people. The survey also revealed the uniqueness of South Africa as a hunting safari location, for the hunters agreed strongly that South Africa has abundant natural beauty with a wide variety of habitat and game species. They agreed that South Africa is a truly unique hunting experience and that hunting there was “a dream come true.”
MARKETING RESEARCH INSIGHT 7. 4 Global Application
M07_BURN3261_08_GE_C07.indd 193M07_BURN3261_08_GE_C07.indd 193 16/08/16 10:55 am16/08/16 10:55 am

194 CHAPTER 7 • EVALUATING SURVEY DATA COLLECTION METHODS
invitations are sent to a company’s customers who agree to receive them, a large percentage of
those who take part in the survey may be exceptionally loyal customers but the survey may be
testing tactics to solidify the patronage of new customers. Similarly, in either case, there may
evidence of respondents speeding through the survey, skipping questions, or providing suspi-
cious answers to key questions. The resulting poor data quality of such “cold call” or even
“respondent friendly” surveys is an unfortunate reality and, as will be described in the next
section of this chapter, good data quality is a prime objective of every survey.
Rising to the forefront of data collection is a special kind of marketing research institution
known as a panel company. A panel company recruits large numbers of potential respondents
who agree to take part in surveys for compensation. “Large” is an understatement, because
some panel companies claim to have hundreds of thousands of members worldwide, and a
few claim 1 or 2 million. These respondents agree to reply to any survey quickly and provide
complete and truthful answers. Normally, the panel members are motivated by points or a
similar awards system that accumulates as they take part in surveys, which they can redeem
for products and/or services.
ADVANTAGES OF USING A PANEL COMPANY The popularity of panel companies should be readily understandable by reviewing the follow-
ing advantages they represent.
1. Fast Turnaround Most panel companies are online, meaning that their panelist
members can be contacted almost immediately by email or text, and they complete
online surveys in a day or two after being contacted.
2. High Quality Panelists agree to careful completion of surveys, and the best panel
companies have internal checks as to timely turnaround, diligence in responding to
survey questions, and accuracy.
3. Database Information Panelists often provide large amounts of demographic,
lifestyle, purchase behavior, and other descriptive information as part of the sign-up
process. Thus, there is a wealth of information for each panelist in the panel company’s
database storage. This information may be purchased for each panelist respondent,
which subsequently reduces the length of the questionnaire for a survey. Normally, the
panel company charges by the number of questions on the survey, so this aff ords some
savings.
4. Access to Targeted Respondents Since panelists are known in the database with
respect to demographics, health profi le, possessions, experiences, and the like, it is very
easy for the panel company to customize the alerts to only panelists who qualify or are
consistent with the parameters of the client’s sample characteristics. For instance, an
automobile manufacturer may want to survey SUV owners who have two or more chil-
dren under 13 years of age, or a home environmental controls company like Nest may
require a sample of homeowners of two-story houses located in Snowbelt states. The
fact that panel companies have hundreds of thousands of panel members allows them to
deliver sizeable samples with special qualifi cations.
5. Integrated Features The leading panel companies usually have several survey
services for customers. For example, not only do they provide effi cient data collection,
but also they often have questionnaire design capabilities, data analysis and dashboards,
preset survey schedules, tracking studies, and qualitative research capabilities such
as online focus groups, in-home usage tests, and more. In fact, some operate as full-
service, custom-designed marketing research organizations if the client desires.
DISADVANTAGES OF USING A PANEL COMPANY The rapid growth and very significant adoption of panel companies by marketing
researchers suggest that they are a panacea to the world’s refusal to take part in surveys,
M07_BURN3261_08_GE_C07.indd 194M07_BURN3261_08_GE_C07.indd 194 16/08/16 10:55 am16/08/16 10:55 am
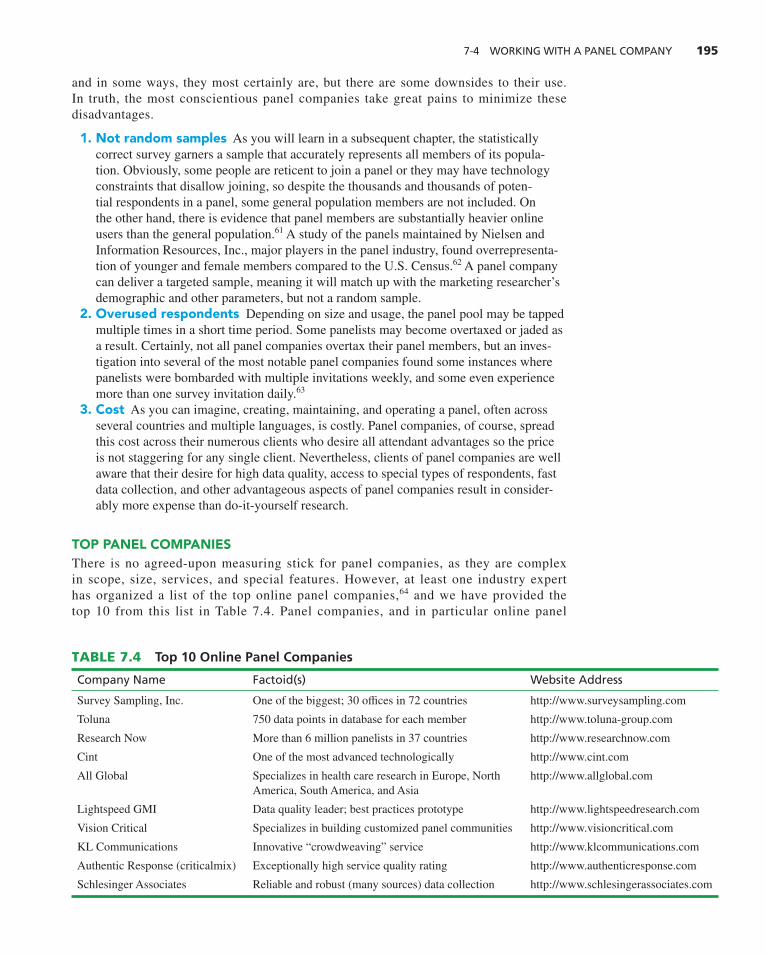
7-4 WORKING WITH A PANEL COMPANY 195
and in some ways, they most certainly are, but there are some downsides to their use.
In truth, the most conscientious panel companies take great pains to minimize these
disadvantages.
1. Not random samples As you will learn in a subsequent chapter, the statistically
correct survey garners a sample that accurately represents all members of its popula-
tion. Obviously, some people are reticent to join a panel or they may have technology
constraints that disallow joining, so despite the thousands and thousands of poten-
tial respondents in a panel, some general population members are not included. On
the other hand, there is evidence that panel members are substantially heavier online
users than the general population. 61 A study of the panels maintained by Nielsen and
Information Resources, Inc., major players in the panel industry, found overrepresenta-
tion of younger and female members compared to the U.S. Census. 62 A panel company
can deliver a targeted sample, meaning it will match up with the marketing researcher’s
demographic and other parameters, but not a random sample.
2. Overused respondents Depending on size and usage, the panel pool may be tapped
multiple times in a short time period. Some panelists may become overtaxed or jaded as
a result. Certainly, not all panel companies overtax their panel members, but an inves-
tigation into several of the most notable panel companies found some instances where
panelists were bombarded with multiple invitations weekly, and some even experience
more than one survey invitation daily. 63
3. Cost As you can imagine, creating, maintaining, and operating a panel, often across
several countries and multiple languages, is costly. Panel companies, of course, spread
this cost across their numerous clients who desire all attendant advantages so the price
is not staggering for any single client. Nevertheless, clients of panel companies are well
aware that their desire for high data quality, access to special types of respondents, fast
data collection, and other advantageous aspects of panel companies result in consider-
ably more expense than do-it-yourself research.
TOP PANEL COMPANIES There is no agreed-upon measuring stick for panel companies, as they are complex
in scope, size, services, and special features. However, at least one industry expert
has organized a list of the top online panel companies, 64 and we have provided the
top 10 from this list in Table 7. 4 . Panel companies, and in particular online panel
TABLE 7. 4 Top 10 Online Panel Companies
Company Name Factoid(s) Website Address
Survey Sampling, Inc. One of the biggest; 30 offi ces in 72 countries http://www.surveysampling.com
Toluna 750 data points in database for each member http://www.toluna-group.com
Research Now More than 6 million panelists in 37 countries http://www.researchnow.com
Cint One of the most advanced technologically http://www.cint.com
All Global Specializes in health care research in Europe, North
America, South America, and Asia
http://www.allglobal.com
Lightspeed GMI Data quality leader; best practices prototype http://www.lightspeedresearch.com
Vision Critical Specializes in building customized panel communities http://www.visioncritical.com
KL Communications Innovative “crowdweaving” service http://www.klcommunications.com
Authentic Response (criticalmix) Exceptionally high service quality rating http://www.authenticresponse.com
Schlesinger Associates Reliable and robust (many sources) data collection http://www.schlesingerassociates.com
M07_BURN3261_08_GE_C07.indd 195M07_BURN3261_08_GE_C07.indd 195 16/08/16 10:55 am16/08/16 10:55 am

196 CHAPTER 7 • EVALUATING SURVEY DATA COLLECTION METHODS
In selecting a data collection mode, the researcher balances quality against cost, time, and other considerations.
TABLE 7. 5 Relative Speed, Cost, and Data Quality of Common Data Collection Methods*
Method Speed Cost Data Quality
In-home interview Slow High High
Mall-intercept interview Fast Medium Medium
In-offi ce interview Slow High High
Telephone interview Fast Low Low
Fully automated interview Fast Medium Medium
Online survey Fast Medium Medium
Group self-administered survey Medium Low Low
Drop-off survey Fast Low Low
Mail survey Slow Low Low
*These judgments are generalizations; the special circumstances and considerations of each survey must be taken into account in the fi nal determination of best data collection method.
companies, will continue to grow and dominate the data collection landscape. Leading
companies improve, challengers enter with innovative approaches, and mergers hap-
pen every year. The companies in Table 7. 4 or others that assume leadership in this
industry in the coming years will be the mainstays of data collection for the foresee-
able future.
7- 5 Choice of the Survey Method How does a marketing researcher decide what survey method to use? Since you have read
our descriptions, you now know that each data collection method has unique advantages,
disadvantages, and special features. In its annual survey of marketing research company
practices, Greenbook typically asks about the importance of various considerations when
selecting a data collection method. Both research companies and their clients agree that
three considerations are paramount: speed, cost, and data quality. 65 Accordingly, we have
developed Table 7. 5 , which lists how each of the nine diff erent data collection methods
we have described stacks up on each consideration. As you can see by reviewing this
table, there is no “perfect” data collection method. The marketing researcher is faced with
the problem of selecting the one survey mode that is most suitable in a given situation.
We hasten to warn you that our table includes generalizations and that each data collection
situation is unique. How does a researcher decide the best survey mode for a particular research project?
When answering this question, the researcher should always have the overall quality of
the data collected as a foremost concern. Even the most sophisticated techniques of anal-
ysis cannot make up for poor data. The researcher must strive to choose a survey method
that achieves the highest quality of data allowable with the time, cost, and other special
considerations 66 involved with the research project at hand. We wish we could provide a
set of questions about these considerations that, when answered, would point to the single
most appropriate data collection method. However, this is not possible because situations
are unique and researchers have to apply good judgment to narrow down the many candi-
date data collection methods to one that best fi ts the circumstances. In some cases, these
judgments are quite obvious, but in others, they require some careful thinking. Also, as
we have indicated in our descriptions, new data collection methods have emerged and
M07_BURN3261_08_GE_C07.indd 196M07_BURN3261_08_GE_C07.indd 196 16/08/16 10:55 am16/08/16 10:55 am

7-5 CHOICE OF THE SURVEY METHOD 197
improvements in existing methods have come about, so the researcher must constantly
update his or her knowledge of these data collection methods. Nonetheless, data qual-
ity, time, cost, and special circumstances are prime considerations in the data collection
method decision.
HOW FAST IS THE DATA COLLECTION? Sometimes data must be collected quickly. There are many reasons for tight deadlines.
A national campaign is set to kick off in four weeks, and one component needs testing.
A trademark infringement trial, set to begin in four weeks, needs a survey of the aware-
ness of the company’s trademark. An application for a radio license with the FCC is due
in six weeks, and a listenership study of other stations in the area must be conducted.
These are just a few time constraints in data collection. The traditional choice in projects
with a short time horizon is a telephone survey. Today, online surveys are exceptionally
fast data collection alternatives. Magazine ads, logos, and other marketing stimuli may
be evaluated in online surveys. Poor choices under the condition of a short time horizon
would be in-home interviews or mail surveys because their logistics require long time
periods.
HOW MUCH DOES THE DATA COLLECTION COST? With a generous budget, any appropriate data collection method can be considered,
but with a tight budget, the more costly data collection methods must be eliminated from
consideration. With technology costs dropping and Internet access becoming more and
more common, online survey research options have become attractive even when the
data collection budget is austere. For example, some online survey companies allow their
clients to design the questionnaire and select the target sample type and number from
their panels. Here, surveys can be completed for a few hundred or a few thousand dol-
lars, which, most researchers would agree, is a small data collection budget. Of course,
the researcher must be convinced that the panel members are those he or she desires
to survey.
HOW GOOD IS THE DATA QUALITY? In our descriptions of the nine common data collection methods, disadvantages such as
lack of monitoring, diffi culties in allowing respondents to examine or try out prototypes,
When selecting a survey method, a researcher uses several considerations.
A short deadline may dictate which data collection method to use.
© E
ric
Isse
lee/
Shu
tter
stoc
k
M07_BURN3261_08_GE_C07.indd 197M07_BURN3261_08_GE_C07.indd 197 16/08/16 10:55 am16/08/16 10:55 am

198 CHAPTER 7 • EVALUATING SURVEY DATA COLLECTION METHODS
access of certain population segments, and even acceptable respondent time-on-task
diminish the quality of the data collected in any given survey. Ideally, survey data should
be deep, broad, and truthful, that is, of the highest quality, but data collection method
constraints and realities tend to diminish data quality. Sometimes, required data qual-
ity drives the survey method: There might be a requirement that the respondent inspect
an advertisement, package design, or logo. Or the researcher may want respondents to
handle a prototype product, taste formulations, or watch a video. At other times practical
considerations, such as a short deadline or limited funds, force the researcher to be less
adamant for the highest data quality possible. Typically, when requirements such as these
are built into the survey, the researcher has discussed data collection issues early on with
the client and agreed on a data collection mode that accommodates the client’s time, cost,
and other requirements. For example, if the respondent needs to view photos of a logo or magazine ad, mail
surveys or online surveys may be considered. If the respondent needs to observe a short
video or moving graphic, online surveys may be considered. If the respondent needs to
watch a 20-minute infomercial, mailed videos, mall intercepts, or special online systems
can be considered. If the respondent is required to handle, touch, feel, or taste a product,
mall-intercept company services are reasonable. If a respondent is required to actually use
a product in a realistic setting, in-home interviews may be the only data collection method
that will work.
OTHER CONSIDERATIONS It is not possible to list all other considerations because every survey is unique, but we will
note two considerations that are almost always part of the survey method decision. One is
the incidence rate, while the other is situational factors that have a bearing on the selection
of the data collection method. By incidence rate we are referring to the percentage of the
population that possesses some characteristic necessary to be included in the survey. Rarely
are research projects targeted to “everyone.” In most cases, there are qualifi ers for being
included in a study. Examples are registered voters, persons owning and driving their own
automobile, and persons age 18 and older. Sometimes the incidence rate is very low. A drug
company may want to interview only men above 50 with medicated cholesterol above the
250 level. A cosmetics fi rm may only want to interview women who were planning facial
cosmetic surgery within the next six months. In low-incidence situations such as these, cer-
tain precautions must be taken in selecting the data collection method. In the examples of
people with a specifi c medical condition or interest in cosmetic surgery, it would be foolishly
time consuming and expensive to send out interviewers door-to-door looking for members
who have the qualifi cations to participate in the study. A data collection method that can
screen respondents easily and inexpensively, such as with telephone or Internet modes, is
desirable with a low-incidence-rate situation because a great many potential respondents
must be contacted but a large percentage of these would not qualify to take the survey. Of
course, the marketing research industry has worked with low-incidence populations for a
long time, and online panels that are maintained by research providers are often touted as
aff ordable ways for researchers to access the low-incidence panel members who have been
previously identifi ed. 67 Finally, on occasion, data collection method choice is shaped by situational factors
such as cultural norms and/or communication or other systems that are in place. These con-
siderations have become more of an issue as more and more marketing research companies
operate around the globe. For example face-to-face is the preferred mode for Spaniards.
However, in Scandinavia, residents are uncomfortable allowing strangers in their homes.
Therefore, telephone and online surveying is more popular than door-to-door interviewing.
If respondents need to see, handle, or experience something, the data collection mode must accommodate these requirements.
The incidence rate, the percentage of the population that possesses some characteristic necessary to be included in the survey, affects the decision about data collection mode.
Cultural norms and/or limitations of communications systems may limit the data collection mode choice.
M07_BURN3261_08_GE_C07.indd 198M07_BURN3261_08_GE_C07.indd 198 16/08/16 10:55 am16/08/16 10:55 am

SUMMARY 199
Summary
We began the chapter noting that surveys are interviews of
large numbers of respondents using a predesigned ques-
tionnaire and that surveys have the following advantages:
standardization, easy administration, can get “beneath the
surface” of actions, easy analysis, and ability to study sub-
groups. Surveys involve data collection that can occur with
or without an interviewer present and with or without the
use of a computer. Technology has very greatly impacted
data collection. The data collection step in the marketing
research process is accomplished via fi ve basic survey
modes: (1) person-administered surveys, (2) computer-
assisted surveys, (3) computer-administered surveys,
(4) self-administered surveys, and (5) mixed-mode,
sometimes called hybrid , surveys. Person-administered
survey modes are advantageous because they allow feed-
back, permit rapport building, facilitate certain quality
controls, and capitalize on the adaptability of a human
interviewer. However, they are slow, prone to human
error, and costly, and they sometimes produce respondent
apprehension known as interview evaluation . Computer-
assisted interviews have all the person-administered
survey advantages and disadvantages, with added advan-
tages of less error, more effi ciency, and use of computer
media.
Computer-administered interviews, on the other
hand, are faster and error free; they may include pictures
or graphics capabilities, allow for real-time capture of
data, and make respondents feel more at ease because
another person is not listening to their answers. Disad-
vantages are that technical skills are sometimes required,
and high set-up costs may be required if users are not
computer literate. Self-administered survey modes have
the advantages of reduced cost, respondent control, and
no interview evaluation apprehension. The disadvantages
are that respondents may not complete the task or com-
plete the task in error, there is no monitor to guide respon-
dents, and the questionnaire must be “perfect” to facilitate
self-administration.
Finally, mixed-mode or hybrid surveys use multiple
data collection methods. The advantage of mixed-mode
surveys is that researchers can take the advantages of each
of the various modes to achieve their data collection goals.
Disadvantages are that diff erent modes may produce diff er-
ent responses to the same research question, and research-
ers must evaluate these diff erences. In addition, multimode
methods result in greater complexities, as researchers must
design diff erent questionnaires and be certain that data
from diff erent sources all come together in a common data-
base for analysis.
At least nine alternative survey data collection
methods may be used: (1) in-home interviews, which
are conducted in respondents’ homes; (2) mall-intercept
interviews, conducted by approaching shoppers in a
mall; (3) in-offi ce interviews, conducted with executives
or managers in their places of work; (4) telephone inter-
views, either from central location telephone interviews
conducted by workers in a telephone interview compa-
ny’s facilities or using a CATI system; (5) computerized,
fully automated surveys; (6) online surveys; (7) group
self-administered surveys, in which the questionnaire is
handed out to a group for individual responses; (8) drop-
off surveys, in which the questionnaire is left with the
respondent to be completed and picked up or returned
at a later time; and (9) mail surveys, in which question-
naires are mailed to prospective respondents who are
requested to fi ll them out and mail them back. The spe-
cifi c advantages and disadvantages of each data collec-
tion method were discussed.
Because there is reluctance worldwide to take part in
surveys and in combination with technological advances,
panel companies have become a viable and popular
means of data collection. A panel company recruits large
numbers of potential respondents who agree to take
part in surveys for compensation. These companies can
deliver fast turnaround, high-quality database informa-
tion, access to targeted respondents, and integrated ser-
vices. Even though they do not deliver random samples,
their panels are sometimes overworked, and they are not
cheap, panel companies dominate the data collection
landscape.
Researchers must take into account several consider-
ations when deciding on a survey data collection mode:
(1) speed of data collection, (2) cost of data collection,
(3) the resulting data quality, and (4) other considerations
On the other hand, in India, less than 10% of residents have a telephone, and online access
is very low; as a result, door-to-door interviewing is used often. 68 In Canada, where incen-
tives are typically not off ered to prospective respondents, there is heavy use of telephone
surveys.
M07_BURN3261_08_GE_C07.indd 199M07_BURN3261_08_GE_C07.indd 199 16/08/16 10:55 am16/08/16 10:55 am

200 CHAPTER 7 • EVALUATING SURVEY DATA COLLECTION METHODS
Key Terms
Survey (p. 171 )
Person-administered survey
(p. 175 )
Interview evaluation (p. 176 )
Computer-assisted survey (p. 177 )
Self-administered survey (p. 178 )
Computer-administered survey
(p. 179 )
Mixed-mode survey (p. 180 )
In-home survey (p. 182 )
Mall-intercept survey (p. 183 )
In-offi ce survey (p. 184 )
Central location telephone survey
(p. 186 )
Computer-assisted telephone
interviews (CATI) (p. 186 )
Fully automated survey
(p. 188 )
Completely automated telephone
survey (CATS) (p. 188 )
Internet-based questionnaire
(p. 189 )
Group self-administered survey
(p. 191 )
Drop-off survey (p. 191 )
Mail survey (p. 192 )
Nonresponse (p. 192 )
Self-selection bias (p. 192 )
Panel company (p. 194 )
Incidence rate (p. 198 )
Review Questions/Applications
7- 1. List the major advantages of survey research meth-
ods over qualitative methods. Can you think of any
drawbacks; if so, what are they?
7- 2. How and why has technology impacted data
collection from the recent past through the
present?
7- 3. What aspects of person-administered surveys make
them attractive to marketing researchers? What
aspects make them unattractive?
7- 4. What aspects of computer-assisted surveys make
them attractive to marketing researchers?
7- 5. What are the advantages of person-adminis-
tered over self-administered surveys, and vice
versa?
7- 6. What would be the motivation for a researcher to
consider a mixed-mode survey?
7- 7. Indicate the diff erences between (a) in-home surveys,
(b) mall-intercept surveys, and (c) in-offi ce surveys.
What do they share in common?
7- 8. Why were telephone surveys popular before wide-
spread Internet access?
7- 9. Indicate the pros and cons of self-administered
surveys.
7- 10. What advantages do online surveys have over various
types of self-administered surveys?
7- 11. What are the major disadvantages of a mail
survey?
7- 12. How does a drop-off survey diff er from a regular mail
survey?
7- 13. What is a panel company and why are such
companies dominating survey data collection
today?
7- 14. How does the incidence rate aff ect the choice of a
data collection mode?
7- 15. Is a telephone interview inappropriate for a sur-
vey that has as one of its objectives a com-
plete listing of all possible advertising media a
person was exposed to in the last week? Why or
why not?
7- 16. NAPA Auto Parts is a retail chain specializing in
stocking and selling both domestic and foreign
automobile parts. To learn about the company’s
customers, the marketing director sends instruc-
tions to all 2,000 store managers telling them that
whenever a customer makes a purchase of $150 or
more, they are to write down a description of the
customer who made that purchase. They are to do
this just for the second week in October, writing
each description on a separate sheet of paper. At the
end of the week, they are to send all sheets to the
marketing director. Comment on this data collec-
tion method.
7- 17. Recommend and justify the type of survey mode for
the following cases:
a. Super-Juice would like to test a fruit-based
smoothie and a dairy-based smoothie.
b. Super-Connection, a telecommunications com-
pany, requires information on the degree to which
such as incidence rate or special circumstances of the
survey. All should be considered, but one or more fac-
tors may be paramount because each data collection situ-
ation is unique. Ultimately, the researcher will select a
data collection mode with which he or she feels comfort-
able and one that will result in the desired quality and
quantity of information without exceeding time or budget
constraints.
M07_BURN3261_08_GE_C07.indd 200M07_BURN3261_08_GE_C07.indd 200 16/08/16 10:55 am16/08/16 10:55 am

REVIEW QUESTIONS/APPLICATIONS 201
its post-paid customers are satisfi ed with the ser-
vices provided.
c. Clean-Pro is considering a vacuum cleaner with
new mopping functions and wants to know peo-
ple’s reaction to it.
d. The Residents’ Committees (RCs) has received
numerous complaints about irresponsible security
guards and noisy neighbors and wants to know
how to resolve these problems.
7- 18. Nonresponse is a growing problem for marketing
researchers. The problem is more prevalent in mail
surveys, in which respondents are asked to fi ll out
a questionnaire and return it by mail. The reasons
for nonresponse could be that the respondents are
unavailable, are not willing to participate, or are
unable to answer the survey questions. However,
many organizations may still consider using
this survey mode because it is self-administered
and inexpensive. Suggest ways to increase the
response rate.
7- 19. Compu-Ask Corporation has developed a stand-
alone computerized interview system that can be
adapted to almost any type of survey. It can fit on
a handheld tablet computer, and the respondent
directly answers questions using a stylus once the
interviewer has turned on the tablet and started
up the program. Indicate the appropriateness of
this interviewing system in each of the following
cases:
a. A survey of plant managers concerning a new
type of hazardous waste disposal system
b. A survey of high school teachers to see if they are
interested in a company’s videos of educational
public broadcast television programs
c. A survey of consumers to determine their reac-
tions to a nonrefrigerated variety of yogurt
7- 20. Pet-Pro is a company that imports and markets pet
food feeders to customers in Malaysia. The food
feeder, which is called “Smart Feeder,” allows pet
owners to feed pre-determined quantities of food
at pre-set times to their pets. The system has built-
in webcam and Wi-Fi technology, allowing the pet
owners to watch their pets from anywhere and at any
time. It also has a voice recording system that allows
the pet owners to record their voice. The manager of
Pet-Pro would like to fi nd out pet lovers’ perceived
value of such a product and the likelihood of their
buying it. The manager of Pet-Pro wants to under-
stand the advantages and disadvantages of using the
following survey modes: (a) in-home interview, (b)
mall intercept, (c) online survey, (d) drop-off survey,
and (e) CATI survey.
CASE 7. 1
Machu Picchu National Park Survey
In Peru, there are many ruins of the temples and palaces
of the Inca Indians, who attained what some historians
consider to be the highest accomplishments in the Ameri-
cas for agriculture, engineering, monument building, and
craftsmanship. Unfortunately, the Incas were no match
for the Spanish explorers, who, with fi rearms and horses,
defeated the entire Incan Empire in a matter of a few years
in the 1560s.
In 1913, Hiram Bingham discovered the Incan com-
plex called Machu Picchu, which was not plundered
by the Spanish Conquistadors. It is the best-preserved
Incan ruin of its type, and it is on the World Heritage List
of UNESCO ( http://whc.unesco.org/en/list/274 ). Located
at 8,000 feet above sea level on a mountain at the border
of the Andes Mountains and the Peruvian jungle, Machu
Picchu is still very diffi cult to access, as it requires a three-
hour mountain train ride to reach from Cusco, Peru, the
closest city. Normally, tourists board the train very early in
the morning in Cusco and arrive at the Machu Picchu vil-
lage train station around 10 a.m. They then board buses that
take 30 minutes to climb up the 6-mile switchback dirt road
to the entrance of Machu Picchu. With guides or on their
own, tourists wander the expansive Machu Picchu ruins,
have lunch at the Machu Picchu lodge located at the top of
the mountain, and hurry to catch the bus down the moun-
tain so they will not miss the one train that leaves around
3 p.m. to return to Cusco. Some tourists stay overnight at
the Machu Picchu Lodge or in one of the six hotels located
at the base in Machu Picchu village. At peak season, ap-
proximately 1,000 tourists visit Machu Picchu daily.
Machu Picchu is a Peruvian national park, and since it
is one of the top tourist attractions in the world, the national
park department wishes to conduct a survey to research the
satisfaction of tourists with the park’s many features and
with their total experience on their visit to Peru. With the
help of a marketing researcher who specializes in tourism
research, the park department offi cials have created a self-
administered questionnaire for its survey. Now they must
choose from several alternatives for gathering the data.
Using concepts in this chapter and your knowledge of
M07_BURN3261_08_GE_C07.indd 201M07_BURN3261_08_GE_C07.indd 201 05/09/16 1:07 PM05/09/16 1:07 PM

202 CHAPTER 7 • EVALUATING SURVEY DATA COLLECTION METHODS
Joe Spivey is president of Advantage Research, Inc. The
fi rm specializes in customized research for clients in a
variety of industries by conducting computer-assisted
mall interviews in fi ve of the largest malls in the United
States. It operates a computer-assisted telephone inter-
view (CATI) facility with 100 calling stations. Housed
in this facility is an interactive voice response (IVR)
capability. Its Advantage Online division specializes
in online surveys and has recruited over 200,000 panel
members residing in North America. There is a database
with over 250 bits of information (demographic, life-
style, possessions, etc.) gathered and stored for every
Advantage Online panel member. If necessary, Joe will
subcontract the services of other research fi rms in order
to provide his client with the most appropriate data
collection method. In a daily meeting with his project
directors, Joe discusses each client’s special situation.
Here is a summary of the major aspects of today’s three
client discussions.
Client 1: A small tools manufacturer has created a new
device for sharpening high-precision drill bits. High-preci-
sion drill bits are used to drill near-perfect holes in devices
such as engine blocks. Such applications have demand-
ing specifi cations, and drill bits may be used only a few
times before being discarded. However, the new sharpen-
ing device takes the bits back to original specifi cations,
and the bits can be resharpened and used in as many as a
dozen applications. After testing the device and conducting
several focus groups in order to get modifi cation sugges-
tions, the client is now ready for more information on sales
presentation methods. The project director and the client
have developed several diff erent sales presentation formats.
The client wishes to have some market evaluation of these
presentations before launching a nationwide training pro-
gram of the company’s 125-person sales force.
Client 2: A regional bakery markets several brands of
cookies and crackers to supermarkets throughout Califor-
nia, Nevada, Arizona, and New Mexico. The product cat-
egory is very competitive and competitors use a great deal
of newspaper and television advertising, with the most pro-
gressive competitors moving into social media advertising.
The bakery’s vice president of marketing desires more ana-
lytics in making the promotional decisions for the fi rm. She
has lamented that while she spends several million dollars
a year on promotions in the four states, she has no measure
with which to evaluate the eff ectiveness of the expendi-
tures. Advantage Research’s project director has recom-
mended a study that will establish baseline measures of
top-of-mind brand awareness (called TOMA, this measure
of awareness is achieved by asking respondents to name
the fi rst three brands that come to mind when thinking of a
product or service category, such as “cookies”), attitudes,
and preferences.
Client 3: An inventor has developed a new device that sani-
tizes a toothbrush each time the brush is used and replaced
in the device. The device uses steam to sanitize the brush,
and lab tests have shown the mechanism to be very eff ec-
tive at killing virtually all germs and viruses. There is an
app that communicates with the toothbrush sanitizer, track-
ing its use and eff ectiveness, and notifi es the user when
to replace the cleaning fi lters and fl uids. The inventor has
approached a large manufacturer that is interested in buy-
ing the rights to the device. But the manufacturer wants to
know if people have any concerns with toothbrush sanitiza-
tion and whether or not they would be willing to purchase
CASE 7. 2
Advantage Research, Inc.
data collection methods and issues, answer the following
questions.
1. If the questionnaire is an online survey, would it be suc-
cessful? Why or why not?
2. If the park department uses a mail survey, what issues
must be resolved? Would it be successful? Why or
why not?
3. If the seven hotels in the Machu Picchu area each
desired to know how its customers felt about the
hotel’s services, prices, and accommodations, how
might both the park department and the hotels work
together on data collection to eff ect a mutually benefi -
cial survey?
4. Using the knowledge that the Peruvian national park
department has meager resources for marketing
research, suggest a diff erent method (not online, not
mail, and not partnering with the local hotels) with the
potential of eff ecting a high response rate and high-
quality responses.
M07_BURN3261_08_GE_C07.indd 202M07_BURN3261_08_GE_C07.indd 202 16/08/16 10:55 am16/08/16 10:55 am

REVIEW QUESTIONS/APPLICATIONS 203
a countertop, plug-in device with app to keep their tooth-
brush sterile. The project director states that the manufac-
turer is interested in a survey that covers the United States
and Canada using a sample size of 3,000 representative
people. The inventor is anxious to supply this information
very quickly before the manufacturer loses interest in the
idea.
1. For each client’s survey, take each of the nine data col-
lection methods identifi ed in this chapter and specify
what you think are the strongest and weakest aspects of
using that data collection method for the client’s survey
situation.
2. Based on your analysis from the preceding ques-
tion and taking into consideration any other relevant
aspects, decide which is the best data collection method
for each client’s survey. Defend your choice in each
case.
3. Assume that you are the project director recommend-
ing the data collection method you have chosen for
each client’s survey in the preceding question, but
during the next daily meeting, Joe and the other proj-
ect directors vote your recommendations down. What
is the next best data collection method in your mind
for each client’s survey? Defend your choice in each
case.
M07_BURN3261_08_GE_C07.indd 203M07_BURN3261_08_GE_C07.indd 203 16/08/16 10:55 am16/08/16 10:55 am

▶
LEARNING OBJECTIVES In this chapter you will learn:
8- 1 What the basic concepts of measurement are
8- 2 About the two types of measures used in marketing research
8- 3 Three interval scales that are commonly used in marketing research
8- 4 Reliability and validity of measurements
8- 5 What is involved with the design of a questionnaire
8- 6 How to develop questions including dos and don’ts
8- 7 The recommended organization of questions and sections of a questionnaire
8- 8 How computer-assisted questionnaire design simplifi es and expedites this process
8- 9 What coding and pretesting entail
“WHERE WE ARE”
1 Establish the need for marketing
research.
2 Defi ne the problem.
3 Establish research objectives.
4 Determine research design.
5 Identify information types and sources.
6 Determine methods of accessing data.
7 Design data collection forms.
8 Determine the sample plan and size.
9 Collect data.
10 Analyze data.
11 Prepare and present the fi nal
research report.
MARC USA: Using Behavioral Economics to Understand Consumer Choice
We’ve all been there. You think you’re going
to do one thing and end up doing something
entirely different. Maybe you spend more than
you planned or buy something you said you
never would. Worst case, you make a deci-
sion that is not in your best interest. It’s as if
your decision-making ability has a mind of its
own. The fact is up to 95% of decision making
starts in the emotional, mostly unconscious,
parts of the brain. It’s where our real reasons
for the choices we make lie. This knowledge,
along with the desire to understand and infl u-
ence choice, has fueled recent research advances in behavioral econom-
ics. And marketers, whose role is to understand and infl uence behaviors,
are paying attention. At MARC USA, we’re leveraging brain science and
behavioral economics to help us better understand how decisions are
made so we can create communications that change behavior—whether
it’s about a purchase choice or an important health issue.
Our tool box includes dozens of foundational behavioral economic
principles, with labels like Framing, Loss Aversion, Default Bias, Relativ-
ity, Herding, Power of Free, Fear of Regret, Anchoring, Chunking, Para-
dox of Choice, Social Proof, and more. As an example, let’s see how
Social Proof comes into play in changing what people do at the onset
of heart attack symptoms. Social Proof assumes that something is good
(or bad) based on the behavior of family, friends, and even strangers,
and people will often copy another’s behavior and avoid behaviors that
others avoid. We worked with the American Heart Association (AHA) to
change behavior of calling 9-1-1 at the fi rst sign of a heart attack. For
8 Understanding Measurement, Developing Questions, and Designing the Questionnaire
Jim McConnell, group
director, Consumer
Insights
M08_BURN3261_08_GE_C08.indd 204M08_BURN3261_08_GE_C08.indd 204 29/08/16 1:12 pm29/08/16 1:12 pm

205
years, the AHA approach was to remind people of heart attack symptoms, often by a victim or
medical professional. If people simply knew they had life-threatening symptoms, they would
call, right? Wrong. The percentage of people calling 9-1-1 didn’t change. People wait and
wait. When the symptoms can’t be overlooked any longer, more often than not, they drive
themselves or their loved one to the hospital. So why don’t people make the right decision,
even when they know they are experiencing the very symptoms that could kill them? Our
research showed that people often don’t call 9-1-1 because they are embarrassed and don’t
want to make a fuss, especially if it might be a false alarm. To many, the fear of doing some-
thing out of the norm was greater than their fear of dying—Social Proof in action!
A new intervention was clearly needed. With this insight, MARC USA designed a commu-
nications campaign to create a new social norm—making it socially unacceptable not to call
9-1-1. The idea came to life in a TV spot plus print and outdoor executions in which a violent
heart—complete with arms and legs—attacks a man sitting on a park bench as bystanders
watch and do nothing. We made it appear ridiculous to watch a heart attack and not act.
We asked, “Why wouldn’t you call 9-1-1 at the fi rst sign of a heart attack?” The unexpected,
edgy ads produced staggering results. Within three months of launch, the number of heart
attack patients or those around them calling 9-1-1 in the test market rose from 58% to 76%
and continued to rise, reaching 80% six months later. Yes, a marketing campaign can produce
behavior change—and tapping into behavioral economics to understand and confront the
real reasons behind behaviors was the catalyst.
Source: Text and photos courtesy of Jim McConnell and MARC USA.
8- 1 Basic Measurement Concepts As this chapter’s opening remarks by Mr. McConnell reveal, marketing research relies
heavily on measurement , which is defined as determining a description or the amount
of some property of an object that is of interest to the researcher. For instance, a mar-
keting manager may want to determine what brand a person typically purchases or how
much of the product he or she uses in a certain time period. This information, once com-
piled, can help answer specific research objectives such as determining product opinions
and usage.
But what are we really measuring? We are measuring properties—sometimes called
characteristics, attributes, or qualities—of objects. Objects include consumers, brands, stores,
advertisements, or whatever construct is of interest to the researcher working with a particular
manager. Properties are the specifi c features or characteristics of an object that can be used
to distinguish it from another object. For example, assume the object we want to research is
a consumer. As depicted in Figure 8. 1 , the properties of interest to a manager who is trying
to defi ne who buys a specifi c product are a combination of demographics, such as age and
gender, and buyer behavior, which includes such things as the buyer’s preferred brand and
perceptions of various brands. Once the object’s designation on a property has been deter-
mined, we say that the object has been measured on that property. Measurement underlies
Visit MARC USA at
marcusa.com
Measurement is determining a description or amount of some property of an object that is of interest to the researcher.
M08_BURN3261_08_GE_C08.indd 205M08_BURN3261_08_GE_C08.indd 205 29/08/16 1:12 pm29/08/16 1:12 pm

206 CHAPTER 8 • UNDERSTANDING MEASUREMENT, DEVELOPING QUESTIONS, AND DESIGNING THE QUESTIONNAIRE
marketing research to a great extent because researchers are keenly interested in describing
marketing phenomena. Furthermore, researchers are often given the task of fi nding relevant
diff erences in the profi les of various customer types, and measurement is a necessary fi rst step
in this task.
Measurement is a simple process as long as we are measuring objective properties ,
which are physically verifi able characteristics such as age, income, number of bottles
purchased, store last visited, and so on. They are observable and tangible. Typically,
objective properties such as gender are preset as to appropriate response options, such as
“male” or “female.” However, marketing researchers often desire to measure subjective properties , which cannot be directly observed because they are mental constructs such as
a person’s attitude or intentions. Subjective properties are unobservable and intangible.
In this case, the marketing researcher must ask a respondent to translate his or her feel-
ings or opinions onto a measurement continuum, which is not an easy task. To do this,
the marketing researcher must adapt or develop rating scale formats that are very clear
and used identically by respondents. This process is known as scale development , which
is designing questions and response formats to measure the subjective properties of an
object. 1 Our exploration of this process begins with introducing some basic measurement
concepts.
8- 2 Types of Measures Marketing researchers describe measures in several diff erent ways. In this section we describe
the three measures used by SPSS: nominal, ordinal, and scale. This approach will facilitate
your future use of SPSS because it will link your questionnaire design knowledge with the
concepts used in SPSS.
NOMINAL MEASURES Nominal measures are defi ned as those that use only labels; that is, they possess only
the characteristic of description. Examples include designations as to race, religion, type
of dwelling, gender, brand last purchased, and buyer/nonbuyer. Answers involve yes–no,
agree–disagree, or any other instance in which the descriptors cannot be diff erentiated
except qualitatively. If you describe respondents in a survey according to their occupation—
fi nancial analyst, fi refi ghter, computer programmer—you have used a nominal scale. Note
that these examples of a nominal scale only categorize the consumers. They do not provide
other information such as “greater than,” “twice as large,” and so forth. Examples of nomi-
nally scaled questions are found in Table 8. 1 A.
35 years
Female
Pepsi
“Fair”
Property:Age
Property:Gender
Property:Preferred Brand
Property:Opinion
How old are you?___ Years
What is your gender?___ Male ___ Female
Which is your favorite brand?__ Coke __ Pepsi __ Dr Pepper
How do you rate our brand?__ Poor __ Fair __ Good __ Excellent
Person,Product,Brand,Company,Etc.
Measurement ResultMeasurement ProcessPropertiesThe Object
FIGURE 8. 1 How Measurement Works in Marketing Research
Objective properties are observable and tangible. Subjective properties are unobservable and intangible, and they must be translated onto a rating scale through the process of scale development.
Nominal scales label objects.
M08_BURN3261_08_GE_C08.indd 206M08_BURN3261_08_GE_C08.indd 206 29/08/16 1:12 pm29/08/16 1:12 pm

8-2 TYPES OF MEASURES 207
ORDINAL MEASURES Ordinal measures permit the researcher to rank order the
respondents or their responses. For instance, if the respondent
is asked to indicate his or her fi rst, second, third, and fourth
choices of brands, the results are ordinally scaled. Similarly,
if one respondent checks the category “Commute regularly”
on a travel-frequency scale and another checks the category
“Commute infrequently,” the result is an ordinal measurement
because we know that the fi rst respondent commutes more
than the second one, but not by how much. Ordinal scales
indicate only relative size diff erences among objects: greater
than, less than, or equal to. The natural order of the objects
(fi rst, second, etc.) is known, but the exact diff erences between
objects are unknown. See some examples of ordinal measures
in Table 8. 1 B.
SCALE MEASURES Scale measures are those in which the distance between each
level is known. There are two types of scale measures. Ratio scale measures are ones in which a true zero origin exists—such as an actual number of
purchases in a certain time period, dollars spent, miles traveled, number of children in the
household, or years of college education. As you can see, ratio scales are easy for respondents
to understand as they are in dollars, miles, years, or some other familiar denomination. The
ratio characteristic allows us to construct ratios when comparing results of the measurement.
One person may spend twice as much or travel one-third as far as another. Refer to Table 8. 1 D
for examples. Interval scale measures are rating scales for subjective properties where, for adjacent
levels, the distance is normally defi ned as one scale unit. For example, a coff ee brand rated
3 in taste is one unit away from one rated 4. Implicitly, equal intervals exist between the
adjacent level descriptors. That is, if you are asked to evaluate a store’s salespeople by
selecting a single designation from a list of “extremely friendly,” “very friendly,” “some-
what friendly,” “somewhat unfriendly,” “very unfriendly,” or “extremely unfriendly,” the
researcher assumes that each designation is one unit away from the preceding or succeeding
one. In these cases, we say that the scale is an assumed interval . Interval scales, such as
those in Table 8. 1 C, may be intuitive for respondents, but they always measure subjective
properties, and as you will soon learn, they require careful judgment on the part of the mar-
keting researcher when used. Because most subjective, or psychological, properties exist on a continuum ranging from
one extreme to another in the mind of the respondent, it is common practice to use interval
scale questions to measure them. Sometimes numbers are used to indicate a single unit of
distance between each position on the scale. Usually, but not always, the scale ranges from an
extreme negative through a neutral to an extreme positive designation. As you will soon learn,
the neutral point is not considered zero, or an origin; instead, it is considered a point along
the continuum. In the examples in Table 8. 2 , you will see that all of them span a continuum
ranging from extremely negative to extremely positive, usually with a “no opinion” position
in the middle of the scale. 2 As shown in Tables 8. 1 C and 8. 2 , these descriptors are evenly
spaced on a questionnaire; as such, the labels connote a continuum and the check lines are
equal distances apart. By wording or spacing the response options on a scale so they appear
to have equal intervals between them, the researcher achieves a higher level of measurement
than on ordinal and nominal scales, thereby allowing the researcher to see fi ner distinctions
among respondents’ properties.
Ordinal scales indicate only relative size differences between objects.
Ordinal measures rank objects, but their exact diff erences
are unknown.
Ratio scales have a true zero point.
Interval scales are used to measure unobservable constructs.
Learn about basic scales used in marketing research
by going to www.youtube.com and search for “Variable measurement scales.”
© S
teph
en F
inn/
Shu
tter
stoc
k
M08_BURN3261_08_GE_C08.indd 207M08_BURN3261_08_GE_C08.indd 207 29/08/16 1:12 pm29/08/16 1:12 pm

208 CHAPTER 8 • UNDERSTANDING MEASUREMENT, DEVELOPING QUESTIONS, AND DESIGNING THE QUESTIONNAIRE
TABLE 8. 1 Examples of the Use of Different Types of Measures
A. Nominal Measure Questions 1. Please indicate your gender.
_______ Male _____ Female
2. Are you planning on purchasing a new automobile in the next six months?
_____ Yes _____ No _____ Unsure
3. Do you recall seeing a Delta Airlines advertisement for “carefree vacations” in the past week?
_____ Yes _____ No
B. Ordinal Measure Questions 1. Please rank each brand in terms of your preference. Place a “1” by your first choice, a “2” by your second choice, and so on.
_____ 3 Musketeers
_____ Baby Ruth
_____ Milky Way
2. In your opinion, the prices at Walmart are
_____ Higher than Sears
_____ About the same as Sears
_____ Lower than Sears
C. Interval Scale Measure Questions 1. Please rate each of the following television shows in terms of your overall enjoyment.
Rating (Circle One)
Show Not Enjoyable Very Enjoyable
America’s Got Talent 1 2 3 4 5 6 7 8 9 10
American Idol 1 2 3 4 5 6 7 8 9 10
Dancing with the Stars 1 2 3 4 5 6 7 8 9 10
2. Indicate your degree of agreement with the following statements by circling the appropriate number.
Strongly Disagree
Strongly Agree
a. I always look for bargains. 1 2 3 4 5
b. I enjoy being outdoors. 1 2 3 4 5
c. I love to cook. 1 2 3 4 5
3. Please rate the Chevrolet Camaro by checking the line that best corresponds to your evaluation of each item listed.
Slow pickup _____ _____ _____ _____ _____ _____ _____ Fast pickup
Good design _____ _____ _____ _____ _____ _____ _____ Bad design
Low price _____ _____ _____ _____ _____ _____ _____ High price
D. Ratio Scale Measure Questions 1. Please indicate your age.
_____Years
2. Approximately how many times in the last month have you purchased something over $10 in price at a 7-Eleven store?
0 1 2 3 4 5 More (specify:_____)
3. How much do you think a typical purchaser of a $250,000 term life insurance policy pays per year for that policy?
$_________
M08_BURN3261_08_GE_C08.indd 208M08_BURN3261_08_GE_C08.indd 208 29/08/16 1:12 pm29/08/16 1:12 pm

8-3 INTERVAL SCALES COMMONLY USED IN MARKETING RESEARCH 209
8- 3 Interval Scales Commonly Used in Marketing Research
It is not good practice to invent a novel scale format with
every questionnaire. Instead, marketing researchers often
fall back on standard types used by the industry. By now
you know that marketing researchers often measure sub-
jective properties of consumers. There are various terms
and labels given to these constructs, including attitudes,
opinions, evaluations, beliefs, impressions, perceptions,
feelings, and intentions. Because these constructs are
subjective, the marketing researcher must develop some
means of allowing respondents to express the direc-
tion and intensity of their impressions in a convenient
and understandable manner. To do this, the marketing
researcher uses interval scales. In this section, we will
describe the basic interval scale formats that are most
common in marketing research practice. You will fi nd these scale formats time and again on
questionnaires; hence, we refer to them as workhorse scales because they do the bulk of the
measurement work in marketing research.
THE LIKERT SCALE An interval scale commonly used by marketing researchers 3 is the Likert scale , in which
respondents are asked to indicate their degree of agreement or disagreement on a symmetric
agree–disagree scale for each of a series of statements. 4 That is, the scale captures the inten-
sity of their feelings toward the statement’s claim or assertion because respondents are asked
how much they agree or disagree with the statement. With this scale, it is best to use “fl at” or
plain statements and let the respondent indicate the intensity of his or her feelings by using
the agree–disagree response continuum position. Table 8. 3 presents an example of its use in
an online survey.
The Likert type of response format, borrowed from a formal scale development
approach introduced by Rensis Likert, has been extensively modifi ed and adapted by mar-
keting researchers; 5 so much, in fact, that its defi nition varies from researcher to researcher.
Some assume that any intensity scale using descriptors such as “strongly,” “somewhat,” and
“slightly” is a Likert variation. Others use the term only for questions with agree–disagree
Marketing researchers use standard scales rather than inventing new ones for each research project.
TABLE 8. 2 The Intensity Continuum Underlying Scaled-Response Question Forms
Extremely Negative Neutral Extremely Positive
Strongly
Disagree
Disagree Somewhat
Disagree
Neither Agree
nor Disagree
Somewhat
Agree
Agree Strongly Agree
1 2 3 4 5 6 7
Extremely
Dissatisfi ed
Very
Dissatisfi ed
Somewhat
Dissatisfi ed
No Opinion Somewhat
Satisfi ed
Very
Satisfi ed
Extremely
Satisfi ed
1 2 3 4 5 6 7
Extremely
Unfavorable
Very
Unfavorable
Somewhat
Unfavorable
No Opinion Somewhat
Favorable
Very
Favorable
Extremely
Favorable
1 2 3 4 5 6 7
Marketing researchers often rely on the standard measures known
as workhorse scales .
The Likert scale format measures intensity of agreement or disagreement.
© B
ecky
Sw
ora/
Shu
tter
stoc
k
M08_BURN3261_08_GE_C08.indd 209M08_BURN3261_08_GE_C08.indd 209 29/08/16 1:12 pm29/08/16 1:12 pm

210 CHAPTER 8 • UNDERSTANDING MEASUREMENT, DEVELOPING QUESTIONS, AND DESIGNING THE QUESTIONNAIRE
response options. We tend to agree with the second opinion and prefer to refer to any scaled
measurement other than an agree–disagree dimension as a “sensitivity” or “intensity” scale.
But this convention is only our preference, and you should be aware that diff erent researchers
embrace other designations. A special application of the Likert question form called the lifestyle inventory takes
into account the values and personality traits of people as refl ected in their unique activities,
interests, and opinions (AIOs) toward their work, leisure time, and purchases. Examples of
lifestyle statements are “I shop a lot for specials,” “I prefer to pay for purchases with my
debit card,” or “My children are an important part of my life.” Lifestyle questions measure
consumers’ unique ways of living. These questions can be used to distinguish among types
of purchasers such as heavy versus light users of a product, store patrons versus nonpatrons,
or other customer types. They can assess the degree to which a person is, for example, price-
conscious, fashion-conscious, an opinion giver, a sports enthusiast, child oriented, home cen-
tered, or fi nancially optimistic. The technique was originated by advertising strategists who
wanted to obtain descriptions of groups of consumers as a means of establishing more eff ec-
tive advertising. The underlying belief is that knowledge of consumers’ lifestyles, as opposed
to just demographics, off ers direction for marketing decisions. Many companies use psycho-
graphics as a market targeting tool. 6
The Likert 5-point scale is fl exible when it comes to measuring constructs or concepts. It
is also amenable to sophisticated statistical analysis that has the potential to reveal important
relationships or associations among constructs.
THE SEMANTIC DIFFERENTIAL SCALE A specialized interval scale format that has sprung directly from the problem of translating a
person’s qualitative judgments into metric estimates is the semantic diff erential scale . Like
the Likert scale, this one has been borrowed from another area of research, namely, semantics.
The semantic diff erential scale contains a series of bipolar adjectives for the various properties
of the object under study, and respondents indicate their impressions of each property by indi-
cating locations along its continuum. The focus of the semantic diff erential is on the measure-
ment of the meaning of an object, concept, person, or experience. 7 Because many marketing
stimuli have meanings, mental associations, or connotations, this type of synthetic scale works
well when the marketing researcher is attempting to determine brand, store, or other images. 8
The construction of a semantic diff erential scale begins with the determination of
a concept or object to be rated, usually a brand or company. The researcher then selects
bipolar pairs of words or phrases that could be used to describe the object’s salient properties.
A lifestyle inventory measures a person’s activities, interests, and opinions with a Likert scale.
TABLE 8. 3 Example of a Likert Scale
Indicate the degree to which you agree or disagree with each of the following statements.
Statement Strongly Agree Agree Neutral Disagree
Strongly Disagree
Levi’s 501 jeans are
good looking.
Levi’s 501 jeans are
reasonably priced.
Your next pair of jeans will
be Levi’s 501 jeans.
Levi’s 501 jeans are easy to
identify on someone.
Levi’s 501 jeans make you
feel good.
To see a “cute” presenta-tion on the Likert scale,
launch www.youtube.com , and search for “Using the Likert Scale to evaluate a kid’s Halloween party.”
The semantic differential scale is a good way to measure a brand, company, or store image.
M08_BURN3261_08_GE_C08.indd 210M08_BURN3261_08_GE_C08.indd 210 29/08/16 1:12 pm29/08/16 1:12 pm

8-3 INTERVAL SCALES COMMONLY USED IN MARKETING RESEARCH 211
Depending on the object, some examples might be “friendly–unfriendly,” “hot–cold,” “convenient–
inconvenient,” “high quality–low quality,” and “dependable–undependable.” The opposites
are positioned at the endpoints of a continuum of intensity, and it is customary to use fi ve or
seven separators between each point. The respondent then indicates his or her evaluation of
the performance of the object, say, a brand, by checking the appropriate line. The closer the
respondent checks to an endpoint on a line, the more intense is his or her evaluation of the
object being measured. Table 8. 4 shows a semantic diff erential scale for a survey for Chipotle Mexican Grill. The
respondents also rated Jose’s Macho Taco Restaurant on the same survey. You can see that
each respondent has been instructed to indicate his or her impression of various restaurants
such as Chipotle by checking the appropriate circle between the several bipolar adjective
phrases. As you look at the phrases, you should note that they have been randomly fl ipped
to avoid having all of the “good” ones on one side. This fl ipping procedure is used to avoid
the halo eff ect , 9 which is a general feeling about a store or brand that can bias a respondent’s
impressions on its specifi c properties. 10 For instance, let’s say respondents who are big fans
of Chipotle complete a survey with all the positive items on the right-hand side and all the
negative on the left-hand side; they might check the answers on the right-hand side without
reading each characteristic carefully. But it is entirely possible that some specifi c aspects of
the Chipotle dining experience might not be as good as others. Perhaps the restaurant is not
located in a convenient place, or the menu is not as broad as some might like. Randomly fl ip-
ping favorable and negative ends of the descriptors in a semantic diff erential scale minimizes
the halo eff ect. 11 Also, there is some evidence that when respondents are ambivalent about the
survey topic, it is best to use a balanced set of negatively and positively worded questions. 12 One of the most appealing aspects of the semantic diff erential scale is the ability of the
researcher to compute averages and then to plot a “profi le” of the brand or company image. Each
check line is assigned a number for coding. Usually, the numbers 1, 2, 3, and so on, beginning
from the left side, are customary. Then, because a metric scale is used, an average may be com-
puted for each bipolar pair. The averages are plotted as you see them, and marketing researchers
have a nice graphical communication vehicle with which to report the fi ndings to their clients.
Active Learning
Construct a College Student Lifestyle Inventory
As a college student yourself, you can easily relate to the dimensions of college student lifestyle. In this Active Learning exercise, take each of the following college student activities and write the Likert scale statement that could appear on a college student lifestyle inventory questionnaire. Be sure to model your statements as recommended in our descriptions of the Likert scale workhorse scale format.
College Lifestyle Dimension
Write Your Statement
BelowStrongly Disagree Disagree
Neither Disagree nor
Agree AgreeStrongly Agree
Studying 1 2 3 4 5
Going out 1 2 3 4 5
Working 1 2 3 4 5
Exercising 1 2 3 4 5
Shopping 1 2 3 4 5
Dating 1 2 3 4 5
Spending money 1 2 3 4 5
When using a semantic differential scale, you should control for the halo effect.
With a semantic differential scale, a researcher can plot the average evaluation on each set of bipolar descriptors.
M08_BURN3261_08_GE_C08.indd 211M08_BURN3261_08_GE_C08.indd 211 29/08/16 1:12 pm29/08/16 1:12 pm
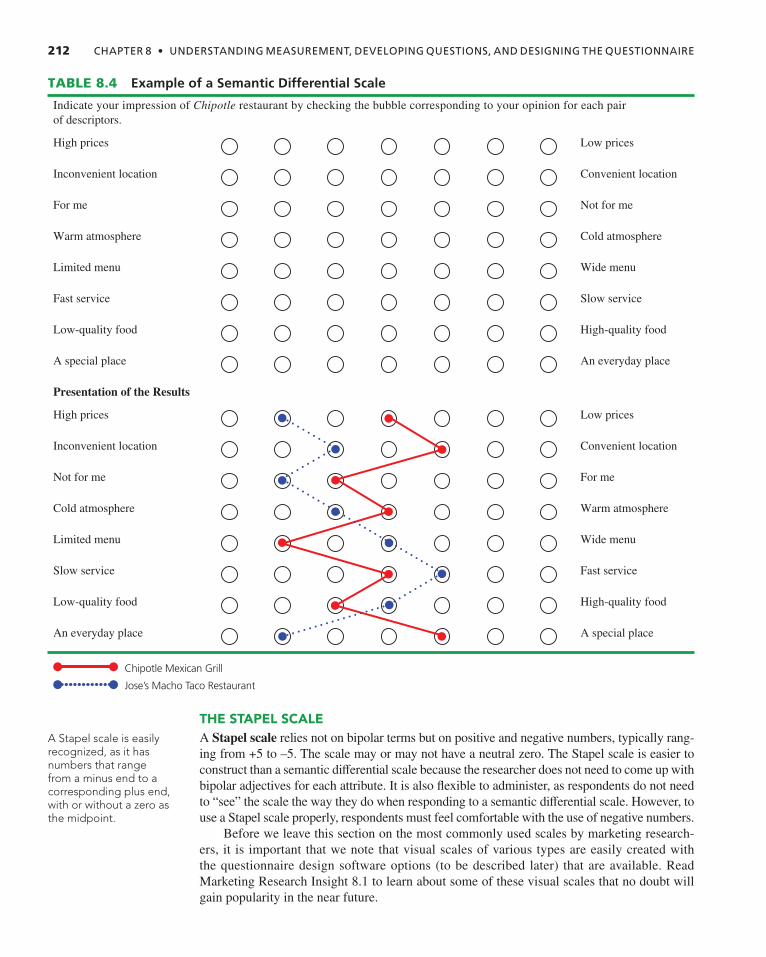
212 CHAPTER 8 • UNDERSTANDING MEASUREMENT, DEVELOPING QUESTIONS, AND DESIGNING THE QUESTIONNAIRE
THE STAPEL SCALE A Stapel scale relies not on bipolar terms but on positive and negative numbers, typically rang-
ing from +5 to –5. The scale may or may not have a neutral zero. The Stapel scale is easier to
construct than a semantic diff erential scale because the researcher does not need to come up with
bipolar adjectives for each attribute. It is also fl exible to administer, as respondents do not need
to “see” the scale the way they do when responding to a semantic diff erential scale. However, to
use a Stapel scale properly, respondents must feel comfortable with the use of negative numbers.
Before we leave this section on the most commonly used scales by marketing research-
ers, it is important that we note that visual scales of various types are easily created with
the questionnaire design software options (to be described later) that are available. Read
Marketing Research Insight 8. 1 to learn about some of these visual scales that no doubt will
gain popularity in the near future.
TABLE 8. 4 Example of a Semantic Differential Scale
Indicate your impression of Chipotle restaurant by checking the bubble corresponding to your opinion for each pair
of descriptors.
High prices Low prices
Inconvenient location Convenient location
For me Not for me
Warm atmosphere Cold atmosphere
Limited menu Wide menu
Fast service Slow service
Low-quality food High-quality food
A special place An everyday place
Presentation of the Results
High prices Low prices
Inconvenient location Convenient location
Not for me For me
Cold atmosphere Warm atmosphere
Limited menu Wide menu
Slow service Fast service
Low-quality food High-quality food
An everyday place A special place
Chipotle Mexican Grill
Jose’s Macho Taco Restaurant
A Stapel scale is easily recognized, as it has numbers that range from a minus end to a corresponding plus end, with or without a zero as the midpoint.
●
●
●
●
●
●
●
●
●
●
●
●
●
●
●
●
M08_BURN3261_08_GE_C08.indd 212M08_BURN3261_08_GE_C08.indd 212 29/08/16 1:12 pm29/08/16 1:12 pm

8-3 INTERVAL SCALES COMMONLY USED IN MARKETING RESEARCH 213
TWO ISSUES WITH INTERVAL SCALES USED IN MARKETING RESEARCH Our three workhorse scales—Likert, semantic diff erential, and Stapel—simply introduce
you to the basic formats possible for interval scales. Many varieties exist and are easily
constructed with questionnaire design software that will be described soon. But, regard-
less of form or format, we must describe two issues in the use of interval scales. The fi rst
issue is whether to include the middle, neutral response option. Our Likert scale, lifestyle,
and semantic diff erential examples all have a neutral point, but some researchers prefer
to leave out the neutral option on their scales. Valid arguments exist for both options. 13
Those arguing for the inclusion of a neutral option believe that some respondents do not
have opinions formed on that item, and they must be given the opportunity to indicate
their ambivalence. Proponents of not including a neutral position, however, believe that
respondents may use the neutral option as a dodge or a method of hiding their opinions. 14
Eliminating the neutral position forces these respondents to indicate their opinions or
feelings.
The second issue concerns whether to use a symmetric or a nonsymmetric scale.
A symmetric interval scale is “balanced,” as it has equal amounts of positive and negative
positions, and typically it has “no opinion” or “neutral” separating the negative and positive
Visual Scales Online questionnaire design companies have evolved question response formats from check boxes and radio buttons into interactive graphical scales with many variations. With user-friendly point-and-click features, questionnaire designers can choose from a large number of these scales that are engaging and entertaining for respondents to use while taking surveys. Here are some examples of the basic types.
Sliders allow the respondent to drag an indicator on a bar or to drag the end of a bar to indicate the amount of intensity.
64
50
Stars let respondents indicate a star rating including half-stars if desired.
3.5
Graphic sliders incorporate clip art of various objects and sliders.
8
As can be imagined, there are many options as to lay-out, orientation, images, and so on. It is too early to assess the degree to which these visual scales offer more advantages than traditional static scale formats with respect to data quality, but questionnaire developers now have some tools to counter the monotony and boredom often suffered by respondents as they see page after page of matrix-type scales. Proponents of visual scales believe that they are more engrossing, meaning that respondents take more time and effort to use them, and make taking surveys more enjoyable.
MARKETING RESEARCH INSIGHT 8. 1 Digital Marketing Research
Use a neutral response option when you think respondents have a valid “no opinion” response.
M08_BURN3261_08_GE_C08.indd 213M08_BURN3261_08_GE_C08.indd 213 29/08/16 1:12 pm29/08/16 1:12 pm

214 CHAPTER 8 • UNDERSTANDING MEASUREMENT, DEVELOPING QUESTIONS, AND DESIGNING THE QUESTIONNAIRE
sides, as is the case in our examples in Table 8. 2 . But not all constructs have counter opposing
ends. That is, a nonsymmetric interval scale , which has mainly degrees of positive positions,
would be more appropriate because most people do not think in degrees of negative response. Sometimes, common sense causes the researcher to conclude that only the positive side
is appropriate. 15 For example, suppose you were asked to indicate how important having
jail bail bond protection was for you as a feature when you purchased automobile insurance.
It is doubtful that you would diff erentiate between “extremely unimportant,” “very unim-
portant,” or “somewhat unimportant,” but you could indicate how important it was to you
with the response options of “not important” to “somewhat important,” “very important,”
and “extremely important.” In fact, for many constructs, symmetric scales are awkward or
nonintuitive and should not be used. 16 Consequently, some scales contain only the positive
side, because very few respondents would make use of the negative side. When in doubt,
a researcher can pretest both complete and one-sided versions to see whether respondents
will use the negative side. As a general rule, it is best to pretest a sensitivity scale to make
sure it is being used in its entirety. Some individuals, such as Hispanics, have tendencies to
use only one end of a scale, 17 and pretests should be used to fi nd a scale that will be used
appropriately.
THE SCALE SHOULD FIT THE CONSTRUCT It has been our experience that when you study each workhorse scale and the other scaled-
response question formats described in this chapter, each one makes sense. However, when
faced with the actual decision as to what scale to recommend in a given situation, it is diffi cult
for neophyte marketing researchers to sort these scales out. As we indicated in Chapter 3 , the
mind-set of marketing researchers is geared toward the actual survey steps, and questionnaire
design is a vital step that they must think about when formulating marketing research propos-
als. In those situations, researchers rely on “constructs,” or standard marketing concepts, and
develop a mental vision of how each construct will be measured. This mental vision , which
we defi ned in Chapter 3 , is called an operational defi nition . Table 8. 5 off ers a quick reference to appropriate scales pertaining to the constructs most
often measured by marketing researchers. You will notice that the scales in this table are inter-
val scaled because most of the constructs are attitudinal or intensity scales, and the general
recommendation is to use the highest-level scale possible. 18 Of course, while this is not a com-
plete list of marketing constructs, the constructs in Table 8. 5 are often involved in marketing
research undertakings.
A great many variations of interval scales are used in marketing research. If you choose
a career in the marketing research business, you will come to realize that each marketing
research company or marketing research department tends
to rely on “tried-and-true” formats that they apply from
study to study. There are good reasons for this practice of
adopting a preferred question format. First, it expedites
the questionnaire design process. That is, by selecting a
standardized scaled-response form that has been used in
several studies, there is no need to be creative and invent a
new form. This saves both time and costs. 19 Second, test-
ing a standardized scaled-response format across several
studies off ers the opportunity to assess its reliability as
well as its validity. Both of these topics are discussed in
detail in the next sections of this chapter, which introduce
the basic concepts involved with reliability and validity of
measurements and illustrate the methods used to assess
reliability and validity.
Use common sense in deciding whether to have a completely symmetric scale.
Figuring out what scale to use and when is challenging for a
neophyte marketing researcher.
Researchers tend to rely on “tried-and-true” scale formats.
© A
na B
lazi
c Pa
vlov
ic/S
hutt
erst
ock
M08_BURN3261_08_GE_C08.indd 214M08_BURN3261_08_GE_C08.indd 214 29/08/16 1:12 pm29/08/16 1:12 pm

8-4 RELIABILITY AND VALIDITY OF MEASUREMENTS 215
8- 4 Reliability and Validity of Measurements Ideally, a measurement used by a marketing researcher should be reliable and valid. With a
reliable measure , a respondent responds in the same or very similar manner to an identical
or near-identical question. Obviously, if a question elicits wildly diff erent answers from the
same person and you know the person is unchanged between administrations of the question,
something is very wrong with the question. It is unreliable. 20 Validity, on the other hand, refers to the accuracy of the measurement: It is an assessment
of the exactness of the measurement relative to what actually exists. A valid measure is truth-
ful. To illustrate this concept and its diff erence from reliability, think of a respondent who is
embarrassed by a question about his income. This person makes under $40,000 per year, but
he does not want to share that with the interviewer. Consequently, he responds with the high-
est category, “Over $100,000.” In a retest of the questions, the respondent persists in his lie by
stipulating the highest income level again. Here, the respondent has been perfectly consistent
(that is, reliable), but he has also been completely untruthful (that is, invalid). Of course, lying
is not the only reason for invalidity. The respondent may have a faulty memory, may have a
misconception, or may even be a bad guesser, which causes his responses to not conform to
reality. 21 Technical procedures exist for assessment of reliability and validity, although they
are beyond the scope of this text book .
TABLE 8. 5 Commonly Used Interval Scales for Selected Constructs
Construct Response Scale
Brand/store image Semantic diff erential (with 5 or 7 scale points) using a set of bipolar adjectives
Example: Refer to example on page 211 .
Frequency of use Labeled (Never, Rarely, Sometimes, Often, Quite often, Very often)
OR number of times per relevant time period (e.g., month)
Example: How often do you buy takeout Chinese dinners?
Importance Labeled (Unimportant, Slightly important, Important, Quite important, Very important)
OR numbered rating using 5 scale points
Example: How important is it to you that your dry-cleaning service has same-day service?
Intention to purchase Labeled (Very unlikely, Unlikely, Somewhat unlikely, Undecided, Somewhat likely, Likely, Very likely)
OR 100% probability
Example: The next time you buy cookies, how likely are you to buy a fat-free brand?
Lifestyle/opinion Likert (Strongly disagree–Strongly agree with 5 scale points) using a series of lifestyle statements
Example: Indicate how much you agree or disagree with each of the following statements. 1. I have a busy schedule. 2. I work a great deal.
Performance or attitude Labeled (Poor, Fair, Good, Very good, Excellent)
OR numbered rating scale using 5 scale points
OR Stapel scale using –3 to +3
Example: Indicate how well you think Arby’s performs on each of the following features. 1. Variety of items on the menu
2. Reasonable price
3. Location convenient to your home
Satisfaction Labeled (Very satisfi ed, Satisfi ed, Somewhat satisfi ed, Neutral, Somewhat unsatisfi ed,
Unsatisfi ed, Very unsatisfi ed)
OR 10-point satisfaction scale where 1 = “Not at all satisfi ed” and 10 = “Completely satisfi ed”
Example: Based on your experience with Federal Express, how satisfi ed have you been with its overnight delivery service?
Reliable measures obtain identical or very similar responses from the same respondent.
M08_BURN3261_08_GE_C08.indd 215M08_BURN3261_08_GE_C08.indd 215 29/08/16 1:12 pm29/08/16 1:12 pm

216 CHAPTER 8 • UNDERSTANDING MEASUREMENT, DEVELOPING QUESTIONS, AND DESIGNING THE QUESTIONNAIRE
8- 5 Designing a Questionnaire A questionnaire is the vehicle used to present the questions the researcher desires respon-
dents to answer. A questionnaire serves six key functions: (1) It translates the research objec-
tives into specifi c questions asked of respondents. (2) It standardizes those questions and the
response categories so that every participant responds to identical stimuli. (3) By its word-
ing, question fl ow, and appearance, it fosters cooperation and keeps respondents motivated
throughout the interview. (4) It serves as an enduring record of the research. (5) Depending on
the data collection mode used, such as online, a questionnaire can speed up the process of data
analysis. (6) Finally, it contains the information on which reliability and validity assessments
may be made. In other words, questionnaires are used by researchers for quality control. Given that it serves all of these functions, the questionnaire is at the center of the research
process. In fact, studies have shown that questionnaire design directly aff ects the quality of the
data collected. Even experienced interviewers cannot compensate for questionnaire defects. 22
The time and eff ort invested in developing a good questionnaire are well spent. 23 Designing a
questionnaire requires the researcher to go through a series of interrelated steps.
THE QUESTIONNAIRE DESIGN PROCESS Questionnaire design is a systematic process in which the researcher contemplates various
question formats, considers a number of factors characterizing the survey at hand, words the vari-
ous questions carefully, organizes the questionnaire’s layout, and ultimately launches the survey.
Figure 8. 2 off ers a fl owchart of the various phases in a typical questionnaire design pro-
cess. Beginning with the research objectives, the researcher identifi es the properties of con-
structs of interest and decides what type of measure to use for each one. Next, the wording
of each question is addressed, after which the researcher decides on the fl ow or order of the
questions on the questionnaire. Finally, the client is briefed, fi nal testing takes place, coding is
checked, and the questionnaire is then launched for data collection.
As you can see, a signifi cant part of questionnaire design involves the development of
individual questions in the survey, identifi ed as “Decide on Wording” in the fi gure. As you can
imagine, a question will ordinarily go through a series of drafts before it is in acceptable fi nal
form. In fact, even before the question is constructed, the researcher mentally reviews alter-
native question response scale formats to decide which ones are best suited to the survey’s
respondents and circumstances. As the question begins to take shape, the researcher continu-
ally evaluates the question and its response options. Changes are made, and the question’s
wording is reevaluated to make sure that it is asking what the researcher intends. Also, the
researcher strives to minimize question bias , defi ned as the ability of a question’s wording
or format to infl uence respondents’ answers. 24 Question development takes place for every
question pertaining to each research objective.
We elaborate on question development and the
minimization of question bias in the following
sections.
With a custom-designed research study, the
questions on the questionnaire, along with its
instructions, introduction, and general layout,
are all systematically evaluated for potential
error and revised accordingly. Generally, this
evaluation takes place at the researcher’s end,
and the client will not be involved until after
the questionnaire has undergone considerable
development and evaluation by the researcher.
The client is given the opportunity to comment
on the questionnaire during the client approval
A questionnaire presents the survey questions to respondents.
Determine what andhow to measure
Decide on wording
Organize questionnaire
Finalize and launch
Identify constructs’ propertiesand type of measure for each
Word each question usingdos and avoiding don’ts
Write introduction, put questionsin order, use skip logic as needed
Get client approval, pretest,code, launch
FIGURE 8. 2 Question Development and Questionnaire Design Process
Questionnaire design is a systematic process that requires the researcher to go through a series of considerations.
Question bias occurs when the question’s wording or format infl uences the respondent’s answer.
To watch a presentation on effec-tive online questionnaire
design, launch www.youtube.com , and search for “How to Create a Free Online Survey with Google Docs.”
M08_BURN3261_08_GE_C08.indd 216M08_BURN3261_08_GE_C08.indd 216 29/08/16 1:12 pm29/08/16 1:12 pm

8-6 DEVELOPING QUESTIONS 217
step, in which the client reviews the questionnaire and agrees that it covers all appropriate
issues. This step is essential, and some research companies require the client to sign or initial
a copy of the questionnaire as verifi cation of approval. Granted, the client may not appreciate
all the technical aspects of questionnaire design, but he or she is vitally concerned with the
research objectives and can comment on the degree to which the questions on the question-
naire appear to address these objectives. Prior to client approval, the questionnaire normally
undergoes a pretest, which is an actual fi eld test using a limited sample to reveal any dif-
fi culties that might still lurk in wording, instructions, administration, and so on. We describe
pretesting more fully later in this chapter. 25 Response codes, to be described later as well, are
decided, and the questionnaire is fi nalized.
You will soon learn several guidelines to good questionnaire design, but as a preview
to your learning, we have prepared Marketing Research Insight 8. 2 , which lists several best
practices in questionnaire design.
Questionnaire Design Best Practices While some may consider questionnaire design—including question wording, choice of response scales, question fl ow, and so on—an art rather than a science, there has been a fair amount of research and writing on what works best. Recently, a comprehensive review was conducted of research on ques-tionnaire design, and the author 26 of that article issued recom-mendations for various aspects of the questionnaire design process. We have recast his recommendations into the follow-ing 11 best practices for designing a questionnaire.
1. Questions should be as clear, simple, specifi c, and rel-evant for the study’s research aims as possible.
2. Questions should focus on current attitudes and very recent behavior.
3. More general questions should precede more specifi c questions.
4. Vague words should be avoided. Carefully pretest response options that seem ambiguous.
5. Likert-type response scales should range from fi ve to eight response options.
6. When appropriate, include a neutral or no opinion middle option in a scale to increase validity and reliability.
7. All numeric labels should be shown to respondents. 8. Numeric and verbal scale endpoints should be explicit. 9. “Disagree” options should have lower numeric values
attached to them than “Agree” options. 10. Use a “Don’t know” response option when respondents
may hesitate due to unfamiliarity, lack of information, or reluctance.
11. Demographic questions should be put at the end of the questionnaire.
MARKETING RESEARCH INSIGHT 8. 2 Practical Application
Question development is the practice of selecting appropriate response formats and wording questions that are understandable, unambiguous, and unbiased.
8- 6 Developing Questions Question development is the practice of selecting appropriate response formats and word-
ing questions that are understandable, unambiguous, and unbiased. Marketing research-
ers take great care in developing research questions that measure (1) attitudes, (2) beliefs,
(3) behaviors, and (4) demographics 27 because they desire reliable and valid responses.
Question development is absolutely vital to the success of the survey. Here is a corny example
to make our point that question wording is crucial. How would you respond to the following
question that might appear on a questionnaire?
Are you trying to control your compulsive gambling?
_____ Yes _____ No
If you answer “Yes” or “No,” you are admitting to a gambling addiction. Either way, the
conclusion is that everyone who took part in the survey gambles compulsively. But we all
know that everyone is not a compulsive gambler, so the question wording must be fl awed, and
it surely is. 28
M08_BURN3261_08_GE_C08.indd 217M08_BURN3261_08_GE_C08.indd 217 29/08/16 1:12 pm29/08/16 1:12 pm
218 CHAPTER 8 • UNDERSTANDING MEASUREMENT, DEVELOPING QUESTIONS, AND DESIGNING THE QUESTIONNAIRE
A single word can make a diff erence in how study participants respond to a question, and
there is considerable research to illustrate this point. For example, researchers in one study let
subjects view a picture of an automobile for a few seconds. Then they asked a single question,
but they changed one word. They asked, “Did you see the broken headlight?” to one group of
participants and asked, “Did you see a broken headlight?” to another group. Only the “a” and
the “the” were diff erent, yet the question containing the “the” produced more “Don’t know” and
“Yes” answers than did the “a” question. 29 Our point is that as little as one word in a question
can result in question bias that will distort the survey fi ndings. Unfortunately, words that we use
commonly in speaking to one another sometimes encourage biased answers when they appear
on a questionnaire because their literal interpretations are impossible to answer. For example,
“Did you ever use a Laundromat?” means anytime in your lifetime; “Did you have any concerns
about your cell phone’s reception?” means absolutely even the tiniest concern; and “Do you
always buy Bose products?” means every time without fail. These commonly used words are
extreme absolutes , meaning that they place respondents in a situation where they must either
agree fully or they must completely disagree with the extreme position in the question.
FOUR DOS OF QUESTION WORDING Question evaluation amounts to scrutinizing the wording of a question to ensure that question
bias is minimized and that the question is worded so that respondents understand it and can
respond to it with relative ease. As we noted earlier, question bias occurs when the phrasing of
a question infl uences a respondent to answer wrongly or with other than perfect accuracy. Ide-
ally, every question should be examined and tested according to a number of crucial factors
known to be related to question bias. To be sure, question evaluation is a judgment process,
but we can off er four simple guidelines, or “dos,” for question wording. 30 We strongly advise
ensuring that the question is (1) focused, (2) simple, (3) brief, and (4) crystal clear. A discus-
sion of these four guidelines follows.
The Question Should Be Focused on a Single Issue or Topic To the greatest extent
possible, the question must be focused on the specifi c issue or topic. 31 Questions that violate
this guideline are vague and prone to inconsistent interpretation. For example, take the ques-
tion “What type of hotel do you usually stay in when on a trip?” The focus of this question
is vague because it does not narrow down the type of trip or when the hotel is being used.
For example, is it a business or a pleasure trip? Is the hotel at a place en route or at the fi nal
destination? A more focused version is “When you are on a family vacation, what type of
destination hotel do you typically use?” As a second example, consider how “unfocused” the
following question is: “When do you typically go to work?” Does this mean when do you
leave home for work or when do you actually begin work once at your workplace? A better
question would be “At what time do you ordinarily leave home for work?”
The Question Should Be Brief Unnecessary and redundant words should always be elim-
inated. This requirement is especially important when designing questions that will be admin-
istered verbally, such as over the telephone. Brevity will help the respondent comprehend the
central question and reduce the distraction of wordiness. Here is a question that suff ers from
a lack of brevity: “What are the considerations that would come to your mind while you are
confronted with the decision to have some type of repair done on the automatic icemaker in
your refrigerator assuming that you noticed it was not making ice cubes as well as it did when
you fi rst bought it?” A better, brief form would be “If your icemaker was not working right,
how would you correct the problem?” One source recommends that a question should be no
more than 20 words long. 32
The Question Should Be Grammatically Simple A simple sentence is preferred
because it has only a single subject and predicate, whereas compound and complex sentences
are busy with multiple subjects, predicates, objects, and complements. The more complex
Some words, when taken literally, introduce question bias.
The researcher uses question evaluation to scrutinize a possible question for question bias.
A question should be focused.
A question should be brief.
M08_BURN3261_08_GE_C08.indd 218M08_BURN3261_08_GE_C08.indd 218 29/08/16 1:12 pm29/08/16 1:12 pm

8-6 DEVELOPING QUESTIONS 219
the sentence, the greater the potential for respondent error. With more conditions to remem-
ber, the respondent’s attention may wane, or he or she may concentrate on only one part of
the question. To avoid these problems, the researcher should strive to use only simple sentence
structure 33 —even if two separate sentences are necessary to communicate the essence of the
question. Take the question “If you were looking for an automobile that would be used by
the head of your household who is primarily responsible for driving your children to and from
school, music lessons, and friends’ houses, how much would you and your spouse discuss the
safety features of one of the cars you took for a test drive?” A simple approach is “Would you
and your spouse discuss the safety features of a new family car?” followed by (if yes) “Would
you discuss safety ‘very little,’ ‘some,’ ‘a good deal,’ or ‘to a great extent’?”
The Question Should Be Crystal Clear 34,35 It is essential that all respondents “see” the
question identically. Crystal clear means extremely obvious and easy to understand. It is best
to avoid words that are imprecise or open to misinterpretations. For example, the question
“How many children do you have?” is unclear because it can be interpreted in various ways.
One respondent might think of only those children living at home, whereas another might
include children from a previous marriage. A better question is “How many children under the
age of 18 live with you in your home?” To develop a crystal clear question, the researcher may
be forced to slightly abuse the previous guideline of simplicity, but with a bit of eff ort, ques-
tion clarity can be obtained with an economical number of words. 36 One author has nicely
summarized this guideline: “The question should be simple, intelligible, and clear.” 37
FOUR DO NOT’S OF QUESTION WORDING In four “do not” situations question bias is practically
assured. An awareness of these problem areas can help
avoid them or spot them when you are reviewing a ques-
tionnaire draft. Specifi cally, the question should not be
(1) leading, (2) loaded, (3) double-barreled, or (4) over-
stated. Before we describe each instance of a poorly
worded question, we wish to point out that if any one of
them is used intentionally by a researcher, it is a viola-
tion of the Marketing Research Association’s Code of
Ethics. Marketing Research Insight 8. 3 states simply
that any “framing,” or wording of questions that infl u-
ences a respondent’s answer, is wrong.
Do Not “Lead” the Respondent to a Particu-lar Answer A leading question gives a strong cue or
expectation as to what answer to provide. 38 Therefore,
it biases responses. Consider this question: “Don’t you
A question should be grammatically simple.
A question should be crystal clear.
Do not use leading questions that have strong cues on how to answer.
“Don’t you think children eat too much junk food?” is a leading
question.
© B
iker
ider
lond
on/S
hutt
erst
ock
Marketing Research Association Code of Ethics: Respondent Participation 3. Infl uence no respondent’s opinion or attitude through
direct or indirect attempts, including the framing or order of questions.
During screening, prequalifi cation or other qualifi cation proce-dures and data collection, great care must be taken to source
and collect information impartially so that research results accu-rately refl ect reality.
Exceptions: Projects intending to determine how opinions can be manipulated such as message testing.
MARKETING RESEARCH INSIGHT 8. 3 Ethical Consideration
Source: Used courtesy of the Marketing Research Association.
M08_BURN3261_08_GE_C08.indd 219M08_BURN3261_08_GE_C08.indd 219 29/08/16 1:12 pm29/08/16 1:12 pm

220 CHAPTER 8 • UNDERSTANDING MEASUREMENT, DEVELOPING QUESTIONS, AND DESIGNING THE QUESTIONNAIRE
worry when using your credit card for online purchases?” The respondent is being led because
the question wording insinuates that one should worry. Therefore, the question “leads”
respondents to the conclusion that there must be some worries and, therefore, they will likely
agree with the question, particularly respondents who have no opinion. Rephrasing the ques-
tion as “Do you have concerns when using your credit card for online purchases?” is a much
more objective request of the respondent. Here the respondent is free—that is, not led—to
respond “yes” or “no.” Examine the following questions for other forms of leading questions:
As a Cadillac owner, you are satisfied
with your car, aren’t you?
This is a leading question because the wording
presupposes that all Cadillac owners are satisfied. It
places the respondent in a situation where disagreement
is uncomfortable and singles him or her out as an
outlier.
Have you heard about the satellite
Internet service that everyone is talking
about?
This is a leading question because it conditions the
respondent in terms of answering in a socially desirable
manner. In other words, few people would want to
admit they are clueless about something “everybody is
talking about.” 39
Do Not Use “Loaded” Wording or Phrasing Whereas leading questions are typically
obvious, loaded questions are stealthy. That is, a loaded question has buried in its word-
ing elements a sneaky presupposition, or it might make reference to universal beliefs or
rules of behavior. It may even apply emotionalism or touch on a person’s inner fears. Our
compulsive gambling question was loaded because it presupposes that respondents have a
gambling problem. Some researchers refer to a loaded question simply as a “biased ques-
tion.” 40 Identifying bias in a question requires thoughtful judgment. For example, a company
marketing mace for personal use may use the question, “Should people be allowed to protect
themselves from harm by using a Taser in self-defense?” Obviously, most respondents will
agree with the need to protect oneself from harm, and self-defense is acceptable, but these
are loaded concepts because no one wants to be harmed and self-defense is only legal if one
is attacked. Eliminating the loaded aspect of this question would result in the question, “Do
you think carrying a Taser for personal safety is acceptable?” As you can see, the phrasing of
each question should be examined thoroughly to guard against the various sources of ques-
tion bias error. With the new wording of the question in our example, we do not load it by
mentioning harm or self-defense.
Do Not Use a “Double-Barreled” Question A double-barreled question is really two
diff erent questions posed in one question. 41 With two questions posed together, it is diffi cult
for a respondent to answer either one directly. 42 Consider a question asked of patrons at a
restaurant, “Were you satisfi ed with the restaurant’s food and service?” How do respondents
answer? If they say “yes,” does it mean they were satisfi ed with the food? The service? Both?
The survey would be much improved by asking two questions: one about the food and another
about service. In general, any question with more than one subject or more than one predicate
is double-barreled.
Do Not Use Words That Overstate the Case An overstated question places undue
emphasis on some aspect of the topic. It uses what might be considered “dramatics” to
describe the topic. Here is an example that might be found in a survey conducted for Ray-
Ban sunglasses: “How much do you think you would pay for a pair of sunglasses that will
protect your eyes from the sun’s harmful ultraviolet rays, which are known to cause blind-
ness?” As you can see, the overstatement concerns the eff ects of ultraviolet rays, and because
of this overstatement, respondents may be compelled to think about how much they would
pay for something that can prevent blindness and not about how much they would really pay
Do not use double-barreled questions that ask two questions at the same time.
Do not use overstated questions with wording that overemphasizes the case.
Do not use loaded questions that have unjustifi ed assumptions.
M08_BURN3261_08_GE_C08.indd 220M08_BURN3261_08_GE_C08.indd 220 29/08/16 1:12 pm29/08/16 1:12 pm

8-6 DEVELOPING QUESTIONS 221
for sunglasses. A more toned-down and acceptable question wording would be, “How much
would you pay for sunglasses that will protect your eyes from the sun’s glare?” Avoid using
words that overstate conditions. It is better to present the question in a neutral tone rather than
in a strongly positive or negative tone. To be sure, there are other question wording pitfalls. 43 For example, it is nonsensical to
ask respondents about details they don’t recall (“How many and what brands of aspirin did
you see last time you bought some?”), to pose questions that invite guesses (“What is the
price per gallon of premium gasoline at the Exxon station on the corner?”), or to ask respon-
dents to predict their actions in circumstances they cannot fathom (“How often would you
frequent this new, upscale restaurant that will be built 10 miles from your home?”). Using
common sense in developing questions for your questionnaire will help to avoid most sources
of question wording bias.
For tips on developing good survey questions, launch www.
youtube.com , and search for “7 Tips for Good Survey Questions.”
Active Learning
Identify and Reword ‘Bad’ Questions
Can you identify what is “bad” about a question and correct it? Here are some questions that might appear on a questionnaire. Each violates at least one of the dos-and-don’ts question wording presented in this chapter. For each question, write a short description about what makes it problematic, identify the “do” or “don’t” it violates, and suggest a better version.
Question What’s the Problem? What’s a Better Question?
How do you feel about car seats for infants?
When your toddler wants to ride in the car with you when you run errands or pick up your older children at school, practice, or a friend’s home, do you use an infant car seat?
If using an infant car seat is not convenient for you to use, or when you are in a hurry and your toddler is crying, do you still go ahead and use the infant car seat?
How much do you think you should have to pay for an infant seat that restrains and protects your toddler in case someone runs into your car or you lose control of your car and run into a light post or some other object?
Shouldn’t concerned parents of toddlers use infant car seats?
Since infant car seats are proven to be exceptionally valuable, do you agree that infant car seats be used for your loved ones?
Do you think parents who are responsible citizens and who are aware of driving dangers use infant car seats?
If you had an accident with your toddler on board, do you believe an infant car seat could protect your child from being maimed?
M08_BURN3261_08_GE_C08.indd 221M08_BURN3261_08_GE_C08.indd 221 29/08/16 1:12 pm29/08/16 1:12 pm

222 CHAPTER 8 • UNDERSTANDING MEASUREMENT, DEVELOPING QUESTIONS, AND DESIGNING THE QUESTIONNAIRE
Table 8. 6 summarizes guidelines for question wording and applies the dos and don’ts dis-
cussed thus far to a survey on automobile navigation systems. This table provides examples
of problematic questions that violate the associated question wording recommendation along
with improved examples that abide by the recommendations. Use Table 8. 6 as a handy study
guide and a reference to keep our question wording recommendations foremost in your mind
when you are involved in question development.
Adhering to these guidelines is standard operating procedure for seasoned researchers,
but slips do occur occasionally even for the most experienced professionals. This potential
for mistakes explains why many researchers use “experts” to review drafts of their question-
naires. For example, it is common for the questionnaire to be designed by one employee of the
research company and then given to a colleague who understands questionnaire design for a
thorough inspection for question bias as well as face validity —that is, if the questions “look
right.”
8- 7 Questionnaire Organization Now that you have learned about question development, we can turn to the organization of
the questionnaire. Normally, the researcher creates questions by starting with each research
objective in turn and developing the questions that relate to each objective. In other words, the
questions are developed but not arranged on the questionnaire. Questionnaire organization
is the sequence or “fl ow” of statements and questions that make up a questionnaire. Ques-
tionnaire organization is a critical concern because the questionnaire’s arrangement and the
TABLE 8. 6 Examples of Dos and Don’ts for Question Wording
Do-or-Don’t Guideline Problematic Question Improved Question
Do: Be focused How do you feel about your automobile’s
navigation system?
Please rate your automobile’s navigation
system for each of the following features.
(Features are listed.)
Do: Be brief When traffi c conditions are bad, do you or do
you not rely on your automobile’s navigation
system to fi nd the fastest way to work?
Does your automobile navigation system help
you arrive at work on time?
Do: Be grammatically simple If you needed to fi nd your child’s best friend’s
house that was over 10 miles from your house
for your child to attend a birthday party, would
you rely on your automobile navigation system
to get you there?
To what extent would you rely on your
automobile navigation system to fi nd a
friend’s house?
Do: Be crystal clear Is your automobile navigation system useful? How useful is your automobile navigation
system for each of the following occasions?
(Occasions are listed.)
Don’t: Lead Shouldn’t everyone have a navigation system in
their automobile?
In your opinion, how helpful is an automobile
navigation system?
Don’t: Load If navigation systems were shown to help us
decrease our depletion of world oil reserves,
would you purchase one?
How much do you think an automobile
navigation system might save you on
gasoline?
Don’t: Double-barrel Would you consider purchasing an automobile
navigation system if it saved you time, money,
and worry?
Would you consider buying an automobile
navigation system if you believed it would
reduce your commuting time by 10%? (Separate
questions for money and worry savings.)
Don’t: Overstate Do you think an automobile navigation system
can help you avoid traffi c jams that may last for
hours?
To what extent do you believe an automobile
navigation system will help you avoid traffi c
congestion?
Questionnaire organization pertains to the introduction and actual fl ow of questions on the questionnaire.
M08_BURN3261_08_GE_C08.indd 222M08_BURN3261_08_GE_C08.indd 222 29/08/16 1:12 pm29/08/16 1:12 pm

8-7 QUESTIONNAIRE ORGANIZATION 223
ease with which respondents complete the questions have potential to aff ect the quality of the
information that is gathered. Well-organized questionnaires motivate respondents to be con-
scientious and complete, while poorly organized surveys discourage and frustrate respondents
and may even cause them to stop answering questions in the middle of the survey. We will
describe two critical aspects of questionnaire organization: the introduction and the actual
fl ow of questions in the questionnaire body.
THE INTRODUCTION The introduction is crucial in questionnaire design. 44 The introduction sets the stage; it is
what a potential respondent reads or hears before he or she begins answering survey questions.
Of course, each survey and its target respondent group are unique, so a researcher cannot use
a standardized introduction. In this section, we discuss fi ve functions that are accomplished
by the introduction.
Who is Doing the Survey? First, it is common courtesy for the interviewer to introduce
himself or herself at the beginning of a survey. Additionally, the sponsor of the survey may
be identifi ed. There are two options with respect to sponsor identity. With an undisguised survey , the sponsoring company is identifi ed, but with a disguised survey , the sponsor’s
name is not divulged to respondents. The choice of which approach to take rests with the sur-
vey’s objectives or with the researcher and client who agree whether disclosure of the spon-
sor’s name or true intent can in some way infl uence respondents’ answers. Another reason for
disguise is to prevent alerting competitors to the survey.
What is the Survey About? Second, the general purpose of the survey should be described
clearly and simply. By simply, we mean that the purpose may be expressed generically in one
or two sentences. Typically, respondents are not informed of the several specifi c purposes of
the survey, as it would be boring and perhaps intimidating to list all the research objectives.
Consider a bank hiring a marketing research fi rm to conduct a survey. The actual purpose
of the survey is to determine the bank’s image relative to that of its competitors. However,
researchers conducting the survey need only say, “We are conducting a survey on customers’
perceptions of fi nancial institutions in this area.” This satisfi es the respondent’s curiosity and
does not divulge the name of the bank.
How did You Pick Me? Third, prospective respondents must be made aware of how and
why they were selected. Just a short sentence to answer the respondent’s mental question of
“Why me?” will suffi ce. Telling respondents that they were “selected at random” usually is
suffi cient. Of course, you should be ethical and tell them the actual method that was used. If
their selection wasn’t random, you should inform them as to which method was used but in a
nontechnical manner.
Motivate Me to Participate Fourth, prospective respondents must be asked for their par-
ticipation in the survey. If you are conducting a personal interview or a telephone interview,
you might say something like “I would now like to ask you a few questions about your expe-
riences with automotive repair shops. OK?” You should be as brief as possible, yet let the
respondent know you are getting ready for him or her to participate by answering questions.
This is also the appropriate time to off er an incentive to participate. Incentives are off ers to do
something for the respondent to increase the probability that the respondent will participate
in the survey. Researchers may use various incentives to encourage participation. As consum-
ers have become more resistant to telemarketers and marketing researchers’ pleas for infor-
mation, researchers are reporting they must off er increased incentives. Off ering a monetary
incentive, providing a product sample, and giving a copy of study results are examples. Other
incentives encourage respondent participation by letting them know the importance of their
participation: “You are one of a select few, randomly chosen, to express your views on a new
The decision about whether to use a disguised survey depends on the survey’s objectives, possible undue infl uence with knowledge of the client, or desire not to alert competitors of the survey.
The introduction should indicate to respondents how they were selected.
M08_BURN3261_08_GE_C08.indd 223M08_BURN3261_08_GE_C08.indd 223 29/08/16 1:12 pm29/08/16 1:12 pm

224 CHAPTER 8 • UNDERSTANDING MEASUREMENT, DEVELOPING QUESTIONS, AND DESIGNING THE QUESTIONNAIRE
type of automobile tire.” Or the topic itself can be highlighted for importance: “It is important
that consumers let companies know whether they are satisfi ed.”
Other forms of incentives address respondent anxieties concerning privacy. Two meth-
ods tend to reduce these anxieties and, therefore, increase participation. The fi rst is ensuring
anonymity , in which the respondent is not known and therefore is assured that neither
the respondent’s name nor any identifying designation will be associated with his or her
responses. The second method is confi dentiality , 45 which means the respondent’s name is
known by the researcher but is not divulged to a third party, namely, the client. Anonymous
surveys are most appropriate in data collection modes where the respondent responds directly
on the questionnaire. Any self-administered survey qualifi es for anonymity as long as the
respondent does not indicate his or her identity and provided the questionnaire does not have
any covert identifi cation tracing mechanism. However, when an interviewer is used, appoint-
ments and/or callbacks are usually necessary, so there typically is an explicit designation of
the respondent’s name, address, telephone number, and so forth associated with the responses.
In this case, confi dentiality may be required.
Am I Qualifi ed to Take Part? A fi fth and fi nal function of the introduction is to qualify
prospective respondents if they are to be screened for their appropriateness to take part in the
survey. Screening questions are used to ferret out respondents who do not meet the qualifi ca-
tions necessary to take part in the research study. 46 Whether you screen respondents depends
on the research objectives. If the survey’s objective is to determine the factors used by con-
sumers to select an automobile dealer for the purpose of purchasing a new car, you may want
to screen out those who have never purchased a new car or those who have not purchased a
new car within the last, say, two years. For those who answer “no” to the question “Have you
purchased a new car within the last two years?” the survey is terminated with a polite “Thank
you for your time.” Some would argue that you should put the screening question early on so
as to not waste the time of the researcher or the respondent. This should be considered with
each survey. We place screening questions last in the introduction because we have found it
awkward to begin a conversation with a prospective respondent without fi rst taking care of the
four items we just discussed. The creation of the introduction should entail just as much care and eff ort as the devel-
opment of the questions on the questionnaire. The fi rst words heard or read by prospective
respondents will largely determine whether they will take part in the survey. It makes sense,
therefore, for the researcher to labor over an invitation or opening until it has a maximum
chance of eliciting the respondents’ cooperation to take part in the survey. 47 If the researcher is
unsuccessful in persuading prospective respondents to take part in the survey, all of his or her
work on the questionnaire will have been in vain. 48
QUESTION FLOW Question fl ow pertains to the sequencing of questions or blocks of questions, including any
instructions, on the questionnaire. Each research objective gives rise to a question or a set of
questions. As a result, as indicated in Figure 8. 2 , questions are usually developed on an objective-
by-objective basis. However, to facilitate respondents’ ease in answering questions, the
organization of these sets of questions should follow some understandable logic as much as
possible. A commonly used sequence of questions is presented in Table 8. 7 . Questions should
be organized in a logical or commonsense progression. 49 Of course, it should be obvious that
an objective is to keep the questionnaire as short as possible, as long questionnaires have a
negative eff ect on the response rate. 50 If necessary, the fi rst few questions are normally screen-
ing questions, which will determine whether the potential respondent qualifi es to participate
in the survey based on certain selection criteria the researcher has deemed essential.
Once the individual qualifi es to take the survey, the next questions may serve a “warm-
up” function. Warm-up questions are simple and easy-to-answer questions that are used
Anonymity means the respondent is not known and, therefore, may not be identifi ed, while confi dentiality means the respondent’s identity is not to be divulged to a client or any other third party.
Screening questions are used to identify respondents who do not meet the qualifi cations necessary to take part in the research study.
Warm-up questions are used near the beginning of the survey to get the respondent’s interest and demonstrate the ease of responding to the research request.
M08_BURN3261_08_GE_C08.indd 224M08_BURN3261_08_GE_C08.indd 224 29/08/16 1:12 pm29/08/16 1:12 pm

8-7 QUESTIONNAIRE ORGANIZATION 225
to get the respondents’ interest 51 and to demonstrate the ease of responding to the research
request. Ideally, warm-up questions pertain to the research objectives, but the researcher may
opt for a few quick and easy superfl uous questions to heighten the respondent’s interest so
that he or she will be more inclined to deal with the harder questions that follow. Transitions are statements or questions used to let the respondent know that changes in
question topic or format are about to happen. A statement such as “Now, I would like to ask
you a few questions about your TV viewing habits” is an example of a transition statement.
Such statements aid in making certain that the respondent understands the line of questioning.
Transitions include “skip” questions. The response to a skip question aff ects which question
will be answered next. An example is the question “When you buy groceries, do you usually
use coupons?” If the person responds in the negative, questions asking the details of coupon
usage are not appropriate, and the questionnaire will instruct the respondent (or the inter-
viewer, if one is being used) to skip over or to bypass those questions. If the researcher has a
great number of transitions and skip questions, he or she may consider making a fl owchart of
the questions to ensure there are no errors in the instructions. 52 As Table 8. 7 reveals, it is good practice to “bury” complicated and diffi cult-to-answer
questions deep in the questionnaire. Scaled-response questions, such as semantic diff erential
scales, Likert-type response scales, or other questions that require some degree of mental
activity, such as evaluating choices, voicing opinions, recalling past experiences, indicating
intentions, or responding to “what if” questions, are found here. There are two main reasons
for this placement. First, by the time the respondent has arrived at these questions, he or she
has answered several relatively easy questions and is now caught up in a responding mode in
which he or she feels some sort of commitment. Thus, even though the questions in this sec-
tion require more mental eff ort, the respondent will feel more compelled to complete the ques-
tionnaire than to break it off . Second, if the questionnaire is self-administered, the respondent
TABLE 8. 7 Logical Sequence of Survey Questions
Question Type Order Examples Rationale
Screens First questions asked “Have you shopped at Old Navy
in the past month?” “Is this your fi rst
visit to this store?”
Used to select the respondent
types desired by the researcher
to be in the survey
Warm-ups Immediately after any
screens
“How often do you go shopping for
casual clothes?”
“On what days of the week do you
usually shop for casual clothes?”
Easy to answer; shows
respondent that survey is easy
to complete; generates interest
Transitions (statements and questions)
Prior to major sections
of questions or changes
in question format
“Now, for the next few questions, I want
to ask about your family’s TV viewing
habits.”
“Next, I am going to read several
statements and, after each, I want you
to tell me if you agree or disagree with
this statement.”
Notifi es respondent that the
subject or format of the
following questions will change
Complicated and diffi cult-to-answer questions
Middle of the question-
naire; close to the end
“Rate each of the following 10 stores
on the friendliness of their salespeople
on a scale of 1 to 7.”
“How likely are you to purchase each of
the following items in the next three
months?”
Respondent has committed
himself or herself to completing
the questionnaire; can see
(or is told) that there are not
many questions left
Classifi cation and demographic questions
Last section “What is the highest level of education
you have attained?”
Questions that are “personal”
and possibly off ensive are placed
at the end of the questionnaire
Transitions are statements made to let the respondent know that changes in question topic or format are forthcoming.
M08_BURN3261_08_GE_C08.indd 225M08_BURN3261_08_GE_C08.indd 225 29/08/16 1:12 pm29/08/16 1:12 pm

226 CHAPTER 8 • UNDERSTANDING MEASUREMENT, DEVELOPING QUESTIONS, AND DESIGNING THE QUESTIONNAIRE
will see that only a few sections of questions remain to be answered. The end is in sight, so
to speak. If the survey is being administered by an interviewer, the questionnaire will typi-
cally have prompts included for the interviewer to notify the respondent that the interview is
in its fi nal stages. Also, experienced interviewers can sense when respondents’ interest levels
sag, and they may voice their own prompts, if permitted, to keep respondents on task. Online
surveys often have a “% complete” bar or indication that the survey is close to completion. The fi nal section of a questionnaire is traditionally reserved for classifi cation questions.
Classifi cation questions , which almost always include demographic questions, are used to
The more complicated and diffi cult-to-answer questions are placed deep in the questionnaire.
Attention should be given to placing the questions developed into a logical sequence to ease respondent participation.
Active Learning
Decide on Questionnaire Order in a Questionnaire
For a survey to determine the attractiveness of a possible new restaurant, the following table identifies each of the research objectives as well as a possible measurement scale to be used with each research objective. Using your newly acquired knowledge of question flow and questionnaire organization, for each objective, indicate where on the questionnaire you rec-ommend placing the question(s) pertaining to that research objective. Jot down your reason-ing for your recommendation on question order as well.
Research Objective and Description How to Measure?
Order in the Questionnaire and Reason(s) for This Order
Will the restaurant be successful? Will a sufficient number of people patronize the restaurant?
Describe the restaurant concept and ask intentions to purchase there on a scale.
How should the restaurant be designed? What about décor, atmosphere, specialty entrées and desserts, wait staff uniforms, reservations, special seating, and so on?
Determine respondents’ prefer-ences for each of the several possible design features on a preference scale.
What should be the average price of entrées? How much are potential patrons willing to pay for the entrées as well as for the house specials?
Describe standard entrées and possible house specials and identify how much respondents are willing to pay using price ranges.
What is the optimal location? How far from patrons’ homes are patrons willing to drive, and are there any special location features (such as waterfront deck seating, free valet parking, no reservations, etc.) to take into consideration?
Determine furthest driving dis-tance respondents are willing to drive to the new restaurant for each location feature.
What is the profile of the target market?
Ask for demographics of the respondents.
What are the best promotional media? What advertising media should be used to best reach the target market?
Determine normal use of various local media, such as newspaper, radio, and television, and iden-tify specifics, such as what news-paper sections are read, what radio programming respondents prefer, and what local television news times are watched.
M08_BURN3261_08_GE_C08.indd 226M08_BURN3261_08_GE_C08.indd 226 29/08/16 1:12 pm29/08/16 1:12 pm

8-8 COMPUTER-ASSISTED QUESTIONNAIRE DESIGN 227
classify respondents into various groups for purposes of analysis. For instance, the researcher
may want to classify respondents into categories based on age, gender, and income level. The
placement of classifi cation questions such as these at the end of the questionnaire is useful
because some respondents will consider certain demographic questions “personal,” and they
may refuse to give answers to questions about the highest level of education they attained,
their age, their income level, or marital status. 53 In these cases, if a respondent refuses to
answer, the refusal comes at the very end of the questioning process. If it occurred at the
beginning, the interview would begin with a negative tone, perhaps causing the person to
think that the survey will be asking any number of personal questions, and the respondent
may very well object to taking part in the survey at that point. 54
8- 8 Computer-Assisted Questionnaire Design Computer-assisted questionnaire design refers to software that allows users to use com-
puter technology to develop and disseminate questionnaires and to retrieve and analyze data
gathered by the questionnaire. A quick Google or Bing or other search will reveal a consid-
erable number of companies that have online questionnaire design systems including Qual-
trics®, SurveyMonkey®, SnapSurveys®, SmartSurvey®, KeySurvey®, and others. Just about
all of these companies have free trial versions and/or extensive demonstrations of their capa-
bilities. Most are web-based systems, so there is practically no installation, and users need
only to have Internet access to use them.
The trial versions typically have limitations such as a short expiration date or allowing
only a small number of responses. Most have short-term subscriptions that are reasonable
and longer enterprise licenses that are bargains for researchers who do many such surveys in
a year. Computer-assisted questionnaire design software packages off er several advantages:
Compared to using a word processor, they are easier, faster, friendlier, and provide signifi cant
functionality. 55 Users simply point and click to access a large array of questionnaire design
features, and extensive documentation, examples, templates, and helpful hints are normally
included. In this section, we discuss the functionality of computer-assisted questionnaire
design programs.
QUESTION CREATION The typical questionnaire design program will query the user on, for example, what type of
question to use, how many response categories to include, whether multiple responses are per-
mitted, and how response options will appear on the questionnaire. Usually, the program off ers
a selection list of question types such as closed-ended,
open-ended, numeric, or scaled-response questions. Visual
scales with sliders, graphics of all kinds, and interactive
features are commonplace. The program may even have
a question library 56 feature that provides “standard” ques-
tions on constructs that researchers often measure, such as
demographics, importance, satisfaction, performance, or
usage. Plus, the researcher can upload graphics fi les of var-
ious types if these are part of the research objectives. Most
computer-assisted questionnaire design programs are quite
fl exible and allow the user to modify question formats,
build blocks or matrices of questions with the identical
response format, include an introduction and instructions
to specifi c questions, and move the location of questions
with great ease. Often the appearance can be modifi ed to
the designer’s preferences for font, background, color, and
more, including mobile device layouts.
Demographics questions, sometimes called classifi cation questions , are used to classify respondents into various groups for purposes of analysis.
Computer-assisted questionnaire design is easy, fast, friendly, and fl exible.
Computer-assisted questionnaire design programs have question types, question libraries, real-time data capture, and downloadable datasets.
To learn about one company’s survey software,
launch www.youtube.com and search for “Survey Software: What Is Snap Survey Software?”
Most computer-assisted questionnaire design systems provide
for mobile device layout and administration.
© B
loom
ua/S
hutt
erst
ock
M08_BURN3261_08_GE_C08.indd 227M08_BURN3261_08_GE_C08.indd 227 29/08/16 1:12 pm29/08/16 1:12 pm

228 CHAPTER 8 • UNDERSTANDING MEASUREMENT, DEVELOPING QUESTIONS, AND DESIGNING THE QUESTIONNAIRE
SKIP AND DISPLAY LOGIC Skip logic lets the questionnaire designer direct the online survey to skip questions based on
answers given to previous questions. For instance, if the answer is “Yes” to the question, “Did
you order a Papa John’s Pizza delivery for your family in the past month?” the respondent will
be directed to several questions about Papa John’s Pizza, but if the answer is “No,” these ques-
tions will be skipped. That is, the “No” respondent will not see these questions. Display logic is
similar to skip logic, and the survey displays or asks questions that are appropriate based on the
respondent’s prior answers. With display logic, there can be a list of companies with a question,
such as “Check all the pizza delivery companies you have used in the past month.” Then the pro-
gram asks, or displays, only those questions pertaining to the company or companies indicated.
DATA COLLECTION AND CREATION OF DATA FILES Computer-assisted questionnaire design programs create online survey questionnaries.
Once online, the survey is ready for respondents who are alerted to the online survey with
whatever communication methods the researcher wishes to use. Normally, a data fi le is
built as respondents take part—that is, in real time. To elaborate, each respondent accesses
the online questionnaire, registers responses to the questions, and typically clicks on a
“Submit” button at the end of the questionnaire. The submit signal prompts the program to
write the respondent’s answers into a data fi le, so the data fi le grows in direct proportion to
and at the same rate as respondents submit their surveys. Features such as requesting an email
address are often available to block multiple submissions by the same respondent. The data
fi le can be downloaded at the researcher’s discretion, and several diff erent formats, including
SPSS-readable fi les, are usually available.
READY-MADE RESPONDENTS Questionnaire design companies are cognizant of the public’s reluctance to take part in sur-
veys, so many partner with a panel company and integrate panel sample access into their
questionnaire design websites so users can seamlessly gain access to the panel company’s
respondents. Sometimes the panel company being used is apparent, while at other times it is
less obvious. Regardless, the user purchases access to respondents according to the pricing
system negotiated in the partnership. If the user does not want to use panel access, he or she
can simply launch the survey and provide the web address of the online questionnaire to pro-
spective respondents.
DATA ANALYSIS, GRAPHS, AND DOWNLOADING DATA Many of the software programs for questionnaire design have provisions for data analysis,
graphic presentation, and report formats of results. Some packages off er only simplifi ed
graphing capabilities, whereas others off er diff erent statistical analysis options. It is useful to
researchers to monitor the survey’s progress with these features. The graph features vary, and
some of these programs enable users to create professional-quality graphs that can be saved
and/or embedded in word processor report fi les. Of course, all provide for downloading the
survey data in a variety of formats such as Excel (csv), text, and even SPSS, as most market-
ing researchers prefer to use more powerful analysis and data visualization tools than are typi-
cally available with the questionnaire design systems.
We have highlighted only some of the major features of questionnaire design systems.
One feature that resonates with the way some respondents prefer to take surveys is the mobile
device format. However, the mobile device option has obvious constraints that must be taken
into consideration. It is unwise to take a questionnaire designed for online administration
and simply let the questionnaire design system present it in mobile device format. Marketing
Research Insight 8. 4 lists some tips issued by the president of a marketing research company
with deep expertise in mobile administration.
M08_BURN3261_08_GE_C08.indd 228M08_BURN3261_08_GE_C08.indd 228 29/08/16 1:12 pm29/08/16 1:12 pm

8-9 FINALIZE THE QUESTIONNAIRE 229
8- 9 Finalize the Questionnaire Regardless of whether or not the questionnaire is designed for online administration, there are
two steps remaining: precoding and pretesting.
CODING THE QUESTIONNAIRE An important task in questionnaire design is coding , or using numbers associated with ques-
tion response options to facilitate data analysis after the survey has been conducted. Online
questionnaires typically do coding automatically. The logic of coding is simple once you
know the ground rules. The primary objective of coding is to represent each possible response
with a unique number because numbers are easier and faster to use in computer tabulation
programs, such as SPSS , which you learn how to use and interpret in subsequent chapters .
Here are the basic rules for questionnaire coding:
■ Every closed-ended question should have a code number associated with every possible
response. ■ Use single-digit code numbers, beginning with “1,” incrementing them by 1 and using
the logical direction of the response scale. ■ Use the same coding system for questions with identical response options regardless of
where these questions are positioned in the questionnaire. ■ Remember that a “check all that apply” question is just a special case of a “yes” or
“no” question, so use a 1 (= yes) and 0 (= no) coding system for each response option. ■ Whenever possible, set up the coding system before the questionnaire is finalized.
For a hard-copy questionnaire, codes are normally placed in parentheses beside the answers.
In an online questionnaire, the codes are set up internally and not displayed. For labeled scales, it is
recommended that the numbers match the direction of the scale. For example, the codes 1–5 would
match a Poor-Fair-Good-Very good-Excellent scale. If we happened to have a 5-point Likert scale
with Strongly disagree to Strongly agree response options in our questionnaire, the codes would
be 1–5. For any interval scale questions in which numbers are used as the response categories,
the numbers are already on the questionnaire, so there is no need to use codes for these questions. Finally, occasionally a researcher uses an “all that apply” question that asks respondents
to select more than one item from a list of possible responses. 57 With “all that apply” questions,
the standard approach is to have each response category option coded with a 0 or a 1. The
designation 0 will be used if the category is not checked, whereas a 1 is used if it is checked by
a respondent. It is as though the researcher asked each item in the list with a yes/no response.
Codes are numbers associated with question responses to facilitate data entry and analysis.
The codes for an “all that apply” question are set up as though each possible response was answered with “yes” or “no.”
Tips for Effective Mobile Marketing Research Mobile marketing research is the fastest-growing form of data collection, and it means that respondents are increas-ingly being asked to respond to questions on their mobile devices or smartphones. This trend has signifi cant impli-cations for questionnaire design, as the viewing area on a smartphone is much smaller than on desktop PCs, laptops, and even tablets. The president of CatalystMR®, a company with deep experience and recognized expertise in mobile sur-veys, recently gave several tips for companies that wish to succeed in this data collection arena. Here are some bullets from his article. 63
• Keep the survey length from 10 to 15 minutes or less. • Limit scales to 5 points (maximum 7 points). • Limit the amount of text for each question. • Avoid ranking questions and others that require scrolling. • Program one question per screen. • Use skip logic, as it works well with mobile devices. • Pay careful attention to the survey introduction.
• Keep it engaging. • Keep it short, clear, and compelling. • Make it clear that the invitation is being sent only to a
select group (if true).
MARKETING RESEARCH INSIGHT 8. 4 Practical Application
M08_BURN3261_08_GE_C08.indd 229M08_BURN3261_08_GE_C08.indd 229 29/08/16 1:12 pm29/08/16 1:12 pm

230 CHAPTER 8 • UNDERSTANDING MEASUREMENT, DEVELOPING QUESTIONS, AND DESIGNING THE QUESTIONNAIRE
Synthesize Your Learning
This exercise will require you to take into consideration concepts and material from these two chapters.
Chapter 7 Evaluating Survey Data Collection Methods Chapter 8 Understanding Measurement, Developing Questions, and
Designing the Questionnaire
Moe’s Tortilla Wraps
Moe’s sandwich shop sells wraps that are made with tortillas rather than sandwich bread. Seven Moe’s units are located in the greater San Diego, California, area, and Moe is thinking about setting up a franchise system to go “big time” with statewide coverage. Moe hires a marketing strategy consultant, who recommends that he conduct a baseline survey of his seven San Diego units to better understand his customers and to spot strengths and weaknesses he might not be aware of. The consultant recommends that Moe also do a survey of consumers in the San Diego area who are not Moe’s Tortilla Wraps customers or who are infrequent customers to see if there are weaknesses or factors that are preventing them from being loyal customers. Finally, the consultant recommends that surveys be done in three of the possible expansion metropoli-tan areas of San Francisco, Sacramento, and Los Angeles to ascertain the attractiveness of and market potential for Moe’s Tortilla Wraps to sandwich shop users in these cities. The consultant mentions that, ideally, the three surveys would have some equivalent or highly similar ques-tions to facilitate comparisons of the findings among the surveys.
Together Moe and the consultant agree on the following research objectives.
Research Objectives for Users of Moe’s Tortilla Wraps Survey in San Diego, California
1. How often do users purchase a sandwich at Moe’s?
2. Overall, how satisfied are users with Moe’s Tortilla Wraps?
3. How do they rate the performance of Moe’s Tortilla Wraps on the following aspects?
a. Competitive price b. Convenience of locations c. Variety of sandwiches d. Freshness of sandwich fillings e. Speed of service
PRETESTING THE QUESTIONNAIRE Refer back to Figure 8. 2 , and you will fi nd that as part of the questionnaire fi nalization pro-
cess, a pretest should be made of the entire questionnaire. 58 A pretest involves conducting
a dry run of the survey on a small, representative set of respondents to reveal questionnaire
errors before the survey is launched. 59 Pretest participants should be representative of the tar-
get population under study. Before the questions are administered, participants are informed
of the pretest, and their cooperation is requested in spotting words, phrases, instructions,
question fl ow, or other aspects of the questionnaire that appear confusing, diffi cult to under-
stand, or otherwise problematic. Normally, from 5 to 10 respondents are involved in a pretest,
and the researcher looks for common problem themes across this group. 60 For example, if
only one pretest respondent indicates some concern about a question, the researcher prob-
ably would not attempt modifi cation of its wording, but if three mention the same concern,
the researcher would be alerted to the need to undertake a revision. Ideally, when making
revisions, researchers ask the following questions from a respondent’s point of view: Is the
meaning of the question clear? Are the instructions understandable? Are the terms precise?
Are there any loaded or charged words? 61 Because researchers can never completely replicate
the respondent’s perspective, a pretest is extremely valuable. 62
A pretest is a dry run of a questionnaire to fi nd and repair diffi culties that respondents encounter while taking the survey.
M08_BURN3261_08_GE_C08.indd 230M08_BURN3261_08_GE_C08.indd 230 29/08/16 1:12 pm29/08/16 1:12 pm

8-9 FINALIZE THE QUESTIONNAIRE 231
f. Taste of wraps g. Uniqueness of sandwiches
4. Obtain a demographic profile of the sample.
Research Objectives for Nonusers of Moe’s Tortilla Wraps Survey in San Diego, California
1. How often do people purchase sandwiches from sandwich shops?
2. Overall, how satisfied are they with the sandwich shop they use most often?
3. Have they heard of Moe’s Tortilla Wraps?
4. If so, have they used Moe’s in the past six months?
5. If so, how do they rate Moe’s Tortilla Wraps performance on the following various aspects?
a. Competitive price b. Convenience of locations c. Variety of sandwiches d. Freshness of sandwich fillings e. Speed of service f. Taste of wraps g. Uniqueness of sandwiches
6. Obtain a demographic profile of the sample.
Research Objectives for Potential Users of Moe’s Tortilla Wraps Survey in San Francisco, Sacramento, and Los Angeles, California
1. How often do people purchase sandwiches from sandwich shops?
2. How do they rate the sandwich shop they use most often on the following various aspects?
a. Competitive price b. Convenience of locations c. Variety of sandwiches d. Freshness of sandwich fillings e. Speed of service f. Taste of sandwiches g. Uniqueness of sandwiches
3. Given the following description …
A sandwich shop that uses tortillas rather than bread for its sandwiches. It specializes in Southwest-flavored beef, chicken, ham, or processed-meat sandwiches dressed with cheese, chopped lettuce, tomato, onions, and/or peppers and topped with salsa or a spicy chipotle dressing, all priced at about the same you would pay for a sandwich at Jack in the Box.
What is their reaction to the use of tortilla in place of bread in a sandwich?
4. How likely are they to use this sandwich shop if it was at a convenient location in their city?
5. Obtain a demographic profile of the sample.
For each set of objectives associated with each target group of consumers, decide on and justify a data collection method. Given your chosen data collection method, design the full questionnaire, including selecting measurement scales, developing questions, and finalizing the appearance of the questionnaire for each of the three Moe’s Tortilla Wraps surveys. In your deliberations, keep in mind that cost is a concern, as Moe does not have deep pockets to finance this research. However, his expansion plans are not on a fast timetable, so the completion time of the surveys is not especially critical. Of course, it is important to have survey findings that are representative of the respective target consumers for each survey.
M08_BURN3261_08_GE_C08.indd 231M08_BURN3261_08_GE_C08.indd 231 29/08/16 1:12 pm29/08/16 1:12 pm

232 CHAPTER 8 • UNDERSTANDING MEASUREMENT, DEVELOPING QUESTIONS, AND DESIGNING THE QUESTIONNAIRE
Summary
This chapter discussed the concepts involved in measure-
ment of the subjective properties of marketing phenomena.
The three types of measures used in marketing research are
(1) nominal or simple classifi cations, (2) ordinal or rank
order, and (3) scale measures that include ratio scales using
real numbers with a true zero and interval scales using
equal-appearing spaced gradations. Marketing researchers
commonly use interval scales to measure subjective prop-
erties of objects. First, the Likert scale appears as an agree–
disagree continuum with fi ve to seven positions. Lifestyle
questions use a Likert approach to measure people’s atti-
tudes, interests, and opinions. Second, the semantic diff er-
ential scale uses bipolar adjectives to measure the image of
a brand or a store. Third, the Stapel scale uses a symmetric
+ and – number system. Some constructs are measured
with a symmetric interval scale, whereas others that do not
have gradations of negativity are commonly measured with
a nonsymmetric interval scale.
Finally, reliability and validity of measurement were
described. Reliability is the degree to which a respondent
is consistent in his or her answers. Validity, on the other
hand, is the accuracy of responses. It is possible to have
reliable measures that are inaccurate and, therefore, not
valid.
The questionnaire design process involves question
development to ensure unbiased questions and ques-
tion organization, or sequencing, on the questionnaire.
We advocate that the designer follow a step-by-step
development process that begins with determining what
constructs and properties to measure, deciding the precise
wording of questions by using dos-and-don’ts guidelines,
organizing the questionnaire components with the appro-
priate question fl ow, and fi nalizing it into launch mode. The
objective of question development is to create questions
that minimize question bias and to ensure that questions are
focused, simple, brief, and crystal clear. Question bias is
most likely to occur when the question wording is leading,
loaded, double-barreled, or overstated.
The organization of questions on the questionnaire is
critical, including the fi rst statements or introduction to
the survey. The introduction should identify the sponsor
of the survey, relate its purpose, explain how the respon-
dent was selected, solicit the individual’s cooperation to
take part, and, if appropriate, qualify him or her to take
part in the survey. The order and fl ow of questions on
the questionnaire relate to the roles of screens, warm-
ups, transitions, “diffi cult” questions, and classifi cation
questions.
Survey questions are typically coded with numbers
corresponding to all possible responses to facilitate analy-
sis. Marketing researchers typically use web-based soft-
ware systems that perform online questionnaire design;
we briefl y described the several advantageous features
of these programs. This chapter concluded with a dis-
cussion of the function of and details for pretesting a
questionnaire.
Key Terms
Measurement (p. 205 )
Properties (p. 205 )
Objective properties (p. 206 )
Subjective properties (p. 206 )
Scale development (p. 206 )
Nominal measures (p. 206 )
Ordinal measures (p. 207 )
Scale measures (p. 207 )
Ratio scale (p. 207 )
Interval scale (p. 207 )
Workhorse scales (p. 209 )
Likert scale (p. 209 )
Lifestyle inventory (p. 210 )
Semantic diff erential scale
(p. 210 )
Halo eff ect (p. 211 )
Stapel scale (p. 212 )
Symmetric interval scale (p. 213 )
Nonsymmetric interval scale
(p. 214 )
Reliable measure (p. 215 )
Valid measure (p. 215 )
Questionnaire (p. 216 )
Questionnaire design (p. 216 )
Question bias (p. 216 )
Question development (p. 217 )
Question evaluation (p. 218 )
Leading question (p. 219 )
Loaded question (p. 220 )
Double-barreled question (p. 220 )
Overstated question (p. 220 )
Face validity (p. 222 )
Questionnaire organization
(p. 222 )
Introduction (p. 223 )
Undisguised survey (p. 223 )
Disguised survey (p. 223 )
Incentives (p. 223 )
Anonymity (p. 224 )
Confi dentiality (p. 224 )
Screening questions (p. 224 )
Question fl ow (p. 224 )
Warm-up questions (p. 224 )
Transitions (p. 225 )
Skip question (p. 225 )
Classifi cation questions (p. 226 )
Computer-assisted questionnaire
design (p. 227 )
Skip logic (p. 228 )
Display logic (p. 228 )
Coding (p. 229 )
“All that apply” question
(p. 229 )
Pretest (p. 230 )
M08_BURN3261_08_GE_C08.indd 232M08_BURN3261_08_GE_C08.indd 232 29/08/16 1:12 pm29/08/16 1:12 pm

REVIEW QUESTIONS/APPLICATIONS 233
Review Questions/Applications
8- 1. What is measurement? In your answer, diff erenti-
ate an object from its properties, both objective and
subjective.
8- 2. Distinguish the three measures used in marketing
research.
8- 3. How does an interval scale diff er from a ratio scale?
8- 4. Explain what is meant by a continuum along which
subjective properties of an object can be measured.
8- 5. What are the arguments for and against the inclu-
sion of a neutral response position in a symmetric
scale?
8- 6. Distinguish among a Likert scale, a lifestyle scale,
and a semantic diff erential scale.
8- 7. What is the halo eff ect, and how does a researcher
control for it?
8- 8. Provide questions to measure each of the constructs
that follow. Before you construct the measure, con-
sult a source book to fi nd a concise defi nition of the
construct. Relate the defi nition and then provide the
question.
a. Brand loyalty
b. Intentions to purchase
c. Importance of “value for the price”
d. Attitude toward a brand
e. Recall of an advertisement
f. Past purchases
8- 9. How does reliability diff er from validity? In your
answer, defi ne each term.
8- 10 . What is a questionnaire, and what functions does it
serve?
8- 11. What is meant by the statement that questionnaire
design is a systematic process?
8- 12 . What are the four guidelines or “dos” for question
wording?
8- 13. What are the four “don’ts” for question wording?
Describe each.
8- 14. What is the purpose of a questionnaire introduction,
and what should it accomplish?
8- 15. Indicate the functions of (a) screening questions,
(b) warm-ups, (c) transitions, (d) “skip” questions,
and (e) classifi cation questions.
8- 16. What is coding and why is it used? Relate the special
coding requirement with “all that apply” questions.
8- 17. Koharu Café, popular in the Kuala Lumpur city center,
has been seeing a decline in the number of customers
over the last three months. The manager understands
that it is important to retain customers in order for the
café to enjoy long-term customer loyalty. He suspects
that the decline in the number of customers is due to
deterioration in the quality of customer service at the
café. He commissions you as a consultant to help gauge
customers’ satisfaction with the quality of service at the
café. Your fi ndings will help the café to make better
operational decisions. You are charged with the respon-
sibility of developing a suitable research instrument
that will help the café achieve its objective.
8- 18. Each of the following examples involves a market
researcher’s need to measure some construct. Devise
an appropriate scale for each one. In working out the
scale, you are required to clearly indicate its scaling
assumptions, the number of response categories, use
or nonuse of a “no opinion” or neutral response cat-
egory, and face validity.
a. A private hospital would like to know the eff ec-
tiveness of a new painkiller that its pediatrics
department is prescribing to children who are suf-
fering chronic pain.
b. Wholesome Ingredients House (WIH) would like
to launch a new type of cheese. WIH would like to
fi nd out consumers’ opinions on the texture of the
new cheese.
c. ProVehicle, a car manufacturer in a developing
country, will be launching an economical ver-
sion of a hybrid car in two years. A major con-
cern for ProVehicle is whether its consumers are
convinced of the reliability of this car. ProVehicle
would like to fi nd out consumers’ purchase inten-
tion for its new model.
8- 19 . Marks & Spencer (M&S) is a well-known multina-
tional retailer that sells high-quality products in the
clothing, food, and home-products categories. They
have set up retail outlets in few prime locations in
West Malaysia and are now planning to start a chain
of M&S-branded cafés. However, before launching
the project, the management team at M&S would
like to gauge (a) consumers’ perception of M&S and
(b) consumers’ acceptance of the chain of cafés that
M&S plans to set up. Design a Likert measurement
scale that can be used in a telephone study to help
fi nd out consumers’ views on these two points.
8- 20. Listed here are fi ve diff erent aspects of a questionnaire
to be designed for the crafts guild of Maui, Hawaii. It
is to be administered by personal interviewers who
will intercept tourists as they are waiting at the Maui
Airport in the seating areas of their departing fl ight
gates. Indicate a logical question fl ow on the ques-
tionnaire using the guidelines in Table 8. 3 .
a. Determine how they selected Maui as a destination.
b. Discover what places they visited in Maui and
how much they liked each one.
c. Describe what crafts they purchased, where they
purchased them, when they bought them, how
M08_BURN3261_08_GE_C08.indd 233M08_BURN3261_08_GE_C08.indd 233 05/09/16 1:11 PM05/09/16 1:11 PM

234 CHAPTER 8 • UNDERSTANDING MEASUREMENT, DEVELOPING QUESTIONS, AND DESIGNING THE QUESTIONNAIRE
much they paid, who made the selection, and why
they bought those particular items.
d. Specify how long they stayed and where they
stayed while on Maui.
e. Provide a demographic profi le of each tourist
interviewed.
8- 21. Using an Internet search engine of your choice,
choose a computer-assisted questionnaire design
platform such as SurveyMonkey® or Smar tSurvey®.
Sign up for their free trial plan, and familiarize
yourself with the platform and its capabilities.
With each of the following possible features of
computer-assisted questionnaire design platforms,
briefl y relate the specifi cs on how the platform you
have chosen provides the feature. Mention how
these features can help in designing surveys which
use web interviews.
a. Question-type options (including those using
audio and visual media)
b. Web interviews in multiple languages
c. Survey distribution and data collection
d. Reporting and results analysis
e. Integration of the survey platform with popular
social media networks
f. Customization of their services and platform
features
8- 22. Comfort Vision (CV) has developed new weekly-disposable contact lenses that can focus automati-cally, that enable clear vision at any time of the day or night and aid nearsightedness or farsightedness. Th is variety of lenses is targeted at individuals who are above 38 years of age and have poor eyesight at close or large distances. CV has enlisted the help of some optometrists to look for respondents to try the lenses for two weeks. Th e respondents would need to be above 38 years of age and could be nearsighted or farsighted. Th ey would need to provide feedback on the ability of the lenses to focus automatically, their clarity of vision at night, their sharpness of vision, and their overall comfort when wearing the lenses. Respondents would be given two pairs of two-week contact lenses, aft er which they would have to answer some interviewer-administered survey questions related to the new pair of contact lenses. In addition to that, each subject will be gift ed a pair of sunglasses worth $200 aft er completing the survey. Draft a script to use when approaching the subject and inviting the subject to take part in the survey.
CASE 8. 1
Extreme Exposure Rock Climbing Center Faces The Krag
For the past fi ve years, Extreme Exposure Rock Climbing
Center has enjoyed a monopoly. Located in Sacramento,
California, Extreme Exposure is the dream of Kyle Ander-
son, a former extreme sports participant who had to “retire”
due to repeated injuries resulting from this activity. Kyle
has worked hard to make Extreme Exposure the best rock-
climbing facility in the northwestern United States.
Kyle’s rock-climbing center has over 6,500 square feet
of simulated rock walls to climb with about 100 diff erent
routes up to a maximum of 50 vertical feet. Extreme Ex-
posure’s design permits the four major climbing types: top-
roping, where the climber climbs up with a rope anchored at
the top; lead-climbing, where the climber tows the rope that
he or she fi xes to clips in the wall while ascending; boulder-
ing, where the climber has no rope but stays near the ground;
and rappelling, where the person descends quickly by sliding
down a rope. Climbers can buy daily or monthly passes or
annual memberships. Rental cost for shoes and harnesses is
inexpensive, and helmets are available free of charge as all
climbers must wear protective helmets. In addition to indi-
vidual and group climbing classes, Extreme Exposure has
several group programs, including birthday parties, a kids’
summer camp, and corporate team-building classes.
Kyle notices a newspaper article about another rock-
climbing center called The Krag, which will be built in
Sacramento in the next six months. He notes the follow-
ing items about The Krag that are diff erent from Extreme
Exposure: (1) The Krag will have climbs up to a maximum
of 60 vertical feet, (2) it will have a climber certifi cation pro-
gram, (3) there will be day trips to outdoor rock- climbing
areas, (4) there will be group overnight and extended-
stay rock-climbing trips to the Canadian Rockies, and
(5) The Krag’s annual membership fee will be about 20%
lower than Extreme Exposure’s fee.
Kyle chats with Dianne, one of his Extreme Exposure
members who is in marketing, during a break in one of her
climbing visits. Dianne summarizes what she believes Kyle
needs to fi nd out about his current members:
1. What is the demographic and rock-climbing profi le of
Extreme Exposure’s members?
2. How satisfi ed are members with Extreme Exposure’s
climbing facilities?
3. How interested are its members in (a) day trips to out-
door rock-climbing areas, (b) group overnight and/
or extended-stay rock-climbing trips to the Canadian
Rockies, (c) single (one person), couple, and/or family
rock-climbing adventures with a personal rock-climbing
guide, and (d) a rock climber certifi cation program that
would require at least fi ve outside climbing sessions?
M08_BURN3261_08_GE_C08.indd 234M08_BURN3261_08_GE_C08.indd 234 30/08/16 4:08 pm30/08/16 4:08 pm

REVIEW QUESTIONS/APPLICATIONS 235
4. What are members’ opinions of the annual membership
fee charged by Extreme Exposure?
5. Will members consider leaving Extreme Exposure to
join a new rock-climbing center with climbs that are
10 feet higher than the maximum climb at Extreme
Exposure?
6. Will members consider leaving Extreme Exposure to
join a new rock-climbing center with higher climbs and
a lower annual membership fee?
For each of Dianne’s questions, identify the relevant con-
struct and indicate how it should be measured.
CASE 8. 2 INTEGRATED CASE
Auto Concepts
Nick Thomas, CEO of Auto Concepts, has hired CMG
Research to perform a survey. Cory Rogers, vice president
of CMG Research, now feels he has a good grasp of the
research objectives needed to conduct the research study.
Furthermore, he has taken some time to write operational
defi nitions of the constructs, so he has done most of the pre-
liminary work on the questionnaire. The next step is ques-
tionnaire design. Cory and Nick have decided that the most
reasonable approach to the survey is to use an online panel.
This alternative, while somewhat expensive, will guarantee
that the fi nal sample is representative of the market. That is,
companies that operate such panels assure buyers of their
services that the sample will represent any general target
market that a buyer may desire to have represented. In the
case of Auto Concepts, the market of interest is “all auto-
mobile owners,” meaning that practically all adults qualify.
Consequently, it is time to design a questionnaire suit-
able for administration to an online panel of adult consum-
ers. The survey objectives relevant to questionnaire design
for this phase of the research project include the following:
1. What are automobile buyers’ attitudes toward
a. Gasoline use contribution to global warming
b. Global warming
2. Do attitudes related to global warming vary by market
segment? Market segments are defi ned by the following
demographics:
a. Age
b. Income
c. Education
d. Gender
e. Family size
f. Hometown size
g. Dwelling type
3. What are consumer preferences and intentions for
various types of fuel-effi cient automobiles?
a. Super cycle, one-seat all electric
b. Runabout sport, two-seat all electric
c. Runabout hatchback, two-seat gasoline hybrid
d. Economy hybrid, four-seat diesel hybrid
e. Economy standard, fi ve-seat standard gasoline
4. What are the media habits of those who prefer the new
automobile types?
a. Reading the local newspaper (local news, state news,
national, sports, etc.)
b. Watching TV (comedy, drama, sports, reality,
documentary, etc.)
c. Listening to FM radio (easy listening, country, top
40, oldies, jazz, etc.)
d. Reading magazines (general interest, business,
science, sports, cooking, parenting, etc.)
5. What are the social media usage profi les of these consum-
ers with respect to how often they engage in the following?
a. Online blogging
b. Content communities
c. Social network sites
d. Online games
e. Virtual worlds
If necessary, go over the needed integrated case facts and
information imparted to you in previous chapters, and
design an online survey questionnaire for Auto Concepts.
Aim for proper construct measurement, clear question
wording, appropriate question fl ow, and all other principles
of good questionnaire design. (Note: Your instructor may
require you to use a specifi c online questionnaire design
company for this assignment. If not, inquire as to your
options for the construction of the questionnaire.)
M08_BURN3261_08_GE_C08.indd 235M08_BURN3261_08_GE_C08.indd 235 29/08/16 1:12 pm29/08/16 1:12 pm

▶
LEARNING OBJECTIVES In this chapter you will learn:
9- 1 Basic concepts involved with samples and sampling
9- 2 The reasons for taking a sample
9- 3 Differences between probability and nonprobability sampling
9- 4 How to perform each of four different types of probability sampling
9- 5 How to perform each of four different types of nonprobability sampling
9- 6 About online sampling techniques
9- 7 The steps involved with developing a sampling plan
“WHERE WE ARE”
1 Establish the need for marketing
research.
2 Defi ne the problem.
3 Establish research objectives.
4 Determine research design.
5 Identify information types and
sources.
6 Determine methods of accessing
data.
7 Design data collection forms.
8 Determine the sample plan and size.
9 Collect data.
10 Analyze data.
11 Prepare and present the fi nal
research report.
InSites Consulting
INNOVATION IS OUR LIFE-
BLOOD. From the start of InSites
Consulting in 1997 until today,
there has been only one constant:
we are continuously pushing the
boundaries of marketing research
for deeper engagement, more
inspiration, and longer-lasting
impact. Listed as one of the top
5 most innovative marketing
research agencies in the world
(GRIT) and having been cheered
by the industry with more than
25 international awards, we bring our clients to the future fi rst. Today,
we are proud to shape the future of more than one third of the world’s
global brands all across the globe.
COLLABORATION IS OUR BELIEF. We believe in the power of col-
laboration. Over the last 10 years, companies applying a collaborative
mindset have grown no less than 3 times faster compared to ‘Good
to Great’ companies. Times have changed since the famous quote of
Henry Ford: “If I had asked people what they wanted, they would have
said faster horses.” Power shifted from organizations to individual con-
sumers and employees, composing a world full of problem solvers who
are creating billions of dollars’ worth in value. Lifting on the virtues of
today’s collaborative economy, we outpace old and tried solutions and
respond to today’s business needs for more effi cient, agile and impactful
decision making.
CONSUMER INSIGHTS ARE OUR CURRENCY. We empower peo-
ple with consumer insights to make companies better and more future
proof. Our unique consumer insight ecosystem helps companies to put
9 Selecting the Sample
Kristof De Wulf, CEO, InSites
Consulting
M09_BURN3261_08_GE_C09.indd 236M09_BURN3261_08_GE_C09.indd 236 30/08/16 9:46 am30/08/16 9:46 am

237
consumer insights at the heart of everything they do. We bring the voice of the con-
sumer all the way up to the company boardroom in 3 different unique ways:
1. Consumer Consulting Boards to generate fresh and relevant consumer insights
and to embed the voice of consumers in your organization. A Consumer Consult-
ing Board is a closed, moderated online and mobile community of interesting
and interested consumers collaborating with an organization or brand over time.
2. Consumer Activation Studios to share consumer insights faster throughout your
organization, to sharpen consumer insights with a broader group of employees
and to have employees act upon consumer insights. The Consumer Activation
Studio is a SaaS (Software as a Service) corporate solution to unite and activate
employees around consumer insights.
3. Insight Impact Surveys to validate the impact of (possible) marketing decisions
and to measure the return on consumer insights.
MAXIMIZING RETURN ON INSIGHTS IS OUR PROMISE. We help our clients to maximize
the return on their consumer insights, distinguishing ourselves in the following ways:
1. Deeper insights: we are experts in empowering, engaging, connecting and activating
a diverse group of interesting and interested people as the basis for deep and mean-
ingful collaboration
2. Better insights: we master the art of generating, activating and validating consumer
insights that have the power to cause a big or a small transformation in your business
3. Longitudinal insights: we build, grow and protect a structural organizational capability
to tap into the collaborative powers of both consumers and employees, allowing itera-
tive and consecutive learning
4. Broader insights: we focus on driving organization-wide impact, translating consumer
insights into measurable results focusing on agility, efficiency and market impact
5. Global insights: we have a global network of experienced, trained and certified mod-
erators in over 50 countries around the world, efficiently driving collaboration on a
global scale
Source: Text and photos courtesy of Kristof De Wulf and InSites Consulting.
Visit InSites Consulting at
insites-consulting.com
International markets are measured in hundreds of millions of people, national markets
comprise millions of individuals, and even local markets may constitute hundreds of thou-
sands of households. To obtain information from every single person in a market is usually
impossible and obviously impractical. For these reasons, marketing researchers make use of
a sample. This chapter describes how researchers go about taking samples. As can be seen in
our InSites Consulting vignette, both technology and globalization have combined to make
taking a sample a complicated process. We begin with definitions of basic concepts, such
as population, sample, and census. Then we discuss the reasons for taking samples. From
M09_BURN3261_08_GE_C09.indd 237M09_BURN3261_08_GE_C09.indd 237 17/08/16 4:03 pm17/08/16 4:03 pm

238 CHAPTER 9 • SELECTING THE SAMPLE
here, we distinguish the four types of probability sampling
methods from the four types of nonprobability sampling
methods. Because online surveys are popular, we discuss
sampling aspects of these surveys. Finally, we present a
step-by-step procedure for taking a sample, regardless of
the sampling method used.
9- 1 Basic Concepts in Samples and Sampling Sampling has its own basic terminology: population, cen-
sus, sample, sample unit, sample frame, sample frame
error, and sample error. As we describe these concepts, it
will be useful to refer to Figure 9. 1 , which depicts them in
a way that conveys how they relate to one another.
POPULATION A population is defi ned as the entire group under study as specifi ed by the objectives of the
research project. As can be seen in Figure 9. 1 , the population shape is the largest and most
encompassing entity. Managers tend to have a less specifi c defi nition of the population than
do researchers. This is because the researcher must use the description of the population pre-
cisely, whereas the manager uses it in a more general way.
For instance, let us examine this diff erence for a research project performed for Terminix
Pest Control. If Terminix were interested in determining how prospective customers were
combating roaches, ants, spiders, and other insects in their homes, the Terminix manager
would probably defi ne the population as “everybody who might use our services.” However,
the researcher in charge of sample design would use a defi nition such as “heads of households
in those metropolitan areas served by Terminix who are responsible for insect pest control.”
Notice that the researcher has converted “everybody” to “households who are responsible for
insect pest control” and has indicated more precisely who the respondents will be in the form
of “heads of households.” The defi nition is also made more specifi c by the requirement that
the household be in a metropolitan Terminix service area. Just as problem defi nition error can
be devastating to a survey, so can population defi nition error, because a survey’s fi ndings are
applicable only to the population from which the survey sample is drawn. For example, if the
Terminix population is “everybody who might use our services,” it would include industrial,
institutional, and business users as well as households. If a large national chain such as Hilton
Hotels or Olive Garden Restaurants were included in the survey, then the fi ndings could not
be representative of households alone.
CENSUS A census is defi ned as an accounting of the complete population. In other words, if you
wanted to know the average age of members of a population, you would have to ask each
and every population unit his or her age and compute the average. Surely, you can see the
impracticalities associated with a census, particularly when you think about target markets
encompassing millions of consumers.
Perhaps the best example of a census is the U.S. census taken every 10 years by the
U.S. Census Bureau ( www.census.gov ). The target population in the case of the U.S. census
is all households in the United States. In truth, this defi nition of the population constitutes
an “ideal” census, for it is virtually impossible to obtain information from every single U.S.
household. At best, the Census Bureau can reach only a certain percentage of households,
obtaining a census that provides information within the time period of the census-taking
Sample Error
Sample
Population
Sample Frame
Sample Unit
Sample Frame Error
FIGURE 9. 1 Basic Sampling Concepts
The population is the entire group under study as defi ned by research objectives.
A census requires information from everyone in the population.
M09_BURN3261_08_GE_C09.indd 238M09_BURN3261_08_GE_C09.indd 238 17/08/16 4:03 pm17/08/16 4:03 pm

9-1 BASIC CONCEPTS IN SAMPLES AND SAMPLING 239
activity. Even with a public awareness pro-
motional campaign budget of several hundred
thousand dollars that covered all of the major
advertising media forms, such as television,
newspaper, and radio, and an elaborate follow-
up procedure, the Census Bureau admits that its
numbers are not 100% accurate. 1
The diffi culties encountered by U.S. cen-
sus takers are identical to those encountered
in marketing research. For example, there are
instances of individuals who are in transition
between residences, without places of resi-
dence, illiterate, incapacitated, illegally residing
in the United States, or unwilling to partici-
pate. Marketing researchers undertaking survey
research face all of these problems and a host of others. In fact, researchers long ago real-
ized the impracticality and outright impossibility of taking a census of a population. Con-
sequently, they turned to the use of subsets, or samples, which were chosen to represent the
target population.
SAMPLE AND SAMPLE UNIT Both a sample and a sample unit are depicted in Figure 9. 1 . A sample is a subset of the popu-
lation that suitably represents that entire group. 2 Once again, there are diff erences in how the
manager and the researcher use this term. The manager will often overlook the “suitably”
aspect of this defi nition and assume that any sample is a representative sample. However, the
researcher is trained in detecting sample errors and is careful in assessing the degree of repre-
sentativeness of the subgroup selected to be the sample.
A sample unit is the basic level of investigation. That is, in the Terminix example, the
unit is a household. For a WeightWatchers survey, the unit would be one person, but for a
survey of hospital purchases of laser surgery equipment, the sample unit would be hospital
purchasing agents because hospital purchases are being researched.
SAMPLE FRAME AND SAMPLE FRAME ERROR You should notice in Figure 9. 1 that the sample and sample unit exist within the area called
the sample frame . A sample frame is a master source of sample units in the population. You
can see in Figure 9. 1 that the sample frame shape does not take in all of the population shape;
further, it takes in some area that is outside the population’s boundary. In other words, the
sample frame does not always correspond perfectly to the population.
For instance, if a researcher has defi ned a population to be all automobile dealers in the
state of Wyoming, she would need a master listing of these establishments as a frame from
which to sample. Similarly, if the population being researched were certifi ed public accoun-
tants (CPAs), a sample frame for this group would be needed. In the case of automobile deal-
ers, a list service such as American Business Lists of Turnersville, New Jersey, which has
compiled its list of automobile dealers’ Yellow Pages listings, might be used. For CPAs, the
researcher could use the list of members of the American Institute of Certifi ed Public Accoun-
tants, located in New York City, which contains a listing of all accountants who have passed
the CPA exam. Sometimes the researcher cannot fi nd a list, and the sample frame becomes a
matter of whatever access to the population the researcher can conceive, such as “all shoppers
who purchased at least $50 worth of merchandise at a Radio Shack store in March.”
A sample frame invariably contains sample frame error , which is the degree to which
the sample frame fails to account for all of the population. From the fi gure, you can see that a
sample frame may be incomplete, meaning it might omit some units, or it might be inaccurate,
The population is the entire group under study.
The sample is a subset of the population, and the sample unit pertains to the basic level of investigation.
A sample frame is a master source of sample units in the population.
© R
ober
t F.
Bal
azik
/Shu
tter
stoc
k
M09_BURN3261_08_GE_C09.indd 239M09_BURN3261_08_GE_C09.indd 239 17/08/16 4:03 pm17/08/16 4:03 pm
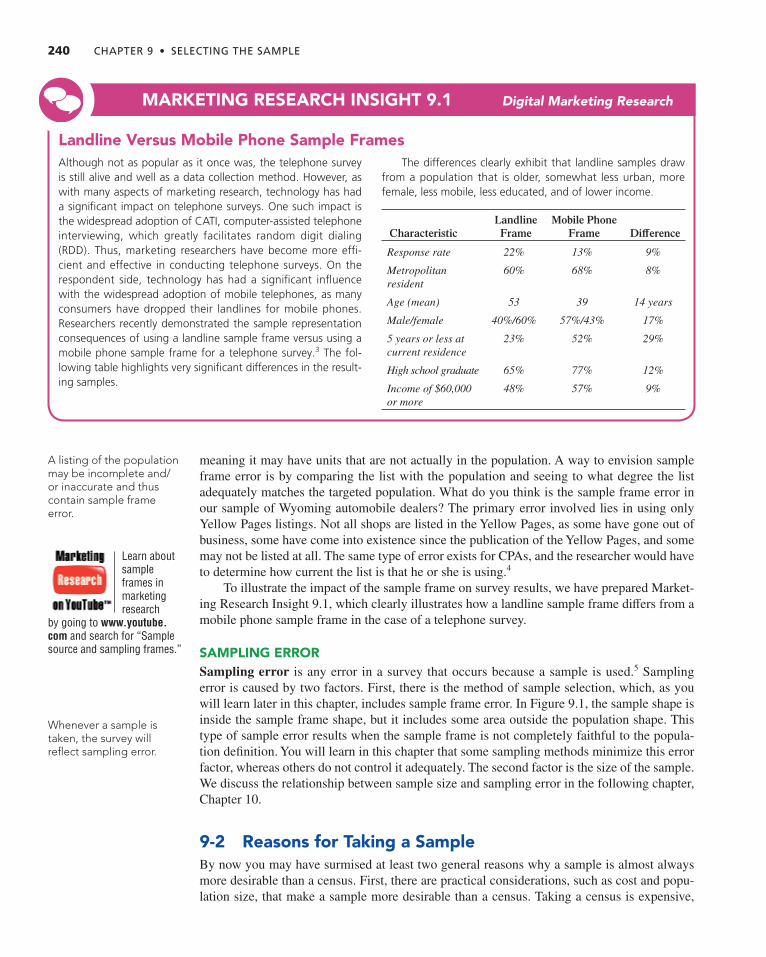
240 CHAPTER 9 • SELECTING THE SAMPLE
meaning it may have units that are not actually in the population. A way to envision sample
frame error is by comparing the list with the population and seeing to what degree the list
adequately matches the targeted population. What do you think is the sample frame error in
our sample of Wyoming automobile dealers? The primary error involved lies in using only
Yellow Pages listings. Not all shops are listed in the Yellow Pages, as some have gone out of
business, some have come into existence since the publication of the Yellow Pages, and some
may not be listed at all. The same type of error exists for CPAs, and the researcher would have
to determine how current the list is that he or she is using. 4
To illustrate the impact of the sample frame on survey results, we have prepared Market-
ing Research Insight 9. 1 , which clearly illustrates how a landline sample frame diff ers from a
mobile phone sample frame in the case of a telephone survey.
SAMPLING ERROR Sampling error is any error in a survey that occurs because a sample is used. 5 Sampling
error is caused by two factors. First, there is the method of sample selection, which, as you
will learn later in this chapter, includes sample frame error. In Figure 9. 1 , the sample shape is
inside the sample frame shape, but it includes some area outside the population shape. This
type of sample error results when the sample frame is not completely faithful to the popula-
tion defi nition. You will learn in this chapter that some sampling methods minimize this error
factor, whereas others do not control it adequately. The second factor is the size of the sample.
We discuss the relationship between sample size and sampling error in the following chapter,
Chapter 10 .
9- 2 Reasons for Taking a Sample By now you may have surmised at least two general reasons why a sample is almost always
more desirable than a census. First, there are practical considerations, such as cost and popu-
lation size, that make a sample more desirable than a census. Taking a census is expensive,
A listing of the population may be incomplete and/or inaccurate and thus contain sample frame error.
Learn about sample frames in marketing research
by going to www.youtube.com and search for “Sample source and sampling frames.”
Whenever a sample is taken, the survey will refl ect sampling error.
Landline Versus Mobile Phone Sample Frames Although not as popular as it once was, the telephone survey is still alive and well as a data collection method. However, as with many aspects of marketing research, technology has had a signifi cant impact on telephone surveys. One such impact is the widespread adoption of CATI, computer-assisted telephone interviewing, which greatly facilitates random digit dialing (RDD). Thus, marketing researchers have become more effi -cient and effective in conducting telephone surveys. On the respondent side, technology has had a signifi cant infl uence with the widespread adoption of mobile telephones, as many consumers have dropped their landlines for mobile phones. Researchers recently demonstrated the sample representation consequences of using a landline sample frame versus using a mobile phone sample frame for a telephone survey. 3 The fol-lowing table highlights very signifi cant differences in the result-ing samples.
The differences clearly exhibit that landline samples draw from a population that is older, somewhat less urban, more female, less mobile, less educated, and of lower income.
CharacteristicLandline
FrameMobile Phone
Frame Diff erence
Response rate 22% 13% 9%
Metropolitan resident
60% 68% 8%
Age (mean) 53 39 14 years
Male/female 40%/60% 57%/43% 17%
5 years or less at current residence
23% 52% 29%
High school graduate 65% 77% 12%
Income of $60,000 or more
48% 57% 9%
MARKETING RESEARCH INSIGHT 9. 1 Digital Marketing Research
M09_BURN3261_08_GE_C09.indd 240M09_BURN3261_08_GE_C09.indd 240 17/08/16 4:03 pm17/08/16 4:03 pm

9-3 PROBABILITY VERSUS NONPROBABILITY SAMPLING METHODS 241
as consumer populations may number in the millions. Even if the population is restricted to a
medium-sized metropolitan area, hundreds of thousands of individuals can be involved.
Second, typical research fi rms or the typical researcher cannot analyze the huge amounts
of data generated by a census. Although computer statistical programs can handle thousands
of observations with ease, they slow down appreciably with hundreds of thousands, and most
are unable to accommodate millions of observations. In fact, even before researchers consider
the size of the computer or tabulation equipment to be used, they must consider the various
data preparation procedures involved in just handling the questionnaires or responses and
transferring these responses into computer fi les. If “hard-copy” questionnaires are to be used,
the sheer physical volume can easily overwhelm the researcher’s capabilities.
Defending the use of samples from a diff erent tack, we can turn to an informal cost–ben-
efi t analysis to defend the use of samples. If the project director of our Terminix household
survey had chosen a sample of 500 households at a cost of $10,000 and had determined that
20% of those surveyed “would consider” switching to Terminix from their current pest con-
trol provider, what would be the result if a completely diff erent sample of the same size were
selected in identical fashion to determine the same characteristic? For example, suppose the
second sample resulted in an estimate of 22%. The project would cost $10,000 more, but
what has been gained with the second sample? Common sense suggests very little additional
information has been gained, for if the project director combined the two samples, he would
come up with an estimate of 21%. In eff ect, $10,000 more has been spent to gain 1% more of
information. It is extremely doubtful that this additional precision off sets the additional cost.
We will develop this notion in more detail in the following chapter on sample size determina-
tion, where you will learn that perfectly acceptable precision or accuracy can be obtained with
surprisingly small samples.
9- 3 Probability Versus Nonprobability Sampling Methods All sample designs fall into one of two categories: probability or nonprobability. Probability samples are samples in which members of the population have a known chance (probability)
of being selected into the sample. Nonprobability samples , on the other hand, are samples
where the chances (probability) of selecting members from the population into the sample are
unknown. Unfortunately, the terms known and unknown are misleading; to calculate a precise
probability, one would need to know the exact size of the population, and it is impossible to
know the exact size of the population in most marketing research studies. If we were target-
ing, for example, Uber users, the exact size of the population changes from week to week as
a result of new adopters, old users dropping the service, and fl uctuations in sales as a func-
tion of traffi c dynamics, weather, and so forth. In fact, it is hard to think of cases in which the
population size is known and stable enough to be associated with an exact number.
The essence of a “known” probability rests in the sampling method rather than in know-
ing the exact size of the population. Probability sampling methods are those that ensure that,
if the exact size of the population were known for the moment in time that sampling took
place, the probability of any member of the population being selected into the sample could
be calculated. In other words, this probability value is really never calculated in actuality, but
we are assured by the sample method that the chances of any one population member being
selected into the sample could be computed. This is an important theoretical notion underly-
ing probability sampling.
With nonprobability methods there is no way to determine the probability even if the
population size is known because the selection technique is subjective. As one author has
described the diff erence, nonprobability sampling uses human intervention, whereas probabil-
ity sampling does not. 6 Nonprobability sampling is sometimes called “haphazard sampling”
With probability sampling, the chances of selection are known; with nonprobability sampling, they are not known.
Taking a sample is less expensive than taking a census.
With probability sampling, the method determines the chances of a sample unit being selected into the sample.
M09_BURN3261_08_GE_C09.indd 241M09_BURN3261_08_GE_C09.indd 241 17/08/16 4:03 pm17/08/16 4:03 pm

242 CHAPTER 9 • SELECTING THE SAMPLE
because it is prone to human error and even subconscious biases. 7 The following descriptions
underscore that the sampling method determines probability or nonprobability sampling.
9- 4 Probability Sampling Methods There are four probability sampling methods: simple random sampling, systematic sampling,
cluster sampling, and stratifi ed sampling. Table 9. 1 introduces each of these methods.
Simple Random Sampling With simple random sampling , the probability of being
selected into the sample is equal for all members of the population. This probability is
expressed by the following formula:
Formula for simple random sample probability
Probability of selection = sample size/population size
With simple random sampling, if the researcher is surveying a population of 100,000
recent Apple Watch buyers with a sample size of 1,000 respondents, the probability of selec-
tion of any single population member into this sample would be 1,000 divided by 100,000, or
1 out of 100, calculated to be 1%.
Examples of simple random sampling include the random device method and the random
numbers method.
The Random Device Method The random device method involves using an apparatus
or a procedure to ensure that every member of the population has the same chance of being
selected into the sample. Familiar examples of the random device method include the fl ipping
of a coin to decide heads or tails, lottery numbers selected by numbered balls, a roulette wheel
in a casino, and a hand dealt in a poker game. In every case, every member of the population
has the same probability of being selected as every other member of that population: 1/2 for
the coin toss, 5/69 Powerball lottery balls, 1/37 roulette numbers, or 5/52 cards. Applied to
With simple random sampling, the probability of selection into the sample is “known” for all members of the population.
The “random device” is a form of simple random sampling.
TABLE 9. 1 Four Different Probability Sampling Methods
Simple Random Sampling The researcher uses random numbers from a computer, random digit dialing, or some other random selection procedure that guaran-
tees each member of the population in the sample frame has an identical chance of being selected into the sample.
Systematic Sampling Using a sample frame that lists members of the population, the researcher selects a random starting point for the fi rst sample mem-
ber. A constant skip interval , calculated by dividing the number of population members in the sample frame by the sample size, is
then used to select every other sample member from the sample frame. This procedure accomplishes the same end as simple random
sampling, and it is more effi cient.
Cluster Sampling The sample frame is divided into groups called clusters, each of which must be highly similar to the others. The researcher can then
randomly select a few clusters and perform a census of each one (one stage). Alternatively, the researcher can randomly select more
clusters and take samples from each one (two stage). This method is desirable when highly similar clusters can be easily identifi ed,
such as subdivisions spread across a wide geographic area.
Stratifi ed Sampling If the population is believed to have a skewed distribution for one or more of its distinguishing factors (e.g., income or product
usage), the researcher identifi es subpopulations in the sample frame called strata . A simple random sample is then taken of each
stratum. Weighting procedures may be applied to estimate population values, such as the mean. This approach is better suited than
other probability sampling methods for populations that are not distributed in a bell-shaped pattern (e.g., skewed).
M09_BURN3261_08_GE_C09.indd 242M09_BURN3261_08_GE_C09.indd 242 17/08/16 4:03 pm17/08/16 4:03 pm

9-4 PROBABILITY SAMPLING METHODS 243
sampling, you can create a device for randomly choosing participants by their names or some
other unique designation. For example, suppose you wanted to determine the attitudes of stu-
dents in your marketing research class toward a career in marketing research. Assume that the
class you have chosen as your population has 30 students enrolled. To do a blind draw , you
write the name of every student on a 3-by-5 index card and put all the cards inside a container.
Next, you place a top on the container and shake it vigorously. This procedure ensures that the
names are thoroughly mixed. You then ask some person to draw the sample. This individual is
blindfolded so that he or she cannot see inside the container. You would instruct him or her to
take out 10 cards as the sample. In this sample, every student in the class has an equal chance
of being selected with a probability of 10/30 or 33%—a 1-in-3 chance of being selected into
that sample.
Active Learning
Are Random Numbers Really Random?
Some people do not believe that random numbers are actually random. These individuals sometimes point out that certain numbers seem to repeat more frequently than other num-bers in lotteries, or they may claim to have a “favorite” or “lucky” number that wins for them when gambling or taking a chance of some sort. You can test the randomness of random numbers by creating an Excel spreadsheet and using its random number function. Use the following steps to perform this test.
1. First, open Excel and place numbers 1–100 in cells A2–A101 with 1 in A2, 2 in A3, 3 in A4, etc., up to 100 in A101.
2. Place numbers 1–100 in cells C1–CX1, respectively.
3. Next, in cells C2–CX101, enter the Excel function =RANDBETWEEN(1,100). (Note: you can enter this formula into cell C2, then copy it and paste the copy into cells C2–CX101. You should see numbers that are whole integers ranging from 1 to 100 in cells C3–CX101.)
4. Next, in cell B2, enter =COUNTIF(C2:CX2,A2). Copy this formula and paste it into cells B2–B101. You will now see integers such as 0, 1, 2, 3, etc., in column B2–B101.
5. Finally, in cell B102, enter in the formula =AVERAGE(B2:B101). Format Cell B102 to be a Number with 2 decimal places.
6. Cell B102 is the average number of times the number in column A2–A101 appears in the corresponding row, meaning row C2–CX2 for A2 or 1, C3–CX3, for A3 or 2, and so on.
What is in cell B102? It is the average number of times out of 100 times that each number from 1 to 100 appeared in its respective row. In other words, if the average in cell B102 is 1, then every number from 1 to 100 had an equal chance of being in its respective row. Stated differently, B102 is the number of chances out of 100 for any number from 1 to 100 to be selected by Excel’s random number function.
You can “redraw” all 1,000 random numbers in Excel by simply entering in a blank-Return anywhere in the spreadsheet. Try this with cell A1 several times, and you will see that the aver-age changes slightly, but it will tend to “hover” around 1.0.
You can test the “lucky number” theory by copying row 101 into rows 105–114 and plac-ing the lucky number into cells A105–A114. Create an average of cells B105:B114 in cell B115. Then do several repetitions by entering in a blank-Return and keep track of the numbers that appear in cell B115. You will find that it is typically 1, meaning that the lucky number has no more chance of being drawn than any of the 99 other random numbers.
M09_BURN3261_08_GE_C09.indd 243M09_BURN3261_08_GE_C09.indd 243 17/08/16 4:03 pm17/08/16 4:03 pm

244 CHAPTER 9 • SELECTING THE SAMPLE
The Random Numbers Method All of our random device ex-
amples involve small populations that are easily accommodated by
the physical aspects of the device. With large populations, random
devices become cumbersome (just try shuffl ing a deck of 1,000 play-
ing cards). A tractable and more sophisticated application of simple
random sampling is to use computer-generated numbers based on
the concept of random numbers , which are numbers whose chance
nature is assured. Computer programs can be designed to generate
numbers without any systematic sequence to the numbers whatso-
ever—that is, they are random. A computer easily handles datasets
of hundreds of thousands of individuals; it can quickly label each
one with a unique number or designation, generate a set of random
numbers, and match the random numbers with the unique designa-
tions of the individuals in the dataset to select or “pull” the sample.
Using random numbers, a computer system can draw a huge random
sample from a gigantic population in a matter of minutes and guar-
antee that every population member in the computer’s fi les has the
same chance of being selected in the sample.
Marketing Research Insight 9. 2 shows the steps involved in
using random numbers generated by a spreadsheet program to select
students from this 30-member population. Beginning with the fi rst
generated random number, you would progress through the set of random numbers to select
members of the population into the sample. If you encounter the same number twice within
the same sample draw, the number is skipped over because it is improper to collect informa-
tion twice from the same person.
Games of chance such as bingo, lottery, or roulette
are based on random selection, which underlies
random sampling.
How to Use Random Numbers to Select a Simple Random Sample
Step 1: Assign a unique number to each member of the population.
Name Number
Adams, Bob 1
Baker, Carol 2
Brown, Fred 3
Chester, Harold 4
Downs, Jane 5
… ↓ Zimwitz, Roland 30
Step 2: Generate random numbers in the range of 1 to N (30 in this case) by using the random number func-tion in a spreadsheet program such as Microsoft Excel. 8 With Excel, use the =RANDBETWEEN(1,N) function described in the Active Learning exercise on the previous page to generate random numbers
in the range of 1 to N . The following set of random numbers was generated this way.
23 12 8 4 22 17 6 23 14 2 13
Select the fi rst random number and fi nd the corre-sponding population member. In the example, num-ber 23 is the fi rst random number.
Step 3: Select the person corresponding to that number into the sample.
#23—Stepford, Ann
Step 4: Continue to the next random number and select that person into the sample.
#12—Fitzwilliam, Roland
Step 5: Continue on in the same manner until the full sam-ple is selected. If you encounter a number selected earlier, such as the 23 that occurs as the eighth ran-dom number, simply skip over it because you have already selected that population member into the sample. (This explains why 11 numbers were drawn.)
MARKETING RESEARCH INSIGHT 9. 2 Practical Application
A random number embodies simple random sampling assumptions.
© z
enti
lia/1
23R
F
M09_BURN3261_08_GE_C09.indd 244M09_BURN3261_08_GE_C09.indd 244 17/08/16 4:03 pm17/08/16 4:03 pm

9-4 PROBABILITY SAMPLING METHODS 245
Advantages and Disadvantages of Simple Random Sampling Simple random sam-
pling is an appealing sampling method simply because it embodies the requirements necessary
to obtain a probability sample and, therefore, to derive unbiased estimates of the population’s
characteristics. This sampling method guarantees that every member of the population has an
equal chance of being selected into the sample; therefore, the resulting sample, no matter what
the size, will be a valid representation of the population.
However, there are some slight disadvantages associated with simple random sam-
pling. To use either the random device or the random numbers approach, it is necessary to
uniquely identify and label each and every population member. In the blind draw example,
each student’s name was written on an index card, and in the random numbers example,
every population member was assigned a unique label or number. In essence, simple ran-
dom sampling necessarily begins with a complete listing of the population, and current
and complete listings are sometimes diffi cult to obtain. Incomplete or inaccurate listings of
populations, of course, contain sample frame error. If the sample frame does not exist as
an electronic list, it can be cumbersome to manually provide unique designations for each
population member.
Simple Random Sampling Used in Practice There are two practical applications in
which simple random sample designs are employed quite successfully: random digit dialing
and computer-based random samples. In fact, these two general cases constitute the bulk of
the use of simple random sampling in marketing research.
One instance in which simple random sampling is commonly employed is through the
use of random digit dialing. Random digit dialing (RDD) is used in telephone surveys to
overcome the problems of unlisted and new telephone numbers. Of course, a current chal-
lenge to random digit dialing is cell phone ownership. 9
In random digit dialing, telephone numbers are generated randomly with the aid of a
computer. These numbers are called, and telephone interviewers administer the survey to
the respondent once the person has been qualifi ed. 10 Before random digit dialing became
essentially universal, the plus-one dialing procedure , in which numbers are selected from
a telephone directory and a digit, such as a “1,” is added to each number to determine which
telephone number is then dialed was sometimes used. Alternatively, the last digit can be sub-
stituted with a random number. 11
While random digit dialing was the marketing research industry’s fi rst wholesale incor-
poration of random sampling, with current computer technology, it is feasible to use random
sampling in a wide variety of situations. For example, often companies possess computer
lists, company fi les, or commercial listing services that have been converted into databases.
Practically every database software program has a random number selection feature, so sim-
ple random sampling is easy to achieve if the researcher has a computerized database of the
population. The database programs can work with random numbers of as many digits as are
necessary, so even Social Security numbers with nine digits are no problem. Companies with
credit fi les, subscription lists, or marketing information systems have the greatest opportunity
to use this approach, or a research company may turn to a specialized sampling company such
as Survey Sampling, Inc., to have it draw a random sample of households or businesses in a
certain geographic area using its extensive databases.
In our chapter on the marketing research industry, we made note of the many companies
that maintain consumer and business panels of various types, and practically every one of
these companies sells access to random samples of their panels. That is, their panels, which
sometimes number in the tens of thousands of individuals, are really megasamples of various
types of populations. These panels operate as sample frames from which the panel company
draws smaller random samples according to the specifi cations of their clients.
Systematic Sampling Before computer databases were largely available, researchers used
a physical telephone book or a directory as the sample frame, in which case the time, expense,
To learn about simple random sampling, launch www.
youtube.com and search for “Simple Random Sampling by Steve Mays.”
Using random numbers to draw a simple random sample requires a complete accounting of the population.
Random digit dialing overcomes problems of unlisted and new telephone numbers.
M09_BURN3261_08_GE_C09.indd 245M09_BURN3261_08_GE_C09.indd 245 17/08/16 4:03 pm17/08/16 4:03 pm

246 CHAPTER 9 • SELECTING THE SAMPLE
and practical implementation challenges of simple random sampling were daunting. Fortu-
nately, an economical alternative probability sampling method was available. Systematic sampling , which is a way to select a random sample from a directory or list, is much more
effi cient (uses less eff ort) than simple random sampling. So, in the special case of a physical
listing of the population, such as a membership directory or a telephone book, systematic
sampling is advantageous to simple random sampling primarily due to the economic effi -
ciency it represents. In this instance, systematic sampling can be applied with less diffi culty
and accomplished in a shorter time than can simple random sampling. Furthermore, in these
instances, systematic sampling has the potential to create a sample that is almost identical in
quality to samples created from simple random sampling.
To use systematic sampling, it is necessary to have a complete listing of the population.
As noted earlier, the most common listing is a directory of some sort, but it might be a data-
base. The researcher decides on a skip interval , which is calculated by dividing the number
of names on the list by the sample size, as can be seen in the following formula:
Formula for skip interval
Skip interval = population list size/sample size
Names are selected based on this skip interval. For example, if one calculated a skip
interval of 250, every 250th name would be selected into the sample. The use of this skip
interval formula ensures that the entire list will be covered. Marketing Research Insight 9. 3
shows how to take a systematic sample.
Why Systematic Sampling Is “Fair” Systematic sampling is probability sampling be-
cause it employs a random starting point, which ensures there is suffi cient randomness in the
systematic sample to approximate an equal probability of any member of the population being
selected into the sample. In essence, systematic sampling envisions the list as made up of the
skip interval number of mutually exclusive samples, each one of which is representative of the
listed population. The random starting point guarantees that the selected sample is selected
randomly.
How does the random starting point take place? With a directory or physical list as the
sample frame, the effi cient approach is to fi rst generate a random number between 1 and the
Systematic sampling is more effi cient than simple random sampling.
One must calculate a “skip interval” to use systematic sampling.
How to Take a Systematic Sample Step 1: Identify a listing of the population that contains an
acceptable level of sample frame error. Example: the telephone book for your city
Step 2: Compute the skip interval by dividing the number of names on the list by the sample size.
Example: 25,000 names in the phone book, sam-ple size of 500, so skip interval = every 50th name
Step 3: Using random number(s), determine a starting posi-tion for sampling the list.
Example: Select : random number for page number Select : random number for the column on that page Select : random number for name position in that column (say, Jones, William P.)
Step 4: Apply the skip interval to determine which names on the list will be in the sample.
Example: Jones, William P. (skip 50 names); Lathum, Ferdinand B.
Step 5: Treat the list as “circular.” That is, the fi rst name on the list is now the initial name you selected, and the last name is now the name just prior to the initially selected one.
Example: When you come to the end of the phone book names ( Z s), just continue on through the beginning ( A s).
MARKETING RESEARCH INSIGHT 9. 3 Practical Application
M09_BURN3261_08_GE_C09.indd 246M09_BURN3261_08_GE_C09.indd 246 17/08/16 4:03 pm17/08/16 4:03 pm

9-4 PROBABILITY SAMPLING METHODS 247
number of pages to determine the page on which you will start. Suppose page 53 is drawn.
Another random number would be drawn between 1 and the number of columns on a page to
decide the column on that page. Assume the third column is drawn. A fi nal random number
between 1 and the number of names in a column would be used to determine the actual start-
ing position in that column. Let’s say the 17th name is selected. From that beginning point,
the skip interval would be employed. The skip interval would ensure that the entire list would
be covered, and the fi nal name selected would be approximately one skip interval before the
starting point. It is convenient to think of the listing as circular, so that A follows Z if the
list were alphabetized, and the random starting point determines where the list “begins.” Of
course, with an electronic database, the starting point will be a random number between 1 and
the number of individuals in the database.
The essential diff erence between systematic sampling and simple random sampling is
apparent in the use of the words systematic and random . The system used in systematic sam-
pling is the skip interval, whereas the randomness in simple random sampling is determined
through the use of successive random draws. Systematic sampling skips its way through the
entire population list from random beginning point to end, whereas random sampling guaran-
tees that the complete population will be covered by successive random draws. The effi ciency
in systematic sampling is gained by two features: (1) the skip interval aspect and (2) the need
to use random number(s) only at the beginning.
As we have indicated, a systematic sample requires a listing of the population, and we
have included Marketing Research Insight 9. 4 , which describes how researchers in China
Systematic sampling is more effi cient than simple random sampling because only one or a very few random numbers need to be drawn at the beginning.
Systematic Sample of Chinese Hospitals Reveals Video-on-Web Strategies Despite being the most populated country in the world in the midst of a very aggressive modernization phase costing the Chinese government and private companies countless billions of dollars, some sectors are lagging. In particular, the Chinese medical sector in the form of Chinese hospitals is struggling to deliver better health practices to Chinese citizens. No single culprit exists; instead a number of factors can be identifi ed that collectively have stymied the advancement of “e-health” campaigns. Among these factors are traditional Chinese medi-cal practices such as herbal medicines, acupuncture, massage, and special diets that are revered by older Chinese citizens; low Internet penetration in rural areas; lack of technical expertise on the part of Chinese hospital administrators; and lack of resources. Recently, Chinese researchers decided to investigate the use of online videos by Chinese hospitals. 12
These researchers found statistics attesting that 6.27 billion patient visits to doctors occurred in a typical year at approxi-mately 22,000 public and private Chinese hospitals. Further, these hospitals hold 3.7 million beds with an occupancy rate of just under 90%.
The researchers wanted to study the use of e-health vid-eos by Chinese hospitals by directly observing the contents of hospital websites. Because visiting thousands of these websites was an impossible task, they had to select a sample. The sample frame became an immediate problem, for there is no offi cial list
of Chinese hospitals. The Chinese Healthcare Ministry reported a total of 22,000 hospitals in China, but it did not have a pub-lically available list. The researchers conducted an extensive search, and they found a list of 19,084 Chinese hospitals that had been compiled by a private company about a year earlier. Because this list was available online, it became the sample frame, and the researchers selected every eighth hospital on the list. That is, they used a systematic sample with a skip inter-val of 8 to select 2,385 hospitals. The researchers then sought to visit the website of each selected hospital and to conduct content analysis on the video content found on the website.
Thus, with the use of probability sampling in the form of a systematic sample, the researchers’ fi ndings accurately describe the entire population of Chinese hospitals as follows:
• 42% have a website • 22% with a website have at least one video on it • About 10% have only one video • About 7% have 2 to 10 videos • About 3% have 11 to 30 videos • About 1% have more than 30 videos
The researchers concluded that Chinese hospitals were greatly underutilizing videos on their websites, which is appalling given that China is one of the largest video consumption markets in the world.
MARKETING RESEARCH INSIGHT 9. 4 Global Application
M09_BURN3261_08_GE_C09.indd 247M09_BURN3261_08_GE_C09.indd 247 05/09/16 1:16 PM05/09/16 1:16 PM

248 CHAPTER 9 • SELECTING THE SAMPLE
selected a sample of hospitals in a study of how Chinese hospitals are using videos on their
websites.
Disadvantage of Systematic Sampling The greatest danger in the use of systematic
sampling lies in the listing of the population (sample frame). Sample frame error is a major
concern for telephone directories because of unlisted numbers. It is also a concern for lists that
are not current. In both instances, because the sample frame will not include certain popula-
tion members, these members have no chance of being selected into the sample.
Cluster Sampling Another form of probability sampling is known as cluster sampling ,
in which the population is divided into subgroups called “clusters,” each of which could rep-
resent the entire population. Note that the basic concept behind cluster sampling is similar
to the one described for systematic sampling, but the implementation diff ers. The procedure
uses some convenient means that identifi es clusters that are theoretically identical, such as
the pages of listings in a hard-copy directory. Any one cluster or page, therefore, could be a
Active Learning
Take a Systematic Sample Using an Electronic List
This Active Learning exercise will give you experience in taking a systematic sample from an electronic list, such as a class roster or membership roll. For this exercise, you will use the Internet to search for a membership list in Excel. You will then apply systematic sam-pling steps as though you were selecting a sample of 100 members. First, you must find a list. Use Google or Bing or some other search engine to find “membership list.” It does not matter what organization or association you find as long as it allows you to download the complete membership list in Excel. For instance, the USA Fencing Association has such a list ( www.usfencing.org ) of over 19,000 current members.
To draw a systematic sample, use the following steps:
1. Estimate the total number of individuals on the list. Typically, each member occupies a unique row, so all you need to do is to determine the number of rows in the dataset less any row(s) used for headings.
Number of members in the list: ____________________ 2. Determine the skip interval by dividing the number of members on the list by the sam-
ple size, 100. Skip interval: ____________________ 3. Now, using some sort of random number generator such as an Excel function or a table
of random numbers (typically found in a statistics textbook), select a random starting point. Using the Excel random number function “RANDBETWEEN,” you can select a random number between 1 and the total number of members in your sample frame (the list you downloaded).
4. The RANDBETWEEN number you have obtained is the starting point for your sample. Go to that row in the database, adjusting for any heading row(s) at the top of the spreadsheet.
5. Using your skip interval, you can now select the sample of 100 members. 6. The procedure you have used here assumes that every one of your 100 randomly
selected members will participate in the survey (100% response rate); however, this assumption is unrealistic. Assume that you expect a 50% response rate. What adjust-ment to the skip interval calculation can you make to accommodate the fact that every other prospective respondent will refuse to take part in the survey when asked?
With systematic sampling, the small loss in sampling precision is counterbalanced by its economic savings.
A cluster sampling method divides the population into groups, any one of which can be considered a representative sample.
M09_BURN3261_08_GE_C09.indd 248M09_BURN3261_08_GE_C09.indd 248 17/08/16 4:03 pm17/08/16 4:03 pm
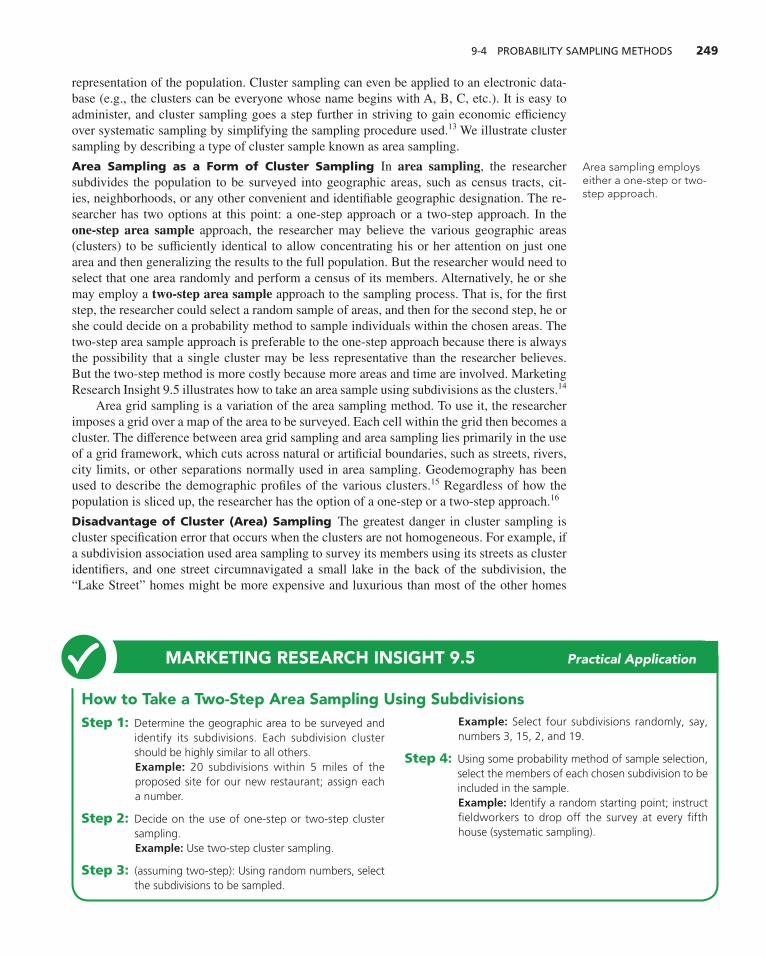
9-4 PROBABILITY SAMPLING METHODS 249
representation of the population. Cluster sampling can even be applied to an electronic data-
base (e.g., the clusters can be everyone whose name begins with A, B, C, etc.). It is easy to
administer, and cluster sampling goes a step further in striving to gain economic effi ciency
over systematic sampling by simplifying the sampling procedure used. 13 We illustrate cluster
sampling by describing a type of cluster sample known as area sampling.
Area Sampling as a Form of Cluster Sampling In area sampling , the researcher
subdivides the population to be surveyed into geographic areas, such as census tracts, cit-
ies, neighborhoods, or any other convenient and identifi able geographic designation. The re-
searcher has two options at this point: a one-step approach or a two-step approach. In the
one-step area sample approach, the researcher may believe the various geographic areas
(clusters) to be suffi ciently identical to allow concentrating his or her attention on just one
area and then generalizing the results to the full population. But the researcher would need to
select that one area randomly and perform a census of its members. Alternatively, he or she
may employ a two-step area sample approach to the sampling process. That is, for the fi rst
step, the researcher could select a random sample of areas, and then for the second step, he or
she could decide on a probability method to sample individuals within the chosen areas. The
two-step area sample approach is preferable to the one-step approach because there is always
the possibility that a single cluster may be less representative than the researcher believes.
But the two-step method is more costly because more areas and time are involved. Marketing
Research Insight 9. 5 illustrates how to take an area sample using subdivisions as the clusters. 14
Area grid sampling is a variation of the area sampling method. To use it, the researcher
imposes a grid over a map of the area to be surveyed. Each cell within the grid then becomes a
cluster. The diff erence between area grid sampling and area sampling lies primarily in the use
of a grid framework, which cuts across natural or artifi cial boundaries, such as streets, rivers,
city limits, or other separations normally used in area sampling. Geodemography has been
used to describe the demographic profi les of the various clusters. 15 Regardless of how the
population is sliced up, the researcher has the option of a one-step or a two-step approach. 16
Disadvantage of Cluster (Area) Sampling The greatest danger in cluster sampling is
cluster specifi cation error that occurs when the clusters are not homogeneous. For example, if
a subdivision association used area sampling to survey its members using its streets as cluster
identifi ers, and one street circumnavigated a small lake in the back of the subdivision, the
“Lake Street” homes might be more expensive and luxurious than most of the other homes
Area sampling employs either a one-step or two-step approach.
How to Take a Two-Step Area Sampling Using Subdivisions Step 1: Determine the geographic area to be surveyed and
identify its subdivisions. Each subdivision cluster should be highly similar to all others.
Example: 20 subdivisions within 5 miles of the proposed site for our new restaurant; assign each a number.
Step 2: Decide on the use of one-step or two-step cluster sampling.
Example: Use two-step cluster sampling.
Step 3: (assuming two-step): Using random numbers, select the subdivisions to be sampled.
Example: Select four subdivisions randomly, say, numbers 3, 15, 2, and 19.
Step 4: Using some probability method of sample selection, select the members of each chosen subdivision to be included in the sample.
Example: Identify a random starting point; instruct fi eldworkers to drop off the survey at every fi fth house (systematic sampling).
MARKETING RESEARCH INSIGHT 9. 5 Practical Application
M09_BURN3261_08_GE_C09.indd 249M09_BURN3261_08_GE_C09.indd 249 17/08/16 4:03 pm17/08/16 4:03 pm

250 CHAPTER 9 • SELECTING THE SAMPLE
in the subdivision. If, by chance, Lake Street was selected as a cluster in the survey, it would
most likely bias the results toward the opinions of the relatively few wealthy subdivision resi-
dents. In the case of one-step area sampling, this bias could be severe.
Stratifi ed Sampling All of the sampling methods we have described thus far implicitly
assume that the population has a normal, or bell-shaped, distribution for its key proper-
ties. That is, every potential sample unit is assumed to have a fairly good representation
of the population, and any that are extreme in one way are perfectly counterbalanced by
others that are oppositely extreme potential sample units. Unfortunately, it is common to
work with populations in marketing research that contain unique subgroupings; you might
encounter a population that is not distributed symmetrically across a normal curve. With
this situation, unless you make adjustments in your sample design, you will end up with a
sample described as “statistically ineffi cient”—that is, inaccurate. One solution is stratifi ed sampling , which separates the population into diff erent subgroups and then samples all of
these subgroups.
Working with Skewed Populations A skewed population has a long tail on one side and
a short tail on the opposite end. As such, it deviates greatly from the bell-shaped distribution
that is assumed to be the case in the use of simple random, systematic, or cluster sampling. If
any of these methods is used to draw the sample from a skewed distribution, it most certainly
would be inaccurate.
For example, let’s take the case of a college that is attempting to assess how its students
perceive the quality of its educational programs. A researcher has formulated the question
“To what extent do you value your college degree?” The response options are along a 5-point
scale where 1 equals “Not valued at all” and 5 equals “Very highly valued.” The population
of students is stratifi ed or divided by year: freshman, sophomore, junior, and senior. That is,
the researcher identifi es four strata that comprise the complete population of the college’s
students. We would expect the response to diff er by stratum (the respondent’s year classifi ca-
tion) because seniors probably value a degree more than do juniors, who value a degree more
With stratifi ed sampling, the population is separated into different strata, and a sample is taken from each stratum.
Stratifi ed sampling is used when the researcher is working with a “skewed” population divided into strata and wishes to achieve high statistical effi ciency.
Our area sampling example uses subdivisions as clusters.
© L
ee P
rinc
e/S
hutt
erst
ock
M09_BURN3261_08_GE_C09.indd 250M09_BURN3261_08_GE_C09.indd 250 17/08/16 4:03 pm17/08/16 4:03 pm

9-4 PROBABILITY SAMPLING METHODS 251
than do sophomores, and so on. At the same time, you would expect that seniors would be
more in agreement (have less variability) than would underclass students. This belief is due to
the fact that freshmen are students who are trying out college, some of whom are not serious
about completing it and do not value it highly but some of whom are intending to become
doctors, lawyers, or professionals whose training will include graduate degree work as well
as their present college studies. The serious freshmen students would value a college degree
highly, whereas their less serious peers would not. Thus, we would expect much variability
in the freshmen students, less in sophomores, still less in juniors, and the least with seniors.
The situation might be something similar to the distributions illustrated in Figure 9. 2 . Note
that this fi gure portrays the four class strata distributions as normal curves, whereas the entire
college population of all four classes is a skewed curve.
With stratifi ed random sampling, one takes a skewed population and identifi es the sub-
groups, or strata , contained within it. Simple random sampling, systematic sampling, or some
other type of probability sampling procedure is then applied to draw a sample from each stra-
tum because we typically believe that the individual strata have bell-shaped distributions. In
other words, it is a “divide and conquer” approach to sampling.
Accuracy of Stratifi ed Sampling How does stratifi ed sampling result in a more accurate
overall sample? This accuracy is achieved in two ways. First, stratifi ed sampling allows for
explicit analysis of each stratum. Our college degree example ( Figure 9. 2 ) illustrates why a
researcher would want to know about the distinguishing diff erences between the strata to as-
sess the true picture. Each stratum represents a diff erent response profi le, and by recognizing
this, stratifi ed sampling is a more accurate sample design.
Second, there is a procedure that allows the estimation of the overall sample mean by use
of a weighted mean , whose formula takes into consideration the sizes of the strata relative to
the total population size and applies those proportions to the strata’s means. The population
mean is calculated by multiplying each stratum by its proportion and summing the weighted
1Not at All
“To what extent do you value a college degree?”
Key:F FreshmenS SophomoresJr JuniorsSr Seniors
2
F S Jr Sr
FreshmenMean
Population
3 4 5Very Highly
SophomoresMean
JuniorsMean
SeniorsMean
FIGURE 9. 2 Four Strata in the Population of a College’s Students
M09_BURN3261_08_GE_C09.indd 251M09_BURN3261_08_GE_C09.indd 251 17/08/16 4:03 pm17/08/16 4:03 pm

252 CHAPTER 9 • SELECTING THE SAMPLE
stratum means. This formula results in an estimate that is consistent with the true distribution
of the population. This formula is used for two strata:
Formula for weighted mean
Meanpopulation = (meanA)(proportionA) + (meanB)(proportionB)
where A signifi es stratum A , and B signifi es stratum B .
Here is an example of the use of a weighted mean. A researcher separates a popula-
tion of households that rent movies on a regular basis into two strata. Stratum A is families
without young children, and stratum B is families with young children. When asked to use
a scale of 1 = Poor, 2 = Fair, 3 = Good, 4 = Very good, and 5 = Excellent to rate Netfl ix on
its movie selection, the means were computed to be 2.0 (Fair) for the families with young
children (stratum B ) sample and 4.0 (Very good) for the families without young children
(stratum A ) sample. The researcher knows from census information that families without
young children account for 70% of the population, whereas families with young children
account for the remaining 30%. The weighted mean rating for Netfl ix’s movie selection
is then computed as (.7)(2.0) + (.3)(4.0) = 2.6 (between fair and good in this fi ctitious
example).
How to Apply Stratifi ed Sampling Marketing researchers fi nd stratifi ed sampling es-
pecially useful when they encounter skewed populations. Prior knowledge of populations
under study, augmented by research objectives sensitive to subgroupings, sometimes reveals
that the population is not normally distributed. Under these circumstances, it is advanta-
geous to apply stratifi ed sampling to preserve the diversity of the various subgroups. Usu-
ally, a surrogate measure , which is some observable or easily determined characteristic
of each population member, is used to help partition or separate the population members
into their various subgroupings. For example, in the instance of the college, the year clas-
sifi cation of each student is a handy surrogate. Researchers may divide the population into
as many relevant strata as necessary to capture diff erent subpopulations. For instance, the
college might want to further stratify on college of study or grade-point average (GPA)
ranges. Perhaps professional school students value their degrees more than do liberal arts
students or high GPA students more than average GPA or failing students. The key issue
is that researchers should use some basis for dividing the population into strata that results
in diff erent responses across strata. Also, there should be some logic or usefulness to the
stratifi cation system.
If the strata sample sizes are faithful to their relative sizes in the population, the
research design refl ects a proportionate stratifi ed sample . Here you do not need to use the
weighted formula because each stratum’s weight is automatically accounted for by its sam-
ple size. But think for a moment about proportionate sampling: It erroneously assumes that
the variability of each stratum is related to its size. Larger strata have more variability than
small ones, but a large stratum could be composed of homogeneous individuals, translating
to a relatively small stratum sample size, while a small stratum could be composed of very
diff erent individuals, translating to a relatively large stratum sample size. As a result, some
researchers opt to use the stratum relative variability rather than the relative size as a factor
in deciding stratum sample size. That is, if a stratum has low variability, precise estimates of
that stratum may be obtained with a small sample size, and the “extra” sample saved could
be allocated to strata with high variance. This provides for statistical effi ciency , meaning
for the same sample size researchers may obtain equivalent precision among the strata. This
approach is called disproportionate stratifi ed sampling , and a weighted formula needs to
be used because the strata sizes do not refl ect their relative proportions in the population.
We have provided a step-by-step description of stratifi ed sampling in Marketing Research
Insight 9. 6 .
A stratifi ed sample may require the calculation of a weighted mean to achieve accuracy.
To learn about stratifi ed sampling, launch www.
youtube.com and search for “Stratifi ed Sampling by Steve Mays.”
Researchers should select a basis for stratifi cation that reveals different responses across the strata.
IBM SPSS Student Assistant About your IBM SPSS Student Assistant
M09_BURN3261_08_GE_C09.indd 252M09_BURN3261_08_GE_C09.indd 252 17/08/16 4:03 pm17/08/16 4:03 pm

9-5 NONPROBABILITY SAMPLING METHODS 253
9- 5 Nonprobability Sampling Methods All of the sampling methods we have described thus far embody probability sampling
assumptions. In each case, the probability of any unit being selected from the population
into the sample is known, even though it cannot be calculated precisely. The critical diff er-
ence between probability and nonprobability sampling methods is the mechanics used in the
sample design. With a nonprobability sampling method, selection is not based on chance or
randomness. Instead, a nonprobability sample is based on an inherently biased selection pro-
cess, typically to reduce the cost of sampling. 17 With a nonprobability sample, the researcher
has some savings in cost and/or time but at the expense of using a sample that is not truly rep-
resentative of the population. 18 There are four nonprobability sampling methods: convenience
samples, purposive samples, referral samples, and quota samples ( Table 9. 2 ). A discussion of
each method follows.
Convenience Samples Samples drawn from groups to which the researcher has easy
access are called convenience samples . Typically, the most convenient areas to a researcher
in terms of reduced time and eff ort turn out to be high-traffi c areas, such as shopping malls
or busy pedestrian intersections. The selection of the place and, consequently, prospective
respondents is subjective rather than objective. Certain members of the population are auto-
matically eliminated from the sampling process. 19 For instance, people who may be infre-
quent visitors or even nonvisitors of the particular high-traffi c area being used would not be
included. In the absence of strict selection procedures, some members of the population may
be omitted because of their physical appearance, general demeanor, or the fact that they are
in a group rather than alone. One author states, “Convenience samples … can be seriously
misleading.” 20
It should be obvious that mall-intercept companies use convenience sampling to recruit
respondents. For example, shoppers are encountered at large shopping malls and quickly
qualifi ed with screening questions. For those satisfying the desired population characteristics,
a questionnaire may be administered or a taste test performed. Alternatively, the respondent
How to Take a Stratifi ed Sample Step 1: Be certain that the population’s distribution for
some key factor is not bell-shaped and that separate subpopulations exist.
Example: Condominium owners differ from apart-ment dwellers in their homeowners’ insurance needs, so stratify by condo ownership and apart-ment dwelling.
Step 2: Use this factor or some surrogate variable to divide the population into strata consistent with the sepa-rate subpopulations identifi ed.
Example: Use a screening question on condo ownership/apartment dwelling. This may require a screening survey using random digit dialing to iden-tify respondent pools for each stratum.
Step 3: Select a probability sample from each stratum. Example: Use a computer to select simple random samples for each stratum.
Step 4: Examine each stratum for managerially relevant differences.
Example: Do condo owners differ from apartment dwellers in the value of the furniture they own (and needs to be covered by insurance)? Answer: Condo owners average $15,000 in owned furniture value; apartment dwellers average $5,000 in owned fur-niture value.
Step 5: If stratum sample sizes are not proportionate to the stratum sizes in the population, use the weighted mean formula to estimate the population value(s).
Example: If condo owners are 30% and apartment dwellers are 70% of the population, the estimate of the average is ($15,000)(.30) + ($5,000)(.70) = $8,000 owned furniture value.
MARKETING RESEARCH INSIGHT 9. 6 Practical Application
With nonprobability
sampling, there is a
good possibility that
nonrepresentative sample
units will be selected.
(New Orleans Saints fan
Scott McGowan, dressed
as the Joker.)
With nonprobability sampling methods, some members of the population do not have any chance of being included in the sample.
© J
ulia
Mor
gan
Phot
ogra
phy
M09_BURN3261_08_GE_C09.indd 253M09_BURN3261_08_GE_C09.indd 253 17/08/16 4:03 pm17/08/16 4:03 pm

254 CHAPTER 9 • SELECTING THE SAMPLE
may be given a test product and asked if he or she would use it at home. A follow-up tele-
phone call some days later solicits his or her reaction to the product’s performance. In this
case, the convenience extends beyond easy access of respondents into considerations of setup
for taste tests, storage of products to be distributed, and control of the interviewer workforce.
Additionally, large numbers of respondents can be recruited in a matter of days. The screening
questions and geographic dispersion of malls may appear to reduce the subjectivity inherent
TABLE 9. 2 Four Types of Nonprobability Sampling Methods
Convenience Sampling The researcher or interviewer uses a high-traffi c location, such as a busy pedestrian area or a shop-
ping mall, as the sample frame from which to intercept potential respondents. Sample frame error
occurs in the form of members of the population who are infrequent users or nonusers of that loca-
tion. Other error may result from any arbitrary way the interviewer selects respondents from the
sample frame.
Purposive Sampling The researcher uses his or her judgment or that of some other knowledgeable person to identify who
will be in the sample. Subjectivity and convenience enter in here; consequently, certain members of
the population will have a smaller chance of selection than will others.
Chain Referral Sampling Respondents are asked for the names or identities of others like themselves who might qualify to
take part in the survey. Members of the population who are less well known or disliked or whose
opinions confl ict with the selected respondents have a low probability of being selected.
Quota Sampling The researcher identifi es quota characteristics, such as demographic or product use factors, and uses
these to set up quotas for each class of respondent. The sizes of the quotas are determined by the
researcher’s belief about the relative size of each class of respondent in the population. Often, quota
sampling is used as a means of ensuring that convenience samples will have the desired proportion
of diff erent respondent classes.
Active Learning
Assess the Representativeness of Various Convenience Samples
Suppose the Athletic Department at your university is disappointed about student atten-dance of its “minor” collegiate sports events such as wrestling, cross country, and softball. The athletic director wants to learn why students do not attend these events. Listed here are possible locations for a convenience sample. Indicate what types of students would be over-represented in the sample and what types would be underrepresented versus the population of students at your university for each case.
Convenience sample locationWhat students would be overrepresented?
What students would be underrepresented?
The University Recreation Center
The University Commons
The Library
Physics 401 (Advanced class for physics majors)
Mall intercepts are convenience samples.
Convenience samples may misrepresent the population.
To learn about nonprobabil-ity sampling methods,
launch www.youtube.com and search for “Sampling 06: Non-Probability Sampling.”
M09_BURN3261_08_GE_C09.indd 254M09_BURN3261_08_GE_C09.indd 254 17/08/16 4:03 pm17/08/16 4:03 pm

9-5 NONPROBABILITY SAMPLING METHODS 255
in the sample design, but in fact the vast majority of the population was not there and could
not be approached to take part. There are ways of reducing convenience sample selection
error using a quota system, which we discuss shortly.
Purposive Samples Unlike convenience samples, purposive samples require a
judgment or an “educated guess” as to who should represent the population. Often the
researcher or some individual helping the researcher who has considerable knowledge about
the population will choose the types of individuals whom he or she feels constitute the sam-
ple. This practice is sometimes called a judgment sample or an exemplar sample . It should
be apparent that purposive samples are highly subjective and, therefore, prone to much
error.
Focus group studies use purposive sampling rather than probability sampling. In a
recent focus group concerning the likely demand for low-fat, nutritious snacks, 12 moth-
ers of preschool children were selected as representative of the present and prospective
market. Six of the women also had school-age children, while the other six had only
preschoolers. That is, the researcher purposely included the two types of focus group
participants because in his judgment, these 12 women represented the population ade-
quately for the purposes of the research. It must be quickly pointed out, however, that
the intent of this focus group was far diff erent from the intent of a survey. Consequently,
the use of a purposive sample was considered satisfactory for this particular phase in the
research process for the snacks. The focus group fi ndings served as the foundation for a
large-scale regional survey conducted two months later that relied on a probability sam-
pling method.
As you would expect, there are grave ethical considerations attached to sample method
decisions in marketing research. The relevant sections in the Marketing Research Asso-
ciation (MRA) Code of Ethics that pertain to sample methods are presented in Marketing
Research Insight 9. 7 . The MRA states that researchers must explain sample methods to
clients and disclose sample information such as the sample frame, sample method used,
sample size, and sample error. Sample size and sample error is treated in the next chapter
of your textbook.
With a purposive sample, one “judges” the sample to be representative.
Marketing Research Association Code of Ethics: Sampling Method 30. Offer guidance to clients as to the appropriate-
ness of the methodology being employed and sample selected to the fullest extent possible on each project. Laypersons often do not have the necessary knowledge or experience to conduct research or to properly interpret data and recommend courses of action based upon that interpretation. Members must educate clients and the public in the proper methods and execution of marketing research, and use of research fi ndings. When researchers are made aware of instances in which clients are improp-erly interpreting or otherwise using research, a profes-sional duty exists to advise the errant party in the proper understanding or application of the data.
39. Provide appropriate disclosure of methods for all research released for public or media consumption. Disclosure of methods statements as appropriate to include:
• The method of data collection used• The date(s) of data collection• The sampling frame• The sampling method• The sample size• The calculated margin of sampling error
Source: Used courtesy of the Marketing Research Association.
MARKETING RESEARCH INSIGHT 9. 7 Ethical Consideration
M09_BURN3261_08_GE_C09.indd 255M09_BURN3261_08_GE_C09.indd 255 17/08/16 4:03 pm17/08/16 4:03 pm

256 CHAPTER 9 • SELECTING THE SAMPLE
Chain Referral Samples Sometimes called “snowball samples,” chain referral samples
require respondents to provide the names of prospective respondents. Such samples begin
when the researcher compiles a short list of possible respondents that is smaller than the total
sample he or she desires for the study. After each respondent is interviewed, he or she is que-
ried about the names of other possible respondents. 21 In this manner, additional respondents
are referred by previous respondents. Or, as the informal name implies, the sample grows just
as a snowball grows when it is rolled downhill. Some researchers call these simply “referral
samples.”
Chain referral samples are most appropriate when there is a limited or disappointingly
short sample frame and when respondents can provide the names of others who would qualify
for the survey. The nonprobability aspects of referral sampling come from the selectivity used
throughout. The initial list may also be special in some way, and the primary means of adding
people to the sample is by tapping the memories of those on the original list. While they rely
heavily on social networks, 22 referral samples are often useful in industrial marketing research
situations. 23
Quota Samples When a researcher specifi es percentages of the total sample for various
types of individuals to be interviewed and selects them via nonprobability sampling, it is
termed a quota sample . In other words, the researcher identifi es groups in the popula-
tion and sets the number of respondents (percentage of the fi nal sample) for each group.
Respondents are selected with convenience, purposive, referral, or some other nonprob-
ability sampling method. For example, a researcher may desire the sample to be 50% males
and 50% females. As we indicated earlier, quota samples are commonly used by marketing
researchers who rely on mall intercepts, a convenience sample method. The quotas are
determined through application of the research objectives and are defi ned by key charac-
teristics used to identify the population. In the application of quota sampling, a fi eldworker
is provided with screening criteria that will classify the potential respondent into a par-
ticular quota group. For example, if the interviewer is assigned to obtain a sample quota
of 50 each for black females, black males, white females, and white males, the qualifying
characteristics would be race and gender. If our fi eldworkers were assigned mall intercepts,
each would determine through visual inspection where the prospective respondent falls
and work toward fi lling the quota in each of the four groups. When based on the actual
proportions of the various groups in the population, a quota system may reduce some of the
nonrepresentativeness inherent in nonprobability samples, but it does not ensure a random
sample.
Quota samples are best used by companies that have a fi rm grasp on the features charac-
terizing the individuals they wish to study in a particular marketing research project. A large
bank, for instance, might stipulate that the fi nal sample be one-half adult males and one-half
adult females because in the bank’s understanding of its market, the customer base is equally
divided between males and females. When done conscientiously and with a fi rm understand-
ing of the population’s characteristics, quota sampling can rival probability sampling in the
minds of researchers.
9- 6 Online Sampling Techniques Sampling for Internet surveys poses special opportunities and challenges, but most of these
issues can be addressed in the context of our probability and nonprobability sampling con-
cepts. 24 The trick is to understand how the online sampling method in question works and
to interpret the sampling procedure correctly with respect to basic sampling concepts. 25
Unfortunately, these sampling procedures are often “behind the scenes” or not obvious
until one delves into the mechanics of the sample selection process. Basically, three types
A chain referral sample asks respondents to provide the names of additional respondents.
Quota samples rely on key characteristics to defi ne the composition of the sample.
Quota samples are appropriate when researchers have a detailed demographic profi le of the population on which to base the sample.
IBM SPSS Student Assistant IBM SPSS Quick Tour: Part I
M09_BURN3261_08_GE_C09.indd 256M09_BURN3261_08_GE_C09.indd 256 17/08/16 4:03 pm17/08/16 4:03 pm

9-7 DEVELOPING A SAMPLE PLAN 257
of samples are used with online surveys: (1) online panels, (2) river samples, and (3) list
samples.
ONLINE PANEL SAMPLES Online panel samples , as we have described and alluded to in various places in this
text book , are comprised of individuals who have agreed to participate in online surveys.
Normally, they have registered with a panel company and have agreed to participate in sur-
veys with some sort of compensation, such as points that can be redeemed for products and
services. Panel members have divulged large amounts of information about themselves to
the panel company, so it is easy for the company to select panelists who satisfy population
membership criteria specifi ed by clients, such as age range, education level, and household
size. Panel companies have hundreds of thousands of prospective respondents, and they
select them based on any such criteria and/or sampling requirements specifi ed by their cli-
ents. Panel companies are especially adept at delivering “targeted samples” because they
have huge databases of information regarding demographics, possessions, lifestyle, medi-
cal ailments, and so on that can be used to select panel members to be survey respondents.
Online panel samples are popular, but there are lingering concerns about the true repre-
sentativeness of samples provided by panel companies because their sample frames are
imperfect.
RIVER SAMPLES A river sample is created via the use of banners, pop-ups, or other online devices that invite
website visitors to take part in the survey. The “river” is the steady stream of website visi-
tors, and these invitations fi guratively dip respondents out of the Internet river. Of course,
the online questionnaire may have screening questions so that only qualifi ed prospects are
allowed to take part in the survey. The sample frame of a river sample is the stream of visi-
tors visiting the site issuing the invitation, and river samples are considered random samples
of these sample frames as long as the invitations are not unusual in duration, appearance, or
relevance.
EMAIL LIST SAMPLES Email list samples are those purchased or otherwise procured from someone or some
company that has compiled email addresses of opt-in members of the population of inter-
est. The vendor company can pull random samples and may have the ability to satisfy
selection criteria specifi ed by the client company. The list company may sell the list, or
it might issue email invitations to maintain the propriety of email addresses on the list.
Obviously, the master source list is the sample frame, so if the list company has been
diligent, the email list sample will be a good representation of the population. However,
if the list company has not done due diligence, there will be sample frame error in the
email list.
9- 7 Developing a Sample Plan Up to this point, we have discussed various aspects of sampling as though they were
discrete and seemingly unrelated decisions. However, they are logically joined in a defi -
nite sequence of steps, called the sample plan , which the researcher goes through to
draw and ultimately arrive at the fi nal sample. 26 These steps are listed and described
in Table 9. 3 .
Online samples include online panel samples, river samples, and email list samples.
IBM SPSS Student Assistant IBM SPSS Quick Tour: Part II
A sample plan lists all the steps necessary to draw a sample.
M09_BURN3261_08_GE_C09.indd 257M09_BURN3261_08_GE_C09.indd 257 17/08/16 4:03 pm17/08/16 4:03 pm

258 CHAPTER 9 • SELECTING THE SAMPLE
Summary
Sampling methods facilitate marketing research with-
out requiring a census of an entire population. Market-
ing researchers aim to avoid sample frame error, which
includes omissions and inaccuracies that will adversely
aff ect the sample drawn from it.
A sample is taken because it is too costly to perform
a census and there is suffi cient information in a sample
to allow it to represent the population. We described four
probability sampling methods in which there is a known
chance of a member of the population being selected into
the sample. Simple random sampling uses devices or aids,
such as random numbers, to ensure that every member of
the population has the same chance of being selected into
the sample. Systematic sampling uses a random starting
point and “skips” through a list. Cluster sampling can be
applied to areas such as subdivisions so that only a few
areas are selected and canvassed or sampled. Stratifi ed
sampling is used when diff erent strata are apparent in the
population and each stratum is randomly sampled.
We also described four nonprobability sampling
methods that contain bias because all members of the
population do not have a fair chance of being selected
into the sample. Convenience sampling uses high-traffi c
locations, such as shopping malls, to make it easy for an
interviewer to intercept respondents. Purposive sampling
rests on someone’s subjective judgment as to who should
be in the sample. Chain referral sampling relies on respon-
dents to give up names of friends to be asked to take part
in the survey, and quota sampling is convenience sampling
with quotas or limits on the numbers of respondents with
specifi c characteristics. With the popularity of online sur-
veys, online samples provided by panel companies, river
samples that tap into the stream of online visitors to a web-
site, and email samples are common. With knowledge of
the sample method specifi cs, a researcher can assess the
degree to which an online sample embodies random sam-
pling requirements.
Finally, we described six steps needed to develop a
sample plan: (1) defi ne the relevant population, (2) obtain a
sample frame, (3) decide on the sample method, (4) decide
on the sample size, (5) draw the sample, and (6) validate
the sample.
TABLE 9. 3 Steps in a Sample Plan
Step Action Description
1 Defi ne the population. Create a precise description of the group under investiga-
tion using demographics, buyer behavior, or other relevant
constructs.
2 Obtain a sample frame. Gain access to some master source that uniquely identifi es
all the units in the population with minimal sample frame
error.
3 Decide on the sample method. Based on survey objectives and constraints, endeavor to
select the best probability sample method, or alternatively,
if appropriate, select the best nonprobability sample method.
4 Decide on the sample size. If a probability sampling plan is selected, use a formula ;
to be covered in the following chapter .
5 Draw the sample. Using the chosen sample method, apply the necessary steps
to select potential respondents from the sample frame.
6 Validate the sample. Inspect some relevant characteristics of the sample
(such as distribution of males and females, age ranges,
etc.) to judge how well it matches the known distribution
of these characteristics in the population.
Learn about the sample plan by going to www.youtube.com
and searching for “Developing a Sampling Plan.”
Key Terms
Population (p. 238 )
Census (p. 238 )
Sample (p. 239 )
Sample unit (p. 239 )
Sample frame (p. 239 )
Sample frame error (p. 239 )
Sampling error (p. 240 )
Probability samples (p. 241 )
Nonprobability samples (p. 241 )
M09_BURN3261_08_GE_C09.indd 258M09_BURN3261_08_GE_C09.indd 258 17/08/16 4:03 pm17/08/16 4:03 pm

REVIEW QUESTIONS/APPLICATIONS 259
Simple random sampling (p. 242 )
Random device method (p. 242 )
Blind draw (p. 243 )
Random numbers (p. 244 )
Random digit dialing (RDD) (p. 245 )
Plus-one dialing procedure (p. 245 )
Systematic sampling (p. 246 )
Skip interval (p. 246 )
Cluster sampling (p. 248 )
Area sampling (p. 249 )
One-step area sample (p. 249 )
Two-step area sample (p. 249 )
Stratifi ed sampling (p. 250 )
Skewed population (p. 250 )
Strata (p. 251 )
Weighted mean (p. 251 )
Surrogate measure (p. 252 )
Proportionate stratifi ed sample
(p. 252 )
Statistical effi ciency (p. 252 )
Disproportionate stratifi ed sampling
(p. 252 )
Convenience samples (p. 253 )
Purposive samples (p. 255 )
Chain referral samples (p. 256 )
Quota sample (p. 256 )
Online panel sample (p. 257 )
River sample (p. 257 )
Email list samples (p. 257 )
Sample plan (p. 257 )
Review Questions/Applications
9- 1. Distinguish a nonprobability from a probability sam-
pling method. Which one is the preferable method
and why? Indicate the pros and cons associated with
probability and nonprobability sampling methods.
9- 2. Why is a sample more desirable than a census? What
are some of the reasons for taking a sample?
9- 3. Name and explain four popular types of probability
sampling methods and describe the advantages of
each of these methods.
9- 4. Briefl y describe the steps of a sample plan.
9- 5. Why is probability sampling widely preferred? To
what situations, if any, is non-probability sampling
better suited?
9- 6. Diff erentiate one-step from two-step area sampling
and indicate when each one is preferred.
9- 7. What is a weighted mean? How can it be used?
9- 8. How can the challenges of sampling for Internet sur-
veys be addressed?
9- 9. What is the diff erence between a convenience sample
and a purposive sample?
9- 10. Why is quota sampling often used with a conve-
nience sampling method such as mall intercepts?
9- 11. Provide the marketing researcher’s defi nitions for
each of the following populations:
a. Nest Thermostat, a company that sells a home
thermostat that runs on the Internet of Things,
wants to determine interest in an entry cam-
era that activates with motion anytime someone
enters a dwelling via the front door.
b. The manager of your student union is interested
in determining if students desire a “universal”
debit ID card that will be accepted anywhere on
campus and in many stores off campus.
c. Joy Manufacturing Company decides to conduct a
survey to determine the sales potential of a new type
of air compressor used by construction companies.
9- 12. Here are four populations and a potential sample
frame for each one. With each pair, identify (1) mem-
bers of the population who are not in the sample
frame and (2) sample frame items that are not part of
the population. Also, for each one, would you judge
the amount of sample frame error to be acceptable or
unacceptable?
Population Sample Frame
a. Buyers of Scope
mouthwash
Mailing list of Consumer Reports subscribers
b. Subscribers to SiriusXM
satellite radio
State registration records of new
automobile buyers
c. Prospective buyers
of a new client and
prospective client’s
tracking software product
Members of Sales and
Marketing Executives
International (a national
organization of sales managers)
d. Users of weatherproof
decking materials (to
build outdoor decks)
Individuals’ names registered at
a recent home and garden show
9- 13. A market researcher is proposing a survey for the
Big Tree Country Club, a private country club that
is contemplating several changes in its layout to
make the golf course more championship caliber.
The researcher is considering three diff erent sample
designs as a way to draw a representative sample
of the club’s golfers. The three alternative designs
include the following:
a. Station an interviewer at the fi rst hole tee on one
day chosen at random, with instructions to ask
every 10th golfer to fi ll out a self-administered
questionnaire.
b. Put a stack of questionnaires on the counter where
golfers check in and pay for their golf carts with
a sign above the questionnaires off ering an incen-
tive for a “free dinner in the clubhouse” for three
M09_BURN3261_08_GE_C09.indd 259M09_BURN3261_08_GE_C09.indd 259 30/08/16 9:45 am30/08/16 9:45 am

260 CHAPTER 9 • SELECTING THE SAMPLE
players who fi ll out the questionnaire and whose
names are selected by a lottery.
c. Use the city telephone directory to conduct a
plus-one dialing procedure. With this procedure,
a random page in the directory would be selected,
and a name on that page would be selected, both
using a table of random numbers. The plus-one
system would be applied to that name and every
name listed after it until 1,000 golfers are identi-
fi ed and interviewed by telephone.
Assess the representativeness and other issues
associated with this sample problem. Be sure to iden-
tify the sample method being contemplated in each
case. Which sample method do you recommend
using and why?
9- 14. A researcher has the task of estimating how many
units of a revolutionary new high-speed offi ce copier
machine (it does not require ink cartridges and it
is guaranteed not to jam) will be purchased among
businesses in Cleveland, Ohio, for the coming annual
sales forecast. Her plan is to ask the likelihood that
they will purchase the new device, and for those who
are “very likely” to purchase, she wants respondents
to estimate how many machines their company will
buy. She has data to divide the companies into small,
medium, and large fi rms based on number of employ-
ees at the Cleveland offi ce.
a. What sampling plan should be used?
b. Why?
9- 15. Honda USA is interested in learning what its 550
U.S. dealers think about a new service program the
carmaker provided to dealers at the beginning of last
year. Honda USA wants to know if the dealers are
using the program and, if so, their likes and dislikes
about it. The carmaker does not want to survey all
550 dealers but hopes to ensure that the results are
representative of all dealers.
a. What sampling plan should be used?
b. Why?
9- 16. Applebee’s Restaurants has spent several tens of
thousands of dollars advertising the restaurant dur-
ing the last two years. Marketing executives want to
measure what eff ect the advertising has had, and they
decide to measure top-of-mind awareness (TOMA).
A TOMA score for such a restaurant is the ranking a
fi rm has as a result of asking a representative sample
of consumers in the service area to “name a non-fast-
food restaurant.” The restaurant that is named by the
most persons has the top TOMA score. It is impor-
tant that Applebee’s management conduct the TOMA
survey on a representative sample in the metropolitan
area.
a. What sampling plan should be used?
b. Why?
9- 17. Belk has a chain of department stores across the
South. Top management requires that each store
manager collect, maintain, and respond to customer
complaints (emails, letters, calls, etc.). Each store
manager is supposed to keep a list of complaints that
have been received. Top management is considering
establishing a more formalized method of monitor-
ing and evaluating the responses managers give to the
complaints. They want some information that will tell
them whether they need to develop such a formalized
program or whether they can leave well enough alone
and allow managers to use their discretion in handling
the complaints. They want to review a sample of these
complaints and the responses to them.
a. What sampling plan should be used?
b. Why?
Located on the outskirts of a large city, the suburb of
Peaceful Valley comprises approximately 6,000 upscale
homes. The subdivision came about 10 years ago when a
developer built an earthen dam on Peaceful River and cre-
ated Peaceful Lake, a meandering 20-acre body of water.
The lake became the centerpiece of the development, and
the fi rst 1,000 half-acre lots were sold as lakefront property.
Now Peaceful Valley is fully developed with 50 streets,
all approximately the same length with about 120 houses
on each street. Peaceful Valley’s residents are primarily
young, professional, dual-income families with one or two
school-age children.
Peaceful Valley has not been living up to its name in
recent months. The Suburb Steering Committee has recom-
mended that the community build a swimming pool, tennis
court, and meeting room facility on four adjoining vacant
lots in the back of the subdivision. Construction cost es-
timates range from $2.5 million to $3 million, depending
on the size of the facility. Currently, every Peaceful Val-
ley homeowner is billed $250 annually for maintenance,
security, and upkeep of the development. About 75% of
residents pay this fee. To fi nance the proposed recreational
facility, every Peaceful Valley household would be ex-
pected to pay a one-time fee of $1,500, and annual fees
CASE 9. 1
Peaceful Valley Subdivision: Trouble in Suburbia
M09_BURN3261_08_GE_C09.indd 260M09_BURN3261_08_GE_C09.indd 260 17/08/16 4:03 pm17/08/16 4:03 pm
would increase to $500 based on facility maintenance cost
estimates.
Objections to the recreational facility come from vari-
ous quarters. For some, the one-time fee is unacceptable;
for others, the notion of a recreational facility is not appeal-
ing. Some residents have their own swimming pools, be-
long to local tennis clubs, or otherwise have little use for a
meeting room facility. Other Peaceful Valley homeowners
see the recreational facility as a wonderful addition where
their children could learn to swim, play tennis, or just hang
out under supervision.
The president of the Peaceful Valley Suburb Associa-
tion has decided to conduct a survey to poll the opinions
and preferences of Peaceful Valley homeowners regarding
the swimming pool, tennis court, and meeting room facility
concept. Review the following possible sample methods.
Indicate your reactions and answers to the questions asso-
ciated with each possible method.
1. There is only one street into and out of the subdivision.
The president is thinking of paying his teenage daughter
to stand at the stop light at the entrance to Peaceful Val-
ley next week between the hours of 7:00 and 8:30 a.m.
to hand out questionnaires to exiting drivers while they
wait for the red light to change. The handouts would
include addressed, postage-paid envelopes for returns.
Identify what sample method the president would be
using, list its pros and cons, and indicate how represen-
tative a sample would result.
2. The chairperson of the Suburb Steering Committee
thinks the 1,000 homeowners whose houses are on the
waterfront properties of Peaceful Lake are the best ones
to survey because they paid more for their lots, their
houses are bigger, and they tend to have lived in Peace-
ful Valley longer than other residents. If these 1,000
homeowners are used for the sample, what sample
method would be involved, what are its pros and cons,
and how representative a sample would result?
3. Assume that the Steering Committee chairperson’s
point that the 1,000 waterfront owners are not the
same as the other 5,000 Peaceful Valley Subdivision
homeowners is true. How should this fact be used to
draw a representative sample of the entire subdivision?
Identify the probability sampling method that is most
appropriate, and indicate, step by step, how it should be
applied here.
4. How would you select a simple random sample of
those Peaceful Valley homeowners who paid their
subdivision association dues last year? What, if any,
sample bias might result from this approach?
5. How could a two-step cluster sample be used here?
Identify this sample method and describe how it could
be used to select a representative sample of Peaceful
Valley households.
Jetadiah Brown wants to establish a pet store called Jet’s
Pets. Jet thinks there is an opportunity on the north side of
the city because he knows that many new subdivisions have
been built, and many families have bought homes there.
Plus, he knows there are no pet stores located on the north
side. This growth in the number of families and the lack of
competitors strongly suggest a marketing opportunity for
Jet’s Pets.
Jet wants to survey the approximately 10,000 families in
two ZIP code areas. Of course, he cannot survey all of them,
so he must use a sample. For each of the following possible
ways of selecting a sample of the families living in several
subdivisions in two ZIP code areas: (1) identify the type of
sample method; (2) identify the sample frame; (3) indicate
what, if any, sample frame error there is; and (4) indicate the
degree to which the resulting sample will be representative
of all families living in the two ZIP code areas.
1. Place questionnaires in veterinarian clinics located
in the two ZIP code areas for pet owners to fi ll out
while they are waiting for the doctor to examine
their pet.
2. Select every 100th name in the city telephone book;
call and interview only those who live in the two ZIP
code areas.
3. Use a random number system to select a single sub-
division located somewhere in the two ZIP code areas,
and then place questionnaires in the mailboxes of every
home in that selected subdivision.
4. Announce in the local newspaper a “Cutest Dog Con-
test” with contestants sending in a photo and address
information. Use the contestants who live in the two
ZIP code areas as the sample.
5. Go to the local animal shelter and get the addresses
of the past pet adopters who live in the two ZIP code
areas. Send a mail survey to the nearest neighbor’s
address for each of the addresses obtained from the
animal shelter. For example, if the adopter lives at
1 Green Street, send the mail questionnaire to the
occupants at 2 Green Street.
CASE 9. 2
Jet’s Pets
REVIEW QUESTIONS/APPLICATIONS 261
M09_BURN3261_08_GE_C09.indd 261M09_BURN3261_08_GE_C09.indd 261 17/08/16 4:03 pm17/08/16 4:03 pm

▶
LEARNING OBJECTIVES In this chapter you will learn:
10- 1 Several axioms about sample size
10- 2 What it means to compute sample size using the confi dence interval method
10- 3 How to compute sample size using the sample size formula
10- 4 Practical considerations in sample size determination
10- 5 Other methods of sample size determination and reasons why most of them are undesirable
10- 6 Three sample size determination special situations: sampling small populations, using nonprobability sample methods, and using a panel company
“WHERE WE ARE”
1 Establish the need for marketing
research.
2 Defi ne the problem.
3 Establish research objectives.
4 Determine research design.
5 Identify information types and
sources.
6 Determine methods of accessing data.
7 Design data collection forms.
8 Determine the sample plan and size .
9 Collect data.
10 Analyze data.
11 Prepare and present the fi nal
research report.
Lucid
Patrick Comer (CEO) and Brett
Schnittlich (CTO) fi rst envisioned
Lucid on a Las Feliz, California,
porch in the mid-2000s. The buy-
ing and selling of surveys, or
“sample,” had not yet grown into
the Internet age. The opportunity
was ripe to develop an automated
online exchange, similar to the
programmatic exchanges that transformed the advertising industry. The
shift to online exchange would bring the sample business off of telephones
and onto the Internet, increasing quality and effi ciency—what used to take
weeks could be fi nished like magic, in hours, for a fraction of the cost.
In 2010, Comer founded Federated Sample. The company raised
a modest amount of funds and utilized profi ts from Federated Sample’s
services team to build out its Fulcrum software. Fulcrum quickly grew
into the vision of its founders: a highly scalable SaaS business and the
industry’s fi rst programmatic exchange. By mid-2015, nearly 6 billion
questions had been answered, over 125 million unique visitors had com-
pleted a survey, and over $200 million of sample had been sold on the
platform. By early 2015, Federated Sample had outgrown its name. It
had matured into a technology company more aptly described as “soft-
ware” than sample. Massive amounts of unique visitors and completed
surveys had created a gold mine of data to power ventures outside of
sample’s confi nes but within market research’s standards.
On August 19, 2015, Federated Sample became Lucid. The
rebranding was more than a name change—it refl ected a paradigm shift
for the company. Now no longer a start-up, Lucid is a diversifying tech-
nology company in the market research space that is bent on perpetuat-
ing the signifi cant growth of its fi rst fi ve years. All Lucid’s efforts center
10 Determining the Size of a Sample
Patrick Comer, founder and CEO,
Lucid
M10_BURN3261_08_GE_C10.indd 262M10_BURN3261_08_GE_C10.indd 262 30/08/16 9:53 am30/08/16 9:53 am

263
on the alchemy of extracting clarity from chaos, as did the Fulcrum platform that started
it all. The revamped brand tells the company’s whole story: Lucid’s mission is to bring
transparency, clarity, and a touch of magic to the market research industry.
Source: Text and photos courtesy of Patrick Comer and Lucid.
RIWI Corp.
RIWI CEO Neil Seeman thought outside the box to create an innovative solu-
tion to an existing and recurring problem in the world of market research.
The technology he invented was initially applied at the University of Toronto
for global pandemic research. The Web-based technology, known as RDIT™
(Random Domain Intercept Technology), allows organizations to engage
online populations that do not usually if ever answer surveys. The technology
accesses randomized and diverse local populations based on unintentional
Internet navigation and data input errors. Since its development in 2009, it
has reached millions of respondents all over the world on all mobile devices
including smartphones and tablets.
Because the RDIT methodology collects no personal information, respon-
dents can answer questions more freely and with less bias, particularly with sen-
sitive topics (e.g., same-sex marriage, marijuana use). Respondents are asked
to identify their age and gender along with a series of questions that may vary
based on the topic of research and the client. RDIT is the only technology of
its kind in the world. It has the ability to reach beyond paid panel respondents
or social media users and is able to engage the previously unengaged—that
is, people who do not typically answer surveys. RDIT has been used in all sec-
tors of the market from large global consumer packaged goods companies to
nongovernmental organizations to governments themselves from all over the
world. More specifi cally, RIWI has researched public opinions on various topics
ranging from health care to global confl icts to electronic purchases.
Source: Text and photos courtesy of Neil Seeman and RIWI Corp.
Visit Lucid at https://luc.id/
Neil Seeman, founder and CEO,
RIWI Corp.
Visit RIWI at www.riwi.com
Marketing managers typically confuse sample size with sample representativeness.
In the previous chapter, you learned that the method of sample selection determines its rep-
resentativeness. Unfortunately, many managers falsely believe that sample size and sam-
ple representativeness are related, but they are not. By studying this chapter, you will learn
that the size of a sample directly affects its degree of accuracy or error, which is completely
different from its representativeness. As you can see in our opening company vignettes, tech-
nology now allows for relatively easy access to thousands of randomly selected respondents;
however, as you will learn in this chapter, sample accuracy may be satisfactory with apprecia-
bly smaller numbers of respondents.
M10_BURN3261_08_GE_C10.indd 263M10_BURN3261_08_GE_C10.indd 263 16/08/16 2:34 pm16/08/16 2:34 pm

264 CHAPTER 10 • DETERMINING THE SIZE OF A SAMPLE
Consider this example to demonstrate that there is no relationship between the size of
a sample and its representativeness of the population from which it is drawn. Suppose we
want to fi nd out what percentage of the U.S. workforce dresses “business casual” most of the
workweek. We take a convenience sample by standing on a corner of Wall Street in New York
City, and we ask everyone who will talk to us about whether they come to work in business
casual dress. At the end of one week, we have questioned more than 5,000 respondents in
our survey. Are these people representative of the U.S. workforce population? No, of course
they are not. In fact, they are not even representative of New York City workers because a
nonprobability sampling method was used. What if we asked 10,000 New Yorkers with the
same sample method? No matter what its size, the sample would still be unrepresentative for
the same reason.
There are two important points. First, only a probability sample, typically referred to as a
random sample , is truly representative of the population and, second, the size of that random
sample determines the sample’s accuracy of fi ndings. 1 Sample accuracy refers to how close
a random sample’s statistic (for example, percent of yes answers to a particular question) is to
the population’s value (that is, the true percent of agreement in the population) it represents.
Sample size has a direct bearing on how accurate the sample’s fi ndings are relative to the true
values in the population. If a random sample has 5 respondents, it is more accurate than if it
had only 1 respondent; 10 respondents are more accurate than 5 respondents and so forth.
Common sense tells us that larger random samples are more accurate than smaller random
samples. But, as you will learn in this chapter, 5 is not 5 times more accurate than 1, and 10 is
not twice as accurate as 5. The important points to remember at this time are that (1) sample
method determines a sample’s representativeness, while (2) sample size determines a random
sample’s accuracy. Precisely how accuracy is aff ected by the size of the sample constitutes a
major focus of this chapter.
We are concerned with sample size because a signifi cant cost savings occurs when the
correct sample size is calculated and used. To counter the high refusal rate that marketing
research companies encounter when they do surveys, many companies have created respon-
dent panels , as described earlier in this textbook . Tens and hundreds of thousands of consum-
ers have joined these panels with the agreement that they will respond to survey requests
quickly, completely, and honestly. These panels are mini-populations that represent consumer
markets of many types. The panel companies sell access to their panel members for a fee
per respondent, typically based on the length of the survey. If a marketing research project
director requests a sample size of 10,000 respondents and the panel company charges $5 per
respondent, the sample cost is 10,000 times $5, or $50,000. A sample size of 1,000 respon-
dents would cost 1,000 times $5, or $5,000. Thus, if 1,000 is the “correct” sample size, there
would be a $45,000 savings in the marketing research project cost. When marketing research
proposals are submitted, the cost or price is included. The 10,000 sample size bid would be
signifi cantly higher in price than would be the 1,000 sample size bid, and it would probably
not be competitive for that reason.
Accordingly, this chapter is concerned with random sample size determination methods.
To be sure, sample size determination can be a complicated process, 2, 3, 4 but our aim in this
chapter is to simplify the process and make it more intuitive. To begin, we share some axioms
about sample size. These statements serve as the basis for the confi dence interval approach,
which is the best sample size determination method to use; we describe its underlying notions
of variability, allowable sample error, and level of confi dence. These are combined into a
simple formula to calculate sample size, and we give some examples of how the formula
works. Next, we describe four other popular methods used to decide on a sample’s size that
have important limitations. Finally, we briefl y review some practical considerations and spe-
cial situations that aff ect the fi nal sample size.
The accuracy of a sample is a measure of how closely it reports the true values of the population it represents.
The selection method, not the size of the sample, determines a sample’s representativeness.
M10_BURN3261_08_GE_C10.indd 264M10_BURN3261_08_GE_C10.indd 264 16/08/16 2:34 pm16/08/16 2:34 pm

10-2 THE CONFIDENCE INTERVAL METHOD OF DETERMINING SAMPLE SIZE 265
10- 1 Sample Size Axioms How to determine the number of respondents in a particular sample is actually one of the
simplest decisions in the marketing research process, 5 but it may appear bewildering because
formulas are used. A sample size decision is usually a compromise between what is theoreti-
cally perfect and what is practically feasible. This chapter presents the fundamental concepts
that underlie sample size decisions. 6
There are two good reasons a marketing researcher should have a basic understanding of
sample size determination. First, many practitioners have a large sample size bias , which is a
false belief that sample size determines a sample’s representativeness. This bias is represented
by a common question: “How large a sample should we have to be representative?” We have
already established that there is no relationship between sample size and representativeness,
so you already know one of the basics of sample size determination. Second, a marketing
researcher should have a basic understanding of sample size determination because sample
size is often a major cost factor, particularly for personal interviews but even with telephone
and online surveys. Consequently, understanding how sample size is determined will enable
researchers to help managers to better manage their resources.
Table 10. 1 , which lists eight axioms about sample size and accuracy, should help to con-
tradict the large sample size bias among many marketing research clients. An axiom is a
universal truth, meaning that the statement will always be correct. However, we must point
out that these axioms pertain only to probability samples, so they are true only as long as a
random sample is being used. Remember, no matter how astonishing one of our statements
might seem, it will always be true when dealing with a random sample. As we describe the
confi dence interval method of sample size determination, we will refer to each axiom in turn
and help you understand the axiom.
10- 2 The Confi dence Interval Method of Determining Sample Size The most correct method of determining sample size is the confi dence interval approach ,
which applies the concepts of accuracy (margin of sample error), variability, and confi dence
interval to create a “correct” sample size. This approach is used by national opinion polling
TABLE 10. 1 The Axioms of Random Sample Size and Sample Accuracy
1. The only perfectly accurate sample is a census.
2. A random sample will always have some inaccuracy, which is referred to as margin of sample error or simply sample error .
3. The larger a random sample is, the more accurate it is, meaning the less margin of sample
error it has.
4. Margin of sample error can be calculated with a simple formula and expressed as a ±%
number.
5. You can take any fi nding in the survey, replicate the survey with a random sample of the
same size, and be “very likely” to fi nd the same fi nding within the ±% range of the original
sample’s fi nding.
6. In almost all cases, the margin of sample error of a random sample is independent of the size
of the population.
7. A random sample size can be a tiny percent of the population size and still have a small mar-
gin of sample error.
8. The size of a random sample depends on the client’s desired accuracy (acceptable margin of
sample error) balanced against the cost of data collection for that sample size.
The confi dence interval approach is the correct method by which to determine sample size.
The size of a sample has nothing to do with its representativeness. Sample size affects the sample accuracy.
M10_BURN3261_08_GE_C10.indd 265M10_BURN3261_08_GE_C10.indd 265 16/08/16 2:34 pm16/08/16 2:34 pm

266 CHAPTER 10 • DETERMINING THE SIZE OF A SAMPLE
companies and most marketing researchers. To describe the confi dence interval approach to
sample size determination, we fi rst must describe the four underlying concepts.
SAMPLE SIZE AND ACCURACY The fi rst axiom, “ The only perfectly accurate sample is a census, ” is easy to understand. You
should be aware that a survey has two types of error: nonsampling error and sampling error.
Nonsampling error pertains to all sources of error other than the sample selection method
and sample size, including problem specifi cation mistakes, question bias, data recording
errors, or incorrect analysis. Recall from Chapter 9 that sampling error involves both sample
selection method and sample size. 7 With a census, every member of the population is selected,
so there is no error in selection. Because a census accounts for every single individual, and
if we assume there is no nonsampling error, it is perfectly accurate, meaning that it has no
sampling error.
However, a census is almost always infeasible due to cost and practical reasons, so we
must use some random sampling technique. This fact brings us to the second axiom, “ A ran-dom sample will always have some inaccuracy, which is referred to as ‘margin of sample error’ or simply ‘sample error .’” This axiom emphasizes that no random sample is a perfect representation of the population. However, it is important to remember that a random sample
is nonetheless a very good representation of the population, even if it is not perfectly accurate.
The third axiom, “The larger a random sample is, the more accurate it is, meaning the less margin of sample error it has,” serves notice that there is a relationship between sample
size and accuracy of the sample. This relationship is presented graphically in Figure 10. 1 . In
this fi gure, margin of sample error is listed on the vertical axis, and sample size is noted on the
horizontal axis. The graph shows the sample error levels for samples ranging in size from 50
to 2,000. The shape of the graph is consistent with the third axiom because margin of sample
error decreases as sample size increases. However, you should immediately notice that the
graph is not a straight line. In other words, doubling sample size does not result in halving the
sample error. The relationship is an asymptotic curve that will never achieve 0% error.
There is another important property of the sample error graph. As you look at the graph,
note that at a sample size of around 1,000, the margin of sample error is about ±3% (actually
±3.1%), and it decreases at a very slow rate with larger sample sizes. In other words, once
a sample is greater than, say, 1,000, large gains in accuracy are not realized even with large
increases in the size of the sample. In fact, if it is already ±3.1% in accuracy, little additional
accuracy is possible.
With the lower end of the sample size axis, however, large gains in accuracy can be made
with a relatively small sample size increase. You can see this vividly by looking at the sample
errors associated with smaller sample sizes in Table 10. 2 . For example, with a sample size
The only perfectly accurate sample is a census.
The larger the size of the (probability) sample, the less is its margin of sample error.
16%
Mar
gin
of S
ampl
e Er
ror
Sample Size
n � 1,000Accuracy � �3.1%
n � 2,000Accuracy � �2.2%
From a sample size of 1,000 ormore, very little gain in accuracyoccurs, even with doubling the
sample to 2,000.
14%
12%
10%
8%
6%
4%
2%
0%50 200 350 500 650 800 950 2,0001,8501,7001,5501,4001,2501,100
FIGURE 10. 1 The Relationship Between Sample Size and Sample Error
M10_BURN3261_08_GE_C10.indd 266M10_BURN3261_08_GE_C10.indd 266 16/08/16 2:34 pm16/08/16 2:34 pm

10-2 THE CONFIDENCE INTERVAL METHOD OF DETERMINING SAMPLE SIZE 267
of 50, the margin of sample error is ±13.9%, whereas with a sample
size of 200 it is ±6.9%, meaning that the accuracy of the 200 sample is
roughly double that of the 50 sample. But as was just described, such
huge gains in accuracy are not the case at the other end of the sample
size scale because of the nature of the curved relationship. You will
see this fact if you compare the sample error of a sample size of 2,000
(±2.2%) to that of a sample size of 10,000 (±1.0%): with 8,000 more
in the sample, we have improved the accuracy only by 1.2%. So, while
the accuracy surely does increase with greater and greater sample sizes,
there is only a minute gain in accuracy when these sizes are more than
1,000 respondents.
The sample error values and the sample error graph were pro-
duced via the fourth axiom: 8 “Margin of sample error can be calcu-lated with a simple formula, and expressed as a ±% number.” The
formula follows:
Margin of sample error formula
Margin of Sample Error , = 1.96 * Ap * q
n
Yes, this formula is simple; n is the sample size, and there is a constant,
1.96. But what are p and q ?
p and q: THE CONCEPT OF VARIABILITY Let’s set the scene. We have a population, and we want to know what percent of the population
responds “yes” to the question, “The next time you order a pizza, will you use Domino’s?”
We will use a random sample to estimate the population percent of “yes” answers. What are
the possibilities? We might fi nd 100% of respondents answering “yes” in the sample, we
might fi nd 0% of yes responses, or we might fi nd something in between, say, 50% “yes”
responses in the sample.
When we fi nd a wide dispersion of responses—that is, when we do not fi nd one response
option accounting for a large number of respondents relative to the other items—we say that
the results have much variability. Variability is defi ned as the amount of dissimilarity in
respondents’ answers to a particular question. If most respondents indicate the same answer
on the response scale, the distribution has little variability because respondents are highly
similar. On the other hand, if respondents are evenly spread across the question’s response
options, there is much variability because respondents are quite dissimilar. So, the 100% and
the 0% agreement cases have little variability because everyone answers the same, while the
50% in-between case has a great deal of variability because with any two respondents, one
answers “yes” while the other one answers “no.”
The sample error formula pertains only to nominal data, or data in which the response
items are categorical. We recommend that you always think of a yes/no question; the greater
the similarity, meaning that the more you fi nd people saying “yes” in the population, the less
the variability in the responses. For example, we may fi nd that the question “The next time
you order a pizza, will you use Domino’s?” yields a 90% to 10% distribution split between
“yes” versus “no.” In other words, most of the respondents give the same answer, meaning
that there is much similarity in the responses and the variability is low. In contrast, if the ques-
tion results in a 50/50 split, the overall response pattern is (maximally) dissimilar, and there is
much variability. You can see the variability of responses in Figure 10. 2 . With the 90/10 split,
the graph has one high side (90%) and one low side (10%), meaning almost everyone agrees
on Domino’s. In contrast, with disagreement or much variability in people’s answers, both
sides of the graph are near even (50%/50%).
TABLE 10. 2 Sample Sizes and Margin of Sample Error
Sample Size ( n )Margin of Sample Error
(Accuracy Level)
10 ±31.0%
50 ±13.9%
100 ±9.8%
200 ±6.9%
400 ±4.9%
500 ±4.4%
750 ±3.6%
1,000 ±3.1%
1,500 ±2.5%
2,000 ±2.2%
5,000 ±1.4%
10,000 ±1.0%
With a sample size of 1,000 or more, very little gain in accuracy occurs even with doubling or tripling the sample size.
Variability refers to how similar or dissimilar responses are to a given question.
M10_BURN3261_08_GE_C10.indd 267M10_BURN3261_08_GE_C10.indd 267 16/08/16 2:34 pm16/08/16 2:34 pm

268 CHAPTER 10 • DETERMINING THE SIZE OF A SAMPLE
The Domino’s Pizza example relates to p and q in the following way:
p = percent saying yes
q = 100% – p , or percent saying no
In other words, p and q are complementary numbers that must always sum to 100%, as
in the cases of 90% + 10% and 50% + 50%. The p represents the variable of interest in the
population that we are trying to estimate.
In our sample error formula, p and q are multiplied. The largest possible product of
p times q is 2,500, or 50% times 50%. You can verify this fact by multiplying other combina-
tions of p and q , such as 90/10 (900), 80/20 (1,600),
or 60/40 (2,400). Every combination will have a result
smaller than 2,500; the most lopsided combination of
99/1 (99) yields the smallest product. If we assume the
worst possible case of maximum variability, or 50/50
disagreement, the sample error formula becomes even
simpler and can be given with two constants, 1.96 and
2,500, as follows:
Sample error formula with p = 50% and q = 50%
{ Margin of Sample Error , = 1.96 * A2,500
n
This is the maximum margin of sample error
formula we used to create the sample error graph in
Figure 10. 1 and the sample error percentages in
Table 10. 2 . To determine how much sample error is
associated with a random sample of a given size, all you
need to do is to plug in the sample size in this formula.
The less variability in the population, the smaller will be the sample size.
Will your next pizza be a Domino’s?
50% 50%
90%
10%
Yes No
Much variability: folks do not agree Little variability: folks agree
FIGURE 10. 2 The amount of variability is refl ected in the spread of the distribution.
A 50/50 split in response signifi es maximum variability (dissimilarity) in the population, whereas a 90/10 split signifi es little variability.
© N
omad
_S
oul/
Shu
tter
stoc
k
M10_BURN3261_08_GE_C10.indd 268M10_BURN3261_08_GE_C10.indd 268 16/08/16 2:34 pm16/08/16 2:34 pm

10-2 THE CONFIDENCE INTERVAL METHOD OF DETERMINING SAMPLE SIZE 269
THE CONCEPT OF A CONFIDENCE INTERVAL The fi fth sample size axiom states, “You can take any fi nding in the survey, replicate the survey with a ran-dom sample of the same size, and be “very likely” to fi nd the same fi nding within the ±% range of the origi-nal sample’s fi nding.” This axiom is based on the con-
cept of a confi dence interval.
A confi dence interval is a range whose endpoints
defi ne a certain percentage of the responses to a ques-
tion. A confi dence interval is based on the normal,
or bell-shaped, curve commonly found in statistics.
Figure 10. 3 reveals that the properties of the normal
curve are such that 1.96 multiplied by the standard devi-
ation theoretically defi nes the endpoints for 95% of the
distribution.
The theory called the central limit theorem under-
lies many statistical concepts, and this theory is the basis
of the fi fth axiom. A replication is a repeat of the original, so if we repeated our Domino’s
survey a great many times—perhaps 1,000—with a fresh random sample of the same size and
we made a bar chart of all 1,000 percents of “yes” results, the central limit theorem holds that
our bar chart would look like a normal curve. Figure 10. 4 illustrates how the bar chart would
look if 50% of our population members intended to use Domino’s the next time they ordered
a pizza.
Figure 10. 4 reveals that 95% of the replications fall within ±1.96 multiplied by the sam-
ple error. In our example, 1,000 random samples, each with sample size ( n ) equal to 100, were
taken; the percentage of yes answers was calculated for each sample and all of these were
plotted in a line chart. The sample error for a sample size of 100 is calculated as follows:
Sample error formula with p = 50%, q = 50%, and n = 100
{ Margin of Sample Error % = 1.96 * A2,500
n
= 1.96 * A2,500
100
= 1.96 * 225
= 1.96 * 5
= {9.8
The result means that the limit of the 95% confi dence
interval in our example is 50% ± 9.8%, or 40.2% to
59.8%.
The confi dence interval is calculated as follows:
Confi dence interval formula
Confidence interval = p { margin of sample error
How can a researcher use the confi dence interval?
This is a good time to leave the theoretical and move
to the practical aspects of sample size. The confi dence
interval approach allows the researcher to predict
what would be found if a survey were replicated many
times. Of course, no client would agree to the cost of
A confi dence interval defi nes endpoints based on knowledge of the area under a bell-shaped curve.
�1.96 � Standard Deviation
�1.96 � Standard Deviation
95% of the Normal Curve Distribution
Percent
FIGURE 10. 3 A Normal Curve with Its 95% Properties Identifi ed
�1.96 � Sample Error �1.96 � Sample Error
95% of the replications will fall between�1.96 times the sample error.
p = 50%
FIGURE 10. 4 Plotting the Findings of 1,000 Replications of the Domino’s Pizza Survey: Illustration of the Central Limit Theorem
To learn about the central limit theorem, launch www.youtube.com
and search for “The Central Limit Theorem … Kahn Academy.”
M10_BURN3261_08_GE_C10.indd 269M10_BURN3261_08_GE_C10.indd 269 16/08/16 2:34 pm16/08/16 2:34 pm

270 CHAPTER 10 • DETERMINING THE SIZE OF A SAMPLE
1,000 replications, but the researcher can say, “I found that 50% of the sample intends to
order Domino’s the next time. I am very confi dent that the true population percent is between
40.2% and 59.8%; in fact, I am confi dent that if I did this survey over 1,000 times, 95% of the
fi ndings will fall in this range.” Notice that the researcher never does 1,000 replications; he or
she just uses one random sample, uses this sample’s accuracy information from p and q , and
applies the central limit theorem assumptions to calculate the confi dence intervals.
What if the confi dence interval was too wide? That is, what if the client felt that a range
from about 40% to 60% was not precise enough? Figure 10. 5 shows how the sample size
aff ects the shape of the theoretical sampling distribution and, more important, the confi dence
interval range. Notice in Figure 10. 5 that the larger the sample, the smaller the range of the
The confi dence interval gives the range of fi ndings if the survey were replicated many times with the identical sample size.
35% 40% 45% 50% 55% 60% 65%
n = 100, Sample error ±9.8%n = 500, Sample error ±4.4%n = 1,000, Sample error ±3.1%
FIGURE 10. 5 Sampling Distribu-tions Showing How the Sample Error Is Less with Larger Sample Sizes
Active Learning
How Does the Level of Confidence Affect the Sample Accuracy Curve?
Thus far, the sample error formula has used a z value of 1.96, which corresponds to the 95% level of confidence. However, marketing researchers sometimes use another level of confidence—the 99% level of confidence with the corresponding z value of 2.58. For this Active Learning exercise, use the sample error formula with p = 50% and q = 50% but use a z value of 2.58 and calculate the sample error associated with the following sample sizes:
Sample Size ( n ) Sample Error ( e )
100 ±_____%
500 ±_____%
1,000 ±_____%
2,000 ±_____%
Plot your computed sample error ± numbers that correspond to 99% confidence level sample sizes of 100, 500, 1,000, and 2,000 in Figure 10. 1 . Connect your four plotted points with a curved line similar to the one already in the graph. Use the percentages in Table 10. 2 to draw a similar line for the 95% confidence level sample sizes’ sample error values. Using your computations and the drawing you have just made, write down two conclusions about the effect of a level of confidence different from 95% on the amount of sample error with samples in the range of the horizontal axis in Figure 10. 3 .
1. __________________________________________________________________________
2. __________________________________________________________________________
M10_BURN3261_08_GE_C10.indd 270M10_BURN3261_08_GE_C10.indd 270 16/08/16 2:34 pm16/08/16 2:34 pm

10-3 THE SAMPLE SIZE FORMULA 271
confi dence interval. Why? Because larger sample sizes have less sample error, meaning that
they are more accurate, and the range or width of the confi dence interval is smaller with more
accurate samples.
HOW POPULATION SIZE ( N ) AFFECTS SAMPLE SIZE Perhaps you noticed an element that is absent in these discussions and calculations that is
mentioned in the sixth sample size axiom, “In almost all cases, the margin of sample error of a random sample is independent of the size of the population.” Our formulas do not
include N , the size of the population! We have been calculating sample error and confi dence
intervals without taking the size of the population into account. Does this mean that a sample
of 100 will have the same sample error and confi dence interval of ±9.8% for a population of
20 million people who watched the last Super Bowl, 2 million Kleenex tissue buyers, and
200,000 Scottish terrier owners? Yes, it does. The only time the population size is a consider-
ation in sample size determination 9 is in the case of a “small population,” and this possibility
is discussed in the fi nal section in this chapter.
Because the size of the sample is independent of the population size, the seventh sample size
axiom, “A random sample size can be a very tiny percent of the population size and still have a small margin of sample error,” can now be understood. National opinion polls tend to use sample
sizes ranging from 1,000 to 1,200 people, meaning that the sample error is around ±3%, or highly
accurate. In Table 10. 2 , you will see that a sample size of 5,000 yields an error of ±1.4%, which
is a very small error level, yet 5,000 is less than 1% of 1 million, and a great many consumer
markets—cola drinkers, condominium owners, debit card users, allergy suff erers, home garden-
ers, Internet surfers, and so on—each comprise many millions of customers. Here is one more
example to drive our point home: A sample of 500 is just as accurate for the entire population of
China (1.3 billion people) as it is for the Montgomery, Alabama, area (375,000 people) as long as
a random sample is taken in both cases. In both cases, the sample error is ±4.4%.
10- 3 The Sample Size Formula You are now acquainted with the basic concepts essential to understanding sample size deter-
mination using the confi dence interval approach. To calculate the proper sample size for a sur-
vey, only three items are required: (1) the variability believed to be in the population, (2) the
acceptable margin of sample error, and (3) the level of confi dence required in your estimates
of the population values. This section will describe the formula used to compute sample size
via the confi dence interval method . As we describe the formula, we will present some of the
concepts you learned earlier a bit more formally.
DETERMINING SAMPLE SIZE VIA THE CONFIDENCE INTERVAL FORMULA As you would expect, there is a formula that includes our three required items. 10 When con-
sidering a percentage, the formula is as follows: 11
Standard sample size formula
n =z2(pq)
e2
where
n = the sample size
z = standard error associated with the chosen level of confi dence (typically, 1.96)
p = estimated percent in the population
q = 100 – p
e = acceptable margin of sample error
To learn about sample size, launch www.youtube.com and search
for “How sample size is determined.”
IBM SPSS Student Assistant Milk Bone Biscuits: Setup Basics for Your IBM SPSS Dataset
To compute sample size, only three items are required: variability, acceptable sample error, and confi dence level.
With few exceptions, the sample size and the size of the population are not related to each other.
The standard sample size formula is applicable if you are concerned with the nominally scaled questions in the survey, such as yes or no questions.
M10_BURN3261_08_GE_C10.indd 271M10_BURN3261_08_GE_C10.indd 271 16/08/16 2:34 pm16/08/16 2:34 pm
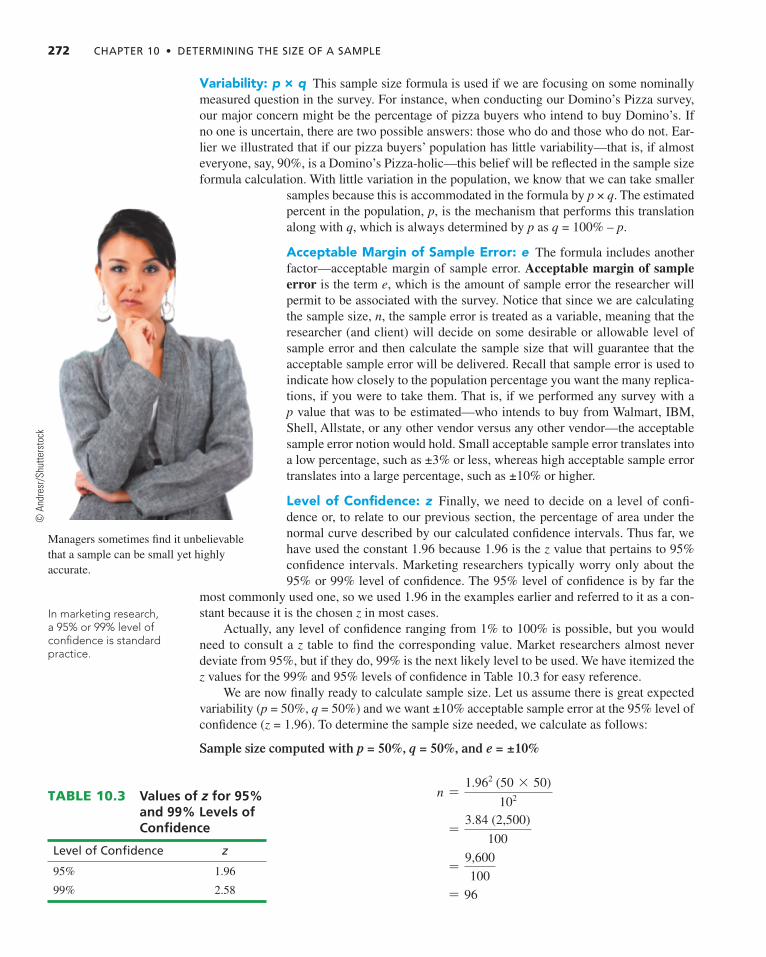
272 CHAPTER 10 • DETERMINING THE SIZE OF A SAMPLE
Variability: p × q This sample size formula is used if we are focusing on some nominally
measured question in the survey. For instance, when conducting our Domino’s Pizza survey,
our major concern might be the percentage of pizza buyers who intend to buy Domino’s. If
no one is uncertain, there are two possible answers: those who do and those who do not. Ear-
lier we illustrated that if our pizza buyers’ population has little variability—that is, if almost
everyone, say, 90%, is a Domino’s Pizza-holic—this belief will be refl ected in the sample size
formula calculation. With little variation in the population, we know that we can take smaller
samples because this is accommodated in the formula by p × q . The estimated
percent in the population, p , is the mechanism that performs this translation
along with q , which is always determined by p as q = 100% – p .
Acceptable Margin of Sample Error: e The formula includes another
factor—acceptable margin of sample error. Acceptable margin of sample error is the term e , which is the amount of sample error the researcher will
permit to be associated with the survey. Notice that since we are calculating
the sample size, n , the sample error is treated as a variable, meaning that the
researcher (and client) will decide on some desirable or allowable level of
sample error and then calculate the sample size that will guarantee that the
acceptable sample error will be delivered. Recall that sample error is used to
indicate how closely to the population percentage you want the many replica-
tions, if you were to take them. That is, if we performed any survey with a
p value that was to be estimated—who intends to buy from Walmart, IBM,
Shell, Allstate, or any other vendor versus any other vendor—the acceptable
sample error notion would hold. Small acceptable sample error translates into
a low percentage, such as ±3% or less, whereas high acceptable sample error
translates into a large percentage, such as ±10% or higher.
Level of Confi dence: z Finally, we need to decide on a level of confi -
dence or, to relate to our previous section, the percentage of area under the
normal curve described by our calculated confi dence intervals. Thus far, we
have used the constant 1.96 because 1.96 is the z value that pertains to 95%
confi dence intervals. Marketing researchers typically worry only about the
95% or 99% level of confi dence. The 95% level of confi dence is by far the
most commonly used one, so we used 1.96 in the examples earlier and referred to it as a con-
stant because it is the chosen z in most cases.
Actually, any level of confi dence ranging from 1% to 100% is possible, but you would
need to consult a z table to fi nd the corresponding value. Market researchers almost never
deviate from 95%, but if they do, 99% is the next likely level to be used. We have itemized the
z values for the 99% and 95% levels of confi dence in Table 10. 3 for easy reference.
We are now fi nally ready to calculate sample size. Let us assume there is great expected
variability ( p = 50%, q = 50%) and we want ±10% acceptable sample error at the 95% level of
confi dence ( z = 1.96). To determine the sample size needed, we calculate as follows:
Sample size computed with p = 50%, q = 50%, and e = ±10%
n =1.962 (50 * 50)
102
=3.84 (2,500)
100
=9,600
100
= 96
Managers sometimes fi nd it unbelievable
that a sample can be small yet highly
accurate.
In marketing research, a 95% or 99% level of confi dence is standard practice.
TABLE 10. 3 Values of z for 95% and 99% Levels of Confi dence
Level of Confi dence z
95% 1.96
99% 2.58
© A
ndre
sr/S
hutt
erst
ock
M10_BURN3261_08_GE_C10.indd 272M10_BURN3261_08_GE_C10.indd 272 16/08/16 2:34 pm16/08/16 2:34 pm

10-3 THE SAMPLE SIZE FORMULA 273
For further validation of the use of the confi dence interval approach, recall our previous comment
that most national opinion polls use sample sizes of about 1,100 and claim about ±3% accuracy
(allowable sample error). Using the 95% level of confi dence, the computations would be:
Sample size computed with p = 50%, q = 50%, and e = 3%
n =1.962 (50 * 50)
32
=3.84 (2,500)
9
=9,600
9
= 1,067
In other words, if these national polls were to be ±3% accurate at the 95% confi dence
level, they would need to have sample sizes of 1,067 (or about 1,100 respondents). The next
time you read in the news or see a report on a national opinion poll, check the sample size to
see if there is a footnote or reference on the “margin of error.” It is a good bet that you will
fi nd the error to be somewhere close to ±3% and the sample size to be in the 1,100 range.
What if the researcher wanted a 99% level of confi dence in estimates? The computations
would be as follows:
99% confi dence interval sample size with p = 50%, q = 50%, and e = 3%
n =2.582 (50 * 50)
32
=6.66 (2,500)
9
=16,650
9
= 1,850
To learn about sample size using proportions, launch www.
youtube.com and search for “How to calculate sample size proportions.”
IBM SPSS Student Assistant Milk Bone Biscuits: Modifying Variables and Values
Active Learning
Sample Size Calculations Practice
While you can mentally follow the step-by-step sample size calculations examples we have just described, it is always more insightful for those just learning about sample size to perform the calculations themselves. In this Active Learning exercise, refer back to the standard sam-ple size formula and use it to calculate the appropriate sample size for each of the following six cases. Each case represents a different question on a survey.
Case Confidence Level Value of p Allowable ErrorSample Size (write your
answer below)
Alpha 95% 65% ±3.5% _____________
Beta 99% 75% ±3.5% _____________
Gamma 95% 60% ±5% _____________
Delta 99% 70% ±5% _____________
Epsilon 95% 50% ±2% _____________
Zeta 99% 55% ±2% _____________
M10_BURN3261_08_GE_C10.indd 273M10_BURN3261_08_GE_C10.indd 273 16/08/16 2:34 pm16/08/16 2:34 pm

274 CHAPTER 10 • DETERMINING THE SIZE OF A SAMPLE
Determining Sample Size Using the Mean: An Example of Variability of a Scale We have presented the standard sample size formula in this chapter, which assumes that the researcher is working with a case of percentages ( p and q ). However, there are instances when the reseacher is more concerned with the mean of a vari-able, in which case the percentage sample size formula does not fi t. Instead, the researcher must use a different formula for sample size that includes the variability expressed as a standard deviation. That is, this situation calls for the use of the standard deviation, instead of p and q , to indicate the amount of varia-tion. In this case, the sample size formula changes slightly to be the following:
Sample size formula for a mean
n =s2z2
e2
where
n = the sample size z = standard error associated with the chosen level of confi -
dence (typically, 1.96) s = variability indicated by an estimated standard deviation e = the amount of precision or allowable error in the sample
estimate of the population
Although this formula looks different from the one for a percentage, it applies the same logic and key concepts. 12 As you can see, the formula determines sample size by multiplying the squares of the variability ( s ) and level of confi dence values ( z ) and dividing that product by the square of the desired precision value ( e ).
First, let us look at how variability of the population is a part of the formula. It appears in the form of s , or the estimated standard deviation of the population. This means that, because
we are estimating the population mean, we need to have some knowledge of or at least a good guess at how much variability there is in the population. We must use the standard deviation because it expresses this variation. Unfortunately, unlike our percentage sample size case, there is no “50% equals the most variation” counterpart, so we have to rely on some prior knowl-edge about the population for our estimate of the standard deviation. That prior knowledge could come from a previous study on the same population or a pilot study.
If information on the population variability is truly unknown and a pilot study is out of the question, a researcher can use a range estimate and knowledge that the range is approximated by the mean ±3 standard deviations (a total of 6).
On occasion, a market researcher fi nds he or she is working with metric scale data rather than nominal data. For instance, the researcher might have a 10-point importance scale or a 7-point satisfaction scale that is the critical variable with respect to determining sample size. Finally, we must express e , which is the acceptable error around the sample mean when we ulti-mately estimate the population mean for our survey. In the for-mula, e must be expressed in terms of the measurement units appropriate to the question. For example, on a 1–10 scale, e would be expressed as, say, a 0.25 scale unit.
Suppose, for example, that a critical question on the sur-vey involved a scale in which respondents rated their satisfac-tion with the client company’s products on a scale of 1 to 10. If respondents use this scale, the theoretical range would be 10, and 10 divided by 6 equals a standard deviation of 1.7, which would be the variability estimate. Note that this would be a conservative estimate, as respondents might not use the entire 1–10 scale, or the mean might not equal 5, the midpoint, meaning that 1.7 is the largest variability estimate possible in this case. 13
MARKETING RESEARCH INSIGHT 10. 1 Practical Application
Thus, if a survey were to have ±3% allowable sample error at the 99% level of confi dence,
it would need to have a sample size of 1,850, assuming the maximum variability (50%).
A researcher can calculate sample size using either a percentage or a mean. We have just
described (and you have just used in the Active Learning exercise) the percentage approach
to computing sample size. Marketing Research Insight 10. 1 describes how to determine sam-
ple size using a mean. Although the formulas are diff erent, the basic concepts involved are
identical.
10- 4 Practical Considerations in Sample Size Determination Although we have discussed how variability, acceptable sample error, and confi dence level
are used to calculate sample size, we have not discussed the criteria used by the marketing
manager and researcher to determine these factors. General guidelines follow.
M10_BURN3261_08_GE_C10.indd 274M10_BURN3261_08_GE_C10.indd 274 16/08/16 2:34 pm16/08/16 2:34 pm

10-4 PRACTICAL CONSIDERATIONS IN SAMPLE SIZE DETERMINATION 275
HOW TO ESTIMATE VARIABILITY IN THE POPULATION When applying the standard sample size formula using percentages, there are two alterna-
tives: (1) expect the worst case or (2) guesstimate the actual variability. We have shown that
with percentages the greatest or worst-case variability is 50%/50%. This assumption is the
most conservative one, and it will result in the calculation of the largest possible sample size.
On the other hand, a researcher may want to use an educated guess about p , or the per-
centage, in order to lower the sample size. Remember that any p / q combination other than
50%/50% will result in a lower calculated sample size because p times q is in the numerator of
the formula. A lower sample size means less eff ort, time, and cost, so there are good reasons
for a researcher to try to estimate p rather than to take the worst case.
Surprisingly, information about the target population often exists in many forms.
Researchers can estimate variance in a population by seeking prior studies on the population or
by conducting a small pilot study. Census descriptions are available in the form of secondary
data, and compilations and bits of information may be gained from groups such as chambers
of commerce, local newspapers, state agencies, groups promoting commercial development,
and a host of other similar organizations. Moreover, many populations under study by fi rms
are known to them either formally through prior research studies or informally through busi-
ness experiences. All of this information combines to help the research project director to
grasp the variability in the population. If the project director has confl icting information or is
worried about the timeliness or some other aspect of the information about the population’s
variability, he or she may conduct a pilot study to estimate p more confi dently. 14, 15
HOW TO DETERMINE THE AMOUNT OF ACCEPTABLE SAMPLE ERROR The marketing manager intuitively knows that small samples are less accurate, on average, than
are large samples. But it is rare for a marketing manager to think in terms of sample error. It is up
to the researcher to educate the manager on what might be acceptable or “standard” sample error.
Translated in terms of accuracy, the more accurate the marketing decision maker desires
the estimate to be, the larger must be the sample size. It is the task of the marketing research
director to extract from the marketing decision maker the acceptable range of allowable
margin of error suffi cient to make a decision. As you have learned, the acceptable sample
error is specifi ed as a plus or minus percent. That is, the researcher might say to the market-
ing decision maker, “I can deliver an estimate that is within ±10% of the actual fi gure.” If
the marketing manager is confused at this, the researcher can next say, “This means that if
I fi nd that 45% of the sample is thinking seriously about leaving your competitors and buying
your brand, I will be telling you that I estimate that between 35% and 55% of your competi-
tors’ buyers are thinking about jumping over to be your customers.” The conversation would
continue until the marketing manager feels comfortable with the confi dence interval range.
HOW TO DECIDE ON THE LEVEL OF CONFIDENCE All marketing decisions are made under a certain amount of risk, and it is mandatory to
incorporate the estimate of risk, or at least some sort of a notion of uncertainty, into sample
size determination. Because sample statistics are estimates of population values, the proper
approach is to use the sample information to generate a range in which the population value
is anticipated to fall. Because the sampling process is imperfect, it is appropriate to use an
estimate of sampling error in the calculation of this range. Using proper statistical terminol-
ogy, the range is what we have called the confi dence interval. The researcher reports the
range and the confi dence he or she has that the range includes the population fi gure.
As we have indicated, the typical approach in marketing research is to use the standard
confi dence interval of 95%. This level translates to a z of 1.96. As you may recall from your
statistics course, any level of confi dence between 1% and 99.9% is possible, but the only
other level of confi dence that market researchers usually consider is 99%. With the 99% level
When estimating a standard deviation, researchers may rely on (a) prior knowledge of the population (previous study), (b) a pilot study, or (c) divide the range by 6.
By estimating p to be other than 50%, the researcher can reduce the sample size and save money.
Researchers can estimate variability by (a) assuming maximum variability ( p = 50%, q = 50%), (b) seeking previous studies on the population, or (c) conducting a small pilot study.
Marketing researchers often must help decision makers understand the sample size implications of their requests for high precision, expressed as acceptable sample error.
Use of 95% or 99% level of confi dence is standard in sample size determination.
M10_BURN3261_08_GE_C10.indd 275M10_BURN3261_08_GE_C10.indd 275 16/08/16 2:34 pm16/08/16 2:34 pm

276 CHAPTER 10 • DETERMINING THE SIZE OF A SAMPLE
of confi dence, the corresponding z value is 2.58. The 99% level of confi dence means that if
the survey were replicated many times with the sample size determined by using 2.58 in the
sample size formula, 99% of the sample p ’s would fall in the sample error range, or e .
However, since the z value is in the numerator of the sample size formula, an increase
from 1.96 to 2.58 will increase the sample size. In fact, for any given sample error, the use of
the 99% level of confi dence will increase sample size by about 73%. In other words, using the
99% confi dence level has profound eff ects on the calculated sample size. Are you surprised
that most marketing researchers opt for a z of 1.96?
HOW TO BALANCE SAMPLE SIZE WITH THE COST OF DATA COLLECTION Perhaps you thought we had forgotten the fi nal sample size axiom, “ The size of a random sample depends on the client’s desired accuracy (acceptable margin of sample error) bal-anced against the cost of data collection for that sample size. ” This is a crucial axiom, as it
describes the reality of almost all sample size determination decisions. In a previous chapter,
we commented on the cost of the research versus the value of the research and that there is
always a need to make sure that the cost of the research does not exceed the value of the infor-
mation expected from that research. In situations where data collection costs are signifi cant,
such as with personal interviews or in the case of buying access to online panel respondents,
cost and value issues come into play vividly with sample size determination. 16 Because using
the 99% level of confi dence impacts sample size considerably, market researchers almost
always use the 95% level of confi dence.
To help you understand how to balance sample size and cost, let’s consider the typical sam-
ple size determination case. First, a 95% level of confi dence is used, so z = 1.96. Next, the p =
q = 50% situation is customarily assumed, as it is the worst possible case of variability. Then the
researcher and marketing manager decide on a preliminary acceptable sample error level. As an
example, let’s take the case of a researcher and a client initially agreeing to a ±3.5% sample error.
Using the sample size formula, the sample size, n , is calculated as follows.
Sample size computed with p = 50%, q = 50%, and e = 3.5%
n =1.962 (50 * 50)
3.52
= 3.84 (2,500)
=9,604
12.25
= 784 (rounded up)
If the cost per completed interview averages around $20, then the cost of data collection
for a sample size is 784 times $20, which equals $15,680. The client now knows the sample
size necessary for a ±3.5% sample error and the cost for these interviews. If the client has
issues with this cost, the researcher may create a table with alternative accuracy levels and
their associated sample sizes based on knowing the standard sample size formula. The table
could also include the data collection cost estimates so that the client can make an informed
decision on the acceptable sample size. Although not every researcher creates a table such
as this, the acceptable sample errors and the costs of various sample sizes are most certainly
discussed when coming to an agreement on the survey’s sample size. In most cases, the fi nal
agreed-to sample size is a trade-off between acceptable error and research cost. Marketing
Research Insight 10. 2 presents an example of how this trade-off occurs.
10- 5 Other Methods of Sample Size Determination In practice, a number of diff erent methods are used to determine sample size, including some
that are beyond the scope of this text book . 17 The more common methods are described briefl y
in this section. As you will soon learn, most have limitations that make them undesirable, even
The researcher must take cost into consideration when determining sample size.
A table that relates data collection cost and sample error is a useful tool when deciding on the survey sample size.
M10_BURN3261_08_GE_C10.indd 276M10_BURN3261_08_GE_C10.indd 276 16/08/16 2:34 pm16/08/16 2:34 pm

10-5 OTHER METHODS OF SAMPLE SIZE DETERMINATION 277
though you may fi nd instances in which they are used and proponents who argue for their use.
Since you are acquainted with the eight sample size axioms and you know how to calculate
sample size using the confi dence interval method formula, you should comprehend the limita-
tions as we point out each one.
ARBITRARY “PERCENT RULE OF THUMB” SAMPLE SIZE The arbitrary approach may take on the guise of a “percent rule of thumb” statement regard-
ing sample size: “A sample should be at least 5% of the population in order to be accurate.” In
fact, it is not unusual for a marketing manager to respond to a marketing researcher’s sample
size recommendation by saying, “But that is less than 1% of the entire population!”
You must agree that the arbitrary percentage rule of thumb approach certainly has some
intuitive appeal in that it is very easy to remember, and it is simple to apply. Surely, you will
not fall into the seductive trap of the percent rule of thumb, for you understand that sample
size is not related to population size. Just to convince yourself, consider these sample sizes.
How Clients and Marketing Researchers Agree on Sample Size In this fi ctitious example, we describe how sample size is deter-mined for a survey for a water park owner who is thinking about adding an exciting new ride to be called “The Frantic Flume.”
Larry, our marketing researcher, has worked with Dana, the water park owner, to develop the research objectives and basic research design for a survey to see if there is suffi cient interest in the Frantic Flume ride. Yesterday, Dana indicated she wanted to have an accuracy level of ±3.5% because this was “just a little less accurate than your typical national opinion poll.”
Larry did some calculations and created the following table, which he faxed to Dana.
The Frantic Flume Survey Sample Size, Sample Error, and Sample Data Collection Cost
Sample Size Sample Error Sample Cost*
784 ±3.5% $15,680
600 ±4.0% $12,000
474 ±4.5% $9,480
384 ±5.0% $7,680
317 ±5.5% $6,340
267 ±6.0% $5,340 *Estimated at $20 per completed interview
The following phone conversation now takes place.
LARRY: Did the fax come through okay?
DANA: Yes, but maybe I wish it didn’t.
LARRY: What do you mean?
DANA: There is no way I am going to pay over $15,000 just for the data collection.
LARRY: Yes, I fi gured this when we talked yesterday, but we were talking about the accuracy of a national opin-ion poll then. Now we are talking about your water park survey. So I prepared a schedule with some alternative sample sizes, their accuracy levels, and their costs.
DANA: Gee, can you really get an accuracy level of ±6% with just 267 respondents? That seems like a very small sample.
LARRY: Small in numbers, but it is still somewhat hefty in price, as the data collection company will charge $20 per completed telephone interview. You can see that it will still amount to over $5,000.
DANA: Well, that’s nowhere near $15,000! What about the 384 size? It will come to $7,680 according to your table, and the accuracy is ±5%. How does the accu-racy thing work again?
LARRY: If I fi nd that, say, 70% of the respondents in the random sample of your customers want the Frantic Flume at your water park, then you can be assured that between 65% and 75% of all of your custom-ers want it.
DANA: And with $7,680 for data collection, the whole sur-vey comes in under $15,000?
LARRY: I am sure it will. I can calculate a fi rm total cost using the 384 sample size.
DANA: Sounds like a winner to me. When can you get it to me?
LARRY: I'll have the proposal completed by Friday. You can study it over the weekend.
DANA: Great. I'll set up a tentative meeting with the inves-tors for the middle of next week.
MARKETING RESEARCH INSIGHT 10. 2 Practical Application
Arbitrary sample size approaches rely on erroneous rules of thumb.
M10_BURN3261_08_GE_C10.indd 277M10_BURN3261_08_GE_C10.indd 277 16/08/16 2:34 pm16/08/16 2:34 pm

278 CHAPTER 10 • DETERMINING THE SIZE OF A SAMPLE
If you take 5% samples of populations with sizes 10,000, 1 million, and 10 million, the n ’s
will be 500, 50,000, and 500,000, respectively. Now, think back to the sample accuracy graph
( Figure 10. 1 ). The highest sample size on that graph was 2,000, so obviously the percent rule
of thumb method can yield sample sizes that are absurd with respect to accuracy. Further, you
have also learned from the sample size axioms that a sample can be a very small percentage
of the total population and have great accuracy.
In sum, arbitrary sample sizes are simple and easy to apply, but they are neither effi -
cient nor economical. With sampling, we wish to draw a subset of the population in a thrifty
manner and to estimate the population values with some predetermined degree of accuracy.
“Percent rule of thumb” methods lose sight of the accuracy aspect of sampling; they certainly
violate some of the axioms about sample size and, as you just saw, they certainly are not cost-
eff ective when the population under study is large.
CONVENTIONAL SAMPLE SIZE SPECIFICATION The conventional approach follows some “convention” or number believed somehow to
be the right sample size. Managers who are knowledgeable of national opinion polls may
notice that they are often taken with sample sizes of between 1,000 and 1,200 respondents.
They may question marketing researchers whose sample size recommendations vary from
this convention. On the other hand, a survey may be one in a series of studies a company has
undertaken on a particular market, and the same sample size may be applied each succeeding
year simply because it was used last year. The convention might be an average of the sample
sizes of similar studies, it might be the largest sample size of previous surveys, or it might be
equal to the sample size of a competitor’s survey the company somehow discovered.
The basic diff erence between a percent rule of thumb and a conventional sample size
determination is that the fi rst approach has no defensible logic, whereas the conventional
approach appears logical. However, the logic is faulty. We just illustrated how a percent rule
of thumb approach such as a 5% rule of thumb explodes into huge sample sizes very quickly;
conversely, the national opinion poll convention of 1,200 respondents would be constant
regardless of the population size. Still, this characteristic is one of the conventional sample
size determination method’s weaknesses, for it assumes that (1) the manager wants an accu-
racy of around ±3% and (2) there is maximum variability in the population.
Adopting past sample sizes or taking those used by other companies can
be criticized as well, for both approaches assume that whoever determined
sample size in the previous studies did so correctly—that is, not with a fl awed
method. If a fl awed method was used, you simply perpetuate the error by
copying it, and if the sample size method used was not fl awed, the circum-
stances and assumptions surrounding the predecessor’s survey may be very
diff erent from those encompassing the present one. The conventional sample
size approach ignores the circumstances surrounding the study at hand and
may well prove to be much more costly than would be the case if the sample
size were determined correctly.
STATISTICAL ANALYSIS REQUIREMENTS SAMPLE SIZE SPECIFICATION On occasion, a sample’s size will be determined using a statistical analysis approach , meaning that the researcher wishes to perform a particular type of
data analysis that has sample size requirements. 18 In truth, the sample size for-
mulas in this chapter are appropriate for the simplest data analyses. 19 We have
not discussed statistical procedures as yet in this text, but we can assure you
that some advanced techniques require certain minimum sample sizes to be
reliable or to safeguard the validity of their statistical results. 20 Sample sizes
based on statistical analysis criteria can be quite large. 21
Arbitrary sample sizes are simple and easy to apply, but they are neither effi cient nor economical.
The conventional approach mistakenly
uses a “cookie cutter” that results in the
same sample size for every survey.
Using conventional sample size can result in a sample that may be too small or too large.
Conventional sample sizes ignore the special circumstances of the survey at hand.
© M
onke
y B
usin
ess
Imag
es/S
hutt
erst
ock
M10_BURN3261_08_GE_C10.indd 278M10_BURN3261_08_GE_C10.indd 278 16/08/16 2:34 pm16/08/16 2:34 pm

10-5 OTHER METHODS OF SAMPLE SIZE DETERMINATION 279
Sometimes a research objective is to perform subgroup analysis, 22 which is an investiga-
tion of subsegments within the population. As you would expect, the desire to gain knowledge
about subgroups has direct implications for sample size. 23 It should be possible to look at each
subgroup as a separate population and to determine sample size for each subgroup, along with
the appropriate methodology and other specifi cs to gain knowledge about that subgroup. That
is, if you were to use the standard sample size formula described in this chapter to determine
the sample size and more than one subgroup was to be analyzed fully, this objective would
require a total sample size equal to the number of subgroups multiplied by the standard sam-
ple size formula’s computed sample size. 24 Once this is accomplished, all subgroups can be
combined into a large group to obtain a complete population picture. If a researcher is using a
statistical technique, he or she should have a sample size large enough to satisfy the assump-
tions of the technique. Still, a researcher needs to know if that minimum sample size is large
enough to give the desired level of accuracy.
COST BASIS OF SAMPLE SIZE SPECIFICATION Sometimes termed the “all you can aff ord” approach , this method uses cost as an overriding
basis for sample size. Returning to the eighth sample size axiom, managers and marketing
research professionals are vitally concerned with the costs of data collection because they
can mount up quickly, particularly for personal interviews, telephone surveys, and even mail
surveys in which incentives are included in the envelopes. Thus, it is not surprising that cost
sometimes becomes the only basis for sample size.
Exactly how the “all you can aff ord” approach is applied varies a great deal. In some
instances, the marketing research project budget is determined in advance, and set amounts
are specifi ed for each phase. Here, the budget may have, for instance, $10,000 for interview-
ing, or it might specify $5,000 for data collection. A variation is for the entire year’s market-
ing research budget amount to be set and to have each project carve out a slice of that total.
With this approach, the marketing research project director is forced to stay within the total
project budget, but he or she can allocate the money across the various cost elements, and the
sample size ends up being whatever is aff ordable within the budget.
Specifying sample size based on a predetermined budget is a case of the tail wagging the
dog. That is, instead of establishing the value of the information to be gained from the survey
as the primary consideration in determining sample size, the focus is on budget factors that
usually ignore the value of the survey’s results to management. In addition, this approach
certainly does not consider sample accuracy at all. In fact, because many managers harbor a
large sample size bias, it is possible that their marketing research project costs are overstated
for data collection when smaller sample sizes could have suffi ced quite well. As can be seen
in our Marketing Research Insight 10. 3 , the Marketing Research Association Code of Ethics
excerpt warns that marketing researchers should not misrepresent sample methodology; the
code labels as unscrupulous taking advantage of any large sample size biases in clients as a
means of charging a high price or infl ating the importance of the fi ndings.
Still, as the fi nal sample size axiom advises, marketing researchers and their clients can-
not decide on sample size without taking cost into consideration. The key is to remember
when to consider cost. In the “all you can aff ord” examples we just described, cost drives
the sample size determination completely. When we have $5,000 for interviewing and a data
collection company tells us it charges $25 per completed interview, our sample is set at 200
respondents. However, the correct approach is to consider cost relative to the value of the
research to the manager. If the manager requires extremely precise information, the researcher
will surely suggest a large sample and then estimate the cost of obtaining the sample. The
manager, in turn, should then consider this cost in relation to how much the information is
actually worth. Using the cost schedule concept, the researcher and manager can then discuss
alternative sample sizes, diff erent data collection modes, costs, and other considerations. This
is a healthier situation, for now the manager is assuming some ownership of the survey and
Sometimes the researcher’s desire to use particular statistical techniques infl uences sample size.
The appropriateness of using cost as a basis for sample size depends on when cost factors are considered.
Using cost as the sole determinant of sample size may seem wise, but it is not.
M10_BURN3261_08_GE_C10.indd 279M10_BURN3261_08_GE_C10.indd 279 16/08/16 2:34 pm16/08/16 2:34 pm

280 CHAPTER 10 • DETERMINING THE SIZE OF A SAMPLE
a partnership arrangement is being forged between the manager and the researcher. The net
result will be a better understanding on the part of the manager as to how and why the fi nal
sample size was determined. This way cost will not be the only means of determining sample
size, but it will be given the consideration it deserves.
10- 6 Three Special Sample Size Determination Situations In concluding our exploration of sample size, let’s take up three special cases: sample size
when sampling from small populations, sample size when using a nonprobability sampling
method, and panel samples.
SAMPLING FROM SMALL POPULATIONS Implicit to all sample size discussions thus far in this chapter is the assumption that the popu-
lation is very large. This assumption is reasonable because there are multitudes of households
in the United States, millions of registered drivers, millions of persons over the age of 65, and
so forth. It is common, especially with consumer goods and services marketers, to draw sam-
ples from very large populations. Occasionally, however, the population is much smaller. This
is not unusual in the case of B2B marketers. This case is addressed by the condition stipulated
in our sixth sample size axiom, “In almost all cases, the accuracy (margin of sample error) of
a random sample is independent of the size of the population .”
As a general rule, a small population situation is one in which the sample exceeds 5%
of the total population size. Notice that a small population is defi ned by the size of the sample
under consideration. If the sample is less than 5% of the total population, you can consider the
population to be of large size, and you can use the procedures described earlier in this chapter.
On the other hand, if it is a small population, the sample size formula needs some adjustment
with what is called a fi nite multiplier , which is an adjustment factor that is approximately equal
to the square root of that proportion of the population not included in the sample. For instance,
suppose our population size was considered to be 1,000 companies and we decided to take a
sample of 500. That would result in a fi nite multiplier of about 0.71, or the square root of 0.5,
which is ([1,000 – 500]/1,000). That is, we could use a sample of only 355 (or 0.71 × 500) com-
panies, and it would be just as accurate as one of size 500 if we had a large population.
With small populations, you should use the fi nite multiplier to determine sample size.
Marketing Research Association Code of Ethics: Sample Considerations Sample—All sample-based research (qualitative and quantita-tive) should state parameters of the sample design employed. These include information on:
• Population of interest• Probability or non-probability design, with specifi cs on
selection method, such as simple random, multistage, etc.• Estimated population incidence of sample elements or
segments• Sampling frame and estimated degree of population
coverage• Sample size• Cooperation and or response rates, as appropriate
• Margin of error on the total sample and key segments of interest (for probability designs)
3. Infl uence no respondent’s opinion or attitude through direct or indirect attempts, including the framing or order of questions. During screening, prequalifi cation or other qualifi cation pro-cedures and data collection, great care must be taken to source and collect information impartially so that research results accurately refl ect reality.
Exceptions: Projects intending to determine how opinions can be manipulated such as message testing.
MARKETING RESEARCH INSIGHT 10. 3 Ethical Consideration
Source: Used courtesy of the Marketing Research Association.
M10_BURN3261_08_GE_C10.indd 280M10_BURN3261_08_GE_C10.indd 280 16/08/16 2:34 pm16/08/16 2:34 pm

10-6 THREE SPECIAL SAMPLE SIZE DETERMINATION SITUATIONS 281
The formula for computation of a sample size using the fi nite multiplier is as follows:
Small population sample size formula
Small Population Sample Size = sample size formula n * AN - nN - 1
Here is an example using the 1,000 company population. Suppose we want to know
the percentage of companies interested in a substance abuse counseling program for their
employees off ered by a local hospital. We are uncertain about the variability, so we use our
50/50 worst-case approach. We decide to use a 95% level of confi dence, and the director of
Counseling Services at Claremont Hospital would like the results to have an accuracy of ±5%.
The computations are as follows:
Sample size computed with p = 50%, q = 50%, and e = 5%
n =1.962 (pq)
e2
= 1.962 (50 * 50)
52
=3.84 (2,500)
25
=9,600
25
= 384
Now, since 384 is larger than 5% of the 1,000 company population, we apply the fi nite
multiplier to adjust the sample size for a small population:
Example: Sample size formula to adjust for a small population size
Small Size Population Sample = nAN - nN - 1
= 384A1,000 - 384
1,000 - 1
= 384A616
999
= 3842.62
= 384 * .79
= 303
In other words, we need a sample size of 303, not 384, because we are working with
a small population. By applying the fi nite multiplier, we can reduce the sample size by 81
respondents and achieve the same accuracy level. If this survey required personal interviews,
we would gain a considerable cost savings.
SAMPLE SIZE USING NONPROBABILITY SAMPLING All sample size formulas and other statistical considerations treated in this chapter assume
that some form of probability sampling method has been used. In other words, the sample
must be random with regard to selection, and the only sampling error present is due to sam-
ple size. Remember, sample size determines the accuracy, not the representativeness, of the
sample. The sampling method determines the representativeness. All sample size formulas
assume that representativeness is guaranteed with use of a random sampling procedure.
Appropriate use of the fi nite multiplier formula will reduce a calculated sample size and save money when performing research on small populations.
When using nonprobability sampling, sample size is unrelated to accuracy, so cost–benefi t considerations must be used.
M10_BURN3261_08_GE_C10.indd 281M10_BURN3261_08_GE_C10.indd 281 16/08/16 2:34 pm16/08/16 2:34 pm

282 CHAPTER 10 • DETERMINING THE SIZE OF A SAMPLE
Synthesize Your Learning
This exercise will require you to take into consideration concepts and material from these two chapters. Chapter 9 Selecting the Sample Chapter 10 Determining the Size of a Sample
Niagara Falls Tourism Association
One of the most popular tourist destinations in the United States is Niagara Falls, located on the U.S.–Canada border in northern New York. An estimated 12 million tourists visit Niagara Falls each year. However, while its attractiveness has not changed, environmental fac-tors have recently threatened to significantly decrease these numbers. At least three factors are at work: (1) a sluggishly recovering national economy, (2) the substantial weakening of the global economy, and (3) increased competition by beefed-up marketing efforts of other tour-ist attractions that are experiencing declines due to the first two factors.
A large majority of Niagara Falls visitors are Americans who drive to the location, so fam-ily financial worries have the Niagara Falls Tourism Association especially concerned. The association represents all types of businesses in the greater Niagara area that rely on tourism. Among their members are 80 hotels that account for approximately 16,000 rooms. The hotels have anywhere from 20 to 600 rooms, with a large majority (about 80%, accounting for 30% of the rooms) being local and smaller, and the larger ones (the remaining 20%, accounting for 70% of the rooms) being national chains and larger. For all hotels in the area, occupancy at peak season (June 15–September 15) averages around 90%. The association wants to con-duct a survey of current visitors to evaluate their overall satisfaction with their visit to the Niag-ara area and their intentions to tell friends, relatives, and coworkers to visit Niagara Falls. The association has designed a face-to-face interview questionnaire, and it has issued a request for proposals for sample design. It has received three bids, each of which is described here.
Bid 1. The Maid of the Mist union—employees of the company that operates the boats that take tourists on the Niagara River to view and experience the falls—proposes to do the interviews with tourists who are waiting for the Maid boats to return and load up. Union employees will conduct interviews with 1,000 adult American tourists (one per family group) during a one-week period in July at $3 per completed interview. Bid 2. The Simpson Research Company, a local marketing research company, proposes to take a sample of the five largest association member hotels and conduct 200 inter-views in the lobbies of these hotels with American tourists (one per family) during the months of July and August at a cost of $5 per completed interview. Bid 3. The SUNY-Niagara Marketing Department, an academic unit in the local univer-sity, proposes to randomly select 20 hotels from all hotels in the area (not just those belonging to the Tourism Association) and to then select a proportional random sample of rooms, using room numbers, from each selected hotel based on hotel room capacities. It will interview 750 American tourists (one per family) in their rooms during the period of June 15–September 15 at a cost of $10 per completed interview.
Questions
1. What is the sample frame in each bid? 2. Identify the type of sample method and assess the representativeness of the sample
with respect to American tourists visiting the Niagara Falls area. 3. Evaluate the accuracy (sample error) with each bid. 4. The Niagara Falls Tourism Association has budgeted $5,000 for data collection in this
survey. Using information from your answers to questions 1 to 3 and further consider-ing the total cost of data collection, which one of the proposals do you recommend that the Niagara Falls Tourist Association accept? Justify your recommendation.
M10_BURN3261_08_GE_C10.indd 282M10_BURN3261_08_GE_C10.indd 282 16/08/16 2:34 pm16/08/16 2:34 pm

SUMMARY 283
The only reasonable way of determining sample size with nonprobability sampling is to
weigh the benefi t or value of the information obtained with that sample against the cost of
gathering that information. Ultimately, this is a subjective exercise, as the manager may place
signifi cant value on the information for a number of reasons. For instance, the information
may crystallize the problem, it may open the manager’s eyes to vital additional consider-
ations, or it might even make him or her aware of previously unknown market segments. 25 But
because of the unknown bias introduced by a haphazard sample selection 26 process, it is inap-
propriate to apply sample size formulas. For nonprobability sampling, sample size is a judg-
ment based almost exclusively on the value of the biased information to the manager, rather
than desired precision, relative to cost. Many managers do select nonprobability sampling
plans, knowing their limitations. In these cases, the sample size question is basically, “How
many people will it take for me to feel comfortable in making a decision?”
SAMPLING FROM PANELS As has been noted several times in this text book , many prospective respondents refuse to take
part in surveys, and this fact severely impacts the accuracy of the fi nal sample. That is, sample
size formulas assume 100% response rates: every person chosen takes part in the survey. Or, if
anyone refuses, it is assumed that a perfectly identical person is drawn as a substitute. So, as
also has been described earlier, panel companies recruit hundreds of thousands of panel mem-
bers who take surveys for various types of compensation. Using a panel company is somewhat
expensive, but it is expedient and guarantees delivery of the specifi ed number of completed
surveys. Most panel companies claim random selection of some sort, so there is the appear-
ance of a random sample of the population. Consequently, it is common practice for marketing
researchers, particularly the do-it-yourselfers, to consider a panel sample to be a random sample.
The truth is, however, that because panel members are volunteers who take part in sur-
veys often, they are not truly representative of the general population. Panel samples are at
best representative of the panel populations from which they are drawn. Often the panel popu-
lation is a reasonable sample frame, and companies are content with the accuracy levels mar-
keting researchers ascribe to their panel samples. Unfortunately, every panel is unique, and
universal acceptance or condemnation of the integrity of a sample drawn from panel members
is unacceptable. The marketing research industry is in the process of examining and generat-
ing guidelines for the assessment of the accuracy of panel samples. 27 For instance, recommen-
dations have been put forth for diligent review of all responses to catch cheaters and speeders,
for careful defi nition of sample parameters and selection criteria, for inspection to weed out
respondents who take excessive amounts of surveys, and for scrutiny of IP addresses to ensure
that international survey participants are located in countries they represent. At this time,
panel sample integrity and accuracy are a work in progress that most probably will ultimately
be incorporated in the Marketing Research Association Code of Ethics.
IBM SPSS Student Assistant Coca-Cola: Sorting, Searching, and Inserting Variables and Cases
Summary
Many managers adhere to the “large sample size” bias.
To counter this myth, eight sample size axioms relate the
size of a random sample to its accuracy, or closeness of its
fi ndings to the true population value. These axioms are the
basis for the confi dence interval sample size determination
method, which is the most correct method because it relies
on sound logic based upon the statistical concepts of vari-
ability, confi dence intervals, and margin of sample error.
When estimating a percentage, marketing researchers
rely on a standard sample size formula that uses variability
( p and q ), level of confi dence ( z ), and acceptable margin
of sample error ( e ) to compute the sample size, n . Confi -
dence levels of 95% or 99% are typically applied, equating
to z values of 1.96 and 2.58, respectively. For variability
with percentage estimates, the researcher can fall back on
a 50%/50% split, which is the greatest variability case pos-
sible. When estimating a mean, another formula is used.
The standard sample size formula is best considered a start-
ing point for deciding the fi nal sample size, for data collec-
tion costs must be taken into consideration. Normally, the
M10_BURN3261_08_GE_C10.indd 283M10_BURN3261_08_GE_C10.indd 283 16/08/16 2:34 pm16/08/16 2:34 pm

284 CHAPTER 10 • DETERMINING THE SIZE OF A SAMPLE
Review Questions/Applications
10- 1. When determining sample size, what is the basic dif-
ference between a “percent rule of thumb” approach
and a “conventional” approach?
10- 2. What is the confi dence interval formula for calcu-
lating sample size? Describe all the elements of the
formula.
10- 3. What are the disadvantages of using the “all you can
aff ord” approach when determining sample size?
10- 4. What are some of the methods that researchers
could employ while estimating standard deviation?
10- 5. Dabur wants to conduct a nationwide quantitative
study to map the usage of almond oil. However, the
variability is unknown to the manager, who wishes
to calculate the sample size that she might need to
conduct the research. She wants a confi dence level
of 95% with precision (allowable error) of 65%. Determine the sample size using the formula in the
text, and arrive at a fi gure that the manager could
use in this case, where the variability is unknown.
10- 6. How can sample size and the cost of data collection
be balanced?
10- 7. What is a worst-case variability?
10- 8. What is a small population? What is a fi nite multi-
plier in the context of a small population?
10- 9. A researcher knows from experience the average
costs of various data collection alternatives:
Data Collection Method Cost/Respondent
Personal interview $50
Telephone interview $25
Mail survey $ 0.50 (per mail-out)
If $2,500 is allocated in the research budget for
data collection, what are the levels of accuracy for
the sample sizes allowable for each data collection
method? Based on your fi ndings, comment on the
inappropriateness of using cost as the only means of
determining sample size.
10- 10. Hamdard Laboratories, a manufacturer of alterna-
tive medicines based in India, conducted a study
last year and found that 30% of the public preferred
alternative medicine over mainstream modern med-
icine for skin- and hair-related problems. This year,
the company wants to have a nationwide telephone
survey performed with random digit dialing. What
sample size should be used in this year’s study to
achieve an accuracy level of 62.5% at the 99%
level of confi dence? What about at the 95% level of
confi dence?
10- 11. Allbookstores.com has a used textbook division.
It buys its books in bulk from used book buyers
who set up kiosks on college campuses during fi nal
Key Terms
Sample accuracy (p. 264 )
Large sample size bias (p. 265 )
Confi dence interval approach (p. 265 )
Nonsampling error (p. 266 )
Margin of sampling error (p. 267 )
Variability (p. 267 )
Maximum margin of sample error
(p. 268 )
Confi dence interval (p. 269 )
Central limit theorem (p. 269 )
Confi dence interval method
(p. 271 )
Acceptable margin of sample error
(p. 272 )
Worst-case variability (p. 275 )
Arbitrary approach (p. 277 )
Conventional approach (p. 278 )
Statistical analysis approach
(p. 278 )
“All you can aff ord” approach
(p. 279 )
Small population (p. 280 )
Finite multiplier (p. 280 )
researcher and manager will discuss the alternative sample
error levels and their associated data collection costs to
come to agreement on a fi nal acceptable sample size.
Although they have limitations, there are other meth-
ods of determining sample size: (1) designating size arbi-
trarily, (2) using a “conventional” size, (3) basing size on
the requirements of statistical procedures to be used, and
(4) letting cost determine the size. Two sampling situations
raise special considerations. With a small population, the
fi nite multiplier should be used to adjust the sample size
determination formula. With nonprobability sampling, a
cost–benefi t analysis should take place.
M10_BURN3261_08_GE_C10.indd 284M10_BURN3261_08_GE_C10.indd 284 30/08/16 9:52 am30/08/16 9:52 am

REVIEW QUESTIONS/APPLICATIONS 285
exams, and it sells the used textbooks to students
who log on to the allbookstores.com website via a
secured credit card transaction. The used texts are
then sent by United Parcel Service to the student.
The company has conducted a survey of used book
buying by college students each year for the past
four years. In each survey, 1,000 randomly selected
college students have been asked to indicate
whether they bought a used textbook in the previous
year. The results are as follows:
Years Ago
1 2 3 4
Percent buying
used text(s)
45% 50% 60% 70%
What are the sample size implications of these
data?
10- 12. American Ceramics, Inc. (ACI) has been developing
a new form of ceramic that can withstand high tem-
peratures and sustained use. Because of its improved
properties, the project development engineer in
charge of this project thinks the new ceramic will
compete as a substitute for the ceramic currently
used in spark plugs. She talks to ACI’s market-
ing research director about conducting a survey of
prospective buyers of the new ceramic material.
During their phone conversation, the research direc-
tor suggests a study using about 100 companies as
a means of determining market demand. Later that
day, the research director does some background
work using the Thomas Register as a source of
names of companies manufacturing spark plugs.
A total of 312 companies located in the continen-
tal United States are found in the register. How
should this fi nding impact the fi nal sample size of
the survey?
10- 13. Here are some numbers you can use to sharpen your
computational skills for sample size determination.
Crest toothpaste is reviewing plans for its annual
survey of toothpaste purchasers. With each case that
follows, calculate the sample size pertaining to the
key variable under consideration. Where informa-
tion is missing, provide reasonable assumptions.
Key Variable Variability Acceptable Error Confi dence Level
a Market share of Crest toothpaste last year 23% share 4% 95%
b Percent of people who brush their teeth per week Unknown 5% 99%
c How likely Crest buyers are to switch brands 30% switched last year 5% 95%
d Percent of people who want tartar-control features
in their toothpaste
20% two years ago;
40% one year ago
3.5% 95%
e Willingness of people to adopt the toothpaste
brand recommended by their family dentist
Unknown 6% 99%
10- 14. Do managers really have a large sample size bias?
Because you cannot survey managers easily, this
exercise will use surrogates. Ask any fi ve seniors
majoring in business administration who have not
taken a marketing research class the following
questions. Indicate whether each of the following
statements is true or false.
a. A random sample of 500 is large enough to represent
all full-time college students in the United States.
b. A random sample of 1,000 is large enough to
represent all full-time college students in the
United States.
c. A random sample of 2,000 is large enough to
represent all full-time college students in the
United States.
d. A random sample of 5,000 is large enough to
represent all full-time college students in the
United States.
What have you found out about sample size bias?
10- 15. The following items pertain to determining sample
size when a mean is involved. Calculate the sample
size for each case.
Key Variable Standard Deviation Acceptable Error Confi dence Level
a Number of car rentals per year for business trip usage 10 2 95%
b Number of songs downloaded with iTunes per month 20 2 95%
c Number of miles driven per year to commute to work 500 50 99%
d Use of a 9-point scale measuring satisfaction with the
brand
2 0.3 95%
M10_BURN3261_08_GE_C10.indd 285M10_BURN3261_08_GE_C10.indd 285 16/08/16 2:34 pm16/08/16 2:34 pm

286 CHAPTER 10 • DETERMINING THE SIZE OF A SAMPLE
CASE 10. 1
Target: Deciding on the Number of Telephone Numbers
Target is a major retail store chain specializing in good-
quality merchandise and good values for its customers.
Currently, Target operates about 1,700 stores, including
more than 200 “Super Targets,” in major metropolitan areas
in 48 states. One of the core marketing strategies employed
by Target is to ensure that shoppers have a special experi-
ence every time they shop at Target. This special shopping
experience is enhanced by Target’s “intuitive” department
arrangements. For example, toys are next to sporting goods.
Another shopping experience feature is the “racetrack” or
extra wide center aisle that helps shoppers navigate the
store easily and quickly. A third feature is the aesthetic
appearance of its shelves, product displays, and seasonal
specials. Naturally, Target continuously monitors the opin-
ions and satisfaction levels of its customers because com-
petitors are constantly trying to outperform Target and/or
customer preferences change.
Target management has committed to an annual sur-
vey of 1,000 customers to determine these very issues and
to provide for a constant tracking and forecasting system
of customers’ opinions. The survey will include custom-
ers of Target’s competitors such as Walmart, Kmart, and
Sears. In other words, the population under study is all
consumers who shop in mass merchandise stores in Tar-
get’s geographic markets. The marketing research project
director has decided on the use of a telephone survey to
be conducted by a national telephone survey data collec-
tion company, and he is currently working with Survey
Sampling, Inc. (SSI), to purchase the telephone numbers of
consumers residing in Target’s metropolitan target markets.
SSI personnel have informed him of the basic formula they
use to determine the number of telephone numbers needed.
The formula is as follows:
Telephone numbers needed = completed interviews> (working phone rate * incidence * completion rate)
where
working phone rate = percent of telephone numbers
that are “live”
incidence = percentage of those reached that will take
part in the survey
completion rate = percentage of those willing to take
part in the survey that will actually complete the survey
As a matter of convenience, Target identifies four
diff erent regions that are roughly equal in sales volume:
North, South, East, and West.
1. With a desired fi nal sample size of 250 for each region,
what is the lowest total number of telephone numbers
that should be purchased for each region?
10- 16. The Andrew Jergens Company markets Wet Skin
Moisturizers, which are applied to a woman’s skin
while she takes a shower. From previous research,
Jergens management knows that 60% of all women
use some form of skin moisturizer and 30% believe
their skin is their most beautiful asset. There is some
concern among management that women will asso-
ciate the drying aspects of taking a shower while
applying Wet Skin Moisturizer and not believe that
it can provide a skin moisturizing benefi t. Can these
facts about use of moisturizers and concern for skin
beauty be used in determining the size of the sample
in the Wet Skin Moisturizers survey? If so, indicate
how. If not, indicate why and how sample size can
be determined.
10- 17. Donald Heel is the Microwave Oven Division
Manager of Sharp Products. Don proposes a $40
cash rebate program as a means of promoting
Sharp’s new crisp-broil-and-grill microwave oven.
However, the Sharp president wants evidence
that the program would increase sales by at least
25%, so Don applies some of his research budget
to a survey. He uses the National Phone Systems
Company to conduct a nationwide survey using
random digit dialing. National Phone Systems is
a fully integrated telephone polling company, and
it has the capability of providing daily tabulations.
Don decides to use this option, and instead of
specifying a fi nal sample size, he chooses to have
National Phone Systems perform 50 completions
each day. At the end of fi ve days of fi eldwork, the
daily results are as follows:
Day 1 2 3 4 5
Total sample size 50 100 150 200 250
Percentage of
respondents who
would consider
buying a Sharp
microwave with a
$40 rebate
50% 40% 35% 30% 33%
For how much longer should Don continue the
survey? Indicate your rationale.
M10_BURN3261_08_GE_C10.indd 286M10_BURN3261_08_GE_C10.indd 286 16/08/16 2:34 pm16/08/16 2:34 pm

REVIEW QUESTIONS/APPLICATIONS 287
2. With a desired fi nal sample size of 250 for each region,
what is the highest total number of telephone numbers
that should be purchased for each region?
3. What is the lowest and highest total number of
telephone numbers to be purchased for the entire
survey?
Scope, a Procter & Gamble (P&G) brand, competes with
several other mouthwash brands. Listerine has been the
market leader for the past several years while Scope, Crest,
and Colgate have been market followers. In an attempt to
make Scope more competitive, the Scope brand manager
has decided to undertake an extensive market research
investigation of the mouthwash market in the United States
to discover unsatisfi ed latent needs in mouthwash users and
to identify the strengths and weaknesses of the competi-
tors. Hopefully, this research endeavor will generate some
signifi cant improvements for Scope that will ultimately
result in appreciable market share. In particular, the deci-
sion has been made to purchase panel access, meaning that
the online survey will be completed by individuals who
have joined the ranks of the panel data company and agreed
to periodically answer surveys online. Although these
individuals are compensated by their panel companies,
the companies claim that their panel members are highly
representative of the general population. Also, because the
panel members have provided extensive information about
themselves such as demographics, lifestyles, and product
ownership, which is all stored in the panel company data-
base, a client can purchase these data without the necessity
of asking these questions on its survey.
After doing some investigation, the Scope marketing
team has concluded that several panel companies can pro-
vide a representative sample of U.S. households. Among
these are Knowledge Networks, e-Rewards, and Survey
Sampling International, and their costs and services seem
comparable. For a “blended” online survey of about
25 questions, the cost is roughly $10 per completed
response. “Blended” means a combination of stored data-
base information and answers to online survey questions.
Thus, the costs of these panel company services are based
on the number of respondents, and each company will bid
on the work based on the nature and size of the sample.
The Scope brand manager is operating under two con-
straints. First, P&G top management has agreed to pay the
total cost for all the research, and it is up to the Scope brand
manager to spend this budget prudently. If a large portion
of the budget is expended on a single activity, such as the
cost of an online panel sample, there is less available for
other research activities. Second, the Scope brand manager
knows that P&G top management will expect this project
to have a large sample size. Of course, from past experi-
ence, the brand manager realizes that large sample sizes are
generally not required from a sample error standpoint, but
he must be prepared to respond to questions, reservations,
or objections from his P&G managers when the sample
size is proposed. As preparation for the possible need to
convince top management that his recommendation is the
right decision for the sample size for the Scope survey, and
with the help of his marketing research staff specialist, he
decides to make a table that specifi es sample error and cost
of the sample.
For each of the following possible sample sizes listed
here, calculate the associated expected cost of the panel
sample and the sample error.
1. 20,000
2. 10,000
3. 5,000
4. 2,500
5. 1,000
6. 500
CASE 10. 2
Scope Mouthwash
Region North South East West
Low High Low High Low High Low High
Working Rate 70% 75% 60% 65% 65% 75% 50% 60%
Incidence 65% 70% 70% 80% 65% 75% 40% 50%
Completion Rate 50% 70% 50% 60% 80% 90% 60% 70%
M10_BURN3261_08_GE_C10.indd 287M10_BURN3261_08_GE_C10.indd 287 16/08/16 2:34 pm16/08/16 2:34 pm

▶
LEARNING OBJECTIVES In this chapter you will learn:
11- 1 What constitutes sampling error
11- 2 About errors that occur during fi eld data collection
11- 3 How to control fi eld data collections error
11- 4 All about nonresponse error
11- 5 How panel companies control errors
11- 6 What a dataset, coding of data, and the data code book are
11- 7 Data quality issues in data sets
“WHERE WE ARE”
1 Establish the need for marketing
research.
2 Defi ne the problem.
3 Establish research objectives.
4 Determine research design.
5 Identify information types and
sources.
6 Determine methods of accessing
data.
7 Design data collection forms.
8 Determine the sample plan and size.
9 Collect data.
10 Analyze data.
11 Prepare and present the fi nal
research report.
Discuss.io
Customer feedback is vital for successful prod-
uct development. That type of feedback, how-
ever, can be more complex than most people
anticipate. Quantitative market research, or
the numerical evaluation of a market, is popu-
lar for charting overall effi cacy. Qualitative
methods such as focus groups and individual
discussions, meanwhile, help us understand
why products are appealing. Such methods also require a more inter-
personal approach. Time-intensive recruiting and travel are common
drawbacks of the method, as modern product development is far faster.
Bringing qualitative research into the information age, Seattle-based
Discuss.io makes possible remote market interviews in real time.
Online qualitative research platforms are simplifying the qualitative
process signifi cantly. Discuss.io, for instance, fi rst is given a hypothesis
or problem by a client. Then it formulates a discussion guide to help the
brand fi lter key information from respondents. From there, its patent-
pending Rapid Recruiter automatically matches brands with participants
in their target demographics. Millions of participants volunteer from over
20 countries, and translators are available in 14 languages. Immediate
access to respondents dramatically increases research agility and speed,
dodging the usual months-long recruitment and review process. Further,
it places far more voices and perspectives in the limelight. Researchers
can make instant market segmentations across much of the world, radi-
calizing how brands develop and localize their goods.
Once impossible because of technological limitations, online inter-
view services are now generating a resurgence in qualitative methods
and theory. Bandwidth-effi cient, HD video streams offer the same obser-
vational detail as real life. Qualitative market research analyzes the total
communication picture, and body language plays a huge role. Lifelike
detail is important in examining a participant’s full set of reactions, as well
11 Dealing with Fieldwork and Data Quality Issues
Zach Simmons,
founder, Discuss.io
M11_BURN3261_08_GE_C11.indd 288M11_BURN3261_08_GE_C11.indd 288 30/08/16 10:23 am30/08/16 10:23 am

289
as in facilitating productive conversation. With AV quality now up to par, online
qualitative research matches the accuracy of its traditional, real-life counterpart.
Reducing project time condenses development cycles, particularly com-
pared to traditional qualitative research. Discuss.io decreases expenses by up
to 80%, as travel, facility rentals, accommodations, and the like are no lon-
ger needed. This opens new opportunities for brands that could not support the expense
that past qualitative methods would have entailed. A huge enabler for organizations without
large-scale budgets, Discuss.io helps level the playing fi eld. Ideas once deemed too expen-
sive or risky become worthwhile to investigate, spurring originality and innovation.
Online qualitative research’s applicability is as vast as its potential. Unilever took an inter-
est in Discuss.io’s platform and unique approach in early 2014. Thirty pages of Unilever feed-
back and several platform revisions later, Discuss.io is now operating in 26 countries and
serving dozens of clients. It has garnered numerous honors as well, having been named one
of the Top 50 Most Innovative Research Firms in the 2015 GRIT Report and listed in Unilever’s
Foundry50. If the rising prominence of online qualitative research is any indication, Discuss.io
and similar services will continue improving their technology and methods to enhance the
opportunities available to organizations worldwide.
Source: Text and photos courtesy of Zach Simmons, CEO, Discuss.io
Visit Discuss.io at www.discuss.io
This chapter deals with data collection and data quality issues, an arena in which
Discuss.io excels. There are two kinds of errors in survey research. The first is sam-
pling error, which arises from the fact that we have taken a sample. Those sources of
error were discussed in the previous chapter. Error may also arise from a respondent who
does not listen carefully to the question or from an interviewer who is almost burned out from
listening to answering machines or having prospective respondents hang up. This second
type of error is called nonsampling error . This chapter discusses the sources of nonsampling
errors and suggests how marketing researchers can minimize the negative effect of each type
of error. We also address how to calculate the response rate to measure the amount of nonre-
sponse error. We indicate what a researcher looks for in preliminary questionnaire screening
after the survey has been completed to spot respondents whose answers may exhibit bias,
such as always responding positively (or negatively) to questions.
11- 1 Data Collection and Nonsampling Error In the two previous chapters, you learned that the sample plan and sample size are important
in predetermining the amount of sampling error you will experience. The signifi cance of
understanding sampling is that we can control sampling error. 1 The counterpart to sampling
error is nonsampling error , which consists of all errors in a survey except those attributable
to the sample plan and sample size. Nonsampling error includes (1) all types of nonresponse
error, (2) data-gathering errors, (3) data-handling errors, (4) data analysis errors, and
(5) interpretation errors. It also includes errors in problem defi nition and question wording—
everything, as we have said, other than sampling error.
Nonsampling error consists of all errors in a survey except those due to the sample plan and sample size.
M11_BURN3261_08_GE_C11.indd 289M11_BURN3261_08_GE_C11.indd 289 16/08/16 5:03 pm16/08/16 5:03 pm

290 CHAPTER 11 • DEALING WITH FIELDWORK AND DATA QUALITY ISSUES
Generally, there is great potential for large nonsampling error to occur during the data col-
lection stage, so we discuss errors that can occur during this stage at some length. Data col-lection is the phase of the marketing research process during which respondents provide their
answers or information in response to inquiries posed by the researcher. These inquiries may be
direct questions asked by a live, face-to-face interviewer; they may be posed over the telephone;
they may be administered by the respondent alone, as with an online survey; or they may take
some other form of solicitation that the researcher has decided to use. Because nonsampling
error cannot be measured by a formula as sampling error can, we describe the various con-
trols that can be imposed on the data collection process to minimize the eff ects of nonsampling
error. 2 Also, much marketing research utilizes panel companies that maintain very large num-
bers of respondents who are guaranteed to fi ll out surveys quickly and accurately. Therefore, we
describe the safeguards that panel companies employ to ensure the quality of their data.
11- 2 Possible Errors in Field Data Collection A wide variety of nonsampling errors can occur during data collection. We divide these errors
into two general types and further specify errors within each general type. The fi rst general
type is fi eldworker error , defi ned as errors committed by the individuals who administer
questionnaires, typically interviewers. 3 The quality of fi eldworkers can vary dramatically
depending on the researcher’s resources and the circumstances of the survey, but it is impor-
tant to keep in mind that fi eldworker error can occur with professional data collection workers
as well as with do-it-yourselfers. Of course, the potential for fi eldworker error is less with pro-
fessionals than with fi rst-timers or part-timers. The other general type is respondent error ,
which consists of errors on the part of the respondent. These errors, of course, can occur
regardless of the method of data collection, but some data collection methods have greater
potential for respondent error than others. Within each general type, we identify two classes
of error: intentional errors, or errors that are committed deliberately, and unintentional errors,
or errors that occur without willful intent. 4 Table 11. 1 lists the various errors/types of errors
described in this section under each of the four headings. In the early sections of this chapter,
we will describe these data collection errors; later, we will discuss the standard controls that
marketing researchers employ to minimize these errors.
INTENTIONAL FIELDWORKER ERRORS Intentional fi eldworker errors occur whenever a data collector willfully violates the data
collection requirements set forth by the researcher. We describe two variations of intentional
fi eldworker errors: interviewer cheating and leading the respondent. Both are constant con-
cerns of all researchers.
Interviewer cheating occurs when the interviewer intentionally misrepresents respon-
dents. You might think to yourself, “What would induce an interviewer to intentionally falsify
There is the potential for large nonsampling error to occur during the data collection stage in a survey.
Nonsampling errors are committed by fi eldworkers and respondents.
TABLE 11. 1 Data Collection Errors Can Occur with Fieldworkers or Respondents
Fieldworker Errors Respondent Errors
Intentional Errors • Cheating
• Leading respondents
• Falsehoods
• Nonresponse
Unintentional Errors • Interviewer characteristics
• Misunderstandings
• Fatigue
• Misunderstanding
• Guessing
• Attention loss
• Distractions
• Fatigue
M11_BURN3261_08_GE_C11.indd 290M11_BURN3261_08_GE_C11.indd 290 16/08/16 5:03 pm16/08/16 5:03 pm

11-2 POSSIBLE ERRORS IN FIELD DATA COLLECTION 291
responses?” The cause is often found in the compensation system. 5 Interviewers may work by
the hour, but another common practice is to reward them by completed interviews. That is, a
telephone interviewer or a mall-intercept interviewer may be paid at a rate of $7.50 per com-
pleted interview. At the end of an interview day, he or she simply turns in the “completed”
questionnaires (or data fi les, if the interviewer uses a laptop, tablet, or PDA system), and the
number is credited to the interviewer. The opportunity to infl ate the number of completed inter-
views is clear. Other interviewers may cheat by interviewing someone who is convenient to
access instead of a person designated by the sampling plan. Again, the by-completed-interview
compensation arrangement may provide an incentive for this type of cheating. 6 Further, most
interviewers are not full-time employees, 7 and their integrity may be diminished as a result. You might ask, “Wouldn’t changing the compensation system for interviewers fi x this
problem?” There is some defensible logic for a paid-by-completion compensation system.
Interviewers do not always work like production-line workers. With mall intercepts, for
instance, there are periods of inactivity, depending on mall shopper fl ow and respondent qual-
ifi cation requirements. Telephone interviewers are often instructed to call only during a small
number of “prime time” hours in the evening, or they may be waiting for periods of time to
satisfy the policy on number of call-backs for a particular survey. Also, as you may already
know, the compensation levels for fi eldworkers are low, the hours are long, and the work is
frustrating at times. 8 As a result, the temptation to turn in bogus completed questionnaires is
certainly present, and some interviewers give in to this temptation.
The second error that we are categorizing as intentional on the part of the interviewer is
leading the respondent , or attempting to infl uence the respondent’s answers through word-
ing, voice infl ection, or body language. In the worst case, the interviewer may actually reword
a question so that it does lead the respondent to answer in a certain way. For instance, consider
the question: “Is conserving electricity a concern for you?” An interviewer can infl uence the
respondent by changing the question to “Isn’t conserving electricity a concern for you?” Another area of subtle leading occurs in interviewers’ cues. In personal interviews, for
instance, interviewers might ever so slightly shake their heads “no” to questions they disagree
with, and nod “yes” to those they agree with, while posing the question. Respondents may per-
ceive these cues and begin responding in the manner signaled by interview-
ers’ nonverbal cues. Over the telephone, interviewers might give verbal cues
such as “unhuh” to responses they disagree with or “okay” to responses they
agree with, and this continued reaction pattern may subtly infl uence respon-
dents’ answers. Again, we have categorized these examples as intentional
errors because professional interviewers are trained to avoid them, so if they
commit such errors, they are likely to be aware of their violations.
UNINTENTIONAL FIELDWORKER ERRORS An unintentional interviewer error occurs whenever an interviewer com-
mits an error while believing that he or she is performing correctly. 9 There
are three general sources of unintentional interviewer errors: interviewer
personal characteristics, interviewer misunderstandings, and interviewer
fatigue. Unintentional interviewer error is found in the interviewer’s per-
sonal characteristics such as accent, sex, and demeanor. It has been shown
that under some circumstances, the interviewer’s voice, 10 speech, 11 gen-
der, 12 or lack of experience 13 can be a source of bias. The simple act of
wearing a fl ower in the hair has been shown to increase compliance to
survey requests by female interviewers. 14 In fact, the mere presence of an
interviewer, regardless of personal characteristics, may be a source of bias. Interviewer misunderstanding occurs when an interviewer believes
he or she knows how to administer a survey but instead does it incorrectly.
Interviewer cheating is a concern, especially when compensation is calculated on a per-completed-interview basis.
Interviewers should not infl uence respondents’ answers.
Unintentional interviewer errors include misunderstandings and fatigue.
Personal characteristics such as
appearance, dress, or accent may cause
unintentional fi eldworker errors.
© W
arre
n G
olds
wai
n/S
hutt
erst
ock
M11_BURN3261_08_GE_C11.indd 291M11_BURN3261_08_GE_C11.indd 291 16/08/16 5:03 pm16/08/16 5:03 pm

292 CHAPTER 11 • DEALING WITH FIELDWORK AND DATA QUALITY ISSUES
Active Learning
What Type of Cheater Are You?
Students who read about the cheating error we have just described are sometimes skeptical that such cheating goes on. However, if you are a “typical” college student, you probably have cheated to some degree in your academic experience. Surprised? Take the following test, and circle “Yes” or “No” under the “I have done this” heading for each statement.
Statement I have done this.
1. Allowed someone else to copy your homework/assignments Yes No
2. Collaborated on assignments you were supposed to do alone Yes No
3. Copied another student's homework/assignments Yes No
4. Told another student what was on an exam before he or she took it Yes No
5. Found out what was on an exam before taking it Yes No
6. Kept silent about other students who you know cheated Yes No
7. Split homework questions with another student and handed them in as your own work
Yes No
8. Collaborated on take-home exams you were supposed to do alone Yes No
9. Lied about or exaggerated personal or family situations in order to get an assignment deadline extended
Yes No
10. Lied about or exaggerated personal or family situations in order to delay taking an exam
Yes No
11. Looked at or copied from someone else's exam during a test Yes No
12. Allowed someone else to copy from your exam during a test Yes No
13. Programmed extra help or information into a calculator to use on an exam
Yes No
14. Brought in concealed information to use during an exam Yes No
15. Obtained a copy of an exam before it was officially available Yes No
16. Allowed someone else to do your work and turned it in as your own Yes No
17. Left the room during an exam to look up information or get help Yes No
18. Altered answers on a graded test or assignment and then submitted it for regrading
Yes No
19. Removed tests from the classroom without an instructor's permission Yes No
20. Used a cell phone to transmit or receive information during an exam Yes No
Statements 1–10 are considered “trivial” cheating, and a majority of college students admit to them. Statements 11–20 are considered “serious” cheating, and perhaps up to 20% of college students are guilty of committing some of these actions. Thus, if you circled “Yes” for some of these cheating practices, you are consistent with most college students. 15 Now, if you and the majority of college students in general are cheating to some extent on examinations and assignments, don’t you think that interviewers who may be in financially tight situations are tempted to “cheat” on their interviews?
As we have described, a questionnaire may include various types of instructions for the inter-
viewer, a variety of response scales, directions on how to record responses, and other com-
plicated guidelines to which the interviewer must adhere. As you can guess, there is often a
considerable education gap between marketing researchers who design questionnaires and
interviewers who administer them. Thus the instructions on the questionnaire are sometimes
M11_BURN3261_08_GE_C11.indd 292M11_BURN3261_08_GE_C11.indd 292 16/08/16 5:03 pm16/08/16 5:03 pm

11-2 POSSIBLE ERRORS IN FIELD DATA COLLECTION 293
confusing to the interviewer. Interviewer experience cannot overcome poor questionnaire
instructions. 16 When instructions are hard to understand, the interviewer will usually struggle
to comply with the researcher’s wishes but may fail to do so. 17
The third type of unintentional interviewer error involves fatigue-related mistakes ,
which can occur when an interviewer becomes tired. You may be surprised that fatigue can
enter into asking questions and recording answers, because these tasks are not physically
demanding, but interviewing is labor-intensive 18 and can become tedious and monotonous.
It is repetitious at best, and it is especially demanding when respondents are uncoopera-
tive. Toward the end of a long interviewing day, the interviewer may be less mentally alert
than earlier in the day, and this condition can cause slip-ups and mistakes. The interviewer
might fail to obey a skip pattern, might forget to make note of the respondent’s reply to
a question, might hurry through a section of the questionnaire, or might appear or sound
weary to a potential respondent who refuses to take part in the survey as a result.
INTENTIONAL RESPONDENT ERRORS Intentional respondent errors occur when respondents willfully misrepresent themselves in
surveys. There are at least two major intentional respondent errors: falsehoods and refusals.
Falsehoods occur when respondents fail to tell the truth in surveys. They may feel embarrassed,
they may want to protect their privacy, or they may even suspect that the interviewer has a hidden
agenda, such as turning the interview into a sales pitch. 19 Sensitive topics have greater potential
for misrepresentation. 20 For instance, personal income level is a sensitive topic for many people,
disclosure of marital status is a concern for women living alone, age is a delicate topic for some,
and questions about personal hygiene may off end some respondents. Respondents may also
become bored, deem the interview process burdensome, or fi nd the interviewer irritating. For a
variety of reasons, they may want to end the interview in a hurry. Falsehoods may be motivated
by a desire on the part of the respondent to deceive, or they may be mindless responses uttered
just to complete the interview as quickly as possible. Although their fi ndings were inconclusive,
one set of researchers claimed that falsehoods are more likely among females, younger respon-
dents, and less educated respondents but less likely with experienced interviewers and among
respondents with positive attitudes toward research and positive prior research experiences. 21
Marketing Research Insight 11. 1 is related to the issue of respondents lying. The second type of intentional respondent error is nonresponse , which
we have referred to at various times in this text . Nonresponse includes
failure on the part of a prospective respondent to take part in the survey,
premature termination of the interview, and refusal to answer specifi c ques-
tions on the questionnaire. In fact, nonresponse of various types is probably
the most common intentional respondent error that researchers encounter.
Some observers believe that survey research is facing tough times ahead
because of a growing distaste for survey participation, increasingly busy
schedules, and a desire for privacy. 22 By one estimate, the refusal rate of
U.S. consumers is almost 90%. 23 Most agree that declining cooperation
rates present a major threat to the industry. 24 Nonresponse in general, and
refusals in particular, are encountered in virtually every survey conducted.
Business-to-business (B2B) marketing research is even more challenging,
presenting additional hurdles that must be cleared (such as negotiating
“gatekeepers”) just to fi nd the right person to take part in the survey. We
devote an entire section to nonresponse error later in this chapter.
UNINTENTIONAL RESPONDENT ERRORS An unintentional respondent error occurs whenever a respondent gives a
response that is not valid but that he or she believes is the truth. There are fi ve
Sometimes respondents do not tell the truth.
Nonresponse is defi ned as failure on the part of a prospective respondent to take part in a survey or to answer a question.
To learn about nonresponse, launch www.youtube.com
and search for “Nonresponse— AAPOR 2008: Robert Groves.”
Guesses are a form of unintentional
respondent error.
© L
asse
Kri
sten
sen/
Shu
tter
stoc
k
M11_BURN3261_08_GE_C11.indd 293M11_BURN3261_08_GE_C11.indd 293 16/08/16 5:03 pm16/08/16 5:03 pm

294 CHAPTER 11 • DEALING WITH FIELDWORK AND DATA QUALITY ISSUES
Sometimes a respondent will answer without understanding the question.
types of unintentional respondent errors: misunderstanding, guessing, attention loss, distrac-
tions, and fatigue. First, respondent misunderstanding occurs when a respondent gives an
answer without comprehending the question and/or the accompanying instructions. Poten-
tial respondent misunderstandings exist in all surveys. Such misunderstandings range from
simple errors, such as checking two responses to a question when only one is called for,
to complex errors, such as misunderstanding terminology. 26 For example, a respondent may
think in terms of net income for the past year rather than income before taxes as desired by the
researcher. Any number of misunderstandings such as these can plague a survey. A second form of unintentional respondent error is guessing , in which a respondent gives
an answer when he or she is uncertain of its accuracy. Occasionally, respondents are asked
about topics about which they have little knowledge or recall, but they feel compelled to
provide an answer to the questions being posed. Respondents might guess the answer, and
all guesses are likely to contain errors. Here is an example of a question very likely to elicit
guessing: If you were asked to estimate the amount of electricity, in kilowatt-hours, that you
used last month, how many would you say you used?
A third unintentional respondent error, known as attention loss , occurs when a respon-
dent’s interest in the survey wanes. The typical respondent is not as excited about the sur-
vey as the researcher is, and some respondents fi nd themselves less and less motivated to
take part in the survey as they work their way through the questionnaire. With attention loss,
FTF versus ACASI: Do Respondents Lie When Looking an Interviewer in the Eye? Technology has given rise to the “audio computer-assisted self-interview,” or ACASI, in which a computer is used to “read” questions to respondents. There are many variations of this approach, but essentially a computer voice or a prerecorded voice is used rather than a living human interviewer (referred to as “face-to-face” or FTF interviewing). The ACASI version may be administered over the telephone or with the respon-dent sitting in front of a laptop or desktop computer monitor. The FTF mode requires that the interviewer and the respondent be physically present at the same time, and as a result, both the respondent and the interviewer can observe each other's facial and body movements. As shown in many studies, survey respondents are more likely to give socially acceptable answers to human interviewers than to computer interviewers. Stated differently, it is easier to tell the truth about undesirable behav-iors to a computer than to a real person.
Four researchers recently investigated lying in respondents by comparing FTF with ACASI. 25 In the FTF condition they administered an actual face-to-face interview in which the inter-viewer and respondent faced each other, and the interviewer read questions aloud from a laptop computer to the respondent and recorded the respondent’s verbal answers on the computer. In the ACASI condition, the respondent sat facing the laptop computer and wore headphones, listening to each question that was prerecorded and administered upon the respondent's click. He or she then clicked the answer on the computer screen, and a “next” button moved the computer to the following question. Based on the data provided by these researchers in
their article, the following fi gure illustrates that the FTF condi-tion consistently resulted in more favorable answers to socially desirable issues such as drinking moderately, saving regularly, and keeping up with the news. In fact, the average difference across all such behaviors was 20%. In other words, assum-ing that the answers to the computer-administered questions are the “truth,” a face-to-face interviewer appears to inspire respondents to answer with lies 20% more often to score bet-ter on socially desirable behaviors. When asked to estimate the number of their sex partners since their 18th birthday, the FTF respondents answered with a median of 16, and the ACASI respondents’ median was 14, which suggests that for socially undesirable behaviors, respondents may lie by as much at 15% when in the presence of a human interviewer.
MARKETING RESEARCH INSIGHT 11. 1 Digital Marketing Research
0%Own credit
card(s)Watch TV
infrequentlyRead
newspaperdaily
Give a seat toa stranger
Drinkmoderately
Savemonthly
Give food tohomeless
10%
20%
40%
30%
50%
60%
70%
80%
90%
Respondents Lie to Look Better to Human Interviewers
Face-to-face interviewer Audio computer-assisted self-interview
Unintentional respondent errors may result from misunderstanding, guessing, attention loss, distractions, or fatigue.
Whenever a respondent guesses, error is likely.
M11_BURN3261_08_GE_C11.indd 294M11_BURN3261_08_GE_C11.indd 294 16/08/16 5:03 pm16/08/16 5:03 pm

11-2 POSSIBLE ERRORS IN FIELD DATA COLLECTION 295
respondents do not attend carefully to questions, they provide superfi cial and perhaps mind-
less answers, and they may refuse to continue taking part in the survey.
Fourth, distractions , such as interruptions, may occur while the questionnaire is being
administered. For example, during a mall-intercept interview, a respondent might be dis-
tracted when an acquaintance walks by and says hello. A parent answering questions on the
telephone might have to attend to a fussy toddler, or an online survey respondent might be
prompted that an email message has just arrived. A distraction may cause the respondent to
get “off track” or otherwise not take the survey as seriously as the researcher desires.
Fifth, unintentional respondent error can take the form of respondent fatigue , in which
the respondent gets tired of answering questions. Whenever a respondent tires of a survey,
deliberation and refl ection diminish. Exasperation will mount and cooperation will decrease.
The respondent might even opt for the “no opinion” response category just as a means of
fi nishing the survey quickly. Sometimes the mode of the survey engenders either more or less respondent error. In fact,
the almost universal replacement of land line telephones with mobile or cell phones in some
populations might be a cause for worry. Read Marketing Research Insight 11. 2 to learn why
cell phone interviews diff er from land line interviews in ways that may aff ect data quality.
IBM SPSS Student Assistant: Red Lobster: Recoding and Computing Variables
Do Cell Phones Make a Difference in Data Quality? Despite the widespread popularity of online surveys, telephone surveys remain a signifi cant form of data collection. Many years ago, the land line telephone survey was the “gold standard” of data collection; however, cell phones and mobile phones have eclipsed the land line telephone's prominence. Researchers have many valid worries about the differences in data quality between land lines and mobile phones. A recent article 27 enu-merated the reasons for these worries and compared the data quality of land line telephone interviews with that of mobile phone interviews. Four conditions are necessary for an optimal telephone interview. Here are those conditions and the aspects of a mobile phone interview that have the potential to reduce the quality of an interviewee's responses.
Condition 1: Ability to hear clearly. The mobile phone sometimes suffers from poor reception qual-ity and from a multitude of distractions in the environment where the user is responding to survey questions. Also, respondents differ in their aural reception of cell phone calls and in their comfort with cell phone usage.
Condition 2: Suffi cient attention. The mobile phone envi-ronment can be highly distracting, especially if the user is in a public location, in a work situation, or not at home. Also, cell phones are commonly used while multitasking, so the respondent may be watching television, exer-cising, or surfi ng the web during the interview.
Condition 3: Suffi cient effort. Answering survey questions, regardless of the mode of the interview, requires
cognitive effort in the forms of memory (recall), evaluation, judgment, and expression of opin-ions. Compared to land line conversation, cell phone communication tends to be short and superfi cial and done without a lot of thought.
Condition 4: Willingness to answer. Survey questions may touch on personal or private topics, but cell phones are often used in public where friends or strangers can hear the respon-dent's answers. This situation may deter respondents from answering such questions or from answering them honestly.
Thus, it would appear that the mobile phone interview has sev-eral strikes against its data quality, and the researchers who wrote the article sought to compare the incidence of known errors such as don’t knows, excessive agreements, extreme answers, middle-of-the-roads, and speeding (some of these will be described later in this chapter) that land line respondents and mobile phone respondents made to the same survey. Sur-prisingly, they found that mobile phone respondents did not exhibit many differences from land line respondents. The only differences of note were that mobile phone respondents dem-onstrate less social desirability bias and that properly designed mobile phone interviews are slightly longer than land line inter-views. Thus mobile phone respondents may take a bit longer due to multitasking or distractions, but their answers are appar-ently of the same quality as those of land line respondents. And on personal issues, the mobile phone interviewee may be a tad more honest than the land line interviewee.
MARKETING RESEARCH INSIGHT 11. 2 Practical Marketing Research
M11_BURN3261_08_GE_C11.indd 295M11_BURN3261_08_GE_C11.indd 295 16/08/16 5:03 pm16/08/16 5:03 pm

296 CHAPTER 11 • DEALING WITH FIELDWORK AND DATA QUALITY ISSUES
11- 3 Field Data Collection Quality Controls Precautions and procedures can be implemented to minimize the eff ects of the various types
of errors just described. Please note that we said “minimize” and not “eliminate” because the
potential for error always exists. However, by instituting the following controls, a researcher
can reduce the nonsampling error involved with data collection. The fi eld data collection qual-
ity controls that we describe are listed in Table 11. 2 .
CONTROL OF INTENTIONAL FIELDWORKER ERROR Two general strategies—supervision and validation—can be employed to guard against
the interviewer intentionally committing an error. 28 Supervision consists of administrators
overseeing the work of fi eld data collection workers. 29 Most centralized telephone inter-
viewing companies have a “listening in” capability that the supervisor can use to tap into
and monitor any interviewer’s line during an interview. Even though they have been told
that the interview “may be monitored for quality control,” the respondent and the inter-
viewer may be unaware of the monitoring, so the “listening in” samples a representative
interview performed by that interviewer. The monitoring may be performed on a recording
of the interview rather than in real time. If the interviewer is leading or unduly infl uenc-
ing respondents, this procedure will spot the violation, and the supervisor can take correc-
tive action such as reprimanding that interviewer. With personal interviews, the supervisor
Active Learning
What Type of Error Is It?
It is sometimes confusing to students when they first read about intentional and unintentional errors and the attribution of errors to interviewers or respondents. To help you learn and remember these various types of data collection errors, see if you can correctly identify the type for each of the following data collection situations. Place an “X” in the cell that corre-sponds to the type of error that appears in each situation.
Situation
Interviewer Error Respondent Error
Intentional Unintentional Intentional Unintentional
A respondent says, “No opinion” to every question asked.
When a mall-intercept interviewer is suffering from a bad cold, few people want to take the survey.
Because a telephone respondent has an incoming call, he asks his wife to take the phone and answer the rest of the interviewer’s questions.
A respondent grumbles about doing the survey, so an interviewer decides to skip the demographic questions.
A respondent who lost her job gives her last year’s income level rather than the much lower one she will earn for this year.
Intentional fi eldworker error can be controlled with supervision and validation procedures.
M11_BURN3261_08_GE_C11.indd 296M11_BURN3261_08_GE_C11.indd 296 16/08/16 5:03 pm16/08/16 5:03 pm

11-3 FIELD DATA COLLECTION QUALITY CONTROLS 297
An industry standard is verifi cation of 10% of the completed surveys.
might accompany an interviewer to observe that interviewer administering a questionnaire
in the fi eld. Because “listening in” without the consent of the respondent could be consid-
ered a breach of privacy, many companies now inform respondents that all or part of the call
may be monitored and/or recorded.
Validation verifi es that the interviewer did the work. This strategy is aimed at the
falsifi cation/cheating problem. There are various ways to validate the work. One type of
validation is for the supervisor to recontact respondents to fi nd out whether they took part
in the survey. An industry standard is to randomly select 10% of the completed surveys
for purposes of making a call-back to validate that the interview was conducted. A few
sample questions might even be readministered for comparison purposes. In the absence
of call-back validation, a supervisor may inspect completed questionnaires and may, with
a trained eye, spot patterns in an interviewer’s completions that raise suspicion of falsifi -
cation. Interviewers who turn in bogus completed questionnaires are not always careful
about simulating actual respondents. The supervisor might fi nd inconsistencies (such as
very young respondents with large numbers of children) that raise doubts about a question-
naire’s authenticity.
CONTROL OF UNINTENTIONAL FIELDWORKER ERROR As you would expect, supervision is instrumental in minimizing unintentional inter-
viewer error. We describe four mechanisms commonly used by professional fi eld data
Unintentional fi eldworker errors can be reduced with supervised orientation sessions and role playing.
TABLE 11. 2 How to Control Data Collection Errors
Error Types Control Mechanisms
Intentional fi eldworker errors
Cheating
Leading respondent
Supervision
Validation
Unintentional fi eldworker errors
Interviewer characteristics
Misunderstandings
Selection and training of interviewers
Orientation sessions and role playing
Fatigue Required breaks and alternative surveys
Intentional respondent errors
Falsehoods
Ensuring anonymity and confi dentiality
Incentives
Validation checks
Third-person technique
Nonresponse
Ensuring anonymity and confi dentiality
Incentives
Third-person technique
Unintentional respondent errors
Misunderstandings Well-drafted questionnaire
Direct questions
Guessing Well-drafted questionnaire
Response options, such as “unsure”
Attention loss
Distractions
Fatigue
Reversal of scale endpoints
Prompters x
x
x
x
x
x
x
x
x
M11_BURN3261_08_GE_C11.indd 297M11_BURN3261_08_GE_C11.indd 297 16/08/16 5:03 pm16/08/16 5:03 pm

298 CHAPTER 11 • DEALING WITH FIELDWORK AND DATA QUALITY ISSUES
collection companies in this regard: selection and training, orientation sessions, role
playing, 30 and methods to reduce fatigue. Interviewer personal characteristics that can
cause unintentional errors are best taken care of by the careful selection of interview-
ers. Following selection, it is important to train them well to avoid any biases resulting
from manner, appearance, and so forth. Orientation sessions are meetings in which the
supervisor introduces the survey and questionnaire administration requirements to the
fi eldworkers. 31 The supervisor might highlight qualifi cation or quota requirements, note
skip patterns, or go over instructions to the interviewer that are embedded throughout
the questionnaire to standardize the interview across interviewers. 32 Finally, often as a
means of becoming familiar with a questionnaire’s administration requirements, super-
visors often conduct role-playing sessions , which are dry runs or dress rehearsals of
administering the questionnaire, with the supervisor or some other interviewer playing
the respondent’s role. Successive role-playing sessions serve to familiarize interview-
ers with the questionnaire’s special administration aspects. To control for interviewer
fatigue, some researchers require interviewers to take frequent breaks and/or to use alter-
nate surveys, if possible. In short, the more competent the fi eld interviewer becomes
through training, supervision, and development of personal skills, the lower the potential
for interviewer error. 33
CONTROL OF INTENTIONAL RESPONDENT ERROR To control intentional respondent error, it is important to minimize falsehoods and non-
response tendencies on the part of respondents. Tactics useful in minimizing intentional
respondent error include anonymity, confidentiality, incentives, validation checks, and
the third-person technique. 34 Anonymity occurs when the respondent is assured that
his or her name will not be associated with his or her answers. Confidentiality occurs
when the respondent is given assurances that his or her answers will remain private.
Both assurances are believed to be helpful in forestalling falsehoods. The assumption
is that when respondents are guaranteed that they will remain nameless, they will be
more comfortable in self-disclosure and will refrain from lying or misrepresenting
themselves. 35 Another tactic for reducing falsehoods and nonresponse error is
the use of incentives , which are cash payments, gifts, or something of
value promised to respondents in return for their participation. 36 For
participating in a survey, respondents may be paid cash or provided
with redemption coupons. They might be given a gift such as a ball-
point pen or a T-shirt. In a sense, respondents are being induced to
tell the truth by direct payment. Respondents may now feel morally
obligated to tell the truth because they will receive compensation. Or
they may feel guilty at receiving an incentive and then not answering
truthfully. Unfortunately, practitioners and academic researchers are
just beginning to understand how to entice prospective respondents to
take part in a survey. 37 For instance, only recently has relevance of the
subject matter been documented to increase response rates. 38
A different approach for reducing falsehoods is the use of vali-dation checks , in which information provided by a respondent is
confirmed during the interview. For example, in an in-home sur-
vey on Leap Frog educational products for preschool children, the
interviewer might ask to see the respondent’s Leap Frog unit and
modules as a verification or validation check. A more unobtrusive
validation is to have the interviewer check for older-appearing
Confi dentiality and/or anonymity may reduce
refusals to take part in a survey.
Tactics useful in minimizing intentional respondent error include anonymity, confi dentiality, validation checks, and third-person technique.
Incentives sometimes compel respondents to be more truthful while also discouraging nonresponse.
© T
yler
Ols
on/S
hutt
erst
ock
M11_BURN3261_08_GE_C11.indd 298M11_BURN3261_08_GE_C11.indd 298 16/08/16 5:03 pm16/08/16 5:03 pm
11-3 FIELD DATA COLLECTION QUALITY CONTROLS 299
respondents who say they are young, shabbily dressed respondents who say they are
wealthy, and so on. A well-trained interviewer will make note of suspicious answers. 39 Finally, there is a questionnaire design feature that a researcher can use to reduce
intentional respondent errors. Sometimes the opportunity arises to use the third-person technique , in which, instead of directly quizzing the respondent about a subject that
might be embarrassing, the interviewer couches the question in terms of a third person
who is similar to the respondent. For instance, a middle-aged man might be asked, “Do
you think a person such as yourself uses Viagra?” Here, the respondent will probably
think in terms of his own circumstances, but, because the subject of the question is some
unnamed third party, the question is not seen as personal. In other words, the respondent
will not be divulging personal and private information by talking about this fi ctitious
other person. The third-person technique may be used to reduce both falsehoods and
nonresponse.
CONTROL OF UNINTENTIONAL RESPONDENT ERROR The control of unintentional respondent error takes various forms as well, including well-
drafted questionnaire instructions and examples, reversals of scale endpoints, and use of
prompters. Clear-cut questionnaire instructions and examples are commonly used as a way
of avoiding respondent confusion. We described these in our chapter on questionnaire design.
Also, researchers sometimes resort to direct questions to assess respondent understanding.
For example, after describing a 5-point agree–disagree response scale in which 1 = Strongly
agree, 2 = Agree, 3 = Neither agree nor disagree, 4 = Disagree, and 5 = Strongly disagree,
the interviewer might be instructed to ask, “Are these instructions clear?” If the respondent
answers in the negative, the instructions are repeated until the respondent understands them.
Guessing may be reduced by alerting respondents to response options such as “no opinion,”
“do not recall,” or “unsure.”
A tactic we described when we discussed the semantic diff erential is reversals of scale endpoints , in which instead of putting all of the negative adjectives on one side
and all the positive ones on the other side, a researcher will switch the positions of a few
items. Such reversals are intended to warn respondents that they must respond to each
bipolar pair individually. With agree–disagree statements, this tactic is accomplished by
negatively wording a statement every now and then to induce respondents to attend to
each statement individually. Both of these tactics are intended to heighten the respondent’s
attention. Finally, long questionnaires often include prompters , such as “We are almost fi nished,”
“That was the most diffi cult section of questions to answer,” or other statements strategically
located to encourage the respondent to remain on track. Sometimes interviewers will sense
an attention lag or fatigue on the part of the respondent and provide their own prompters or
comments to maintain the respondent’s full participation in the survey. Online surveys often
have a “% completed” scale or other indication that informs respondents of their progress in
the survey.
FINAL COMMENT ON THE CONTROL OF DATA COLLECTION ERRORS As you can see, a wide variety of nonsampling errors can occur on the parts of both inter-
viewers and respondents during the data collection stage of the marketing research process.
Similarly, a variety of precautions and controls are used to minimize nonsampling error. Each
survey is unique, of course, so we cannot provide universally applicable guidelines. We will,
however, stress the importance of good questionnaire design in reducing these errors. Also,
professional fi eld data collection companies whose existence depends on how well they can
With an embarrassing question, the third-person technique may make the situation less personal.
Ways to combat unintentional respondent error include well-drafted questionnaire instructions and examples, reversals of scale endpoints, use of scale endpoints, and use of prompters.
Prompters are used to keep respondents on task and alert.
M11_BURN3261_08_GE_C11.indd 299M11_BURN3261_08_GE_C11.indd 299 16/08/16 5:03 pm16/08/16 5:03 pm

300 CHAPTER 11 • DEALING WITH FIELDWORK AND DATA QUALITY ISSUES
control interviewer and respondent error are commonly relied on by researchers who under-
stand the true value of these services.
11- 4 Nonresponse Error Nonresponse was briefl y described in our discussion of mail surveys. We will now describe this
issue more fully, including various types of nonresponse, how to assess the degree of this error, and
some ways of adjusting or compensating for nonresponse in surveys. Nonresponse was defi ned
earlier as a failure on the part of a prospective respondent to take part in the survey or to answer
specifi c questions on the questionnaire. Nonresponse has been labeled the marketing research
industry’s biggest problem, 40 , 41 and it is multinational in scope. 42 Compounding the problem has
been the increase in the numbers of surveys, which means that the likelihood of being asked to
participate in a survey has increased. Some industry observers believe that nonresponse is caused
by fears of invasion of privacy, skepticism of consumers regarding the benefi ts of participating in
research, and the use of research as a guise for telemarketing. Of course, it is unethical to force or
trick people to respond. The Marketing Research Association Code of Ethics—portions of which
are presented in Marketing Research Insight 11. 3 —clearly states that respondents have the right
to refuse to participate in a study or to withdraw from a study at any time. The identifi cation, control, and adjustments necessary for nonresponse are critical to the
success of a survey. There are at least three diff erent types of potential nonresponse error lurk-
ing in any survey: refusals to participate in the survey, break-off s during the interview, and
refusals to answer specifi c questions, or item omission. Table 11. 3 briefl y describes each type
of nonresponse.
There are three types of nonresponse error: refusals to participate in the survey, break-offs during the interview, and refusals to answer specifi c questions (item omissions).
Marketing Research Association Code of Ethics: Respondent Participation The Marketing Research Association Code of Ethics specifi es that the marketing research interviewer
2. Protect the rights of respondents, including the right to refuse to participate in part or all of the research process.Researchers must respect the bounds of cooperation set by respondents, who control the parameters under which infor-mation is given. In practice, this means all of the following:
• Respondent agreement to participate in research must be obtained upfront, rather than after the fact.
• Consent must be granted freely, without coercion.• Consent may be withdrawn by the respondent at any
point during the contact.
• Consent must be granted expressly for participation in any subsequent studies.
• An explicit opt-out request for any future contact or participation at any point during the process will be honored.
• All reasonable precautions are taken so that respond-ents are in no way adversely affected as a result of their participation in a marketing research project.
Respondent cooperation is strictly on a voluntary basis. Respon-dents are entitled to withdraw from a research project. Com-pany policies and/or interviewer instructions should state that the interviewer must give respondents the opportunity not to participate for any reason.
MARKETING RESEARCH INSIGHT 11. 3 Ethical Consideration
TABLE 11. 3 The Three Types of Nonresponses with Surveys
Name Description
Refusal The prospective respondent declines to participate in the survey.
Break-off After answering some questions in the survey, the respondent stops participating.
Item omission The respondent does not answer a particular question but does answer other
questions.
M11_BURN3261_08_GE_C11.indd 300M11_BURN3261_08_GE_C11.indd 300 16/08/16 5:03 pm16/08/16 5:03 pm
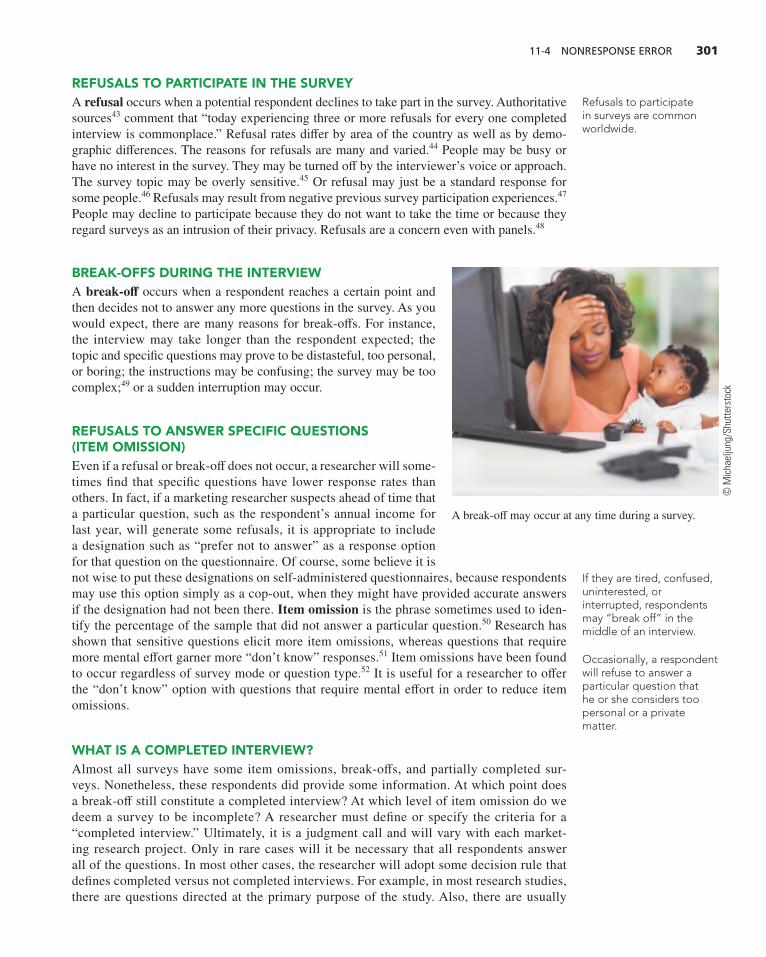
11-4 NONRESPONSE ERROR 301
REFUSALS TO PARTICIPATE IN THE SURVEY A refusal occurs when a potential respondent declines to take part in the survey. Authoritative
sources 43 comment that “today experiencing three or more refusals for every one completed
interview is commonplace.” Refusal rates diff er by area of the country as well as by demo-
graphic diff erences. The reasons for refusals are many and varied. 44 People may be busy or
have no interest in the survey. They may be turned off by the interviewer’s voice or approach.
The survey topic may be overly sensitive. 45 Or refusal may just be a standard response for
some people. 46 Refusals may result from negative previous survey participation experiences. 47
People may decline to participate because they do not want to take the time or because they
regard surveys as an intrusion of their privacy. Refusals are a concern even with panels. 48
BREAK-OFFS DURING THE INTERVIEW A break-off occurs when a respondent reaches a certain point and
then decides not to answer any more questions in the survey. As you
would expect, there are many reasons for break-off s. For instance,
the interview may take longer than the respondent expected; the
topic and specifi c questions may prove to be distasteful, too personal,
or boring; the instructions may be confusing; the survey may be too
complex; 49 or a sudden interruption may occur.
REFUSALS TO ANSWER SPECIFIC QUESTIONS (ITEM OMISSION) Even if a refusal or break-off does not occur, a researcher will some-
times fi nd that specifi c questions have lower response rates than
others. In fact, if a marketing researcher suspects ahead of time that
a particular question, such as the respondent’s annual income for
last year, will generate some refusals, it is appropriate to include
a designation such as “prefer not to answer” as a response option
for that question on the questionnaire. Of course, some believe it is
not wise to put these designations on self-administered questionnaires, because respondents
may use this option simply as a cop-out, when they might have provided accurate answers
if the designation had not been there. Item omission is the phrase sometimes used to iden-
tify the percentage of the sample that did not answer a particular question. 50 Research has
shown that sensitive questions elicit more item omissions, whereas questions that require
more mental eff ort garner more “don’t know” responses. 51 Item omissions have been found
to occur regardless of survey mode or question type. 52 It is useful for a researcher to off er
the “don’t know” option with questions that require mental eff ort in order to reduce item
omissions.
WHAT IS A COMPLETED INTERVIEW? Almost all surveys have some item omissions, break-off s, and partially completed sur-
veys. Nonetheless, these respondents did provide some information. At which point does
a break-off still constitute a completed interview? At which level of item omission do we
deem a survey to be incomplete? A researcher must defi ne or specify the criteria for a
“completed interview.” Ultimately, it is a judgment call and will vary with each market-
ing research project. Only in rare cases will it be necessary that all respondents answer
all of the questions. In most other cases, the researcher will adopt some decision rule that
defi nes completed versus not completed interviews. For example, in most research studies,
there are questions directed at the primary purpose of the study. Also, there are usually
Refusals to participate in surveys are common worldwide.
If they are tired, confused, uninterested, or interrupted, respondents may “break off” in the middle of an interview.
A break-off may occur at any time during a survey.
Occasionally, a respondent will refuse to answer a particular question that he or she considers too personal or a private matter.
© M
icha
elju
ng/S
hutt
erst
ock
M11_BURN3261_08_GE_C11.indd 301M11_BURN3261_08_GE_C11.indd 301 16/08/16 5:03 pm16/08/16 5:03 pm

302 CHAPTER 11 • DEALING WITH FIELDWORK AND DATA QUALITY ISSUES
questions that are asked for the purpose of adding insight into how respondents answered
the primary questions. Such secondary questions often include a list of demographics
questions, which, being more personal in nature, are typically placed at the end of the
questionnaire. Because these secondary questions are not the primary focus of the study, a
completed interview may be defi ned as one in which all the primary questions have been
answered. In this way, the marketing researcher has data for primary questions and most
of the data for secondary questions. Interviewers can then be given a specifi c statement
about what constitutes a completed survey, such as “If the respondent answers through
question 18, you may count it as a completion.” (The demographics begin with question
19.) Likewise, the researcher must adopt a decision rule for determining the extent of item
omissions necessary to invalidate a survey or a particular question. The American Associa-
tion for Public Opinion Research off ers these guidelines: complete survey: 80%–100% of
applicable questions answered, partial completion: 50%–80% answered, and break-off :
less than 50% answered. 53
MEASURING RESPONSE RATE IN SURVEYS Most marketing research studies report their response rates, and the currently accepted
method of calculating this fi gure is based on a 1982 Council of American Survey Research
Organizations (CASRO) report that provides a uniform defi nition and method for calculating
the response rate. 54 According to the CASRO report and the American Association for Public
Opinion Research, response rate is defi ned as the ratio of the number of completed interviews
to the number of eligible units in the sample. 55 Here, in its simplest form, is the CASRO response rate formula :
Response rate 5Number of completed interviews
Number of eligible units in sample
In most surveys, eligible units are respondents determined by screening or qualifying
questions. For example, if we were working with a department store that was specifi cally con-
cerned with its kitchenware department, we would determine eligibility for the survey by ask-
ing prospective respondents the screening question “Do you shop at Acme Department Store
regularly?” For those who answered affi rmatively, we would then ask, “Have you shopped
in the kitchenware department at any time during the last three months?” Those respondents
who again answered “Yes” would be eligible to take part in the survey.
Let’s assume we have a survey of 1,000 shoppers, and the results of the survey are the
following:
Completions = 400
Ineligible = 300
Refusals = 100
Not reached = 200
This information enables you to calculate the number of sample units that are (a) eligible,
(b) ineligible, and (c) not ascertained because they were not reached. When calculating the
response rate, we have the number of completions in the numerator, and in the denominator
we have the number of completions plus the numbers of those who refused, whose lines were
busy, and who were eligible but did not answer. Because we do not talk to those who refuse
(before the screening question), don’t answer, have busy signals, or are not at home, how do
we determine what percentage of these people would have been eligible? We multiply their
number by the percentage of those we did talk with who are eligible. This method assumes
that the same percentage of eligibles exists in the population of those we did talk with (of the
700 we talked with, 57% were eligible) as exists in the population of those we did not get to
Marketing researchers must defi ne a “completed” interview.
The marketing research industry has an accepted way to calculate a survey’s response rate.
Completions are eligible people who take part in the survey.
M11_BURN3261_08_GE_C11.indd 302M11_BURN3261_08_GE_C11.indd 302 16/08/16 5:03 pm16/08/16 5:03 pm

11-4 NONRESPONSE ERROR 303
Active Learning
How to Calculate a Response Rate Using the CASRO Formula
Whereas the CASRO formulas seem simple and straightforward, questions arise about exactly how to interpret them when dealing with individual research projects. We have created this Active Learning exercise so you can appreciate what goes into the proper calculation of a response rate.
Assume you are doing this survey as a class project, and you have been assigned the task of conducting telephone interviews. You are given a list of randomly selected telephone numbers and told to fill a quota of five completions. You are instructed to make at least three contact attempts before giving up on a telephone number. Also, you are given a call record sheet where you are to write in the result of each call attempt. As you call each number, you record one of the following outcomes in the column corresponding to the contact attempt that pertains to that particular call. The results you can record are as follows:
Disconnected (D) —message from phone company that number is no longer in service. Wrong Target (WT) —(ineligible) number is a business phone, and you are interested only in residences. Ineligible Respondent (IR) —no one in household has purchased an automobile within last year. Refusal (R) —subject refuses to participate. Terminate (T) —subject begins survey but stops before completing all questions. Completed (C) —questionnaire is completed. Busy (BSY) —phone line is busy; attempt call-back at later time unless this is your third attempt. No Answer (NA) —no one answers or you encounter a telephone answering device. You may leave a message and state that you will call back later, unless this is your third attempt. Call Back (CB) —Subject has instructed you to call back at more convenient time; record call-back time and date, and return call unless this is your third attempt.
talk with (because of refusals, no answers, or busy signals). The formula for calculating the
response rate for this situation follows.
CASRO Response Rate Formula (Expanded Form)
Response rate 5Completions
Completions 1 a Completions
Completions 1 Ineligibleb 3 1Refusals 1 Not reached 2
Here are the calculations:
Calculation of CASRO Response Rate (Expanded Form)
Response rate 5400
400 1 a 400
400 1 300b 1100 1 200 2
5400
400 1 10.57 2 1300 25 70%
M11_BURN3261_08_GE_C11.indd 303M11_BURN3261_08_GE_C11.indd 303 16/08/16 5:03 pm16/08/16 5:03 pm
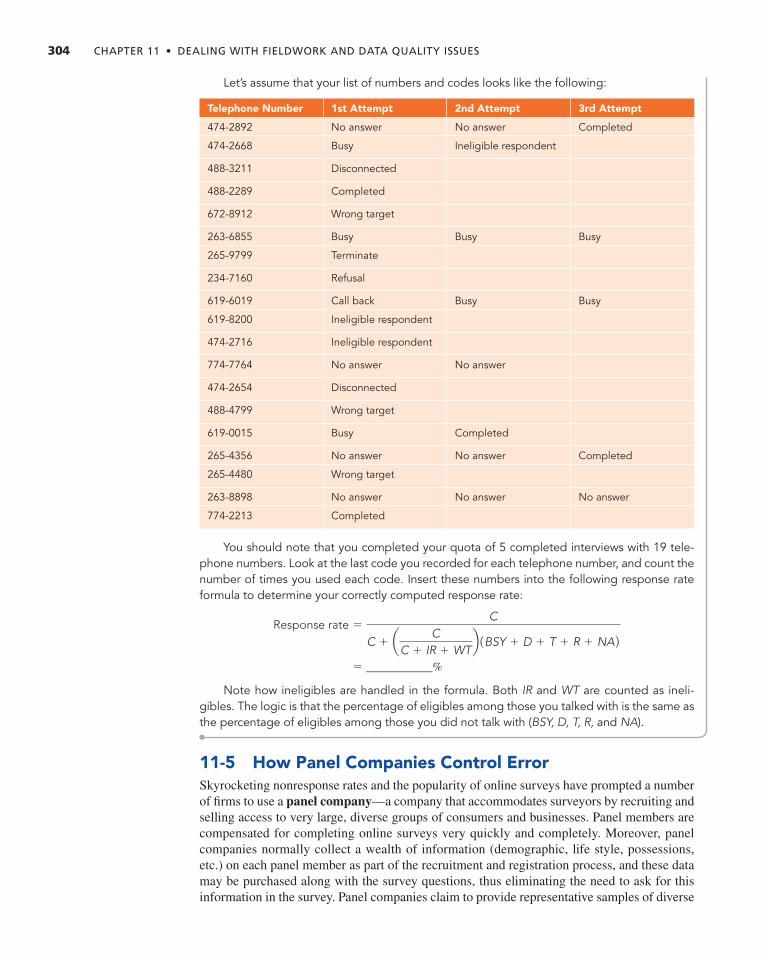
304 CHAPTER 11 • DEALING WITH FIELDWORK AND DATA QUALITY ISSUES
11- 5 How Panel Companies Control Error Skyrocketing nonresponse rates and the popularity of online surveys have prompted a number
of fi rms to use a panel company —a company that accommodates surveyors by recruiting and
selling access to very large, diverse groups of consumers and businesses. Panel members are
compensated for completing online surveys very quickly and completely. Moreover, panel
companies normally collect a wealth of information (demographic, life style, possessions,
etc.) on each panel member as part of the recruitment and registration process, and these data
may be purchased along with the survey questions, thus eliminating the need to ask for this
information in the survey. Panel companies claim to provide representative samples of diverse
Let’s assume that your list of numbers and codes looks like the following:
Telephone Number 1st Attempt 2nd Attempt 3rd Attempt
474-2892 No answer No answer Completed
474-2668 Busy Ineligible respondent
488-3211 Disconnected
488-2289 Completed
672-8912 Wrong target
263-6855 Busy Busy Busy
265-9799 Terminate
234-7160 Refusal
619-6019 Call back Busy Busy
619-8200 Ineligible respondent
474-2716 Ineligible respondent
774-7764 No answer No answer
474-2654 Disconnected
488-4799 Wrong target
619-0015 Busy Completed
265-4356 No answer No answer Completed
265-4480 Wrong target
263-8898 No answer No answer No answer
774-2213 Completed
You should note that you completed your quota of 5 completed interviews with 19 tele-phone numbers. Look at the last code you recorded for each telephone number, and count the number of times you used each code. Insert these numbers into the following response rate formula to determine your correctly computed response rate:
Response rate 5C
C 1 a CC 1 IR 1 WT
b 1BSY 1 D 1 T 1 R 1 NA 25 ___________%
Note how ineligibles are handled in the formula. Both IR and WT are counted as ineli-gibles. The logic is that the percentage of eligibles among those you talked with is the same as the percentage of eligibles among those you did not talk with ( BSY, D, T, R, and NA ).
M11_BURN3261_08_GE_C11.indd 304M11_BURN3261_08_GE_C11.indd 304 16/08/16 5:03 pm16/08/16 5:03 pm

11-6 DATASET, CODING DATA, AND THE DATA CODE BOOK 305
populations, including citizens of foreign countries, and they can provide samples of very
specifi c consumer types by inviting only those panel members who qualify on specifi c criteria
to participate in any given survey.
The widespread popularity of online panels has given rise to a great many panel com-
panies, some of which have been criticized for lax data quality controls. Especially at risk
are the many do-it-yourself (DIY) marketing researchers and others who are not aware of
the shortcomings often found in the quality of data generated via panels. In fact, practically
every research association has some sort of formalized recommendations, best practices, stan-
dards, or admonishments to guide researchers in identifying the highest-quality panel compa-
nies when considering their services. For example, ESOMAR makes publically available its
28 Questions to Help Research Buyers of Online Samples (which, incidentally, is the basis
for Case 11. 2 at the end of this chapter). It is beyond the scope of this text to describe all the
nuances of panel data quality control, but Table 11. 4 summarizes a number of representative
best practices for online panels advocated by the Marketing Research Association (MRA).
11- 6 Dataset, Coding Data, and the Data Code Book For the vast majority of surveys, respondents’ answers are typically contained in an electronic
dataset , which is a matrix arrangement of numbers (mainly) in rows and columns similar
to a Microsoft Excel or other spreadsheet. Each row pertains to the answers that a single
TABLE 11. 4 Illustrative Best Practices for Online Panels Quality Assurance *
Best Practice Explanation
Panel purpose. Ensure that the panel is used
solely for marketing research.
Some panel companies have members who are
recruited via third-party product registration
rather than for “marketing research purposes.”
Recruitment. Panel members should be ethi-
cally invited or otherwise accorded an “opt-
in” relationship with the panel company to
participate in bona fi de marketing surveys.
Some panel companies use spambots, spiders, or
other dubious and unethical methods of gaining
respondents.
Privacy. There should be a formal, published
privacy policy concerning anonymity, con-
fi dentiality, and privacy of personal data of
panel members.
Researchers who ensure privacy must have a
guarantee by the panel company that panel
member data are undiscoverable.
Participation. Panel members should not
participate in multitudes of surveys in short
periods of time.
Participation limits eliminate “professional
respondents” and otherwise limit overrepresenta-
tion of these panel members in surveys.
Panel replacement. There should be a health-
based attrition and replacement of panelists
each year.
The MRA states that natural attrition, sometimes
called “churn rate,” ranges between 25% and
30% per year because of members who lose
interest or are otherwise delisted.
Panel profi ling. There should be abundant,
up-to-date classifi cation information on panel
members.
Clients often wish to sample very specifi c
subpopulations.
Data quality. There should be validation
procedures in place, as well as provisions to
minimize data quality errors on the part of
panelists.
Tangible assurance that the desired panelists
participated is desirable, and provisions should
be in place for identifying “straightlining,”
“speeding” (both described later in this chapter),
unreliability, and other respondent errors.
* This table is based on information posted on the website of the Marketing Research Association ( www.marketingresearch.org ).
A dataset is an arrangement of numbers (mainly) in rows and columns.
M11_BURN3261_08_GE_C11.indd 305M11_BURN3261_08_GE_C11.indd 305 16/08/16 5:03 pm16/08/16 5:03 pm

306 CHAPTER 11 • DEALING WITH FIELDWORK AND DATA QUALITY ISSUES
respondent provides to the questions on the questionnaire. Each column represents a question
on the questionnaire. Of course, if a question has multiple parts to it, then it will take up mul-
tiple columns. Because the answers vary from respondent to respondent, data pertaining to the
questions or question parts are sometimes referred to as variables . Normally, the fi rst row of
a data matrix where the researcher locates a label such as “Age,” “Gender,” or “Satisfaction”
identifi es the question or question part associated with each column in the data matrix; these
designations are often called variable labels or variable names . The dataset is generated by an operation called data coding , which is defi ned as the
identifi cation of code values that are associated with the possible responses for each question
on the questionnaire. You learned about data coding in the chapter on questionnaire design,
where we described this same operation as precoding . Typically, these codes are numerical
because numbers are quick and easy to input, and computers work with numbers more effi -
ciently than they do with letter or text codes. In large-scale projects, and especially in cases
where the data entry is performed by a subcontractor, researchers use a data code book that
identifi es (1) the questions on the questionnaire, (2) the variable name or label that is associ-
ated with each question or question part, and (3) the code numbers associated with each pos-
sible response to each question. With a code book that describes the data fi le, any analyst can
work on the dataset, regardless of whether that analyst was involved in the research project
during its earlier stages. As you will soon learn, after an SPSS dataset is fully set up, the data
code book is contained in the dataset. Because precoded questionnaires have response codes associated with the various
responses, it is a simple matter to create a code book. However, the researcher will no doubt
encounter missing data where respondents have failed to answer a question. What code is
used when a missing item is encountered? The easiest and most acceptable code for a missing
response is to use a blank, meaning that nothing is entered for that respondent on the question
that was not answered. Practically all statistical analysis programs treat a blank as “missing,”
so a blank or empty cell is the universal default code to signify missing data.
With online surveys, the data fi le “builds” or “grows” as respondents submit their com-
pleted online questionnaires. That is, the codes are programmed into the questionnaire fi le
automatically by the online questionnaire software and/or by the person who designs the
online questionnaire. These codes are invisible to respondents and are typically viewable only
for the questionnaire designer when using question edit mode. In the case of web-based sur-
veys, the code book is vital as the researcher’s only map to decipher the numbers found in the
data fi le and to connect them to the answers to the questions on the questionnaire.
When doing data analysis, it is far more convenient to have fi ndings tables use the labels
on the questionnaire, such as “male” or “female,” rather than the code numbers, such as “1”
and “2.” Thus practically all statistical analysis programs have features that enable users to
identify the number codes and the associated word labels. With SPSS, it is easy to obtain the
coding after the dataset has been set up. Figure 11. 1 illustrates how the SPSS Variable View
feature can be used to reveal the coding for each variable in an SPSS dataset. In other words,
when fi nalized, an SPSS dataset makes the complete data code book for that dataset available
to any user.
11- 7 Data Quality Issues Nonresponses appear in practically every survey. At the same time, some respondents
may provide answers that exhibit a suspicious pattern. Both of these occurrences necessi-
tate a separate phase of the data preparation stage in the marketing research process that
involves inspecting respondents’ answers in the dataset. Data quality is a concern for market-
ing researchers. 56 Obviously, the researcher’s goal is to work with a set of data with as few
data quality problems as humanly possible. Consequently, the researcher must examine the
responses for data quality problems prior to analysis.
Data coding is the identifi cation of code values associated with the possible responses for each question on the questionnaire.
Researchers use data coding when preparing and working with a computer data fi le.
IBM SPSS Student Assistant: Noxzema Skin Cream: Selecting Cases
Datasets should be inspected for errors.
To learn about the data code book, launch www.youtube.
com and search for “Code book—Lisa Dierker.”
M11_BURN3261_08_GE_C11.indd 306M11_BURN3261_08_GE_C11.indd 306 16/08/16 5:03 pm16/08/16 5:03 pm

11-7 DATA QUALITY ISSUES 307
WHAT TO LOOK FOR IN RAW DATA INSPECTION The purpose of raw data inspection is to determine the presence of “bad” respondents and,
as noted earlier, to throw out the ones with severe problems. Problem respondents fall into
the following fi ve categories: incomplete responses (break-off s), nonresponses to specifi c
questions (item omissions), yea- or nay-saying patterns, and middle-of-the-road patterns. We
describe each problem, and Table 11. 5 provides an example of each one. In industry jargon,
these are “exceptions,” and they signal data quality errors to a researcher.
Incomplete Response An incomplete response is a break-off where the respondent
stops answering in the middle of the questionnaire. Again, the reason why the survey was
not completed may never be known. In Table 11. 5 , Respondent A stopped answering after
Question 3.
Nonresponses to Specifi c Questions (Item Omissions) For whatever reason, a
respondent sometimes leaves a question blank. In a telephone interview, he or she might
decline to answer a question, and the interviewer might note this occurrence with the designa-
tion “ref” (refused) or some other code to indicate that the respondent failed to answer the
question. In Table 11. 5 , Respondent B did not answer Questions 4 and 7.
Yea- or Nay-Saying Patterns Even when questions are answered, there can be signs of
problems. A yea-saying pattern may be evident in the form of all “Yes” or “Strongly agree”
answers. 57 An example is the “5” code for all Respondent C’s answers to Questions 5–9 in
Table 11. 5 . The yea-sayer has a persistent tendency to respond in the affi rmative regardless
of the question, and yea-saying implies invalid responses. The negative counterpart to yea-
saying is nay-saying , which is identifi able as persistent responses in the negative, such as
all the “1” codes for Respondent D’s answers to Questions 4–9 in Table 11. 5 . Repeating the
same answer on grid-type questions is a variation called “straightlining,” which also signals a
response quality problem. 58
Raw data inspection determines the presence of “bad” respondents.
When a respondent does not answer a particular question, it is referred to as an item omission .
Some questionnaires may be only partially completed.
Yea-saying and nay-saying are seen as persistent tendencies on the part of some respondents to agree or disagree, respectively, with most of the questions asked.
To learn about data quality, launch www.youtube.com
and search for “Data quality—lightspeedresearch.”
FIGURE 11.1 IBM SPSS Variable View and Variables Command Reveals a Dataset’s Code Book
Source: Reprint Courtesy of International Business Machines Corporation, © International Business Machines Corporation.
M11_BURN3261_08_GE_C11.indd 307M11_BURN3261_08_GE_C11.indd 307 16/08/16 5:03 pm16/08/16 5:03 pm

308 CHAPTER 11 • DEALING WITH FIELDWORK AND DATA QUALITY ISSUES
Middle-of-the-Road Patterns The middle-of-the-road pattern is seen as a preponder-
ance of “no opinion” responses, such as the “3” codes for Respondent E’s Questions 5–9 in
Table 11. 5 . No opinion is in essence no response, and prevalent no opinions on a question-
naire may signal low interest, lack of attention, or even objections to being involved in the
survey. True, a respondent may not have an opinion on a topic, but if one gives many such
answers, questions arise about how useful that respondent is to the survey. It should be
noted that our yea-saying, nay-saying, and middle-of-the-road examples in Table 11. 5 are
extreme cases; sometimes these appear as tendencies such as almost all 4s and 5s for yea-
saying, almost all 1s and 2s for nay-saying, and almost all “neutral” responses for middle-
of-the-road errors. Online survey respondents who yea-say, nay-say, or give excessive “no
opinion” answers are sometimes referred to as “speeders” because they are giving rapid-
fi re answers without reading the questions carefully. They are also called “straightliners”
because they select the same answer time and again on a scale. 59 Unfortunately, response
error tendencies are found worldwide. We have prepared Marketing Research Insight 11. 4
to compare middle-of-the-road, yea-saying, and nay-saying response patterns across 15
countries.
Other Data Quality Problems Marketing researchers may encounter other bothersome
problems during questionnaire screening. For example, respondents may check more than
one response option when only one was supposed to be checked. They may have failed to
look at the back of a questionnaire page and thus have missed all of the questions there.
Or they may have ignored an agree–disagree scale and simply written in personal com-
ments. Usually, detecting these errors requires physically examining the questionnaires.
With online surveys, however, most such problems can usually be prevented by selecting
options or requirements in the online questionnaire program that prevent the occurrence of
such errors.
How to Handle Data Quality Issues When a researcher encounters data quality issues
such as those just described, there are three options. First, if there are several egregious errors,
the researcher is most likely to throw out the respondent’s entire data row. Second, if the
errors are minor and will not skew, or distort, the survey fi ndings, the researcher will probably
TABLE 11. 5 Identifi cation of Data Quality Errors Found in Raw Data Matrix Inspection
Case
Data Matrix Column Labels
Q1 Q2 Q3 Q4 Q5 Q6 Q7 Q8 Q9 Error Type— Description of Error
A 1 2 3 Break-off — Questionnaire is incompletely fi lled out.
No answers after Q3.
B 1 2 1 4 2 4 5
Item omission— The respondent refused to answer particular
question(s) but answered others before and after it. Q4 and
Q7 are not answered.
C 1 2 2 3 5 5 5 5 5
Yea-saying— Respondent exhibits persistence to respond
favorably (yea) regardless of the questions. Q5–Q9 are all 5,
the code for “Strongly agree.”
D 2 1 3 1 1 1 1 1 1
Nay-saying— Respondent exhibits persistence to respond
unfavorably (nay) regardless of the questions. Q5–Q9 are all
1, the code for “Strongly disagree.”
E 2 1 3 1 3 3 3 3 3 Middle-of-the-road— Respondent indicates “no opinion” to
most questions. Q5–Q9 are all 3, the code for “Neutral.”
Code Book: Questions Q1–Q4 are 1 = Yes, 2 = No, 3 = No opinion; Questions Q5–Q9 are 1 = Strongly disagree, 2 = Disagree, 3 = Neutral, 4 = Agree, and 5 = Strongly agree
Some respondents hide their opinions by indicating “no opinion” throughout the survey.
IBM SPSS Student Assistant: Getting IBM SPSS Help
M11_BURN3261_08_GE_C11.indd 308M11_BURN3261_08_GE_C11.indd 308 16/08/16 5:03 pm16/08/16 5:03 pm
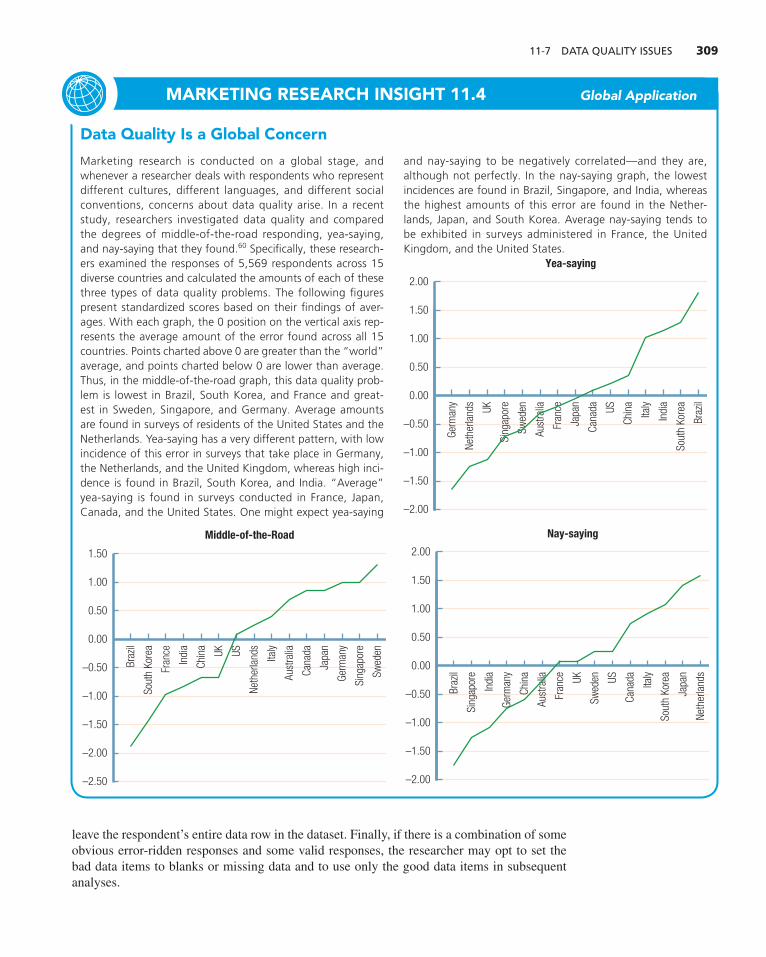
11-7 DATA QUALITY ISSUES 309
leave the respondent’s entire data row in the dataset. Finally, if there is a combination of some
obvious error-ridden responses and some valid responses, the researcher may opt to set the
bad data items to blanks or missing data and to use only the good data items in subsequent
analyses.
Data Quality Is a Global Concern
Marketing research is conducted on a global stage, and whenever a researcher deals with respondents who represent different cultures, different languages, and different social conventions, concerns about data quality arise. In a recent study, researchers investigated data quality and compared the degrees of middle-of-the-road responding, yea-saying, and nay-saying that they found. 60 Specifi cally, these research-ers examined the responses of 5,569 respondents across 15 diverse countries and calculated the amounts of each of these three types of data quality problems. The following fi gures present standardized scores based on their fi ndings of aver-ages. With each graph, the 0 position on the vertical axis rep-resents the average amount of the error found across all 15 countries. Points charted above 0 are greater than the “world” average, and points charted below 0 are lower than average. Thus, in the middle-of-the-road graph, this data quality prob-lem is lowest in Brazil, South Korea, and France and great-est in Sweden, Singapore, and Germany. Average amounts are found in surveys of residents of the United States and the Netherlands. Yea-saying has a very different pattern, with low incidence of this error in surveys that take place in Germany, the Netherlands, and the United Kingdom, whereas high inci-dence is found in Brazil, South Korea, and India. “Average” yea-saying is found in surveys conducted in France, Japan, Canada, and the United States. One might expect yea-saying
and nay-saying to be negatively correlated—and they are, although not perfectly. In the nay-saying graph, the lowest incidences are found in Brazil, Singapore, and India, whereas the highest amounts of this error are found in the Nether-lands, Japan, and South Korea. Average nay-saying tends to be exhibited in surveys administered in France, the United Kingdom, and the United States.
0.00
–0.50
–1.00
–1.50
–2.00
0.50
1.00
1.50
Germ
any
Neth
erla
nds UK
Sing
apor
e
Swed
en
Aust
ralia
Fran
ce
Japa
n
Cana
da US
Chin
a
Italy
Indi
a
Sout
h Ko
rea
Braz
il
2.00
Yea-saying
MARKETING RESEARCH INSIGHT 11. 4 Global Application
0.00
–0.50
–1.00
–1.50
–2.00
–2.50
0.50
1.00
1.50
Braz
il
Sout
h Ko
rea
Fran
ce
Indi
a
Chin
a UK US
Neth
erla
nds
Italy
Aust
ralia
Cana
da
Japa
n
Germ
any
Sing
apor
e
Swed
en
Middle-of-the-Road
0.00
–0.50
–1.00
–1.50
–2.00
0.50
1.00
1.50
Braz
il
Sing
apor
e
Indi
a
Germ
any
Chin
a
Aust
ralia
Fran
ce UK
Swed
en US
Cana
da Italy
Sout
h Ko
rea
Japa
n
Neth
erla
nds
2.00
Nay-saying
M11_BURN3261_08_GE_C11.indd 309M11_BURN3261_08_GE_C11.indd 309 16/08/16 5:14 pm16/08/16 5:14 pm

310 CHAPTER 11 • DEALING WITH FIELDWORK AND DATA QUALITY ISSUES
Summary
Total error in survey research is a combination of sampling
error and nonsampling error. Sampling error may be con-
trolled by the sample plan and the sample size. Research-
ers must know both the sources of nonsampling error and
ways to minimize its eff ect on total error. The data collec-
tion phase of marketing research holds great potential for
nonsampling errors. Intentional and unintentional errors
on the parts of both interviewers and respondents must be
regulated. Dishonesty, misunderstanding, and fatigue aff ect
fi eldworkers, whereas falsehoods, refusals, misunderstand-
ing, and fatigue aff ect respondents. Several controls and
procedures may be used to overcome these sources of error,
such as supervision, validation, careful selection, and ori-
entation sessions for interviewers. In addition, research-
ers use anonymity, confi dentiality, incentives, validation
checks, the third-person technique, well-drafted question-
naire instructions and examples, response options such as
“unsure,” reversals of scale endpoints, and prompters to
minimize respondent errors.
Nonresponse errors of various types are encountered in
the data collection phase; they include refusals to take part
in the survey, break-off s during the survey, and item omis-
sion (not answering particular questions while answering
all the others). Nonresponse error can be measured by cal-
culating the response rate using the CASRO response rate
formula.
Researchers are becoming increasingly dependent on
panel companies, which maintain very large numbers of
potential respondents who agree to answer surveys quickly
and completely. Even though these companies hold non-
response to a minimum and deliver seemingly represen-
tative samples, data quality is still an issue, and policies
and procedures such as those listed in Table 11. 5 should be
strictly followed.
Responses to surveys are organized into a dataset,
which consists of rows and columns of (mainly) num-
bers where each respondent is represented by a row and
each question or question part is recorded in a column.
Researchers use a data code book that indicates how the
code numbers are related to the question responses on the
questionnaire. Prior to data analysis, the dataset should
be inspected for data quality issues such as incomplete
responses, yea-saying, nay-saying, middle-of-the-road pat-
terns, and other respondents whose answers are suspect.
These respondents’ answers should be removed from the
dataset.
Key Terms
Nonsampling error (p. 289 )
Data collection (p. 290 )
Fieldworker error (p. 290 )
Respondent error (p. 290 )
Intentional fi eldworker errors (p. 290 )
Interviewer cheating (p. 290 )
Leading the respondent (p. 291 )
Unintentional interviewer errors
(p. 291 )
Interviewer misunderstanding (p. 291 )
Fatigue-related mistakes (p. 293 )
Intentional respondent errors (p. 293 )
Falsehoods (p. 293 )
Nonresponse (p. 293 )
Unintentional respondent error
(p. 293 )
Respondent misunderstanding (p. 294 )
Guessing (p. 294 )
Attention loss (p. 294 )
Distractions (p. 295 )
Respondent fatigue (p. 295 )
Supervision (p. 296 )
Validation (p. 297 )
Orientation sessions (p. 298 )
Role-playing sessions (p. 298 )
Anonymity (p. 298 )
Confi dentiality (p. 298 )
Incentives (p. 298 )
Validation checks (p. 298 )
Third-person technique (p. 299 )
Questionnaire instructions and
examples (p. 299 )
Reversals of scale endpoints (p. 299 )
Prompters (p. 299 )
Refusals (p. 301 )
Break-off s (p. 301 )
Item omission (p. 301 )
Completed interview (p. 302 )
CASRO response rate formula
(p. 302 )
Panel company (p. 304 )
Dataset (p. 305 )
Data coding (p. 306 )
Data code book (p. 306 )
Incomplete response (p. 307 )
Yea-saying (p. 307 )
Nay-saying (p. 307 )
Middle-of-the-road pattern (p. 308 )
Review Questions/Applications
11- 1. Distinguish sampling error from nonsampling error.
11- 2. How can sampling error be controlled?
11- 3. Identify diff erent types of intentional fi eldworker
errors and the controls used to minimize them.
Identify diff erent types of unintentional fi eldworker
errors and the controls used to minimize them.
11- 4. Identify diff erent types of intentional respondent
errors and the controls used to minimize them.
M11_BURN3261_08_GE_C11.indd 310M11_BURN3261_08_GE_C11.indd 310 05/09/16 1:22 PM05/09/16 1:22 PM
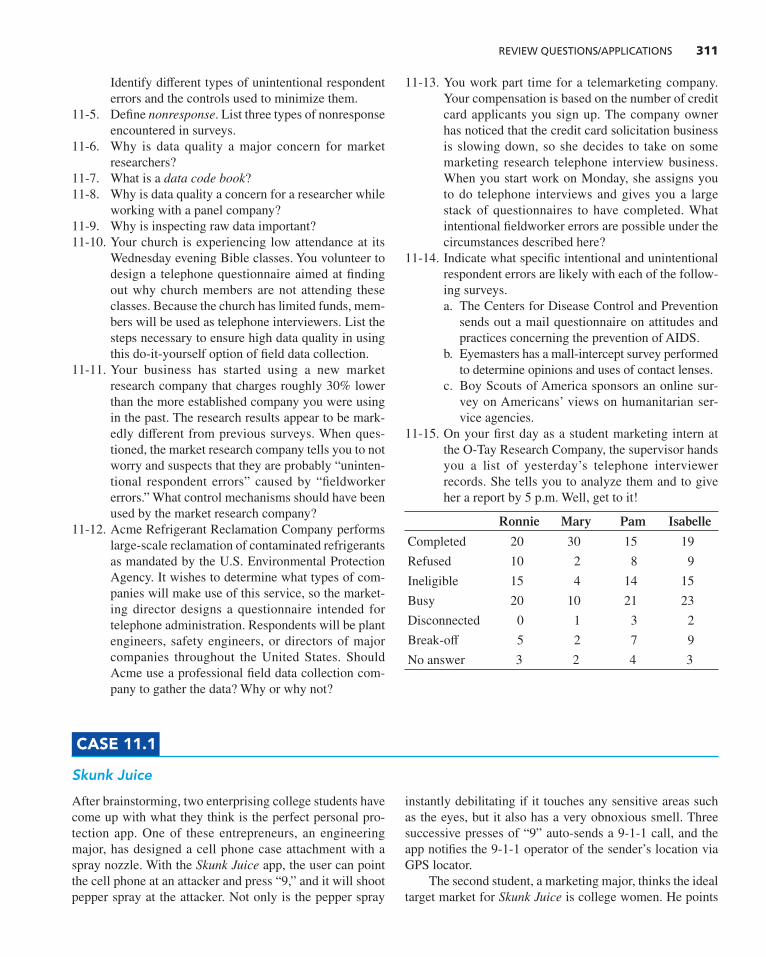
REVIEW QUESTIONS/APPLICATIONS 311
Identify diff erent types of unintentional respondent
errors and the controls used to minimize them.
11- 5. Defi ne nonresponse . List three types of nonresponse
encountered in surveys.
11- 6. Why is data quality a major concern for market
researchers?
11- 7. What is a data code book?
11- 8. Why is data quality a concern for a researcher while
working with a panel company?
11- 9. Why is inspecting raw data important?
11- 10. Your church is experiencing low attendance at its
Wednesday evening Bible classes. You volunteer to
design a telephone questionnaire aimed at fi nding
out why church members are not attending these
classes. Because the church has limited funds, mem-
bers will be used as telephone interviewers. List the
steps necessary to ensure high data quality in using
this do-it-yourself option of fi eld data collection.
11- 11. Your business has started using a new market
research company that charges roughly 30% lower
than the more established company you were using
in the past. The research results appear to be mark-
edly diff erent from previous surveys. When ques-
tioned, the market research company tells you to not
worry and suspects that they are probably “uninten-
tional respondent errors” caused by “fi eldworker
errors.” What control mechanisms should have been
used by the market research company?
11- 12. Acme Refrigerant Reclamation Company performs
large-scale reclamation of contaminated refrigerants
as mandated by the U.S. Environmental Protection
Agency. It wishes to determine what types of com-
panies will make use of this service, so the market-
ing director designs a questionnaire intended for
telephone administration. Respondents will be plant
engineers, safety engineers, or directors of major
companies throughout the United States. Should
Acme use a professional fi eld data collection com-
pany to gather the data? Why or why not?
11- 13. You work part time for a telemarketing company.
Your compensation is based on the number of credit
card applicants you sign up. The company owner
has noticed that the credit card solicitation business
is slowing down, so she decides to take on some
marketing research telephone interview business.
When you start work on Monday, she assigns you
to do telephone interviews and gives you a large
stack of questionnaires to have completed. What
intentional fi eldworker errors are possible under the
circumstances described here?
11- 14. Indicate what specifi c intentional and unintentional
respondent errors are likely with each of the follow-
ing surveys.
a. The Centers for Disease Control and Prevention
sends out a mail questionnaire on attitudes and
practices concerning the prevention of AIDS.
b. Eyemasters has a mall-intercept survey performed
to determine opinions and uses of contact lenses.
c. Boy Scouts of America sponsors an online sur-
vey on Americans’ views on humanitarian ser-
vice agencies.
11- 15. On your fi rst day as a student marketing intern at
the O-Tay Research Company, the supervisor hands
you a list of yesterday’s telephone interviewer
records. She tells you to analyze them and to give
her a report by 5 p.m. Well, get to it!
Ronnie Mary Pam Isabelle
Completed 20 30 15 19
Refused 10 2 8 9
Ineligible 15 4 14 15
Busy 20 10 21 23
Disconnected 0 1 3 2
Break-off 5 2 7 9
No answer 3 2 4 3
CASE 11. 1
Skunk Juice
After brainstorming, two enterprising college students have
come up with what they think is the perfect personal pro-
tection app. One of these entrepreneurs, an engineering
major, has designed a cell phone case attachment with a
spray nozzle. With the Skunk Juice app, the user can point
the cell phone at an attacker and press “9,” and it will shoot
pepper spray at the attacker. Not only is the pepper spray
instantly debilitating if it touches any sensitive areas such
as the eyes, but it also has a very obnoxious smell. Three
successive presses of “9” auto-sends a 9-1-1 call, and the
app notifi es the 9-1-1 operator of the sender’s location via
GPS locator.
The second student, a marketing major, thinks the ideal
target market for Skunk Juice is college women. He points
M11_BURN3261_08_GE_C11.indd 311M11_BURN3261_08_GE_C11.indd 311 05/09/16 1:24 PM05/09/16 1:24 PM

312 CHAPTER 11 • DEALING WITH FIELDWORK AND DATA QUALITY ISSUES
out that on any given night on campus—and especially in
the college’s parking lots—female college students can be
seen walking while using their cell phones or with their cell
phones in their hands. The marketing student believes that
college women who are worried about personal safety will
be eager to buy the Skunk Juice app and cell phone cover
attachment that holds the pepper spray feature as their cell
phones are always in the “ready” state.
These two college students are, of course, working in
a “bare bones” situation because they have tuition, living
expenses, and all the other college student fi nancial obliga-
tions to consider. However, their concept won the campus-
wide “best budding idea” contest, and they have $1,000 to
devote to marketing. The marketing major consults with his
marketing research professor, who recommends that they
conduct a survey of women enrolled in their college. Rec-
ognizing the meager budget, he suggests using the Ameri-
can Marketing Association (AMA) student chapter for
personal interview data collection in a survey as a means of
holding costs down. Personal interviews are necessary be-
cause the Skunk Juice app must be demonstrated and tested
by respondents.
Although the enterprising entrepreneurs are ex-
cited about the survey, they are skeptical of the ability of
students to execute this research. The professor off ers to
facilitate a meeting with them and the marketing research
projects director of the student AMA chapter. He informs
the AMA student chapter president of the opportunity and
suggests that the marketing research projects director draft
a list of the quality control safeguards that would be used
in the Skunk Juice personal interview survey, utilizing 10
AMA student chapter interviewers (fi ve teams) located at
high-traffi c locations on campus.
1. Take the role of the marketing research projects direc-
tor. Draft all the interviewer controls you believe are
necessary to ensure data collection comparable in
quality to that gathered by a professional interviewing
company.
2. The AMA student chapter president calls the marketing
research projects director and says, “I’m concerned
about the questionnaire’s length. It will take over
20 minutes for the typical respondent to complete it.
Isn’t that length going to cause problems?” Again, take
the role of the marketing research projects director.
Indicate what nonresponse problems might result
from the questionnaire’s length and recommend
ways to counter each of these problems.
CASE 11. 2
Sony Televisions Ultra HD TV Survey
Located in Tokyo, Japan, Sony Mobile Communi-
cations is a prominent competitor in the worldwide
electronics equipment market. Because of stagnant
sales in its ultra HD TVs, that division has decided
to use an online panel company as the data collection
method for a survey on consumer attitudes and per-
ceptions of Sony and its major competitors, such as
Samsung and LG. Among the reasons for this decision
are (1) use of an online questionnaire, (2) assurance
of a random sample that represents U.S. households,
(3) high response rate, (4) quick survey data collec-
tion, (5) low refusals to particular questions, (6) no
need to ask about demographics, electronics owner-
ship, and lifestyle, because these attributes of online
panel members are known, and (7) reasonable total
cost.
The Sony marketing research specialist heading up this
survey has narrowed the choice to two online panel com-
panies, based on inspections of their website descriptions,
email and telephone communications, and other factors. The
costs of using these companies are comparable, so no single
provider is favored at this time. To assist in the selection
process, the research team studies the set of questions pub-
lished by the European Society for Opinion and Marketing
Research (ESOMAR), 28 Questions to Help Research Buy-ers of Online Samples . 61 The team selects fi ve questions that
are geared toward data quality. Each competing online panel
company has prepared short responses to the fi ve ques-
tions. Your task is to review the responses of Company A
and Company B and to recommend which company to use.
In your decision, remember that the assurance of highest
data quality is the most important consideration.
Question 1. What experience does your company have with providing online samples for market research?
Company A: We have conducted market research since
1999. We are the only panel company to take advantage
of computer technology and provide a truly nationally
representative U.S. sample online.
Company B: We have supplied online U.S. samples since
1990 and European samples since 2000, and our Asian
Panel went “live” in 2005. We have supplied approximately
5,000 online samples to our clients in the past 10 years.
M11_BURN3261_08_GE_C11.indd 312M11_BURN3261_08_GE_C11.indd 312 16/08/16 5:03 pm16/08/16 5:03 pm

REVIEW QUESTIONS/APPLICATIONS 313
Question 2. Please describe and explain the type(s) of online sample sources from which you recruit respondents.
Company A: Individuals volunteer for our online panel
via our website, where they are informed that they will
be compensated with redemption points based on the
number of surveys in which they take part.
Company B: We recruit household members by asking
them to join our panel, telling them they can have a
say in the development of new products and services.
They are rewarded with “credits” they can use to claim
products.
Question 3. What steps do you take to achieve a representative sample of the target population?
Company A: Our master panel of over 100,000
individuals mirrors the population distribution of the
U.S. Census with respect to 10 demographic factors
such as gender, education, income, marital status, etc.
Company B: The client specifies the target market
population using any one of 1,000 variables, including
demographic, ownership, purchase behavior, and other
variables. We invite panelists who meet the client’s
criteria to participate in the survey.
Question 4. What profiling data are held on respondents? How is it done?
Company A: We maintain extensive individual-level
data in the form of about 1,000 variables, including
demographics, household characteristics, financials,
shopping and ownership, lifestyles, and more. All are
updated every other year.
Company B: For each panelist, we have about 2,500
data points on demographics, assortment of goods and
services owned, segmentation/lifestyle factors, health-
related matters, political opinions, travel, financials,
Internet usage, leisure activities, memberships, etc. Our
updating is done annually.
Question 5. Please describe your survey invitation process.
Company A: Typically a survey invitation is sent via
email and posted on every selected panel member’s
personal member page with a link to the online survey
location: “Click here to start your survey.” The email
invitation is sent daily to selected panelists until the
survey quota is filled.
Company B: Based on the client’s sample requirements,
we email selected panelists with a link to the online
survey. After 48 hours, if the panelist has not
participated, we send a reminder, and we do so again
48 hours after the first reminder.
M11_BURN3261_08_GE_C11.indd 313M11_BURN3261_08_GE_C11.indd 313 16/08/16 5:03 pm16/08/16 5:03 pm

▶
LEARNING OBJECTIVES In this chapter you will learn:
12- 1 What the different types of statistical analyses used in marketing research are
12- 2 Descriptive analysis and how to do it
12- 3 When to use a particular descriptive analysis measure
12- 4 How to perform descriptive analyses with SPSS
12- 5 How to report descriptive statistics to clients
12- 6 The difference between sample statistics and population parameters
12- 7 How to estimate the population percent or mean with a confi dence interval
12- 8 How to obtain confi dence intervals with SPSS
12- 9 How to report confi dence intervals to clients
12- 10 What hypothesis tests are and how to perform them
12- 11 How to report hypothesis tests to clients
“WHERE WE ARE”
1 Establish the need for marketing
research.
2 Defi ne the problem.
3 Establish research objectives.
4 Determine research design.
5 Identify information types and sources.
6 Determine methods of accessing data.
7 Design data collection forms.
8 Determine the sample plan and size.
9 Collect data.
10 Analyze data .
11 Prepare and present the fi nal research
report.
Believe It or Not, You Already Know Basic Descriptive Statistics
When asked what is meant by basic descrip-
tive statistics, most students start trying to
recall some of the concepts they learned back
in their basic statistics course. Of course, try-
ing to recall these concepts is painful, as most
students did not enjoy their required statis-
tics course experience. Probably a few of you
remember something about basic descriptive
statistics, but it may come as a surprise to
learn that all of you know what they are! That’s
correct. In fact, you use basic descriptive sta-
tistics frequently, even though you may not
realize it, and we can prove it. What are the
fi rst few questions students ask their professors after they take a test?
In our experience as professors, the questions go something like this…
First question: “What was the average score on the test?”
Let’s suppose that your professor answers “85.” Now, some of you
were hoping to make much higher than a B and others of you may won-
der, “Wow! I hope I made an 85 but I wonder how many scored below
the average.” So, the answer to the fi rst question almost immediately
gives rise to the second question.
Second question: “What was the grade distribution? How many As,
Bs, Cs, and so on?”
These two “natural” questions that students ask about grades actu-
ally involve basic descriptive statistics. For a survey, basic descriptive
statistics answer two fundamental questions: (1) How did the average
person respond? and (2) How different are the others from this average?
So, when your professor says the average grade was an 85, he or she is
12 Using Descriptive Analysis, Performing Population Estimates, and Testing Hypotheses
What is the fi rst
question students ask
their professor after
the class takes a test?
© W
aveb
reak
med
ia/S
hutt
erst
ock
M12_BURN3261_08_GE_C12.indd 314M12_BURN3261_08_GE_C12.indd 314 30/08/16 10:47 am30/08/16 10:47 am

315
answering the fi rst question. When your professor gives you the numbers, or percentages, of
letter grades A, B, C, and so forth for the class, he or she is answering the second question.
Note that it is important to know answers to both questions. Knowing only the fi rst answer
tells you the average performance of the class but not how different the other scores may
be. While it is possible that everyone scored an 85, it is also possible that no one scored an
85; some may have scored very high and some may have scored very low! Note how these
answers will cause the professor to make different interpretations of the average test score. In
the fi rst case, everyone is doing “average.” In the second case, the class has some outstand-
ing students and others who, for whatever reason, are not learning the material well at all. You
can see why it is important to answer both these questions.
Let’s think of a marketing research application of basic descriptive statistics. In our Auto
Concepts case we have asked a sample of consumers many questions about their demo-
graphics, magazine readership, other media preferences, and the desirability of various
fuel-effi cient new automobile models that could be developed. After making certain that all
the data have been correctly input into a computer program such as SPSS, the marketing
researcher will run basic descriptive statistics. You will have the opportunity to work with this
SPSS dataset as you read and do the Active Learning and Integrated Case exercises in this
chapter. For now, simply read our example. We will look at the question: “How desirable is a
fi ve-seat economy gasoline automobile model?” The answers are measured on a 1–7 scale
ranging from Very undesirable (1) to Very desirable (7). Now we are ready to answer our two
questions: What was the average response to the question? Since we have an interval scale,
“average” may be an arithmetic mean. As you will learn in this chapter, when you want to
calculate an arithmetic mean, you run the SPSS command “Descriptives,” which gives you the
following output:
Descriptive Statistics
N Minimum Maximum Mean Std. DeviationDesirability: 5-Seat Economy Gasoline
1,000 1 7 3.21 1.453
Valid N (listwise) 1,000
We see our average as 3.21 on a 7-point scale. This is like knowing that our average test
score is 85, which alone gives us some information. We know there is some preference for
this auto; we don’t have a really low score nor do we have an extremely high score. Now,
what about our second question? How different are those who didn’t have this “average”
score? Statisticians use the term variance to describe the degree to which data vary. One
measure of variance is the standard deviation, which is reported to us as 1.453. The higher
this number, the more people differ from the average; the lower the number, the less they
differ. Another measure of variance is the range . We see that some scored the minimum (1)
M12_BURN3261_08_GE_C12.indd 315M12_BURN3261_08_GE_C12.indd 315 17/08/16 4:05 pm17/08/16 4:05 pm

316 CHAPTER 12 • USING DESCRIPTIVE ANALYSIS, PERFORMING POPULATION ESTIMATES, AND TESTING HYPOTHESES
and some scored the maximum (7). If we want to know how many scored in each of the seven
different scale categories, we would run another SPSS command, “Frequencies.” The output
is shown here.
Desirability: 5-Seat Economy Gasoline Frequency Percent Valid Percent Cumulative Percent
Very undesirable 104 10.4 10.4 10.4
Undesirable 248 24.8 24.8 35.2
Somewhat undesirable 288 28.8 28.8 64.0
Neutral 141 14.1 14.1 78.1
Somewhat desirable 150 15.0 15.0 93.1
Desirable 51 5.1 5.1 98.2
Very desirable 18 1.8 1.8 100.0
Total 1,000 100.0 100.0
With these two tables alone, the marketing researcher has provided the client with all the
basic descriptive statistics the client needs to understand the responses to this question. In
this chapter you will learn when and how to run “Descriptives” and “Frequencies” in SPSS.
When you fi nish the chapter, you will be able to do more than just articulate what is meant by
basic descriptive statistics. You will know how to use the powerful SPSS tool to generate them
for you. You will also learn that basic descriptive statistics are the mainstay of most marketing
research projects.
This chapter begins our discussion of the various statistical techniques available to
the marketing researcher. As you will soon learn, these techniques are devices to
convert formless data into valuable information, as illustrated in the vignette that
opens this chapter. These techniques summarize and communicate patterns found in the
datasets marketing researchers analyze. We preview five different types of statistical
analyses commonly used by marketing researchers. Next, we define descriptive analysis
and discuss descriptive measures such as the mode, median, and mean. We also discuss
measures of variability, including the frequency distribution, range, and standard devia-
tion. It is important to understand when each measure is appropriate, so this topic is also
addressed. Finally, we show you how to obtain the various descriptive statistics available
in SPSS.
We continue the chapter by noting that the term statistic applies to a number computed
for a sample, whereas the term parameter pertains to the related population value. Next,
we describe the concept of logical inference and show how it relates to statistical infer-
ence. There are two basic types of statistical inference, and we discuss both cases. The
fi rst is parameter estimation in which a value, such as the population mean, is estimated
based on a sample’s mean and its size. Second is hypothesis testing in which an assess-
ment is made as to how much of a sample’s fi ndings support a manager’s or researcher’s a
priori belief regarding the size of a population value. We provide formulas and numerical
examples and also show examples of SPSS procedures and output using the Auto Concepts
survey data.
M12_BURN3261_08_GE_C12.indd 316M12_BURN3261_08_GE_C12.indd 316 17/08/16 4:05 pm17/08/16 4:05 pm

12-1 TYPES OF STATISTICAL ANALYSES USED IN MARKETING RESEARCH 317
12- 1 Types of Statistical Analyses Used in Marketing Research You learned in the previous chapter that a marketing researcher works with a dataset, which
is an arrangement of numbers (mainly) in rows and columns. You also know that the columns
represent answers to the various questions on the survey questionnaire, and the rows repre-
sent each respondent. The problem confronting the marketing researcher when faced with a
dataset is data analysis , which is defi ned as the process of describing a dataset by comput-
ing a small number of statistics that characterize various aspects of the dataset. Data analysis
distills the dataset while retaining enough information so the client can mentally envision its
salient characteristics. 1
There are fi ve basic types of statistical analyses that can be used by marketing researchers
to reduce a dataset: descriptive analysis, inference analysis, diff erence analysis, association
analysis, and relationships analysis ( Table 12. 1 ). Each one has a unique role in the data analy-
sis process; moreover, they are usually combined into a complete analysis of the information
in order to satisfy the research objectives. These techniques are progressively more complex,
but at the same time, they convert raw data into increasingly more useful information as they
increase in complexity. These introductory comments preview the subject matter that will be covered in this and
other chapters . Because this is an introduction, we use the names of statistical procedures,
but we do not defi ne or describe them here. The specifi c techniques are all developed later in
this textbook. It is important, however, that you understand each of the various categories of
analysis available to the marketing researcher and comprehend generally what each is about.
DESCRIPTIVE ANALYSIS Certain measures such as the mean, mode, standard deviation, and range are forms of descrip-tive analysis used by marketing researchers to describe the sample dataset in such a way as
to portray the “typical” respondent and to reveal the general pattern of responses. Descriptive
measures are typically used early in the analysis process and become foundations for subse-
quent analysis. 2
TABLE 12. 1 Five Types of Statistical Analyses Used by Marketing Researchers
Type Description Example Statistical Concepts
Descriptive Analysis
( Chapter 12 )
Summarizes basic fi ndings
for the sample
Describes the typical respondent,
describes how similar respondents
are to the typical respondent
Mean, median, mode, frequency
distribution, range, standard
deviation
Inference
Analysis
( Chapter 12 )
Determines population
parameters, tests hypotheses
Estimates population values Standard error, null hypothesis
Diff erence
Analysis
( Chapter 13 )
Determines if diff erences
exist
Evaluates the statistical signifi cance
of diff erence in the means of two
groups in a sample
t test of diff erences, analysis of
variance
Association
Analysis
( Chapter 14 )
Determines connections Determines if two variables are
related in a systematic way
Correlation, cross-tabulation
Relationships
Analysis
( Chapter 15 )
Finds complex relationships
for the variables in
the dataset
Determines how several independent
variables are related to a key depen-
dent variable
Multiple regression
Descriptive analysis is used to describe the variables (question responses) in a dataset (all respondents’ answers).
M12_BURN3261_08_GE_C12.indd 317M12_BURN3261_08_GE_C12.indd 317 17/08/16 4:05 pm17/08/16 4:05 pm
318 CHAPTER 12 • USING DESCRIPTIVE ANALYSIS, PERFORMING POPULATION ESTIMATES, AND TESTING HYPOTHESES
Difference analysis is used to compare the mean of the responses of one group to that of another group, such as satisfaction ratings for “heavy” users versus “light” users.
INFERENCE ANALYSIS When statistical procedures are used by marketing researchers to generalize the results of
the sample to the target population that it represents, the process is referred to as inference analysis . In other words, such statistical procedures allow a researcher to draw conclusions
about the population based on information contained in the dataset provided by the sample.
Inferential statistics include hypothesis testing and estimating true popula-
tion values using confi dence intervals. We describe basic statistical inference
in this chapter.
DIFFERENCE ANALYSIS Occasionally, a marketing researcher needs to determine whether two groups
are diff erent. For example, the researcher may be investigating credit card
usage and may want to see if high-income earners diff er from moderate-
income earners in how often they use American Express. The researcher
may statistically compare the average annual dollar expenditures charged on
American Express by high- versus moderate-income buyers. Important mar-
ket segmentation information may come from this analysis. Or he or she may
run an experiment to see which of several alternative advertising themes gar-
ners the most favorable impression. The researcher uses diff erence analysis
to determine the degree to which real and generalizable diff erences exist in
the population in order to help the manager make an enlightened decision on
which advertising theme to use. Statistical diff erences analyses include the t test for signifi cant diff erences between groups and analysis of variance. We
defi ne and describe them in Chapter 13 .
ASSOCIATION ANALYSIS Other statistical techniques are used by researchers to determine systematic
relationships among variables. Association analysis investigates if and how
two variables are related. For instance, are advertising recall scores positively
associated with intentions to buy the advertised brand? Are expenditures
on sales force training positively associated with sales force performance?
Depending on the statistic used, the analysis may indicate the strength of the association and/
or the direction of the association between two questions on a questionnaire in a given study.
We devote Chapter 14 to descriptions of cross-tabulations and correlations that are basic asso-
ciation analysis methods used in marketing research.
RELATIONSHIPS ANALYSIS Techniques are also available if the researcher is interested in determining more complex pat-
terns of associations, but most of these procedures are beyond the scope of this textbook, with
one exception. Statistical procedures and models are available to the marketing researcher to
help make forecasts about future events; these fall under the category of relationships analysis .
Regression analysis is commonly used by the marketing researcher to understand such com-
plex connections. Because marketing managers are typically worried about several factors
simultaneously, understanding connections among these factors is very desirable, as this
understanding can provide very valuable insight of multiple relationships among the variables
in a dataset. Regression analysis is described in depth in Chapter 15 . It is not our intention to make you an expert in statistical analysis. Rather, the primary
objective of our chapters on statistical analysis is to acquaint you with the basic concepts
involved in each of the selected measures. You will certainly do basic statistical analysis
throughout your marketing career, and it is very likely that you will encounter information
summarized in statistical terms. So it is important for you to have a conceptual understanding
Inference analysis is used to generate conclusions about the population’s characteristics based on the sample data.
Diff erences analysis may reveal important
distinctions among various types of credit
card users.
Association analysis determines the strength and direction of relationships between two or more variables (questions in the survey).
Relationships analysis allows insights into multiple relationships among variables.
© P
affy
/Shu
tter
stoc
k
M12_BURN3261_08_GE_C12.indd 318M12_BURN3261_08_GE_C12.indd 318 17/08/16 4:05 pm17/08/16 4:05 pm

12-2 UNDERSTANDING DESCRIPTIVE ANALYSIS 319
of the commonly used statistical procedures. Our descriptions are intended to show you when
and where each measure is appropriately used and to help you interpret the meaning of the
statistical result once it is reported. We also rely heavily on computer statistical program out-
put because you will surely encounter statistical program output in your company’s marketing
information system and/or summarized in a marketing research study report.
12- 2 Understanding Descriptive Analysis We now turn to the several tools in descriptive analysis available to the researcher to sum-
marize the data obtained from a sample of respondents. In this chapter and in all other data
analysis chapters , we are going to use the Auto Concepts survey dataset organized in an
SPSS data fi le called Auto Concepts.sav . That way, you can reconstruct the data analysis on
your own with SPSS using the dataset. To download this dataset, go to the following website
http://www.pearsonglobaleditions.com/burns and fi nd the dataset download area.
Two sets of measures are used extensively to describe the information obtained in a sam-
ple. The fi rst set involves measures of central tendency or measures that describe the “typi-
cal” respondent or response. The second set involves measures of variability or measures that
describe how similar (dissimilar) respondents or responses are to (from) “typical” respon-
dents or responses. Other types of descriptive measures are available, but they do not enjoy
the popularity of central tendency and variability. In fact, they are rarely reported to clients.
MEASURES OF CENTRAL TENDENCY: SUMMARIZING THE “TYPICAL” RESPONDENT The basic data analysis goal involved in all measures of central tendency is to report a
single piece of information that describes the most typical response to a question. The term
central tendency applies to any statistical measure used that somehow refl ects a typical or fre-
quent response. 3 Three such measures of central tendency are commonly used as data analysis
devices. 4 They are the mode, the median, and the mean. We describe each one in turn.
Mode The mode is a descriptive analysis measure defi ned as that value in a string of num-
bers that occurs most often. In other words, if you scanned a list of numbers constituting a
fi eld in a dataset, the mode would be that number that appeared more than any other. You should note that the mode is a relative measure of central tendency, for it does not
require that a majority of responses occurred for this value. Instead, it simply specifi es the
value that occurs most frequently, and there is no requirement that this occurrence is 50%
or more. It can take on any value as long as it is the most frequently occurring number. If a
tie for the mode occurs, the distribution is considered to be “bimodal.” Or it might even be
“trimodal” if there is a three-way tie.
Median An alternative measure of central tendency is the median , which expresses that
value whose occurrence lies in the middle of an ordered set of values. That is, it is the value
such that one-half of all of the other values is greater than the median and one-half of the
remaining values is less than the median. Thus, the median tells us the approximate halfway
point in a set or string of numbers that are arranged in ascending or descending order while
taking into account the frequency of each value. With an odd number of values, the median
will always fall on one of the values, but with an even number of values, the median may fall
between two adjacent values. To determine the median, the researcher creates a frequency or percentage distribution
with the numbers in the string in either ascending or descending order. In addition to the raw
percentages, he or she computes cumulative percentages and, by inspecting these, fi nds where
the 50–50 break occurs. You should notice that the median supplies more information than
does the mode, for a mode may occur anywhere in the string, but the median must be at the
halfway point.
Commonly used descriptive analysis reveals central tendency (typical response) and variability (similarity of responses).
Three measures of central tendency are mode, median, and mean.
With a set of numbers, the mode is that number appearing most often.
The median expresses the value whose occurrence lies in the middle of a set of ordered values.
M12_BURN3261_08_GE_C12.indd 319M12_BURN3261_08_GE_C12.indd 319 17/08/16 4:05 pm17/08/16 4:05 pm

320 CHAPTER 12 • USING DESCRIPTIVE ANALYSIS, PERFORMING POPULATION ESTIMATES, AND TESTING HYPOTHESES
Mean A third measure of central tendency is the mean , sometimes referred to as the aver-
age. It diff ers from the mode and the median in that a computation is necessary. The mean is
computed through the use of the following formula:
Formula for a mean
Mean (x) =a
n
i=1
xi
n
where
n = the number of cases
x i = each individual value
∑ signifi es that all the x i values are summed
As you can see, all of the members in the set of n numbers, each designated by x i , are
summed and that total is divided by the number of members in that set. The resulting number
is the mean, a measure that indicates the central tendency of those values. It approximates the
typical value in that set of values. Because the mean is determined by taking every member of
the set of numbers into account through this formula, it is more informative than the median.
The mean communicates a great deal of information, and it is a practically universally under-
stood statistical concept.
MEASURES OF VARIABILITY: RELATING THE DIVERSITY OF RESPONDENTS Although they are extremely useful, measures of central tendency are incomplete descriptors
of the values in a particular set of numbers. That is, they do not indicate the variability of
responses to a particular question or, alternatively, the diversity of respondents on some char-
acteristic measured in our survey. To gain sensitivity for the diversity or variability of values,
the marketing researcher must turn to measures of variability. All measures of variability are
concerned with depicting the “typical” diff erence among the numbers in a set
of values. It is one matter to know the mode or some other measure of central ten-
dency, but it is quite another matter to be aware of how close to that mean or
measure of central tendency the rest of the values fall. Knowing the variabil-
ity of the data could greatly impact a marketing decision based on the data
because it expresses how similar the respondents are to one another on the
topic under examination. Three measures of variability are frequency distri-
bution, range, and standard deviation. Each measure provides its own unique
version of information that helps to describe the diversity of responses.
Frequency and Percentage Distribution A frequency distribution
is a tabulation of the number of times that each diff erent value appears in a
particular set of values. Frequencies themselves are raw counts, and normally
these frequencies are converted into percentages for ease of comparison. The
conversion is arrived at very simply through the division of the frequency for
each value by the total number of observations for all of the values, resulting
in a percent, called a percentage distribution . Of course, the sum of all these
percent values is 100%. To elaborate, a frequency distribution is an accounting of the occurrences
of values in a set. It quickly communicates all the diff erent values in the set,
and it expresses how similar the values are. The percentage distribution is often
used along with or in place of a frequency distribution because people can eas-
ily relate to percentages. Plus, percentage distributions are easily presented as
The mean is the arithmetic average of a set of numbers.
Measures of variability reveal the typical difference between the values in a set of values.
Measures of variability include frequency distribution, range, and standard deviation.
Variability indicates how diff erent
respondents are on a topic, such as what
model of automobile is preferred.
A frequency (percentage) distribution reveals the number (percent) of occurrences of each number in a set of numbers.
To learn about mea-sures of cen-tral tendency, launch www.
youtube.com , and search for “Measures of Central Tendency Rap.”
© M
ango
stoc
k/S
hutt
erst
ock
M12_BURN3261_08_GE_C12.indd 320M12_BURN3261_08_GE_C12.indd 320 17/08/16 4:05 pm17/08/16 4:05 pm

12-2 UNDERSTANDING DESCRIPTIVE ANALYSIS 321
pie or bar charts, 5 which are convenient graphical representations of these distributions that
researchers fi nd very helpful in communicating fi ndings to clients or others.
Range The range identifi es the distance between the lowest value (minimum) and the high-
est value (maximum) in an ordered set of values. Stated somewhat diff erently, the range speci-
fi es the diff erence between the endpoints in a set of values arranged in order. The range does
not provide the same amount of information supplied by a frequency distribution; however, it
identifi es the interval in which the set of values occurs. The range also does not tell you how
often the maximum and minimum occurred, but it does provide some information on the dis-
persion by indicating how far apart the extremes are found.
Standard Deviation The standard deviation indicates the degree of variation or diversity
in the values in such a way as to be translatable into a normal or bell-shaped curve distribu-
tion. Marketing researchers often rely on the standard deviation when performing basic analy-
ses, and they usually report it in their tables. So it is worthwhile to digress for a moment to
describe this statistical concept. Figure 12. 1 shows the properties of a bell-shaped or normal distribution of values. As we
have indicated in our chapter on sample size determination, the usefulness of this model is
apparent when you realize that it is a symmetric distribution: Exactly 50% of the distribution
lies on either side of the midpoint (the apex of the curve). With a normal curve, the midpoint
is also the mean, signifi ed by μ, the population mean, in the fi gure. Standard deviations are
standardized units of measurement that are located on the horizontal axis. They relate directly
to assumptions about the normal curve. For example, the range of 1.64 standard deviations
above and 1.64 standard deviations below the midpoint includes 90% of the total area under-
neath that curve. Because the bell-shaped distribution is a theoretical or ideal concept, this
property never changes. Moreover, the proportion of area under the curve and within plus or
minus any number of standard deviations from the mean is perfectly known. For the purposes
of this presentation, normally only two or three of these values are of interest to marketing
researchers. Specifi cally, ±2.58 standard deviations describes the range in which 99% of the
area underneath the curve is found, ±1.96 standard deviations is associated with 95% of the
area underneath the curve, and ±1.64 standard deviations corresponds to 90% of the bell-
shaped curve’s area. Remember, we must assume that the shape of the frequency distribu-
tion of the numbers approximates a normal curve, so keep this in mind during our following
examples.
The range identifi es the maximum and minimum values in a set of numbers.
A standard deviation indicates the degree of variation in a way that can be translated into a bell-shaped curve distribution.
The standard deviation embodies the properties of a bell-shaped distribution of values.
� – 3� � + 3�� + 2�� + 1�� – 2� � – 1� �
68.26%
95.46%
99.73%
FIGURE 12.1 Normal Curve Interpretation of Standard Deviation
M12_BURN3261_08_GE_C12.indd 321M12_BURN3261_08_GE_C12.indd 321 17/08/16 4:05 pm17/08/16 4:05 pm

322 CHAPTER 12 • USING DESCRIPTIVE ANALYSIS, PERFORMING POPULATION ESTIMATES, AND TESTING HYPOTHESES
It is now time to review the calculation of the standard deviation. The equation typically
used for the standard deviation is as follows:
Formula for a standard deviation
Standard deviation (s) = Ra
n
i - 1
(xi - x)2
n - 1
where
n = the number of cases
x i = each individual value
x− = the mean (average)
∑ signifi es that all the x i values are summed
The standard deviation is a measure of the diff erences of all observations from the mean,
expressed as a single number. To compute the standard deviation, you must begin with the
mean, and then compare each observation to the mean by subtracting and squaring the dif-
ference. It may seem strange to square diff erences, add them up, divide them by ( n − 1) and
then take the square root. If we did not square the diff erences, we would have positive and
negative values; if we summed them, there would be a cancellation eff ect. That is, large
negative diff erences would cancel out large positive diff erences, and the numerator would
end up being close to zero. But this result is contrary to what we know is the case with large
diff erences: There is variation, which should be expressed by the standard deviation. The for-
mula remedies this problem by squaring the subtracted diff erences before they are summed.
Squaring converts all negative numbers to positives and, of course, leaves the positives posi-
tive. Next, all of the squared diff erences are summed and divided by 1 less than the number
of total observations in the string of values; 1 is subtracted from the number of observations
to achieve what is typically called an “unbiased” estimate of the standard deviation. But we
now have an infl ation factor to worry about because every comparison has been squared. To
adjust for this, the equation specifi es that the square root be taken after all other operations
are performed. This fi nal step adjusts the value back down to the original measure (e.g., units
rather than squared units). By the way, if you did not take the square root at the end, the value
would be referred to as the variance . In other words, the variance is the standard deviation
squared. Now, whenever a standard deviation is reported along with a mean, a specifi c pic-
ture should appear in your mind. Assuming that the distribution is bell shaped, the size
of the standard deviation number helps you envision how similar or dissimilar the typical
responses are to the mean. If the standard deviation is small, the distribution is greatly com-
pressed. With a large standard deviation value, the distribution is consequently stretched out
at both ends.
12- 3 When to Use a Particular Descriptive Measure In Chapter 8 , you learned that the level of measurement for a scale aff ects how it may be
statistically analyzed. Remember, for instance, that nominal question forms contain much
less information than do those questions with interval scaling assumptions. Recall that in
Chapter 8 , we defi ned and gave examples of interval and ratio scales. SPSS allows users to
identify scale types, and it uses “scale” as the label to refer to either an interval or a ratio
scale. We will use the SPSS label from this point on. Similarly, the amount of informa-
tion provided by each of the various measures of central tendency and dispersion diff ers.
As a general rule, statistical measures that communicate the most amount of information
should be used with scales that contain the most amount of information, and measures that
communicate the least amount of information should be used with scales that contain the
The squaring operation in the standard deviation formula is used to avoid the cancellation effect.
With a bell-shaped distribution, 95% of the values lie within ±1.96 times the standard deviation away from the mean.
To learn about mea-sures of cen-tral tendency, launch www.
youtube.com , and search for “Summarizing Distributions: Measures of Variability.”
M12_BURN3261_08_GE_C12.indd 322M12_BURN3261_08_GE_C12.indd 322 17/08/16 4:05 pm17/08/16 4:05 pm

12-4 THE AUTO CONCEPTS SURVEY: OBTAINING DESCRIPTIVE STATISTICS WITH SPSS 323
least amount of information. The level of measurement deter-
mines the appropriate measure; otherwise, the measure cannot
be interpreted. At fi rst reading, this rule may seem confusing, but on refl ec-
tion it should become clear that the level of measurement of each
question dictates the measure that should be used. It is precisely
at this point that you must remember the arbitrary nature of cod-
ing schemes. For instance, if on a demographic question concern-
ing religious affi liation, “Catholic” is assigned a “1,” “Protestant”
is assigned a “2,” “Jewish” is assigned a “3,” and so forth, a mean
could be computed. But what would be the interpretation of an
average religion of 2.36? It would have no practical interpreta-
tion because the mean assumes interval or ratio scaling (SPSS’s
“scale”), whereas the religion categories are nominal. The mode
would be the appropriate central tendency measure for these
responses.
Table 12. 2 indicates how the level of measurement relates to
each of the three measures of central tendency and measures of
variation. The table should remind you that a clear understanding
of the level of measurement for each question on the question-
naire is essential because the researcher must select the statistical
procedure and direct the computer to perform the procedure. The
computer cannot distinguish the level of measurement because
we typically store and handle our data as numbers as matters of
convention and convenience.
12- 4 The Auto Concepts Survey: Obtaining Descriptive Statistics with SPSS
INTEGRATED CASE Beginning with this chapter and all subsequent chapters dealing with statistical analyses, we
provide illustrations with the use of SPSS in two ways. First, in your textbook descriptions,
we indicate step-by-step procedures used with SPSS to obtain the statistical analyses being
described. Plus, we have included examples of SPSS output in these sections. The second
way is with the use of your SPSS Student Assistant. By now, you are well acquainted with the
Student Assistant. We prompt you to look at the statistical analysis sections that illustrate how
to operate SPSS, as well as how to fi nd specifi c statistical results in SPSS output.
The scaling assumptions underlying a question determine which descriptive measure is appropriate.
TABLE 12. 2 What Descriptive Statistic to Use When
Example Question Measurement LevelCentral Tendency (Most Typical Response)
Variability (Similarity of Responses)
What is your gender? Nominal scale Mode Frequency and/or percentage
distribution
Rank these fi ve brands from your fi rst
choice to your fi fth choice.
Ordinal scale Median Cumulative percentage
distribution
On a scale of 1 to 5, how does “Starbucks”
rate on variety of its coff ee drinks?
Interval scale Mean Standard deviation and/or
range
About how many times did you buy fast
food for lunch last week?
Ratio scale Mean Standard deviation and/or
range
Don’t monkey around! Use the guide in Table 12. 2
to decide which is the appropriate descriptive analysis
to use.
Descriptive statistics are needed to see the Auto Concepts survey’s basic fi ndings.
© E
ric
Isse
lee/
Shu
tter
stoc
k
M12_BURN3261_08_GE_C12.indd 323M12_BURN3261_08_GE_C12.indd 323 17/08/16 4:05 pm17/08/16 4:05 pm

324 CHAPTER 12 • USING DESCRIPTIVE ANALYSIS, PERFORMING POPULATION ESTIMATES, AND TESTING HYPOTHESES
USE SPSS TO OPEN UP AND USE THE AUTO CONCEPTS DATASET For your information and as a quick review, the questionnaire was posted online, and with
the aid of a panel company qualifi ed respondents answered the questions and submitted their
questionnaires in the time period allotted for the online survey. Certain questions, such as
demographics and automobile ownership, were purchased from the panel company’s data-
base. The survey and database data were combined and set up in SPSS with variable names
and value labels and cleaned. The fi nal dataset has a total of 1,000 respondents and 32 vari-
ables, and it exists as an SPSS data fi le called “ Auto Concepts.sav .” At your earliest con-
venience, you should download the “ Auto Concepts.sav ” fi le and use SPSS to examine the
questions and response formats that were used in the Auto Concepts survey. We will refer to
some of these as we instruct you on the use of SPSS for various types of analyses described in
this chapter and other chapters that follow .
From now on, you are going to “watch over the shoulder” of the marketing researcher
confronted with analyzing this dataset. As you should know, an SPSS dataset is made up
Active Learning
Compute Measures of Central Tendency and Variability
This chapter has described measures of central tendency (mean, median, and mode) as well as measures of variability (percentage distribution, range, and standard deviation). At the same time, you should realize that certain measures are appropriate for some scales but inap-propriate for other scales. In the table that follows is a dataset of respondents who answered questions on a survey about the propane gas grills they own.
For each question, determine what measure(s) of central tendency and what measures of variability are appropriate and compute them. We have identified the relevant measures under the “Respondent” column of the dataset, and your task is to write in the proper answer (or “not appropriate”) under each of the three questions in the survey.
Respondent
For how many years have you owned your gas grill?
Where did you purchase your
gas grill?
About how much did you pay for your gas grill?
1 2 Department store $200
2 7 Hardware store $500
3 8 Department store $300
4 4 Specialty store $400
5 2 Specialty store $600
6 1 Department store $300
7 3 Department store $400
8 4 Department store $300
9 6 Specialty store $500
10 8 Department store $400
Mean ____ ____ ____
Standard Deviation ____ ____ ____
Range: maximum ____ ____ ____
Range: minimum ____ ____ ____
Median ____ ____ ____
Mode ____ ____ ____
M12_BURN3261_08_GE_C12.indd 324M12_BURN3261_08_GE_C12.indd 324 17/08/16 4:05 pm17/08/16 4:05 pm

12-4 THE AUTO CONCEPTS SURVEY: OBTAINING DESCRIPTIVE STATISTICS WITH SPSS 325
of rows and columns (in the “Data View” window). The columns are the variables that cor-
respond to the questions and parts of questions on the questionnaire, and the individual rows
represent each respondent. To review the response categories and scales used in the survey,
use the “Variable View” window and/or the Utilities-Variables feature of SPSS.
OBTAINING A FREQUENCY DISTRIBUTION AND THE MODE WITH SPSS Many questions on the Auto Concepts survey had categorical response options and, thus,
embodied nominal scaling assumptions. With a nominal scale, the mode is the appropriate
measure of central tendency, and variation must be assessed by looking at the distribution of
responses across the various response categories. To illustrate how to obtain a frequency distribution and a percentage distribution and to
determine the mode of our 1,000-respondent Auto Concepts dataset, we will use the size of
the hometown variable, as it is a nominal scale. Figure 12. 2 shows the clickstream sequence
to fi nd a mode for the size of hometown using the entire Auto Concepts survey dataset.
As you can see, the primary menu sequence is ANALYZE-DESCRIPTIVE STATISTICS-
FREQUENCIES. This sequence opens up the variable selection window where you specify
the variable(s) to be analyzed, and the Statistics … button opens up the Statistics window,
which has several statistical concepts as options. Since we are working only with the mode,
click in the check mark box beside the Mode. Click Continue to close this window and OK to
close the variable selection and cause SPSS to create a frequency distribution and to identify
the mode. You can see this output in Figure 12. 3 where the code number “4” is specifi ed as
the mode response, and the frequency distribution shows that “500K to 1 million” is the larg-
est hometown/city size represented with 396 respondents selecting it, or 39.6% of the total.
As you look at the output, you should notice that the variable labels and value labels were
defi ned, and they appear on the output. The DESCRIPTIVE STATISTICS-FREQUENCIES pro-
cedure creates a frequency distribution and associated percentage distribution of the responses for
each question. Its output includes a statistics table and a table for each variable that includes the
variable label, value labels, frequencies, percent, valid percent, and cumulative percent.
A frequency distribution and mode are appropriate for nominal scales.
Use the ANALYZE-DESCRIPTIVE STATISTICS-FREQUENCIES procedure to produce descriptive statistics for variables with nominal or ordinal scaling.
FIGURE 12.2 IBM SPSS Clickstream to Obtain a Frequency Distribution and the Mode
Source: Reprint Courtesy of International Business Machines Corporation, © International Business Machines Corporation.
M12_BURN3261_08_GE_C12.indd 325M12_BURN3261_08_GE_C12.indd 325 17/08/16 4:05 pm17/08/16 4:05 pm

326 CHAPTER 12 • USING DESCRIPTIVE ANALYSIS, PERFORMING POPULATION ESTIMATES, AND TESTING HYPOTHESES
Our Auto Concepts survey dataset is not typical because there are no missing answers.
There are no missing responses because the dataset was purchased from a consumer panel
company that guaranteed 100% response. However, as you learn in Chapter 14 , it is not
uncommon for respondents to refuse to answer a question in a survey or for them to be unable
to answer a question. Alternatively, a respondent may be directed to skip a question if his or
her previous answer does not qualify him or her for the subsequent question. If any of these
occurs, and the respondent is still included in the dataset, we have an instance of “missing
data.” This is absolutely no problem for SPSS and most other data analysis programs, but the
output will be adjusted to compensate for the missing data. Do the following Active Learning
exercise to learn how SPSS recognizes and handles missing data.
FINDING THE MEDIAN WITH SPSS It is also a simple matter to determine the median using the ANALYZE-DESCRIPTIVE
STATISTICS-FREQUENCIES menu sequence. As we indicated, in order for the median to
be a sensible measure of central tendency, the values must, at minimum, have ordinal scale
properties. The size of town variable uses the following codes: (1) Under 10K, (2) 10K to
100K, (3) 100K to 500K, (4) 500K to 1 million, and (5) 1 million and more.
The codes have ordinal properties: A “1” size is smaller than a “2” size, and so on,
through a “5” size city. It is a simple matter to use the Auto Concepts dataset to obtain the
size of hometown median from the full dataset. The procedure is very similar to the mode
procedure as, fi rst, the “size of hometown or city” variable is selected in the variable selection
window, but, second, the median, rather than the mode, is checked in the statistics window.
Refer to Figure 12. 3 , and just imagine that the size of hometown or city is the chosen variable
and that the median is checked instead of the mode.
The resulting SPSS output will have the frequency distribution of our likelihood variable,
and it will show that code number 4, pertaining to “500K to 1 million” is the 50/50 location
in the scale, or the median.
FIGURE 12.3 IBM SPSS Output for a Frequency Distribution and the Mode
Source: Reprint Courtesy of International Business Machines Corporation, © International Business Machines Corporation.
IBM SPSS Student Assistant Element Descriptive Statistics for Nominal Data: Frequencies, Percents, Mode
M12_BURN3261_08_GE_C12.indd 326M12_BURN3261_08_GE_C12.indd 326 17/08/16 4:05 pm17/08/16 4:05 pm

12-4 THE AUTO CONCEPTS SURVEY: OBTAINING DESCRIPTIVE STATISTICS WITH SPSS 327
FINDING THE MEAN, RANGE, AND STANDARD DEVIATION WITH SPSS As we have mentioned, computer statistical programs cannot distinguish the level of measure-
ment of various questions. Consequently, it is necessary for the analyst to discern the level
of measurement and to select the correct procedure(s). There are some questions in the Auto
Concepts survey that asked respondents to use a 7-point Likert (very strongly disagree to very
strongly agree) response scale, so we have an interval scale. For quick data analysis of these variables, we do not want frequency tables for two rea-
sons. First, the Likert scale variables are interval scaled and, second, the frequency tables
would be full of percents of all sizes, and their modes and medians would be very confus-
ing, to say the least. But we can turn to the mean and other summarization statistics for
interval or ratio data for help here. Specifi cally, we will use the ANALYZE-DESCRIPTIVE
STATISTICS-DESCRIPTIVES commands, and click on the Options button after we have
selected “Gasoline emissions contribute to global warming” as the variable for analysis. In
the Options panel, you can select the mean, standard deviation, range, and so forth. Refer to
Figure 12. 4 for the SPSS clickstream sequence. Figure 12. 5 presents the output generated from this option. In our Auto Concepts survey,
the output reveals that the average reaction to the statement “Gasoline emissions contrib-
ute to global warming” is 4.62. Recalling the interval scale used (1=Very strongly disagree,
2=Strongly disagree, 3=Disagree, 4=Neither disagree nor agree, 5=Agree, 6=Strongly agree,
and 7=Very strongly agree), a 4.62 rounds to “5,” meaning that, on average, our survey
Active Learning
How SPSS Handles Missing Data
Use your SPSS Auto Concepts dataset to compute the frequency distribution and percentage distribution and to identify the mode as we have just described. Use Figure 12. 2 to direct your mouse clicks and selections using the hometown size variable in the dataset. Compare the SPSS output that you obtain with Figure 12. 3 and make sure that you can identify the mode of 5 (1 mil-lion and more). Also, if you want to understand the “valid percent” output provided by SPSS for its Frequencies analysis, use your cursor and block the first 10 respondents on the Data View of the SPSS Data Editor. With a right-click of your mouse, use the “clear” function to set these 10 town size numbers to blanks. Then rerun the frequencies for the hometown size variable.
You will now see that the SPSS frequencies table reports the 10 “Missing System” respon-dents because their responses were blanks. While missing data are not a concern in the Auto Concepts survey dataset, you most certainly will encounter this issue if your marketing research course includes an actual survey that you perform as part of the course requirements. Wait! Don’t save your Auto Concepts dataset with the missing data unless you give it a new SPSS dataset name such as AutoConceptswithMissingData.sav.
Active Learning
Find a Median with SPSS
Use your SPSS Auto Concepts dataset to find the median size of hometown variable in the Auto Concepts survey. Again, use Figure 12. 2 as your clickstream guide, but select the “num-ber of people in household” variable for the analysis and place a check mark in the median checkbox. If you do not find that the code number 3 is the 50/50 location in the scale, or the median, redo your work carefully to correct any errors you may have made.
IBM SPSS Student Assistant Element Obtaining Descriptive Statistics for Scaled Data: Mean, Standard Deviation, Median, Range
When using SPSS DESCRIPTIVES, always bear in mind the variables being analyzed should be interval or ratio scaled.
M12_BURN3261_08_GE_C12.indd 327M12_BURN3261_08_GE_C12.indd 327 17/08/16 4:05 pm17/08/16 4:05 pm

328 CHAPTER 12 • USING DESCRIPTIVE ANALYSIS, PERFORMING POPULATION ESTIMATES, AND TESTING HYPOTHESES
FIGURE 12.4 IBM SPSS Clickstream to Obtain a Mean, Standard Deviation, and Range
Source: Reprint Courtesy of International Business Machines Corporation, © International Business Machines Corporation.
FIGURE 12.5 IBM SPSS Output for a Mean, Standard Deviation, and Range
Source: Reprint Courtesy of International Business Machines Corporation, © International Business Machines Corporation.
respondents “agree” with this statement. The standard deviation is 1.7 (rounded), meaning
there was much variability, and you can also see that the lowest response (minimum) was 1,
and the highest (maximum) was 7, meaning that the entire range of the scale was used by the
sample of respondents.
M12_BURN3261_08_GE_C12.indd 328M12_BURN3261_08_GE_C12.indd 328 17/08/16 4:05 pm17/08/16 4:05 pm
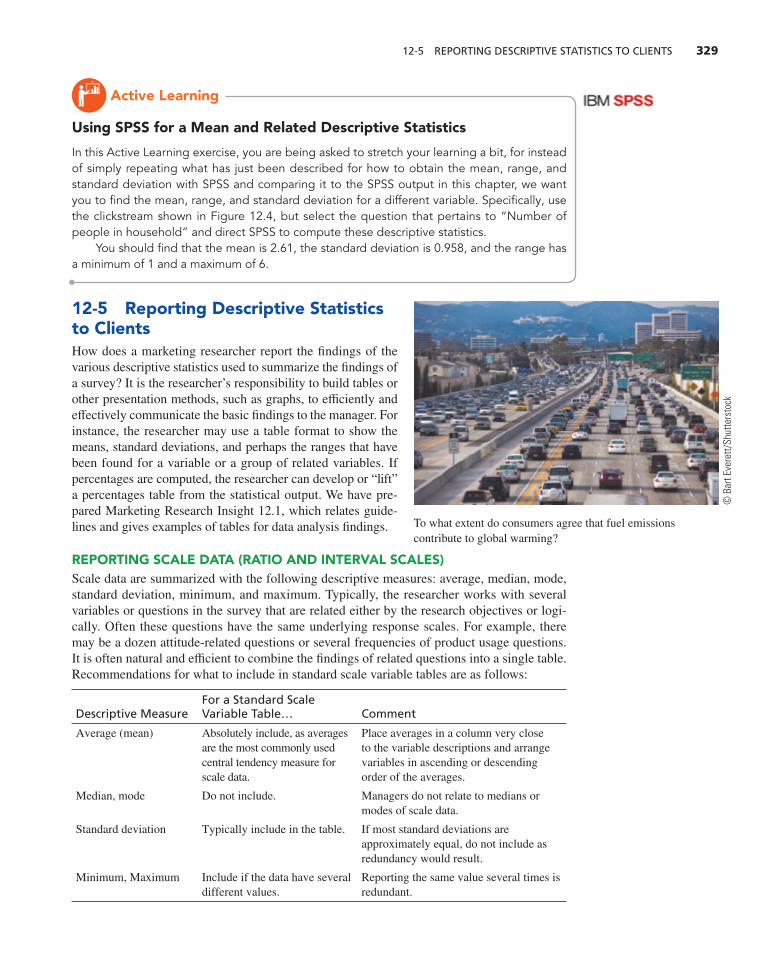
12-5 REPORTING DESCRIPTIVE STATISTICS TO CLIENTS 329
12- 5 Reporting Descriptive Statistics to Clients How does a marketing researcher report the fi ndings of the
various descriptive statistics used to summarize the fi ndings of
a survey? It is the researcher’s responsibility to build tables or
other presentation methods, such as graphs, to effi ciently and
eff ectively communicate the basic fi ndings to the manager. For
instance, the researcher may use a table format to show the
means, standard deviations, and perhaps the ranges that have
been found for a variable or a group of related variables. If
percentages are computed, the researcher can develop or “lift”
a percentages table from the statistical output. We have pre-
pared Marketing Research Insight 12. 1 , which relates guide-
lines and gives examples of tables for data analysis fi ndings.
REPORTING SCALE DATA (RATIO AND INTERVAL SCALES) Scale data are summarized with the following descriptive measures: average, median, mode,
standard deviation, minimum, and maximum. Typically, the researcher works with several
variables or questions in the survey that are related either by the research objectives or logi-
cally. Often these questions have the same underlying response scales. For example, there
may be a dozen attitude-related questions or several frequencies of product usage questions.
It is often natural and effi cient to combine the fi ndings of related questions into a single table.
Recommendations for what to include in standard scale variable tables are as follows:
Descriptive MeasureFor a Standard Scale Variable Table… Comment
Average (mean) Absolutely include, as averages
are the most commonly used
central tendency measure for
scale data.
Place averages in a column very close
to the variable descriptions and arrange
variables in ascending or descending
order of the averages.
Median, mode Do not include. Managers do not relate to medians or
modes of scale data.
Standard deviation Typically include in the table. If most standard deviations are
approximately equal, do not include as
redundancy would result.
Minimum, Maximum Include if the data have several
different values.
Reporting the same value several times is
redundant.
Active Learning
Using SPSS for a Mean and Related Descriptive Statistics
In this Active Learning exercise, you are being asked to stretch your learning a bit, for instead of simply repeating what has just been described for how to obtain the mean, range, and standard deviation with SPSS and comparing it to the SPSS output in this chapter, we want you to find the mean, range, and standard deviation for a different variable. Specifically, use the clickstream shown in Figure 12. 4 , but select the question that pertains to “Number of people in household” and direct SPSS to compute these descriptive statistics.
You should find that the mean is 2.61, the standard deviation is 0.958, and the range has a minimum of 1 and a maximum of 6.
To what extent do consumers agree that fuel emissions
contribute to global warming?
© B
art
Ever
ett/
Shu
tter
stoc
k
M12_BURN3261_08_GE_C12.indd 329M12_BURN3261_08_GE_C12.indd 329 17/08/16 4:05 pm17/08/16 4:05 pm

330 CHAPTER 12 • USING DESCRIPTIVE ANALYSIS, PERFORMING POPULATION ESTIMATES, AND TESTING HYPOTHESES
Here is an example of a scale variables table. Notice that the labels are self-explanatory
and the averages are highlighted to indicate their importance. The features are arranged in
descending order of the averages so it is easy to identify the highest-performing feature
(assortment of breads) and the lowest performer (distinctive taste). The standard deviations
are reported, as they vary, but the minimum and maximum values are not reported, as they
are “1” or “5” in almost all cases. You should also note that an informative table footnote
describes the scale used in these ratings.
Performance of the Subshop
Feature of the Subshop Average* Standard Deviation
Assortment of breads 4.5 0.5
Variety of subs 4.3 0.7
Variety of toppings 4.0 0.8
Freshness of bread 3.9 0.8
Freshness of toppings 3.8 0.7
Promptness of service 3.7 1.0
Cleanliness of facility 3.7 0.9
Value for the price 3.6 1.1
Generosity of toppings 3.5 1.0
Distinctive taste 3.2 1.3
*Based on a scale where 1 = “poor” and 5 = “excellent.”
REPORTING NOMINAL OR CATEGORICAL DATA Nominal data are summarized with the following descriptive measures: frequencies, fre-
quency distribution, percents, percent distribution, and mode. It is important to note that
usually only one categorical variable is summarized in each table because the categories are
unique to the variable (such as male and female for gender or buyer and nonbuyer for type
Guidelines for the Presentation of Data Analysis A table is the most common vehicle for presenting sum-marizations of data. The most useful tables are ones where quick inspection will reveal the basic pattern(s) or the essence of the findings. Here are some table organization guidelines. 6
• Keep tables as simple as possible. • Use rows for the variables (scale data) or the categories
(categorical data) presented in the table. • Use columns for measures of central tendency and
variability. • Use highly descriptive and self-explanatory labels. • Typically, use variables with identical response scales in a
single table. • If appropriate, arrange the variables (rows)
in logical order, usually ascending or
descending, based on the descriptive measure being used.
• Highlight key measures.
Beyond organization, there are guidelines that will ensure that the table strongly implies that it is credible and should be taken very seriously.
• Use one decimal place unless convention demands otherwise (e.g., currency requires two decimal places for cents).
• With scales, include a table footnote that describes the scale.
• Do not report measures that are largely redundant. • Only report fi ndings that are meaningful or useful. • Use a conservative, professional format.
MARKETING RESEARCH INSIGHT 12. 1 Practical Research
M12_BURN3261_08_GE_C12.indd 330M12_BURN3261_08_GE_C12.indd 330 17/08/16 4:05 pm17/08/16 4:05 pm

12-6 STATISTICAL INFERENCE: SAMPLE STATISTICS AND POPULATION PARAMETERS 331
of customer). Recommendations for what to put in standard categorical data tables are as
follows:
Descriptive Measure
For a Standard Categorical Variable Table… Comment
Frequencies,
frequency
distribution
Include if the researcher wants
the reader to note something
about the sample, such as a
very small sample in which
percentages are greatly
affected by a few respondents.
Place frequencies in a column very close to
the variable group labels (such as male,
female). If appropriate, arrange the categories
in ascending or descending order of the
percentages. Include a total of the frequencies
at the bottom.
Percents, percent
distribution
Absolutely include, as
percentages are the most
commonly used descriptive
measure for nominal data.
Place percentages in a column close to the
variable group labels (such as male, female)
and beside the frequencies, if used. If
appropriate, arrange the categories in ascending
or descending order of the percentages. Include
a 100% total at the bottom.
Mode Highlight, but if obvious do
not report in the table.
The largest percentage group is usually readily
apparent in a percent distribution, especially if
ascending or descending order can be used.
Here is a sample nominal (or categorical) variable table. The frequencies are not included,
as a large number of respondents answered this question. Each time period is listed chrono-
logically, and the mode is identifi ed with the percentage in bold. The 100% total is included to
indicate that all time periods are included in this table.
What Time in the Day Do You Typically Visit the Subshop?
Time Period PercentBefore 12 p.m. 5.3%
Between 12 p.m. and 3 p.m. 56.8%
Between 3 p.m. and 6 p.m. 24.2%
After 6 p.m. 13.7%
Total 100.0%
12- 6 Statistical Inference: Sample Statistics and Population Parameters As you have just learned, descriptive measures of central tendency and measures of vari-
ability adequately summarize the fi ndings of a survey. However, whenever a probability
sample is drawn from a population, it is not enough to simply report the sample’s descrip-
tive statistics, for these measures contain a certain degree of error due to the sampling
process. Every sample provides some information about its population, but there is always
some sample error that must be taken into account. Values that are computed from infor-
mation provided by a sample are referred to as the sample’s statistics , whereas values
that are computed from a complete census, which are considered to be precise and valid
measures of the population, are referred to as parameters . Statisticians use Greek letters
(alpha, beta, etc.) when referring to population parameters and Roman letters (a, b, etc.)
when referring to statistics. Every sample statistic has a corresponding population param-
eter. For example, the notation used for a percentage is p for the statistic and π (pi) for the
parameter, and the notations for the mean are x (statistic) and μ (parameter mu). Because
a census is impractical, the sample statistic is used to estimate the population parameter.
We will next describe the procedures used when estimating various population parameters.
Statistics are sample values, whereas parameters are corresponding population values.
M12_BURN3261_08_GE_C12.indd 331M12_BURN3261_08_GE_C12.indd 331 17/08/16 4:05 pm17/08/16 4:05 pm

332 CHAPTER 12 • USING DESCRIPTIVE ANALYSIS, PERFORMING POPULATION ESTIMATES, AND TESTING HYPOTHESES
Inference is a form of logic in which you make a general statement (a generalization)
about an entire class based on what you have observed about a small set of members of that
class. When you infer, you draw a conclusion from a small amount of evidence, such as a
sample. Statistical inference is a set of procedures in which the sample size and sample
statistic are used to make an estimate of the corresponding population parameter. That is, sta-
tistical inference has formal steps for estimating the population parameter (the generalization)
based on the evidence of the sample statistic and taking into account the sample error based
on sample size. For now, let us concentrate on the percentage, p , as the sample statistic we are
using to estimate the population percentage, π, and see how sample size enters into statistical
inference. Suppose that Dodge suspected that there were some dissatisfi ed customers, and it
commissioned two independent marketing research surveys to determine the amount of dis-
satisfaction that existed in its customer group. (Of course, our Dodge example is entirely fi cti-
tious. We don’t mean to imply that Dodge cars perform in an unsatisfactory way.) In the fi rst survey, 100 customers who had purchased a Dodge in the last six months are
surveyed and it is found that 30 respondents (30%) are dissatisfi ed. This fi nding could be
inferred to be the total population of Dodge owners who had bought one in the last six months,
and we would say that there is 30% dissatisfaction. However, because we know that our sam-
ple, which was a probability sample, must contain some sample error, we would have to say
that there was about 30% dissatisfaction in the population. In other words, it might actually be
more or less than 30% if we did a census because the sample provided us with only an estimate. The second survey utilized 1,000 respondents—that’s 10 times more than in the fi rst
survey—and this survey found that 35% of the respondents are “dissatisfi ed.” Again, we
know that the 35% is an estimate that contains sampling error, so now we would also say
that the population dissatisfaction percentage was about 35%. This means that we have two
estimates of the degree of dissatisfaction with Dodges. One is about 30%, whereas the other
is about 35%.
How do we translate our answers (remember they include the word about ) into more accu-
rate numerical representations? We could translate them into ballpark ranges. That is, we could
translate them so we could say “30% plus or minus x %” for the sample of 100 and “35% plus
or minus y %” for the sample of 1,000. How would x and y compare? To answer this question,
consider that more evidence makes for stronger inferences. That is, with a larger sample (or
more evidence), you would be more certain that the sample statistic was accurate with respect
to estimating the true population value. In other words, with a larger sample size you should
expect the range used to estimate the true population value to be smaller. Actually, the range
for y is smaller than the range for x because you have a larger sample and less sampling error.
So, with statistical inference for estimates of population parameters such as the percent-
age or mean, the sample statistic is used as the beginning point, and then a range is computed
in which the population parameter is estimated to fall. The size of the sample, or n , plays a
crucial role in this computation, as you will see in all of the statistical inference formulas we
present in this chapter.
Two types of statistical inferences often used by marketing researchers are described
in this chapter: parameter estimates and hypothesis tests. A parameter estimate is used
to approximate the population value (parameter) through the use of confi dence intervals.
Hypothesis testing is used to compare the sample statistic with what is believed (hypoth-
esized) to be the population value prior to undertaking the study.
12- 7 Parameter Estimation: Estimating the Population Percent or Mean Parameter estimation is the process of using sample information to compute an interval
that describes the range of a parameter such as the population mean (μ) or the population
percentage (π). It involves the use of three values: the sample statistic (such as the mean or
Statistical inference takes into account that large random samples are more accurate than are small ones.
Statistical inference is based on sample size and variability, which then will determine the amount of sampling error.
Two types of statistical inference are parameter estimation and hypothesis tests.
M12_BURN3261_08_GE_C12.indd 332M12_BURN3261_08_GE_C12.indd 332 17/08/16 4:05 pm17/08/16 4:05 pm

12-7 PARAMETER ESTIMATION: ESTIMATING THE POPULATION PERCENT OR MEAN 333
the percentage), the standard error of the statistic, and the desired level of confi dence (usually
95% or 99%). A discussion of how each value is determined follows.
SAMPLE STATISTIC The mean is the average of a set of scale variable numbers. For example, you might be work-
ing with a sample of golfers and researching the average number of golf balls they buy per
month. Or you might be investigating how much high school students spend, on average, on
fast foods between meals. For a percentage, you could be examining what percentage of golf-
ers buy only Titleist balls, or you might be looking at what percentage of high school students
buy from Taco Bell between meals. In either case, the mean or percentage is derived from a
sample, so it is the sample statistic.
STANDARD ERROR There usually is some degree of variability in the sample. That is, our golfers do not
all buy the same number of golf balls per month and they do not all buy Titleist. Not
all of our high school students eat fast food between meals and not all of the ones
who do go to Taco Bell. Earlier in this chapter, we introduced you to variability with
a mean by describing the standard deviation. We used the percentage distribution as a
way of describing variability with a mean by describing the standard deviation, and we
used the percentage distribution as a way of describing variability when percentages
are being used. Also, we described how, if you theoretically took many, many samples
and plotted the mean or percentage as a frequency distribution, it would approximate
a bell-shaped curve called the sampling distribution. The standard error is a measure
of the variability in the sampling distribution based on what is theoretically believed to
occur were we to take a multitude of independent samples from the same population. We
described the standard error formulas in Chapter 10 on sample size, but we repeat them
here because they are vital to statistical inference, as they tie together the sample size
and its variability. The formula for the standard error of the mean is as follows:
Formula for standard error of the mean
sx =s
2n
where
sx = standard error of the mean
s = standard deviation
n = sample size
The formula for the standard error of the percentage is as follows:
Formula for standard error of the percentage
sp = Ap * q
n
where
sp = standard error of the percentage
p = the sample percentage
q = (100 − p )
n = sample size
In parameter estimation, the sample statistic is usually a mean or a percentage.
The standard error is a measure of the variability in a sampling distribution.
M12_BURN3261_08_GE_C12.indd 333M12_BURN3261_08_GE_C12.indd 333 17/08/16 4:05 pm17/08/16 4:05 pm

334 CHAPTER 12 • USING DESCRIPTIVE ANALYSIS, PERFORMING POPULATION ESTIMATES, AND TESTING HYPOTHESES
The formula for mean standard error differs from a percentage standard error.
In both equations, the sample size n is found in the denominator. This means
that the standard error will be smaller with larger sample sizes and larger with
smaller sample sizes. At the same time, both of these formulas for the standard
error reveal the impact of the variation found in the sample. Variation is repre-
sented by the standard deviation s for a mean and by (p * q) for a percentage.
In either equation, the variation is in the numerator, so the greater the variability,
the greater the standard error. Thus, the standard error simultaneously takes into
account both the sample size and the amount of variation found in the sample.
The following examples illustrate this fact. Let’s take two cases: New York Times surveys on the amount of daily
time spent reading the Times have determined (1) a standard deviation of
20 minutes, and (2) a standard deviation of 40 minutes. Both surveys used a
sample size of 100. The resulting standard error of the mean calculations would
be as follows:
Calculations of standard error of the mean with standard deviation = 20 and with standard deviation = 40
Std. dev. = 20
sx =s
2n
sx =20
2100
=20
10
5 2 minutes
Std. dev. = 40
sx =s
2n
sx =40
2100
=40
10
5 4 minutes
As you can see, the standard error of the mean from a sample with little variability (20
minutes) is smaller than the standard error of the mean from a sample with much variability
(40 minutes), as long as both samples have the same size. In fact, you should have noticed
that when the variability was doubled from 20 to 40 minutes, the standard error also doubled,
given identical sample sizes. Refer to Figure 12. 6 .
The standard error of a percentage mirrors this logic, although the formula looks a bit dif-
ferent. In this case, as we indicated earlier, the degree of variability is inherent in the (p * q)
aspect of the equation. Very little variability is indicated if p and q are very diff erent in size.
For example, if a survey of 100 McDonald’s breakfast buyers determined that 90% of the
respondents ordered coff ee with their Egg McMuffi n and 10% of the respondents did not,
there would be very little variability because almost everybody orders coff ee with break-
fast. On the other hand, if the sample determined that there was a 50–50 split between those
who had and those who had not ordered coff ee, there would be a great deal more variability
because any two customers would probably diff er in their drink orders. The computations
show that greater variability in responses results in a larger standard error of the percentage at
a given sample size.
Calculation of standard error of the percent with (1) p = 90 and q = 10 and (2) p = 50 and q = 50
p = 90, q = 10
sp = Ap * q
n
= A(90)(10)
100
= A900
100
= 29
= 3 %
p = 50, q = 50
sp = Ap * q
n
= A(50)(50)
100
= A2500
100
= 225
= 5 %
The standard error takes into account sample size and the variability in the sample.
Notice how sample variability affects the standard error in these two examples.
Statistical inference can be used to
estimate how many minutes people read
their daily newspaper.
With a 50–50 split there is great variability.
A 50–50 split has a larger standard error than a 90–10 split when sample size is the same.
© M
onke
y B
usin
ess
Imag
es/S
hutt
erst
ock
M12_BURN3261_08_GE_C12.indd 334M12_BURN3261_08_GE_C12.indd 334 17/08/16 4:05 pm17/08/16 4:05 pm

12-7 PARAMETER ESTIMATION: ESTIMATING THE POPULATION PERCENT OR MEAN 335
CONFIDENCE INTERVALS Because there is always some sampling error when a
sample is taken, it is necessary to estimate the population
parameter with a range. We did this in the Dodge owners’
example earlier. One factor aff ecting the size of the range
is how confi dent the researcher wants to be that the range
includes the true population percentage (parameter). Nor-
mally, the researcher fi rst decides on how confi dent he or
she wants to be; that is, the researcher formally selects a
level of confi dence. The sample statistic is the beginning
of the estimate, but because there is sample error pres-
ent, a “plus” amount and an identical “minus” amount is
added and subtracted from the sample statistic to determine
the maximum and minimum, respectively, of the range.
Confi dence intervals are the degree of accuracy desired
by the researcher and stipulated as a level of confi dence
in the form of a range with a lower boundary and an upper
boundary. Typically, marketing researchers rely only on the
99%, 95%, or 90% levels of confi dence, which correspond
to ±2.58, ±1.96, and ±1.64 standard errors, respectively.
They are designated za , so z0.99 is ±2.58 standard errors. By far, the most commonly used level of confi dence in marketing research is the 95% level, 7 corresponding to 1.96 standard
errors. In fact, the 95% level of confi dence is usually the default level found in statistical
analysis programs such as SPSS. Now that the relationship between the standard error and
the measure of sample variability—be it the standard deviation or the percentage—is appar-
ent, it is a simple matter to determine the range in which the population parameter will be
estimated. We use the sample statistics, x or p , compute the standard error, and then apply
our desired level of confi dence. In notation form these are as follows:
Formula for confidence interval for a mean x ± zasx
where
x = sample mean
sx = standard error of the mean
Formula for confidence interval for a percentage p ± zasp
where
p = sample percentage
sp = standard error of the percentage
za = z value for 95% or 99% level of confi dence
How do these formulas relate to inference? Recall that we are estimating a population
parameter. That is, we are indicating a range into which it is believed that the true popula-
tion parameter falls. The size of the range is determined by those pieces of information we
have about the population on hand as a result of our sample. The fi nal ingredient is our level
of confi dence or the degree to which we want to be correct in our estimate of the population
parameter. If we are conservative and wish to assume the 99% level of confi dence, then the
range would be more encompassing than if we are less conservative and assume only the
95% level of confi dence because 99% is associated with ±2.58 standard errors and 95% is
associated with ±1.96 standard errors. Using these formulas for the sample of 100 New York Times readers with a mean reading
time of 45 minutes and a standard deviation of 20 minutes, the 95% confi dence ( z = 1.96)
interval estimate would be calculated as shown in the following table on the left. Similarly, if
50% of the 100 McDonald’s customers order coff ee, the 95% confi dence ( z = 1.96) interval
would be computed using the percentage formula on the right.
Standard error = 2
Standard error = 4
More variabilityLess variability
FIGURE 12.6 Variability Found in the Sample Directly Affects the Standard Error
Population parameters are estimated with the use of confi dence intervals.
The range of your estimate of the population mean or percentage depends largely on the sample size and the variability found in the sample.
Confi dence intervals are estimated using these formulas.
Marketing researchers typically use only the 95% or 99% confi dence interval.
M12_BURN3261_08_GE_C12.indd 335M12_BURN3261_08_GE_C12.indd 335 17/08/16 4:05 pm17/08/16 4:05 pm

336 CHAPTER 12 • USING DESCRIPTIVE ANALYSIS, PERFORMING POPULATION ESTIMATES, AND TESTING HYPOTHESES
There are fi ve steps to computing a confi dence interval.
Calculation of a 95% Confi dence Interval for a Mean
Calculation of a 95% Confi dence Interval for a Percentage
x ± 1.96 * sx
x ± 1.96 *s
2n
45 ± 1.96 *20
2100
45 ± 1.96 * 2
45 ± 3.9
41.1 - 48.9 minutes
where
mean = 45
std. dev. = 20
p ± 1.96 * sp
p ± 1.96 * Ap * q
n
50 ± 1.96 * A50 * 50
100
50 ± 1.96 * 5
50 ± 9.8
40.2% - 59.8%
where
p = 50
q = 50
n = 100
Of course, if we use the 99% confi dence interval, the computations would necessitate
the use of 2.58 standard errors. The confi dence interval is always wider for 99% than it is for
95% when the sample size is the same and the variability is equal. The fi ve steps involved in
computing confi dence intervals for a mean or a percentage are listed in Table 12. 3 .
Here are examples of confi dence interval computation with a mean and with a percentage.
TABLE 12. 3 How to Compute a Confi dence Interval for a Mean or a Percentage
Step 1. Find the sample statistic, either the mean, x , or the percentage, p .
Step 2. Identify the sample size, n .
Step 3. Determine the amount of variability found in the sample in the form of standard error of the
mean, sx ,
sx =s
2n
or standard error of the percentage, s p .
sp = Ap * q
n
Step 4. Decide on the desired level of confidence to determine the value for z : z .95 (1.96) or z .99 (2.58).
Step 5. Compute your (95%) confidence interval as x ± 1.96 sx or p ± 1.96 s p .
To learn about confi dence intervals, launch www.youtube.com ,
and search for “Confi dence Intervals Part 1 YouTube.”
HOW TO INTERPRET AN ESTIMATED POPULATION MEAN OR PERCENTAGE RANGE How are these ranges interpreted? The interpretation is quite simple when you remember
that the sampling distribution notion is the underlying theoretical concept. If we were using a
95% level of confi dence, and if we repeated the sampling process and computed the sample
statistic many times, their frequency distribution (the sampling distribution) would comprise a
bell-shaped curve. A total of 95% of these repeated sample results would produce a range that
includes the population parameter.
Obviously, a marketing researcher would take only one sample for a particular marketing
research project, and this restriction explains why estimates must be used. Furthermore, it is
the conscientious application of probability sampling techniques that allows us to make use
of the sampling distribution concept. So, statistical inference procedures are the direct link-
ages between probability sample design and data analysis. Do you remember that you had to
grapple with confi dence levels when we determined sample size? Now we are on the other
M12_BURN3261_08_GE_C12.indd 336M12_BURN3261_08_GE_C12.indd 336 17/08/16 4:05 pm17/08/16 4:05 pm

12-8 THE AUTO CONCEPTS SURVEY: HOW TO OBTAIN AND USE A CONFIDENCE INTERVAL FOR A MEAN WITH SPSS 337
side of the table, so to speak, and we must use the sample size for our inference procedures.
Confi dence intervals must be used when estimating population parameters, and the size of the
random sample used is always refl ected in these confi dence intervals.
12- 8 The Auto Concepts Survey: How to Obtain and Use a Confi dence Interval for a Mean with SPSS Fortunately, because the calculations are a bit more complicated and tedious, your SPSS pro-
gram will calculate the confi dence interval for a mean. To illustrate this feature, we will look
at the evidence that the general public is of the opinion that gasoline usage is detrimental. You
should recall that in our descriptive analysis example of a mean (page 327 ), we found that the
average disagree–agree response to the statement “Gasoline emissions contribute to global
warming” was 4.6, or “agree.”
To determine the 95% confi dence interval for this average, examine Figure 12. 7 , which
shows the clickstream sequence to accomplish a 95% confi dence interval estimate using
SPSS. As you can see, the correct SPSS procedure is a “One-Sample T Test,” and you use
the ANALYZE-COMPARE MEANS-ONE SAMPLE T TEST menu clickstream sequence to
open up the proper window. Refer to Figure 12. 7 to see that all you need to do is to select the
“Gasoline emissions contribute to global warming” variable in the Test Variables area, and
then click OK. Figure 12. 8 shows the results of ANALYZE-COMPARE MEANS-ONE SAMPLE
T TEST for our “Gasoline emissions contribute to global warming” variable. As you can
see, the average is 4.62, and the 95% confi dence interval is 4.51–4.72. Although a “5” is
the code for “Agree,” this confi dence interval is suffi ciently close so we can claim that
it amounts to “Agree.” Our interpretation of this fi nding: If we conducted a great many
replications of this survey using the same sample size, we would fi nd that 95% of the
sample average agreement with the statement “Gasoline emissions contribute to global
warming.”
Active Learning
Calculate Some Confidence Intervals
This Active Learning section will give you practice in calculating confidence intervals. For this set of exercises, you are working with a survey of 1,000 people who responded to questions about satellite radio. The questions, sample statistics, and other pertinent information are listed below. Compute the 95% confidence interval for the population parameter in each case. Be certain to follow the logic of the questions, as it has implications for the sample size pertaining to each question.
Question Sample Statistic( s )
95% Confidence Interval
Lower Boundary
Upper Boundary
Have you heard of satellite radio? 500/1,000 = 50% responded “yes”
If yes, do you own a satellite radio? 150/500 = 30% responded “yes”
If you own satellite radio, about how many minutes of satellite radio did you listen to last week?
Average of 100.7 minutes; stan-dard deviation of 25.0 minutes for the 150 satellite radio owners
IBM SPSS Student Assistant: The Advanced Automobile Concepts Survey: Establishing Confi dence Intervals for Means
M12_BURN3261_08_GE_C12.indd 337M12_BURN3261_08_GE_C12.indd 337 17/08/16 4:05 pm17/08/16 4:05 pm

338 CHAPTER 12 • USING DESCRIPTIVE ANALYSIS, PERFORMING POPULATION ESTIMATES, AND TESTING HYPOTHESES
FIGURE 12.7 IBM SPSS Clickstream to Obtain a 95% Confi dence Interval for a Mean
Source: Reprint Courtesy of International Business Machines Corporation, © International Business Machines Corporation.
FIGURE 12.8 IBM SPSS Output for a 95% Confi dence Interval for a Mean
Source: Reprint Courtesy of International Business Machines Corporation, © International Business Machines Corporation.
12- 9 Reporting Confi dence Intervals to Clients How do marketing researchers report confi dence intervals to their clients? It may surprise
you to learn that detailed confi dence intervals are typically not reported. Just think about all
of the numbers that would have to be computed and reported to clients if confi dence intervals
M12_BURN3261_08_GE_C12.indd 338M12_BURN3261_08_GE_C12.indd 338 17/08/16 4:05 pm17/08/16 4:05 pm

12-9 REPORTING CONFIDENCE INTERVALS TO CLIENTS 339
were reported for every fi nding—it would require two more numbers per fi nding: the lower
boundary and the upper boundary. So there is a dilemma: Clients do not want to wade through
so much detail, yet researchers must somehow inform clients that there is sample error in the
fi ndings. The solution to this dilemma is really quite simple, and you will learn about it by
reading Marketing Research Insight 12. 2 .
Active Learning
Use SPSS for a Confidence Interval for a Mean
You have just learned that the 95% confidence interval for “Gasoline emissions contribute to global warming” variable would include an average of 4.62, with a lower boundary of 4.51 and an upper boundary of 4.72. What about the statement “I am worried about global warming”?
To answer this question, you must use SPSS to compute the 95% confidence interval for the mean of this variable. Use the clickstream identified in Figure 12. 7 and use the annotations in Figure 12. 8 to find and interpret your 95% confidence interval for the public’s opinion on this topic. How do you interpret this finding, and how does this confidence interval compare to the one we found for “Gasoline emissions contribute to global warming”?
Guidelines for the Presentation of Confi dence Intervals Researchers have two options when it comes to reporting confi -dence intervals to clients or readers of their marketing research reports. These options are (1) the general case and (2) fi ndings-specifi c confi dence intervals.
The General Case This is the industry standard; it is used almost unanimously with opinion polling, and it is by far the most popular approach used by marketing researchers. The general case is merely to state the sampling error associated with the survey sample size. For example, the report may say “fi ndings are accurate to ±4%,” or “the survey has an error of ±3.5%.” This sample error, of course, is calculated using the sample error formula (refer to Chapter 13 ) , typically at the 95% level of confi dence with p = q = 50%, and z = 1.96.
Sample error formula
{Sample Error % = 1.96 * Ap * q
n
The Findings-Specifi c Case To decide whether or not to use the fi ndings-specifi c approach, the researcher must answer the following question, “Are there fi ndings that require more than the general case of reporting sample error?” For instance, there may be fi ndings that the cli-ent will use to answer critical questions or on which to base important decisions. If the answer is no, the researcher will just
report the general case. If yes, the next step is to identify all the fi ndings that he or she believes absolutely require the report-ing of fi ndings-specifi c confi dence intervals. To present the confi dence intervals for each relevant fi nding, the researcher can provide a table that lists the 95% confi dence interval lower and upper boundaries, which must be computed either by the researcher’s statistical analysis program or the use of some other computational aid in the researcher’s tool kit. The follow-ing table illustrates how a researcher can effi ciently accommo-date the confi dence intervals for diverse variables in a single table. Most likely, these fi ndings will have been reported else-where in the report with other informative summary statistics, such as standard deviations and sample sizes for respondents answering various questions.
95% Confi dence Intervals for Key Findings Sample Finding
Lower Boundary
Upper Boundary
Used the Subshop in the past 60 days
30% 26.0% 34.0%
Used a Subshop coupon in the past 30 days
12% 9.2% 14.8%
Number of Subshop visits in the past 60 days
1.5 1.4 1.6
Overall satisfaction with the Subshop*
5.6 5.4 5.8
*Based on a scale where 1 = Very dissatisfi ed and 7 = Very satisfi ed.
MARKETING RESEARCH INSIGHT 12. 2 Practical Research
M12_BURN3261_08_GE_C12.indd 339M12_BURN3261_08_GE_C12.indd 339 17/08/16 4:05 pm17/08/16 4:05 pm

340 CHAPTER 12 • USING DESCRIPTIVE ANALYSIS, PERFORMING POPULATION ESTIMATES, AND TESTING HYPOTHESES
12- 10 Hypothesis Tests In some cases, the marketing researcher or marketing manager may off er an expectation
about the population parameter (either the mean or the percentage) based on prior knowledge,
assumptions, or intuition. This expectation, called a hypothesis , most commonly takes the
form of an exact specifi cation as to what the population parameter value is. A hypothesis test is a statistical procedure used to “accept” or “reject” the hypothesis
based on sample evidence. 8 With all hypothesis tests, you should keep in mind that the sample
is the only source of current information about the population. Because our sample is random
and representative of the population, the sample results are used to determine if the hypothesis
about the population parameter is accepted or rejected. 9
All of this might sound frightfully technical, but it is a form of inference that you do
every day. You just do not use the words hypothesis or parameter when you do it. Here is
an example to show how hypothesis testing occurs naturally. Your friend Bill does not use
an automobile seat belt because he thinks only a few drivers actually wear them. But Bill’s
car breaks down, and he has to ride with his coworkers to and from work while it is being
repaired. Over the course of a week, Bill rides with fi ve diff erent coworkers, and he notices
that four out of the fi ve buckle up. When Bill begins driving his own car the next week, he
begins fastening his seat belt because he did not fi nd support for his hypothesis that few driv-
ers buckle up. Consequently, Bill changes his belief to be consistent with reality.
TEST OF THE HYPOTHESIZED POPULATION PARAMETER VALUE The hypothesized population parameter value can be determined using either a percentage
or a mean. The equations used to test the hypothesis of a population percentage and a hypoth-
esis about a mean are as follows:
Formula for test of a hypothesis about a percent
z =p - pH
sx
where
p = sample percentage
pH = hypothesized population percentage
sp = standard error of the percentage
Formula for test of a hypothesis about a mean
z =x - mH
sx
where
x = sample mean
mH = hypothesized population mean
sx = standard error of the mean
Note that the equation used to test the hypothesis of a mean is identical in logic, except it uses
the mean and standard error of the mean. Tracking the logic of these equations, one can see that the sample mean ( x ) is compared
to the hypothesized population mean ( mH ). Similarly, the sample percentage ( p ) is compared
to the hypothesized percentage ( pH ). In this case, “compared” means “take the diff erence.”
This diff erence is divided by the standard error to determine how many standard errors away
from the hypothesized parameter the sample statistic falls. The standard error, you should
remember, takes into account the variability found in the sample as well as the sample size.
A small sample with much variability yields a large standard error, so our sample statistic
A hypothesis is what the manager or researcher expects the population mean (or percentage) to be.
Here are formulas used to test a hypothesized population parameter.
M12_BURN3261_08_GE_C12.indd 340M12_BURN3261_08_GE_C12.indd 340 17/08/16 4:05 pm17/08/16 4:05 pm

12-10 HYPOTHESIS TESTS 341
could be quite far away from the mean arithmetically but still less than one standard error
away in certain circumstances. All the relevant information about the population as found by
our sample is included in these computations. Knowledge of areas under the normal curve
then comes into play to translate this distance into a probability of support for the hypothesis:
If the computed z value is greater than 1.96 or less than −1.96, we are 95% confi dent that the
sample evidence does not support the hypothesized parameter value. Here is a simple illustration using Bill’s hypothesis that only 10% of drivers use seat
belts. Let’s suppose that Bill reads that a Harris poll fi nds that 80% of respondents in a
national sample of 1,000 drivers wear their seat belts. The hypothesis test would be computed
as follows (notice we substituted the formula for sp in the second step):
Calculation of a test of Bill’s hypothesis that only 10% of drivers “buckle up”
Notes:
Hypothesized percent = 10
Sample percent ( p ) = 80
Sample q = 100 − p = 20
n = 1,000
z =p - pH
sp
=p - pH
Ap * q
n
=80 - 10
A80 * 20
1000
=70
A1600
1000
=70
21.6
= 55.3
The crux of statistical hypothesis testing is the sampling distribution concept . Our actual sample is one of the many
theoretical samples comprising the assumed bell-shaped curve
of possible sample results using the hypothesized value as the
center of the bell-shaped distribution. If the person who stated
the hypothesis is correct, there is a greater probability of fi nd-
ing a sample result close to the hypothesized number than of
fi nding one that is far away. So, if our sample value turns out to
be within ±1.96/±2.58 standard errors of the hypothesized mean, it supports the hypothesis
maker at the 95%/99% level of confi dence because it falls within 95%/99% of the area
under the curve. But what if the sample result is found to be outside this range? Which is correct—the hypoth-
esis or the researcher’s sample results? The answer to this question is always the same: Sample
information is invariably more accurate than a hypothesis. Of course, the sampling procedure
must adhere strictly to probability sampling requirements and assure representativeness. As you
can see, Bill was greatly mistaken because his hypothesis of 10% of drivers wearing seat belts was
55.3 standard errors away from the 80% fi nding of the poll of nationally representative drivers.
The following example serves to describe the hypothesis testing process with a mean.
Northwestern Mutual Life Insurance Company has a college student internship program that
allows college students to participate in a training program and to become fi eld agents in one
academic term. Rex Reigen, district agent, hypothesizes, based on his knowledge of the pro-
gram, that the typical college agent will be able to earn about $2,750 in his or her fi rst semester
of participation in the program. To check Rex’s hypothesis, a survey was taken of 100 current
college agents. The sample mean is determined to be $2,800, and the standard deviation is $350. The amount of $2,800 found by the sample diff ers from the hypothesized amount of
$2,750 by $50. Is this amount a suffi cient enough diff erence to cast doubt on Rex’s estimate?
To a statistician, “compare” means to “take the difference.”
An example of no support for Bill’s seat belt hypothesis.
The sampling distribution concept says that our sample is one of many theoretical samples that comprise a bell-shaped curve with the hypothesized value as the mean.
You always assume the sample information to be more accurate than any hypothesis.
A hypothesis test gives you the probability of support for your hypothesis based on your sample evidence and sample size.
Bill found that his hypothesis about seat belts was not
supported, so he started buckling up.
© J
asm
in M
erda
n/12
3rf
M12_BURN3261_08_GE_C12.indd 341M12_BURN3261_08_GE_C12.indd 341 17/08/16 4:05 pm17/08/16 4:05 pm

342 CHAPTER 12 • USING DESCRIPTIVE ANALYSIS, PERFORMING POPULATION ESTIMATES, AND TESTING HYPOTHESES
Or, in other words, is it far enough from the hypothesized mean to reject the hypothesis? To
answer these questions, we compute as follows (note that we have substituted the formula for
the standard error of the mean in the second step):
Calculation of a test of Rex’s hypothesis that Northwestern Mutual interns make an average of $2,750 in their first semester of work.
Notes:
Hypothesized mean = 2,750
Sample mean = 2,800
Std. dev. = 350
n =100
z =x - mH
sx
=x - mH
s
2n
=2,800 - 2,750
350
2100
=50
35
= 1.43
The sample variability and the sample size have been used to determine the size of the
standard error of the assumed sampling distribution. In this case, one standard error of the
mean is equal to $35 (standard error of the mean formula: 350/ 2100 ). When the diff erence
of $50 is divided by $35 to determine the number of standard errors from the hypothesized
mean that the sample statistic falls, the result is 1.43. As illustrated in Figure 12. 9 , 1.43 stan-
dard errors is within ±1.96 standard errors of Rex’s hypothesized mean. It also reveals that the
hypothesis is supported because it falls in the acceptance region.
It is handy to just recall the two num-
bers, 1.96 and 2.58; as we have said, these
two are directly associated with the 95%
and 99% confi dence levels, respectively,
which are the “standards” of the market-
ing research industry. Anytime that the
computed z value falls outside ±2.58/1.96,
the resulting probability of support for the
hypothesis is 0.01/0.05 or less. Of course,
computer statistical programs such as
SPSS will provide the exact probability
because they are programmed to look up
the probability in the z table just as you
would have to do if you did the test by
manual calculations and you wanted the
exact probability. The five basic steps
involved in hypothesis testing are listed in
Table 12. 4 .
AUTO CONCEPTS: HOW TO USE SPSS TO TEST A HYPOTHESIS FOR A MEAN We can test the hypothesized mean of any scale variable (interval or ratio scale) in our Auto
Concepts survey. As an illustration, we will hypothesize that the general public is neutral to the
statement “I am worried about global warming.” You should recall that on our scale the “neu-
tral” position corresponds to the value code of “4.” Your SPSS software can be easily directed
to make a mean estimation or to test a hypothesis for a mean.
To perform a mean hypothesis test, SPSS provides a Test Value box in which the hypoth-
esized mean can be entered. As you can see in Figure 12. 10 , you get to this box by using
the ANALYZE-COMPARE MEANS-ONE SAMPLE T TEST command sequence. You then
Does the sample support Rex’s hypothesis that student interns make $2,750 in the fi rst semester?
z = –1.96 z = +1.96 $2,800x
$2,750�H
Hypothesized mean Sample mean$50 computes to
z = +1.43
Acceptance region
Rejectionregion
Rejectionregion
FIGURE 12.9 Sample Findings Support the Hypothesis in This Example
A computed z value of 1.43 is less than 1.96, so the hypothesis is supported.
M12_BURN3261_08_GE_C12.indd 342M12_BURN3261_08_GE_C12.indd 342 17/08/16 4:05 pm17/08/16 4:05 pm

12-10 HYPOTHESIS TESTS 343
Here are fi ve steps in hypothesis testing.
select the variable, “I am worried about global warming.” Next, enter “4” as the Test Value
and click the OK button. The resulting output is contained in Figure 12. 11 . The information layout for the out-
put is identical to the previous output table. The output indicates our test value is equal
to 4, and the bottom table contains 95% confi dence intervals for the estimated population
parameter (the population parameter is the diff erence between the hypothesized mean and
the sample mean, expected to be 0). There is a mean diff erence of 0.880, which was calcu-
lated by subtracting the hypothesized mean value (4) from the sample mean (4.88), and the
standard error is provided in the upper half (1.329). A t value of 20.932 is determined by
dividing 0.880 by 0.042. It is associated with a two-tailed signifi cance level of 0.000. (For
now, assume t value is the z value we have used in our formulas and explanations.) In other
words, our Auto Concepts sample fi nding of an average of about 4.88 does not support the
hypothesis of 4.
TABLE 12. 4 The Five Basic Steps Involved in Hypothesis Testing
Step 1. Begin with a statement about what you believe exists in the population, that is, the popula-
tion mean ( mH ) or percentage ( pH ).
Step 2. Draw a random sample and determine the sample mean ( x ) or percent (p ).
Step 3. Compare the statistic to the hypothesized parameter; divide by standard error to compute z.
z =x - mH
sx z =
p - pH
sp
Step 4. If z is within ±1.96/±2.58 standard errors, it supports the hypothesis at the 95%/99% level
of confi dence. (Alternatively, the exact degree of support can be assessed on SPSS output.)
Step 5. If the sample does not support the hypothesis, revise the hypothesis to be consistent with
the sample’s statistic using the confi dence interval formula.
To test a hypothesis about a mean with SPSS, use the ANALYZE-COMPARE MEANS-ONE SAMPLE T TEST command sequence.
IBM SPSS Student Assistant: The Advanced Automobile Concepts Survey: Testing a Hypothesis for a Mean
To learn about hypothesis tests, launch www.youtube.
com , and search for “Hypoth-esis tests, p -value − Statistics Help.”
FIGURE 12.10 IBM SPSS Clickstream to Test a Hypothesis About a Mean
Source: Reprint Courtesy of International Business Machines Corporation, © International Business Machines Corporation.
M12_BURN3261_08_GE_C12.indd 343M12_BURN3261_08_GE_C12.indd 343 17/08/16 4:05 pm17/08/16 4:05 pm

344 CHAPTER 12 • USING DESCRIPTIVE ANALYSIS, PERFORMING POPULATION ESTIMATES, AND TESTING HYPOTHESES
12- 11 Reporting Hypothesis Tests to Clients Explicit hypotheses are sometimes encountered by marketing researchers. When this happens,
the marketing researcher performs the appropriate hypothesis test and interprets the fi ndings.
The steps involved are straightforward and listed in Marketing Research Insight 12. 3 .
FIGURE 12.11 IBM SPSS Output for the Test of a Hypothesis About a Mean
Source: Reprint Courtesy of International Business Machines Corporation, © International Business Machines Corporation.
Guidelines for the Presentation of Hypothesis Tests The step-by-step approach to the presentation of hypothesis tests is as follows.
Step 1: State the hypothesis.
Step 2: Perform appropriate hypothesis test computations. That is, if the hypothesis test is stated as a per-cent, the percent formula should be used; if it is stated as an average, the average formula should be used.
Step 3: Determine if the hypothesis is supported or not sup-ported by comparing the computed z value to the critical z value (normally 1.96 for a 95% level of confi dence).
Step 4: If the hypothesis is not supported, compute confi -dence intervals to provide the client with the appro-priate confi dence intervals.
These steps are followed for each explicitly stated hypothe-sis. An example of how to present hypothesis tests in a research report follows:
Results of Hypothesis Tests
Hypothesis Result of Test
Hypothesis 1: 60% of consumers buy from a fast-food location at least one time per month.
This hypothesis was supported at the 95% level of confidence by the findings of the survey.
Hypothesis 2: In a typical month, those consumers who purchase from a fast-food outlet spend about $45 for food, drinks, snacks, etc.
The average was found to be $31.87, and the hypothesis of $45 was not supported. The 95% confidence interval computations determined the range to be between $28.50 and $35.24.
MARKETING RESEARCH INSIGHT 12. 3 Practical Research
M12_BURN3261_08_GE_C12.indd 344M12_BURN3261_08_GE_C12.indd 344 17/08/16 4:05 pm17/08/16 4:05 pm

REVIEW QUESTIONS/APPLICATIONS 345
Summary
This chapter introduced you to the descriptive statistics
researchers use to inspect basic patterns in datasets. We
previewed the fi ve types of statistical analysis: descrip-
tive, inference, difference, association, and relation-
ships. Descriptive analysis is performed with measures
of central tendency such as the mean, mode, or median,
each of which portrays the typical respondent or the typi-
cal answer to the question being analyzed. The chapter
contained formulas and examples of how to determine
these central tendency measures. Measures of variabil-
ity, including the frequency distribution, range, and stan-
dard deviation, provide bases for envisioning the degree
of similarity of all respondents to the typical respondent.
The chapter also contained instructions and formulas
of key variability measures. Basically, descriptive anal-
ysis yields a profi le of how respondents in the sample
answered the various questions in the survey. The chap-
ter also provided information on how to instruct SPSS to
compute descriptive analyses with SPSS using the Auto
Concepts survey dataset. Both clickstream sequences
for setting up the analyses and the resulting output were
shown.
The chapter then distinguished a sample statistic from
its associated population parameter. We then introduced you
to the concept of statistical inference, which is a set of pro-
cedures for generalizing the fi ndings from a sample to the
population. A key factor in inference is the sample size, n . It
appears in statistical inference formulas because it expresses
the amount of sampling error: Large samples have less sam-
pling error than do small samples given the same variability.
We described how a population parameter, such as a mean
or a percent, can be estimated by using confi dence intervals
computed by application of the standard error formula. We
then related how a researcher can use the sample fi ndings to
test a hypothesis about a mean or a percentage.
We used SPSS and the Auto Concepts data to illus-
trate how you can direct SPSS to calculate 95% confi dence
intervals for the estimation of a mean as well as how to test
a hypothesis about a mean. Both are accomplished with the
SPSS One-Sample T Test procedure. For parameter esti-
mation or test of a hypothesis with a percent, you can use
SPSS to determine the percent, but you must use the for-
mulas in this chapter to calculate the confi dence interval or
perform the signifi cance test.
Key Terms
Data analysis (p. 317 )
Descriptive analysis (p. 317 )
Inference analysis (p. 318 )
Diff erence analysis (p. 318 )
Association analysis (p. 318 )
Relationships analysis (p. 318 )
Measures of central tendency (p. 319 )
Mode (p. 319 )
Median (p. 319 )
Mean (p. 320 )
Measures of variability (p. 320 )
Frequency distribution (p. 320 )
Percentage distribution (p. 320 )
Range (p. 321 )
Standard deviation (p. 321 )
Variance (p. 322 )
Statistics (p. 331 )
Parameters (p. 331 )
Inference (p. 332 )
Statistical inference (p. 332 )
Parameter estimate (p. 332 )
Hypothesis testing (p. 332 )
Parameter estimation (p. 332 )
Standard error (p. 333 )
Confi dence intervals (p. 335 )
Most commonly used level of
confi dence (p. 335 )
Hypothesis (p. 340 )
Hypothesis test (p. 340 )
Hypothesized population parameter
(p. 340 )
Sampling distribution concept
(p. 341 )
Review Questions/Applications
12- 1. Indicate what data analysis is and why it is useful.
12- 2. Explain any four types of statistical analysis and their
underlying statistical concepts. Describe how each of
them has a unique role in the data analysis process.
12- 3. What are the two popular types of descriptive mea-
sures? How are they related?
12- 4. Explain the concept of variability and relate how it
helps in the description of responses to a particular
question on a questionnaire.
12- 5. Using examples, illustrate how a frequency dis-
tribution (or a percentage distribution) reveals the
variability in responses to a Likert-type question
in a lifestyle study. Use two extreme examples of
much variability and little variability.
12- 6. What does a bell-shaped curve distribution show
you? How is it used?
12- 7. With explicit reference to the formula for a stan-
dard deviation, show how it measures how diff erent
respondents are from one another.
12- 8. Explain why the mean is an inappropriate measure
of central tendency in each of the following cases:
(a) gender of respondent (male or female); (b)
marital status (single, married, divorced, separated,
widowed, other); (c) a taste test in which subjects
M12_BURN3261_08_GE_C12.indd 345M12_BURN3261_08_GE_C12.indd 345 05/09/16 1:38 PM05/09/16 1:38 PM

346 CHAPTER 12 • USING DESCRIPTIVE ANALYSIS, PERFORMING POPULATION ESTIMATES, AND TESTING HYPOTHESES
indicate their fi rst, second, and third choices of
Miller Lite, Bud Light, and Coors Light.
12- 9. For each of the cases in question 8, what is the
appropriate central tendency measure?
12- 10. In a survey on productivity apps, respondents write
in the number of apps they have installed in the past
six months. What measures of central tendency can
be used? Which is the most appropriate and why?
12- 11. If you use the standard deviation as a measure of the
variability in a sample, what statistical assumptions
have you implicitly adopted?
12- 12. What essential factors are taken into consideration
when statistical inference takes place?
12- 13. What is meant by “parameter estimation,” and what
function does it perform for a researcher?
12- 14. How does parameter estimation for a mean diff er
from that for a percentage?
12- 15. List the steps in statistical hypothesis testing and the
steps in intuitive hypothesis testing. How are they
similar? How are they diff erent?
12- 16. What does it mean when a researcher says that a
hypothesis has been supported at the 95% confi -
dence level?
12- 17. Here are several computation practice exercises to
help you identify which formulas pertain and learn
how to perform the necessary calculations. In each
case, perform the necessary calculations and write
your answers in the column identifi ed by “Your
Confi dence Intervals” or “Your Test Results.”
a. Determine Confi dence Intervals for Each of the
Following
Sample Statistic
Sample Size
Confi dence Level
Your Confi dence Intervals
Mean: 150 200 95%
Standard Deviation: 30 _______
Sample Statistic
Sample Size
Confi dence Level
Your Confi dence Intervals
Percent: 67% 300 99% _______
Mean: 5.4 250 99%
Standard Deviation: 0.5 _______
Percent: 25.8% 500 99% _______
b. Test the Following Hypothesis and Interpret
Your Findings
HypothesisSample Findings
Confi dence Level
Your Test Results
Mean = 7.5 Mean: 8.5 95%
Standard Deviation: 1.2
n = 670 _______
Percent = 86% p = 95 99%
n = 1000 _______
Mean = 125 Mean: 135 95%
Standard Deviation: 15
n = 500 _______
Percent = 33% p = 31 99%
n = 120 _______
12- 18. Alamo Rent-A-Car executives believe that Alamo
accounts for about 50% of all Cadillacs that are
rented. To test this belief, a researcher randomly
identifies 20 major airports with on-site rental
car lots. Observers are sent to each location and
instructed to record the number of rental-company
Cadillacs observed in a four-hour period. About 500
are observed, and 30% are observed being returned
to Alamo Rent-A-Car. What are the implications of
this fi nding for the Alamo executives’ belief?
CASE 12. 1
L’Experience Félicité Restaurant Survey Descriptive and Inference Analysis
In addition to the Auto Concepts survey, Cory Rogers of
CMG Research was working with Jeff Dean, who believed
that there was an opportunity to build an upscale restaurant,
possibly to be called L’Experience Félicité (for “Delight-
ful Experience”) somewhere in the metropolitan area. The
proposed restaurant was described as follows…
A restaurant with a very elegant decor, off ering very
personal service in a spacious, semi-private atmo-
sphere, featuring both traditional and unusual menu
items prepared by a chef with an international reputa-
tion. The atmosphere, food, and service at this res-
taurant meet the standards of the fi nest restaurants.
Menu items are priced separately, known as “à la
carte,” and the prices are what one would expect for
a restaurant meeting the highest restaurant standards.
Cory’s team had designed an online questionnaire and
gathered a representative sample. The code book for the
SPSS dataset follows.
M12_BURN3261_08_GE_C12.indd 346M12_BURN3261_08_GE_C12.indd 346 05/09/16 1:38 PM05/09/16 1:38 PM

REVIEW QUESTIONS/APPLICATIONS 347
Question Codes Labels
Do you eat at an upscale restaurant at least once every two weeks? 1,2 Yes, No (If No, terminate the survey)
How many total dollars do you spend per month in restaurants
(for your meals only)?
Actual
dollars
No labels
How likely would it be for you to patronize this proposed new
upscale restaurant?
1,2,3,4,5 Very unlikely, … , Very likely
What would you expect an average evening meal entrée item
alone to be priced in the proposed new restaurant? (If not
“very unlikely” in previous question)
Actual
dollars
No labels
Would you describe yourself as one who listens to the radio? 1,2 Yes, No
(If yes) To which type of radio programming do you most
often listen?
1,2,3,4,5 Country, Easy listening, Rock, Talk/
news, No preference
Would you describe yourself as a viewer of TV local news? 1,2 Yes, No
(If yes) Which newscast do you watch most frequently? 1,2,3,4 7:00 a.m., Noon, 6:00 p.m., 10:00 p.m.
Do you read the newspaper? 1,2 Yes, No
(If yes) Which section of the local newspaper would you say
you read most frequently?
1,2,3,4,5 Editorial, Business, Local, Classifi eds,
Life-Health-Entertainment
Do you subscribe to City Magazine ? 1,2 Yes, No
How often have you used online reviews to choose products
and services?
0,1,2,3,4 Never, 1–2 times, 3–4 times, 5–7
times, more than 7 times per month
In this proposed new restaurant how much would you prefer…
• Waterfront view
• Drive less than 30 minutes
• Formal waitstaff wearing tuxedos
• Unusual desserts
• Large variety of entrées
• Unusual entrées
• Simple decor
• Elegant decor
• String quartet
• Jazz combo
1,2,3,4,5 Very strongly not prefer, Somewhat
not prefer, Neither prefer nor not
prefer, Somewhat prefer, Very
strongly prefer
Year you were born Actual year No labels
What is your highest level of education? 1,2,3,4,5,6,7,8 Less than high school, Some high school,
High school graduate, Some college,
Associate degree, Bachelor’s degree,
Master’s degree, Doctorate degree
What is your marital status? 1,2,3 Single, Married, Other
Including children under 18 living with you, what is your
family size?
# children No labels
Please check the letter that includes the ZIP code in which you live
(designated by letter by combining ZIPs using the last two digits).
1,2,3,4 A (01 & 02), B (03, 04, & 05),
C (07, 08, & 09), D (10, 11 & 12)
Which of the following categories best describes your before-
tax household income?
1,2,3,4,5,6,7 Under $15,000; $15,000 to $24,999;
$25,000 to $49,999; $50,000 to
$74,999; $75,000 to $99,999; $100,000
to $149,999; $150,000 and above
What is your gender? 1,2 Male, Female
M12_BURN3261_08_GE_C12.indd 347M12_BURN3261_08_GE_C12.indd 347 17/08/16 4:05 pm17/08/16 4:05 pm

348 CHAPTER 12 • USING DESCRIPTIVE ANALYSIS, PERFORMING POPULATION ESTIMATES, AND TESTING HYPOTHESES
Cory had other marketing research projects and meet-
ings scheduled with present and prospective clients, so he
called in his marketing intern, Christine Yu. Christine was
a senior marketing major at Able State University, and she
had taken marketing research in the previous semester.
Cory said, “Christine, it is time to do some analysis on the
survey we did for Jeff Dean. For now, let’s just get a feel
for what the data look like. I’ll leave it up to your judgment
as to what basic analysis to run. Let’s meet tomorrow at
2:30 p.m. and see what you have found.”
Your task is to take the role of Christine Yu, marketing
intern. The fi le name is L’Experience.sav and it is in SPSS
data fi le format. Your instructor will provide this SPSS data
fi le to you or indicate how you can obtain it.
1. Determine what variables are categorical (either nomi-
nal or ordinal scales), perform the appropriate descrip-
tive analysis, and interpret it.
2. Determine what questions are scale variables (either
interval or ratio scales), perform the appropriate
descriptive analysis, and interpret it.
3. What are the population estimates for each of the
following?
a. Preference for “easy listening” radio programming
b. Viewing of 10 p.m. local news on TV
c. Subscribe to City Magazine
d. Average age of heads of households
e. Average price paid for an evening meal entrée
4. Because this restaurant will be upscale, it will appeal
to high-income consumers. The investors hope that
15% of the households represented in the survey
have an income level of $100,000 or higher. Test
this hypothesis.
5. With respect to those who are “very likely” to patronize
L’Experience Félicité Restaurant, Jeff believes that they
will either “very strongly” or “somewhat” prefer each
of the following: (a) waitstaff with tuxedos, (b) unusual
desserts, (c) large variety of entrées, (d) unusual
entrées, (e) elegant decor, and (f) jazz combo music.
Does the survey support or refute Jeff ’s hypotheses?
Interpret your fi ndings.
CASE 12. 2 INTEGRATED CASE
Auto Concepts Descriptive and Inference Analysis Cory Rogers of CMG Research was happy to call Nick
Thomas to inform him that Auto Concepts survey data
were collected and ready for analysis. Of course, Cory had
other marketing research projects and meetings scheduled
with present and prospective clients, so he called in his data
analyst, Celeste Brown. Cory said, “Celeste, it is time to
do some analysis on the survey we did for Nick Thomas of
Auto Concepts. I am going to assign you primary respon-
sibility for all data analysis on this important project. For
now, let’s just get a feel for what the data look like, so do
some descriptives in order to reveal the basic patterns and
to gain an understanding of the nature of the variability in
the data. Let’s meet tomorrow at 3:30 p.m. and see what
you have found.”
Your task in Case 12. 2 is to take the role of Celeste
Brown, data analyst. The dataset for the Auto Concepts
survey is now ready for descriptive analysis. The fi le name
is Auto Concepts.sav, and it is in SPSS data fi le format.
The instructor of your marketing research course will tell
you how to access this SPSS dataset. The dataset sample
represents American households, and it includes owners as
well as nonowners of vehicles because any new vehicles
to be developed will not “hit” the market for another 3 to
5 years.
Question Description Codes Value Labels
Size of hometown or city 1,2,3,4,5 Under 10K, 10K to 100K, 100K to 500K, 500K to
1 million, 1 million and more
Gender 0,1 Male, Female
Marital status 0,1 Unmarried, Married
Number of people in family Actual number No labels
Age category 1,2,3,4,5 18 to 24, 25 to 34, 35 to 49, 50 to 64, 65 and older
Education category 1,2,3,4,5 Less than high school, High school diploma, Some
college, College degree, Postgraduate degree
Income category 1,2,3,4,5 Under $25K, $25K to 49K, $50K to $74K, $75K
to $125K, $125K and more
Dwelling type 1,2,3,4 Single family, Multiple family, Condominium/
townhouse, Mobile home
M12_BURN3261_08_GE_C12.indd 348M12_BURN3261_08_GE_C12.indd 348 17/08/16 4:05 pm17/08/16 4:05 pm
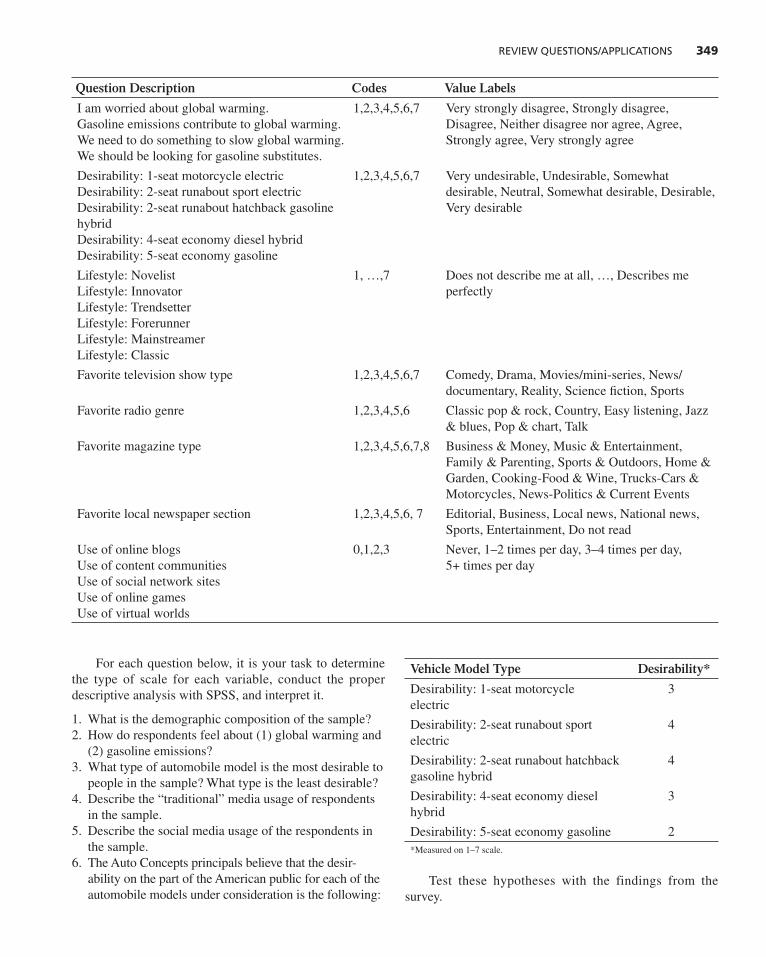
REVIEW QUESTIONS/APPLICATIONS 349
Question Description Codes Value Labels
I am worried about global warming.
Gasoline emissions contribute to global warming.
We need to do something to slow global warming.
We should be looking for gasoline substitutes.
1,2,3,4,5,6,7 Very strongly disagree, Strongly disagree,
Disagree, Neither disagree nor agree, Agree,
Strongly agree, Very strongly agree
Desirability: 1-seat motorcycle electric
Desirability: 2-seat runabout sport electric
Desirability: 2-seat runabout hatchback gasoline
hybrid
Desirability: 4-seat economy diesel hybrid
Desirability: 5-seat economy gasoline
1,2,3,4,5,6,7 Very undesirable, Undesirable, Somewhat
desirable, Neutral, Somewhat desirable, Desirable,
Very desirable
Lifestyle: Novelist
Lifestyle: Innovator
Lifestyle: Trendsetter
Lifestyle: Forerunner
Lifestyle: Mainstreamer
Lifestyle: Classic
1, …,7 Does not describe me at all, …, Describes me
perfectly
Favorite television show type 1,2,3,4,5,6,7 Comedy, Drama, Movies/mini-series, News/
documentary, Reality, Science fi ction, Sports
Favorite radio genre 1,2,3,4,5,6 Classic pop & rock, Country, Easy listening, Jazz
& blues, Pop & chart, Talk
Favorite magazine type 1,2,3,4,5,6,7,8 Business & Money, Music & Entertainment,
Family & Parenting, Sports & Outdoors, Home &
Garden, Cooking-Food & Wine, Trucks-Cars &
Motorcycles, News-Politics & Current Events
Favorite local newspaper section 1,2,3,4,5,6, 7 Editorial, Business, Local news, National news,
Sports, Entertainment, Do not read
Use of online blogs
Use of content communities
Use of social network sites
Use of online games
Use of virtual worlds
0,1,2,3 Never, 1–2 times per day, 3–4 times per day,
5+ times per day
For each question below, it is your task to determine
the type of scale for each variable, conduct the proper
descriptive analysis with SPSS, and interpret it.
1. What is the demographic composition of the sample?
2. How do respondents feel about (1) global warming and
(2) gasoline emissions?
3. What type of automobile model is the most desirable to
people in the sample? What type is the least desirable?
4. Describe the “traditional” media usage of respondents
in the sample.
5. Describe the social media usage of the respondents in
the sample.
6. The Auto Concepts principals believe that the desir-
ability on the part of the American public for each of the
automobile models under consideration is the following:
Vehicle Model Type Desirability*
Desirability: 1-seat motorcycle
electric
3
Desirability: 2-seat runabout sport
electric
4
Desirability: 2-seat runabout hatchback
gasoline hybrid
4
Desirability: 4-seat economy diesel
hybrid
3
Desirability: 5-seat economy gasoline 2
*Measured on 1–7 scale.
Test these hypotheses with the findings from the
survey.
M12_BURN3261_08_GE_C12.indd 349M12_BURN3261_08_GE_C12.indd 349 17/08/16 4:05 pm17/08/16 4:05 pm

▶
LEARNING OBJECTIVES In this chapter you will learn:
13- 1 Why differences are important
13- 2 How SPSS eliminates the worry of small samples
13- 3 To test for signifi cant differences between two groups (percentages and averages)
13- 4 Analysis of variance: testing for signifi cant differences in means among more than two groups
13- 5 How to report group differences tests to clients
13- 6 To test for differences between two means within the same sample (paired sample differences)
13- 7 The null hypotheses for various differences tests described in this chapter
“WHERE WE ARE”
1 Establish the need for marketing
research.
2 Defi ne the problem.
3 Establish research objectives.
4 Determine research design.
5 Identify information types and sources.
6 Determine methods of accessing data.
7 Design data collection forms.
8 Determine the sample plan and size.
9 Collect data.
10 Analyze data.
11 Prepare and present the fi nal
research report.
20|20 Research
20|20 Research is a global leader
in the development, support, and
service of online qualitative mar-
ket research and the software and
technology that sustain it. The
company helps market research
and advertising firms around the
world perform better research for
their clients.
Launched in 1986 by Jim
Bryson, founder and CEO, the fi rm
began as an in-person focus group
facility in Nashville, Tennessee, later expanding to include similar
centers in other parts of the nation. With the rapid growth of tech-
nology in the market research industry, in 2003 Bryson led a major
pivot for the fi rm from leading in-person focus groups to specializing
in emerging innovative technologies for researchers. The fi rm is now
the global leader for online qualitative research software and services
and the preferred provider for seven of the top 10 research compa-
nies in the world. It currently has projects in more than 122 countries
and 30+ languages.
Some of 20|20’s innovations include the following:
■ a threaded bulletin board platform that allows participants
to join focus groups at times and locations convenient to
them.
■ a tool that uses webcam technology and streaming video to pro-
vide real-time face-to-face research.
■ markup software that allows respondents to provide pointed
feedback on ads, design concepts, new product ideas, story-
boards, and other visual stimuli.
13 Implementing Basic Differences Tests
Jim Bryson, founder and CEO,
20|20 Research
M13_BURN3261_08_GE_C13.indd 350M13_BURN3261_08_GE_C13.indd 350 30/08/16 10:54 am30/08/16 10:54 am

351
■ the first real-time, fully integrated human translation tool for
global online qualitative research that quickly translates any of
24 languages.
■ facial coding technology that provides researchers insights into the
true emotions of respondents, which can be implemented anywhere
in the world where there is a computer, a webcam, and the Internet.
■ a platform that harnesses virtual/augmented reality to place respon-
dents in almost any setting, measure their responses, and better
understand their reactions and purchasing behavior.
In the past fi ve years the company has been named one of the top 15 most innovative
research fi rms worldwide by GreenBook Research Industry Trends, a principal arbiter of the
market research industry. The fi rm’s operations are headquartered in Nashville and the com-
pany continues to maintain traditional focus group facilities in Nashville, Charlotte, and Miami
as well as a European offi ce in London, England.
Bryson sits on the Market Research Association board of directors, has served three
terms as president of Qualitative Research Consultants Association, and was named Market
Research Executive of the Year in 2013 by Research Business Report . He holds an M.B.A. from
Vanderbilt University.
Source: Text and photos courtesy of Jim Bryson and 20 ƒ20 Research.
Visit 20 ƒ20 Research at www.2020research.com
In this chapter, we describe the logic of differences tests, and we show you how to use
SPSS to conduct various types of differences tests. 1 Whereas meaningful insights are com-
mon with qualitative research, such as those described for 20|20 Research, differences
tests also provide very useful findings; however, they require the use of quantitative data from
a sizeable sample of survey participants. We begin this chapter discussing why differences
are important to marketing managers. Next, we introduce differences (percentages or means)
between two independent groups, such as a comparison of high-speed cable versus DSL tele-
phone Internet users on how satisfied they are with their Internet connection service. Next, we
introduce ANOVA, a scary name for a simple way to compare the means of several groups
simultaneously and to quickly spot patterns of significant differences. We provide numerical
examples and share examples of SPSS procedures and output using the Auto Concepts survey
data. Finally, we establish that it is possible to test for a difference between the averages of
two similarly scaled questions. For instance, do buyers rate a store higher in “merchandise
selection” than they rate its “good values”?
13- 1 Why Differences Are Important Perhaps one of the most useful marketing management concepts is market segmentation.
Basically, market segmentation holds that diff erent types of consumers have diff erent require-
ments, and these diff erences can be the bases of marketing strategies. As an example, the
Iams Company that markets pet foods has over 20 diff erent varieties of dry dog food geared
M13_BURN3261_08_GE_C13.indd 351M13_BURN3261_08_GE_C13.indd 351 17/08/16 4:06 pm17/08/16 4:06 pm

352 CHAPTER 13 • IMPLEMENTING BASIC DIFFERENCES TESTS
to the dog’s age (puppy, adult, senior), weight
situation (small, medium, large), and activity
level (reduced, normal, moderate, high). Toyota
Motors has 20 models including fi ve car mod-
els, two truck models, seven SUV/van models,
and eight hybrid/crossover models. Even Boe-
ing Airlines has six diff erent types of commer-
cial jets plus a separate business jets division
for corporate travel. Let’s look at diff erences
from the consumer’s side. Everyone washes
his or her hands, but the kind of soap required
diff ers for weekend gardeners with potting soil
under their fi ngernails, factory workers whose
hands are dirty with solvents, preschoolers who
have sticky drink residue on their hands and
faces, or aspiring beauty princesses who wish
their hands to look absolutely fl awless. The needs and requirements of each of these market
segments diff er greatly from the others, and an astute marketer will customize his or her mar-
keting mix to each target market’s unique situation. 2
These diff erences, of course, are quite obvious, but as competition becomes more intense
with prolifi c market segmentation and target marketing being the watchword of most compa-
nies in an industry, there is a need to investigate diff erences among consumer groups for con-
sumer marketers and business establishments for B2B (business-to-business) marketers. One
commonly used basis for market segmentation is the discovery of (1) statistically signifi cant,
(2) meaningful, (3) stable, and (4) actionable diff erences. We will discuss each requirement
briefl y. In our comments, we will assume that we are working with a pharmaceuticals com-
pany that markets cold remedies.
The diff erences must be signifi cant. As you know, the notion of statistical signifi cance
underpins marketing research. 3 Statistical signifi cance of diff erences means that the diff er-
ences found in the sample(s) truly exist in the population(s) from which the random samples
are drawn. The diff erences that are apparent between and among market segments must be
subjected to tests that assess the statistical signifi cance of those diff erences. We will endeavor
to teach you how to perform and interpret tests of the statistical signifi cance of diff erences.
With our cold remedy marketer, we could ask cold suff erers, “How important is it that your
cold remedy relieves your ____?” The respondents would use a scale from 1 = “Not impor-
tant” to 10 = “Very important” for each cold symptom such as fever, sore throat, congestion,
and aching muscles, and statistical tests such those described in this chapter would deter-
mine if the responses were signifi cantly diff erent. With those in the grip of a cold virus, we
might fi nd two groups that have statistically signifi cant diff erences: (1) congestion suff erers ,
who greatly desire breathing congestion relief, and (2) muscle aches and pains suff erers , who
instead greatly desire relief from musculoskeletal aches and pains associated with their colds. The diff erences must be meaningful. A fi nding of statistical signifi cance in no way guar-
antees “meaningful” diff erence. In fact, with the proliferation of data mining analysis due
to scanner data with tens of thousands of records, online surveys that garner thousands of
respondents, and other ways to capture very large samples, there is a very real danger of fi nd-
ing a great deal of statistical signifi cance that is not meaningful. The reason for this danger is
that statistical signifi cance is determined in large part by the sample size. 4 You will see in this
chapter by examining the formulas we provide that the sample size, n , is instrumental in the
calculation of z , the determinant of the signifi cance level. Large samples, those in excess of
1,000 per sample group, often yield statistically signifi cant results when the absolute diff er-
ences between the groups are quite small. A meaningful diff erence is one that the marketing
manager can potentially use as a basis for marketing decisions.
Market segmentation is based on differences between groups of consumers.
Market segmentation strategy explicitly recognizes diff erences between
groups of consumers.
To be potentially useful to the marketing researcher or manager, differences must, at minimum, be statistically signifi cant.
To be useful to the marketing researcher or manager, differences must, if statistically signifi cant, be meaningful.
© L
jupc
o S
mok
ovsk
i/S
hutt
erst
ock
M13_BURN3261_08_GE_C13.indd 352M13_BURN3261_08_GE_C13.indd 352 17/08/16 4:06 pm17/08/16 4:06 pm

13-1 WHY DIFFERENCES ARE IMPORTANT 353
In our common cold example, there are meaningful implications that those in one group
cannot breathe easily while those in the other group have aches and pains, and thankfully
there are cold remedy ingredients that reduce congestion and other ingredients that diminish
pain. Should the pharmaceuticals company include both ingredients in one remedy? Research
shows that the congestion suff erers do not want an ingredient that might make them drowsy
due to the strong pain relief ingredient, and the aches and pains suff erers do not want their
throats and nasal passages to feel dry and uncomfortable due to the decongestant ingredient.
Thus these diff erences are meaningful both to the customer groups and to the pharmaceuticals
manufacturer. The diff erences should be stable. Stability refers to the requirement that we are not
working with a short-term or transitory set of diff erences. Thus, a stable diff erence is one
that will be in place for the foreseeable future. The persistent problem experienced by con-gestion suff erers is most probably due to some respiratory weakness or condition. They may
have preconditions such as allergies or breathing problems, or they may be exposed to heavy
pollution or some other factor that aff ects their respiration in general. Muscle aches and pains suff erers may be very active people who do not have respiration weaknesses but who value
active lifestyle practices such as regular exercise, or their occupations may require a good deal
of physical activity. In either case, there is a very good possibility that when a cold strikes,
the suff erer will experience the same discomfort, either congestion or muscle aches, time and
time again. That is, the diff erences between the two groups are stable. The pharmaceuticals
company can develop custom-designed versions of a cold relief product because managers
know from experience and research that certain consumers will be consistent (stable) in seek-
ing certain types of relief or specifi c product benefi ts when they suff er from colds. The diff erences must be actionable. Market segmentation requires that standard or innovative
market segmentation bases are used, and that these bases uniquely identify the various groups
so they can be analyzed and put in the marketer’s targeting mechanisms.
An actionable diff erence means that the marketer can focus various
marketing strategies and tactics, such as product design or advertising,
on the market segments to accentuate the diff erences between the seg-
ments. There are a great many segmentation bases that are actionable
such as demographics, lifestyles, and product benefi ts. In our example,
among the many symptoms manifested by cold suff erers, we have iden-
tifi ed two meaningful and stable groups, so a cold remedy product line
that concentrates on each one of these groups separately is possible. A
quick glance at the cold remedies section of your local drugstore will
verify the actionability of these cold symptoms market segments.
You may be confused about meaningful and actionable diff er-
ences. Recall that we used the phrase “potentially use” in our defi ni-
tion of a meaningful diff erence. With our cold remedies example, a
pharmaceutical company could potentially develop and market a cold
remedy that was specifi c to every type of cold symptom as experi-
enced by every demographic group and further identifi ed by lifestyle
diff erences. For example, there could be a cold medicine to alleviate
the runny noses of teenage girls who participate in high school athlet-
ics, and a diff erent one for the sniffl es in teenage boys who play high
school sports. But it would be economically unjustifi able to off er so
many diff erent cold medicines, so all marketers must assess action-
ably based on market segment size and profi tability considerations.
Nevertheless, the fundamental diff erences are based on statistical sig-
nifi cance, meaningfulness, and stability assessments. To be sure, the bulk of this chapter deals strictly with statistically
signifi cant diff erences because it is the beginning point for market
To be useful to the marketing researcher or manager, differences must, if statistically signifi cant and meaningful, be stable.
To be useful to the marketing researcher or manager, differences must be statistically signifi cant, meaningful, stable, and actionable.
Because cold suff ers consistently have diff erent
symptoms such as runny noses, congestion, and
achy muscles, pharmaceutical companies have
identifi ed diff erent market segments.
© S
ubbo
tina
/123
rf
M13_BURN3261_08_GE_C13.indd 353M13_BURN3261_08_GE_C13.indd 353 17/08/16 4:06 pm17/08/16 4:06 pm

354 CHAPTER 13 • IMPLEMENTING BASIC DIFFERENCES TESTS
segmentation and savvy target marketing. Meaningfulness, stability, and actionability are not
statistical issues; rather, they are marketing manager judgment calls.
13- 2 Small Sample Sizes: The Use of a t Test or a z Test and How SPSS Eliminates the Worry Most of the equations related in this chapter will lead to the computation of a z value. As we
pointed out in the previous chapter, the computation of the z value makes the assumption that
the raw data for most statistics under scrutiny have normal or bell-shaped distributions. How-
ever, statisticians have shown that this normal curve property does not occur when the sample
size is 30 observations or fewer. 5 In this instance, a t value is computed instead of a z value. The
t test is defi ned as the statistical inference test to be used with small samples sizes ( n … 30).
Any instance when the sample size is 30 or greater requires the use of a z test . The great advantage to using statistical analysis routines on a computer is that they
are programmed to compute the correct statistic. In other words, you do not need to decide
whether you want the program to compute a t value, a z value, or some other value. With
SPSS, the analyses of diff erences are referred to as t tests , but now that you realize that SPSS
will always determine the correct signifi cance level whether it is a t or a z , you do not need to
worry about which statistic to use. The talent you need to acquire is how to interpret the sig-
nifi cance level that is reported by SPSS. We have provided Marketing Research Insight 13. 1
to introduce you to a “stoplight” analogy that students have told us is helpful in this regard.
The t test should be used when the sample size is 30 or fewer.
Most computer statistical programs report only the t value because it is identical to the z value with large samples.
Green Stoplight Signals and Signifi cance in Statistical Analysis The output from statistical procedures in all software programs can be envisioned as “green light” devices. When the green signal light is on, statistical signifi cance is present. Then, and only then, is it warranted to look more closely to determine the pattern of the fi ndings; if the light is not green, your time will be wasted by looking any further. To read statistical stoplight signals, you need to know two things. First, where is the stop-light located? Second, what color light is illuminated?
Where Is the Light? Virtually every statistical test or procedure involves the com-putation of some critical statistic, and that statistic is used to determine the statistical signifi cance of the fi ndings. The criti-cal statistic’s name changes depending on the procedure and its underlying assumptions, but usually the statistic is identi-fi ed as a letter, as in z , t , or F . Statistical analysis computer programs will automatically identify and compute the cor-rect statistic, so although it is helpful to know ahead of time what statistic will be computed, it is not essential to know it. Moreover, the statistic is not the signal light; rather it is just a computation necessary to determine what color light to illuminate.
The computer program will also contain the stoplight, but its name changes a bit depending on the procedure. Often
called “ p values” by statisticians, they are identifi ed on com-puter output by the term signifi cance or probability . Sometimes abbreviations such as “Sig.” or “Prob.” are used to econo-mize on the output. To fi nd the stoplight, locate the “Sig.” or “Prob.” designation in the analysis and look at the number that is associated with it. The number will be a decimal perhaps as low as .000 and ranging as high as 1.000. When you locate it, you have found the statistical signifi cance stoplight.
What Is the Color of the Stoplight Signal? Whenever you encounter a stoplight while driving your car, a green lights signals that you can advance forward. For purposes of this textbook , we have adopted the 95% level of confi dence. That is, if you were 95% confi dent that the green light is on, you would proceed by stepping on your gas pedal. As we noted previously, the signifi cance or probability values reported in sta-tistical analysis output range from .0000 to 1.000, and they indicate the degree of support for the null hypothesis (no differ-ences). If you take 1 minus the reported signifi cance level—for example, if the signifi cance level is .03, you take 1 minus .03 to come up with .97, or 97%—it is the level of confi dence for our fi nding. Any time this value is 95% or greater, you should know that you have the green light to start your interpretation of the fi ndings.
MARKETING RESEARCH INSIGHT 13. 1 Practical Application
M13_BURN3261_08_GE_C13.indd 354M13_BURN3261_08_GE_C13.indd 354 17/08/16 4:06 pm17/08/16 4:06 pm

13-3 TESTING FOR SIGNIFICANT DIFFERENCES BETWEEN TWO GROUPS 355
13- 3 Testing for Signifi cant Differences Between Two Groups Often, as we have done in our cold remedy example, a researcher will want to compare two
groups of interest. That is, the researcher may have two independent groups such as fi rst-time
versus repeat customers, and he or she may want to compare their answers to the same ques-
tion. The question may use either a nominal or a scale measure. A nominal variable requires
that the researcher compare percentages; a scale variable requires comparing means. As you
know by now, the formulas diff er depending on whether percentages or means are being tested.
DIFFERENCES BETWEEN PERCENTAGES WITH TWO GROUPS (INDEPENDENT SAMPLES) When a marketing researcher is interested in making comparisons between two groups of
respondents to determine whether or not there are statistically signifi cant diff erences between
them, in concept, he or she is considering them as two potentially diff erent populations. The
question to be answered then becomes whether or not their respective population parameters
are diff erent. But, as always, a researcher can only work with the sample results. Therefore,
the researcher must fall back on statistical signifi cance to determine whether the diff erence
that is found between the two sample statistics is a true population diff erence. You will shortly
discover that the logic of diff erences tests is very similar to the logic of hypothesis testing that
you learned about in the previous chapter . To begin, we will refer to an intuitive approach you use every day when comparing two
things to make an inference. Let us assume you have read a Business Week article about col-
lege recruiters that quotes a Harris poll of 100 randomly selected companies, indicating that
65% of them will be visiting college campuses to interview business majors. The article goes
on to say that a similar poll taken last year with 300 companies found that only 40% would be
recruiting at college campuses. This is great news: More companies will be coming to your
campus this year with job interviews. However, you cannot be completely confi dent of your
joyous conclusion because of sampling error. If the diff erence between the percentages was
very large, say 80% for this year and 20% for last year, you would be more inclined to believe
that a true change had occurred. But if you found out the diff erence was based on small sam-
ple sizes, you would be less confi dent of your inference that last year’s college recruiting and
this year’s college recruiting are diff erent. Intuitively, you have taken into account two critical
factors in determining whether statistically signifi cant diff erences exist between a percentage
or a mean compared between two samples: the magnitude of the diff erence between the com-
pared statistic (65% versus 40%) and sample sizes (100 versus 300).
To test whether a true diff erence exists between two group percentages, we test the
null hypothesis , or the hypothesis that the diff erence in their population parameters is equal
to zero. The alternative hypothesis is that there is a true diff erence between them. To per-
form the test of signifi cance of diff erences between two percentages , each representing
a separate group (sample), the fi rst step requires a comparison of the two percentages. The
comparison is made by fi nding the arithmetic diff erence between them. The second step
requires that this diff erence be translated into a number of standard errors away from the
hypothesized value of zero. Once the number of standard errors is known, knowledge of
the area under the normal curve will yield an assessment of the probability of support for the
null hypothesis. For a diff erence between two percentages test, the equation is as follows:
Formula for signifi cance of the diff erence between two percentages
z =p1 - p2
sp1 - p2
Statistical tests are used when a researcher wants to compare the means or percentages of two different groups or samples.
Independent samples are treated as representing two potentially different populations.
With a differences test, the null hypothesis states there is no difference between the percentages (or means) being compared.
M13_BURN3261_08_GE_C13.indd 355M13_BURN3261_08_GE_C13.indd 355 17/08/16 4:06 pm17/08/16 4:06 pm

356 CHAPTER 13 • IMPLEMENTING BASIC DIFFERENCES TESTS
where
p1 = percentage found in sample 1
p2 = percentage found in sample 2
sp1 - p2= standard error of the difference between two percentages
The standard error of the diff erence between two percentages combines the standard error
of the percentage for both samples, and it is calculated with the following formula:
Formula for the standard error of the diff erence between two percentages
sp1 - p2= A
p1 * q1
n1
+p2 * q2
n2
where
q1 = 100 - p1
q2 = 100 - p2
n1, n2 = sample sizes for sample 1 and 2, respectively
Again, if you compare these formulas to the ones we used in hypothesis testing in
Chapter 12 , you will see that the logic is identical. First, in the numerator, we subtract one
sample’s statistic ( p 2 ) from the other sample’s statistic ( p 1 ) just as we subtracted the hypoth-
esized percent from the sample percent in hypothesis testing. You should have noticed that we
use the subscripts 1 and 2 to refer to the two diff erent sample statistics. Second, the sampling
distribution is expressed in the denominator. However, the sampling distribution under con-
sideration now is the assumed sampling distribution of the diff erences between the percentage
rather than the simple standard error of a percentage used in hypothesis testing. That is, the
assumption has been made that the diff erences have been computed for comparisons of the
two sample statistics for many repeated samplings. If the null hypothesis is true, this distribu-
tion of diff erences follows the normal curve with a mean equal to zero and a standard error
equal to one. Stated somewhat diff erently, the procedure requires us, as before, to accept the
(null) hypothesis as true until it lacks support from the statistical test. Consequently, the dif-
ferences of a multitude of comparisons of the two sample percentages generated from many,
many samplings would average zero. In other words, our sampling distribution is now the dis-
tribution of the diff erence between one sample and the other, taken over many, many times. 6
The following example will walk you through the point we just made.
Here is how you perform the calculations for the Harris poll on companies coming
to campus to hire college seniors. Recall that last year’s poll with 300 companies reported
40% were coming to campuses, whereas this year’s poll with 100 companies reported that
65% were visiting campuses.
Computation of the signifi cance of the diff erence between two percentages
Notes:
p 1 = 65%
p 2 = 40%
n 1 = 100
n 2 = 300
z =p1 - p2
sp1 - p2
=65 - 40
A65 * 35
100+
40 * 60
300
=25
222.75 + 8
=25
5.55
= 4.51
We compare the computed z value with our standard z of 1.96 for the 95% level of con-
fi dence, and the computed z of 4.51 is larger than 1.96. A computed z value that is larger than
the standard z value of 1.96 amounts to no support for the null hypothesis at the 95% level
With a differences test, you test the null hypothesis that no differences exist between the two group means (or percentages).
M13_BURN3261_08_GE_C13.indd 356M13_BURN3261_08_GE_C13.indd 356 17/08/16 4:06 pm17/08/16 4:06 pm

13-3 TESTING FOR SIGNIFICANT DIFFERENCES BETWEEN TWO GROUPS 357
of confi dence. Thus there is a statistically signifi cant diff erence between the two percentages
and we are confi dent that if we repeated this comparison many, many times with a multitude
of independent samples, we would conclude that there is a signifi cant diff erence in at least
95% of these replications. Of course, we would never do so many replications, but this is the
statistician’s basis for the level of signifi cance.
It is a simple matter to apply the formulas to percentages to determine the signifi cance of
their diff erences, for all that is needed is the sample size of each group. We provide Marketing
Research Insight 13. 2 , which relies on diff erences between percentages for two diff erent
groups. This feature highlights how U.S. Hispanic consumers have become and will continue
to be a major market segment.
Do U.S. Hispanics Differ from Non-Hispanics in Digital Media Use? In the past decade, a quiet revolution of sorts has occurred with respect to consumers in the United States. For a number of rea-sons, the Hispanic segment of the U.S. population has made very signifi cant gains, and it is estimated that there are now well over 50 million Hispanic consumers living in the United States. At the current rate of growth the Hispanic segment may account for one-third of all U.S. consumers in the next 30 to 50 years.
While it is well known that U.S. consumers are heavy digital media users, is this also the case for the Hispanic segment in the United States? An article was recently published by executives 7 at comScore, a large digital metrics company, contrasting U.S. Hispanics from non-Hispanics. For anyone who has not kept up with U.S. Hispanic market segment trends, the fi ndings are probably quite surprising. As can be seen in the accompanying
fi gure, the percentages of Hispanic consumers’ uses of all types of digital media surpass those of non-Hispanics. In particular, in the case of use of mobile phones, Hispanics are twice as active as non-Hispanics for photo and/or video posting; they are one-third more active for social networking uses, and almost twice as active for status updating. It can also be seen that Hispanics are more active than non-Hispanics in all measured digital multi-media and entertainment uses: games, music, streaming, video, and multiple types of television uses. You might ask about English- versus Spanish-speaking Hispanics. The authors report that almost one-half of U.S. Hispanic consumers speak primar-ily English, while another one-quarter speaks both English and Spanish. The incidence of Spanish-only speakers among U.S. Hispanics will diminish over the near term due to a younger population and a higher birthrate among U.S. Hispanics.
MARKETING RESEARCH INSIGHT 13. 2 Digital Marketing Reseach
0%Photo/video
sharingSocial
networkingListened
tomusicdaily
Postedstatusupdate
Playedgamesdaily
Usedstreaming
musicservice
WatchedTV/video
daily
Watchedweb-based
videos
WatchedTV
(live/ondemand)
Watchedpaid
TV/video
5%
10%
20%
15%
25%
30%
35%
40%
45%
Use of Digital Media
Non-hispanic Hispanic
9.6%
19.0
%
28.7
%39
.4%
8.3%
14.4
%
15.9
% 21.2
%
10.9
% 16.9
%
13.4
% 18.4
%
4.8%
9.1%
28.8
% 42.6
%
13.2
%27
.9%
13.2
%26
.8%
Diff erences in U.S. Hispanic and Non-Hispanic Consumers’ Use of Digital Media
M13_BURN3261_08_GE_C13.indd 357M13_BURN3261_08_GE_C13.indd 357 17/08/16 4:06 pm17/08/16 4:06 pm

358 CHAPTER 13 • IMPLEMENTING BASIC DIFFERENCES TESTS
HOW TO USE SPSS FOR DIFFERENCES BETWEEN PERCENTAGES OF TWO GROUPS As is the case with most statistical analysis programs, SPSS does not perform tests of the
signifi cance of the diff erence between the percentages of two groups. You can, however, use
SPSS to determine the sample percentage on your variable of interest along with its sample
size. Use the SPSS command FREQUENCIES. Repeat this descriptive analysis for the other
sample, and you will have all the values required ( p 1 , p 2 , n 1 , and n 2 ) to perform the calcula-
tions by hand or in a spreadsheet program. (Recall that you can compute q 1 and q 2 , based on
the “ p + q = 100%” relationship.)
DIFFERENCES BETWEEN MEANS WITH TWO GROUPS (INDEPENDENT SAMPLES) The procedure for testing signifi cance of diff erence between two means from two diff erent
groups (either two diff erent samples or two diff erent groups in the same sample) is identical to
the procedure used in testing two percentages. However, the equations diff er because a scale
variable is involved.
Here is the equation for the test of diff erence between two sample means:
Formula for signifi cance of the diff erence between two means
z =x1 - x2
sx1 - x2
where
x1 = mean found in sample 1
x2 = mean found in sample 2
sx1 - x2= standard error of the difference between two means
To learn about propor-tion differ-ences tests, launch www.
youtube.com , and search for “Hypothesis Test Comparing Population Proportions.”
SPSS does not perform tests of the signifi cance of the difference between the percentages of two groups, but you can use SPSS to generate the relevant information and perform a hand calculation.
If the null hypothesis is true, when you subtract one group mean from the other, the result should be about zero.
Active Learning
Calculations to Determine Significant Differences Between Percentages
You can now perform your own tests of the differences between two percentages using the formulas we have provided and described. A local health club has just finished a media blitz (newspaper, television, radio, etc.) for new memberships. Whenever a prospective new mem-ber visited one of the health club’s facilities, he or she was asked to fill out a short question-naire. One question asked the person to indicate what ads he or she saw in the past month. Some of these prospects joined the health club, while some did not, which gave us two populations: those who joined the health club and those who did not. At the end of 30 days, a staff member performed the following tabulations.
Joined the Health Club Did Not Join the Health Club
Total visitors 100 30
Recalled newspaper ads 45 15
Recalled FM radio station ads 89 20
Recalled Yellow Pages ads 16 5
Recalled local TV news ads 21 6
Use your knowledge of the formula and the test of the significance of the difference between two percentages to ascertain if there are any significant differences in the data. What are the implications of your findings with respect to the effectiveness of the various advertising media used during the membership recruitment ad blitz?
M13_BURN3261_08_GE_C13.indd 358M13_BURN3261_08_GE_C13.indd 358 17/08/16 4:06 pm17/08/16 4:06 pm

13-3 TESTING FOR SIGNIFICANT DIFFERENCES BETWEEN TWO GROUPS 359
The standard error of the diff erence is easy to
calculate and again relies on the variability that has
been found in the samples and their sizes. Because
we are working with means, we use the standard
deviations in the formula for the standard error of a
diff erence between two means:
Formula for the standard error of the diff erence between two means
sx1 - x2= C
s21
n1
+s2
2
n2
where
s1 = standard deviation in sample 1
s2 = standard deviation in sample 2
n1 = size of sample 1
n2 = size of sample 2
To illustrate how signifi cance of diff erence computations are made, we use the following
example that answers the question “Do male teens and female teens drink diff erent amounts
of sports drinks?” In a recent survey, teenagers were asked to indicate how many 20-ounce
bottles of sports drinks they consume in a typical week. The descriptive statistics revealed
that males consume 9 bottles on average and females consume 7.5 bottles of sports drinks on
average. The respective standard deviations were found to be 2 and 1.2. Both samples were of
size 100. Applying this information to the formula for the test of statistically signifi cant dif-
ferences, we get the following:
Computation of the signifi cance of the diff erence between two means
Notes:
x1 = 9.0
x2 = 7.5
s1 = 2.0
s2 = 1.2
n1 = 100
n2 = 100
z =x1 - x2
Cs2
1
n1
+s2
2
n2
=9.0 - 7.5
C22
100+
1.22
100
=1.5
2.04 + 0.144
=1.5
0.233
= 6.43
Figure 13. 1 indicates how these two samples compare on the sampling distribution assumed
to underlie this particular example. In the bottom of the fi gure, we have provided the standard
error of the diff erence bell-shaped curve with 0 as its mean (the null hypothesis). By looking
at the computed z value labeled on the graph, you know the probability of support for the null
hypothesis of no diff erence between the two means is less than .05 because the large number of
standard errors (6.43) calculated to exist for this example is much greater than 1.96.
How do you interpret this test for signifi cance of diff erences? As always, the sampling
distribution concept underlies our interpretation. If the null hypothesis is true, and we drew
many, many samples and did this explicit comparison each time, then 95% of diff erences
would fall within ±1.96 standard errors of zero. Of course, only one comparison can be made,
Here is the formula for the standard error of the difference between two means.
Is there a diff erence in the average number of sports drinks consumed by
males versus the average number of sports drinks consumed by females?
Here are the calculations for a test of the difference between the means of two groups.
© W
arre
n G
olds
wai
n/S
hutt
erst
ock
M13_BURN3261_08_GE_C13.indd 359M13_BURN3261_08_GE_C13.indd 359 17/08/16 4:06 pm17/08/16 4:06 pm

360 CHAPTER 13 • IMPLEMENTING BASIC DIFFERENCES TESTS
and you have to rely on the sampling distribution concept and its attendant assumptions to
determine whether this one particular instance of information supports or refutes the hypoth-
esis of no signifi cant diff erences found between the means of your two groups.
INTEGRATED CASE
The Auto Concepts Survey: How to Perform an Independent Sample Signifi cance of Differences Between Means Test with SPSS To demonstrate an independent samples signifi cance test, we will take up the question of
whether or not market segmentation is relevant to Auto Concepts. We will begin by looking at
gender as a possible segmentation variable and the desirability of the fi ve-seat economy gaso-
line model. We have two groups: males and females. We can test the mean of the desirabil-
ity of the fi ve-seat economy gasoline model, which was measured on a 7-point scale where
1 = Very undesirable and 7 = Very desirable.
The clickstream that directs SPSS to perform an independent samples t test of the signifi -
cance of the diff erence between means is displayed in Figure 13. 2 . As you can see, you begin
with the ANALYZE-COMPARE MEANS-INDEPENDENT SAMPLES T-TEST … menu
sequence. This sequence opens up the selection menu, and the “Desirability: 5 Seat Economy
Gasoline” model variable is clicked into the “Test variable” area, while the “Gender” variable
is clicked in the “Grouping Variable” box. Using the “Defi ne Groups” button, a window opens
to let us identify the codes of the two groups (0 = male and 1 = female). This sets up the t test,
and a click on OK executes it.
The annotated output is found in Figure 13. 3 . The fi rst table reveals that the mean of the
560 males is 3.51, while the mean for the 440 females is 2.83.
The statistical test for the diff erence between the two means is given next. However, SPSS
computes the results two diff erent ways. One is identifi ed as the “equal variances assumed,”
and the other is called the “equal variances not assumed.” In our previous descriptions,
we omitted a detail involved in tests for the signifi cance of diff erence between two means.
2 163 4 5 6 7 8 9 10 1311 151412
Female soft drinkers
Females’ meanMales’ mean
Male soft drinkers
Standard error of difference
Null hypothesis(difference � 0)
95%of area
under curve
Computed z value for
Male:Femalemean
Standard errors
Soft drinks
–1.96–2.58 0 1.96 2.58 6.43
FIGURE 13.1 A Signifi cant Difference Exists Between the Two Means Because z Is Calculated to Be Greater Than 1.96 (95% Level of Confi dence)
To determine the signifi cance of the difference in the means of two groups with SPSS, use the ANALYZE-COMPARE MEANS-INDEPENDENT SAMPLES T-TEST … menu sequence.
M13_BURN3261_08_GE_C13.indd 360M13_BURN3261_08_GE_C13.indd 360 17/08/16 4:06 pm17/08/16 4:06 pm

13-3 TESTING FOR SIGNIFICANT DIFFERENCES BETWEEN TWO GROUPS 361
In some cases, the variances (standard deviations) of the two samples are about the same; that
is, they are not signifi cantly diff erent. If so, you can use the formula pertaining to the equal
variances (same variance for both samples), but if the standard deviations are statistically sig-
nifi cant in their diff erences, you should use the unequal variances line on the output.
FIGURE 13.2 IBM SPSS Clickstream to Obtain an Independent Samples t Test
Source: Reprint Courtesy of International Business Machines Corporation, © International Business Machines Corporation.
FIGURE 13.3 IBM SPSS Output for an Independent Samples t Test
Source: Reprint Courtesy of International Business Machines Corporation, © International Business Machines Corporation.
M13_BURN3261_08_GE_C13.indd 361M13_BURN3261_08_GE_C13.indd 361 17/08/16 4:06 pm17/08/16 4:06 pm

362 CHAPTER 13 • IMPLEMENTING BASIC DIFFERENCES TESTS
How do you know which one to use? The null hypothesis here is that there is no diff er-
ence between the variances (standard deviations), and it is tested with an F value printed in
the top row of the independent samples test table. The F test is just another statistical test,
and it is the proper one here. (Recall that we stated earlier that SPSS will always select and
compute the correct statistical test.) The F value is based on a procedure called “Levene’s
Test for Equality of Variances.” In our output, the F value is identifi ed as 78.64 with a Sig.
(probability) of .000. The probability reported here is the probability that the variances are
equal, so anytime the probability is greater than, say .05, you would use the equal variance
line on the output. If the probability associated with the F value is small, say .05 or less, then
the variances null hypothesis is not supported, and you should use the unequal variance line
(identifi ed as “Equal variances not assumed”). If you forget this rule, look at the standard
deviations. Try to remember that if they are about the same size, you would use the equal
variances t value.
Using the “equal variances not assumed” estimate information, you will fi nd that the
computed t value is 7.733, and the associated probability of support for the null hypothesis of
no diff erence between the males’ preference mean and the females’ preference mean is .000.
In other words, they diff er signifi cantly. Males prefer the standard-size gasoline model more
than do females, and Auto Concepts can segment this model’s market using gender. However,
one should bear in mind that the male mean is essentially “neutral,” so perhaps other segmen-
tation bases will derive more useful fi ndings.
To learn about dif-ferences between means tests,
launch www.youtube.com , and search for “Hypothesis Test for Difference of Means.”
IBM SPSS Student Assistant: Assessing Differences Between Means for 2 Groups (Independent)
Active Learning
Perform Means Differences Analysis with SPSS
You have just observed how to perform an independent samples t test with SPSS using your Auto Concepts survey data. For this Active Learning exercise, determine if there is a differ-ence in preferences for the various possible electric or hybrid models based on gender. That is, redo the five-seat economy gasoline analysis to make sure that you can find and execute the analysis. Then use the clickstream instructions in Figure 13. 2 to direct SPSS to perform this analysis for each of the four other possible models. Use the annotations on the independent samples t test output provided in Figure 13. 3 to interpret your findings.
Synthesize Your Learning
The following case study will serve to synthesize your knowledge of material covered in the following chapters.
Chapter 11 Dealing with Fieldwork and Data Quality Issues Chapter 12 Using Descriptive Analysis, Performing Population Estimates, and
Testing Hypotheses Chapter 13 Implementing Basic Differences Tests
A survey was recently conducted for a store called Pets, Pets, & Pets (PPP). The store has a list of 10,000 customers who have made a purchase there in the last year, and a random sample of 400 of these customers participated in the survey. Following are some of the relevant findings.
PPP Survey Table 1
What type of pet do you own? Dog Cat Other Total
45% 34% 21% 100%
M13_BURN3261_08_GE_C13.indd 362M13_BURN3261_08_GE_C13.indd 362 17/08/16 4:06 pm17/08/16 4:06 pm

13-3 TESTING FOR SIGNIFICANT DIFFERENCES BETWEEN TWO GROUPS 363
PPP Survey Table 2
Sample Yes Dog Owner Cat Owner
Do you use PPP quite often? 44% 50% 38%
Would you recommend PPP to a friend? 82% 91% 75%
Do you recall a PPP newspaper ad in past month? 53% 50% 55%
Do you recall a PPP coupon in the past month? 47% 53% 40%
PPP Survey Table 3
Rate each of the following aspects of PPP.*
Sample Dog Owner Cat Owner
Average Std Dev Average Std Dev Average Std Dev
Assortment of merchandise 4.6 2.1 4.9 1.6 4.5 1.9
Friendliness of employees 4.6 2.1 4.7 1.3 4.5 2.2
Speed of check-out 4.4 1.9 4.6 0.9 4.2 1.8
Convenience of parking 4.1 1.9 4.5 1.6 3.8 2.4
Competitive prices 4.0 2.0 4.3 1.9 4.0 1.9
Store layout 3.8 2.1 4.3 1.6 3.6 1.6
Helpfulness of employees 3.4 1.9 3.7 1.8 3.3 2.1
Variety of cat/dog food brands 3.4 2.1 3.4 1.8 3.4 1.9
Convenient location 2.8 1.9 3.3 1.5 2.8 1.6
Overall satisfaction with PPP 4.6 1.5 4.9 1.2 4.2 2.2
*Based on a scale where 1 = Very unsatisfi ed, … 5 = Very satisfi ed.
PPP Survey Table 4
What is your household income level? Sample Dog Owner Cat Owner
Refused 5% 0% 25%
Between $60,000 and $80,000 10% 15% 10%
Between $80,000 and $100,000 20% 25% 10%
Greater than $100,000 65% 60% 55%
Total 100% 100% 100%
1. Perform appropriate differences tests (95% level of confidence) to answer this question: “Do PPP dog owners differ from PPP cat owners with respect to their answers in PPP Table 1 ?” If so, how do they differ?
2. Perform appropriate differences tests (95% level of confidence) to answer this question: “Do PPP dog owners differ from PPP cat owners with respect to their answers in PPP Table 2 ?” If so, how do they differ?
3. PPP management believes that 75% of its customers are dog owners. Test this hypothe-sis, and if not supported at the 95% level of confidence, compute the confidence interval.
4. PPP management believes that all of its customers are overall “very satisfied” with PPP. Test this hypothesis, and if not supported at the 95% level of confidence, compute the confidence interval.
5. PPP Table 4 suggests that if PPP targets customers with household income of greater than $100,000 per year, it should emphasize its dog merchandise. Consider the data quality of the information contained in the table and assess if this conclusion is correct or incorrect. Be sure to do the appropriate statistical tests at the 95% level of confidence.
M13_BURN3261_08_GE_C13.indd 363M13_BURN3261_08_GE_C13.indd 363 17/08/16 4:06 pm17/08/16 4:06 pm
364 CHAPTER 13 • IMPLEMENTING BASIC DIFFERENCES TESTS
13- 4 Testing for Signifi cant Differences in Means Among More Than Two Groups: Analysis of Variance As you have learned, it is fairly easy to test for the signifi cance of the diff erence between
means for two groups. But sometimes a researcher will want to compare the means of three,
four, fi ve, or more diff erent groups. Analysis of variance, sometimes called ANOVA, should
be used to accomplish such multiple comparisons. 8 The use of the word variance is mislead-
ing, for it is not an analysis of the standard deviations of the groups. To be sure, the standard
deviations are taken into consideration, and so are the sample sizes, as you just saw in all of
our diff erences between means formulas. Fundamentally, ANOVA (analysis of variance) is
an investigation of the diff erences between the group means to ascertain whether sampling
errors or true population diff erences explain their failure to be equal. 9 That is, the word vari-ance signifi es for our purposes diff erences between two or more groups’ means—do they
vary from one another signifi cantly? Although a term such as analysis of variance or ANOVA
sounds frightfully technical, it is nothing more than a statistical procedure that allows you to
compare the means of several groups. As we noted in our discussion on market segmenta-
tions, markets are often comprised of a number of market segments, not just two, so ANOVA
is a valuable tool for discovering diff erences between and among multiple market segments.
The following sections explain the basic concepts involved with analysis of variance and how
it can be applied to marketing research situations.
BASICS OF ANALYSIS OF VARIANCE In using analysis of variance there is a desire on the part of a researcher to determine whether
a statistically signifi cant diff erence exists between the means for any two groups in a sample
with a given variable regardless of the number of groups. The end result of analysis of vari-
ance is an indication to the marketing researcher as to whether a signifi cant diff erence at some
chosen level of statistical signifi cance exists between at least two group means. Signifi cant
diff erences may exist between all of the group means, but analysis of vari-
ance results alone will not communicate how many pairs of means are statis-
tically signifi cant in their diff erences.
To elaborate, ANOVA is a green light procedure , meaning that if at
least one pair of means has a statistically signifi cant diff erence, ANOVA will
signal this by indicating signifi cance. Then it is up to the researcher to con-
duct further tests (called post hoc tests ) to determine precisely how many
statistically signifi cant diff erences actually exist and which ones they are. If
the green light is not illuminated, the researcher can conclude that no signifi -
cant diff erences exist. Let us elaborate just a bit on how ANOVA works. ANOVA uses some
complicated formulas, and we have found from experience that market
researchers do not memorize them. Instead, a researcher understands the basic
purpose of ANOVA and is adept in interpreting ANOVA output. Let’s assume
that we have three groups, A, B, and C. In concept ANOVA performs all possi-
ble independent samples t tests for signifi cant diff erences between the means,
comparing, in our example, A:B, A:C, and B:C. ANOVA is very effi cient, as it
makes these comparisons simultaneously, not individually as you would need
to do if you were running independent samples t tests. ANOVA’s null hypoth-
esis is that no single pair of means is signifi cantly diff erent. Because multiple
pairs of group means are being tested, ANOVA uses the F test statistic, and the
signifi cance level (sometimes referred to as the p value) that appears on the
output in this F test is the probability of support for the null hypothesis. Here is an example that will help you to understand how ANOVA works
and when to use it. A major department store conducts a survey. One of the
ANOVA is used when comparing the means of three or more groups.
ANOVA will “signal” when at least one pair of means has a statistically signifi cant difference, but it does not tell which pair.
ANOVA is a “green light” procedure that
signals when at least one pair of means is
signifi cantly diff erent.
© E
ray
Kul
a/S
hutt
erst
ock
M13_BURN3261_08_GE_C13.indd 364M13_BURN3261_08_GE_C13.indd 364 17/08/16 4:06 pm17/08/16 4:06 pm

13-4 TESTING FOR SIGNIFICANT DIFFERENCES IN MEANS AMONG MORE THAN TWO GROUPS: ANALYSIS OF VARIANCE 365
questions on the survey is “In what department did you last make a purchase for over $250?”
There are four departments where signifi cant numbers of respondents made these purchases:
(1) electronics, (2) home and garden, (3) sporting goods, and (4) automotive. Another ques-
tion on the survey is “How likely are you to purchase another item for over $250 from that
department?” The respondents indicate how likely they are to do this on a 7-point scale where
1 = Very unlikely to 7 = Very likely. It is easy to calculate the mean of how likely each group is
to return to the department store and purchase another major item from that same department.
The researcher who is doing the analysis decides to compare these means statistically, so six
diff erent independent samples t tests of the signifi cance of the diff erences are performed. A sum-
mary of the fi ndings is found in Table 13. 1 . On examining the table, you will see that the automo-
tive department’s mean is signifi cantly diff erent and lower than the repurchase likelihood means
of the other three departments. Also, there is no signifi cant diff erence in the other three department
buyers’ means. In other words, there is a good indication that the customers who bought an item
for more than $250 from the department store’s automotive department are not as satisfi ed with
the purchase as are customers who bought large-ticket items from any of the other departments. Now, look at Table 13. 2 . It is an abbreviated ANOVA output. Instead of looking at several
signifi cance values as in Table 13. 1 , all the researcher needs to do is to look at the signifi cance
level (Sig.) for the F test, our signal light. It is .000, which is less than .05, meaning that there
is at least one pair of means with a signifi cant diff erence, so the researcher has the green light
to spend time and eff ort to look at the next table to fi nd the signifi cant diff erence(s). This table
is arranged so the means that are not signifi cantly diff erent fall in the same column, while
those that are signifi cantly diff erent fall in separate columns, and each column is identifi ed
as a unique subset. The means are arranged in the second table from the lowest mean to the
highest mean, and it is immediately apparent that the automotive department has a problem.
TABLE 13. 1 Results of 6 Independent Samples t Tests of How Likely Customers Are to Return to Make Their Next Major Purchase
Groups Compared Group Means* Signifi cance
Electronics: Home and Garden 5.1: 5.3 .873
Electronics: Sporting Goods 5.1: 5.6 .469
Electronics: Automotive 5.1: 2.2 .000
Home and Garden: Sporting Goods 5.3: 5.6 .656
Home and Garden: Automotive 5.3: 2.2 .000
Sporting Goods: Automotive 5.6: 2.2 .000
*Based on a scale where 1 = Very unlikely to 7 = Very likely.
Signifi cant
diff erence
between the
two compared
groups
F Sig.
226.991 .000
Department Subsets*
1 2
Automotive 2.2
Electronics 5.1
Home and Garden 5.3
Sporting Goods 5.6
*Means in the same column are not signifi cantly different; means in different columns are signifi cantly different.
There is a signifi cant diff erence
between at least two groups
We have a problem with the
Automotive Department!
The Sig. value in the ANOVA table indicates the level of signifi cance.
TABLE 13. 2 Results of ANOVA of How Likely Customers Are to Return to Make Their Next Major Purchase
M13_BURN3261_08_GE_C13.indd 365M13_BURN3261_08_GE_C13.indd 365 17/08/16 4:06 pm17/08/16 4:06 pm

366 CHAPTER 13 • IMPLEMENTING BASIC DIFFERENCES TESTS
ANOVA has two distinct advantages over performing multiple independent sample t tests of the signifi cance of the diff erence between means. First, it immediately notifi es the
researcher if there is any signifi cant diff erence, because all he or she needs to do is to look at
the Sig. value, our green signal light. Second, in our example, it arranges the means so the
signifi cant diff erences can be located and interpreted easily. To elaborate, this Sig(nifi cance) value is the green light that we referred to earlier. When
the light is green, the researcher is then justifi ed at looking at the second table to fi nd which
means are signifi cantly diff erent. Once you learn how to read SPSS ANOVA output, it is quite
easy to identify these cases. Of course, if the F statistic p value stoplight is not green, meaning
that the p value is greater than .05, it is a waste of time to look at the diff erences between the
pairs of means, as no diff erence will be statistically signifi cant at the 95% level of confi dence.
POST HOC TESTS: DETECT STATISTICALLY SIGNIFICANT DIFFERENCES AMONG GROUP MEANS As we mentioned earlier, post hoc tests are options that are available to determine where the
pair(s) of statistically signifi cant diff erences between the means exist(s). As you will soon
see in our SPSS example, there are over a dozen of these to choose from, including Scheff e’s
and Tukey’s that you may recognize from your statistics course. It is beyond the scope of this
book to provide a complete delineation of the various types of tests. Consequently, only one
test, Duncan’s multiple range test , will be shown as an illustration of how the diff erences
may be determined. Duncan’s multiple range test provides output that is mostly a “picture”
of what means are signifi cantly diff erent, and it is much less statistical than most of the other
post hoc tests, so we have chosen to use it here for these reasons. The picture provided by the
Duncan’s post hoc test is the arrangement of the means as you saw them in Table 13. 2 . To illustrate how running ANOVA is much more effi cient and convenient than perform-
ing successive independent sample diff erences tests, we have composed Marketing Research
Insight 13. 3 , which describes a survey that measured how accepting consumers in 15 diff erent
countries are of six types of innovative new products.
INTEGRATED CASE
Auto Concepts: How to Run Analysis of Variance on SPSS In the Auto Concepts survey, there are several categorical variables that have more than two
groups. For example, there are fi ve education categories: less than high school diploma, high
school diploma, some college, college degree, and postgraduate degree.
One-way ANOVA uses only one grouping variable and, in this case, is done under the
ANALYZE-COMPARE MEANS-ONE-WAY ANOVA menu command sequence illustrated
in Figure 13. 4 . A window opens to set up the ANOVA analysis. The “Dependent list” is where
you click in the variable(s) pertaining to the means, while the “Factor” variable is the group-
ing variable. In our example, the preference for the fi ve-seat economy gasoline model is our
dependent variable, and the “Age category” is the grouping variable. Figure 13. 4 also shows
how to select Duncan’s Multiple Range option under the Post Hoc … Tests menu. Returning
to the selection window and clicking OK commences the ANOVA procedure.
Figure 13. 5 is an annotated ANOVA output. The fi rst table contains a number of interme-
diate and additional computational results, but our attention should be focused on the “Sig.”
column. Here is the support for the null hypothesis that not one pair of means is signifi cantly
diff erent. Since the Sig. value is .000, we are assured that there is at least one signifi cantly
diff erent pair. The next table is the Duncan’s test output. Specifi cally, the table is arranged so
the means ascend in size from top left to right bottom, and the columns represent subsets of
groups that are signifi cantly diff erent from groups in the other columns. You can immediately
see that “18 to 24” (1.80) is the lowest group average, and it is signifi cantly diff erent from all
other age groups because it occupies a column by itself. Similarly, looking at the next column,
Using ANOVA is much more advantageous than running multiple t tests of the signifi cance of the difference between means.
Duncan’s multiple range test is our preferred post hoc test because its presentation is easy to interpret.
To run analysis of variance with SPSS, use the ANALYZE-COMPARE MEANS-ONE-WAY ANOVA menu command sequence.
IBM SPSS Student Assistant: Applying ANOVA (Analysis of Variance)
M13_BURN3261_08_GE_C13.indd 366M13_BURN3261_08_GE_C13.indd 366 17/08/16 4:06 pm17/08/16 4:06 pm

13-4 TESTING FOR SIGNIFICANT DIFFERENCES IN MEANS AMONG MORE THAN TWO GROUPS: ANALYSIS OF VARIANCE 367
ANOVA to the Rescue: How Accepting of Innovative Products Are Consumers in Different Countries? No doubt you have become accustomed to encountering new, improved, and sometimes radically different products on a regular basis. Perhaps you are an eager adopter of such inno-vations; however, not everyone welcomes change or desires to learn and adopt new products and services. Researchers suspected that acceptance of innovative products differed by country because some countries, such as India and Japan, have long histories and deeply ingrained traditions while other coun-tries, such as the United States and Australia that have been in existence for a much shorter time, have cultural values that favor progress and change. These researchers 10 conducted a very ambitious survey that took place in 15 different countries and sampled 5,569 respondents, or about 370 in each coun-try. A key measure in the study was the degree of openness to innovative products or “eagerness to adopt” new products and services. However, the study was complicated by the fact that different product categories were used. Thus, for each coun-try, the researchers determined the average eagerness to adopt home appliances, automobiles, cosmetics, food products, sporting goods, and fi nancial services. The following fi gure is very busy, but it communicates all of the averages computed
in the study—15 countries with six product categories plus an overall average.
For any one product category, such as home appliances, determining signifi cant differences in the eagerness to adopt measure between countries would require a total of 105 separate independent samples tests (e.g., Brazil:Australia; Brazil:Canada, etc.). For the six product categories plus the overall average, there would need to be 7 × 10⁵, or 735, sepa-rate independent samples average differences tests! Now, you might ask why not just use the country average measure and keep it down to 105, but by looking at the fi gure, it is apparent that some products such as food items tend to have high eager-ness averages across all countries, while other products such as cosmetics tend to have low eagerness to adopt averages, and these important product differences would be lost by just looking at the country averages. Thus, all 735 comparisons are necessary. It is easy to see that ANOVA is a huge time saver and a much more convenient analysis to use here because it takes only seven ANOVAs (one per product category and one more for the country total) to accomplish the 735 different compari-sons of each country average to all other country averages.
MARKETING RESEARCH INSIGHT 13. 3 Global Application
Sing
apor
e
Indi
a
Kore
a
Fran
ce Italy
Japa
n
Germ
any
Unite
d St
ates
Neth
erla
nds
Unite
d Ki
ngdo
m
Chin
a
Braz
il
Swed
en
Aust
ralia
Cana
da
Acceptance of Innovative Products by CountryHome appliancesAutomobilesCosmeticsFoodSporting goodsFinancial servicesCountry Average
Acceptance of Innovative Products Across 15 Countries
M13_BURN3261_08_GE_C13.indd 367M13_BURN3261_08_GE_C13.indd 367 17/08/16 4:06 pm17/08/16 4:06 pm

368 CHAPTER 13 • IMPLEMENTING BASIC DIFFERENCES TESTS
you can see two age groups have means that are not signifi cantly diff erent: 25 to 34 (2.71)
and 35 to 49 (3.10). Next, the 50 to 64 (4.00) age group is in a column by itself, so it is signifi -
cantly diff erent from all other age groups, and fi nally we can see that the mean of the “65 and
older” age is signifi cantly diff erent from all other education groups, and its mean is 4.84. Plus,
since this column is the one on the far right, it is the one with the highest average. We have
FIGURE 13.4 IBM SPSS Clickstream to Perform Analysis of Variance (ANOVA)
Source: Reprint Courtesy of International Business Machines Corporation, © International Business Machines Corporation.
FIGURE 13.5 IBM SPSS Output for Analysis of Variance (ANOVA)
Source: Reprint Courtesy of International Business Machines Corporation, © International Business Machines Corporation.
M13_BURN3261_08_GE_C13.indd 368M13_BURN3261_08_GE_C13.indd 368 17/08/16 4:06 pm17/08/16 4:06 pm

13-6 DIFFERENCES BETWEEN TWO MEANS WITHIN THE SAME SAMPLE (PAIRED SAMPLE) 369
found that the people in the highest age group market segment most prefer the fi ve-seat econ-
omy gasoline model. Now, let’s think about this fi nding a bit. Most likely the consumers in
the oldest age group are suspicious of the power of an electric or a hybrid fuel vehicle and/or
they are resistant to changing from gasoline power, which they have used for several decades.
INTERPRETING ANOVA (ANALYSIS OF VARIANCE) How do we interpret this fi nding? The answer lies in our knowledge that if we replicated this
survey hundreds of times, we would fi nd these age group diff erences exactly as we have found
them with this one survey. Granted, the averages’ values might shift slightly up or down, but the
pattern portrayed in the Duncan’s multiple range test table in Figure 13. 5 would appear in at
least 95% of these replications. Further, we can say that we have discovered a meaningful diff er-
ences fi nding with the “65 and older” age group’s mean of 4.84, which is on the positive side of
the preference scale and quite a bit higher than the 1.80–4.00 range of the four youngest groups.
To learn about analysis of variance, launch www.
youtube.com , and search for “One-Way ANOVA Using SPSS.”
Of several possible post hoc tests with ANOVA, we have used Duncan’s multiple range test as an illustration with the Auto Concepts survey data.
Active Learning
Perform Analysis of Variance with SPSS
Let’s investigate age group means differences across all of the models under consideration at this time by Auto Concepts. We recommend that you use the Auto Concepts.sav dataset and run the ANOVA just described. Make sure that your SPSS output looks like that in Figure 13. 5 . Then investigate the preference mean differences for the other hybrid models by age group.
13- 5 Reporting Group Differences Tests to Clients Finding signifi cant diff erences is exciting to marketing researchers because it means that the
researcher will have something that is potentially very useful to report to the client. Remem-
ber, market segmentation is very prevalent, and whenever signifi cant diff erences are found,
they may represent important market segmentation implications. However, in the bowels of a
long marketing research report, diff erences may not be obvious to the client, especially if the
researcher does not take care to highlight them. Marketing Research Insight 13. 4 describes
how researchers can use table organization and arrangement to present diff erences fi ndings in
a succinct and useful manner.
The reporting of fi ndings has a signifi cant ethical burden for the marketing researcher, as
he or she cannot choose to report only “good news” to the client. Read the MRA ethical code
section in Marketing Research Insight 13. 5 . You will fi nd that researchers are charged with the
responsibility of reporting “bad news” if it is discovered in the fi ndings.
13- 6 Differences Between Two Means Within the Same Sample (Paired Sample) There is a fi nal diff erence test to describe that is not used for market segmentation purposes.
Occasionally, a researcher will want to test for diff erences between the means for two vari-
ables within the same sample. For example, in our pharmaceuticals company cold remedy
situation described earlier in this chapter, a survey can be used to determine “How important
is it that your cold remedy relieves your ____?” using a scale of 1 = Not important to 10 =
Very important for each cold symptom. The question then becomes whether any two average
importance levels are signifi cantly diff erent. To determine the answer to this question, we
must perform a paired samples test for the diff erence between two means , which is a test to
determine if two means of two diff erent questions using the same scale format and answered
by the same respondents in the sample are signifi cantly diff erent. Of course, the variables
must be measured on the same scale; otherwise, the test would be analyzing diff erences
M13_BURN3261_08_GE_C13.indd 369M13_BURN3261_08_GE_C13.indd 369 17/08/16 4:06 pm17/08/16 4:06 pm

370 CHAPTER 13 • IMPLEMENTING BASIC DIFFERENCES TESTS
Guidelines for the Reporting of Differences Tests In reporting group differences to clients, marketing researchers usually construct a group comparison table that summarizes the signifi cant differences in an effi cient manner. In the case of two-group comparison tables, the presentation is made side by side where the groups are columns and the rows are the vari-ables where signifi cant differences are found. Depending on the objectives of the research, it is perfectly acceptable to com-bine percentage differences and mean differences in the same table. Of course, it is incumbent on the marketing researcher to design a table that communicates the differences with a mini-mum of confusion. Study the following example of two group differences found in a survey for the Subshop.
Diff erences Between Female and Male Customers of the Subshop* Item Females Males
Menu Items Typically Purchased
Alcoholic beverage 14% 37%
Large size sandwich 24% 59%
Salad 53% 13%
Rating of the Subshop**
Value for the price 5.2 6.1
Fast service 4.5 5.2
Overall Satisfaction with the Subshop*** 4.9 5.5
Use Subshop Promotions
Use Subshop coupons 23% 5%
Belong to Subshop frequent buyer club 33% 12%
*Statistically signifi cant at 95% level of confi dence.
**Based on a rating scale where 1 = Poor to 7 = Excellent.
***Based on a rating scale where 1 = Very unsatisfi ed to 7 = Very satisfi ed.
In this group comparison table, it can be immediately seen that male and female customers of the Subshop are being com-pared and that there are four areas of comparison: menu items
purchased, ratings of the Subshop’s features, overall satisfac-tion, and use of promotions.
When the researcher is reporting differences found from ANOVA, the table presentation becomes more challenging, as there can be overlap of nonsignifi cant differences and sig-nifi cant differences. For the purposes of this textbook , we rec-ommend that the researcher use a modifi cation of Duncan’s multiple range post hoc table.
Subshop Performance Diff erences Between Customer Types* Subshop Feature**
Sit-Down Customers
Take-Out Customers
Drive-Through Customers
Fast service 5.4 |----------6.2-------------|
Value for the price
6.2 5.5 5.0
Friendly employees
5.1 |----------4.0-------------|
*Statistically signifi cant at 95% level of confi dence.
**Based on a rating scale where 1 = Poor to 7 = Excellent.
In this group comparison table, three types of customers are being compared, and the researcher has found signifi cant dif-ferences for three different Subshop features. With the fast service rating, the take-out and drive-through customer groups are not different, but the sit-down customers rate the service slower than either of the other groups. With value for the price, all three group means are signifi cantly different, while the sit-down customers’ average rating for friendly employees is higher than the average for the take-out and drive-through customers, which are not signifi cantly different. Notice that where nonsignifi cant differences are reported, the group cells are merged and the average of the two groups combined is indicated so the client will not focus on nonsignifi cant arithme-tic differences.
MARKETING RESEARCH INSIGHT 13. 4 Practical Application
Marketing Research Association Code of Ethics: Reporting Findings 37. Report research results accurately and honestly.
During data analysis and presentation of fi ndings, research-ers must strive for objectivity so that the data “speak for themselves.” Such objectivity need not preclude the for-mation of researchers’ own opinions or recommendations
regarding fi ndings. Instead, objectivity means that research-ers analyze data impartially and let their opinions and rec-ommendations be guided by the results of those analyses, rather than tailoring analyses to support preconceived agendas or biases.
MARKETING RESEARCH INSIGHT 13. 5 Ethical Consideration
Source: Used courtesy of the Marketing Research Association.
M13_BURN3261_08_GE_C13.indd 370M13_BURN3261_08_GE_C13.indd 370 17/08/16 4:06 pm17/08/16 4:06 pm

13-6 DIFFERENCES BETWEEN TWO MEANS WITHIN THE SAME SAMPLE (PAIRED SAMPLE) 371
between variables that are logically incomparable, such as the number of dollars spent versus
the number of miles driven. Because the same respondents answered both questions, you do not have two indepen-
dent groups. Instead, you have two independent questions with one group. The logic and
equations we have described still apply, but there must be an adjustment factor because there
is only one sample involved. We do not provide the equations, but in the following SPSS sec-
tion we describe how to perform and interpret a paired samples t test. 11
INTEGRATED CASE
The Auto Concepts Survey: How to Perform a Paired Samples t Test Signifi cance of Differences Between Means Test with SPSS With the paired samples test, we can test the signifi cance of the diff erence between the mean
of any two questions by the same respondents in our sample. Let’s consider a critical ques-
tion that Auto Concepts may have to address: Are worries about global warming and gasoline
emissions contributing to global warming the same? If they are not statistically signifi cant in
their diff erences, the diff erence will evaporate in the face of a single replication of the survey.
Using a paired samples diff erence test, you can determine the statistical signifi cance.
The SPSS clickstream sequence to perform a paired samples t test of the signifi cance
of the diff erence between means is displayed in Figure 13. 6 . As you can see, you begin with
the ANALYZE-COMPARE MEANS-PAIRED SAMPLES T-TEST … menu sequence.
This sequence opens up the selection menu, and via cursor clicks, you can select “I am wor-
ried about global warming” and “Gasoline emissions contribute to global warming” as the
variable pair to be tested. This sets up the t test, and a click on OK executes it. The resulting annotated output is found in Figure 13. 7 . You should notice that the table
is similar, but not identical, to the independent samples output. The relevant information
includes (1) 1,000 respondents gave answers to each statement and were analyzed; (2) the
You can test the signifi cance of the difference between two means for two different questions answered by the same respondents using the same scale.
To test the signifi cance of difference between two means for questions answered by the same respondents, use the SPSS ANALYZE-COMPARE MEANS-PAIRED SAMPLES T-TEST … menu sequence.
FIGURE 13.6 IBM SPSS Clickstream to Obtain a Paired Samples t Test
Source: Reprint Courtesy of International Business Machines Corporation, © International Business Machines Corporation.
M13_BURN3261_08_GE_C13.indd 371M13_BURN3261_08_GE_C13.indd 371 17/08/16 4:06 pm17/08/16 4:06 pm

372 CHAPTER 13 • IMPLEMENTING BASIC DIFFERENCES TESTS
means for worry about global warming and gasoline emissions contributing to global warm-
ing are 4.88 and 4.62, respectively; (3) the computed t value is 8.6; and (4) the two-tailed sig-
nifi cance level is 0.000. In words, the test gives almost no support for the null hypothesis that
the means are equal. So, on average, people agree with both statements, but they have stronger
agreement with their worry about global warming than with a belief that gasoline emissions
contribute to global warming.
13- 7 Null Hypotheses for Differences Tests Summary Because we realize that it is confusing to keep in mind the null hypothesis, to understand all
the equations, and to fi gure out how to interpret the fi ndings for various diff erences tests, we
have provided a table that describes the null hypothesis for each type of group diff erences test
that is described in this chapter. Refer to Table 13. 3 .
FIGURE 13.7 IBM SPSS Output for a Paired Samples t Test
Source: Reprint Courtesy of International Business Machines Corporation, © International Business Machines Corporation.
TABLE 13. 3 Null Hypotheses for Differences Tests
Null Hypothesis What Does It Mean If the Hypothesis Is Not Supported?
Differences Between Two Group Percentages
No diff erence exists between the percentages of the two groups
(populations).
A diff erence does exist between the percentages of the two
groups (populations).
Differences Between Two Group Percentages
No diff erence exists between the means of the two groups
(populations).
A diff erence does exist between the means of the two groups
(populations).
Differences in Means Among More Than Two Groups (ANOVA)
No diff erence exists among the means of all paired groups
(populations).
A diff erence exists between the means of at least one pair of
groups (populations).
Differences Between Means for Two Variables (Paired Sample)
No diff erence exists between the means of the two variables. A diff erence does exist between the means of the two variables.
IBM SPSS Student Assistant: Assessing Differences Between Means for Two Questions (Paired)
M13_BURN3261_08_GE_C13.indd 372M13_BURN3261_08_GE_C13.indd 372 17/08/16 4:06 pm17/08/16 4:06 pm

REVIEW QUESTIONS/APPLICATIONS 373
Summary
Diff erences matter to marketing managers. Basically,
market segmentation implications underlie most dif-
ferences analyses. It is important that diff erences are
statistically signifi cant, but it is also vital that they are
meaningful and stable as well as an actionable basis of
marketing strategy.
Diff erences between two percentages or means in two
samples can be tested for statistical signifi cance. The chap-
ter illustrates how to determine if two percentages drawn
from two diff erent samples are signifi cantly diff erent. The
t test procedure in SPSS is used to test the signifi cance of
the diff erence between two means from two independent
samples. This chapter presented an illustration of how to
use SPSS for this analysis using the Auto Concepts dataset.
When a researcher has more than two groups and
wishes to compare their various means, the correct proce-
dure involves analysis of variance (ANOVA). ANOVA is
a signaling technique that tests all possible pairs of means
for all the groups involved and indicates via the Sig. (sig-
nifi cance) value in the ANOVA table if at least one pair is
statistically signifi cant in its diff erence. If the Sig. value is
greater than .05, the researcher will inspect the means for
diff erences. But if the Sig. value is .05 or less, the researcher
can use a post hoc procedure such as Duncan’s multiple
range test to identify the pair or pairs of groups where the
means are signifi cantly diff erent. Finally, you learned about
a paired samples test and how to perform and interpret it
using SPSS.
Key Terms
Statistical signifi cance of diff erences
(p. 352 )
Meaningful diff erence (p. 352 )
Stable diff erence (p. 353 )
Actionable diff erence (p. 353 )
t test (p. 354 )
z test (p. 354 )
Null hypothesis (p. 355 )
Signifi cance of diff erences between
two percentages (p. 355 )
Signifi cance of diff erence between
two means (p. 358 )
ANOVA (analysis of variance)
(p. 364 )
Green light procedure (p. 364 )
Post hoc tests (p. 366 )
Duncan’s multiple range test (p. 366 )
One-way ANOVA (p. 366 )
Group comparison table (p. 370 )
Paired samples test for the diff erence
between two means (p. 369 )
Review Questions/Applications
13- 1. What are differences and why should market
researchers be concerned with them? Why are mar-
keting managers concerned with them?
13- 2. What is meant by statistical signifi cance of diff er-ences? How does this notion underpin marketing
research?
13- 3. When a market researcher compares the responses
of two identifiable groups with respect to their
answers to the same question, what is this called?
13- 4. With regard to diff erences tests, briefl y defi ne and
describe each of the following:
a. Null hypothesis
b. Sampling distribution
c. Signifi cant diff erence
13- 5 . Relate the formula and identify each formula’s
components in the test of signifi cant diff erences
between two groups when the question involved is
a. A “yes/no” type
b. A scale variable question
13- 6. For each of the following three cases (a–c), are the
two sample results signifi cantly diff erent?
Sample One Sample TwoConfi dence Level
Your Finding
a. Mean: 10.6 Mean: 11.7 95%
Std. dev:1.5 Std. dev: 2.5
n = 150 n = 300
b. Percent: 45% Percent: 54% 99%
n = 350 n = 250
c. Mean: 1500 Mean: 1250 95%
Std. dev: 550 Std. dev: 500
n = 1200 n = 500
13- 7. When should one-way ANOVA be used and why?
13- 8 . When a researcher fi nds a signifi cant F value in an
analysis of variance, why may it be considered a
“green light” device?
13- 9. Why should a market researcher use a paired sam-ples test? What does it s how?
M13_BURN3261_08_GE_C13.indd 373M13_BURN3261_08_GE_C13.indd 373 30/08/16 10:57 am30/08/16 10:57 am

374 CHAPTER 13 • IMPLEMENTING BASIC DIFFERENCES TESTS
13- 10 . The circulation manager of the Daily Advocate
newspaper commissions a market research study
to determine what factors underlie its circulation
attrition. Specifi cally, the survey is designed to
compare current Daily Advocate subscribers with
those who dropped their subscriptions in the past
year. A telephone survey is conducted with both
sets of individuals. Following is a summary of the
key fi ndings from the study. Interpret these fi nd-
ings for the circulation manager.
ItemCurrent Subscribers
Lost Subscribers Signifi cance
Length of
residence in
the city
20.1 yr 5.4 yr .000
Length of time
as a subscriber
27.2 yr 1.3 yr .000
Watch local
TV news
program(s)
87% 85% .372
Watch
national news
program(s)
72% 79% .540
Obtain news
from the
Internet
13% 23% .025
Satisfaction*
with…
Delivery of
newspaper
5.5 4.9 .459
Coverage of
local news
6.1 5.8 .248
Coverage of
national news
5.5 2.3 .031
Coverage of
local sports
6.3 5.9 .462
Coverage of
national sports
5.7 3.2 .001
Coverage of
local social
news
5.8 5.2 .659
Editorial
stance of the
newspaper
6.1 4.0 .001
Value for
subscription
price
5.2 4.8 .468
*Based on a 7-point scale where 1 = Very dissatisfi ed to 7 = Very satisfi ed.
13- 11. A researcher is investigating different types
of customers for a sporting goods store. In
a survey, respondents are asked to use their
Fitbit devices to indicate how much they exer-
cised last week using categories of “Less than
1 hour,” “Between 1 and 2 hours,” “Between 2 and
3 hours,” and so on. These respondents have
also rated the performance of the sporting goods
store across 12 different characteristics, such
as good value for the price, convenience of loca-
tion, helpfulness of the sales clerks, and so on.
The researcher used a 7-point rating scale for
these 12 characteristics where 1 = Poor perfor-
mance to 7 = Excellent performance. How can
the researcher investigate diff erences in the rat-
ings based on the amount of exercise reported by
the respondents?
13- 12. A marketing manager of newegg, a web-based
electronic products sales company, uses a
segmentation scheme based on the incomes
of target customers. The segmentation system
has four segments: (1) low income, (2) moder-
ate income, (3) high income, and (4) wealthy.
The company database holds information on
customers’ purchases over the past several
months. Using Microsoft Excel on this database,
the marketing manager finds that the average
total dollar purchases for the four groups are as
follows.
Market Segment Average Total Dollar Purchases
Low income $101
Moderate income $120
High income $231
Wealthy $595
Construct a table that is based on the Duncan’s
multiple range test table concept discussed in the
chapter that illustrates that the low- and moderate-
income groups are not different from each other, but
the other groups are significantly different from one
another.
M13_BURN3261_08_GE_C13.indd 374M13_BURN3261_08_GE_C13.indd 374 17/08/16 4:06 pm17/08/16 4:06 pm

REVIEW QUESTIONS/APPLICATIONS 375
CASE 13. 1
L’Experience Félicité Restaurant Survey Differences Analysis
(For necessary background on this case, read Case 12. 1 on
page 346 .)
Cory Rogers of CMG Research called a meeting with
Jeff Dean, the client who needed research on the demand for
a new, upscale restaurant to possibly be called L’Experience
Félicité , with marketing intern, Christine Yu, attending. Cory
began the meeting with a review of the research objectives
agreed to by Jeff . After about 20 minutes, Christine listed the
six following questions in which Jeff was especially interested.
Your task in this case is to take Christine’s role. Using
the L’Experience Félicité Restaurant survey SPSS dataset,
perform the proper analysis and interpret the fi ndings for
each of the following questions.
1. Jeff wonders if L’Experience Félicité Restaurant is
more appealing to women than it is to men or vice
versa. Perform the proper analysis, interpret it, and
answer Jeff ’s question.
2. With respect to the location of L’Experience Félicité
Restaurant, is a waterfront view preferred more than a
drive of less than 30 minutes?
3. With respect to the restaurant’s atmosphere, is a string
quartet preferred over a jazz combo?
4. What about unusual entrées versus unusual desserts?
5. In general, upscale establishments are more appeal-
ing to higher-income households than they are to
lower-income households. Is this pattern the case for
L’Experience Félicité Restaurant?
6. Jeff and Cory speculated that the diff erent geographic
areas that they identifi ed by ZIP codes would have dif-
ferent reactions to the prospect of patronizing a new
upscale restaurant. Are these anticipated diff erences
substantiated by the survey? Perform the proper analy-
sis and interpret your fi ndings.
CASE 13. 2 INTEGRATED CASE
The Auto Concepts Survey Differences Analysis Cory Rogers of CMG Research called a meeting with Nick
Thomas, and Celeste Brown, CMG analyst, attended it.
After meeting for about 20 minutes, Celeste understood
that the Auto Concepts principals were encouraged by the
fi ndings of the survey, which indicate that there is substan-
tial demand for the various types of futuristic high-mileage
automobiles under consideration. Depending on develop-
ment costs, prices, and other fi nancial considerations, it
seems that any one model or any combination of the new
automobile models could be a viable option. The next step
in their planning is to identify the target market for each
automobile model type under consideration. This step is
crucial to market strategy because the more precise the tar-
get market defi nition is, the more specifi c and pinpointed
the marketing strategy can be. For a fi rst cut at the market
segment descriptions, the survey included the following
commonly used demographic factors:
• Hometown size category
• Gender
• Marital status
• Age category
• Education category
• Income category
Your task is to apply appropriate diff erences analysis
using the survey’s desirability measures in your Auto Con-
cepts SPSS dataset to determine the target market descrip-
tions for each of the fi ve possible automobile models.
1. “Super Cycle,” One-Seat All Electric, mpg-e rating
125; estimated MSRP (manufacturer’s suggested retail
price) $30,000; range 200 miles.
2. “Runabout Sport,” Two-Seat All Electric, mpg-e 99;
estimated MSRP $35,000; range 150 miles.
3. “Runabout Hatchback,” Two-Seat Gasoline Hybrid,
mpg-e 50; runs on battery for 50 miles and then switches
to gas engine; estimated MSRP $35,000; range 250 miles.
4. “Economy Hybrid,” Four-Seat Diesel Hybrid, mpg-e 75;
runs on battery for 75 miles and then switches to effi cient
diesel engine; estimated MSRP $38,000; range 300 miles.
5. “Economy Gasoline,” Five-Seat Economy Gasoline, mpg
36; runs on gasoline with computer control for maximum
effi ciency; estimated MSRP $37,000; range 350 miles.
M13_BURN3261_08_GE_C13.indd 375M13_BURN3261_08_GE_C13.indd 375 17/08/16 4:06 pm17/08/16 4:06 pm

▶
LEARNING OBJECTIVES In this chapter you will learn:
14- 1 The types of relationships between two variables
14- 2 How relationships between two variables may be characterized
14- 3 What correlation coeffi cients and covariation are
14- 4 About the Pearson Product Moment Correlation Coeffi cient and how to obtain it in with SPSS
14- 5 The way to report correlation fi ndings to clients
14- 6 What cross-tabulations are and how to compute them
14- 7 Chi-square analysis and how it is used in cross-tabulation analysis
14- 8 The way to report cross-tabulation fi ndings to clients
14- 9 Special considerations when performing association analyses such as correlations and cross-tabulations
“WHERE WE ARE”
1 Establish the need for marketing
research.
2 Defi ne the problem.
3 Establish research objectives.
4 Determine research design.
5 Identify information types and sources.
6 Determine methods of accessing data.
7 Design data collection forms.
8 Determine the sample plan and size.
9 Collect data.
10 Analyze data.
11 Prepare and present the fi nal
research report.
iModerate
iModerate is a consumer insights fi rm that
helps clients become fl uent in their audiences
through a deeper understanding of consum-
ers’ motivations, needs, and language. Most
companies today are employing some combi-
nation of listening, asking, and observing to
learn more about their consumers. Whether
that means monitoring what consumers say
on social networks, looking at the reviews left
on websites, employing surveys, or crunching
behavioral data, there is no shortage of infor-
mation streams and feedback mechanisms.
However, the information gathered is often incomplete and diffi cult to
tie together.
At iModerate, they believe that without understanding the “why”
behind consumer behavior, it’s challenging to pinpoint how to move for-
ward. Without a complete picture of the consumer, companies often attend
to the wrong problem, misread the market, and push forward haphazardly.
Using solutions ranging from next-generation text analytics to one-
on-one consumer engagements, iModerate helps clients get to know
their consumers inside and out. The more companies know about their
consumers, the better they can cater to them, the more loyalty they can
build, and the more impact they can have on the bottom line.
A cognitive framework called ThoughtPath informs the way that
the fi rm engages with its clients at each step of the research process,
from design through reporting. Rooted in key elements of cognitive
psychology—perception, experience, and identity—and informed by
results from more than 200,000 consumer conversations, ThoughtPath is
the backbone of everything they do at iModerate. Because it taps into how
people naturally think, it’s a useful guide to asking smarter, more engaging
questions and the key to discovering deeper, more relevant insights.
14 Making Use of Associations Tests
Adam Rossow, partner,
head of marketing,
iModerate
M14_BURN3261_08_GE_C14.indd 376M14_BURN3261_08_GE_C14.indd 376 30/08/16 11:05 am30/08/16 11:05 am

377
The fi rm’s products include the following:
(iM)pact One-On-Ones are professionally moderated individual conversations
conducted online, which enable talking to consumers with complete anonym-
ity, thereby creating an ideal environment for unveiling honest responses. The
one-on-one setting allows moderators to utilize ThoughtPath, prompting richer,
more relevant consumer responses to bring hidden knowledge to the forefront.
Whether conducted as a survey add-on or as a stand-alone, in-depth interview,
these online, text-based conversations help clients fill the holes created by big data
and other noncontextual information sources. Used on an ongoing basis, they help
establish consumer intimacy, spot buying and acceptance trends, predict product
receptivity, observe how outside factors—seasons, competitor moves, news events—
impact consumers, and even anticipate behavior changes.
(iM)merge Analytics helps clients collect, analyze, and distill consumer commentary
into answers rich with context. Consumers’ social chatter, open-end survey responses,
reviews, and call center transcripts can provide a starting point for understanding, but
this commentary is often difficult to distill into meaningful insights. In other cases, the
feedback clients need to answer questions isn’t accessible or simply doesn’t exist yet.
Whether the goal is to extract value from existing feedback streams or gener-
ate thoughtful questions and walk away with an answer, (iM)merge can help. This
advanced text solution takes in all forms of consumer feedback and marries human
storytelling with software’s unbiased, scalable appeal.
(iM)merse Longitudinal gives clients a continual and flexible insights solution built on
qualitative engagements with a broad swath of their target audience. A combination
of one-on-one conversations and carefully crafted open-end questions allows iModer-
ate to achieve both the depth and the scale clients need to make informed decisions.
(iM)merse differs from other traditional longitudinal activities in that it offers clients
the ability to explore, assess, and generate ideas without barriers. Unlike trackers,
(iM)merse is agile due to the ability to shift topics and areas of focus. Unlike communi-
ties, the individuals in the target audience are different every month, thereby reducing
bias and fatigue.
(iM)merse keeps a finger on the pulse of an audience. Whether it’s identifying the most
recent needs of the home cook as the basis for a new small kitchen appliance, keeping
up to speed with the language of Gen Z so tweets sound authentic, or understanding that
a hotel-sponsored wine and cheese hour might be the perfect way to engender traveler
loyalty, the benefits of an ongoing dialogue with consumers cannot be overstated.
Source: Text and photos courtesy of iModerate.com
Visit iModerate at imoderate.com
M14_BURN3261_08_GE_C14.indd 377M14_BURN3261_08_GE_C14.indd 377 17/08/16 4:07 pm17/08/16 4:07 pm

378 CHAPTER 14 • MAKING USE OF ASSOCIATIONS TESTS
This chapter illustrates the usefulness of statistical analyses beyond simple descriptive
measures, statistical inference, and differences tests. Just as iModerate is a company
that collects and analyzes hundreds of qualitative comments for insights, the analy-
ses in this chapter are applied to hundreds or thousands of quantitative data points gathered
in a survey. Often, as we have described in the opening comments of this chapter, market-
ers are interested in relationships among variables. For example, Frito-Lay wants to know
what kinds of people and under what circumstances these people choose to buy Cheetos,
Fritos, Lay’s potato chips, and any of the other items in the Frito-Lay line. The Pontiac
Division of General Motors wants to know what types of individuals would respond favor-
ably to the various style changes proposed for the Solstice. A newspaper wants to under-
stand the lifestyle characteristics of its subscribers so that it is able to modify or change
sections in the newspaper to better suit its audience. Furthermore, the newspaper desires
information about various types of subscribers so as to communicate this information to its
advertisers, helping them in copy design and advertisement placement within the various
newspaper sections. For all of these cases, there are statistical procedures available, termed
associative analyses , which determine answers to these questions.
As you learned in Chapter 8 , every scale has unique descriptors, sometimes called
levels or labels, that identify the diff erent demarcations of that scale. The term levels implies
that the scale is interval or ratio, whereas the term labels implies that the scale is, typically,
nominal. A simple label is a “yes” or “no,” for instance, if a respondent is labeled as a buyer
(yes) or nonbuyer (no) of a particular product or service. Associative analyses determine
whether a stable relationship exists between two variables; they are the central topic of this
chapter. We begin the chapter by describing the four diff erent types of relationships pos-
sible between two variables. Then we describe correlation coeffi cients, and we illustrate the
use of Pearson product moment correlations. From correlations, we move to a discussion
of cross-tabulations and indicate how a cross-tabulation can be used to determine whether
a statistically signifi cant association exists between the two variables. As in our previous
analysis chapters, we show the SPSS steps to perform these analyses and the resulting
output.
14- 1 Types of Relationships Between Two Variables A relationship is a consistent and systematic linkage between the levels for two scale vari-
ables or between the labels for two nominal variables. We use the words relationship and
association interchangeably. This linkage is statistical, not necessarily causal. A causal link-
age is one in which you are certain one variable aff ected the other one, but with a statistical
linkage you cannot be certain because some other variable might have had some infl uence.
Nonetheless, statistical linkages or relationships often provide us with insights that lead to
understanding even though they are not cause-and-eff ect relationships. For example, if we
found a relationship that most daily exercisers purchased some brand of sports drink, we
understand that the ingredients of sports drinks are important to those who want to keep fi t.
Associative analysis procedures are useful because they determine if there is a consistent
and systematic relationship between the presence (label) or amount (level) of one variable
and the presence (label) or amount (level) of another variable. There are four basic types
of relationships between two variables: linear, curvilinear, monotonic, and nonmonotonic.
A discussion of each follows.
LINEAR AND CURVILINEAR RELATIONSHIPS First, we turn to a precise form of relationship, and one that is very easy to envision. A linear relationship is a “straight-line association” between two scale variables. Here, knowledge
of the amount of one variable will automatically yield knowledge of the amount of the other
A relationship is a consistent and systematic linkage between the levels or labels for two variables.
Associative analyses determine whether stable relationships exist between two variables.
A linear relationship means the two variables have a “straight-line” relationship.
M14_BURN3261_08_GE_C14.indd 378M14_BURN3261_08_GE_C14.indd 378 17/08/16 4:07 pm17/08/16 4:07 pm

14-1 TYPES OF RELATIONSHIPS BETWEEN TWO VARIABLES 379
variable as a consequence of applying the linear or straight-line formula that is known to exist
between them. In its general form, a straight-line formula is as follows:
Formula for a straight line
y = a + bx
where
y = the dependent variable being estimated or predicted
a = the intercept
b = the slope
x = the independent variable used to predict the dependent variable
The terms intercept and slope should be familiar to you, but if they are a bit hazy, do not
be concerned as we describe the straight-line formula in detail in the next chapter. It should be
apparent to you that a linear relationship is precise and contains a good deal of information.
By simply substituting the values of a and b , an exact amount can be determined for y given
any value of x . For example, if Jack-in-the-Box estimates that every customer will spend
about $9 per lunch visit, it is easy to use a linear relationship to estimate how many dollars of
revenue will be associated with the number of customers for any given location. The follow-
ing equation would be used:
Straight-line formula example
y = $0 + $9 * number of customers
where x is the number of customers. So if 100 customers come to a Jack-in-the-Box loca-
tion, the associated expected total revenue would be $0 plus $9 times 100, or $900. If 200
customers are expected to visit the location, the expected total revenue would be $0 plus
$9 times 200, or $1,800. To be sure, the Jack-in-the-Box location would not derive exactly
$1,800 for 200 customers, but the linear relationship shows what is expected to happen on
average.
In a curvilinear relationship one variable is again associated with another variable, but
in this case the relationship is described by a curve rather than a straight line. In other words,
the formula for a curved relationship is used rather than the formula for a straight line. Many
curvilinear patterns are possible. For example, the relationship may be an S-shape, a J-shape,
or some other curved-shape pattern. Curvilinear relationships are beyond the scope of this
text; nonetheless, it is important to list them as a type of relationship that can be investigated
through the use of special-purpose statistical procedures.
MONOTONIC RELATIONSHIPS In monotonic relationships , the researcher can assign a general direction to the association
between the two variables. There are two types of monotonic relationships: increasing and
decreasing. Monotonic increasing relationships are those in which one variable increases as
the other variable increases. As you would guess, monotonic decreasing relationships are
those in which one variable increases as the other variable decreases. You should note that
in neither case is there any indication of the exact amount of change in one variable as the
other changes. Monotonic means that the relationship can be described only in a general
directional sense. Beyond this, precision in the description is lacking. For example, if a com-
pany increases its advertising, we would expect its sales to increase, but we do not know
the amount that the sales would increase. Monotonic relationships are also not in the scope
of this textbook , so we will simply mention them here as a type of relationship that can be
investigated.
A monotonic relationship means you know the general direction (increasing or decreasing) of the relationship between two variables.
A curvilinear relationship means some smooth curve pattern describes the association.
Linear relationships are quite precise.
M14_BURN3261_08_GE_C14.indd 379M14_BURN3261_08_GE_C14.indd 379 17/08/16 4:07 pm17/08/16 4:07 pm
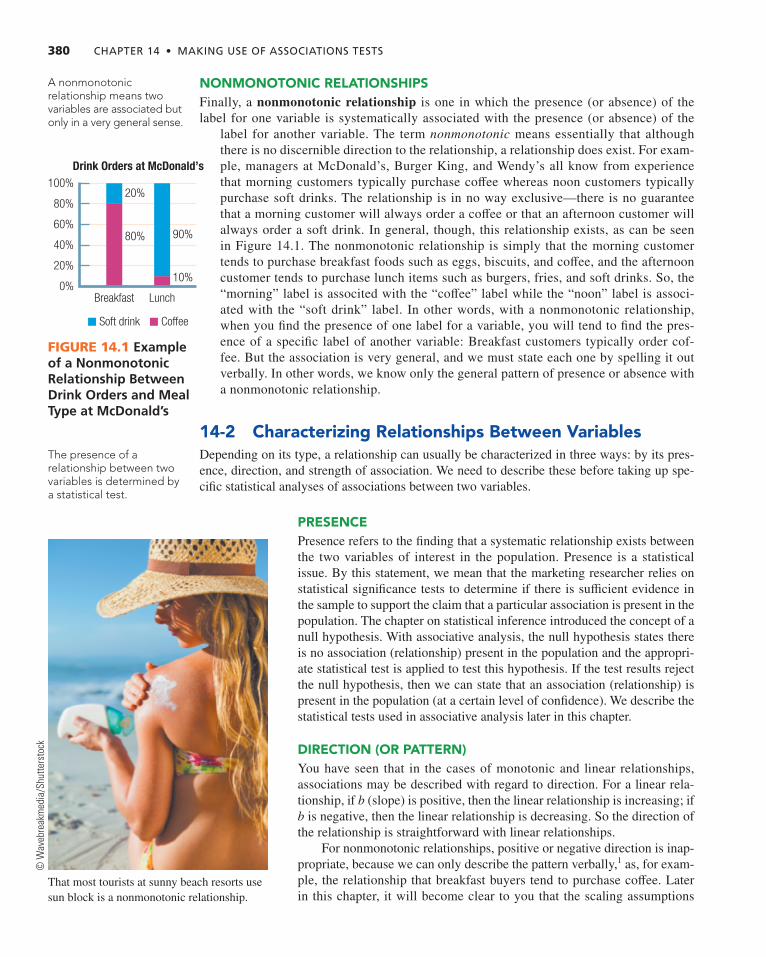
380 CHAPTER 14 • MAKING USE OF ASSOCIATIONS TESTS
NONMONOTONIC RELATIONSHIPS Finally, a nonmonotonic relationship is one in which the presence (or absence) of the
label for one variable is systematically associated with the presence (or absence) of the
label for another variable. The term nonmonotonic means essentially that although
there is no discernible direction to the relationship, a relationship does exist. For exam-
ple, managers at McDonald’s, Burger King, and Wendy’s all know from experience
that morning customers typically purchase coff ee whereas noon customers typically
purchase soft drinks. The relationship is in no way exclusive—there is no guarantee
that a morning customer will always order a coff ee or that an afternoon customer will
always order a soft drink. In general, though, this relationship exists, as can be seen
in Figure 14. 1 . The nonmonotonic relationship is simply that the morning customer
tends to purchase breakfast foods such as eggs, biscuits, and coff ee, and the afternoon
customer tends to purchase lunch items such as burgers, fries, and soft drinks. So, the
“morning” label is associted with the “coff ee” label while the “noon” label is associ-
ated with the “soft drink” label. In other words, with a nonmonotonic relationship,
when you fi nd the presence of one label for a variable, you will tend to fi nd the pres-
ence of a specifi c label of another variable: Breakfast customers typically order cof-
fee. But the association is very general, and we must state each one by spelling it out
verbally. In other words, we know only the general pattern of presence or absence with
a nonmonotonic relationship.
14- 2 Characterizing Relationships Between Variables Depending on its type, a relationship can usually be characterized in three ways: by its pres-
ence, direction, and strength of association. We need to describe these before taking up spe-
cifi c statistical analyses of associations between two variables.
PRESENCE Presence refers to the fi nding that a systematic relationship exists between
the two variables of interest in the population. Presence is a statistical
issue. By this statement, we mean that the marketing researcher relies on
statistical signifi cance tests to determine if there is suffi cient evidence in
the sample to support the claim that a particular association is present in the
population. The chapter on statistical inference introduced the concept of a
null hypothesis. With associative analysis, the null hypothesis states there
is no association (relationship) present in the population and the appropri-
ate statistical test is applied to test this hypothesis. If the test results reject
the null hypothesis, then we can state that an association (relationship) is
present in the population (at a certain level of confi dence). We describe the
statistical tests used in associative analysis later in this chapter.
DIRECTION (OR PATTERN) You have seen that in the cases of monotonic and linear relationships,
associations may be described with regard to direction. For a linear rela-
tionship, if b (slope) is positive, then the linear relationship is increasing; if
b is negative, then the linear relationship is decreasing. So the direction of
the relationship is straightforward with linear relationships.
For nonmonotonic relationships, positive or negative direction is inap-
propriate, because we can only describe the pattern verbally, 1 as, for exam-
ple, the relationship that breakfast buyers tend to purchase coff ee. Later
in this chapter, it will become clear to you that the scaling assumptions
0%Breakfast Lunch
20%
40%
80%
60%
100%20%
80% 90%
10%
Drink Orders at McDonald’s
Soft drink Coffee
FIGURE 14.1 Example of a Nonmonotonic Relationship Between Drink Orders and Meal Type at McDonald’s
A nonmonotonic relationship means two variables are associated but only in a very general sense.
That most tourists at sunny beach resorts use
sun block is a nonmonotonic relationship.
The presence of a relationship between two variables is determined by a statistical test.
© W
aveb
reak
med
ia/S
hutt
erst
ock
M14_BURN3261_08_GE_C14.indd 380M14_BURN3261_08_GE_C14.indd 380 17/08/16 4:07 pm17/08/16 4:07 pm

14-2 CHARACTERIZING RELATIONSHIPS BETWEEN VARIABLES 381
of variables having nonmonotonic association negate the directional aspects of the relation-
ship. Nevertheless, we can verbally describe the pattern of the association as we have in our
examples, and that statement substitutes for direction.
STRENGTH OF ASSOCIATION Finally, when present, that is, statistically signifi cant, the association between two variables
can be envisioned as to its strength, commonly using words such as “strong,” “moderate,”
“weak,” or some similar characterization. That is, when a consistent and systematic associa-
tion is found to be present between two variables, it is then up to the marketing researcher
to ascertain the strength of association. Strong associations are those in which there is a high
probability that the two variables will exhibit a dependable relationship, regardless of the type
of relationship being analyzed. A low degree of association, on the other hand, is one in which
there is a low probability that the two variables will exhibit a dependable relationship. The
relationship exists between the variables, but it is less evident.
There is an orderly procedure for determining the presence, direction, and strength of a
relationship, which is outlined in Table 14. 1 . As can be seen in the table, you must fi rst decide
what type of relationship can exist between the two variables of interest: nonmonotonic or
linear. As you will learn in this chapter, the answer to this question depends on the scaling
assumptions of the variables; as we will illustrate further, nominal scales can embody only
imprecise, pattern-like, relationships, but scale variables (interval or ratio) can incorporate
very precise and linear relationships. Once you identify the appropriate relationship type as
either nonmonotonic or linear, the next step is to determine whether that relationship actually
exists in the population you are analyzing. This step requires a statistical test, and we will
describe the use of correlation (for scale variables, a linear relationship) and cross-tabulation
(for nominal variables, a nonmonotonic relationship) beginning with the next section of this
chapter.
When you determine that a true relationship does exist in the population by means of
the correct statistical test, you then establish its direction or pattern. Again, the type of rela-
tionship dictates how you describe its direction. You might have to inspect the relationship
in a table or graph, or you might need only to look for a positive or negative sign before the
computed statistic. Finally, the strength of the relationship remains to be judged. Some asso-
ciative analysis statistics, such as correlations, indicate the strength in a very straightforward
manner—that is, just by their absolute size. With nominally scaled variables, however, you
must inspect the pattern to judge the strength. We describe this procedure, the use of cross-
tabulations, after we describe correlation analysis next in this chapter.
Direction means that you know if the relationship is positive or negative, whereas pattern means you know the general nature of the relationship.
Based on scaling assumptions, fi rst determine the type of relationship, and then perform the appropriate statistical test.
TABLE 14. 1 Step-by-Step Procedure for Analyzing the Relationship Between Two Variables
Step Description
Step 1. Choose variables to analyze. Identify two variables you think might be related.
Step 2. Determine the scaling assumptions of the chosen variables.
For purposes of this chapter, both must be either scale (interval or ratio) or cat-
egorical (nominal) variables.
Step 3. Use the correct relationship analysis.
For two scale (interval and/or ratio scale) variables, use correlation; for two
nominal variables, use cross-tabulation.
Step 4. Determine if the relationship is present.
If the analysis shows the relationship is statistically signifi cant, it is present.
Step 5. If present, determine the direction of the relationship.
A linear (scale variables) relationship will be either increasing or decreasing; a
nonmonotonic relationship (nominal scales) will require looking for a pattern.
Step 6. If present, assess the strength of the relationship.
With correlation, the size of the coeffi cient denotes strength; with cross-tabulation,
the pattern is subjectively assessed.
Strength means you know how consistent the relationship is.
M14_BURN3261_08_GE_C14.indd 381M14_BURN3261_08_GE_C14.indd 381 17/08/16 4:07 pm17/08/16 4:07 pm

382 CHAPTER 14 • MAKING USE OF ASSOCIATIONS TESTS
14- 3 Correlation Coeffi cients and Covariation Because you have no doubt heard about and perhaps used it, we will now describe the use
of correlation analysis. The correlation coeffi cient is an index number, constrained to fall
between −1.0 and +1.0, that communicates both the strength and the direction of a linear
relationship between two scale variables. The strength of association between two variables
is communicated by the absolute size of the correlation coeffi cient, whereas its sign com-
municates the direction of the association. Stated in a slightly diff erent manner, a correlation
coeffi cient indicates the degree of covariation between two variables. Covariation is defi ned
as the amount of change in one variable systematically associated with a change in another
variable. The greater the absolute size of the correlation coeffi cient, the greater is the covaria-
tion between the two variables, or the stronger is their relationship. 2
Let us take up the statistical signifi cance of a correlation coeffi cient fi rst. Regardless of its
absolute value, a correlation that is not statistically signifi cant has no meaning at all. This is
because of the null hypothesis, which states that the population correlation coeffi cient is equal
to zero. If this null hypothesis is rejected (statistically signifi cant correlation), then you can
be assured that a correlation other than zero will be found in the population. But if the sample
correlation is found to be not signifi cant, the population correlation will be zero. Here is a
question. If you can answer it correctly, you understand the statistical signifi cance of a cor-
relation. If you repeated a correlational survey many, many times and computed the average
for a correlation that was not signifi cant across all of these surveys, what would be the result?
(The answer is zero because if the correlation is not signifi cant, the null hypothesis is true, and
the population correlation is zero.)
Step 4, “Determine if the relationship is present,” in our “Procedure for Analyzing Rela-
tionships” in Table 14. 1 , requires a statistical test, but how do you determine the statistical
signifi cance of a correlation coeffi cient? Although tables exist that give the lowest value of the
signifi cant correlation coeffi cients for given sample sizes, most computer statistical programs
will indicate the statistical signifi cance level of the computed correlation coeffi cient. Your
SPSS program provides the signifi cance in the form of the probability that the null hypothesis
is supported. In SPSS, this is a Sig. value that we will identify for you when we show you
SPSS correlation output.
RULES OF THUMB FOR CORRELATION STRENGTH After we have established that a correlation coeffi cient is statistically signifi cant, we can talk
about some general rules of thumb concerning the strength of association. Correlation coef-
fi cients that fall between the absolute values of 1.00 and .81 are generally considered to be
“very strong.” Those correlations that fall between the absolute values of .80 and .61 generally
indicate a “strong” association. Those that fall between the absolute values of .60 and .41 are
typically considered to be “moderate.” Any correlation that falls between the absolute value
range of .21 and .40 is usually considered indicative of a “weak” association between the vari-
ables. Finally, any correlation that is equal to or less than the absolute value of .20 is typically
uninteresting to marketing researchers because it rarely identifi es a meaningful association
between two variables. Of course, this range includes a correlation coeffi cient of 0, or no asso-
ciation whatsoever, so we characterize the +.20 to −.20 range as “very weak.”
We provide Table 14. 2 as a reference on these rules of thumb. As you use these guide-
lines, remember two things: First, we are assuming that the statistical signifi cance of the cor-
relation has been established. Second, researchers make up their own rules of thumb, so you
may encounter someone whose guidelines diff er slightly from those in the table. 3
In any case, it is helpful to think in terms of the closeness of the correlation coeffi cient
to zero or to ±1.00. Statistically signifi cant correlation coeffi cients that are close to zero show
that there is no systematic association between the two variables, whereas those that are closer
to +1.00 or −1.00 express that there is some systematic association between the variables.
A correlation coeffi cient standardizes the covariation between two variables into a number ranging from −1.0 to +1.0.
To use a correlation, you must fi rst determine that it is statistically signifi cant from zero.
Rules of thumb exist concerning the strength of a correlation based on its absolute size.
M14_BURN3261_08_GE_C14.indd 382M14_BURN3261_08_GE_C14.indd 382 17/08/16 4:07 pm17/08/16 4:07 pm

14-3 CORRELATION COEFFICIENTS AND COVARIATION 383
THE CORRELATION SIGN: THE DIRECTION OF THE RELATIONSHIP But what about the sign of the correlation coeffi cient? The sign indicates the direction of the
relationship. A positive sign indicates a positive direction; a negative sign indicates a negative
direction. For instance, if you found a signifi cant correlation of .83 between years of educa-
tion and hours spent viewing National Geographic Digital magazine, it would mean that
people with more education spend more hours viewing this magazine. But if you found a sig-
nifi cant negative correlation between years of education and frequency of cigarette smoking,
it would mean that more educated people smoke less.
GRAPHING COVARIATION USING SCATTER DIAGRAMS We addressed the concept of covariation between two variables in our introductory comments
on correlations. It is now time to present covariation in a slightly diff erent manner. Here is
an example: A marketing researcher is investigating the possible relationship between total
company sales for Novartis, a leading pharmaceuticals sales company, in a particular territory
and the number of salespeople assigned to that territory. At the researcher’s fi ngertips are the
sales fi gures and number of salespeople assigned for each of 20 diff erent Novartis territories
in the United States.
It is possible to depict the raw data for these two variables on a scatter diagram such as
the one in Figure 14. 2 . A scatter diagram plots the points corresponding to each matched
pair of x and y variables. In this fi gure, the vertical axis is Novartis sales for the territory
and the horizontal axis contains the number of salespeople in
that territory. The arrangement or scatter of points appears to
fall in a long ellipse. Any two variables that exhibit system-
atic covariation will form an ellipse-like pattern on a scatter
diagram. Of course, this particular scatter diagram portrays
the information gathered by the marketing researcher on sales
and the number of salespeople in each territory and only that
information. In actuality, the scatter diagram could have taken
any shape, depending on the relationship between the points
plotted for the two variables concerned. 4
A number of diff erent types of scatter diagram results are
portrayed in Figure 14. 3 . The results of each of these scatter
diagrams are indicative of a diff erent degree of covariation.
For instance, you can see that the scatter diagram depicted in
Figure 14. 3 (a) is one in which there is no apparent association
or relationship between the two variables; the points fail to
create any identifi able pattern. Instead, they are clumped into
a large, formless shape. Those points in Figure 14. 3 (b) indi-
cate a negative relationship between variable x and variable y ;
TABLE 14. 2 Rules of Thumb About Correlation Coeffi cient Size*
Coeffi cient Range Strength of Association*
+.81 to +1.00; −.81 to −1.00 Very strong
+.61 to +.80; −.61 to −.80 Strong
+.41 to +.60; −.41 to −.60 Moderate
+.21 to +.40; −.21 to −.40 Weak
+.20 to −.20 Very weak
*Assuming the correlation coeffi cient is statistically signifi cant
A correlation indicates the strength of association between two variables by its size. The sign indicates the direction of the association.
1000 2 4 6 8 10
Number of salespersons
12 14 16 18 20
150
200
Terri
tory
sal
es
300
250
FIGURE 14 .2 A Scatter Diagram Showing Covariation
Covariation can be examined with use of a scatter diagram.
M14_BURN3261_08_GE_C14.indd 383M14_BURN3261_08_GE_C14.indd 383 17/08/16 4:07 pm17/08/16 4:07 pm

384 CHAPTER 14 • MAKING USE OF ASSOCIATIONS TESTS
higher values of x tend to be associated with lower values of y . Those
points in Figure 14. 3 (c) are fairly similar to those in Figure 14. 3 (b),
but the angle or the slope of the ellipse is diff erent. This slope indi-
cates a positive relationship between x and y because larger values of
x tend to be associated with larger values of y .
What is the connection between scatter diagrams and correlation
coeffi cients? The answer to these questions lies in the linear relation-
ship described earlier in this chapter. Look at Figures 14. 3(b) and
14. 3(c). Both form ellipses. Imagine taking an ellipse and pulling on
both ends. It would stretch out and become thinner until all of its
points fall on a straight line. If you happened to fi nd some data that
formed an ellipse with all points falling on the axis line and you com-
puted a correlation, you would fi nd it to be exactly 1.0 (+1.0 if the
ellipse went up to the right and −1.0 if it went down to the right).
Now imagine pushing the ends of the ellipse until it became the pat-
tern in Figure 14. 3 (a). There would be no identifi able straight line.
Similarly, there would be no systematic covariation. The correlation
for a ball-shaped scatter diagram is zero because there is no discern-
able linear relationship. In other words, a correlation coeffi cient indi-
cates the degree of covariation between two variables, and you can
envision this relationship as a scatter diagram. The form and angle of
the scatter pattern are revealed by the size and sign, respectively, of
the correlation coeffi cient.
14- 4 The Pearson Product Moment Correlation Coeffi cient The Pearson product moment correlation measures the linear
relationship between two interval- and/or ratio-scaled variables
(scale variables) such as those depicted conceptually by scatter diagrams. The correlation
coeffi cient that can be computed between the two variables is a measure of the “closeness”
of the scatter points to the straight line. You already know that in a case in which all of the
points fall exactly on the straight line, the correlation coeffi cient indicates this as a plus or
minus 1.00. In the case in which it was impossible to discern an ellipse, such as in scat-
ter diagram Figure 14. 3 (a), the correlation coeffi cient approximates zero. Of course, it is
extremely unlikely that you will fi nd perfect 1.00 or .00 correlations. Usually, you will fi nd
The success of a prescription drug pharmaceutical
company may be related to how many salespersons
it has in the fi eld to talk with doctors.
(a) No association (b) Negative association (c) Positive association
FIGURE 14 .3 Scatter Diagrams Illustrating Various Relationships
Two highly correlated variables will appear on a scatter diagram as a tight ellipse pattern.
© M
icha
elju
ng/S
hutt
erst
ock
M14_BURN3261_08_GE_C14.indd 384M14_BURN3261_08_GE_C14.indd 384 17/08/16 4:07 pm17/08/16 4:07 pm

14-4 THE PEARSON PRODUCT MOMENT CORRELATION COEFFICIENT 385
some value in between that, if statistically signifi cant, can be interpreted as “strong,” “mod-
erate,” “weak,” and so on, using the rules of thumb given earlier.
The computational formula for Pearson product moment correlations is as follows:
Formula for Pearson product moment correlation
rxy =ai=1
n(xi - x)(yi - y)
nsxsy
where
xi = each x value
x = mean of the x values
yi = each y value
y = mean of the y values
n = number of paired cases
sx, sy = standard deviations of x and y , respectively
We briefl y describe the components of this formula to help you see how the concepts
we just discussed fi t in. In the statistician’s terminology, the numerator represents the cross-
products sum and indicates the covariation or “covariance” between x and y . The cross-products
sum is divided by n to scale it down to an average per pair of x and y values. This average
covariation is then divided by both standard deviations to adjust for diff erences in units. The
result constrains rxy to fall between −1.0 and +1.0.
Here is a simple computational example. You have some data on population and retail
sales by county for 10 counties in your state. Is there a relationship between population and
retail sales? You do a quick calculation and fi nd the average number of people per county is
690,000, and the average retail sales are $9.54 million. The standard deviations are 384.3 and
7.8, respectively, and the cross-products sum is 25,154. The computations to fi nd the correla-
tion are the following:
Calculation of a correlation coefficient
Notes:
Cross-products sum = 25,154
n = 10
Standard deviation of x = 7.8
Standard deviation of y = 384.3
rxy =a
n
i - 1
(xi - x)(yi - y)
nsxsy
=25,154
10 * 7.8 * 384.4
=25,154
29,975.4
= .84
A correlation of .84 is a high positive correlation coeffi cient for the relationship. This
value reveals that the greater the number of citizens living in a county, the greater the county’s
retail sales.
To summarize, Pearson product moment correlation and other linear association cor-
relation coeffi cients indicate not only the degree of association but the direction as well
because, as we described in our introductory comments on correlations, the sign of the
correlation coeffi cient indicates the direction of the relationship. Negative correlation coef-
fi cients reveal that the relationship is opposite: As one variable increases, the other vari-
able decreases. Positive correlation coeffi cients reveal that the relationship is increasing:
Larger quantities of one variable are associated with larger quantities of another variable.
The Pearson product moment correlation coeffi cient measures the degree of linear association between two variables.
M14_BURN3261_08_GE_C14.indd 385M14_BURN3261_08_GE_C14.indd 385 17/08/16 4:07 pm17/08/16 4:07 pm

386 CHAPTER 14 • MAKING USE OF ASSOCIATIONS TESTS
It is important to note that the angle or the slope of the ellipse has nothing to do with the
size of the correlation coeffi cient. Everything hinges on the width of the ellipse. (The slope
will be considered in Chapter 15 under regression analysis.) To learn how correlations
were used to discover the relationships among certain brand fans and their music pref-
erences, see the fi ndings of companies that analyze social media in Marketing Research
Insight 14. 1 .
A positive correlation signals an increasing linear relationship, whereas a negative correlation signals a decreasing one.
Active Learning
Date.net : Male Users’ Chat Room Phobia
Date.net is an online meeting service that competes with other dating sites such as Match, eHarmony, and ChristianMingle. Date.net operates a virtual meeting place for men seeking women and women seeking men. Date.net ’s public chat room is where its members first become aquainted and, if a couple wants to move into its own private chat room, Date.net creates one and assesses a fee for each minute that the couple is chatting in this private chat room. Recent internal analysis has revealed that women chat room users are considerably less satisfied with Date.net ’s public chat room than are its male chat room users. This is frustrating to Date.net principals, as they know that disappointing public chats will not lead to private chats.
Brand Fans and Music Preferences Social media contain vast stores of data, and it is possible to fi nd correlations and other associations that have marketing strategy implications. Specifi cally, it is possible to fi nd “brand fans,” consumers who avidly follow brands on Facebook, Twit-ter, Instagram, Spotify, and other social media sites, and then to trace their online searches for favorite music lyrics, concerts, or other platforms. Two companies, Cellfi sh and Echo Nest, recently divulged some of these correlation fi ndings. 5 In the list-ing that follows, see if you can correctly match the “brand” with the preferred music of its fans. Match each brand or topic with a line just as you did with the matching questions on your tests in grammar school. The correct answers appear at the end of this chapter.
What is the value of these correlations? Just think about the fact that consumers are hit with thousands upon thou-sands of visual, audio, and other commercial impressions daily. Consequently, consumers are “tuning” out many of these impressions because they are not relevant. However, when a consumer hears or sees a favorite music performer, something called “selective perception” kicks in, and the consumer imme-diately stops and pays attention to the stimulus. So, if a com-pany knows the favorite music artists of its fans, it can pair its
advertising or other promotions with that music to increase the likelihood that its fans will attend to the message.
Fans of This Brand or Topic Have Which Musical Preference?
Ciroc vodka American Idol alt-rocker Chris Daughtry
Craft beers Andrew Lloyd Webber
EA’s console sports games
Bruce Springsteen and Pink Floyd
Harrods Classic rock stars such as the Beatles, Jimi Hendrix, etc.
Motorola Hip-hop and rap artists
NHL Jam bands (Phish, Umphrey’s McGee)
NPR Hip-hop and rap artists (Ice Cube, Nas)
Travel Channel Rock and country rock artists, like Meat Loaf, Kid Rock
Victoria’s Secret Pink brand
Younger artists like Miley Cyrus, the Jonas Brothers
MARKETING RESEARCH INSIGHT 14. 1 Digital Marketing Research
M14_BURN3261_08_GE_C14.indd 386M14_BURN3261_08_GE_C14.indd 386 17/08/16 4:07 pm17/08/16 4:07 pm

14-4 THE PEARSON PRODUCT MOMENT CORRELATION COEFFICIENT 387
INTEGRATED CASE
Auto Concepts: How to Obtain Pearson Product Moment Correlation(s) with SPSS With SPSS, it takes only a few clicks to compute correlation coeffi cients. Once again, we
will use the Auto Concepts survey case study, as you are familiar with it. In the survey, we
measured preferences for each of the fi ve possible automobile models on a 7-point interval
scale. CMG Research also purchased the lifestyle measures of the respondents. There are six
diff erent lifestyles: Novelist, Innovator, Trendsetter, Forerunner, Mainstreamer, and Classic.
Each lifestyle type is measured with a 7-point interval scale where 1 = Does not describe me
Managers at Date.net commission an online marketing research company to design a questionnaire that is posted on the Date.net website. The survey asks a number of questions covering demographics, online chatting, Date.net services usage, and personal satisfaction measures, and over 3,000 Date.net users fill it out. Date.net executives request a separate analysis of men members who use the public chat room. The research company reports all correlations that are significant at the .01 level. Here is a summary of the correlation analysis findings:
Factor
Correlation with Amount of Date.net
Chat Room Use
Demographics: Age −.68
Income −.76
Education −.78
Number of years divorced +.57
Number of children +.68
Years at present address −.90
Years at present job −.85
Satisfaction with: Relationships −.76
Job/career −.86
Personal appearance −.72
Life in general −.50
Online behavior: Minutes online daily +.90
Online purchases −.65
Other chatting time/month +.86
Number of email accounts +.77
Use of Date.net (where 1 = Not important and 5 = Very important):
Meet new people +.38
Only way to talk to women +.68
Looking for a life partner −.72
Not much else to do +.59
For each factor, use your knowledge of correlations and provide a statement of how it char-acterizes the typical Date.net male chat room user. Given your findings, what tactics do you recommend to Date.net to address the low satisfaction with Date.net ’s public chat room that has been expressed by its female members?
M14_BURN3261_08_GE_C14.indd 387M14_BURN3261_08_GE_C14.indd 387 17/08/16 4:07 pm17/08/16 4:07 pm

388 CHAPTER 14 • MAKING USE OF ASSOCIATIONS TESTS
at all to 7 = Describes me perfectly. Correlation analysis can be used to fi nd out what lifestyle
profi le is associated with a particular automobile model preference. That is, high positive cor-
relations would indicate that consumers wanted a particular model and that they scored high
on the lifestyle type. Conversely, low or negative correlations would signal that they did not
match up well at all. We’ll only do one of the model preferences here, and you can do the rest
in your SPSS integrated case analysis work specifi ed at the end of the chapter.
We need to perform correlation analysis with the preference for the fi ve-seat, economy
gasoline automobile model and the six lifestyle types to determine which, if any, lifestyle
type is associated with preference for this model. The clickstream sequence is ANALYZE-
CORRELATE-BIVARIATE that leads, as can be seen in Figure 14. 4 , to a selection box to
specify which variables are to be correlated. Note that we have selected the desirability of
the standard size gasoline model and all six lifestyle types. Diff erent types of correlations
are optional, so we have selected Pearson’s, and the two-tailed test of signifi cance is the
default.
The output generated by this command is provided in Figure 14. 5 . As can be seen in the
fi gure, whenever you instruct SPSS to compute correlations, its output is a symmetric correla-
tion matrix composed of rows and columns that pertain to each of the variables. Each cell in
the matrix contains three items: (1) the correlation coeffi cient, (2) the signifi cance level, and
(3) the sample size. Figure 14. 5 sets out the computed correlations between “Desirability:
5 Seat Economy Gasoline” and the six lifestyles of Novelist, Innovator, Trendsetter, Forerunner,
Mainstreamer, and Classic.
If you look at our correlation printout, you will notice that a correlation of 1 is reported
where a variable is correlated with itself. This reporting may seem strange, but it serves the
purpose of reminding you that the correlation matrix that is generated with this procedure is
symmetric. In other words, the correlations in the matrix above the diagonal 1s are identi-
cal to those correlations below the diagonal. With only a few variables, this fact is obvious;
IBM SPSS Student Assistant: Working with Correlations
With SPSS, correlations are computed with the CORRELATE-BIVARIATE feature.
A correlation matrix is symmetric with 1s on the diagonal.
FIGURE 14 .4 IBM SPSS Clickstream to Obtain Correlations
Source: Reprint Courtesy of International Business Machines Corporation, © International Business
Machines Corporation.
M14_BURN3261_08_GE_C14.indd 388M14_BURN3261_08_GE_C14.indd 388 17/08/16 4:07 pm17/08/16 4:07 pm

14-6 CROSS-TABULATIONS 389
FIGURE 14 .5 IBM SPSS Output for Correlations
Source: Reprint Courtesy of International Business Machines Corporation, © International Business Machines Corporation.
With correlation analysis, each correlation will have a unique signifi cance level.
however, sometimes several variables are compared in a single run, and the 1s on the diagonal
are handy reference points. They all have a Sig. value of .000 that translates into a .001 or less
probability that the null hypothesis of zero correlation is supported.
Since we now know that the correlations are statistically signifi cant, or signifi cantly dif-
ferent from zero, we can assess their strengths. Searching the fi rst column of statistics, we fi nd
only one correlation of appreciable size. It is .634 for Classic. In other words, we only have
one lifestyle-type relationship that is positive, stable, and strong. The interpretation of this
fi nding is that those who prefer the fi ve-seat economy gasoline model are people who tend to
be traditional and reluctant to change their ways.
14- 5 Reporting Correlation Findings to Clients We again remind you that in step 4 of the “Procedure for Analyzing Relationships” outlined in
Table 14. 1 , the researcher must test to determine that a signifi cant correlation has been found
before reporting it. Losing sight of this step is entirely possible when a statistical analysis
program issues a great many correlations often in a layout that is confusing to fi rst-time data
analysts. To our knowledge, there is no marketing research industry standard on how to report
statistically signifi cant correlations to clients. But we do have a recommended approach that
takes into account correlation signs and sizes. Our recommendation is off ered in Marketing
Research Insight 14. 2 .
14- 6 Cross-Tabulations We now turn to cross-tabulation and the associated Chi-square value used to assess if a non-
monotonic relationship exists between two nominally scaled variables. Recall that nonmono-
tonic relationships are those in which the presence of the label for one nominally scaled
To learn how to compute a Pearson product moment
correlation, launch www.youtube.com , and search for “Product Moment Correlation Coeffi cient: Exam Solutions.”
M14_BURN3261_08_GE_C14.indd 389M14_BURN3261_08_GE_C14.indd 389 17/08/16 4:07 pm17/08/16 4:07 pm
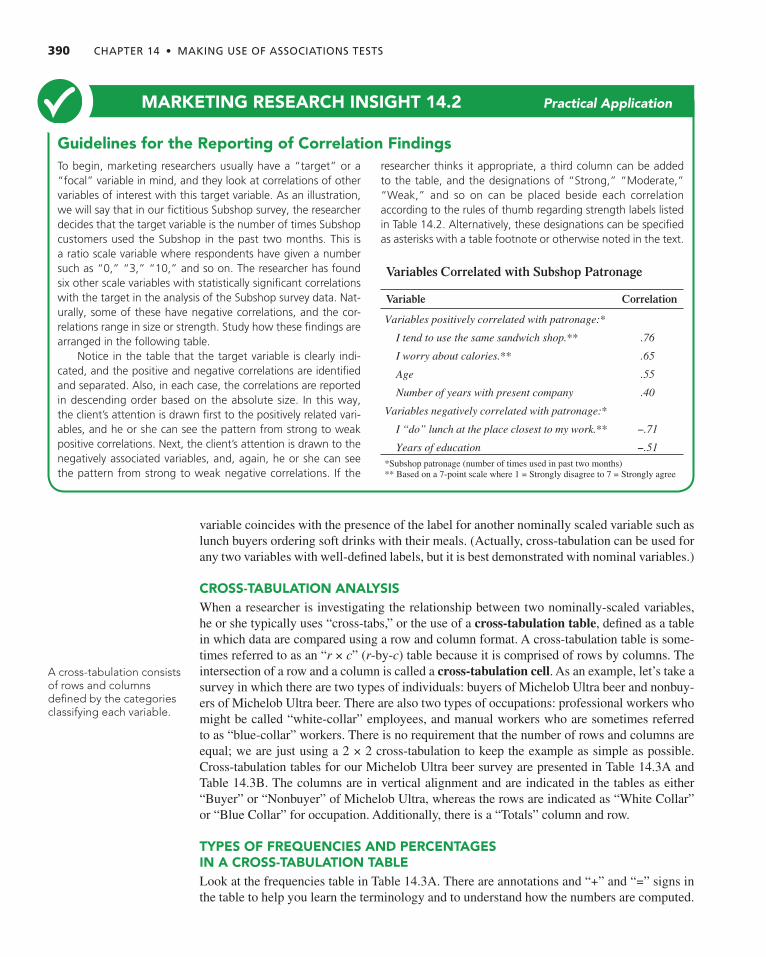
390 CHAPTER 14 • MAKING USE OF ASSOCIATIONS TESTS
variable coincides with the presence of the label for another nominally scaled variable such as
lunch buyers ordering soft drinks with their meals. (Actually, cross-tabulation can be used for
any two variables with well-defi ned labels, but it is best demonstrated with nominal variables.)
CROSS-TABULATION ANALYSIS When a researcher is investigating the relationship between two nominally-scaled variables,
he or she typically uses “cross-tabs,” or the use of a cross-tabulation table , defi ned as a table
in which data are compared using a row and column format. A cross-tabulation table is some-
times referred to as an “ r × c ” ( r -by- c ) table because it is comprised of rows by columns. The
intersection of a row and a column is called a cross-tabulation cell . As an example, let’s take a
survey in which there are two types of individuals: buyers of Michelob Ultra beer and nonbuy-
ers of Michelob Ultra beer. There are also two types of occupations: professional workers who
might be called “white-collar” employees, and manual workers who are sometimes referred
to as “blue-collar” workers. There is no requirement that the number of rows and columns are
equal; we are just using a 2 × 2 cross-tabulation to keep the example as simple as possible.
Cross-tabulation tables for our Michelob Ultra beer survey are presented in Table 14. 3A and
Table 14. 3B . The columns are in vertical alignment and are indicated in the tables as either
“Buyer” or “Nonbuyer” of Michelob Ultra, whereas the rows are indicated as “White Collar”
or “Blue Collar” for occupation. Additionally, there is a “Totals” column and row.
TYPES OF FREQUENCIES AND PERCENTAGES IN A CROSS-TABULATION TABLE Look at the frequencies table in Table 14. 3A . There are annotations and “+” and “=” signs in
the table to help you learn the terminology and to understand how the numbers are computed.
Guidelines for the Reporting of Correlation Findings To begin, marketing researchers usually have a “target” or a “focal” variable in mind, and they look at correlations of other variables of interest with this target variable. As an illustration, we will say that in our fi ctitious Subshop survey, the researcher decides that the target variable is the number of times Subshop customers used the Subshop in the past two months. This is a ratio scale variable where respondents have given a number such as “0,” “3,” “10,” and so on. The researcher has found six other scale variables with statistically signifi cant correlations with the target in the analysis of the Subshop survey data. Nat-urally, some of these have negative correlations, and the cor-relations range in size or strength. Study how these fi ndings are arranged in the following table.
Notice in the table that the target variable is clearly indi-cated, and the positive and negative correlations are identifi ed and separated. Also, in each case, the correlations are reported in descending order based on the absolute size. In this way, the client’s attention is drawn fi rst to the positively related vari-ables, and he or she can see the pattern from strong to weak positive correlations. Next, the client’s attention is drawn to the negatively associated variables, and, again, he or she can see the pattern from strong to weak negative correlations. If the
researcher thinks it appropriate, a third column can be added to the table, and the designations of “Strong,” “Moderate,” “Weak,” and so on can be placed beside each correlation according to the rules of thumb regarding strength labels listed in Table 14. 2 . Alternatively, these designations can be specifi ed as asterisks with a table footnote or otherwise noted in the text.
Variables Correlated with Subshop Patronage
Variable Correlation
Variables positively correlated with patronage:*
I tend to use the same sandwich shop.** .76
I worry about calories.** .65
Age .55
Number of years with present company .40
Variables negatively correlated with patronage:*
I “do” lunch at the place closest to my work.** −.71
Years of education −.51 *Subshop patronage (number of times used in past two months)
** Based on a 7-point scale where 1 = Strongly disagree to 7 = Strongly agree
MARKETING RESEARCH INSIGHT 14. 2 Practical Application
A cross-tabulation consists of rows and columns defi ned by the categories classifying each variable.
M14_BURN3261_08_GE_C14.indd 390M14_BURN3261_08_GE_C14.indd 390 17/08/16 4:07 pm17/08/16 4:07 pm

14-6 CROSS-TABULATIONS 391
TABLE 14. 3A Cross-Tabulation Frequencies Table for a Michelob Ultra Survey
Observed Frequencies Table
Type of Buyer
Buyer Nonbuyer Totals
Buyer/White Collar
Cell Frequency
White Collar 152 + 8 = 160
+ + +
Occupational Status Blue Collar 14 + 26 = 40
= = =
Totals 166 + 34 = 200
Row Totals
Grand TotalColumn Totals
TABLE 14. 3B Cross-Tabulation Percentages Tables for a Michelob Ultra Survey
Raw Percentages Table
Buyer Nonbuyer Totals
Buyer/White Collar
Cell Raw Percent
White Collar 76% + 4% = 80%
(152/200) (8/200) (160/200)
+ + +
Occupational Status Blue Collar 7% + 13% = 20%
(14/200) (26/200) (40/200)
= = =
Totals 83% + 17% = 100%
(166/200) (34/200) (200/200)
Column Percentages Table
Buyer Nonbuyer Totals
Buyer/White Collar
Column Percent
White Collar 92% 24% 80%
(152/166) (8/34) (160/200)
+ + +
Occupational Status Blue Collar 8% 76% 20%
(14/166) (26/34) (40/200)
= = =
100% 100% 100%
Totals (166/166) (34) (200/200)
Row Percentages Table
Buyer Nonbuyer Totals
Buyer/White Collar
Row Percent
White Collar 95% + 5% = 100%
(152/160) (8/160) (160/160)
Occupational Status Blue Collar 35% + 65% = 100%
(14/40) (26/40) (40/40)
Totals 83% + 17% = 100%
(166/200) (34/200) (200/200)
M14_BURN3261_08_GE_C14.indd 391M14_BURN3261_08_GE_C14.indd 391 17/08/16 4:07 pm17/08/16 4:07 pm

392 CHAPTER 14 • MAKING USE OF ASSOCIATIONS TESTS
The frequencies table (often referred to as the observed frequencies table ) contains the raw
numbers determined from the preliminary tabulation. 6 The upper left-hand cell number is
a frequency cell that counts people in the sample who are both white-collar workers and
buyers of Michelob Ultra (152), and the cell frequency to its right identifi es the number of
individuals who are white-collar workers who do not buy Michelob Ultra (8). These cell
numbers represent raw counts or frequencies; that is, the number of respondents who pos-
sess the quality indicated by the row label as well as the quality indicated by the column
label. The cell frequencies can be summed to determine the row totals and the column totals.
For example, Buyer/White Collar (152) and Nonbuyer/White Collar (8) sum to 160, while
Buyer/White Collar (152) and Buyer/Blue Collar (14) sum to 166. Similarly, the row and
column totals sum to equal the grand total of 200. Take a few minutes to be familiar with the
terms and computations in the frequencies table, as they will be referred to in the following
discussion.
Table 14. 3B illustrates how at least three diff erent sets of percentages can be computed
for cells in the table. These three percentages tables are the raw percentages table, the column
percentages table, and the row percentages table.
The fi rst table in Table 14. 3B shows that the raw frequencies can be converted to raw
percentages by dividing each by the grand total. The raw percentages table contains the
percentages of the raw frequency numbers just discussed. The grand total location now has
100% (or 200/200) of the grand total. Above it are 80% and 20% for the raw percentages
of white-collar occupational respondents and blue-collar occupational respondents, respec-
tively, in the sample. Divide a couple of the cells just to verify that you understand how they
are derived. For instance, 152 , 200 = 76%. Our “+” and “=” signs indicate how the totals
are computed.
Two additional cross-tabulation tables can be presented, and these are more valu-
able in revealing underlying relationships. The column percentages table divides
the raw frequencies by the column total raw frequency. That is, the formula is as
follows:
Formula for a column cell percent
Column cell percent =Cell frequency
Total of cell frequencies in that column
For instance, it is apparent that of the nonbuyers, 24% are white-collar respondents
and 76% are blue-collar respondents. Note the reverse pattern for the buyers group: 92% of
Michelob Ultra buyers are white-collar respondents and 8% are blue-collar. You are beginning
to see the nonmonotonic relationship.
The row percentages table presents the data with the row totals as the 100% base for
each. That is, a row cell percentage is computed as follows:
Formula for a row cell percent
Row cell percent =Cell frequency
Total of cell frequencies in that row
Now it is possible to see that, of the white-collar respondents, 95% are buyers and 5% are
nonbuyers. As you compare the row percentages table to the column percentages table, you
should detect the relationship between occupational status and Michelob Ultra beer prefer-
ence. Can you state it at this time?
Row (column) percentages are row (column) cell frequencies divided by the row (column) total.
A cross-classifi cation table can have four types of numbers in each cell: frequency, raw percentage, column percentage, and row percentage.
Raw percentages are cell frequencies divided by the grand total.
M14_BURN3261_08_GE_C14.indd 392M14_BURN3261_08_GE_C14.indd 392 17/08/16 4:07 pm17/08/16 4:07 pm

14-7 CHI-SQUARE ANALYSIS 393
Unequal percentage concentrations of individuals in a few cells, as we have in this exam-
ple, illustrate the possible presence of a nonmonotonic association. If we had found that
approximately 25% of the sample had fallen in each of the four cells, no relationship would
be found to exist—it would be equally probable for any person to be a Michelob Ultra buyer
or nonbuyer and a white- or a blue-collar worker. However, the large concentrations of indi-
viduals in two particular cells here suggest that there is a high probability that a buyer of
Michelob Ultra beer is also a white-collar worker, and there is also a tendency for nonbuyers
to work in blue-collar occupations. In other words, there is probably an association between
occupational status and the beer-buying behavior of individuals in the population represented
by this sample. However, as noted in step 4 of our procedure for analyzing relationships
( Table 14. 1 ), we must test the statistical signifi cance of the apparent relationship before we
can say anything more about it.
14- 7 Chi-Square Analysis Chi-square (x 2 ) analysis is the examination of frequencies for two nominally scaled
variables in a cross-tabulation table to determine whether the variables have a statis-
tically signifi cant nonmonotonic relationship. 7 The formal procedure for Chi-square
analysis begins when the researcher formulates a statistical null hypothesis that the two
variables under investigation are not associated in the population. Actually, it is not
necessary for the researcher to state this hypothesis in a formal sense, for Chi-square
analysis always implicitly takes this hypothesis into account. In other words, whenever
we use Chi-square analysis with a cross-tabulation, we always begin with the assump-
tion that no association exists between the two nominally scaled variables under
analysis. 8
OBSERVED AND EXPECTED FREQUENCIES The statistical procedure is as follows. The cross-tabulation table in Table 14. 3A contains
observed frequencies , which are the actual cell counts in the cross-tabulation table. These
observed frequencies are compared to expected frequencies , which are defi ned as the
theoretical frequencies that are derived from this hypothesis of no association between
the two variables. The degree to which the observed frequencies depart from the expected
frequencies is expressed in a single number called the Chi-square test statistic . The com-
puted Chi-square test statistic is then compared to a table Chi-square value (at a chosen
level of signifi cance) to determine whether the computed value is signifi cantly diff erent
from zero.
The expected frequencies are those that would be found if there were no association
between the two variables. Remember, this is the null hypothesis. About the only “diffi cult”
part of Chi-square analysis is in the computation of the expected frequencies. The computa-
tion is accomplished using the following equation:
Formula for an expected cross-tabulation cell frequency
Expected cell frequency =Cell column total * Cell row total
Grand total
The application of this equation generates a number for each cell that would occur if no
association existed. Returning to our Michelob Ultra beer example in which 160 white-collar
and 40 blue-collar consumers were sampled, it was found that there were 166 buyers and
Chi-square analysis assesses the statistical signifi cance of nonmonotonic associations in cross-tabulation tables.
Expected frequencies are calculated based on the null hypothesis of no association between the two variables under investigation.
M14_BURN3261_08_GE_C14.indd 393M14_BURN3261_08_GE_C14.indd 393 17/08/16 4:07 pm17/08/16 4:07 pm

394 CHAPTER 14 • MAKING USE OF ASSOCIATIONS TESTS
34 nonbuyers of Michelob Ultra. The expected frequency for each cell, assuming no associa-
tion, calculated with the expected cell frequency is as follows:
Calculations of expected cell frequencies using the Michelob Ultra example
Notes:
Buyers total = 166
Nonbuyers total = 34
White-collar buyers total = 160
Blue-collar buyers total = 40
Grand total = 200
White@collar buyer =160 * 166
200= 132.8
White@collar nonbuyer =160 * 34
200= 27.2
Blue@collar buyer =40 * 166
200= 33.2
Blue@collar nonbuyer =40 * 34
200= 6.8
THE COMPUTED x 2 VALUE Next, compare the observed frequencies to these expected frequencies. The Chi-square formula for this computation is as follows:
Chi-square formula
x2 = an
i - 1
(Observedi - Expectedi)2
Expectedi
where
Observed i = observed frequency in cell i
Expected i = expected frequency in cell i
n = number of cells
Applied to our Michelob Ultra beer example,
Calculation of Chi-square value (Michelob Ultra example)
Notes:
Observed frequencies are in Table 14. 3A
Expected frequencies are computed above
x2 =(152 - 132.8)2
132.8+
(8 - 27.2)2
27.2
+(14 - 33.2)2
33.2+
(26 - 6.8)2
6.8= 81.64
You can see from the equation that each expected frequency is compared (via subtrac-
tion) to the observed frequency and squared to adjust for any negative values and to avoid
the cancellation eff ect. This value is divided by the expected frequency to adjust for cell size
diff erences, and these amounts are summed across all the cells. If there are many large devia-
tions of observed frequencies from the expected frequencies, the computed Chi-square value
will increase. But if there are only a few slight deviations from the expected frequencies, the
computed Chi-square number will be small. In other words, the computed Chi-square value
is really a summary indication of how far away from the expected frequencies the observed
frequencies are found to be. As such, it expresses the departure of the sample fi ndings from
the null hypothesis of no association.
THE CHI-SQUARE DISTRIBUTION Now that you’ve learned how to calculate a Chi-square value, you need to know if it is sta-
tistically signifi cant. In previous chapters, we described how the normal curve or z distribu-
tion, the F distribution, and Student’s t distribution, all of which exist in tables, are used by
The computed Chi-square value compares observed to expected frequencies.
The Chi-square test statistic summarizes how far away from the expected frequencies the observed cell frequencies are found to be.
M14_BURN3261_08_GE_C14.indd 394M14_BURN3261_08_GE_C14.indd 394 17/08/16 4:07 pm17/08/16 4:07 pm

14-7 CHI-SQUARE ANALYSIS 395
a computer statistical program to determine level of
signifi cance. Chi-square analysis requires the use of a
diff erent distribution. The Chi-square distribution is
skewed to the right and the rejection region is always
at the right-hand tail of the distribution. It diff ers from
the normal and t distributions in that it changes its
shape depending on the situation at hand, and it does
not have negative values. Figure 14. 6 shows examples
of two Chi-square distributions.
The Chi-square distribution’s shape is deter-
mined by the number of degrees of freedom. The fi g-
ure shows that the greater the degrees of freedom, the
more the curve’s tail is pulled to the right. Or, in other
words, the greater the degrees of freedom, the larger
the Chi-square value must be to fall in the rejection
region for the null hypothesis.
It is a simple matter to determine the number of
degrees of freedom. In a cross-tabulation table, the
degrees of freedom are found through the following
formula:
Formula for Chi-square degrees of freedom
Degrees of freedom = (r - 1)(c - 1)
where
r = the number of rows
c = the number of columns
A table of Chi-square values contains critical points that determine the break between the
acceptance and rejection regions at various levels of signifi cance. It also takes into account
the number of degrees of freedom associated with each curve. That is, a computed Chi-square
value says nothing by itself—you must consider the number of degrees of freedom in the
cross-tabulation table because more degrees of freedom indicate higher critical Chi-square
For doing a great job, do these blue-collar workers want their boss
to buy them a Michelob Ultra? Cross-tabulation can answer this
question.
0
Chi-square curve for4 degrees of freedom
Chi-square curve for6 degrees of freedom
Rejection region is theright-hand end of curve
FIGURE 14 .6 The Chi-Square Curve’s Shape Depends on Its Degrees of Freedom
The Chi-square distribution’s shape changes depending on the number of degrees of freedom.
© C
athy
Yeu
let/
123r
f
M14_BURN3261_08_GE_C14.indd 395M14_BURN3261_08_GE_C14.indd 395 17/08/16 4:07 pm17/08/16 4:07 pm

396 CHAPTER 14 • MAKING USE OF ASSOCIATIONS TESTS
table values for the same level of signifi cance. The logic of this situation stems from the
number of cells. With more cells, there is more opportunity for departure from the expected
values. The higher table values adjust for potential infl ation due to chance alone. After all, we
want to detect real nonmonotonic relationships, not phantom ones.
SPSS and virtually all computer statistical analysis programs have Chi-square tables in
memory and display the probability of the null hypothesis. Let us repeat this point: The pro-
gram itself will take into account the number of degrees of freedom and determine the prob-
ability of support for the null hypothesis. This probability is the percentage of the area under
the Chi-square curve that lies to the right of the computed Chi-square value. When rejection
of the null hypothesis occurs, we have found a statistically signifi cant nonmonotonic associa-
tion existing between the two variables. 9 With our Michelob Ultra example, the degrees of
freedom is 1, and the critical Chi-square value is 3.841, so because 81.64 is greater, there is
less than 5% support for the null hypothesis. A statistically signifi cant association does exist.
HOW TO INTERPRET A CHI-SQUARE RESULT How does one interpret a Chi-square result? Chi-square analysis yields the amount of support
for the null hypothesis if the researcher repeated the study many, many times with indepen-
dent samples. By now, you should be well acquainted with the concept of many, many inde-
pendent samples. For example, if the Chi-square analysis yielded a .02 signifi cance level for
the null hypothesis, the researcher would conclude that only 2% of the time would he or she
fi nd evidence to support the null hypothesis. Since the null hypothesis is not supported, this
means there is a signifi cant association.
It must be pointed out that Chi-square analysis is simply a method to determine whether
a statistically signifi cant nonmonotonic association exists between two variables. Chi-square
does not indicate the nature of the association, and it indicates only roughly the strength of
association by its size. It is best interpreted as a prerequisite to looking more closely at the
two variables to discern the nature of the association that exists between them. That is, the
Chi-square test is another one of our “signal lights” telling us whether or not it is worthwhile
to inspect all those rows and columns percentages. Read Marketing Research Insight 14. 3
to see how cross-tabulation fi ndings are used to identify the demographic profi les of Indian
hypermarket shoppers.
Computer statistical programs look up table Chi-square values and display the probability of support for the null hypothesis.
The computed Chi-square value is compared to a table value to determine statistical signifi cance.
A signifi cant Chi-square means the researcher should look at the cross-tabulation row and column percentages to “see” the association pattern.
Cross-Tabulation Discovers Indian Hypermarket Shopper Segment Profi les In India, as in many countries experiencing modernization and growth in the retail sector, one of the fastest-growing retail for-mats is the hypermarket. A hypermarket, popularly known as a “superstore” in the United States, is a very large department store–supermarket facility where shoppers can buy a very wide variety of merchandise as well as groceries without having to travel or otherwise patronize several stores on the same shop-ping trip. The growth rate of Indian hypermarkets is nothing short of phenomenal, and the competition is intense as several national and multinational retail companies are locked in battle for shares of the immense Indian consumer market.
An interesting aspect of the Indian consumer market is that many shoppers are distrustful of giant and impersonal grocery
markets. That is, they prefer traditional, small, local food ven-dors where they can fully inspect the items and engage in bargaining and bartering as have taken place for generations in India. As with other countries that have experienced rapid transition from agrarian to urban venues, hypermarkets are replacing local food vendors, but not all consumers have com-pletely embraced the hypermarket concept, even though they are being forced to shop in them. To better understand Indian hypermarket shoppers and to identify important demographic segments, researchers 10 recently surveyed shoppers patroniz-ing a typical Indian hypermarket as well as shoppers patron-izing traditional grocery stores. These researchers discovered four shopper segments that they labeled as follows: Utilitarian,
MARKETING RESEARCH INSIGHT 14. 3 Global Application
M14_BURN3261_08_GE_C14.indd 396M14_BURN3261_08_GE_C14.indd 396 17/08/16 4:07 pm17/08/16 4:07 pm

14-7 CHI-SQUARE ANALYSIS 397
Maximizer, Enthusiast, and Browser. The Utilitarian shopper segment is comprised of shoppers who just want to buy items without any fanfare whatsoever and with minimal effort. Max-imizer shoppers are similar to Utilitarian shoppers in that they want the one-stop, easy access aspects of hypermarkets, but they enjoy their shopping trips and consider them recreational and entertaining as well as functional. Enthusiast shoppers are like Maximizers, but they also seek social aspects such as being in shopper crowds and just watching other shoppers. Finally, Browser shoppers greatly enjoy the social aspects of being with and observing other shoppers, but they are not on purchasing missions as are the other segment shoppers. With respect to the total hypermarket shopper population, Utilitar-ians account for about 25%, Maximizers account for about 33%, Enthusiasts are about 12%, and Browsers constitute the last 33%.
The researchers then used cross-tabulations and Chi-square analysis to determine distinct demographic profi les of these shopper segments. They found signifi cant associa-tions with four demographic variables: gender, marital sta-tus, age, and education. The stacked bar graphs for gender and marital status reveal that Utilitarians tend to be married females, Maximizers are married males or females, Enthu-siasts tend to be married males, and Browsers are largely single males.
The two bar graphs reveal the age and education profi les of these hypermarket shopper segments. Utilitarians tend to have college degrees and are 30 years old or more; Maximizers also have college degrees but are more likely to be in the 30–49 age range. Enthusiasts are quite similar to Utilitarians with respect to age and education, whereas Browsers are somewhat lower in education and younger in age than other segments.
0%Utilitarian
(%)Maximizer
(%)Enthusiast
(%)Browser
(%)
20%
40%
80%
60%
100%Gender
64%
36%
48%
52%
38%
63%
22%
78%
Male Female
0%Utilitarian
(%)Maximizer
(%)Enthusiast
(%)Browser
(%)
20%
40%
80%
60%
100%Marital Status
18%
82%
10%
90%
21%
79%
70%
30%
Married Single
0%Utilitarian
(%)
10%
20%
40%
30%
50%
60%
70%
Age
Under 30 30–49 Over 50
Maximizer(%)
Enthusiast(%)
Browser(%)
14%
44%
42%
10%
63%
27%
21%
50%
29%
47%
42%
12%
0%Utilitarian
(%)
10%
20%
40%
30%
50%
60%
70%Education
High school Graduate Postgraduate
Maximizer(%)
Enthusiast(%)
Browser(%)
12%
52%
36%
8%52
%40
%
17%
50%
33%
30%
57%
13%
M14_BURN3261_08_GE_C14.indd 397M14_BURN3261_08_GE_C14.indd 397 17/08/16 4:07 pm17/08/16 4:07 pm

398 CHAPTER 14 • MAKING USE OF ASSOCIATIONS TESTS
INTEGRATED CASE
Auto Concepts: Analyzing Cross-Tabulations for Signifi cant Associations by Performing Chi-Square Analysis with SPSS We are going to use our Auto Concepts survey data to demonstrate how to perform and inter-
pret cross-tabulation analysis with SPSS. You should recall that we have several demographic
variables including gender and marital status. We will take gender as one of the nominal
variables. For the second nominal variable, we will take the preferred magazine type. Thus,
we are investigating the possible association of gender (male versus female) and favorite
magazine type (Business & Money; Music & Entertainment; Family & Parenting; Sports &
Outdoors; Home & Garden; Cooking, Food & Wine; Trucks, Cars & Motorcycles; or News,
Politics & Current Events).
The clickstream command sequence to perform a Chi-square test with SPSS is
ANALYZE-DESCRIPTIVE STATISTICS-CROSSTABS, which leads to a dialog box in
which you can select the variables for Chi-square analysis. In our example in Figure 14. 7 ,
we have selected Gender as the column variable, and Favorite magazine type as the row vari-
able. There are three option buttons at the bottom of the box. The Cells … option leads to the
specifi cation of observed frequencies, expected frequencies, row percentages, column per-
centages, and so forth. We have opted for just the observed frequencies (raw counts) and the
row percents. The Statistics … button opens up a menu of statistics that can be computed from
cross-tabulation tables. Of course, the only one we want is the Chi-square option.
The resulting output is found in Figure 14. 8 . In the top table, you can see that we have
variable and value labels, and the table contains the raw frequency as the fi rst entry in each
cell. Also, the row percentages are reported along with each row and column total. In the
second table, there is information on the Chi-square analysis result. For our purposes, the
FIGURE 14 .7 IBM SPSS Clickstream to Create Cross-Tabulations with Chi-Square Analysis
Source: Reprint Courtesy of International Business Machines Corporation, © International Business Machines Corporation.
With SPSS, Chi-square is an option under the “Crosstabs” analysis routine.
M14_BURN3261_08_GE_C14.indd 398M14_BURN3261_08_GE_C14.indd 398 17/08/16 4:07 pm17/08/16 4:07 pm

14-7 CHI-SQUARE ANALYSIS 399
only relevant statistic is the “Pearson Chi-square,” which you can see has been computed
to be 16.671. The df column pertains to the number of degrees of freedom, which is 7;
and the Asymp. Sig. corresponds to the probability of support for the null hypothesis.
Signifi cance in this example is .020, which means that there is practically no support for
the hypothesis that Gender and Favorite magazine type are not associated. In other words,
they are related.
SPSS has eff ected the fi rst step in determining a nonmonotonic association. Through
Chi-square analysis, it has signaled that a statistically signifi cant association actually exists.
The next step is to fathom the nature of the association. Remember that with a nonmono-
tonic relationship, you must inspect the pattern and describe it verbally. We can ask the
question, “Which gender is reading what magazine type?” Remember that the pattern is a
matter of degree, not “on versus off .” Look at the column percents in Figure 14. 8 , and you
will see some magazine types that garner proportionally more male readers: Trucks, Cars
& Motorcyles; Cooking, Food & Wine; and Sports & Outdoors. The other magazine types
have somewhat balanced readership profi les with respect to gender. You can interpret this
fi nding in the following way: If Auto Concepts wants to communicate to prospective male
automobile buyers, it should use the magazine types they prefer; if it desires to communi-
cate to prospective female buyers, it should not use these types, as women do not prefer to
read them.
In other words, because the signifi cance is less than .05, it is worthwhile to inspect and
interpret the percentages in the cross-tabulation table. By doing this, we can discern the pat-
tern or nature of the association, and the percentages indicate its relative strength. More
importantly, because the relationship was determined to be statistically signifi cant, you can be
assured that this association and the relationship you have observed will hold for the popula-
tion that this sample represents.
FIGURE 14 .8 IBM SPSS Output for Cross-Tabulations with Chi-Square Analysis
Source: Reprint Courtesy of International Business Machines Corporation, © International Business
Machines Corporation.
IBM SPSS Student Assistant: Setting Up and Analyzing Cross-Tabulations
With Chi-square analysis, interpret the SPSS signifi cance level as the amount of support for no association between the two variables being analyzed.
M14_BURN3261_08_GE_C14.indd 399M14_BURN3261_08_GE_C14.indd 399 17/08/16 4:07 pm17/08/16 4:07 pm

400 CHAPTER 14 • MAKING USE OF ASSOCIATIONS TESTS
14- 8 Reporting Cross-Tabulation Findings to Clients Whenever the researcher fi nds a statistically signifi cant cross-tabulation relationship, he or
she moves to the presentation phase. When we introduced the notion of relationship or asso-
ciation analysis, we noted that characterizing the direction and strength of nonmonotonic
relationships is not possible because nominal scales are involved. Nominal scales do not have
order or magnitude; they are simply categories or labels that uniquely identify the data. As
you have learned in our descriptions of the various tables possible with cross-tabulations, per-
centages are easily prepared, and percentages can usually depict nonmonotonic relationships
quite well. In addition, to reveal the nonmonotonic relationships found to be signifi cant in
cross-tabulation tables, researchers often turn to graphical presentations, as pictures will show
the relationships very adequately. We have created Marketing Research Insight 14. 4 , which
describes alternative ways to present the fi ndings of cross-tabulation relationships analyses to
clients.
14- 9 Special Considerations in Association Procedures While cross-tab is not common, it is unfortunate that the word correlation is used in everyday
language, because statistical correlations are sometimes misunderstood by clients. 11 We will
discuss each of four cautions to keep in mind when working with associations—either corre-
lations or cross-tabulations. First, we will reiterate that the correlation coeffi cient discussed in
this section assumes that both variables share interval-scaling assumptions at minimum. If the
two variables have nominal-scaling assumptions, the researcher would use cross-tabulation
analysis. Second, the association analyses in this chapter take into consideration only the
relationship between two variables. They do not take into consideration interactions with any
other variables. In fact, you must explicitly assume that all other variables do not have any
bearing on the relationship with the two variables of interest. All other factors are considered
to be constant or “frozen” in their bearing on the two variables under analysis.
Third, association analysis and especially the correlation coeffi cient explicitly do not
assume a cause-and-eff ect relationship , which is a condition of one variable bringing about
the other variable. For instance, although you might be tempted to believe that more company
salespeople cause more company sales or that an increase in the competitor’s sales force in
a territory takes away sales, correlation should not be interpreted to demonstrate such cause-
and-eff ect relationships. 12 Just think of all of the other factors that aff ect sales: price, product
quality, service policies, population, advertising, and more. It would be a mistake to assume
that just one factor causes sales. Instead, a correlation coeffi cient merely investigates the pres-
ence, strength, and direction of a linear relationship between two variables. Similarly, cross-
tabulation investigates only the presence and pattern of a nonmonotonic relationship between
two variables.
Fourth and fi nally, the Pearson product moment correlation expresses only linear rela-
tionships. Consequently, a correlation coeffi cient result of approximately zero does not
To learn about cross-tabulation and Chi-square analysis,
launch www.youtube.com , and search for “Interpreting the SPSS Output for a Chi Square Analysis.”
Active Learning
Practice Cross-Tabulation Analysis with SPSS
To make certain that you can perform SPSS cross-tabulation with Chi-square analysis, use the Auto Concepts SPSS dataset and replicate the Gender–Favorite magazine type analysis just described. When you are convinced that you can do this analysis correctly and interpret the output, use it to see if there is an association between marital status and favorite magazine type. What about marital status and newspaper reading habits?
Bar charts can be used to “see” a nonmonotonic relationship.
Association does not demonstrate cause and effect.
M14_BURN3261_08_GE_C14.indd 400M14_BURN3261_08_GE_C14.indd 400 17/08/16 4:07 pm17/08/16 4:07 pm

14-9 SPECIAL CONSIDERATIONS IN ASSOCIATION PROCEDURES 401
Guidelines for the Reporting of Cross-Tabulation Findings Using Column and Row Percents A question that quickly arises whenever a researcher fi nds a statistically signifi cant relationship in a cross-tabulation analy-sis is “Should I report the row percents, or should I report the column percents?” The answer to this question depends on the research objective that fostered the nominal questions on the survey. Take, for instance, the following signifi cant cross-tabulation fi nding for the Subshop.
Column Percents Table
Size of Sandwich Ordered Males Females
Jumbo size 50% 5%
Large size 40% 20%
Regular size 10% 75%
Total 100% 100%
Rows Percents Table
Size of Sandwich Ordered Males Females Total
Jumbo size 90% 10% 100%
Large size 67% 33% 100%
Regular size 13% 87% 100%
If the research question is “Who orders what size of sand-wich?” the rows percents table is appropriate as it indicates that males tend to order the Jumbo size and the Large size (90% and 67%, respectively), while females tend to be the ones who order the Regular size (87%). However, if the research
question is “What do males versus females order?” then the column percents table is appropriate, as it indicates that males order Jumbo and Large sizes (50% and 40%), while females order the Regular size (75%). You should remember that we described a nonmonotonic relationship as an identifi able asso-ciation where the presence of one variable is paired with the presence (or absence) of another, so the relationships are not 100% versus 0%; rather, it is a degree or relative presence that exists in the population. Study our two presentation tables, and you will notice that we have used shading to help you under-stand how the percents are computed. That is, the males and females columns are different shades, as they express percents within each gender. Similary, the sandwich size rows are differ-ent shades, as they represent percents within each sandwich size. We have also used bold font to emphasize where the per-cents reveal especially strong relationships.
Using Stacked Bar Charts A handy graphical tool that illustrates a nonmonotonic relation-ship is a stacked bar chart. With a stacked bar chart, two vari-ables are accommodated simultaneously in the same bar graph. Each bar in the stacked bar chart stands for 100%, and it is divided proportionately by the amount of relationship that one variable shares with the other variables. You saw stacked bar charts in the graphs for gender and marital status in Marketing Research Insight 14. 3 . Thus, a stacked bar chart is an excellent visual display of row or column percents in a cross-tabulation table. For instance, you can see in the following fi gures that the two Subshop cross-tabulation percents tables have been used to create the visual displays.
MARKETING RESEARCH INSIGHT 14. 4 Practical Application
0%Jumbo
SizeLargeSize
RegularSize
20%
40%
80%
60%
100%
Gender Preferences for EachSandwich Size
10%
90%
33%
67%
87%
13%
Male Female
0%Males Females
20%
40%
80%
60%
100% 10%
50%
40% 75%
20%5%
Sandwich Size Ordered byMales Versus Females
Regular SizeLarge SizeJumbo Size
M14_BURN3261_08_GE_C14.indd 401M14_BURN3261_08_GE_C14.indd 401 17/08/16 4:07 pm17/08/16 4:07 pm

402 CHAPTER 14 • MAKING USE OF ASSOCIATIONS TESTS
Key Terms
Associative analyses (p. 378 )
Relationship (p. 378 )
Linear relationship (p. 378 )
Straight-line formula (p. 379 )
Curvilinear relationship (p. 379 )
Monotonic relationships (p. 379 )
Nonmonotonic relationship (p. 380 )
Correlation coeffi cient (p. 382 )
Covariation (p. 382 )
Scatter diagram (p. 383 )
Pearson product moment correlation
(p. 384 )
Cross-tabulation table (p. 390 )
Cross-tabulation cell (p. 390 )
Frequencies table (p. 392 )
Raw percentages table (p. 392 )
Column percentages table (p. 392 )
Row percentages table (p. 392 )
Chi-square ( x2 ) analysis (p. 393 )
Observed frequencies (p. 393 )
Expected frequencies (p. 393 )
Chi-square formula (p. 394 )
Chi-square distribution (p. 395 )
Cause-and-eff ect relationship (p. 400 )
necessarily mean that the scatter diagram that could be drawn from the two variables defi nes a
formless ball of points. Instead, it means that the points do not fall in a well-defi ned elliptical
pattern. Any number of alternative, curvilinear patterns such as an S-shape or a J-shape pat-
tern are possible, and the linear correlation coeffi cient would not be able to communicate the
existence of these patterns to the marketing researcher. Only those cases of linear or straight-
line relationships between two variables are identifi ed by the Pearson product moment cor-
relation. In fact, when a researcher does not fi nd a signifi cant or strong correlation, but still
believes some relationship exists between two variables, he or she may resort to running a
scatter plot. This procedure allows the researcher to visually inspect the plotted points and
possibly to spot a systematic nonlinear relationship. Your SPSS program has a scatter plot
option that will provide a scatter diagram that you can use to obtain a sense of the relation-
ship, if any exists, between two variables.
Correlation will not detect nonlinear relationships between variables.
Summary
This chapter deals with instances in which a marketing
researcher wants to see if there is a relationship between
the responses to one question and the responses to another
question in the same survey. Four diff erent types of rela-
tionship are possible. First, a linear relationship is char-
acterized by a straight-line appearance if the variables are
plotted against one another on a graph. Second, a curvi-
linear relationship means the pattern has a defi nite curved
shape. Third, a nonmonotonic relationship indicates that
the presence (or absence) of a label for one nominal vari-
able is sytematically associated with the presence (or
absence) of a label for another nominal variable. Fourth
and fi nally, a monotonic relationship indicates the direction
of one variable relative to the direction of the other vari-
able. In the cases of linear relationships and nonmonotonic
relationships in this chapter, association analyses to assess
these relationships statistically are described.
Associations can be characterized by presence, direc-
tion, and strength, depending on the scaling assumptions
of the questions being compared. These characteristics are
readily seen in correlation analysis. A correlation coeffi -
cient is an index number, constrained to fall between +1.0
and −1.0, that communicates both the strength and the
direction of association between two variables. The sign
indicates the direction of the relationship, and the absolute
size indicates the strength of the association. Normally,
correlations in excess of ±.8 are considered high. With
two questions that are interval and/or ratio in their scal-
ing assumptions, the Pearson product moment correlation
coeffi cient is appropriate as the means of determining the
underlying linear relationship. A scatter diagram can be
used to inspect the pattern.
With Chi-square analysis, a cross-tabulation table is
prepared for two nominally scaled questions, and the Chi-
square test statistic is computed to determine whether the
observed frequencies (those found in the survey) diff er sig-
nifi cantly from what would be expected if there were no
nonmonotonic relationship between the two. If the null
hypothesis of no relationship is rejected, the researcher
then looks at the cell percentages to identify the underlying
pattern of association.
With correlations as well as cross-tabulations, it is
important to keep in mind that only two variables are being
examined and that all other variables are explicitly assumed
to not have infl uence in the relationship. Also, while it is
tempting to do so, one should not infer any “cause-and-
eff ect” relationship exists between the two variables. Cor-
relations should be envisioned within the context of the
linear relationship assumptions that underpin them, and
cross-tabulation relationships should be interpreted with
the appropriate percentages, using tables or helpful bar
charts to display the patterns that have been discovered.
M14_BURN3261_08_GE_C14.indd 402M14_BURN3261_08_GE_C14.indd 402 17/08/16 4:07 pm17/08/16 4:07 pm

REVIEW QUESTIONS/APPLICATIONS 403
Review Questions/Applications
14- 1. Explain the distinction between a statistical rela-
tionship and a causal relationship.
14- 2. Defi ne and provide an example for each of the fol-
lowing types of relationship: (a) linear, (b) curvilin-
ear, (c) nonmonotonic, and (d) monotonic.
14- 3. Relate the three diff erent aspects of a relationship
between two variables.
14- 4. Do association analysis and the correlation coeffi -
cient explicitly assume a cause-and-eff ect relation-
ship? State the reasons for your answer.
14- 5. Briefl y describe the connections among the follow-
ing: covariation, scatter diagram, correlation, and
linear relationship.
14- 6. Indicate, with the use of a scatter diagram, the gen-
eral shape of the scatter of data points in each of the
following cases: (a) a strong positive correlation,
(b) a weak negative correlation, (c) no correlation,
(d) a correlation of −.98.
14- 7. What must be determined before using correlation?
Why is it essential?
14- 8. What are the scaling assumptions assumed by
Pearson product moment correlation?
14- 9. What is the advantage of reporting cross-tabulation
fi ndings through a stacked bar chart?
14- 10. With respect to Chi-square analysis, describe
or identify each of the following: (a) r × c table,
(b) frequencies table, (c) observed frequencies,
(d) expected frequencies, (e) Chi-square distribution,
(f) signifi cant association, (g) scaling assumptions,
(h) row percentages versus column percentages, and
(i) degrees of freedom.
14- 11. Listed here are various factors that may have rela-
tionships that are interesting to marketing managers.
With each one, (1) identify the type of relationship,
(2) indicate its nature or direction, and (3) specify
how knowledge of the relationship could help a
marketing manager in designing marketing strategy.
a. The amount (number of minutes per day) of time
spent reading certain sections of the Sunday
newspaper and age of the reader for a sporting
goods retail store.
b. Subscription to the local television cable com-
pany versus online TV viewing and household
income (low or high) for a telemarketing service
being used by a public television broadcasting
station soliciting funds.
c. Number of miles driven in company cars and need
for service such as oil changes, tune-ups, or fi lter
changes for a quick auto service chain attempting
to market fl eet discounts to companies.
d. Plans to take a fi ve-day vacation to Jamaica and
the exchange rate of the Jamaican dollar to that
of other countries for Sandals, an all-inclusive
resort located in Montego Bay.
e. Homeowners opting for do-it-yourself home
repairs and state of the economy (for example, a
recession or a boom) for Ace Hardware stores.
14- 12. Indicate the presence, nature, and strength of the
relationship involving purchases of intermediate-
size automobiles and each of the following factors:
(a) price, (b) fabric versus leather interior, (c) exte-
rior color, and (d) size of rebate.
14- 13. With each of the following examples, compose a
reasonable statement of an association you would
expect to fi nd existing between the factors involved,
and construct a stacked bar chart expressing that
association.
a. Wearing braces to straighten teeth by children
attending expensive private schools versus those
attending public schools.
Correct Answers for Marketing Research Insight 14. 1
Fans of This Brand or Topic Have What Musical Preference?
Ciroc vodka Hip-hop and rap artists
Craft beers Jam bands (Phish, Umphrey’s McGee)
EA’s console sports games Rap and hip-hop artists (Ice Cube, Nas)
Harrods Andrew Lloyd Webber
Motorola Younger artists like Miley Cyrus, the Jonas Brothers
NHL Bruce Springsteen and Pink Floyd
NPR Classic rock stars such as the Beatles, Jimi Hendrix, etc.
Travel Channel Rock and country rock artists, like Meat Loaf, Kid Rock
Victoria’s Secret Pink brand American Idol alt-rocker Chris Daughtry
M14_BURN3261_08_GE_C14.indd 403M14_BURN3261_08_GE_C14.indd 403 30/08/16 11:06 am30/08/16 11:06 am

404 CHAPTER 14 • MAKING USE OF ASSOCIATIONS TESTS
CASE 14. 1
L’Experience Félicité Restaurant Survey Associative Analysis
(For necessary background, read Case 12. 1 on page 346 ,
and Case 13. 1 on page 375 .)
Cory Rogers calls in his marketing intern, Christine
Yu, and says, “I am going to be in San Francisco attend-
ing the AMA Marketing Research Event for three days, but
I need you to make progress on the L’Experience Félicité
Restaurant survey. I know you might be a bit lost with this
project, but why don’t you take a look at the proposal, and
see if there is any further analysis that you can do while I
am out. Have Tonya pull the proposal from the fi le.” Chris-
tine immediately looks at the research proposal, and she
jots down some notes with respect to research questions
that need to be addressed. Her notes follow.
Your task in Case 14. 1 is to use the L’Experience
Félicité Restaurant SPSS dataset and perform the proper
analysis. You will also need to interpret the fi ndings.
1. Perform the correct analysis and interpret your fi ndings
with regard to the L’Experience Félicité Restaurant
menu, décor, and atmosphere for those people who pre-
fer to drive less than 30 minutes to get to the restaurant.
2. Do older or younger people want unusual desserts and/
or unusual entrées?
3. Use the variable that distinguishes the “Probable
patrons” of L’Experience Félicité Restaurant (Likely
to patronize = 1 or 2) from the “Not probable patrons”
(Likely to patronize = 3, 4, or 5). If the probable
b. Having a Doberman pinscher as a guard dog, use
of a home security alarm system, and ownership
of rare pieces of art.
c. Adopting MyPlate eating style recommended by
the U.S. Department of Argiculture and family
history of heart disease.
d. Purchasing toys as gifts during the Christmas
buying season versus other seasons of the year
by parents of preschool-aged children.
14- 14. Following is some information about 10 respon-
dents to a mail survey concerning candy purchases.
Use SPSS to construct the four diff erent types of
cross-tabulation tables that are possible. Label each
table and indicate what you perceive to be the gen-
eral relationship apparent in the data.
RespondentBuy Plain
M&MsBuy Peanut
M&Ms
1 Yes No
2 Yes No
3 No Yes
4 Yes No
5 No No
6 No Yes
7 No No
8 Yes No
9 Yes No
10 No Yes
14- 15. Morton O’Dell is the owner of Mort’s Diner,
which is located in downtown Atlanta, Georgia.
Mort’s opened up about 12 months ago, and it has
experienced success. But Mort is always worried
about what food items to order on a weekly basis
because, on some weeks, Mort has excess inven-
tory, such as too much fi sh that must be discarded.
Mort’s daughter, Mary, is an M.B.A. student at
Georgia State University, and she off ers to help
her father. She asks him to provide sales data for
the past 10 weeks in terms of total pounds of food
bought by customers. With some diffi culty, Mort
comes up with the following numbers.
Week Meat Fish Fowl Vegetables Desserts
1 100 50 150 195 50
2 91 55 182 200 64
3 82 60 194 209 70
4 75 68 211 215 82
5 66 53 235 225 73
6 53 61 253 234 53
7 64 57 237 230 68
8 76 64 208 221 58
9 94 68 193 229 62
10 105 58 181 214 62
Mary uses these sales fi gures to construct scatter
diagrams that illustrate the basic relationships among
the various types of food items purchased at Mort’s
Diner over the past 10 weeks. She tells her father
that the diagrams provide some help in his weekly
inventory ordering problem. Construct Mary’s scat-
ter diagrams with SPSS to indicate what assistance
they are to Mort. Perform the appropriate associated
analysis with SPSS and interpret your fi ndings.
M14_BURN3261_08_GE_C14.indd 404M14_BURN3261_08_GE_C14.indd 404 17/08/16 4:07 pm17/08/16 4:07 pm

REVIEW QUESTIONS/APPLICATIONS 405
Cory Rogers of CMG Research was very pleased with the
way the Auto Concepts project was shaping up. Celeste
Brown, the CMG data analyst, had applied diff erences
analysis using the desirability measures for the various
alternative automobile models that might be developed,
and she had found a unique demographic target market
profi le for each model. Celeste had summarized her fi nd-
ings into a professional PowerPoint presentation that Cory
and Celeste presented to Nick Thomas and his assembled
managers just yesterday. The presentation was one of the
smoothest possible, and Nick’s development team mem-
bers became very excited and animated when they realized
that Auto Concepts had a possibility of multiple “winner”
model vehicles to work with. In fact, at the end of the meet-
ing, Nick had decided to go ahead with a preliminary mar-
keting plan for each model.
Nick informed Cory and Celeste that all automobile
companies place a huge amount of emphasis on commu-
nications, investing millions of dollars every year in many
diff erent types of advertising to convince prospective cus-
tomers that their models are the best possible choices.
Nick explained, “Everything is based on solid marketing
research that reveals the media usage characteristics of
each target market. That is why I insisted on including the
media usage information in our Auto Concepts survey. My
superiors will most certainly shoot us down if we come to it
with any preliminary marketing plan for any proposed auto-
mobile model that does not have advertising recommenda-
tions based on media usage research. I did not realize at the
time that we would be working on all fi ve models, but each
of my development teams will need whatever media usage
fi ndings you can come up with for its particular model.”
Cory and Celeste are in a meeting the following day
to discuss further analysis for the Auto Concepts project.
Cory says, “I recall that we have a lot of detail on the media
habits of the survey respondents. Let’s see, it includes
favorite television show type, radio genre, magazine type,
and local newspaper section as well as four diff erent types
of social marketing media. Nick Thomas called this morn-
ing and asked if we could have our fi ndings to him inside
of a week, so I guess he and his team are moving very fast.
Nick also told me that the advertising agency they use has
strong preferences as to which demographic factors should
be used for the diff erent media. Nick says that for radio
they prefer to use age; for newspaper and television, they
prefer to use education; and for magazines, they prefer
to use income. Social media are somewhat new, so if you
could fi nd distinct profi les for these, it would be like icing
on the cake.”
Celeste says, “I can get to it by the end of this week
and have it ready to present early next week, assuming no
glitches.” Cory concludes the meeting by saying, “Great,
just let me know on Friday morning how it is coming,
as I told Nick I will call him on that day to set up the
presentation.”
Your task in Case 14. 2 is to revisit Case 13. 2 where
Celeste used differences analyses to find the unique
demographic profi les for each of the fi ve possible new
models.
a. “Super Cycle,” One-Seat All Electric, mpg-e rating
125; estimated MSRP (manufacturer’s suggested
retail price) $30,000; range 200 miles.
b. “Runabout Sport,” Two-Seat All Electric, mpg-e 99;
estimated MSRP $35,000; range 150 miles.
c. “Runabout Hatchback,” Two-Seat Gasoline Hybrid,
mpg-e 50; runs on battery for 50 miles and then
switches to gas engine; estimated MSRP $35,000;
range 250 miles.
d. “Economy Hybrid,” Four-Seat Diesel Hybrid,
mpg-e 75; runs on battery for 75 miles and then
switches to effi cient diesel engine; estimated MSRP
$38,000; range 300 miles.
e. “Economy Standard,” Five-Seat Standard Gasoline,
mpg 36; runs on gasoline with computer control
for maximum effi ciency; estimated MSRP $37,000;
range 350 miles.
1. Use each unique automobile model demographic pro-
fi le to determine whether or not statistically signifi cant
associations exist, and if they do, recommend the spe-
cifi c media vehicles for radio, newspaper, television,
and magazines. Do not forget to use the advertising
division’s preferred demographic for each medium.
2. What is the social media profi le of each of the possible
target markets, and what are the implications of this
fi nding for the placement of advertising messages that
would “speak” to this market segment when the auto-
mobile model is introduced?
CASE 14. 2 INTEGRATED CASE
The Auto Concepts Survey Associative Analysis
patrons constitute L’Experience Félicité Restaurant’s
target market, what is the demographic makeup of this
target market? Use the demographics of household
income, education level, gender, and ZIP code.
4. Is City Magazine a viable advertising medium for
Jeff Dean to use? Apart from this question, are there
other viable promotion vehicles that Jeff should know
about?
M14_BURN3261_08_GE_C14.indd 405M14_BURN3261_08_GE_C14.indd 405 17/08/16 4:07 pm17/08/16 4:07 pm

▶
LEARNING OBJECTIVES In this chapter you will learn:
15- 1 What bivariate linear regression analysis is, including basic concepts such as terms, assumptions, and equations
15- 2 What multiple regression analysis is, including the basic underlying conceptual model, terms, assumptions, and computations
15- 3 What stepwise multiple regression is, including how to do it with SPSS
15- 4 Some warnings regarding the use of multiple regression analysis
15- 5 How to report multiple regression fi ndings to clients
“WHERE WE ARE”
1 Establish the need for marketing
research.
2 Defi ne the problem.
3 Establish research objectives.
4 Determine research design.
5 Identify information types and
sources.
6 Determine methods of accessing data.
7 Design data collection forms.
8 Determine the sample plan and size.
9 Collect data.
10 Analyze data.
11 Prepare and present the fi nal
research report.
MESH Experience
In 2006 MESH was set up to help clients make
quicker and smarter decisions about their mar-
keting and trade investment. Brand growth
is driven by all experiences people have with
brands, yet half or more typically go unmea-
sured. By taking an experience-driven market-
ing approach and capturing how people come
into contact with brands in real time (real-time
experience tracking—RET), MESH helps clients
measure and create experiences that grow brands, people, and society.
With over a million experiences collected across many countries during the
last decade, MESH has a rich dataset to mine to understand how people
experience brands today.
MESH operates globally out of offi ces in New York, London, Sao
Paulo, and Singapore (entity and virtual team) servicing annual and ad
hoc contracts for clients across a variety of sectors including fi nancial
services, the automotive industry, airlines, electronics, utilities, mobile
networks, and packaged goods. Major clients include LG Electronics,
Delta Air Lines, Diageo, General Motors, Unilever, Heineken, PepsiCo,
and Latin American Airlines.
What sets MESH apart is its development of innovative and bespoke
tools to help CEOs and marketers have the right information at their
fi ngertips just when they need it. Experience-driven marketing provides
a human-centered approach in a complex world. It can unlock new
opportunities for brand growth.
MESH’s state-of-the-art Experience Intelligence Unit has developed
proprietary tools and interfaces to provide clients with data today that
predict customers’ behavior tomorrow. New experience metrics trans-
form a marketer’s ability to take action. For instance, share of experience
is much more predictive of brand growth than share of voice .
15 Understanding Regression Analysis Basics
Fiona Blades, chief
experience offi cer,
MESH Experience
M15_BURN3261_08_GE_C15.indd 406M15_BURN3261_08_GE_C15.indd 406 30/08/16 11:21 am30/08/16 11:21 am

407
Pioneering the Real-time Experience Tracking (RET)™ market, MESH cap-
tures every way customers come into contact with a client’s brand and its com-
petitors’ brands. Harvard Business Review (September 2012) described RET as
“a new tool (that) radically improves marketing research.”
Sustainable research offers companies a unique way of getting a deeper
customer understanding while building sustainability credentials. This award-
winning work with PepsiCo in Brazil acted as a change agent for Pepsi stakeholders to under-
stand the emerging middle class. MESH business strategists work with researchers to provide
robust information that clearly signals the actions needed by a client’s team.
Source: Text and photos courtesy of Fiona Blades, President and Chief Experience Offi cer, MESH.
T his chapter takes up the subject of multiple regression analysis. Undoubtedly, your
reading of Fiona Blades’s company clued you into the fact that an important goal
of marketing research is insight, the deeper the better. Your own perceptive insight
should alert you to the fact that we are going to describe a very complex analytical technique.
We will endeavor to describe multiple regression analysis in a slow and methodical manner,
and when we end our description, we will warn you that, while you have learned to run it and
interpret its findings, we have barely scratched the surface of this complicated analysis.
15- 1 Bivariate Linear Regression Analysis In this chapter, we will deal exclusively with linear regression analysis, a predictive model
technique often used by marketing researchers. However, regression analysis is a complex sta-
tistical technique with a large number of requirements and nuances. 1 Because this chapter is
basically an introduction to this area, we will remind you toward the end of the material that
there are a great many aspects of regression analysis that are beyond the scope of this textbook .
We fi rst defi ne regression analysis as a predictive analysis technique in which one or more
variables are used to predict the level of another by use of the straight-line formula. Bivariate regression means only two variables are being
analyzed, and researchers sometimes refer to this
case as “simple regression.” We will review the
equation for a straight line and introduce basic
terms used in regression. We also describe some
basic computations and signifi cance with bivariate
regression. A straight-line relationship underlies regres-
sion, and it is a powerful predictive model.
Figure 15. 1 illustrates a straight-line relation-
ship, and you should refer to it as we describe the
elements in a general straight-line formula. The
formula for a straight-line relationship is shown
here:
Formula for a straight-line relationship
y = a + bx
Visit the MESH Experience at
www.meshexperience.com
With bivariate regression, one variable is used to predict another variable using the formula for a straight line.
x
y
b
a = intercept, the point on the y-axis that the line cuts when x = 0
b = the slope, the change in the linefor each one-unit change in x
a 1
0 FIGURE 15. 1 General Equation for a Straight Line in Graph Form
M15_BURN3261_08_GE_C15.indd 407M15_BURN3261_08_GE_C15.indd 407 17/08/16 12:00 pm17/08/16 12:00 pm
408 CHAPTER 15 • UNDERSTANDING REGRESSION ANALYSIS BASICS
where
y = the predicted variable
x = the variable used to predict y
a = the intercept , or point where the line cuts the y axis when x = 0
b = the slope or the change in y for any one-unit change in x You should recall the straight-line relationship we described underlying the correlation
coeffi cient: When the scatter diagram for two variables appears as a thin ellipse, there is a high
correlation between them. Regression is directly related to correlation.
BASIC CONCEPTS IN REGRESSION ANALYSIS We now defi ne the variables and show how the intercept and slope are computed. Then we use
SPSS output to show how tests of signifi cance are interpreted.
Independent and Dependent Variables As we indicated, bivariate regression analy-
sis is a case in which only two variables are involved in the predictive model. When we
use only two variables, one is termed dependent and the other is termed independent . The
dependent variable is that which is predicted, and it is customarily termed y in the regression
straight-line equation. The independent variable is that which is used to predict the depen-
dent variable, and it is the x in the regression formula. We must quickly point out that the
terms dependent and independent are arbitrary designations and are customary to regression
analysis. There is no cause-and-eff ect relationship or true dependence between the dependent
and independent variables. It is strictly a statistical relationship, not causal, that may be found
between these two variables.
Computing the Slope and the Intercept To compute a (intercept) and b (slope), you
must work with a number of observations of the various levels of the dependent variable
paired with diff erent levels of the independent variable, identical to the scatter diagrams we
illustrated previously when we were demonstrating how to perform correlation analysis.
The formulas for calculating the slope ( b ) and the intercept ( a ) are rather complicated, but
some instructors are in favor of their students learning these formulas, so we have included
them in Marketing Research Insight 15. 1 .
When SPSS or any other statistical analysis program computes the intercept and the
slope in a regression analysis, it does so on the basis of the least squares criterion. The least squares criterion is a way of guaranteeing that the straight line that runs through the points
on the scatter diagram is positioned so as to minimize the vertical distances away from the
line of the various points. In other words, if you draw a line where the regression line is cal-
culated and calculate the distances of all the points away from that line (called residuals ), it
would be impossible to draw any other line that would result in a lower sum of all of those
distances. The least squares criterion guarantees that the line is the one with the lowest total
squared residuals. Each residual is squared to avoid a cancellation eff ect of positive and nega-
tive residuals.
HOW TO IMPROVE A REGRESSION ANALYSIS FINDING When a researcher wants to improve a regression analysis, the researcher can use a scatter dia-
gram to identify outlier pairs of points. An outlier 2 is a data point that is substantially outside
the normal range of the data points being analyzed. As one author has noted, outliers “stick
out like sore thumbs.” 3 When using a scatter diagram to identify outliers, 4 draw an ellipse that
encompasses most of the points that appear to be in an elliptical pattern. 5 Then eliminate outli-
ers from the data and rerun the regression analysis. Generally, this approach will improve the
regression analysis results.
The straight-line equation is the basis of regression analysis.
In regression, the independent variable is used to predict the dependent variable.
Regression is directly related to correlation by the underlying straight-line relationship.
The least squares criterion used in regression analysis guarantees that the “best” straight-line slope and intercept will be calculated.
To learn about linear regression, launch www.youtube.
com , and search for “Intro to Linear Regression.”
M15_BURN3261_08_GE_C15.indd 408M15_BURN3261_08_GE_C15.indd 408 17/08/16 12:00 pm17/08/16 12:00 pm

15-1 BIVARIATE LINEAR REGRESSION ANALYSIS 409
How to Calculate the Intercept and Slope of a Bivariate Regression In this example, we are using the Novartis pharmaceuticals company sales territory and number of salespersons data found
in Table 15. 1 . Intermediate regression calculations are included later in the chapter in Table 15. 2 .
MARKETING RESEARCH INSIGHT 15. 1 Practical Application
TABLE 15. 1 Bivariate Regression Analysis Data and Intermediate Calculations
Territory ( I )Sales
($ millions) ( y )Number of
Salespersons ( x ) xy x 2
1 102 7 714 49
2 125 5 625 25
3 150 9 1,350 81
4 155 9 1,395 81
5 160 9 1,440 81
6 168 8 1,344 64
7 180 10 1,800 100
8 220 10 2,200 100
9 210 12 2,520 144
10 205 12 2,460 144
11 230 12 2,760 144
12 255 15 3,825 225
13 250 14 3,500 196
14 260 15 3,900 225
15 250 16 4,320 256
16 275 16 4,400 256
17 280 17 4,760 289
18 240 18 4,320 324
19 300 18 5,400 324
20 310 19 5,890 361
Sums 4,325 251 58,603 3,469
(Average = 216,25) (Average = 12.55)
The formula for computing the regression parameter b is:
Formula for b, the slope, in bivariate regression
b =na
n
i=1xiyi - aa
n
i=1xibaa
n
i=1yib
nan
i=1xi
2 - aan
i=1xib
2
where
x i = an x variable value y i = a y value paired with each x i value n = the number of pairs
M15_BURN3261_08_GE_C15.indd 409M15_BURN3261_08_GE_C15.indd 409 17/08/16 12:00 pm17/08/16 12:00 pm

410 CHAPTER 15 • UNDERSTANDING REGRESSION ANALYSIS BASICS
The calculations for b , the slope, are as follows:
Calculation of b, the slope, in bivariate regression using Novartis sales territory data
b =na
n
i=1xiyi - aa
n
i=1xibaa
n
i=1yib
nan
i=1xi
2 - aan
i=1xib
2
=20 * 58603 - 251 * 4325
20 * 3469 - 2512
=1172060 - 1085575
69380 - 63001
=864856379
= 13.56
Notes:
n = 20 Sum xy = 58.603
Sum of x = 251 Sum of y = 4.325
Sum of x 2 = 3.469
The formula for computing the intercept is:
Formula for a, the intercept, in bivariate regression
a = y - bx
The computations for a , the intercept, are as follows:
Calculation of a, the intercept, in bivariate regression using Novartis sales territory data
a = y - bx= 216.25 - 13.56 * 12.55= 216.25 - 170.15= 46.10
Notes:
y = 216.25 x = 12.55
In other words, the bivariate regression equation has been found to be:
Novartis sales regression equation
y = 46.10 + 13.56x
The interpretation of this equation is as follows: Annual sales in the average Novartis sales territory are $46.10 million, and they increase $13.56 million annually with each additional salesperson.
15- 2 Multiple Regression Analysis We follow up our introduction to bivariate regression analysis by discussing multiple regres-
sion analysis. You will fi nd that all of the concepts in bivariate regression apply to multiple
regression analysis, except you will be working with multiple independent variables.
AN UNDERLYING CONCEPTUAL MODEL A model is a structure that ties together various constructs and their relationships. It is benefi -
cial for the marketing manager and the market researcher to have some sort of model in mind
when designing the research plan. The bivariate regression equation that you just learned about
is a model that ties together an independent variable and its dependent variable. The dependent
variables that interest market researchers are typically sales, potential sales, or some attitude
held by those who make up the market. For instance, in the Novartis example, the dependent
variable was territory sales. If Dell computers commissioned a survey, it might want infor-
mation on those who intend to purchase a Dell computer, or it might want information on
those who intend to buy a competing brand as a means of understanding these consumers and
M15_BURN3261_08_GE_C15.indd 410M15_BURN3261_08_GE_C15.indd 410 17/08/16 12:00 pm17/08/16 12:00 pm

15-2 MULTIPLE REGRESSION ANALYSIS 411
perhaps dissuading them. The dependent variable
would be purchase intentions for Dell computers. If
managers at Maxwell House Coff ee were consider-
ing a line of gourmet iced coff ee, they would want to
know how coff ee drinkers feel about gourmet iced
coff ee; that is, their attitude toward buying, prepar-
ing, and drinking iced coff ee would be the depen-
dent variable.
Figure 15. 2 provides a general conceptual
model that fi ts many marketing research situations,
particularly those that are investigating consumer
behavior. A general conceptual model identifi es
independent and dependent variables and shows
their expected basic relationships to one another. In Figure 15. 2 , you can see that purchases,
intentions to purchase, and preferences are in the center, meaning they are dependent. The
surrounding concepts are the possible independent variables. That is, any one could be used to
predict any dependent variable. For example, intentions to purchase an expensive automobile
like a Lexus could depend on income. It could also depend on friends’ recommendations (word
of mouth), personal opinion about how a Lexus would enhance one’s self-image, or experi-
ences riding in or driving a Lexus. In truth, consumers’ preferences, intentions, and actions are potentially infl uenced by
a great number of factors, as would be very evident if you listed all of the subconcepts that
make up each concept in Figure 15. 2 . For example, there are probably a dozen diff erent demo-
graphic variables; there could be dozens of lifestyle dimensions; and a person is exposed to a
great many types of advertising media every day. Of course, in the problem defi nition stage,
the researcher and manager reduce the myriad of independent variables down to a manageable
number to be included on the questionnaire. That is, they have the general model structure in
Figure 15. 2 in mind, but they identify and measure specifi c variables that pertain to the prob-
lem at hand. Because bivariate regression analysis treats only dependent–independent pairs, it
would take a great many bivariate regression analyses to account for all the possible relevant
dependent–independent pairs of variables in a general model such as Figure 15. 2 . Fortunately,
there is no need to perform a great many bivariate regressions, as there is a much better tool
called multiple regression analysis , a technique we will describe in some detail.
There is an underlying general conceptual model in multiple regression analysis.
Purchases;Intentions toPurchase;
Preferences; or Satisfaction
Media Exposure,Word of Mouth
Demographics,Lifestyle
Past Behavior,Experience,Knowledge
Attitudes,Opinions,Feelings
FIGURE 15. 2 A General Conceptual Model for Multiple Regression Analysis
The researcher and the manager identify, measure, and analyze specifi c variables that pertain to the general conceptual model in mind.
Active Learning
The General Conceptual Model for Auto Concepts
Understandably, Nick Thomas, CEO of Auto Concepts, wants everyone to intend to purchase a new gasoline alternative technology automobile; however, this will not be the case due to different beliefs and predispositions in the driving public. Regression analysis will assist Nick by revealing what variables are good predictors of intentions to buy the various new technol-ogy automobile models under consideration at Auto Concepts. What is the general concep-tual model apparent in the Auto Concepts survey dataset?
In order to answer this question and to portray the general conceptual model in the for-mat of Figure 15. 2 , you must inspect the several variables in this SPSS dataset or otherwise come up with a list of the variables in the survey. A handy list of all these variables is found in Case 12. 2 on page 348 . Using the “Desirability” variable as the dependent variable, diagram the general types of independent or predictor variables that are apparent in this study. Comment on the usefulness of this general conceptual model to Nick Thomas; that is, assuming that the regres-sion results are significant, what marketing strategy implications will become apparent?
M15_BURN3261_08_GE_C15.indd 411M15_BURN3261_08_GE_C15.indd 411 17/08/16 12:00 pm17/08/16 12:00 pm

412 CHAPTER 15 • UNDERSTANDING REGRESSION ANALYSIS BASICS
MULTIPLE REGRESSION ANALYSIS DESCRIBED Multiple regression analysis is an expansion of bivariate regression analysis in that more
than one independent variable is used in the regression equation. The addition of indepen-
dent variables complicates the conceptualization by adding more dimensions or axes to the
regression situation. But it makes the regression model more realistic because, as we have just
explained with our general model discussion, predictions normally depend on multiple fac-
tors, not just one.
Basic Assumptions in Multiple Regression Consider our Novartis example with the
number of salespeople as the independent variable and territory sales as the dependent vari-
able. A second independent variable such as advertising levels can be added to the equation.
The addition of a second variable turns the regression line into a regression plane because
there are three dimensions if we were to try to graph it: territory sales ( y ), number of sales
people ( x 1 ), and advertising level (x 2 ). A regression plane is the shape of the dependent vari-
able in multiple regression analysis. If other independent variables are added to the regression
analysis, it would be necessary to envision each one as a new and separate axis existing at
right angles to all other axes. Obviously, it is impossible to draw more than three dimensions
at right angles. In fact, it is diffi cult to even conceive of a multiple-dimension diagram, but the
assumptions of multiple regression analysis require this conceptualization. Everything about multiple regression is largely equivalent to bivariate regression except
you are working with more than one independent variable. The terminology is slightly diff er-
ent in places, and some statistics are modifi ed to take into account the multiple aspects, but for
the most part, concepts in multiple regression are analogous to those in the simple bivariate
case. We note these similarities in our description of multiple regression.
The equation in multiple regression has the following form:
Multiple regression equation
y = a + b1x1 + b2x2 + b3x3 + c + bmxm
where
y = the dependent, or predicted, variable
x i = independent variable i
a = the intercept
b i = the slope for independent variable i
m = the number of independent variables in the equation
As you can see, the addition of other independent variables has done nothing more than
to add b i x i ’ s to the equation. We still have retained the basic y = a + bx straight-line formula,
except now we have multiple x variables, and each one is added to the equation, changing y
by its individual slope. The inclusion of each independent variable in this manner preserves
the straight-line assumptions of multiple regression analysis. This is sometimes known as
additivity because each new independent variable is added on to the regression equation.
Let’s look at a multiple regression analysis result so you can better understand the mul-
tiple regression equation. Here is a possible result using our Lexus example.
Lexus purchase intention multiple regression equation example
Intention to purchase a Lexus = 2 + 1.0 × attitude toward Lexus (1–5 scale) – .5 × attitude toward current auto (1–5 scale) + 1.0 × income level (1–10 scale)
Notes: a = 2
b 1 = 1.0 b 2 = –.5 b 3 = 1.0
This multiple regression equation says that you can predict a consumer’s level of
intention to buy a Lexus if you know three variables: (1) attitude toward the Lexus brand,
Multiple regression means that you have more than one independent variable to predict a single dependent variable.
With multiple regression, you work with a regression plane rather than a line.
A multiple regression equation has two or more independent variables ( x ’s).
M15_BURN3261_08_GE_C15.indd 412M15_BURN3261_08_GE_C15.indd 412 17/08/16 12:00 pm17/08/16 12:00 pm

15-2 MULTIPLE REGRESSION ANALYSIS 413
(2) attitude toward the automobile the consumer owns now, and (3) income level using a scale
with 10 income grades. Further, we can see the impact of each of these variables on Lexus
purchase intentions. Here is how to interpret the equation. First, the average person has a
2 intention level, or some small propensity to want to buy a Lexus. Attitude toward Lexus is
measured on a 1–5 scale, and with each attitude scale point, intention goes up one point. That
is, an individual with a strong positive attitude of 5 will have a greater intention than one with
a strong negative attitude of 1. With attitude toward the current automobile he or she owns
(for example, a potential Lexus buyer may currently own a Cadillac or a BMW), the inten-
tion decreases by .5 for each level on the 5-point scale. Of course, we are assuming that these
potential buyers own automobile models other than a Lexus. Finally, the intention increases
by 1 with each increasing income grade.
Here is a numerical example for a potential Lexus buyer whose Lexus attitude is 4, cur-
rent automobile model attitude is 3, and income is 5.
Calculation of Lexus purchase intention using the multiple regression equation
Intention to purchase a Lexus = 2 + 1.0 × 4 – .5 × 3 + 1.0 × 5 = 9.5
Notes: Intercept = 2 Attitude toward Lexus ( x 1 ) = 4 Attitude toward current auto ( x 2 ) = 3 Income level ( x 3 ) = 5
Multiple regression is a very powerful tool because it tells us what factors are related to
the dependent variable, how each factor infl uences the dependent variable (the sign), and how
much each factor infl uences it (the size of b i ). It is possible to inspect the strength of the linear relationship between the independent
variables and the dependent variable with multiple regression. Multiple R , also called the
coeffi cient of determination , is a handy measure of the strength of the overall linear relation-
ship. Just as in bivariate regression analysis, the multiple regression analysis model assumes
that a straight-line (plane) relationship exists among the variables. Multiple R ranges from 0
to +1.0 and represents the amount of the dependent variable “explained,” or accounted for, by
the combined independent variables. High multiple R values indicate that the regression plane
applies well to the scatter of points, whereas low values signal that the straight-line model
does not apply well. At the same time, a multiple regression result is an estimate of the popu-
lation multiple regression equation and, just as is the case with other estimated population
parameters, it is necessary to test for statistical signifi cance. Multiple R is like a lead indicator of the multiple regression analysis fi ndings. As you will
see soon, it is one of the fi rst pieces of information provided in a multiple regression output.
Many researchers mentally convert the multiple R value into a percentage. For example, a
multiple R of .75 means that the regression fi ndings will explain 75% of the dependent vari-
able. The greater the explanatory power of the multiple regression fi nding, the better and more
useful it is for the researcher.
Before we show you how to run a multiple regression analysis using SPSS, consider this
caution. The independence assumption stipulates that the independent variables must be
statistically independent and uncorrelated with one another. The independence assumption is
very important because, if it is violated, the multiple regression fi ndings are untrue. The pres-
ence of moderate or stronger correlations among the independent variables is termed mul-ticollinearity and will violate the independence assumption of multiple regression analysis
results when it occurs. 6 It is up to the researcher to test for and remove multicollinearity if it
is present. The way to avoid multicollinearity is to use warning statistics issued by most statisti-
cal analysis programs to identify this problem. One commonly used method is the variance infl ation factor (VIF) . The VIF is a single number, and a rule of thumb is that as long as
VIF is less than 10, multicollinearity is not a concern. With a VIF greater than 10 associated
with any independent variable in the multiple regression equation, it is prudent to remove that
Multiple R indicates how well the independent variables can predict the dependent variable in multiple regression.
With multiple regression, the independent variables should have low correlations with one another.
Multicollinearity can be assessed and eliminated in multiple regression with the VIF statistic.
M15_BURN3261_08_GE_C15.indd 413M15_BURN3261_08_GE_C15.indd 413 17/08/16 12:00 pm17/08/16 12:00 pm

414 CHAPTER 15 • UNDERSTANDING REGRESSION ANALYSIS BASICS
variable from consideration or to otherwise reconstitute the set of independent variables. 7 In
other words, when examining the output of any multiple regression, the researcher should
inspect the VIF number associated with each independent variable that is retained in the fi nal
multiple regression equation by the procedure. If VIF is greater than 10, the researcher should
remove that variable from the independent variable set and rerun the multiple regression. 8
This iterative process is used until only independent variables that are statistically signifi cant
and that have acceptable VIFs are in the fi nal multiple regression equation. Although you have not learned how to run multiple regression analysis on SPSS, you
have suffi cient knowledge to realize that this analysis can provide interesting insights into
consumer behavior. We have prepared Marketing Research Insight 15. 2 to demonstrate an
application of multiple regression analysis in the social media marketing research arena.
Multiple Regression Reveals Why Fans Post Likes and Comments on Facebook Of the several social media platforms, Facebook is perhaps the oldest and most widely used. For many companies, Face-book is the premier social media promotional vehicle, and companies have a number of tactics or aspects of their posts on Facebook available to engage followers. With Facebook, there are two measures of such engagement: (1) likes and (2) comments. Fans may click a “like” icon on a post to indi-cate that they feel positive about the post. Company posts with a large number of likes are successful, whereas posts with few or no likes are considered unsuccessful at garner-ing fan engagement. Alternatively, fans may post comments that are different with respect to engagement. Comments require fans to think about the post and to compose some phrase or statement about it. Thus, a comment requires more cognitive and physical effort than a like, so presumably the fan who comments on a company post has a deeper and longer-lasting engagement with the company than the fan who simply likes it.
Social media researchers recently sought to use multiple regression as a means of understanding what aspects of com-pany posts are related to likes and comments. 9 They identifi ed the following six aspects of company posts that qualifi ed as independent variables.
• Followers—the number of followers of the brand • Characters—the number of words in the company post • Links—the number of links in the post • Images—the number of images within the post • Videos—the number of videos in the post • Time—time of day of the post, measured by a 24-hour clock
The dependent variables for the two multiple regression anal-yses were number of likes and number of comments. These analyses found statistically signifi cant independent variables that differed. Since this was not an attempt to predict the num-ber of likes or comments, only the signs of the signifi cant betas are relevant. A summary of the fi ndings appears in the follow-ing table.
Facebook Likes Comments
Post Aspect
Followers
Characters
Links
Images
Videos
Time of day
As can be seen, likes are strongly infl uenced by the number of followers, length of the post, number of images, and videos. Comments, on the other hand, are related to the number of fol-lowers, number of images, and time of day of the post. Also comments are dampened or discouraged by the number of links in the post.
These fi ndings make it clear that companies should strive for large numbers of followers because more followers are associated with both more likes and more comments on any given company Facebook post. Longer Facebook posts with more images and videos are highly “likable” or otherwise asso-ciated with a greater number of like votes. More images and posting later in the day tend to garner more comments; how-ever, links are apparently distracting and perhaps pull fans off the Facebook site and onto other sites before they take the time to write a comment to the post.
MARKETING RESEARCH INSIGHT 15. 2 Digital Marketing Research
M15_BURN3261_08_GE_C15.indd 414M15_BURN3261_08_GE_C15.indd 414 17/08/16 12:00 pm17/08/16 12:00 pm

15-2 MULTIPLE REGRESSION ANALYSIS 415
INTEGRATED CASE
Auto Concepts: How to Run and Interpret Multiple Regression Analysis on SPSS Running multiple regression fi rst requires specifi cation of the dependent and independent
variables. Let’s select the desirability of the fi ve-seat, standard-size gasoline automobile
model as the dependent variable, and think about a general conceptual model that might per-
tain to Auto Concepts. We already know from basic marketing strategy that demographics
are often used for target marketing, and we have hometown size, age, income, education, and
household size. Also, beliefs are often useful for predicting market segments, and we have
some variables that pertain to beliefs about gasoline usage and global warming. To summa-
rize, we have determined our conceptual model: the desirability of a standard-size gasoline
automobile related to (1) household demographics and (2) beliefs about global warming and
gasoline usage. Where appropriate, we have recoded the ordinal demographic variables with
midpoints to convert them to ratio scales. If you wish to perform this analysis, use the dataset
called Auto Concepts.Recoded.sav .
The ANALYZE-REGRESSION-LINEAR command sequence is used to run a multiple
regression analysis, and the variable Desirability: 5-seat economy gasoline model is selected
as the dependent variable, while the other 11 are specifi ed as the independent variables. You
will fi nd this annotated SPSS clickstream in Figure 15. 3 .
As the computer output in Figure 15. 4 shows, the multiple R value (Adjusted R Square
in the Model Summary table) indicating the strength of relationship between the independent
variables and the dependent variable is .249, signifying that there is some linear relationship
present. Next, the printout reveals that the ANOVA F is signifi cant, signaling that the null
hypothesis of no linear relationship is rejected, and it is justifi able to use a straight-line rela-
tionship to model the variables in this case. It is necessary in multiple regression analysis to test for statistical signifi cance of the b i
(beta) determined for each independent variable. In other words, you must determine whether
The SPSS ANALYZE-REGRESSION-LINEAR command is used to run multiple regression.
FIGURE 15. 3 IBM SPSS Clickstream for Multiple Regression Analysis
Source: Reprint Courtesy of International Business Machines Corporation, © International Business Machines Corporation.
M15_BURN3261_08_GE_C15.indd 415M15_BURN3261_08_GE_C15.indd 415 17/08/16 12:00 pm17/08/16 12:00 pm

416 CHAPTER 15 • UNDERSTANDING REGRESSION ANALYSIS BASICS
sampling error is infl uencing the results and giving a false reading. One must test for signifi -
cance from zero (the null hypothesis) through the use of separate t tests for each b i . The SPSS
output in Figure 15. 4 indicates the levels of statistical signifi cance in the Coeffi cients table in
the Sig. column, and we have highlighted in yellow the cases where the signifi cance level is
.05 or less (95% level of confi dence). It is apparent that size of hometown, gender, household
size, age, income, and the two attitude variables are statistically signifi cant. The other inde-
pendent variables fail this test, meaning that their computed betas must be treated as zeros. No
VIF value is greater than the problem level of 10, so multicollinearity is not a concern here.
“TRIMMING” THE REGRESSION FOR SIGNIFICANT FINDINGS What do you do with the mixed signifi cance results we have just found in our multiple regres-
sion analysis? Before we answer this question, you should be aware that this mixed result
is very likely, so how to handle it is vital to your understanding of how to perform mul-
tiple regression analysis successfully. Here is the answer: It is standard practice in multiple
regression analysis to systematically eliminate one by one those independent variables that
are shown to be insignifi cant through a process called “trimming.” You successively rerun the
trimmed model and inspect the signifi cance levels each time. This series of eliminations or
iterations helps to achieve the simplest model by eliminating the nonsignifi cant independent
variables. The trimmed multiple regression model with all signifi cant independent variables is
found in Figure 15. 5 . Notice that the VIF diagnostics were not selected, as they were exam-
ined on the untrimmed SPSS output and found to be acceptable. This trimming process enables the marketing researcher to think in terms of fewer dimen-
sions within which the dependent variable relationship operates. Generally, successive itera-
tions sometimes cause the multiple R to change somewhat, and it is advisable to scrutinize
this value after each run. You can see that the new multiple R is .250, so in our example there
has been very little change. Iterations will also cause the beta values and the intercept value
to shift slightly; consequently, it is necessary to inspect all signifi cance levels of the betas
FIGURE 15. 4 IBM SPSS Output for Multiple Regression Analysis
Source: Reprint Courtesy of International Business Machines Corporation, © International Business Machines Corporation.
With multiple regression, look at the signifi cance level of each calculated beta.
A trimmed regression means that you eliminate the nonsignifi cant independent variables and rerun the regression.
M15_BURN3261_08_GE_C15.indd 416M15_BURN3261_08_GE_C15.indd 416 17/08/16 12:00 pm17/08/16 12:00 pm

15-2 MULTIPLE REGRESSION ANALYSIS 417
once again. Through a series of iterations, the marketing researcher fi nally arrives at the fi nal
regression equation expressing the salient independent variables and their linear relationships
with the dependent variable. A concise predictive model has been found. Using the signs of
the betas, the fi ndings predict that people who prefer the fi ve-seat economy gasoline model
reside in smaller cities, have larger families, are older with less income, are less concerned
about global warming, and agree that we should be looking for gasoline substitutes. Gender is
also signifi cant, but it is a “dummy” variable, which will be explained next.
SPECIAL USES OF MULTIPLE REGRESSION ANALYSIS We will return to our fi ndings in Figure 15. 5 shortly, but fi rst we need to describe some special
uses and considerations to keep in mind when running multiple regression analysis. These
include using a “dummy” independent variable, examining standardized betas to compare
the importance of independent variables, and using multiple
regression as a screening device.
Using a “Dummy” Independent Variable A dummy independent variable is defi ned as one that is scaled with a
nominal 0-versus-1 coding scheme. The 0-versus-1 code is tra-
ditional, but any two adjacent numbers might be used, such
as 1-versus-2. The scaling assumptions that underlie multiple
regression analysis require that the independent and dependent
variables both be at least intervally scaled. However, there are
instances in which a marketing researcher may want to use an
independent variable that does not embody interval-scaling
assumptions. It is not unusual, for instance, for the marketing
researcher to wish to use a dichotomous or two-level variable
as an independent variable in a multiple regression analysis.
Some commonly used dummy variables are gender (males
FIGURE 15. 5 IBM SPSS Output for Trimmed Multiple Regression Analysis
Source: Reprint Courtesy of International Business Machines Corporation, © International Business Machines Corporation.
Run trimmed regressions iteratively until all betas are signifi cant.
IBM SPSS Student Assistant: Running and Interpreting Multiple Regression
Gender can be used as a dummy variable in multiple
regression analysis.
© J
akri
t Ji
rara
twar
o/S
hutt
erst
ock
M15_BURN3261_08_GE_C15.indd 417M15_BURN3261_08_GE_C15.indd 417 17/08/16 12:00 pm17/08/16 12:00 pm

418 CHAPTER 15 • UNDERSTANDING REGRESSION ANALYSIS BASICS
versus female), purchasing behavior (buyer versus nonbuyer), advertising exposure (recalled
versus not recalled), and purchase history (fi rst time buyer versus repeat buyer). For instance,
with gender, a researcher may want to use a “0” for male and “1” for female as an indepen-
dent variable. In these instances, it is usually permissible to go ahead and slightly violate the
assumption of interval or ratio scaling (called “metric”) for the independent variable to come
up with a result that is in some degree interpretable. In our Auto Concepts multiple regres-
sion example, we used two dummy variables: Gender and Marital status. The other variables
were metric or assumed to be metric (recall midrange recoding of the ordinal demographic
variables). In Figure 15. 4 , gender is signifi cant, and it has a positive beta sign, so since the
dummy coding is 0 = male and 1 = female, females fi nd the fi ve-seat economy gasoline model
more desirable than do males.
Using Standardized Betas to Compare the Importance of Independent Variables Regardless of the application intentions of the marketing researcher, it is usually of interest to
determine the relative importance of the independent variables in the fi nal multiple regression
result. Because independent variables are often measured with diff erent units, it is errone-
ous to make direct comparisons between the calculated betas. For example, it is improper to
directly compare the beta coeffi cient for family size to another for money spent per month
on personal grooming because the units of measurement are so diff erent (people versus dol-
lars). The most common approach is to standardize the independent variables through a quick
operation that involves dividing the diff erence between each independent variable value and
its mean by the standard deviation of that independent variable. This results in what is called
the standardized beta coeffi cient . In other words, standardization translates each indepen-
dent value into the number of standard deviations away from its own mean. Essentially, this
procedure transforms these variables into a set of values with a mean of 0 and a standard
deviation equal to 1.0. Standardized, direct comparisons may be made among the resulting betas. The larger
the absolute value of a standardized beta coeffi cient, the more relative importance it assumes
in predicting the dependent variable. SPSS and most other statistical programs provide the
standardized betas automatically. In Figure 15. 5 , we have highlighted the standardized betas
with light green, and we will discuss how to interpret them shortly. You probably need a
break from all of this technical information, so do so by reading
about road rage exhibited by Chinese drivers in Marketing Research
Insight 15. 3 .
Using Multiple Regression as a Screening Device A fi nal
important application of multiple regression analysis is as an iden-
tifying or screening device . That is, the marketing researcher may
be faced with a large number and variety of prospective indepen-
dent variables in a general conceptual model, and he or she may use
multiple regression as a way of spotting the salient (statistically sig-
nifi cant) independent variables for the dependent variable at hand. In
this instance, the intent is not to determine some sort of a prediction
of the dependent variable; rather, it may be to search for clues as
to what factors help the researcher understand the behavior of this
particular dependent variable. For instance, the researcher might be
seeking market segmentation bases and could use regression to spot
which demographic variables are related to the consumer behavior
variable under study. The true purpose is to identify segments of the
car-buying public that are more likely to purchase various vehicle
models in the future; this goal is usually well served when multi-
ple regression is used as a screening device to identify the salient
The interval-at-minimum scaling assumption requirement of multiple regression may be relaxed by use of a dummy variable.
The researcher can compare standardized beta coeffi cients’ sizes directly, but comparing unstandardized betas is like comparing apples and oranges.
Used as a screening device, multiple regression
analysis identifi es independent variables that qualify
to be part of the fi nal equation.
© S
ofi p
hoto
/Shu
tter
stoc
k
M15_BURN3261_08_GE_C15.indd 418M15_BURN3261_08_GE_C15.indd 418 17/08/16 12:01 pm17/08/16 12:01 pm

15-2 MULTIPLE REGRESSION ANALYSIS 419
Multiple Regression Applied to Stressed-Out, Angry, Drunk Drivers: Chinese Road Ragers “Road rage” occurs when vehicle drivers act out in dangerous and irrational ways. Wikipedia 10 lists the following manifesta-tions of road rage:
• Generally driving aggressively, including suddenly acceler-ating or braking and close tailgating
• Cutting others off in a lane or deliberately preventing someone from merging
• Chasing other motorists • Flashing lights and/or sounding the horn excessively • Yelling or exhibiting disruptive behavior at roadside
establishments • Driving at high speeds in the median of a highway to
terrify drivers in both lanes • Gesturing rudely • Shouting verbal abuses or threats • Intentionally causing a collision between vehicles • Hitting other vehicles • Assaulting other motorists, their passengers, cyclists, or
pedestrians • Exiting the car to attempt to start confrontations, includ-
ing striking other vehicles with an object • Threatening to use or using a fi rearm or other deadly
weapon • Throwing projectiles from a moving vehicle with the
intent of damaging other vehicles
As can be seen in this list, road rage ranges from vulgar and rude gestures to dangerous, life-threatening driving. Moreover, road rage is not isolated to a single country; just as automobiles are driven in every country in the world, rude and dangerous driving is found universally.
Compared to Western and European countries, the Peo-ple’s Republic of China has only recently joined the road rage club, but it has caught up quickly. Researchers recently studied the psychological makeup and other aspects of Chinese drivers in an attempt to understand Chinese road rage. 11 They mea-sured the propensity for road rage with a “dangerous driving index” that has four components: emotional driving, aggres-sive driving, risky driving, and drunk driving. They also mea-sured personality traits such as anger, sensation seeking, and
the like. Finally, they measured drivers’ perceived stress levels. In the accompanying fi gure, the check marks indicate statistical signifi cance at the .01 level or less.
Dangerous Driving
Emotional Driving
Aggressive Driving
Risky Driving
Drunk Driving
Stressed
Angry
Sensation seeking
Altruistic
(minus) (minus)
In general, dangerous Chinese drivers are stressed-out, angry, and sensation-seeking individuals. However, emotional driving occurs under stress regardless of internal anger or other personality factors. Aggressive driving that is not especially risky tends to occur with Chinese drivers who are angry, sensa-tion seeking, and not altruistic. Risky Chinese drivers are not necessarily under stress or angry, but they are sensation seek-ers. Finally, drunk Chinese driving is most likely with stressed-out and nonaltruistic drivers who are not angry or sensation seekers.
Although the sample used in this research was composed strictly of Chinese drivers, the fi ndings are intuitive and may apply to all raging drivers. Here are some tag lines that con-cerned organizations, such as the American Automobile Asso-ciation, might consider using to quell road rage:
• Stressed? Don’t take a drink to calm your nerves, and take the bus, the train, or car pool.
• Angry? Get a grip before getting behind the wheel. • Need a thrill? Go to an amusement park or play an
exciting video game instead of driving around. • Don’t like your coworkers or neighbors? Don’t drown
your sorrows in alcohol.
MARKETING RESEARCH INSIGHT 15. 3 Global Application
segmentation factors. We have included Marketing Research Insight 15. 4 to illustrate the use
of multiple regression analysis as a screening device.
Interpreting the Findings of Multiple Regression Analysis By now, you prob-
ably realize that our Auto Concepts multiple regression analysis example showed the use
of multiple regression analysis to identify the signifi cant demographic and/or attitudinal
M15_BURN3261_08_GE_C15.indd 419M15_BURN3261_08_GE_C15.indd 419 17/08/16 12:01 pm17/08/16 12:01 pm

420 CHAPTER 15 • UNDERSTANDING REGRESSION ANALYSIS BASICS
independent variables. That is, it was used as a screening device. Now, let’s look at the
standardized beta values (green highlight in Figure 15. 5 ) to interpret our fi ndings. Interpre-
tation is facilitated by the relative sizes of the standardized betas and their signs. A positive
value means that there is a positive relationship, so people who prefer the fi ve-seat economy
gasoline automobile model are males (dummy coded with 0 = female and 1 = male), have
more people in their households, are older, and tend to believe that we should be looking for
gasoline substitutes. A negative sign means that there is a negative relationship, so desire
for the fi ve-seat economy gasoline automobile model tends to be higher for individuals
living in smaller hometowns, with lower income, and with people who are less worried
about global warming. Because it has the highest absolute standardized beta (.465), age is
the most important variable in identifying people desiring the fi ve-seat economy gasoline
model, and hometown size is the next most important, with belief that we should be look-
ing for gasoline substitutes falling in third place. When you examine the standardized betas
and take into consideration their relative sizes and signs, you can develop a mental market
segment picture of the kind of individual who would comprise the target market if Auto
Concepts develops a standard-size gasoline automobile model. You can also begin to under-
stand these consumers’ desires for a gasoline-powered automobile: They are not worried
about global warming.
Using Multiple Regression Analysis as a Screening Device Simplifi es Marketing Competition in the Optical Centers Industry
According to the Vision Council of America, about 75% of adults use some sort of vision correction. Many of these individ-uals use optical or vision centers for eye testing, diagnosis, and making purchases. Eyeglass purchasing is a unique phenom-enon. Often vision is directly affected by age. That is, people with 20/20 vision almost invariably experience deterioration in vision, normally nearsightedness, as they age. It is quite com-mon for individuals in their forties and fi fties to realize that reading regular-sized print is diffi cult, so they turn to optical centers or other eye-testing alternatives for diagnosis and pre-scriptions for reading glasses. However, the decision to wear eyeglasses or contact lens is subject to a number of consid-erations. For instance, there are social infl uence factors, such as the advice of opinion leaders, family members, coworkers, or other acquaintances. There are psychological factors such as motivations, perceptions, and self-concept. Finally, there are individual differences such as gender or income.
Researchers 12 listed 13 possible competitive factors that might affect a consumer’s decision to purchase eyeglasses and used multiple regression analysis to determine which ones were signifi cant to the age-related eyeglasses purchase decision. These factors included the following:
• Design of the frame • Lens brand • Price • Weight of the frame
• Warranty • Treatment of the lens (such as scratch resistance, etc.) • Materials making up the lens (glass, plastic, etc.) • Lens type (such as polarized, bifocals, etc.) • Lens accessories • Purchase promotion • Eye exam • Point-of-sale service • Advertising
Due to the several independent variables identified, the researchers used multiple regression analysis as a screening device to identify the statistically signifi cant ones. Three vari-ables were found to be signifi cant at the 95% level of confi -dence, while a fourth one was signifi cant at the 90% level of confi dence. To be more precise, price, warranty, and adver-tising comprise the fi rst three statistically signifi cant inde-pendent variables, and point-of-sale service was the fourth one. Interestingly, advertising was found to have a negative beta coeffi cient, whereas the other three exhibited positive relationships.
Interpretation of these fi ndings gives marketing strategy recommendations for optical centers: (1) offer competitive prices, (2) incorporate attractive warranties, (3) ensure that point-of-sale purchase employees and systems are top-notch, and (4) do not engage in advertising battles with other optical centers.
MARKETING RESEARCH INSIGHT 15. 4 Practical Application
Standardized betas indicate the relative importance of alternative predictor variables.
M15_BURN3261_08_GE_C15.indd 420M15_BURN3261_08_GE_C15.indd 420 17/08/16 12:01 pm17/08/16 12:01 pm

15-2 MULTIPLE REGRESSION ANALYSIS 421
Active Learning
Segmentation Associates, Inc.
Segmentation Associates, Inc., is a marketing research company that specializes in market segmentation studies. It has access to large and detailed databases on demographics, life-styles, asset ownership, consumer values, and a number of other consumer descriptors. It has developed a reputation for reducing these large databases into findings that are mana-gerially relevant to its clients. That is, Segmentation Associates is known for its ability to translate its findings into market segmentation variables for its clients to use in their market-ing strategies.
In the past year, Segmentation Associates has conducted a great many market segmen-tation studies for a number of automobile manufacturers. The company has agreed to pro-vide disguised findings of some of its work. In the following table segmentation variables are identified, and each of three different automobile buyer types is identified. For each segmen-tation variable, Segmentation Associates has provided the results of its multiple regression findings. The values are the standardized beta coefficients of those segmentation variables found to statistically significant. Where “—” appears, the regression coefficient was not stati-cally significant.
Segmentation Variable Economy Auto Buyer Sports Car Buyer Luxury Auto Buyer
Demographics
Age –.28 –.15 +.59
Education –.12 +.38 —
Family Size +.39 –.35 —
Income –.15 +.25 +.68
Lifestyle/Values
Active — +.59 –.39
American Pride +.30 — +.24
Bargain Hunter +.45 –.33 —
Conservative — –.38 +.54
Cosmopolitan –.40 +.68 —
Embraces Change –.30 +.65 —
Family Values +.69 — +.21
Financially Secure –.28 +.21 +.52
Optimistic — +.71 +.37
Here are some questions to answer.
1. What is the underlying conceptual model used by Segmentation Associates that is apparent in these three sets of fi ndings?
2. What are the segmentation variables that distinguish economy automobile buyers and in what ways?
3. What are the segmentation variables that distinguish sports car buyers and in what ways?
4. What are the segmentation variables that distinguish luxury automobile buyers and in what ways?
M15_BURN3261_08_GE_C15.indd 421M15_BURN3261_08_GE_C15.indd 421 17/08/16 12:01 pm17/08/16 12:01 pm
422 CHAPTER 15 • UNDERSTANDING REGRESSION ANALYSIS BASICS
15- 3 Stepwise Multiple Regression When the researcher is using multiple regression as a screening tool or is otherwise faced
with a large number of independent variables in the conceptual model to be tested by multiple
regression, it can become tedious to narrow down the independent variables by successive
manual trimming. Fortunately, a type of multiple regression called stepwise multiple regres-sion does the trimming operation automatically .
Here is a simple explanation. With stepwise multiple regression , the statistically sig-
nifi cant independent variable that explains the most variance in the dependent variable is
determined and entered into the multiple regression equation. Then the statistically signifi cant
independent variable that contributes most to explaining the remaining unexplained variance
in the dependent variable is determined and entered. This process is continued until all statis-
tically signifi cant independent variables have been entered into the multiple regression equa-
tion. 13 In other words, all the insignifi cant independent variables are eliminated from the fi nal
multiple regression equation based on the level of signifi cance stipulated by the researcher in
the multiple regression options. The fi nal output contains only statistically signifi cant inde-
pendent variables. Stepwise regression is used by researchers when they are confronted with
a large number of competing independent variables and they want to narrow down the analy-
sis to a set of statistically signifi cant independent variables in a single regression analysis.
With stepwise multiple regression, there is no need to trim and rerun the regression analysis
because SPSS does the trimming automatically based on the stepwise method selected by the
researcher.
HOW TO DO STEPWISE MULTIPLE REGRESSION WITH SPSS A researcher executes stepwise multiple regression by using the ANALYZE-
REGRESSION-LINEAR command sequence precisely as described for multiple regres-
sion. The dependent variable and many independent variables are selected into their
respective windows as before. To direct SPSS to perform stepwise multiple regression,
one uses the “Method:” drop-down menu to select “Backward.” The findings will be
the same as those arrived at by a researcher who uses the iterative trimmed multiple
regressions that we described earlier. Of course, with stepwise multiple regression out-
put, information on those independent variables is taken out of the multiple regression
equation based on nonsignificance and, if the researcher wishes, SPSS stepwise multiple
regression will also take into account the VIF statistic to assure that multicollinearity is
not an issue.
We do not have screenshots of stepwise multiple regression, as this technique is quite
advanced. In fact, there are four diff erent stepwise regression methods available on SPSS.
We do not recommend that you use stepwise multiple regression unless you gain a good deal
more background on multiple regression, as you may encounter fi ndings that are diffi cult to
understand or are even counterintuitive. 14
STEP-BY-STEP SUMMARY OF HOW TO PERFORM MULTIPLE REGRESSION ANALYSIS While we have attempted to move slowly, you are no doubt overwhelmed by all the facets
of multiple regression analysis that we have covered. Nonetheless, you realize that every
statistical analysis beyond simple descriptive ones involves some sort of statistical test,
and the complexity of regression analysis requires multiple such tests. These tests are
considered in a step-by-step manner by the marketing researcher, and we have listed and
described these steps in Table 15. 2 as a way of summarizing how to perform multiple
regression analysis.
Stepwise regression is useful if a researcher has many independent variables and wants to narrow the set down to a smaller number of statistically signifi cant variables.
To learn about per-forming step-wise multiple regression
with SPSS, launch www.youtube.com , and search for “Multiple Regression – SPSS (Brief).”
M15_BURN3261_08_GE_C15.indd 422M15_BURN3261_08_GE_C15.indd 422 17/08/16 12:01 pm17/08/16 12:01 pm

15-4 WARNINGS REGARDING MULTIPLE REGRESSION ANALYSIS 423
15- 4 Warnings Regarding Multiple Regression Analysis Before leaving our description of multiple regression analysis, we must issue warnings about
your interpretation of regression. First, we all have a natural tendency to think in terms of
causes and eff ects, and regression analysis invites us to think in terms of a dependent variable
resulting from or being caused by an independent variable’s actions. This line of thinking is
absolutely incorrect: Regression analysis is nothing more than a statistical tool that assumes
a linear relationship between two variables. It springs from correlation analysis, which is, as
you will recall, a measure of the linear association and not the causal relationship between
two variables. Consequently, even though two variables, such as sales and advertising, are
logically connected, a regression analysis does not permit the marketing researcher to make
cause-and-eff ect statements because other independent variables are not controlled. Our other warning is that the amount of knowledge about multiple regression analy-
sis presented in this chapter is indeed rudimentary. There is a great deal more to multiple
regression analysis that is beyond the scope of this textbook . Our coverage in this chapter
introduces you to regression analysis, and it provides you with enough information about it to
run uncomplicated regression analyses on SPSS, to identify the relevant aspects of the SPSS
output, and to interpret the fi ndings. As you will see when you work with the SPSS regres-
sion analysis procedures, we have only scratched the surface of this topic. 15 There are many
more options, statistics, and considerations involved. 16 In fact, there is so much material that
whole textbooks on regression exist. Our purpose has been to teach you the basic concepts
TABLE 15. 2 Step-by-Step Procedure for Multiple Regression Analysis Using SPSS
Step Description
Step 1. Choose the dependent variable and independent variables to analyze.
The dependent variable ( y ) is the predicted variable, and the independent variables ( x i ’s)
are used to predict y . Typically, both y and x variables are scale variables (interval or
ratio scales), although some dummy independent variables are allowable.
Step 2. Determine if a linear relationship exists in the population (using 95% level of confi dence).
From the initial SPSS output, the ANOVA table reports a computed F value and
associated Sig. level.
a. If the Sig. value is .05 or less, there is a linear relationship among the chosen
variables in the population. Go to Step 3.
b. If the Sig. value is more than .05, there is no linear relationship among the chosen
variables in the population. Return to Step 1 with a new set of variables, or stop.
Step 3. Determine if the chosen independent variables are statistically signifi cant (using 95% level of confi dence).
Also look at the Sig. level for the computed beta coeffi cient for each associated
independent variable.
a. If the Sig. level is .05 or less, it is permissible to use the associated independent
variable to predict the dependent variable with the y = a + bx linear equation.
b. If the Sig. level is more than .05, it is not permissible to use the associated
independent variable to predict the dependent variable.
c. If you fi nd a mixture of a. and b., you should do “trimmed” or stepwise multiple
regression analysis (see the text on these techniques).
Step 4. Determine the strength of the relationship(s) in the linear model.
In the SPSS output Model Summary table, R Square is the square of the correlation
coeffi cient, and the Adjusted R Square reduces the R 2 by taking into account the sample
size and number of parameters estimated. Use Adjusted R Square as a measure of the
“percent variance explained” in the y variable using the linear equation to predict y .
Step 5. Interpret the fi ndings. With a result where only statistically signifi cant independent variables are used in the
analysis, use the standardized betas’ magnitudes and signs. Then assess each inde-
pendent variable’s relative importance and relationship direction with the dependent
variable.
Regression is a statistical tool, not a cause-and-effect statement.
M15_BURN3261_08_GE_C15.indd 423M15_BURN3261_08_GE_C15.indd 423 17/08/16 12:01 pm17/08/16 12:01 pm

424 CHAPTER 15 • UNDERSTANDING REGRESSION ANALYSIS BASICS
and to help you interpret the statistics associated with these concepts as you encounter them
as statistical analysis program output. Our descriptions are merely an introduction to multiple
regression analysis to help you comprehend the basic notions, common uses, and interpreta-
tions involved with this predictive technique. 17
Despite our simple treatment, we fully realize that even simplifi ed regression analysis
is very complicated and diffi cult to learn and that we have showered you with a great many
regression statistical terms and concepts in this chapter. Seasoned researchers are intimately
knowledgeable with them and very comfortable in using them. However, as a student encoun-
tering them for the fi rst time, you undoubtedly feel very intimidated. While we may not be
able to reduce your anxiety, we have created Table 15. 3 that lists all of the regression analysis
concepts we have described in this chapter, and it provides an explanation of each one. At
least, you will not need to search through the chapter to fi nd these concepts when you are try-
ing to learn or use them.
TABLE 15. 3 Regression Analysis Concepts
Concept Explanation
Regression analysis A predictive model using the straight-line relationship of y = a + bx
Intercept The constant, or a , in the straight-line relationship that is the value of y when x = 0
Slope The b , or the amount of change in y for a one-unit change in x
Dependent variable y , the variable that is being predicted by the x (s) or independent variable(s)
Independent variable(s) The x variable(s) used in the straight-line equation to predict y
Least squares criterion A statistical procedure that assures that the computed regression equation is the best one
possible
R Square A number ranging from 0 to 1.0 that reveals how well the straight-line model fi ts the
scatter of points; the higher, the better
Multiple regression analysis A powerful form of regression where more than one x variable is in the regression
equation
Additivity A statistical assumption that allows the use of more than one x variable in a multiple
regression equation: y = a + b 1 x 1 + b 2 x 2 … + b m x m
Independence assumption A statistical requirement that when more than one x variable is used, no pair of x
variables has a high correlation
Multiple R Also called the coeffi cient of determination, a number that ranges from 0 to 1.0 that
indicates the strength of the overall linear relationship in a multiple regression; the
higher, the better
Multicollinearity The term used to denote a violation of the independence assumption that causes
regression results to be in error
Variance infl ation factor (VIF) A statistical value that identifi es what x variable(s) contribute to multicollinearity and
should be removed from the analysis to eliminate multicollinearity. Any variable with
VIF of 10 or greater should be removed.
Trimming Removing an x variable in multiple regression because it is not statistically signifi cant,
rerunning the regression, and repeating until all remaining x variables are signifi cant
Beta coeffi cients and standardized beta coeffi cients
Beta coeffi cients are the slopes ( b values) determined by multiple regression for each
independent variable x . These are normalized to be in the range of .00 to .99 so they can
be compared directly to determine their relative importance in y ’s prediction.
Dummy independent variable Use of an x variable that has a 0, 1, or similar coding, used sparingly when nominal
variables must be in the independent variables set
Stepwise multiple regression A specialized multiple regression that is appropriate when there is a large number of
independent variables that need to be trimmed down to a small, signifi cant set and the
researcher wishes the statistical program to do this automatically
M15_BURN3261_08_GE_C15.indd 424M15_BURN3261_08_GE_C15.indd 424 17/08/16 12:01 pm17/08/16 12:01 pm

15-5 REPORTING REGRESSION FINDINGS TO CLIENTS 425
15- 5 Reporting Regression Findings to Clients The objective of a screening mechanism is to identify the relevant or meaningful variables as
they relate to some dependent variable of interest. For most clients, the dependent variable of
interest is sales, purchases, intentions to purchase, satisfaction, or some other variable that
translates in some way to how customers regard or behave toward the company or brand.
Normally, the researcher is faced with a large number of possible factors, any combination of
which might relate to the dependent variable. When regression is used as a screening device,
the items to report are (1) the dependent variable, (2) statistically signifi cant independent
variables, (3) signs of beta coeffi cients, and (4) standardized beta coeffi cients for the signifi -
cant variables. Following is a table that reports the use of regression analysis to determine the
target market profi le of the Subshop.
Factors Related to Number of Visits to the Subshop (Stepwise Regression Analysis Results)
Dependent Variable
How many times have you eaten at the Subshop in the past 30 days? 288 Total Cases
Independent Variable(s) Coeffi cient* Standardized
Demographic Factors
Gender** –3.02 –.43
Age 4.71 .35
Education –7.28 –.12
Lifestyle Factors
I typically go to restaurants that have good prices.*** 0.32 .35
Eating at restaurants is a large part of my diet. –0.21 –.27
I usually buy the “special of the day” at lunch. –0.17 –.20
Intercept 2.10
*95% level of confi dence **(Dummy variable coded 0 = female and 1 = male) ***Based on a scale where 1 = Strongly disagree to 7 = Strongly agree
In the presentation table, there are a number of nuances that we will point out. First, the
method of multiple regression (stepwise) is reported. Second, only the statistically signifi cant
(95% level of confi dence) independent variables are reported. Third, the types of independent
variables (demographics and lifestyle, here) are separated. Fourth, within each type, the inde-
pendent variables are arranged in descending order according to the absolute values of their
standardized beta coeffi cients. Fifth, where the coding of the independent variable is pertinent
to proper interpretation, the measurement scale is reported as a footnote to the table. Note, in
particular, that gender was used as a dummy variable, so it is important that the reader know
the code in order to realize that the fi nding denotes that the Subshop’s target market is skewed
toward women.
Synthesize Your Learning
This exercise will require you to take into consideration concepts and material from these three chapters.
Chapter 13 Implementing Basic Differences Tests Chapter 14 Making Use of Associations Tests Chapter 15 Understanding Regression Analysis Basics
M15_BURN3261_08_GE_C15.indd 425M15_BURN3261_08_GE_C15.indd 425 17/08/16 12:01 pm17/08/16 12:01 pm

426 CHAPTER 15 • UNDERSTANDING REGRESSION ANALYSIS BASICS
Alpha Airlines
In the middle of the second decade of the 21st cen-tury, many airlines found themselves in a very unfor-tunate situation. On the supply side, costs rose at an unusually high rate. Aviation fuel, despite a slight dip, continued to rise, and other costs—employee wages and salaries, supplies, services, rent, and repair—rose faster than ever before. Unable to counter these cost increases, most airlines slowly instituted price increases and unbundled some of their services, such as charg-ing $15 per checked-in bag. On the demand side, as the result of rising costs of many goods and services, business flyers reduced their flying and consumers cut back on their travel plans or turned to less expensive travel methods such as traveling by train or personal automobile. Reports by ticket sales agencies con-firmed that many international vacationers and tourists
had canceled or indefinitely postponed their plans due to high airline costs and concerns about personal safety.
Alpha Airlines, a major international airline, felt the squeeze on both sides of the equa-tion during this time as passenger miles and revenues began to fall in what some airline industry analysts characterized as a “death spiral.” However, marketing executives at Alpha Airlines vowed to not give up without putting up a very good fight, and they designed a questionnaire to obtain some baseline data as well as to assess the reactions of customers to possible changes in the airline’s services and prices. An abbreviated version of the question-naire follows.
1. Approximately how many of the following trips have you taken on Alpha Airlines this year?
a. Domestic business ________ b. Domestic tourist ________ c. International business ________ d. International tourist ________
2. Do you … (check all that apply)
________ Belong to Alpha Airlines’ frequent flyer program? ________ Belong to Alpha Airlines’ Prestige Club (private lounge areas in some air-
ports)? ________ Typically use Alpha Airlines’ website to book most of your flights? ________ Usually travel business class (including first class) on Alpha Airlines?
3. Indicate how desirable each of the following potential new Alpha Airlines’ services is to you from 1 to 7 where 1 = Do not want at all to 7 = Desire very much.
________ Double Alpha Airlines frequent flyer miles for any trips after you have earned 25,000 miles in that year
________ From 33% to 50% savings on airfare for a second family member on any inter-national flight with you
________ No $15 checked-in bag charge if you belong to the Alpha Airlines Prestige Club
________ Priority boarding on international Alpha Airlines flights if you belong to the Alpha Airlines Frequent Flyer program
________ Free wireless Internet service while in flight
Alpha Airlines uses marketing research to decide on service
improvements.
© M
icha
elju
ng/S
hutt
erst
ock
M15_BURN3261_08_GE_C15.indd 426M15_BURN3261_08_GE_C15.indd 426 17/08/16 12:01 pm17/08/16 12:01 pm

15-5 REPORTING REGRESSION FINDINGS TO CLIENTS 427
In addition to the answers to these questions, the questionnaire also gathered information on the following: gender, education level (highest level in years), income level (in $10,000 increments), age (actual years), marital status, approximate number of air flight trips (any airline) taken for each of the past three years, and some lifestyle dimensions. 18 (From my experience, I have found that the larger the airline company the lower the actual cost of travel has been; I generally call several airlines or travel agents to get price quotes and routing before I decide on a particular airline; the price I pay for my ticket is more important to me than the service I receive prior to and during the flight; I choose to travel by airline because my time is very valuable to me; I feel that the services I receive during the flight are good; I feel that the pre-flight services, such as baggage handling and ticket processing, are good; and normally, I fly with one particular airline company.)
The self-administered questionnaire is handed out by flight attendants to all Alpha Airlines passengers traveling on domestic or international flights during the first week of the month, resulting in over 20,000 completed and usable questionnaires. The Alpha Airlines marketing executives have a number of questions that they hope will be answered by this survey.
For each question that follows, indicate the specific questions or variables in the sur-vey that should be analyzed, paying close attention to the scale properties of each variable. Specify the type of statistical analysis that is appropriate and how SPSS output would indicate whether or not statistically significant findings are present.
1. What is the target market profile of each of the following types of Alpha Airlines traveler? That is, what demographic and lifestyle factors are related to the number of miles traveled on Alpha Airlines for each of the following types?
a. Domestic business traveler b. Domestic tourist traveler c. International business traveler d. International tourist traveler
2. Are there differences in the desirabilities of each of the five potential new Alpha Airlines services with respect to the following?
a. Gender b. Belonging (or not) to Alpha Airlines’ frequent flyer program c. Belonging (or not) to Alpha Airlines’ Prestige Club (private lounge areas in some airports) d. Use or nonuse of Alpha Airlines’ website to book most flights e. Usual class of seating (business versus economy class) on Alpha Airlines
3. Do relationships exist for estimated number of air flight trips in each of the past three years on any airline with each of the following charateristics?
a. Age b. Income c. Education d. Any of the lifestyle dimensions
4. Do associations exist for (1) participating or not in Alpha Airlines’ frequent flyer program, (2) membership or not in Alpha Airlines Prestige Club (private lounge areas in some air-ports), and/or (3) use or not of Alpha Airlines website to book most flights with the follow-ing variables?
a. Gender b. Marital status c. Usual class of seating (business versus economy class) on Alpha Airlines
Source: Cano, Lucila Zarraga, Sandoval, Enrique Corona, and Miguel Angel Olivares Urbina (2012), Proposals for Marketing Strategies for Optical Centers Based on the Consumer, Global Conference on Business and Finance Proceedings, Vol. 7, No 1, 601-606.
M15_BURN3261_08_GE_C15.indd 427M15_BURN3261_08_GE_C15.indd 427 17/08/16 12:01 pm17/08/16 12:01 pm

428 CHAPTER 15 • UNDERSTANDING REGRESSION ANALYSIS BASICS
Summary
Market researchers use regression analysis to make predic-
tions. The basis of this technique is an assumed straight-
line relationship existing between the variables. With
bivariate regression, one independent variable, x , is used
to predict the dependent variable, y , using the straight-line
formula of y = a + bx . A high R 2 and a statistically sig-
nifi cant slope indicate that the linear model is a good fi t.
With multiple regression analysis, the underlying concep-
tual model specifi es that several independent variables are
to be used, and it is necessary to determine which ones are
signifi cant. Multiple regression analysis allows for the use
of several independent variables (additivity) that are not
highly correlated with one another. Multicollinearity, or
the condition of high correlations among the independent
variables, violates this necessary condition, and statistical
analysis programs can be programmed to report variance
infl ation factors (VIFs) that will warn the researcher of this
violation and prompt him or her to eliminate some of the
off ending independent variables.
By systematically eliminating the nonsignificant
independent variables in an iterative manner in a process
called trimming, a researcher will ultimately derive a set
of signifi cant independent variables that yields a signifi -
cant predictive model. While the dependent and indepen-
dent variables should be scale variables (interval or ratio),
it is permitted to use a few dummy independent variables
that are nominally coded for two categories such as male/
female. With surveys, it is common for market researchers
to use multiple regression analysis as a screening device
to determine the statistically signifi cant independent vari-
ables that emerge from a large set of possible independent
variables. Interpretation of a multiple regression analysis
fi nding is facilitated by examining the standardized beta
coeffi cients that indicate the relative importance and the
direction of the relationship of the variables.
Because the process of trimming nonsignifi cant inde-
pendent variables is tedious and time consuming, seasoned
researchers may opt to use stepwise multiple regression
analysis if faced with a large number of candidate inde-
pendent variables, such as several demographic, lifestyle,
and buyer behavior characteristics. With stepwise multiple
regression, independent variables are entered by the pro-
gram until the multiple regression equation contains only
statistically signifi cant independent variables.
Key Terms
Regression analysis (p. 407 )
Bivariate regression (p. 407 )
Intercept (p. 408 )
Slope (p. 408 )
Dependent variable (p. 408 )
Independent variable (p. 408 )
Least squares criterion (p. 408 )
Outlier (p. 408 )
General conceptual model (p. 411 )
Multiple regression analysis (p. 412 )
Regression plane (p. 412 )
Additivity (p. 412 )
Independence assumption (p. 413 )
Multicollinearity (p. 413 )
Variance infl ation factor (VIF)
(p. 413 )
Dummy independent variable
(p. 417 )
Standardized beta coeffi cient (p. 418 )
Screening device (p. 418 )
Stepwise multiple regression (p. 422 )
Review Questions/Applications
15- 1. Use an x-y graph to construct and explain a reason-
ably simple linear model for each of the following
cases:
a. What is the relationship between gasoline prices
and distance traveled for family automobile
touring vacations?
b. How do hurricane-force wind warnings (e.g.,
Category 1, Category 2, etc.) relate to purchases
of fl ashlight batteries in the expected landfall
area?
c. What is the relationship between passengers
with carry-on luggage and charges for checking
luggage on airlines?
15- 2. Indicate what the scatter diagram and probable
regression line would look like for two variables
that are correlated in each of the following ways
(in each instance, assume a negative intercept):
(a) –0.89 (b) +0.48, and (c) –0.10.
15- 3 . Circle K runs a contest, inviting customers to fi ll out
a registration card. In exchange, they are eligible
for a grand-prize drawing of a trip to Alaska. The
card asks for the customer’s age, education, gender,
estimated weekly purchases (in dollars) at that
Circle K, and approximate distance the Circle K
is from his or her home. Identify each of the fol-
lowing if a multiple regression analysis were to be
M15_BURN3261_08_GE_C15.indd 428M15_BURN3261_08_GE_C15.indd 428 17/08/16 12:01 pm17/08/16 12:01 pm

REVIEW QUESTIONS/APPLICATIONS 429
performed: (a) independent variable, (b) dependent
variable, (c) dummy variable.
15- 4. Explain what is meant by the independence assump-
tion in multiple regression. How can you examine
your data for independence, and what statistic is
issued by most statistical analysis programs? How
is this statistic interpreted? That is, what would
indicate the presence of multicollinearity, and what
would you do to eliminate it?
15- 5 . What is a general conceptual model? With respect
to multiple regression analysis, in what ways can a
general conceptual model help marketing research-
ers and managers?
15- 6 . If one uses the “enter” method for multiple regres-
sion analysis, what statistics on an SPSS output
should be examined to assess the result? Indicate
how you would determine each of the following:
a. Variance explained in the dependent variable by
the independent variables
b. Statistical signifi cance of each of the indepen-
dent variables
c. Relative importance of the independent vari-
ables in predicting the dependent variable
15- 7 . Explain what is meant by the notion of “trimming” a
multiple regression result. Use the following exam-
ple to illustrate your understanding of this concept.
A bicycle manufacturer maintains records over
20 years of the following: retail price in dollars,
cooperative advertising amount in dollars, competi-
tors’ average retail price in dollars, number of retail
locations selling the bicycle manufacturer’s brand,
and whether or not the winner of the Tour de France
was riding the manufacturer’s brand (coded as a
dummy variable where 0 = no and 1 = yes).
The initial multiple regression result determines
the following:
Variable Signifi cance Level
Average retail price in dollars .001
Cooperative advertising amount
in dollars
.202
Competitors’ average retail price
in dollars
.028
Number of retail locations .591
Tour de France winner .032
Using the “enter” method in SPSS, what would be
the trimming steps you would expect to undertake
to identify the signifi cant multiple regression result?
Explain your reasoning.
15- 8. Using the bicycle example in question 7, what do
you expect would be the elimination of variables
sequence using stepwise multiple regression?
Explain your reasoning with respect to the opera-
tion of each step of this technique.
15- 9 . Using SPSS graphical capabilities, diagram the
regression plane for the following variables.
Number of Gallons of Gasoline Used per Week
Miles Commuted to Work per Week
Number of Riders in Carpool
5 50 4
10 125 3
15 175 2
20 250 0
25 300 0
15- 10. The Maximum Amount is a company that special-
izes in making fashionable clothes in large sizes for
plus-size people. A survey was performed for the
Maximum Amount, and a regression analysis was
run on some of the data. Of interest in this analysis
was the possible relationship between self-esteem
(dependent variable) and number of Maximum
Amount articles purchased last year (independent
variables). Self-esteem was measured on a 7-point
scale in which 1 signifi es very low and 7 indicates
very high self-esteem. Below are some items that
have been taken from the output.
Pearson product moment correlation = +0.63
Intercept = 3.5
Slope = +0.2
All statistical tests are signifi cant at the .01 level or less.
What is the correct interpretation of these fi ndings?
15- 11. Wayne LaTorte is a safety engineer who works for
the U.S. Postal Service. For most of his life, Wayne
has been fascinated by UFOs. He has kept records
of UFO sightings in the desert areas of Arizona,
California, and New Mexico over the past 15 years
and he has correlated them with earthquake tremors.
A fellow engineer suggests that Wayne use regres-
sion analysis as a means of determining the relation-
ship. Wayne does this and fi nds a “constant” of 30
separate earth tremor events and a slope of 5 events
per UFO sighting. Wayne then writes an article for
the UFO Observer , claiming that earthquakes are
largely caused by the subsonic vibrations emitted
by UFOs as they enter Earth’s atmosphere. What is
your reaction to Wayne’s article?
M15_BURN3261_08_GE_C15.indd 429M15_BURN3261_08_GE_C15.indd 429 30/08/16 11:22 am30/08/16 11:22 am

430 CHAPTER 15 • UNDERSTANDING REGRESSION ANALYSIS BASICS
(For necessary background, refer to Case 12. 1 on page 346 ,
Case 13. 1 on page 375 , and Case 14. 1 on page 404 .)
Jeff Dean, the aspiring restaurant owner, was a
very happy camper. He had learned that his dream of
L’Experience Félicité Restaurant could be a reality.
Through the research conducted under Cory Rogers’s ex-
pert supervision and Christine Yu’s SPSS analysis, Jeff had
a good idea of what features were desired, where the res-
taurant should be located, and even what advertising media
to use to promote it. He believed he had all the information
he needed to obtain the fi nancing necessary to design and
build L’Experience Félicité Restaurant.
Jeff called Cory on Friday morning and said, “Cory, I
am very excited about everything that your work has found
about the good prospects of L’Experience Félicité Restau-
rant. I want to set up a meeting with my banker next week
to pitch it to him for the funding. Can you get me the fi nal
report by then?”
Cory was silent for a moment, and then he said, “Chris-
tine is doing the fi nal fi gures and dressing up the tables so
we can paste them into the report document. But I think you
have forgotten about the last research objective. We still
need to address the target market defi nition with a fi nal set
of analyses. I know Christine just fi nished some exams at
school, and she has been asking if there is any work she can
do over the weekend. I’ll give her this task. Why don’t you
plan on coming over at 11:00 a.m. on Monday. Christine
and I will show you what we have found, and then we can
take Christine to lunch for giving up her weekend.”
Your task in Case 15. 1 is to take Christine Yu’s role,
use the L’Experience Félicité Restaurant SPSS dataset, and
perform the proper analysis. You will also need to interpret
the fi ndings.
1. What is the demographic target market defi nition for
L’Experience Félicité Restaurant?
2. What is the restaurant spending behavior target market
defi nition for L’Experience Félicité Restaurant?
3. Develop a general conceptual model of market seg-
mentation for L’Experience Félicité Restaurant. Test it
using multiple regression analysis and interpret your
fi ndings for Jeff Dean.
CASE 15. 1
L’Experience Félicité Restaurant Survey Regression Analysis
CASE 15. 2 INTEGRATED CASE
Auto Concepts Segmentation Analysis
It is Monday, and today is your fi rst day in your new mar-
keting internship. After a rigorous application and review
process including two grueling interviews with Cory Rog-
ers and Celeste Brown, you have been hired by CMG
Research. It is 9:00 a.m., and you are in Rogers’s offi ce
along with Brown. Cory says, “We know that it is just your
fi rst day as the CMG Research marketing intern, but we
are getting bogged down with a lot of work that must be
completed very quickly or our clients will be unhappy. As
I indicated to you a few days ago when I let you know that
we chose you to be this year’s marketing intern, Celeste
and I were very impressed with your command of SPSS
and your understanding of more advanced statistical analy-
ses such as regression and analysis of variance. So, we are
going to let you show us your stuff right away.”
Cory continues, “We are in the fi nal stages of a major
survey that we conducted for Auto Concepts. They have fi ve
automobile models under consideration for multimillion-
dollar development. We have provided them with a great
deal of analysis, and they are in the process of narrowing
down the development list. I would like to give them one
more set of fi ndings. Specifi cally, I would like to give them
target market defi nitions for each of the possible models.
That is, using multiple regression analysis as a screening
device, we need to identify the signifi cant demographic and
attitudes about global warming that uniquely defi ne these
preference segments.”
Celeste then says, “We can go to the offi ce where I
can give you a copy of the SPSS dataset, and, as you know,
you can use SPSS Variable View or Utilities-Variables to
see the code book for this survey.” Cory ends the meeting
by saying, “Great. I am sure that you will do a fantastic job
with this assignment. Celeste and I have to catch a fl ight in
a couple of hours, and we will be out of town for the next
three days. But you can call, text, or email. Let’s set a meet-
ing for 9:00 a.m. on Thursday, and you can show us what
you have found.”
Your task as the new CMG marketing intern: Use
the AutoConcepts.Recoded.sav data fi le. The dataset is
“recoded” with midpoint values for town size, education,
and so on, so these variables are now scale variables that
conform to the requirements for regression analysis. Per-
form the proper analyses to identify the salient demographic
and/or attitude factors that are related to preferences for
M15_BURN3261_08_GE_C15.indd 430M15_BURN3261_08_GE_C15.indd 430 17/08/16 12:01 pm17/08/16 12:01 pm

REVIEW QUESTIONS/APPLICATIONS 431
each of the automobile models under consideration. With
each automobile model, prepare a summary that:
1. Lists the statistically signifi cant independent variables
(use 95% level of confi dence).
2. Interprets the direction of the relationship of each
statistically signifi cant independent variable with
respect to the preference for the automobile model
concerned.
3. Identifi es or distinguishes the relative importance
of each of the statistically signifi cant independent
variables.
4. Assesses the strength of the statistically signifi cant
independent variables as they join to predict the prefer-
ences for the automobile model concerned.
M15_BURN3261_08_GE_C15.indd 431M15_BURN3261_08_GE_C15.indd 431 17/08/16 12:01 pm17/08/16 12:01 pm

▶
LEARNING OBJECTIVES In this chapter you will learn: 16- 1 The importance of the marketing
research report 16- 2 How to position the report for the
audience 16- 3 What plagiarism is, why it is a serious
problem, and how to properly reference sources
16- 4 The elements that should be included in the marketing research report
16- 5 The basic guidelines and principles for writing effective marketing research reports
16- 6 How to accurately represent data using visuals, such as fi gures, tables, charts, and graphs
16- 7 How to make visuals, such as tables and charts, using SPSS
16- 8 The basic principles for presenting an oral report
16- 9 Alternate ways to report fi ndings 16- 10 Methods for disseminating results
across the organization, including dashboards
“WHERE WE ARE”
1 Establish the need for marketing research.
2 Defi ne the problem.
3 Establish research objectives.
4 Determine research design.
5 Identify information types and sources.
6 Determine methods of accessing data.
7 Design data collection forms.
8 Determine the sample plan and size.
9 Collect data.
10 Analyze data.
11 Prepare and present the fi nal research report.
Tableau: Modern Marketers: It’s Never Too Late to Start Your Analytics Journey
Marketers have come a long way even
in recent years; once known primarily for
logos, brochures, and pretty websites,
modern marketers are not only expected
to build the brand, spread awareness, and
drive sales of products and services, but
they’re expected to justify all expenses
with proven return on investment (ROI) as
well. Furthermore, the majority of market-
ers today are using and tracking the perfor-
mance of at least nine different channels, digital and offl ine, to target
customers.
Because the days of go-with-your-gut-style marketing tactics are
long gone, the successful multichannel marketers are able to integrate
and understand all their data to help drive decision making for faster,
better results. Never before have data and analytics played a more cru-
cial role in marketing.
That being said, data visualization dashboards are one of the most
important and often overlooked tools for marketers. Top-tier employers
expect all marketers, leaders and entry level alike, to ask and answer
their own questions of the data and to waste no time in acting on those
insights. With the world’s volume of data growing exponentially by the
day, analytical skills are no longer optional.
The good news: Tableau Software, Inc., has created an easy-to-use,
drag-and-drop analytics platform to help marketers see and understand
what’s happening across their many channels, campaigns, and business
goals in real time.
16 The Research Report
Elissa Fink, Global
Chief Marketing Offi cer,
Tableau Software.
M16_BURN3261_08_GE_C16.indd 432M16_BURN3261_08_GE_C16.indd 432 30/08/16 11:29 am30/08/16 11:29 am

433
If you haven’t yet embraced data,
you may fi nd the whole idea intimidating.
Here are three tips to help you get started
today:
1. Start with a Small Database The fi rst step is to stop procrastinating.
It’s not about having the perfect dataset.
Start with what you have. Look to Google
Analytics data to better understand web-
site traffi c. Play with social media data to
measure engagement. Dig into campaign
data to see which efforts are resonating
with your customers. Nothing begets suc-
cess like success, and even small achieve-
ments will encourage you to push further.
Students at accredited schools anywhere
in the world can start learning these cru-
cial analytics skills today with a free license of Tableau Desktop. Learn more at http://www.
tableau.com/academic .
2. Visualize Your Data If you thought spreadsheets were powerful, try on visualization for size. Because our brains
are wired to process information visually, we’re much faster at spotting trends, identifying
correlations, and honing in on outliers when our data are visualized. With visual marketing
dashboards, your insights become easier to absorb, whether through a map capturing geo-
graphic information, height variations within a bar chart, or a trend line aggregating millions
of data points.
3. Interact with Your Data Marketing dashboards are important because they get teams looking at the same data visu-
alizations. But once users are interacting with the same datasets, different viewers will have
unique questions about what they see. Marketers and agency clients alike will both interact
with the same data to get answers to specifi c questions they each have.
Interactive dashboards enable basic analytical tasks, such as fi ltering views, adjust-
ing parameters, making quick calculations, and drilling down to examine underlying data.
Because interactivity transforms stockpiles of data into actionable insights, marketers and
This dashboard is connected directly with Google Analytics. It is easy to see
traffi c trends by country, section of website visited, and number of visits in a
given time period. Click into the visualization to interact with this dataset (link:
http://www.tableau.com/learn/gallery/website-traffi c-trends ).
M16_BURN3261_08_GE_C16.indd 433M16_BURN3261_08_GE_C16.indd 433 17/08/16 1:30 pm17/08/16 1:30 pm

434 CHAPTER 16 • THE RESEARCH REPORT
business leaders throughout an organization become engaged in problem solving and deci-
sion making instead of struggling to understand datasets.
—Elissa Fink
About Elissa Fink Elissa Fink, the global chief marketing offi cer at Tableau Software since 2007, believes that
human intelligence is a key part of making data work for marketing decisions. The Tableau
Software marketing department uses its own tool every day to execute across hundreds of
campaigns and business goals. “Marketing is about recognizing where you are and knowing
where you want to be. It’s all about measuring progress,” Fink says.
Source: Text and photos courtesy of Elissa Fink and Tableau Software, Inc.
The importance of communicating the findings from a marketing research project with
clarity, accuracy, and style cannot be overemphasized. Quite simply, no matter how
competently a research project has been conducted—from the problem definition stage
to the data analysis stage—if the results are not presented well, the project is a failure. A
researcher’s work is often judged solely on the basis of the quality of the marketing research
report.
As this chapter’s introduction demonstrates, one of the many ways that the marketing
research industry has been changing is in the new and innovative ways that are being used
to communicate results. Research results are now often displayed through animations, vid-
eos, photographs, and other visual tools. Innovative research fi rms use storytelling and other
emotion-inducing techniques to present results so that their research clients will be drawn into
the fi ndings. 1 Marketing research results can even be presented in the form of documentary
videos or theater.
Another trend is the growing expectation that marketing researchers will not just present
statistical fi ndings but also recommend actionable strategies that stem from the results. To be
seen as relevant, researchers must demonstrate to their clients that acting on their fi ndings will
have a positive impact on their business. 2 Researchers who simply present table after table
of results without explaining why these data are important off er limited value to managers.
Researchers are increasingly being asked not only to collect data but also to serve in the role
of trusted advisor.
A related trend is an increased emphasis on getting data into the hands of the client-side
users across multiple departments in an organization, called the “democratization” of market-
ing research. As explained in the introduction, software platforms such as Tableau allow users
throughout a fi rm to have access to data in real time to perform their own analyses and create
their own graphics. Tableau specializes in data visualization , or the visual display of infor-
mation in graphical or pictorial form. Increasingly, marketing research fi rms are being asked
to support end users in managing their own data. 3
It is important for you to be aware of these new trends, tools, and techniques that are
transforming the marketing industry. Yet none of these changes mitigate the importance of
knowing how to present research results clearly and accurately in both oral and written forms.
In this chapter, you will learn the basics of preparing written and oral reports. You will learn
the important elements that compose a report. You will be introduced to guidelines and prin-
ciples for the written report. You will be shown how to develop visuals, such as tables and fi g-
ures, to clearly display your fi ndings. And you will be provided with guidelines for presenting
oral reports. To end the chapter, we will introduce other tools that can be used to communicate
results in eff ective, easy-to-understand, and impactful ways.
Data visualization is the visual display of information in graphical or pictorial form.
M16_BURN3261_08_GE_C16.indd 434M16_BURN3261_08_GE_C16.indd 434 17/08/16 1:30 pm17/08/16 1:30 pm

16-2 KNOW YOUR AUDIENCE 435
16- 1 The Importance of the Marketing Research Report The marketing research report is a written and/or oral presentation that transmits research
results, conclusions, recommendations, and other important information to the client, who
in turn bases his or her decision making on the contents of the report. The importance of the
research report was addressed by the marketing research director at Kodak, who stated that even
the best research will not drive the appropriate action unless the audience understands the results
and their meaning. 4 Marketing researcher James A. Rohde notes that the presentation is impor-
tant in demonstrating that the fi ndings are relevant to the client because these decision makers
base their judgments on what they can accomplish with the information in the fi nal report. They
are less concerned about the method and analytical tools used by the researcher. 5 This places
greater importance on writing a report that is relevant to the decisions the client must make. The
ultimate result of all the work on the research project is communication with the client.
The marketing research report is the product that represents the eff orts of the marketing
research team. It is often the only part of the project that the client will see. If the report is
poorly written, riddled with grammatical errors, sloppy, or inferior in any way, the quality of
the research (including its analysis and information) becomes suspect and its credibility is
reduced. If organization and presentation are faulty, the reader may never reach the intended
conclusions. The time and eff ort expended in the research process are wasted if the report
does not communicate eff ectively.
If, on the other hand, all aspects of the report are done well, the report will not only
communicate properly, but also it will serve to build credibility. Many managers will not be
involved in any aspect of the research process but will use the report to make business deci-
sions. Eff ective reporting is essential and includes careful attention to organization, format-
ting, good writing, and good grammar.
IMPROVING THE EFFICIENCY OF REPORT WRITING Assuming that you have written a term paper (or several!), you realize that report writing is
not easy. Still, electronic tools can aid in some processes. Word processing software typi-
cally includes many features that increase writing effi ciency. Features such as automatic ref-
erencing coupled with automated citation formatting, available on many of today’s online
databases, have reduced much of the tedious time spent on report writing. Most of today’s
statistical analysis packages, such as SPSS, include sophisticated tools that off er ease of pre-
sentation in tables, pie charts, bar graphs, and other visuals that allow for customization to suit
the writer’s purpose.
Computer-assisted questionnaire design tools, such as SurveyMonkey or Qualtrics, often
generate automatic reports, including tables and graphs, with the survey results (see Chapter 8 ) .
These reports generally present only descriptive statistics. To conduct higher-level statistical
tests, you need access to the raw data of your survey. Computer-assisted questionnaire design
tools often allow you to download survey results to data analysis software such as Excel or
SPSS, although that capability is typically only available on a long-term basis if you pay a
higher price for the service. Your university may provide free access for students to a profes-
sional version of an electronic survey.
16- 2 Know Your Audience Marketing research reports are tailored to specifi c audiences and purposes, and you must
consider both in all phases of the research process, including planning the report. Before you
begin writing, you must answer some questions:
■ What message do you want to communicate? ■ What is your purpose?
The marketing research report is a written and/or oral report that transmits research results, conclusions, vital recommendations, and other important information to the client, who in turn bases his or her decision making on the contents of the report.
M16_BURN3261_08_GE_C16.indd 435M16_BURN3261_08_GE_C16.indd 435 17/08/16 1:30 pm17/08/16 1:30 pm

436 CHAPTER 16 • THE RESEARCH REPORT
■ Do demographic and lifestyle variables of your audience affect their perspective of your
research? ■ What are your audience’s interests, values, and concerns?
These and other questions must be addressed before you can determine how best to structure
your report.
When you are preparing the fi nal report, it is often helpful “to get on the other side of
the desk.” Assume you are the reader instead of the writer. Doing so will help you see things
through the eyes of your audience and increase the success of your communication. This is your
opportunity to ask that basic (and critical) question from the reader’s point of view: “What’s in
it for me?” Once you have answered these questions, you need to organize your report.
16- 3 Avoid Plagiarism! Before we introduce the major elements of a marketing research report, it is important to dis-
cuss the importance of carefully referencing sources. If you use secondary information, you
will need to document your sources (provide enough information so that your sources can be
located). You do not need to document facts that are common knowledge or can be easily veri-
fi ed. But if you are in doubt, document! Plagiarism refers to representing the work of others
as your own. Citing the work of others not only allows you to avoid charges of plagiarism but
also adds credibility to your message. All sources, including information that is found online,
should be accurately referenced.
Students often underestimate what a serious off ense it is to commit plagiarism. Plagia-
rism can cost you your job. Detecting plagiarism is much easier today than it was in the past.
To check a document for plagiarism, all you need to do is to put the suspected part of a docu-
ment into a search engine and see what matches appear. In addition, specialized software such
as Turnitin can be used to check for plagiarism.
Take the opportunity to learn more about plagiarism by watching the YouTube video
cited in the following feature. You can also explore the Internet for examples of how serious
plagiarism is: Students have lost their college degrees, top-level professionals have lost their
jobs, and well-known celebrity writers have been defamed. Marketing Research Insight 16. 1
off ers more information about this important topic.
Plagiarism refers to representing the work of others as your own. It is a serious offense to plagiarize; people lose their jobs due to this ethical lapse.
Make sure you understand what plagiarism means. If in doubt, provide a reference to the source and put the citation in the proper format.
To learn more about the perils of plagiarism, go to www.
youtube.com and type in “Understanding Plagiarism” and “York St. John University.”
Know your audience.
■ Who is the audience? ■ If there are multiple audi-
ences, who is your primary
audience? Your secondary
audience? ■ What does your audience
know? ■ What does your audience need
to know? ■ Are there cultural differences
you need to consider? ■ What biases or preconceived
notions of the audience might
serve as barriers to your
message? ■ What strategies can you use
to overcome these negative
attitudes? © R
awpi
xel/
Shu
tter
stoc
k
M16_BURN3261_08_GE_C16.indd 436M16_BURN3261_08_GE_C16.indd 436 17/08/16 1:30 pm17/08/16 1:30 pm

16-4 ELEMENTS OF THE REPORT 437
16- 4 Elements of the Report Reports are organized in sections, or elements. If the organization for which you are conduct-
ing the research has specifi c guidelines for preparing the document, you should follow them.
If no specifi c guidelines are provided, certain elements must be considered when you are
preparing the report. These elements can be grouped into three sections: front matter, body,
and end matter. Table 16. 1 displays these three sections along with elements covered in each
section.
FRONT MATTER The front matter consists of all pages that precede the fi rst page of the report: the title page,
letter of authorization (optional), letter/memo of transmittal, table of contents, list of illustra-
tions, and abstract/executive summary.
Front matter consists of all pages that precede the fi rst page of the report.
Properly Reference Your Sources Plagiarism is derived from a Latin word for kidnapping a Roman citizen’s slave. 6 Words can be thought of as property. Avoiding plagiarism involves respect for the original author’s work and respect for your audience’s needs or desire to trace data and learn more from the source.
Just as all printed sources must be documented, so must information found online. In a letter to the New York Times , Marilyn Bergman, president of the American Society of Com-posers, Authors, and Publishers, expressed a disturbing trend of online theft of words when she said that Americans are prompted by a “free for the taking” feeling of information on the web. 7 The Internet is not public domain. Proper documen-tation of all sources helps a writer avoid public humiliation and maintain professional integrity.
APA (American Psychological Association) and MLA (Modern Language Association) are two styles that offer formats for citation. Many online databases offer a “Cite This” option that automatically gives you the refer-ence in a format of your choice. In terms of formats, APA is used in business fi elds, and MLA is used in the humani-ties. Style books and university websites offer examples of documentation for a range of sources, including electronic formats.
Sample Format:
Author, I., Author, I., & Author, I. (Year, month date). Title, [Type of medium]. Available: Site/Path/File [Access date].
MARKETING RESEARCH INSIGHT 16. 1 Ethical Consideration
Referencing sources is essential in the business
world.
© L
ucky
Bus
ines
s/S
hutt
erst
ock
M16_BURN3261_08_GE_C16.indd 437M16_BURN3261_08_GE_C16.indd 437 17/08/16 1:30 pm17/08/16 1:30 pm

438 CHAPTER 16 • THE RESEARCH REPORT
TABLE 16. 1 The Elements of a Marketing Research Report
A. Front Matter
1. Title Page
2. Letter of Authorization
3. Letter/Memo of Transmittal
4. Table of Contents
5. List of Illustrations
6. Abstract/Executive Summary
B. Body
1. Introduction
2. Research Objectives
3. Method
4. Results
5. Limitations
6. Conclusions or Conclusions and Recommendations
C. End Matter
1. Appendices
2. Endnotes
Title Page The title page ( Figure 16. 1 ) contains four major items of information: (1) the
title of the document, (2) the organization/person(s) for whom the report was prepared,
(3) the organization/person(s) who prepared the report, and (4) the date of submission. If
names of individuals appear on the title page, they may be in either alphabetical order or
some other agreed-upon order; each individual should also be given a designation or descrip-
tive title.
The document title should be as informative as possible. It should include the purpose
and content of the report, such as “An Analysis of the Demand for a Branch Offi ce of the Law
Firm of Dewey, Cheatam, and Howe” or “Alternative Advertising Copy to Introduce the New
M&M/Mars Low-Fat Candy Bar.” The title should be centered and printed in all uppercase
(capital) letters. Other items of information on the title page should be centered and printed in
uppercase and lowercase letters. The title page is counted as page i of the front matter; how-
ever, no page number is printed on it. See Figure 16. 1 . On the page following the title page,
the printed page number will be ii.
Some experts recommend that you change the title to be brief and understandable if you
are making a presentation on the survey results. 8 For example, “An Analysis of the Demand
for a Branch Offi ce of the CPA Firm of Dean and Allen” would be simplifi ed to “Demand for
a Branch Offi ce of Dean and Allen.” Additional insights on preparing for an oral presentation
are provided later in the chapter.
Letter of Authorization The letter of authorization is the marketing research fi rm’s cer-
tifi cation to do the project. This element is optional. It includes the name and title of the
persons authorizing the research to be performed, and it may also include a general descrip-
tion of the nature of the research project, completion date, terms of payment, and any special
conditions of the research project requested by the client or research user. If you allude to the
conditions of your authorization in the letter/memo of transmittal, the letter of authorization is
not necessary in the report. However, if your reader may not know the conditions of authoriza-
tion, inclusion of this document is helpful.
M16_BURN3261_08_GE_C16.indd 438M16_BURN3261_08_GE_C16.indd 438 17/08/16 1:30 pm17/08/16 1:30 pm

16-4 ELEMENTS OF THE REPORT 439
Letter/Memo of Transmittal Use a letter of transmittal to release or deliver the docu-
ment to an organization for which you are not a regular employee. Use a memo of trans-mittal to deliver the document within your organization. The letter/memo of transmittal
describes the general nature of the research in a sentence or two and identifi es the individual
who is releasing the report. The primary purpose of the letter/memo of transmittal is to ori-
ent the reader to the report and to build a positive image of the report. It should establish
rapport between the writer and receiver. It gives the receiver a person to contact if questions
arise.
Writing style in the letter/memo of transmittal should be personal and slightly informal.
Some general elements that may appear in the letter/memo of transmittal are a brief identifi -
cation of the nature of the research, a review of the conditions of the authorization to do the
research (if no letter or authorization is included), comments on fi ndings, suggestions for
further research, and an expression of interest in the project and further research. It should end
FIGURE 16. 1 Title Page
NEW PRODUCTS DIVISION
OF HOGER CHOCOLATIERS:
A MARKETING RESEARCH STUDY OF SHOPPERS’ REACTIONS TO NEW PACKAGING
OF GIFT CHOCOLATES
Prepared for Ms. Ola Hoger, CEO
Prepared by Jonathan Yu, Vice President
CMG Research, Inc.
July 2016
Use a letter of transmittal outside your organization and a memo within your organization.
M16_BURN3261_08_GE_C16.indd 439M16_BURN3261_08_GE_C16.indd 439 17/08/16 1:30 pm17/08/16 1:30 pm

440 CHAPTER 16 • THE RESEARCH REPORT
with an expression of appreciation for the assignment, acknowledgment of assistance from
others, and suggestions for following up. Personal observations, unsupported by the data, are
appropriate. Figure 16. 2 presents an example of a letter of transmittal.
Table of Contents The table of contents helps the reader locate information in the
research report. The table of contents ( Figure 16. 3 ) should list all sections of the report that
follow. Each heading should read exactly as it appears in the text and should identify the
number of the page on which it appears. If a section is longer than one page, list the page on
which it begins. Indent subheadings under headings. All items except the title page and the
table of contents are listed with page numbers in the table of contents. Front-matter pages are
numbered with lowercase Roman numerals: i, ii, iii, iv, and so on. Arabic numerals (1, 2, 3)
begin with the introduction section of the body of the report.
FIGURE 16. 2 Letter of Transmittal
CMG Research, Inc. 1100 St. Louis Place
St. Louis, MO
July 14, 2016
Ms. Ola Hoger
Gift Chocolate Division
Hoger Chocolatiers
Cocoa, USA 00000
Dear Ms. Hoger:
With your letter of authorization, dated April 25, 2016, you authorized CMG to conduct a research
project for Hoger Chocolatiers. With this letter, I am hereby transmitting to you the report of that
project, entitled “A MARKETING RESEARCH STUDY OF SHOPPERS’ REACTIONS TO
NEW PACKAGING OF GIFT CHOCOLATES.”
The method used to generate the fi ndings of this report is described in detail in the report.
Moreover, the method follows that described in our proposal to you. We believe the report accom-
plishes the research objectives we set out at the beginning of this process and, therefore, you should
be able to use the information contained herein to make the important decisions needed for Hoger
Chocolatiers.
My colleagues and I have been pleased to work with you on this project. We are prepared to
make a presentation of the report at your convenience. Do not hesitate to call me at (877) 492-2891
should you have any questions.
Sincerely,
Jonathan Yu
Jonathan Yu
M16_BURN3261_08_GE_C16.indd 440M16_BURN3261_08_GE_C16.indd 440 17/08/16 1:30 pm17/08/16 1:30 pm

16-4 ELEMENTS OF THE REPORT 441
FIGURE 16. 3 Table of Contents
Table of Contents Section Title ................................................................................................................................ Page
List of Illustrations ........................................................................................................................... vi
Executive Summary ....................................................................................................................... viii
Introduction ....................................................................................................................................... 1
Defi nition of the Population .......................................................................................................... 1
Sample Plan .................................................................................................................................. 2
Sample Size ................................................................................................................................... 6
Development of the Questionnaire ................................................................................................ 8
Data Collection Method .............................................................................................................. 12
Methods to Reduce Nonsampling Error ...................................................................................... 16
Findings ........................................................................................................................................... 24
Response Rate ............................................................................................................................. 24
Profi le of the Sample ................................................................................................................... 27
Size of Hometown/City ........................................................................................................... 28
Gender ..................................................................................................................................... 29
Family Life Cycle ................................................................................................................... 30
Number in Family ................................................................................................................... 30
Age .......................................................................................................................................... 31
Education ................................................................................................................................ 33
Income ..................................................................................................................................... 35
Dwelling Type ......................................................................................................................... 38
Desirability Ratings of Proposed Packaging ............................................................................... 40
Model 1 ................................................................................................................................... 43
Model 2 ................................................................................................................................... 46
Model 3 ................................................................................................................................... 50
Model 4 ................................................................................................................................... 54
Model 5 ................................................................................................................................... 58
Attitudes Toward Sustainable Packaging .................................................................................... 62
Lifestyles ..................................................................................................................................... 70
List of Illustrations If the report contains tables and/or fi gures, include in the table of
contents a list of illustrations with page numbers on which they appear. All tables and
fi gures should be included in this list, which helps the reader fi nd specifi c illustrations that
graphically portray the information. Tables are words and/or numbers arranged in rows and
columns; fi gures are graphs, charts, maps, pictures, and so on. Because tables and fi gures
are numbered independently, you may have both a Figure 1 and a Table 1 in your list of
illustrations. Give each a name, and list each in the order in which it appears in the report.
Abstract/Executive Summary Your report may have many readers. Some of them will
need to know the details of your research, such as the supporting data on which you base
your conclusions and recommendations. Others will not need as many details but will want
M16_BURN3261_08_GE_C16.indd 441M16_BURN3261_08_GE_C16.indd 441 17/08/16 1:30 pm17/08/16 1:30 pm

442 CHAPTER 16 • THE RESEARCH REPORT
to read the conclusions and recommendations. Still others with a general need to know may
read only the executive summary. Therefore, the abstract or executive summary is a “skel-
eton” of your report. It serves as a summary for the busy executive or a preview for the
in-depth reader. It provides an overview of the most useful information, including the con-
clusions and recommendations. The abstract or executive summary should be very carefully
written, conveying the information as concisely as possible. It should be single-spaced and
should briefl y cover the general subject of the research, the scope of the research (what the
research covers/does not cover), identifi cation of the methods used (e.g., an electronic survey
of 1,000 homeowners), conclusions, and recommendations.
BODY The body is the bulk of the report. It contains an introduction to the report, an explanation of
your method, a discussion of your results, a statement of limitations, and a list of conclusions
and recommendations. Generally, only a few people will read a traditional marketing research
report in its entirety. Most will read the executive summary, conclusions, and recommenda-
tions. Therefore, formal reports are repetitious. For example, you may specify the research
objectives in the executive summary and refer to them again in the fi ndings section as well
as in the conclusions section. Researchers often choose to use the same terminology to intro-
duce the tables and/or fi gures. In many lengthy reports, repetition actually enhances reader
comprehension.
The fi rst page of the body contains the title, such as “Introduction.” Whatever title you
select should be centered on the top of the page; this page is counted as page 1 , but no page
number is printed on it. All other pages throughout the document are numbered consecutively.
Introduction The introduction to the marketing research report orients the reader to its
contents. It may contain a statement of the background situation leading to the problem, the
statement of the problem, and a summary description of how the research process was initi-
ated. It should contain a statement of the general purpose of the report and also the specifi c
objectives for the research.
Research Objectives Research objectives may be listed either as a separate section or
within the introduction. The listing of research objectives should follow the statement of the
problem, since the two concepts are closely related. The list of specifi c research objectives
often serves as a good framework for organizing the results section of the report.
Method The method describes, in as much detail as necessary, how you conducted the
research, who (or what) your subjects were, and what tools or methods were used to achieve
your objectives. In most cases, the method section does not need to be long. It should, how-
ever, provide the essential information that your reader needs to understand how the data
were collected and how the results were achieved. It should be detailed enough that the data
collection could be replicated by others for purposes of reliability. In other words, the method
section should be clear enough that other researchers could conduct a similar study. In some
cases, the needs of the research user may dictate an extensive method section. A client may,
for example, want the researcher to not only thoroughly describe the method that was used
but also discuss why other methods were not selected. For example, in situations in which
research information will be provided in litigation, where there is certain to be an adversary, a
researcher may be asked to provide an exhaustive description of the methods used in conduct-
ing the study as well as the methods that were not chosen.
Method or Methodology? The method section describes the details of the procedures
and tools used in the study. Some reports may instead use methodology as the title for this
section, but we recommend sticking with method . Why? The two terms have diff erent mean-
ings. Because so many people use them interchangeably does not mean that such usage
The method describes in detail how the research was conducted, who (or what) the subjects were, and what tools or methods were used to achieve the objectives.
Abstracts are summaries of reports.
M16_BURN3261_08_GE_C16.indd 442M16_BURN3261_08_GE_C16.indd 442 17/08/16 1:30 pm17/08/16 1:30 pm

16-4 ELEMENTS OF THE REPORT 443
is correct. Methodology refers to the science of determining appropriate methods to conduct
research. It has been defi ned as the theoretical analysis of the methods appropriate to a fi eld
of study or to the body of methods and principles particular to a branch of knowledge. 9
Therefore, it would be appropriate to say that there are objections to the methodology of a consumer survey (that is, objections dealing with the appropriateness of the methods used in
the survey) or to refer to the methodology of modern marketing research (that is, the princi-
ples and practices that underlie research in the fi eld of marketing research). 10 Consequently,
there is an important conceptual distinction between methodology and method. Method
refers to the tools of scientifi c investigation (and the tools used in a marketing research
project are described in detail in the method section of the report). Methodology refers to the
principles that determine how such tools are deployed and interpreted. Marketing research
methodology prescribes, for example, that we must use probability samples if we desire to
have a sample that is representative of some population. Researchers would describe their
use of a probability sample for a particular study in the method section of their paper. In
short, use method, not methodology .
Results The results section is the main body of your report. Some researchers prefer to use
the term fi ndings . This section should logically present the fi ndings of your research and may
be organized around the research objectives for the study. The results should be presented in
narrative form and accompanied by tables, charts, fi gures, and other appropriate visuals that
support and enhance the explanation of results. Tables and fi gures are supportive material;
they should not be overused or used as fi ller. Each should contain a number and title and
should be referred to in the narrative.
Outline your results section before you write the report. The survey questionnaire itself
can serve as a useful aid in organizing your results because the questions are often grouped in
a logical order or in purposeful sections. Another useful method for organizing your results is
to individually print all tables and fi gures and arrange them in a logical sequence. Once you
have the results outlined properly, you are ready to write the introductory sentences, defi ni-
tions (if necessary), review of the fi ndings (often referring to tables and fi gures), and transi-
tion sentences to lead into the next topic.
Limitations No research is fl awless. Do not attempt to hide or disguise problems in your
research. Always be above board and open regarding all aspects of your research. Reporting
all important limitations can actually add credibility to your research. Avoiding discussion of
limitations may render suspect your integrity and your research, and not reporting research
results accurately and honestly is against the Marketing Research Association’s Code of
Marketing Research Standards. 11 Suggest what the limitations are or may be and what impact
they have on the results.
You might also suggest opportunities for further study based on the limitations. Typical
limitations in research reports often focus on but are not limited to factors such as constraints
of time, the size and composition of the sample, and biases that may have been introduced into
the research process. Consider the following example: “The reader should note that this study
was based on a survey of graduating students at a midsized public university in the Southeast
United States. Care should be exercised in generalizing these fi ndings to other populations.”
Conclusions and Recommendations Conclusions and recommendations may be listed
together or in separate sections, depending on the amount of material you have to report. In
any case, you should note that conclusions are not the same as recommendations. Conclusions
are the outcomes and decisions you have reached based on your research results. For example,
if the data show the order of preference for fi ve car models, a conclusion would be “Model C
had the highest preference.”
Recommendations are suggestions for how to proceed based on the conclusions. For
example, “The company should produce and market Model C.” The researcher and the
Methodology refers to the science of determining appropriate methods to conduct research.
The results section is the most important portion of your report and should logically present the fi ndings of the research.
Recommendations are suggestions for how to proceed based on the conclusions.
Conclusions are the outcomes and decisions you have reached based on your research results.
Limitations of research, such as constraints of time, the size and composition of the sample, and biases that may have been introduced into the research process, should always be reported.
M16_BURN3261_08_GE_C16.indd 443M16_BURN3261_08_GE_C16.indd 443 17/08/16 1:30 pm17/08/16 1:30 pm
444 CHAPTER 16 • THE RESEARCH REPORT
client should determine prior to the study to what extent the report is to contain recom-
mendations. A clear understanding of the researcher’s role will result in a smoother pro-
cess and will help avoid confl ict. As stated in the introduction, an emerging trend in the
marketing research industry is the expectation that researchers will perform a consulting
role with their clients. That is, researchers are increasingly expected to become knowl-
edgeable about their clients’ businesses and off er recommendations that have strategic
value (see Chapter 3 ) .
END MATTER The end matter comprises the appendices , which contain additional information to which
the reader may refer for further reading but that is not essential to reporting the data; refer-
ences list; and endnotes. Any information that is critical to the reader should be included in the
report itself. Appendices contain “nice to know” information—not “need to know.” Therefore,
that information should not clutter the body of the report but should instead be inserted at the
end for the reader who desires or requires additional information. Tables, fi gures, additional
reading, technical descriptions, data collection forms, and appropriate computer printouts are
some elements that may appear in an appendix. Each appendix should be labeled with both a
letter and a title, and each should appear in the table of contents.
A reference page or endnotes (if appropriate) should precede the appendix. A reference list contains all of the sources from which information was collected for the report. The refer-
ences should be complete so that a reader could retrieve the source if needed. Endnotes are
notes at the end of a document that provide supplementary information or comments on ideas
provided in the body of the report.
16- 5 Guidelines and Principles for the Written Report In addition to understanding the purpose of the parts of the research report, you should also
consider their form, format, and style.
HEADINGS AND SUBHEADINGS In a long report, your reader needs signals and signposts that serve as a road map. Headings
and subheadings perform this function. Headings indicate the topic of each section. All infor-
mation under a specifi c heading should relate to that heading, and subheadings should divide
that information into segments. A new heading should introduce a change of topic. Choose
the kind of heading that fi ts your purpose—single word, phrase, sentence, question—and con-
sistently use that form throughout the report. If you use subheadings within the divisions, the
subheadings must be parallel to one another but not to the main headings.
You should begin by organizing your report into sections. This requires time on the front
end of the process, but it is time well spent. A well-organized report, with appropriate head-
ings and subheadings, will substantially improve readability. Then fi nd any communications
book and organize your headings using one of the standard formats. For example, a Level 1
heading is centered and all caps; a Level 2 heading is left justifi ed with upper- and lowercase.
Alternatively, use the professional format contained in a word processing program such as
Microsoft Word. Learning how to use headings and subheadings will improve your writing
skills. Be sure that all of the sections of a report follow a consistent format, particularly if dif-
ferent people have responsibility for diff erent sections.
VISUALS Visuals are tables, fi gures, charts, diagrams, graphs, and other graphic aids. Used properly,
they can dramatically and concisely present information that might otherwise be diffi cult
Visuals are tables, fi gures, charts, diagrams, graphs, and other graphic aids that concisely present information that might otherwise be diffi cult to comprehend.
A well-organized report, with appropriate headings and subheadings, will substantially improve readability.
End matter contains additional information to which the reader may refer for further reading but that is not essential to reporting the data.
M16_BURN3261_08_GE_C16.indd 444M16_BURN3261_08_GE_C16.indd 444 17/08/16 1:30 pm17/08/16 1:30 pm

16-5 GUIDELINES AND PRINCIPLES FOR THE WRITTEN REPORT 445
to comprehend. Tables systematically present numerical data or words in columns and rows.
Figures translate numbers into visual displays so that relationships and trends become com-
prehensible. Examples of fi gures are graphs, pie charts, and bar charts.
Visuals should tell a story; they should be uncluttered and self-explanatory. Even though
they are self-explanatory, the key points of all visuals should be explained in the text. Refer
to visuals by number: “ . . . as shown in Figure 1.” Each visual should be titled and numbered.
If possible, place the visual immediately below the paragraph in which its fi rst reference
appears. Or, if suffi cient space is not available, continue the text and place the visual on the
next page. Visuals can also be placed in an appendix. Additional information on preparing
visuals in SPSS is presented later in this chapter.
STYLE Proper grammar and sentence construction are essential in report writing. Sentences should
be constructed for the reader’s ease of reading and understanding, and the rules of grammar
should be observed. Readers will make assumptions about your knowledge of other subjects
based on your knowledge of grammar.
Good paragraph construction is essential to a well-written report. A good paragraph has
one main idea, and a topic sentence should state that main idea. For example: “To assess
whether residents would patronize an upscale restaurant, respondents were asked their likeli-
hood of patronizing an upscale restaurant.” Next, the body of the paragraph provides the
main idea of the topic sentence by giving more information, analysis, or examples. For exam-
ple, continuing from the topic sentence example: “A description of an upscale restaurant was
read to all respondents. The description was as follows: . . . The respondents were then asked to
indicate their likelihood of patronizing an upscale restaurant by selecting a choice on a 5-point
response rating scale ranging from ‘Very likely to patronize’ to ‘Very unlikely to patronize.’
The actual scale was as follows: . . . .”
Paragraphs should close with a sentence that signals the end of the topic and indi-
cates where the reader is headed. For example: “How respondents answered the likelihood-
to-patronize scale is discussed in the following two paragraphs.” Note this last sentence
is a transitional sentence , which tells readers where they are headed. This helps readers’
comprehension.
Controlling for the length of paragraphs should encourage good communication. As a
rule, paragraphs should be short. Business communication experts believe most paragraphs
should be under or around the 100-word range. 12 This is long enough for the topic sentence
and three or four sentences in the body of the paragraph. The paragraph should never cover
more than one main topic. Complex topics should be broken into several paragraphs.
Other guidelines for improving the style of your report include the following:
■ Use jargon sparingly. ■ Use strong verbs (for example, say “recommend” instead of “making a recommenda-
tion”). ■ Favor the active voice (the subject of the verb is doing the action). ■ Remove extra words. ■ Avoid changes in tense. ■ Keep the subject and the verb close together.
Overall, edit and proofread your report carefully. Proofread a report multiple times to be
sure it is without errors, and then ask somebody else to read the report and report problems
to you. Often professionals rewrite reports several times until they are confi dent that their
writing is clear and then ask somebody else in the company to review the report and note any
problems.
M16_BURN3261_08_GE_C16.indd 445M16_BURN3261_08_GE_C16.indd 445 17/08/16 1:30 pm17/08/16 1:30 pm

446 CHAPTER 16 • THE RESEARCH REPORT
16- 6 Using Visuals: Tables and Figures Visual representations of data and ideas assist in the eff ective presentation of fi ndings. The
key to a successful visual is a clear and concise presentation that conveys the message of the
report. The selection of the visual should match the presentation purpose for the data. Com-
mon visuals include the following: 13
Tables , which identify exact values (see Marketing Research Insight 16. 2 )
Graphs and charts , which illustrate relationships among items
Pie charts , which compare a specifi c part of the whole to the whole (see Marketing
Research Insight 16. 3 )
Bar charts (see Marketing Research Insight 16. 4 ) and line graphs , which compare
items over time or show correlations among items
Flow diagrams , which introduce a set of topics and illustrate their relationships (useful
when the sequence of events or topics is important)
Maps , which defi ne geographical locations
Photographs , which visually display and provide live examples of fi ndings
Drawings , which illustrate details of fi ndings to provide clarity
A discussion of some of these visuals follows.
TABLES Tables allow the reader to compare numerical data. Eff ective table guidelines are as
follows:
■ Do not allow computer analysis to imply a level of accuracy that is not achieved. Limit
your use of decimal places (12% or 12.2% instead of 12.223%). ■ Place items you want the reader to compare in the same column, not the same row. ■ If you have many rows, darken alternating entries or double-space after every few (five)
entries to assist the reader in accurately lining up items. ■ Total columns and rows when relevant.
In practice, researchers commonly report the sum of the two highest rating points (or the
bottom two rating scores) from a scale in a table. This is called the top-two box scores . 14 For
example, instead of showing an entire table, only the “Very likely” and “Somewhat likely”
scores are shown. Top-two box scores refer to the sum of percentages in the top two boxes
(e.g., “Agree” and “Strongly agree”) on a 5-point or 7-point scale. Clients often request top-
two box, top box, and (sometimes) bottom-two box scores. Clients sometimes fi nd these
easier to interpret than mean scores. Marketing Research Insight 16. 2 lists the necessary key-
stroke instructions to create tables using SPSS.
PIE CHARTS When you want to illustrate the relative sizes or proportions of one component versus oth-
ers, pie charts are useful. For example, if you wanted to illustrate the proportions of con-
sumers that prefer diff erent types of radio programming, a pie chart would be an excellent
tool for showing the relative sizes of each type of programming preference. The pie chart is a circle divided into sections. Each section represents a percentage of the total area
of the circle associated with one category of data. Today’s data analysis programs eas-
ily and quickly make pie charts. SPSS, for example, allows you to build customized pie
charts.
Tables allow the reader to compare numerical data.
Pie charts are useful to illustrate the relative sizes or proportions of categories of data.
M16_BURN3261_08_GE_C16.indd 446M16_BURN3261_08_GE_C16.indd 446 17/08/16 1:30 pm17/08/16 1:30 pm
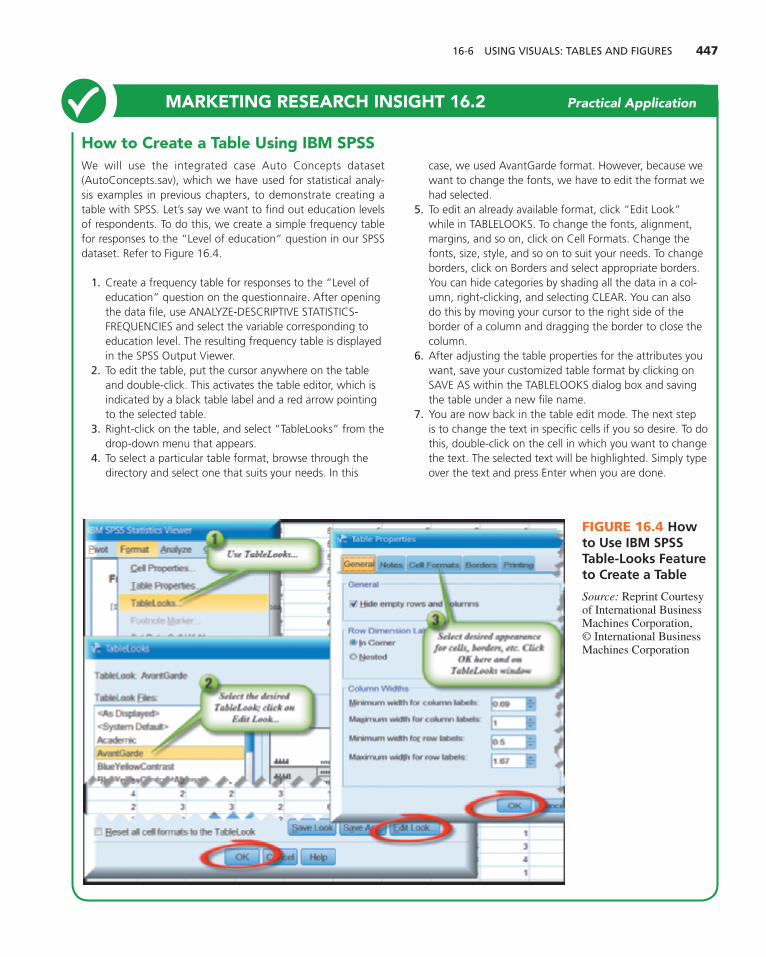
16-6 USING VISUALS: TABLES AND FIGURES 447
How to Create a Table Using IBM SPSS We will use the integrated case Auto Concepts dataset ( AutoConcepts.sav ) , which we have used for statistical analy-sis examples in previous chapters, to demonstrate creating a table with SPSS. Let’s say we want to fi nd out education levels of respondents. To do this, we create a simple frequency table for responses to the “Level of education” question in our SPSS dataset. Refer to Figure 16. 4 .
1. Create a frequency table for responses to the “Level of education” question on the questionnaire. After opening the data fi le, use ANALYZE-DESCRIPTIVE STATISTICS-FREQUENCIES and select the variable corresponding to education level. The resulting frequency table is displayed in the SPSS Output Viewer.
2. To edit the table, put the cursor anywhere on the table and double-click. This activates the table editor, which is indicated by a black table label and a red arrow pointing to the selected table.
3. Right-click on the table, and select “TableLooks” from the drop-down menu that appears.
4. To select a particular table format, browse through the directory and select one that suits your needs. In this
case, we used AvantGarde format. However, because we want to change the fonts, we have to edit the format we had selected.
5. To edit an already available format, click “Edit Look” while in TABLELOOKS. To change the fonts, alignment, margins, and so on, click on Cell Formats. Change the fonts, size, style, and so on to suit your needs. To change borders, click on Borders and select appropriate borders. You can hide categories by shading all the data in a col-umn, right-clicking, and selecting CLEAR. You can also do this by moving your cursor to the right side of the border of a column and dragging the border to close the column.
6. After adjusting the table properties for the attributes you want, save your customized table format by clicking on SAVE AS within the TABLELOOKS dialog box and saving the table under a new fi le name.
7. You are now back in the table edit mode. The next step is to change the text in specifi c cells if you so desire. To do this, double-click on the cell in which you want to change the text. The selected text will be highlighted. Simply type over the text and press Enter when you are done.
MARKETING RESEARCH INSIGHT 16. 2 Practical Application
FIGURE 16. 4 How to Use IBM SPSS Table-Looks Feature to Create a Table
Source: Reprint Courtesy of International Business Machines Corporation, © International Business Machines Corporation
M16_BURN3261_08_GE_C16.indd 447M16_BURN3261_08_GE_C16.indd 447 17/08/16 1:30 pm17/08/16 1:30 pm

448 CHAPTER 16 • THE RESEARCH REPORT
Most experts agree that the pie chart should have a limited number of segments (four to
eight, at most). If your data have many small segments, consider combining the smallest or
the least important into an “other” or “miscellaneous” category. Because internal labels are
diffi cult to read for small sections, labels for the sections should be placed outside the circle.
Marketing Research Insight 16. 3 lists the keystroke instructions for creating pie charts
using SPSS.
FIGURE 16. 5 How to Make a Pie Chart with IBM SPSS
Source: Reprint Courtesy of International Business Machines Corporation, © International Business Machines Corporation
How to Create a Pie Chart Using IBM SPSS We again use data from the Auto Concepts survey (AutoConcepts.sav) to demonstrate the creation of a simple pie graph using SPSS. Let’s say we want to show responses to the “Level of education” question in the form of a pie chart.
1. Create a pie chart for responses to the “Level of educa-tion” question on the questionnaire. As Figure 16. 5 demonstrates, use the Command sequence of the GRAPHS-LEGACY DIALOGS-PIE. Click Summaries for Groups of Cases and then Defi ne.
The next screen allows you to choose the variable you want to graph. Select the variable corresponding to the question on the questionnaire; click the button for Defi ne Slices By, and the variable will be entered. You can choose what you want your slices to represent. In this case, we selected the slices to represent % of cases.
2. Enter the titles and footnotes for the chart by clicking on TITLES and entering the appropriate labels. Using the com-mand OPTIONS, you can decide how you want missing values to be treated. Click OK and the resulting pie chart will appear in the SPSS Viewer. SPSS displays a legend with the pie chart. You are now ready to edit the chart. (If you have an existing template of a pie graph, you can request the output to be formatted according to template specifi cations by double-clicking anywhere on the chart; go to FILE-APPLY CHART TEMPLATE and select the saved fi le name.)
3. Scroll down to the pie chart. To edit the chart, double-click anywhere on the chart. This takes you to the SPSS Chart Editor screen. You will do all your editing in this screen. Refer to Figure 16. 6 .
MARKETING RESEARCH INSIGHT 16. 3 Practical Application
M16_BURN3261_08_GE_C16.indd 448M16_BURN3261_08_GE_C16.indd 448 17/08/16 1:30 pm17/08/16 1:30 pm

16-6 USING VISUALS: TABLES AND FIGURES 449
4. In the Chart Editor screen, click on the area you wish to edit. This puts a border around the area to be edited. It also changes the editing tools available to you in the Chart Editor. Click once on the title. You can now edit the font. Right-click once on the pie. Go to SHOW DATA LABELS. A Properties prompt screen will appear. To place a descriptive label on each slice as well as the value, click on the description under Not Displayed and click the green upward arrow. Click Apply and Close. This places values and corresponding descriptive labels within each slice. Click once on any slice so that only that slice is highlighted with a border. Right-click and go to EXPLODE SLICE.
5. Still in Chart Editor, right-click on the pie chart, as shown in Figure 16. 6 . Choose PROPERTIES WINDOW. Select DEPTH & ANGLE-3-D for EFFECT, move the slide bar down to –60 for ANGLE , 3 for DISTANCE. Apply and Close.
6. You can add text anywhere on the chart in SPSS. Click the TEXT icon in Chart Editor (or go OPTIONS-TEXT BOX).
7. After making all the changes, save your customized chart by using the command options FILE-SAVE CHART TEMPLATE. For future charts, you can call up the customized template, saving the need for you to edit every pie chart you create.
8. The chart is now ready to be transferred to a word pro-cessing document.
FIGURE 16. 6 Use the IBM SPSS Chart Editor to Improve Your Pie Chart’s Appearance
Source: Reprint Courtesy of International Business Machines Corporation, © International Business Machines Corporation
BAR CHARTS Bar charts are used often in reporting survey data because they are easy to interpret. They
are useful to report the magnitude of responses or to compare magnitudes among groups.
They are also useful for illustrating change over time. Several types of bar charts can be used.
Marketing Research Insight 16. 4 lists the keystroke instructions for creating bar charts of vari-
ous types using SPSS. Study the types of bar charts available to you in SPSS. Your selection
of the type of bar chart will depend on what you are trying to communicate to your readers.
LINE GRAPHS Line graphs are easy to interpret if they are designed properly. Line graphs may be drawn in
SPSS using the graphs option. You will notice there are several options in types of line graphs.
Bar charts are useful to report the magnitude of responses, to compare magnitudes among groups, and to illustrate change over time.
M16_BURN3261_08_GE_C16.indd 449M16_BURN3261_08_GE_C16.indd 449 17/08/16 1:30 pm17/08/16 1:30 pm

450 CHAPTER 16 • THE RESEARCH REPORT
How to Create a Bar Chart Using IBM SPSS We use data from the Auto Conceptss dataset (AutoConcepts.sav) to demonstrate the creation of a simple bar graph using SPSS. Let’s say we want to show graphically the frequency dis-tribution of the level of education.
1. Create a bar chart for responses for “Level of Education.” As you can see in Figure 16. 7 , after opening the data fi le, use the command GRAPHS-LEGACY DIALOGS-BAR. You have the option of choosing from three different styles of bar charts. In this case, we used the Simple chart. Click Summaries for Groups of Cases and then Defi ne.
The next screen allows you to choose the variable you want to graph. Enter “Level of Education” in Category Axis. You can choose what you want your bars to rep-resent. In this case, we selected the bars to represent % of cases because we want to know the percentages of respondents’ level of education.
2. At this stage, you can also enter the titles and footnotes for the chart by clicking on TITLES. Click OK and the bar chart will appear in the SPSS Viewer. You are now ready to edit the chart. (If you have an existing template of a bar graph while in the Defi ne Simple Bar Summaries for
Groups of Cases box, you can request the output to be formatted according to template specifi cations by clicking on Use Chart Specifi cations From and selecting the saved fi le name.)
3. To edit the chart, double-click anywhere on the chart. This opens the SPSS Chart Editor screen. You will do all your editing in this screen. Figure 16. 8 shows the opera-tion of the SPSS Chart Editor screen with our bar chart.
4. In the Chart Editor screen, right-click and select Properties Window. This window allows size, fi ll and border, 3-D elements, and Variables selections.
5. Click once on one of the bars. All the bars should now be highlighted with a border around them. Notice the tools available to you on the menu bar. Go to the PROPERTIES icon (or go to EDIT-PROPERTIES). Select DEPTH & ANGLE, choose SHADOW for EFFECT , and set OFFSET to +15 by moving the slide bar. APPLY. Again, click on a bar and then the PROPERTIES icon. Select FILL & BORDER and select a pattern and fi ll color for your bars. APPLY. Note: Click the fi ll button to change the color of the bars. The border button allows you to change the color of the bor-der line of the bars.
MARKETING RESEARCH INSIGHT 16. 4 Practical Application
FIGURE 16. 7 How to Make a Bar Chart with IBM SPSS Source: Reprint Courtesy of International Business Machines Corporation, © International Business Machines Corporation
M16_BURN3261_08_GE_C16.indd 450M16_BURN3261_08_GE_C16.indd 450 17/08/16 1:30 pm17/08/16 1:30 pm

16-7 PRODUCING AN APPROPRIATE VISUAL 451
6. Still in Chart Editor, click anywhere other than a bar. Select PROPERTIES WINDOW-FILL & BORDER. Change the color of the background. Click APPLY
7. To edit the textual content of the chart, select the TEXT icon in the Chart Editor (or go to OPTIONS-TEXT BOX). A box and a set of markers will appear. Insert your text and then drag the box where you want the text to appear.
8. After making all the changes, you can save your custom-ized chart by using the command FILE-SAVE CHART TEMPLATE. For future charts, you can call up the custom-ized template, saving the need for you to edit every bar chart you create.
9. The chart is now ready to be transferred to a word pro-cessing document.
FIGURE 16. 8 Use the SPSS Chart Editor to Improve Your Bar Chart’s Appearance
Source: Reprint Courtesy of International Business Machines Corporation, © International Business Machines Corporation
FLOW DIAGRAMS Flow diagrams introduce a set of topics and illustrate their relationships. Flow diagrams are
particularly useful to illustrate topics that are sequential (for example, step 1, step 2, and so on).
16- 7 Producing an Appropriate Visual A marketing researcher should always provide visuals that accurately demonstrate the data
and avoid misrepresenting the information. Sometimes misrepresenting information is inten-
tional (as when a client asks a researcher to misrepresent the data to promote his or her “pet
project”) or it may be unintentional. In the latter case, those preparing a visual are sometimes
so familiar with the material being presented that they falsely assume the graphic message is
apparent to all who view it.
To ensure that you have accurately and objectively prepared your visuals, you should do
the following:
■ Double- and triple-check all labels, numbers, and visual shapes. A faulty or misleading
visual discredits your report and work. ■ Make sure all parts of the scales are presented. Truncated graphs (having breaks in the
scaled values on either axis) are acceptable only if the audience is familiar with the data.
M16_BURN3261_08_GE_C16.indd 451M16_BURN3261_08_GE_C16.indd 451 17/08/16 1:30 pm17/08/16 1:30 pm

452 CHAPTER 16 • THE RESEARCH REPORT
16- 8 Presenting Your Research Orally Marketing researchers are often asked to present an oral summary of the conclusions and rec-
ommendations of their research. The purpose of the oral presentation is to succinctly present
the information and to provide an opportunity for questions and discussion. The presentation
may be accomplished through a simple conference with the client, or it may be a formal pre-
sentation to a roomful of people.
To be adequately prepared when you present your research orally, follow these steps:
1. Identify and analyze your audience. Consider the same questions you addressed at
the beginning of the research process and at the beginning of this chapter.
2. Find out the expectations your audience has for your presentation. Is the
presentation formal or informal? Does your audience expect a graphical
presentation?
3. Determine the key points your audience needs to hear.
4. Outline the key points, preferably on 3-by-5 cards or in presentation software
“notes” areas to which you can easily refer.
5. Be sure you have a cohesive structure to your report, including an informative
introduction that explains why what you are about to say is important.
6. Present your points succinctly and clearly. The written report will serve as a
reference for further reading.
7. Plan the time you have to present your fi ndings carefully by prioritizing the points
and allocating time among the points.
8. Make sure your visuals graphically portray your key points.
9. Plan a coherent ending that summarizes your fi ndings and leaves a fi nal strong
impression.
10. Practice your presentation. Be comfortable with what you are going to say and
how you look. The more prepared you are and the better you feel about yourself,
the less you will need to worry about jitters.
11. Check out the room and media equipment prior to the presentation.
12. Arrive early.
13. Be positive and confi dent. You are the authority; you know more about your
subject than anyone else.
14. Speak loudly enough for all in the room to hear. Enunciate clearly. Maintain eye
contact and good posture.
15. Look engaged while other members of your team are presenting.
16. Dress appropriately.
16- 9 Alternative Ways to Present Findings It is important for you to know the standard practices of reporting data as presented in this
chapter. However, you should also know that there are a number of alternative innovative
and eff ective ways to present fi ndings. Using an example of its research on Latino consum-
ers, the marketing research fi rm Gongos demonstrates how researchers present fi ndings in
ways that bring data to life for their clients in Marketing Research Insight 16. 5 . In another
example, MTV used an entire fl oor of offi ces to create an exhibit called “High School Hall-
ways.” Parts of the exhibit included a high school bedroom, a party room, and a social
media detox tent (see Chapter 6 ) . While Gongos and MTV take communicating results to a
whole new level, there are a number of tools that all researchers can use to present results in
interesting and potent ways, such as videos and infographics. Keep in mind, however, that
no matter what techniques you use, it is up to you—not your tools—to bring meaning to the
data that you present. 15
The purpose of the oral presentation is to succinctly present the recommendations and conclusions of research and to provide an opportunity for questions and discussion.
To see how one marketing research fi rm incorporates
storytelling when presenting results, go to www.youtube.com and type in “Unforgettable Story Writing in 6 Easy Steps.”
M16_BURN3261_08_GE_C16.indd 452M16_BURN3261_08_GE_C16.indd 452 17/08/16 1:30 pm17/08/16 1:30 pm

16-9 ALTERNATIVE WAYS TO PRESENT FINDINGS 453
Reporting in the World of Market Research: The New Dimensionality of Learning There was a time when an 80+-page research report was com-monplace. Nearly every question market researchers asked of their consumer subjects landed either in a chart, an executive summary, or both. Those deliverables, often found in Power-Point, were eventually dispersed on a shared drive and archived into growing terabytes of proprietary knowledge.
But today a new imperative—one that serves to empower frontline and C-suite executives—exists inside insight orga-nizations within Fortune 500 and Global 1000 companies: Storytelling. Synthesis. Insight Curation. Video Documentaries. And the ever-important IWIK-SIC (“I wish I knew, so I could”). These are the new buzzwords in “reporting.” And the students of today and researchers of tomorrow will not only become intimately acquainted with these tools but work swiftly and strategically as well to create new generations of information-gathering techniques and knowledge-centric platforms.
The Industry’s Stance Peer-to-peer industry presentations and feature articles exclaim-ing “Is PowerPoint dead?” have fi lled the blogosphere since 2012. Soon after, the onslaught of “big data” and other impending sources of consumer knowledge changed the way we take in information. Beyond dashboards and other digi-tal visualization platforms, insight professionals had to fi nd a way to cut through the fray of information to truly garner the attention of time-constrained decision makers. With real-time information feeds and the mandate to gut check those against
primary research fi ndings, conventional reporting was neither the quickest nor the most impactful way to distribute infor-mation that would ultimately empower decision makers to do their job well.
Besides presenting compelling and immersive insights packaged inside a headline or two, this information needs to reach a broader corporate audience while being accessible, consumable, and memorable. In theory, research fi ndings of today must fi nd ways to reach readers at a visceral level. They need to inform and inspire people at all levels of an organiza-tion to make faster and better decisions on behalf of their peers and their organization.
Insights in Action: One Client’s Story So, what does this actually look like inside an organization?
As an industry, health care had experienced a marketplace shift brought on, in part, by the Affordable Care Act (ACA) of 2010. As a result, this shift prompted the need for a promi-nent health insurer in the Midwest to recalibrate its customer-minded strategies to create more reciprocal relationships with Latinos living in Michigan. In its vast customer base, Latinos are a critical, growing, underinsured population deserving to be understood both from a cultural and community-driven perspective.
This client entrusted Gongos’ insight curation practice, Arti|fact, to create an immersive experience at its corporate headquarters to enable key executives and decision makers to
MARKETING RESEARCH INSIGHT 16. 5 Practical Application
Visit Gongos at http://www.gongos.com .
M16_BURN3261_08_GE_C16.indd 453M16_BURN3261_08_GE_C16.indd 453 17/08/16 1:30 pm17/08/16 1:30 pm

454 CHAPTER 16 • THE RESEARCH REPORT
VIDEOS Many marketing research fi rms and advertising agencies supplement their written and oral
research reports with videos showing “in-the-moment” clips (sometimes called “vox pops”
or “voice of the people”). Videos can be embedded in electronic reports or incorporated into
oral presentations. A written and oral report can be replaced by a documentary-style video. 16
Video footage that is gathered through observation or ethnographic methods can be used to
illustrate key takeaways from research studies. For example, when Pittsburgh advertising
agency MARC USA presented research for repositioning a cable television network, the
agency illustrated its fi ndings by incorporating video clips of opinions from the target audi-
ence. 17 When BP conducted a segmentation study, the research report was supplemented
with an eight-minute video that featured footage of a person from each segment. 18 Seeing
real people speaking with emotion can be a very powerful tool in support of recommended
directions.
“walk in the shoes” of Latino families. Instead of presenting the research insights and subsequent marketing and business implications within the staid walls of a boardroom, researchers leveraged the senses of sight, sound, and touch to empower
company stakeholders to truly understand—and empathize with—this growing population. In place of an 80+-page report, the research fi ndings came to life inside of an 800+-square-foot space.
Gongos replaced a research report with an immersive experience to make research fi ndings come to life.
Source: Text and photos courtesy Gongos Research
M16_BURN3261_08_GE_C16.indd 454M16_BURN3261_08_GE_C16.indd 454 17/08/16 1:30 pm17/08/16 1:30 pm

16-10 DISSEMINATING RESULTS THROUGHOUT AN ORGANIZATION 455
INFOGRAPHICS Infographics are visual reports designed to make key research results understood quickly
and easily. Infographics are part of a trend to keep results simple and actionable. Like written
reports, infographics display fi ndings through graphs, tables, fi gures, and other visuals with
written explanations reduced to their essential meanings. Infographics can take a physical
form, as in a brochure or a newsletter-style document, or be solely electronic.
Well-designed infographics can summarize or even replace lengthy written reports—
and can take just as long to create. Creating a short and eff ective document that avoids
“chartjunk” takes skill and time. 19 A demand exists in the marketing fi eld for employees
who are not only knowledgeable about marketing research techniques but who also have the
graphic skills to create attractive and informative visual representations of information. 20
Excellent examples of infographics can be found online at websites such as http://www.
teradata.com , http://www.dailyinfographic.com , http://www.coolinfographics.com , and
http://www.mashable.com .
16- 10 Disseminating Results Throughout an Organization Whatever method is used to present research fi ndings, results uncovered from a market-
ing research study will ultimately have little or no eff ect on how a company conducts its
business if the insights gained from the project are not disseminated across a fi rm to all
the essential operating units and become part of the “lifeblood” of the organization. 21
Tom De Ruyck, managing partner of InSites Consulting, advocates for “the memefi cation
of insights” in which insights about consumer behavior and emotions are spread through
“key ambassadors” in a company. In one example, InSites used multiple methods to
increase the knowledge that 1,000 Unilever employees working in research and develop-
ment had of consumers, including administering mini-quizzes on consumers’ habits and
attitudes over a period of several weeks. 22 In another example, Northstar Research cre-
ated and distributed coasters with customer-inspired avatars throughout the Land Rover
automobile manufacturer to develop awareness of consumer characteristics in all depart-
ments of the organization. 23 Research updates can be disseminated on an ongoing basis to
managers through regular newsletters or through social media tools such Twitter. What-
ever the method, it is important that research fi ndings are communicated throughout a
company.
DASHBOARDS Web-based platforms, often called “dashboards,” are an increasingly popular means of dis-
seminating research throughout an organization. As featured in the introduction, Tableau and
other brands of dashboards allow users to visualize and interact with their data. Dashboards
provide digital interfaces that allow users to quickly and easily see information that is pre-
sented in a simplifi ed manner. Dashboards are part of the “democratization” of marketing
research that was referred to in the introduction. They allow companies to gather and integrate
data from several diff erent sources and then exhibit the data automatically with tables, graphs,
and other numerical displays. Dashboards can be used for tracking a number of marketing
activities, such as performance of web pages, responses to advertising campaigns, and geo-
graphical buying behavior.
Firms such as Tableau and Burke, Inc., provide clients with access to dashboards that
allow clients to monitor data on an ongoing basis. Readers can examine total results or con-
duct their own subgroup analysis, even down to examining the results of individual respon-
dents. Because the reports are available online, diff erent client users can access the reports
Infographics are visual reports designed to make key research results understood quickly and easily.
Dashboards provide digital interfaces that allow users to quickly and easily see information that is presented in a simplifi ed manner.
M16_BURN3261_08_GE_C16.indd 455M16_BURN3261_08_GE_C16.indd 455 17/08/16 1:30 pm17/08/16 1:30 pm

456 CHAPTER 16 • THE RESEARCH REPORT
and conduct analyses that are important to their unit or division. Online reporting software
electronically distributes marketing research reports to selected managers in an interactive
format that allows users to conduct their own analyses. To give you a “close encounter” with
Burke’s dashboard concept, we provide an Active Learning exercise.
Active Learning
Take a Tour of an Online Marketing Research Report Service
To take a closer look at Burke’s online reporting writing software, Digital Dashboard, go to http://www.digitaldashboard.com . Click on “About Digital Dashboard®.” Read about the features and take a look at the example output pages. (Don’t run the demonstration yet!) Note the features of “In the Customer’s Words,” “Individual Reports,” and “Data Collection Status Report.” When you have read all the features, it is time to take the tour, noted at the bottom of the screen. (The program will run automatically—just give it a few seconds.) Watch for features such as the data filter, executive summary, trends over time, and comparison of the results of significant subgroups; the ability to filter to examine any subgroup results desired; the option to search for verbatim comments; the ability to conduct statistical testing using the report software; and the utility to create your own charts and titles and transfer data to spreadsheets. Can you see how such tools can make the reporting process more efficient and the report more usable for clients?
The use of dashboards is an important development in the reporting of marketing research data for two important reasons. First, dashboards put research results into the hands of nontechnical users, allowing managers to explore data on their own. Second, research analysts may use dashboards to replace slide presentations of data, such as PowerPoint slides. The dashboard can be projected, allowing a researcher to use just one dynamic computerized interface to display data. An advantage of this method is that it eliminates the time needed to develop static slides, along with the mistakes that can result when data are copied. In addition, the data used in a presentation will always be the lat-est data, with no need to update slides. When questions arise during a presentation (for example, “How did lower-income consumers respond to this question?” or “Which retail-ers showed the best response to these promotions?”), the researcher is able to answer the queries on the spot.
Summary
Just as technology has changed the way we do many
things, it has also aff ected report writing and presentations.
The marketing research report is a factual message that
transmits research results, vital recommendations, conclu-
sions, and other important information to the client, who
in turn bases his or her decision making on the contents of
the report. The client’s decisions may depend on how well
the report communicates the research results. Regardless
of the care in the design and execution of the research proj-
ect itself, if the report does not adequately communicate
the project to the client, all of the hard work in conducting
the project is meaningless.
While preparing and writing the report may be time
consuming, advances are being made to make report writing
more effi cient. Tools are available that automatically provide
citations for sources of information used in a report. Statisti-
cal packages, such as SPSS, have features that allow for ease
of preparation of tables and visuals such as bar charts and
pie charts. Technology will continue to improve report writ-
ing, presentation preparation, and distribution of reports.
M16_BURN3261_08_GE_C16.indd 456M16_BURN3261_08_GE_C16.indd 456 17/08/16 1:30 pm17/08/16 1:30 pm

REVIEW QUESTIONS/APPLICATIONS 457
Marketing research reports should be tailored to their
audiences. They are typically organized into the elements
of front matter, body, and end matter. Each element has
subparts that serve a specifi c purpose.
Plagiarism refers to representing the work of others as
your own. It is a serious off ense in the real world to plagia-
rize; people lose their jobs due to this ethical lapse. Proper
referencing of source materials not only allows writers
to avoid charges of plagiarism but off ers other advantages
as well.
Conclusions are based on the results of the research,
and recommendations are suggestions on how to pro-
ceed based on conclusions. Increasingly, researchers are
expected to add strategic value to their reports.
Guidelines for writing the marketing research report
include proper use of headings and subheadings, which
serve as signposts to the reader, and proper use of visu-
als, such as tables and fi gures. Style considerations include
beginning paragraphs with topic sentences, using transi-
tional sentences, and keeping paragraphs short. Style also
includes spare use of jargon, strong verbs, active voice,
consistent tense, and proofreading.
Care should be taken to ensure that all presentations
are clear and objective to the reader. Many visual aids may
be distorted so that they have a diff erent meaning to the
reader. Researchers must adhere to ethical guidelines when
preparing research reports. Reports rely on tables, fi gures,
and graphical displays of various types. SPSS includes
routines for creating report tables and graphs. We describe
step-by-step commands on how to use SPSS to make
professional-appearing tables and graphs.
In some cases, marketing researchers are required to
present the fi ndings of their research project to the client
orally. Guidelines for making an oral presentation include
knowing the audience and their expectations and the key
points you wish to make; correctly preparing visuals; prac-
ticing; checking out presentation facilities and equipment
prior to the presentation; and being positive.
In addition to traditional written and oral reports, there
are a number of alternative and innovative ways to present
research results. Some research fi rms emphasize storytelling
techniques to bring data to life. An example by Gongos
Research shows how the company created a room-sized
physical space to provide clients with an immersive and
interactive understanding of the research fi ndings. Many
marketing research suppliers and advertising fi rms use vid-
eos to show “in-the-moment” clips. Infographics are used
to make key research results understood quickly and easily.
Online reporting software is an efficient tool that
assists marketing researchers in monitoring data collection
and disseminating research results. It also allows data users
to interact with the reports and to manage data. Tableau is
a good example of an online reporting system that allows
clients to interact with the report.
Key Terms
Data visualization (p. 434 )
Marketing research report (p. 435 )
Plagiarism (p. 436 )
Front matter (p. 437 )
Title page (p. 438 )
Letter of authorization (p. 438 )
Letter of transmittal (p. 439 )
Memo of transmittal (p. 439 )
Table of contents (p. 440 )
List of illustrations (p. 441 )
Tables (p. 441 )
Figures (p. 441 )
Abstract/executive summary (p. 442 )
Body (p. 442 )
Introduction (p. 442 )
Research objectives (p. 442 )
Method (p. 442 )
Methodology (p. 443 )
Results (p. 443 )
Limitations (p. 443 )
Conclusions (p. 443 )
Recommendations (p. 443 )
End matter (p. 444 )
Appendices (p. 444 )
Reference list (p. 444 )
Endnotes (p. 444 )
Headings (p. 444 )
Subheadings (p. 444 )
Visuals (p. 444 )
Topic sentence (p. 445 )
Body of the paragraph (p. 445 )
Transitional sentence (p. 445 )
Tables (p. 446 )
Top-two box scores (p. 446 )
Pie charts (p. 446 )
Bar charts (p. 449 )
Line graphs (p. 449 )
Flow diagrams (p. 451 )
Oral presentation (p. 452 )
Infographics (p. 455 )
Dashboards (p. 455 )
Review Questions/Applications
16- 1. Discuss the relative importance of the marketing
research report to the other stages in the marketing
research process.
16- 2. What is the derivation of the word plagiarism ?
16- 3. What are the components of the marketing research
report?
M16_BURN3261_08_GE_C16.indd 457M16_BURN3261_08_GE_C16.indd 457 17/08/16 1:30 pm17/08/16 1:30 pm

458 CHAPTER 16 • THE RESEARCH REPORT
16- 4. When should you write a memo? When should you
write a letter?
16- 5. Should you use method or methodology to describe
how the research was conducted? Why?
16- 6. Distinguish among results, conclusions, and
recommendations.
16- 7. When should you acknowledge you have limita-
tions in your report?
16- 8. When should you use a subheading?
16- 9. What are the components of a readable, logical
paragraph?
16- 10 . What are some elements of good style in report
writing?
16- 11. What are the key features of a table?
16- 12. What visual would be the best at displaying the rel-
ative changes in spending between four promotion
mix variables over time?
16- 13. What tool can be used to present lengthy fi ndings in
a shorter form?
16- 14. What is the purpose of an oral presentation?
16- 15. Go online and search for examples of marketing
research reports. Chances are good that you will
be able to fi nd several reports of various kinds.
Examine the reports. What commonalities do they
have in terms of the sections the authors have cre-
ated? Look at the sections carefully. What types of
issues were addressed in the introduction section
and the method section? How did the authors orga-
nize all of the information reported in the results
section? How are recommendations diff erent than
conclusions?
16- 16. Describe what may be in the future for reporting
data, based on the example provided by Gongos
Research.
16- 17. How can videos be utilized in marketing research
reports?
16- 18. What are dashboards? How can they be used by
marketing researchers and clients?
Cory Rogers is ready to write the fi rst draft of the fi nal
report for Auto Concepts. Nick Thomas of Auto Concepts
has told Cory that ZEN Motors has its own marketing
research department and that researchers there are eager
to read his report. Cory knows they will be particularly
interested in technical issues such as determination of
sample size and margin of error. Cory has also had a frank
discussion with Nick about conclusions and recommen-
dations. Nick told him, “Cory, I want to know what the
numbers say. What are the conclusions based on those
numbers? In terms of how to proceed, I will meet with
my top staff members, and we will make those deci-
sions. We have to factor in many constraints to make fi nal
decisions.”
As an experienced marketing researcher, Cory is very
familiar with the steps in the marketing research process.
Knowledge of these steps is useful in writing the method
section of his marketing research reports. For example,
Cory knows he should address the types and sources of
information used in the report; he should also address
the research design and why it was chosen over other de-
signs. The sampling plan and sample size should also be
included in this section. Cory makes a list of topics he
should cover and starts organizing these topics in terms
of headings and subheadings that will be used in the fi nal
report.
Cory reminds himself, “I have to properly cite every
source I have used in this report.” He dreads this step. As
many times as he has written reports, remembering every
detail that goes in a reference is just something that will
not stay in Cory’s memory bank. Still, he understands
how important it is to use the proper form for his refer-
ence list.
1. What should Cory consider doing with the informa-
tion in this case before he actually begins to write
the report? Name some specifi c issues Cory should
address.
2. Should Cory include the standard “Conclusions and
Recommendations” section of the report? Why or
why not?
3. What tools can Cory use to be sure he is properly citing
the secondary sources used in the marketing research
report?
CASE 16. 1 INTEGRATED CASE
Auto Concepts: Report Writing
M16_BURN3261_08_GE_C16.indd 458M16_BURN3261_08_GE_C16.indd 458 30/08/16 11:31 am30/08/16 11:31 am

REVIEW QUESTIONS/APPLICATIONS 459
Cory Rogers of CMG Research completes the report for
Auto Concepts and decides to make some PowerPoint
slides to use in his presentation of the fi ndings. Working
in Microsoft Word, he writes a title to his presentation:
“Auto Concepts: A Marketing Research Study to Deter-
mine Car Model Preferences and Profi le Market Seg-
ments.” Then he writes several other comments he wants
to include in the beginning of his presentation, such as
the research objectives and several issues dealing with
the method used, including the sample plan and sample
size. After Cory writes a number of the statements that
he thinks might help him communicate the purpose and
method of the study, he turns his attention to presenting
the fi ndings.
Cory decides to begin his presentation of the study
with a description of the sample, often referred to as a “pro-
fi le of the sample.” He notices that for gender and mari-
tal status, there are only two categories (male, female and
married, unmarried) for each question. He decides to orally
report the percentages of these categories. However, for
some of the other variables, there are several categories of
response, and he decides the best way to communicate the
results is by showing the frequency distribution table. He
prepares a frequency distribution of the responses to these
questions using SPSS and then continues to make several
key analyses of the data using SPSS.
1. Using a word processing program, write several of the
statements you think would be appropriate to present to
the client in an oral presentation.
2. Import the statements you prepared in question 1 into
PowerPoint using copy and paste. Experiment with dif-
ferent color text and font sizes and styles.
3. For each statement, using SPSS, run the appropriate
frequency distribution. Using TABLELOOKS, select
the format you like. Copy and paste your tables into
PowerPoint.
4. Using SPSS, make a bar chart of the answers to the
question regarding the variable “I am worried about
global warming.” Experiment with the diff erent options
of bar charts available to you in SPSS. Select a bar
chart and copy and paste that chart into PowerPoint
using copy and paste. Experiment with making edits on
your slide.
CASE 16. 2 INTEGRATED CASE
Auto Concepts: Making a PowerPoint Presentation
M16_BURN3261_08_GE_C16.indd 459M16_BURN3261_08_GE_C16.indd 459 17/08/16 1:30 pm17/08/16 1:30 pm

A01_MISH4182_11_GE_FM.indd 6 10/06/15 11:46 am
This page intentionally left blank

ENDNOTES 461
Chapter 1 1. Wasserstrom, J. (2011, February 24). Media and revolution 2.0: From
Tiananmen to Tahrir. Retrieved from Miller-McCune, http://www.
miller-mccune.com/media/media-and-revolution-2-0-tiananmen-
to-tahrir-28595
2. Kotler, P., & Keller, K. L. (2006). Marketing management (12th
ed.). Upper Saddle River, NJ: Prentice Hall, p. 5.
3. Kindle Fire is the most successful product we’ve ever launched.
(2011, December 11). Time Techland . Retrieved from http://
techland.time.com/2011/12/15/amazon-kindle-fire-is-the-most-
successful-product-weve-ever-launched
4. American Marketing Association. (2007, October). Definition
of marketing. Retrieved from https://www.ama.org/AboutAMA/
Pages/Definition-of-Marketing.aspx
5. Shostack, G. L. (1977). Breaking free from product marketing.
Journal of Marketing, 41 (2), 74. Shostack’s original example used
General Motors.
6. Schneider, J., & Hall, J. (2011, April). Why most product launches
fail. Harvard Business Review, 21–23.
7. 25 biggest product flops of all time. (2012, January 21). Daily Finance . Retrieved from http://www.dailyfinance.com/photos/
top-25-biggest-product-flops-of-all-time
8. Jargon, J. (2014, April 13). Burger King drops lower-calorie fry ‘sat-
isfries.’” Wall Street Journal . Retrieved from http://www.wsj.com/
articles/burger-king-drops-lower-calorie-fries-1407964129
9. These philosophies epitomize the product concept and the selling
concept. See Kotler, P., & Armstrong, G. (2001). Principles of mar-keting (9th ed.). Upper Saddle River, NJ: Prentice Hall, p. 18.
10. Kotler, P. (2003). Marketing management (11th ed.). Upper Saddle
River, NJ: Prentice Hall, p. 19.
11. Kotler, P. (2003). Marketing management (11th ed.). Upper Saddle
River, NJ: Prentice Hall, p. 19.
12. Some scholars have added the concept of holistic marketing, which
includes four components: relationship marketing, integrated mar-
keting, internal marketing, and social responsibility marketing. For
additional reading on this topic, see Kotler & Keller, Marketing management , pp. 15–23.
13. Bennett, P. D. (Ed.) (1995). Dictionary of marketing terms (2nd ed.).
Chicago: American Marketing Association, p. 169.
14. See the Marketing Research Association website for a glos-
sary of these and other terms used in the marketing and opinion
research industry. (2012, June 29). Retrieved from http://www.
marketingresearch.org/glossary
15. Pimley, S. (2008, August). Looking to increase their (s)miles per
gallon. Quirk’s Marketing Research Review, p. 32.
16. Berstell, G. (2011, December) Listen and learn—and sell. Quirk’s Marketing Research Review, 48.
17. Monllos, K. (2015, September 28). Chobani extends its “Flip” Cam-
paign after sales increase by 300%. Adweek . Retrieved from http://
www.adweek.com/news/advertising-branding/chobani-extends-
its-flip-campaign-after-sales-increase-300-167186
18. Dahab, D., O’Gara, L., & Vermass, J. (2007, October). As banks
strive to build relationships, a national tracking study finds that
good service is still key for customers. Quirk’s Marketing Research Review, 52.
19. Janakiraman, N., Meyer, R., & Hoch, S. (2011). The psychology
of decisions to abandon waits for service. Journal of Marketing Research, 48 (6), 970. Retrieved from ABI/INFORM Global (Docu-
ment ID: 2548456281)
20. Personal communication with the authors from Vincent P. Barabba,
General Motors Corp, 1997.
21. Market research: Pre-testing helps ad effectiveness. (2003, May 8).
Marketing , 27.
22. Tracy, K. (1998). Jerry Seinfeld: The entire domain. Secaucus, NJ:
Carol, pp. 64–65.
23. Hodock, C. L. (2007). Why smart companies do dumb things. Am-
herst, NY: Prometheus, p. 157.
24. The description of MIS is adapted from Kotler & Keller, Marketing management .
25. Ibid.
Chapter 2 1. U.S. News & World Report. (2015). Best business jobs. Retrieved
from http://money.usnews.com/careers/best-jobs/market-research-
analyst
2. Lockley, L. C. (1950). Notes on the history of marketing research.
Journal of Marketing, 14 (5), 733–736.
3. Gallup, G., & Rae, S. F. (1940). The pulse of democracy . New York:
Simon & Schuster, p. 35.
4. Hower, R. M. (1939). The history of an advertising agency . Cam-
bridge, MA: Harvard University Press, pp. 88–90.
5. You can see a list of past Parlin Award winners going back to 1945 at
http://themarketingfoundation.org/parlin_recipients.html
6. Hardy, H. (1990). The politz papers: Science and truth in marketing research. Chicago: American Marketing Association.
7. Bartels, R. (1976). The history of marketing thought. Cleveland,
OH: Grid Publishing, p. 125.
8. Much of this section is based on Honomichl, J. (2006). Jack J.
Honomichl on the marketing research industry. In Burns, A. C.,
& Bush, R. F. (2006). Marketing research (5th ed.). Upper Saddle
River, NJ: Pearson/Prentice Hall, pp. 40–41.
9. GreenBook. (2015) . GreenBook Industry Trends Report , 17th ed.,
New York, p. 40.
10. Murphy, L. (2015, July 21). Microsoft aims to disrupt mar-
ket research: Here is the scoop and what it means for the future.
GreenBook . Retrieved from www.greenbookblog.org/2015/07/21/
microsoft-aims-to-disrupt-market-research-here-is-the-scoop-and-
what-it-means-for-the-future
11. ESOMAR Industry Report. (2014). Global market research 2014 .
Amsterdam, The Netherlands: ESOMAR, p. 6.
12. Bowers, D., & Brereton, M. (2015). The 2015 AMA gold global top
50 report. Marketing News, 13.
13. Ibid.
14. Ibid.
15. ESOMAR (2015). Global market research 2015 , p. 6.
16. Poynter, R. (2010). The handbook of online and social media re-search: Tools and techniques for market researchers. West Sussex, UK: Wiley, pp. xiv–xix.
17. ESOMAR (2015). Global market research 2015 , p. 59.
18. ESOMAR (2015). Global market research 2015 , p. 64.
461
Endnotes
Z01_BURN3261_08_GE_NOTE.indd 461Z01_BURN3261_08_GE_NOTE.indd 461 17/08/16 2:13 pm17/08/16 2:13 pm

462 ENDNOTES
19. ESOMAR (2011). Global market research 2011 , pp. 22–29.
20. ESOMAR (2015). Global market research 2015 , p. 64.
21. Rydholm, J. (2015). Client-side researchers offer dos and don’ts for
MR vendors. Quirk’s Marketing Research Media . Retrieved from
http://www.quirks.com/articles/2015/20151025-1.aspx
22. Quirk’s Marketing Research Media (2015). Quirk’s Corporate Research Report . http://www.quirks.com/PDF/CorporateResearch
Report.pdf
23. GreenBook . (2015 ). GreenBook Industry Trends Report , 17th ed.,
New York, p. 46.
24. Rydholm, J. (2015). Client-side researchers offer dos and don’ts for
MR vendors. Quirk’s Marketing Research Media . Retrieved from
http://www.quirks.com/articles/2015/20151025-1.aspx
25. GreenBook . (2015 ). GreenBook Industry Trends Report , 17th ed.,
New York, pp. 43–45.
26. GreenBook . (2015 ). GreenBook Industry Trends Report , 17th ed.,
New York, p. 46.
27. ESOMAR. (2015). Global market research 2015 , p. 59.
28. ESOMAR. (2015). Global market research 2015 , p. 61.
29. See http://www.marketingresearch.org/issues-policies/best-practice
30. What is a push poll? AAPOR defines it as a form of negative cam-
paigning disguised as a political poll. “Push polls” are actually po-
litical telemarketing—phone calls disguised as research that aim
to persuade large numbers of voters and affect election outcomes
rather than measure opinions. Retrieved from http://www.aapor.org/
What_is_a_Push_Poll_1.htm , accessed March 10, 2012.
31. Council of American Survey Research Organizations. (2015,
July 1). What survey participants need to know. Retrieved from
http://www.casro.org/?page=participantstoknow&hhSearchTerms=
%22Survey+and+Participants+and+Need+and+Know%22
32. American Association for Public Opinion Research. (2015, July 1).
Transparency Initiative. Retrieved from https://www.aapor.org/
AAPORKentico/Transparency-Initiative.aspx
33. ESOMAR. (2015). Global market research 2015 , pp. 60–65.
34. Riviera, E. (2015). Market research in the U.S . Retrieved from
http://www.ibisworld.com/industry/default.aspx?indid=1442
Chapter 3 1. Others have broken the marketing research process down into dif-
ferent numbers of steps. Regardless, there is widespread agreement
that using a step process approach is a useful tool for learning mar-
keting research.
2. Malhotra, N. (2010). Marketing research: An applied orientation
(6th ed.). Upper Saddle River, NJ: Pearson/Prentice Hall, p. 14.
3. Hagins, B. (2010, May). The ROI on calculating research’s ROI.
Quirk’s Marketing Research Review, 14 , 52–58.
4. Adapted from Adler, L. (1979, September 17). Secrets of when and
when not to embark on a marketing research project. Sales & Mar-keting Management Magazine, 123 , 108.
5. Gibson, L. D. (1998, Spring). Defining marketing problems: Don’t
spin your wheels solving the wrong puzzle. Marketing Research, 10 (4), 7.
6. Retrieved from www.dictionary.com , accessed November 13, 2003.
7. Muthalyan, S. (2011, November 15). Maximizing retail promotions
using smart alerts. Marketing News , 13.
8. For example, see Gordon, G. L., Schoenbachler, D. D., Kamin-
ski, P. F., & Brouchous, K. A. (1997). New product development:
Using the salesforce to identify opportunities. Business and Industrial Marketing, 12 (1), 33; Ardjchvilj, A., Cardozo, R., & Ray, S. (2003,
January). A theory of entrepreneurial opportunity identification and
development. Journal of Business Venturing, 18 (1), 105.
9. Drummond-Dunn, D. (2015, May 6). Why marketing doesn’t al-
ways get the research it needs, but usually what it deserves. Green-Book . Retrieved from http://www.greenbookblog.org/2015/05/06/
why-marketing-doesnt-always-get-the-research-it-needs-but-
usually-what-it-deserves
10. Semon, T. (1999, June 7). Make sure the research will answer the
right question. Marketing News, 33 (12), H30.
11. Adapted from Merriam-Webster online at http://www.merriam-
webster.com/dictionary/hypothesis and dictionary.com/hypothesis
12. “Students may be surprised to learn that there is little agreement in
the advertising industry as to what constitutes a ‘better’ advertising
claim at the testing stage. The researcher is often saddled with the
task of measuring the quality of the claims and with defining what a
better claim should be. It would be helpful if the firm has a history
of testing claims and has reached agreement on what constitutes a
‘better’ claim. In the end the definition of ‘better’ must be based on
consensus or the decision cannot be made.” Quote provided to the
authors by Ron Tatham, Ph.D.
13. Smith, S. M., & Albaum, G. S. (2005). Fundamentals of marketing research. Thousand Oaks, CA: Sage, p. 349.
14. American Marketing Association. (n.d.). Dictionary. Retrieved from
www.marketingpower.com , December 10, 2003.
15. Bearden, W. O., Netemeyer, R. G., & Mobley, M. F. (1993). Hand-book of marketing scales . Newberry Park, CA: Sage; Bearden,
W. O., & Netemeyer, R. G. (1999). Handbook of marketing scales: Multi-item measures for marketing and consumer behavior re-search. Thousand Oaks, CA: Sage; and Bruner, G. C., Hensel, P. J.,
& James, K. E. (2005). Marketing scales handbook: A compila-tion of multi-item measures for consumer behavior and advertising .
Chicago: American Marketing Association.
16. Moser, A. (2005). Take steps to avoid misused research pitfall. Mar-keting News, 39 (15), 27.
17. See Burns, A. C., & Bush, R. F. (2006). Insights based on 30 years
of defining the problem and research objectives, Marketing research
(5th ed.). Upper Saddle River, NJ: Pearson/Prentice Hall, pp. 92–93.
18. Kane, C. (1994, November 28). New product killer: The research
gap. Brandweek, 35 (46), 12.
19. Mariampolski, H. (2000, December). A guide to writing and evalu-
ating qualitative research proposals. Quirk’s Marketing Research Review .
Chapter 4 1. Singleton, D. (2003, November 24). Basics of good research involve
understanding six simple rules. Marketing News , 22–23.
2. For an excellent in-depth treatment of research design issues, see
Creswell, J. (2003). Research design: Qualitative, quantitative, and mixed methods approaches . Thousand Oaks, CA: Sage.
3. Boitnott, J. (2014, September 22). 40 young people who became
millionaires before they were 20. Inc. Retrieved from http://www.
inc.com/john-boitnott/40-young-people-who-became-millionaires-
before-they-were-20.html
4. Company test marketing water bottle kiosks at WVU. (2012, April
9). The Marietta Times. Retrieved from http://www.wvgazettemail.
com/Business/201204080024
5. For one example, see Parasuraman, A., Berry, L. L., & Zeithaml,
V. A. (1991, Winter). Refinement and reassessment of the
SERVQUAL scale. Journal of Retailing, 67 (4), 420ff. A small effort
of exploratory research on this topic will find many references on
measuring service quality.
6. Stewart, D. W. (1984). Secondary research: Information sources and methods. Newbury Park, CA: Sage; Davidson, J. P. (1985,
Z01_BURN3261_08_GE_NOTE.indd 462Z01_BURN3261_08_GE_NOTE.indd 462 17/08/16 2:13 pm17/08/16 2:13 pm

ENDNOTES 463
April). Low cost research sources. Journal of Small Business Man-agement, 23, 73–77.
7. Malhotra, N. K. (2010). Marketing research: An applied orientation
(6th ed.). Upper Saddle River, NJ: Pearson Prentice Hall, p. 40.
8. Bonoma, T. V. (1984). Case research in marketing: Opportuni-
ties, problems, and a process. Journal of Marketing Research, 21, 199–208.
9. Chen, C., Zhang, J., & Delaurentis, T. (2014). Quality control in
food supply chain management: An analytical model and case study
of the adulterated milk incident in China. International Journal of Production Economics, 152 , 188–199.
10. Bowen, S. A., & Zheng, Y. (2015). Auto recall crisis, framing, and
ethical response: Toyota’s missteps. Public Relations Review, 41 (1),
40–49.
11. Thomas, J. (2015, April 2). Rams fans make plea, express concern
to NFL over team’s possible move. McClatchy-Tribune Business News . ProQuest.
12. Sudman, S., & Wansink, B. (2002). Consumer panels (2nd ed.).
Chicago: American Marketing Association. This book is recognized
as an authoritative source on panels.
13. Esterl, M., & Vranica, S. (2015, August 7). Pepsi starts ship-
ping aspartame-free soda. Wall Street Journal . Retrieved from
http://www.wsj.com/articles/pepsi-starts-shipping-aspartame-
free-soda-1438948840
14. Esterl, M. (2015, October 8). New Diet Pepsi leaves some loyal-
ists with bad taste. Wall Street Journal . Retrieved from http://
www.wsj.com/articles/new-diet-pepsi-leaves-some-loyalists-with-
bad-taste-1444327691
15. In fact, the Affordable Care Act signed into law in March 2010
by President Obama requires the FDA to develop standards re-
quiring restaurant chains with 20 or more outlets to provide food
labeling.
16. See, for example, Montgomery, D. (2001). Design and analysis of experiments . New York: Wiley; Kerlinger, F. N. (1986). Founda-tions of behavioral research (3rd ed.). New York: Holt, Rinehart,
and Winston.
17. Campbell, D. T., & Stanley, J. C. (1963). Experimental and quasi-experimental designs for research . Chicago: Rand McNally.
18. Calder, B. J., Phillips, L. W., & Tybout, A. M. (1992, December).
The concept of external validity. Journal of Consumer Research, 9 ,
240–244.
19. Gray, L. R., & Diehl, P. L. (1992). Research methods for business and management . New York: Macmillan, pp. 387–390.
20. Brennan, L. (1988, March). Test marketing. Sales Marketing Man-agement Magazine, 140 , 50–62.
21. Chavez, J. (2015, May 14). Taco Bell’s Quesalupa to be served nation-
wide. Toledo Blade. Retrieved from http://www.toledoblade.com/
Retail/2015/05/14/Taco-Bell-s-Quesalupa-to-be-served-nationwide.
html
22. Churchill, G. A., Jr. (2001). Basic marketing research (4th ed.). Fort
Worth, TX: Dryden Press, pp. 144–145.
23. Spethmann, B. (1985, May 8). Test market USA. Brandweek, 36 ,
40–43.
24. Melvin, P. (1992, September). Choosing simulated test marketing
systems. Marketing Research, 4 (3), 14–16.
25. Ibid. Also see Turner, J., & Brandt, J. (1978, Winter). Development
and validation of a simulated market to test children for selected
consumer skills. Journal of Consumer Affairs , 266–276.
26. Greene, S. (1996, May 4). Chattanooga chosen as test market for
smokeless cigarette. Knight-Ridder/Tribune Business News . Re-
trieved from Lexis-Nexis.
27. Power, C. (1992, August 10). Will it sell in Podunk? Hard to say.
Business Week , 46–47.
28. Murphy, P., & Laczniak, G. (1992, June). Emerging ethical issues
facing marketing researchers. Marketing Research , 6.
29. Much of the content of this case was taken from a discussion with
marketing researcher Doss Struse.
Chapter 5 1. Lohr, S. (2013, January 1). The origins of “Big Data”: An etymologi-
cal detective story. New York Times. Retrieved from http://bits.blogs.
nytimes.com/2013/02/01/the-origins-of-big-data-an-etymological-
detective-story/?_r=0 .
2. Rosenbush, S., & Totty, M. (2013, March 11). From a molehill to a
mountain. Wall Street Journal , p. B1.
3. GreenBook. (2015 ). GreenBook Industry Trends Report , 17th
ed. New York, p. 44.
4. Survey monitor: Boomers and gen X the most spend-happy; Millen-
nials buy more per trip. (2010, May). Quirk’s Marketing Research Review, 14 , 10, 59.
5. Short, K. (2015, February). Brands, prepare to engage with Genera-
tion Z. Quirk’s Marketing Research Media . Retrieved from http://
www.quirks.com
6. Tootelian, D. H., & Varshney, S. B. (2010). The grandparent
consumer: A financial “goldmine” with gray hair? The Journal of Consumer Marketing, 27 (1), 57–63. Retrieved May 5, 2010, from
ABI/INFORM Global (Document ID: 1945854611).
7. Senn, J. A. (1988). Information technology in business: Principles, practice, and opportunities. Upper Saddle River, NJ: Prentice Hall,
p. 66.
8. Grisaffe, D. (2002, January 21). See about linking CRM and MR
systems. Marketing News, 36 (2), 13.
9. Drozdenko, R. G., & Drake, P. D. (2002). Optimal database marketing. Thousand Oaks, CA: Sage.
10. Berman, B., & Evans, J. R. (2010). Retail management: A strategic approach . Upper Saddle River, NJ: Pearson Prentice Hall, p. 235.
11. Kotler, P., & Keller, K. L. (2016). Marketing management (15th ed.).
Upper Saddle River, NJ: Pearson Prentice Hall, p. 640.
12. McKim, R. (2001, September). Privacy notices: What they mean
and how marketers can prepare for them. Journal of Database Marketing, 9 (1), 79–84.
13. Economist. (2015, November 21). Out of the box, pp. 56–57.
14. Data.gov . (2015). Retrieved from http://www.data.gov/
15. For a discussion of these and other similar situations, see Crosen,
C. (1994). Tainted truth: The manipulation of fact in America. New
York: Simon & Schuster, p. 140.
Z01_BURN3261_08_GE_NOTE.indd 463Z01_BURN3261_08_GE_NOTE.indd 463 17/08/16 2:13 pm17/08/16 2:13 pm

464 ENDNOTES
16. America’s experience with Census 2000. (2000, August). Direct Marketing, 63 (4), 46–51.
17. Accuracy of the census is measured by Census Coverage Measure-
ment (CCM). CCM for the 2010 Census showed that it had an error
of 0.01 percent overcount, meaning that an estimated 36,000 extra
people were counted. Retrieved on May 24, 2012, from http://www.
census.gov .
18. Lange, K. E. (2009, November). The big idea: Electric cars.
National Geographic , p. 24.
19. Database of personalities (living and dead). (n.d.). Retrieved on May
30, 2012, from http://www.qscores.com/Web/personalities.aspx
20. Based on information provided to the authors by Marketing Evalu-
ations, Inc., on May 31, 2012. These were the top two celebrities in
the 2012 Performer Q study.
21. Television measurement. (2012). Retrieved on May 30, 2012,
from http://www.nielsen.com/us/en/measurement/television-
measurement.html
22. Actually, virtually all these firms offer some customization of data
analysis, and many offer varying methods of collecting data. Still,
while customization is possible, these same companies provide
standardized processes and data.
23. Lifestyles-Esri Tapestry Segmentation. (n.d.). Retrieved on May 30,
2012, from http://www.esri.com/data/esri_data/tapestry.html
24. Murphy, L. (2015). The top 10 most innovative supplier companies
in market research. GreenBook Blog. Retrieved from http://www.
greenbookblog.org/2015/04/28/the-top-10-most-innovative-supplier-
companies-in-market-research-grit-spring-2015-sneak-peek
25. ESOMAR. (2015). Global market research 2015 , p. 35.
26. Fitzsimmons, C. (2013, October 10). Big Data: Forget the “big” and
make better use of the data you already have . Business Review Weekly .
Retrieved from http://www.brw.com.au/p/tech-gadgets/data_data_
forget_already_have_and_cY0C3L5M9N1dYkVrsOFeuK
27. ESOMAR. (2014, June 10). The future of market research. RW Connect . Retrieved from https://rwconnect.esomar.org/the-future-
of-market-research
28. Campbell, S., & Swigarts, S. (2015, April 17). 10 things mar-
keting research needs to know about the Internet of Things.
Marketing Research Association . Retrieved from http://www.
marketingresearch.org/article/10-things-market-researchers-need-
know-about-internet-things
29. Smith, R. (2015, August 19). Ralph Lauren to sell wearable-tech
shirt timed for US Open. Wall Street Journal . Retrieved from
http://www.wsj.com/articles/ralph-laurens-new-wearable-shirt-for-
us-open-1439999079?alg=y
30. Inspired by a project by Robert Bellon, Steven Moser, Alec Pearson,
Marissa Pertler, and Daniel Stropes.
Chapter 6 1. Ezzy, D. (2001, August). Are qualitative methods misunderstood?
Australian and New Zealand Journal of Public Health, 25 (4),
294–297.
2. Clark, A. (2001, September 13). Research takes an inventive
approach. Marketing , 25–26.
3. GreenBook. (2015, Q3-4 ). GreenBook Research Industry Trends Report (18th ed.). New York: New York, p. 10.
4. Rydholm, J. (2011, May). A clearer picture. Quirk’s Marketing Research Review, 25 (5), 30–33.
5. Cusumano, L. (2010, April). How Big Pharma is misusing qualita-
tive marketing research. Quirk’s Marketing Research Review, 24 (4),
18–20.
6. Smith, S. M., & Whitlark, D. B. (2001, Summer). Men and women
online: What makes them click? Marketing Research, 13 (2), 20–25.
7. Piirto, R. (1991, September). Socks, ties and videotape. American Demographics , 6.
8. Fellman, M. W. (1999, Fall). Breaking tradition. Marketing Research, 11 (3), 20–34.
9. Modified from Tull, D. S., & Hawkins, D. I. (1987). Marketing research (4th ed.). New York: Macmillan, p. 331.
10. Rust, L. (1993, November/December). How to reach children in
stores: Marketing tactics grounded in observational research. Jour-nal of Advertising Research, 33 (6), 67–72; Rust, L. (1993, July/
August). Parents and children shopping together: A new approach to
the qualitative analysis of observational data. Journal of Advertising Research, 33 (4), 65–70.
11. Rydholm, J. (2010, May). Steering in the right direction. Quirk’s Marketing Research Review, 24 (5), 26–32.
12. See http://www.instituteofhomescience.com/
13. Viles, P. (1992, August 24). Company measures listenership in cars.
Broadcasting, 122 (35), 27.
14. Mariampolski, H. (1988, January 4). Ethnography makes come-
back as research tool. Marketing News, 22 (1), 32, 44; Peñaloza, L.
(1994, June). Atravesando Fronteras/Border Crossings: A critical
ethnographic study of the consumer acculturation of Mexican im-
migrants. Journal of Consumer Research, 21 , 32–53; Peñaloza, L.
(2006). Researching ethnicity and consumption. In Russell W. Belk
(Ed.), Handbook of qualitative research techniques in marketing. Cheltenham, England: Edward Elgar, 547–549; Carlon, M. (2008,
April). Evolving ethnography. Quirk’s Marketing Research Review, 22 (4), 18, 20.
15. Kephart, P. (1996, May). The spy in aisle 3. American Demograph-ics Marketing Tools. Retrieved from http://www.marketingtools.
com/Publications/MT/96_mt/9605MD04.htm
16. Del Vecchio, E. (1988, Spring). Generating marketing ideas when
formal research is not available. Journal of Services Marketing, 2 (2), 71–74.
17. Hellebursch, S. J. (2000, September 11). Don’t read research by the
numbers. Marketing News, 34 (19), 25.
18. Greenbaum, T. I. (1988). The practical handbook and guide in focus group research . Lexington, MA: D. C. Heath.
19. Knutson, R. (2015, September 19). How a Silicon Valley pro-
ject to reimagine TV became a Verizon app. Wall Street Journal. Retrieved from http://www.wsj.com/articles/verizons-go90-video-
service-targets-millennials-1441906523
20. Stoltman, J. J., & Gentry, J. W. (1992). Using focus groups to study
household decision processes and choices. In R. P. Leone and
V. Kumar (Eds.), AMA Educator’s Conference Proceedings , Vol. 3.
Enhancing knowledge development in marketing (pp. 257–263).
Chicago: American Marketing Association.
21. Quirk’s Marketing Research Media. (2015 ). Quirk’s Corporate Research Report , 8.
22. Greenbaum, T. L. (1993, March 1). Focus group research is not a
commodity business. Marketing News, 27 (5), 4.
23. Greenbaum, T. L. (1991, May 27). Answer to moderator problems
starts with asking right questions. Marketing News, 25 (11), 8–9;
Fern, E. F. (1982, February). The use of focus groups for idea gen-
eration: The effects of group size, acquaintanceship, and moderator
on response quantity and quality. Journal of Marketing Research ,
1–13.
24. Greenbaum, T. L. (1991). Do you have the right moderator for your
focus groups? Here are 10 questions to ask yourself. Bank Market-ing, 23 (1), 43.
25. For guidelines for “backroom observers,” see Langer, J. (2001, Sep-
tember 24). Get more out of focus group research. Marketing News, 35 (20), 19–20.
Z01_BURN3261_08_GE_NOTE.indd 464Z01_BURN3261_08_GE_NOTE.indd 464 17/08/16 2:13 pm17/08/16 2:13 pm

ENDNOTES 465
26. Grinchunas, R., & Siciliano, T. (1993, January 4). Focus groups pro-
duce verbatims, not facts. Marketing News, 27 (1), FG-19.
27. Lonnie, K. (2001, November 19). Combine phone, Web for focus
groups. Marketing News, 35 (24), 15–16.
28. For interesting comments, see DeNicola, N., & Kennedy, S.
(2001, November 19). Quality Inter(net)action. Marketing News, 35 (24), 14.
29. Jarvis, S., & Szynal, D. (2001, November 19). Show and tell. Mar-keting News, 35 (24), 1, 13.
30. Langer, J. (2001). The mirrored window: Focus groups from a mod-
erator’s viewpoint. New York: Paramount Market, 11.
31. Quinlan, P. (2000, December). Insights on a new site. Quirk’s Mar-keting Research Review, 15 (11), 36–39.
32. Hines, T. (2000). An evaluation of two qualitative methods (focus
group interviews and cognitive maps) for conducting research into
entrepreneurial decision making. Qualitative Market Research, 3 (1), 7–16; Quinlan, P. (2008, June). Let the maps be your guide.
Quirk’s Marketing Research Review, 22 (6), 74, 76, 77.
33. Berlamino, C. (1989, December/January). Designing the qualitative
research project: Addressing the process issues. Journal of Adver-tising Research, 29 (6), S7–S9; Johnston, G. (2008, June). Qualita-
tively speaking. Quirk’s Marketing Research Review, 22 (6), 18, 20;
Alert! Magazine . (2007, September). Special expanded qualitative
research issue, 45 (9); Brownell, L. (2008, April). Chief executive
column. Alert! Magazine, 46 (4), 11, 23.
34. Perez, R. (2010, May). Shaping the discussion. Quirk’s Marketing Research Review , 24(5), 34–40.
35. See, for example, Seidler, S. (2010, May). Qualitative research
panels: A new spin on traditional focus groups. Quirk’s Marketing Research Review, 25 (5), 18–20.
36. American Marketing Association. (n.d.). Dictionary. Retrieved from
http://www.marketingpower.com
37. Taylor, C. (2003, December). What’s all the fuss about? Quirk’s Marketing Research Review, 17 (11), 40–45.
38. Brogdon, T. (2011, February). A bit more personal. Quirk’s Market-ing Research Review, 25 (2), 50–53.
39. Davis, J. (2015, September/October). 10 minutes with Mike Micku-
nas. Marketing Insights, 27 (5), 28–31.
40. Burns, A., & Bush, R. (2010). Marketing research (6th ed.). Upper
Saddle River, NJ: Prentice Hall, p. 231.
41. Rodriguez, L. (2014, February). Qualitatively speaking: Mobile,
yes; ethnography, not so much. Quirk’s Marketing Research Review, 28 (2), 20–23.
42. Kozinets, R. V. (2015). Netnography: Redefined . Thousand Oaks,
CA: Sage.
43. Are marketers losing control of fashion brands? (2014). Strategic Direction, 30 (6), 20–22.
44. de la Pena, A., & Quintanilla, C. (2015). Share, like and achieve:
The power of Facebook to reach health-related goals. International Journal of Consumer Studies, 39 (5), 495–505.
45. GreenBook. (2015 ). GreenBook Industry Trends Report (17th ed.).
New York: New York, p. 44.
46. Conon, J. (2014, April). 12 strategies for keeping your Gen Z
community engaged. Quirk’s Marketing Research Review, 28 (4),
56–59.
47. Austin, M. (2013, May). More than an activity: How passive
“shopping” is changing the path to purchase. Quirk’s Marketing Research Review, 27 (5). Retrieved from http://www.quirks.com/
articles/2013/20130526-2.aspx?searchID=1437330499&sort=
5&pg=1
48. Based on a table in Goon, E. (2011, May). Need research? Won’t
travel. Quirk’s Marketing Research Review, 25 (5), 22–28.
49. Davies, H. (2014). Online communities vs. focus groups—who
wins? Quirk’s Marketing Research Review. Retrieved from http://
researchindustryvoices.com/2014/03/13/online-communities-vs-
focus-groups-who-wins/
50. Flores Letelier, M., Spinosa, C., & Calder, B. (2000, Winter). Tak-
ing an expanded view of customers' needs: Qualitative research for
aiding innovation. Marketing Research, 12 (4), 4–11.
51. Grapentine, T. (2010, December). Does more time equal more in-
sights? Quirk’s Marketing Research Review, 24 (10), 34–37.
52. Donnely, T. (2011, May). Marrying phone and web. Quirk’s Market-ing Research Review, 25 (5), 42–46.
53. Kahan, H. (1990, September 3). One-on-ones should sparkle like the
gems they are. Marketing News, 24 (18), 8–9.
54. Roller, M. R. (1987, August 28). A real in-depth interview wades
into the stream of consciousness. Marketing News, 21 (18), 14.
55. Kahan, One-on-ones should sparkle like the gems they are.
56. An interesting article on developments in in-depth interviewing is
Wansink, B. (2000, Summer). New techniques to generate key mar-
keting insights. Marketing Research, 12 (2), 28–36.
57. Kates, B. (2000, April). Go in-depth with depth interviews. Quirk’s Marketing Research Review, 14 (4), 36–40.
58. Mitchell, V. (1993, First Quarter). Getting the most from in-depth
interviews. Business Marketing Digest, 18 (1), 63–70.
59. Reynolds, T. J., & Gutman, J. (1988). Laddering, method, analy-
sis, and interpretation. Journal of Advertising Research, 28 (1),
11–21.
60. Qualitative Research Services. (n.d.). Word association tests. Retrieved
on May 20, 2015, from http://www.decisionanalyst.com
61. These techniques are provided by Holly M. O'Neill, President, Talk-
ing Business.
62. Pich, C., & Dean, D. (2015). Qualitative projective techniques in
political brand image research from the perspective of young adults . Qualitative Market Research: An International Journal 2015 18 (1),
115–144.
63. Singer, N. (2010, November 13). Making ads that whisper to
the brain. New York Times . Retrieved from http://www.nytimes.
com/2010/11/14/business/14stream.html?_r=0
64. Crupi, A. (2015, May 27). Nielsen buys neuromarketing research
company Innerscope: Ratings giant wants to get inside your head.
Advertising Age . Retrieved from http://adage.com/article/media/
nielsen-buys/298771/
65. Eisenberger, N., Lieberman, M., & Williams, K. (2003). Does rejec-
tion hurt? An fMRI study of social exclusion. Science, 302 (5643),
290–292.
66. Marshall, S., Drapeau, T., & DiSciullo, M. (2001, July/August). An
eye on usability. Quirk’s Marketing Research Review, 15 (7), 20–21,
90–92.
67. Zapata, C. (2012). What caught their eye? Quirk’s Marketing Research Review, 26 (5), 32–37.
68. Hille, D., & Levin, A. (2013, March). Applying facial coding to ad
testing . Quirk’s Marketing Research Review, 27 (3), 46–51.
69. Randall, K. (2015, November 3). Neuropolitics: Where campaigns
try to read your mind. New York Times . Retrieved from http://www.
nytimes.com/2015/11/04/world/americas/neuropolitics-where-
campaigns-try-to-read-your-mind.html?_r=0
70. Jarrett, J. (2015, October 14). Has the age of neuromarketing finally
arrived ? New York Magazine . Retrieved from http://nymag.com/
scienceofus/2015/10/has-the-age-of-neuromarketing-finally-
arrived.html
71. Dooley, R. (2015, June 3). Nielsen doubles down on neuro. Forbes .
Retrieved from http://www.forbes.com/sites/rogerdooley/2015/06/
03/nielsen-doubles-down-on-neuro/
Z01_BURN3261_08_GE_NOTE.indd 465Z01_BURN3261_08_GE_NOTE.indd 465 17/08/16 2:13 pm17/08/16 2:13 pm

466 ENDNOTES
Chapter 7 1. Malhotra, N. (1999). Marketing research: An applied orientation
(3rd ed.). Upper Saddle River, NJ: Prentice Hall, p. 125.
2. Tourangeau, R. (2004). Survey research and societal change. Annual Review of Psychology, 55 (1), 775–802.
3. Blyth, B. (2008). Mixed mode: The only ‘fitness’ regime. Interna-tional Journal of Market Research, 50 (2), 241–266.
4. Curtin, R., Presser, S., & Singer, E. (2005, Spring). Changes in
telephone survey nonresponse over the past quarter century. Public Opinion Quarterly, 69 (1), 87–98.
5. Macer, T., & Wilson, S. (2015, April). FocusVision Annual
Market Research Technology Report, meaning ltd, London,
p. 17.
6. Couper, M. P. (2011). The future of modes of data collection.
Public Opinion Quarterly, 75 (5), 889–908.
7. See Oishi, S. M. (2003). How to conduct in-person interviews for surveys . Thousand Oaks, CA: Sage, p. 6.
8. Bronner, F., & Kuijlen, T. (2006, June). The live or digital
interviewer. International Journal of Market Research, 49 (2),
167–190.
9. Bourque, L., & Fielder, E. (2003 ). How to conduct self-administered and mail surveys (2nd ed.). Thousand Oaks, CA: Sage.
10. Jang, H., Lee, B., Park, M., & Stokowski, P. A. (2000, February).
Measuring underlying meanings of gambling from the perspec-
tive of enduring involvement. Journal of Travel Research, 38 (3),
230–238.
11. Mavletova, A. (2015). A gamification effect in longitudinal web
surveys among children and adolescents. International Journal of Market Research, 57 (3), 413–438.
12. Maronick, T. (2011, March). Pitting the mall against the Internet in
advertising-research completion. Journal of Advertising Research, 51 (1), 321–331.
13. See, for example, Dudley, D. (2001, January). The name col-
lector. New Media Age , 18–20; Kent, R., & Brandal, H. (2003).
Improving email response in a permission marketing context.
International Journal of Market Research, 45 (4), 489–540; Agrawal,
A., Basak, J., Jain, V., Kothari, R., Kumar, M., Mittal, P. A., et al.
(2004, September/October). Online marketing research. IBM Jour-nal of Research & Development, 48 (5/6), 671–677.
14. Bronner, F., & Kuijlen, T. (2007). The live or digital interviewer.
International Journal of Market Research, 49 (2), 167–190.
15. Haynes, D. (February 2005). Respondent goodwill is a cooperative
activity. Quirk’s Marketing Research Review, 19 (2), 30–32.
16. Macer, T., & Wilson, S. (February 2007). Online makes more in-
roads. Quirk’s Marketing Research Review, 23 (2), 50–55; West-
ergaard, J. (2005, November). Your survey, our needs. Quirk’s Marketing Research Review, 19 (10), 64–66.
17. Some authors restrict the definition to only cases where two or more
data collection methods are used in the same phase of the study.
See Hogg, A. (2002, July). Multi-mode research dos and don’ts.
Quirk’s Marketing Research Review. Retrieved from http://www.
quirks.com .
18. Cuneo, A. Z. (2004, November). Researchers flail as public cuts the
cord. Advertising Age, 75 (46), 3.
19. Townsend, L. (2010, November). Hit ‘em where they surf. Quirk’s Marketing Research Review, 24 (11), 40–43.
20. Katz, M., & Mackey, P. (2010, April). Positive, negative, or neutral.
Quirk’s Marketing Research Review , 24(4), 26–31.
21. Mora, M. (2011, July). Understanding the pros and cons of mixed-
mode research. Quirk’s Marketing Research Review, 25 (7), 50–54.
22. Lugtig, P., Gerty, J. L. M., Lensvelt-Mulders, R. F., & Greven, A.
(2011). Estimating nonresponse bias and mode effects in a
mixed-mode survey. International Journal of Market Research, 53 (5), 669–686.
23. Fricker, S., Galesic, M., Tourangeau, R., & Ting, Y. (2005, Fall).
An experimental comparison of web and telephone surveys. Public Opinion Quarterly, 69 (3), 370–392.
24. Hsu, J. W., & McFall, B. H. (2015). Mode effects in mixed-mode
economic surveys: Insights from a randomized experiment. Finance and Economics Discussion Series 2015-008 . Washington: Board of
Governors of the Federal Reserve System. Retrieved from http://
www.federalreserve.gov/econresdata/feds/2015/files/2015008pap
.pdf .
25. See Roy, A. (2003). Further issues and factors affecting the re-
sponse rates of e-mail and mixed-mode studies. In M. Barone et al.
(Eds.), Enhancing knowledge development in marketing . Proceed-
ings of the American Marketing Association Educators' Confer-
ence, Chicago, pp. 338–339; Bachmann, D., Elfrink, J., & Vazzana,
G. (1999). E-mail and snail mail face off in rematch. Marketing Research, 11 (4), 11–15.
26. Hogg, Multi-mode research dos and don’ts.
27. Roy, S. (2004, July). The littlest consumers. Display & Design Ideas, 16 (7), 18–21.
28. Trott, D. L., & Simpson, A. M. (2005). Computer assisted personal
interviewing—The Bermuda experience. Statistical Journal of the United Nations , ECE 22, 133–145.
29. Caeyers, B., Chalmers, N., & De Weerdt, J. (2012). Improving
consumption measurement and other survey data through CAPS:
Evidence of a randomized experiment. Journal of Development Economics, 98 , 19–33.
30. See Jacobs, H. (1989, Second Quarter). Entering the 1990s: The state
of data collection–From a mall perspective. Applied Marketing Re-search, 30 (2), 24–26; Lysaker, R. L. (1989, October). Data collection
methods in the U.S. Journal of the Market Research Society, 31 (4),
477–488; Gates, R., & Solomon, P. J. (1982, August/September).
Research using the mall intercept: State of the art. Journal of Ad-vertising Research, 43–50; Bush, A. J., Bush, R. F., & Chen, H. C.
(1991). Method of administration effects in mall intercept inter-
views. Journal of the Market Research Society, 33 (4), 309–319.
31. See, for example, Ghazali, E., Mutum, A. D., & Mahbob, N. A.
(2006). Attitude towards online purchase of fish in urban Malaysia:
An ethnic comparison. Journal of Food Products Marketing, 12 (4),
109–128; Yun, W., & Heitmeyer, J. (2006, January). Consumer at-
titude toward US versus domestic apparel in Taiwan. International Journal of Consumer Studies, 30 (1), 64–74.
32. Frost-Norton, T. (2005, June). The future of mall research: Current
trends affecting the future of marketing research in malls. Journal of Consumer Behavior, 4 (4), 293–301.
33. Hornik, J., & Eilis, S. (1989, Winter). Strategies to secure compli-
ance for a mall intercept interview. Public Opinion Quarterly, 52 (4),
539–551.
34. At least one study refutes the concern about shopping frequency.
See DuPont, T. D. (1987, August/September). Do frequent mall
shoppers distort mall-intercept results? Journal of Advertising Research, 27 (4), 45–51.
35. Bourque, L., & Fielder, E. (2003). How to conduct telephone inter-views (2nd ed.). Thousand Oaks, CA: Sage.
36. Holbrook, A. L., Green, M. C., & Krosnick, J. A. (2003, Spring).
Telephone versus face-to-face interviewing of national probability
samples with long questionnaires. Public Opinion Quarterly, 67 (1),
79–126.
37. Brennan, M., Benson, S., & Kearns, Z. (2005). The effect of in-
troductions on telephone survey participation rates. International Journal of Market Research, 47 (1), 65–75.
Z01_BURN3261_08_GE_NOTE.indd 466Z01_BURN3261_08_GE_NOTE.indd 466 17/08/16 2:13 pm17/08/16 2:13 pm
ENDNOTES 467
38. At the extreme, it is reported that Chinese research companies
monitor at least 50% of all telephone interviews; see Harrison, M.
(2006, Winter). Learning the language. Marketing Research, 18 (4),
10–16.
39. Bos, R. (1999, November). A new era in data collection. Quirk’s Marketing Research Review, 12 (10), 32–40.
40. Fletcher, K. (1995, June 15). Jump on the omnibus. Marketing, 25–28.
41. Bronner, F., & Kuijlen, T. (2007). The live or digital interviewer:
A comparison between CASI, CAPI, and CATI with respect to
difference in response behavior . International Journal of Market Research, 49 (2), 167–190.
42. DePaulo, P. J., & Weitzer, R. (1994, January 3). Interactive phone
technology delivers survey data quickly. Marketing News, 28( 1), 15.
43. Jones, P., & Palk, J. (1993). Computer-based personal interview-
ing: State-of-the-art and future prospects. Journal of the Market Research Society, 35 (3), 221–233.
44. For a “speed” comparison, see Cobanouglu, C., Warde, B., & Moeo,
P. J. (2001). A comparison of mail, fax and Web-based survey meth-
ods. International Journal of Market Research, 43 (3), 441–452.
45. See De Bruijne, M., & Wijnant, A. (2014, Winter). Improving re-
sponse rates and questionniare design for mobile web surveys. Pub-lic Opinion Quarterly, 78 (4), 951–962; Fine, B., & Menictas, C.
(2012, December). The who, when, where and how of smartphone
research. Australasian Journal of Market & Social Research, 20 (2),
29–46.
46. See Singh, A., Taneja, A., & Mangalaraj, G. (2009, June). Creat-
ing online surveys: Some wisdom from the trenches tutorial. IEEE Transactions on Professional Communication, 52 (2), 197–212;
Costa de Silva, S., & Duarte, P. (2014). Suggestions for interna-
tional research using electronic surveys. The Marketing Review, 4 (3), 297–309.
47. Not all observers agree that this trend is positive. See Lauer, H.
(2005, July/August). You say evolution, I say devolution. Quirk’s Marketing Research Review, 19 (7), 82–88.
48. Miles, L. (2004, June 16). Online market research panels offer cli-
ents high response rates at low prices. Marketing , 39.
49. Grecco, C. (2000, July/August). Research non-stop. Quirk’s Mar-keting Research Review, 14 (7), 70–73.
50. Greenberg, D. (2000, July/August). Internet economy gives rise
to real-time research. Quirk’s Marketing Research Review, 14 (7),
88–90.
51. Frazier, D., & Rohmund, I. (2007, July/August). The real-time ben-
efits of online surveys, Electric Perspectives, 32 (4), 88–91.
52. Noh, M., Runyan, R., & Mosier, J. (2014). Young consumers' inno-
vativeness and hedonic/utilitarian cool attitudes. International Jour-nal of Retail & Distribution Management, 42 (4), 267–280.
53. Brown, S. (1987). Drop and collect surveys: A neglected research
technique? Journal of the Market Research Society, 5 (1), 19–23.
54. See Ibeh, K. I., & Brock, J. K. (2004). Conducting survey research
among organizational populations in developing countries. Interna-tional Journal of Market Research , (3), 375–383; Ibeh, K. I., Brock,
J. K., & Zhou, Y. J. (2004, February). The drop and collect survey
among industrial populations: Theory and empirical evidence. In-dustrial Marketing Management, 33 (2), 155–165.
55. Bourque & Fielder, How to conduct self-administered and mail surveys .
56. American Statistical Association. (1997). More about mail surveys.
ASA Series: What is a survey? Alexandria, VA: Author.
57. Anderson, R. C., Fell, D., Smith, R. L., Hansen, E. N., & Gomon,
S. (2005, January). Current consumer behavior research in forest
products. Forest Products Journal, 55 (1), 21–27.
58. Grandcolas, U., Rettie, R., & Marusenko, K. (2003). Web survey
bias: Sample or mode effect? Journal of Marketing Management, 19 , 541–561.
59. See, for example, McDaniel, S. W., & Verille, P. (1987, January). Do
topic differences affect survey nonresponse? Journal of the Market Research Society, 29 (1), 55–66; Whitehead, J. C. (1991, Winter).
Environmental interest group behavior and self-selection bias in
contingent valuation mail surveys. Growth & Change, 22 (1), 10–21.
60. Radder, L., Malder, A., & Han, X. (2013). Motivations and socio-
demographic characteristics of safari hunters: A South African per-
spective. Academy of Marketing Studies Journal, 17 (1), 3–4.
61. Fulgoni, G. (2014, June). Uses and misuses of online-survey panels
in digital research. Journal of Advertising Research, 54 (2), 133–137.
62. Lusk, J. L., & Brooks, K. (2011). Who participates in household
scanning panels? American Journal of Agricultural Economics, 93 (1), 226–240.
63. Sellers, R. (2009). Dirty little secrets of online panels. Grey Matter
Research & Consulting, Phoenix, AZ. Retrieved from http://
affluenceresearch.org/Dirty-Little-Secrets-of-Online-Panels.pdf .
64. Kanyal, A. (2014, May 14). Top 20 most valuable companies in the online
panel industry. Retrieved from http://www.onlinemr.com/2012/05/14/
top-20-most-valuable-companies-in-the-online-panel-industry/ .
65. Murphy, L. F. (Ed.), (2014, Fall). Greenbook Research Industry
Trends. Greenbook, GRIT greenbook.org/GRIT , New York, 24.
66. An industry study identified effectiveness, demand for a specific
modality, cost, speed of data collection, and available resources as
the top five selection criteria when selecting a data collection modal-
ity. Pioneer Marketing Research. (2004, April). Research industry trends: 2004 report . Retrieved from http://www.dialtek.com .
67. Philpott, G. (2005, February). Get the most from Net-based panel
research. Marketing News, 39 (2), 58.
68. Gerlotto, C. (2003, November). Learning on the go: Tips on getting
international research right. Quirk’s Marketing Research Review , 44.
Chapter 8 1. For an example of formal, academically sound scale development,
see Sung, Y., Choi, S. M., Ahn, H., & Song, Y. (2015, January).
Dimensions of luxury brand personality: Scale development and
validation. Psychology and Marketing, 32 (1), 121–132.
2. In some cases, it is recommended to use “Don’t know” instead of
“No opinion.” See Dolnicar, S., & Grun, B. (2012, September).
Including don’t know answer options in brand image surveys im-
proves data quality. International Journal of Marketing Research, 56 (1), 33–50.
3. See, for example, Yoon, S., & Kim, J. (2001, November/December).
Is the Internet more effective than traditional media? Factors affect-
ing the choice of media. Journal of Advertising Research, 41 (6),
53–60; Donthu, N. (2001, November/December). Does your web
site measure up? Marketing Management, 10 (4), 29–32; Finn, A.,
McFadyen, S., Hoskins, C., & Hupfer, M. (2001, Fall). Quantifying
the sources of value of a public service. Journal of Public Policy & Marketing, 20 (2), 225–239.
4. For research on the number of categories, see Wakita, T.,
Ueshima, N., & Noguchi, H. (2012). Psychological distance be-
tween categories in the Likert scale: Comparing different numbers
of options. Educational and Psychological Measurement, 72 (4),
533–546.
5. Edmondson, D., Edwards, Y., & Boyer, S. (2014, Fall). Likert
scales: A marketing perspective. International Journal of Business, Marketing, and Decision Sciences, 5 (2), 73–85.
6. See, for example, Wellner, A. S. (2002, February). The female per-
suasion. American Demographics, 24 (2), 24–29; Wasserman, T.
Z01_BURN3261_08_GE_NOTE.indd 467Z01_BURN3261_08_GE_NOTE.indd 467 17/08/16 2:13 pm17/08/16 2:13 pm

468 ENDNOTES
(2002, January 7). Color me bad. Brandweek, 43 (1), 2; Wilke, M.,
& Applebaum, M. (2001, November 5). Peering out of the closet.
Brandweek, 42 (41), 26–32.
7. Kaplanidou, K., & Vogt, C. (2010, September). The meaning
and measurement of a sport event experience among active sport
tourists. Journal of Sport Management, 24 (5), 544–566.
8. Other methods of brand image measurement have been found
to be comparable. See Driesener, C., & Romaniuk, J. (2006). Com-
paring methods of brand image measurement. International Journal of Market Research, 48 (6), 681–698.
9. Another way to avoid the halo effect is to have subjects rate
each stimulus on the same attribute and then move to the next at-
tribute. See Wu, B. T. W., & Petroshius, S. (1987). The halo effect
in store image management. Journal of the Academy of Marketing Science, 15 (1), 44–51.
10. The halo effect is real and used by companies to good advantage.
See, for example, Moukheiber, Z., & Langreth, R. (2001, December
10). The halo effect. Forbes, 168 (15), 66; Sites seeking advertising
(the paid kind). (2002, March 11). Advertising Age, 73 (10), 38.
11. Some authors recommend using negatively worded statements with
Likert scales to avoid the halo effect; however, recent evidence ar-
gues convincingly against this recommendation. See Swain, S. D.,
Weathers, D., & Niedrich, R. W. (2007, February). Assessing three
sources of misresponse to reversed Likert items. Journal of Market-ing Research, 45 (1), 116–131.
12. Garg, R. K. (1996, July). The influence of positive and negative
wording and issue involvement on responses to Likert scales in mar-
keting research. Journal of the Marketing Research Society, 38 (3),
235–246.
13. See, for example, Bishop, G. F. (1985, Summer). Experiments with
the middle response alternative in survey questions. Public Opinion Quarterly, 51 , 220–232; Schertizer, C. B., & Kernan, J. B. (1985,
October). More on the robustness of response scales. Journal of the Marketing Research Society, 27 , 262–282.
14. See also Duncan, O. D., & Stenbeck, M. (1988, Winter). No opinion
or not sure? Public Opinion Quarterly, 52 , 513–525; Durand, R. M.,
& Lambert, Z. V. (1988, March). Don’t know responses in survey:
Analyses and interpretational consequences. Journal of Business Research, 16 , 533–543.
15. Semon, T. T. (2001, October 8). Symmetry shouldn’t be goal for
scales. Marketing News, 35 (21), 9.
16. Semon, Symmetry shouldn’t be goal for scales.
17. Elms, P. (2000, April). Using decision criteria anchors to measure
importance among Hispanics. Quirk’s Marketing Research Review, 15 (4), 44–51.
18. Ashley, D. (2003, February). The questionnaire that launched a
thousand responses. Quirk’s Marketing Research Review. Retrieved
from http://www.quirks.com .
19. Scale development requires rigorous research. See, for example,
Churchill, G. A. (1979, February). A paradigm for developing better
measures of marketing constructs. Journal of Marketing Research, 16 , 64–73; Ram, S., & Jung, H. S. (1990). The conceptualization
and measurement of product usage. Journal of the Academy of Mar-keting Science, 18 (1), 67–76.
20. The topic of internal consistency of multiple-item measures is too
advanced for this basic textbook. Also, recent research touts single-
item measures in certain instances. See Bergkvist, L., & Rossiter,
J. (2007, May). The predictive validity of multiple-item versus
single-item measures of the same constructs. Journal of Marketing Research, 44 (2), 175–184.
21. For example, bogus recall was found negatively related to educa-
tion, income, and age but positively related to “yea-saying” and
attitude toward the slogan. See Glassman, M., & Ford, J. B. (1988,
Fall). An empirical investigation of bogus recall. Journal of the Academy of Marketing Science, 16 (3–4), 38–41; Singh, R. (1991).
Reliability and validity of survey research in marketing: The state
of the art, in R. L. King (Ed.), Marketing: Toward the twenty-first century, Proceedings of the Southern Marketing Association
(pp. 210–213); Pressley, M. M., Strutton, H. D., & Dunn, M. G.
(1991). Demographic sample reliability among selected telephone
sampling replacement techniques, in R. L. King (Ed.), Market-ing: Toward the twenty-first century, Proceedings of the Southern Marketing Association (pp. 214–219); Babin, B. J., Darden, W. R.,
& Griffin, M. (1992). A note on demand artifacts in marketing re-
search, in R. L. King (Ed.), Marketing: Perspectives for the 1990s, Proceedings of the Southern Marketing Association (pp. 227–230);
Dunipace, R. A., Mix, R. A., & Poole, R. R. (1993). Overcoming
the failure to replicate research in marketing: A chaotic explana-
tion, in Tom K. Massey, Jr. (Ed.), Marketing: Satisfying a diverse customerplace, Proceedings of the Southern Marketing Association
(pp. 194–197); Malawian, K. P., & Butler, D. D. (1994). The se-
mantic differential: Is it being misused in marketing research? in
R. Achrol & A. Mitchell (Eds.), Enhancing knowledge development in marketing, A.M.A. Educators' Conference Proceedings , 19.
22. Susan, C. (1994). Questionnaire design affects response rate. Mar-keting News, 28, H25; Sanchez, M. E. (1992). Effects of question-
naire design on the quality of survey data. Public Opinion Quarterly, 56 (2) , 206–217.
23. For a more comprehensive coverage of this topic, see Baker, M. J.
(2003, Summer). Data collection: Questionnaire design. Marketing Review, 3 (3), 343– 370.
24. Babble, E. (1990). Survey research methods (2nd ed.). Belmont,
CA: Wadsworth, pp. 131–132.
25. Hunt, S. D., Sparkman, R. D., & Wilcox, J. (1982, May). The pretest
in survey research: Issues and preliminary findings. Journal of Mar-keting Research, 26 (4), 269–273.
26. Lietz, P. (2010). Research into questionnaire design: A summary
of the literature. International Journal of Market Research, 52 (2),
249–272.
27. Dillman, D. A. (1978). Mail telephone surveys: The total design method. New York: Wiley.
28. Interested readers may wish to read Wood, R. T., & Williams, R. J.
(2007, February). ‘How much money do you spend on gambling?’
The comparative validity of question wordings used to assess gam-
bling expenditure. International Journal of Social Research Meth-odology, 10 (1), 63–77.
29. Loftus, E., & Zanni, G. (1975). Eyewitness testimony: The influ-
ence of the wording of a question. Bulletin of the Psychonomic Society, 5, 86–88.
30. For an alternative set of guidelines, see Webb, J. (2000, Winter).
Questionnaires and their design. The Marketing Review, 1 (2),
197–218.
31. Several other marketing research textbooks advocate question
focus. See Baker, M. J. (2008, February). Data collection: Ques-
tionnaire design do’s and don’ts. CRM Magazine, 12 (2), Special
section, 13.
32. Webb, Questionnaires and their design.
33. Ibid.
34. Question clarity must be achieved for respondents of different edu-
cation levels, ages, socioeconomic strata, and even intelligence; see
Noelle-Neumann, E. (1970, Summer). Wanted: Rules for word-
ing structured questionnaires. Public Opinion Quarterly, 34 (2),
191–201.
35. Webb, Questionnaires and their design.
Z01_BURN3261_08_GE_NOTE.indd 468Z01_BURN3261_08_GE_NOTE.indd 468 17/08/16 2:13 pm17/08/16 2:13 pm
ENDNOTES 469
36. For memory questions, it is advisable to have respondents reconstruct
specific events. See, for example, Cook, W. A. (1987, February–
March). Telescoping and memory’s other tricks. Journal of Adver-tising Research, 27 (1), RC5–RC8.
37. Baker, Data collection: Questionnaire design.
38. Ibid.
39. Peterson, R. A. (2000). Constructing effective questionnaires . Thou-
sand Oaks, CA: Sage, p. 58.
40. Webb, Questionnaires and their design.
41. Baker, Data collection: Questionnaire design.
42. Webb, Questionnaires and their design.
43. See, for example, More ways to build a better survey. (2008, May).
HR Focus, 85 (5), 13–14.
44. Brennan, M., Benson, S., & Kearns, Z. (2005). The effect of in-
troductions on telephone survey participation rates. International Journal of Market Research, 47 (1), 65–74.
45. There is some evidence that mention of confidentiality has a nega-
tive effect on response rates, so the researcher should consider not
mentioning it in the introduction even if confidentiality is in place.
See Brennan, Benson, & Kearns, The effect of introductions on tel-
ephone survey participation rates.
46. Screens can be used to quickly identify respondents who will not
answer honestly. See Waters, K. M. (1991, Spring–Summer). De-
signing screening questionnaires to minimize dishonest answers.
Applied Marketing Research, 31 (1), 51–53.
47. The Marketing Research Association offers recommendations and
model introduction, closing, and validation scripts on its website
( http://cmor.org/resp_coop_tools.htm ).
48. For recommended guidelines for introductions in B2B surveys,
see Durkee, A. (2005, March). First impressions are everything in
b-to-b telephone surveys. Quirk’s Marketing Research Review, 19 (3), 30–32.
49. While we advocate common sense, researchers are mindful of ques-
tion order effects. See, for instance, Laflin, L., & Hansen, M. (2006,
October). A slight change in the route. Quirk’s Marketing Research Review, 20 (9), 40–44.
50. Smith, R., Olah, D., Hansen, B., & Cumbo, D. (2003, November/
December). The effect of questionnaire length on participant re-
sponse rate: A case study in the U.S. cabinet industry. Forest Prod-ucts Journal, 53 (11/12), 33–36.
51. Webb, Questionnaires and their design.
52. Bethlehem, J. (1999/2000, Winter). The routing structure of ques-
tionnaires. International Journal of Market Research, 42 (1), 95–110.
53. Baker, Data collection: Questionnaire design.
54. At least one group-administered survey found that question
sequence had no effect on cooperation rate. See Roose, H., De
Lange, D., Agneessens, F., & Waege, H. (2002, May). Theatre audi-
ence on stage: Three experiments analysing the effects of survey
design features on survey response in audience research. Marketing Bulletin, 13 , 1–10.
55. They also represent new presentation and format considerations that
need to be researched. See, for example, Healey, B., Macpherson, T.,
& Kuijten, B., (2005, May). An empirical evaluation of three web
survey design principles. Marketing Bulletin, 2005, 16, Research
Note 2, 1–9; Christian, L. M., Dillman, D. A., & Smyth, J. D. (2007,
Spring). Helping respondents get it right the first time: The influ-
ence of words, symbols, and graphics in web surveys. Public Opin-ion Quarterly, 71 (1), 113–125.
56. Highly sophisticated questionnaire design systems have a great
many question formats and types in their libraries, and they some-
times have algorithms built into them to arrange the questions into
a logical format. See Jenkins, S., & Solomonides, T. (1999/2000,
Winter). Automating questionnaire design and construction. Inter-national Journal of Market Research, 42 (1), 79–95.
57. While very effective, “check all that apply” questions have recently
been found to be slightly less effective than forced choice or yes/
no question formats. See Smyth, J. D., Christian, L. M., & Dillman,
D. A. (2008). Does yes or no on the telephone mean the same as
check-all-that-apply on the web? Public Opinion Quarterly, 72 (1),
103–113.
58. At least one author says to not pretest is foolhardy; see Webb, Ques-
tionnaires and their design.
59. Some authors refer to pretesting as piloting the questionnaire, mean-
ing pilot testing the questionnaire. See Baker, Data collection: Ques-
tionnaire design.
60. Normally pretests are done individually, but a focus group could be
used. See Long, S. A. (1991, May 27). Pretesting questionnaires
minimizes measurement error. Marketing News, 25 (11), 12.
61. For a detailed description of the goals and procedures used in pre-
testing, see Czaja, R. (1998, May). Questionnaire pretesting comes
of age. Marketing Bulletin, 9 , 52–64.
62. For a comprehensive article on pretesting, see Presser, S., Couper,
M. P., Lessler, J. T., Martin, E., Martin, J., Rothgeb, J. M., & Singer, E.
(2004, Spring). Methods for testing and evaluating survey questions.
Public Opinion Quarterly, 68 (1), 109–130.
63. Berman, A. (2013, November). Tips for effective mobile surveying.
Quirk’s Marketing Research Review, 24 (11), 38–41.
Chapter 9 1. Statement by deputy U.S. commerce secretary Rebecca Blank on
release of data measuring 2010 census accuracy. (2012). Lanham,
United States, Lanham: Retrieved from http://ezproxy.lib.uwf.
edu/login?url=http://search.proquest.com/docview/1015154014?
accountid=14787 .
2. Wyner, G. A. (2001, Fall). Representation, randomization, and real-
ism. Marketing Research, 13 (3), 4–5.
3. Jackson, A., Pennay, D., Dowling, N., Coles-Janess, B., &
Christensen, D. (2014). Improving gambling survey research using
dual-frame sampling of landline and mobile phone numbers. Jour-nal of Gambling Studies, 30 , 291–307.
4. Sample frame error is especially a concern in business sam-
ples. See, for example, Macfarlene, P. (2002). Structuring and meas-
uring the size of business markets. International Journal of Market Research, 44 (1), 7–30.
5. Wyner, G. A. (2007, Spring). Survey errors. Marketing Research, 19 (1), 6–8.
6. Bradley, N. (1999, October). Sampling for Internet surveys: An
examination of respondent selection for Internet research. Journal of the Market Research Society, 41 (4), 387.
7. Hall, T. W., Herron, T. L., & Pierce, B. J. (2006, January). How
reliable is haphazard sampling? CPA Journal, 76 (1), 26–27.
8. The RANDBETWEEN (bottom, top) function in Microsoft
Excel returns a random integer number between 2 numbers that de-
fine the bottom and the top of the range.
9. See Tucker, C., Brick, J. M., & Meekins, B. (2007, Spring). House-
hold telephone service and usage patterns in the United Stated in
2004: Implications for telephone samples. Public Opinion Quar-terly, 71 (1), 3–22; Link, M. W., Battaglia, M. P., Frankel, M. R.,
Osborn, L., & Mokdad, A. H. (2008, Spring). A comparison of ad-
dress-based sampling (ABS) versus random-digit dialing (RDD) for
general population surveys. Public Opinion Quarterly, 72 (1), 6–27.
10. Random digit dialing is used by the major web traffic monitoring
companies. See Fatth, H. (2000, November 13). The metrics system.
Adweek, 41 (46), 98–102.
Z01_BURN3261_08_GE_NOTE.indd 469Z01_BURN3261_08_GE_NOTE.indd 469 17/08/16 2:13 pm17/08/16 2:13 pm

470 ENDNOTES
11. Tucker, C., Lepkowski, J. M., & Piekarski, L. (2002). The current
efficiency of list-assisted telephone sampling designs. Public Opin-ion Quarterly, 66 (3), 321–338.
12. Huang, E., Liu, T., & Wang, J. (2014). E-health videos on Chinese
hospitals' websites. International Journal of Healthcare Manage-ment, 7 (4), 273–280.
13. Economy is dependent on the number of clusters. See Zelin, A., &
Stubbs, R. (2005). Cluster sampling: A false economy? Interna-tional Journal of Market Research, 47 (5), 503–524.
14. See also Sudman, S. (1985, February). Efficient screening methods
for the sampling of geographically clustered special populations.
Journal of Marketing Research, 22 , 20–29.
15. Cronish, P. (1989, January). Geodemographic sampling in reader-
ship surveys. Journal of the Market Research Society, 31 (1), 45–51.
16. For a somewhat more technical description of cluster sampling,
see Carlin, J. B., & Hocking, J. (1999, October). Design of cross-
sectional surveys using cluster sampling: An overview with
Australian case studies. Australian and New Zealand Journal of Public Health, 23 (5), 546–551.
17. Academic global business researchers often use nonprobability
samples for cost savings. See Yang, Z., Wang, X., & Su, C. (2006,
December). A review of research methodologies in international
business. International Business Review, 15 (6), 601–617.
18. Thomas, J. S., Reinartz, W., & Kumar, V. (2004, July/August). Get-
ting the most out of all your customers. Harvard Business Review, 82 (7/8), 116–124.
19. Academic marketing researchers often use convenience samples of
college students. See Peterson, R. A. (2001, December). On the use
of college students in social science research: Insights from a second-
order meta-analysis. Journal of Consumer Research, 28 (3), 450–461.
20. Wyner, G. A. (2001, Fall). Representation, randomization, and real-
ism. Marketing Research, 13 (3), 4–5.
21. A variation of the snowball sample is found in Eaton, J., & Stru-
thers, C. W. (2002, August). Using the Internet for organizational
research: A study of cynicism in the workplace. CyberPsychology & Behavior, 5 (4), 305–313; university students were required to return
surveys completed by family, friends, or coworkers.
22. Browne, K. (2005, February). Snowball sampling: Using social
networks to research non-heterosexual women. Journal of Social Research Methodology, 8 (1), 47–60.
23. For an application of referral sampling, see Moriarity, R. T., Jr., &
Spekman, R. E. (1984, May). An empirical investigation of the in-
formation sources used during the industrial buying process. Jour-nal of Marketing Research, 21 (2), 137–147.
24. For an historical perspective and prediction about online sampling,
see Sudman, S., & Blair, E. (1999, Spring). Sampling in the twenty-
first century. Academy of Marketing Science, 27 (2), 269–277.
25. Internet surveys can access hard-to-reach groups. See Pro and con:
Internet interviewing. (1999, Summer). Marketing Research, 11 (2),
33–36.
26. Sample plans are useful wherever someone desires to draw a rep-
resentative group from a population. For an auditing example, see
Martin, J. (2004, August). Sampling made simple. The Internal Auditor, 61 (4), 21–23.
Chapter 10 1. One author refers to these attributes as “quality” and “quantity.”
See Hellebusch, S. J. (2006, September). Know sample quantity for
clearer results. Marketing News, 40 (15), 23–26.
2. Lenth, R. (2001, August). Some practical guidelines for effec-
tive sample size determination. The American Statistician, 55 (3),
187–193.
3. Williams, G. (1999, April). What size sample do I need? Australian and New Zealand Journal of Public Health, 23 (2), 215–217.
4. Cesana, B. M., Reina, G., & Marubini, E. (2001, November). Sam-
ple size for testing a proportion in clinical trials: A “two-step” proce-
dure combining power and confidence interval expected width. The American Statistician, 55 (4), 288–292.
5. This chapter simplifies a complex topic. See, for example, Williams,
What size sample do I need?
6. This chapter pertains to quantitative marketing research samples.
For qualitative research situations, see, for example, Christy, R., &
Wood, M. (1999). Researching possibilities in marketing. Qualita-tive Market Research, 2 (3), 189–196.
7. Frendberg, N. (1992, June). Increasing survey accuracy. Quirk’s Marketing Research Review . Retrieved from http://www.quirks.
com .
8. Frendburg (1992) states it simply: “Sampling error has the unique
distinction of being a measurable source of error in survey research.”
9. We realize that some researchers prefer to always use the sample
size formula that includes N ; however, since N does not affect sam-
ple size unless N is small (or n is large relative to N ), we have opted
for simplicity in using the sample size formula without N .
10. Xu, G. (1999, June). Estimating sample size for a descriptive study
in quantitative research. Quirk’s Marketing Research Review . Re-
trieved from http://www.quirks.com
11. For a similar but slightly different treatment, see Sangren, S. (1999,
January). A simple solution to nagging questions about survey, sam-
ple size and validity. Quirk’s Marketing Research Review . Retrieved
from http://www.quirks.com
12. For a different formula that uses the difference between two means,
see Minchow, D. (2000, June). How large did you say the sample
has to be? Quirk’s Marketing Research Review . Retrieved from
http://www.quirks.com
13. For a caution on this approach, see Browne, R. H. (2001, Novem-
ber). Using the sample range as a basis for calculating sample size
in power calculations. The American Statistician, 55 (4), 293–298.
14. See Shiffler, R. E., & Adams, A. J. (1987, August). A correction for
biasing effects of pilot sample size on sample size determination.
Journal of Marketing Research, 24 (3), 319–321.
15. For more information, see Lenth, Some practical guidelines for
effective sample size determination.
16. Other factors affect the final sample size; see, for example, San-
gren, S. (2000, April). Survey and sampling in an imperfect world.
Quirk’s Marketing Research Review . Retrieved from http://www.
quirks.com
17. See, for example Cesana, Reina, & Marubini, Sample size for test-
ing a proportion in clinical trials.
18. To see how simple cross-tabulations can increase the required
sample size, see Sangren, Survey and sampling in an imperfect
world.
19. Kupper, L. L., & Hafner, K. B. (1989, May). How appropriate
are popular sample size formulas? American Statistician, 43 (2),
101–195.
20. Bartlett, J., Kotrlik, J., & Higgins, C. (2001, Spring). Organizational
research: Determining appropriate sample size in survey research.
Information Technology, Learning, and Performance Journal, 19 (1), 43–50.
21. Hunter, J. E. (2001, June). The desperate need for replications. Jour-nal of Consumer Research, 28 (1), 149–158.
22. A different statistical analysis determination of sample size is
through use of estimated effect sizes. See, for example, Semon, T. T.
(1994). Save a few bucks on sample size, risk millions in opportu-
nity cost. Marketing News, 28 (1), 19.
Z01_BURN3261_08_GE_NOTE.indd 470Z01_BURN3261_08_GE_NOTE.indd 470 17/08/16 2:13 pm17/08/16 2:13 pm

ENDNOTES 471
23. Ball, J. (2004, February). Simple rules shape proper sample size.
Marketing News, 38 (2), 38.
24. Ibid.
25. There are some emerging guidelines to sample size in qualitative
research. See Marshall, B., Cardon, P., Poddar, A., & Fontenot, R.
(2013, Fall). Does sample size matter in qualitative research: A re-
view of qualitative interviews in IS research. Journal of Computer Information Systems, 54 (1), 11–22; Fugard, A., & Potts, H. (2015).
Supporting thinking on sample sizes for thematic analyses: A quan-
titative tool. International Journal of Social Research Methodology, 18 (6), 669–684.
26. See, for example, Hall, T. W., Herron, T. L., Pierce, B. J., & Witt,
T. J. (2001, March). The effectiveness of increasing sample size to
mitigate the influence of population characteristics in haphazard
sampling. Auditing, 20 (1), 169–185.
27. Savage, J. (2014). By the numbers: 10 online sample integrity tips.
Quirk’s Marketing Research Review, 28 (3), 26–28.
Chapter 11 1. In Chapter 10 you learned how to control sampling error by using
a sample size formula that determines the sample size required to
control for the amount of sample error (e) you are willing to accept.
2. For a breakdown of the types of nonsampling errors encountered
in business-to-business marketing research studies, see Lilien, G.,
Brown, R., & Searls, K. (1991, January 7). Cut errors, improve esti-
mates to bridge biz-to-biz info gap. Marketing News, 25 (1), 20–22.
3. Interviewer errors have been around for a long time. See
Snead, R. (1942). Problems of field interviewers. Journal of Mar-keting, 7 (2), 139–145.
4. Intentional errors are especially likely when data are supplied
by competitors. See Croft, R. (1992). How to minimize the problem
of untruthful response. Business Marketing Digest, 17 (3), 17–23.
5. To better understand this area, see Barker, R. A. (1987, July).
A demographic profile of marketing research interviewers. Journal of the Market Research Society, 29 , 279–292.
6. For some interesting theories on interviewer cheating, see Har-
rison, D. E., & Krauss, S. I. (2002, October). Interviewer cheating:
Implications for research on entrepreneurship in Africa. Journal of Developmental Entrepreneurship, 7 (3), 319–330.
7. Peterson, B. (1994, Fall). Insight into consumer cooperation.
Marketing Research, 6 (4), 52–53.
8. These problems are international in scope. For an example
from the United Kingdom, see Kreitzman, L. (1990, February 22).
Market research: Virgins and groupies. Marketing, 35–38.
9. Collins, M. (1997, January). Interviewer variability: A review
of the problem. Journal of the Market Research Society, 39 (1),
67–84.
10. See Flores-Macias, F., & Lawson, C. (2008, Spring). Effects of in-
terviewer gender on survey responses: Findings from a household
survey in Mexico. International Journal of Public Opinion Research, 20 (1), 100–110; Oksenberg, L., Coleman, L., & Cannell, C. F.
(1986, Spring). Interviewers' voices and refusal rates in telephone
surveys. Public Opinion Quarterly, 50 (1), 97–111.
11. Conrad, F. G., Broome, J. S., Benkí, J. R., Kreuter, F., Groves, R.
M., Vannette, D., & McClain, C. (2013). Interviewer speech and
success of survey invitations. Journal of the Royal Statistical Soci-ety, 176 (1), 191–210.
12. See, for example, Pol, L. G., & Ponzurick, T. G. (1989, Spring).
Gender of interviewer/gender of respondent bias in telephone sur-
veys. Applied Marketing Research, 29 (2), 9–13 or Dykema, J.,
Diloreto, K., Price, J. L., White, E., & Schaeffer, N. C. (2012, June).
ACASI gender-of-interviewer voice effects on reports to questions
about sensitive behaviors among young adults. Public Opinion Quarterly, 76 (2), 311–325.
13. See Hansen, K. M. (2007, Spring). The effects of incentive, inter-
view length, and interviewer characteristics on response rates in
a CATI study. International Journal of Public Opinion Research, 19 (1), 112–121; Olson, K., & Peytchev, A. (2007, Summer). Effect
of interviewer experience on interview pace and interviewer atti-
tudes. Public Opinion Quarterly, 71 (2), 273–286.
14. Guéguen, N., Stefan, J., Jacob, C., & Sobecki, M. (2014). She
wore a red/white flower in her hair: The effect of hair ornamenta-
tion on compliance with a survey request. Marketing Bulletin, 25 (1),
1–5.
15. McKendall, M., Klein, H., Levenburg, N., & de la Rosa, D. (2010,
Fall). College student cheating and perceived instructor fairness.
Journal of the Academy of Business Education, 11 , 14–32.
16. Sanchez, M. E. (1992, Summer). Effects of questionnaire design
on the quality of survey data. Public Opinion Quarterly, 56 (2),
206–217.
17. Kiecker, P., Nelson, J. E. 1996, April). Do interviewers follow tele-
phone survey instructions? Journal of the Market Research Society, 38 (2), 161–173.
18. Loosveldt, G., Carton, A., & Billiet, J. (2004). Assessment of survey
data quality: A pragmatic approach focused on interviewer tasks.
International Journal of Market Research, 46 (1), 65–82.
19. Epstein, W. M. (2006, January). Response bias in opinion polls and
American social welfare. Social Science Journal, 43 (1), 99–110.
20. Tourangeau, R., & Yan, T. (2007). Sensitive questions in surveys.
Psychological Bulletin, 133 (5), 859–883.
21. Preisendörfer, P., & Wolter, F. (2014, Spring). Who is telling the
truth? A validation study on determinants of response behavior in
surveys. Public Opinion Quarterly, 78 (1), 126–146.
22. Honomichl, J. (1991, June 24). Legislation threatens research by
phone. Marketing News, 25 (13), 4; Webster, C. (1991). Consumers'
attitudes toward data collection methods, in R. L. King (Ed.), Mar-keting: Toward the twenty-first century, Proceedings of the Southern Marketing Association, 220–224.
23. The Pew Research Center for the People & the Press (2012). As-
sessing the representativeness of public opinion surveys. Retrieved
from http://www.people-press.org/files/legacy-pdf/Assessing%
20the%20Representativeness%20of%20Public%20Opinion%20
Surveys.pdf
24. Arnett, R. (1990). Mail panel research in the 1990s. Applied Market-ing Research, 30 (2), 8–10.
25. Lind, L. H., Schober, M. F., Conrad, F. G., & Reichert, H. (2013,
Winter). Why do survey respondents disclose more when computers
ask the questions? Public Opinion Quarterly, 77 (4), 888–935.
26. One author refers to responses to questions on a survey as “hear-
say,” which includes potential for misunderstanding. See Semon, T.
(2003). Settle for personal truth vs. facts in surveys. Marketing News, 37 (2), 17.
27. Lynn, P., & Kaminska, O. (2012, Summer). The impact of mobile
phones on survey measurement error. Public Opinion Quarterly, 77 (2), 586–605.
28. Of course, eliminating the interviewer entirely may be an option.
See Horton, K. (1990, February). Disk-based surveys: New way to
pick your brain. Software Magazine, 10 (2), 76–77.
29. For early articles on interviewers and supervision, see Clarkson, E. P.
(1949, January). Some suggestions for field research supervisors.
Journal of Marketing, 13 (3), 321–329; Reed, V. D., Parker, K. G., &
Vitriol, H. A. (1948, January). Selection, training, and supervision
of field interviewers in marketing research. Journal of Marketing, 12 (3), 365–378.
Z01_BURN3261_08_GE_NOTE.indd 471Z01_BURN3261_08_GE_NOTE.indd 471 17/08/16 2:13 pm17/08/16 2:13 pm

472 ENDNOTES
30. See Fowler, F., & Mangione, T. (1990). Standardized survey inter-viewing: Minimizing interviewer-related error . Newbury Park, CA:
Sage.
31. There are advocates for interviewer certification in the United King-
dom. See Hemsley, S. (2000, August 17). Acting the part. Marketing Week, 23 (28), 37–40.
32. For an argument against interviewer standardization, see Gobo, G.
(2006, October). Set them free: Improving data quality by broaden-
ing the interviewer’s tasks. International Journal of Social Research Methodology, 9 (4), 279–301.
33. Tucker, C. (1983, Spring). Interviewer effects in telephone surveys.
Public Opinion Quarterly, 47 (1), 84–95.
34. See Childers, T., & Skinner, S. (1985, January). Theoretical and em-
pirical issues in the identification of survey respondents. Journal of the Market Research Society, 27 , 39–53; Finlay, J. L., & Seyyet, F. J.
(1988). The impact of sponsorship and respondent attitudes on re-
sponse rate to telephone surveys: An exploratory investigation, in
D. L. Moore (Ed.), Marketing: Forward motion, Proceedings of the Atlantic Marketing Association, 715–721; Goldsmith, R. E. (1987).
Spurious response error in a new product survey, in J. J. Cronin,
Jr., & M. T. Stith (Eds.), Marketing: Meeting the Challenges of the 1990s, Proceedings of the Southern Marketing Association, 172–175; Downs, P. E., & Kerr, J. R. (1982). Recent evidence on
the relationship between anonymity and response variables, in J. H.
Summey, B. J. Bergiel, & C. H. Anderson (Eds.), A spectrum of contemporary marketing ideas, Proceedings of the Southern Mar-keting Association , 258–264; Glisan, G., & Grimm, J. L. (1982).
Improving response rates in an industrial setting: Will traditional
variables work? in J. H. Summey, B. J. Bergiel, & C. H. Anderson
(Eds.), A spectrum of contemporary marketing ideas, Proceedings of the Southern Marketing Association , 265–268; Taylor, R. D.,
Beisel, J., & Blakney, V. (1984). The effect of advanced notifica-
tion by mail of a forthcoming mail survey on the response rates,
item omission rates, and response speed, in D. M. Klein & A. E.
Smith (Eds.), Marketing comes of age, Proceedings of the Southern Marketing Association , 184–187; Friedman, H. H. (1979, Spring).
The effects of a monetary incentive and the ethnicity of the spon-
sor’s signature on the rate and quality of response to a mall survey.
Journal of the Academy of Marketing Science, 95–100; Goldstein,
L., & Friedman, H. H. (1975, April). A case for double postcards
in surveys. Journal of Advertising Research, 43–49; Hubbard, R.,
& Little, E. L. (1988, Fall). Cash prizes and mail response rates:
A threshold analysis. Journal of the Academy of Marketing Science, 42–44; Childers, T. L., & Ferrell, O. C. (1979, August). Response
rates and perceived questionnaire length in mail surveys. Journal of Marketing Research, 429–431; Childers, T. L., Pride, W. M., &
Ferrell, O. C. (1980, August). A reassessment of the effects of ap-
peals on response to mail surveys. Journal of Marketing Research, 365–370; Steele, T., Schwendig, W., & Kilpatrick, J. (1992, March/
April). Duplicate responses to multiple survey mailings: A problem?
Journal of Advertising Research, 26–33; Wilcox, J. B. (1977, No-
vember). The interaction of refusal and not-at-home sources of non-
response bias. Journal of Marketing Research , 592–597.
35. An opposite view is expressed by Pruden and Vavra, who contend
that it is important to identify participants and provide some sort
of follow-up acknowledgment of their participation in the survey.
Pruden, D. R., & Vavra, T. G. (2000, Summer). Customer research,
not marketing research. Marketing Research, 12 (2), 14–19.
36. See, for example, Lynn, P. (2002, Autumn). The impact of incen-
tives on response rates to personal interview surveys: Role and per-
ceptions of interviewers. International Journal of Public Opinion Research, 13 (3), 326–336.
37. A comparison on nonresponse errors under different incentives is
offered by Barsky, J. K., & Huxley, S. J. (1992, December). A cus-
tomer-survey tool: Using the “quality sample.” The Cornell Hotel and Restaurant Administration Quarterly, 33 (6), 18–25.
38. Derham, P. (2006, October). Increase response rates by increasing
relevance. Quirk’s Marketing Research Review, 20 (9), 26–30.
39. Screening questionnaires can also be used. See Waters, K. M. (1991,
Spring/Summer). Designing screening questionnaires to minimize
dishonest answers. Applied Marketing Research, 31 (1), 51–53.
40. Coleman, L. G. (1991, January 7). Researchers say nonresponse is
single biggest problem. Marketing News, 25 (1), 32–33.
41. Landler, M. (1991, February 11). The “bloodbath” in market re-
search. Business Week, 72, 74.
42. Baim, J. (1991, June). Response rates: A multinational perspective.
Marketing & Research Today, 19 (2), 114–119.
43. Dutwin, D., Loft, J. D., Darling, J. E., Holbrook, A. L., Johnson, T. P.,
Langley, R. E., Lavrakas, P. J., Olson, K., & Peytcheva, E. (2015,
Summer). Current knowledge and considerations regarding survey
refusals: Executive summary of the AAPOR task force report on
survey refusals. Public Opinion Quarterly, 79 (2), 411–419.
44. Groves, R. M., Couper, M. P., Presser, S., Singer, E., Tourangeau,
R., Acosta, G. P., & Nelson, L. (2006). Experiments in producing
nonresponse bias. Public Opinion Quarterly, 70 (5), 720–736.
45. Tourangeau, R., & Yan, T. (2007, September). Sensitive questions in
surveys. Psychological Bulletin, 133 (5), 859–883.
46. For an interesting attempt to explain participation in surveys, see
Heerwegh, D., & Loosveldt, G. (2009, July). Explaining the inten-
tion to participate in a web survey: A test of the theory of planned
behavior. International Journal of Social Research Methodology, 12 (3), 181–195.
47. Eisenfeld, B. (2011, January). Play it forward. Quirk’s Marketing Research Review, 25 (1), 58–61.
48. Vogt, C. A., & Stewart, S. I. (2001). Response problems in a vaca-
tion panel study. Journal of Leisure Research, 33 (1), 91–105.
49. Suresh, N., & Conklin, M. (2009, July). Designed to engage. Quirk’s Marketing Research Review, 24 (7), 34–41. See also Peytchev, A.
(2009, Spring). Survey break-off. Public Opinion Quarterl y, 73 (1),
74–97.
50. Some authors use the term unit nonresponse to refer to item omis-
sions. See, for example, Hudson, D., Seah, L., Hite, D., & Haab, T.
(2004). Telephone presurveys, self-selection, and nonresponse bias
to mail and Internet surveys in economic research. Applied Econom-ics Letters, 11 (4), 237–240.
51. Shoemaker, P. J., Eichholz, M., & Skewes, E. A. (2002, Summer).
Item nonresponse: Distinguishing between don’t know and refuse.
International Journal of Public Opinion Research, 14 (2), 193–201.
52. Vicente, P., Reis, E., & Santos, M. (2009). Using mobile phones
for survey research: A comparison with fixed phones. International Journal of Market Research, 51 (5), 613–633.
53. The American Association for Public Opinion Research (2015).
Standard Definitions; Final Dispositions of Case Codes and Out-come Rates for Surveys , 14.
54. Frankel, L. R. (1982). Special report on the definition of response rates . Port Jefferson, NY: Council of American Survey Research
Organizations.
55. The CASRO formula pertains to telephone surveys. For web-based
surveys, see Bowling, J. M., Rimer, B. K., Lyons, E. J., Golin, C.
E., Frydman, G., & Ribisl, K. M. (2006, November). Methodologic
challenges of e-health research. Evaluation and Program Planning, 29 (4), 390–396.
56. Data quality issues endemic in marketing. (2007, October). Data Strategy, 3 (8), 10.
Z01_BURN3261_08_GE_NOTE.indd 472Z01_BURN3261_08_GE_NOTE.indd 472 17/08/16 2:13 pm17/08/16 2:13 pm

ENDNOTES 473
57. For yea-saying and nay-saying, see Bachman, J. G., & O’Malley, P. M.
(1985, Summer). Yea-saying, nay-saying, and going to extremes:
Black–white differences in response styles. Public Opinion Quar-terly, 48 , 491–509; Greenleaf, E. A. (1992, May). Improving rating
scale measures by detecting and correcting bias components in some
response styles. Journal of Marketing Research, 29 (2), 176–188.
58. Fisher, S. (2007). How to spot a fake. Quirk’s Marketing Research Review, 21 (1), 44.
59. Speeders are not necessarily straightliners. See Professional test tak-
ers (2008, Spring). Marketing Research, 20 (1), 4.
60. Tellis, G. J., & Chandrasekaran, D. (2010). Extent and impact of
response biases in cross-national survey research. International Journal of Research in Marketing, 27 , 329–341.
61. ESOMAR. (2012). 28 questions to help buyers of online samples.
Retrieved from https://www.esomar.org/knowledge-and-standards/
research-resources/28-questions-on-online-sampling.php .
Chapter 12 1. It is important for the researcher and client to have a partnership dur-
ing data analysis. See, for example, Fitzpatrick, M. (2001, August).
Statistical analysis for direct marketers—in plain English. Direct Marketing, 64 (4), 54–56.
2. The use of descriptive statistics is sometimes called “data reduc-
tion,” although some authors term any appropriate analysis that
makes sense of data “data reduction.” See Vondruska, R. (1995,
April). The fine art of data reduction. Quirk’s Marketing Research Review , online archive.
3. Some authors argue that central tendency measures are too sterile.
See, for example, Pruden, D. R., & Vavra, T. G. (2000, Summer).
Customer research, not marketing research. Marketing Research, 12 (2), 14–19.
4. For an illustrative article on central tendency measures used
in business valuation, see Sellers, K., Yingping, H., & Campbell, S.
(2008, January/February). Measures of central tendency in business
valuation. Value Examiner , 7–18.
5. Gutsche, A. (2001, September 24). Visuals make the case.
Marketing News, 35 (20), 21–23.
6. Some guidelines are drawn from Ehrenberg, A. (2001, Winter).
Data, but no information. Marketing Research, 13 (2), 36–39.
7. The 95% level is standard in academic research and com-
monly adopted by practitioners; however, some authors prefer to
use the “probability” of 1 minus the discovered significance level of
a finding being true. See Zucker, H. (1994). What is significance?
Quirk’s Marketing Research Review , electronic archive.
8. It has been well documented that tests of statistical significance are
often misused in the social sciences, including the field of market-
ing research. Critics note that researchers endow the tests with more
capabilities than they actually have and rely on them as the sole ap-
proach for analyzing data (Sawyer & Peter, 1983). Other critics note
that combining p values with alpha levels in the often used model
p ≤ α = significance is inappropriate since the two concepts arise
from incompatible philosophies (Hubbard & Bayarri, 2003). Users
of statistical tests should be familiar with these arguments and other
writings noting misinterpretations of statistical significance testing
(Carver, 1978). See Sawyer, A. G., & Peter, J. P. (1983, May). The
significance of statistical significance tests in marketing research.
Journal of Marketing Research, 20 , 122–133; Hubbard, R., &
Bayarri, M. J. (2003, August). Confusion over measures of evi-
dence ( p ’s) versus errors (α’s) in classical statistical testing (with
comments). The American Statistician, 57 , 171–182; and Carver,
R. P. (1978, August). The case against statistical significance testing.
Harvard Educational Review, 48 , 278–399.
9. Some disciplines, such as psychology and medicine, encourage
their researchers to refrain from performing hypothesis testing and
to report confidence intervals instead. See Fidler, F., Cumming,
G., Burgman, M., & Thomason, N. (2004, November). Statistical
reform in medicine, psychology and ecology. Journal of Socio-Economics, 33 (5), 615–630; or Fidler, F., Thomason, N., Cumming,
G., Finch, S., & Leeman, J. (2004, February). Research article edi-
tors can lead researchers to confidence intervals, but can’t make
them think: Statistical reform lessons from medicine. Psychological Science, 15 (2), 119–126.
Chapter 13 1. One author considers t tests (differences tests) to be one of the most
important statistical procedures used by marketing researchers. See
Migliore, V. T. (1996). If you hate statistics … Quirk’s Marketing Research Review . Retrieved from http://www.quirks.com
2. For a contrary view, see Mazur, L. (2000, June 8). The only truism
in marketing is they don’t exist. Marketing, 20.
3. Unfortunately, the nature of statistical significance is not
agreed to: See Hubbard, R., & Armstrong, J. S. (2006). Why we
don’t really know what statistical significance means: Implications
for educators. Journal of Marketing Education, 28 (2), 114–120.
4. Meaningful difference is sometimes called “practical signifi-
cance.” See Thompson, B. (2002, Winter). “Statistical,” “practical,”
and “clinical”: How many kinds of significance do counselors need
to consider? Journal of Counseling and Development, 30 (1), 64–71.
5. This is common but controversial. See Ozgur, C., & Strasser, S.
(2004). A study of the statistical inference criteria: Can we agree
on when to use z versus t ? Decision Sciences Journal of Innovative Education, 2 (2), 177–192.
6. For some cautions about differences tests, see Helgeson, N.
(1999). The insignificance of significance testing. Quirk’s Market-ing Research Review , electronic archive.
7. Fulgoni, G., & Lella, A. (2014). Is your digital marketing
strategy in sync with Latino-user behavior? Journal of Advertising Research, 54 (3), 255–258.
8. Hellebusch, S. J. (2001, June 4). One chi square beats two z tests.
Marketing News, 35 (12), 11, 13.
9. For illumination, see Burdick, R. K. (1983, August). State-
ment of hypotheses in the analysis of variance. Journal of Marketing Research, 20 (3), 320–324.
10. Tellis, G. J., Yin, E., & Bell, S. (2009). Global consumer innovative-
ness: Cross-country differences and demographic commonalities.
Journal of International Marketing, 2 (17), 1–22.
11. For an example of the use of paired samples t tests, see Ryan, C., &
Mo, X. (2001, December). Chinese visitors to New Zealand demo-
graphics and perceptions. Journal of Vacation Marketing, 8 (1), 13–27.
Chapter 14 1. For elaboration and an example, see Semon, T. (1999, August). Use
your brain when using a Chi-square. Marketing News, 33 (16), 6.
2. Garee, M. (1997, September). Statistics don’t lie if you know what
they're really saying. Marketing News, 31 (9), 11.
3. Correlation is sensitive to the number of scale points, especially
in instances when variables have fewer than 10 scale points. See
Martin, W. (1978, May). Effects of scaling on the correlation coef-
ficient: Additional considerations. Journal of Marketing Research, 15 (2), 304–308.
4. For a more advanced treatment of scatter diagrams, see Goddard,
B. L. (2000, April). The power of computer graphics for compara-
tive analysis. The Appraisal Journal, 68 (2), 134–141.
Z01_BURN3261_08_GE_NOTE.indd 473Z01_BURN3261_08_GE_NOTE.indd 473 17/08/16 2:13 pm17/08/16 2:13 pm

474 ENDNOTES
5. Pathak, S. (2013, September 30). Fans and brands. Advertising Age, 84 (34), 18.
6. It is not advisable to use cross-tabulations analysis with Chi-
square when there are cases of cell frequencies of fewer than five
cases. See Migliore, V. (1998). Quirk’s Marketing Research Review ,
electronic archive.
7. For advice on when to use Chi-square analysis, see Hellebush,
S. J. (2001, June 4). One chi square beats two z tests. Marketing News, 35 (12), 11, 13.
8. An alternative view is that the researcher is testing multiple
cases of percentage differences (analogous to multiple independ-
ent group means tests) in a cross-tabulation table, and use of the
Chi-square test compensates for Type I error that reduces the confi-
dence level. See Neal, W. (1989, March). The problem with multiple
paired comparisons in crosstabs. Marketing Research, 1 (1), 52–54.
9. For a more technical explanation of contingency table analy-
sis, see Anawis, M. (2013, August). Contingency tables: A special
class of analysis. Scientific Computing, 23–25.
10. Mehta, R., Sharma, N. K., & Swami, S. (2013). A typology of Indian
hypermarket shoppers based on shopping motivation. International Journal of Retail and Distribution Management, 42 (1), 40–55.
11. See also Gibson, L. (2007). Irreverent thoughts: Just what are cor-
relation and regression? Marketing Research, 19 (2), 30–33.
12. For a great many such “spurious” correlations that illustrate the ab-
surdity of attributing cause and effect, see http://www.tylervigen.
com/spurious-correlations
Chapter 15 1. At least one marketing researcher thinks that regression analysis is
so complex that it actually clouds reality. See Semon, T. T. (2006).
Complex analysis masks real meaning. Marketing News, 40 (12), 7.
2. There are, of course, other and more acceptable ways of identifying
outliers. However, our approach relates to the graphical presentation
we have used for visualizing linear relationships existing in correla-
tions and regression. At best, our approach simply introduces stu-
dents to outlier analysis and helps them identify the most obvious
cases.
3. Semon, T. (1999, June 23). Outlier problem has no practical
solution. Marketing News, 31 (16), 2.
4. A well-known marketing academic has recommended graph-
ing to researchers: Zinkhan, G. (1993). Statistical inference in ad-
vertising research. Journal of Advertising, 22 (3), 1.
5. For more sophisticated handling of outliers, see Clark, T. (1989,
June). Managing outliers: Qualitative issues in the handling of
extreme observations in marketing research. Marketing Research, 2 (2), 31–48.
6. For more information, see, for example, Grapentine, T. (1997, Fall).
Managing multicollinearity. Marketing Research, 9 (3), 11–21, and
Mason, R. L., Gunst, R. F., & Webster, J. T. (1986). Regression
analysis and problems of multicollinearity in marketing models: Di-
agnostics and remedial measures. International Journal of Research in Marketing, 3 (3), 181–205.
7. For a graphical presentation, see Stine, R. (1995, February). Graphi-
cal interpretation of variance inflation factors. The American Statis-tician, 49 (1), 53–56.
8. For alternatives see Wang, G. (1996, Spring). How to handle
multicollinearity in regression modeling, The Journal of Business Forecasting, 14 (4), 23–27.
9. Sabate, F., Bergegal-Mirabent, J., Canabate, A., & Levherz, P. R.
(2014). Factors influencing popularity of branded content in Face-
book fan pages, European Management Journal, 32(6) , 1001–1011.
10. https://en.wikipedia.org/wiki/Road_rage
11. Ge, Y., Qu, W., Jiang, C., Du, F., Sun., X., & Xhang, K. (2014).
The effect of stress and personality on dangerous driving behav-
ior among Chinese drivers. Accident Analysis and Prevention, 73 ,
34–40.
12. Cano, L. Z., Sandoval, E. C., & Urbina, M. (2012). Proposals for
marketing strategies for optical centers based on the consumer,
Global Conference on Business and Finance Proceedings, 7 (1),
601–606.
13. Our description pertains to “forward” stepwise regression. We admit
that this is a simplification of stepwise multiple regression.
14. See, for example, Kennedy, P. (2005, Winter). Oh no! I got the
wrong sign! What should I do? Journal of Economic Education, 36 (1), 77–92.
15. We admit that our description of regression is introductory. Two
books that expand our description are Lewis-Beck, M. S. (1980).
Applied regression : An introduction . Sage Publications, Newbury
Park, CA; Schroeder, L. D., Sjoffquist, D. L., & Stephan, P. E.
(1986). Understanding regression analysis: An introductory guide. Sage Publications, Newbury Park, CA.
16. For readable treatments of problems encountered in multiple regres-
sion applied to marketing research, see Mullet, G. (1994, October).
Regression, regression. Quirk’s Marketing Research Review , elec-
tronic archive; Mullet, G. (1998, June). Have you ever wondered….
Quirk’s Marketing Research Review, electronic archive; Mullet, G.
(2003, February). Data abuse. Quirk’s Marketing Research Review ,
electronic archive.
17. Regression analysis is commonly used in academic marketing re-
search. Here are some examples: Callahan, F. X. (1982, April/
May). Advertising and profits 1969–1978. Journal of Advertising Research, 22(2), 17–22; Dubinsky, A. J., & Levy, M. (1989, Sum-
mer). Influence of organizational fairness on work outcomes of
retail salespeople. Journal of Retailing, 65(2) , 221–252; Frieden,
J. B., & Downs, P. E. (1986, Fall). Testing the social involvement
model in an energy conservation context. Journal of the Academy of Marketing Science, 14(3) , 13–20; and Tellis, G. J., & Fornell, C.
(1988, February). The relationship between advertising and product
quality over the product life cycle: A contingency theory. Journal of Marketing Research, 25(1) , 64–71. For an alternative to regres-
sion analysis, see Quaintance, B. S., & Franke, G. R. (1991). Neural
networks for marketing research. In Robert L. King, ed., Marketing:
Toward the twenty-first century. Proceedings of the Southern Mar-keting Association (1991), 230–235.
18. Taken from Bruning, E. R., Kovacic, M. L., & Oberdick, L. E.
(1985). Segmentation analysis of domestic airline passenger mar-
kets. Journal of the Academy of Marketing Science, 13 (1), 17–31.
Chapter 16 1. Ewing, T. (2015, June). Why the research industry has reasons to
be cheerful. Quirk’s Marketing Research Review . Retrieved from
http://www.quirks.com/articles/2015/20150610.aspx?searchID=
1430763919&sort=7&pg=2
2. De Ruyck, T., & Willems, A. (2015, July 27). The memefica-
tion of insights. Retrieved from http://www.greenbookblog.org/
2015/07/27/the-memefication-of-insights
3. Macer, T., & Wilson, S. (2015, July). Highlights from the Focus-
Vision 2014 Annual MR Technology Report. Quirk’s Marketing Research Review . Retrieved from http://www.quirks.com/articles/
2015/20150609.aspx?searchID=1430763919&sort=7&pg=2
4. Based on personal communications with the authors and Michael
Lotti. Originally published in Burns, A., & Bush, R. (2005). Market-ing research: Online research applications (4th ed.). Upper Saddle
River, NJ: Prentice Hall, p. 580.
Z01_BURN3261_08_GE_NOTE.indd 474Z01_BURN3261_08_GE_NOTE.indd 474 17/08/16 2:13 pm17/08/16 2:13 pm

ENDNOTES 475
5. Rohde, J. A. (2012, May). Three steps to better research pres-
entations. Retrieved from Quirk’s e-newsletter at http://www.quirks.
com
6. Jameson, D. A. (1993, June). The ethics of plagiarism:
How genre affects writers' use of source materials. The Bulletin, 2, 18–27.
7. Imperiled copyrights. (1998, April 15). New York Times , A24.
8. Fink, A. (2003). How to report on surveys (2nd ed.). Thousand
Oaks, CA: Sage, p. 35.
9. The American Heritage Dictionary of the English Language
(4th ed.) (2000). Boston: Houghton-Mifflin. Retrieved May 24,
2005, from http://www.dictionary.com
10. American Heritage Dictionary. Retrieved May 24, 2005, from
http://www.dictionary.com
11. See Section A.7, Marketing Research Association’s Code of Mar-
keting Research Standards. Retrieved June 7, 2012, from http://
www.marketingresearch.org/standards
12. Ober, S. (1998). Contemporary business communication (3rd ed.).
Boston: Houghton Mifflin, p. 121.
13. Tufte, E. R. (1983). The visual display of quantitative information .
Cheshire, CT: Graphics Press.
14. Based on personal conversation with the authors and Research Now’s Kartik Pashupati following a discussion of terms used by
marketing research practitioners on March 9, 2012.
15. Donaldson, C. (2015, April). Dear PowerPoint. Quirk’s Marketing Research Review . Retrieved from http://www.quirks.com/articles/
2015/20150426-1.aspx
16. Kelly, B. (2015). Want foresight from Insight? Part 2: An interview with
Gongos' Greg Heist. Retrieved from http://www.innovationexcellence.
com/blog/2015/07/05/foresight-from-isight/?utm_campaign=
Innovate+%40TBD+Festival&utm_content=17857989&utm_
medium=social&utm_source=twitter&Itemid=92
17. Personal communication with Jim McConnell, Director of Con-
sumer Insights, MARC USA, October 25, 2015.
18. Chakravarty, R., & Gudding, L. (2013, May). Activating segmenta-
tion through storytelling. Quirk’s Marketing Research Review . Re-
trieved from http://www.quirks.com/articles/2013/20130507.aspx?
searchID=1431741196&sort=7&pg=1
19. Tufte, E. (2001). The visual display of quantitative information (2nd
ed.). Cheshire, CT: Graphics Press.
20. Macer, T., & Wilson, S. (2015, July). Highlights from the Focus-
Vision 2014 Annual MR Technology Report. Quirk’s Marketing Research Review . Retrieved from http://www.quirks.com/articles/
2015/20150609.aspx?searchID=1430763919&sort=7&pg=2
21. Kelly, B. (2015). Pulling wisdom from abundant data—Part 1: An
interview with Gongos' Greg Heist. Retrieved from http://www.
innovationexcellence.com/blog/2015/06/01/pulling-wisdom-from-
abundant-data-part-1-an-interview-with-gongos%E2%80%99-
greg-heist
22. De Ruyck, T., & Willems, A. (2015, July 27). The memefication
of insights. GreenBook , Retrieved from http://www.greenbookblog.
org/2015/07/27/the-memefication-of-insights
23. Middlemiss, M. (2015). Sharing good ideas. Retrieved from http://
www.aqr.org.uk/a/20150415-sharing-good-ideas
Z01_BURN3261_08_GE_NOTE.indd 475Z01_BURN3261_08_GE_NOTE.indd 475 17/08/16 2:13 pm17/08/16 2:13 pm

A01_MISH4182_11_GE_FM.indd 6 10/06/15 11:46 am
This page intentionally left blank

NAME INDEX 477
Derham, P., 298 n 38
Diehl, P. L., 106 n 19
Dillman, D. A., 217 n 27, 229 n 57
DiSciullo, M., 164 n 66
Donaldson, C., 452 n 15
Donnely, T., 160 n 52
Dooley, R., 164 n 71
Dowling, N., 240 n 3
Drake, P. D., 119 n 9
Drapeau, T., 164 n 66
Driesener, C., 210 n 8
Drummond-Dunn, D., 76 n 9
Du, F., 419 n 11
DuPont, T. D., 184 n 34
Durkee, A., 224 n 48
Dutwin, D., 301 n 43
E Eaton, J., 256 n 21
Edmondson, D., 209 n 5
Edwards, Y., 209 n 5
Eichholz, M., 301 n 51
Eilis, S., 183 n 33
Eisenberger, N., 163 n 65
Eisenfeld, B., 301 n 47
Elms, P., 214 n 17
Epstein, W. M., 293 n 19
Esterl, M., 102 n 13, 102 n 14
Evans, J. R., 119 n 10
Ewing, T., 434 n 1
Ezzy, D., 144 n 1
F Fell, D., 192 n 57
Fellman, M. W., 146 n 8
Fidler, F., 340
Fielder, E., 178 n 9, 185 n 35, 192
Fink, A., 438 n 8
Fink, E., 432 – 433
Fisher, S., 307 n 58
Fitzsimmons, C., 135 n 26
Fletcher, K., 187 n 40
Flores Letelier, M., 160 n 50
Flores-Macias, F., 291 n 10
Fontenot, R., 283 n 25
Fowler, F., 298 n 30
Frankel, L. R., 302 n 54
Frazier, D., 189 n 51
Frendberg, N., 266 n 7, 267 n 8
Fricker, S., 180 n 23
Frost-Norton, T., 183 n 32
Fulgoni, G., 195 n 61, 357 n 7
G Galesic, M., 180 n 23
Gallup, G., 50 n 3
Garee, M., 382 n 2
Garg, R. K., 211 n 12
Bush, R., 156 n 40
Bush, R. F., 84 n 17
C Caeyers, B., 183 n 29
Calder, B., 160 n 50
Calder, B. J., 105 n 18
Campbell, D. T., 105 n 17
Campbell, S., 136 n 28
Canabate, A., 414 n 9
Cano, L. Z., 420 n 12, 427 n 12
Cardon, P., 283 n 25
Carlin, J. B., 249 n 16
Carton, A., 293 n 18
Cesana, B. M., 264 n 4
Chakravarty, R., 454 n 18
Chalmers, N., 183 n 29
Chandrasekaran, D., 309 n 60
Chavez, J., 107 n 21
Chen, C., 98 n 9
Childers, T., 298 n 34
Christensen, D., 240 n 3
Christian, L. M., 229 n 57
Chronish, P., 249 n 15
Churchill, G. A., 214 n 19
Churchill, G. A., Jr., 107 n 22
Cisnero, K., 114 – 115
Clark, A., 144 n 2
Clark, T., 408 n 5
Clarkson, E. P., 296 n 29
Cobanouglu, C., 189 n 44
Coleman, L. G., 300 n 40
Coles-Janess, B., 240 n 3
Collins, M., 291 n 9
Comer, P., 262 – 263
Conklin, M., 301 n 49
Conon, J., 158 n 46
Conrad, F. G., 291 n 11, 294 n 25
Couper, M. P., 175 n 6, 301 n 44
Crupi, A., 163 n 64
Cumbo, D., 224 n 50
Cumming, G., 340
Cuneo, A. Z., 180 n 18
Curtin, R., 174 n 4
Cusumano, L., 145 n 5
D Darling, J. E., 301 n 43
Davies, H., 159 n 48
Davis, J., 156 n 39
De Bruijne, M., 189 n 45
de la Pena, A., 158 n 44
de la Rosa, D., 292 n 15
De Ruyck, T., 434 n 2, 455 n 22
De Weerdt, J., 183 n 29
De Wulf, K., 236 – 237
Dean, D., 163 n 62
Del Vecchio, E., 148 n 16
Delaurentis, T., 98 n 9
DePaulo, P. J., 188 n 42
A Acosta, G. P., 301 n 44
Adler, L., 71
Albaum, G. S., 82 n 13
Anawis, M., 396 n 9
Anderson, R. C., 192 n 57
Armstrong, G., 36
Arnett, R., 293 n 24
Ashley, D., 214 n 18
Austin, M., 158 n 47
B Babble, E., 216 n 24
Baim, J., 300 n 42
Baker, M. J., 67 , 216 n 23, 220 n 31
Ball, J., 279 n 23
Barabba, V. P., 41 n 20
Barsky, J. K., 298 n 37
Bartels, R., 51 n 7
Bartlett, J., 278 n 20
Bearden, W. O., 82 n 15
Bell, S., 367 n 10
Benkí, J. R., 291 n 11
Bennett, P. D., 37 n 13
Benson, S., 186 n 37, 223 n 44
Bergegal-Mirabent, J., 414 n 9
Bergman, M., 437
Berlamino, C., 153 n 33
Berman, A., 229 n 63
Berman, B., 119 n 10
Berstell, G., 39 n 16
Bethlehem, J., 225 n 52
Billiet, J., 293 n 18
Blades, F., 406 – 407
Blair, E., 256 n 24
Blyth, B., 174 n 3
Boitnott, J., 95 n 3
Bonoma, T. V., 96 n 8
Bos, R., 187 n 39
Bourque, L., 178 n 9, 185 n 35, 192
Bowen, S. A., 98 n 10
Bowers, D., 55 n 12–14
Boyer, S., 209 n 5
Bradley, N., 241 n 6
Breisach, C., 66 – 67
Brennan, L., 107 n 20
Brennan, M., 186 n 37, 223 n 44
Brereton, M., 55 n 12–14
Brick, J. M., 245 n 9, 245 n 11
Brock, J. K., 192 n 54
Brogdon, T., 156 n 38
Bronner, F., 176 n 8, 180 n 14, 187 n 41
Brooks, K., 195 n 62
Broome, J. S., 291 n 11
Brown, S., 192 n 53
Browne, K., 256 n 22
Bryson, J., 350 – 351
Burgman, M., 340
Burns, A., 156 n 40
Burns, A. C., 84 n 17
477
Name Index
Z02_BURN3261_08_GE_NIDX.indd 477Z02_BURN3261_08_GE_NIDX.indd 477 24/08/16 3:38 pm24/08/16 3:38 pm

478 NAME INDEX
Lohr, S., 116 n 1
Lonnie, K., 151 n 27
Loosveldt, G., 293 n 18, 301 n 46
Lotti, M., 435 n 4
Lugtig, P., 180 n 22
Lynn, P., 295 n 27, 298 n 36
M Macer, T., 174 n 5, 180 n 16, 434 n 3,
455 n 20
Mackey, P., 180 n 20
Malder, A., 193 n 60
Malhotra, N., 71 n 2, 96 n 7, 171 n 1
Mangione, T., 298 n 30
Mariampolski, H., 86 n 19, 148 n 14
Maronick, T., 179 n 12
Marshall, B., 283 n 25
Marshall, S., 164 n 66
Martin, W., 382 n 3
Marusenko, K., 192 n 58
Mason, C., 48 – 49
Mavletova, A., 179 n 11
McClain, C., 291 n 11
McConnell, J., 204 – 205 , 454 n 17
McDaniel, S. W., 192 n 59
McFall, B. H., 180 n 24
McKendall, M., 292 n 15
McKim, R., 120 n 12
Meekins, B., 245 n 9, 245 n 11
Mehta, R., 396 n 10
Melvin, P., 109 n 24
Meyer, R., 40 n 19
Middlemiss, M., 455 n 23
Migliore, V. T., 351 n 1, 352 n 1
Miles, L., 189 n 48
Mitchell, V., 160 n 58
Mobley, M. F., 82 n 15
Monllos, K., 39 n 17
Mora, M., 180 n 21
Moriarity, R. T., Jr., 256 n 23
Moser, A., 83 n 16
Mosier, J., 190 n 52
Moukheiber, Z., 211 n 10
Mullet, G., 423 n 16
Murphy, L., 51 n 10, 133 n 24
Murphy, L. F., 196 n 65
Murphy, P., 109 n 28
Muthalyan, S., 75 n 7
N Nelson, J. E., 293 n 17
Nelson, L., 301 n 44
Netemeyer, R. G., 82 n 15
Niedrich, R. W., 211
Noguchi, H., 209 n 4
Noh, M., 190 n 52
O O’Neill, H. M., 163 n 61
Ober, S., 445 n 12
Oishi, S. M., 175 n 7
Olah, D., 224 n 50
Olson, K., 301 n 43
Ozgur, C., 354 n 5
J Jackson, A., 240 n 3
Jacob, C., 291 n 14
Jacobs, H., 183 n 30
Jameson, D. A., 437 n 6
Janakiraman, N., 40 n 19
Jang, H., 178 n 10
Jargon, J., 35 n 8
Jarrett, J., 164 n 70
Jarvis, S., 151 n 29
Jiang, C., 419 n 11
Johnson, T. P., 301 n 43
Jones, P., 189 n 43
K Kahan, H., 160 n 53
Kaminska, O., 295 n 27
Kane, C., 84 n 18
Kanyal, A., 195 n 64
Kaplanidou, K., 210 n 7
Kates, B., 160 n 57
Katz, M., 180 n 20
Kearns, Z., 186 n 37, 223 n 44
Keller, K. L., 34 n 2, 41 n 24–25, 119 n 11
Kelly, B., 454 n 16, 455 n 21
Kephart, P., 148 n 15
Kiecker, P., 293 n 17
Kim, J., 209 n 3
Klein, H., 292 n 15
Knutson, R., 149 n 19
Kotler, P., 34 n 2, 36 , 36 n 10–11, 41 n 24–25, 119 n 11
Kotrlik, J., 278 n 20
Kozinets, R. V., 157 – 158 n42
Kreuter, F., 291 n 11
Krosnick, J. A., 185 n 36
Kuijlen, T., 176 n 8, 180 n 14, 187 n 41
Kumar, V., 253 n 18
Kupper, L. L., 278 n 19
L Laczniak, G., 109 n 28
Laflin, L., 224 n 49
Landler, M., 300 n 41
Lange, K. E., 130 n 18
Langer, J., 150 n 30, 152 n 30
Langley, R. E., 301 n 43
Langreth, R., 211 n 10
Lauer, H., 189 n 47
Lavrakas, P. J., 301 n 43
Lawson, C., 291 n 10
Lee, B., 178 n 10
Lella, A., 357 n 7
Lensvelt-Mulders, R. F., 180 n 22
Lenth, R., 264 n 2
Lepkowski, J. M., 245 n 11
Levenburg, N., 292 n 15
Levherz, P. R., 414 n 9
Levin, A., 164 n 68
Lewis-Beck, M. S., 423 n 15
Lieberman, M., 163 n 65
Lietz, P., 217 n 26
Lind, L. H., 294 n 25
Liu, T., 247 n 12
Lockley, L. C., 50 n 2
Loft, J. D., 301 n 43
Loftus, E., 218 n 29
Ge, Y., 419 n 11
Gentry, J. W., 149 n 20
Gerlotto, C., 199 n 68
Gerty, J. L. M., 180 n 22
Gibson, L., 400 n 11
Gibson, L. D., 75 n 5
Goddard, B. L., 383 n 4
Gomon, S., 192 n 57
Grandcolas, U., 192 n 58
Grapentine, T., 160 n 51, 413 n 6
Gray, L. R., 106 n 19
Grecco, C., 189 n 49
Green, M. C., 185 n 36
Greenbaum, T. I., 149 n 18
Greenbaum, T. L., 150 n 22–24
Greenberg, D., 189 n 50
Greene, S., 109 n 26
Greven, A., 180 n 22
Grinchunas, R., 150 n 26
Grisaffe, D., 119 n 8
Groves, R. M., 291 n 11, 301 n 44
Gudding, L., 454 n 18
Guéguen, N., 291 n 14
Gutman, J., 160 n 59
Gutsche, A., 321 n 5
H Hafner, K. B., 278 n 19
Hagins, B., 71 n 3
Hall, J., 35
Hall, T. W., 242 n 7, 283 n 26
Han, X., 193 n 60
Hansen, B., 224 n 50
Hansen, E. N., 192 n 57
Hansen, K. M., 291 n 13
Hansen, M., 224 n 49
Hardy, H., 51 n 6
Harrison, M., 186 n 38
Hawkins, D. I., 146 n 9
Haynes, D., 180 n 15
Heerwegh, D., 301 n 46
Helgeson, N., 356 n 8
Hellebusch, S. J., 148 n 17, 264 n 1,
364 n 8
Herron, T. L., 242 n 7, 283 n 26
Higgins, C., 278 n 20
Hille, D., 164 n 68
Hillhouse, A., 142 – 143
Hines, T., 152 n 32
Hoch, S., 40 n 19
Hocking, J., 249 n 16
Hodock, C. L., 41 n 23
Hogg, A., 180 n 17
Holbrook, A. L., 185 n 36, 301 n 43
Honomichl, J., 51 n 8, 293 n 22
Hornik, J., 183 n 33
Horton, K., 296 n 28
Hower, R. M., 50 n 4
Hsu, J. W., 180 n 24
Huang, E., 247 n 12
Hunt, S. D., 217 n 25
Hunter, J. E., 278 n 21
Huxley, S. J., 298 n 37
I Ibeh, K. I., 192 n 54
Z02_BURN3261_08_GE_NIDX.indd 478Z02_BURN3261_08_GE_NIDX.indd 478 24/08/16 3:38 pm24/08/16 3:38 pm

NAME INDEX 479
Tull, D. S., 146 n 9
Tybout, A. M., 105 n 18
U Ueshima, N., 209 n 4
Urbina, M., 420 n 12, 427 n 12
V Vannette, D., 291 n 11
Varshney, S. B., 118 n 6
Veeck, A., 98
Verille, P., 192 n 59
Vicente, P., 301 n 52
Viles, P., 148 n 13
Vogt, C., 210 n 7
Vogt, C. A., 301 n 48
Vranica, S., 102 n 13
W Wakita, T., 209 n 4
Wang, G., 414 n 8
Wang, J., 247 n 12
Wang, X., 253 n 17
Wansink, B., 100 n 12, 160 n 56
Warde, B., 189 n 44
Wasserstrom, J., 34 n 1
Waters, K. M., 298 n 39
Weathers, D., 211
Webb, J., 70 , 72 , 218 n 30, 220 , 220 n 35
Weitzer, R., 188 n 42
Wellner, A. S., 210 n 6
Whitlark, D. B., 146 n 6
Wijnant, A., 189 n 45
Wilcox, J., 217 n 25
Willems, A., 434 n 2, 455 n 22
Williams, G., 264 n 3
Williams, K., 163 n 65
Williams, R. J., 217 n 28
Wilson, S., 174 n 5, 180 n 16, 434 n 3, 455 n 20
Witt, T. J., 283 n 26
Wolter, F., 293 n 21
Wood, R. T., 217 n 28
Wu, B. T. W., 211
Wyner, G. A., 239 – 240 n2, 240 n 5, 253 n 20
X Xhang, K., 419 n 11
Xu, G., 271 n 10
Y Yan, T., 293 n 20, 301 n 45
Yang, Z., 253 n 17
Yin, E., 367 n 10
Yoon, S., 209 n 3
Z Zanni, G., 218 n 29
Zapata, C., 164 n 67
Zelin, A., 249 n 13
Zhang, J., 98 n 9
Zheng, Y., 98 n 10
Zinkhan, G., 408 n 4
Sellers, R., 195 n 63
Semon, T., 78 n 10, 294 , 294 n 26, 380 n 1, 407 ,
407 n 3, 408
Semon, T. T., 214 n 15, 279 n 22
Senn, J. A., 119 n 7
Sharma, N. K., 396 n 10
Shoemaker, P. J., 301 n 51
Short, K., 118 n 5
Shostack, G. L., 34 n 5
Siciliano, T., 150 n 26
Simmons, Z., 288 – 289
Simpson, A. M., 183 n 28
Singer, E., 174 n 4, 301 n 44
Singer, N., 163 n 63
Singleton, D., 92 n 1
Skewes, E. A., 301 n 51
Skinner, S., 298 n 34
Smith, R., 136 n 29, 224 n 50
Smith, R. L., 192 n 57
Smith, S. M., 82 n 13, 146 n 6
Smyth, J. D., 229 n 57
Sobecki, M., 291 n 14
Sparkman, R. D., 217 n 25
Spekman, R. E., 256 n 23
Spethmann, B., 108 n 23
Spinosa, C., 160 n 50
Stanley, J. C., 105 n 17
Stefan, J., 291 n 14
Stewart, D. W., 96 n 6
Stewart, S. I., 301 n 48
Stine, R., 414 n 7
Stokowski, P. A., 178 n 10
Stoltman, J. J., 149 n 20
Strasser, S., 354 n 5
Stubbs, R., 249 n 13
Su, C., 253 n 17
Sudman, S., 100 n 12, 249 n 14, 256 n 24
Sun., X., 419 n 11
Suresh, N., 301 n 49
Susan, C., 216 n 22
Swain, S. D., 211
Swami, S., 396 n 10
Swigarts, S., 136 n 28
Szynal, D., 151 n 29
T Tatham, R., 82 n 12, 84
Taylor, C., 156 n 37
Tellis, G. J., 309 n 60, 367 n 10
Thomas, J., 98 n 11
Thomas, J. S., 253 n 18
Thomason, N., 340
Thompson, B., 352 n 4
Ting, Y., 180 n 23
Tootelian, D. H., 118 n 6
Totty, M., 116 n 2
Tourangeau, R., 174 n 2, 180 n 23, 293 n 20,
301 n 44, 301 n 45
Townsend, L., 180 n 19
Tracy, K., 41 n 22
Trott, D. L., 183 n 28
Tucker, C., 245 n 9, 245 n 11, 298 n 33
Tufte, E., 455 n 19
Tufte, E. R., 446 n 13
P Palk, J., 189 n 43
Park, M., 178 n 10
Pashupati, K., 446 n 14
Pennay, D., 240 n 3
Perez, R., 154 n 34
Peter, J. P., 340 n 8
Peterson, B., 291 n 7
Peterson, R. A., 220 n 39, 253
Petroshius, S., 211
Peytcheva, E., 301 n 43
Phillips, L. W., 105 n 18
Philpott, G., 198 n 67
Pich, C., 163 n 62
Piekarski, L., 245 n 11
Pierce, B. J., 242 n 7, 283 n 26
Piirto, R., 146 n 7
Pimley, S., 39 n 15
Poddar, A., 283 n 25
Power, C., 109 n 27
Poynter, R., 57 n 16
Preisendörfer, P., 293 n 21
Presser, S., 174 n 4, 301 n 44
Q Qu, W., 419 n 11
Quinlan, P., 152 n 31
Quintanilla, C., 158 n 44
R Radder, L., 193 n 60
Rae, S. F., 50 n 3
Randall, K., 164 n 69
Reichert, H., 294 n 25
Reina, G., 264 n 4
Reinartz, W., 253 n 18
Reis, E., 301 n 52
Rettie, R., 192 n 58
Reynolds, T. J., 160 n 59
Riviera, E., 62 n 34
Rodriguez, L., 157 n 41
Rohde, J. A., 435 n 5
Rohmund, I., 189 n 51
Roller, M. R., 160 n 54
Romaniuk, J., 210 n 8
Rosenbush, S., 116 n 2
Rossow, A., 376 – 377
Roy, A., 180 n 25
Roy, S., 183 n 27
Runyan, R., 190 n 52
Rust, L., 147 n 10
Rydholm, J., 32 – 33 , 58 n 21, 145 n 4, 147 n 11
S Sabate, F., 414 n 9
Sanchez, M. E., 293 n 16
Sandoval, E. C., 420 n 12, 427 n 12
Santos, M., 301 n 52
Savage, J., 283 n 27
Sawyer, A. G., 340 n 8
Schlesinger, S., 170 – 171
Schneider, J., 35
Schober, M. F., 294 n 25
Z02_BURN3261_08_GE_NIDX.indd 479Z02_BURN3261_08_GE_NIDX.indd 479 24/08/16 3:38 pm24/08/16 3:38 pm

A01_MISH4182_11_GE_FM.indd 6 10/06/15 11:46 am
This page intentionally left blank

SUBJECT INDEX 481
C Career development in marketing research,
62 – 63
Case analysis, 96 – 97 , 98
CASRO response rate formula, 302 – 304
Categorical data, reporting guidelines for,
330 – 331
Causality, defined, 102
Causal research, 102 – 107
Cause-and-effect relationship, 400
Cell phones. See Mobile devices
Cell Zones, 35
Census, U.S., 128 – 129 , 238 – 239
Census sampling, 238 – 239
Central location telephone surveys, 186
Central tendency, 319 – 320
Certification in marketing industry, 60 – 61
Chain referral samples, 256
Charts, 401
China
hospitals in, 247
road rage in, 419
Chipotle Mexican Grill, 211 – 212
Chi-square analysis
interpretations, 396
observed/expected frequencies, 393 – 394
Chi-square distribution, 395
Chi-square formula, 394
Chobani, 39
Chrysler, 41
Cint, 195
Classification questions, 226 – 227
Clients
confidence interval report to, 338 – 339
correlation findings report to, 389
cross-tabulation reports to, 400
group differences tests, 369
hypothesis testing report to, 344
multiple, data collection for, 93
regression analysis reports to, 425
sample size, agreeing on, 277
Client-side research, 51
Cluster sampling, 248 – 250
advantages/disadvantages of, 249
Coca Cola
Center for Marketing Studies, 48
information database at, 70
marketing process for, 51
Coded questionnaires, 229
Code of Marketing Research Standards, 60
Coefficient of determination, multiple
regression analysis, 413
Collaboration, marketing and, 34 – 35
Color My World projective technique, 163
Column percentages table, 392
Column percents, 401
Communities, Web-based, 57
Company policy regarding marketing research,
exploratory research, 69
Completed interview, 301 – 302
cross-tabulations, 389 – 393
curvilinear relationships, 379
integrated case study, 387 – 389 , 398 – 400
linear relationships, 378 – 379
monotonic relationships, 379
nonmonotonic relationships, 380
Pearson product moment correlation
coefficient, 384 – 389
two-variable relationships, 378 – 380
Assumed interval, measurement units, 207
Assumptions, decision alternatives based on,
79
AT&T, 40 , 164
Attention, loss of by survey respondents,
294 – 295
Attitude scale, 215
Audio computer-assisted self interview
(ASACI), 294
Australia, 134 – 135
Authentic Response (criticalmix), 195
Auto Concepts.sav, 319 , 324 – 326
B Background information, exploratory research
and, 95
Balloon/cartoon test, 162
Bar chart creation, 450 – 451
Bartels, Robert, 50
Basic research, marketing research as, 40
Before-after with control group experimental
design, 104 – 105
Best practices
in marketing research, 58
online panels, 305
questionnaire design, 217
Big data, 115 , 116
Bivariate linear regression, 407 – 410
Black & Decker, 147
Blind draw, for sampling, 243
Blogs, 57
Blue Book listings, 54 , 56
BP, 454
Brain activity monitoring, neuromarketing
and, 163 – 164
BrainJuicer, 133 , 157 , 163
Brainsights, 163 – 164
Brand fans, 386
Brand scale, 215
Brand-switching studies, 100 – 101
Break-off, by survey respondent, 301
Breisach, Carrie, 66 – 67
Brevity in questionnaire design, 218
Bureau of Labor Statistics, 48 – 49
Burger King, 380
Burke, Inc., 52 – 53 , 455 – 456
Burke Institute, the, 61 – 62
Business source directories, 121
Business-to-business (B2B) research, 293
BVM (German Market Research Association),
90
A Abstract/executive summary, in reports,
441 – 442
A/B testing, in experimental design, 105
Acceptable margin of sample error,
272 – 273
Accuracy
confidence interval, 270
sample size, 266 – 267
stratified sampling, 254 – 256
Actionable difference, 353
Action standards, research objectives and,
83 – 85
Activities, interests, and opinions (AIOs), 210
Additivity, 412
Ad hoc studies, in marketing research, 44
Advertising Research Foundation, 158
Affordable Care Act (ACA), 453 – 454
Age distribution in market, 118
Agencies, external suppliers as, 53
All England Lawn Tennis and Croquet Club
(AELTC), 117
All Global, 195
“All that apply” question, 229 – 230
“All you can afford” approach, for sample size,
279
AMA Gold Global Top 50 Report, 53 – 56
Amazon, 34
American Association for Public Opinion
Research (AAPOR), 59 , 60
American Business Lists, 239
American Community Survey (ACS), 128 – 130
American Marketing Association (AMA),
34 , 37 – 38
marketing research firm rankings, 53 – 54
American Psychological Association (APA)
style, 437
American Red Cross, 80 – 81
American Statistical Association, 192
Analysis of variance (ANOVA)
basic principles, 364 – 366
consumers in different countries, 367
interpretation of, 369
Annie’s Homegrown, 38
Anonymity, 224
in field research, 298
Appendices, in reports, 444
Apple Computer, 34 , 98 , 164
Applied research, marketing research as, 40
Arbitrary percent rule of thumb for sample size,
277 – 278
Archives, in qualitative research, 146
The Arizona Republic newspaper, 145
Articles, as secondary information sources, 121
Association analyses, 318
between-variable relationships, 378 – 380
case studies, 404 – 405
chi-square analysis, 393 – 399
correlation coefficients and covariation,
382 – 384
481
Subject Index
Z03_BURN3261_08_GE_SIDX.indd 481Z03_BURN3261_08_GE_SIDX.indd 481 30/08/16 12:53 pm30/08/16 12:53 pm

482 SUBJECT INDEX
Direction, in relationships, 380 – 381
Direct observation, 146
Discontinuous panels, descriptive research,
100
Discuss.io, 288 – 289
Disguised survey, questionnaire design, 223
Display logic, computer-assisted questionnaire
design, 228
Disproportionate stratified sampling, 252
Distraction of respondents, 295
Distribution research, 39 – 40
chi-square distribution, 394 – 396
promotion control in test market cities, 109
Do-it-yourself (DIY) research, internal
suppliers, 51 – 52
Domino’s Pizza, 268
Dot, Dot, Dot projective technique, 163
Double-barreled questions, 220
Drop-off surveys, 191 – 193
“Dummy” independent variable, multiple
regression analysis, 417 – 418
Duncan Hines, 41
Duncan’s multiple range test, 366
dunnhumby Ltd., 54
E eBay, 180
Eclipse smokeless cigarette, 109
Education in marketing research, 62
e-health videos in China, 247
Electronic test markets, 108
Eleven-step marketing research process
caveats to, 68 – 70
data acquisition methods, 72 – 73
data analysis, 73 – 74
data collection forms, 72 – 73
data collection techniques, 72 – 73
design criteria, 72
final report preparation and presentation, 74
information types and sources, 72
need for research, establishment of, 69 – 70
overview, 68 – 74
problem definition, 71 , 74 – 80
research objectives, establishment of, 67 – 74 ,
80 – 83
Email list samples, 257
Encyclopedias, 121
Endnotes, in reports, 444
Errors
acceptable margin of sample error, 272 – 273
data collection errors, 289 – 296
data quality and, 296 – 300
fatigue-related mistakes, 293 – 295
in field data collection, 290 – 296
fieldworker error, 290 – 293
identification of, 296
intentional fieldworker errors, 290 – 291
intentional respondent errors, 298 – 299
in marketing research, 40 – 41
maximum margin of sample error, 268 – 269
nonresponse errors, 293
nonsampling error, 289
respondent error, 293 – 295
sample frame errors, 239 – 240
unintentional fieldworker errors, 291 – 293
unintentional respondent errors, 293 – 295
ESOMAR association, 61, 90
careers, 58 , 62
quality of data, 197 – 198 , 306 – 309
speed, 197
data.gov, 123
Data management
collection methods, 72 – 73 , 174 – 196 , 181 – 193
data acquisition methods, 73 – 74
data coding and data code book, 305 – 306
descriptive analysis and, 317 – 323
exploratory research, 94 – 98
marketing research and, 53 – 57
mixed-mode surveys, 180 – 181
nonsampling error and, 289 – 290
over- or under-estimation of data collection
costs, 93
person-administered surveys, 175 – 177
quality controls, 296 – 300
research design for multiple clients and, 93
in situation analysis, 76 – 77
survey data, 171 – 199
syndicated data, 129
Data mining, 119
Dataset, defined, 305 – 306
Dataset, quality issues, 305 – 306
Data visualization, 434
Date.net , 386 – 387
Dead Q scores, 131
Decipher Market Research, 136
Decision alternatives, 78
Decision Analyst, Inc., 161
Decision making, alternatives, 78
Decision support systems (DSS), marketing
research and, 43 , 70
Degree of isolation, of test market cities, 109
Degrees of freedom, chi-squared distribution, 395
Dell computers, 410 – 411
Democratization of marketing research, 51 – 52
Dependent variables, 102
regression analysis, 408
Derived demand, marketing research growth
and, 55
Descriptive analysis
applications for, 322 – 323
case studies, 346 – 349
client reporting guidelines, 329 – 331
data analysis using, 317 – 323
defined, 317
design for, 98 – 101
integrated case applications, 323 – 324
Descriptive measure, application of, 322 – 323
Descriptive research, 98 – 101
Dictionaries, 121
Difference analysis, 318
Differences analysis
analysis of variance and, 364 – 369
case studies, 375
differences between means, 358 – 360
differences between percentages, 358
differences between two groups, 355 – 363
importance of, 351 – 354
integrated case study, 360 – 363
paired sample differences between means,
369 – 372
reporting to clients on, 369
Digital Dashboard, Burke’s, 52 – 53 , 456
Digital dashboards, as report writing tool,
455 – 456
Digital media, expansion of, 33
consumer collaboration, 34 – 35
hispanic vs. nonhispanic use of, 357
Completely automated telephone survey
(CATS), 188 – 189
Computer-administered surveys, 179 – 180
Computer-assisted personal interviewing
(CAPI), 187
Computer-assisted survey, 177 – 178
Computer-assisted telephone interviews
(CATI), 186 – 188 , 240
Conclusions, in reports, 443
Confidence interval formula, 269
Confidence interval method
basic principles, 269 – 271
client reporting guidelines, 338 – 339
computation of, 335 – 337
parameter estimation, 335 – 337
sample size, 269 – 271
Confidentiality, 224
in field research, 298
Consequences, 78 – 79
Constructs, 81 – 82
Consumer behavior, video surveillance to
track, 61
Consumer Insights, 204 – 205
Consumer packaged goods (CPG), marketing
process for, 51
Continuing education in marketing research,
61 – 62
Continuous panels, descriptive research, 100
Control group, 104 – 105
Controlled test markets, 107
Convenience sampling, 253 – 255
Conventional approach, sample size
specification, 278
Correlation, 400
Correlation coefficients, 382
Cost-benefit analysis of marketing research, 71
estimation of data collection costs, 93
in marketing research proposal, 93
sample size specification, 279 – 280
syndicated data, 132
Council of American Survey Research
Organizations (CASRO), 59 , 302 – 304
Covariation, association analyses, 382
Covert observation, 147
Cross-sectional studies, descriptive research, 99
Cross-tab, 400
Cross-tabulations
association analyses, 389 – 393
reporting to clients, 400
tables and cells, 390
Crowdsourcing, 34 – 35 , 127
Cultural norms, data collection method and,
198 – 199
Curtis Publishing Company, 50
Customer relationship management, 119
D Dannon, 158
Dashboards, for reports, 455 – 456
Data aggregators, 124
Data analysis, 317
Database, 119
Data code book, 306
Data collection
case studies, 311 – 313
cost, 197
definition of, 290
incidence rate, 198 – 199
Z03_BURN3261_08_GE_SIDX.indd 482Z03_BURN3261_08_GE_SIDX.indd 482 30/08/16 4:08 pm30/08/16 4:08 pm

SUBJECT INDEX 483
Gongos, 452 – 454
Google, 75
alerts, marketing intelligence using, 43
marketing process for, 51
online survey, 189
Google Glass, 164
Government agencies, secondary data and, 118
GreenBook Research Industry Trends Report (GRIT), 54 – 59 , 116
Green light procedures
analysis of variance, 364 – 366
statistical analysis, 354
Green stoplight signals, 354
Group comparison tables, 370
Group differences
differences between means, 358 – 360
percentage differences, 355 – 360
Group self-administered surveys, 191
Guessing, as respondent error, 294
H Halo effect, 211
Happy Thinking People, 90 – 91
Hassloch, Germany, 108
Headings, in reports, 4114
Hispanics, digital media use by, 357
Honomichl Top 50 report. See AMA Gold Global Top 50
Hootsuite, 52 , 114 – 115
Hypermarket, 396 – 397
Hypermarket shopper segment profiles, 396 – 397
Hypotheses, 81
defined, 340
in exploratory research, 95 – 96
Hypothesis testing
development of, 340 – 344
differences between percentages, 340 – 342
report to clients, 344
I IBIS World Industry Reports, 62
IBM, and Wimbledon, 117
IBM SPSS (Statistical Package for the Social
Sciences), 73 – 74
analysis of variance, 366 – 369
auto concepts survey, 323 – 329
bar chart creation, 450 – 451 , 453 – 454
case selection, 306
chi-square analysis, 398 – 400
confidence interval for a mean, 337 – 338
cross-tabulation analysis, 389 – 393
data analysis software, 51
data quality controls, 296 – 300 , 312
datasets, 305 – 306
descriptive analysis and, 316 – 319 , 321 – 331
difference analysis using, 351 – 362
differences between means testing, 358 – 360
differences between percentages, group
differences, 358 – 360
frequency distribution and mode from,
325 – 327
help, 308
hypothesis testing using, 342 – 344
independent sample significance of
differences between means test, 360 – 362
as marketing research tool, 43
mean, 327
meeting sites for, 154 – 155
objectives of, 152 – 153
online focus groups, 151
operational aspects of, 153 – 155 , 153 – 156
procedures, 150
projective techniques for, 161 – 164
qualitative research and, 149 – 155 , 149 – 156
recruitment for, 154
report preparation and dissemination, 155
situation analysis, 76
size, 153
traditional groups, 153 – 155 , 153 – 156
Focus Pointe Global, 151
FocusVision Worldwide, 151
Formulas
for an expected cross-tabulation cell
frequency, 393
for Chi-squares degrees of freedom, 395
for a column cell percent, 392
for a mean, 320
for Pearson product moment correlation, 385
for a row cell percent, 392
for significance of difference between two
means, 358
for significance of the difference between two
percentages, 355
for simple random sample probability, 242
for the standard error of the difference
between two means, 359
for the standard error of the difference
between two percentages, 356
for standard error of the mean, 333 – 334
for standard error of the percentage, 333 – 334
for a straight line, 379
for weighted mean, 252
Fortune 500 firms, marketing research and, 51
Forums, Web-based, 57
Frames of reference, research objectives, 83
Frequencies table, 392
Frequency of use scale, 215
Frito-Lay, 378
Front matter, of reports, 437
Frugging, method of marketing research, 59
Full-service supplier firms, marketing research
by, 54 – 55
Fully automated surveys, 188
Functional magnetic resonance imaging
( f MRI), 163
Funding for marketing research, lack of, 71
G Gallup, George, 51
Galvanometry, neuromarketing research,
163 – 164
Gender, as dummy variable, 417
General conceptual model, multiple regression
analysis, 411
General Mills, 38 , 66 – 67 , 146
General Motors, 34 , 40 – 41 , 53 , 378
Geodemographic information systems, 133
Geographic knowledge, 127
GfK BehaviorScan, 108
GfK SE, 54, 108
Global Consumer Insights, 66 – 67 , 367
Globalization
data quality, 309
innovation, acceptance of, 367
marketing research and, 33 – 34
marketing research performance evaluation,
54 – 55
standards of ethical conduct, 60
Esri Tapestry Segmentation, 131
Ethics in marketing research, 59 – 62
data gathering, 181
in observational research, 120 , 149
properly referencing sources, 437
reporting findings, 370
research proposal and, 86
respondent participation, 300
sampling, 255 , 280
sensitivity in research design, 93
surveys and, 223
test marketing and, 109
Ethnographic research, 156 – 158
Executive summary, in reports, 441 – 442
Expected frequencies, chi-square analysis,
393 – 394
Experience survey, 76 , 96
Experimental design, defined, 103
Experiments
in causal research, 102 – 107
design of, 103 – 105
Exploratory research, 92
applications for, 95 – 96
design for, 94 – 98
methods for conducting, 96 – 98
External secondary data, 120 – 124
External validity, research design and, 105 – 106
Extraneous variables, in causal research, 102
Eye tracking
in marketing research, 55
neuromarketing and, 164
F Facebook
multiple regression analysis of, 414
“Face-to-face” interviewing (FTF), 294
Face validity, questionnaire design, 222
Facial coding, in qualitative research, 164
Falsehoods, by interview respondents, 293
Famous Amos, 100 – 101
Fatigue-related mistakes, 293
Faulty recall, observational research, 148
Field data collection
data quality and, 296 – 300
errors in, 290 – 296
quality controls, 296 – 300
research design and, 106 – 107
Field experiments, in research design, 106
Field services, 55
Field services firms, 73
Fields of information, defined, 119
Fieldworker error, 290 – 293
intentional errors, 290 – 291
unintentional errors, 291 – 293
Field-workers, 73
Figures, in reports, 441
Finite multiplier, 280
Flow diagrams, in reports, 451
Focus group report, 150
Focus groups, 92
advantages of, 151
applications for, 152
in exploratory research, 98
guides, 73
in marketing research, 51
Z03_BURN3261_08_GE_SIDX.indd 483Z03_BURN3261_08_GE_SIDX.indd 483 05/09/16 1:52 PM05/09/16 1:52 PM

484 SUBJECT INDEX
Leap Frog, 298
Learning, from consumers, 34 – 35
Least squares criterion, regression analysis, 408
Lego, 35
Letter/memo of transmittal, in reports, 439 – 440
Letter of authorization, in reports, 438
Letter of transmittal, 439 – 440
Level of confidence, determination of sample
size, 272 – 273
Levene’s Test for Equality of Variances, 362
Lexis-Nexis, 43
Lexus, 412 – 413
Lifestyle inventory, of Likert scale, 210
Lifestyle scale, 215
Lightspeed GMI, 195
Likert scale, 209 – 210
Limitations, noting in reports, 443
Limited-service supplier firms, marketing
research by, 54 – 55
Line graphs, for reports, 449
Loaded questions, 220
Longitudinal studies, descriptive research, 99
Lucid (technology company), 262 – 263
Lululemon, 140 – 141
M Machu Picchu, 201 – 202
Mail surveys, 192
Mall-intercept surveys, 57 , 183 – 184
Management decision process, 69 – 70
“Man on the street” interviews, 95
MARC USA, 204 – 205 , 454
Margin of sample error formula, 267
Maritz Research, 39
Marketing
defined, 34
marketing research and, 34 – 41 , 37 – 40
process of, 40
Marketing concept, philosophy of, 36
Marketing decision support system (DSS), 43
Marketing directories, 121 – 122
Marketing information systems (MIS), 42 – 43
as alternative to independent research, 70
components of, 42 – 44
Google alerts and, 43
internal reports system, 42
internal secondary data, 119 – 120
marketing research and, 41 – 44
problem and opportunities, identifying,
75 – 76
Marketing mix/brand equity modeling, 57
Marketing News, 53
Marketing opportunity, recognition of, 75 – 76
Marketing research, 34 – 41 , 37
action generation, refinement and evaluation,
38 – 39
agencies for, 53
applications for, 38 – 41
available information in place of, 70
bad timing for, 70 – 71
basic principles, 37 – 38
career opportunities in, 62 – 63
case studies in, 46 – 47 , 88 – 89
client decision making and, 69 – 71
cost-benefit analysis of, 71
credibility in, 58 – 59
current developments in, 33 – 37
INTAGE Group, 54
Integrated case in marketing research, 46 – 47
analysis of variance, 364 – 369
associative analysis, 399
chi-square analysis, 398 – 399
credibility of message, 88
descriptive and inference analysis, 348 – 349
descriptive statistics in, 323 – 329
differences between means testing, 360 – 363
multiple regression analysis, general
conceptual model, 415 – 417
paired sample differences, 371 – 372
Pearson product moment correlations,
387 – 389
problems, stating, 89 – 90
qualitative research, 169
questionnaire, 235
report preparation and presentation, 458 – 459
sample size, 287
segmentation analysis, 430 – 431
survey differences analysis, 375
Intentional fieldworker errors, 290 – 291
Intentional respondent errors, 293
Intention to purchase scale, 215
Intercept, 407 – 410
Internal database, defined, 119
internal reports system, 42
Internal validity, 105
Internet-based questionnaire, 189 – 190
Internet of Things, the (IoT), 57 , 136 – 137
Interval scales, 207 – 215
Likert scale, 209 – 210
reporting guidelines for, 329 – 330
semantic differential scale, 210 – 211
Stapel scale, 212
symmetric interval, 213 – 214
Interviewer cheating, 290 – 291
Interviewer misunderstanding, 291 – 293
Introduction, in reports, 442
Invented observation, 147
Invitations to bid (ITBs), 85 – 86
iPad, 98
Ipsos S.A., 54
IRI, 54 , 99
Item omission, 301
Item omissions, 307
“I Wish I Knew So I Could,” 453
J John Hancock Mutual Life, 116
Journal of Marketing Research, 40
K Kantar, 54
Kellogg’s, 146 , 156
Key-informant technique, 96
KL Communications, 195
Knoll, Inc., 184
Kraft, 134 – 135 , 154 , 157
Krispy Kreme company, 152
L Laboratory experiments, research design and,
106
Laddering technique, in-depth interviews, 160
Leading the respondent, 291
Lead-user survey, 96
median calculations, 326 – 327
missing data management in, 327
modifying variables and values, 273
multiple regression analysis, 415 – 417
nonprobability sampling and, 285 – 286
paired sample differences between means,
371 – 372
Pearson product moment correlation
coefficient, 387 – 389
Pearson product moment correlations,
387 – 389
pie chart creation, 448 – 449
range, 327
recoding and computing, 295
report visuals created by, 449 – 454 , 458 – 459
sample size and, 275 , 278
setup basics, 271
sorting, searching, and inserting variables,
283
standard deviation, 327 – 329
statistical analysis, 317
stepwise multiple regression, 422
table creation, 447
testing hypothesis for a mean, 342 – 344
variable view and variables command, 307
IdeaShifters panel, 99
Ikea, 145
Illustrations, list of, in reports, 441
IModerate, 376 – 377
Importance scale, 215
IMS Health Inc., 54
Incentives, data quality control, 298
Incentives, questionnaire design, 223 – 224
Incidence rate, 198 – 199
Incidence rate, in surveys, 198 – 199
Incomplete response, 307
Independence assumption, multiple regression
analysis, 413
Independent samples, differences between
means, 358 – 360
Independent variables
in causal research, 102
“dummy” independent variable, 417 – 418
regression analysis, 408
standardized beta comparisons, 418
India, 396 – 397
Indirect observation, 146
Industrial Revolution, marketing research and,
50
Industry segment specialists, 55
Inference analysis, 318 , 332
case studies, 346 – 349
defined, 318
Infographics, 455
Information
availability of, 70
gaps, decision alternatives and, 78 – 80
from previous projects, research design using,
93
social media data, 134 – 135
types and sources, 72
Information state, 79
Information state, decision alternatives and,
79 – 80
In-home surveys, 182 – 183
In-office surveys, 184
InSites Consulting, 236 – 237 , 455
In situ observation, 147
IBM SPSS (continued)
Z03_BURN3261_08_GE_SIDX.indd 484Z03_BURN3261_08_GE_SIDX.indd 484 30/08/16 12:53 pm30/08/16 12:53 pm

SUBJECT INDEX 485
MRA Blue Book, 54 – 56 . See also Marketing
Research Association (MRA)
MSR Group, 40
MTV, 142 – 143 , 158 , 452 – 453
Multicollinearity, multiple regression analysis,
413
Multiple clients, research design for data
collection for, 93
Multiple regression analysis, 407 – 422 ,
412 – 427
applications, 417 – 420
disadvantages of, 423 – 424
dummy independent variables, 417 – 418
integrated case, 415 – 417
interpretations, 419 – 421
screening applications, 418 – 420
standardized beta comparisons, 418
step-by-step summary, 423
stepwise multiple regression, 422
Multiple regression equation, 412 – 413
Murphy Research, 76
Music preferences, 386
MyServiceFellow, 157
Mystery shoppers, 149
N Nabisco, 100 – 101
National Car Rental, 158
National Do Not Call Registry, 59
National Football League (NFL), 98
National Geographic Digital magazine, 383
Nay-saying patterns, raw data inspection, 307
Negative association, scatter diagram, 384
Netnography, 157 – 158
Neuroimaging, 55 , 163 – 164
Neuromarketing research, 163 – 164
Neurosense, 163
New products, test marketing of, 107 – 109
News sharing sites, 57
Niagara Falls Tourism Association, 282
Nichols-Shepard Company, 50
Nielsen Audio, 131 , 133 , 147
Nielsen Inc., 39 , 50 , 54 , 55 , 99 , 132 , 134
Nielsen Ratings, 131
Nielson, A.C., 51
No association, scatter diagram, 384
Nominal measures, 206
reporting guidelines for, 330 – 331
Nonprobability sampling, 241 – 242 , 253 – 256
chain referral sampling, 256
convenience sampling, 253 – 255
purposive sampling, 255
sample size, 281
Nonresponse bias
intentional respondent errors and, 293
mail surveys, 192
Nonresponse errors, 307
Nonsampling error, 266
Nonsymmetric interval scale, 214
Novartis, 383
Null hypothesis
analysis of variance, 372
differences between means, 372
group differences tests, 355 – 360
Nurse Jackie (television show), 145
N. W. Ayer and Son, 50
Market segmentation
difference analysis, 355 – 363
packaged information services for, 133
Market segment specialists, 55
Mason, Charlotte, 48 – 49
Master of Marketing Research program
(MMR), 48 – 49 , 62
Maximum margin of sample error, 268 – 269
McDonald’s, 95 , 109 , 380
Mean
analysis of variance, differences between
means, 364 – 369
in descriptive analysis, 318
differences between means, 358 – 362
sample size determination, 274
Meaningful difference, 352 – 353
Measurement
basic concepts, 205 – 206
design of, 204 – 231 , 204 – 231
interval scales, 207 – 215
nominal measures, 206
options and design of, 204 – 231
ordinal measures, 207
reliability and validity of, 215
research objectives and, 82 – 83
scale measures, 207 – 215 , 207 – 218
of survey response rate, 302 – 303
types of, 206 – 208
Measures of central tendency
descriptive analysis and, 319–322
mode, 319
Measures of variability, 320 – 322
Median
in descriptive analysis, 319
finding with SPSS, 326 – 328
Media usage monitoring and promotion
effectiveness, 133
Memo of transmittal, in reports, 439 – 440
Merton, Robert, 51
MESH Experience, 406 – 407
Method, of reports, 442
Methodology, 443
Michelob Ultra, 390 – 393
Microblogs, 57
Micromarketing, 119
Middle-of-the-road pattern, 308
Millenials generation, marketing research
online community for, 158
Misunderstanding
interviewer misunderstanding, 291 – 293
respondent misunderstanding, 294
Mixed methods research, defined, 144
Mixed-mode surveys, 180 – 181
Mobile data collection
surveys using, 229
Mobile devices, marketing research on, 240 ,
295
Mobile ethnography, 156 – 157
advantages of, 157
applications of, 157
Mobile research services, 55
Mode, 319 – 320
Modeling methods, multiple regression
analysis, 410 – 411
Moderators, 150
Modern Language Association (MLA) style,
437
Most commonly used level of confidence,
335
data acquisition methods, 73 – 75
data analysis, 116 – 117 , 317 – 323
data collection forms, 72 – 73
data collection techniques, 57 , 72 – 73
design criteria, 72 – 73
distribution by size and number of employees,
51 – 52
distribution research, 39 – 40
educational programs for, 62
eleven-step process for, 67 – 74
evolution of, 50 – 51
external suppliers, 53
final report preparation and presentation, 74
functions of, 37 – 38
information types and sources, 72
internal suppliers in, 51
lack of funding for, 71
marketing information systems and, 41 – 44
in marketing process, 34 – 37 , 34 – 37
on marketing processes, 40
marketing research and, 50
marketing strategy and, 36
need for, 69 – 70
objectives, establishment of, 71–72, 91 – 92
opportunities and problems, identification of,
37 , 75 – 76
performance monitoring, 40
pricing research, 39
problem definition in, 71 , 74 – 80
product failures and, 35
product research, 39
promotion research, 39
report preparation guidelines, 435 – 451
reports system, 42
secondary data, 116 – 129
social media and, 97 – 98
suppliers, in marketing research, 53 – 54
Marketing Research and Intelligence
Association (MRIA), 60
Marketing Research Association (MRA), 50
Bluebook of, 54 – 56
code of conduct, 94
Code of Ethics, 182 , 219 , 255 , 280 , 300
Code of Marketing Research Standards,
60 , 94
ethical issues agreement, 86
Professional Researcher Certification, 61
Marketing research industry, 48 – 63
case studies in, 64 – 65
ethical conduct in, 59 – 60
firm size by revenue, 53 – 54
growth of, 50
major types of firms, 54
maturation of, 50
performance evaluation, 54 – 58
professional researcher certification, 61
self-improvement in, 58 – 60
specialization in, 54
structure of, 53 – 56
top 10 marketing firms in, 54
Marketing Research Online Community
(MROC), 158 – 159
Marketing research proposal
elements of, 85 – 86
ethical issues and, 86
Marketing research report, 435
Marketing research system, 43 – 44
Marketing Science Institute, 40
Market research, 37
Z03_BURN3261_08_GE_SIDX.indd 485Z03_BURN3261_08_GE_SIDX.indd 485 30/08/16 12:53 pm30/08/16 12:53 pm

486 SUBJECT INDEX
ethnographic research, 156 – 158
focus groups, 51 , 149 – 155
in-depth interviews, 159 – 160
marketing research industry performance,
54 – 58
observation techniques, 144 – 149
online information about, 158 – 159
projective techniques, 161 – 163
protocol analysis, 160 – 161
techniques for, 144 – 166
Qualitative research consultants (QRCs), 150 ,
164
Qualitative Research Consultants Association,
150 , 156 , 164 – 165
Qualtrics, 52
Quantitative marketing research, defined,
143 – 144
Question bias, 216
Question creation, computer-assisted
questionnaire design, 227 – 228
Question development, 217 – 222
Question evaluation, 218
Question flow, 224 – 227
Questionnaires
case studies, 234 – 235
classification questions, 226 – 227
coding, 229
computer-assisted design, 227 – 228
definition of, 216
design, 216 – 217
development dos and don’ts, 218 – 222
double-barreled questions, 220
evaluation of, 218 – 219
finalization of, 229 – 230
instructions and examples for, 299
introduction in, 223 – 224
leading of respondents in, 219 – 220
loaded wording or phrasing, 219 – 220
logical question sequence, 228
marketing research and, 73
organization, 222 – 227
pretesting of, 230
question development, 217 – 222
question flow, 224 – 227
screening questions, 224
Quirk’s, 58
Quirk’s Marketing Research Media, 32 – 33
Quirk’s Marketing Research Review, 33, 71
Quirk’s Researcher SourceBook, 54–56
Quotas, mall-intercept surveys, 184
Quota sample, 256
R Random device method, 242 – 243
Random digit dialing (RDD), 245
quality issues, 240
Random Domain Intercept Technology (RDIT),
263
Random numbers method, simple random
sampling, 244 – 245
Random sampling, 242 – 245
Ratio scale data, 329 – 330
Ratio scale measures, 207
Raw data inspection, 307 – 309
Raw percentages table, 392
Recommendations, in reports, 443 – 444
Records, defined, 119
People magazine, 44
People Meters (Nielsen), 147
Pepperidge Farm, 100 – 101
PepsiCo, 102
Percentage distribution, 320
confidence interval computation, 335 – 336
differences between percentages, 336 – 337
Performance monitoring
in marketing, 40
marketing research industry, 54 – 58
Performance scale, 215
Person-administered surveys, 175 – 176 ,
175 – 177
Personal Data Act, 61
Photo sharing sites, 57
Physical traces, in qualitative research, 146
Picture test, 162
Picture This, Picture That projective technique,
163
Pie chart creation, 448 – 449
Pilot studies, 76
Plagiarism, 436
Plus-one dialing procedure, 245
Politz, Alfred, 51
Population estimation, 332 – 337
Population mean, 336 – 337
Population sampling, 238
Positive association, scatter diagram, 384
Posttest, as experimental measurement, 104
PowerPoint presentations, 459
Presence, variable relationships, 380
Pretest, as experimental measurement, 104
Pretesting, of questionnaires, 230
Pricing research, 39
Primary data analysis, secondary data vs.,
116 – 117
Probability sampling, 241 – 253
Problems, 74 – 80
defining, 71 , 97
in exploratory research, 95 – 96
marketing research identification of, 38
statement of, 80
Procter & Gamble, 108, 157 , 287
marketing research policies at, 51
Product orientation, 36
Product research, 39
Professional networks, 57
Professional Researcher Certification (PRC)
program, 50 , 62
Projective techniques, qualitative marketing
research, 161 – 164
Promotion research, 39 , 109
Prompters, 299
Properties, defined, 205 – 206
Proportionate stratified sampling, 252
Protocol analysis, qualitative marketing
research, 160 – 161
Public behavior, observational research, 148
Public credibility, in marketing research, 58 – 59
Published sources, as external secondary data,
122 – 123
Q Qualified Research Professionals, CPA, CFA,
60 – 61
Qualitative marketing research, 51
case study, 168 – 169
defined, 144
O Objective properties, measurement of, 206
Objectives
failure to meet, 75
in marketing research, 71
Observational research
advantages of, 148
appropriate conditions for, 147 – 148
limitations of, 148 – 149
qualitative marketing research, 146 – 149
Official statistics, 123
Omnibus survey/panel, descriptive research,
100
One-step area sampling, 249
One-way ANOVA, 366 – 369
Online market research
focus groups, 158
internet based questionnaire, 189 – 190
online communities, 158 – 159
sample company, 70
sampling panels, 257
sampling techniques, 256 – 257
specialists, 55
survey software for, 190
Online panel samples, 257
Open Data Policy, 123
Operational definitions, research objectives
and, 82 – 83 , 214
Opinion scale, 215
Opportunities, marketing research identification
of, 38 , 75 – 76
Optical centers industry, 420
Oral presentations, 452
Ordinal measures, 207
Orientation sessions for fieldworkers, 298
Outdated data, 125
Outlier, 408
Overstated questions, 220 – 222
Overt observation, 147
P Packaged information, 116
advantages and disadvantages, 132
applications of, 132 – 134
secondary data from, 131
Packaged services, 55 , 131
Paired samples, differences between means,
369 – 372
Panel company, for data collection, 193 – 196
advantages of, 194
disadvantages of, 194 – 195
quality control, 304 – 305
top companies listed, 195
Panels
descriptive research, 99
online panel samples, 283
Paradigm Sample, 99
Parameter
defined, 331 – 332
estimated population parameter, 332 – 337
Parameter estimation
defined, 332 – 333
population percent or mean, 332 – 337
Parlin, Charles Coolidge, 50
Passive data, 57 , 136
Patterns, in relationships, 380 – 381
Pearson product moment correlation, 400 – 401
coefficient, 384 – 389
Z03_BURN3261_08_GE_SIDX.indd 486Z03_BURN3261_08_GE_SIDX.indd 486 30/08/16 12:53 pm30/08/16 12:53 pm

SUBJECT INDEX 487
ethics of, 255
frame and frame error, 239 – 240
misrepresentation of, 94
nonprobability samples, 241 – 242 , 253 – 256
online techniques, 256 – 257
population, 238
probability samples, 241 – 253
reasons for taking sample, 240 – 241
sample and sample unit, 239 – 240
sample plan development, 257 – 258
sample plans, 77 , 257
simple random sampling, 242 – 243
skewed populations, 250 – 251
stratified sampling, 250 – 252
systematic sampling, 245 – 249
Sampling services, 55
SAP, and Women’s Tennis Association, 117
Satisfaction scale, 215
Saturday Evening Post, 50
Saturday Evening Post magazine, 50
Scale data
association analyses, 318
measures in, 207 – 215
reporting guidelines, 329 – 330
Scale development, 206
Scatter diagrams, covariation graphing,
383 – 384
Schlesinger Associates, 170 – 171 , 195
Screening device, multiple regression analysis,
418 – 420
Screening questions, questionnaire design,
224
Search terms, identifying key, 97
Secondary data analysis
American Community Survey and, 128 – 130
applications of, 118
case study, 140 – 141
evaluation of, 125 – 128
exploratory research, 96
external secondary data, 120 – 124
internal secondary data, 119 – 120
key sources of, 121 – 122
packaged information and, 129 – 130
primary data vs., 116 – 117
situation analysis, 76 – 77
Segmentation Associates, Inc., 421
Seinfeld (television series), 41
Self-administered surveys, 178 – 179 , 191 – 193
Self-improvement in marketing research
industry, 58 – 60
Self-selection bias, mail surveys, 192
Sentiment, 136
Service innovations, test marketing of, 107 – 109
Shopalongs, 156
Short time intervals, observational research,
148
Significance
differences between means, 358 – 360
differences between percentages, 355 – 360
Sig. value, analysis of variance, 365
Simple random sampling, 242 – 245
Simulated test markets (STMs), 109
Situation analysis, 76
Skip interval, 246
Skip logic, computer-assisted questionnaire
design, 228
Skip question, questionnaire design, 225
SKOPOS Insight Group, 133
Sliders, in visual scales, 213
frame of reference of, 83
guessing by, 294
intentional errors by, 293
leading of respondents, 219 – 220
misunderstanding by, 294
mixed-mode surveys, 180 – 181
mobile vs. land-line telephone respondents,
240
unintentional errors by, 293 – 295
variability measurements for, 320 – 322
wrongful methods for gaining, 94
Results, in reports, 443
Return on investment (ROI), marketing research
and, 33 – 34
Revenues, marketing research firm size and,
53 – 54
Reversal of scale endpoints, 299
Review sites, 57 , 96
RIWI Corp., 263
R.J. Reynolds, 109
Rogers Communication, 163 – 164
Role playing, 162 – 163
Role-playing sessions for interviewers, 298
Row percentages table, 392
reporting guidelines, 400
Row percents, 401
Rydholm, Joe, 31 – 33
S Safari hunters, 193
Sales orientation, 35 , 36
Sample, 239
Sample accuracy, 264
Sample error formula, 268
Sample frame error, 239 – 240
Sample plan, development of, 257 – 258
Sample size
arbitrary approach to, 277 – 278
axioms of, 265
calculations, 273 – 274
case studies, 286 – 287
client and researchers agreement on, 277
confidence interval approach, 265 – 271
conventional approach, 278
cost basis of, 279 – 280
data collection costs, 276
determination of, 73 , 77 , 274 – 283
determining using mean, 274
difference analysis, 354
error acceptability, 272
formula for, 271 – 272
level of confidence, 272 – 273 , 275 – 276
margin of sample error and, 267 , 268
nonprobability sampling, 281
percent rule of thumb, 277 – 278
population variability, 267
small populations, 280 – 281
Sample surveys, descriptive research, 99
Sample unit, 239
Sampling distribution concept, 341 – 342
Sampling error, 240
Sampling methods
applications of, 242 – 252
basic concepts, 238 – 240
case study, 260 – 261
census, 238 – 239
cluster sampling, 248 – 250
convenience sampling, 253 – 255
Reference list, in reports, 444
Refusals, in survey research, 301
Regression analysis
basic concepts, 408 , 424
basic principles, 407 – 427
bivariate linear regression, 407 – 410
case studies, 430 – 431
improvements for, 408
multiple regression, 410 – 417
reports to clients, 425
Regression plane, 412
Relationship analysis, 318
Relationships
analytic procedures for, 381
correlation sign of, 383
curvilinear, 379
direction/pattern in, 380 – 381
linear, 378 – 379
monotonic, 379
nonmonotonic, 380
Reliability, of measurements, 215
Report preparation and presentation
alternate methods for presentation, 452 – 455
audience identification, 435 – 436
bar charts, 449
body of reports, 442 – 444
confidence interval report to client, 338 – 339
cross-tabulation analysis, 400
dashboards, 455 – 456
differences analysis, 369
flow diagrams, 451
focus group reports, 150
front matter in report, 437 – 442
hypothesis testing report, 344
importance of, 435
infographics, 455
marketing research, 74
oral reporting, 452
pie charts, 446 – 449
report elements, 438
videos, 454
visuals in, 444 – 451
Representativeness, of test market cities, 109
Requests for proposals (RFPs), 85
Research design, 72
case study, 112 – 113
causal research, 102 – 107
defined, 92
descriptive research, 98 – 101
ethical sensitivity in, 93 – 94
exploratory research, 94 – 98
importance of, 92 – 93
test marketing and, 107 – 109
types of, 93
warnings concerning, 94
Research Now, 195
Research objectives
action standards, 83 – 85
defined, 80 – 81
frames of reference in, 83
in marketing research, 71 , 80 – 81
in marketing research proposal, 85
in reports, 442
Research priorities, in exploratory research, 96
Respondent misunderstanding, 294
Respondents (surveys)
attention loss of, 294 – 295
data collection error, 290
fatigue of, 295
Z03_BURN3261_08_GE_SIDX.indd 487Z03_BURN3261_08_GE_SIDX.indd 487 30/08/16 12:53 pm30/08/16 12:53 pm

488 SUBJECT INDEX
Talking Business, 162 – 163
T and z tests for small sample sizes, 354
Target (store), 286
Target markets, 39
Target return on investment (TOI), 34
Tele-depth interviews (TDIs), 160
Telephone surveys, 60 , 184 – 187 , 184 – 188
mobile vs. land line respondents, 240
Tennis, 117
Terminix Pest Control, 238 , 241
Terminology, in exploratory research, 95
Tesco, 120
Test for small sample sizes, 354
Test marketing
pros and cons of, 109
selecting cities, 109
types of, 107 – 109
Third-person techniques, field research and, 299
Timetable, in marketing research proposal, 86
Timing, critical role in market research of, 70 – 71
Title page, of reports, 438
Toluna, 195
Total Quality Management, 58
Tracking studies, 101 , 134
Transitions, questionnaire design, 225
Transparency Initiative, 59
20/20 Research, 350 – 351
Two-step area sampling, 249
U UK Conservative Party, 162 – 163
Undisguised survey, 223
Unilever, 51 , 455
Unintentional interviewer errors, 291 – 293
United States data, 123
University of George Terry College of
Business, 48 – 49 , 62
Unstructured observation, 147
U.S. Census, 128 – 129 , 238 – 239
User-generated content (UGC), 57 , 96 , 134
U.S. News & World Report, 2015 , 50
U.S. Post Office, 146
V Validation checks, 298 – 299
field data, 297
Validity of experiments
external, 105
internal, 105
research design and, 105 – 106
Valid measure, 215
Variability
measures of, 320 – 322
sample size, 267 , 275
Variables
measurement of, 82
relationships between, 380 – 381
strength of association, 381
Variance, statistical analysis, 322
Variance inflation factor (VIF), multiple
regression analysis, 413 – 414
Verizon, 149
Videos, in reports, 454
Video sharing network, 57
Video surveillance, 61
Vision Council of America, 420
Vision Critical, 195
green flag signals and significance, 354
hypothesis testing, 342 – 344
inference analysis, 318
in marketing research, 52
marketing research applications, 317 – 319
method selection, 322 – 323
parameter estimation, 332 – 337
reports to clients on, 338 – 339 , 344
sample size specification, 278 – 279
SPSS tools for, 323 – 329
statistical inference, 331 – 332
types of, 317 – 319
Statistical efficiency, 252
Statistical inference, 332
Statistical significance of differences, 352
Stepwise multiple regression, 422 – 423
Stock-keeping units (SKUs), 40
internal reports system, 42
market tracking, 101
Stoplight signals, 354
Store image scale, 215
Straight-line formula
linear relationships, 379
Stratified sampling, 250 – 252
accuracy of, 251 – 252
application of, 252
Strength, of relationships, 381
Structured observation, 147
Subdivisions, two-step area sampling, 249
Subheadings, in reports, 444
Subjective properties, 206
Sugging practices, 58 – 59
Super Bowl television advertisements, 164
Supervision, quality control of fieldworkers
credibility of, 58 – 59
data quality in, 296 – 300
mixed-mode surveys, 180 – 181
nonresponse error in, 300 – 304
Supplier, 53
Supply-side research, 53
Surrogate measure, 252
SurveyMonkey, 52
Surveys, 170 – 199 , 174 – 181
advantages of, 172 – 173
case studies, 201 – 203
computer-assisted, advantages of, 177
data collection, 174 – 181 , 174 – 198 , 174 – 199
advantages of, 172 – 173
computer-assisted, advantages of, 177
methods, choosing, 196 – 199
Survey Sampling International, 195 , 245
Symmetric interval scale, 213 – 214
Symptoms, 76 , 77 – 78
Syndicated data, 129 – 132
advantages and disadvantages of, 132
defined, 129
marketing research, 55 , 57
research design and, 72
Systematic sampling, 245 – 249
advantages and disadvantages of, 246 – 248
T Tableau Software, Inc., 432 – 434 , 455
Table of contents, in reports, 440 – 441
Tables, in reports, 441
defined, 446
top-two box scores, 446
Taco Bell, 107
Slope
bivariate linear regression, 407 – 410
linear relationships, 379
Small populations, sample size, 280 – 281
SO1, 108
Social media
data, 134 , 135
exploratory data analysis, 96 – 98
marketing research and, 55
market performance monitoring of, 114 – 115
monitoring/listening, 134 , 136
user-generated content, 57
Social Mention, 136
Social networks, 57
Sony, 77 , 312 – 313
Sort Me Straight projective technique, 163
Sort Me Up projective technique, 163
Sources, referencing, 437
South Africa, safari hunters in, 193
SPSS (Statistical Package for the Social
Sciences)
analysis of variance, 366 – 369
chi-square analysis, 398 – 400
confidence interval for a mean, 337 – 338
cross-tabulation analysis, 389 – 393
data analysis software, 51
data quality controls, 296 – 300
datasets, 305 – 306
descriptive analysis and, 316 – 319
difference analysis using, 351 – 362
differences between means testing, 358 – 360
differences between percentages, group
differences, 358 – 360
frequency distribution and mode from, 325 – 327
hypothesis testing using, 342 – 344
mean, 327
median calculations, 326 – 327
missing data management in, 327
multiple regression analysis, 415 – 417
paired sample differences between means,
371 – 372
Pearson product moment correlation
coefficient, 387 – 389
range, 327
standard deviation, 327 – 329
statistical analysis, 317
stepwise multiple regression, 422
Stable difference, 353
Stacked bar charts, 401
Standard deviation
determination of, 327 – 329
formula for, 322
statistical analysis, 321 – 322
Standard error
differences between means, 359 – 360
parameter estimation, 333 – 334
Standardized beta coefficient, 418
Standard sample size formula, 271 – 272
Standard test market, 107
Stapel scale, 212
Stars, in visual scales, 213
Statisitical theory, 51
Statistic, defined, 122 , 331 – 332
Statistical analysis, 316 – 344
association analysis, 318
Chi-square statistic, 393 – 399
confidence intervals, 337 – 338
descriptive analysis, 317 , 319 – 322
difference analysis, 318
Z03_BURN3261_08_GE_SIDX.indd 488Z03_BURN3261_08_GE_SIDX.indd 488 30/08/16 12:53 pm30/08/16 12:53 pm

SUBJECT INDEX 489
data quality, 307
differences between means testing, 362
fully automated survey, 188
initial steps of new project, 76
Internet of Things, 137
Likert scale, 210
“man on the street” interviews, 95
marketing research, 41
measures of central tendency, 320 , 322
nonprobability sampling, 254
nonresponse, 293
online questionnaire design, 216
online survey, 189
Open Data Policy, 123
Pearson product moment correlation, 389
plagiarism on, 436
product testing, 109
proportion differences tests, 358
random sampling, 245
results presentation, 452
sample frames, 240
sample size, 271 , 273
sampling plan, 258
social media command center, 136
stepwise regression, 422
stratified sampling, 252
survey questions, 221
surveys, conducting, 182
survey software, 227
variable measurement scales, 207
Z ZappiStore, 70
z tests for small sample sizes, 354
appendices, 444
body of the paragraph, 445
conclusions, 443
end matter, 444
endnotes, 444
front matter, 437 – 442
headings, 444
introduction, 442
letter/memo of transmittal, 439 – 440
letter of authorization, 438
limitations of research, 443
list of illustrations/tables/figures, 441
method/methodology, 442 – 443
recommendations, 443 – 444
reference list, 444
research objectives, 442
results, 443
style, 445
subheadings, 444
table of contents, 440 – 441
target audience, 435 – 436
title page, 438
topic sentence, 445
transitional sentence, 445
visuals, 444 – 451
Y Yea-saying patterns, raw data inspection, 307
Yellow Pages, 240
YouTube
analysis of variance, 369
chi-square analysis, 400
confidence intervals, 336
data code book, 306
Visuals, in reports, 446 – 451
bar charts, 449 – 451
drawings, 446
flow diagrams, 451
graphs and charts, 446 – 451
line graphs, 449
pie charts, 446 – 449
tables, 446
types of, 446
Visual scales, 213
W Walkman, Sony, 77
Walmart, 44
Warm-up questions, 224 – 225
Warner-Lambert, 153
Wearables, 136
Wearable technology, 136
Web-based communities and forums, 57
Weighted mean, stratified sampling, 251 – 252
Wendy’s, 95 , 146 , 380
Westat Inc., 54
“Where We Are,” eleven-step marketing
research process and, 69
Whirlpool, 147
Wimbledon, IBM and, 117
Women’s Tennis Association (WTA), SAP and,
117
Wood MacKenize, 54
Word-of-mouth (WOM ) influence, 103
Workhorse scale, 209
Worst-case variability, 275
Written report
abstract/executive summary, 441 – 442
Z03_BURN3261_08_GE_SIDX.indd 489Z03_BURN3261_08_GE_SIDX.indd 489 30/08/16 12:53 pm30/08/16 12:53 pm

A01_MISH4182_11_GE_FM.indd 6 10/06/15 11:46 am
This page intentionally left blank

A01_MISH4182_11_GE_FM.indd 6 10/06/15 11:46 am
This page intentionally left blank

A01_MISH4182_11_GE_FM.indd 6 10/06/15 11:46 am
This page intentionally left blank

A01_MISH4182_11_GE_FM.indd 6 10/06/15 11:46 am
This page intentionally left blank

A01_MISH4182_11_GE_FM.indd 6 10/06/15 11:46 am
This page intentionally left blank

A01_MISH4182_11_GE_FM.indd 6 10/06/15 11:46 am
This page intentionally left blank

A01_MISH4182_11_GE_FM.indd 6 10/06/15 11:46 am
This page intentionally left blank

This is a special edition of an established title widely used by colleges and universities throughout the world. Pearson published this exclusive edition for the benefit of students outside the United States and Canada. If you purchased this book within the United States or Canada, you should be aware that it has been imported without the approval of the Publisher or Author.
Pearson Global Edition
GlobAl edITIon
For these Global editions, the editorial team at Pearson has collaborated with educators across the world to address a wide range of subjects and requirements, equipping students with the best possible learning tools. This Global edition preserves the cutting-edge approach and pedagogy of the original, but also features alterations, customization, and adaptation from the north American version.
GlobAl edITIon
Marketing Research
Marketing ResearcheIGHTH edITIon
Alvin C. Burns • Ann Veeck • Ronald F. Bush
Glo
bA
l ed
ITIo
nBurns • Veeck • Bush
eIGH
TH
ed
ITIo
n
Burns_08_1292153261_Final.indd 1 18/08/16 6:54 AM
Copyright © 2022 FDOKUMEN