
Market Update 2014 27th Edition September 2014 Edited by Katie Hughes Toys & Games
52
Market Update 2014 27th Edition September 2014 Edited by Katie Hughes ISBN 978-1-78304-211-1 Toys & Games
-
Upload
independent -
Category
Documents
-
view
0 -
download
0
Transcript of Market Update 2014 27th Edition September 2014 Edited by Katie Hughes Toys & Games

Market Update 2014
27th Edition September 2014Edited by Katie Hughes
ISBN 978-1-78304-211-1
Toys & Games

In today’s competitive business environment, knowledge and understanding of yourmarketplace is essential. With over 30 years’ experience producing highly respectedoff-the-shelf publications, Key Note has built a reputation as the number one sourceof UK market information. Below are just a few of the comments our business partnersand clients have made on Key Note’s range of reports.
“The test of any marketing strategy and plan lies in the quality of information used, upon whichmarketing judgments and decisions are based. Quality is the key word here. The Key Notereports are an excellent source of such quality information, covering a wide variety of productsectors.”
The Chartered Institute of Marketing
“I regard Key Note as the number one provider of UK market research. The way Key Notecontent is packaged and presented is appealing and easy to understand and therefore a mustfor my taught course students. Its products are complemented by remarkably high levels ofcustomer service.”
University of Cambridge, Judge Business School
“Key Note is one of the most dynamic and intuitive products the department subscribes to. Ithas also remained one of the most-used services for a number of years. The combination ofmarket reports, linked to real company data, within one product, is particularly useful. Theconstant investment and desire to improve the service sets it aside from a number of otherorganisations and I look forward to working with them for many years to come.”
Jack Mears, Knowledge and Information Partner, Department for Business,Innovation and Skills
“Key Note is the Swiss Army knife of report platforms, incorporating both consumer and B2Bresearch (not to mention Companies House data). It therefore has a comprehensive line-up oftitles, all of which are frequently updated. I like the fact that the analysis within the reports isbased on ‘hard data’, through a combination of in-house and external sources. As a result, usingKey Note is a great way to keep up-to-speed on a variety of markets, sectors, products andbrands and it’s a great tool to have on hand for new business and strategy development.”
Jim Clark, Head of Insight, IPA
Toys & Games Foreword
© Key Note Ltd 2014
Contents
Introduction & Definition 1
REPORT COVERAGE....................................................................................................................1
MARKET SECTORS.......................................................................................................................1
1. Executive Summary 2
2. What’s KEY in the Market? 3
KEY DRIVERS.................................................................................................................................3
MARKET TRENDS.........................................................................................................................3
Child Population.............................................................................................................................3
Table 2.1: UK Child Population by Age (000), 2009-2013......................................................4
Number of Live Births...................................................................................................................4
Table 2.2: Number of Live Births and Total Fertility Rates in England and Wales(000 and number), 2009-2013.....................................................................................................5
Figure 2.1: Number of Live Births and Total Fertility Rates in England and Wales(000), 2009-2013.............................................................................................................................5
Household Activity.........................................................................................................................6
Table 2.3: People in Households by Type of Household and Combined EconomicActivity Status of Household Members in the UK (000), April to June 2009-2013...........6
Tablets vs. Traditional Toys..........................................................................................................8
Hamleys’ Top 10 List 2014............................................................................................................9
’Pocket-Money’ Toy Volume Fall................................................................................................9Trends in Distribution.................................................................................................................10
ECONOMIC TRENDS..................................................................................................................10
Table 2.4: UK Economic Trends (000, £m, million and £), 2009-2013................................11
KEY CURRENT ISSUES...............................................................................................................13
HOW ROBUST IS THE MARKET?...........................................................................................13
3. Market Size, Segmentation & Forecasts 15
MARKET SIZE & SEGMENTATION.........................................................................................15
The Total Market.........................................................................................................................15
Table 3.1: The Total UK Market for Traditional Toys and Games by Value(£m at rsp), 2009-2013.................................................................................................................15
Toys & Games Contents
© Key Note Ltd 2014
Figure 3.1: The Total UK Market for Traditional Toys and Games by Value(£m at rsp), 2009-2013.................................................................................................................15
Market Sectors..............................................................................................................................16
Table 3.2: The Total UK Market for Traditional Toys and Games by Product Sectorby Value (£m at rsp), 2013..........................................................................................................16
Figure 3.2: The Total UK Market for Traditional Toys and Games by Product Sectorby Value (£m at rsp), 2013..........................................................................................................17
Infant/Pre-School Toys and Games...........................................................................................17
Activity Toys..................................................................................................................................17
Dolls................................................................................................................................................18
Games and Puzzles......................................................................................................................18
Outdoor and Sports Toys and Games......................................................................................19
Vehicles..........................................................................................................................................19
Action Toys....................................................................................................................................19
Electronic Toys..............................................................................................................................19
Plush Toys......................................................................................................................................20
Other Products..............................................................................................................................20
MARKET POSITION....................................................................................................................20
The UK............................................................................................................................................20
Table 3.3: Consumer Expenditure on Games, Toys and Hobbies and Total DomesticExpenditure in the UK (£m), 2009-2013..................................................................................21
OVERSEAS TRADE......................................................................................................................21
General Overview........................................................................................................................21
Table 3.4: UK Trade Balance of Toys and Games by Value (£m), 2009-2013...................22
Figure 3.3: UK Trade Balance of Toys and Games by Value (£m), 2009-2013..................22
Exports............................................................................................................................................23
Table 3.5: UK Exports of Toys and Games by Value (£000 and %), 2012 and 2013.......23
Imports...........................................................................................................................................24
Table 3.6: UK Imports of Toys and Games by Value (£000 and %), 2012 and 2013.......24
FORECASTS..................................................................................................................................25
Future Trends................................................................................................................................25
Forecast Economic Trends..........................................................................................................25
Table 3.7: Forecast Economic Trends (000, %, million), 2014-2018...................................26
Toy Renting...................................................................................................................................26
Upcoming Toy Merchandising Opportunities........................................................................27
Forecast Total Market.................................................................................................................27
Table 3.8: The Forecast Total UK Market for Traditional Toys and Games by Value(£m at rsp), 2014-2018.................................................................................................................27
MARKET GROWTH....................................................................................................................27
Figure 3.4: Growth in the Total UK Market for Traditional Toys and Games by Value(£m at rsp), 2009-2018.................................................................................................................28
Toys & Games Contents
© Key Note Ltd 2014
4. Strengths, Weaknesses, Opportunities & Threats 29
STRENGTHS..................................................................................................................................29
WEAKNESSES..............................................................................................................................29
OPPORTUNITIES.........................................................................................................................30
THREATS.......................................................................................................................................31
5. PESTEL 32
POLITICAL ....................................................................................................................................32
Counterfeit Toys...........................................................................................................................32
ECONOMIC .................................................................................................................................32
Improving Economy Boosts Toys and Games Sales...............................................................32
SOCIAL .........................................................................................................................................33
Gender Stereotypes.....................................................................................................................33
TECHNOLOGICAL ......................................................................................................................33
New Generation of Video Gaming Consoles..........................................................................33
Internet Access in the UK...........................................................................................................34
Table 7.1: Internet Penetration Rates in the UK by Sex and Age (%), Q12011-2014......................................................................................................................................35
Tablet Computer Penetration...................................................................................................35
ENVIRONMENTAL ....................................................................................................................36
Going Green With Eco-Friendly Toys.......................................................................................36
LEGISLATIVE ...............................................................................................................................37
General Legislation......................................................................................................................37
New Toy Safety Directive............................................................................................................37
6. Company Financials 39
7. Further Sources 40
Publications.................................................................................................................................40
Government Publications ......................................................................................................40
Key Note Research 41
The Key Note Range of Reports 42
Toys & Games Contents
© Key Note Ltd 2014
Introduction & Definition
REPORT COVERAGE
This Key Note Market Update analyses and evaluates the UK market fortraditional toys and games. The scope of products covered by this report focusspecifically on toys and games targeted towards those aged under 14, but mayalso include some that are bought and used by adults. It should be noted thatdespite this report not explicitly covering electronic products such as video,personal computer (PC), and console games and systems, toys and games whichcontain an electronic element that target the under-14s age group have beenincluded. In addition, such items may be discussed, where relevant, in relationto their competition to the traditional toys and games market.
MARKET SECTORS
This Key Note Market Update predominantly focuses on the traditional toysand games market, which has been sub-categorised into the following sectorsfor the purposes of more thorough analysis:
• action toys — e.g. action figures, wrestling toys, toy guns, etc.
• activity toys — e.g. building and construction sets, and arts and crafts
• dolls
• electronic toys — e.g. educational computers and electronic learning aids(ELAs)
• games and puzzles — e.g. board games, jigsaws and other puzzle games
• infant/pre-school toys and games — e.g. toys targeting children aged 5 andunder
• outdoor and sports toys and games — e.g. outdoor playsets, swings,playhouses, trampolines and climbing frames
• plush toys — e.g. stuffed toys and teddy bears
• vehicles — e.g. toy cars, trains and planes
• other products — e.g. dressing-up clothes and pocket-money novelties, etc.
Toys & Games Introduction & Definition
© Key Note Ltd 2014 1
1. Executive Summary
Key Note estimates that between 2009 and 2013, the overall value of the UKmarket for traditional toys and games grew by 6.6%, although growth in themarket has failed to maintain consistency, with a decline of 1.1% in 2012 forinstance. These fluctuations between growth and decline are, in part, a resultof the economic downturn, with growth continuing to remain unstablefollowing the recession of 2008/2009.
The UK market for toys and games is also suffering from underinvestment innew product development (NPD) across Europe, in addition to the decliningpresence of high-street toy retailers, such as Modelzone and the Early LearningCentre (ELC). Downwards pressure has also been put on the market by theinflux of discount and value toy retailers, particularly online retailers such asAmazon.com, which are able to offer prices beneath those seen at traditionaltoy retailers.
Figures from National Statistics suggest a continuing consumer base for toysand games, with the number of children aged 14 and under in the UKcontinuing to exhibit signs of growth between 2009 and 2013, with furtherincreases forecast in the future. However, despite these trends, fears have beenraised about the enduring appeal of digital and electronic products, which areincreasingly taking up a greater share of children’s time at the expense ofplaying with traditional toys. In order to combat this, toymakers have investedconsiderable sums of money in developing new hybrid game-toy products, suchas the popular console playset game Skylanders, which is now thought to beworth in excess of $1bn. In addition, the ascent of digital and electronic gamingcontent has in some cases spurned successful traditional toy and game productlines, perhaps most notably the Angry Birds franchise.
These new trends, in addition to the improving economic fortunes of the UKand increases in new product development (NPD), are anticipated to lift thevalue of sales for toys and games in the UK in 2014 and onwards, withnoticeably stronger growth coming from online retailing distributors, mostlikely at the expense of sales in-store.
Key Note forecasts that the UK market for toys and games will grow at anaverage annualised pace of between 1.9% and 2.8% between 2014 and 2018,with the value of the market rising by 10.9% over the forecast period as awhole.
Toys & Games Executive Summary
© Key Note Ltd 2014 2

2. What’s KEY in the Market?
KEY DRIVERS
• The toys and games industry in the UK and around the world sawsubstantially reduced new product development (NPD) in the aftermath ofthe 2008/2009 recession. However, in the midst of improving global economicfortunes, investment in the development of the industry is expected toincrease in coming years, offering a considerable boost to the market.
• Toys and games remain extremely popular forms of gift-giving, meaning themarket is most profitable during peak seasons, notably Christmas. Themarket currently looks forward to Christmas 2014 with optimism as consumerexpenditure on gift-giving is expected to rise year-on-year.
• An improving economic outlook in the UK will make consumers more willingthan in previous years to spend money on toys and games.
• Increasingly, the importance of electronic and digital innovations isbecoming more prevalent in the toys and games industry, as the market looksto cope with increasing competition from items such as smartphones andtablet computers, which are taking up an ever greater proportion ofchildren’s spare time.
• Healthy population growth in the under-14s age group will contribute to asteadily growing consumer base for the foreseeable future.
• Character licensing provides new opportunities for product sales, and canprove particularly popular as new television programmes and films arereleased. Most significantly in the future, the industry will look forward tothe upcoming new Star Wars film trilogy, which is anticipated to boost toysales for the franchise.
MARKET TRENDS
Child Population
According to figures from National Statistics, the population of children in theUK aged 14 and under grew at a relatively steady year-on-year rate between2009 and 2013, rising by 2.3% overall and reaching a projected figure of11.3 million at the end of the 5-year review period.
Toys & Games What’s KEY in the Market?
© Key Note Ltd 2014 3
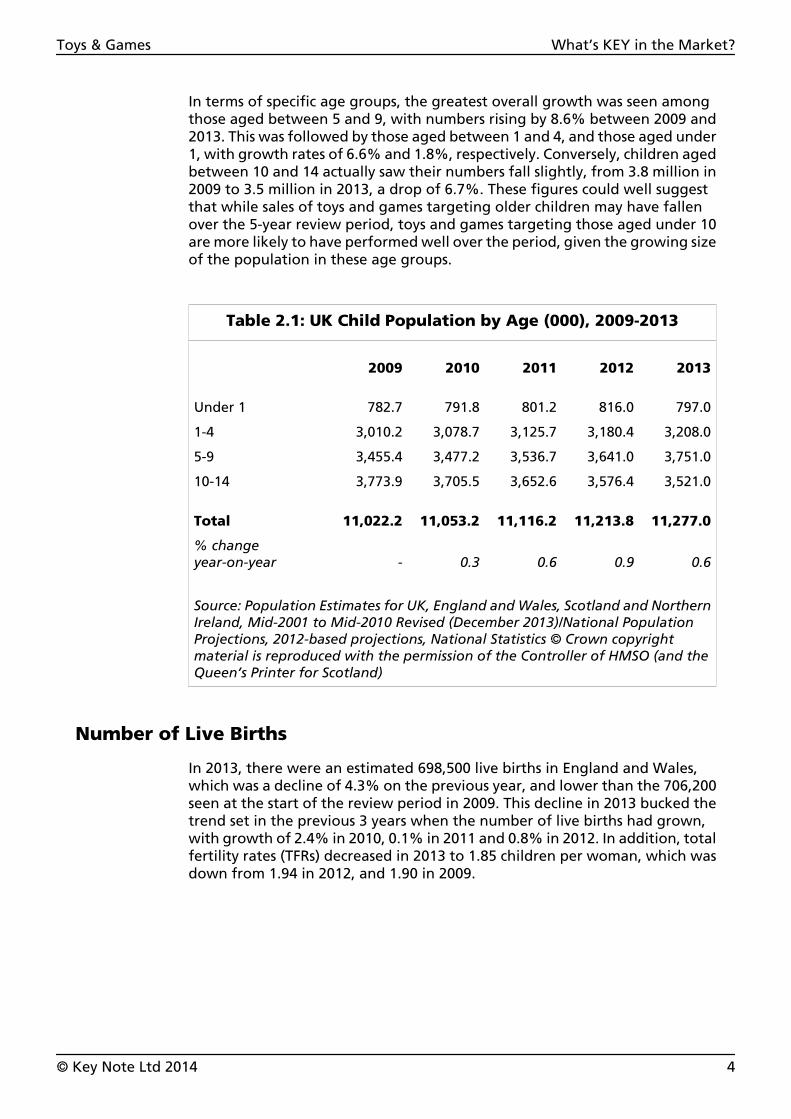
In terms of specific age groups, the greatest overall growth was seen amongthose aged between 5 and 9, with numbers rising by 8.6% between 2009 and2013. This was followed by those aged between 1 and 4, and those aged under1, with growth rates of 6.6% and 1.8%, respectively. Conversely, children agedbetween 10 and 14 actually saw their numbers fall slightly, from 3.8 million in2009 to 3.5 million in 2013, a drop of 6.7%. These figures could well suggestthat while sales of toys and games targeting older children may have fallenover the 5-year review period, toys and games targeting those aged under 10are more likely to have performed well over the period, given the growing sizeof the population in these age groups.
Table 2.1: UK Child Population by Age (000), 2009-2013
2009 2010 2011 2012 2013
Under 1 782.7 791.8 801.2 816.0 797.0
1-4 3,010.2 3,078.7 3,125.7 3,180.4 3,208.0
5-9 3,455.4 3,477.2 3,536.7 3,641.0 3,751.0
10-14 3,773.9 3,705.5 3,652.6 3,576.4 3,521.0
Total 11,022.2 11,053.2 11,116.2 11,213.8 11,277.0
% changeyear-on-year - 0.3 0.6 0.9 0.6
Source: Population Estimates for UK, England and Wales, Scotland and NorthernIreland, Mid-2001 to Mid-2010 Revised (December 2013)/National PopulationProjections, 2012-based projections, National Statistics © Crown copyrightmaterial is reproduced with the permission of the Controller of HMSO (and theQueen’s Printer for Scotland)
Number of Live Births
In 2013, there were an estimated 698,500 live births in England and Wales,which was a decline of 4.3% on the previous year, and lower than the 706,200seen at the start of the review period in 2009. This decline in 2013 bucked thetrend set in the previous 3 years when the number of live births had grown,with growth of 2.4% in 2010, 0.1% in 2011 and 0.8% in 2012. In addition, totalfertility rates (TFRs) decreased in 2013 to 1.85 children per woman, which wasdown from 1.94 in 2012, and 1.90 in 2009.
Toys & Games What’s KEY in the Market?
© Key Note Ltd 2014 4

Table 2.2: Number of Live Births and Total Fertility Ratesin England and Wales (000 and number), 2009-2013
2009 2010 2011 2012 2013
Live births (000) 706.2 723.2 723.9 729.7 698.5
% changeyear-on-year - 2.4 0.1 0.8 -4.3
Total fertility rate† 1.90 1.94 1.93 1.94 1.85
† — the average number of live children that a group of women would bear if theyexperienced the age-specific fertility rates of the calendar year in question throughouttheir childbearing lifespan
Source: Birth Summary Tables, England and Wales, 2013, National Statistics ©Crown copyright material is reproduced with the permission of the Controller ofHMSO (and the Queen’s Printer for Scotland)
Figure 2.1: Number of Live Births and Total Fertility Ratesin England and Wales (000), 2009-2013
2009 2010 2011 2012 2013697.5
700.0
702.5
705.0
707.5
710.0
712.5
715.0
717.5
720.0
722.5
725.0
727.5
730.0
Source: Birth Summary Tables, England and Wales, 2013, National Statistics ©Crown copyright material is reproduced with the permission of the Controllerof HMSO (and the Queen’s Printer for Scotland)/Key Note
Toys & Games What’s KEY in the Market?
© Key Note Ltd 2014 5

Household Activity
According to data from National Statistics, between 2009 and 2013, thenumber of working households with dependent children has grown from7.6 million to 7.9 million, and while the number of these houses consisting ofa lone parent has remained relatively unchanged (at 904,000 in 2009 and905,000 in 2013), the number of such houses which feature a couple livingtogether has grown from 6.6 million to 6.8 million. Overall, in 2013, there were20.2 million working households, of which 7.9 million were households withdependent children, while 12.4 million were households without dependentchildren. This compares similarly to 2009, when there was a total of 20.2 millionworking households, with 7.6 million containing dependent children, and12.6 million with no dependent children.
The overall number of mixed households in the UK (which contain bothworking and non-working members) grew from 14.1 million to 15.1 millionbetween 2009 and 2013. Of this 15.1 million in 2013, 7.7 million householdscontained dependent children, while 7.5 million did not.
Over the period from 2009 to 2013, with the unemployment rate steadilyfalling, there has been a decrease in the number of workless households in theUK, from 5.4 million in 2009 to 4.9 million in 2013. This fall typically bodes wellfor the toys and games market, particularly in workless households whichcontain dependent children, as working households often possess higher levelsof disposable income, thus boosting their consumption.
Table 2.3: People in Households by Type of Householdand Combined Economic Activity Status of Household
Members in the UK (000), April to June 2009-2013
2009 2010 2011 2012 2013
Working Households
Households with dependent children†
Lone parent 904 928 926 941 905
Couple 6,632 6,572 6,452 6,605 6,846
Other household types 106 100 100 130 134
Total households withdependent children 7,642 7,599 7,478 7,676 7,884
Households without dependentchildren 12,596 12,382 12,646 12,256 12,357
Total working households 20,238 19,981 20,124 19,932 20,241
Table continues...
Toys & Games What’s KEY in the Market?
© Key Note Ltd 2014 6

Table 2.3: People in Households by Type of Householdand Combined Economic Activity Status of Household
Members in the UK (000), April to June 2009-2013
...table continued
2009 2010 2011 2012 2013
Mixed Households‡
Households with dependent children†
Lone parent 879 873 865 912 861
Couple 6,022 6,300 6,315 6,261 6,245
Other household types 464 428 467 567 554
Total households withdependent children 7,365 7,601 7,647 7,740 7,661
Households without dependentchildren 6,776 6,961 7,025 7,490 7,455
Total mixed households 14,140 14,562 14,671 15,230 15,115
Workless Households
Households with dependent children†
Lone parent 930 901 926 857 824
Couple 750 699 660 634 633
Other household types 50 37 32 43 57
Total households withdependent children 1,730 1,637 1,618 1,534 1,514
Table continues...
Toys & Games What’s KEY in the Market?
© Key Note Ltd 2014 7
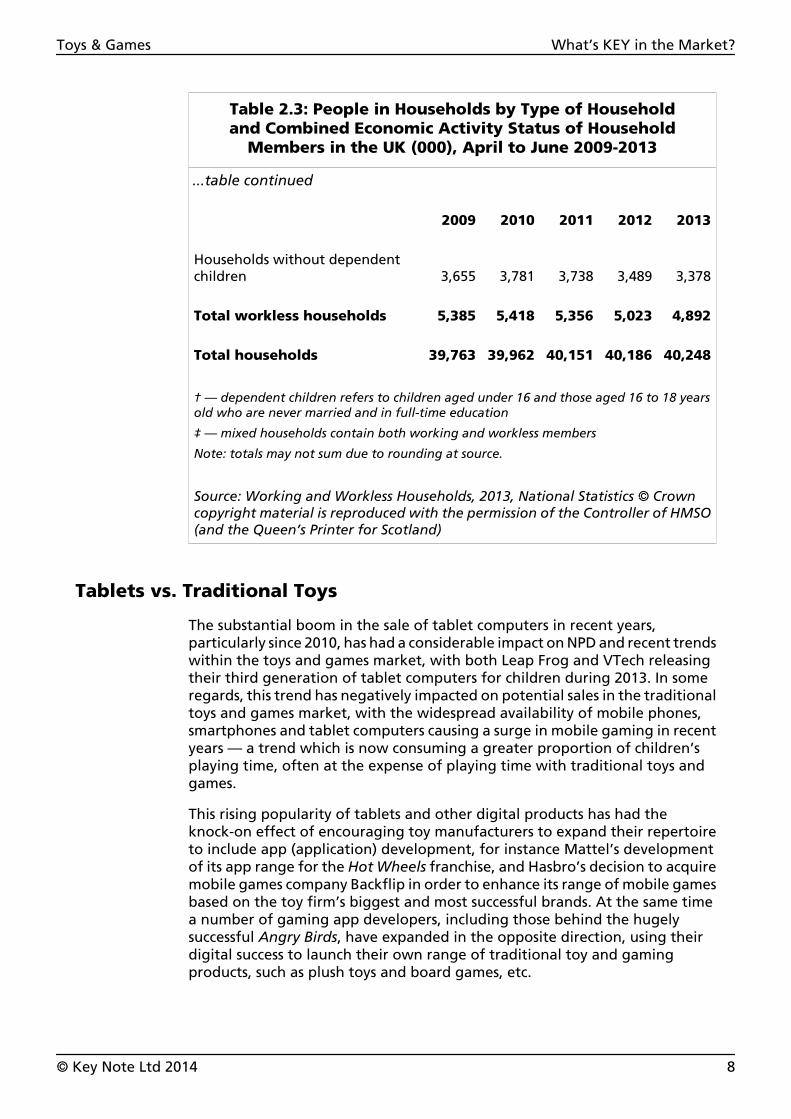
Table 2.3: People in Households by Type of Householdand Combined Economic Activity Status of Household
Members in the UK (000), April to June 2009-2013
...table continued
2009 2010 2011 2012 2013
Households without dependentchildren 3,655 3,781 3,738 3,489 3,378
Total workless households 5,385 5,418 5,356 5,023 4,892
Total households 39,763 39,962 40,151 40,186 40,248
† — dependent children refers to children aged under 16 and those aged 16 to 18 yearsold who are never married and in full-time education
‡ — mixed households contain both working and workless members
Note: totals may not sum due to rounding at source.
Source: Working and Workless Households, 2013, National Statistics © Crowncopyright material is reproduced with the permission of the Controller of HMSO(and the Queen’s Printer for Scotland)
Tablets vs. Traditional Toys
The substantial boom in the sale of tablet computers in recent years,particularly since 2010, has had a considerable impact on NPD and recent trendswithin the toys and games market, with both Leap Frog and VTech releasingtheir third generation of tablet computers for children during 2013. In someregards, this trend has negatively impacted on potential sales in the traditionaltoys and games market, with the widespread availability of mobile phones,smartphones and tablet computers causing a surge in mobile gaming in recentyears — a trend which is now consuming a greater proportion of children’splaying time, often at the expense of playing time with traditional toys andgames.
This rising popularity of tablets and other digital products has had theknock-on effect of encouraging toy manufacturers to expand their repertoireto include app (application) development, for instance Mattel’s developmentof its app range for the Hot Wheels franchise, and Hasbro’s decision to acquiremobile games company Backflip in order to enhance its range of mobile gamesbased on the toy firm’s biggest and most successful brands. At the same timea number of gaming app developers, including those behind the hugelysuccessful Angry Birds, have expanded in the opposite direction, using theirdigital success to launch their own range of traditional toy and gamingproducts, such as plush toys and board games, etc.
Toys & Games What’s KEY in the Market?
© Key Note Ltd 2014 8
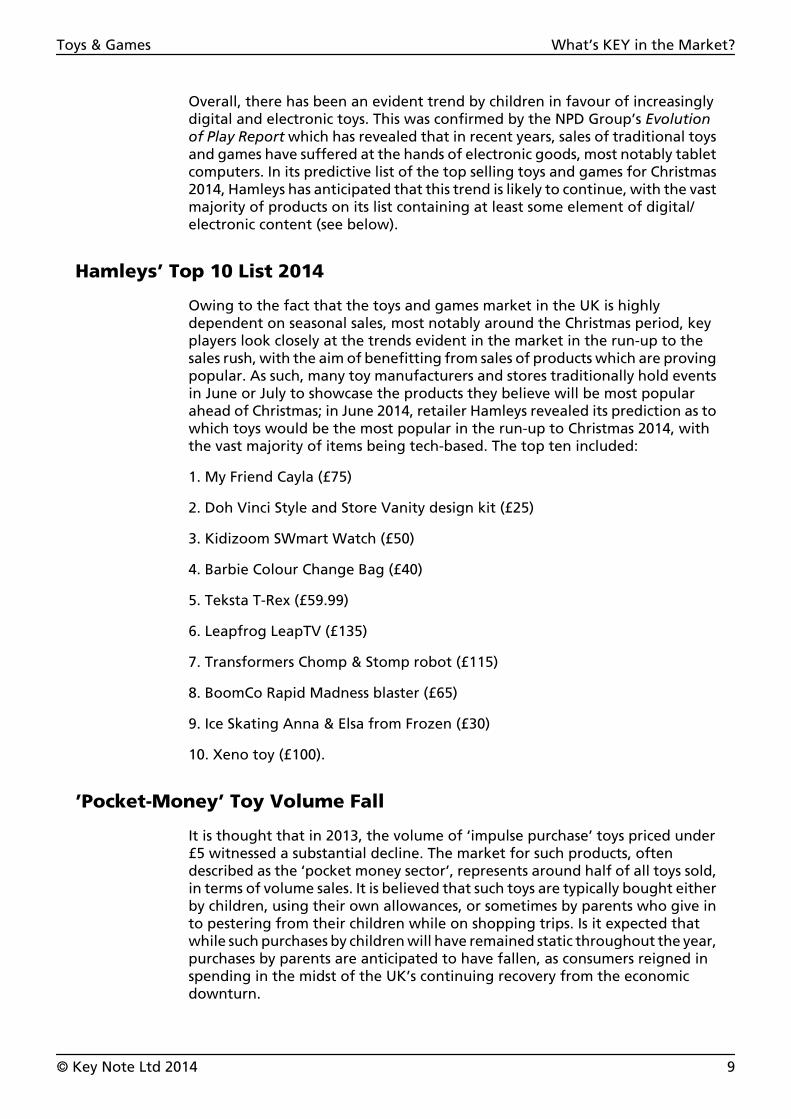
Overall, there has been an evident trend by children in favour of increasinglydigital and electronic toys. This was confirmed by the NPD Group’s Evolutionof Play Report which has revealed that in recent years, sales of traditional toysand games have suffered at the hands of electronic goods, most notably tabletcomputers. In its predictive list of the top selling toys and games for Christmas2014, Hamleys has anticipated that this trend is likely to continue, with the vastmajority of products on its list containing at least some element of digital/electronic content (see below).
Hamleys’ Top 10 List 2014
Owing to the fact that the toys and games market in the UK is highlydependent on seasonal sales, most notably around the Christmas period, keyplayers look closely at the trends evident in the market in the run-up to thesales rush, with the aim of benefitting from sales of products which are provingpopular. As such, many toy manufacturers and stores traditionally hold eventsin June or July to showcase the products they believe will be most popularahead of Christmas; in June 2014, retailer Hamleys revealed its prediction as towhich toys would be the most popular in the run-up to Christmas 2014, withthe vast majority of items being tech-based. The top ten included:
1. My Friend Cayla (£75)
2. Doh Vinci Style and Store Vanity design kit (£25)
3. Kidizoom SWmart Watch (£50)
4. Barbie Colour Change Bag (£40)
5. Teksta T-Rex (£59.99)
6. Leapfrog LeapTV (£135)
7. Transformers Chomp & Stomp robot (£115)
8. BoomCo Rapid Madness blaster (£65)
9. Ice Skating Anna & Elsa from Frozen (£30)
10. Xeno toy (£100).
’Pocket-Money’ Toy Volume Fall
It is thought that in 2013, the volume of ‘impulse purchase’ toys priced under£5 witnessed a substantial decline. The market for such products, oftendescribed as the ‘pocket money sector’, represents around half of all toys sold,in terms of volume sales. It is believed that such toys are typically bought eitherby children, using their own allowances, or sometimes by parents who give into pestering from their children while on shopping trips. Is it expected thatwhile such purchases by children will have remained static throughout the year,purchases by parents are anticipated to have fallen, as consumers reigned inspending in the midst of the UK’s continuing recovery from the economicdownturn.
Toys & Games What’s KEY in the Market?
© Key Note Ltd 2014 9
Trends in Distribution
Toys and games can be distributed in a number of ways, ranging from onlinesellers to supermarkets and specialist shops. Although traditional, high-streetretailers including The Entertainer, Mothercare, The Disney Store, the EarlyLearning Centre (ELC) and Toys ‘R’ Us continue to possess a substantial shareof the market in terms of distribution, such stores have suffered in recent yearsas a result of increased competition among alternative distributors, such assupermarkets, discount stores and online retailers, including Amazon, eBayand Play.com; many of these distributors are able to provide a considerablerange of toys and games at prices cheaper than those witnessed in high-streetstores. Of particular note is supermarkets, which have increasingly devoted agreater amount of shelf space to non-food lines, including children’s toys andgames — a trend particularly evident during peak seasons such as Christmas.Overall, an obvious trend exists in which consumers are increasingly opting topurchase toys and game products via online means; however, at least for theforeseeable future, tangible in-store sales of such products will continue tocommand a substantial share of overall sales.
ECONOMIC TRENDS
According to data released by National Statistics, the population of the UKcontinued to rise at a healthy annual rate of between 0.6% and 0.8% between2009 and 2013, to reach a projected 64.1 million. This trend was assisted by theUK’s relatively high birth rate and ageing population, in addition to positivelevels of net migration. The growing population should, in theory, result in anoverall boost in consumer spending, which in turn will benefit the widereconomy, including the UK market for toys and games. In particular, the UK’srelatively high birth rate will result in a steady and consistent number ofchildren in the UK, which would be a positive development for the prospect ofthe UK’s toys and games market.
Despite the UK’s economic performance following on from the 2008/2009recession being somewhat inconsistent, recently the country has begun toexhibit more positive signs of stabilisation and growth. In 2013, the UK grewat an annualised pace of 1.7%, with the country anticipated to be thefastest-growing economy in the Group of 7 (G7) nations in 2014. Although thisis a positive development for the UK, it should be remembered that grossdomestic product (GDP) was only able to match its pre-recession peak in thelatter half of 2014.
The 2008/2009 recession and subsequent economic difficulties caused anoticeable fall in the level of inflation in the country, with the UK brieflyentering a deflationary period in 2009, with prices dropping by 0.5%year-on-year. Actions by the Bank of England (BoE), including droppinginterest rates to a historic low of 0.5% and launching a quantitative easing (QE)program worth £375bn, helped to push inflation to a peak of 5.2% in 2011;this steadily fell to 3.2% in 2012 and 3% in 2013. Inflation, as measured by theconsumer price index (CPI), fell to 2% in December 2013, in line with the BoE’starget, and as of July 2014 was at 1.6%.
Toys & Games What’s KEY in the Market?
© Key Note Ltd 2014 10
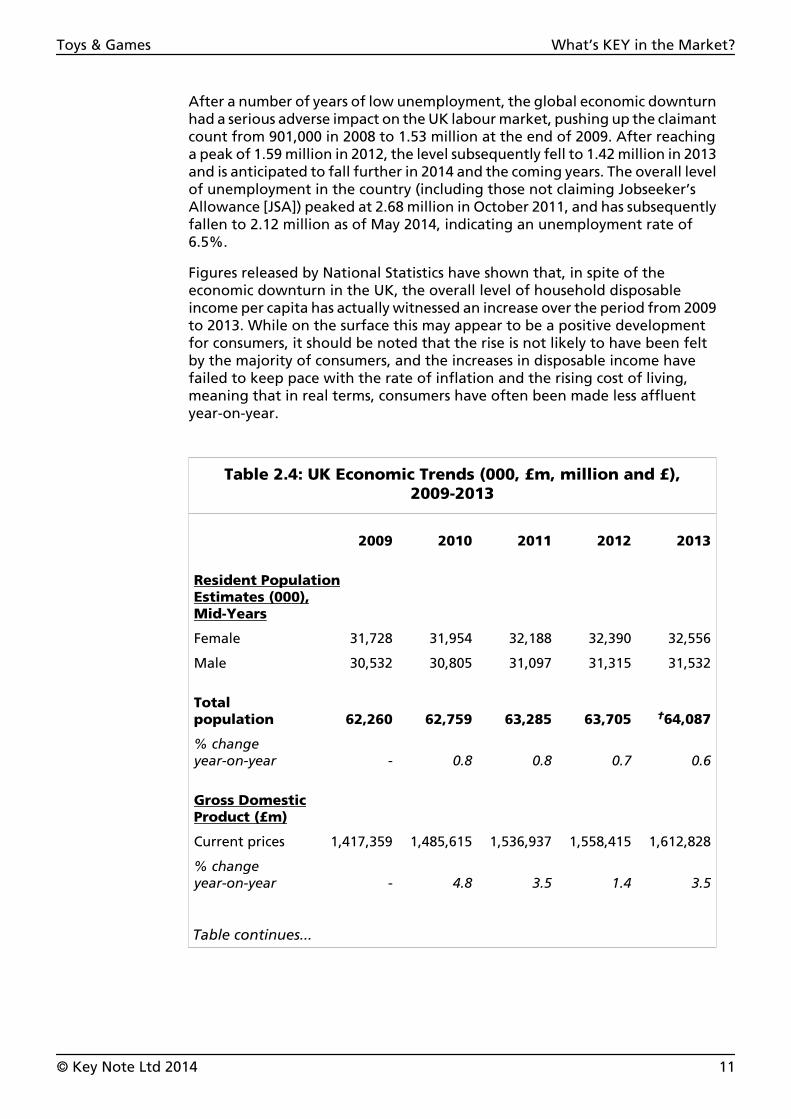
After a number of years of low unemployment, the global economic downturnhad a serious adverse impact on the UK labour market, pushing up the claimantcount from 901,000 in 2008 to 1.53 million at the end of 2009. After reachinga peak of 1.59 million in 2012, the level subsequently fell to 1.42 million in 2013and is anticipated to fall further in 2014 and the coming years. The overall levelof unemployment in the country (including those not claiming Jobseeker’sAllowance [JSA]) peaked at 2.68 million in October 2011, and has subsequentlyfallen to 2.12 million as of May 2014, indicating an unemployment rate of6.5%.
Figures released by National Statistics have shown that, in spite of theeconomic downturn in the UK, the overall level of household disposableincome per capita has actually witnessed an increase over the period from 2009to 2013. While on the surface this may appear to be a positive developmentfor consumers, it should be noted that the rise is not likely to have been feltby the majority of consumers, and the increases in disposable income havefailed to keep pace with the rate of inflation and the rising cost of living,meaning that in real terms, consumers have often been made less affluentyear-on-year.
Table 2.4: UK Economic Trends (000, £m, million and £),2009-2013
2009 2010 2011 2012 2013
Resident PopulationEstimates (000),Mid-Years
Female 31,728 31,954 32,188 32,390 32,556
Male 30,532 30,805 31,097 31,315 31,532
Totalpopulation 62,260 62,759 63,285 63,705 †64,087
% changeyear-on-year - 0.8 0.8 0.7 0.6
Gross DomesticProduct (£m)
Current prices 1,417,359 1,485,615 1,536,937 1,558,415 1,612,828
% changeyear-on-year - 4.8 3.5 1.4 3.5
Table continues...
Toys & Games What’s KEY in the Market?
© Key Note Ltd 2014 11

Table 2.4: UK Economic Trends (000, £m, million and £),2009-2013
...table continued
2009 2010 2011 2012 2013
Annualchain-linked GDP 1,461,361 1,485,616 1,502,216 1,506,388 1,532,652
% changeyear-on-year - 1.7 1.1 0.3 1.7
Rate of Inflation (%)
Inflation -0.5 4.6 5.2 3.2 3.0
Percentage pointchangeyear-on-year - 5.1 0.6 -2.0 -0.2
Actual Number ofUnemployed Personsin the UK (million)
Actual number ofclaimants 1.53 1.50 1.53 1.59 1.42
% changeyear-on-year - -2.0 2.0 3.9 -10.7
Household DisposableIncome Per Capita (£)
Householddisposable income 15,443 16,058 16,371 16,830 17,058
% changeyear-on-year - 4.0 1.9 2.8 1.4
† — does not sum due to rounding at source
GDP — gross domestic product
Note: inflation is at retail price index (RPI); inflation data shown are annual averagechanges; claimant count measures the number of people claiming Jobseeker’s Allowance.
Source: Population Estimates for UK, England and Wales, Scotland and NorthernIreland, Mid-2001 to Mid-2010 Revised, December 2013/National PopulationProjections, 2012-based projections/United Kingdom Economic Accounts Q12014, published June 2014/Consumer Price Inflation, July 2014/Labour MarketStatistics, August 2014, National Statistics website © Crown copyright material isreproduced with the permission of the Controller of HMSO (and the Queen’sPrinter for Scotland)
Toys & Games What’s KEY in the Market?
© Key Note Ltd 2014 12
KEY CURRENT ISSUES
The UK market for traditional toys and games is forecast by Key Note to havegrown by 2.1% in value in 2013 despite a number of hurdles. One of the keycurrent issues facing the market is the enduring threat posed from counterfeitproducts, with the existence of such items providing a cheaper alternative togenuine goods, and therefore damaging industry-wide sales figures. Inaddition, and more recently, the market for traditional toys and games hascome under increasing pressure from electronic/digital devices. The uptake ofproducts such as smartphones and tablet computers has soared in recent years,with a significant proportion of children now owning multiple such devicesand subsequently spending increasingly greater amounts of their leisure timeusing these products as opposed to playing with traditional toys and games.
In order to counter this problem, many toys and games manufacturers areadding digital content to their products in order to address the threat fromsmartphones and tablet computers, with retailer Hamleys predicting that themajority of the most popular children’s toys and games in the run-up toChristmas 2014 will contain at least an element of digital content. In additionto devices such as smartphones and tablet computers, the toys and gamesmarket is currently competing against the video gaming industry, particularlyin light of the recent launch of the eighth-generation of gaming consoles,which are expected to hinder sales in the traditional toys and games market.Presently, the toys and games industry is witnessing a growing trend of ‘toyrenting’, and looking forward, the market will be hotly anticipating, as ever,the new release of blockbuster films such as the upcoming new Star Warstrilogy, with the release of such films and television shows typicallyencouraging a boost in sales of toys and games associated with such franchises.
HOW ROBUST IS THE MARKET?
Recent years have seen the volume and value sales of toys and games fluctuateconsiderably, particularly in response to the 2008/2009 recession and aperceived lack of NPD, a feature especially prevalent within the Europeanmarketplace. Although the UK economic recovery has gathered noticeablemomentum during the latter part of 2013 and 2014, consumer spending hasremained subdued as expenditure on discretionary items, such as toys andgames, has been either frozen or reduced in line with pressures on householdbudgets.
Increasingly, children are beginning to mature at a much younger age thanpreviously, with the uptake of electronic and digital products commencing ata much earlier stage than ever before. Additionally, and partly owing to thistrend, children are now more wired towards the latest crazes and fashions,thereby forcing toys and games manufacturers into producing ever-greaterinnovations and modern products in order to maintain competitiveness in asaturated marketplace. Consequently there has been an apparent move awayfrom traditional toys, for instance toy vehicles, collectibles and plush toys, withsales in each of these categories suffering as a result over the past few years.
Toys & Games What’s KEY in the Market?
© Key Note Ltd 2014 13

Despite economic difficulties and evolving trends in the industry, the overallmarket for toys and games in the UK can be considered relatively robust. Atpresent, and looking forward, the demand for toys and games is forecast toremain stable, particularly as many parents appreciate the developmental andeducational added value that such products can provide for their children. TheUK’s recent return to economic normalcy is likely to drive growth in the future,with NPD activity also expected to witness growth in the coming years. As withprevious years, the UK’s positive birth rate is forecast to contribute towards acontinual increase in the potential consumer base for toys and games.
Toys & Games What’s KEY in the Market?
© Key Note Ltd 2014 14
3. Market Size, Segmentation & Forecasts
MARKET SIZE & SEGMENTATION
The Total Market
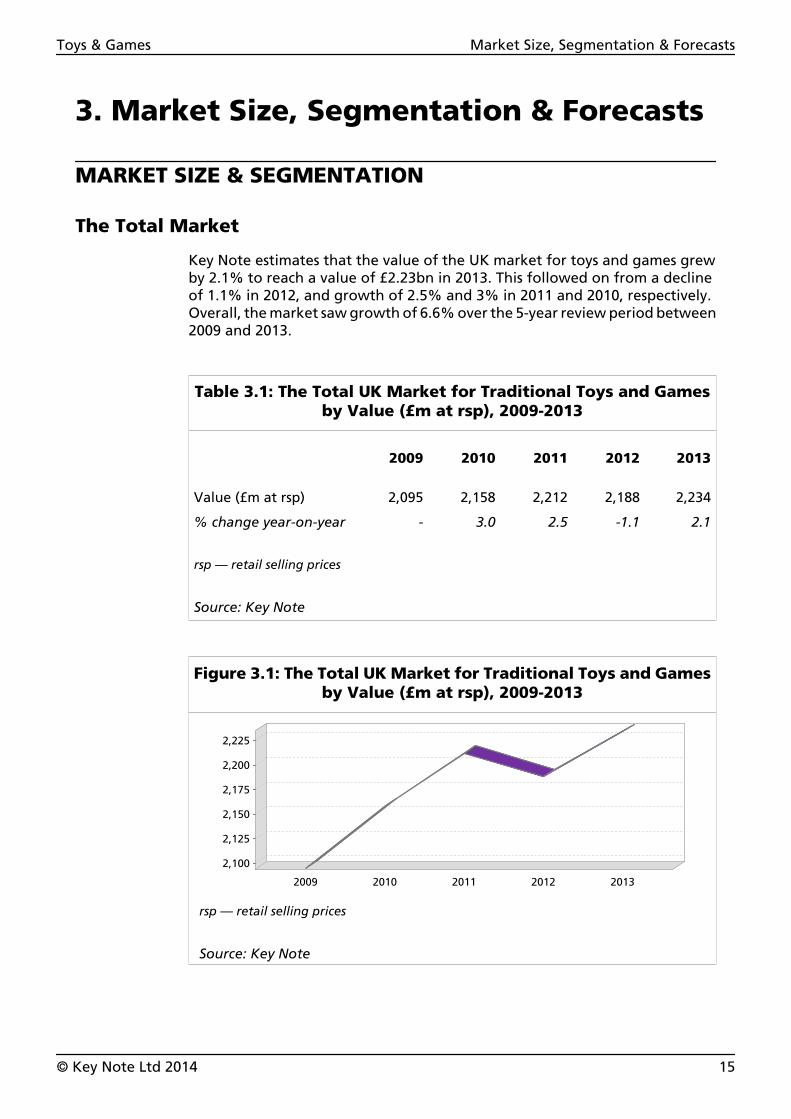
Key Note estimates that the value of the UK market for toys and games grewby 2.1% to reach a value of £2.23bn in 2013. This followed on from a declineof 1.1% in 2012, and growth of 2.5% and 3% in 2011 and 2010, respectively.Overall, the market saw growth of 6.6% over the 5-year review period between2009 and 2013.
Table 3.1: The Total UK Market for Traditional Toys and Gamesby Value (£m at rsp), 2009-2013
2009 2010 2011 2012 2013
Value (£m at rsp) 2,095 2,158 2,212 2,188 2,234
% change year-on-year - 3.0 2.5 -1.1 2.1
rsp — retail selling prices
Source: Key Note
Figure 3.1: The Total UK Market for Traditional Toys and Gamesby Value (£m at rsp), 2009-2013
2009 2010 2011 2012 2013
2,100
2,125
2,150
2,175
2,200
2,225
rsp — retail selling prices
Source: Key Note
Toys & Games Market Size, Segmentation & Forecasts
© Key Note Ltd 2014 15
Market Sectors
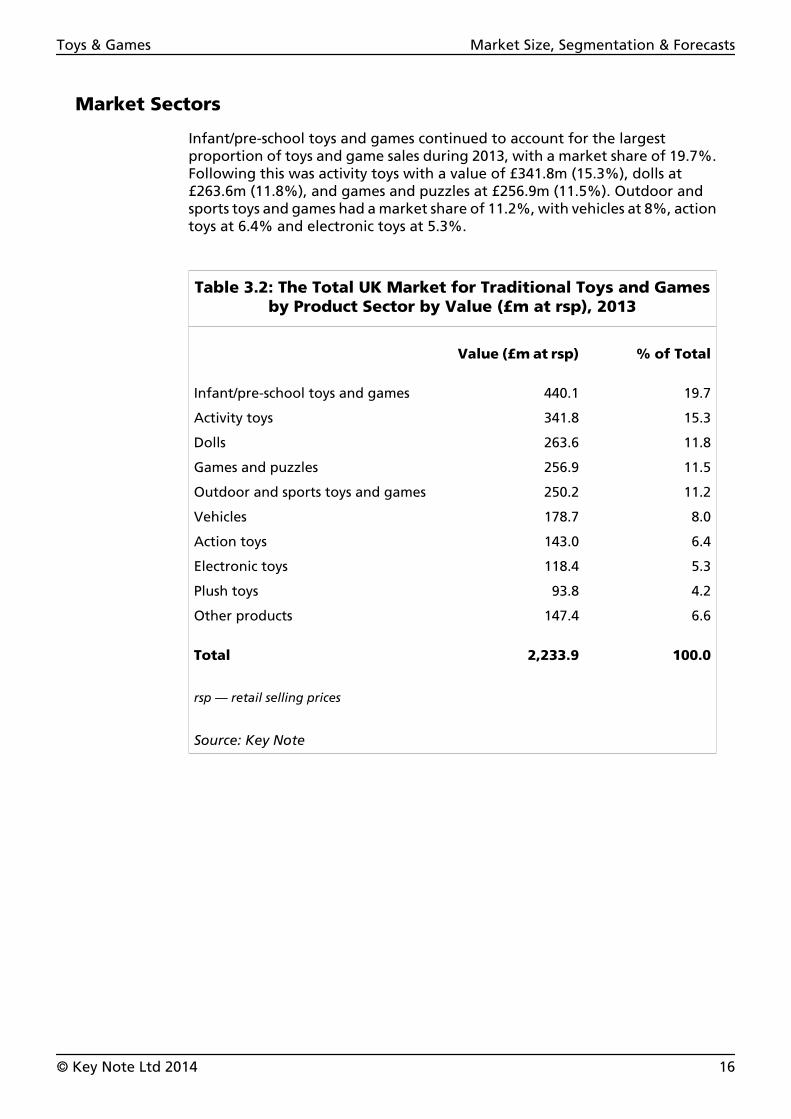
Infant/pre-school toys and games continued to account for the largestproportion of toys and game sales during 2013, with a market share of 19.7%.Following this was activity toys with a value of £341.8m (15.3%), dolls at£263.6m (11.8%), and games and puzzles at £256.9m (11.5%). Outdoor andsports toys and games had a market share of 11.2%, with vehicles at 8%, actiontoys at 6.4% and electronic toys at 5.3%.
Table 3.2: The Total UK Market for Traditional Toys and Gamesby Product Sector by Value (£m at rsp), 2013
Value (£m at rsp) % of Total
Infant/pre-school toys and games 440.1 19.7
Activity toys 341.8 15.3
Dolls 263.6 11.8
Games and puzzles 256.9 11.5
Outdoor and sports toys and games 250.2 11.2
Vehicles 178.7 8.0
Action toys 143.0 6.4
Electronic toys 118.4 5.3
Plush toys 93.8 4.2
Other products 147.4 6.6
Total 2,233.9 100.0
rsp — retail selling prices
Source: Key Note
Toys & Games Market Size, Segmentation & Forecasts
© Key Note Ltd 2014 16

Figure 3.2: The Total UK Market for Traditional Toys and Gamesby Product Sector by Value (£m at rsp), 2013
Infant/pre-school
Activity toys
DollsGam
es and puzzles
Outdoor and sports
Vehicles
Action toys
Electronic toys
Plush toys
Other
0
50
100
150
200
250
300
350
400
450
rsp — retail selling prices
Source: Key Note
Infant/Pre-School Toys and Games
In 2013, infant/pre-school toys and games continued to account for the largestshare of the overall UK market for toys and games, with a market value of£440.1m, representing 19.7% of the total. Sales in this particular sectorobserved an increase of 2.8% over the course of 2013.
The infant/pre-school toys and games market is primarily targeted towardschildren aged 2 and under, and is saturated with well-known brands such asTOMY, Fisher-Price Sidney and PlaySkool. In addition to these establishedbrands, other pre-school licences also maintain a considerable presence withinthe sector, including leading brands such as Peppa Pig and Thomas & Friends.
Activity Toys
In 2013, Key Note estimates that retail sales of activity toys amounted to£341.8m, representing 15.3% of the total UK toys and games market.
Toys & Games Market Size, Segmentation & Forecasts
© Key Note Ltd 2014 17
The activity toys sector includes items such as building and construction sets,and arts and crafts. The arts and crafts category of this sector is the largestsubsector and can include items such as jewellery making sets, with popularbrands including Aqua Beads, Hama and Grafix; cookery sets, such as thoseproduced by Kitchen Craft and Cooksmart; and arts and painting sets, andmodelling and play putty sets. Licenced entertainment brands, includingDisney, Peppa Pig and Thomas & Friends, also feature heavily.
Danish brand Lego dominates the building sets subsector of the market, whileconstruction toy sets produced by K’NEX also remain popular. The success oflicensed entertainment products also remains important for this subsector,with franchises such as Harry Potter, Star Wars and Toy Story assisting to drivesales in recent years.
Dolls
Key Note estimates that total sales of dolls stood at a value of £263.6m in 2013,thereby representing 11.8% of the overall market.
Although this sector of the market has been dominated by leading doll brandBarbie, from Mattel, for a number of years, Barbie products have begun to losemarket share of late, with the brand facing stiff competition from alternativedoll ranges, such as Monsters High and Bratz. This area of the market continuesto benefit considerably from new product innovation and add-on products,such as accessories and clothing, which are often bought as separate items afterthe purchase of an initial doll. Additionally, many of the major brands, forinstance Barbie and the Cabbage Patch Kids, have continued to remain popularamong doll collectors, with some products now commanding high prices if theyare seen as collectibles.
Games and Puzzles
In 2013, Key Note estimates that the value of the games and puzzles marketwas worth £256.9m, representing 11.5% of the overall market.
This particular sector of the market includes products such as board games,puzzles, jigsaws and party games. Growth within this sector has been drivensomewhat by the desire among consumers to purchase less-expensive indoorgames, such as games and puzzles, rather than expensive days out orhigher-priced items. A number of board game manufacturers have utilised thepopularity of digital/console games in order to enhance their own products,for instance, Mattel’s launch of Knock on Wood, an Angry Birds-themed boardgame. Conversely, the popularity of technology has also allowed for a greaternumber of board games in this sector which utilise technology, such as DVDs,to come into existence, such as the Scene It? range of games.
Another trend that has emerged in this sector is ‘retro’ packaging, with anumber of well-known, classic board games, including Monopoly, nowavailable in old-fashioned boxes in order to appeal to both adults and children.
Toys & Games Market Size, Segmentation & Forecasts
© Key Note Ltd 2014 18
Outdoor and Sports Toys and Games
Key Note estimates that the value of sales of outdoor and sports toys andgames reached £250.2m in 2013, representing 11.2% of the overall market.
This subsector of the market includes products such as trampolines, skates andskateboards, scooters, swing sets, footballs and other various ball and racketgames. Popular brands within this subsector include Swingball and ChadValley, which produce a variety of games sets for children for particular sports,such as cricket and football. In addition, wheeled toys have remained popularin past years, particularly scooters, following an influx of a range of licensedscooters from popular children’s franchises, including Disney, Peppa Pig andFireman Sam.
Vehicles
Key Note estimates that retail sales of toy vehicles reached a value of £178.7min 2013, representing 8% of the total toys and games market.
Some of the major brands within the toy vehicle sector include Hot Wheels andMatchbox, both of which are produced by Mattel, and Scalextric from Hornby.Recent advances in technology and new product development (NPD) haveallowed manufacturers of such toys to incorporate the popularity of mobiledevices into their products, with a number of toy vehicles now available thatcan be controlled via the iPhone. In addition to this, the release of popularDisney films Cars and Cars 2 is expected to have sparked an interest in toyvehicles, and as such, a range of the films’ characters in the form of toy vehicleshave been released onto the market.
Action Toys
Key Note estimates that the value of sales for action toys reached £143m in2013, representing 6.4% of the overall UK market for toys and games.
For a number of years, growth in this sector of the market has principally beendriven by associated film releases, for instance the Transformers, G.I. Joe andStar Wars franchises, all of which have served to boost the sector and sparkedthe development and release of new action toy product lines. One of the mostpopular brands of action toys in the UK is Star Wars, which is anticipated to befurther boosted in line with the upcoming release of the new trilogy of StarWars films, starting in 2015. Other popular movie titles which have bolsteredthis sector of the market include Spiderman, Batman, Iron Man, Thor andTheAvengers.
Electronic Toys
Key Note estimates that sales of electronic toys in the UK stood at £118.4m in2013, thereby representing 5.3% of the overall toys and games market.
Toys & Games Market Size, Segmentation & Forecasts
© Key Note Ltd 2014 19

The increasing popularity of tablet and other electronic devices in recent years,particularly since 2010, has been reflected in increased NPD activity in thissector, with market leaders VTech and Leap Frog both introducing theirthird-generation (3G) tablet computers for children during 2013. Anotherrecent development within the electronic toys sector has been ‘apptivity’products, such as steering wheels, for instance, which can be connected to theiPhone for playing downloadable games.
Plush Toys
Key Note estimates that retail sales of plush toys reached £93.8m in 2013,accounting for 4.2% of total toys and games sales in the UK.
Sales of plush toys witnessed a decline in 2013, mainly as a result of increasingcompetition from alternative toys such as digital products, with a far greateramount of NPD focusing on electronic gadgets or hybrid digital-physicalproducts.
Major brands dominating this sector of the market include items such as BeanieBabies and Pillow Pets. Demand for such products usually peaks depending oncurrent trends, with many lines quickly coming into and going out of fashionin quick succession, such as Go Go Hamsters in the UK.
The market is also strengthened to a certain extent by the enduring popularityof specialised stores within the sector, such as Build-A-Bear Workshops, whichwere founded in the US in 1997 and expanded in the UK after The BearWorkshop was purchased from Hamleys in 2006.
Other Products
Other products within the toys and games market include dressing-up clothesand pocket-money novelties, which are typically inexpensive. Key Noteestimates that sales of other products reached £147.4m in 2013, accounting for6.6% of the total toys and games market in the UK.
MARKET POSITION
The UK
According to figures from National Statistics, consumer expenditure on games,toys and hobbies grew by 9.6% in 2013 to reach a value of £19.2bn, which wasan increase of 10.5% over the 5-year review period between 2009 and 2013.This meant that in 2013, consumer expenditure on games, toys and hobbiesrepresented 1.9% of total UK domestic consumer expenditure, which wasdown from a share of 2% in 2009.
Toys & Games Market Size, Segmentation & Forecasts
© Key Note Ltd 2014 20
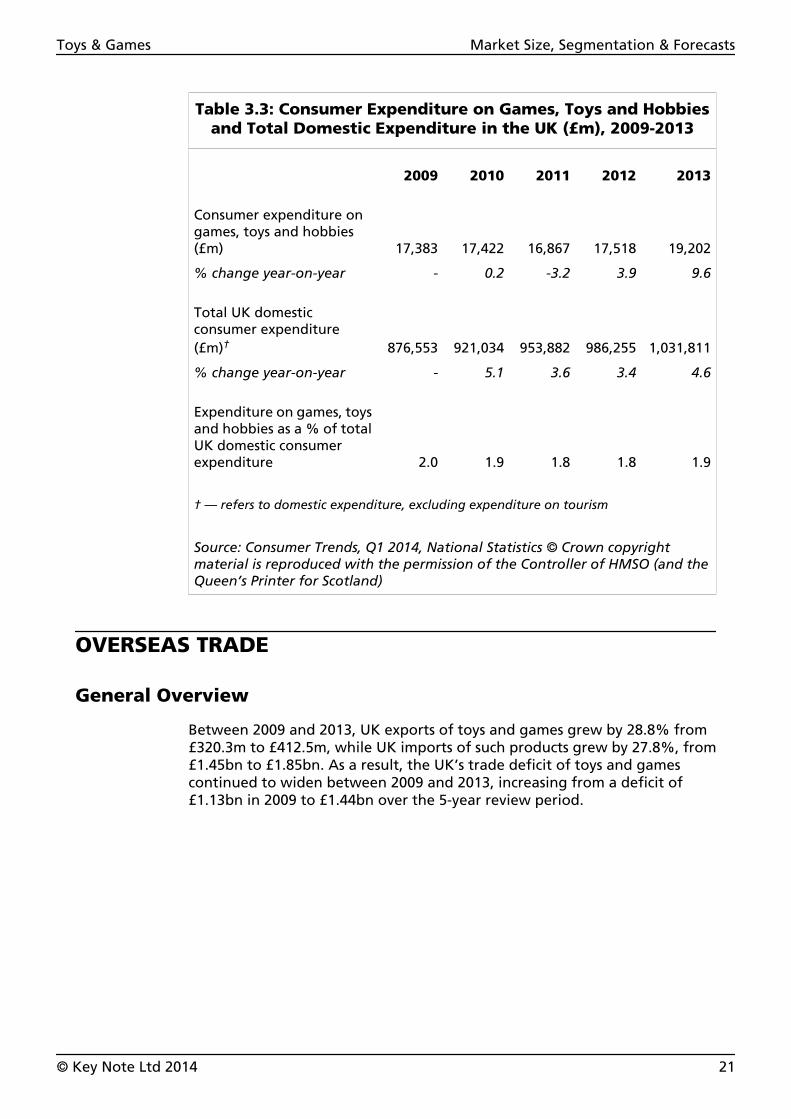
Table 3.3: Consumer Expenditure on Games, Toys and Hobbiesand Total Domestic Expenditure in the UK (£m), 2009-2013
2009 2010 2011 2012 2013
Consumer expenditure ongames, toys and hobbies(£m) 17,383 17,422 16,867 17,518 19,202
% change year-on-year - 0.2 -3.2 3.9 9.6
Total UK domesticconsumer expenditure(£m)† 876,553 921,034 953,882 986,255 1,031,811
% change year-on-year - 5.1 3.6 3.4 4.6
Expenditure on games, toysand hobbies as a % of totalUK domestic consumerexpenditure 2.0 1.9 1.8 1.8 1.9
† — refers to domestic expenditure, excluding expenditure on tourism
Source: Consumer Trends, Q1 2014, National Statistics © Crown copyrightmaterial is reproduced with the permission of the Controller of HMSO (and theQueen’s Printer for Scotland)
OVERSEAS TRADE
General Overview
Between 2009 and 2013, UK exports of toys and games grew by 28.8% from£320.3m to £412.5m, while UK imports of such products grew by 27.8%, from£1.45bn to £1.85bn. As a result, the UK’s trade deficit of toys and gamescontinued to widen between 2009 and 2013, increasing from a deficit of£1.13bn in 2009 to £1.44bn over the 5-year review period.
Toys & Games Market Size, Segmentation & Forecasts
© Key Note Ltd 2014 21

Table 3.4: UK Trade Balance of Toys and Games by Value(£m), 2009-2013
2009 2010 2011 2012 2013
Exports 320.3 342.7 372.8 374.4 412.5
Less imports 1,448.4 1,816.7 1,687.7 1,753.6 1,850.7
Trade balance -1,128.1 -1,474.0 -1,314.9 -1,379.2 -1,438.2
Note: data refer to items exported/imported by and into the UK under the remit of UKTrade Commodity Code 9501 — wheeled toys, designed to be ridden by children (forexample, tricycles, scooters, pedal cars), dolls’ carriages; Commodity Code 9502 — dollsrepresenting only human beings; Commodity Code 9503 — tricycles, scooters, pedal carsand similar wheeled toys, dolls’ carriages, dolls, other toys, reduced-size ‘scale’recreational models (working or not), puzzles of all kinds; Commodity Code 9505 —festival, carnival or other entertainment articles, including conjuring tricks and noveltyjokes.
Source: UKtradeinfo, HM Revenue & Customs © Crown copyright
Figure 3.3: UK Trade Balance of Toys and Gamesby Value (£m), 2009-2013
Exports
Imports
Trade balance
20092010
20112012
2013
-1,000
-500
0
500
1,000
1,500
Note: data refer to items exported/imported by and into the UK under the remit of UKTrade Commodity Code 9501 — wheeled toys, designed to be ridden by children (forexample, tricycles, scooters, pedal cars), dolls’ carriages; Commodity Code 9502 — dollsrepresenting only human beings; Commodity Code 9503 — tricycles, scooters, pedal carsand similar wheeled toys, dolls’ carriages, dolls, other toys, reduced-size ‘scale’recreational models (working or not), puzzles of all kinds; Commodity Code 9505 —festival, carnival or other entertainment articles, including conjuring tricks and noveltyjokes.
Source: UKtradeinfo, HM Revenue & Customs © Crown copyright/Key Note
Toys & Games Market Size, Segmentation & Forecasts
© Key Note Ltd 2014 22
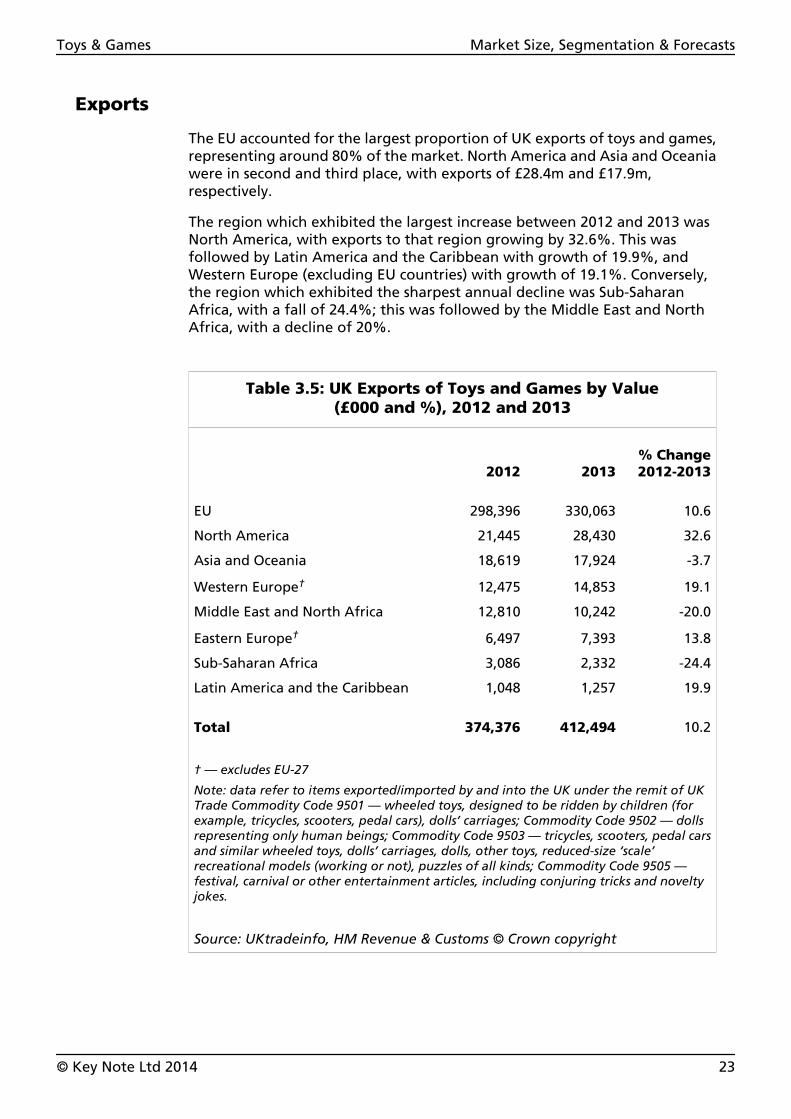
Exports
The EU accounted for the largest proportion of UK exports of toys and games,representing around 80% of the market. North America and Asia and Oceaniawere in second and third place, with exports of £28.4m and £17.9m,respectively.
The region which exhibited the largest increase between 2012 and 2013 wasNorth America, with exports to that region growing by 32.6%. This wasfollowed by Latin America and the Caribbean with growth of 19.9%, andWestern Europe (excluding EU countries) with growth of 19.1%. Conversely,the region which exhibited the sharpest annual decline was Sub-SaharanAfrica, with a fall of 24.4%; this was followed by the Middle East and NorthAfrica, with a decline of 20%.
Table 3.5: UK Exports of Toys and Games by Value(£000 and %), 2012 and 2013
2012 2013% Change2012-2013
EU 298,396 330,063 10.6
North America 21,445 28,430 32.6
Asia and Oceania 18,619 17,924 -3.7
Western Europe† 12,475 14,853 19.1
Middle East and North Africa 12,810 10,242 -20.0
Eastern Europe† 6,497 7,393 13.8
Sub-Saharan Africa 3,086 2,332 -24.4
Latin America and the Caribbean 1,048 1,257 19.9
Total 374,376 412,494 10.2
† — excludes EU-27
Note: data refer to items exported/imported by and into the UK under the remit of UKTrade Commodity Code 9501 — wheeled toys, designed to be ridden by children (forexample, tricycles, scooters, pedal cars), dolls’ carriages; Commodity Code 9502 — dollsrepresenting only human beings; Commodity Code 9503 — tricycles, scooters, pedal carsand similar wheeled toys, dolls’ carriages, dolls, other toys, reduced-size ‘scale’recreational models (working or not), puzzles of all kinds; Commodity Code 9505 —festival, carnival or other entertainment articles, including conjuring tricks and noveltyjokes.
Source: UKtradeinfo, HM Revenue & Customs © Crown copyright
Toys & Games Market Size, Segmentation & Forecasts
© Key Note Ltd 2014 23
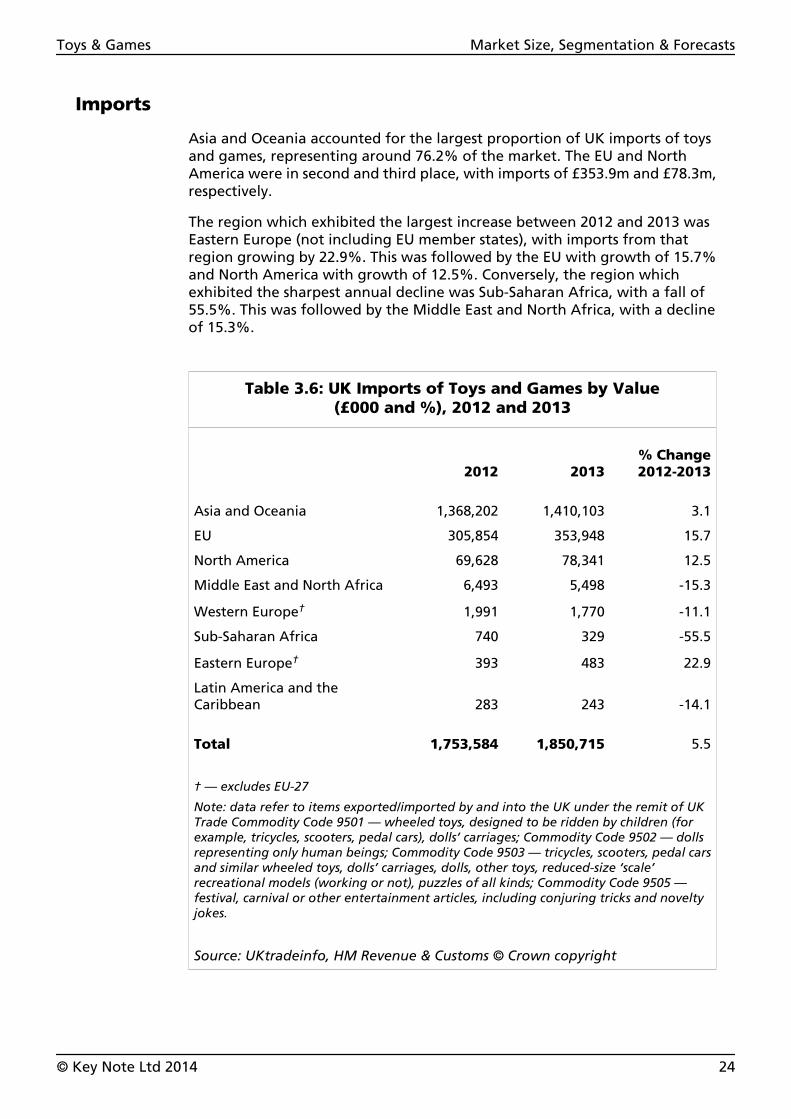
Imports
Asia and Oceania accounted for the largest proportion of UK imports of toysand games, representing around 76.2% of the market. The EU and NorthAmerica were in second and third place, with imports of £353.9m and £78.3m,respectively.
The region which exhibited the largest increase between 2012 and 2013 wasEastern Europe (not including EU member states), with imports from thatregion growing by 22.9%. This was followed by the EU with growth of 15.7%and North America with growth of 12.5%. Conversely, the region whichexhibited the sharpest annual decline was Sub-Saharan Africa, with a fall of55.5%. This was followed by the Middle East and North Africa, with a declineof 15.3%.
Table 3.6: UK Imports of Toys and Games by Value(£000 and %), 2012 and 2013
2012 2013% Change2012-2013
Asia and Oceania 1,368,202 1,410,103 3.1
EU 305,854 353,948 15.7
North America 69,628 78,341 12.5
Middle East and North Africa 6,493 5,498 -15.3
Western Europe† 1,991 1,770 -11.1
Sub-Saharan Africa 740 329 -55.5
Eastern Europe† 393 483 22.9
Latin America and theCaribbean 283 243 -14.1
Total 1,753,584 1,850,715 5.5
† — excludes EU-27
Note: data refer to items exported/imported by and into the UK under the remit of UKTrade Commodity Code 9501 — wheeled toys, designed to be ridden by children (forexample, tricycles, scooters, pedal cars), dolls’ carriages; Commodity Code 9502 — dollsrepresenting only human beings; Commodity Code 9503 — tricycles, scooters, pedal carsand similar wheeled toys, dolls’ carriages, dolls, other toys, reduced-size ‘scale’recreational models (working or not), puzzles of all kinds; Commodity Code 9505 —festival, carnival or other entertainment articles, including conjuring tricks and noveltyjokes.
Source: UKtradeinfo, HM Revenue & Customs © Crown copyright
Toys & Games Market Size, Segmentation & Forecasts
© Key Note Ltd 2014 24

FORECASTS
Future Trends
Forecast Economic Trends
Estimates from National Statistics predict that the total population of the UKwill rise from 64.5 million in 2014 to 66.3 million in 2018, representing a rise of2.7% over the 5-year period. This rise is likely to be attributable to the UK’shigher birth than death rate, in addition to a continual positive net migrationlevel and ageing population for the foreseeable future. The growingpopulation should, in theory, result in an overall boost in consumer spending,which in turn will benefit the wider economy, including the UK market for toysand games.
Forecast figures from the UK Treasury indicate an expected gross domesticproduct (GDP) growth rate of 2.9% in 2014, 2.5% in 2015 and 2.4% thereafterto the end of the review period. While this anticipated growth is positive forthe economy, it should be noted that these levels remain beneath those seenprior to the economic downturn, and that, therefore, recovery is not yet fullyentrenched. This may be attributable, in part, to tight public-sector fiscalconsolidation, in addition to lingering concerns in the Eurozone, which servesas the UK’s most vital trading partner. Nevertheless, in spite of theless-than-impressive forecast growth figures, it is anticipated that the UK willbe the fastest-growing economy in the Group of 7 (G7) nations in 2014, andone of the better-performing countries in Europe.
The most recent economic data indicated that inflation, as measured by theretail prices index (RPI), will average 2.5% in 2014, which remains above theBank of England’s (BoE’s) target rate of 2%. From 2014 onwards, inflation isanticipated to edge upwards, to reach 3.4% by 2018.
The next few years will witness a steady decline in the level of unemploymentin the UK, largely as a result of strong forecast growth in private-sectoremployment. The unemployment rate, as measured by the number ofclaimants of Jobseeker’s Allowance, is anticipated to fall from 1.19 million in2014 to 1.01 million in 2018.
Toys & Games Market Size, Segmentation & Forecasts
© Key Note Ltd 2014 25
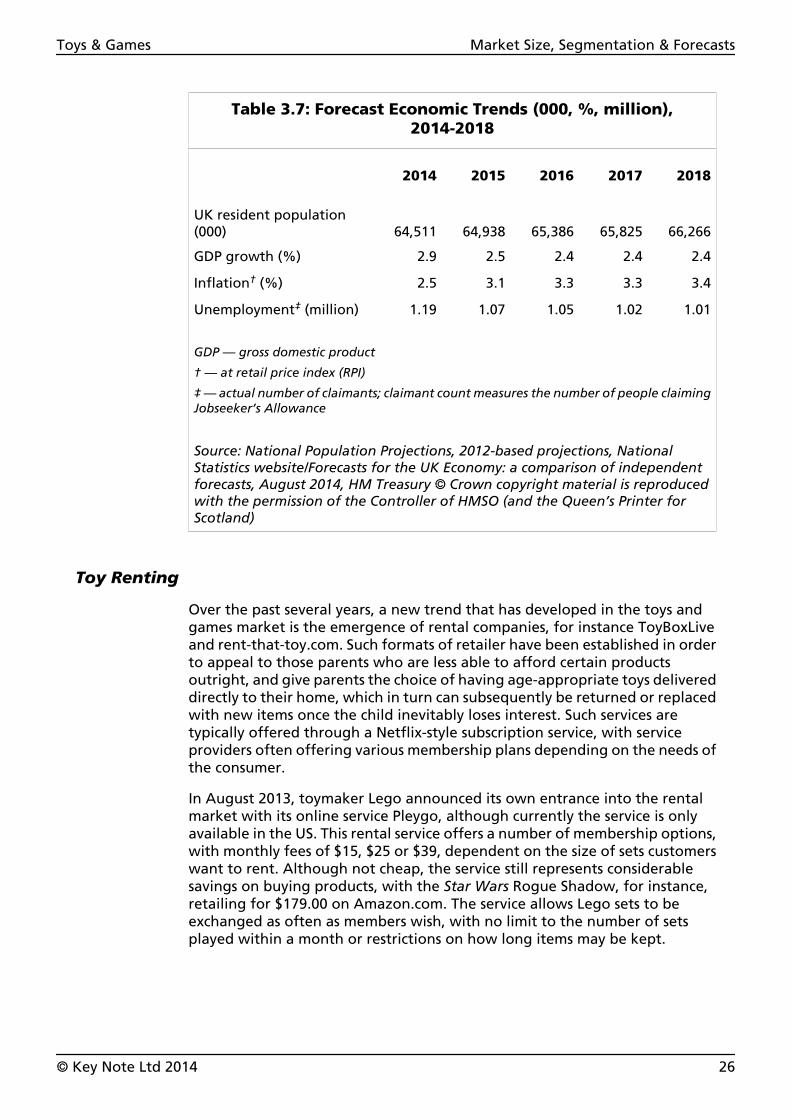
Table 3.7: Forecast Economic Trends (000, %, million),2014-2018
2014 2015 2016 2017 2018
UK resident population(000) 64,511 64,938 65,386 65,825 66,266
GDP growth (%) 2.9 2.5 2.4 2.4 2.4
Inflation† (%) 2.5 3.1 3.3 3.3 3.4
Unemployment‡ (million) 1.19 1.07 1.05 1.02 1.01
GDP — gross domestic product
† — at retail price index (RPI)
‡ — actual number of claimants; claimant count measures the number of people claimingJobseeker’s Allowance
Source: National Population Projections, 2012-based projections, NationalStatistics website/Forecasts for the UK Economy: a comparison of independentforecasts, August 2014, HM Treasury © Crown copyright material is reproducedwith the permission of the Controller of HMSO (and the Queen’s Printer forScotland)
Toy Renting
Over the past several years, a new trend that has developed in the toys andgames market is the emergence of rental companies, for instance ToyBoxLiveand rent-that-toy.com. Such formats of retailer have been established in orderto appeal to those parents who are less able to afford certain productsoutright, and give parents the choice of having age-appropriate toys delivereddirectly to their home, which in turn can subsequently be returned or replacedwith new items once the child inevitably loses interest. Such services aretypically offered through a Netflix-style subscription service, with serviceproviders often offering various membership plans depending on the needs ofthe consumer.
In August 2013, toymaker Lego announced its own entrance into the rentalmarket with its online service Pleygo, although currently the service is onlyavailable in the US. This rental service offers a number of membership options,with monthly fees of $15, $25 or $39, dependent on the size of sets customerswant to rent. Although not cheap, the service still represents considerablesavings on buying products, with the Star Wars Rogue Shadow, for instance,retailing for $179.00 on Amazon.com. The service allows Lego sets to beexchanged as often as members wish, with no limit to the number of setsplayed within a month or restrictions on how long items may be kept.
Toys & Games Market Size, Segmentation & Forecasts
© Key Note Ltd 2014 26

Upcoming Toy Merchandising Opportunities
In addition to seasonal peaks and various ‘trend crazes’, the market for toysand games is also highly dependent on the success of alternative industries,perhaps noticeably the film industry. Many toys and games product rangeshave been launched on the back of successful film franchises, such as HarryPotter, Star Wars, Lord of the Rings, etc. Looking forward, following on fromthe 2012 decision by The Walt Disney Company to purchase Lucasfilm, the toysand games market will be eagerly anticipating the arrival of the new sequeltrilogy of Star Wars films, set to be first released in 2015, which is forecast toencourage a considerable range of associated toys and games onto the market.The industry has also been boosted in recent years by the new Hobbit films,the third and final of which is due to be released in December 2014. Otherupcoming blockbusters which are due to boost the toys and games industryinclude new instalments from The Hunger Games and Jurassic Park, amongothers.
Forecast Total Market
Key Note forecasts that the UK market for toys and games will witness slowbut steady growth over the coming 5 years, in line with the continuingeconomic recovery in the UK and the anticipated rise in the population of 0 to14 year-olds, which should both contribute towards driving demand for toysand games. Overall, the toys and games market is expected to increase by10.9% from £2.28bn in 2014 to £2.53bn in 2018, with annual growthstrengthening towards the end of the review period as economic recoveryconsolidates within the UK.
Table 3.8: The Forecast Total UK Market for Traditional Toysand Games by Value (£m at rsp), 2014-2018
2014 2015 2016 2017 2018
Value (£m at rsp) 2,277 2,334 2,392 2,456 2,525
% change year-on-year 1.9 2.5 2.5 2.7 2.8
rsp — retail selling prices
Source: Key Note
MARKET GROWTH
Between 2009 and 2018, the value of the total market for toys and games inthe UK is expected to rise in value by 20.5%, from £2.1bn to £2.53bn.
Toys & Games Market Size, Segmentation & Forecasts
© Key Note Ltd 2014 27
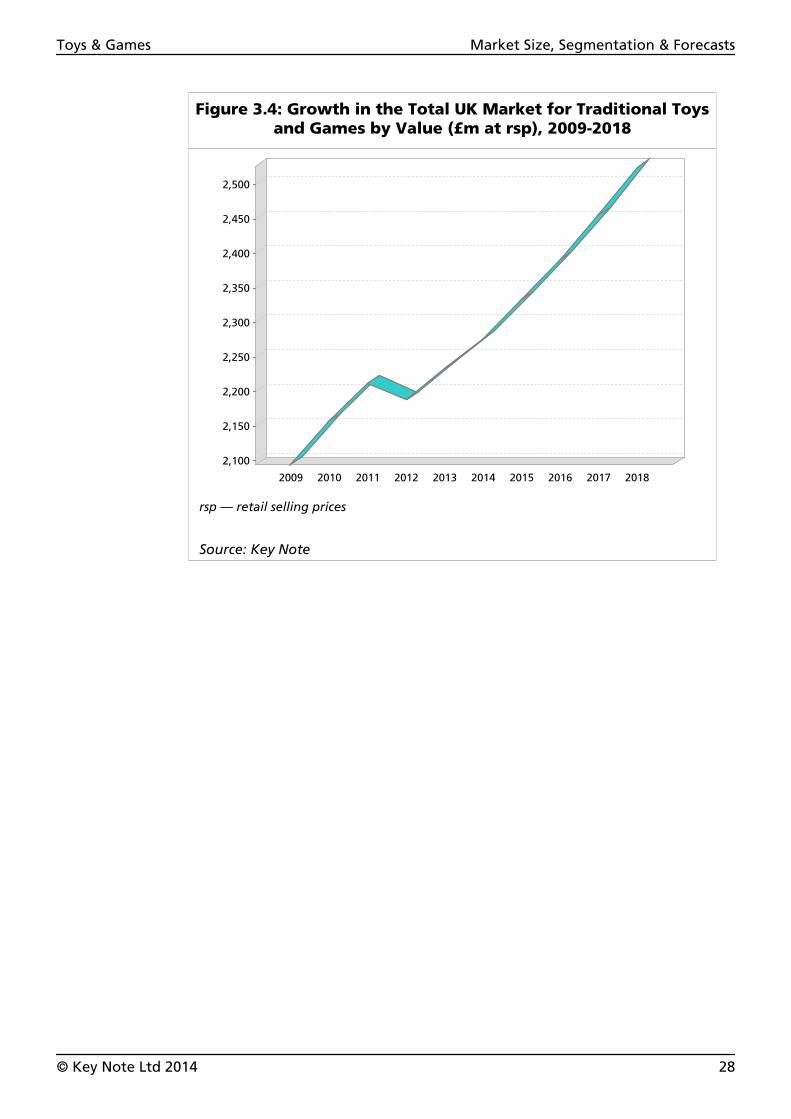
Figure 3.4: Growth in the Total UK Market for Traditional Toysand Games by Value (£m at rsp), 2009-2018
2009 2010 2011 2012 2013 2014 2015 2016 2017 2018
2,100
2,150
2,200
2,250
2,300
2,350
2,400
2,450
2,500
rsp — retail selling prices
Source: Key Note
Toys & Games Market Size, Segmentation & Forecasts
© Key Note Ltd 2014 28

4. Strengths, Weaknesses, Opportunities &Threats
STRENGTHS
• One of the key characteristics of the toys and games market is the high levelof new product development (NPD), which means there is a considerableamount of consumer choice.
• In addition to NPD, the industry is also highly dependent on new and evolvingtrends, which tend to appear and disappear from the market at a very fastpace; parents are often keen to ensure their children are given the mostpopular toys of the moment, thus serving to boost sales.
• Toys and games remain popular gift items, meaning that the market is mostprofitably during peak seasonal periods, such as Christmas, in addition toother celebrations/festivities.
• The importance of toys and games to children’s development has beenenhanced by campaigns such as ‘Make Time 2 Play’ by the British Toy & HobbyAssociation (BTHA), thereby consolidating sales for items which are perceivedto offer educational and developmental benefits.
• Toys and games are widely available across a broad spectrum of pricing levels,meaning that a considerable choice of toys and games are available to thevast majority of consumers, regardless of socio-economic background.
• The toys and games market is boosted significantly by hobby-makers andcollectors, who often drive sales in the market, with special collectors’ itemsand limited-edition items performing particularly well consideringconsumers’ willingness to spend greater sums of money.
• The rising proportion of couples waiting until they are older and morefinancially stable before starting a family means that, in theory, the averagehousehold with young children now has a greater amount of disposableincome to spend on toys and games.
• The majority of children have — and constantly expand upon — a largecollection of toys and games, with parents willing to spend money on a rangeof different products for their kids.
WEAKNESSES
• The UK toys and games industry is highly saturated and extremelycompetitive, with a substantial multitude of products on the market; thisoften makes it difficult for small- to medium-sized enterprises (SMEs) to gaina meaningful foothold in the industry.
Toys & Games Strengths, Weaknesses, Opportunities & Threats
© Key Note Ltd 2014 29
• As the market is heavily dependent on new trends, products and toy rangescan enter and leave the marketplace very quickly, sometimes resulting in theover-production of items which will eventually never sell.
• The expansion of supermarkets and online retailers, for instance Amazon andPlay.com, into the toys and games market has had a negative impact onhigh-street retailers of toys and games, many of which have found itincreasingly hard to compete with the lower-cost models of the supermarketsand online retailers.
• Additionally, the influx of value toy retailers, such as supermarkets andonline retailers, has put downwards pressure on the value of the market.
• There is a strong second-hand marketplace for toys and games, with onlineauction site eBay particularly popular among consumers, which in turndilutes the potential value of primary retail sales.
• New product launches, which can often be expensive, carry a high risk in thecrowded marketplace.
OPPORTUNITIES
• Character licensing opportunities provide new opportunities for productdevelopment, and can prove particularly popular as new programmes andfilms are released (e.g. the upcoming Star Wars sequel trilogy).
• New trends, for instance girls’ construction sets and strategy-based boardgames, have provided new opportunities for toys and games developers andmanufacturers of late.
• In recent years there has been substantial growth in the size and scope ofchildren’s media — particularly children’s television — and this has assistedin driving licensing and promotional opportunities within this particularsector of the toys and games market.
• New electronic and digital innovations are providing an increasingly greaterlevel of interactivity and sophistication, a trend which is particularlyprevalent in the educational and learning sector of the market.
• The rising penetration of the Internet, portable hand-held devices and socialmedia in the UK has assisted in facilitating greater promotional campaigns,product launches and marketing activity in recent years.
• The increasing popularity of certain mobile gaming titles has provided newopportunities for toy manufacturers to develop physical toy ranges tocompliment the franchise. For instance, Angry Birds toys and games haverecently been introduced onto the market to take advantage of the game’shuge digital appeal.
• The UK’s birth rate remains healthy, and looks set to remain so for theforeseeable future. As such, the potential consumer base for toys and gamesin the UK looks set to grow in the coming years.
Toys & Games Strengths, Weaknesses, Opportunities & Threats
© Key Note Ltd 2014 30
THREATS
• The competition posed by the rapid ascent of mobile gaming and onlinegaming in recent years has had a severe impact on the toys and gamesmarket, with many developers and manufacturers forced to diversify intothese sectors themselves.
• The recent release of the eighth generation of video gaming consoles hasthe potential to attract consumer spending away from spending ontraditional toys and games.
• Children’s toys and games are subject to an increasing multitude oflegislation and safety protocols, which can demand a substantial level ofinvestment on the part of manufacturers in order to ensure compliance.Additionally, product recalls can often result in negative press for toy brandsand their manufacturers.
• Children are increasingly maturing at an earlier age than previousgenerations, and as a result, their time spent playing with toys and games isdecreasing when compared to older generations.
Toys & Games Strengths, Weaknesses, Opportunities & Threats
© Key Note Ltd 2014 31
5. PESTEL
POLITICAL
Counterfeit Toys
In was revealed by the European Commission (EC) in August 2013 thatthroughout 2012, an estimated €19.5m worth of counterfeit toys (at domesticvalue, had such toys been genuine) were seized by EU customs and bordercontrol agencies. Toys (excluding games/electronic games) accounted for 4.1%of all seizures throughout the year. However, the figures published by theCommission are thought only to represent a small fraction of the total valueof counterfeit good distributed across EU member states, as many items aresuccessful in evading detection by authorities. The substantial trade incounterfeit goods can potentially have severe consequences for end users, withmany items failing to adhere to the strict safety and manufacturing standardsenforced on the genuine industry.
Globally, moves have been made in order to stem the flow of counterfeit toys,with the International Standards Organization (ISO) announcing in September2012 that it had established a new standard aimed at making it easier to locatecounterfeit products across the globe. It is anticipated that the new standard,the ISO 12931:2012, will make it easier to provide reliable evidence to identifygenuine products by specifying performance requirements for authenticationtools, such as holograms, taggants and marks. The new standards will apply toboth toy products and/or their packaging.
ECONOMIC
Improving Economy Boosts Toys and Games Sales
The UK economy finally emerged from recession in January 2010, putting anend to 6 months of quarterly contractions. Nevertheless, growth remainedpatchy and inconsistent. Although the UK appears to have finally pulled outof recession, levels of economic growth have remained below those recordedpre-recession, with data showing that the UK economy grew by 1.7% in 2013at annual chain-linked gross domestic product (GDP), but that the total GDPonly surpassed its pre-recession peak in the latter half of 2014. The UK isanticipated to be the best-performing economy in the Group of 7 (G7) nationsin 2014, and one of the better performing countries in Europe.
In addition to GDP growth, as of June 2014 inflation was at 1.6%, which iscomfortably beneath the Bank of England’s (BoE’s) target rate of 2%, andunemployment continues to fall year-on-year. These positive economicindicators represent optimism for the future of the toys of games industry, assuch trends will see household disposable incomes increase, which in turnshould encourage higher consumer expenditure, including in the toys andgames market.
Toys & Games PESTEL
© Key Note Ltd 2014 32
SOCIAL
Gender Stereotypes
In response to perceived gender stereotyping regarding the manufacture andsale of toys and games in the UK, the industry has been challenged on itsperpetuation of the issue in terms of toy development and marketing tochildren in recent years. Campaign groups including Let Toys Be Toys andPinkstinks have emerged, challenging the practice of gender-stereotyped shopdisplays and the segregation of boys’ and girls’ items in stores. Of notice, recentcampaigns by Pinkstinks have challenged a global toy range distributed by theEarly Learning Centre (ELC), which included a girls’ pink edition featuringmermaids and a blue edition for boys showing boats. In addition, the grouphas also scrutinised toy ranges aimed at girls which include pink vacuumcleaners and lilac ironing boards; and recently spearheaded a campaign onsocial media sites Twitter and Facebook after which supermarket retailerSainsbury’s was forced to remove gender-specific labelling from an own-brandtoy line which featured doctors’ outfits tagged for boys and nurse andbeautician outfits for girls.
Although marketing based on gender has been a key feature of the toys andgames industry for the past several years, historically, this has not always beenthe case. For instance, according to an article published by the New YorkTimes in 2012, advertising based on gender was found to have been relativelyabsent during the 1970s, with close to 70% of advertising bearing nocorrelation to gender. However, by 1995, gender-specific advertising of toyshad become a distinct element within the industry, with the majority of toysnow carrying some form of gender labelling, either explicitly or subtly, i.e.through colour.
TECHNOLOGICAL
New Generation of Video Gaming Consoles
The traditional toys and games market will undoubtedly face competition fromthe video gaming industry, particularly in light of the recent release of theeighth generation of consoles: the Nintendo Wii U, the PlayStation 4 (PS4), andthe Xbox One. The games console market in general is heavily dependent uponnew-generation hardware releases every several years, and subsequentsoftware releases. The newest generation of gaming consoles follows on fromits seventh generation predecessors: Nintendo’s Wii, Sony’s PlayStation 3 (PS3),and Microsoft’s Xbox 360, respectively. In terms of handheld gaming devices,which are typically less expensive than their static counterparts, the NintendoDS was succeeded in February 2011 in Japan by the Nintendo 3DS, followed bya European and North American release in March 2011. Then, in December2011, the PS Vista (PSV) was released in Japan and in other markets in February2012, replacing the PS Portable (PSP).
Toys & Games PESTEL
© Key Note Ltd 2014 33
The newest generation of consoles have entered the market facing particularlystiff competition from other electronic devices such as smartphones, tabletcomputers and smart televisions, all of which are rapidly growing in popularity,and becoming increasingly capable of facilitating high-quality gamingexperiences. Games such as Angry Birds and Temple Run continue to growstrongly on the smartphone, while there has also been a noticeable increasein the popularity of casual gaming distributed via social media networkingsites, with perhaps two of the most high-profile examples being Candy CrushSaga and Farmville.
Overall, given that a significant proportion of growth in video gaming is noworiginating from non-traditional and exclusive gaming devices, the newergeneration of video gaming consoles has taken a number of steps towardsincorporating auxiliary serves in addition to their gaming capabilities, in orderto prevent the devices from being seen as one dimensional. For instance, at thelaunch of the Xbox One, Microsoft decided not to place substantial emphasison the device’s primary utility (i.e. video gaming), but rather chose to elaborateupon the device’s additional media capabilities, such as the ability to allowusers to stream films, watch live television, make video calls and surf theInternet.
Internet Access in the UK
The toys and games market faces increasing competition from alternativegaming options via digital and electronic mediums, much of which is facilitatedthrough the Internet. According to data sourced from National Statistics’Internet Access Quarterly Update, 2014 Q1 publication, the total number of UKadults aged 16 or over who had ever used the Internet was 44.6 million, whichwas up from 41.1 million in Q1 2011. Accordingly, the number of adults whohad never used the Internet declined from 8.7 million adults in Q1 2011 to 6.4million in Q1 2014. As a percentage of the total, the overall number of adultswho had ever used the Internet rose from 82.2% in Q1 2011 to 87.2% in Q12014.
A breakdown of the results reveals that men were slightly more likely thanwomen to have used the Internet, with penetration rates at 89.3% and 85.3%,respectively. Meanwhile, in terms of age, younger age brackets have almostuniversal penetration rates of Internet use, with 16 to 24, 25 to 35 and 35 to44 year-olds having penetration rates of 99.2%, 98.9% and 97.3%, respectively.By contrast, those aged over 75 had a penetration rate of just 37.1%.
Toys & Games PESTEL
© Key Note Ltd 2014 34
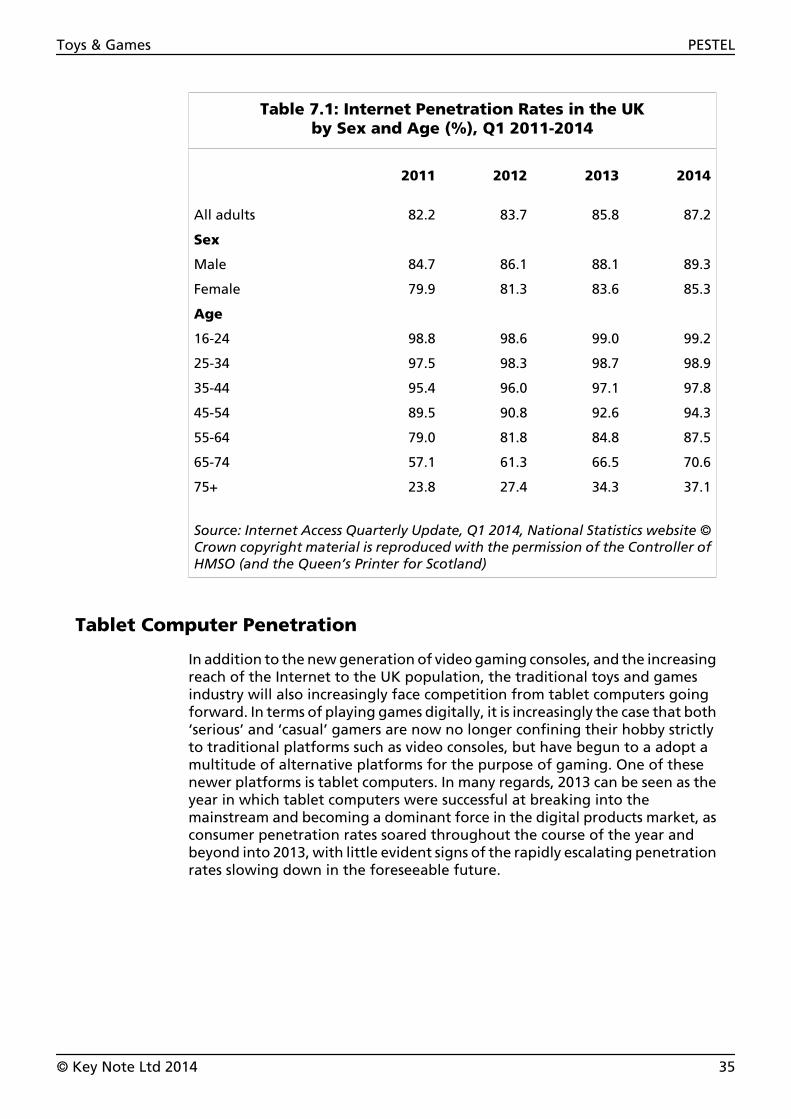
Table 7.1: Internet Penetration Rates in the UKby Sex and Age (%), Q1 2011-2014
2011 2012 2013 2014
All adults 82.2 83.7 85.8 87.2
Sex
Male 84.7 86.1 88.1 89.3
Female 79.9 81.3 83.6 85.3
Age
16-24 98.8 98.6 99.0 99.2
25-34 97.5 98.3 98.7 98.9
35-44 95.4 96.0 97.1 97.8
45-54 89.5 90.8 92.6 94.3
55-64 79.0 81.8 84.8 87.5
65-74 57.1 61.3 66.5 70.6
75+ 23.8 27.4 34.3 37.1
Source: Internet Access Quarterly Update, Q1 2014, National Statistics website ©Crown copyright material is reproduced with the permission of the Controller ofHMSO (and the Queen’s Printer for Scotland)
Tablet Computer Penetration
In addition to the new generation of video gaming consoles, and the increasingreach of the Internet to the UK population, the traditional toys and gamesindustry will also increasingly face competition from tablet computers goingforward. In terms of playing games digitally, it is increasingly the case that both‘serious’ and ‘casual’ gamers are now no longer confining their hobby strictlyto traditional platforms such as video consoles, but have begun to a adopt amultitude of alternative platforms for the purpose of gaming. One of thesenewer platforms is tablet computers. In many regards, 2013 can be seen as theyear in which tablet computers were successful at breaking into themainstream and becoming a dominant force in the digital products market, asconsumer penetration rates soared throughout the course of the year andbeyond into 2013, with little evident signs of the rapidly escalating penetrationrates slowing down in the foreseeable future.
Toys & Games PESTEL
© Key Note Ltd 2014 35
While tablet computers have been around for a number of years now, with2010 to 2012 witnessing Apple dominate the market with its iPad, 2013 saw anexplosion of new devices onto the market, with a considerable number ofmanufacturers and companies attempting to carve out their own stake of theperceivably lucrative and rapidly expanding industry. Of notice, performingparticularly well in 2013 was Goggle’s Android software, with Google’s Nexus7 — costing under £200 — setting a new trend towards less inexpensive andmore affordable tablet computers in competition to Apple, whilesimultaneously managing to provide a similar level of service and standards tothe iPad. In light of this development, and sensing an opportunity, particularlyin the run up to Christmas with the associated surge in gift-giving, retailinggiant Tesco launched its own hugely successful Hudl tablet device, retailing atjust £119 (undercutting the iPad, Nexus 7 and Amazon’s Kindle Fire), and soldmore than 300,000 devices in the first 2 months alone.
In addition to these competitors, other retailers that entered the tablet marketincluded Argos with its Bush MyTablet for £100, and supermarket Aldi, whichmarketed its Lifetab for just £80, with the device completely selling out withinjust 24 hours. Despite Apple introducing two new products onto the market— including a thinner and lighter iPad Air for £400 and a newer version of theiPad Mini, including a high-resolution screen and faster processor, for £320 —the company has lost much of its initial market dominance in terms of volumesales in recent years. However, in spite of this setback, the companypredominantly caters towards the high end and premium section of the marketand, as such, each unit the company sells rewards it with a significantly inflatedsales price and profit when compared to lower end, higher volumecompetitors.
ENVIRONMENTAL
Going Green With Eco-Friendly Toys
Growing public concern regarding the environment has led to greater levelsof scrutiny being levelled against various industries — including the toys andgames market — with respect to their environmental impact. There has beena considerable rise in the popularity of eco-friendly toys for children of late, asa means of conserving the environment in addition to reaching out to childrento do the same. Such toys are considered to be environmentally safe becausethe materials used to create them are natural, biodegradable and recyclable.For instance, such toys use water-based paints which, in turn, reduce chemicalwaste and are also believed to be safer for children. Campaigners emphasisethat even technology-based and digital toys can be less harmful to theenvironment if consumers purchase rechargeable batteries as opposed tothrowing away disposable ones.
Toys & Games PESTEL
© Key Note Ltd 2014 36
LEGISLATIVE
General Legislation
For manufacturers in the UK, a number of essential regulations are laid out aspart of the Toy (Safety) Regulations 1995, which also brings the European ToySafety Directive 88/378 into UK law. The main requirements of the Regulationsstate that toys must:
• satisfy safety requirements
• bear the CE marking
• bear the required name and address details
• be accompanied by warnings if and where necessary.
These Regulations apply to all those who supply toys, including manufacturers,importers, retailers, hirers and other suppliers of new and second-hand toys.The essential safety requirements outlined by the Toy (Safety) Requirements1995 state that the toy user must be protected against risks of injury to healthwhen toys are used reasonably, bearing in mind the behaviour of the user.
New Toy Safety Directive
In July 2013, the second stage of the European Commission’s Toy SafetyDirective 2009 (TSD), which covers chemical requirements for toymanufacturing, came into force. This followed on from the introduction of thefirst part of the Directive, in July 2011, which referred to the mechanical andphysical properties of toys.
The new rules will require toy manufacturing companies to evaluate and carryout a safety assessment of all toys before placing them on the market, byanalysing the potential for chemical and non-chemical (physical, mechanical,electrical, flammability, hygiene and radioactivity) hazards that a toy couldpotentially present, in addition to assessing the toy user’s potential exposureto such hazards. The new regulations affect both intra- and extra-EU toysuppliers, with companies importing toys into the EU expected to ensure theirproducts comply with all of the requirements as of 20th July 2013.
The new regulatory and legislative changes introduced are summarised asfollows:
• EN71-3 has been modified to cover 19 various elements in three distinctmaterial states
• carcinogenic, mutagenic and reprotoxic substances, as detailed underregulation 1272/2008, cannot be used in toys
• the levels of N-nitrosamines and N-nitrosatable substances to be used in themanufacture of toy products are to be restricted in items intended for use bychildren under 36 months old or in other toys intended to be placed in themouth
Toys & Games PESTEL
© Key Note Ltd 2014 37

• 55 allergenic fragrance ingredients will be restricted and a further 11 requirelabelling on the toy and/or toy packaging
• cosmetics for dolls must comply with the Cosmetic Safety Directive 76/768/EEC.
Toys & Games PESTEL
© Key Note Ltd 2014 38
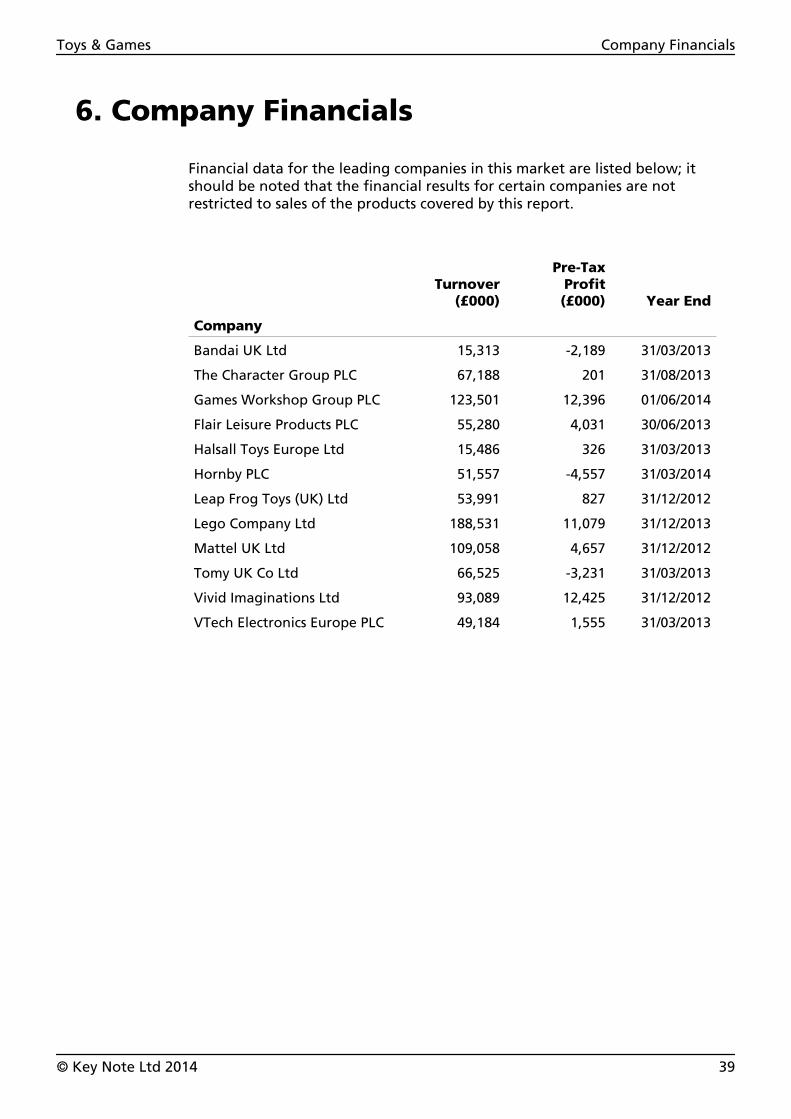
6. Company Financials
Financial data for the leading companies in this market are listed below; itshould be noted that the financial results for certain companies are notrestricted to sales of the products covered by this report.
Turnover(£000)
Pre-TaxProfit(£000) Year End
Company
Bandai UK Ltd 15,313 -2,189 31/03/2013
The Character Group PLC 67,188 201 31/08/2013
Games Workshop Group PLC 123,501 12,396 01/06/2014
Flair Leisure Products PLC 55,280 4,031 30/06/2013
Halsall Toys Europe Ltd 15,486 326 31/03/2013
Hornby PLC 51,557 -4,557 31/03/2014
Leap Frog Toys (UK) Ltd 53,991 827 31/12/2012
Lego Company Ltd 188,531 11,079 31/12/2013
Mattel UK Ltd 109,058 4,657 31/12/2012
Tomy UK Co Ltd 66,525 -3,231 31/03/2013
Vivid Imaginations Ltd 93,089 12,425 31/12/2012
VTech Electronics Europe PLC 49,184 1,555 31/03/2013
Toys & Games Company Financials
© Key Note Ltd 2014 39
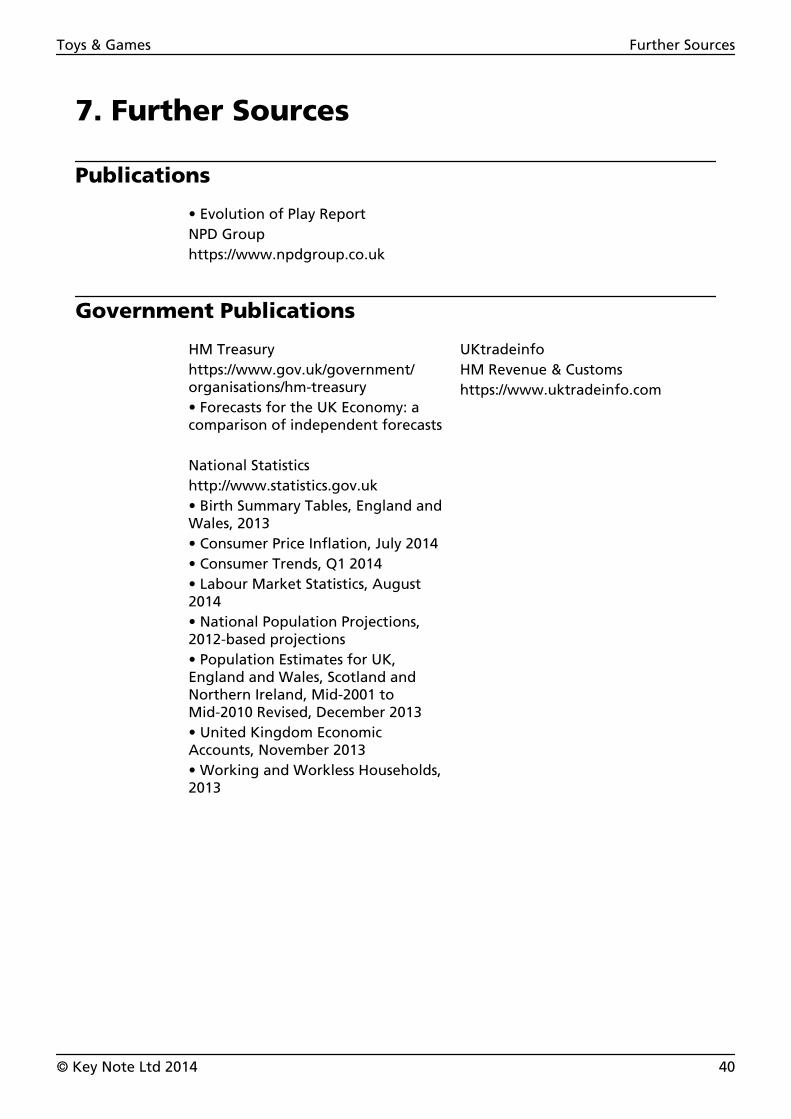
7. Further Sources
Publications
• Evolution of Play ReportNPD Grouphttps://www.npdgroup.co.uk
Government Publications
HM Treasuryhttps://www.gov.uk/government/organisations/hm-treasury• Forecasts for the UK Economy: acomparison of independent forecasts National Statisticshttp://www.statistics.gov.uk• Birth Summary Tables, England andWales, 2013• Consumer Price Inflation, July 2014• Consumer Trends, Q1 2014• Labour Market Statistics, August2014• National Population Projections,2012-based projections• Population Estimates for UK,England and Wales, Scotland andNorthern Ireland, Mid-2001 toMid-2010 Revised, December 2013• United Kingdom EconomicAccounts, November 2013• Working and Workless Households,2013
UKtradeinfoHM Revenue & Customshttps://www.uktradeinfo.com
Toys & Games Further Sources
© Key Note Ltd 2014 40

Key Note Research
Key Note is a leading supplier of market information, publishing an extensive range ofconsumer, industrial, business-to-business and services titles. With over 30 years’ experience,Key Note represents clear, concise, quality market information.
For all reports, Key Note undertakes various types of research:
Online searching is carried out by product code or free search method, and covers the periodfrom the last edition of the report to the current day.
Trade sources, such as trade associations, trade journals and specific company contacts, areinvaluable to the Key Note research process.
Secondary data are provided by Kantar Media (TGI) and Nielsen for consumer/demographicinformation and advertising expenditure, respectively. In addition, various official publicationspublished by National Statistics, etc. are used for essential background data and market trends.
Interviews are undertaken by Key Note for various reports, either face-to-face or by telephone.This provides qualitative data (‘industry comment’) to enhance the statistics in reports;questionnaires may also be used.
Field research is commissioned for various consumer reports and market reviews, and is carriedout by NEMS Market Research.
Key Note estimates are derived from statistical analysis and trade research carried out byexperienced research analysts. Up-to-date figures are inserted where possible, although therewill be some instances where a realistic estimate cannot be made or external sources requestthat we do not update their figures.
Key Note Editorial, 2014
Toys & Games Key Note Research
© Key Note Ltd 2014 41
The Key Note Range of Reports
Key Note publishes over 180 titles each year, across both the Key Note and Market Assessmentproduct ranges. The total range covers consumer, lifestyle, financial services and industrialsectors.
Title Edition Published
Key Note Current Reports
AABC1 Consumer 8 2014
Access Control 14 2014
Accountancy 17 2014
Activity Holidays 6 2014
Advertising Agencies 6 2014
Airlines 24 2014
Airports 17 2014
All-Inclusive Holidays 2 2012
Alternative Healthcare 8 2013
Arts & Media Sponsorship 5 2014
Automatic Vending 27 2014
Automotive Services 9 2014
Autoparts 20 2012
B
B2B Marketing 3 2014
Baby Products 7 2013
Baths & Sanitaryware 16 2013
Betting & Gaming 26 2013
Biscuits & Cakes 21 2014
Book Publishing 22 2012
Book Retailing on the Internet 6 2014
Bookselling 18 2012
Bread & Bakery Products 29 2014
Breakfast Cereals 18 2014
Breweries & the Beer Market 31 2014
Bricks & Tiles 18 2013
Bridalwear 6 2013
Builders’ Merchants 18 2013
Building Contracting 12 2013
Building Materials 15 2013
Bus & Coach Operators 12 2014
Business Postal Services 3 2013
Business Press 16 2014
Business Travel 8 2014
Title Edition Published
C
C2DE Consumer 8 2014
Canned Foods 20 2014
Car Dealers 2 2014
Care Homes 3 2014
Carpets & Floorcoverings 18 2014
Catering Equipment 15 2012
Catering Market 21 2009
Charity Funding 5 2013
Chemical Industry 16 2014
Childcare 7 2012
Children’s Publishing 4 2012
Childrenswear 10 2013
Chilled Foods 18 2014
China & Earthenware 30 2014
Cigarettes & Tobacco 27 2013
Closed-Circuit Television 15 2014
Clothing & Footwear Industry 13 2010
Clothing Manufacturing 18 2014
Clothing Retailing 10 2013
Coffee & Sandwich Shops 8 2013
Commercial Dynamics inFinancial Services 4 2010
Commercial Insurance for SmallBusinesses 5 2014
Commercial Vehicles 17 2014
Computer Hardware 11 2013
Computer Services 11 2014
Computer Software 9 2013
Condiments & Sauces 5 2008
Confectionery 32 2014
Construction Industry 11 2009
Consumer Credit & Debt 7 2012
Consumer Magazines 19 2014
Contact Centres 9 2013
Contraception 7 2014
Contract Catering & FoodserviceManagement 22 2013
Contract Cleaning 23 2013
Cooking & Eating Habits 7 2012
Cooking Sauces & FoodSeasonings 6 2013
Toys & Games The Key Note Range of Reports
© Key Note Ltd 2014 42
Title Edition Published
Corporate Hospitality 8 2014
Corporate & PromotionalGiftware 5 2013
Cosmetic Surgery 11 2014
Cosmetics & Fragrances 26 2013
Courier & Express Services 18 2013
Cruise Market 3 2012
Customer Magazines 6 2014
Customer RelationshipManagement 5 2013
Customer Services in FinancialOrganisations 5 2010
D
Debt Services (Commercial &Consumer) 8 2014
Defence Equipment 12 2014
Diet Foods 5 2013
Digital Broadcasting 7 2014
Digital Communications 2 2012
Direct Insurance 6 2010
Direct Marketing 21 2014
Direct Mortgages 9 2013
Discount Retailing 10 2014
Disposable Paper Products 14 2013
Distribution Industry 10 2009
DIY & Home ImprovementsIndustry 11 2009
Domestic Heating 15 2013
Drinks Market 19 2009
E
E-Commerce: The InternetGrocery Market 8 2014
E-Commerce: The InternetLeisure & Entertainment Market 5 2008
Electrical Contracting 11 2014
Electrical Wholesale 6 2013
Electricity Industry 9 2013
Electronic Banking 4 2008
Energy Industry 8 2010
Equipment for the Disabled 7 2014
E-Recruitment 4 2012
Estate Agents 18 2011
Estate Agents & Services 6 2012
Ethnic Foods 18 2013
European Long-Term Insurance 4 2008
European Renewable Energy 2 2008
European Short Breaks 2 2008
European Telecommunications 3 2010
European Tourist Attractions 3 2010
Title Edition Published
European Trends in FoodShopping 4 2009
Exhibitions & Conferences 14 2014
F
Fast-Food & Home-DeliveryOutlets 27 2013
Film Market 2 2009
Financial Services Marketing toBCs 1 2009
Financial Services Marketing toDEs 2009
Financial Services Marketing toStart-Up Businesses & the Self-Employed 3 2010
Financial Services Marketing tothe Affluent 1 2009
Financial Services Organisationson the Internet 5 2013
Fire Protection Equipment 10 2013
Fish & Fish Products 15 2012
Fitted Kitchens 12 2013
Food Industry 20 2010
Football Clubs & Finance 6 2014
Footwear 18 2013
Forecourt Retailing 9 2012
Franchising 13 2012
Freight Forwarding 18 2011
Frozen Foods 27 2014
Fruit & Vegetables 24 2014
Fruit Juices, Energy & JuiceDrinks 16 2014
Functional Foods 6 2010
Further & Higher Education 9 2014
G
Garden Equipment 15 2013
Gas Industry 8 2014
General Insurance 13 2010
Giftware 20 2011
Glassware 17 2013
Green & Ethical Consumer 6 2013
Greetings Cards 28 2014
Grey Consumer 6 2013
H
Hand Luggage & Leather Goods 17 2013
Health Clubs & Leisure Centres 13 2014
Healthy Eating 6 2008
Holiday Purchasing Patterns 7 2014
Home Entertainment 4 2012
Home Entertainment(Audiovisual) 1 2013
Toys & Games The Key Note Range of Reports
© Key Note Ltd 2014 43
Title Edition Published
Home Entertainment(Computing & Gaming) 1 2013
Home Furnishings 22 2014
Home Insurance 1 2014
Home Shopping 16 2014
Horticultural Retailing 18 2013
Hot Beverages 8 2014
Hotels 27 2013
Housebuilding 21 2013
Household Appliances (BrownGoods) 13 2013
Household Appliances (WhiteGoods) 19 2013
Household Detergents &Cleaners 18 2014
Household Furniture 21 2014
I
Ice Creams & Frozen Desserts 17 2014
Independent Financial Advisers 5 2013
Insurance Companies 12 2009
Insurance Industry 10 2009
Insurance Market 13 2012
Insurance Prospects 2 2008
Internet & Telephone Banking 2 2013
Internet Advertising 8 2013
IT Recruitment 7 2014
IT Security 12 2014
IT Training 15 2014
J
Jewellery & Watches 28 2014
K
Kitchenware 9 2013
L
Laboratory Equipment 12 2014
Legal Services to Consumers 1 2013
Leisure in the Home 3 2010
Leisure Outside the Home 3 2010
Lifestyle Magazines 6 2013
Lingerie 12 2014
Local Government Services 3 2010
Low-Fat & Reduced-Sugar Foods 5 2008
M
Marketing in the Digital Age 4 2012
Meat & Meat Products 24 2014
Medical Equipment 20 2014
Medical & Health Insurance 4 2012
Medical Insurance 1 2014
Men & Women’s Buying Habits 6 2012
Men’s Toiletries & Fragrances 7 2013
Title Edition Published
Metal Recycling 8 2014
Milk & Dairy Products 27 2013
Mobile Marketing 2 2014
Mobile Phones 10 2014
Motor Finance 5 2013
Motor Industry 12 2008
Motor Insurance (Consumer) 1 2014
Music Industry 3 2014
N
Natural Products 3 2012
Newspapers 20 2014
Non-Food Sales in Supermarkets 6 2013
Non-Metal Recycling 5 2014
Nutraceuticals 3 2008
O
Office Equipment Industry 9 2010
Office Furniture 23 2013
Offshore Oil & Gas Industry 7 2013
Ophthalmic Goods & Services 19 2013
Opticians & Optical Goods 5 2010
Organic Food & Drink 8 2012
OTC Pharmaceuticals 17 2014
Over-50s Consumer 1 2009
Own Brands 16 2014
P
Packaging (Food & Drink) 6 2010
Packaging (Glass) 13 2008
Packaging (Metals & Aerosols) 14 2014
Packaging (Paper & Board) 17 2014
Packaging (Plastics) 17 2014
Pensions 7 2013
Personal Banking 2 2012
Personal Lines Insurance 5 2012
Personal Loans 4 2008
Pet Insurance 1 2014
Pet Market 6 2014
Pharmaceuticals Industry 6 2008
Planning for Retirement 1 2008
Plus-Size Fashion 3 2009
Poultry 6 2014
Power Tools 7 2013
Premium Lagers, Beers & Ciders 12 2014
Printing 18 2014
Private Healthcare 23 2014
Protective Clothing & Equipment 9 2014
Public Houses 29 2013
Public Relations Industry 4 2012
Publishing Industry 13 2010
Toys & Games The Key Note Range of Reports
© Key Note Ltd 2014 44
Title Edition Published
R
Rail Travel 8 2011
Ready Meals 14 2013
Recruitment Agencies(Permanent) 13 2014
Recruitment Agencies(Temporary & Contract) 13 2014
Renewable Energy 6 2013
Restaurants 27 2013
Retail Pharmacies 19 2014
Road Haulage 23 2012
Rural Economy 2 2009
S
Sauces & Spreads 13 2012
Savings & Investments 7 2013
Security Industry 13 2010
Shopfitting 16 2014
Shopping Centres 4 2013
Singles Market 5 2012
Slimming Market 5 2013
Small Businesses & Banks 2 2010
Small Domestic ElectricalAppliances 14 2013
Snack Foods 22 2013
Social Media Marketing 3 2014
Soft Drinks (Carbonated &Concentrated) 20 2013
Soup Market 5 2013
Spirits & Liqueurs 3 2014
Sports Clothing & Footwear 16 2014
Sports Equipment 18 2013
Sports Market 13 2010
Sports Sponsorship 10 2014
Stationery (Personal & Office) 27 2013
Supermarket Own Labels 5 2013
Supermarket Services 4 2013
Sweet & Salty Snacks 16 2010
T
Take-Home Trade 18 2011
Teenage & Pre-Teen Magazines 6 2013
Timber & Joinery 21 2013
Toiletries 26 2014
Tourist Attractions 6 2013
Toys & Games 27 2014
Training 22 2014
Travel Insurance 1 2014
Travel & Tourism Market 17 2010
Travel Agents & Overseas TourOperators 26 2014
Trends in Food Shopping 5 2008
Title Edition Published
Trends in Leisure Activities 6 2014
Tyre Industry 7 2014
U
UK Internet Market 1 2009
Utilities 5 2013
V
Vegetarian Foods 7 2012
Vehicle Breakdown Services 8 2014
Vehicle Security 11 2014
Video Gaming 3 2014
Vitamins, Minerals &Supplements 8 2013
W
Wallcoverings & Ceramic Tiles 20 2014
Waste Management 13 2014
Water Industry 8 2013
Windows & Doors 22 2013
Wine 24 2014
Women's Plus-Size Fashion 5 2013
Working Women 5 2009
Y
Youth Fashionwear 5 2014
Key Note Archive Reports
A
Aerospace 12 2003
Agrochemicals & Fertilisers 3 2002
Air Freight 2 2005
Air Transport Logistics 1 2003
Animal Feedstuffs 11 2001
Audio Visual Retailing 1 2000
B
Baby Foods 3 2006
Baths & Showers 1 2000
Bearings 2 2007
Beds, Bedrooms & UpholsteredFurniture 2 2000
Bottled Water 2 2001
C
Cable & Satellite TV 10 2004
Call Centres 6 2006
Cash & Carry Outlets 16 2001
Cinemas & Theatres 9 2001
Clothing Retailers 1 2000
Commercial Radio 8 2004
Consumer Borrowing in Europe 1 2004
Consumer Internet Usage 4 2000
Contracted-Out Services 3 2007
Convenience Retailing 12 2002
Toys & Games The Key Note Range of Reports
© Key Note Ltd 2014 45
Title Edition Published
Cross-Border Shopping 1 2000
Customer Loyalty in the FinancialServices 1 2000
D
Dark Spirits & Liqueurs 3 2004
Defence Industry 7 2003
Design Consultancies 3 2000
Digital TV 2 2003
DINKY Market 3 2007
Document Imaging Systems 1 2007
Domestic Telecommunications 4 2006
Dry Cleaning & Laundry Services 5 2005
E
Electronic ComponentDistribution 12 2002
Electronic ComponentManufacturing 11 2002
Electronic Games 4 2003
Equipment Leasing 12 2003
E-Shopping 1 2002
European Electricity Industry 3 2007
European Gas Industry 3 2007
European Oil & Gas Industry 2 2007
European Water Industry 3 2007
Extended Financial Families 1 2005
F
Factoring & Invoice Discounting 2 2003
Finance Houses 11 2000
Financial Services Marketing toABC1s 1 2000
Financial Services Marketing toABs 4 2006
Financial Services Marketing toC1C2DEs 1 2004
Financial Services Marketing toOver-60s 1 2004
Financial Services Marketing tothe Retired & Elderly 3 2007
Free-To-Air TV 8 2004
Title Edition Published
G
Generation Y 1 2007
Global Positioning Systems 1 2002
Global Waste Management 2 2070
H
Health Foods 22 2003
Healthcare Market 10 2005
Heating, Ventilating & AirConditioning 9 2002
I
In-Car Entertainment 1 2000
Individual Savings Accounts 2 2005
Industrial Fasteners 8 2001
Industrial Pumps 5 2000
Industrial Valves 8 2001
Internet Service Providers 2 2005
Internet Usage in Business 8 2005
Issues & Challenges in the UK LifeAssurance Market 2 2002
Issues in Higher EducationFunding 2 2006
L
Leisure & Recreation Market 15 2005
Lighting Equipment 14 2002
M
Management Consultants 10 2003
Marketing to Children 4-11 3 2003
Mechanical Handling 9 2001
Millenium Youth 2 2002
Mobile Telecommunications 2 2007
N
New Media Marketing 3 2002
O
Off-Trade Spirits 3 2004
Organic Baby & Toddler Care 1 2007
Over-40s Consumer 2 2005
P
Paper & Board Manufacturers 14 2002
Passenger Travel in the UK 5 2007
Pay TV 2 2004
Pension Extenders 1 2002
Photocopiers & Fax Machines 14 2005
Plant Hire 13 2007
Plastic Cards in Europe 2 2005
Plastics Processing 10 2003
Pre-School Childcare 1 2001
Private-Sector Opportunities inEducation 2 2001
Toys & Games The Key Note Range of Reports
© Key Note Ltd 2014 46
Title Edition Published
Process Plant Industry 1 2000
Public Transport 1 2001
R
Rail Transport Logistics 1 2003
Railway Industry 2 2006
Recycling & the Environment 1 2000
Retail Credit 2 2000
Retail Development 1 2001
Road Transport Logistics 1 2003
S
Saving Trends in Eurozone 2 2002
Short Break Holidays 4 2001
Short Breaks 2 2004
Small Office Home OfficeConsumer 1 2001
Small Office Home OfficeProducts 1 2001
Sponsorship 2 2000
Supermarkets & Superstores 20 2003
T
Teenage Magazines 3 2007
Telecommunications 21 2007
Teleworking 2 2003
The Computer Market 11 2004
The Film Industry 4 2002
Title Edition Published
The Fish Industry 1 2001
The Legal Services Market 1 2005
The Luggage Market 1 2000
The Newspaper Industry 3 2005
Tweenagers 1 2001
V
Video & DVD Retail & Hire 8 2005
Videoconferencing 4 2007
W
Water Transport Logistics 1 2003
White Goods 2 2000
White Spirits 1 2005
Women Over 45 3 2007
© Key Note Ltd 2014
All rights reserved.
No part of this publication may be reproduced, copied, stored in an electronic retrieval system or transmittedsave with written permission or in accordance with the provisions of the Copyright, Designs and Patents Act
1988.
Published by Key Note Ltd, 5th Floor, Harlequin House, 7 High Street, Teddington, Richmond Upon Thames,TW11 8EE. Telephone: 0845-504 0452
Stringent efforts have been made by Key Note to ensure accuracy. However, due principally to the fact thatdata cannot always be verified, it is possible that some errors or omissions may occur; Key Note cannot acceptresponsibility for such errors or omissions. Details supplied by Key Note should only be used as an aid, to assist
the making of business decisions, not as the sole basis for taking such decisions.
Under the new Privacy and Electronic Communications Regulations 2004, it is unlawful for a business to makean unsolicited sales & marketing call to a corporate subscriber if it is either registered with CTPS or has
requested NOT to receive such calls.
Key Note Ltd holds and regularly updates (every 28 days) its data in accordance with the regulations andensures that its data are compliant, as of the date created. It is the responsibility of the caller to ensure that
these data are up to date; Key Note Ltd does not hold itself liable for any subsequent legalities.
If you have any queries regarding the CTPS legislation you may find the following website useful:www.ico.gov.uk
Toys & Games The Key Note Range of Reports
© Key Note Ltd 2014 47