Market Analysis of a Privately Owned and Operated Space ...
196
March 2017 Approved for public release; distribution is unlimited. IDA Paper P-8247 Log: H 16-001215 IDA SCIENCE & TECHNOLOGY POLICY INSTITUTE 1899 Pennsylvania Ave., Suite 520 Washington, DC 20006-3602 SCIENCE & TECHNOLOGY POLICY INSTITUTE Market Analysis of a Privately Owned and Operated Space Station Keith W. Crane Benjamin A. Corbin Bhavya Lal Reina S. Buenconsejo Danielle Piskorz Annalisa L. Weigel
-
Upload
khangminh22 -
Category
Documents
-
view
1 -
download
0
Transcript of Market Analysis of a Privately Owned and Operated Space ...
March 2017Approved for public release;
distribution is unlimited.
IDA Paper P-8247Log: H 16-001215
IDA SCIENCE & TECHNOLOGYPOLICY INSTITUTE
1899 Pennsylvania Ave., Suite 520 Washington, DC 20006-3602
S C I E N C E & T E C H N O L O G Y P O L I C Y I N S T I T U T E
Market Analysis of a Privately Ownedand Operated Space Station
Keith W. CraneBenjamin A. Corbin
Bhavya LalReina S. Buenconsejo
Danielle PiskorzAnnalisa L. Weigel
About This PublicationThis work was conducted by the IDA Science and Technology Policy Institute. The views, opinions, and findings should not be construed as representing the official position of the National Science Foundation or the sponsoring office.
For More InformationBhavya Lal, Project Leader [email protected], 202-419-3724
Mark J. Lewis, Director, IDA Science and Technology Policy Institute [email protected], 202-419-5491
Copyright Notice© 2018 Institute for Defense Analyses4850 Mark Center Drive, Alexandria, Virginia 22311-1882 • (703) 845-2000.
This material may be reproduced by or for the U.S. Government pursuant to the copyright license under the clause at FAR 52.227-14 [December 2007].
S C I E N C E & T E C H N O L O G Y P O L I C Y I N S T I T U T E
IDA Paper P-8247
Market Analysis of a Privately Owned and Operated Space Station
Keith W. CraneBenjamin A. Corbin
Bhavya LalReina S. Buenconsejo
Danielle PiskorzAnnalisa L. Weigel

iii
Executive Summary
The United States has built and operated two space stations that have provided a sustained human presence in low Earth orbit (LEO): Skylab, which orbited from 1973 to 1979, and the International Space Station (ISS), which has operated from 1998 to the present. The ISS was at one point scheduled to be retired in 2015 to help fund the Constellation program, but its operational life has been extended until 2024; its life could be extended to 2028 before major subsystems would potentially have to be overhauled or replaced. After retirement, the ISS might be deconstructed, with elements possibly made available for use by follow-on space stations into the 2030s.
The impending retirement of the ISS poses important questions about continued U.S. human presence in LEO for scientific, technological, and geopolitical reasons. Could the future of sustained U.S. human presence in LEO in the post-ISS era be built on the foundation of private sector efforts? Could commercial markets emerge that are large enough to support private space stations in LEO? Or will governments, at home or abroad, continue to be the primary owners, operators, and customers for space stations in LEO?
The purpose of this evaluation is to determine whether a private space station could cover operations and capital costs given current expectations about the likely size of potential future markets for their services. We strove specifically to understand the market for services provided by private space stations in LEO, and assess whether this market is likely to generate adequate revenues from such services to cover the fixed and operations costs of a space station owned and operated by the private sector.
Methodology For the purpose of this study, conducted between May and October 2016, we assumed
that a private space station would be wholly owned and operated by private parties who would decide the station’s capabilities, the markets it would serve, and the prices it would charge for its services. The private parties’ customers could be commercial or government entities—whoever would be willing to pay for the services. Additionally, we assumed that the space station needs to be human-tended or human-inhabited, located in LEO, and able to engage in many revenue-generating activities.
Next, we identified activities that could generate a revenue stream for the station. We envisioned the station as an industrial park in space, where researchers, astronauts, businesses, and non-profit organizations rent parts of the station for their activities. We

iv
then generated two estimates of revenues that the space station could earn by leasing space or providing services in support of these activities. Activities related to media, advertising and education were developed with input and review from experts at the global communications and advertising agency firm Saatchi & Saatchi in New York. For each activity, we employed assumptions that generated lower and higher revenue projections, and summed the lower projections to generate an aggregate “low” estimate and summed the higher projections to generate an aggregate “high” estimate. If a private space station were to be built, actual revenues could be lower or higher than either of the projections presented in this paper.
To generate these estimates, all in constant 2015 dollars, we held discussions with over 70 individuals engaged in activities in space or with detailed knowledge of such activities. In many cases, activities (and their costs) on the ISS were used as points of departure, with appropriate adjustments for private sector operations. Using information from these individuals and from other sources on market size, competing technologies, and costs of conducting the activity on a space station in LEO, we developed separate methodologies to estimate revenues from each activity for the space station.
We then selected space station concepts that might best serve the activities identified, and generate revenues. For each of the selected space station concepts, we generated parametric cost models, and used engineering design parametric relationships to estimate the costs of developing and constructing the station, the costs of operations once built, and the costs of resupply and personnel. We then compared annualized costs to potential revenue streams to determine if prospective revenues might be sufficient to cover a station’s costs and potentially attract private investment.
The analysis incorporated many assumptions, the most critical of which was a major reduction in the price of launch in the 2025 and beyond timeframe. We assumed launching an astronaut would be priced at about $20 million, a decrease of over 75 percent over the current price of launching U.S. astronauts; encapsulated cargo, at $20,000 per kilogram (kg), a decreases of about 66 percent from the current price; full launch, at $62 million, a decrease of about 50 percent; and propellant transport, $5,000 per kg, a service for which there are currently no prices because the service is not yet available.
Potential Private Space Station Activities and Revenue Streams STPI identified 21 activities that have the potential to generate revenues on a private
LEO space station. The activities fell into five categories:
• Human habitat or destination for private space flight participants or government astronauts
• Activities supporting the satellite sector, especially on-orbit assembly of satellites
v
• Manufacturing products and services for use in space and on Earth, specifically high-grade silicon carbide and exotic fiber optic cable
• Research and development (R&D), testing, and Earth observation
• Media, advertising, and education
Our methodology ruled out products such as growing human organs in space that we believe are more than a decade away from becoming a reality. Markets like these or others we have not encountered in our research may emerge, generating revenues not included in this analysis. Some markets for space station-based products and services could experience much more rapid growth than we have assumed here. Conversely, there is the risk that products or services projected to generate large revenues fail to do so. R&D directed towards producing these products in space may actually make it possible to produce those products on Earth or on high-altitude controlled, suborbital or parabolic platforms at lower cost.
Other challenges make our projections uncertain. For example, we do not yet know the extent to which potential future Chinese or Russian space stations might draw away opportunities from a U.S. private space station.
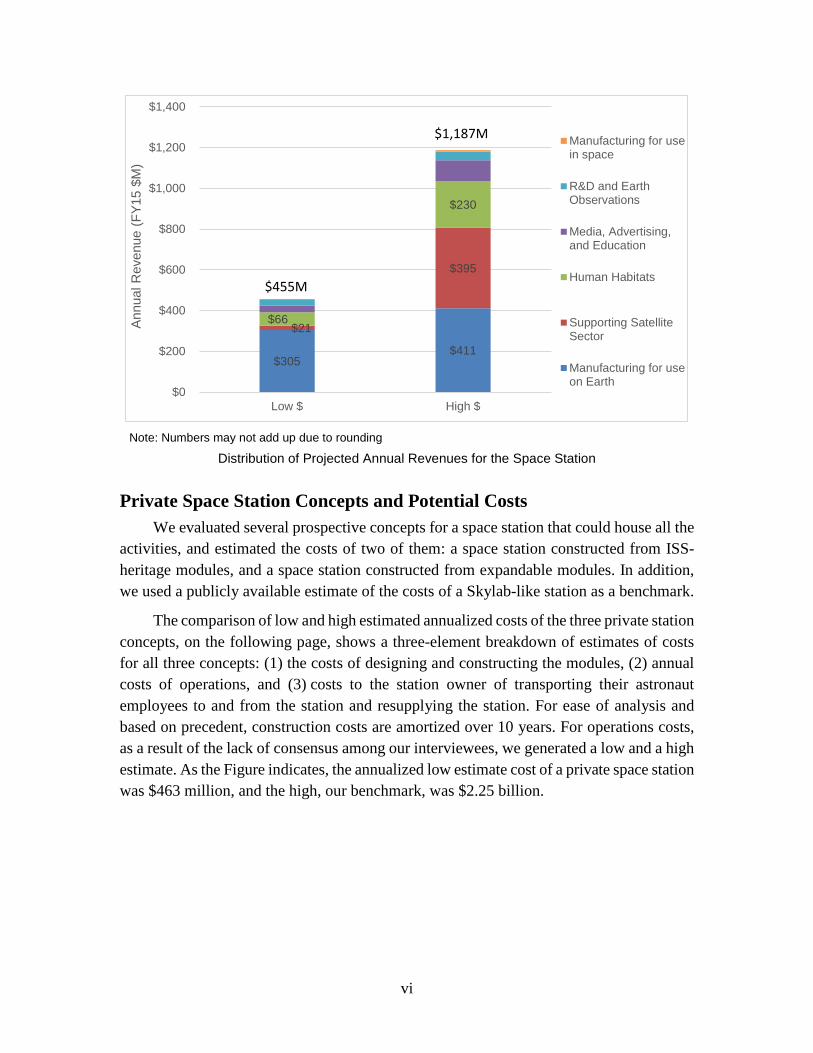
The low estimate for total annualized revenues from activities conducted on a space station is $455 million and the high estimate is $1,187 million. The figure below shows that two categories of activities account for most of the projected revenues. For the high estimate (right column), manufacturing products in space is the largest contributor to overall revenues, accounting for nearly 35 percent. Potentially profitable manufacturing operations for exotic optical fibers drive these revenues. Revenue from satellite support—specifically assembly in orbit—was a close second, at 30 percent of total revenues. In the case of the low estimate (left column), the manufacture of exotic optical fibers alone accounted for over half of total revenues.
These revenues are highly uncertain, and based on extrapolations of current views, as they are for revenues 10 years from 2016. The estimates should not be considered lower or upper bounds; rather, they represent our best attempts to provide data-driven estimates of potential revenues based on different sets of assumptions. The difference between our low estimate and high estimate is large—$732 million. This large difference reflects the highly tentative nature of these estimates.
While the projections are per force speculative, they do provide empirically based assessments of almost all of the activities that have been discussed as potential revenue sources for a privately owned and operated space station. These estimates are designed to help policymakers assess the prospects that the private sector might invest in such endeavors.
vi
Note: Numbers may not add up due to rounding
Distribution of Projected Annual Revenues for the Space Station
Private Space Station Concepts and Potential Costs We evaluated several prospective concepts for a space station that could house all the
activities, and estimated the costs of two of them: a space station constructed from ISS-heritage modules, and a space station constructed from expandable modules. In addition, we used a publicly available estimate of the costs of a Skylab-like station as a benchmark.
The comparison of low and high estimated annualized costs of the three private station concepts, on the following page, shows a three-element breakdown of estimates of costs for all three concepts: (1) the costs of designing and constructing the modules, (2) annual costs of operations, and (3) costs to the station owner of transporting their astronaut employees to and from the station and resupplying the station. For ease of analysis and based on precedent, construction costs are amortized over 10 years. For operations costs, as a result of the lack of consensus among our interviewees, we generated a low and a high estimate. As the Figure indicates, the annualized low estimate cost of a private space station was $463 million, and the high, our benchmark, was $2.25 billion.
$305 $411
$21
$395
$66
$230
$0
$200
$400
$600
$800
$1,000
$1,200
$1,400
Low $ High $
Annu
al R
even
ue (F
Y15
$M)
Manufacturing for usein space
R&D and EarthObservations
Media, Advertising,and Education
Human Habitats
Supporting SatelliteSector
Manufacturing for useon Earth
$455M
$1,187M

vii
Comparison of Low (left) and High (right) Estimated Annualized Costs of Three Private
Station Concepts
Is There a Business Case for Private Space Stations? The quad chart below maps the low and high estimates of annual revenues and
annualized costs for the station. As can be seen, even in a best case scenario where launch costs are significantly lower than they are today, and other optimistic assumptions, neither estimate of annual revenues covers the estimate of annualized costs for the high estimate (our benchmark). Out of the four cases, only in the high-revenue, low-cost scenario do revenues exceed costs.
Estimated Annualized Cost and Revenue Estimates for a Private Space Station
0
500
1000
1500
2000
2500
ISSHeritageModule
ExpandableModules
Benchmark(for a
Skylab-likestation)
Annu
al C
ost (
FY15
$M
)
Personnel and ResupplyOperations - LowConstruction Amortized
0
500
1000
1500
2000
2500
ISSHeritageModule
ExpandableModules
Benchmark(for a
Skylab-likestation)
Annu
al C
ost (
FY15
$M
)
Personnel and ResupplyOperations - HighConstruction Amortized
viii
We conducted a simple financial analysis to determine whether a station might generate a sufficiently high rate of return to attract private investors. For the instances in which station costs were low (the higher cost scenario ended up losing money), we calculated the internal rates of return for a prospective privately owned and operated space station. In the case of high revenues and low construction and low operations costs ($200 million), the internal rate of return is 40 percent, exceeding even the highest venture capital fund hurdle rate. When we use high revenue and low construction costs but high operations costs ($650 million), the internal rate of return falls to 18 percent. Financial results for the low-revenue projections are much less attractive. If construction and operations costs are low, the internal rate of return would be -5 percent. The station loses even more money if operations costs are high. Venture capitalists whom we interviewed noted that the projections of revenues and costs are so uncertain that they would have no interest in financing a space station until projected revenues from these activities show signs of materializing.
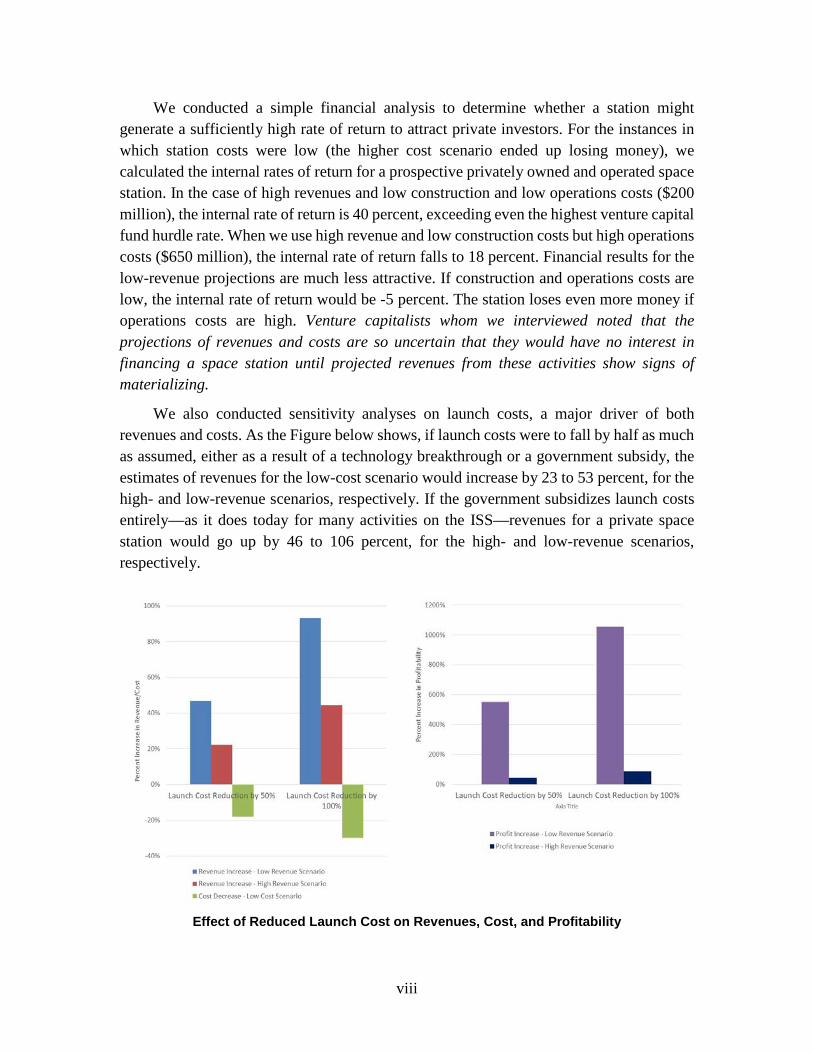
We also conducted sensitivity analyses on launch costs, a major driver of both revenues and costs. As the Figure below shows, if launch costs were to fall by half as much as assumed, either as a result of a technology breakthrough or a government subsidy, the estimates of revenues for the low-cost scenario would increase by 23 to 53 percent, for the high- and low-revenue scenarios, respectively. If the government subsidizes launch costs entirely—as it does today for many activities on the ISS—revenues for a private space station would go up by 46 to 106 percent, for the high- and low-revenue scenarios, respectively.
Effect of Reduced Launch Cost on Revenues, Cost, and Profitability

ix
How Might the Federal Government Participate in the Private Space Station Market?
Based on our findings above, it is unlikely that a commercially owned and operated space station will be economically viable by 2025. It could yield an attractive rate-of-return under our most optimistic assumptions, but the venture capital community views the revenue streams as too uncertain to warrant substantial investment. A wealthy individual could choose to self-finance the project. Alternatively, or in conjunction with the private sector, the Federal Government may wish to think in advance about how it might like to engage in the emergence of a private space station or space stations, and reduce market, financing, regulatory, policy, and technology risks to operators and their investors. Options for government participation range from earlier and more active involvement in the form of public-private partnerships to guide and shape the market for space station services to later-stage involvement as a purchaser of private space station services as they emerge. These options can be used separately or together to assemble a strategy for government participation. Examples of three options along the spectrum of potential Federal Government participation are:
• Early stage investment through a public-private partnership: The U.S. Government may wish to participate as an investor in a public-private partnership with a space station owner and operator to ensure that the project comes to fruition, and also to influence the design of the station to ensure that it fills NASA’s needs. The private partners need not be commercial entities; they can be a non-profit consortium of universities or other organizations with the ability to raise private funds.
• Advance purchase or lease agreements: Through advance purchase agreements and advance long-term lease agreements for a private space station, the U.S. Government could be an early customer to secure for itself a guarantee-of-service at more favorable conditions than purchases at market prices after the station is completed. These policy instruments have the additional advantage of shifting the outlays of expenditures closer to the time of delivery of the product or service than would a direct investment in the station, aligning the costs of using a private space station with the benefits achieved from such use more closely in time, and facilitating better cash flow for the U.S. Government.
• Direct purchases of space station services: The U.S. Government could choose to wait until a space station is completed and operating, and at that point rent space for R&D or purchase other services (such as astronaut visits) provided by the station as needed. At that point in time, purchases of services would be at market prices that are likely to be higher than prices provided for advance purchases. Services may also be subject to availability constraints; however,

x
purchases on these conditions offer the government flexibility, as the government would have made no commitment in advance to purchase services.
xi
Contents
1. Introduction .................................................................................................................1 A. History of U.S. Space Stations and Commercial Activities Associated with
Them ....................................................................................................................1 B. Project Objective, Methodology, and Key Assumptions ....................................4
1. Objective .......................................................................................................4 2. Methodology .................................................................................................4 3. Key Assumptions ..........................................................................................8
C. Previous Work on Estimating the Market Potential of a Space Station ............11 D. Organization of this Report ...............................................................................13
2. Space Station Activities: Human Habitats ................................................................15 A. Private Astronauts .............................................................................................15
1. Description of Service .................................................................................15 2. Methodology for Estimating Revenues .......................................................15 3. Results .........................................................................................................17 4. Alternatives .................................................................................................17
B. Government Astronauts .....................................................................................17 1. Description of Service .................................................................................17 2. Methodology for Estimating Revenues .......................................................18 3. Results .........................................................................................................22
C. Summary ...........................................................................................................24 3. Space Station Activities: Supporting the Satellite Sector ..........................................25
A. Satellite Assembly in Space ..............................................................................26 1. Description of Service .................................................................................26 2. Methodology for Estimating Revenues .......................................................28 3. Results .........................................................................................................33 4. Alternatives .................................................................................................34
B. Other Satellite Support Activities ......................................................................34 1. Satellite Repair ............................................................................................34 2. Refueling Satellites ......................................................................................35 3. Small Satellite Deployment from Station ....................................................37 4. Debris Removal ...........................................................................................40
C. Summary ...........................................................................................................41 4. Space Station Activities: Producing Products and Services in Space for Use on
Earth ..........................................................................................................................43 A. Silicon Carbide Wafers .....................................................................................43
1. Description of Service .................................................................................43 2. Methodology for Estimating Revenues .......................................................44

xii
3. Results .........................................................................................................45 4. Alternatives .................................................................................................46
B. Exotic Fiber Optic Cable ...................................................................................46 1. Description of Service .................................................................................46 2. Methodology for Estimating Revenues .......................................................48 3. Results .........................................................................................................49 4. Alternatives .................................................................................................50
C. Supercomputing .................................................................................................50 1. Description of Service .................................................................................50 2. Methodology for Estimating Revenues .......................................................50 3. Results .........................................................................................................51
D. Summary ...........................................................................................................51 5. Space Station Activities: Manufacturing and Assembling Products for Use in
Space ..........................................................................................................................53 A. Additive Manufacturing ....................................................................................53
1. Description of Services ...............................................................................53 2. Methodology for Estimating Revenues .......................................................56 3. Results .........................................................................................................56
B. Assembling Structures for Use in Space ...........................................................57 1. Description of Service .................................................................................57 2. Potential Cost Savings .................................................................................57 3. Results .........................................................................................................59
C. Summary ...........................................................................................................59 6. Space Station Activities: Research and Development, Technology Development and
Testing, and Earth Observation .................................................................................61 A. Research and Development (R&D) ...................................................................61
1. Description of Service .................................................................................61 2. Methodology for Estimating Revenues .......................................................64 3. Results .........................................................................................................67 4. Alternatives .................................................................................................67
B. Technology Development and Testing ..............................................................67 1. Description of Service .................................................................................67 2. Methodology for Estimating Revenues .......................................................68 3. Results .........................................................................................................68
C. Earth Observation and Remote Sensing ............................................................69 1. Description of Service .................................................................................69 2. Methodology for Estimating Revenues .......................................................69 3. Results .........................................................................................................70
D. Summary ...........................................................................................................70 7. Space Station Activities: Media, Advertising, and Education ..................................73
A. Feature Films and Documentaries .....................................................................73 1. Description of Service .................................................................................73 2. Methodology for Estimating Revenues .......................................................74
xiii
3. Results .........................................................................................................76 4. Alternatives .................................................................................................76
B. Advertising: Commercials and Product Placement ...........................................76 1. Description of Service .................................................................................76 2. Methodology for Estimating Revenues .......................................................77 3. Results .........................................................................................................78
C. Sponsorships ......................................................................................................78 1. Description of Service .................................................................................78 2. Methodology for Estimating Revenues .......................................................79 3. Results .........................................................................................................79
D. Naming Rights ...................................................................................................80 1. Description of Service .................................................................................80 2. Methodology for Estimating Revenues .......................................................80 3. Results .........................................................................................................81
E. Sponsored Events and Sporting Events .............................................................81 1. Description of Service .................................................................................81 2. Methodology for Estimating Revenues .......................................................82 3. Results .........................................................................................................83
F. Virtual and Augmented Reality .........................................................................83 1. Description of Services ...............................................................................83 2. Methodology for Estimating Revenues .......................................................84 3. Results .........................................................................................................84
G. K-12 and Post-Secondary Education .................................................................84 1. Description of Service .................................................................................84 2. Methodology for Estimating Revenues .......................................................85 3. Results .........................................................................................................86
H. Other Activities .................................................................................................86 I. Summary ...........................................................................................................87
8. Design and Configuration Concepts for Future Private Stations ..............................89 A. Critical Design Parameters ................................................................................89
1. Number of Astronauts .................................................................................89 2. Volume ........................................................................................................91 3. Vibration Free Environment ........................................................................91
B. Potential Configuration Concepts .....................................................................92 1. ISS-Heritage Modules .................................................................................93 2. String of Pearls ............................................................................................93 3. Expandable Modules ...................................................................................93 4. Cargo Vehicle Modules ...............................................................................93 5. Refurbished Fuel Tanks ...............................................................................94 6. Short-Term Capsules ...................................................................................94 7. Long-Term Capsules ...................................................................................94
C. Potential Station Orbits .....................................................................................94 1. Orbital Altitude ............................................................................................94
xiv
2. Orbital Inclination .......................................................................................95 D. Space Station Configurations and Inclinations Suitable for Revenue-
Generating Activities .........................................................................................96 1. Configurations .............................................................................................96 2. Inclinations ..................................................................................................96
9. Potential Costs of Future Private Space Stations ......................................................99 A. Module Costs .....................................................................................................99 B. Subsystem Costs ..............................................................................................100
1. Attitude Determination and Control Subsystem .......................................101 2. Power Subsystem ......................................................................................101 3. Telemetry, Tracking, and Command Subsystem ......................................102 4. Communications Subsystem .....................................................................102 5. Propulsion Subsystem ...............................................................................102 6. Life Support Subsystem ............................................................................103 7. Thermal Control Subsystem ......................................................................103 8. Total Subsystem Costs ..............................................................................104
C. Launch Costs ...................................................................................................104 D. Construction Costs Comparison ......................................................................105 E. Operations Costs ..............................................................................................106 F. Resupply Costs ................................................................................................107 G. Total Private Station Costs ..............................................................................108
10. Summary and Conclusion ........................................................................................111 A. Summary of Potential Revenues and Costs .....................................................111
1. Potential Revenues ....................................................................................111 2. Potential Costs ...........................................................................................114 3. Differences between Potential Space Station Revenues and Costs ...........115
B. Financial Analyses ..........................................................................................116 C. Reflections on the Market Analysis ................................................................118
1. Potential Reductions in Costs Due to Private Sector Involvement ...........118 2. Uncertainties Surrounding Revenue Estimates .........................................119 3. Sensitivity Analyses ..................................................................................120
D. Barriers and Enablers to Private Investment in the Private Space Station Market .............................................................................................................122 1. Market Risks ..............................................................................................123 2. Technology Risks ......................................................................................124 3. Regulatory and Policy Risks .....................................................................125 4. Financial Risks ..........................................................................................126
E. How Can the Federal Government Participate in the Private Space Station Market? ............................................................................................................127 1. Early Stage Investment in Private Space Stations .....................................128 2. Advance Purchase or Lease Agreements ..................................................129 3. Direct Purchases of Space Station Services ..............................................130
F. Financing Options ...........................................................................................131
xv
1. Venture Capital ..........................................................................................131 2. Wealthy Individuals ..................................................................................132 3. University Consortia ..................................................................................133
Appendix A. List of Interviews ...................................................................................... A-1 Appendix B. Revenue Calculation Assumptions .............................................................B-1 Appendix C. Potential Station Concepts and Configurations ..........................................C-1 Appendix D. Potential Orbital Inclinations .................................................................... D-1 Appendix E. Cost Estimates for Cargo Module Stations and Capsules .......................... E-1 Appendix F. Cost Estimates for Power Subsystem ......................................................... F-1 Illustrations ..................................................................................................................... G-1 References ....................................................................................................................... H-1 Abbreviations .................................................................................................................... I-1


1
1. Introduction
The United States has had a sustained human presence in low Earth orbit (LEO) through two space stations: Skylab, which operated between 1973 and 1979, and the International Space Station (ISS), the core module of which was launched in 1998. The ISS was at one point scheduled to be retired in 2015 to help fund the Constellation program, but operations have been extended until at least 2024; they could be extended again to 2028 or beyond (Holdren and Bolden 2014). Many experts, including some in positions of leadership at NASA, believe that the private sector should build and operate one or more follow-on space stations so that NASA can devote its resources and expertise to deep space exploration (Smith 2015). Others believe that commercialization of such an endeavor is improbable given the costs and risks.
In light of this debate, in 2016, researchers at the IDA Science and Technology Policy Institute (STPI) analyzed the market case for a privately owned and operated space station as a follow-on to the ISS. Our goal was to determine whether such a station could generate adequate revenues from economic activities in LEO to cover the costs of building and operating a private space station.
A. History of U.S. Space Stations and Commercial Activities Associated with Them A sustained human presence in LEO has been a long-standing priority of U.S. space
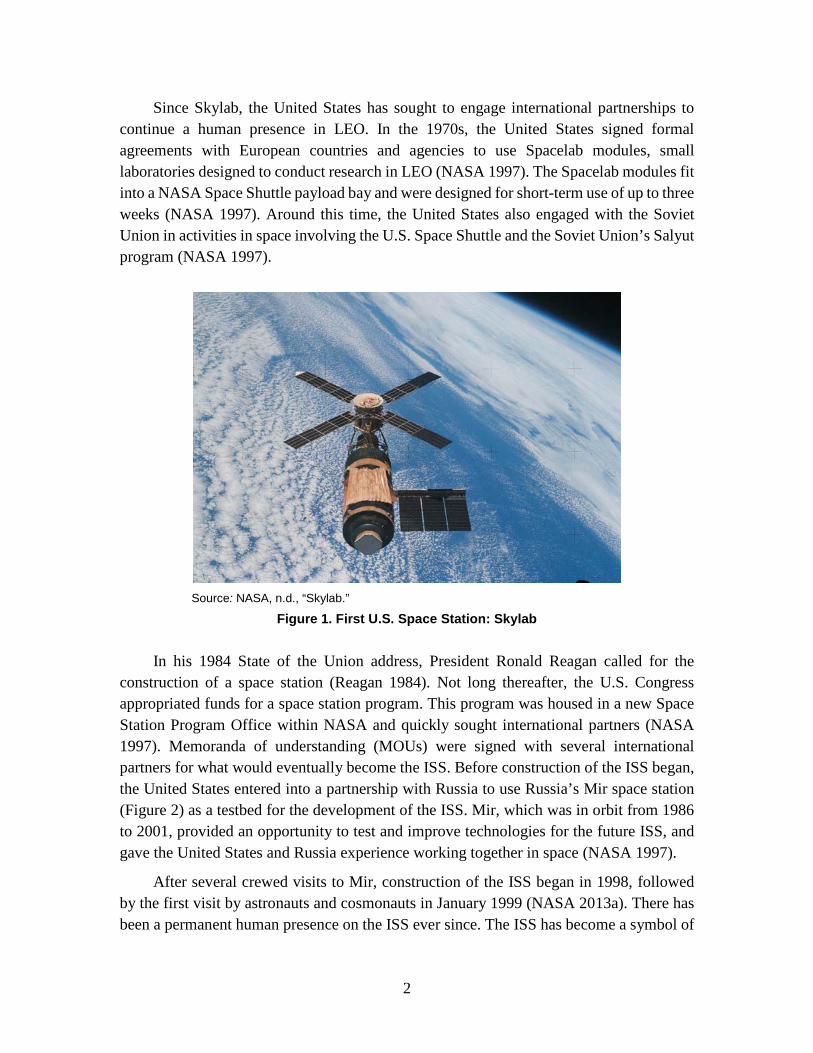
leaders. From 1952 to 1954, Collier’s magazine published an influential series of articles on space exploration and crewed space stations, some of which were written by Werner von Braun. A House Select Committee on Astronautics and Space Exploration summarized inputs from experts and leaders who agreed that a space station was an important follow-on to Project Mercury, the mission that put the first Americans into space. In 1969, the Post-Apollo Agnew Space Task Group recommended that small (6–12 people) permanent space stations be placed in several orbits and be serviced by shuttles, leading to an eventual 50- to 100-person space base built from combined station elements. In 1973, NASA launched Skylab (Figure 1), which hosted three separate crews for stays varying from 28 to 84 days, although it was not capable of hosting a permanent crew (NASA 1997). Activities conducted on Skylab ranged from microgravity research to Earth observations to biomedical tests. Skylab was operational through 1974, when its final crew departed, and was decommissioned in 1979 when it reentered Earth’s atmosphere.
2
Since Skylab, the United States has sought to engage international partnerships to continue a human presence in LEO. In the 1970s, the United States signed formal agreements with European countries and agencies to use Spacelab modules, small laboratories designed to conduct research in LEO (NASA 1997). The Spacelab modules fit into a NASA Space Shuttle payload bay and were designed for short-term use of up to three weeks (NASA 1997). Around this time, the United States also engaged with the Soviet Union in activities in space involving the U.S. Space Shuttle and the Soviet Union’s Salyut program (NASA 1997).
Source: NASA, n.d., “Skylab.”
Figure 1. First U.S. Space Station: Skylab
In his 1984 State of the Union address, President Ronald Reagan called for the construction of a space station (Reagan 1984). Not long thereafter, the U.S. Congress appropriated funds for a space station program. This program was housed in a new Space Station Program Office within NASA and quickly sought international partners (NASA 1997). Memoranda of understanding (MOUs) were signed with several international partners for what would eventually become the ISS. Before construction of the ISS began, the United States entered into a partnership with Russia to use Russia’s Mir space station (Figure 2) as a testbed for the development of the ISS. Mir, which was in orbit from 1986 to 2001, provided an opportunity to test and improve technologies for the future ISS, and gave the United States and Russia experience working together in space (NASA 1997).
After several crewed visits to Mir, construction of the ISS began in 1998, followed by the first visit by astronauts and cosmonauts in January 1999 (NASA 2013a). There has been a permanent human presence on the ISS ever since. The ISS has become a symbol of

3
international cooperation and collaboration (Figure 3); it is, by some measures, the largest peacetime international collaboration ever undertaken (NASA 1997).
Source: NASA, n.d., “Mir Space Station.”
Figure 2. Russian Mir Space Station
Source: NASA, n.d., “International Space Station.”
Figure 3. International Space Station
4
A commercial space station in LEO has been envisioned since the earliest days of the current space station. In his 1984 State of the Union address, President Reagan referenced commercial objectives:
Just as the oceans opened up a new world for clipper ships and Yankee traders, space holds enormous potential for commerce today [emphasis added]. The market for space transportation could surpass our capacity to develop it. Companies interested in putting payloads into space must have ready access to private sector launch services.…We’ll soon implement a number of executive initiatives, develop proposals to ease regulatory constraints, and, with NASA’s help, promote private sector investment in space [emphasis added] (Reagan 1984).
Even at the time it was being developed, NASA was tasked with making plans to commercialize the station; in the long term, NASA was “to establish the foundation for a marketplace and stimulate a national economy for space products and services in LEO, where both demand and supply are dominated by the private sector” and, in the short term, “to begin the transition to private investment and offset a share of the public cost for operating the Space Shuttle fleet and space station through commercial enterprise in open markets” (NASA 1998a). The goal was to position NASA so that an active economic development program would be in place by the time U.S. research facilities were on the ISS in 2000 (NASA 1998a).
B. Project Objective, Methodology, and Key Assumptions
1. Objective The objective of this project is to explore and analyze the market case for one or more
private follow-on space stations to the ISS. It is infeasible to precisely forecast future revenues from a commercial space station—forecasting potential revenues from activities in space, given the rapid changes the space sector is undergoing, is subject to very large uncertainties. Rather, our objective is to identify activities that have the potential to generate relatively substantial revenues for a space station, and to estimate whether those revenues may be large enough to substantially defray the costs of building and operating such a station.
2. Methodology At the highest level, to evaluate the market case for a private space station, we first
estimated potential revenues that a privately operated space station could generate. Next we conceptualized a range of space station configurations, and estimated the potential costs of building and operating a private space station equipped to generate those revenues. We then determined whether the estimated revenues might exceed these costs. Lastly, we
5
assessed financial considerations for a private space station, estimating prospective internal rates of return. All costs in this paper are in Fiscal Year 2015 constant dollars.
The analysis was conducted through four tasks, discussed below:
a. Identify activities that the station would support. Drawing on interviews with representatives from organizations involved in space
activities and other experts, we identified and described a list of commercial activities that a space station might support. Appendix A lists the names and organizational affiliations of all interviewees who agreed to speak with us and have their names acknowledged.
We confined our set of activities to those that might be feasible over the course of the next decade. Unless an activity is currently being conducted on the ISS, or an existing company is likely to be prepared to engage in the activity by 2024, potential investors in a private space station would be unlikely to move forward by 2024 to replace the ISS.
The same rationale held for costs of activities. We used estimates of parameters such as launch and module costs based on technologies currently in use or that are close to becoming commercially available. We did not estimate revenues or costs for activities or technologies that are unlikely to be developed and deployed within the next 10 years. For this reason, activities such as generating space-based solar power or using space elevators for access to space are not included on our list.
b. Estimate the potential revenues for each of these activities. Potential investors in a private space station will invest only if they can generate a
positive rate of return from sales of services from the station greater than from other investment opportunities. Similarly, individuals and companies will purchase services from a space station only if the station can either provide services more cheaply or provide services that cannot be provided through other means. A space station owner can also generate revenues by capitalizing on characteristics only available on a space station.
To generate estimates of revenues for the owner of a private space station, we estimated the value added that a space station might provide for our list of potential commercial activities in space. For most activities, the station would function like an “industrial park in orbit,” leasing out space for organizations and enterprises seeking to exploit the unique environment of space for their activities.
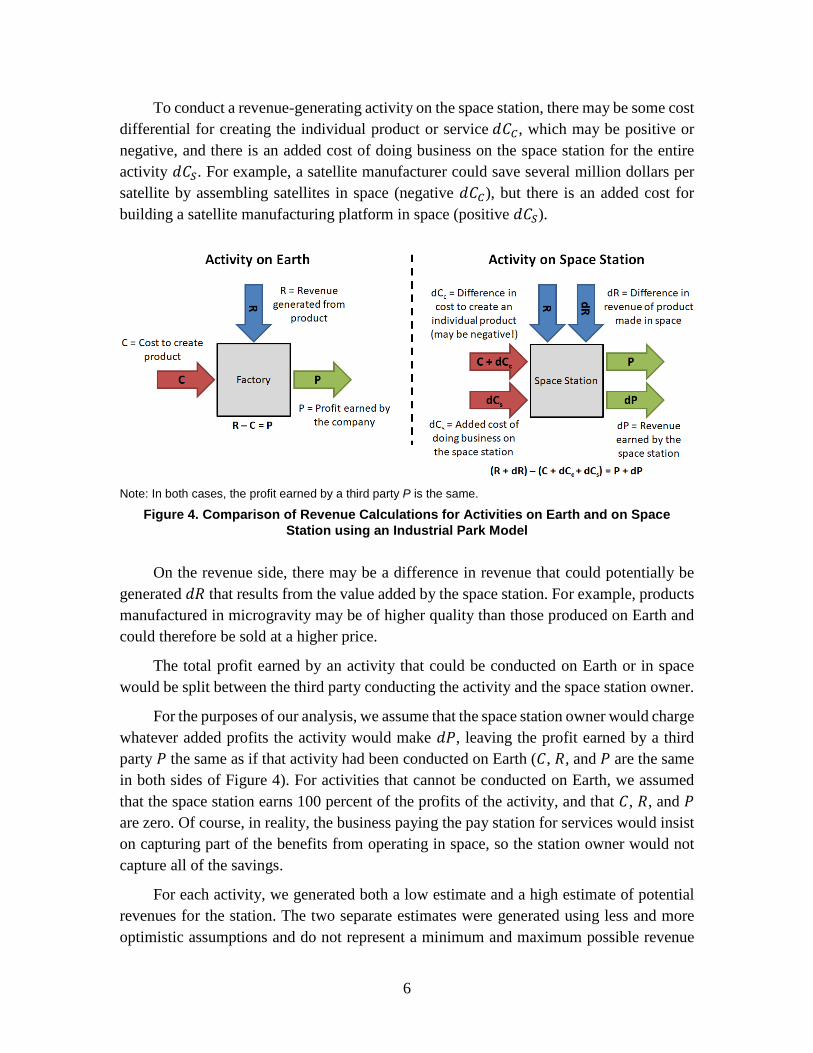
Figure 4 illustrates how revenues for the station owner are calculated compared to how they would be calculated on Earth. For revenue-generating activities conducted on Earth, a third-party company with its own factory would require some cost 𝐶𝐶 to create a product while earning some revenue 𝑅𝑅, for a total profit 𝑃𝑃 = 𝑅𝑅 − 𝐶𝐶 for that activity.
6
To conduct a revenue-generating activity on the space station, there may be some cost differential for creating the individual product or service 𝑑𝑑𝐶𝐶𝐶𝐶, which may be positive or negative, and there is an added cost of doing business on the space station for the entire activity 𝑑𝑑𝐶𝐶𝑆𝑆. For example, a satellite manufacturer could save several million dollars per satellite by assembling satellites in space (negative 𝑑𝑑𝐶𝐶𝐶𝐶), but there is an added cost for building a satellite manufacturing platform in space (positive 𝑑𝑑𝐶𝐶𝑆𝑆).
Note: In both cases, the profit earned by a third party P is the same.
Figure 4. Comparison of Revenue Calculations for Activities on Earth and on Space Station using an Industrial Park Model
On the revenue side, there may be a difference in revenue that could potentially be
generated 𝑑𝑑𝑅𝑅 that results from the value added by the space station. For example, products manufactured in microgravity may be of higher quality than those produced on Earth and could therefore be sold at a higher price.
The total profit earned by an activity that could be conducted on Earth or in space would be split between the third party conducting the activity and the space station owner.
For the purposes of our analysis, we assume that the space station owner would charge whatever added profits the activity would make 𝑑𝑑𝑃𝑃, leaving the profit earned by a third party 𝑃𝑃 the same as if that activity had been conducted on Earth (𝐶𝐶, 𝑅𝑅, and 𝑃𝑃 are the same in both sides of Figure 4). For activities that cannot be conducted on Earth, we assumed that the space station earns 100 percent of the profits of the activity, and that 𝐶𝐶, 𝑅𝑅, and 𝑃𝑃 are zero. Of course, in reality, the business paying the pay station for services would insist on capturing part of the benefits from operating in space, so the station owner would not capture all of the savings.
For each activity, we generated both a low estimate and a high estimate of potential revenues for the station. The two separate estimates were generated using less and more optimistic assumptions and do not represent a minimum and maximum possible revenue
7
range. In some instances, we drew on estimates of a customer’s willingness to pay, for example, potential prices that could be charged for private astronauts. In other cases, we estimated the reduction in costs possible from conducting the activity in space under two different sets of assumptions—for example, two different sets of engineering constants to estimate reductions in costs for assembling satellites in space. These reductions in costs would provide potential savings that the space station could capture by charging rent for that service.
For each activity, we developed models that allow for sensitivity analyses and enable changes in assumptions (e.g., numbers of private astronauts) that would change revenue levels. The revenue models and computational explanations are provided in Chapters 2 through 7, which analyze each activity. Each calculation incorporates both overarching assumptions and assumptions unique to its case. Each assumption is explained in the corresponding section. For ease of review, all assumptions for our revenue calculations are summarized in Appendix B.
c. Estimate the potential costs of various space station configuration concepts. We drew on information available from the literature, manufacturers, and other
experts to identify potential configuration concepts (e.g., location, orbital inclination, and design of the station) for a private space station in LEO likely to support our list of activities. We then estimated the costs of the concepts we deemed most likely to fulfill a station’s critical design parameters.
Views on the costs of constructing and operating a private space station vary widely. Accordingly, as with our estimates of revenues, we provide our cost models in a Microsoft Excel workbook that can be made available to readers, who can change our assumptions to calculate alternative cost levels.1
d. Assess financial considerations for a private space station. Based on these revenue and cost estimates, we generated net profit comparisons
between the space station concepts and potential revenue scenarios. We then looked at investment risks to a private space station endeavor, ways to mitigate those risks, and how the U.S. Government could be involved in the evolution of private space station markets.
We collected data to support the analysis from discussions with representatives of firms interested in either building a space station in LEO, developing businesses on a LEO space station, or both; space insurance experts; venture capital and high-net worth individuals with the ability to fund a station if a market case can be made; NASA and other experts considering LEO commercialization activities; and other stakeholders. Chapter 7,
1 A request for the Microsoft Excel workbook can be sent via email to Bhavya Lal ([email protected]).
8
“Space Station Activities: Media, Advertising, and Education,” was developed with input and review from experts at the global communications and advertising agency firm Saatchi & Saatchi in New York.
In addition to gathering information on potential revenues from economic activities on a space station and the prospective costs of such a station, we asked potential investors and financial analysts about prospective rates of return necessary to attract investment in a privately owned and operated space station. We also asked these and other individuals for their general perspectives on the prospects for private investment in a station in LEO. Interviews were conducted with over 70 experts. We note parenthetically when the source of our information is from an interviewee who is an expert in the area with the notation “expert interview.”
In addition to the interviews, the team reviewed more than 100 papers, articles, websites, and reports. Members of the team also gathered information from interviewing experts attending the 2016 ISS R&D conference in San Diego, California; the 2016 Space 2.0 conference in San Jose, California; and the NewSpace 2016 conference in Seattle, Washington.
3. Key Assumptions
a. Space Station For the purposes of this paper, we assumed that a private space station in LEO would
be tended or inhabited by humans, where human habitation can be sporadic or continuous. In addition to hosting private and sovereign astronauts, the station could also provide a platform for activities such as satellite assembly, research and development (R&D), and manufacturing in space, among others.
Although we did not assume a specific size for the private space station, it would need to be large enough to encompass the various revenue-generating activities we describe in this paper. The station need not emulate any known space station, including the ISS. It could be modular, starting small and potentially growing to a size larger than the ISS, but initially, it is likely to be significantly smaller than the ISS. Our calculations assume a station in steady-state operation, supporting all revenue-generating activities simultaneously. This assumption ensured the largest possible revenue envelope.
We also assumed that the station would be commercial in that it would be owned and operated by private parties that would decide the station’s capabilities, the markets it would serve, and the prices it would charge for its services. Definitions of the terms private and commercial are drawn from Lal et al. (2015). We assumed that the company or entity that owns the space station is incorporated in the United States. The station would be perceived as a U.S. venture, although non-Americans might take an appreciable financial stake in the
9
station. Customers could be any commercial or government entity willing to pay for the station’s services.
We assumed that a privately owned space station would be operating in some capacity by the time the ISS is retired, i.e., by 2024 or 2028. The station might be standalone or might begin by being attached to the current ISS for some period of time.
b. Launch Costs Assumptions concerning the cost of transporting astronauts, large objects (such as
space station modules or space tugs), consumables, and fuel to the space station were major drivers of our estimates of both potential revenues and costs. We used six separate categories for launch costs in our analysis:
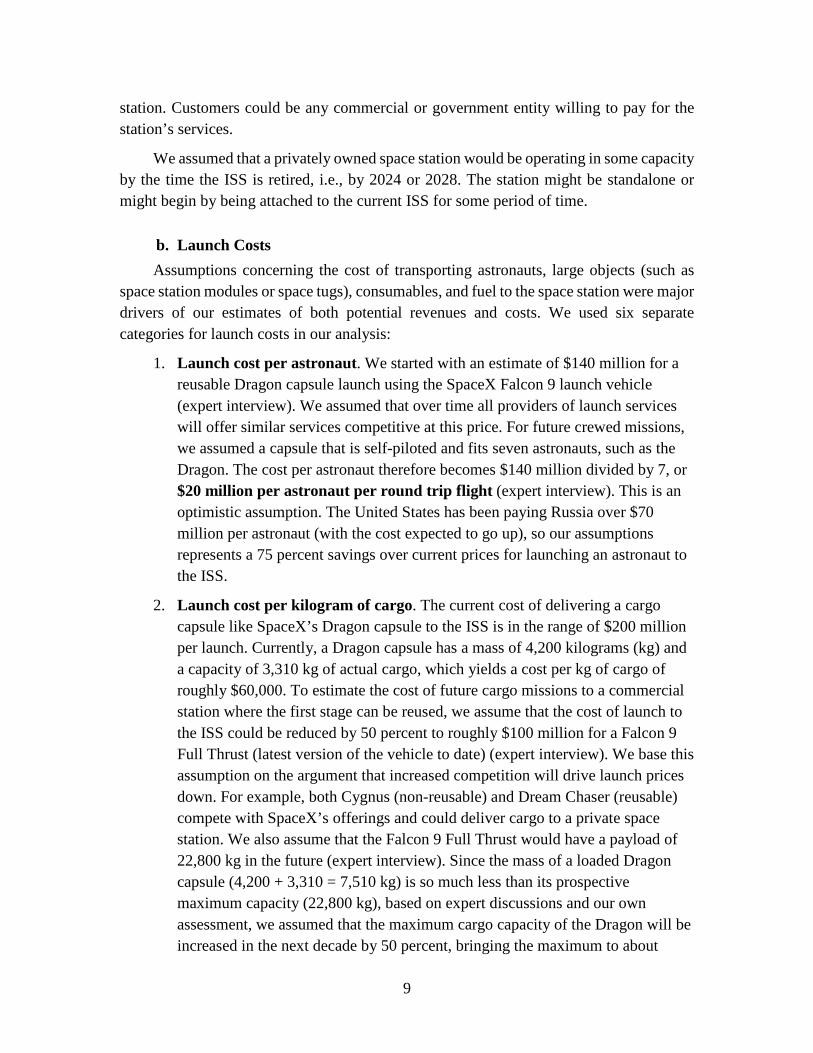
1. Launch cost per astronaut. We started with an estimate of $140 million for a reusable Dragon capsule launch using the SpaceX Falcon 9 launch vehicle (expert interview). We assumed that over time all providers of launch services will offer similar services competitive at this price. For future crewed missions, we assumed a capsule that is self-piloted and fits seven astronauts, such as the Dragon. The cost per astronaut therefore becomes $140 million divided by 7, or $20 million per astronaut per round trip flight (expert interview). This is an optimistic assumption. The United States has been paying Russia over $70 million per astronaut (with the cost expected to go up), so our assumptions represents a 75 percent savings over current prices for launching an astronaut to the ISS.
2. Launch cost per kilogram of cargo. The current cost of delivering a cargo capsule like SpaceX’s Dragon capsule to the ISS is in the range of $200 million per launch. Currently, a Dragon capsule has a mass of 4,200 kilograms (kg) and a capacity of 3,310 kg of actual cargo, which yields a cost per kg of cargo of roughly $60,000. To estimate the cost of future cargo missions to a commercial station where the first stage can be reused, we assume that the cost of launch to the ISS could be reduced by 50 percent to roughly $100 million for a Falcon 9 Full Thrust (latest version of the vehicle to date) (expert interview). We base this assumption on the argument that increased competition will drive launch prices down. For example, both Cygnus (non-reusable) and Dream Chaser (reusable) compete with SpaceX’s offerings and could deliver cargo to a private space station. We also assume that the Falcon 9 Full Thrust would have a payload of 22,800 kg in the future (expert interview). Since the mass of a loaded Dragon capsule (4,200 + 3,310 = 7,510 kg) is so much less than its prospective maximum capacity (22,800 kg), based on expert discussions and our own assessment, we assumed that the maximum cargo capacity of the Dragon will be increased in the next decade by 50 percent, bringing the maximum to about
10
5,000 kg (3,310 kg multiplied by roughly 1.5). At $100 million per launch, under these assumptions the average cost per kg of cargo would be $20,000 per kg ($100 million divided by 5,000 kg) or over 66 percent reduction over present-day prices. Again this assumption is optimistic. NASA has already signed cargo contracts through 2024 at prices similar to what it currently pays, i.e., roughly $60,000 per kg (expert interview).
3. Per kg launch costs to the ISS or other space station of consumables to be used on a space station. We assumed that each astronaut would need 3.5 kg of consumables per day (expert interview). We also assumed that on average an additional 0.5 kg of supplies per day per astronaut would be needed to keep the station operating, for a total of 4 kg per astronaut per day (expert interview). At a cost of $20,000 per kg in launch costs, each astronaut would generate costs of $80,000 per day (4 kg times $20,000) in consumables and supplies.
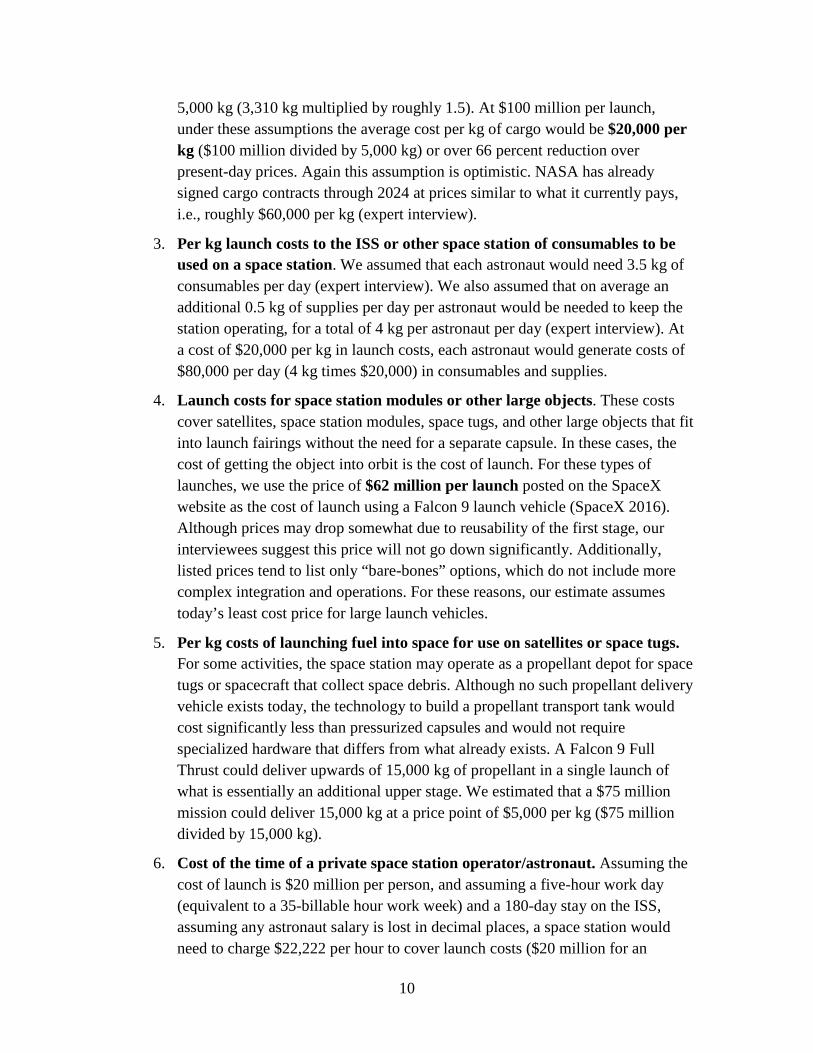
4. Launch costs for space station modules or other large objects. These costs cover satellites, space station modules, space tugs, and other large objects that fit into launch fairings without the need for a separate capsule. In these cases, the cost of getting the object into orbit is the cost of launch. For these types of launches, we use the price of $62 million per launch posted on the SpaceX website as the cost of launch using a Falcon 9 launch vehicle (SpaceX 2016). Although prices may drop somewhat due to reusability of the first stage, our interviewees suggest this price will not go down significantly. Additionally, listed prices tend to list only “bare-bones” options, which do not include more complex integration and operations. For these reasons, our estimate assumes today’s least cost price for large launch vehicles.
5. Per kg costs of launching fuel into space for use on satellites or space tugs. For some activities, the space station may operate as a propellant depot for space tugs or spacecraft that collect space debris. Although no such propellant delivery vehicle exists today, the technology to build a propellant transport tank would cost significantly less than pressurized capsules and would not require specialized hardware that differs from what already exists. A Falcon 9 Full Thrust could deliver upwards of 15,000 kg of propellant in a single launch of what is essentially an additional upper stage. We estimated that a $75 million mission could deliver 15,000 kg at a price point of $5,000 per kg ($75 million divided by 15,000 kg).
6. Cost of the time of a private space station operator/astronaut. Assuming the cost of launch is $20 million per person, and assuming a five-hour work day (equivalent to a 35-billable hour work week) and a 180-day stay on the ISS, assuming any astronaut salary is lost in decimal places, a space station would need to charge $22,222 per hour to cover launch costs ($20 million for an

11
astronaut launch divided by 900, the total number of hours worked over 180 days given a 35-hour work week). Adding the launch cost of consumables, $80,000 per day per astronaut, divided over the astronaut’s work hours, a space station would need to charge over $38,222 per hour for astronaut time to cover costs or with rounding, $38,000 per hour. This figure is substantially lower than the current cost of astronaut time of $100,000 per hour estimated by NASA (NASA Office of the Inspector General 2016).2
C. Previous Work on Estimating the Market Potential of a Space Station In preparing this report, we reviewed past studies and commentary on the potential
for space stations to engage in commercial activities. We found that most past studies have been more qualitative than quantitative; most have focused on activities feasible on the ISS or how to market the ISS for commercial activities.
One report identified barriers to commercialization on the ISS (Davidson, Stone, and Fichtenbaum 2010), but was not useful with respect to prospective revenues. Another, focused on designing an organization that would seek to attract commercial activities to the ISS (ProOrbis 2010). The ProOrbis report aimed to identify commercially valuable uses of the unique ISS environment (tangible and intangible), analyze the current capabilities of the ISS and its supply chain to potentially make these commercial activities possible, identify missing capabilities that have inhibited generating revenues from activities on ISS, and recommend a design for an organization better suited to generate those capabilities (ProOrbis 2010). The report focused on organizational and management issues and included estimates of potential revenues for the ISS from research and education. Details concerning how these estimates were derived were not always clear. The report found that “[o]nce up and running [the organization managing the research component of the ISS] could attract total funding for research and education projects of well over one-hundred million dollars per year (cost of research)” (ProOrbis 2010, 18).
In 2011, in response to Section 403 of the NASA Authorization Act of 2010, NASA published a report entitled “Commercial Market Assessment for Crew and Cargo Systems” (NASA 2011). The report assessed “activities associated with potential private sector utilization of the ISS research and technology development capabilities and other potential activities in low-Earth orbit [emphasis added]” (NASA 2011, 3). The report focused on four markets: National Interests (countries that desire to send astronauts and cargo into space to perform scientific research, acquire technical knowledge, or increase national prestige); Space Tourism (spaceflight participants not flying under the direct employment
2 Because NASA currently pays appreciably more in launch costs per astronaut for using the Soyuz
(currently $70.6 million per astronaut), the costs of astronaut time are correspondingly higher.
12
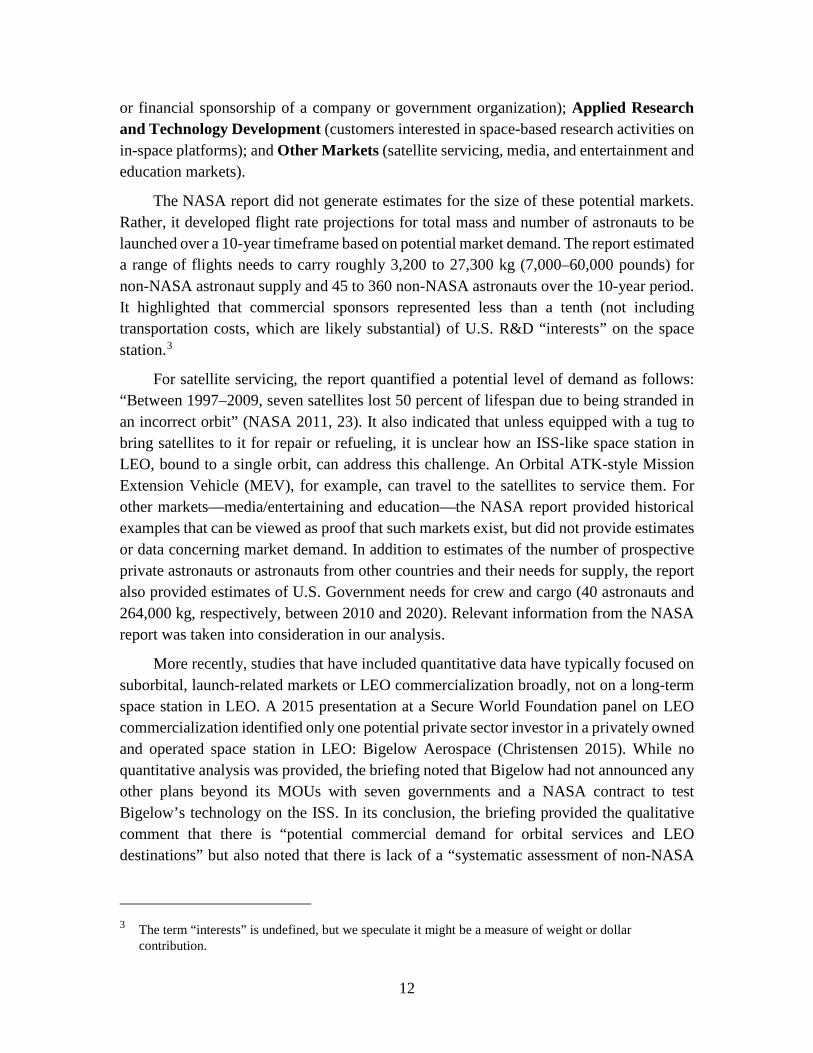
or financial sponsorship of a company or government organization); Applied Research and Technology Development (customers interested in space-based research activities on in-space platforms); and Other Markets (satellite servicing, media, and entertainment and education markets).
The NASA report did not generate estimates for the size of these potential markets. Rather, it developed flight rate projections for total mass and number of astronauts to be launched over a 10-year timeframe based on potential market demand. The report estimated a range of flights needs to carry roughly 3,200 to 27,300 kg (7,000–60,000 pounds) for non-NASA astronaut supply and 45 to 360 non-NASA astronauts over the 10-year period. It highlighted that commercial sponsors represented less than a tenth (not including transportation costs, which are likely substantial) of U.S. R&D “interests” on the space station.3
For satellite servicing, the report quantified a potential level of demand as follows: “Between 1997–2009, seven satellites lost 50 percent of lifespan due to being stranded in an incorrect orbit” (NASA 2011, 23). It also indicated that unless equipped with a tug to bring satellites to it for repair or refueling, it is unclear how an ISS-like space station in LEO, bound to a single orbit, can address this challenge. An Orbital ATK-style Mission Extension Vehicle (MEV), for example, can travel to the satellites to service them. For other markets—media/entertaining and education—the NASA report provided historical examples that can be viewed as proof that such markets exist, but did not provide estimates or data concerning market demand. In addition to estimates of the number of prospective private astronauts or astronauts from other countries and their needs for supply, the report also provided estimates of U.S. Government needs for crew and cargo (40 astronauts and 264,000 kg, respectively, between 2010 and 2020). Relevant information from the NASA report was taken into consideration in our analysis.
More recently, studies that have included quantitative data have typically focused on suborbital, launch-related markets or LEO commercialization broadly, not on a long-term space station in LEO. A 2015 presentation at a Secure World Foundation panel on LEO commercialization identified only one potential private sector investor in a privately owned and operated space station in LEO: Bigelow Aerospace (Christensen 2015). While no quantitative analysis was provided, the briefing noted that Bigelow had not announced any other plans beyond its MOUs with seven governments and a NASA contract to test Bigelow’s technology on the ISS. In its conclusion, the briefing provided the qualitative comment that there is “potential commercial demand for orbital services and LEO destinations” but also noted that there is lack of a “systematic assessment of non-NASA
3 The term “interests” is undefined, but we speculate it might be a measure of weight or dollar
contribution.
13
[orbital] markets available publicly” and “limited analysis” of non-NASA markets available publicly (Christensen 2015).
In 2016, NASA commissioned several economists to write papers on how LEO commercialization could be accelerated (Besha and MacDonald 2016). The papers focused on approaches to stimulate demand for the use of LEO for commercial activities; intrinsic qualities of space that can enable and support economic activity; costs, both in time and money, associated with commercial operations in space; examination of venture capital interest in the ISS; and challenges associated with facilitating and directing development to foster a robust innovation and industrial policy ecosystem in LEO. The compendium did not include any estimates of market size or costs.
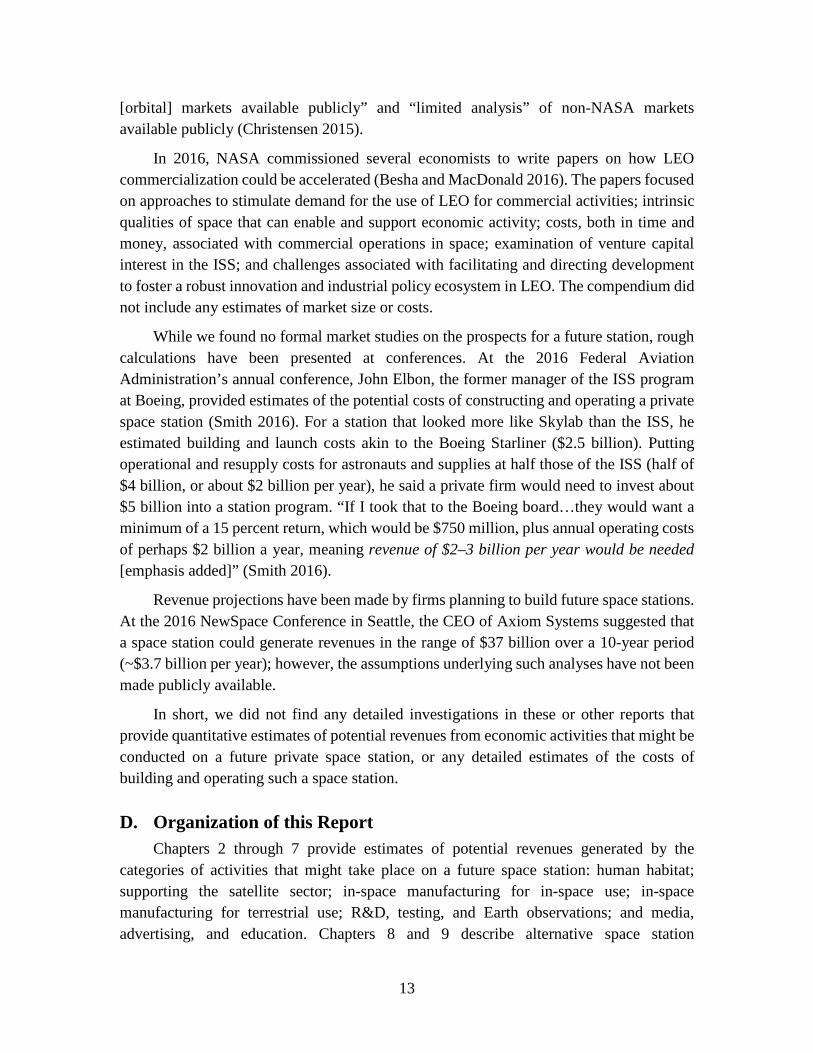
While we found no formal market studies on the prospects for a future station, rough calculations have been presented at conferences. At the 2016 Federal Aviation Administration’s annual conference, John Elbon, the former manager of the ISS program at Boeing, provided estimates of the potential costs of constructing and operating a private space station (Smith 2016). For a station that looked more like Skylab than the ISS, he estimated building and launch costs akin to the Boeing Starliner ($2.5 billion). Putting operational and resupply costs for astronauts and supplies at half those of the ISS (half of $4 billion, or about $2 billion per year), he said a private firm would need to invest about $5 billion into a station program. “If I took that to the Boeing board…they would want a minimum of a 15 percent return, which would be $750 million, plus annual operating costs of perhaps $2 billion a year, meaning revenue of $2–3 billion per year would be needed [emphasis added]” (Smith 2016).
Revenue projections have been made by firms planning to build future space stations. At the 2016 NewSpace Conference in Seattle, the CEO of Axiom Systems suggested that a space station could generate revenues in the range of $37 billion over a 10-year period (~$3.7 billion per year); however, the assumptions underlying such analyses have not been made publicly available.
In short, we did not find any detailed investigations in these or other reports that provide quantitative estimates of potential revenues from economic activities that might be conducted on a future private space station, or any detailed estimates of the costs of building and operating such a space station.
D. Organization of this Report Chapters 2 through 7 provide estimates of potential revenues generated by the
categories of activities that might take place on a future space station: human habitat; supporting the satellite sector; in-space manufacturing for in-space use; in-space manufacturing for terrestrial use; R&D, testing, and Earth observations; and media, advertising, and education. Chapters 8 and 9 describe alternative space station

14
architectures, and estimate costs of constructing, operating, and supplying a station. In Chapter 10, we review potential net profits of a private station and lay out a set of financing and ownership options. Appendix A lists interviewees, and Appendix B summarizes our assumptions. The remaining appendixes (Appendix C through Appendix F) present additional details on the revenue and space station cost calculations.
15
2. Space Station Activities: Human Habitats
A human-tended private space station could raise revenues by providing a destination for private spaceflight participants or astronauts funded privately or by sponsorships. It could also provide a LEO destination for government-sponsored astronauts from countries—including the United States after the ISS is de-constructed or de-orbited—that do not have their own space station and wish to lease access to a station for their space programs. The U.S. Government and governments of other countries may also wish to have access to a space station for their astronauts before the ISS is de-constructed or de-orbited for activities not currently conducted on the ISS.
A. Private Astronauts
1. Description of Service We use the term “private astronaut” to mean any spaceflight participant who is not
flying under the direct employment or financial sponsorship of a government organization. Both private individuals and individuals flying under corporate sponsorship are included under this definition.
Between 2001 and 2009, seven people paid to go to space on eight separate trips on the Russian rocket, Soyuz. On average, they paid $25.5 million for the combined cost of launch and the stay on the ISS (NASA 2011, 15). Since 2009, no private astronauts have gone to space, as slots on the Soyuz have been taken by astronauts from sovereign countries going to the ISS. As of 2015, the latest date for which information was available, Space Adventures, Ltd., the company that has arranged past flights, has two customers who have signed up for trips to the ISS, when slots become available (Space Adventures 2015).
2. Methodology for Estimating Revenues To generate an estimate of potential revenues from private astronauts, we first
estimated the number of astronauts that might visit a private station over 10 years. For our low estimate, we assume that the number of private individuals willing to pay the cost of a trip to a space station in the first 10 years in which a private space station operates would be the same as the number of trips (8), limited by Russian launch capacity, when private astronauts visited the Russian part of the ISS between 2001 and 2009.
For our high estimate, we use values generated by Space Adventures, the space travel company that has brokered private astronaut visits to the ISS, from their assessment of the
16
market. Space Adventures estimated, on the high end, that 143 private astronauts, self-funded or corporate-sponsored, would visit a space station over approximately 10 years (NASA 2011, 16). Thus, for a high estimate, we assumed 143 private astronauts visit the station over a decade.
Next, we estimated how much revenue a private space station could make from each private astronaut. To get to the space station, we assumed each private astronaut would have to pay $20 million (the estimated future cost of launch we presented in the section on assumptions in Chapter 1). The space station owner would then have to charge visitors an additional fee to generate revenue for the station. Bigelow has reported that it intends to charge $25 million to rent space on its module for two months (Messier 2013).4 In the past, private astronauts have averaged 12 days per visit to the ISS (NASA 2011, 15). If a private space station owner chose to use the same price as cited by Bigelow and was willing to prorate its prices according to time spent, the cost of visiting a private space station for 12 days would be $5 million. If the cost of going to space were appreciably less, more people would wish to go. However, we found no evidence that the costs of taking people to orbit and hosting them on a space station would fall to a point where the number of people going to space would increase dramatically. Consequently, price elasticity of demand was not a consideration in our estimates.
We assume that this price includes consumables and supplies. As noted in Chapter 1, we assume that each astronaut will need 3.5 kg in consumables per day and 0.5 kg of other supplies per day for a total of 4 kg per day. At launch costs of $20,000 per kg, that translates into $80,000 per day in consumables and supplies. For a 12-day trip, therefore, the space station operators would have to cover $960,000 in costs of consumables and supplies per astronaut. Given these costs under these assumptions, the space station would net $4 million per visit by private astronauts ($5 million minus $960,000).
The number of private astronauts purchasing a ticket to go into space is likely to be sensitive to the cost of the trip. Virgin Galactic has sold 700 tickets for a suborbital flight at $250,000 per ticket. Kothari and Webber project 14,000 passengers per year for orbital space tourism flights at a price per trip of around $500,000 (2010, 12). The number of people signing up for orbital flights at $500,000 per ticket would certainly be much higher than at a price of $20 million. Yet for the 10-year timeframe considered here, we do not see prospects of the price of launch to orbit in LEO falling to these levels, as none of the launch vehicles and rockets that are likely to be commercially available for the next several
4 At the International Symposium for Personal and Commercial Spaceflight held in Las Cruces, New
Mexico, in October 2016, a participant stated that the cost of leasing space on a Bigelow module could be as low as $1 million for a stay of a month or two (Russo 2016), a figure we found to be too low to cover the space station’s costs. Because all other sources and conversations that we held over the course of this work cited the $25 million figure, we used that figure in our analysis.
17
years could profitably sell seats much below $20 million. Consequently, we did not consider a price point between $500,000 and $20 million.
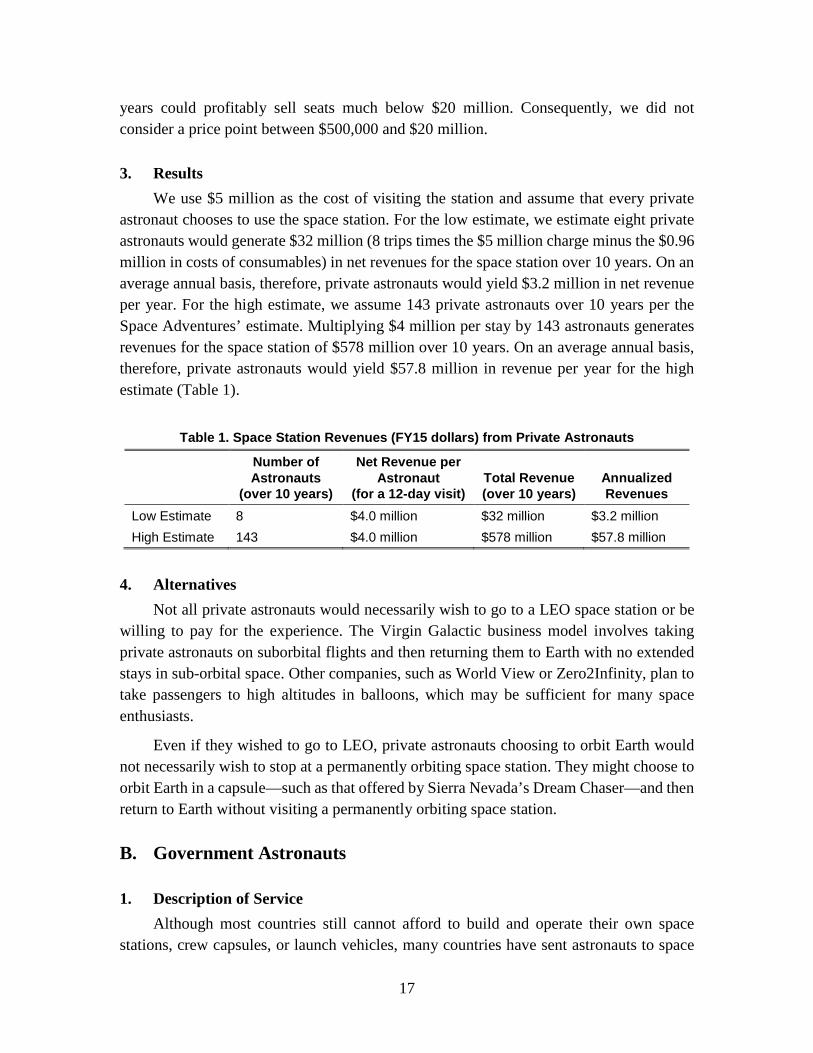
3. Results We use $5 million as the cost of visiting the station and assume that every private
astronaut chooses to use the space station. For the low estimate, we estimate eight private astronauts would generate $32 million (8 trips times the $5 million charge minus the $0.96 million in costs of consumables) in net revenues for the space station over 10 years. On an average annual basis, therefore, private astronauts would yield $3.2 million in net revenue per year. For the high estimate, we assume 143 private astronauts over 10 years per the Space Adventures’ estimate. Multiplying $4 million per stay by 143 astronauts generates revenues for the space station of $578 million over 10 years. On an average annual basis, therefore, private astronauts would yield $57.8 million in revenue per year for the high estimate (Table 1).
Table 1. Space Station Revenues (FY15 dollars) from Private Astronauts
Number of Astronauts
(over 10 years)
Net Revenue per Astronaut
(for a 12-day visit) Total Revenue (over 10 years)
Annualized Revenues
Low Estimate 8 $4.0 million $32 million $3.2 million High Estimate 143 $4.0 million $578 million $57.8 million
4. Alternatives Not all private astronauts would necessarily wish to go to a LEO space station or be
willing to pay for the experience. The Virgin Galactic business model involves taking private astronauts on suborbital flights and then returning them to Earth with no extended stays in sub-orbital space. Other companies, such as World View or Zero2Infinity, plan to take passengers to high altitudes in balloons, which may be sufficient for many space enthusiasts.
Even if they wished to go to LEO, private astronauts choosing to orbit Earth would not necessarily wish to stop at a permanently orbiting space station. They might choose to orbit Earth in a capsule—such as that offered by Sierra Nevada’s Dream Chaser—and then return to Earth without visiting a permanently orbiting space station.
B. Government Astronauts
1. Description of Service Although most countries still cannot afford to build and operate their own space
stations, crew capsules, or launch vehicles, many countries have sent astronauts to space
18
in capsules owned and operated by other countries. Between 1978 and 2015, 34 nations other than the United States, Russia, and China sent 85 astronauts into orbit; 47 of these individuals went to the ISS (World Space Flight 2015). Countries have sent citizens to the ISS for reasons of national pride and prestige, as part of their own space programs, as a way to acquire technical knowledge, as a way to learn to operate in space to inform their own potential space programs, and for scientific research.
2. Methodology for Estimating Revenues
a. High Estimate To project potential revenues from payments by sovereign countries for the use of a
space station for our high estimate, we first estimated which countries would likely have the resources and desire to lease time on a private space station for their national space programs. We included countries that met the following five conditions as potential customers:
• Overall size of the country’s annual budget for space programs
• Size of the country’s budget specifically for human space flight
• Expression of the country’s interest in using a private space station
• Fiscal, economic, and political conditions in the country
• Political willingness to pay an American company for the use of its station
First, we assumed that to send one astronaut to the hypothetical space station would cost a country $20 million in launch costs (per our assumptions in Chapter 1) plus the cost of leasing space on the station for one astronaut. We assume that sovereign astronauts would stay on station for 60 days.5 We use the Bigelow figure of a $25 million charge for a 60-day lease. Thus, to pay for launch and lease costs, a country or program would need an annual budget of at least $45 million to pay for a single 60-day mission.
Second, even countries with space budgets large enough to cover the costs of a 60-day mission may choose not to use those funds for human space flight. In Europe, for example, almost all funding for human space flight from each European Space Agency (ESA) member is channeled through ESA’s human space flight program. Consequently, although Austria, Belgium, Finland, France, Poland, the Netherlands, Norway, Spain, Sweden, and Switzerland all have space budgets of over $45 million annually, none of these countries has a significant human space flight program outside of ESA’s.
5 U.S. astronauts stay in space on average about 180 days. In light of the assumed price charged for
staying on a private space station, we assume that countries will limit the length of stay of astronauts on a private space station to an average of 60 days because of cost considerations.

19
Consequently, in the case of Europe, ESA is considered a potential customer, but the individual ESA-participating countries are not. South American countries, considering a regional space organization, may adopt a similar approach to funding human space flight.
Third, Bigelow Aerospace has been marketing its expandable modules to countries in an effort to identify potential future clients. Bigelow has signed MOUs on the potential use of its expandable module with Australia, Brazil, Canada, Japan, the Netherlands, Singapore, Sweden, the United Arab Emirates, and the United Kingdom (Messier 2013). We include all of these countries among prospective customers of a private space station—including the Netherlands and Sweden, which currently channel most of their funding for human space flight through ESA.
Fourth, some countries that historically had space budgets of a size sufficient to cover the cost of sending an astronaut to a space station in LEO are currently facing financial difficulties or political instability (e.g., Kazakhstan and Venezuela). Although fiscal constraints may ease in coming years, overall budgets in these countries are likely to remain tight for quite some time. For this reason, we chose to remove countries from the list that have had space budgets large enough to cover a 60-day mission but are now facing severe financial constraints or political turmoil. These countries are Argentina, Azerbaijan, Bolivia, Kazakhstan, Nigeria, Turkey, Ukraine, and Venezuela.
Fifth, some countries are highly unlikely to use a U.S.-affiliated station for political reasons or because they are planning on constructing their own space station, which we assumed they would prefer to use over an American-owned and operated station. We excluded Iran, China, and Russia from our list of potential customers for these reasons. We excluded Iran because political relations between that country and the United States remain poor. China and Russia have announced plans to build and launch their own space stations. China is in the process of assembling a human-tended space station with a projected life span similar to that of the ISS. It aims to complete the station by 2020 (Morring 2015). According to a 2015 statement by Roscosmos’s director of manned spaceflight, Russia plans to use the ISS until 2024, and then build its own space station starting with Russian modules separated from the ISS (de Selding 2015b).
Using these five criteria, we identified 15 potential sovereign customers with budgets sufficiently large to cover the costs of a flight and stay on a private space station. To these 15 countries, we added the Netherlands, Singapore, and Sweden. Although these countries did not fit at least one of our five criteria, their governments have signed MOUs with Bigelow Aerospace concerning potentially using a Bigelow module. Thus, 18 potential sovereign customers remain on our list (Table 2).
After identifying countries or programs that could pay for using a private space station, we then estimated how many astronauts each of these countries and programs might send over a 10-year period. For the most part, we looked to precedent to make these
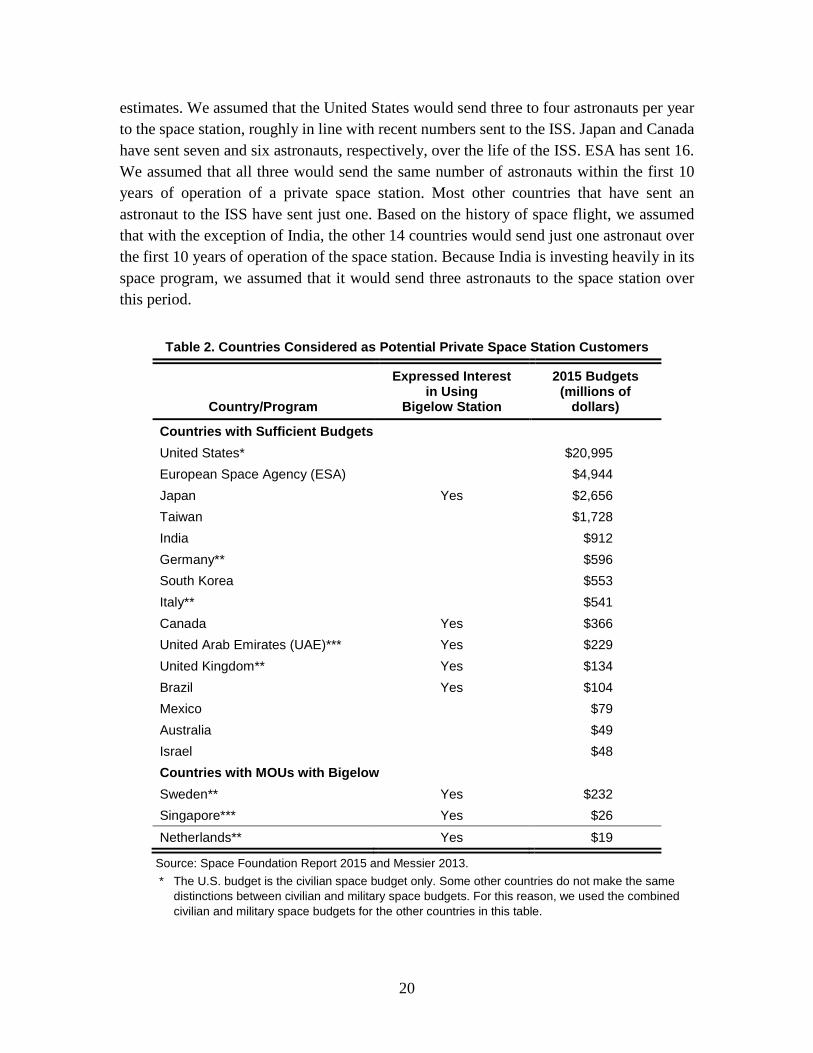
20
estimates. We assumed that the United States would send three to four astronauts per year to the space station, roughly in line with recent numbers sent to the ISS. Japan and Canada have sent seven and six astronauts, respectively, over the life of the ISS. ESA has sent 16. We assumed that all three would send the same number of astronauts within the first 10 years of operation of a private space station. Most other countries that have sent an astronaut to the ISS have sent just one. Based on the history of space flight, we assumed that with the exception of India, the other 14 countries would send just one astronaut over the first 10 years of operation of the space station. Because India is investing heavily in its space program, we assumed that it would send three astronauts to the space station over this period.
Table 2. Countries Considered as Potential Private Space Station Customers
Country/Program
Expressed Interest in Using
Bigelow Station
2015 Budgets (millions of
dollars)
Countries with Sufficient Budgets United States* $20,995 European Space Agency (ESA) $4,944 Japan Yes $2,656 Taiwan $1,728 India $912 Germany** $596 South Korea $553 Italy** $541 Canada Yes $366 United Arab Emirates (UAE)*** Yes $229 United Kingdom** Yes $134 Brazil Yes $104 Mexico $79 Australia $49 Israel $48 Countries with MOUs with Bigelow Sweden** Yes $232 Singapore*** Yes $26 Netherlands** Yes $19
Source: Space Foundation Report 2015 and Messier 2013. * The U.S. budget is the civilian space budget only. Some other countries do not make the same
distinctions between civilian and military space budgets. For this reason, we used the combined civilian and military space budgets for the other countries in this table.
21
** These countries have national human space flight budgets independent of their contribution to ESA for ESA’s human space flight program. Budgets do not include contributions to ESA or European Organisation for the Exploitation of Meteorological Satellites (EUMETSAT).
*** Budget from 2013 (EuroConsult 2014a).
b. Low Estimate For our low estimate, we assume that a number of countries might not be willing to
pay a private space station for the opportunity to have a presence in LEO. Until now, trips to the ISS by foreign astronauts on capsules of other nations have been arranged through government-to-government agreements. Countries have not provided cash compensation to the United States but have instead chosen to contribute to the ISS in kind by providing equipment or services (ESA 2014). Countries including the United States have paid Russia for launches of astronauts and supply missions to the ISS, but these cash arrangements were dictated in part by the fiscal challenges of the Russian space program.
Some foreign countries might prefer to engage in an in-kind agreement with another country’s space station or provide other non-cash offsets rather than make direct cash payments to a private space station owner. China has offered to collaborate with other countries and to enter into partnerships to host astronauts and research on its new space station.6 It has signed initial space station agreements with the Russian Federal Space Agency (RKA) and ESA (de Selding 2015a). While details of international interactions have yet to crystallize and China has yet to make statements on whether or not use of its space station would entail cash payments, partnerships with China on a space station may take a similar form to that of partnerships on the ISS, in which countries party to the collaboration contribute resources in kind rather than in cash. Although there are currently no official plans to send Russian or ESA astronauts to the Chinese space station, the existence of a low-cost or offset-accepting competitor would likely cut into the number of countries that would be willing to pay to send astronauts to a private space station.
If a substantial number of countries choose to use a Chinese station rather than a private space station incorporated in the United States for their astronauts, revenues for a private station from this source would be much smaller. We assumed that from the list in Table 2, only astronauts from countries that have poor relations with China, such as India and Japan, or who wish to make a political gesture to foster U.S. goodwill, like Israel, would choose to pay a private space station to train their astronauts rather than collaborate with China.
6 China recently signed an agreement with the United Nations wherein the Office for Outer Space Affairs
and China Manned Space Agency will work together to enable United Nations Member States, particularly developing countries, to conduct space experiments onboard China’s space station and to provide flight opportunities for astronauts and payload engineers (Messier 2016b).
22
We also assumed for the low estimate scenario that NASA scales back the number of astronauts it sends to a private space station because it has already accomplished most of its goals for research in LEO for human space flight. Consequently, for this scenario we assumed the United States would only send two astronauts per year to the private space station rather than four, as NASA redirects to other activities resources that it formerly used to send astronauts to LEO. Because of ESA’s preference to provide in-kind support rather than cash payments when it has collaborated on projects in space and its MOU with China concerning the use of China’s space station, we assume ESA would not be willing to make a cash payment to use a private space station, preferring to collaborate with China and use the Chinese station.
3. Results For our high estimate, we assume the United States would send 40 astronauts to the
station in its first 10 years of operation; ESA, 16; Japan, 7; Canada, 6; India, 3; and the other 13 countries, 1 each—a total 85 astronauts, with 45 astronauts from countries other than the United States. This compares to a NASA high estimate made in 2010 for the following decade of 186 to 216 sovereign astronaut flights based on estimates it received from Bigelow in 2010 (NASA 2011, 1).
If each country were to pay $25 million for the use of a space station module for each astronaut, we estimate space station net revenues per astronaut would be $20.2 million under the assumption that the space station operator would absorb the cost of each astronaut’s consumables and supplies. Sixty days of consumables at 4 kg per day and $20,000 per kg in launch costs would result in $4.8 million in costs. Under these assumptions, total revenues for the station operator from visits by sovereign astronauts would be $1,717 million over the course of 10 years, of which $808 million would come from the United States and $909 million from other countries. On an annualized basis, therefore, these revenues come to $172 million per year, of which $81 million would come from the United States and $91 million from other countries (Table 3).
For our low estimate, we assume the United States would send 20 astronauts to the station in its first 10 years of operation; Japan, 7; India, 3; and Israel, 1, for a total of 31 astronauts, 11 of whom are foreign. This compares with a NASA low estimate from 2010 of 36 sovereign astronaut flights (excluding the United States and Russia) over the current decade (2011 to 2020) (NASA 2011, 13).
Using the same price assumptions as the high estimate, space station revenues from visits by astronauts could amount to $626 million over the course of 10 years, of which $404 million would come from the United States and $222 million from Japan, India, and Israel. On an annualized basis, therefore, revenues would be $63 million per year, of which $40 million would come from the United States and $23 million from the other three countries (Table 4).
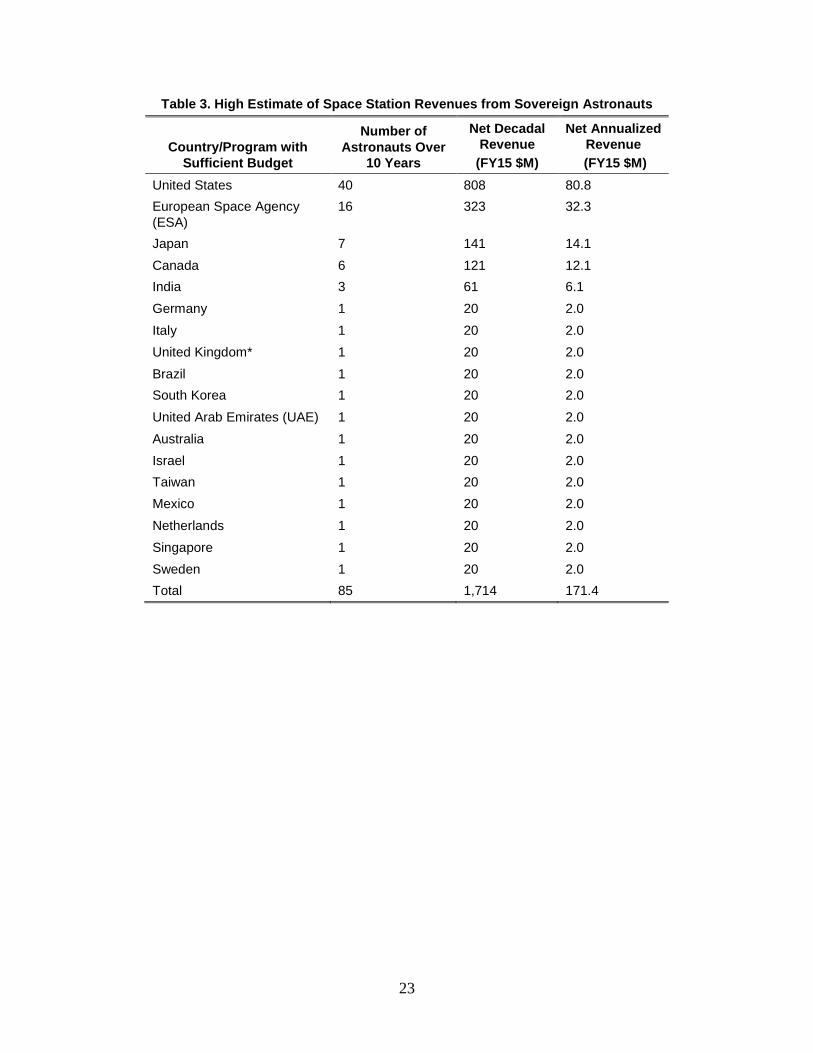
23
Table 3. High Estimate of Space Station Revenues from Sovereign Astronauts
Country/Program with Sufficient Budget
Number of Astronauts Over
10 Years
Net Decadal Revenue
(FY15 $M)
Net Annualized Revenue
(FY15 $M) United States 40 808 80.8 European Space Agency (ESA)
16 323 32.3
Japan 7 141 14.1 Canada 6 121 12.1 India 3 61 6.1 Germany 1 20 2.0 Italy 1 20 2.0 United Kingdom* 1 20 2.0 Brazil 1 20 2.0 South Korea 1 20 2.0 United Arab Emirates (UAE) 1 20 2.0 Australia 1 20 2.0 Israel 1 20 2.0 Taiwan 1 20 2.0 Mexico 1 20 2.0 Netherlands 1 20 2.0 Singapore 1 20 2.0 Sweden 1 20 2.0 Total 85 1,714 171.4
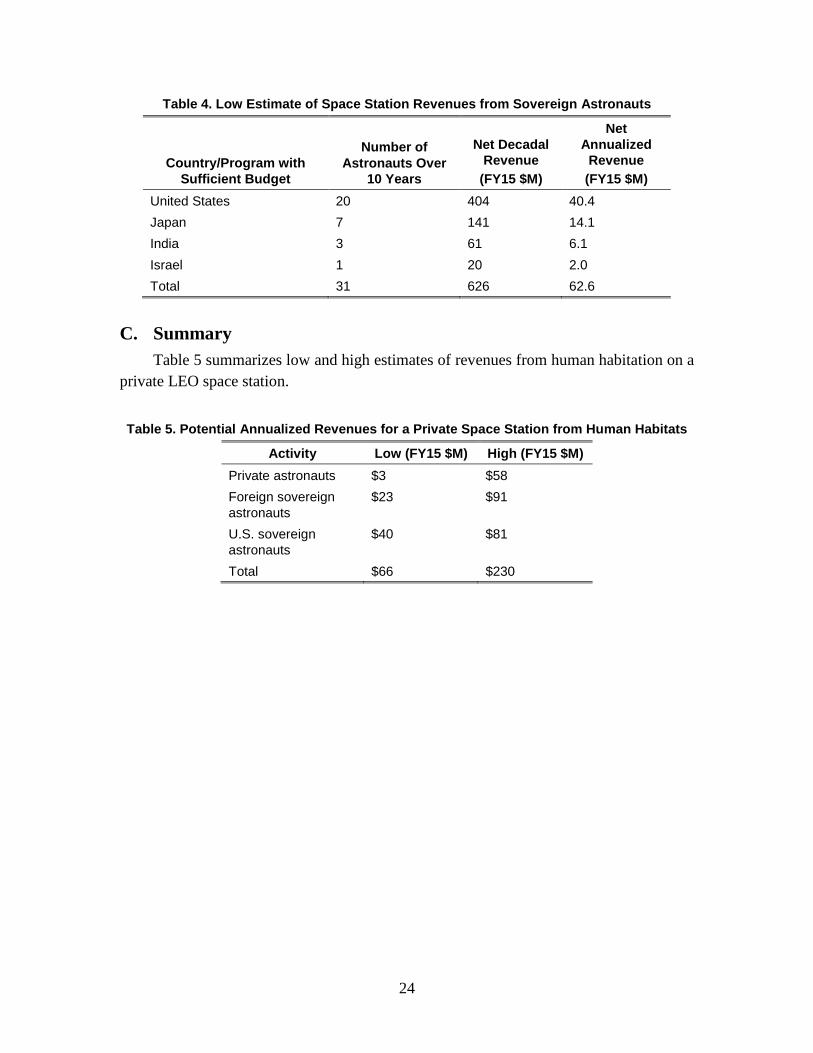
24
Table 4. Low Estimate of Space Station Revenues from Sovereign Astronauts
Country/Program with Sufficient Budget
Number of Astronauts Over
10 Years
Net Decadal Revenue
(FY15 $M)
Net Annualized
Revenue (FY15 $M)
United States 20 404 40.4 Japan 7 141 14.1 India 3 61 6.1 Israel 1 20 2.0 Total 31 626 62.6
C. Summary Table 5 summarizes low and high estimates of revenues from human habitation on a
private LEO space station.
Table 5. Potential Annualized Revenues for a Private Space Station from Human Habitats
Activity Low (FY15 $M) High (FY15 $M) Private astronauts $3 $58 Foreign sovereign astronauts
$23 $91
U.S. sovereign astronauts
$40 $81
Total $66 $230
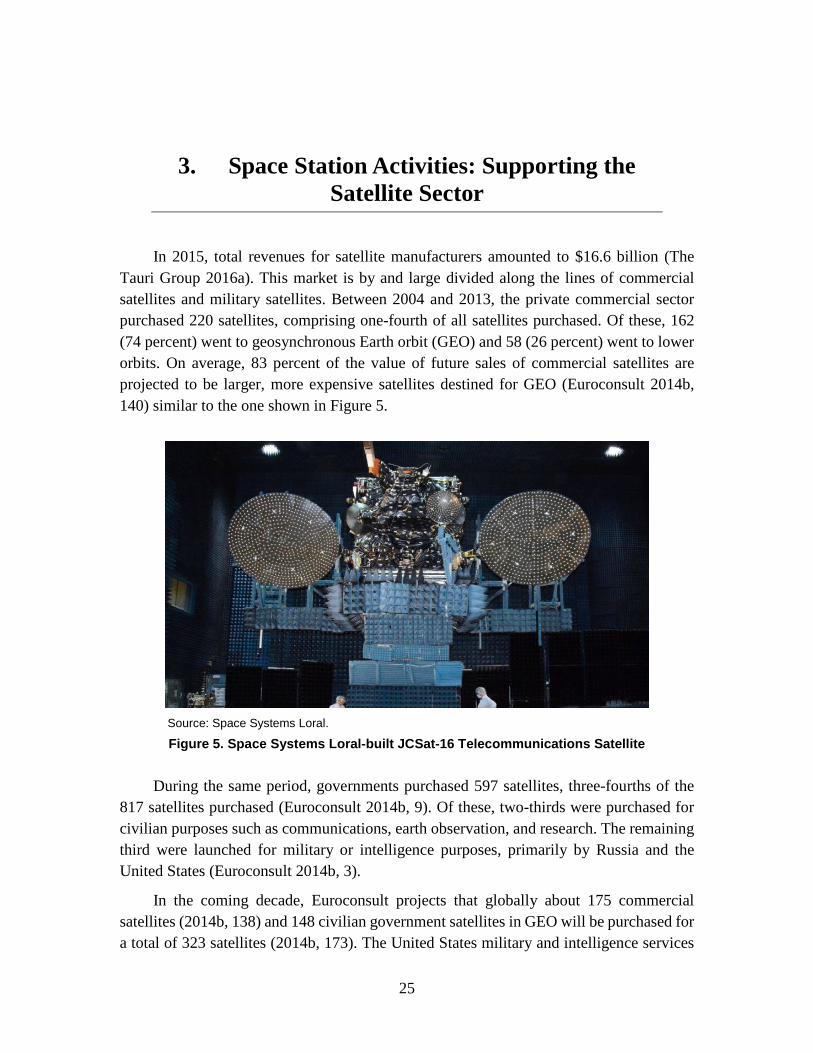
25
3. Space Station Activities: Supporting the Satellite Sector
In 2015, total revenues for satellite manufacturers amounted to $16.6 billion (The Tauri Group 2016a). This market is by and large divided along the lines of commercial satellites and military satellites. Between 2004 and 2013, the private commercial sector purchased 220 satellites, comprising one-fourth of all satellites purchased. Of these, 162 (74 percent) went to geosynchronous Earth orbit (GEO) and 58 (26 percent) went to lower orbits. On average, 83 percent of the value of future sales of commercial satellites are projected to be larger, more expensive satellites destined for GEO (Euroconsult 2014b, 140) similar to the one shown in Figure 5.
Source: Space Systems Loral.
Figure 5. Space Systems Loral-built JCSat-16 Telecommunications Satellite
During the same period, governments purchased 597 satellites, three-fourths of the 817 satellites purchased (Euroconsult 2014b, 9). Of these, two-thirds were purchased for civilian purposes such as communications, earth observation, and research. The remaining third were launched for military or intelligence purposes, primarily by Russia and the United States (Euroconsult 2014b, 3).
In the coming decade, Euroconsult projects that globally about 175 commercial satellites (2014b, 138) and 148 civilian government satellites in GEO will be purchased for a total of 323 satellites (2014b, 173). The United States military and intelligence services
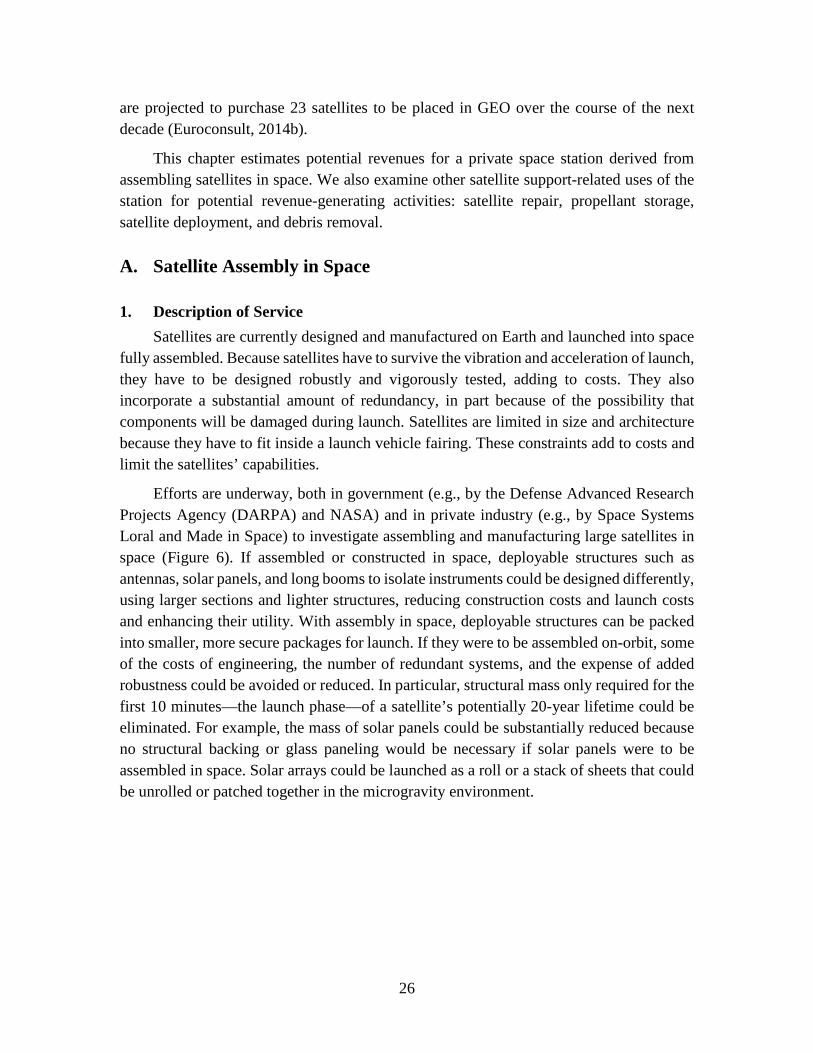
26
are projected to purchase 23 satellites to be placed in GEO over the course of the next decade (Euroconsult, 2014b).
This chapter estimates potential revenues for a private space station derived from assembling satellites in space. We also examine other satellite support-related uses of the station for potential revenue-generating activities: satellite repair, propellant storage, satellite deployment, and debris removal.
A. Satellite Assembly in Space
1. Description of Service Satellites are currently designed and manufactured on Earth and launched into space
fully assembled. Because satellites have to survive the vibration and acceleration of launch, they have to be designed robustly and vigorously tested, adding to costs. They also incorporate a substantial amount of redundancy, in part because of the possibility that components will be damaged during launch. Satellites are limited in size and architecture because they have to fit inside a launch vehicle fairing. These constraints add to costs and limit the satellites’ capabilities.
Efforts are underway, both in government (e.g., by the Defense Advanced Research Projects Agency (DARPA) and NASA) and in private industry (e.g., by Space Systems Loral and Made in Space) to investigate assembling and manufacturing large satellites in space (Figure 6). If assembled or constructed in space, deployable structures such as antennas, solar panels, and long booms to isolate instruments could be designed differently, using larger sections and lighter structures, reducing construction costs and launch costs and enhancing their utility. With assembly in space, deployable structures can be packed into smaller, more secure packages for launch. If they were to be assembled on-orbit, some of the costs of engineering, the number of redundant systems, and the expense of added robustness could be avoided or reduced. In particular, structural mass only required for the first 10 minutes—the launch phase—of a satellite’s potentially 20-year lifetime could be eliminated. For example, the mass of solar panels could be substantially reduced because no structural backing or glass paneling would be necessary if solar panels were to be assembled in space. Solar arrays could be launched as a roll or a stack of sheets that could be unrolled or patched together in the microgravity environment.
27
Source: Space Systems Loral.
Figure 6. Steps of On-orbit Satellite Assembly
Cost savings are not the only reason to want to assemble satellites on orbit. Different satellite architectures made possible by assembly in space could expand capabilities. For example, more antennas could be placed on a communications satellite than is currently possible because of existing limitations on the number of deployable structures that can fit on the satellite and survive launch. Additional solar panels and antennas could be packed above or below the main spacecraft bus without the complicated mechanisms currently needed to deploy them once they are on orbit, providing more transponders and more power to operate them. Assembly in space could give satellite operators more flexibility. For example, satellites could be designed to be modular so that components could be upgraded over the life of the satellite by replacing outdated modules with modules incorporating newer technologies. Satellite life could also be extended by replacing broken components, providing the owners with additional value.
Satellites or other structures assembled in space could be constructed so that they are larger and more capable than if assembled and launched from Earth. Satellite manufacturers could sell a more capable satellite at a premium, raising profits, thereby providing a potential revenue stream for a space station operator to capture in the form of rent. The difference between potential sales prices stemming from the increased capabilities and sales prices paid for satellites launched from Earth could provide a source of revenue that a space station operator could tap from satellite assemblers.
28
2. Methodology for Estimating Revenues For satellite assembly in space to be a viable activity, assembly would need to be
cheaper than the current practice of launching a fully assembled satellite from the ground, or the satellite would have to be more capable than a satellite sold at the same price launched from Earth (so as to bring in greater revenues). To calculate potential revenues for a space station from assembling satellites in space, we estimated the cost savings from assembling a satellite in space versus assembling it terrestrially. We assumed that this cost difference is what a space station can charge a potential manufacturer of a space station, or if the space station operator itself were the assembler, the net revenues the operator would earn that could be applied against the cost of constructing and operating the station.
We calculated cost savings for two types of satellites: U.S. or allied military/intelligence communications satellites and civilian/commercial communications satellites. We assumed that both types of satellites, while assembled in LEO, would eventually be positioned in GEO and transported from LEO to GEO using a space tug (expert interview). We evaluated the more expensive, GEO-based satellites, because, in our view, these are the satellites that could best take advantage of assembly in space. Drawing on satellite manufacturing costs estimated by Henry Apgar (Apgar 2011, 289–324), we identified potential cost savings for both non-recurring (design) and recurring (manufacturing) costs for generic versions of both a military and a civilian satellite.
Using Apgar’s summary with an Air Force cost estimation tool called Unmanned Space Vehicle Cost Model #8 (USCM8), interviews with experts, and our own expertise, we estimated at a subsystems level how much, if at all, costs would increase or decrease when a satellite is assembled on-orbit versus terrestrially. Many assumptions are made in the use of this cost model to estimate the cost to manufacture a satellite, both on the ground and in space. Among the most important are:
• The largest reduction in mass comes from assuming that the mass of the structure of the system would be less because the system does not need to survive launch loads. We assumed that primary structural mass could be reduced by 50 percent if the spacecraft were assembled in space.
• Another major reduction in mass could come from the design of the power subsystem. Typically, solar arrays are made with strong backing structures and glass coatings that make up most of the arrays’ mass. Lighter arrays that are assembled in space can be unfolded or unrolled with very little structural mass. Reducing mass in other parts of the power system, such as cabling and power transformers, would not yield nearly as much of a reduction in mass compared to the solar arrays. We assumed that the overall mass reduction of the power subsystem would also be reduced by 50 percent.
29
• For a payload that can be designed to be packed into a launch faring, its internal structural mass (that is typically considered separately from the bus structure in a systems-level analysis) can also be reduced, but typically not by much. We assumed that the total payload mass could be reduced by up to 30 percent. For communications payloads, where large antennas are placed on booms, both the antenna and boom mass can be significantly reduced, as vibration during launch is no longer an issue for the torque moment arms for such devices because they would no longer be attached to the satellite during launch. Transponder mass cannot be significantly reduced because transponders are typically packed inside the main structure and must still survive normal launch loads in their final configuration.
• While testing would be cheaper because the full system would not have to be tested to the extreme limits experienced by launch, there would be additional costs incurred to design a satellite to be more modular and capable of being assembled in space. Because of these competing cost drivers that are wrapped into the same cost estimating relationship (CER), we assumed that the cost multiplier for integration, assembly, and testing on the ground would not change.
• We also assumed that the cost for flight support, that is the costs of launch operations and orbital support, for in-space assembly would double compared to typical satellite missions. This is because conducting assembly operations on orbit requires additional software due to the increase in complexity compared to assembly operations on the ground.
• We assumed that other subsystems costs would not change significantly between terrestrial and on-orbit assembly.
Table 6 shows how these major assumptions affect the inputs to USCM8. We note that the inputs to the cost model are what differ between terrestrial and on-orbit assembly, not the cost equations. However, the CER for each subsystem scales differently, so a percentage reduction in the mass of one subsystem does not necessarily result in an equal percentage reduction in the cost of that subsystem.
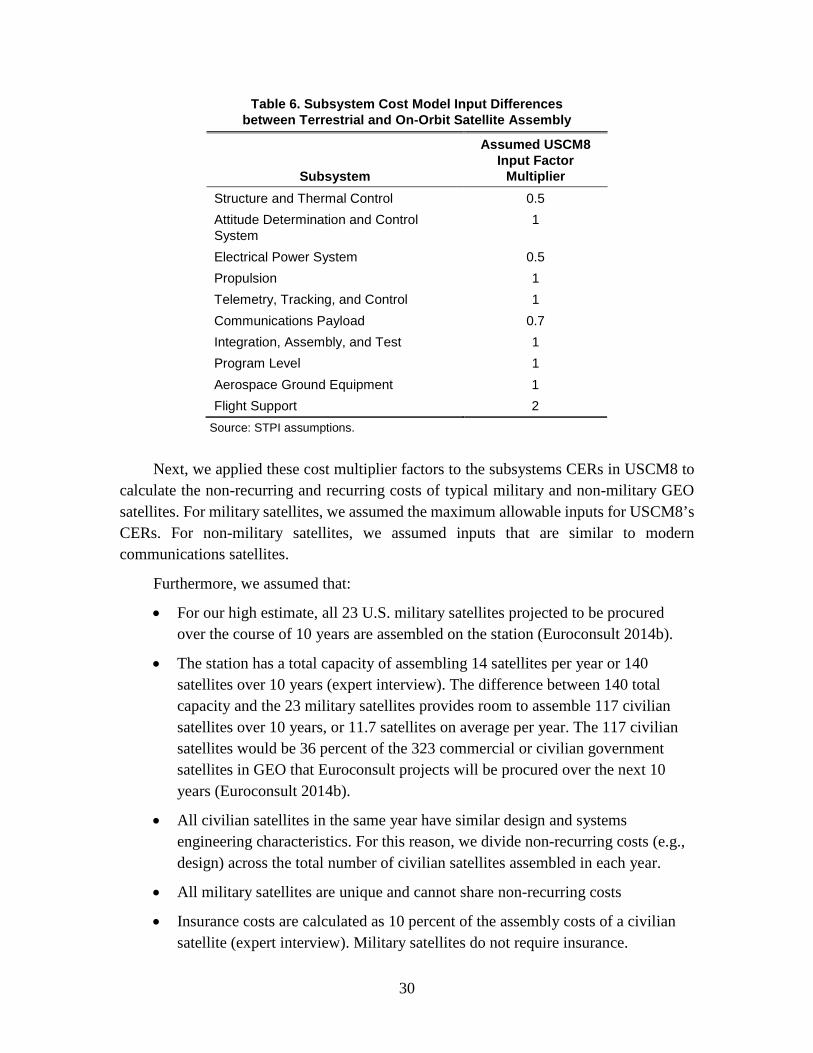
30
Table 6. Subsystem Cost Model Input Differences between Terrestrial and On-Orbit Satellite Assembly
Subsystem
Assumed USCM8 Input Factor
Multiplier Structure and Thermal Control 0.5 Attitude Determination and Control System
1
Electrical Power System 0.5 Propulsion 1 Telemetry, Tracking, and Control 1 Communications Payload 0.7 Integration, Assembly, and Test 1 Program Level 1 Aerospace Ground Equipment 1 Flight Support 2
Source: STPI assumptions.
Next, we applied these cost multiplier factors to the subsystems CERs in USCM8 to
calculate the non-recurring and recurring costs of typical military and non-military GEO satellites. For military satellites, we assumed the maximum allowable inputs for USCM8’s CERs. For non-military satellites, we assumed inputs that are similar to modern communications satellites.
Furthermore, we assumed that:
• For our high estimate, all 23 U.S. military satellites projected to be procured over the course of 10 years are assembled on the station (Euroconsult 2014b).
• The station has a total capacity of assembling 14 satellites per year or 140 satellites over 10 years (expert interview). The difference between 140 total capacity and the 23 military satellites provides room to assemble 117 civilian satellites over 10 years, or 11.7 satellites on average per year. The 117 civilian satellites would be 36 percent of the 323 commercial or civilian government satellites in GEO that Euroconsult projects will be procured over the next 10 years (Euroconsult 2014b).
• All civilian satellites in the same year have similar design and systems engineering characteristics. For this reason, we divide non-recurring costs (e.g., design) across the total number of civilian satellites assembled in each year.
• All military satellites are unique and cannot share non-recurring costs
• Insurance costs are calculated as 10 percent of the assembly costs of a civilian satellite (expert interview). Military satellites do not require insurance.

31
Table 7 shows how much might be saved from assembling satellites in space due to the cost change assumptions summarized in Table 6. Details of how the terrestrial and on-orbit assembly costs are computed using Table 6 are in an Excel workbook available upon request.
As can be seen, substantial savings are potentially available from constructing complex satellites. For military and intelligence satellites in space, this saving amounts to over $200 million per satellite, 17 percent of total costs.
Savings for lower-cost commercial satellites are $44 million per satellite from savings on assembly. In addition, as Table 7 shows, there is a $4 million savings in insurance costs for civilian satellites. Insurance costs are about 10 percent of the value of the satellite (expert interview). We estimated total cost savings for assembly in space for our generic civilian satellite would be $48 million, a 20 percent reduction in costs compared to assembly on Earth plus insurance costs.
Table 7. Potential Cost Savings from Assembling Satellites in Space
(FY15 Millions of Dollars)
Item Terrestrial Assembly
On-Orbit Assembly Difference Percent
Military satellite Non-recurring costs per military satellite
$795 $671 $124
Recurring costs per military satellite $390 $313 $77 Total costs per military satellite $1,185 $984 $201 17% Civilian satellite Non-recurring costs per year per civilian satellite*
$36 $25 $11
Recurring costs per civilian satellite $184 $151 $33 Total assembly costs per civilian satellite
$220 $176 $44
Insurance costs per civilian satellite $22 $18 $4 Total costs per civilian satellite $242 $194 $48 20%
Source: Calculated for generic military and generic civilian communications satellites using Apgar (Apgar 2011, 289–324). Data for terrestrial assembly comes from Apgar 2011. Other assumptions stated in the text. * Total non-recurring costs each year for civilian satellites are estimated at $668 million for civilian satellites
assembled on Earth and $545 million for satellites assembled in space, for a cost savings of $123 million. These numbers were divided by the maximum number of civilian satellites assembled each year (14) to generate the non-recurring cost estimates per civilian satellite in the table. We assume that all military satellites are unique and therefore cannot share non-recurring costs in the same way.
While assembling satellites in space reduces costs in some areas, it adds costs in
others. For example, a satellite assembler in LEO would have to procure a platform on which to assemble the satellites, including equipment such as a robotic arm for assembly.
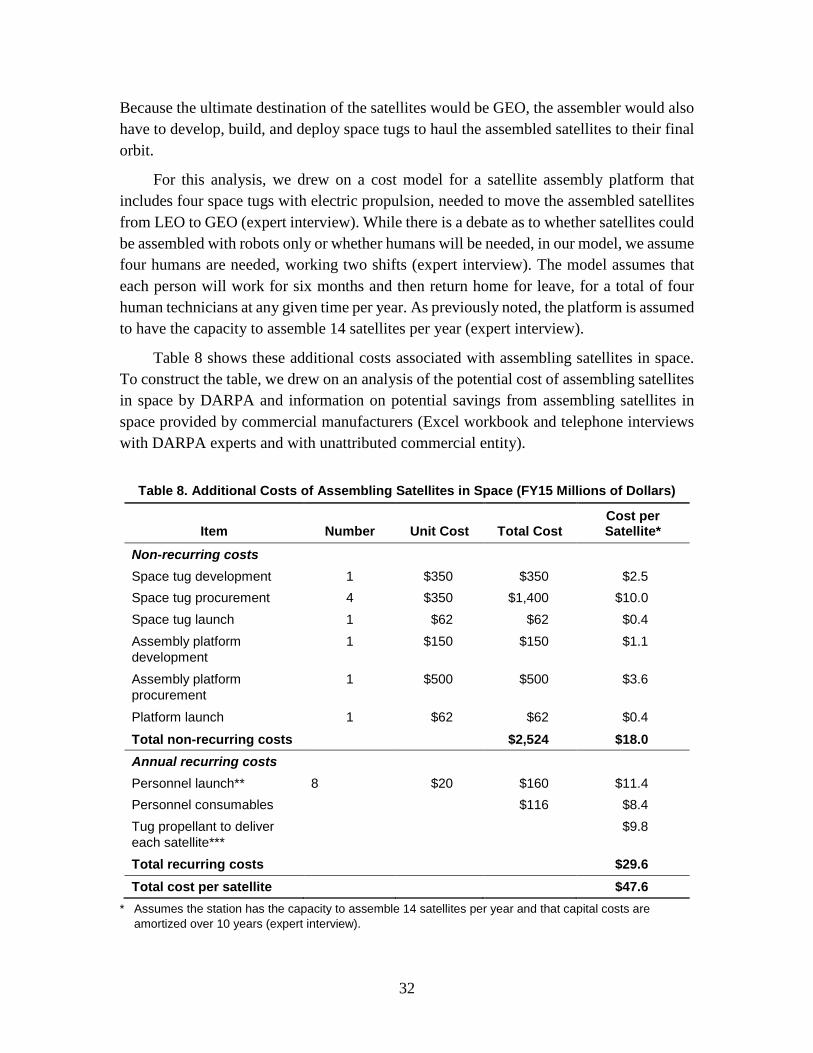
32
Because the ultimate destination of the satellites would be GEO, the assembler would also have to develop, build, and deploy space tugs to haul the assembled satellites to their final orbit.
For this analysis, we drew on a cost model for a satellite assembly platform that includes four space tugs with electric propulsion, needed to move the assembled satellites from LEO to GEO (expert interview). While there is a debate as to whether satellites could be assembled with robots only or whether humans will be needed, in our model, we assume four humans are needed, working two shifts (expert interview). The model assumes that each person will work for six months and then return home for leave, for a total of four human technicians at any given time per year. As previously noted, the platform is assumed to have the capacity to assemble 14 satellites per year (expert interview).
Table 8 shows these additional costs associated with assembling satellites in space. To construct the table, we drew on an analysis of the potential cost of assembling satellites in space by DARPA and information on potential savings from assembling satellites in space provided by commercial manufacturers (Excel workbook and telephone interviews with DARPA experts and with unattributed commercial entity).
Table 8. Additional Costs of Assembling Satellites in Space (FY15 Millions of Dollars)
Item Number Unit Cost Total Cost Cost per Satellite*
Non-recurring costs Space tug development 1 $350 $350 $2.5 Space tug procurement 4 $350 $1,400 $10.0 Space tug launch 1 $62 $62 $0.4 Assembly platform development
1 $150 $150 $1.1
Assembly platform procurement
1 $500 $500 $3.6
Platform launch 1 $62 $62 $0.4
Total non-recurring costs $2,524 $18.0 Annual recurring costs Personnel launch** 8 $20 $160 $11.4 Personnel consumables $116 $8.4 Tug propellant to deliver each satellite***
$9.8
Total recurring costs $29.6 Total cost per satellite $47.6
* Assumes the station has the capacity to assemble 14 satellites per year and that capital costs are amortized over 10 years (expert interview).
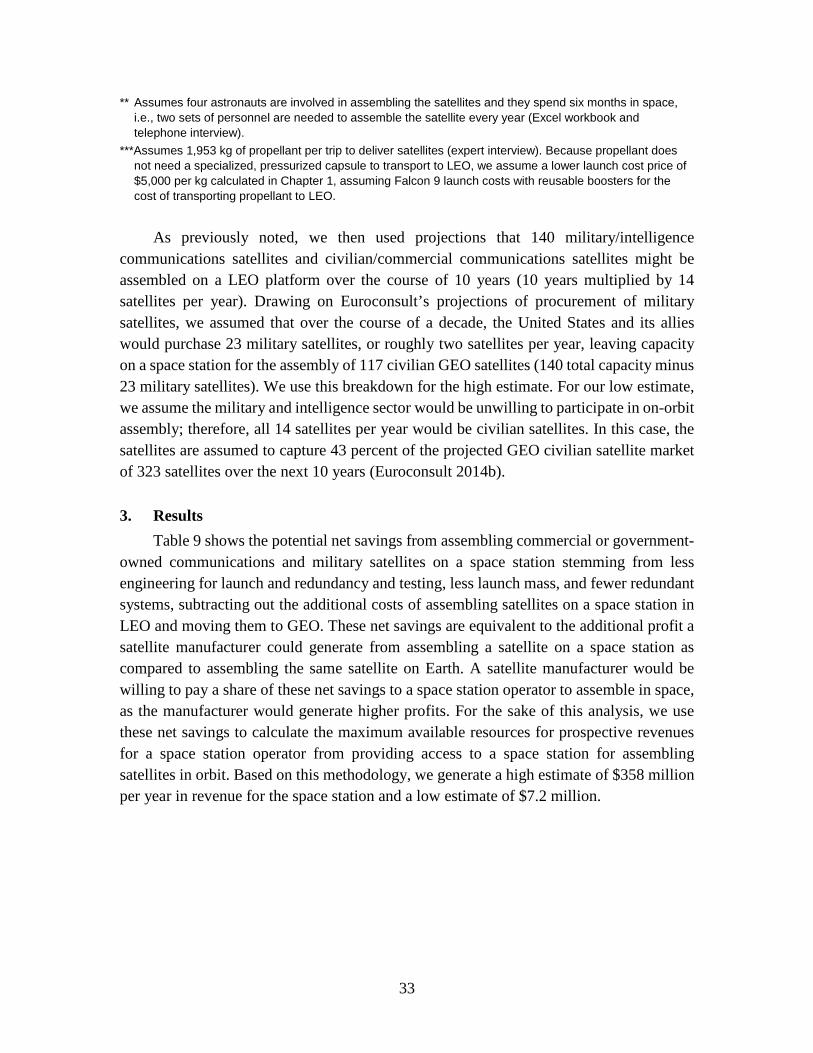
33
** Assumes four astronauts are involved in assembling the satellites and they spend six months in space, i.e., two sets of personnel are needed to assemble the satellite every year (Excel workbook and telephone interview).
***Assumes 1,953 kg of propellant per trip to deliver satellites (expert interview). Because propellant does not need a specialized, pressurized capsule to transport to LEO, we assume a lower launch cost price of $5,000 per kg calculated in Chapter 1, assuming Falcon 9 launch costs with reusable boosters for the cost of transporting propellant to LEO.
As previously noted, we then used projections that 140 military/intelligence
communications satellites and civilian/commercial communications satellites might be assembled on a LEO platform over the course of 10 years (10 years multiplied by 14 satellites per year). Drawing on Euroconsult’s projections of procurement of military satellites, we assumed that over the course of a decade, the United States and its allies would purchase 23 military satellites, or roughly two satellites per year, leaving capacity on a space station for the assembly of 117 civilian GEO satellites (140 total capacity minus 23 military satellites). We use this breakdown for the high estimate. For our low estimate, we assume the military and intelligence sector would be unwilling to participate in on-orbit assembly; therefore, all 14 satellites per year would be civilian satellites. In this case, the satellites are assumed to capture 43 percent of the projected GEO civilian satellite market of 323 satellites over the next 10 years (Euroconsult 2014b).
3. Results Table 9 shows the potential net savings from assembling commercial or government-
owned communications and military satellites on a space station stemming from less engineering for launch and redundancy and testing, less launch mass, and fewer redundant systems, subtracting out the additional costs of assembling satellites on a space station in LEO and moving them to GEO. These net savings are equivalent to the additional profit a satellite manufacturer could generate from assembling a satellite on a space station as compared to assembling the same satellite on Earth. A satellite manufacturer would be willing to pay a share of these net savings to a space station operator to assemble in space, as the manufacturer would generate higher profits. For the sake of this analysis, we use these net savings to calculate the maximum available resources for prospective revenues for a space station operator from providing access to a space station for assembling satellites in orbit. Based on this methodology, we generate a high estimate of $358 million per year in revenue for the space station and a low estimate of $7.2 million.
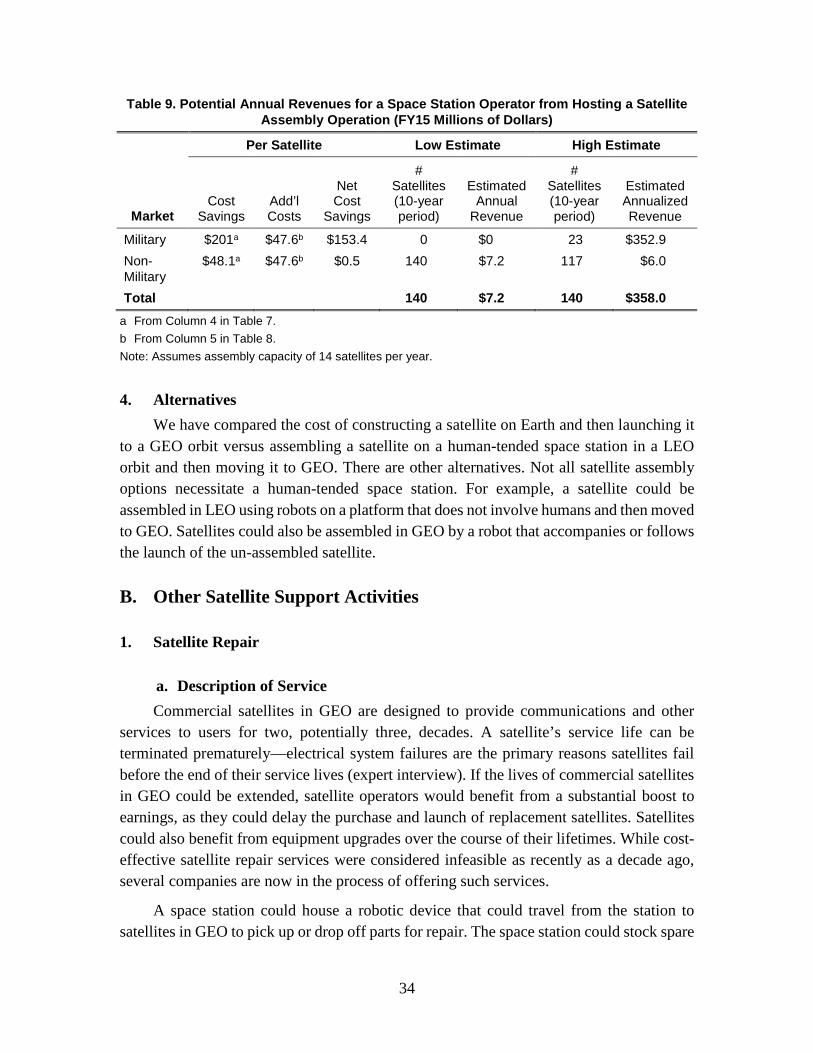
34
Table 9. Potential Annual Revenues for a Space Station Operator from Hosting a Satellite Assembly Operation (FY15 Millions of Dollars)
Market
Per Satellite Low Estimate High Estimate
Cost Savings
Add’l Costs
Net Cost
Savings
# Satellites (10-year period)
Estimated Annual
Revenue
# Satellites (10-year period)
Estimated Annualized Revenue
Military $201a $47.6b $153.4 0 $0 23 $352.9 Non-Military
$48.1a $47.6b $0.5 140 $7.2 117 $6.0
Total 140 $7.2 140 $358.0 a From Column 4 in Table 7. b From Column 5 in Table 8. Note: Assumes assembly capacity of 14 satellites per year.
4. Alternatives We have compared the cost of constructing a satellite on Earth and then launching it
to a GEO orbit versus assembling a satellite on a human-tended space station in a LEO orbit and then moving it to GEO. There are other alternatives. Not all satellite assembly options necessitate a human-tended space station. For example, a satellite could be assembled in LEO using robots on a platform that does not involve humans and then moved to GEO. Satellites could also be assembled in GEO by a robot that accompanies or follows the launch of the un-assembled satellite.
B. Other Satellite Support Activities
1. Satellite Repair
a. Description of Service Commercial satellites in GEO are designed to provide communications and other
services to users for two, potentially three, decades. A satellite’s service life can be terminated prematurely—electrical system failures are the primary reasons satellites fail before the end of their service lives (expert interview). If the lives of commercial satellites in GEO could be extended, satellite operators would benefit from a substantial boost to earnings, as they could delay the purchase and launch of replacement satellites. Satellites could also benefit from equipment upgrades over the course of their lifetimes. While cost-effective satellite repair services were considered infeasible as recently as a decade ago, several companies are now in the process of offering such services.
A space station could house a robotic device that could travel from the station to satellites in GEO to pick up or drop off parts for repair. The space station could stock spare
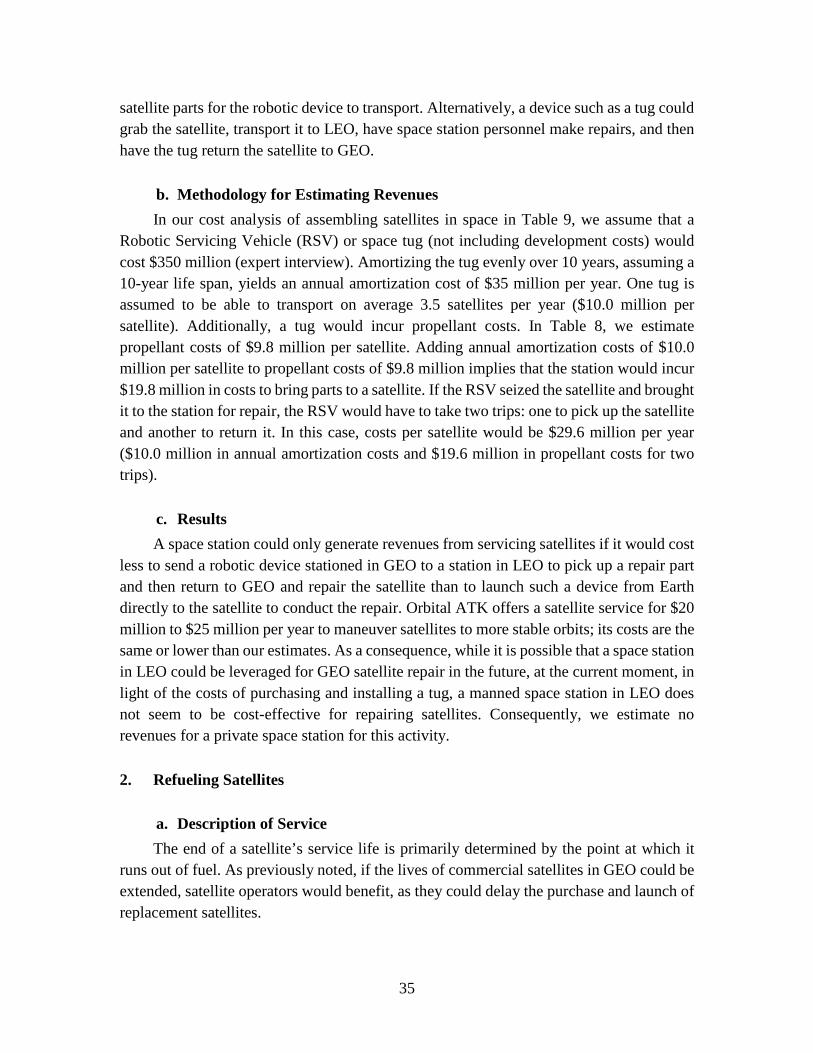
35
satellite parts for the robotic device to transport. Alternatively, a device such as a tug could grab the satellite, transport it to LEO, have space station personnel make repairs, and then have the tug return the satellite to GEO.
b. Methodology for Estimating Revenues In our cost analysis of assembling satellites in space in Table 9, we assume that a
Robotic Servicing Vehicle (RSV) or space tug (not including development costs) would cost $350 million (expert interview). Amortizing the tug evenly over 10 years, assuming a 10-year life span, yields an annual amortization cost of $35 million per year. One tug is assumed to be able to transport on average 3.5 satellites per year ($10.0 million per satellite). Additionally, a tug would incur propellant costs. In Table 8, we estimate propellant costs of $9.8 million per satellite. Adding annual amortization costs of $10.0 million per satellite to propellant costs of $9.8 million implies that the station would incur $19.8 million in costs to bring parts to a satellite. If the RSV seized the satellite and brought it to the station for repair, the RSV would have to take two trips: one to pick up the satellite and another to return it. In this case, costs per satellite would be $29.6 million per year ($10.0 million in annual amortization costs and $19.6 million in propellant costs for two trips).
c. Results A space station could only generate revenues from servicing satellites if it would cost
less to send a robotic device stationed in GEO to a station in LEO to pick up a repair part and then return to GEO and repair the satellite than to launch such a device from Earth directly to the satellite to conduct the repair. Orbital ATK offers a satellite service for $20 million to $25 million per year to maneuver satellites to more stable orbits; its costs are the same or lower than our estimates. As a consequence, while it is possible that a space station in LEO could be leveraged for GEO satellite repair in the future, at the current moment, in light of the costs of purchasing and installing a tug, a manned space station in LEO does not seem to be cost-effective for repairing satellites. Consequently, we estimate no revenues for a private space station for this activity.
2. Refueling Satellites
a. Description of Service The end of a satellite’s service life is primarily determined by the point at which it
runs out of fuel. As previously noted, if the lives of commercial satellites in GEO could be extended, satellite operators would benefit, as they could delay the purchase and launch of replacement satellites.
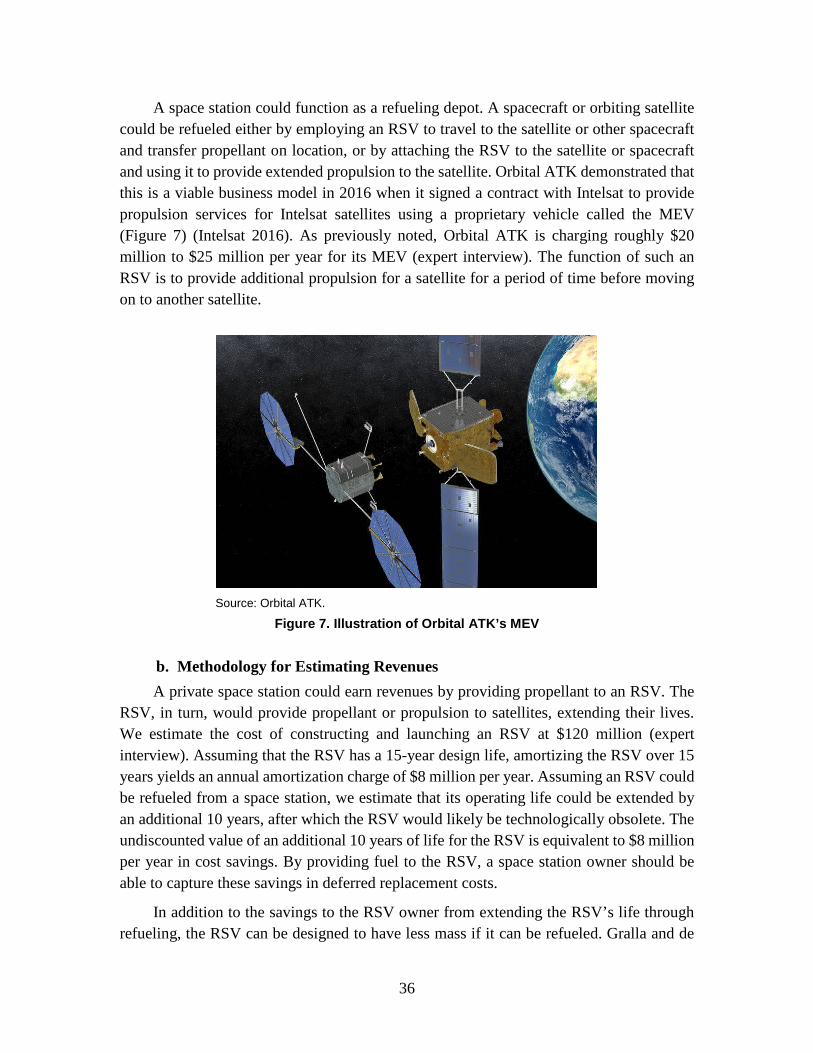
36
A space station could function as a refueling depot. A spacecraft or orbiting satellite could be refueled either by employing an RSV to travel to the satellite or other spacecraft and transfer propellant on location, or by attaching the RSV to the satellite or spacecraft and using it to provide extended propulsion to the satellite. Orbital ATK demonstrated that this is a viable business model in 2016 when it signed a contract with Intelsat to provide propulsion services for Intelsat satellites using a proprietary vehicle called the MEV (Figure 7) (Intelsat 2016). As previously noted, Orbital ATK is charging roughly $20 million to $25 million per year for its MEV (expert interview). The function of such an RSV is to provide additional propulsion for a satellite for a period of time before moving on to another satellite.
Source: Orbital ATK.
Figure 7. Illustration of Orbital ATK’s MEV
b. Methodology for Estimating Revenues A private space station could earn revenues by providing propellant to an RSV. The
RSV, in turn, would provide propellant or propulsion to satellites, extending their lives. We estimate the cost of constructing and launching an RSV at $120 million (expert interview). Assuming that the RSV has a 15-year design life, amortizing the RSV over 15 years yields an annual amortization charge of $8 million per year. Assuming an RSV could be refueled from a space station, we estimate that its operating life could be extended by an additional 10 years, after which the RSV would likely be technologically obsolete. The undiscounted value of an additional 10 years of life for the RSV is equivalent to $8 million per year in cost savings. By providing fuel to the RSV, a space station owner should be able to capture these savings in deferred replacement costs.
In addition to the savings to the RSV owner from extending the RSV’s life through refueling, the RSV can be designed to have less mass if it can be refueled. Gralla and de
37
Weck (2007) have estimated the savings in mass from designing an RSV or space tug so that it can be refueled in space as opposed to using an RSV with no refueling capability. They calculate that over the life of the RSV, refueling saves up to 41 percent, or 600 kg of the mass of launching an RSV with no refueling capability (Gralla and de Weck 2007, 226). Assuming launch costs of an RSV transported in a capsule to be $20,000 per kg, designing an RSV to be refueled and refueling it in space would save $12 million (600 kg times $20,000 per kg) over the life of the RSV. If this cost savings is spread over a prospective 25-year life span for an RSV, annualized savings would be $480,000 dollars per year.
Because the same amount of fuel for in-space propulsion provided to satellites by the RSV would be needed whether an RSV owner de-orbited an RSV after 15 years—replacing it with a new RSV—or extended the life of the RSV to 25 years, there are no net gains and therefore no additional revenues from providing fuel in space or including it when a new RSV is launched. The cost of procuring and launching the fuel are the same in either case.
If we assume that a space station operator could capture the entire $8 million in cost savings from not replacing an RSV and the $480,000 savings from designing and launching an RSV that can be refueled rather than one that cannot, we generate an estimate of a potential $8.5 million per year in revenues for the space station from refueling. We assume that for our low estimate, there is a market for refueling one RSV annually, and for the higher estimate, two RSVs.
c. Results For our low estimate, we estimate that the space station refuels one RSV over the
course of 10 years for annual revenues of $8.5 million. For our high estimate, we assume that the station refuels two RSVs over 10 years for annual revenues of $17.0 million.
3. Small Satellite Deployment from Station
a. Description of Service Currently, many small satellites are deployed to orbit as ride-shares in large rockets
carrying larger primary payloads. Often these ride-sharing options do not put the small satellites into orbits best suited for their purposes. Deploying small satellites from a commercial space station as opposed to launching them directly from a rocket could save satellite owners money by not requiring propulsion systems to maneuver the satellite into the proper orbit, and by piggy-backing on launches for other purposes, potentially obtaining discounted launch prices. Additionally, cargo launches to the space station would run on a fairly regular schedule. If a launch to a station were to be scrubbed, the small satellite may be able to catch a ride as secondary cargo on the next scheduled launch to the station within a relatively short amount of time. When dedicated launches are scrubbed, it

38
often takes a longer period of time to find a new launch window for both the primary and secondary payloads. In short, because there will likely be regular resupply flights to a space station, small payloads would have more flexible options to get to orbit if they were deployed from a station.
Small satellites are already being deployed from the ISS: as of September 2016, NanoRacks and others had deployed a total of 140 CubeSats—small satellites weighing between 1 and 10 kg—from the U.S., Japanese, and Russian modules on the ISS, as shown in Figure 8 (Krebs 2016; expert interview). This represents roughly a third of all CubeSats launched since 2000 (National Academies of Sciences, Engineering, and Medicine 2016).
Source: NASA.
Figure 8. NanoRacks CubeSat Deployer on ISS
b. Methodology for Estimating Revenues To calculate the potential revenue generated by launching small satellites from a
space station, we assume that small satellites would cost $20,000 per kg to launch on a regular cargo mission to the station. Spaceflight Services is currently charging $59,000 per kg for 3U CubeSats for ride-share launches ($295,000 for a 5-kg, 3U CubeSat), although in the next decade, competition may bring this price down. We do not foresee a station being able to charge more than $40,000 per kg to launch a small satellite into its proper orbit, which leads to $20,000 in revenues per kg that the space station can capture through charges to the CubeSat owners for providing this service ($40,000 per kg charge minus $20,000 per kg in launch costs to the station).
We assume the average size of small satellites that would be deployed from the station is 3 kg. Most university payloads try to adhere to the 1U, 1-kg standard for CubeSats, while

39
scientific payloads are opting for the larger 3U, 5-kg and 6U, 10-kg standards, so an average of 3 kg per small satellite is reasonable in light of the preponderance of university payloads in this market.
Euroconsult estimates that of the 3,600 small satellites that are expected to be launched in the next decade, 61 percent (2,196) will be CubeSats, or roughly 220 CubeSats per year (2016). While this is encouraging for a space station that deploys CubeSats, we do not believe that a station can dominate this market because CubeSat owners may want alternative orbits and because of launch market competition.
For our high revenue estimate, we assume that a station will capture roughly 70 percent of the CubeSat launch market, or that an average of 160 3-kg satellites per year would be launched with regular cargo flights and deployed from the station. This high estimate is based on the current growth of the small satellite market and the increasing affordability of developing small satellites, both for commercial and educational applications. It is also based on the assumption that the small satellite launch market using proposed new rockets may not be as successful as currently anticipated (expert interview).
For our low revenue estimate, we assume that the emerging small satellite launch market would be more competitive, and that launching from the station’s orbit would not be seen as desirable by the majority of potential customers. The additional benefit of astronaut time on orbit would still mean that some portion of the market would find this option desirable, however. Therefore, for our low end estimate, we assume that 40 3-kg satellites per year would be launched from the station, and all would use astronauts for deployment.
Some of the small satellites that arrive on station will need assistance from astronauts on board for deployment. To calculate how much additional revenue could be charged to customers who require astronaut time on board the station before deployment, we assume 40 payloads would require one hour of astronaut time, at $38,000 per hour, to be deployed for both our high and low estimates.
c. Results For our high estimate (launch of 160 CubeSats from the station), we calculate that a
space station could generate $9.6 million annually from deploying 160 3-kg satellites. Additionally, for 40 payloads per year, an additional $1.5 million in revenue could be generated by charging for crew time, for a total of $11.1 million in revenue per year.
For our low estimate, we assume that 40 CubeSats are deployed from the space station, all of which use crew time for deployment. For this estimate, we calculate $2.4 million in annual revenue for deploying 40 3-kg satellites and $1.5 million for crew time, bringing the total projected revenue to $3.9 million annually.
40
4. Debris Removal
a. Description of Service There are more than 20,000 pieces of debris larger than 10 centimeters in diameter
and roughly 500,000 pieces of debris 1 centimeter or larger in diameter orbiting Earth, mostly in LEO. There are millions of other pieces of debris too small to track (NASA 2013d). Large amounts of orbital debris pose a serious hazard to satellites, capsules, space stations, and people in space. In 2009, the Russian satellite Kosmos-2251, which was no longer operable, collided with the active Iridium 33 satellite in LEO, destroying both satellites and producing over 3,000 pieces of fragmented debris (NASA 2009a).
A number of methods have been proposed to remove debris from crowded orbits. Proposed methods to actively remove debris include using space tugs to move satellites that are no longer operating to safe graveyard orbits or thrusting a satellite to successfully de-orbit it. Ideas to thrust pieces of orbiting debris have included using a laser “broom” or laser beam photons whereby lasers are used to nudge debris to a different orbit. Others have proposed collecting debris using foamy balls of aerogel, water spray, inflatable balloons, or boom electro-adhesion. Tethers Unlimited is developing Terminator Tape and Terminator Tethers that increase drag on a satellite or very large pieces of debris, resulting in de-orbiting. The company is also developing a net called GRASP (Grapple, Retrieve, and Secure Payload) to capture space debris (Tethers Unlimited 2015). The Aerospace Corporation is developing an extremely thin spacecraft that could wrap itself around debris and safely remove it from orbit (Johnson 2016). Some, but not all of these ideas, might benefit from access to a space station.
While none of these ideas directly references the use of a space station in removing orbital debris, many of these solutions would benefit from services that a space station could provide, such as refueling tugs or removal apparatus engaged in active debris removal. A space station could also serve as a collection and storage site for debris. If recycling technology advances far enough, the station could be used as a recycling center. Using a space station in LEO as a port for orbital debris cleanup would be most effective if it existed near the most favorable orbital altitudes and inclinations to minimize fuel expenditures during inclination changes. Analysis suggests that the orbits that would most benefit from cleanup are on the 71–74 degrees inclination, 81–83 degrees inclination, or sun-synchronous clusters (Levin and Carroll 2012).
b. Methodology for Estimating Revenues To determine potential revenues generated from using a space station in LEO to
facilitate debris removal, we focused on refueling services for a robotic debris-removing device. We assume that one space tug is located in LEO similar in size and cost to Orbital ATK’s MEV. Under this assumption, we employed the same methodology we used to
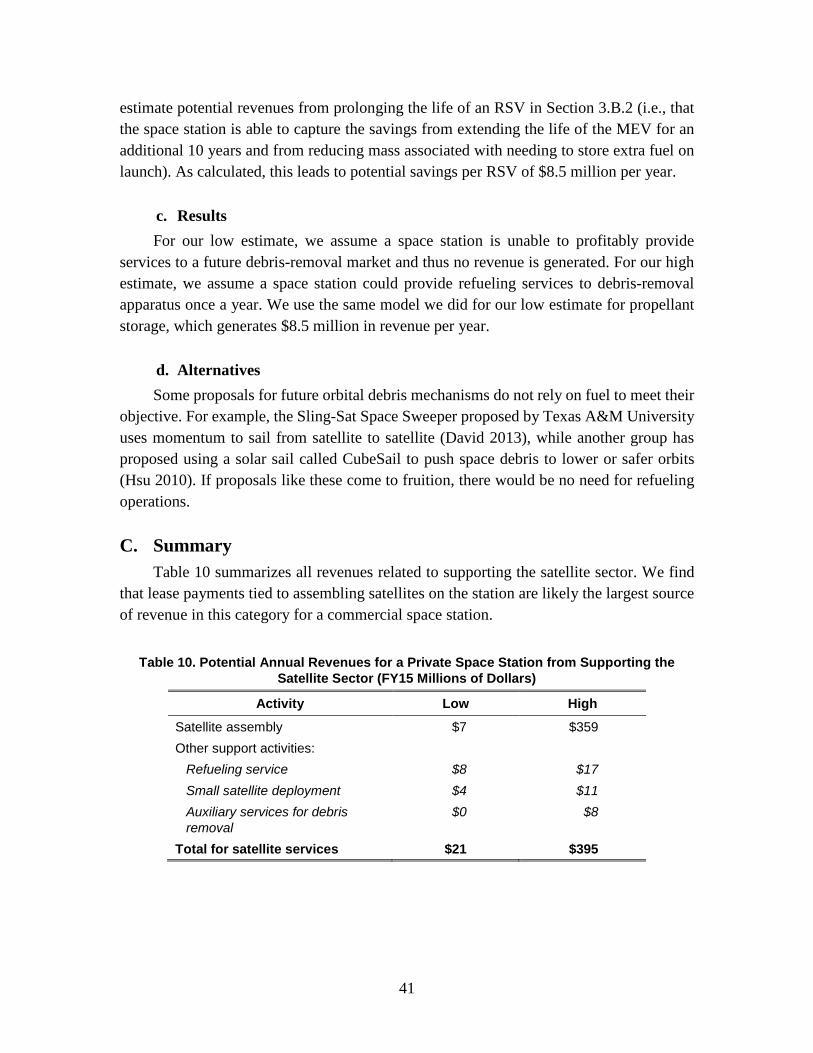
41
estimate potential revenues from prolonging the life of an RSV in Section 3.B.2 (i.e., that the space station is able to capture the savings from extending the life of the MEV for an additional 10 years and from reducing mass associated with needing to store extra fuel on launch). As calculated, this leads to potential savings per RSV of $8.5 million per year.
c. Results For our low estimate, we assume a space station is unable to profitably provide
services to a future debris-removal market and thus no revenue is generated. For our high estimate, we assume a space station could provide refueling services to debris-removal apparatus once a year. We use the same model we did for our low estimate for propellant storage, which generates $8.5 million in revenue per year.
d. Alternatives Some proposals for future orbital debris mechanisms do not rely on fuel to meet their
objective. For example, the Sling-Sat Space Sweeper proposed by Texas A&M University uses momentum to sail from satellite to satellite (David 2013), while another group has proposed using a solar sail called CubeSail to push space debris to lower or safer orbits (Hsu 2010). If proposals like these come to fruition, there would be no need for refueling operations.
C. Summary Table 10 summarizes all revenues related to supporting the satellite sector. We find
that lease payments tied to assembling satellites on the station are likely the largest source of revenue in this category for a commercial space station.
Table 10. Potential Annual Revenues for a Private Space Station from Supporting the
Satellite Sector (FY15 Millions of Dollars)
Activity Low High
Satellite assembly $7 $359 Other support activities:
Refueling service $8 $17 Small satellite deployment $4 $11 Auxiliary services for debris removal
$0 $8
Total for satellite services $21 $395

43
4. Space Station Activities: Producing Products and Services in Space for Use on Earth
The advantages provided by the microgravity environment in space are the primary reasons for manufacturing products in space that can be profitably sold on Earth. In addition to microgravity, space offers manufacturers an environment in which products can potentially be manufactured with less vibration, jitter, or spin than on Earth, depending on the station design.
Manufacturers of items on a space station for consumption on Earth have to cover the cost of ferrying materials to and from the station. Under our assumption of launch costs of $20,000 per kg, products produced in space have to be worth at least that amount just to cover the cost of transport. To date, no manufacturers have been able to surmount this cost hurdle. In addition, the capacity for downmass is a potential constraint on manufacturing products in space for use on Earth, as currently only a small number of spacecraft are able to bring objects back from LEO.
In this chapter, we assess the potential for three products to be manufactured in space whose value could, in the timeframe of interest, exceed launch costs and for which manufacturing in space creates a product that cannot be readily produced on Earth with the same quality and cost: (1) silicon carbide (SiC) wafers, (2) exotic fiber optic cables, and (3) supercomputing services. In the long term, other products may potentially be profitably manufactured in LEO for sale on Earth—for example, growing human organs in space for transplant operations. However, we found that the current state of technological readiness of this potential process did not fall into the timeframe discussed in this report.
A. Silicon Carbide Wafers
1. Description of Service SiC, a compound of silicon and carbon, can be used to produce wafers for the
manufacture of computer chips that can operate at temperatures up to 1,000°C, can withstand 10 times the electric fields that standard semiconductors made of silicon can withstand, and offer high radiation resistance, high thermal conductivity, high maximum current density, and several other interesting properties that make them superior to standard semiconductors manufactured using silicon wafers (Department of Energy (DOE) 2015). SiC wafers can be produced in microgravity at much higher quality than those produced
44
on Earth.7 On Earth, gravity prevents atoms from settling into their lowest energy states on a wafer, producing defects that interfere with the flow of electricity across the wafer. In microgravity, by cycling the pressure and temperature, these defects can be removed, resulting in “S-grade” (“space” grade) wafers with 99 percent of the original defects removed and little to no edge effects (Glover 2016; ACME 2016).
With some redesign, SiC wafers can replace wafers made from silicon (DOE 2015). Because chips and other products manufactured from SiC wafers operate at very high temperatures, substituting SiC-based power electronics for traditional power electronics reduces required heat sinks (Hull 2013). Other uses for SiC include photovoltaic inverters, electric and hybrid vehicles, solar arrays, power grids, and wind turbines (Anagenesis 2015, expert interview).
2. Methodology for Estimating Revenues A future private station could generate revenues by leasing space for the production
of high-grade SiC wafers. To determine how much revenue a private station could generate through such leases, we first estimate the costs of “healing” wafers in orbit. ACME Advanced Materials, based in Albuquerque, New Mexico, has been reprocessing or healing low-grade SiC wafers in microgravity to create high purity wafers with valuable material properties. According to ACME, poorer quality wafers manufactured on Earth that can be healed in microgravity sell for $250 (Glover 2016). We assume that a manufacturer in space purchases low-grade SiC wafers for $250 per wafer and then transports these wafers to the space station for processing.
To calculate launch costs, we use the fact that SiC has a density of 3.21 grams per cubic centimeter (Patnaik 2009); hence, a 4-inch diameter wafer with a thickness of 1 millimeter weighs about 0.03 kg. At a cost of $20,000 per kg to transport wafers to the space station, each wafer would cost $600 to transport to the space station. Thus, the total variable costs for healing a low-quality wafer is $850, the sum of the purchase price of the wafer ($250) and transport costs ($600).
We do not attempt to estimate total fixed costs and amortize them across the total number of wafers healed, because we were unable to obtain information concerning the cost and mass of the manufacturing unit. We concluded that these costs would be small compared to the costs for which we have made estimates.8
7 In addition to quality improvements to SiC wafers, microgravity processing can be used to improve the
purity and crystal structure of other synthetic materials, such as gallium nitride and diamond substrates. 8 The units currently used to heal low-grade wafers on parabolic flights are not massive. If we assume a
full manufacturing unit has a mass of 100 kg, the cost of launch would be $2 million. The unit itself would likely cost less. Spread over several hundred thousand wafers over 10 years, we conclude these fixed costs would not have an appreciable effect on our estimates of potential net revenues.
45
In 2015, over 75,000 SiC wafers were sold for total global sales revenues of $66 million (Anagenesis 2015 and references therein). For our low estimate, we assume this number of wafers (75,000) would be healed on the space station over the course of a year. For our low estimate, we look at the current market growth. The SiC wafer market rose 24 percent from $53.2 million to $66 million dollars between 2010 and 2015 (DOE 2015 and references therein). Assuming that the quantity of wafers grows at this same rate over the next 10 years, by the end of 2025, the number of wafers manufactured on orbit would be 115,320, if all production of wafers moved to space. We use this number for our high estimate.
Additionally, we assume some astronaut time would be needed for healing the wafers. For our low estimate, we assume that the manufacturing operation needs 5 hours per week of astronaut time for supervision and maintenance. At a cost of $38,000 per hour times 260 hours per year (52 weeks times 5 hours), the annual cost of astronaut time would be $9.9 million per year. We assume that the space station provides electric power and other services as part of the rental payment paid by the manufacturer to the station. For our high estimate, to produce a greater number of wafers, we assume a proportional increase in astronaut time to 7.7 hours per week to handle the increased production volume—in other words, 400 hours per year, which would cost $15.3 million.
After reprocessing in microgravity, ACME Advanced Materials sells S-grade SiC for $750 per wafer. Companies that produce better quality A-grade SiC wafers are able to charge $1,500 per wafer (Glover 2016). If substantially more A-quality SiC were to become available, this price would fall. In our analysis, we assume that a SiC wafer manufacturing operation in orbit would produce A-grade SiC wafers, but that it would be able to sell those wafers at the average of these two prices, $1,125 per wafer.
3. Results We assume the space station would be able to capture the profits generated by
manufacturing wafers on orbit in the form of charges for leasing; it would also generate revenues for astronaut time. For our low estimate, multiplying 75,000 wafers per year by $1,125 yields $84.4 million. Subtracting total costs of $73.7 million ($63.7 million in variable costs ($850 per wafer times 75,000) plus $9.9 million in astronaut time) yields $10.7 million available for lease payments. Adding in the $9.9 million in charges for astronaut time generates $20.6 million in revenues for the station.
For our high estimate, we assume 115,320 wafers are healed each year, yielding gross revenues of $129.7 million. Subtracting production costs of $113.3 million ($98.0 million of which is variable costs of $850 per wafer times 115,320) yields $16.4 million available for lease payments. The higher number of astronaut hours yields an additional $15.3 million in space station revenues, for potential total revenues of $31.7 million.

46
4. Alternatives ACME originally healed SiC on suborbital flights of spacecraft. It now heals SiC on
parabolic flights of aircraft; the quality of the product is equivalent to wafers processed on suborbital flights (ACME 2016). Because microgravity reprocessing is additive for SiC wafers, over six minutes of microgravity provided by several parabolic flights can remove 99 percent of defects (expert interview). We estimate the cost of each parabolic flight at $65,000.9 ACME Advanced Materials can heal up to 300 wafers per flight (expert interview). At these prices, it would cost $16.25 million to heal 75,000 wafers.10 This cost is much lower than the $45 million in launch costs needed to heal 75,000 wafers on a space station. Other costs for parabolic processing are relatively low, as reprocessing requires as little as 500 watt-hours of power per flight, which can be provided by batteries. The process of healing SiC wafers on parabolic flights should be fully automated by 2017 (Glover 2016, ACME Advanced Materials’ website, and correspondence with an expert). Costs of launching and retrieving the chips would have to fall below the costs of healing chips on parabolic flights for reprocessing on a space station to make commercial sense.
B. Exotic Fiber Optic Cable
1. Description of Service Producing highly pure fiber optic cables on Earth is limited by gravity-induced
convection and mixing, which causes crystals to form in the fibers before the glass can cool. Crystals begin to grow at a higher temperature in a microgravity environment, resulting in a wider working temperature range over which the glass can be drawn into fiber. Fibers processed in microgravity have better clarity, reduced signal attenuation, and a bandwidth for transmission that extends into the infrared as shown in Figure 9 (Torres, Ganley, and Maji 2014). There is no known alternative to production in microgravity that simultaneously suppresses crystallization during the fiber-drawing process (Torres, Ganley, and Maji 2014).
9 We estimated the cost of one parabolic flight from information from The Tauri Group (2012) using
charges per passenger ($5,200) for parabolic flights (30 passengers times $5,200 equals $65,000). The cost could be reduced if the flight is shared with other passengers or researchers operating their own experiments concurrently with the product manufacturers.
10 At 300 wafers per flight, it would take 250 flights to heal 75,000 wafers, the assumed total for our low estimate. At $65,000 per flight, 250 flights would cost $16.25 million, or $216.66 per wafer. This compares with $600 per wafer in launch costs or $45 million to launch 75,000 wafers to LEO.

47
Source: NASA, n.d., “ZBLAN Fiber Comparison.”
Figure 9. ZBLAN Fiber Pulled in Microgravity (left) and 1-g (right)
Further research into exotic glasses and optical fibers such as the trade-named ZBLAN (ZrF4-BaF2-LaF3-AlF2-NaF) could enable unique medical, sensor, consumer, and communications products. ZBLAN fibers can be used for lasers for surgery and infrared countermeasures for military aircraft. Server farms could benefit from the increased potential for and accuracy of data transmission using ZBLAN (Cozmuta and Harper 2014). ZBLAN’s wide transmission window is ideal for remote sensing, and its hardness to radiation makes it a prime material for sensors for analyzing nuclear processes. To capitalize on the reduced signal attenuation of ZBLAN, long stretches of fiber could be used in telecommunications. ZBLAN fibers are weaker than their traditional optical fiber counterparts, however, so the reliability of very long lengths of fiber is uncertain; they could not currently be used for transcontinental or transoceanic telecommunications cables (expert interview).
Small lengths of up to two meters of ZBLAN can be produced in the 20 seconds of microgravity provided by parabolic flights. These lengths are sufficient for use by the biomedical industry, but not the telecommunications industry (expert interview). Manufacturers are actively investigating the potential to manufacture exotic fiber optic cables on the ISS. Made In Space, in partnership with the Center for the Advancement of Science in Space (CASIS), is slated to fly a technology demonstration of a ZBLAN fiber-pulling apparatus on the ISS in early 2017 (CASIS 2016a). Results from this demonstration project could eventually lead to a commercial manufacturing operation.
Currently, ZBLAN sells for $175 to $1000 per meter, depending on the quality of the fiber (ThorLabs, n.d.; FiberLabs, n.d.). One kg of ZBLAN yields 2.2 kilometers of ZBLAN

48
fiber (MacDonald 2014). This translates into $0.385 million to $2.2 million per kg, substantially higher than the associated launch costs. Therefore, producing ZBLAN on orbit could be profitable.
2. Methodology for Estimating Revenues A future private station could generate revenue by leasing space to produce ZBLAN.
The fiber optics industry had gross global sales of $3 billion in 2015 (IBISWorld 2015).11 Currently, sales of ZBLAN form a very small part of this market, but one analyst estimates that ZBLAN might be able to capture sales of $300 million to $400 million annually, which would be 10 to 13 percent of the current market (expert interview). If ZBLAN increases its market share by 1 percentage point per year over the next decade, by 2028 its share is likely to be in that range. We use the figure of $300 million for our low estimate and $400 million for our high estimate of the potential market size for ZBLAN. The relatively narrow range between the low and high estimates is predicated on the assumption that the ZBLAN market will develop to its full potential.
We next estimate the mass of the preform needed to produce the fiber to generate these revenues. One kg of preform is equivalent to 2.2 kilometers of ZBLAN fiber (expert interview). Using the potential sizes of the prospective market in dollars, we converted the value of the market into numbers of kilometers of ZBLAN fiber and the converted kilometers of fiber into grams using Equation (1). Because increased output of ZBLAN will push prices down, we use the lowest price, $175 per meter, to calculate the number of meters and the mass of preform that would be needed to generate $300 million to $400 million in revenue.
𝑤𝑤𝑤𝑤𝑤𝑤𝑤𝑤ℎ𝑡𝑡 𝑜𝑜𝑜𝑜 𝑍𝑍𝑍𝑍𝑍𝑍𝑍𝑍𝑍𝑍 (𝑤𝑤) = 𝑚𝑚𝑚𝑚𝑚𝑚𝑚𝑚𝑚𝑚𝑚𝑚 𝑠𝑠𝑠𝑠𝑠𝑠𝑚𝑚 ($)
𝑐𝑐𝑐𝑐𝑠𝑠𝑚𝑚 𝑐𝑐𝑜𝑜 𝑍𝑍𝑍𝑍𝑍𝑍𝑍𝑍𝑍𝑍 𝑝𝑝𝑚𝑚𝑚𝑚 𝑚𝑚𝑚𝑚𝑚𝑚𝑚𝑚𝑚𝑚 ($ 𝑚𝑚� )∗ 𝑤𝑤𝑚𝑚𝑠𝑠𝑤𝑤ℎ𝑚𝑚 𝑐𝑐𝑜𝑜 𝑃𝑃𝑚𝑚𝑚𝑚𝑜𝑜𝑐𝑐𝑚𝑚𝑚𝑚 (𝑤𝑤)
𝑙𝑙𝑚𝑚𝑙𝑙𝑤𝑤𝑚𝑚ℎ 𝑐𝑐𝑜𝑜 𝑍𝑍𝑍𝑍𝑍𝑍𝑍𝑍𝑍𝑍 (𝑚𝑚) (1)
Using Equation (1) and the parameters discussed, the mass of ZBLAN that would need to be produced on station to satisfy demand on Earth would be 779 kg for the low estimate and 1,039 kg for the high estimate. If, however, prices need to fall substantially below $175 per meter for ZBLAN to generate sales of $300 million to $400 million annually, the number of kg of ZBLAN—and, hence, preform—needed to satisfy demand would be much higher, significantly raising the costs to the manufacturer of launching preform to the space station to produce ZBLAN fiber.
11 This figure was taken from IBISWorld, “Fiber-Optic Cable Manufacturing in the US: Market Research
Report,” accessed in May 2016. The November 2016 posting on IBISWorld has been changed to report the size of the U.S. market only, not the global market; the site no longer shows the $3 billion figure for the size of the global market.
49
Assuming these volumes of ZBLAN are produced each year on a private space station, we calculated the cost of transporting the preform to the station and returning ZBLAN fiber to Earth.12 Assuming $20,000 per kg in launch costs, we estimate it would cost ZBLAN producers $15.6 million to $20.8 million in launch costs to transport material to the station and back. As with SiC, we also assume that astronaut time will be needed to ensure that the production process is proceeding smoothly, for start and stop operations, and to make sure raw materials are loaded in the machine and the product is offloaded and ready for shipment to Earth. We assume for our low estimate that the manufacturing operation needs 5 hours per week of astronaut time for supervision and maintenance at a cost of $38,000 per hour times 260 hours per year (52 weeks times 5 hours). For our high estimate, we assume a proportional increase in astronaut time based on increased output (1,037 kg divided by 778 kg times 5 hours per week) to 6.7 hours per week to handle the increased production volume. For the low estimate, astronauts would generate charges of $9.9 million; for the high estimate, $13.3 million. We assume that the space station provides power and other services as part of the lease payment that the manufacturer pays the space station.13 Under these assumptions, net revenues from manufacturing ZBLAN in space are calculated by taking the estimated size of the market, subtracting out the cost of launch and return ($15.6 million for the low estimate or $20.7 million for the high estimate) and astronaut time ($9.9 million and $13.3 million, respectively, for the low estimate and high estimate). We assume all net profits will go to the space station operator in addition to revenue generated from charging for astronaut time.
3. Results We assume that the space station operator could capture this net revenue either in the
form of a charge for leasing the station or by running the ZBLAN operations itself. For our low estimate, we estimate that net profits from manufacturing ZBLAN could amount to $284 million ($300 million minus $15.6 million in launch and return costs). The $9.9 million in astronaut charges nets out as the station derives revenues from charging for astronaut time, but these charges reduce the manufacturer’s net profits, which determine the maximum potential lease payment. Employing the same methodology, our high estimate is $379 million ($400 million minus $20.7 million in launch and return costs). Again, the $13.3 million in astronaut charges nets out.
12 We assume that all the preform transported to the space station is successfully converted into ZBLAN fiber. 13 We do not estimate and spread fixed costs over the volumes of ZBLAN fiber produced. The Made In
Space fiber puller is about the size of their 3D printer (CASIS 2016), so in relation to the revenues generated, the costs of purchasing the puller and transporting it to the station are very small.
50
4. Alternatives ZBLAN could be manufactured in bulk in microgravity with a free-flying apparatus
rather than a machine housed on a space station (Starodubov et al. 2014). An initial prototype of Starodubov et al.’s apparatus has been built. It has a 12-inch diameter and 40-inch length and weighs less than 100 pounds. It runs on an internal battery, is controlled by a laptop, and has successfully pulled ZBLAN cable from preform during a parabolic flight. Batch manufacturing using this apparatus could take place in LEO without the use of a space station but using a dedicated platform containing a ZBLAN preform, empty spools, and a robot capable of pulling the fiber. The platform would have to be launched into LEO, the robot would turn on and pull fiber, and the platform would de-orbit, bringing the processed ZBLAN to the ground (expert interview). The heating, slow cooling, and working robot would require about 250 watts of power per hour, which could be provided by batteries and solar panels. The concept would especially benefit from a reusable spacecraft.
C. Supercomputing
1. Description of Service Some experts have proposed that a supercomputer in space could generate revenues
by selling processing services (expert interview; Cozmuta 2014). On Earth, supercomputers provide processing services involving complex operations and large data sets. Operators have found that supercomputers designed to be cooled from the ambient temperature of 280 Kelvin (K) to 4 K (where materials begin to superconduct) perform much better than supercomputers designed to operate at ambient temperatures. These supercomputers require substantial amounts of power for cooling, however—about 2 megawatts for exascale computing (expert interview). If such a supercomputer were to be placed in space, it would have to be cooled from only 40 K (the temperature of LEO in shade) to 4 K, which requires about 0.5 megawatts.14 In other words, a supercomputing data center in space might require significantly less cooling than it would on the ground.
2. Methodology for Estimating Revenues To compute potential revenues for a space station from hosting a superconducting
supercomputer, we look at the potential cost savings from operating a supercomputer in space after accounting for the cost of transporting and operating the computer (primarily cooling it) in space compared to operating it on Earth. We found that although a 14 This estimate assumes about 5 kilowatts (kW) dissipated at 4 K and a refrigerator operating at ~10
percent of Carnot efficiency to cool the system from 40 K to 4 K, because temperatures in space are not cold enough for superconducting. Additional power would be needed to transfer data between space and Earth.
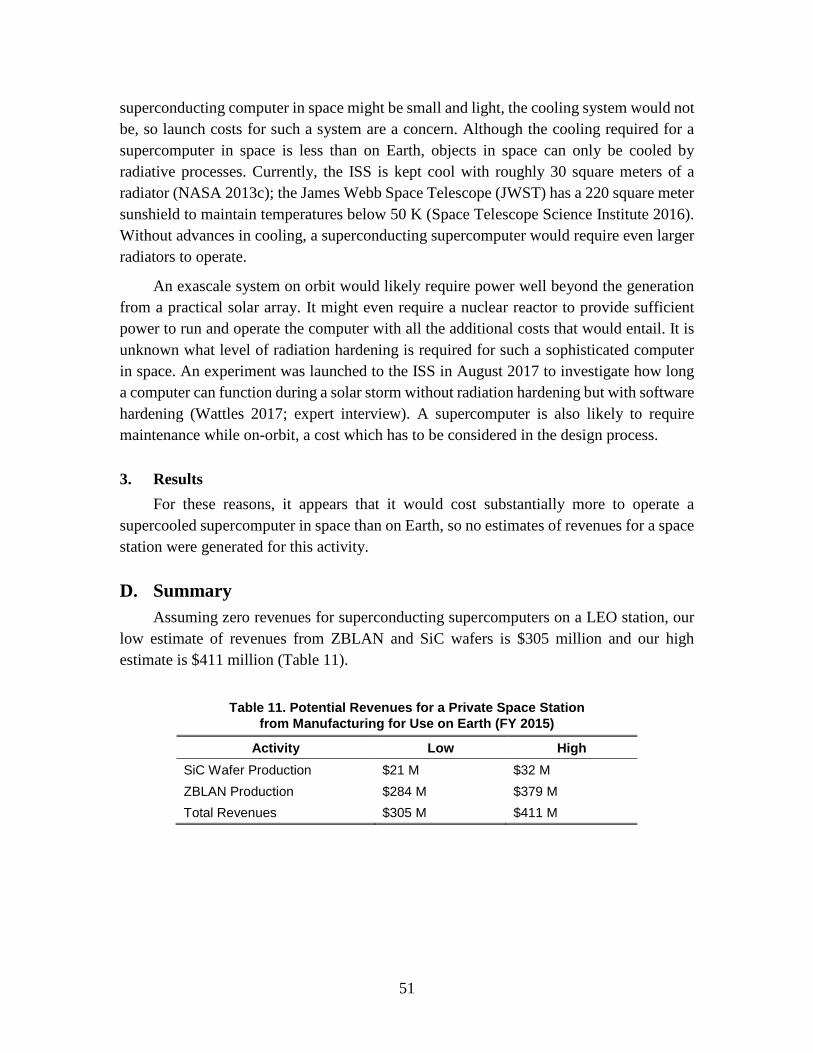
51
superconducting computer in space might be small and light, the cooling system would not be, so launch costs for such a system are a concern. Although the cooling required for a supercomputer in space is less than on Earth, objects in space can only be cooled by radiative processes. Currently, the ISS is kept cool with roughly 30 square meters of a radiator (NASA 2013c); the James Webb Space Telescope (JWST) has a 220 square meter sunshield to maintain temperatures below 50 K (Space Telescope Science Institute 2016). Without advances in cooling, a superconducting supercomputer would require even larger radiators to operate.
An exascale system on orbit would likely require power well beyond the generation from a practical solar array. It might even require a nuclear reactor to provide sufficient power to run and operate the computer with all the additional costs that would entail. It is unknown what level of radiation hardening is required for such a sophisticated computer in space. An experiment was launched to the ISS in August 2017 to investigate how long a computer can function during a solar storm without radiation hardening but with software hardening (Wattles 2017; expert interview). A supercomputer is also likely to require maintenance while on-orbit, a cost which has to be considered in the design process.
3. Results For these reasons, it appears that it would cost substantially more to operate a
supercooled supercomputer in space than on Earth, so no estimates of revenues for a space station were generated for this activity.
D. Summary Assuming zero revenues for superconducting supercomputers on a LEO station, our
low estimate of revenues from ZBLAN and SiC wafers is $305 million and our high estimate is $411 million (Table 11).
Table 11. Potential Revenues for a Private Space Station
from Manufacturing for Use on Earth (FY 2015)
Activity Low High SiC Wafer Production $21 M $32 M ZBLAN Production $284 M $379 M Total Revenues $305 M $411 M

53
5. Space Station Activities: Manufacturing and Assembling Products for Use in Space
New advances in additive manufacturing, robotics and automation, and other technologies offer the potential to manufacture spare parts and components in space, improving space operations and changing systems designs, thereby reducing operations costs. A private space station could charge for manufacturing parts and components in space, generating a stream of revenues from sales of these products to companies with operations in space, like satellite owners, or reducing the costs of operating the space station itself.
On-orbit manufacturing can potentially reduce downtimes for satellites and space stations stemming from broken components. It can also reduce the need to stock inventories of spare parts, reducing launch and stocking costs. In addition, because the materials, not the components themselves, are launched, components do not need to be designed to withstand the stresses of launch (or carry excessive amounts of packaging).
Engineers can design components manufactured in space to operate in zero-gravity, making possible products like gossamer sails and other objects that cannot be manufactured in a gravity environment (NRC 2014).
Space-based three-dimensional (3D) printers are already being used to manufacture simple parts and tools on the ISS. In the next decade, more sophisticated components, tools, solar cells, and potentially sensors and whole satellites may eventually be manufactured or built on-orbit. This chapter summarizes revenue generation on a station based on the use of additive manufacturing onboard. We also discuss the potential of manufacturing scientific apparatus for use in space.
A. Additive Manufacturing
1. Description of Services
a. Current Capabilities: Parts, Components, and Tools NASA and several companies are conducting R&D related to 3D printing in space.
Made In Space installed a 3D printer on the ISS in September 2014, as part of its “3D Printing in Microgravity” experiment. Made In Space and its partner, Lowe’s Innovation Labs, a division of Lowe’s, the hardware and construction materials retailer, installed a
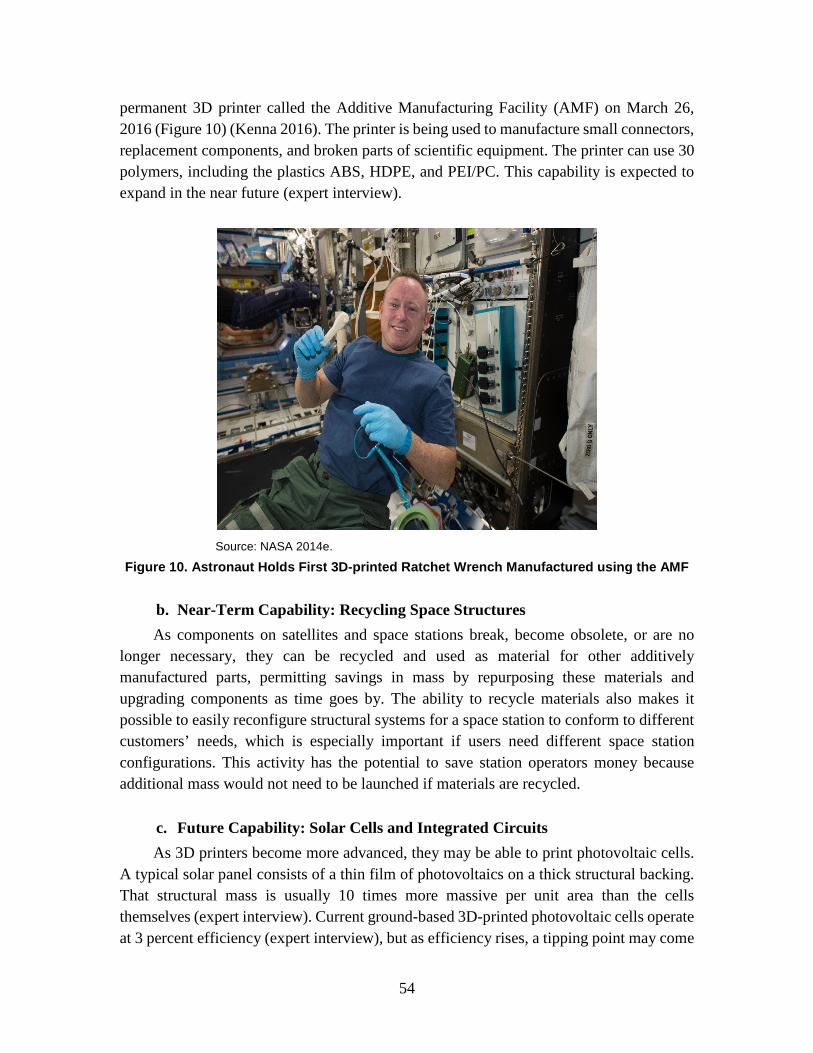
54
permanent 3D printer called the Additive Manufacturing Facility (AMF) on March 26, 2016 (Figure 10) (Kenna 2016). The printer is being used to manufacture small connectors, replacement components, and broken parts of scientific equipment. The printer can use 30 polymers, including the plastics ABS, HDPE, and PEI/PC. This capability is expected to expand in the near future (expert interview).
Source: NASA 2014e.
Figure 10. Astronaut Holds First 3D-printed Ratchet Wrench Manufactured using the AMF
b. Near-Term Capability: Recycling Space Structures As components on satellites and space stations break, become obsolete, or are no
longer necessary, they can be recycled and used as material for other additively manufactured parts, permitting savings in mass by repurposing these materials and upgrading components as time goes by. The ability to recycle materials also makes it possible to easily reconfigure structural systems for a space station to conform to different customers’ needs, which is especially important if users need different space station configurations. This activity has the potential to save station operators money because additional mass would not need to be launched if materials are recycled.
c. Future Capability: Solar Cells and Integrated Circuits As 3D printers become more advanced, they may be able to print photovoltaic cells.
A typical solar panel consists of a thin film of photovoltaics on a thick structural backing. That structural mass is usually 10 times more massive per unit area than the cells themselves (expert interview). Current ground-based 3D-printed photovoltaic cells operate at 3 percent efficiency (expert interview), but as efficiency rises, a tipping point may come

55
when cells printed in space may offer a cheaper alternative to launching solar panels manufactured on Earth. The ability to print efficient solar cells also enhances the adaptability of applications requiring power in space.
d. Future Capability: Printing Sensors and Whole Satellites The capabilities of additive manufacturing may grow to the point where complex
sensors can be 3D-printed in space. Small satellites, which would not need to be designed with enough structural material to survive a launch, could be printed and launched in swarms from a space station or loaded into a delivery vehicle. Theoretically, the AMF currently on the ISS (Figure 11) has the ability to produce 10 CubeSats per week (expert interview). More complex sensors might be manufactured more economically in space if they do not need to be tested on the ground or survive vibration tests. They could be calibrated on-orbit in the operations phase.
Source: Made In Space 2015.
Figure 11. Schematic of AMF on the ISS
e. Future Capability: Creating Space Structures With additive manufacturing, structural components for objects in space can be built
with little notice and without the need for an additional launch. A company with these capabilities on a station could flexibly support a wide variety of customers with varying demands. Structures for a private space station, if assembled in space, could be built that weigh less than if the whole structure had to be launched from the ground. For example, antennas for communications satellites are limited in size by the launch fairing and their survivability during launch. Constructing larger antennas in space allows for greater gains in capacity than would be possible without an increase in power.
Very large structures could be constructed in orbit that would otherwise be impossible to launch into space (NRC 2014). Future large space telescopes could be additively manufactured in LEO or in the location where they are to be placed. A radio telescope the
56
size of Arecibo (300-meter diameter) or larger could be manufactured in space and then assembled using the same technologies already in development for satellite antenna deployment and to manufacture space structures. If components could be assembled in space, costs could be reduced greatly.
2. Methodology for Estimating Revenues To estimate the potential revenue generated by a 3D printer onboard a station for
activities discussed only in the current capabilities subsection (page 53), we used the prices for 3D printing jobs currently being charged by Made In Space and Lowe’s. These prices range from $5,000 to $10,000 for a simple print job to $30,000 to $50,000 for a complicated design (expert interview). Averaging these two ranges yields an average price of $7,500 for a simple job and $40,000 for a complex job. The 3D printer on station is booked for the next six months (expert interview). We assume demand remains at this level over the timeframe of interest, and the operator of the station can charge similar prices. One printer is assumed to have the capacity to produce one job per day, on average (expert interview). Thus, we assume a total of 365 jobs per year per printer. We assume there will be one printer on station, although more could be added. We assume that most jobs would be small, such as simple tools and components, and a few would be larger; we estimate 20 to 40 percent of all 3D printing jobs would be complicated jobs. We also assume that the space station provides power as part of the services it provides in exchange for lease payments. As power is generated by solar panels, there are no variable costs of providing power, only the fixed costs of procuring and installing the panels.
3. Results For our low estimate, we assume that 20 percent of all 3D printing jobs are
complicated jobs costing $40,000 each and the remaining 80 percent of jobs are simpler jobs costing $7,500 each, yielding a low estimate of $5.1 million in annual revenues, assuming 365 jobs per year (Table 12).
Table 12. Potential Revenues for a Private Space Station from Manufacturing Products in
Space (FY 2015)
Low Estimate High Estimate
Number of Jobs Revenue Number of Jobs Revenue Simple 292 (80% of all jobs) $2.2 M 219 (60% of all jobs) $1.6 M Complicated 73 (20% of all jobs) $2.9 M 146 (40% of all jobs) $5.8 M Total Revenue $5.1 M $7.4 M
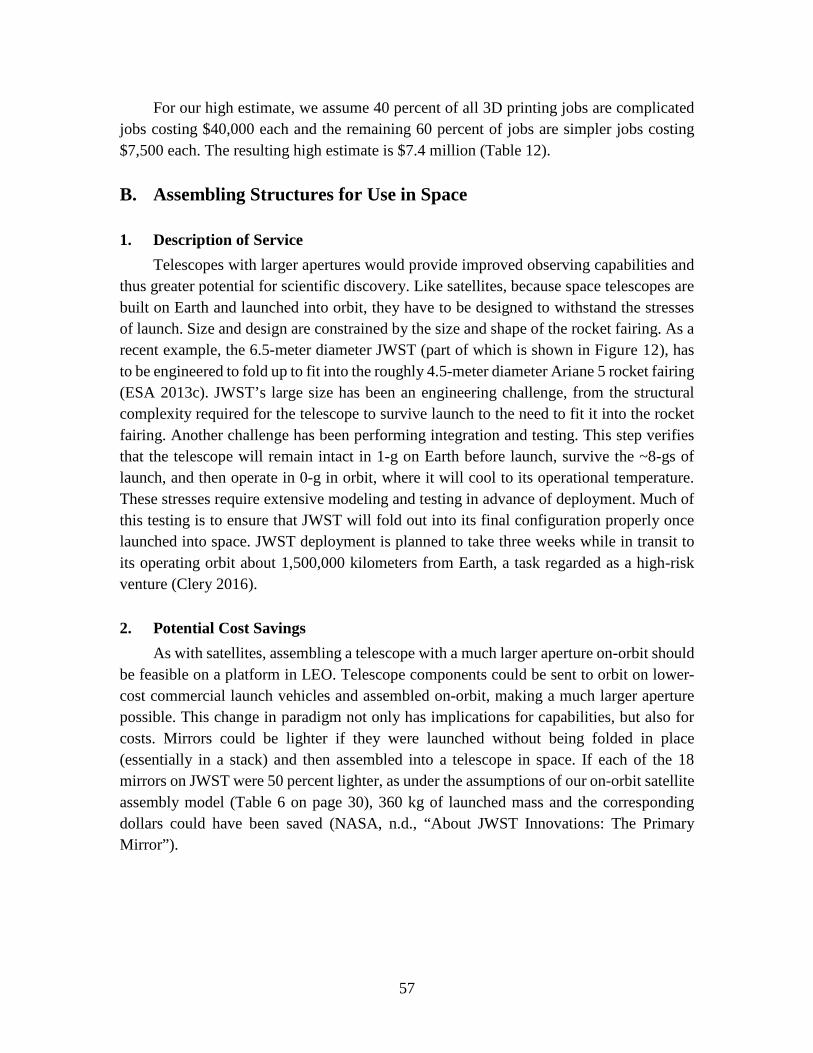
57
For our high estimate, we assume 40 percent of all 3D printing jobs are complicated jobs costing $40,000 each and the remaining 60 percent of jobs are simpler jobs costing $7,500 each. The resulting high estimate is $7.4 million (Table 12).
B. Assembling Structures for Use in Space
1. Description of Service Telescopes with larger apertures would provide improved observing capabilities and
thus greater potential for scientific discovery. Like satellites, because space telescopes are built on Earth and launched into orbit, they have to be designed to withstand the stresses of launch. Size and design are constrained by the size and shape of the rocket fairing. As a recent example, the 6.5-meter diameter JWST (part of which is shown in Figure 12), has to be engineered to fold up to fit into the roughly 4.5-meter diameter Ariane 5 rocket fairing (ESA 2013c). JWST’s large size has been an engineering challenge, from the structural complexity required for the telescope to survive launch to the need to fit it into the rocket fairing. Another challenge has been performing integration and testing. This step verifies that the telescope will remain intact in 1-g on Earth before launch, survive the ~8-gs of launch, and then operate in 0-g in orbit, where it will cool to its operational temperature. These stresses require extensive modeling and testing in advance of deployment. Much of this testing is to ensure that JWST will fold out into its final configuration properly once launched into space. JWST deployment is planned to take three weeks while in transit to its operating orbit about 1,500,000 kilometers from Earth, a task regarded as a high-risk venture (Clery 2016).
2. Potential Cost Savings As with satellites, assembling a telescope with a much larger aperture on-orbit should
be feasible on a platform in LEO. Telescope components could be sent to orbit on lower-cost commercial launch vehicles and assembled on-orbit, making a much larger aperture possible. This change in paradigm not only has implications for capabilities, but also for costs. Mirrors could be lighter if they were launched without being folded in place (essentially in a stack) and then assembled into a telescope in space. If each of the 18 mirrors on JWST were 50 percent lighter, as under the assumptions of our on-orbit satellite assembly model (Table 6 on page 30), 360 kg of launched mass and the corresponding dollars could have been saved (NASA, n.d., “About JWST Innovations: The Primary Mirror”).

58
Source: Spaceflight Insider 2015.
Figure 12. James Webb Space Telescope’s Backplane Structure
Lighter mirrors and reduced complexity result in less packaging, as much of the packaging associated with protecting the telescope during launch would no longer be necessary, saving additional mass and—by extension—potentially launch costs (expert interview). As additive manufacturing capabilities improve, it may also become possible to manufacture some of a telescope’s components (e.g., the mirror’s backplane) in space before assembling it on-orbit, further reducing the amount of packaging that has to be launched.
At the same time, on-orbit assembly of large space telescopes, as with on-orbit assembly of satellites, while potentially the only way to build future telescopes with much larger apertures, would incur substantial initial costs to develop the platform, techniques, and equipment to assemble these telescopes in space. If the telescope is assembled in space, during assembly the components need to be protected from collision with meteorites or other particles, temperature changes, atomic oxygen, radiation, and other qualities of the space environment that do not exist or are more easily controlled on Earth. A platform and the equipment for assembling a telescope in LEO would need to incorporate many features of telescope manufacturing facilities on the ground, including testing equipment, assembly support, and warehousing (expert interview). For exoplanet discovery missions, larger telescopes will be required to discover the minimum viable number of exoplanets.
59
Assembly of larger mirrors in space could increase the number of exoplanets discovered by factors of 3 to 9 and could provide statistically meaningful information. If the diameter of JWST were to be increased to discover a viable number of exoplanets and current costs extrapolated, its cost could increase by more than a factor of 4 (assuming such a large telescope could be launched at all). On-orbit assembly could also enable the construction of modularized and evolvable instruments with far more capabilities than current and proposed telescopes.
On-orbit assembly of a three-stage evolvable telescope would cost about $12.8 billion less than the traditional approach to deploying telescopes (Boyd et al. 2017). It is also important to note that deploying the telescope using the traditional approach is not even feasible, as it would require a launcher that is larger than any of the options being considered in the Space Launch System (SLS) program. Costs would likely fall for subsequent telescopes assembled in space, but the first time such an assembly would be performed would almost certainly generate unanticipated costs.
3. Results Because funding for more capable space telescopes is highly uncertain, and because
of difficulties in obtaining data on terrestrial design and assembly costs and potential savings from these costs stemming from on-orbit assembly, we found it infeasible to estimate potential revenues for this activity.
C. Summary Assuming no revenues from telescope construction, Table 13 summarizes potential
revenues from additively manufacturing components in space.
Table 13. Potential Revenues for a Private Space Station from Additive Manufacturing for
Use in Space (FY 2015)
Low Estimate High Estimate Additive Manufacturing $5.1 M $7.4 M

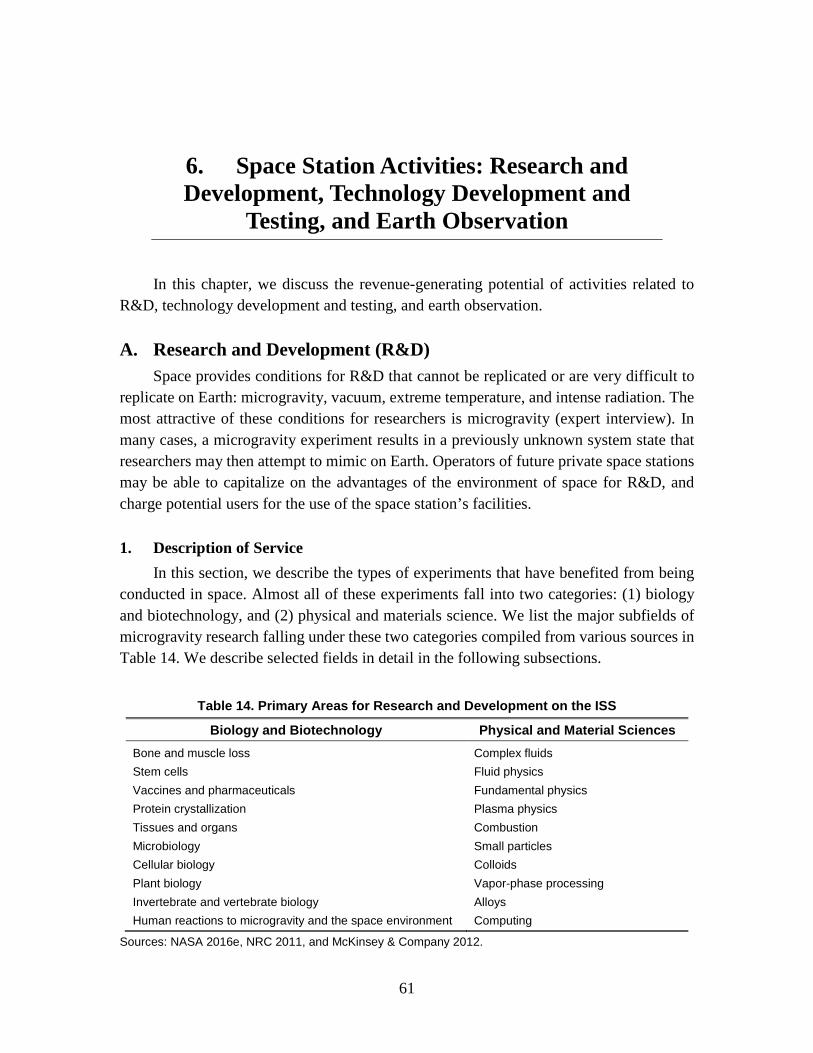
61
6. Space Station Activities: Research and Development, Technology Development and
Testing, and Earth Observation
In this chapter, we discuss the revenue-generating potential of activities related to R&D, technology development and testing, and earth observation.
A. Research and Development (R&D) Space provides conditions for R&D that cannot be replicated or are very difficult to
replicate on Earth: microgravity, vacuum, extreme temperature, and intense radiation. The most attractive of these conditions for researchers is microgravity (expert interview). In many cases, a microgravity experiment results in a previously unknown system state that researchers may then attempt to mimic on Earth. Operators of future private space stations may be able to capitalize on the advantages of the environment of space for R&D, and charge potential users for the use of the space station’s facilities.
1. Description of Service In this section, we describe the types of experiments that have benefited from being
conducted in space. Almost all of these experiments fall into two categories: (1) biology and biotechnology, and (2) physical and materials science. We list the major subfields of microgravity research falling under these two categories compiled from various sources in Table 14. We describe selected fields in detail in the following subsections.
Table 14. Primary Areas for Research and Development on the ISS
Biology and Biotechnology Physical and Material Sciences Bone and muscle loss Stem cells Vaccines and pharmaceuticals Protein crystallization Tissues and organs Microbiology Cellular biology Plant biology Invertebrate and vertebrate biology Human reactions to microgravity and the space environment
Complex fluids Fluid physics Fundamental physics Plasma physics Combustion Small particles Colloids Vapor-phase processing Alloys Computing
Sources: NASA 2016e, NRC 2011, and McKinsey & Company 2012.
62
a. Biology and Biotechnology Biology and biotechnology account for a large share of the experiments that have
been performed on the ISS (MacDonald 2014, CASIS 2016b). A 2012 report identified six specific areas of research within biology and biotechnology for which the microgravity environment has been highly beneficial: (1) osteoporosis, (2) muscle deterioration, (3) immunodeficiency, (4) antigenicity, (5) stem cells, and (6) protein crystallization (McKinsey & Company 2012).
Many biological experiments on the ISS have involved pharmaceuticals. Fosamax, a drug used to treat or prevent specific forms of osteoporosis, was tested on astronauts (Georgakas 2011). Other space-tested drugs include Prolia, which also treats bone loss, which was tested on rodents on the ISS (NASA 2016f), and Peg-Intron, which treats hepatitis C (Cozmuta et al. 2014).
Research on 3D tissue engineering on the Space Shuttle and the ISS has shown improvements in the size and quality of tissues grown in space compared to those grown on Earth. Growing tissues on Earth results in clumped, almost two-dimensional materials, while growing tissues in space results in more uniformity in three dimensions, similar to how beads produced in space are almost perfect spheres. For most organs, three-dimensional tissue engineering still tends to be at an early stage of development; the technology readiness level (TRL) of this research is low. On a scale of 1 to 10, with 10 being ready for commercial launch, in 2014, Carroll et al. (2014) rated tissue engineering to grow organs as TRL-3. According to some, growing portions of organs and muscles in microgravity on parabolic and suborbital flights has shown promise and may become commercially viable by 2024 (expert interview).
Protein crystallization can be an important step in the development of drugs and other compounds. Drugs are generally more effective if proteins incorporated into the drug closely match the docking sites on the human cells the drugs are designed to treat. Close matches between proteins and docking sites reduce side effects. On one hand, growing protein crystals in microgravity allows for larger, more perfect crystals than those grown on Earth, making it possible for researchers to gain a more precise reading of the alignment of the proteins with the docking sites, thereby resulting in fewer side effects (Figure 13). Research in microgravity on protein crystallization has already contributed to the discovery of new system states for proteins in the absence of gravity, which researchers have then been able to replicate on Earth (Pittman 2016). On the other hand, greater use of microgravity for protein crystallization may be seen as risky by pharmaceutical companies because of the costs involved in conducting such experiments on the ISS (Besha and MacDonald 2016).
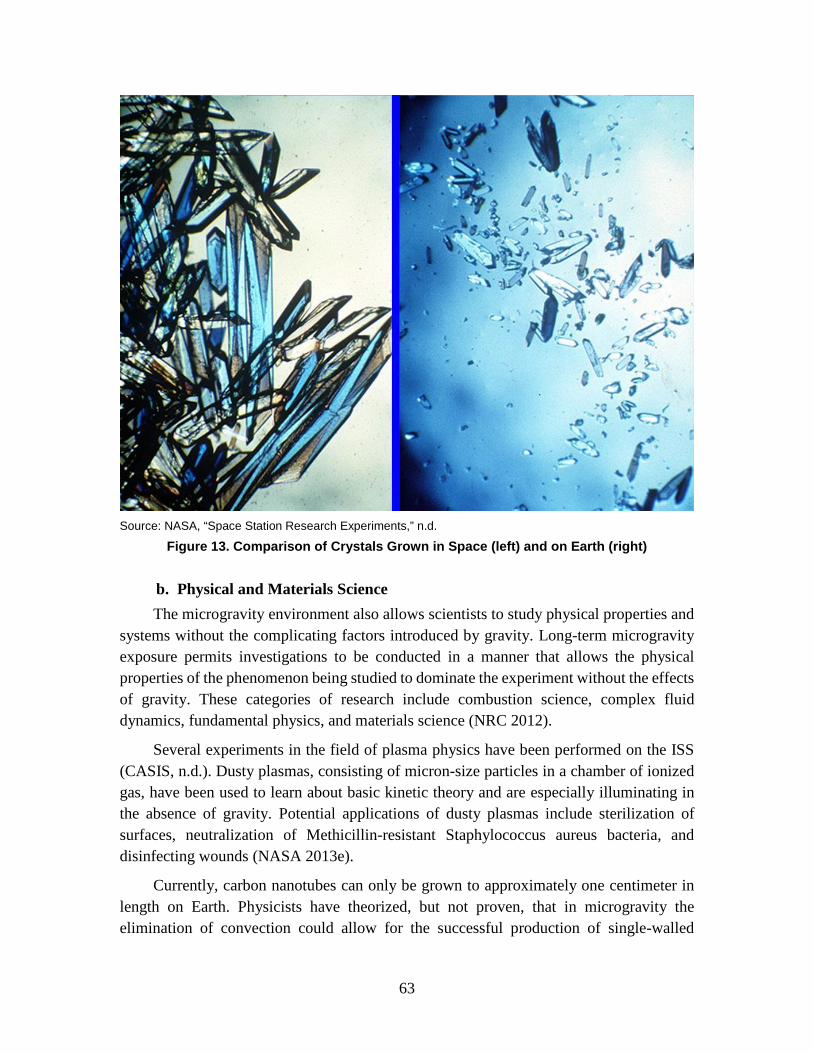
63
Source: NASA, “Space Station Research Experiments,” n.d.
Figure 13. Comparison of Crystals Grown in Space (left) and on Earth (right)
b. Physical and Materials Science The microgravity environment also allows scientists to study physical properties and
systems without the complicating factors introduced by gravity. Long-term microgravity exposure permits investigations to be conducted in a manner that allows the physical properties of the phenomenon being studied to dominate the experiment without the effects of gravity. These categories of research include combustion science, complex fluid dynamics, fundamental physics, and materials science (NRC 2012).
Several experiments in the field of plasma physics have been performed on the ISS (CASIS, n.d.). Dusty plasmas, consisting of micron-size particles in a chamber of ionized gas, have been used to learn about basic kinetic theory and are especially illuminating in the absence of gravity. Potential applications of dusty plasmas include sterilization of surfaces, neutralization of Methicillin-resistant Staphylococcus aureus bacteria, and disinfecting wounds (NASA 2013e).
Currently, carbon nanotubes can only be grown to approximately one centimeter in length on Earth. Physicists have theorized, but not proven, that in microgravity the elimination of convection could allow for the successful production of single-walled
64
carbon nanotubes longer than one centimeter (Alford, Mason, and Feikema 2001). Longer lengths of carbon nanotubes open up possibilities for spinning super strong fibers that can be used for a variety of purposes needing strength, lightness, and conductivity (Zhang et al. 2013).
2. Methodology for Estimating Revenues In contrast to the ISS and other previous government-owned space stations, a private
space station would have to generate revenues from R&D activities. It could generate revenues by leasing space for experiments and by charging for support from astronauts on board the station to run those experiments.
To generate estimates of potential revenues from leasing space for experiments or providing research support, we first evaluated the willingness and ability of institutions funding R&D activities in space to pay a space station for these services. This assessment was used to help estimate the number of experiments that a space station might accommodate over the course of a year. We then estimated a potential charge researchers might be willing and able to pay to lease space for their experiments. We also estimated likely charges for the time astronauts would spend facilitating an experiment.
Previous and current venues for conducting R&D in space, primarily the ISS, provide some information on the likely extent and costs of R&D in space. The number of experiments conducted on the ISS has been ramping up: about 250 experiments were conducted annually in recent years (MacDonald 2014).
Currently, the average cost of putting together and running an experiment on the ISS is $300,000 (expert interview). These costs of experimental design are driven by multiple factors, including (1) various science validation and feasibility tests to ensure that the experiment is designed specifically for microgravity, (2) vibration tests to ensure the experiment can withstand launch, (3) the costs of designing and manufacturing hardware for the ISS, (4) the costs of developing the procedures the astronauts will carry out, and (5) safety tests to ensure the crew’s and station’s well-being during the course of the experiment.
In addition to the costs of designing and running the experiment, each experiment incurs the additional costs of mission integration. These have averaged $450,000 per experiment (expert interview), although integration costs vary depending on the type of experiment. Based on the experience of the ISS, on average the total cost of designing, building, and integrating an experiment is $750,000 ($300,000 to design and build the experiment and $450,000 for integrating it for launch). Assuming an experiment and all accompanying packaging and support equipment weighs about 5 kg, launch costs would
65
add an additional $100,000 (using launch costs of $20,000 per kg), for a total cost of an average experiment of $850,000.15
If required to cover the entire cost of an experiment on a space station, it is unclear whether commercial entities would be willing to pay the aforementioned $850,000. Until now, research on the ISS has been funded by the United States or foreign governments. Most private sector funding has been in the form of contributions in kind, such as the costs of corporate research staff, experiment design and construction, and other expenses (NASA 2011, 19). In all instances, the entire costs of transport to the ISS and use of the ISS have been covered by NASA (NASA 2011, 19). According to NASA, “it is unclear if any of this research would have been conducted had the government financial contribution not existed” (NASA 2011, 19).
Interviews conducted for this project support these findings from earlier NASA reports. In fact, if researchers had to cover all the costs of their experiments from funding other than from NASA, it is reasonable to believe that demand for experiments on a space station would be lower. We were informed by a researcher at a large pharmaceutical company that most of the company’s experiments on Earth cost on the order of $50,000 to $60,000 (expert interview). Even under the current situation, in which NASA covers most of the costs of an experiment, the pharmaceutical company finds a contribution of $100,000 towards an experiment on the ISS to be substantial and a constraint on additional research projects. The company’s R&D division has conducted three microgravity experiments on the ISS through 2016, compared to hundreds of other experiments. The amount of researcher time and costs of experiment design would likely discourage this pharmaceutical company from conducting experiments on a future space station. For these reasons, the private sector would be unlikely to be able to shoulder the full costs of R&D on a private space station without a marked reduction in experiment, integration, and launch costs.
Total costs of an experiment would likely fall in the event of a privately owned and operated space station. Although we believe that the costs of designing and setting up an experiment for a space station are unlikely to fall, continuing to average $300,000 per experiment, a number of interviewees have argued that there is substantial room for economies in integration costs. They point to expected reductions in launch preparation costs as an analogy. One knowledgeable member of the industry has argued that the time to prepare a rocket launch is likely to halve in the coming years, as launch providers
15 Because launch costs are so expensive, researchers try to minimize weight. To save on astronaut time
and to make sure there is sufficient space for the experiment, researchers also try to automate the experiment and reduce the volume needed for the experiment on the space station. Consequently, many recent experiments are quite small in terms of volume and mass. These experiments still need to be prepared for launch, which adds to mass. In addition, experiments involving animals or equipment are much heavier than 5 kg. For these reasons, we have assumed an average launch weight per experiment of 5 kg.

66
improve their operations and reuse rocket stages (Bruno 2016). Commensurate reductions in integration costs are likely. With improved institutional knowledge for experiment integration and shorter lag times between flights, experiment integration costs for a privately owned and operated space station could decrease to half of current levels, or $225,000 as opposed to $450,000. But the average mass of an experiment is unlikely to change, at 5 kg per experiment, including wrappings for launch. Employing our estimate of future flight costs of $20,000 per kg, launch costs would add an additional $100,000 to experiment costs. Under these assumptions, companies or government agencies that fund research would have to cover $625,000 in costs ($300,000 + $225,000 + $100,000) to launch an experiment to a private space station.
Research organizations that use a privately owned and operated space station would presumably have to find funding to cover the full cost of their experiments, including launch and integration costs currently picked up by NASA. These costs, unless covered under expanded grants, will constrain the number of experiments that would be conducted on a private space station. In contrast, some have argued that if R&D projects were handled more efficiently and R&D in space were marketed much more aggressively, 1,000 R&D projects could be conducted on a private space station (expert interview). For this analysis, we took the middle ground, and assumed that a private space station would host 250 projects per year, the current number hosted by the ISS.
This number of experiments is also consistent with the likely amount of astronaut time that would be available for running experiments on a private space station. The ISS currently allocates 35 hours per week for experiments (expert interview), equivalent to about all the time available for these types of activities for one astronaut. For a space station smaller than the ISS with only two astronauts available, allocating more time than this to R&D would be difficult.
We next endeavored to estimate how much revenue per experiment could be generated for the space station owners from hosting and supporting experiments. We recognize that researchers are very cost-sensitive. As a consequence, we assume that a private space station would have to limit its charges for hosting an experiment to a modest increment to the total average costs of the experiments; otherwise, using the space station for experiments would become prohibitively expensive. Accordingly, we assume that the charge for leasing space could be at most 10 percent of the average cost of experiments, or $62,500 (10 percent of $625,000). For our low estimate, we assume the space station is only able to charge 5 percent of the average cost of experiments, or $31,250. A higher charge is assumed to price the space station out of the research market.
We assume that most experiments would be heavily automated, but that each experiment would still require an hour of astronaut time. This hour of astronaut time added to charges for hosting an experiment leads to total revenue for the station of roughly
67
$70,000 ($31,250 plus $38,000) for our low estimate and roughly $100,000 ($62,500 plus 38,000) for our high estimate per experiment.
3. Results We assume that the number of experiments on a private station will remain the same
as the current rate of R&D on the ISS: 250 experiments per year. Assuming $70,000 to $100,000 per experiment leads to $17.4 million in revenues per year for the low estimate and $25.2 million in revenues per year for the high estimate.
4. Alternatives Opinions of interviewees differed as to the extent that parabolic or suborbital flights
could substitute for running experiments on a space station. Some physical scientists argued that running experiments on sounding rockets, balloons, or other alternatives are satisfactory substitutes for experiments conducted on the ISS. Others, especially biologists, argued that they needed an extended period in microgravity to conduct their experiments. Some interviewees argued that changes that occur in a system during the transition to and from microgravity have not been well studied; suborbital flights provide an environment for such investigations (expert interview). Many noted that a space station in LEO is especially important for learning about the effects of microgravity and the space environment on the human body over the long-term (expert interview). Some researchers suggested the importance of testing hypotheses using parabolic or suborbital flights before running a full experiment on the ISS (expert interview). Others have found that downgrading their experiment from suborbital flights to parabolic flights is more cost-effective (expert interview; ACME 2016). Use of suborbital or parabolic flights may become even more common if researchers are unable to shoulder the full cost of conducting their experiments on a space station.
A private space station could face competition for hosting experiments from the upcoming Chinese space station (Jones 2016). The Chinese plan to conduct their own experiments on their new station and let others do so—potentially at no or low cost—as well (Aron 2016).
B. Technology Development and Testing
1. Description of Service A space station provides a unique test bed for technologies that need to operate
reliably in space or harsh environments on Earth. Space stations offer environments for testing equipment, especially for use on satellites, spacecraft, or a space station, in microgravity, high radiation, or other space environments over extended periods of time and where tests can be closely monitored. Testing technologies in space allows developers
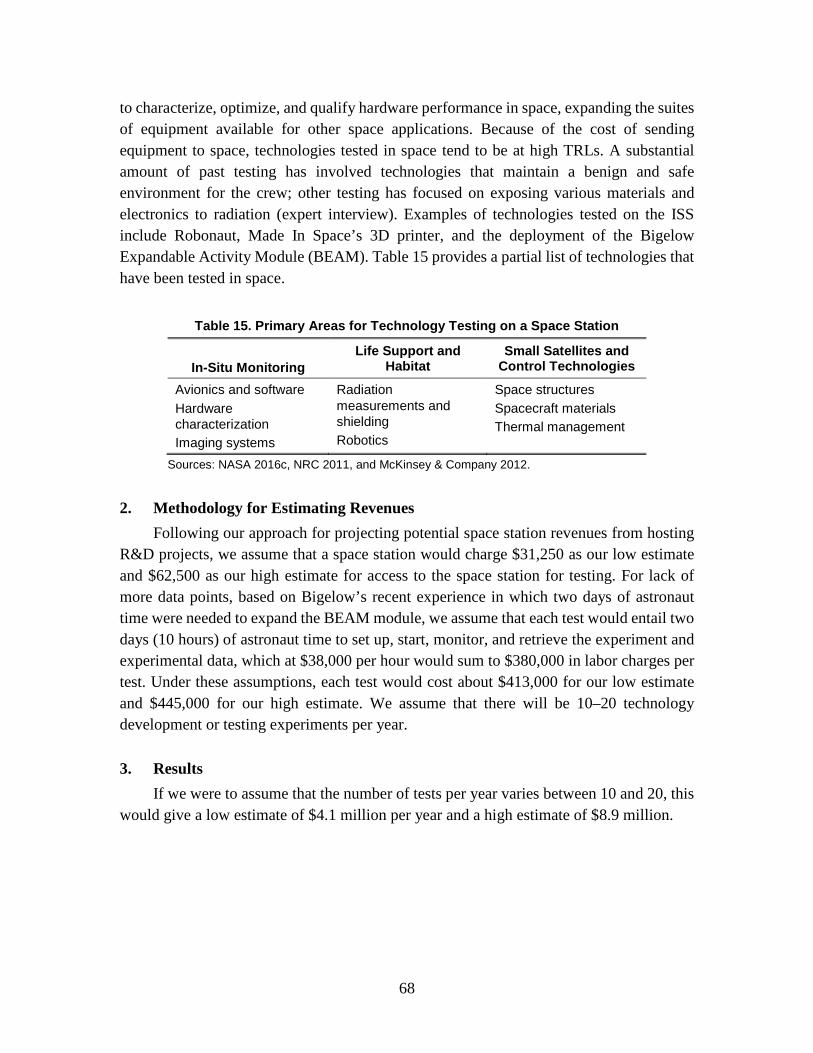
68
to characterize, optimize, and qualify hardware performance in space, expanding the suites of equipment available for other space applications. Because of the cost of sending equipment to space, technologies tested in space tend to be at high TRLs. A substantial amount of past testing has involved technologies that maintain a benign and safe environment for the crew; other testing has focused on exposing various materials and electronics to radiation (expert interview). Examples of technologies tested on the ISS include Robonaut, Made In Space’s 3D printer, and the deployment of the Bigelow Expandable Activity Module (BEAM). Table 15 provides a partial list of technologies that have been tested in space.
Table 15. Primary Areas for Technology Testing on a Space Station
In-Situ Monitoring Life Support and
Habitat Small Satellites and
Control Technologies
Avionics and software Hardware characterization Imaging systems
Radiation measurements and shielding Robotics
Space structures Spacecraft materials Thermal management
Sources: NASA 2016c, NRC 2011, and McKinsey & Company 2012.
2. Methodology for Estimating Revenues Following our approach for projecting potential space station revenues from hosting
R&D projects, we assume that a space station would charge $31,250 as our low estimate and $62,500 as our high estimate for access to the space station for testing. For lack of more data points, based on Bigelow’s recent experience in which two days of astronaut time were needed to expand the BEAM module, we assume that each test would entail two days (10 hours) of astronaut time to set up, start, monitor, and retrieve the experiment and experimental data, which at $38,000 per hour would sum to $380,000 in labor charges per test. Under these assumptions, each test would cost about $413,000 for our low estimate and $445,000 for our high estimate. We assume that there will be 10–20 technology development or testing experiments per year.
3. Results If we were to assume that the number of tests per year varies between 10 and 20, this
would give a low estimate of $4.1 million per year and a high estimate of $8.9 million.

69
C. Earth Observation and Remote Sensing
1. Description of Service A space station in LEO can engage in earth observation and remote sensing like more
traditional satellites. The ISS has provided a platform for several sensors. The Window Observational Research Facility is a highly stable internally mounted platform that holds cameras and sensors steady. The International Space Station Agricultural Camera collects multispectral data supporting agricultural activities and related research in the Upper Midwest of the United States. The Hyperspectral Imager for the Coastal Oceans collects high-quality information in 87 bands over the visible and near-infrared wavelengths on water clarity, bottom materials, bathymetry, and on-shore vegetation along the coasts of Earth’s oceans at approximately 90 meters per pixel. The SERVIR Environmental Research and Visualization System is a planned sensor system consisting of a Schmidt-Cassegrain telescope paired with a digital camera system to collect visible-wavelength imagery at ground resolutions of less than 3 meters per pixel (NASA 2013b). It provides state-of-the-art, satellite-based Earth monitoring, imaging and mapping data, geospatial information, and predictive models and science applications to help improve environmental decision-making among developing nations in eastern and southern Africa, the Hindu-Kush region of the Himalayas, and the lower Mekong River Basin in Southeast Asia. The ISS has also served as a platform for space awareness, as sensors have been installed to look out at space as well as towards Earth. In short, the ISS has provided a platform for visual, infrared, and ultraviolet Earth observation, remote sensing using radar, and space awareness. In each of these cases, the ISS provides power, command, data, and cooling connections. Because of its location and potential disruptions to service from other activities on the station, the ISS has not been used for commercial telecommunications.
By providing a platform for earth observation and remote sensing functions, a future private space station could generate cost savings for satellite operators compared to launching individual satellites. Operators would not need to develop or construct a satellite bus, as they could tap into existing power and data systems on the space station, paying for incremental additions to the capacity of these systems rather than building stand-alone systems for a satellite. By eliminating the mass associated with the bus, launch costs would also be less.
2. Methodology for Estimating Revenues The space station could capture as rent some or all of the savings in costs enjoyed by
satellite operators, because they will not have to purchase a stand-alone satellite for their payloads. Since the station would likely be providing Earth observation services as a secondary service (meaning the station would not be launched just to provide them), most of the costs of operation could be absorbed by the station’s other primary functions.
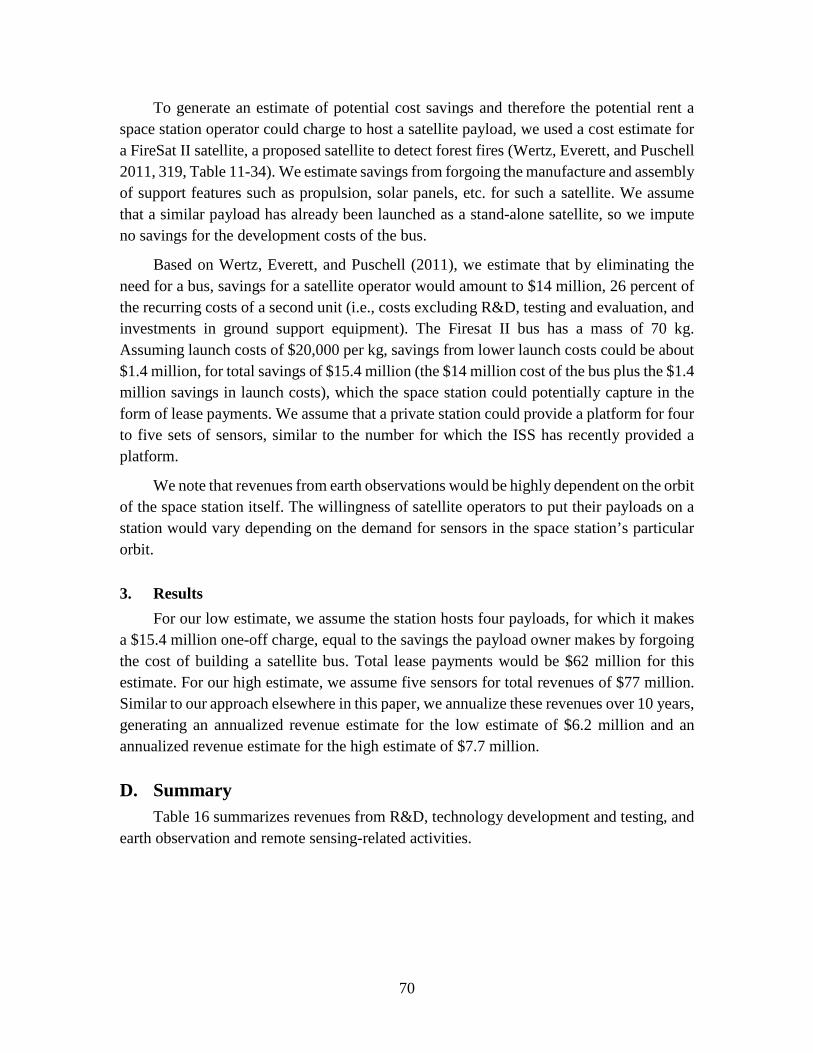
70
To generate an estimate of potential cost savings and therefore the potential rent a space station operator could charge to host a satellite payload, we used a cost estimate for a FireSat II satellite, a proposed satellite to detect forest fires (Wertz, Everett, and Puschell 2011, 319, Table 11-34). We estimate savings from forgoing the manufacture and assembly of support features such as propulsion, solar panels, etc. for such a satellite. We assume that a similar payload has already been launched as a stand-alone satellite, so we impute no savings for the development costs of the bus.
Based on Wertz, Everett, and Puschell (2011), we estimate that by eliminating the need for a bus, savings for a satellite operator would amount to $14 million, 26 percent of the recurring costs of a second unit (i.e., costs excluding R&D, testing and evaluation, and investments in ground support equipment). The Firesat II bus has a mass of 70 kg. Assuming launch costs of $20,000 per kg, savings from lower launch costs could be about $1.4 million, for total savings of $15.4 million (the $14 million cost of the bus plus the $1.4 million savings in launch costs), which the space station could potentially capture in the form of lease payments. We assume that a private station could provide a platform for four to five sets of sensors, similar to the number for which the ISS has recently provided a platform.
We note that revenues from earth observations would be highly dependent on the orbit of the space station itself. The willingness of satellite operators to put their payloads on a station would vary depending on the demand for sensors in the space station’s particular orbit.
3. Results For our low estimate, we assume the station hosts four payloads, for which it makes
a $15.4 million one-off charge, equal to the savings the payload owner makes by forgoing the cost of building a satellite bus. Total lease payments would be $62 million for this estimate. For our high estimate, we assume five sensors for total revenues of $77 million. Similar to our approach elsewhere in this paper, we annualize these revenues over 10 years, generating an annualized revenue estimate for the low estimate of $6.2 million and an annualized revenue estimate for the high estimate of $7.7 million.
D. Summary Table 16 summarizes revenues from R&D, technology development and testing, and
earth observation and remote sensing-related activities.
71
Table 16. Potential Revenues for a Private Space Station from R&D-related Activities (FY15 Millions of Dollars)
Activity Low ($M) High ($M) R&D in space $17 $25 Technology testing $4 $9 Earth observation $6 $8 Total $28 $42
Note: Totals may not sum exactly due to rounding.

73
7. Space Station Activities: Media, Advertising, and Education
This chapter estimates potential revenue streams for a private space station that could be generated from film and video, advertising, naming rights, sponsored events, and educational activities. In many cases, terrestrial analogues were used to estimate potential revenues from these markets for a private space station in LEO. The chapter was developed with input and review from experts at the global communications and advertising agency firm Saatchi & Saatchi in New York.
A. Feature Films and Documentaries
1. Description of Service A privately owned and operated space station could be used to shoot films, just as
IMAX Corporation and NASA have had a long-standing partnership to shoot scenes on the ISS for documentary movies. Over the past 15 years, Space Station 3D, Hubble 3D, Journey to Space, and most recently, A Beautiful Planet, were shot in space using the ISS, providing millions of people with the opportunity to travel to space virtually. Several educational films have also been made in space or have used footage filmed on the ISS.
A private space station could continue to provide IMAX and educational filmmakers with a venue for films shot in space, but at a charge to the filmmakers. A station could also be used for feature films, which up to this point in time have had to use other alternatives to simulate scenes in space. For example, Apollo 13 was the first movie to use NASA’S KC-135 plane to simulate weightlessness by flying in parabolic patterns (Figure 14). In fact, Apollo 13 required 612 flights for scenes simulating weightlessness, which amounted to nearly four hours of filming time (Moviefone 2013). Instead of parabolic flights, the movie Gravity used computerized backdrops and other special effects to give its characters the appearance of weightlessness. This approach required a year of pre-visualization before filming began, special lighting effects, and additional time editing in post-production (Boyle 2013). Another feature film, Avatar, which was set on a fictional distant moon, Pandora, also featured scenes in outer space. About 85 percent of the film relied on computer-generated environments; the remainder of the movie used traditional sets (Thompson 2010). After filming was completed, the digital effects team spent a year editing the movements and expressions of the virtual characters at a substantial cost in terms of all of the pre- and post-production activities and equipment (Thompson 2010).
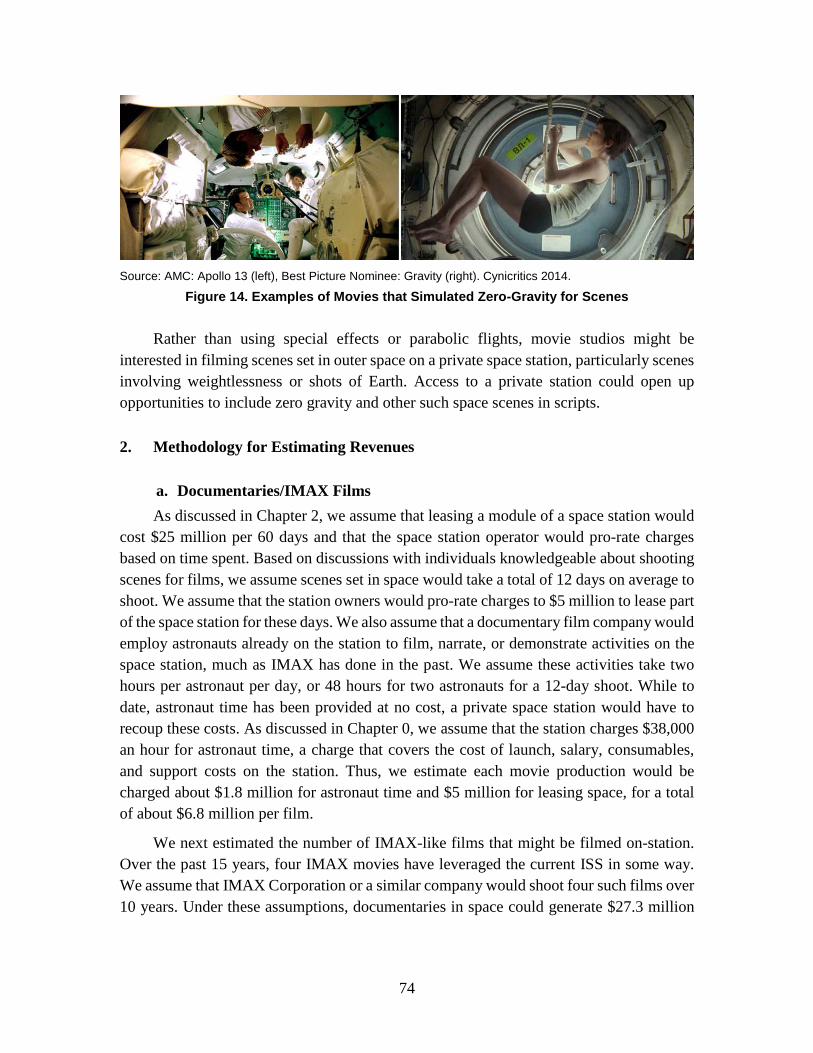
74
Source: AMC: Apollo 13 (left), Best Picture Nominee: Gravity (right). Cynicritics 2014.
Figure 14. Examples of Movies that Simulated Zero-Gravity for Scenes
Rather than using special effects or parabolic flights, movie studios might be interested in filming scenes set in outer space on a private space station, particularly scenes involving weightlessness or shots of Earth. Access to a private station could open up opportunities to include zero gravity and other such space scenes in scripts.
2. Methodology for Estimating Revenues
a. Documentaries/IMAX Films As discussed in Chapter 2, we assume that leasing a module of a space station would
cost $25 million per 60 days and that the space station operator would pro-rate charges based on time spent. Based on discussions with individuals knowledgeable about shooting scenes for films, we assume scenes set in space would take a total of 12 days on average to shoot. We assume that the station owners would pro-rate charges to $5 million to lease part of the space station for these days. We also assume that a documentary film company would employ astronauts already on the station to film, narrate, or demonstrate activities on the space station, much as IMAX has done in the past. We assume these activities take two hours per astronaut per day, or 48 hours for two astronauts for a 12-day shoot. While to date, astronaut time has been provided at no cost, a private space station would have to recoup these costs. As discussed in Chapter 0, we assume that the station charges $38,000 an hour for astronaut time, a charge that covers the cost of launch, salary, consumables, and support costs on the station. Thus, we estimate each movie production would be charged about $1.8 million for astronaut time and $5 million for leasing space, for a total of about $6.8 million per film.
We next estimated the number of IMAX-like films that might be filmed on-station. Over the past 15 years, four IMAX movies have leveraged the current ISS in some way. We assume that IMAX Corporation or a similar company would shoot four such films over 10 years. Under these assumptions, documentaries in space could generate $27.3 million
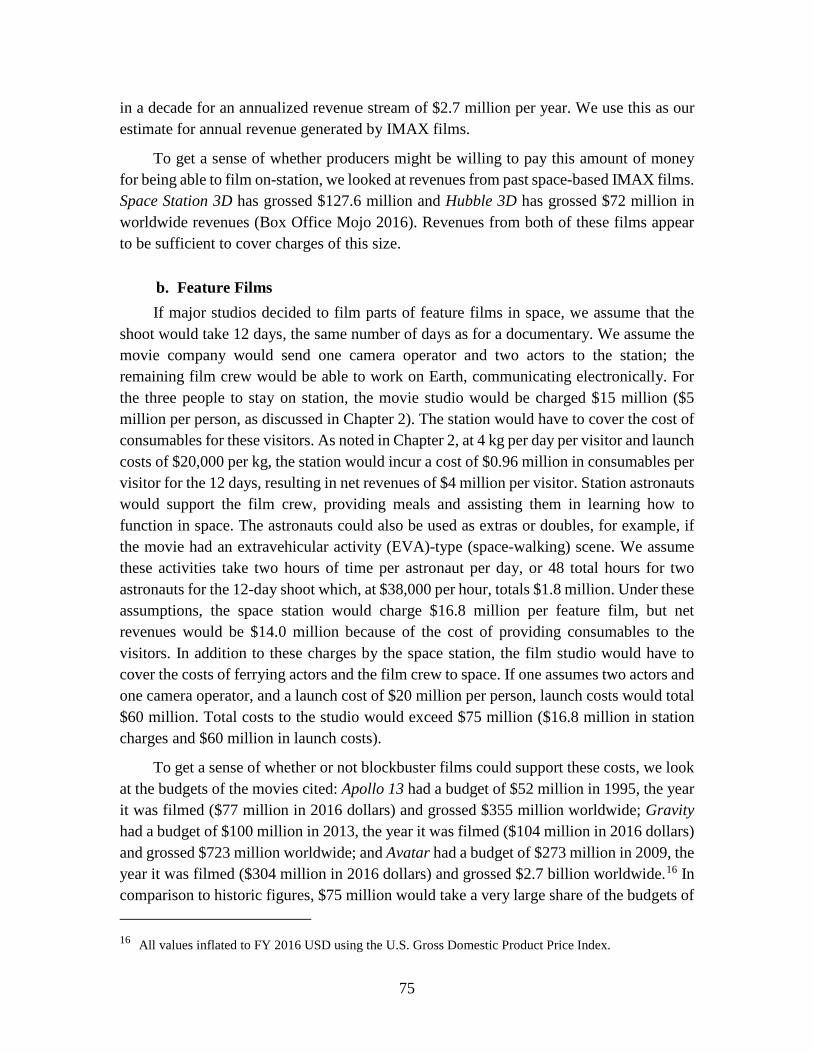
75
in a decade for an annualized revenue stream of $2.7 million per year. We use this as our estimate for annual revenue generated by IMAX films.
To get a sense of whether producers might be willing to pay this amount of money for being able to film on-station, we looked at revenues from past space-based IMAX films. Space Station 3D has grossed $127.6 million and Hubble 3D has grossed $72 million in worldwide revenues (Box Office Mojo 2016). Revenues from both of these films appear to be sufficient to cover charges of this size.
b. Feature Films If major studios decided to film parts of feature films in space, we assume that the
shoot would take 12 days, the same number of days as for a documentary. We assume the movie company would send one camera operator and two actors to the station; the remaining film crew would be able to work on Earth, communicating electronically. For the three people to stay on station, the movie studio would be charged $15 million ($5 million per person, as discussed in Chapter 2). The station would have to cover the cost of consumables for these visitors. As noted in Chapter 2, at 4 kg per day per visitor and launch costs of $20,000 per kg, the station would incur a cost of $0.96 million in consumables per visitor for the 12 days, resulting in net revenues of $4 million per visitor. Station astronauts would support the film crew, providing meals and assisting them in learning how to function in space. The astronauts could also be used as extras or doubles, for example, if the movie had an extravehicular activity (EVA)-type (space-walking) scene. We assume these activities take two hours of time per astronaut per day, or 48 total hours for two astronauts for the 12-day shoot which, at $38,000 per hour, totals $1.8 million. Under these assumptions, the space station would charge $16.8 million per feature film, but net revenues would be $14.0 million because of the cost of providing consumables to the visitors. In addition to these charges by the space station, the film studio would have to cover the costs of ferrying actors and the film crew to space. If one assumes two actors and one camera operator, and a launch cost of $20 million per person, launch costs would total $60 million. Total costs to the studio would exceed $75 million ($16.8 million in station charges and $60 million in launch costs).
To get a sense of whether or not blockbuster films could support these costs, we look at the budgets of the movies cited: Apollo 13 had a budget of $52 million in 1995, the year it was filmed ($77 million in 2016 dollars) and grossed $355 million worldwide; Gravity had a budget of $100 million in 2013, the year it was filmed ($104 million in 2016 dollars) and grossed $723 million worldwide; and Avatar had a budget of $273 million in 2009, the year it was filmed ($304 million in 2016 dollars) and grossed $2.7 billion worldwide.16 In comparison to historic figures, $75 million would take a very large share of the budgets of 16 All values inflated to FY 2016 USD using the U.S. Gross Domestic Product Price Index.

76
even major blockbuster films. The benefits from filming on a space station, eliminating the time and resources it takes to produce weightlessness effects digitally and the publicity from sending actors into space might more than compensate for these additional costs. Based on these costs, however, past numbers of space-based feature films, the difficulties of preparing for and filming in space, and the likelihood that some actors (or their agents) would be reluctant to be sent into space, we assume that it would be unlikely for more than one feature film per year (10 per decade) to be filmed on a space station. Under these assumptions, net revenues for a private space station (charges minus cost of consumables) from feature films in space might be $14.0 million for one film per year for our high estimate. For our low estimate we assume four feature films per decade, the same rate of production as assumed for documentaries mentioned. Annualized, this would produce $5.6 million per year in revenues for the space station.
3. Results If we assume that a space station would host both four documentaries every 10 years
and a feature film every year, our high estimate of potential net revenues from films would be $16.7 million per year on average ($2.7 million from the documentaries plus $14.0 million from feature films). For the low estimate, we assume four documentaries and four feature films in a decade, resulting in annualized revenue of $8.3 million ($2.7 million from documentaries plus $5.6 million from feature films).
4. Alternatives Film studios will continue to have options other than filming in space. Advances in
computer-generated imagery make it less important for directors to film on location. Images of actors can be integrated into shots of the space station taken by astronauts on board or studios can create their own mock-ups of space stations.
B. Advertising: Commercials and Product Placement
1. Description of Service While restrictions on promoting or endorsing commercial products have precluded
NASA from generating revenues from advertising or engaging in product placement (such as that depicted in Figure 15), a future private space station could generate revenues from these sources (Besha and MacDonald 2016). Some companies have already found space stations to be attractive venues for advertising. In 1997, for example, Pepsi paid over $1 million to have Russian cosmonauts on the Russian space station, Mir, pose with an inflatable replica of a Pepsi Cola can and film a four-hour spacewalk with the inflatable model (Borg 1996). Pizza Hut has also advertised in space: in 2001, they spent $1 million to put a logo on the side of a Proton launcher headed for the ISS, and in 2002, the company
77
arranged to deliver ready-made pizzas to cosmonauts on the ISS. Similarly, Kodak put its logo and a slogan onto a material being tested on the outside of the ISS. In 2001, Radio Shack and Popular Mechanics magazine also advertised on the ISS through the Russian space agency (NASA 2011). Bigelow Aerospace has arranged to take photos of company logos inside its Genesis I module.
Source: Inspiration Room 2011.
Figure 15. Space-Based Advertising
Commercials in space along with product placements provide companies with global exposure and the opportunity to lay claims to having a presence in space. According to professionals from the advertising industry, if options open up for filming commercials or product placements in space, there would likely be an initial surge in interest from companies eager to be the first (Saatchi & Saatchi 2016). From interviews with experts, we understand that ongoing demand for space station-based advertising and product placement would need sustained consumer interest in the space station and activities taking place on it (expert interview). Some venues go in and out of style whereas others, like the Statue of Liberty or the Grand Canyon, have become iconic. A private space station could fall into either category.
2. Methodology for Estimating Revenues Before estimating the revenues commercials might bring to the space station, we first
looked at past budgets of major commercials to understand how much advertisers might be willing to pay to use a space station to film a commercial. Most commercials cost much less than $10 million to produce, although a few have cost more; only larger companies are typically willing to approach the $10 million production mark (expert interview), and very few have been willing to exceed it. The most expensive commercial in history that we
78
found was an advertisement for the perfume Chanel No. 5. The commercial, which featured actress Nicole Kidman, cost Chanel $33 million, including approximately $3 million for Kidman’s time (Laya 2011). Shorter cuts of the full-length commercial were shown in a variety of venues. Guinness spent $16 million for a commercial that first aired in 2007 to celebrate the 80th year of its marketing history. Aviva, a British insurance company, spent $13.4 million in 2008 for a commercial advertising its name change from Norwich Union (Laya 2011).
In light of the $20 million needed to launch a single person into space, we believe that advertisers would be unwilling to cover the costs of sending actors or a camera operator to the ISS. They might be willing to pay the space station owner for an astronaut’s time to help film a commercial. We assume that each commercial would require one astronaut to spend 12 hours for filming, which at $38,000 per hour would generate $460,000 per commercial for the station. We assume, for our low estimate, that one company each year would be willing to pay to film a commercial on a space station; for the high estimate, we assume six commercials are filmed annually.
3. Results Based on these assumptions, for our low estimate, the space station would generate a
potential $0.46 million in revenue annually. For the high estimate, the station would generate $2.8 million in revenue annually.
C. Sponsorships
1. Description of Service Companies could pay to be an official sponsor or provider for the space station
(Saatchi & Saatchi 2016). Sponsorships are distinct from product placements in that the former represents longer-term engagements in which the company wishes to seek a brand association with its partner (in this case, the space station). Companies are motivated to sponsor events or link themselves to venues to improve their brand equity by creating associations between the brand and the event or venue (Saatchi & Saatchi 2016). Sponsorship agreements provide companies with additional opportunities to leverage their partnerships. For example, the credit card company, Visa, a global sponsor of the Olympics, uses its status as the only credit card accepted at the Olympic Games as a marketing tool. In 2012, the London Olympic Games reached 3.6 billion people in 220 countries and territories (Olympic.org 2016). Sponsors of the 2016 Rio de Janeiro Olympic Games were guaranteed 2,084 hours of Olympic coverage on National Broadcasting Corporation Universal and 4,500 hours of digital streaming (Olympic.org 2016). In addition, they were associated with the well-established prestige of the Olympic name and were able to use well-recognized Olympic intellectual property, such as the Olympic rings
79
and terms like “Rio 2016” and “Gold” (Heitner 2012). Sponsorships can be a highly cost-effective means of building a brand. Procter & Gamble has reported an estimated return on investment on a $100 million sponsorship of $500 million, a five-fold rate of return (Saatchi & Saatchi 2016).
A private space station could charge companies for sponsorships. Sponsorships could involve placing the company’s logo on the space station and using the station’s name. Companies interested in branding themselves as innovative or technologically driven would likely find sponsoring the space station particularly beneficial (Saatchi & Saatchi 2016). Companies might wish to position themselves as the official provider of a product for the space station. For example, a cereal company might wish to be the official provider of breakfast to astronauts on the station. The cereal company would be able to leverage the space station name and prestige while also benefiting from footage of astronauts eating its product.
2. Methodology for Estimating Revenues Global partners for the Olympics are believed to pay $200 million for a four-year
agreement, which spans one Summer Olympics and one Winter Olympics (Heitner 2012). The Olympics represents the top echelon of sponsorship deals in terms of high visibility. Sponsors are unlikely to be willing to pay an equivalent amount to sponsor a commercial space station unless the station first establishes itself in the marketing arena.
Other venues, such as golf tournaments, may represent more realistic analogies to sponsorships with a space station. Sponsors of golf tournaments pay between $8 million and $13 million; marketing partners pay $1 million to $40 million (Saatchi & Saatchi 2016). To estimate potential revenues from sponsorships for a private space station, we assume that initial sponsors would pay the low end of this range, or $8 million per year to sponsor a space station. Major events such as the Professional Golf Association tournament, the Super Bowl, and the Olympics usually have at least 10 sponsors. We assume a station may similarly have up to four sponsors.
3. Results For our low estimate, we assume one sponsor for the space station, generating $8
million per year. For our high estimate, we assume four sponsors, each selling very different products, resulting in annual revenues of $32 million per year.
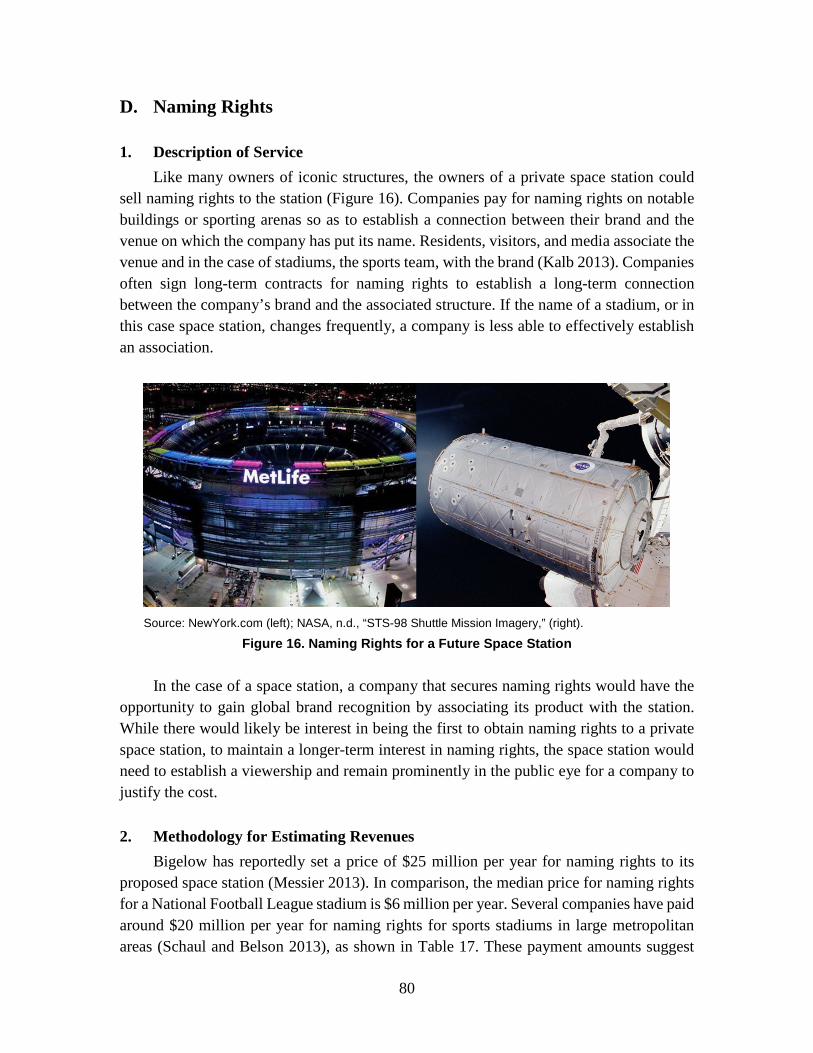
80
D. Naming Rights
1. Description of Service Like many owners of iconic structures, the owners of a private space station could
sell naming rights to the station (Figure 16). Companies pay for naming rights on notable buildings or sporting arenas so as to establish a connection between their brand and the venue on which the company has put its name. Residents, visitors, and media associate the venue and in the case of stadiums, the sports team, with the brand (Kalb 2013). Companies often sign long-term contracts for naming rights to establish a long-term connection between the company’s brand and the associated structure. If the name of a stadium, or in this case space station, changes frequently, a company is less able to effectively establish an association.
Source: NewYork.com (left); NASA, n.d., “STS-98 Shuttle Mission Imagery,” (right).
Figure 16. Naming Rights for a Future Space Station
In the case of a space station, a company that secures naming rights would have the opportunity to gain global brand recognition by associating its product with the station. While there would likely be interest in being the first to obtain naming rights to a private space station, to maintain a longer-term interest in naming rights, the space station would need to establish a viewership and remain prominently in the public eye for a company to justify the cost.
2. Methodology for Estimating Revenues Bigelow has reportedly set a price of $25 million per year for naming rights to its
proposed space station (Messier 2013). In comparison, the median price for naming rights for a National Football League stadium is $6 million per year. Several companies have paid around $20 million per year for naming rights for sports stadiums in large metropolitan areas (Schaul and Belson 2013), as shown in Table 17. These payment amounts suggest
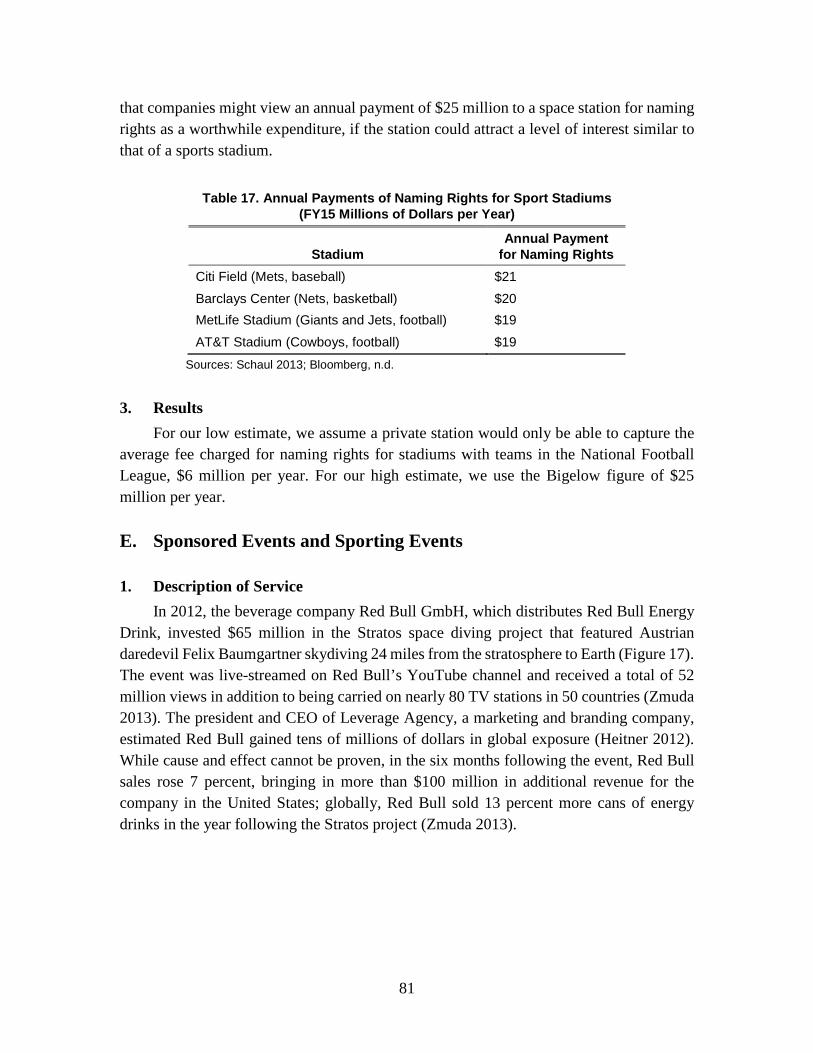
81
that companies might view an annual payment of $25 million to a space station for naming rights as a worthwhile expenditure, if the station could attract a level of interest similar to that of a sports stadium.
Table 17. Annual Payments of Naming Rights for Sport Stadiums
(FY15 Millions of Dollars per Year)
Stadium Annual Payment
for Naming Rights Citi Field (Mets, baseball) $21 Barclays Center (Nets, basketball) $20 MetLife Stadium (Giants and Jets, football) $19 AT&T Stadium (Cowboys, football) $19
Sources: Schaul 2013; Bloomberg, n.d.
3. Results For our low estimate, we assume a private station would only be able to capture the
average fee charged for naming rights for stadiums with teams in the National Football League, $6 million per year. For our high estimate, we use the Bigelow figure of $25 million per year.
E. Sponsored Events and Sporting Events
1. Description of Service In 2012, the beverage company Red Bull GmbH, which distributes Red Bull Energy
Drink, invested $65 million in the Stratos space diving project that featured Austrian daredevil Felix Baumgartner skydiving 24 miles from the stratosphere to Earth (Figure 17). The event was live-streamed on Red Bull’s YouTube channel and received a total of 52 million views in addition to being carried on nearly 80 TV stations in 50 countries (Zmuda 2013). The president and CEO of Leverage Agency, a marketing and branding company, estimated Red Bull gained tens of millions of dollars in global exposure (Heitner 2012). While cause and effect cannot be proven, in the six months following the event, Red Bull sales rose 7 percent, bringing in more than $100 million in additional revenue for the company in the United States; globally, Red Bull sold 13 percent more cans of energy drinks in the year following the Stratos project (Zmuda 2013).
82
Source: Red Bull Stratos.
Figure 17. Red Bull Sponsorship of Suborbital Jump
A private space station could be leveraged for a wide range of sponsored events such as extreme stunts (like the Stratos Project), media content like a reality TV show that features the day-to-day activities of the astronauts, or sporting events in space. Race car driving, boxing, wrestling, and martial arts charge viewers to watch races or matches on a pay-per-view basis. NASA Senior Economic Advisor Alexander MacDonald has spoken of a “Brawl in Free Fall,” in which boxing or mixed martial arts opponents would participate in a microgravity match. Other sponsored events could use a private space station as a venue to incorporate microgravity into the activity and charge for the privilege of watching the event. Revenues from these types of events have the potential to be large. The highest revenue grossed by a boxing match was $600 million in 2015 for a fight between Floyd Mayweather and Manny Pacquiao, for which 4.4 million pay-per-view tickets were purchased (Associated Press 2015).
2. Methodology for Estimating Revenues
a. Sponsored Event We assume the station charges the organizers of a sponsored event a prorated $5
million lease payment to the station. Subtracting out the cost of consumables, net revenues for the station per stunt would be $4 million. However, the organizers would also have to cover the $20 million cost of launching a person to the space station to perform the stunt or participate in the event. Costs of this size fit within the $65 million budget that Red Bull spent on Baumgartner’s skydive. As a low estimate, we assume one stunt per year, and for a high estimate, we assume two stunts per year.
83
b. Sporting Events As noted previously, revenues from pay-per-view boxing matches have been large.
At a minimum, a match would need the two contestants and a referee/medic for a total of three people. At $20 million per person per flight, transportation costs alone would therefore be $60 million. We assume the same $5 million figure for each person to stay on station for 12 days, generating net revenues per person of $4 million after subtracting out the costs of consumables. A sustainable stream of income for a space station would rely on coming up with new, interesting events that hundreds of millions of viewers would be willing to pay to watch. We assume for our low revenue estimate that the station hosts three matches over 10 years, with three people on station per match. For our high estimate, we assume one event per year.
3. Results For sponsored stunts, one to two stunts per year multiplied by $4 million in net
revenues for the space station results in a low estimate of net revenues of $4 million per year and a high estimate of $8 million.
For sponsored sporting events, for our low estimate the station would receive revenues of $36.4 million over 10 years, or annualized revenues of $3.6 million (three sporting events times two participants and a trainer times $4 million per individual in net revenues in a decade). For our high estimate, we assume one sporting event per year yielding $12 million in annual revenue. In total, we estimate between $7.6 million and $20 million in annual revenues for sponsored events (Table 18).
Table 18. Annual Revenues for Sponsored Events (FY 2015 Dollars)
Sponsored Event Low Estimate High Estimate Stunts $4.0 M $8 M Sporting Events $3.6 M $12 M Total Annual Revenue $7.6 M $20 M
F. Virtual and Augmented Reality
1. Description of Services Virtual reality (VR) and augmented reality (AR) involve generating a computer-
simulated environment that alters the viewer’s perspective on reality partially or entirely. While only a handful of people will ever get to experience space or visit a space station, people are likely to be interested in experiencing space or a space station virtually. The company Oculus VR, which manufactures headsets for VR displays, along with its partners, has a program called Titans of Space 2.0. Using VR, this program allows viewers
84
to experience the solar system and beyond. Companies like Oculus could collaborate with a future private space station to develop VR programs for people to virtually visit the space station, conduct experiments, and view Earth and other nearby celestial bodies.
Other companies like MAGNOPUS, a “visual development and experience” firm, are already collaborating with NASA to explore creative uses of VR/AR technology. Such firms might find ways to incorporate images from a private space station into a VR setting for the entertainment industry. Movies like Avatar and The Jungle Book (2016) have used VR for actors to visualize virtual sets. If a movie were set in space, VR could be used to help the actors and crew visualize and navigate the setting.
In the future, VR might be incorporated into social media and accessed through similar online space stations. The idea is that the user would be able to engage with the VR content on an ongoing basis. To generate revenue, the online space station could charge everyone for access or set up a subscription service to receive “premium” access.
2. Methodology for Estimating Revenues If space-based VR were connected to an online space station, it could be set up as a
subscription service, similar to other media platforms such as Spotify or Netflix. Spotify has 30 million subscribers paying $10 per month (Singleton 2016). If we assume a VR platform could capture 1 percent of the Spotify community by 2024, it could potentially have 300,000 customers. We assume each customer would be willing to pay one-tenth of Spotify’s monthly charges, $1 per month ($12 per year), to engage in VR with a space station.
3. Results Assuming 300,000 customers each pay $12 per year, we calculate the station could
earn $3.6 million in revenue annually for our high estimate. For our low estimate, we assume that the space station is unable to leverage the VR market and generates no revenues.
G. K-12 and Post-Secondary Education
1. Description of Service Space has been of great interest for all primary, secondary, and post-secondary school
grade levels. Interest in space has motivated students to study science, technology, engineering, and mathematics (STEM). Several non-governmental organizations, non-profit institutions, and universities have worked with NASA and ESA to operate educational outreach programs involving a wide variety of activities.
85
Like the ISS, a private space station could be used to broadcast educational programs relating to STEM—in particular, space and earth sciences for classroom instruction. One organization run by volunteers, Amateur Radio on the International Space Station (ARISS), uses radio to provide classrooms the opportunity to communicate with astronauts on the ISS. Educational organizations apply for the program by submitting proposals on how students will learn about space and communication. If a proposal is selected, students are provided with a 10-minute window to ask the astronauts questions. Amateur radio operators help with the terrestrial operation of the equipment; astronauts provide their time for free.
Some groups have used competitions to spur interest in space and STEM. For example, CASIS has a competition geared toward high school students called Genes In Space, which operates in the United States and the United Arab Emirates. This competition leverages the technology from a company called miniPCR: experiments involving DNA are put into small, lightweight packages and sent to the ISS. The competition is merit-based: students write proposals for the type of experiment they wish to conduct on the ISS. After a rigorous selection process, the student with the winning project collaborates with New England Biolabs and Math for America to develop a flight-ready experiment. CASIS and its collaborators (including Boeing and miniPCR) donate their services. Some companies that assist students in preparing projects for the ISS charge a fee. For example, DreamUp provides services to students interested in sending their projects to the ISS. These services include planning the logistics of the project and getting the project flight-qualified.
A space station could support education in other ways. As earth and planetary sciences have become increasingly more prominent in school curricula, educational companies could leverage a space station to prepare ready-made lesson plans that could be sold to school districts. Online platforms could be developed, where students and teachers would be able to access educational resources such as lesson plans. These resources could be operated at-cost with sponsorships or charge a “premium” access subscription. Textbook publishers could purchase videos or photos from space for their materials. A private space station could charge for filming and producing these materials. Such programs could generate revenue both from live broadcasts paid by school districts or other educational authorities and from syndication royalties.
2. Methodology for Estimating Revenues
a. Educational Experiments Companies like DreamUp or competitions like Genes in Space could collaborate with
a private space station to continue sending educational experiments to space. These efforts would still rely on university or other support to develop the experiments and sponsors to fund them. In contrast to the ISS, a private station would charge for hosting the experiment.
86
In Chapter 0, we developed low and high estimates for potential charges by a private station to host experiments. For educational experiments, we use the low estimate, $31,250 per experiment, as educational experiments tend to be simpler in content and require a shorter period of time on station. We assume this charge is paid by donors but is nonetheless a revenue stream for the station. Because educational experiments tend to be small and automated (or require very little astronaut involvement), we assume that no astronaut time would be needed to run the experiments. In fiscal year 2015, CASIS awarded support for 20 educational experiments (CASIS 2016b). We use this as the basis for our high estimate of 20 educational experiments per year. Our low estimate assumes half that—10 experiments per year. Under these assumptions, annual revenue for a space station operator from educational experiments for a private space station would be $312,500 (low estimate) or $625,000 (high estimate).
b. Educational Astronaut Calls A private space station could charge an organization like ARISS for video calls with
astronauts on station, the cost for which the organization would pass on to donors willing to sponsor these activities. If it takes an astronaut 30 minutes to set up the radio equipment, call the classroom, and take down the equipment, we assume the station would charge $19,000 for the half hour of the astronaut’s time.17 Since 2000, ARISS has made 1,030 contacts with the ISS. If this baseline were maintained, there would be 68.7 contacts per year, generating $1.2 million per year in revenue.
3. Results In all, for our low estimate, we calculate the revenue generated by education at $1.5
million ($0.3 million for hosting experiments from schools plus $1.2 million in charges for video calls with astronauts) per year. For the high estimate, we calculate $1.86 million in revenue per year ($0.63 million for hosting experiments plus $1.23 million for video calls).
We did not find a suitable methodology to estimate the potential royalties or other payments to a private space station from the market for ready-made curricula, online content, and books originating on a space station.
H. Other Activities A future private space station may be able to leverage other activities involving media
and advertising. While we were unable to calculate revenues for these activities, they are included here for completeness.
17 Prorated based on the calculations in Chapter 0 of $38,000 for an hour of astronaut’s time.
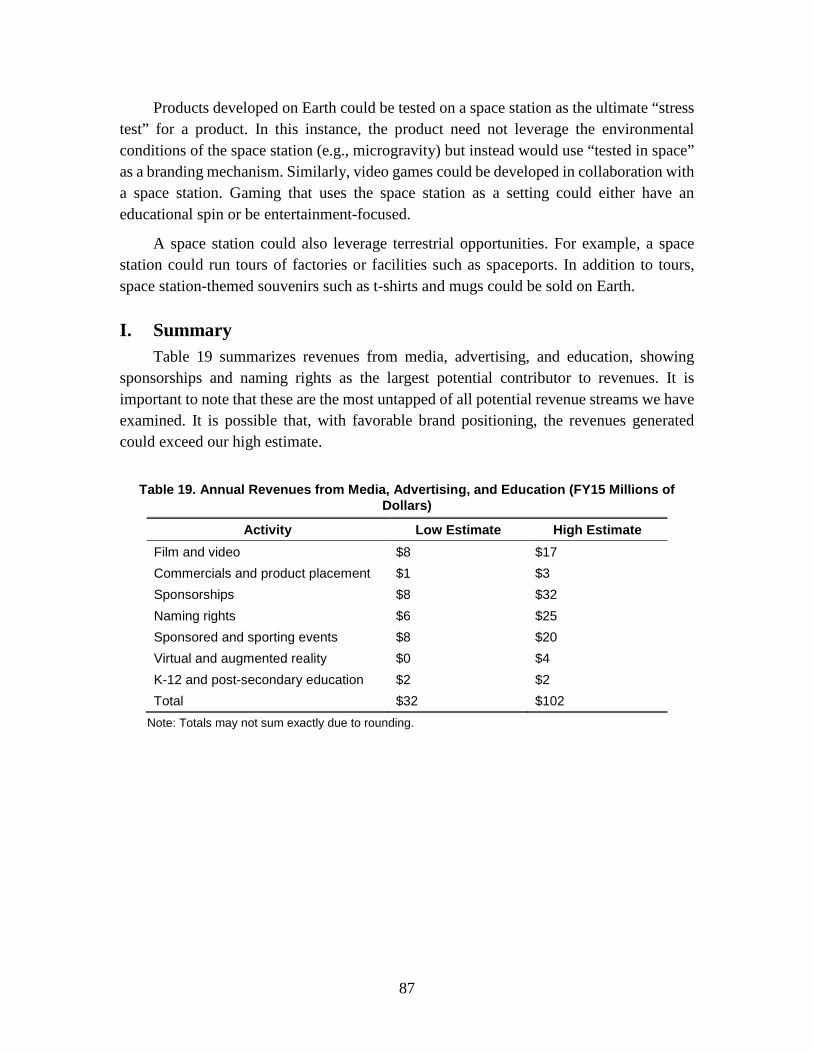
87
Products developed on Earth could be tested on a space station as the ultimate “stress test” for a product. In this instance, the product need not leverage the environmental conditions of the space station (e.g., microgravity) but instead would use “tested in space” as a branding mechanism. Similarly, video games could be developed in collaboration with a space station. Gaming that uses the space station as a setting could either have an educational spin or be entertainment-focused.
A space station could also leverage terrestrial opportunities. For example, a space station could run tours of factories or facilities such as spaceports. In addition to tours, space station-themed souvenirs such as t-shirts and mugs could be sold on Earth.
I. Summary Table 19 summarizes revenues from media, advertising, and education, showing
sponsorships and naming rights as the largest potential contributor to revenues. It is important to note that these are the most untapped of all potential revenue streams we have examined. It is possible that, with favorable brand positioning, the revenues generated could exceed our high estimate.
Table 19. Annual Revenues from Media, Advertising, and Education (FY15 Millions of
Dollars)
Activity Low Estimate High Estimate Film and video $8 $17 Commercials and product placement $1 $3 Sponsorships $8 $32 Naming rights $6 $25 Sponsored and sporting events $8 $20 Virtual and augmented reality $0 $4 K-12 and post-secondary education $2 $2 Total $32 $102
Note: Totals may not sum exactly due to rounding.


89
8. Design and Configuration Concepts for Future Private Stations
In previous chapters, we investigated and provided rough estimates of potential revenues for a privately owned and operated space station from potential activities that could be conducted in LEO. Estimating revenues alone is inadequate to assess the business case for a private space station, however. Revenues need to exceed costs for such a venture to succeed. In Chapters 8 and 9, we explore the costs of a station capable of supporting all of the activities discussed in this paper.
To estimate the potential cost of a space station, we need to know the requirements for the activities to be undertaken on the station in terms of the number of people to be housed at any one time, the station’s volume or area, and the environment on the station for experiments and manufacturing in space. In this chapter, we set these requirements to determine the basic parameters of a station capable of supporting all these activities. In Chapter 9, we develop rough estimates of the capital costs (the costs of designing and building a space station) for such a station, and of the operations and support costs of such a station once constructed.
A. Critical Design Parameters This section determines the minimum design constraints—in particular, volume
requirements—of a LEO space station as a basis for estimating costs. For this discussion, we assume that a single permanently manned station will serve all of the revenue-generating activities discussed. This may not be a realistic assumption—it is possible that there may be several single-activity stations: some robotic, focusing on manufacturing; and others human-tended, focusing on hosting private and sovereign astronauts. But for the purposes of this research, we assume all activities take place on a single station.
1. Number of Astronauts Based on our descriptions of potential activities, at any given time the space station
would have four astronauts needed to assemble satellites (Chapter 3) and two private astronauts or astronauts from the space programs of various countries (Chapter 2). Visits for filming commercials or for sporting events could be interspersed between stays by visiting astronauts. In addition to these visitors, the station would require permanent “housekeeping” staff to maintain the station, handle research experiments, and oversee
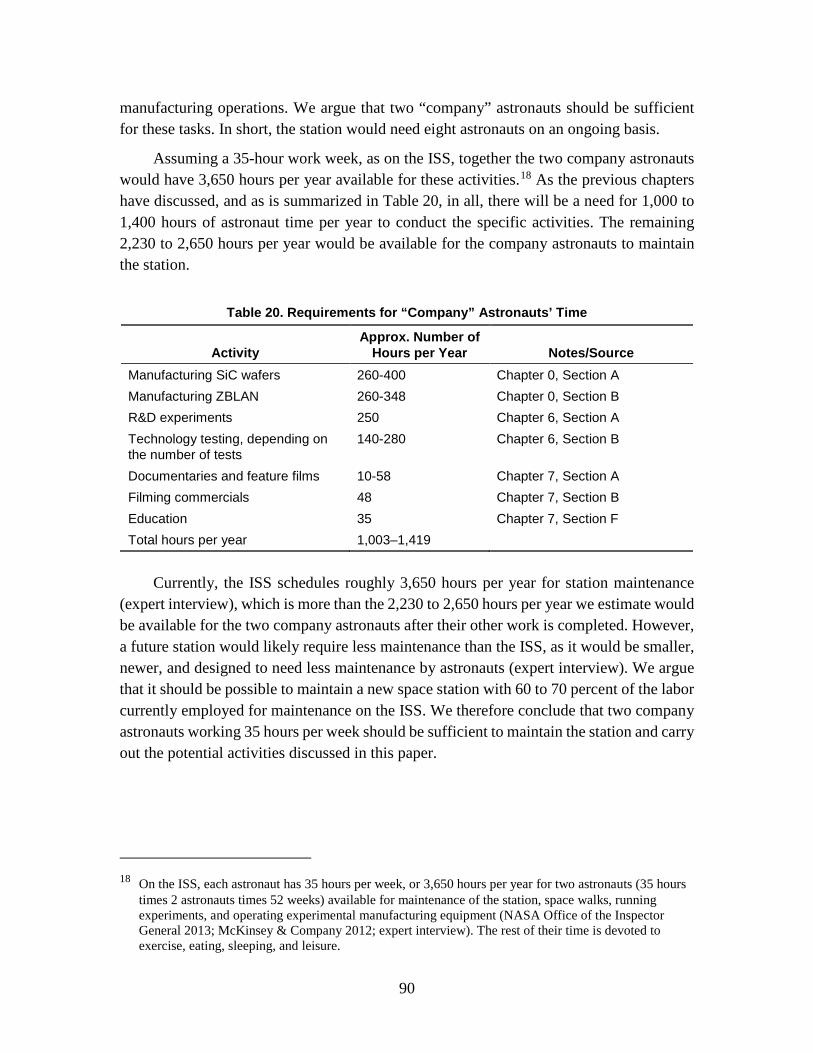
90
manufacturing operations. We argue that two “company” astronauts should be sufficient for these tasks. In short, the station would need eight astronauts on an ongoing basis.
Assuming a 35-hour work week, as on the ISS, together the two company astronauts would have 3,650 hours per year available for these activities.18 As the previous chapters have discussed, and as is summarized in Table 20, in all, there will be a need for 1,000 to 1,400 hours of astronaut time per year to conduct the specific activities. The remaining 2,230 to 2,650 hours per year would be available for the company astronauts to maintain the station.
Table 20. Requirements for “Company” Astronauts’ Time
Activity Approx. Number of
Hours per Year Notes/Source Manufacturing SiC wafers 260-400 Chapter 0, Section A Manufacturing ZBLAN 260-348 Chapter 0, Section B R&D experiments 250 Chapter 6, Section A Technology testing, depending on the number of tests
140-280 Chapter 6, Section B
Documentaries and feature films 10-58 Chapter 7, Section A Filming commercials 48 Chapter 7, Section B Education 35 Chapter 7, Section F Total hours per year 1,003–1,419
Currently, the ISS schedules roughly 3,650 hours per year for station maintenance
(expert interview), which is more than the 2,230 to 2,650 hours per year we estimate would be available for the two company astronauts after their other work is completed. However, a future station would likely require less maintenance than the ISS, as it would be smaller, newer, and designed to need less maintenance by astronauts (expert interview). We argue that it should be possible to maintain a new space station with 60 to 70 percent of the labor currently employed for maintenance on the ISS. We therefore conclude that two company astronauts working 35 hours per week should be sufficient to maintain the station and carry out the potential activities discussed in this paper.
18 On the ISS, each astronaut has 35 hours per week, or 3,650 hours per year for two astronauts (35 hours
times 2 astronauts times 52 weeks) available for maintenance of the station, space walks, running experiments, and operating experimental manufacturing equipment (NASA Office of the Inspector General 2013; McKinsey & Company 2012; expert interview). The rest of their time is devoted to exercise, eating, sleeping, and leisure.
91
2. Volume Based on the experience of the ISS, for a mission duration of several months, each
astronaut needs 20 cubic meters of volume (Cohen 2008; NASA 1995). We therefore assume the station would need to have 160 cubic meters of volume to house eight people. Further, it would need to have sufficient space for the activities discussed in Chapters 2–7. A machine to pull ZBLAN optical fiber would require less than 3 cubic meters of space (expert interview). SiC reprocessing also does not need large volumes of space. Satellite assembly would require relatively little space inside the pressurized volume of the space station, as most of the activity would take place on an external platform. A space station, with slightly more than double the required living space—or 340 cubic meters or more—should be large enough to host eight astronauts as well as experiments and manufacturing operations. It should also have enough space to film commercials or firms and host periodic space events on the station.
This number is consistent with some components of the ISS. The three primary research modules on the ISS—Destiny (NASA), about 110 cubic meters; Columbus (ESA), about 75 cubic meters; and Kibo (the Japanese Aerospace Exploration Agency (JAXA)), about 155 cubic meters—have a total combined volume of about 340 cubic meters.19 For comparison, this total comprises 37 percent of the ISS’s total pressurized volume.20 Because these modules have had sufficient capacity to house the ISS crew, conduct experiments, and host experimental manufacturing facilities, we argue that the combined size of these three modules provides further evidence that a 340 cubic meter space station would be sufficient to pursue all the activities discussed in Chapters 2–7.
3. Vibration Free Environment Microgravity research often needs long periods in a motion-free environment.
Microgravity manufacturing also benefits from such an environment. Experiments need to be separated from the rest of the space station to protect astronauts from chemicals and biological agents. On the ISS, the Microgravity Science Glovebox (MSG) was constructed with built-in gloves to provide such a sealed environment for experiments (NASA 2016d). Ensuring a high-quality microgravity environment may also require isolating experiments and manufacturing from areas on the space station where people or equipment would generate vibrations or otherwise disturb the environment. A box like the MSG could be constructed to be semi-detached from a space station module to dampen the effects of vibrations from humans or machinery on the station, but a semi-detached container for 19 Sources for the volume are, for Destiny, NASA 2014b; for Kibo, JAXA 2008; and for Columbus,
Thirkettle 2002. 20 ISS has total pressurized volume of 915 cubic meters (NASA 2010b). This figure was calculated by
dividing the pressurized volume of the ISS in cubic feet (32,333) by the number of cubic feet per cubic meter (35.3147).
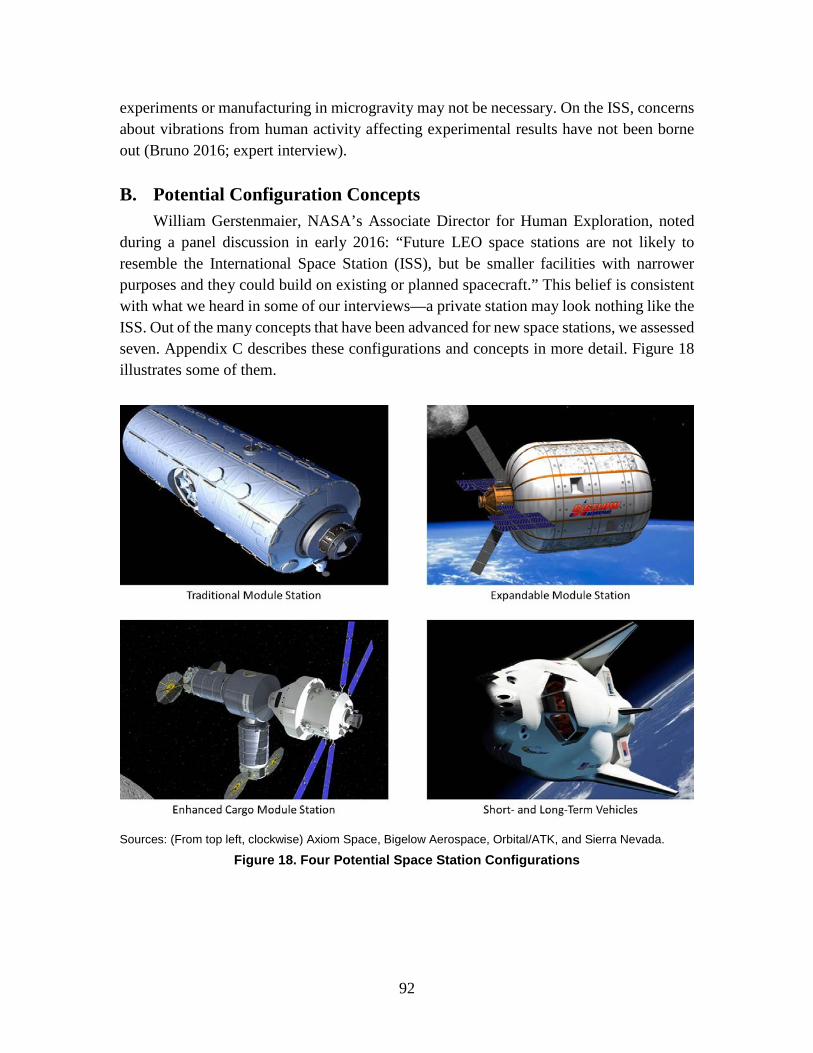
92
experiments or manufacturing in microgravity may not be necessary. On the ISS, concerns about vibrations from human activity affecting experimental results have not been borne out (Bruno 2016; expert interview).
B. Potential Configuration Concepts William Gerstenmaier, NASA’s Associate Director for Human Exploration, noted
during a panel discussion in early 2016: “Future LEO space stations are not likely to resemble the International Space Station (ISS), but be smaller facilities with narrower purposes and they could build on existing or planned spacecraft.” This belief is consistent with what we heard in some of our interviews—a private station may look nothing like the ISS. Out of the many concepts that have been advanced for new space stations, we assessed seven. Appendix C describes these configurations and concepts in more detail. Figure 18 illustrates some of them.
Sources: (From top left, clockwise) Axiom Space, Bigelow Aerospace, Orbital/ATK, and Sierra Nevada.
Figure 18. Four Potential Space Station Configurations
93
1. ISS-Heritage Modules Three of the concepts explored in this paper involve modules similar to those that
have been built for the ISS. Under one such concept, a new station would be constructed out of modules salvaged from the ISS. Under a second, a station would be constructed using new modules, but these modules would be built drawing on designs and expertise employed to build modules currently used by the ISS. A private station constructed from such modules, such as one proposed by Axiom Space, might be linked to the ISS in the first few years of its existence. A third variant would involve newly designed modules linked together around a “pier”-like platform to which new modules could be easily attached. Companies like satellite assemblers might launch and link their own modules to the “pier.”
2. String of Pearls Because a single space station architecture may fail to serve all potential customers,
it may make sense to place several separated modules in the same orbit. The modules with human presence would not be connected physically with robotic ones, giving manufacturers and researchers access to ultra-high quality microgravity. However, because they would be located close together, they could still take advantage of a single supply chain for launches, as the change in velocity, or delta-V, required for a supply vehicle to dock with one module, unload equipment, and fly to another one in the same orbit is negligible. Separated modules would require their own redundant subsystems, so extra mass would be needed on orbit to power and support each module rather than having several modules leverage the same systems.
3. Expandable Modules NASA explored the construction and use of expandable modules in the late 1990s
(Schrimpsher 2006). Today, Bigelow Aerospace is in the process of demonstrating that an expandable module can function in space, providing much larger volume-to-mass ratios than ISS-heritage modules. The BEAM currently attached to the ISS has a pressurized volume of 16 cubic meters. Bigelow Aerospace is also developing a new module, the B330, which has a pressurized volume of 330 cubic meters, about the required volume of our hypothetical station (Bigelow Aerospace 2016).
4. Cargo Vehicle Modules The current generation of cargo vehicles that supply the ISS can be modified to
survive for longer periods of time. It could be possible to construct a station out of several cargo modules and one or more “node” modules. Although these cargo modules have the benefit of being launched with a full load of cargo, and hence would not incur additional launch costs for their second life as part of a space station, the volume per module is too

94
low to build a private space station capable of supporting all of the activities discussed in Chapters 2–7. Other stations could still incorporate these modules into their permanent infrastructure and “grow” with additional resupply vehicles.
5. Refurbished Fuel Tanks The interiors of empty upper stage fuel tanks could be refurbished to support a human
habitat. As an example, Ixion, a partnership between NanoRacks, Space Systems Loral, and United Launch Alliance, will be conducting comprehensive feasibility studies for a low-cost habitat using a refurbished Centaur upper stage fuel tank as part of NASA’s Next Space Technologies for Exploration Partnerships (NextSTEP) effort (Ackerman 2016).
6. Short-Term Capsules For some activities, “space” is the destination; the location or size of the space station
is unimportant. For private astronauts, it may be more economical to ride in a capsule for a few days without going to a space station that charges an additional fee. Sierra Nevada’s DreamChaser is one example of such a capsule. Short-term capsules and their costs are discussed in Appendix C.
7. Long-Term Capsules The same capsules used for short-term missions could also be used for longer-term
missions. These capsules can provide microgravity for experiments or manufacturing for more extended periods of time than short-term capsules. These capsules are generally too small to comfortably support more than one person for a long-term mission, and their life support systems cannot support one human for a full year without modifications and additional consumable cargo.
C. Potential Station Orbits While the cost of building a station may not depend greatly on the altitude or
inclination of the station, resupply and operations costs do. We discuss both topics in the following subsections.
1. Orbital Altitude While a space station could be placed in a variety of orbits (Figure 19), this report
focuses on LEO. Astronauts on a space station in LEO are still heavily protected from radiation by Earth’s magnetic field. It is also cheaper and faster to launch people and supplies to LEO than to higher orbits.
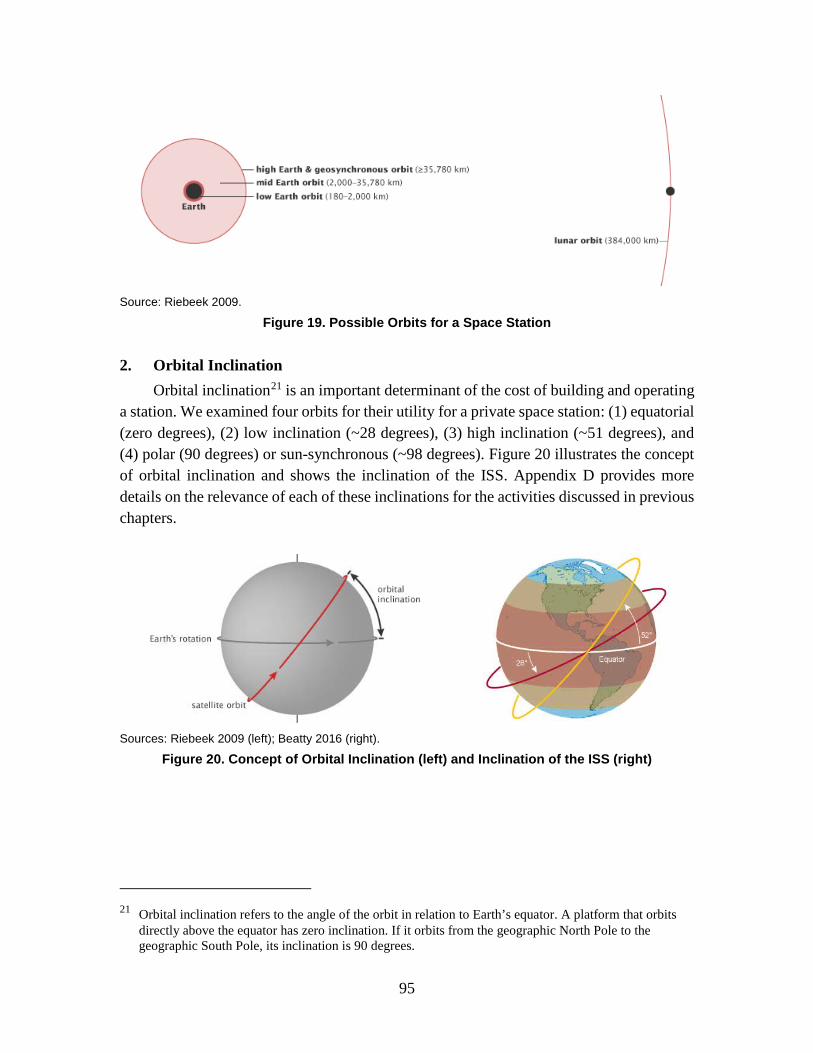
95
Source: Riebeek 2009.
Figure 19. Possible Orbits for a Space Station
2. Orbital Inclination Orbital inclination21 is an important determinant of the cost of building and operating
a station. We examined four orbits for their utility for a private space station: (1) equatorial (zero degrees), (2) low inclination (~28 degrees), (3) high inclination (~51 degrees), and (4) polar (90 degrees) or sun-synchronous (~98 degrees). Figure 20 illustrates the concept of orbital inclination and shows the inclination of the ISS. Appendix D provides more details on the relevance of each of these inclinations for the activities discussed in previous chapters.
Sources: Riebeek 2009 (left); Beatty 2016 (right).
Figure 20. Concept of Orbital Inclination (left) and Inclination of the ISS (right)
21 Orbital inclination refers to the angle of the orbit in relation to Earth’s equator. A platform that orbits
directly above the equator has zero inclination. If it orbits from the geographic North Pole to the geographic South Pole, its inclination is 90 degrees.
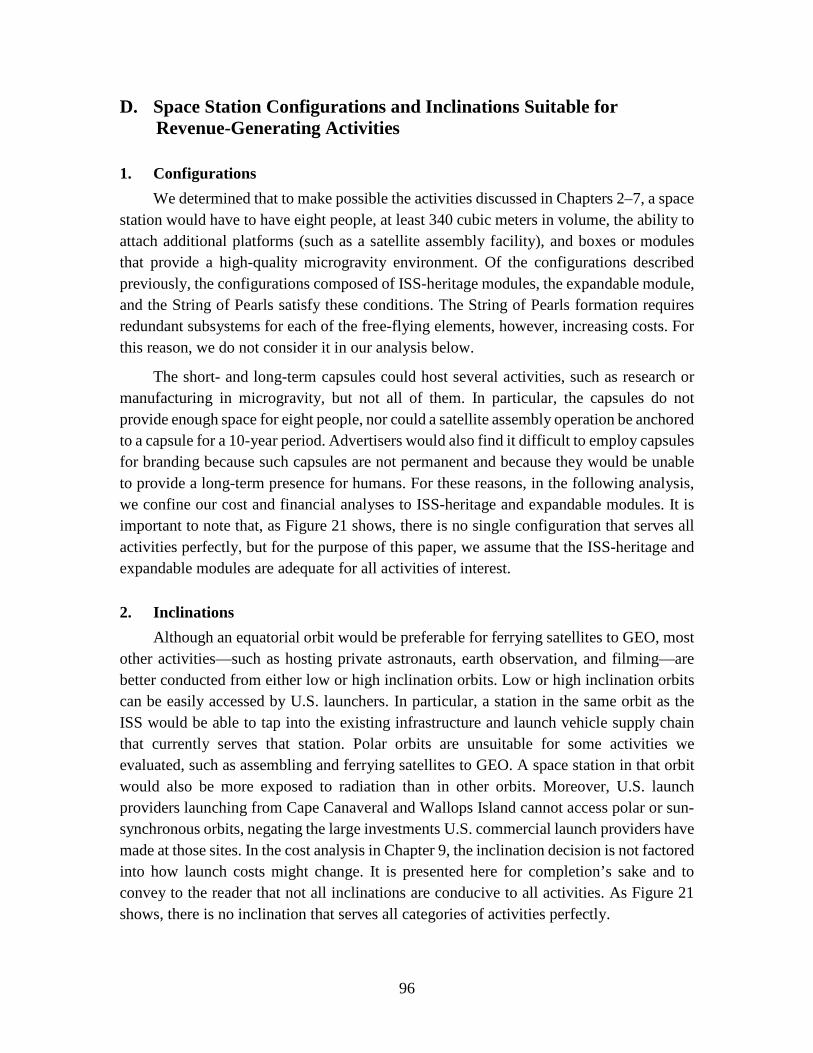
96
D. Space Station Configurations and Inclinations Suitable for Revenue-Generating Activities
1. Configurations We determined that to make possible the activities discussed in Chapters 2–7, a space
station would have to have eight people, at least 340 cubic meters in volume, the ability to attach additional platforms (such as a satellite assembly facility), and boxes or modules that provide a high-quality microgravity environment. Of the configurations described previously, the configurations composed of ISS-heritage modules, the expandable module, and the String of Pearls satisfy these conditions. The String of Pearls formation requires redundant subsystems for each of the free-flying elements, however, increasing costs. For this reason, we do not consider it in our analysis below.
The short- and long-term capsules could host several activities, such as research or manufacturing in microgravity, but not all of them. In particular, the capsules do not provide enough space for eight people, nor could a satellite assembly operation be anchored to a capsule for a 10-year period. Advertisers would also find it difficult to employ capsules for branding because such capsules are not permanent and because they would be unable to provide a long-term presence for humans. For these reasons, in the following analysis, we confine our cost and financial analyses to ISS-heritage and expandable modules. It is important to note that, as Figure 21 shows, there is no single configuration that serves all activities perfectly, but for the purpose of this paper, we assume that the ISS-heritage and expandable modules are adequate for all activities of interest.
2. Inclinations Although an equatorial orbit would be preferable for ferrying satellites to GEO, most
other activities—such as hosting private astronauts, earth observation, and filming—are better conducted from either low or high inclination orbits. Low or high inclination orbits can be easily accessed by U.S. launchers. In particular, a station in the same orbit as the ISS would be able to tap into the existing infrastructure and launch vehicle supply chain that currently serves that station. Polar orbits are unsuitable for some activities we evaluated, such as assembling and ferrying satellites to GEO. A space station in that orbit would also be more exposed to radiation than in other orbits. Moreover, U.S. launch providers launching from Cape Canaveral and Wallops Island cannot access polar or sun-synchronous orbits, negating the large investments U.S. commercial launch providers have made at those sites. In the cost analysis in Chapter 9, the inclination decision is not factored into how launch costs might change. It is presented here for completion’s sake and to convey to the reader that not all inclinations are conducive to all activities. As Figure 21 shows, there is no inclination that serves all categories of activities perfectly.
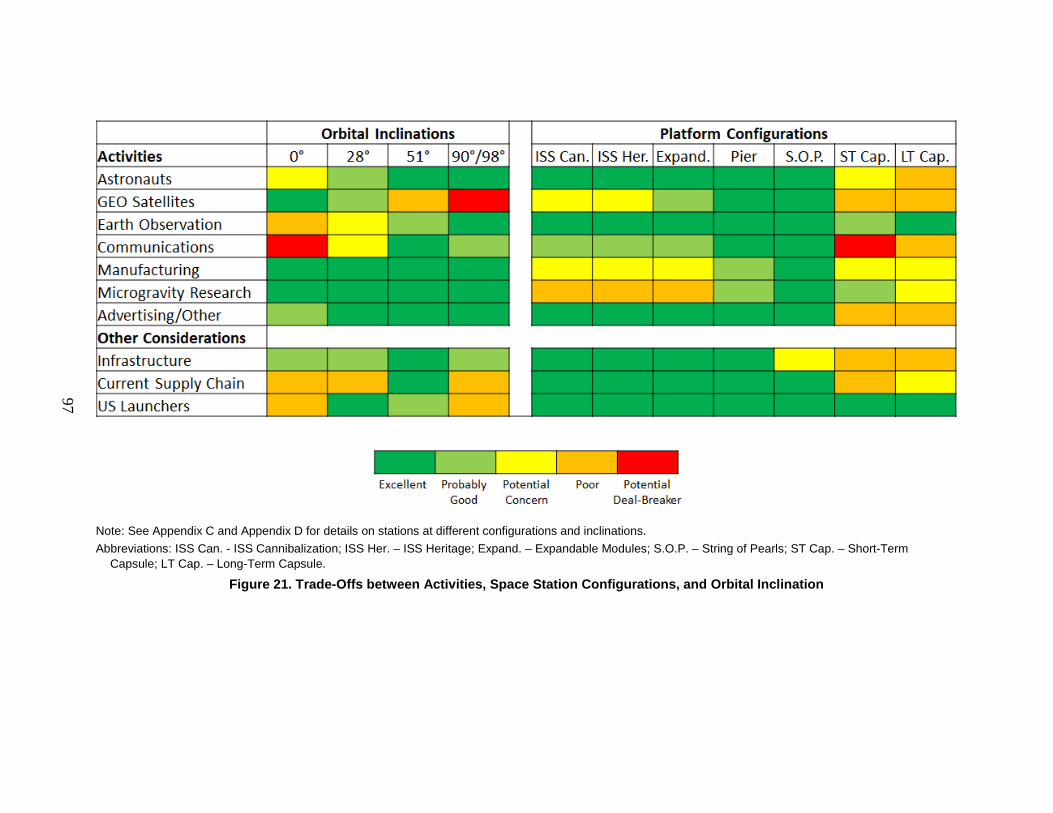
97
Note: See Appendix C and Appendix D for details on stations at different configurations and inclinations. Abbreviations: ISS Can. - ISS Cannibalization; ISS Her. – ISS Heritage; Expand. – Expandable Modules; S.O.P. – String of Pearls; ST Cap. – Short-Term
Capsule; LT Cap. – Long-Term Capsule.
Figure 21. Trade-Offs between Activities, Space Station Configurations, and Orbital Inclination

99
9. Potential Costs of Future Private Space Stations
Launching and operating a space station is an expensive endeavor. The cost of building the ISS for the United States alone was $78 billion (NASA Office of the Inspector General 2015). Other sources quote figures as high as $100 billion to $115 billion for the full cost of the station (ESA 2013b). Operations and maintenance costs of the ISS are also high; in FY 2015 the United States’ share of these costs, not including resupply, were $1,208 million (NASA 2015a). Over the next five years, these costs are expected to rise (NASA 2016b).
The construction and operations costs of a private space station are expected to be much less than for the ISS. While no details are available publicly on a future station, experts have opined on the cost of such a station. For a station similar to Skylab, John Elbon, the former manager of the ISS program at Boeing, provided a rough estimate of construction and launch costs of about $2.5 billion, with operations and resupply costs at about $2 billion per year (Smith 2016).
In Chapter 8, we determined that a space station assembled from modules similar to those used to construct the ISS or an expandable space station should be able to host all the revenue-generating activities described in Chapters 2–7. The Skylab-like option cited by Boeing is a good benchmark for a future space station using one or the other of these two configurations, as Skylab had a pressurized volume of 351 cubic meters (Belew 1977, 21).
In this chapter, we first estimate the costs of constructing and launching the modules and subsystems of ISS-heritage and the expandable station configurations. We then compare these costs with Boeing’s rough cost estimates for a Skylab-like station. Finally, we estimate potential operations and resupply costs and compare the total annual costs for all three examples.
A. Module Costs Some commercial providers interviewed for this project shared their price or cost
estimates for potential space station modules (Table 21). One expert estimated that an ISS-heritage module similar to those used on the ISS would cost $250 million to design, construct, and launch into orbit. An expandable model is estimated to have a price of $300 million or less (expert interview).
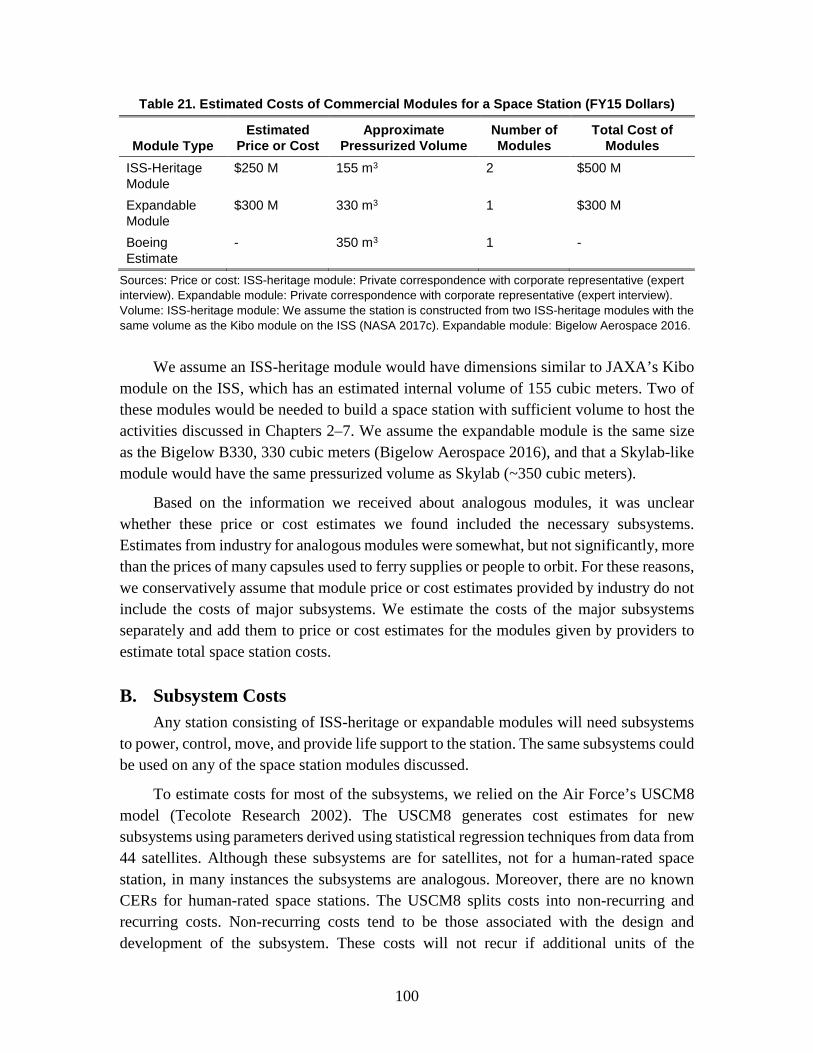
100
Table 21. Estimated Costs of Commercial Modules for a Space Station (FY15 Dollars)
Module Type Estimated
Price or Cost Approximate
Pressurized Volume Number of Modules
Total Cost of Modules
ISS-Heritage Module
$250 M 155 m3 2 $500 M
Expandable Module
$300 M 330 m3 1 $300 M
Boeing Estimate
- 350 m3 1 -
Sources: Price or cost: ISS-heritage module: Private correspondence with corporate representative (expert interview). Expandable module: Private correspondence with corporate representative (expert interview). Volume: ISS-heritage module: We assume the station is constructed from two ISS-heritage modules with the same volume as the Kibo module on the ISS (NASA 2017c). Expandable module: Bigelow Aerospace 2016.
We assume an ISS-heritage module would have dimensions similar to JAXA’s Kibo
module on the ISS, which has an estimated internal volume of 155 cubic meters. Two of these modules would be needed to build a space station with sufficient volume to host the activities discussed in Chapters 2–7. We assume the expandable module is the same size as the Bigelow B330, 330 cubic meters (Bigelow Aerospace 2016), and that a Skylab-like module would have the same pressurized volume as Skylab (~350 cubic meters).
Based on the information we received about analogous modules, it was unclear whether these price or cost estimates we found included the necessary subsystems. Estimates from industry for analogous modules were somewhat, but not significantly, more than the prices of many capsules used to ferry supplies or people to orbit. For these reasons, we conservatively assume that module price or cost estimates provided by industry do not include the costs of major subsystems. We estimate the costs of the major subsystems separately and add them to price or cost estimates for the modules given by providers to estimate total space station costs.
B. Subsystem Costs Any station consisting of ISS-heritage or expandable modules will need subsystems
to power, control, move, and provide life support to the station. The same subsystems could be used on any of the space station modules discussed.
To estimate costs for most of the subsystems, we relied on the Air Force’s USCM8 model (Tecolote Research 2002). The USCM8 generates cost estimates for new subsystems using parameters derived using statistical regression techniques from data from 44 satellites. Although these subsystems are for satellites, not for a human-rated space station, in many instances the subsystems are analogous. Moreover, there are no known CERs for human-rated space stations. The USCM8 splits costs into non-recurring and recurring costs. Non-recurring costs tend to be those associated with the design and development of the subsystem. These costs will not recur if additional units of the

101
subsystem are manufactured. Recurring costs are those that are incurred if additional units are constructed, such as the costs of labor and components.
Because most of the input data used in the statistical regressions were for government satellites, we discounted costs for each subsystem from the USCM8 by 30 percent under the assumption that subsystems developed for the private sector would cost less than similar subsystems developed under U.S. Government contracting procedures. This discount factor was adopted based on conversations with private company executives and published claims that private companies can develop these subsystems more efficiently if unencumbered with government contracting regulations. Similar cost reductions have been claimed to be achieved by companies that have developed new launch vehicles under more flexible U.S. Government contracting procedures.
1. Attitude Determination and Control Subsystem USCM8 estimates costs primarily based on mass. The ISS uses four 600-pound
control moment gyroscopes to control the attitude of the station (Boeing 2006). Using four gyroscopes of this size on the first one or two modules of a private space station would be excessive, as the mass of modules providing 300 to 350 cubic meters in pressurized volume would be smaller than the ISS’s roughly 420 metric tons total mass, which provides 915 cubic meters in pressurized volume (NASA 2016a). The ratio of the assumed pressurized volume of a private space station to the pressurized volume of the ISS is about one to three. Employing this ratio, we assume that the control moment gyroscopes, the heaviest component of the attitude determination and control subsystem (ADCS) for a private station, would be one-third the mass of ISS’s gyroscopes, or 200 pounds (90.9 kg). Using the USCM8 and these assumptions, we estimated the cost of the ADCS at $53 million.22
2. Power Subsystem We estimated the cost of the power subsystem (solar panels and batteries) for a private
station at $110 million. Because the calculations employing the USCM8 are somewhat complex, we show our calculations for this estimate in Appendix F.
22 The costs of the ADCS for a private space station would consist of both non-recurring (development)
and recurring costs. USCM8’s non-recurring cost formula for the ADCS is Y = 324 × X, where X is the mass in kg—in this case, 90.9 kg. This formula yields non-recurring development costs for the ADCS of $29.5 million. USCM8’s recurring cost formula for ADCS is Y = 795 × X0.593, where X is the mass in kg—90.9 kg. This yields a recurring cost of $11.5 million for each control moment gyroscope, or $46 million if four gyroscopes are used. The sum of these non-recurring and recurring costs is $75.5 million ($29.5 million plus $46 million). Applying a private sector discount of 30 percent to this sum yields a total cost of $52.9 million.
102
3. Telemetry, Tracking, and Command Subsystem The telemetry, tracking, and command (TT&C) subsystem was assumed to be the
same size as the maximum mass that USCM8 would allow for this subsystem for a satellite. We estimated the cost of such a subsystem at $24 million.23
4. Communications Subsystem The communications subsystem was assumed to be a small payload compared to the
larger satellites used for the USCM8 cost model that are typically sent to GEO. We estimate the cost of such a subsystem at $28 million.24
5. Propulsion Subsystem The ISS currently uses a Russian chemical propulsion subsystem to fight drag-
induced orbit degradation. Using this subsystem as a model, we assume that a private space station would also use a chemical propulsion subsystem. We estimated the cost of the propulsion subsystem based on the maximum CER input (1,000 kg) and a one cubic meter propellant tank. The total cost for the propulsion subsystem, assuming a 30 percent reduction, would be $31.7 million.25
At some future date, solar electric propulsion could become an alternative to chemical propulsion to maintain the orbit of a space station. A solar electric propulsion subsystem would save on fuel costs, but would require a much larger solar power subsystem. Moreover, power for other station activities from solar panels would have to be interrupted during orbit-raising maneuvers because the electric propulsion subsystem would need to
23 USCM8 assumes constant non-recurring costs for a TT&C subsystem of $26.9 million. Recurring costs
are estimated using the formula Y = 883.7 × X1.491 × 1.13X2, where X1 is the mass of the subsystem and
X2 is equal to zero for LEO missions and 1 for GEO missions. For a TT&C mass of 76 kg, the result is $7.4 million for recurring costs and a total (non-recurring plus recurring) cost of $34.3 million. Applying a 30 percent discount for private sector development yields a total cost of $24 million.
24 USCM8’s communications subsystem cost model is based on mass alone. The non-recurring cost formula is Y = 618 × X, where X is the communications subsystem mass in kg, which we estimate to be 50 kg, and Y is the cost in thousands of dollars. This yields a non-recurring cost of $30.9 million. The recurring cost formula is Y = 189 × X, where again X is the mass in kg and Y is the cost in thousands of dollars. This yields a recurring cost of $9.45 million. The sum of these non-recurring and recurring costs is $40.4 million ($30.9 million plus $9.45 million). Applying a private sector discount of 30 percent to this sum yields a total cost of $28.2 million.
25 USCM8’s propulsion subsystem cost model is based on both the mass of the subsystem and the size of the propellant tank. The non-recurring cost formula is Y = 20.0 × X1
0.485, where X1 is the total tank volume in cubic centimeters and Y is the cost in thousands of dollars. Assuming a propellant tank of 1 cubic meter (1,000,000 cc), the non-recurring costs for a propulsion subsystem would be $16.3 million. The recurring cost formula is Y = 29 × X1 + 0.024 × X2, where X1 is the mass and X2 is the burn time. If burn time is assumed to be low, X2 can be ignored. For a propulsion subsystem with a mass of 1,000 kg, the recurring costs would be $29 million. The sum of these two costs is $45.3 million. Applying a 30 percent private sector discount yields a total cost of $31.7 million.
103
use a significant amount of power. Operators of a private space station might prefer short, high-thrust maneuvers to long, low-thrust maneuvers because manufacturers and researchers utilizing the microgravity environment would prefer shorter interruptions.
Using a separate space tug rather than incorporating a permanent propulsion module is another option for station-keeping. One drawback is that a tug would operate using a low-thrust propulsion subsystem, depriving clients of power and a microgravity environment for longer periods of time. A tug would offer redundancy in an emergency, however.
6. Life Support Subsystem Because USCM8 does not provide estimates for the environmental control and life
support subsystem (ECLSS), an estimate for this subsystem was derived from data provided by NASA. NASA estimates that the cost of a new version of the ECLSS currently on the ISS is approximately $250 million (private correspondence with NASA personnel). According to NASA, a more efficient subsystem could cost as much as $500 million and require more cargo mass. The cost difference would be mitigated over the lifetime of the subsystem if a more efficient ECLSS would reduce the number of supply missions needed. A less-capable ECLSS subsystem could be designed and launched for a much lower price than the current ISS subsystem, but the consequence would be an increase in the required resupply mass for water and air consumables. As a result, we did not consider this less-capable subsystem. Such a subsystem would likely be more cost-effective to use in a station that is only occasionally human-tended.
These estimates were for subsystems contracted through Federal Government contracting procedures. A variety of experts have argued that subsystems purchased by a private space station would be cheaper than if purchased through government contracting procedures. Accordingly, we have reduced the NASA estimates by 30 percent, in line with the other subsystems, to generate our estimate of $175 million for ECLSS.
7. Thermal Control Subsystem We did not generate a separate estimate for the thermal control subsystem. We assume
that the cost of this subsystem is subsumed in the cost of the modules, because the thermal control subsystem will be incorporated into the structure of the module being launched.
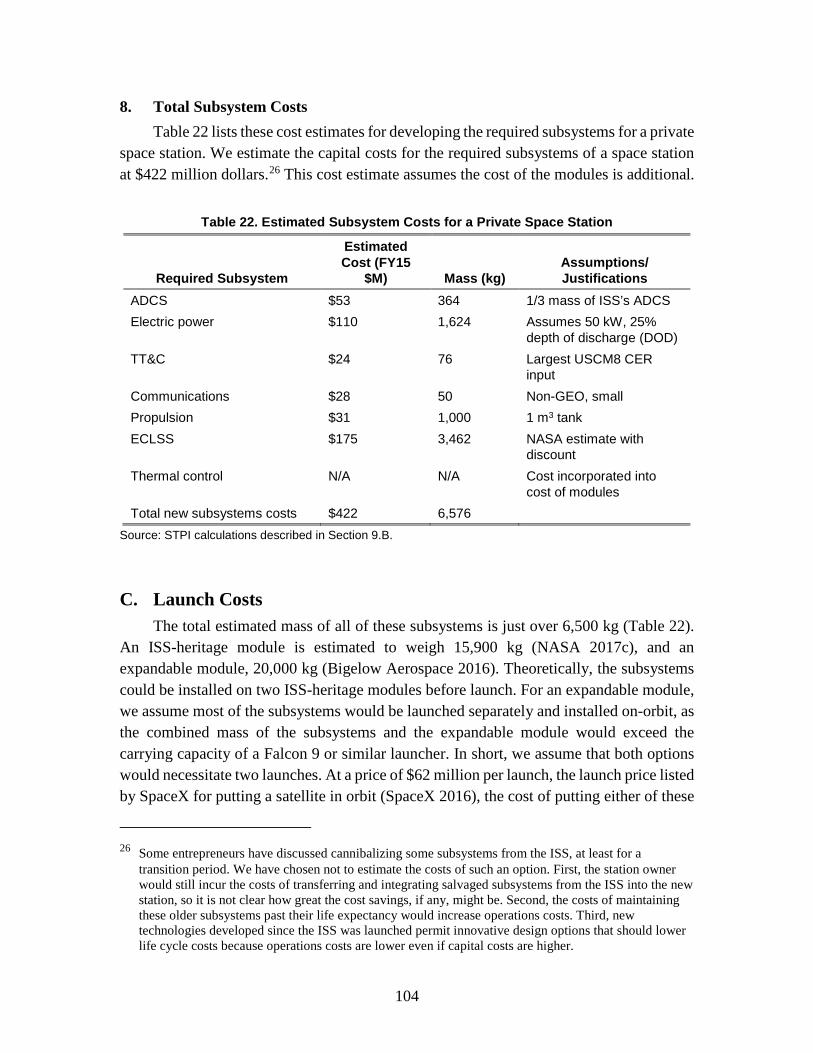
104
8. Total Subsystem Costs Table 22 lists these cost estimates for developing the required subsystems for a private
space station. We estimate the capital costs for the required subsystems of a space station at $422 million dollars.26 This cost estimate assumes the cost of the modules is additional.
Table 22. Estimated Subsystem Costs for a Private Space Station
Required Subsystem
Estimated Cost (FY15
$M) Mass (kg) Assumptions/ Justifications
ADCS $53 364 1/3 mass of ISS’s ADCS Electric power $110 1,624 Assumes 50 kW, 25%
depth of discharge (DOD) TT&C $24 76 Largest USCM8 CER
input Communications $28 50 Non-GEO, small Propulsion $31 1,000 1 m3 tank ECLSS $175 3,462 NASA estimate with
discount Thermal control N/A N/A Cost incorporated into
cost of modules Total new subsystems costs $422 6,576
Source: STPI calculations described in Section 9.B.
C. Launch Costs The total estimated mass of all of these subsystems is just over 6,500 kg (Table 22).
An ISS-heritage module is estimated to weigh 15,900 kg (NASA 2017c), and an expandable module, 20,000 kg (Bigelow Aerospace 2016). Theoretically, the subsystems could be installed on two ISS-heritage modules before launch. For an expandable module, we assume most of the subsystems would be launched separately and installed on-orbit, as the combined mass of the subsystems and the expandable module would exceed the carrying capacity of a Falcon 9 or similar launcher. In short, we assume that both options would necessitate two launches. At a price of $62 million per launch, the launch price listed by SpaceX for putting a satellite in orbit (SpaceX 2016), the cost of putting either of these
26 Some entrepreneurs have discussed cannibalizing some subsystems from the ISS, at least for a
transition period. We have chosen not to estimate the costs of such an option. First, the station owner would still incur the costs of transferring and integrating salvaged subsystems from the ISS into the new station, so it is not clear how great the cost savings, if any, might be. Second, the costs of maintaining these older subsystems past their life expectancy would increase operations costs. Third, new technologies developed since the ISS was launched permit innovative design options that should lower life cycle costs because operations costs are lower even if capital costs are higher.
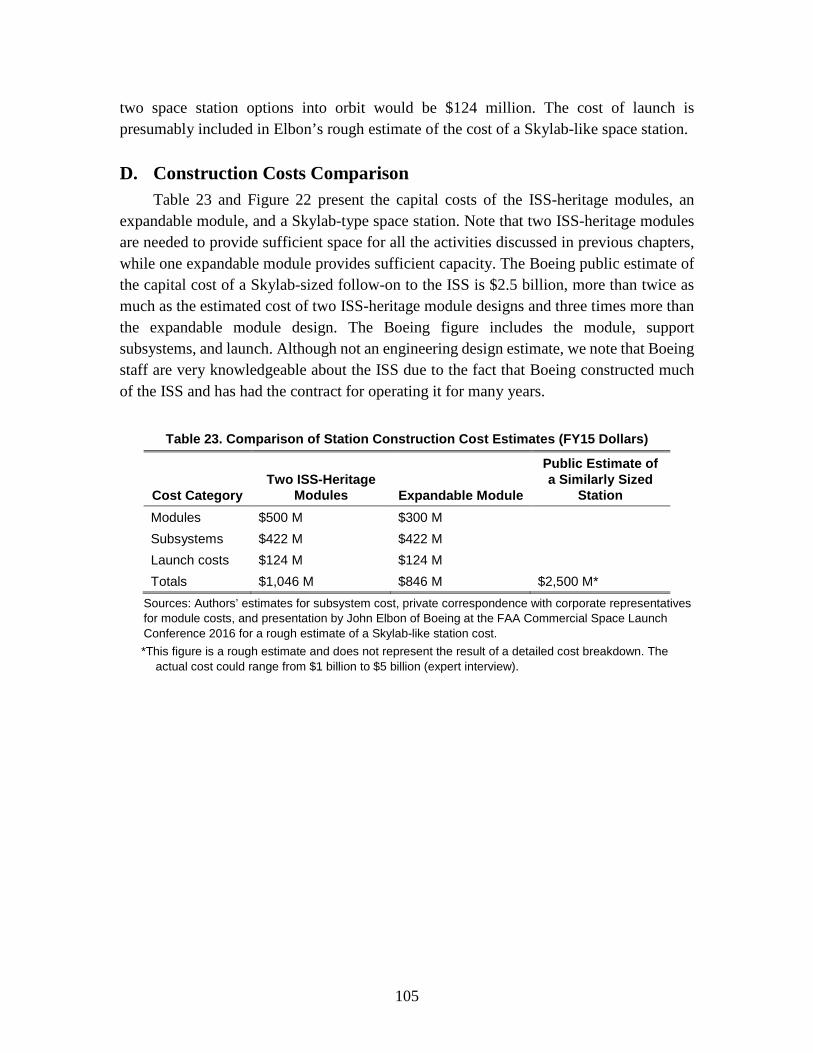
105
two space station options into orbit would be $124 million. The cost of launch is presumably included in Elbon’s rough estimate of the cost of a Skylab-like space station.
D. Construction Costs Comparison Table 23 and Figure 22 present the capital costs of the ISS-heritage modules, an
expandable module, and a Skylab-type space station. Note that two ISS-heritage modules are needed to provide sufficient space for all the activities discussed in previous chapters, while one expandable module provides sufficient capacity. The Boeing public estimate of the capital cost of a Skylab-sized follow-on to the ISS is $2.5 billion, more than twice as much as the estimated cost of two ISS-heritage module designs and three times more than the expandable module design. The Boeing figure includes the module, support subsystems, and launch. Although not an engineering design estimate, we note that Boeing staff are very knowledgeable about the ISS due to the fact that Boeing constructed much of the ISS and has had the contract for operating it for many years.
Table 23. Comparison of Station Construction Cost Estimates (FY15 Dollars)
Cost Category Two ISS-Heritage
Modules Expandable Module
Public Estimate of a Similarly Sized
Station Modules $500 M $300 M Subsystems $422 M $422 M Launch costs $124 M $124 M Totals $1,046 M $846 M $2,500 M*
Sources: Authors’ estimates for subsystem cost, private correspondence with corporate representatives for module costs, and presentation by John Elbon of Boeing at the FAA Commercial Space Launch Conference 2016 for a rough estimate of a Skylab-like station cost. *This figure is a rough estimate and does not represent the result of a detailed cost breakdown. The
actual cost could range from $1 billion to $5 billion (expert interview).
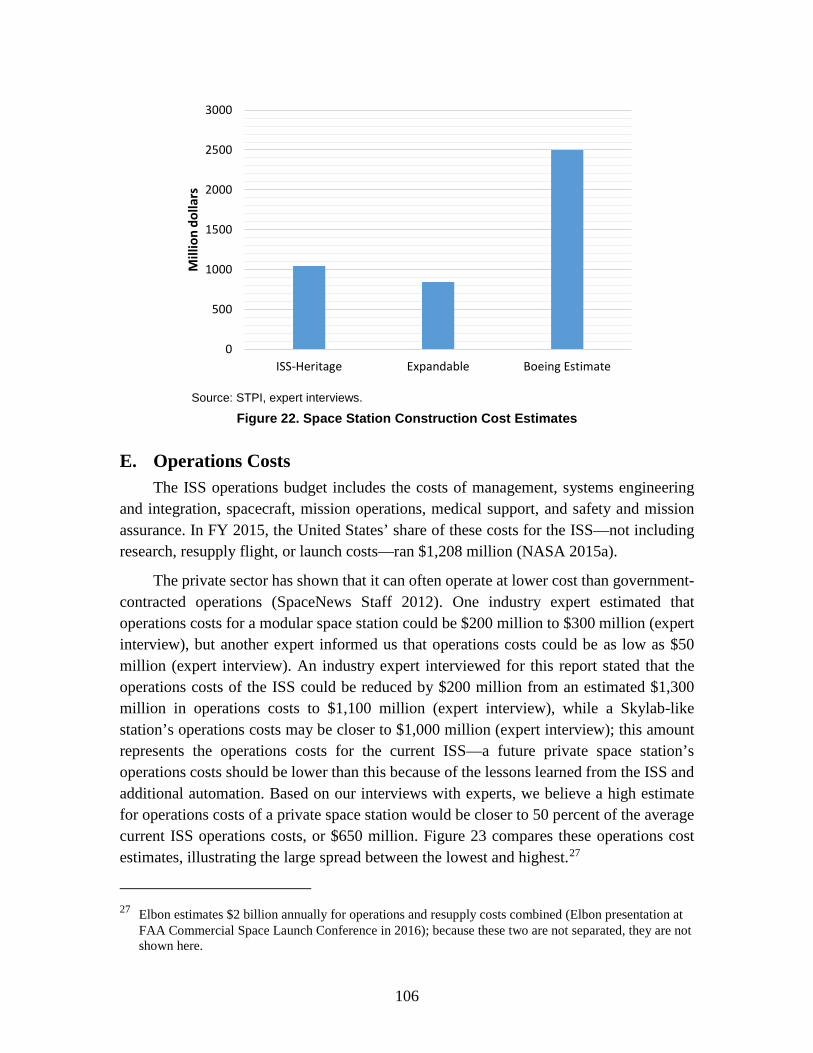
106
Source: STPI, expert interviews.
Figure 22. Space Station Construction Cost Estimates
E. Operations Costs The ISS operations budget includes the costs of management, systems engineering
and integration, spacecraft, mission operations, medical support, and safety and mission assurance. In FY 2015, the United States’ share of these costs for the ISS—not including research, resupply flight, or launch costs—ran $1,208 million (NASA 2015a).
The private sector has shown that it can often operate at lower cost than government-contracted operations (SpaceNews Staff 2012). One industry expert estimated that operations costs for a modular space station could be $200 million to $300 million (expert interview), but another expert informed us that operations costs could be as low as $50 million (expert interview). An industry expert interviewed for this report stated that the operations costs of the ISS could be reduced by $200 million from an estimated $1,300 million in operations costs to $1,100 million (expert interview), while a Skylab-like station’s operations costs may be closer to $1,000 million (expert interview); this amount represents the operations costs for the current ISS—a future private space station’s operations costs should be lower than this because of the lessons learned from the ISS and additional automation. Based on our interviews with experts, we believe a high estimate for operations costs of a private space station would be closer to 50 percent of the average current ISS operations costs, or $650 million. Figure 23 compares these operations cost estimates, illustrating the large spread between the lowest and highest.27
27 Elbon estimates $2 billion annually for operations and resupply costs combined (Elbon presentation at
FAA Commercial Space Launch Conference in 2016); because these two are not separated, they are not shown here.
0
500
1000
1500
2000
2500
3000
ISS-Heritage Expandable Boeing Estimate
Mill
ion
dolla
rs
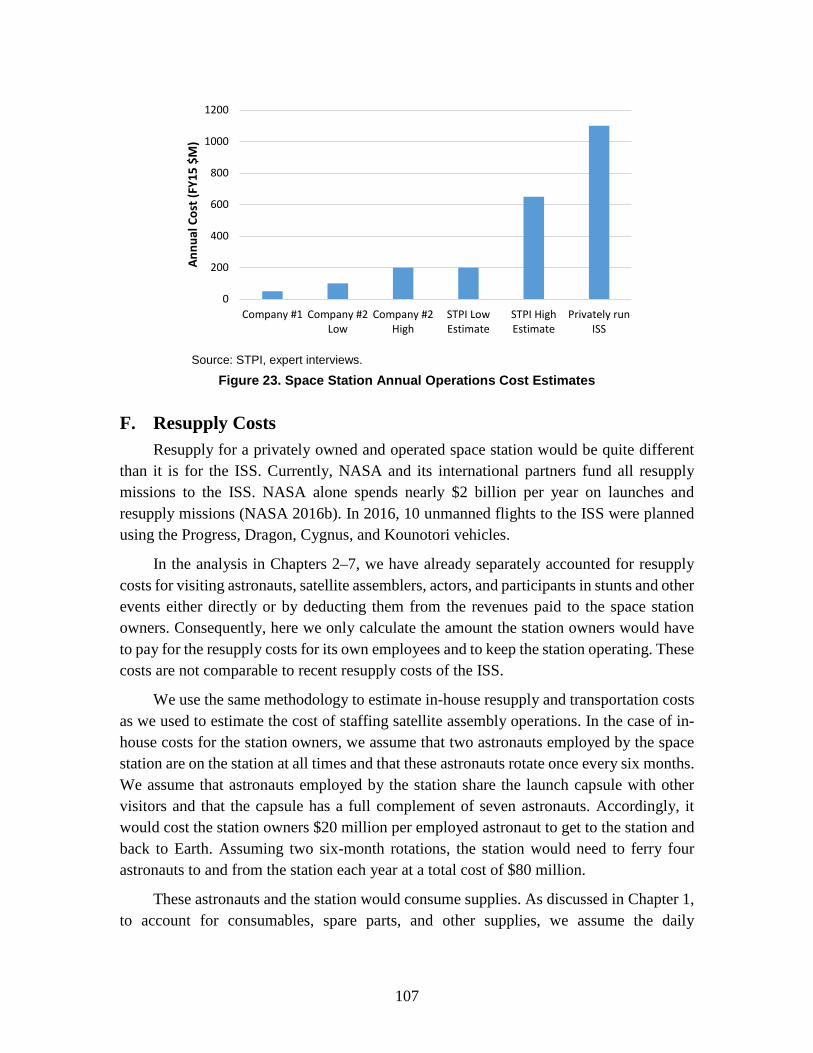
107
Source: STPI, expert interviews.
Figure 23. Space Station Annual Operations Cost Estimates
F. Resupply Costs Resupply for a privately owned and operated space station would be quite different
than it is for the ISS. Currently, NASA and its international partners fund all resupply missions to the ISS. NASA alone spends nearly $2 billion per year on launches and resupply missions (NASA 2016b). In 2016, 10 unmanned flights to the ISS were planned using the Progress, Dragon, Cygnus, and Kounotori vehicles.
In the analysis in Chapters 2–7, we have already separately accounted for resupply costs for visiting astronauts, satellite assemblers, actors, and participants in stunts and other events either directly or by deducting them from the revenues paid to the space station owners. Consequently, here we only calculate the amount the station owners would have to pay for the resupply costs for its own employees and to keep the station operating. These costs are not comparable to recent resupply costs of the ISS.
We use the same methodology to estimate in-house resupply and transportation costs as we used to estimate the cost of staffing satellite assembly operations. In the case of in-house costs for the station owners, we assume that two astronauts employed by the space station are on the station at all times and that these astronauts rotate once every six months. We assume that astronauts employed by the station share the launch capsule with other visitors and that the capsule has a full complement of seven astronauts. Accordingly, it would cost the station owners $20 million per employed astronaut to get to the station and back to Earth. Assuming two six-month rotations, the station would need to ferry four astronauts to and from the station each year at a total cost of $80 million.
These astronauts and the station would consume supplies. As discussed in Chapter 1, to account for consumables, spare parts, and other supplies, we assume the daily
0
200
400
600
800
1000
1200
Company #1 Company #2Low
Company #2High
STPI LowEstimate
STPI HighEstimate
Privately runISS
Annu
al C
ost (
FY15
$M
)

108
consumption per astronaut per day is 4 kg.28 We assume that the station would have to provide consumables for two astronauts employed by and on station throughout the year for a total of 2,920 kg per year. At a launch cost of $20,000 per kg (Chapter 1), the station would have to spend $58.4 million on consumables per year. Adding the $58.4 million to $80 million per year to launch astronauts (computed in the previous paragraph), the total cost for both staff and consumables would be $138 million per year.
Spare parts for maintenance are another major resupply and operations cost for the ISS. The ISS spends approximately $170 million to $190 million annually on spare builds and repairs (expert interviews). This cost does not include anomaly resolution, engineering, or transportation costs. A private space station would be unlikely to spend nearly as much on these costs. A new station would build on the lessons learned from the ISS and be designed to reduce maintenance costs and the need for spares. A smaller station would have fewer parts requiring replacement, further reducing this cost. If the station has a 3D printer on board, some replacement parts could be printed, saving costs. For a private space station, we estimate an average of $40 million per year would be required to develop, launch, and install spare equipment. These costs would start small and grow over time as more systems need replacement. These costs would bring the total annual cost for astronaut resupply and spare parts for maintenance to $178 million.
G. Total Private Station Costs Table 24 shows our estimates of costs for the options discussed. We have amortized
construction costs uniformly over 10 years. Given the wide spread in operations costs, we selected two estimates from the costs in Figure 23: $200 million and $650 million. We believe that the $50 million figure could potentially be omitting several operations and support cost categories, and therefore is likely too low. The $1,100 million figure is based on current operations costs of the ISS minus $200 million in assumed cost efficiencies. It also is consistent with the $2 billion figure cited publicly by Boeing for the combined costs of operations and resupply. Further interviews yielded a rough estimate on the split between operations and resupply for this figure (expert interview). But in our view, the $2 billion figure is larger than would be expected for a future private station because it is based on the current operations costs of the ISS. We argue that a new, privately owned and operated space station would have substantially lower operations costs than the ISS.
Amortizing investment costs over 10 years and adding the operations costs and resupply costs yields annual total cost estimates ranging from $463 million to $2,250 million per year (Table 24).
28 A station that recycles water less efficiently than the ISS would save money on the development of the
ECLSS subsystem, but the assumption of 4 kg per person per day would no longer be valid when calculating resupply costs.
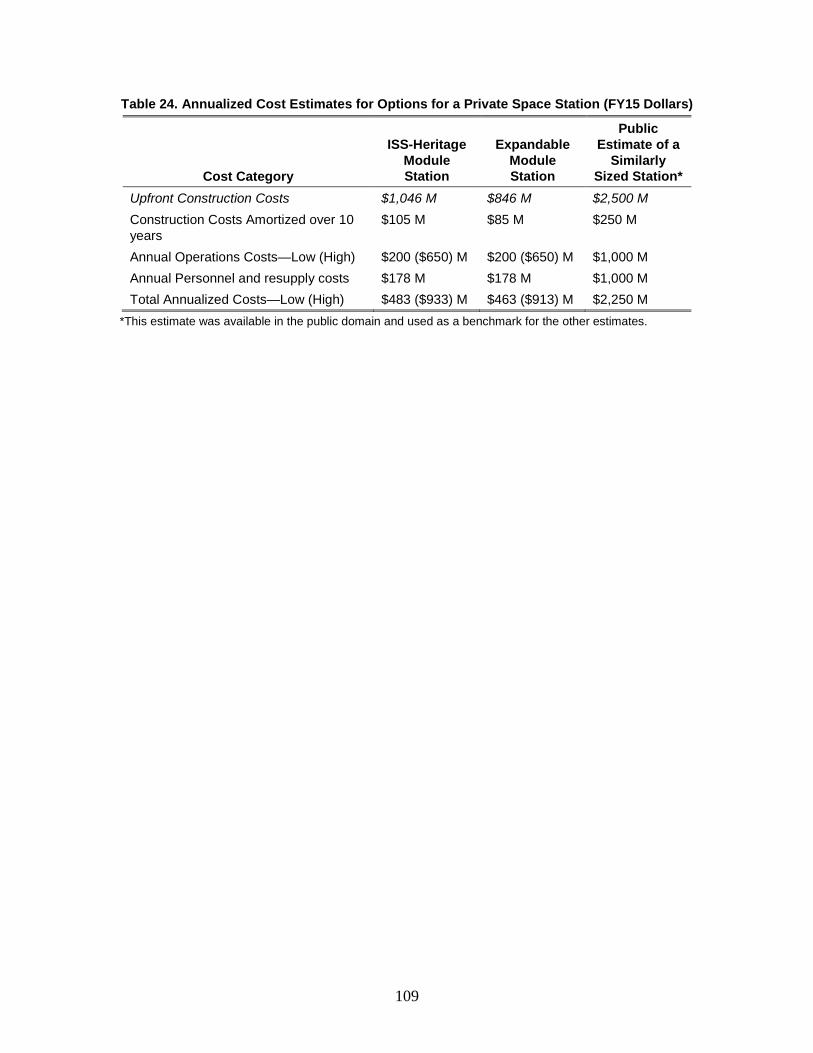
109
Table 24. Annualized Cost Estimates for Options for a Private Space Station (FY15 Dollars)
Cost Category
ISS-Heritage Module Station
Expandable Module Station
Public Estimate of a
Similarly Sized Station*
Upfront Construction Costs $1,046 M $846 M $2,500 M Construction Costs Amortized over 10 years
$105 M $85 M $250 M
Annual Operations Costs—Low (High) $200 ($650) M $200 ($650) M $1,000 M Annual Personnel and resupply costs $178 M $178 M $1,000 M Total Annualized Costs—Low (High) $483 ($933) M $463 ($913) M $2,250 M
*This estimate was available in the public domain and used as a benchmark for the other estimates.


111
10. Summary and Conclusion
In this chapter, we compare our estimates of potential revenues from activities undertaken on a space station with the costs of building and operating a privately owned and operated station. We calculate the difference between annualized revenues and costs to determine the extent to which potential revenues might cover costs. We also examine the extent to which such a station could generate sufficient net revenues to attract private sector investors. We then explore barriers and enablers to private investment in space stations, as well as how the Federal Government could participate in the private space station market.
A. Summary of Potential Revenues and Costs
1. Potential Revenues Table 25 summarizes our low and high estimates of potential revenues developed in
Chapters 2–7. Our low estimate for total annualized revenues from activities conducted on a space station is $455 million; our high estimate is $1,187 million. The difference between our low estimate and high estimate is large—$732 million. This large difference reflects the highly tentative nature of these estimates. The estimates should not be considered lower or upper bounds; rather, they represent our best attempts to provide data-driven estimates of potential revenues based on more pessimistic and more optimistic assumptions.
These estimates differ substantially from some estimates that have been proffered by some stakeholders. At the 2016 NewSpace Conference in Seattle, one stakeholder stated that annualized revenues of $3.7 billion are feasible. We were unable to obtain a breakdown for this projected revenue stream, nor were we were able to reproduce it through independent estimations. Even our high estimate is less than half this value.

112
Table 25. Potential Revenues for a Private Space Station (FY15 Millions of Dollars)
Activity Low High Private tourism $3 $58 Foreign astronauts $22 $91 U.S. astronauts $40 $81 Satellite assembly $7 $359 Propellant storage $8 $17 Satellite delivery $4 $11 Auxiliary services for debris removal
$0 $8
R&D in space $17 $25 Technology testing $4 $9 Earth observation $6 $8 Manufacturing for use in space $5 $7 SiC wafers $21 $32 Exotic fiber optic cable $284 $379 Film and video $8 $17 Advertising $1 $3 Sponsorships $8 $32 Naming rights $6 $25 Sponsored events $4 $8 Sporting events $4 $12 Virtual reality $0 $4 Education $2 $2 Total $455 $1,187
Note: Totals may not sum exactly due to rounding.
As shown Figures 24 and 25, two activities drive total revenues in the high estimate.
For our high estimate, manufacturing in space is the largest contributor to space station revenues, accounting for 35 percent of the total. Satellite assembly in orbit contributes 30 percent of total revenues. Private and sovereign astronauts are the next two largest sources of revenues, accounting for 5 and 14 percent, respectively. All remaining activities contribute just 16 percent of revenues in the high estimate. For the low estimate, revenues from manufacturing in space are the most important by far, accounting for 67 percent of total revenues. Sovereign astronauts, satellite assembly, and R&D account for the remaining large shares of estimated revenues.
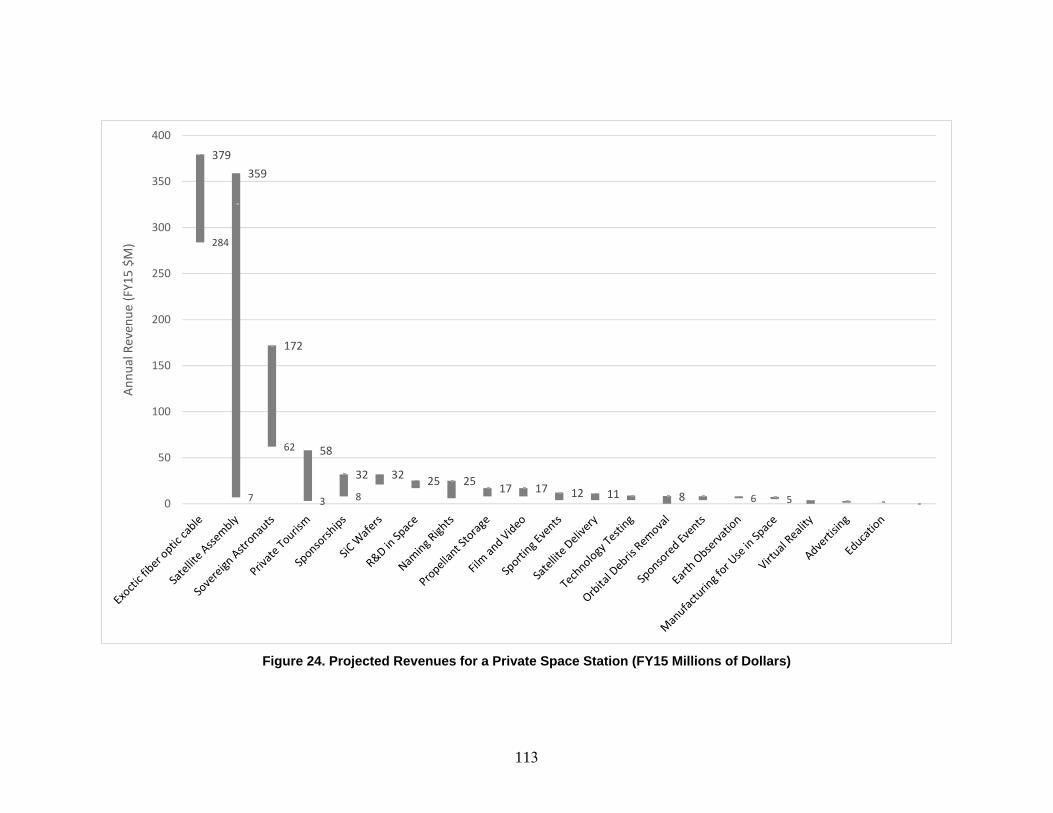
113
Figure 24. Projected Revenues for a Private Space Station (FY15 Millions of Dollars)
284
7
62
3 8 6 5
379359
172
58
32 32 25 25 17 17 12 11 80
50
100
150
200
250
300
350
400An
nual Reven
ue (FY15 $M
)

114
Note: Numbers may not add up due to rounding
Figure 25. Projected Revenues for a Private Space Station (FY15 Millions of Dollars)
2. Potential Costs Table 24, on page 109, shows cost estimates for the three space station options we
included in the analysis. Construction costs for the three options ranged from $846 million to $2,500 million. We used two estimates for annual operations costs—$200 million and $650 million. Personnel and resupply costs were estimated to be $178 million. Amortizing investment costs over 10 years and adding operations, personnel, and resupply costs for all configurations yields annual cost estimates ranging from $463 million to $2,250 million per year (Figure 26).
$305 $411
$21
$395
$66
$230
$0
$200
$400
$600
$800
$1,000
$1,200
$1,400
Low $ High $
Annu
al R
even
ue (F
Y15
$M)
Manufacturing for usein space
R&D and EarthObservations
Media, Advertising, andEducation
Human Habitats
Supporting SatelliteSector
Manufacturing for useon Earth
$457M
$1,187M
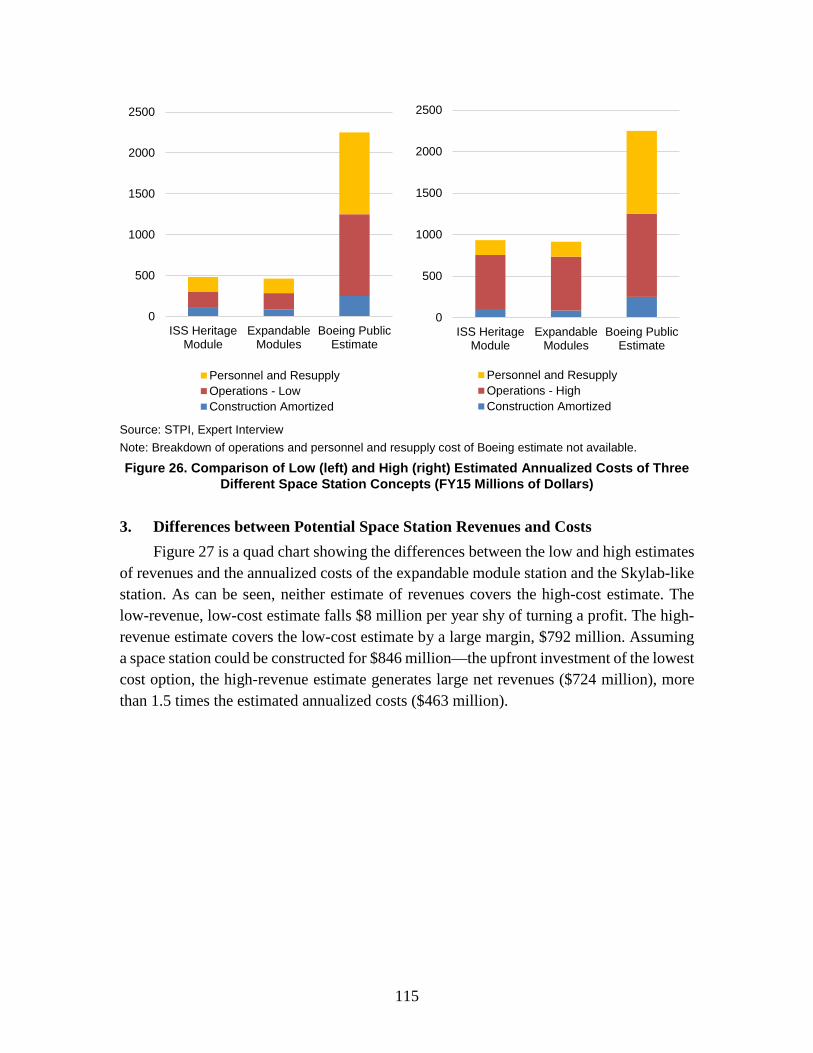
115
Source: STPI, Expert Interview Note: Breakdown of operations and personnel and resupply cost of Boeing estimate not available.
Figure 26. Comparison of Low (left) and High (right) Estimated Annualized Costs of Three Different Space Station Concepts (FY15 Millions of Dollars)
3. Differences between Potential Space Station Revenues and Costs Figure 27 is a quad chart showing the differences between the low and high estimates
of revenues and the annualized costs of the expandable module station and the Skylab-like station. As can be seen, neither estimate of revenues covers the high-cost estimate. The low-revenue, low-cost estimate falls $8 million per year shy of turning a profit. The high-revenue estimate covers the low-cost estimate by a large margin, $792 million. Assuming a space station could be constructed for $846 million—the upfront investment of the lowest cost option, the high-revenue estimate generates large net revenues ($724 million), more than 1.5 times the estimated annualized costs ($463 million).
0
500
1000
1500
2000
2500
ISS HeritageModule
ExpandableModules
Boeing PublicEstimate
Personnel and ResupplyOperations - LowConstruction Amortized
0
500
1000
1500
2000
2500
ISS HeritageModule
ExpandableModules
Boeing PublicEstimate
Personnel and ResupplyOperations - HighConstruction Amortized
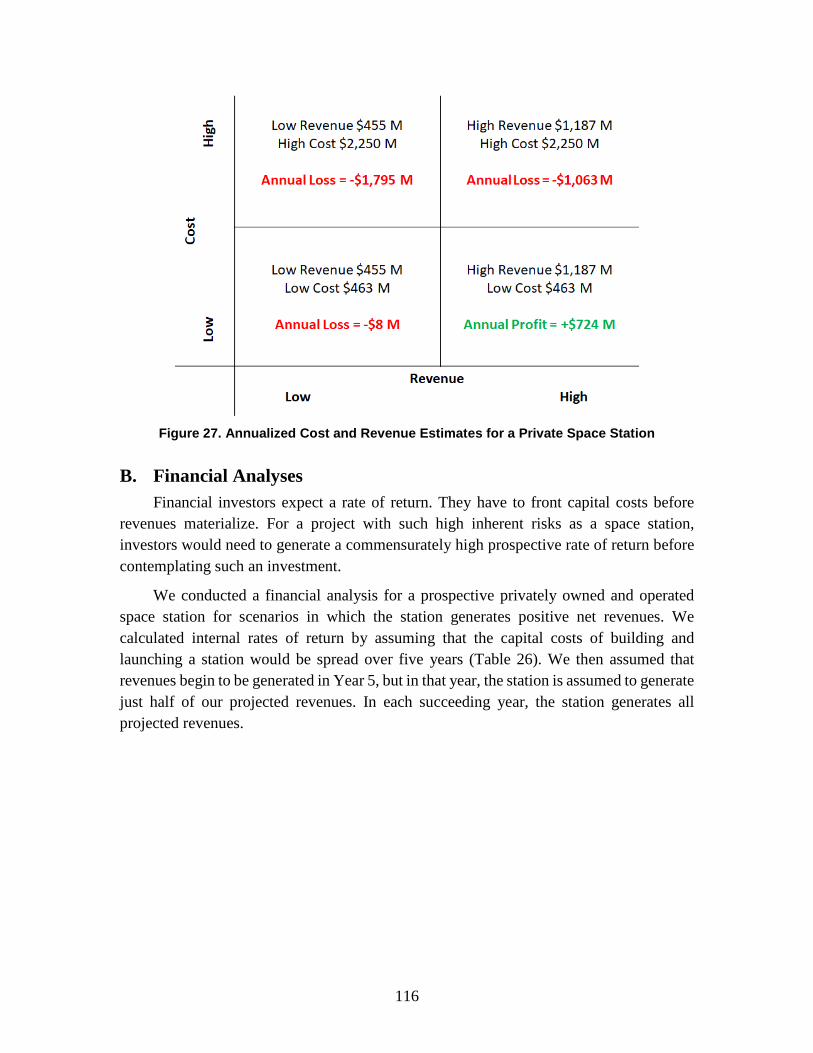
116
Figure 27. Annualized Cost and Revenue Estimates for a Private Space Station
B. Financial Analyses Financial investors expect a rate of return. They have to front capital costs before
revenues materialize. For a project with such high inherent risks as a space station, investors would need to generate a commensurately high prospective rate of return before contemplating such an investment.
We conducted a financial analysis for a prospective privately owned and operated space station for scenarios in which the station generates positive net revenues. We calculated internal rates of return by assuming that the capital costs of building and launching a station would be spread over five years (Table 26). We then assumed that revenues begin to be generated in Year 5, but in that year, the station is assumed to generate just half of our projected revenues. In each succeeding year, the station generates all projected revenues.
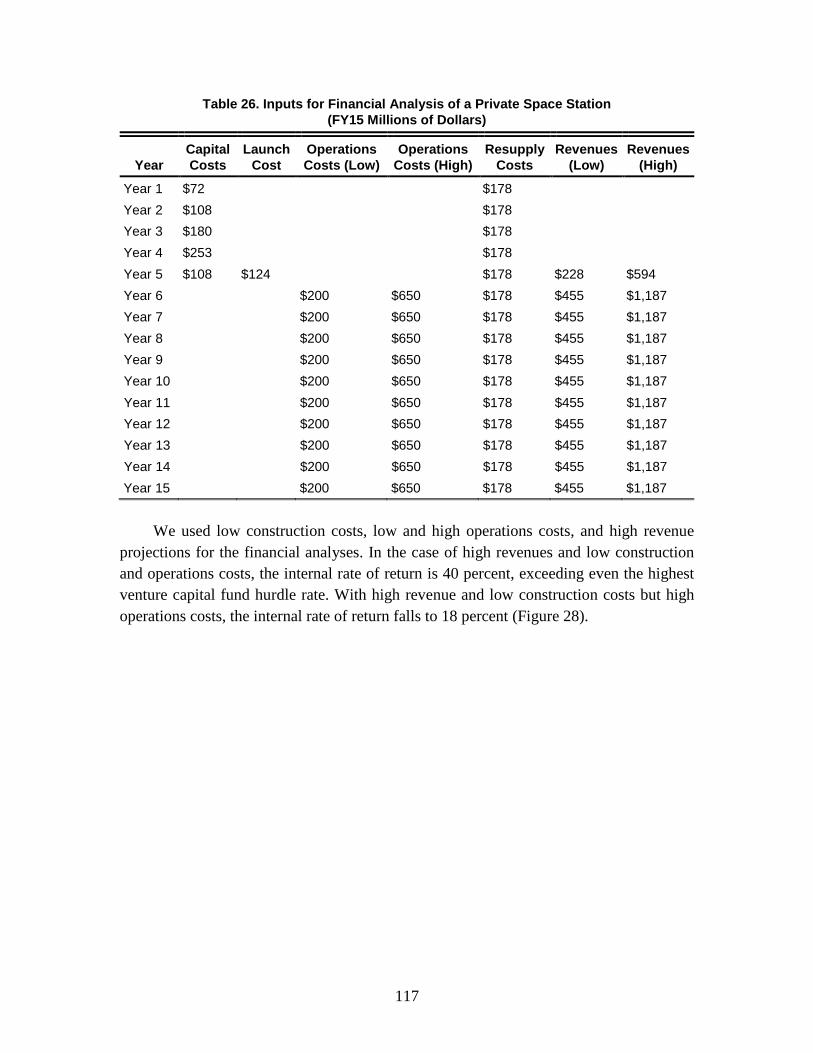
117
Table 26. Inputs for Financial Analysis of a Private Space Station (FY15 Millions of Dollars)
Year Capital Costs
Launch Cost
Operations Costs (Low)
Operations Costs (High)
Resupply Costs
Revenues (Low)
Revenues (High)
Year 1 $72 $178 Year 2 $108 $178 Year 3 $180 $178 Year 4 $253 $178 Year 5 $108 $124 $178 $228 $594 Year 6 $200 $650 $178 $455 $1,187 Year 7 $200 $650 $178 $455 $1,187 Year 8 $200 $650 $178 $455 $1,187 Year 9 $200 $650 $178 $455 $1,187 Year 10 $200 $650 $178 $455 $1,187 Year 11 $200 $650 $178 $455 $1,187 Year 12 $200 $650 $178 $455 $1,187 Year 13 $200 $650 $178 $455 $1,187 Year 14 $200 $650 $178 $455 $1,187 Year 15 $200 $650 $178 $455 $1,187
We used low construction costs, low and high operations costs, and high revenue
projections for the financial analyses. In the case of high revenues and low construction and operations costs, the internal rate of return is 40 percent, exceeding even the highest venture capital fund hurdle rate. With high revenue and low construction costs but high operations costs, the internal rate of return falls to 18 percent (Figure 28).
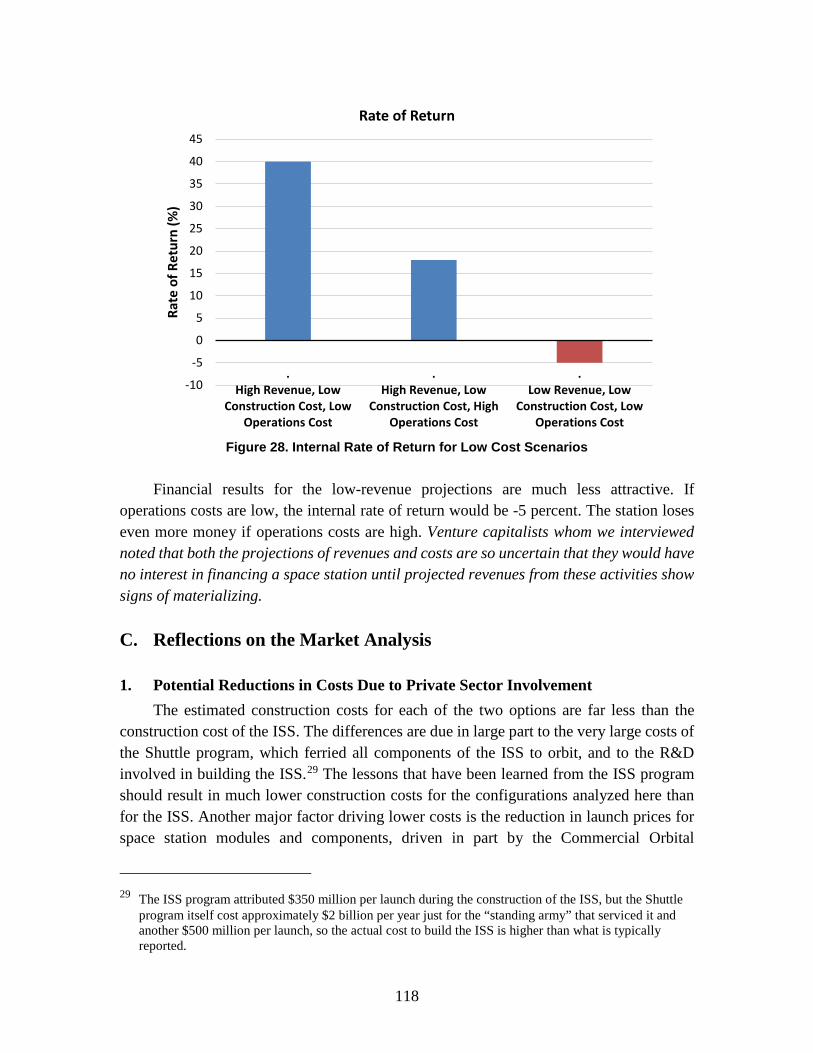
118
Figure 28. Internal Rate of Return for Low Cost Scenarios
Financial results for the low-revenue projections are much less attractive. If
operations costs are low, the internal rate of return would be -5 percent. The station loses even more money if operations costs are high. Venture capitalists whom we interviewed noted that both the projections of revenues and costs are so uncertain that they would have no interest in financing a space station until projected revenues from these activities show signs of materializing.
C. Reflections on the Market Analysis
1. Potential Reductions in Costs Due to Private Sector Involvement The estimated construction costs for each of the two options are far less than the
construction cost of the ISS. The differences are due in large part to the very large costs of the Shuttle program, which ferried all components of the ISS to orbit, and to the R&D involved in building the ISS.29 The lessons that have been learned from the ISS program should result in much lower construction costs for the configurations analyzed here than for the ISS. Another major factor driving lower costs is the reduction in launch prices for space station modules and components, driven in part by the Commercial Orbital
29 The ISS program attributed $350 million per launch during the construction of the ISS, but the Shuttle
program itself cost approximately $2 billion per year just for the “standing army” that serviced it and another $500 million per launch, so the actual cost to build the ISS is higher than what is typically reported.
-10
-5
0
5
10
15
20
25
30
35
40
45
.High Revenue, Low
Construction Cost, LowOperations Cost
.High Revenue, Low
Construction Cost, HighOperations Cost
.Low Revenue, Low
Construction Cost, LowOperations Cost
Rate
of R
etur
n (%
)
Rate of Return
119
Transportation Services (COTS) program, which has increased competition—something that was not a factor during the Shuttle era.
Our estimates of operations costs are also much lower than the current operations costs of the ISS. The owners of a privately owned and operated space station would design and build the station to reduce recurring operations costs and minimize permanent staff, driving down costs. In light of their large investments in the station, investors would also seek to ensure that risk is not significantly increased.
2. Uncertainties Surrounding Revenue Estimates The revenue estimates were made to the best of our abilities based on what the
community knows now and can foresee into the next decade. However, the estimates and the methodologies used to generate them are a means of providing a disciplined analytical framework for assessing potential future revenue flows; the range of feasible estimates is very wide. To illustrate the pitfalls of forecasting revenues from new technologies, in 1980, McKinsey & Company forecasted for Bell Labs the penetration of cell or satellite telephones in the year 2000. McKinsey projected 900,000 cellphone users by 2000. The actual number was almost 110 million; the prediction was off by over two orders of magnitude (adapted from Lozano, n.d.). As with the cell phone market, some markets for space station-based products and services could experience much more rapid growth than we have assumed here. New services and markets may emerge for products or services produced on a space station that could generate additional sources of revenues. If more focused market studies with credible data on particular activities emerge that predict revenues well above our estimates, those numbers should be substituted into the market analysis. An Excel workbook that accompanies this document makes it possible for the reader to generate alternative forecasts easily.
Our methodology ruled out products and services that are more than a decade away from becoming a reality, such as growing human organs in space and manufacturing entire GEO-class satellites in space. Markets like these and others we have not encountered in our research may prove to be profitable and thereby change the financial prospects and operational focus of the station.
There is also the risk that products or services that are projected to generate large revenues fail to do so. R&D directed towards producing these products in space may make it possible to produce those products on Earth at lower cost. If a company were to find a way to produce ZBLAN on Earth, for example, it would drastically change the analysis, making it more difficult for a private space station to generate a profit. There are similarly unknown implications from suborbital and parabolic flight opportunities.
120
Other challenges make our projections uncertain. We do not yet know the impact of future Chinese or Russian space stations and the extent to which these stations could draw away opportunities from a private space station.
Our most optimistic revenue estimates require both satellite servicing and exotic fiber optic cable production. Without either of these, expected revenues fall by at least 30 percent, which would severely affect the projected profitability of the station, especially if costs were to come in substantially higher than the low-cost projections.
3. Sensitivity Analyses For a number of parameters in this analysis, changes may have large effects on the
outcomes for some of the costs and revenues. One of the most critical parameters in this analysis is the price per kg for transporting cargo to the space station and the price of transporting astronauts. Our estimates are based on much lower launch costs and greater cargo capacity compared to what is available today. Without these improvements, potential space station revenues would be lower and operations costs would be substantially higher compared to the estimates calculated in this report.
All customers benefit from lower launch costs; a lower fraction of costs going to the launch provider means more income for the station operator and a larger potential market to which to supply services. If launch costs were even lower than assumed in the report, e.g., half as much as assumed ($10,000 per kg rather than $20,000, $2,500 per kg rather than $5,000 for fuel supply launch costs, $31 million instead of $62 million for the equivalent of a Falcon 9 launch, and $10 million rather than $20 million per human launched), either as a result of a technological breakthrough or a government subsidy, space station revenues would increase by 53 and 23 percent, for the low and high scenarios respectively, and costs decrease by 16 percent for the low-cost scenario (for the high-cost scenario, the cost of launch is not broken out). As a result, the net revenues for the low-cost scenarios would jump from -$8 million and $724 million to $310 million and $1,071 million, respectively.
If the U.S. Government should choose to subsidize a private space station by continuing to cover all launch costs—as it does today for commercial activities on the ISS—revenues in the low scenario would more than double, revenues in the high scenario would increase by 46 percent, costs in the low scenario would come down 33 percent, and net revenues would go up more than an order of magnitude (from -$8 million and $724 million annually to $627 million and $1,417 million annually). Figure 29a shows the percentage changes for revenues and costs in the 50 percent and 100 percent launch subsidy cases, and Figure 29b shows the percentage changes in profitability in the same two scenarios. It is worth pointing out that even in the best case (zero launch cost to users and

121
high revenues), our estimated revenues are still less than half those noted publicly by some stakeholders.30
Figure 29a. Revenues and Costs if Launch Costs Further Reduced/Subsidized
Figure 29b. Profitability Change if Launch Costs Further Reduced/Subsidized
30 Axiom Space notes a needed market of $37 billion between 2020 and 2030 (Messier 2016a).
-40%
-20%
0%
20%
40%
60%
80%
100%
120%
Launch Cost Reduction by 50% Launch Cost Reduction by 100%
Perc
ent I
ncre
ase
in R
even
ue/C
ost
Revenue Increase - Low Revenue Scenario Revenue Increase - High Revenue ScenarioCost Decrease - Low Cost Scenario
0%
200%
400%
600%
800%
1000%
1200%
Launch Cost Reduction by 50% Launch Cost Reduction by 100%
Perc
ent I
ncre
ase
in P
rofit
abili
ty
Profit Increase - Low Revenue Scenario Profit Increase - High Revenue Scenario

122
The potential revenue for satellite assembly is influenced by a number of other factors as well, including how many humans, if any, are required for satellite assembly and servicing. Smaller, cheaper satellites are less attractive to assemble in space because less money can be saved per satellite that would go towards paying for the station. As the launch market matures and competition drives prices down, satellite operators will have more choices. The estimated resupply price of $20,000 per kg for a satellite built in space would not seem so attractive if companies can offer dedicated launches for less than $10 million as some companies have promised. Alternatively, if the price per kg is too high, the satellite assembly company would likely not be able to generate a profit, and therefore neither would the station operator.
Based on our current estimates of the price per kg to launch, SiC and ZBLAN would still be profitable products to manufacture in space even if resupply costs do not drop from today’s prices. The lower the resupply costs, the more potential that other products would become more attractive for in-space manufacturing.
As resupply costs come down, so does the cost per hour of astronaut labor. As this is a major factor in media and education services, it could be possible to generate more business and therefore more revenue if launch costs were lower. Astronaut labor also greatly affects satellite assembly revenues.
Maximizing the ECLSS recyclable capability may lower operations costs and eliminate some expenses for astronauts. If an ECLSS that recycles 100 percent of water can be built for twice the price of one currently on ISS, such a system would add $20 million to $25 million per year to the amortized cost of the station. This may not be worth the investment to the station at current resupply prices. Previous research has shown that the tradeoff between the cost of a highly efficient ECLSS and the spare parts required to maintain it and the cost of additional resupply is more complex than previously thought (Do and de Weck 2015).
D. Barriers and Enablers to Private Investment in the Private Space Station Market Investors will not invest in a private space station if the risk is too high. It is therefore
important to take stock of the potential risks facing prospective investors and to assess ways in which those risks might be mitigated.
For a study sponsored by NASA in 2010, workshop participants examined potential future commercial activities in LEO and brainstormed about barriers to private investment in space markets (Davidson, Stone, and Fichtenbaum 2010). The study identified four general areas of risk facing investors in commercial activities in space: market risk, technology risk, regulatory and policy risk, and financial risk. We discuss each of these
123
risk categories as it pertains to a private space station together with ways in which these risks might be reduced.
1. Market Risks
a. Description Market risks are concerns about the size, composition, quality, reliability, longevity,
timing, and persistence of the markets for services provided by a private space station. The uncertainty associated with each of these elements is a part of market risk. Emerging markets are unproven, with little history about customers or transactions upon which to provide an investor with reliable insights for the future, making revenue projections highly uncertain, as is the case in this report. Because of these risks, many private investors are unwilling to make large investments in companies serving uncertain emerging markets.
b. Market Risk Reduction Enablers Mitigating market risks for private space stations primarily involves demonstrating to
investors that the market opportunities for private space stations are real. A sizable, credible market opportunity can overcome investor reluctance on many other fronts, including concerns about the technology, capital requirements, competitive risks, and sometimes regulatory risks. The agreements listed below are ways to secure from a paying customer their intent to purchase products or services when those products or services have not yet been made commercially available. These mechanisms provide a firm commitment from a future customer, thereby reducing market risk and increasing the ability of a private company to raise the capital needed to complete the project. A space station would require substantial capital. It would also take a long time to build, probably at least five years after the design phase has been completed. For such a project, these agreements are most helpful in reducing risk when they are provided at a point in the project before significant capital outlays are needed. Such agreements give investors confidence that the market exists for the product or service to be provided.
• Advance purchase agreements: Customers interested in services provided by a private space station can write an advance purchase agreement, laying out the performance specifications of the service they require, the price they are willing to pay for the service if the specifications are met, the quantities they are willing to buy, and the time horizon over which the purchase agreement is valid.
• Open indefinite delivery, indefinite quantity (IDIQ) advance purchase agreements: These are similar to advance purchase agreements, but have an indefinite time horizon and indefinite quantities.
124
• Advance long-term lease agreements: Commitment of a large or important customer to lease a significant portion of a private space station for an extended period of time. Such agreements provide surety for the future project and the future market.
2. Technology Risks
a. Description Technology risks are concerns that the technical solutions being offered (1) will not
perform as anticipated, (2) will take longer than anticipated to develop, or (3) cannot be developed at all. If the technical solutions do not perform as anticipated, they may not be accepted well by the market. If the technical solutions are late, they may miss the key timing needed to capture critical market share. If the technical solutions needed cannot be developed, the market opportunity cannot be pursued at all.
b. Technology Risk Reduction Enablers Mitigating technology risks for a private space station is key to increasing investor
confidence in the investment opportunity. While companies are often optimistic about the technical solutions they propose, investors are typically less optimistic and view the technical solutions as an element of material concern for them (Davidson, Stone, and Fichtenbaum 2010). Options for mitigating technology risk as a barrier to investment in private space stations are:
• Use flight-proven components and designs: Components, subsystems, and designs that have been successfully flown in space in the past are a cost-effective way to reduce technology risk, giving investors confidence.
• Prototype and test new components and designs: Conduct modeling, simulation, and testing of new components and designs early on in the development of the technical solution. Computer-based modeling and simulation are cost-effective techniques and require less upfront capital investment.
• Conduct basic and pre-competitive research: If elements of a proposed technical solution require significant basic research or pre-competitive research before they can be designed and prototyped, investors will be concerned about the potential long timelines this may imply. Any required basic or pre-competitive research should ideally be completed before going to investors.
125
3. Regulatory and Policy Risks
a. Description Regulatory and policy risks are concerns that existing or future government rules,
regulations, or policies may negatively affect the success of a business endeavor and hence degrade or negate the potential returns on investments. These are risks that are somewhat unique to space markets, and investors may be generally unfamiliar or uncomfortable with them, which in turns suggests that investors may not know how to appropriately evaluate this category of risks.
Regulatory risks include indemnification issues and compliance with International Traffic in Arms Regulations (ITAR), among other regulations and laws, as well as the uncertainties associated with these issues. Regulatory compliance can be costly; penalties for non-compliance can drive returns on investment to zero for new ventures. Policy risks include competing government programs like the ISS, government practices that lead to an uneven playing field in the commercial space industry, and the reliability of a government customer’s budget needed to make payments for services purchased from a space station, among other issues, as well as the uncertainties associated with these issues.
b. Regulatory and Policy Risk Reduction Enablers Mitigating regulatory and policy risks for a private space station will require
cooperation and assistance from the Federal Government as the primary determining body for regulations and policy governing space markets. Options for mitigating regulatory and policy risk as a barrier to investment in private space stations include:
• Indemnification: The Federal Government provides indemnification to launch vehicle providers, sharing in the responsibility for third-party damages from a launch accident. Under the current launch indemnification regime, launch providers need to demonstrate financial responsibility for the initial roughly $100 million increment of damage; the government then covers the next increment up to roughly $2.8 billion.31 Responsibility for losses above that government-covered level revert back to the launch vehicle company. Such an indemnification regime extended to a nascent private space station market would mitigate financial uncertainty associated with accidents, allowing companies to purchase insurance to cover their financial obligations in the event of an accident.
31 The legislation establishing shared indemnification was written in 1988. At that time, the upper limit on
the Federal Government’s liability was set at $1.5 billion. In the legislation, this limit was to be regularly adjusted for inflation. The $1.5 billion limit in 1988 dollars has risen to about $2.8 billion in today’s dollars.
126
• Assistance with ITAR compliance: Complying with ITAR regulations, which currently govern most products in space markets, can be expensive and sometimes creates an uneven international competitive playing field. U.S. ITAR rules are more stringent than many other countries’ security regulations, allowing those countries to sell more freely to a larger market. Offering companies building private space stations assistance with ITAR compliance could help mitigate this risk.
• Competition from the ISS: The ISS is a potential competitor to a private space station because its retirement date is uncertain. Under current policy, the United States will support the ISS through 2024, but the life of the ISS may be extended beyond that date. Such uncertainty regarding a large, significant, subsidized competitor creates concerns among investors. A firm retirement date and plan for the ISS by the Federal Government, along with credible program actions that support those decisions, would help to mitigate this risk of competition from the Federal Government.
• Creating an even private sector playing field: As the emerging industry and market for a private space station evolves, the Federal Government will need to consider how to ensure that the playing field is even, by making sure not to provide advantages to some players while disadvantaging others.
• Reliability of revenues from government customers: The Federal Government and foreign governments could be potentially significant customers for services provided from a private space station. Revenue streams originating from government customers introduce uncertainties that are hard to predict; governments often lack legal authority to commit to expenditures over the long time horizons needed for the development and operation of a private space station. Policy shifts that could permit government customers to provide more long-term support and commitments to private space stations could help to mitigate this risk.
4. Financial Risks
a. Description Financial risks are concerns that the business case may not close; that an appropriate
risk-adjusted return for investors may not come to fruition. In the first part of this chapter, the potential revenues and costs for a private space station were summarized. Looking at the low-revenue estimate or the high-cost estimate, there is good reason for investors to be concerned about the financial risks of a private space station. Add the long-duration, capital-intensive nature of development activities like those associated with a private space station, and investor concerns intensify.
127
b. Financial Risk Reduction Enablers Mitigating financial risks in large part revolves around the credibility and reliability
of the projections underlying the revenues and costs that will generate the potential returns on investment. Narrowing the uncertainties associated with projections of demand for services provided by private space stations and the costs to build, launch, and operate private space stations contributes to producing a more credible prospective return on investment for an investor. All the mechanisms for reducing market risk outlined in the previous subsections are key to producing better estimates of prospective market size, characteristics, and risks. Similarly, the mechanisms for reducing technology risk contribute to building confidence in the magnitude and timing of capital requirements. Reducing regulatory and policy risks builds further confidence that regulations and government policy will support and not inhibit the growth and expansion of the private space station market, and will favorably affect and not increase the cost of material, development, or capital required for the private space station. Reducing the market, technology, and regulatory risks will contribute to reducing the financial risks of the business case.
In addition to having credible projections of returns on investment, financial risks can be further mitigated by access to debt instruments as well as equity. A balanced, efficient capital structure contributes to reducing financial risk. Affordable existing debt instruments may not be available to companies seeking to build a private space station, as such investments are perceived to be too risky. Government loan guarantees can play a role in opening up debt markets for such companies. These guarantees protect the lenders’ capital by promising that the government will pay a portion of the loan if the company should default on it. They make lenders more willing to extend loans because the government takes on some of the risk that the loans will not be repaid.
Tax breaks and tax incentives for making investments in R&D associated with a private space station can help mitigate financial risks by reducing tax obligations. These enablers need to be considered carefully so that they do not create an uneven playing field, favoring larger companies that have net positive revenues and thus may be in a better position to take advantage of tax credits.
E. How Can the Federal Government Participate in the Private Space Station Market? We found that it is unlikely that a commercially owned and operated space station
will be economically viable by 2025 without an explicit government subsidy. It could yield an attractive rate-of-return under our most optimistic assumptions However, discussions with some members of the venture capital community indicate that they view the revenue streams as too uncertain to warrant substantial investment. A wealthy individual could choose to self-finance the project. Alternatively, or in conjunction with the private sector,
128
the Federal Government may wish to think in advance about the development of a private space station in terms of how it might like to participate in markets for services provided by such a station. Participation options range across a spectrum, from earlier and more proactive involvement in the form of a public-private partnership to guide and shape the construction of a private space station, to later-stage involvement as a general consumer of whatever private space station services might emerge. Examples of three options along that spectrum of potential Federal Government involvement are (1) early stage investment in a public-private partnership, (2) executing advance purchase or lease agreements, and (3) buying private space station services after a space station has been built.
1. Early Stage Investment in Private Space Stations
a. Benefits and Drawbacks The advent of funded Space Act Agreements (SAAs) offers a validated legal
mechanism for the Federal Government to make an early stage investment in a future private space station. Funded SAAs allow the government to make an investment in a system that a private company will build, own, and operate. Rather than the government paying the full cost to design, build, and operate such a system, the government shares that cost with private industry in a partnership arrangement. Instead of setting lengthy, detailed requirements, the government sets out a broad set of capabilities it desires from such a system. Private industry is then free to propose its own solution that meets those broad requirements for capabilities. Industry owns the resulting system and associated intellectual property. The government benefits by gaining access to the capabilities it needs at a cost that may be significantly lower than if it had procured a system through a traditional contracting mechanism to build a station that would be government-owned and government-operated. In addition to cost benefits, a public-private partnership allows the Federal Government to direct efforts along a trajectory that would be most useful to it or most synergistic with other ongoing and planned government efforts in space.
Such public-private partnerships are not without risk or cost. There is a risk the partnership may not produce the results desired. When the government is only one investor among many, it has less ability to intervene if activities are not going as planned. Public-private partnerships are an investment mechanism, and thus require the government to commit funds early in the development process, when the risks to the project are still large. Despite these drawbacks, one recent example of a successful public-private partnership was NASA’s COTS program, which utilized funded SAAs to develop new launch systems to bring supplies and crew to the ISS.
129
b. Case Study: NASA COTS Program When NASA COTS funded SAAs in 2006, it introduced a new contracting
mechanism for the space industry. The COTS SAAs provided significant flexibility, paying fixed fee amounts upon completion of technical or financial milestones rather than on a schedule. Contracts could be terminated if NASA did not receive expected appropriations or if the commercial partner on the SAA did not meet milestones. COTS ended in 2014. It was a successful example of early government investment in public-private partnerships in the space arena. Among the key lessons learned were (NASA 2014e):
• Government expenditures on the COTS capability provided only 50 percent of the COTS development costs.
• Fixed price milestone payments created incentives for private industry partners to control costs and reduce schedule delays.
• Setting out broad capabilities and providing government oversight on the COTS development program (instead of a detailed set of requirements) allowed private industry partners to both innovate and reduce life-cycle development costs.
• The ability to retain intellectual property rights on the part of private industry partners under COTS limited termination liability, and the Federal Government’s commitment to purchase the services once the systems were operational was crucial for attracting private investment.
• The government as a customer perceived that a diversified set of commercial partners in the COTS program, each having different strengths and capabilities, balanced business and technical risk.
The lessons from the COTS program point the way to how public-private partnerships can be used to help create a private space station.
2. Advance Purchase or Lease Agreements Advance purchase agreements set performance specifications for the product or
service, the price to be paid for the product or service if the specifications are met, the quantity to be purchased, and the time horizon over which the purchase agreement is valid. For example, an advance purchase agreement might contract for 200 days of astronaut stay, 600 meals, and 1,000 standard equipment rack operating hours per year between 2028 and 2031 on a private space station. If the advance purchase agreement is an IDIQ, the quantity and time horizon are indefinite. Advance purchase agreements written by the government for private space station services should receive more favorable pricing and terms in return for providing an early customer commitment.
Advance long-term lease agreements would commit the government to use a portion or all of a private space station for an extended period of time. Long-term lease agreements
130
have been in widespread use in the commercial airline industry for decades. Airlines find leasing airplanes to be more attractive than outright purchase and ownership of the airplane, reducing capital demands on their balance sheets. Lease agreements facilitate better cash flow at airlines by aligning in time the costs of providing a service with the revenue from that service. These benefits would also accrue to the Federal Government if it leased space on a private space station.
3. Direct Purchases of Space Station Services The Federal Government could wait until a space station is completed and operating
and rent space or purchase other services provided by the station at that point as needed. In this instance, the government would not provide any of the initial investment in a private space station, nor would it commit to purchase services or lease space in advance. Although the government would make no advance commitments under this option, it would also not have much leverage in shaping and driving the design and construction of the space station. Because the government would take a wait-and-see approach, only committing to the market once it has more fully emerged and been proven by other customers, the space station owners would have no reason to provide favorable treatment to the government as a customer. The government might have to pay higher prices to purchase services from the space station. If the space station faces capacity constraints, the government might find it is unable to purchase services, as the space station operator would favor customers who have made advance commitments.
Table 27 summarizes the benefits and drawbacks of these various options for government participation in a private space station.
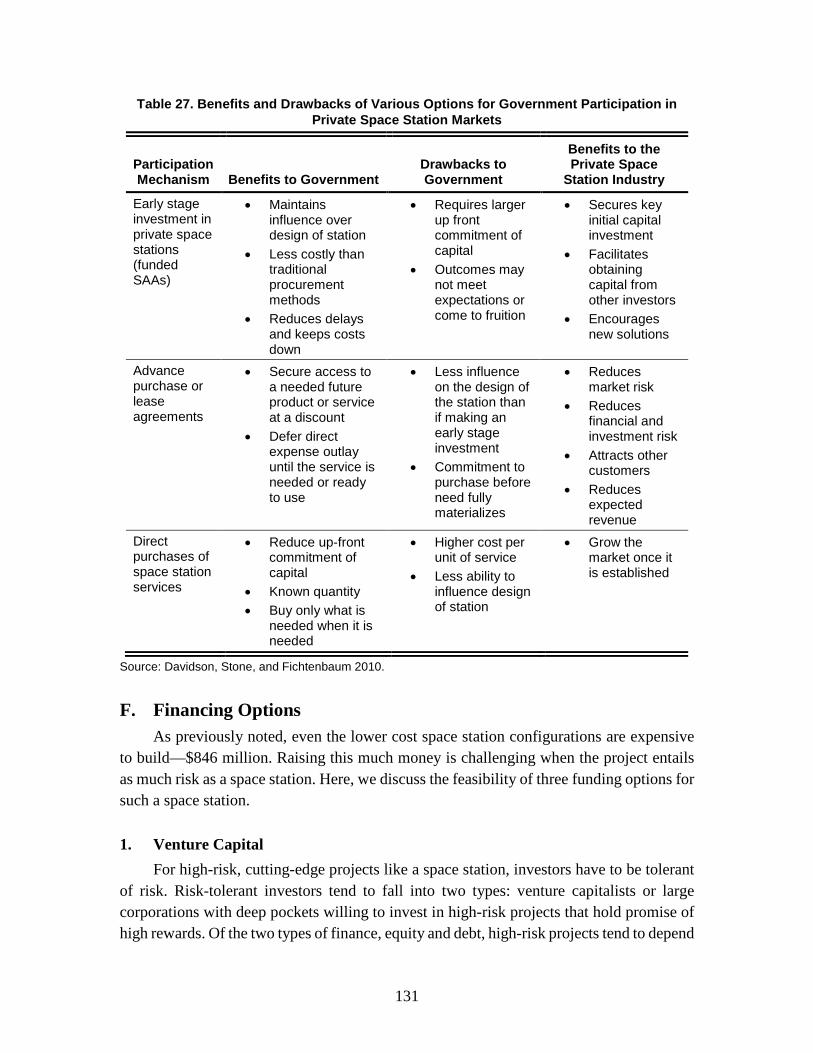
131
Table 27. Benefits and Drawbacks of Various Options for Government Participation in Private Space Station Markets
Participation Mechanism Benefits to Government
Drawbacks to Government
Benefits to the Private Space
Station Industry
Early stage investment in private space stations (funded SAAs)
• Maintains influence over design of station
• Less costly than traditional procurement methods
• Reduces delays and keeps costs down
• Requires larger up front commitment of capital
• Outcomes may not meet expectations or come to fruition
• Secures key initial capital investment
• Facilitates obtaining capital from other investors
• Encourages new solutions
Advance purchase or lease agreements
• Secure access to a needed future product or service at a discount
• Defer direct expense outlay until the service is needed or ready to use
• Less influence on the design of the station than if making an early stage investment
• Commitment to purchase before need fully materializes
• Reduces market risk
• Reduces financial and investment risk
• Attracts other customers
• Reduces expected revenue
Direct purchases of space station services
• Reduce up-front commitment of capital
• Known quantity • Buy only what is
needed when it is needed
• Higher cost per unit of service
• Less ability to influence design of station
• Grow the market once it is established
Source: Davidson, Stone, and Fichtenbaum 2010.
F. Financing Options As previously noted, even the lower cost space station configurations are expensive
to build—$846 million. Raising this much money is challenging when the project entails as much risk as a space station. Here, we discuss the feasibility of three funding options for such a space station.
1. Venture Capital For high-risk, cutting-edge projects like a space station, investors have to be tolerant
of risk. Risk-tolerant investors tend to fall into two types: venture capitalists or large corporations with deep pockets willing to invest in high-risk projects that hold promise of high rewards. Of the two types of finance, equity and debt, high-risk projects tend to depend
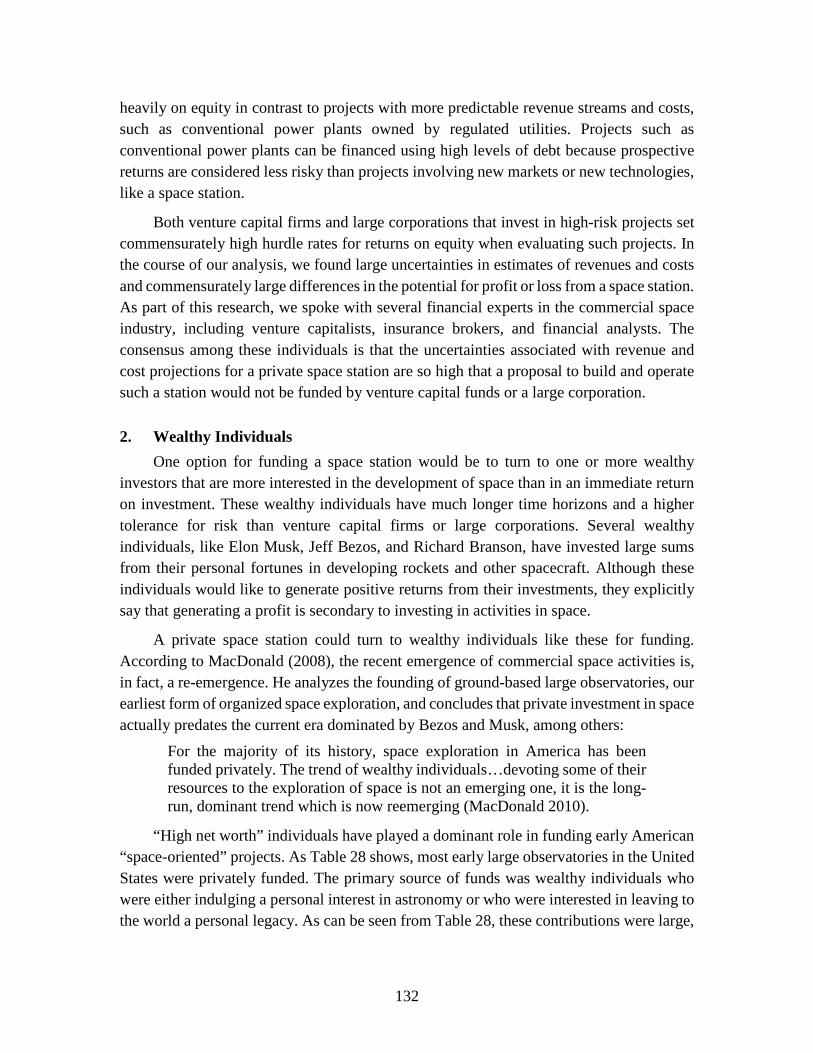
132
heavily on equity in contrast to projects with more predictable revenue streams and costs, such as conventional power plants owned by regulated utilities. Projects such as conventional power plants can be financed using high levels of debt because prospective returns are considered less risky than projects involving new markets or new technologies, like a space station.
Both venture capital firms and large corporations that invest in high-risk projects set commensurately high hurdle rates for returns on equity when evaluating such projects. In the course of our analysis, we found large uncertainties in estimates of revenues and costs and commensurately large differences in the potential for profit or loss from a space station. As part of this research, we spoke with several financial experts in the commercial space industry, including venture capitalists, insurance brokers, and financial analysts. The consensus among these individuals is that the uncertainties associated with revenue and cost projections for a private space station are so high that a proposal to build and operate such a station would not be funded by venture capital funds or a large corporation.
2. Wealthy Individuals One option for funding a space station would be to turn to one or more wealthy
investors that are more interested in the development of space than in an immediate return on investment. These wealthy individuals have much longer time horizons and a higher tolerance for risk than venture capital firms or large corporations. Several wealthy individuals, like Elon Musk, Jeff Bezos, and Richard Branson, have invested large sums from their personal fortunes in developing rockets and other spacecraft. Although these individuals would like to generate positive returns from their investments, they explicitly say that generating a profit is secondary to investing in activities in space.
A private space station could turn to wealthy individuals like these for funding. According to MacDonald (2008), the recent emergence of commercial space activities is, in fact, a re-emergence. He analyzes the founding of ground-based large observatories, our earliest form of organized space exploration, and concludes that private investment in space actually predates the current era dominated by Bezos and Musk, among others:
For the majority of its history, space exploration in America has been funded privately. The trend of wealthy individuals…devoting some of their resources to the exploration of space is not an emerging one, it is the long-run, dominant trend which is now reemerging (MacDonald 2010).
“High net worth” individuals have played a dominant role in funding early American “space-oriented” projects. As Table 28 shows, most early large observatories in the United States were privately funded. The primary source of funds was wealthy individuals who were either indulging a personal interest in astronomy or who were interested in leaving to the world a personal legacy. As can be seen from Table 28, these contributions were large,
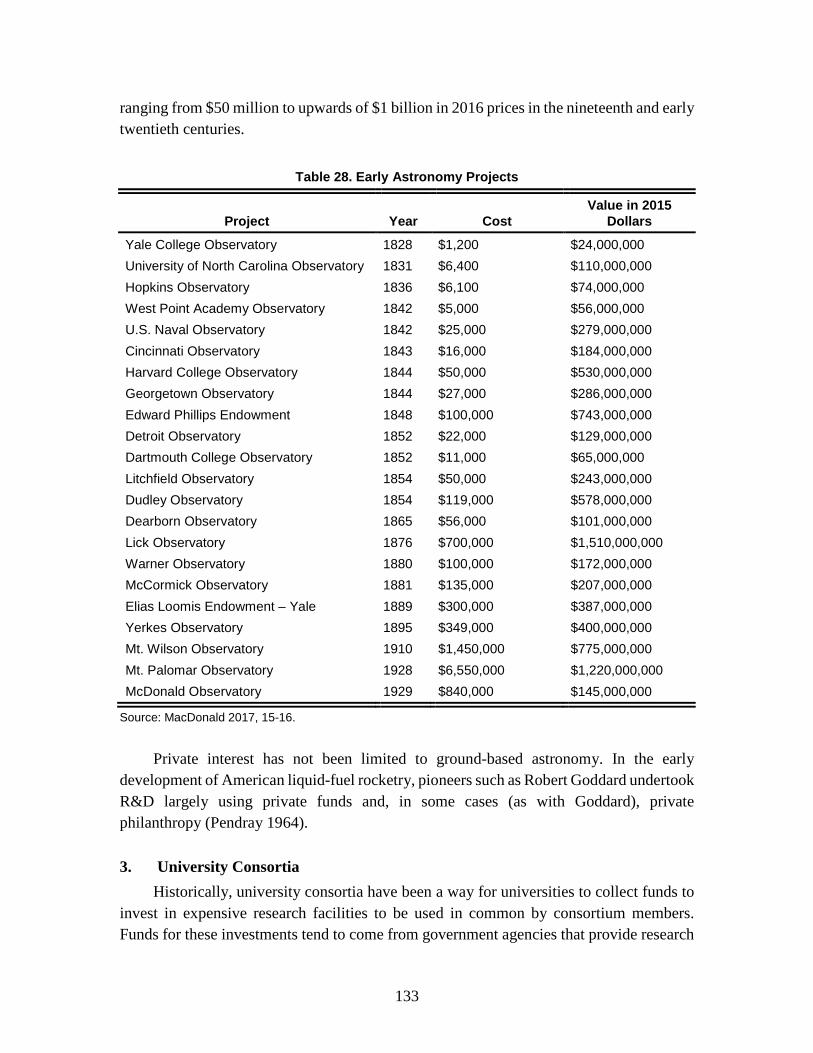
133
ranging from $50 million to upwards of $1 billion in 2016 prices in the nineteenth and early twentieth centuries.
Table 28. Early Astronomy Projects
Project Year Cost Value in 2015
Dollars
Yale College Observatory 1828 $1,200 $24,000,000 University of North Carolina Observatory 1831 $6,400 $110,000,000 Hopkins Observatory 1836 $6,100 $74,000,000 West Point Academy Observatory 1842 $5,000 $56,000,000 U.S. Naval Observatory 1842 $25,000 $279,000,000 Cincinnati Observatory 1843 $16,000 $184,000,000 Harvard College Observatory 1844 $50,000 $530,000,000 Georgetown Observatory 1844 $27,000 $286,000,000 Edward Phillips Endowment 1848 $100,000 $743,000,000 Detroit Observatory 1852 $22,000 $129,000,000 Dartmouth College Observatory 1852 $11,000 $65,000,000 Litchfield Observatory 1854 $50,000 $243,000,000 Dudley Observatory 1854 $119,000 $578,000,000 Dearborn Observatory 1865 $56,000 $101,000,000 Lick Observatory 1876 $700,000 $1,510,000,000 Warner Observatory 1880 $100,000 $172,000,000 McCormick Observatory 1881 $135,000 $207,000,000 Elias Loomis Endowment – Yale 1889 $300,000 $387,000,000 Yerkes Observatory 1895 $349,000 $400,000,000 Mt. Wilson Observatory 1910 $1,450,000 $775,000,000 Mt. Palomar Observatory 1928 $6,550,000 $1,220,000,000 McDonald Observatory 1929 $840,000 $145,000,000
Source: MacDonald 2017, 15-16.
Private interest has not been limited to ground-based astronomy. In the early
development of American liquid-fuel rocketry, pioneers such as Robert Goddard undertook R&D largely using private funds and, in some cases (as with Goddard), private philanthropy (Pendray 1964).
3. University Consortia Historically, university consortia have been a way for universities to collect funds to
invest in expensive research facilities to be used in common by consortium members. Funds for these investments tend to come from government agencies that provide research
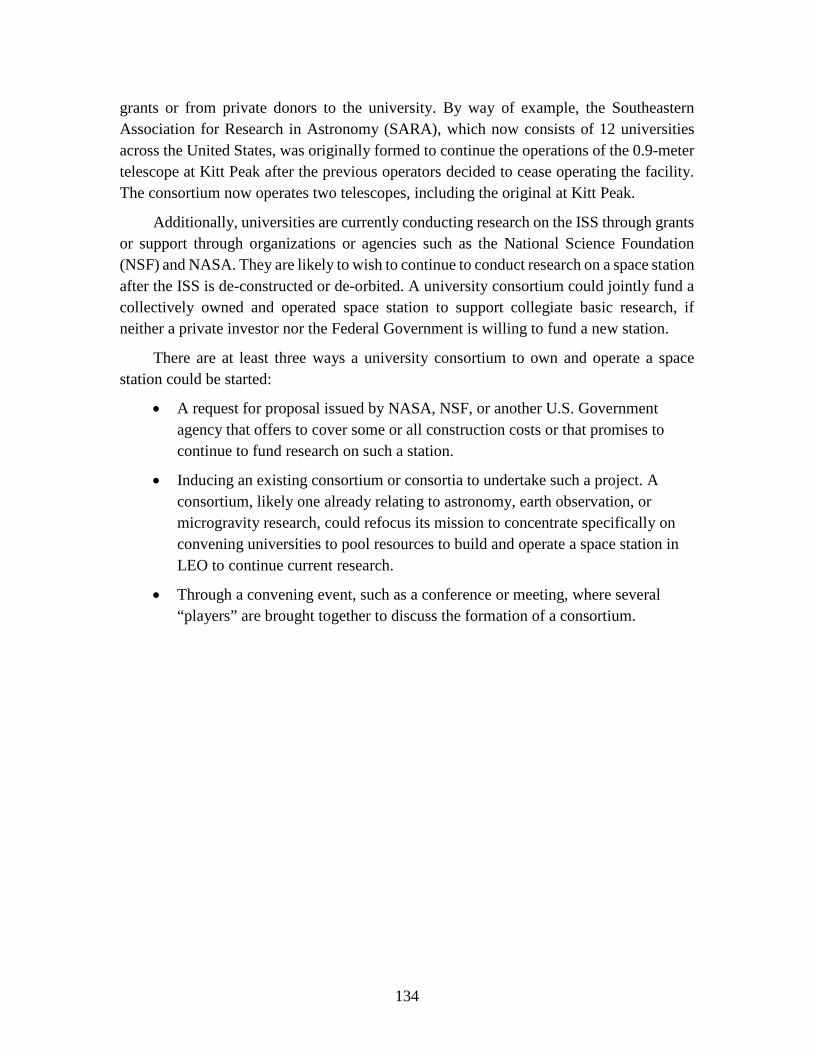
134
grants or from private donors to the university. By way of example, the Southeastern Association for Research in Astronomy (SARA), which now consists of 12 universities across the United States, was originally formed to continue the operations of the 0.9-meter telescope at Kitt Peak after the previous operators decided to cease operating the facility. The consortium now operates two telescopes, including the original at Kitt Peak.
Additionally, universities are currently conducting research on the ISS through grants or support through organizations or agencies such as the National Science Foundation (NSF) and NASA. They are likely to wish to continue to conduct research on a space station after the ISS is de-constructed or de-orbited. A university consortium could jointly fund a collectively owned and operated space station to support collegiate basic research, if neither a private investor nor the Federal Government is willing to fund a new station.
There are at least three ways a university consortium to own and operate a space station could be started:
• A request for proposal issued by NASA, NSF, or another U.S. Government agency that offers to cover some or all construction costs or that promises to continue to fund research on such a station.
• Inducing an existing consortium or consortia to undertake such a project. A consortium, likely one already relating to astronomy, earth observation, or microgravity research, could refocus its mission to concentrate specifically on convening universities to pool resources to build and operate a space station in LEO to continue current research.
• Through a convening event, such as a conference or meeting, where several “players” are brought together to discuss the formation of a consortium.
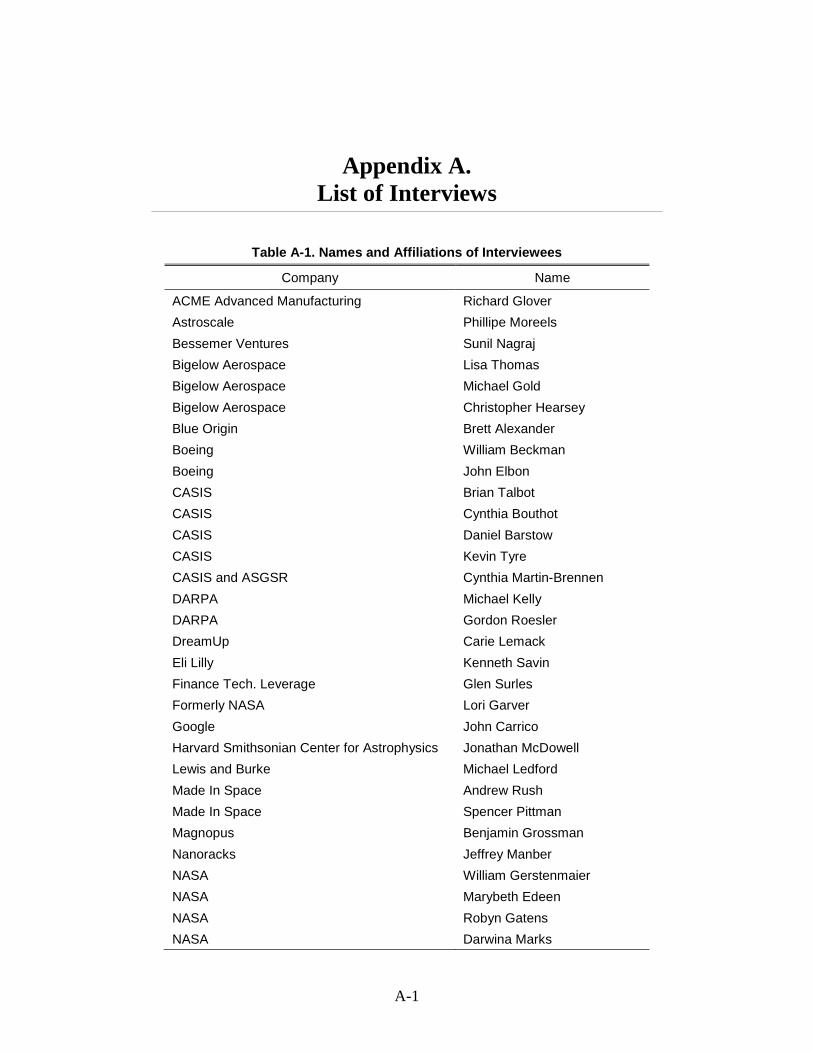
A-1
Appendix A. List of Interviews
Table A-1. Names and Affiliations of Interviewees
Company Name
ACME Advanced Manufacturing Richard Glover Astroscale Phillipe Moreels Bessemer Ventures Sunil Nagraj Bigelow Aerospace Lisa Thomas Bigelow Aerospace Michael Gold Bigelow Aerospace Christopher Hearsey Blue Origin Brett Alexander Boeing William Beckman Boeing John Elbon CASIS Brian Talbot CASIS Cynthia Bouthot CASIS Daniel Barstow CASIS Kevin Tyre CASIS and ASGSR Cynthia Martin-Brennen DARPA Michael Kelly DARPA Gordon Roesler DreamUp Carie Lemack Eli Lilly Kenneth Savin Finance Tech. Leverage Glen Surles Formerly NASA Lori Garver Google John Carrico Harvard Smithsonian Center for Astrophysics Jonathan McDowell Lewis and Burke Michael Ledford Made In Space Andrew Rush Made In Space Spencer Pittman Magnopus Benjamin Grossman Nanoracks Jeffrey Manber NASA William Gerstenmaier NASA Marybeth Edeen NASA Robyn Gatens NASA Darwina Marks
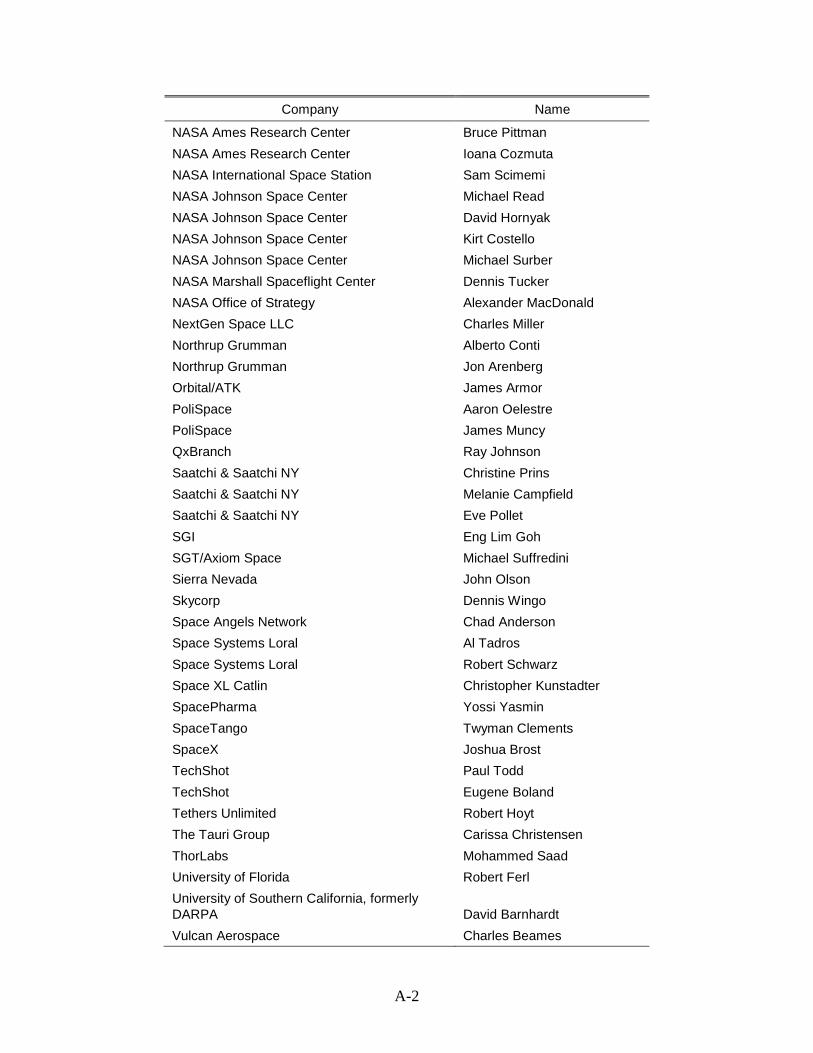
A-2
Company Name
NASA Ames Research Center Bruce Pittman NASA Ames Research Center Ioana Cozmuta NASA International Space Station Sam Scimemi NASA Johnson Space Center Michael Read NASA Johnson Space Center David Hornyak NASA Johnson Space Center Kirt Costello NASA Johnson Space Center Michael Surber NASA Marshall Spaceflight Center Dennis Tucker NASA Office of Strategy Alexander MacDonald NextGen Space LLC Charles Miller Northrup Grumman Alberto Conti Northrup Grumman Jon Arenberg Orbital/ATK James Armor PoliSpace Aaron Oelestre PoliSpace James Muncy QxBranch Ray Johnson Saatchi & Saatchi NY Christine Prins Saatchi & Saatchi NY Melanie Campfield Saatchi & Saatchi NY Eve Pollet SGI Eng Lim Goh SGT/Axiom Space Michael Suffredini Sierra Nevada John Olson Skycorp Dennis Wingo Space Angels Network Chad Anderson Space Systems Loral Al Tadros Space Systems Loral Robert Schwarz Space XL Catlin Christopher Kunstadter SpacePharma Yossi Yasmin SpaceTango Twyman Clements SpaceX Joshua Brost TechShot Paul Todd TechShot Eugene Boland Tethers Unlimited Robert Hoyt The Tauri Group Carissa Christensen ThorLabs Mohammed Saad University of Florida Robert Ferl University of Southern California, formerly DARPA David Barnhardt Vulcan Aerospace Charles Beames

A-3
Company Name
Wyle Labs, NASA Space Biology Kevin Sato Zero Gravity Solutions Richard Godwin

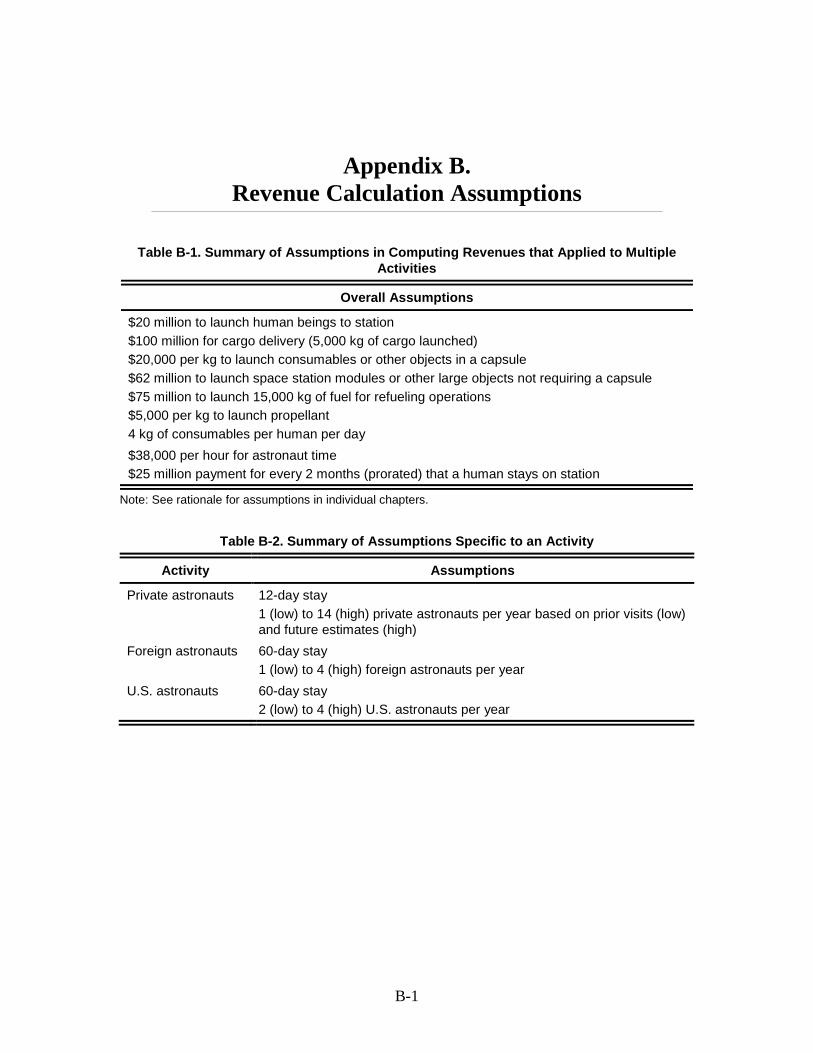
B-1
Appendix B. Revenue Calculation Assumptions
Table B-1. Summary of Assumptions in Computing Revenues that Applied to Multiple Activities
Overall Assumptions
$20 million to launch human beings to station $100 million for cargo delivery (5,000 kg of cargo launched) $20,000 per kg to launch consumables or other objects in a capsule $62 million to launch space station modules or other large objects not requiring a capsule $75 million to launch 15,000 kg of fuel for refueling operations $5,000 per kg to launch propellant 4 kg of consumables per human per day $38,000 per hour for astronaut time $25 million payment for every 2 months (prorated) that a human stays on station
Note: See rationale for assumptions in individual chapters.
Table B-2. Summary of Assumptions Specific to an Activity
Activity Assumptions
Private astronauts 12-day stay 1 (low) to 14 (high) private astronauts per year based on prior visits (low) and future estimates (high)
Foreign astronauts 60-day stay 1 (low) to 4 (high) foreign astronauts per year
U.S. astronauts 60-day stay 2 (low) to 4 (high) U.S. astronauts per year
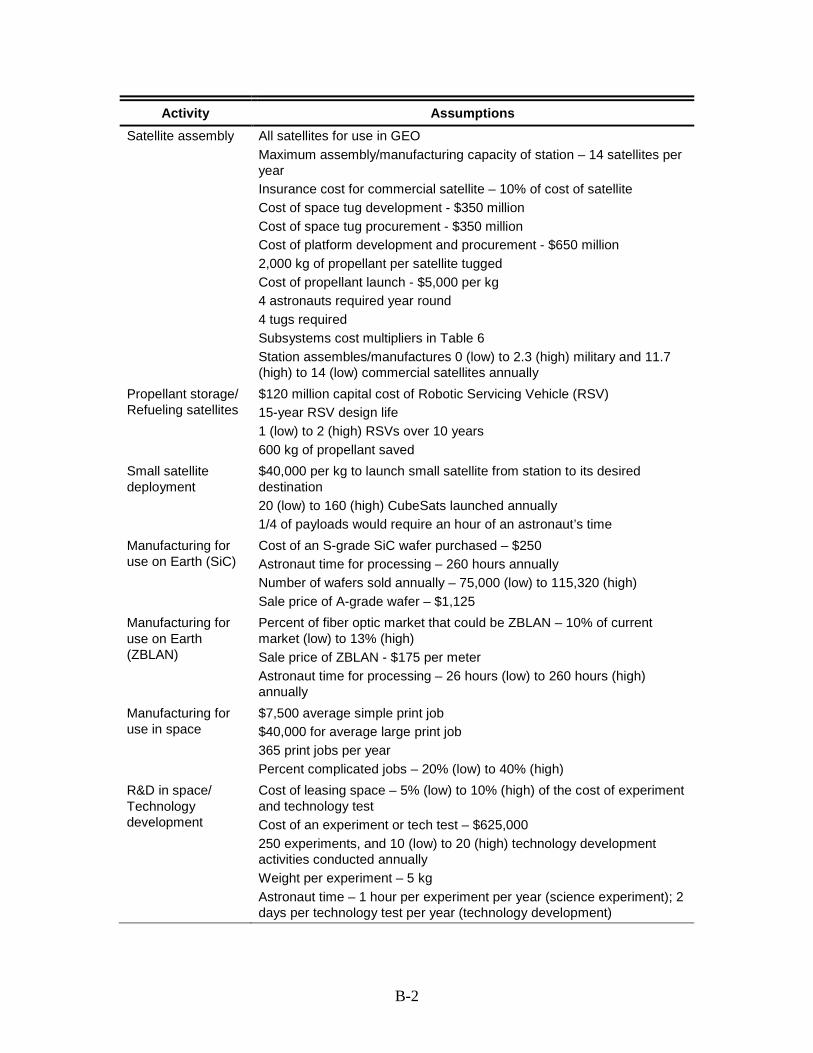
B-2
Activity Assumptions Satellite assembly All satellites for use in GEO
Maximum assembly/manufacturing capacity of station – 14 satellites per year Insurance cost for commercial satellite – 10% of cost of satellite Cost of space tug development - $350 million Cost of space tug procurement - $350 million Cost of platform development and procurement - $650 million 2,000 kg of propellant per satellite tugged Cost of propellant launch - $5,000 per kg 4 astronauts required year round 4 tugs required Subsystems cost multipliers in Table 6 Station assembles/manufactures 0 (low) to 2.3 (high) military and 11.7 (high) to 14 (low) commercial satellites annually
Propellant storage/ Refueling satellites
$120 million capital cost of Robotic Servicing Vehicle (RSV) 15-year RSV design life 1 (low) to 2 (high) RSVs over 10 years 600 kg of propellant saved
Small satellite deployment
$40,000 per kg to launch small satellite from station to its desired destination 20 (low) to 160 (high) CubeSats launched annually 1/4 of payloads would require an hour of an astronaut’s time
Manufacturing for use on Earth (SiC)
Cost of an S-grade SiC wafer purchased – $250 Astronaut time for processing – 260 hours annually Number of wafers sold annually – 75,000 (low) to 115,320 (high) Sale price of A-grade wafer – $1,125
Manufacturing for use on Earth (ZBLAN)
Percent of fiber optic market that could be ZBLAN – 10% of current market (low) to 13% (high) Sale price of ZBLAN - $175 per meter Astronaut time for processing – 26 hours (low) to 260 hours (high) annually
Manufacturing for use in space
$7,500 average simple print job $40,000 for average large print job 365 print jobs per year Percent complicated jobs – 20% (low) to 40% (high)
R&D in space/ Technology development
Cost of leasing space – 5% (low) to 10% (high) of the cost of experiment and technology test Cost of an experiment or tech test – $625,000 250 experiments, and 10 (low) to 20 (high) technology development activities conducted annually Weight per experiment – 5 kg Astronaut time – 1 hour per experiment per year (science experiment); 2 days per technology test per year (technology development)
B-3
Activity Assumptions
Earth observation $14 million for satellite bus (70 kg) 4 (low) to 5 (high) sensors per station
Film and video 12-day shoots 48 hours of astronaut/station personnel time 4 documentaries over 10 years (low); 1 per year (high) 4 (low) to 10 (high) feature films over 10 years
Advertising 1 astronaut filming for 12 hours 1 (low) to 6 (high) commercials per year
Sponsorships $8 million per sponsor 1 (low) to 4 (high) sponsors per year
Naming rights $6 million per year contract (low) to $25 million per year contract (high) Sponsored events and sporting events
1 (low) to 4 (high) sponsors annually 1 (low) to 2 (high) stunts per year 3 personnel on station for sporting event 3 (low) to 10 (high) sporting events per decade
Virtual reality 300,000 subscribers annually $12 for services per year
Education $31,250 to host the experiment on station 10 to 20 experiments annually 30 minutes per astronaut phone call
Note: See rationale for assumptions in individual chapters.

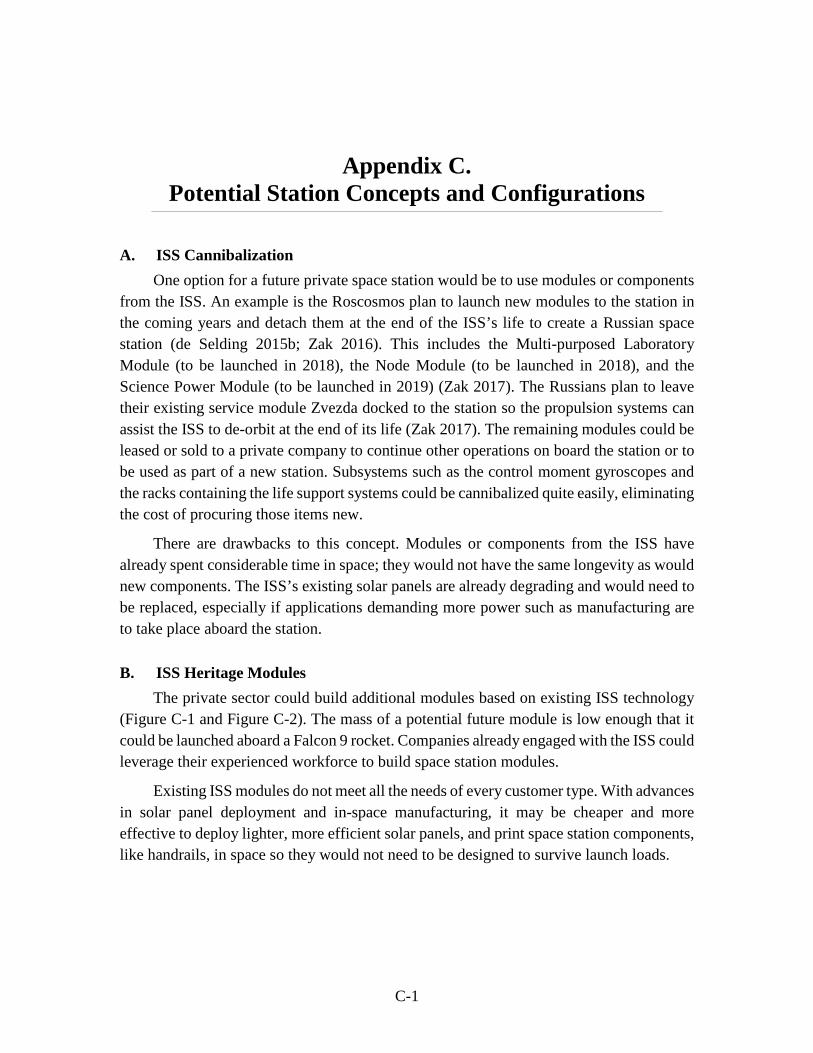
C-1
Appendix C. Potential Station Concepts and Configurations
A. ISS Cannibalization One option for a future private space station would be to use modules or components
from the ISS. An example is the Roscosmos plan to launch new modules to the station in the coming years and detach them at the end of the ISS’s life to create a Russian space station (de Selding 2015b; Zak 2016). This includes the Multi-purposed Laboratory Module (to be launched in 2018), the Node Module (to be launched in 2018), and the Science Power Module (to be launched in 2019) (Zak 2017). The Russians plan to leave their existing service module Zvezda docked to the station so the propulsion systems can assist the ISS to de-orbit at the end of its life (Zak 2017). The remaining modules could be leased or sold to a private company to continue other operations on board the station or to be used as part of a new station. Subsystems such as the control moment gyroscopes and the racks containing the life support systems could be cannibalized quite easily, eliminating the cost of procuring those items new.
There are drawbacks to this concept. Modules or components from the ISS have already spent considerable time in space; they would not have the same longevity as would new components. The ISS’s existing solar panels are already degrading and would need to be replaced, especially if applications demanding more power such as manufacturing are to take place aboard the station.
B. ISS Heritage Modules The private sector could build additional modules based on existing ISS technology
(Figure C-1 and Figure C-2). The mass of a potential future module is low enough that it could be launched aboard a Falcon 9 rocket. Companies already engaged with the ISS could leverage their experienced workforce to build space station modules.
Existing ISS modules do not meet all the needs of every customer type. With advances in solar panel deployment and in-space manufacturing, it may be cheaper and more effective to deploy lighter, more efficient solar panels, and print space station components, like handrails, in space so they would not need to be designed to survive launch loads.
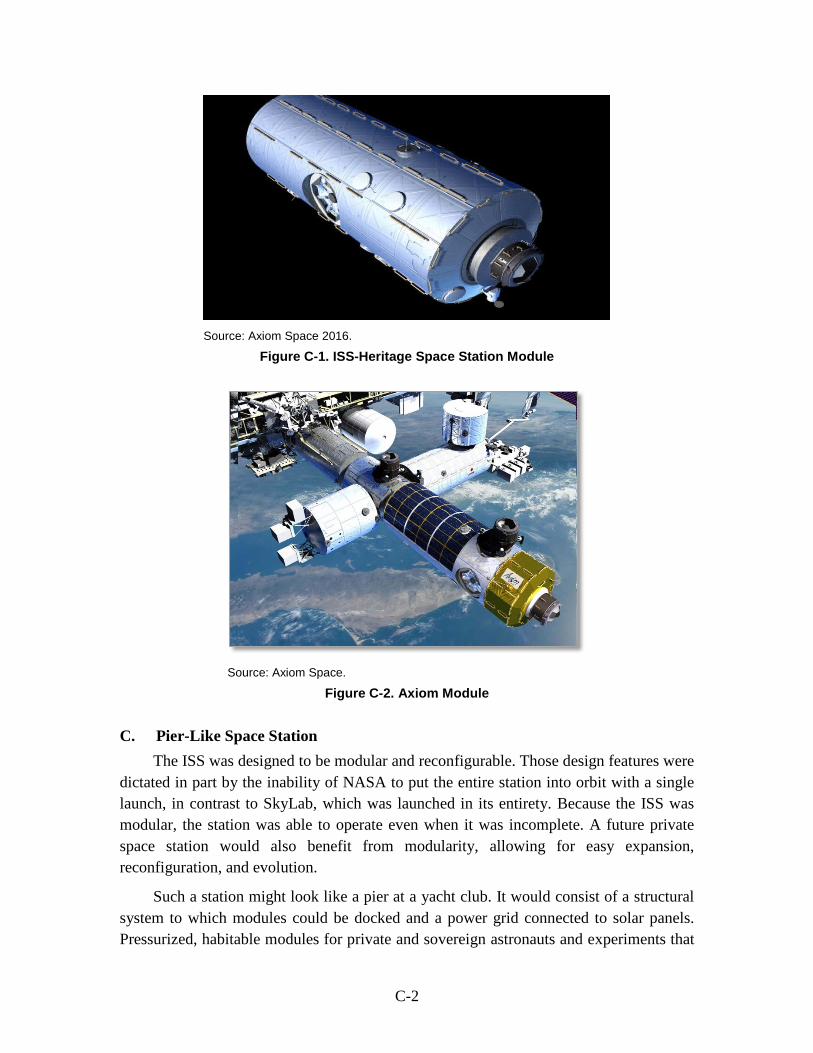
C-2
Source: Axiom Space 2016.
Figure C-1. ISS-Heritage Space Station Module
Source: Axiom Space.
Figure C-2. Axiom Module
C. Pier-Like Space Station The ISS was designed to be modular and reconfigurable. Those design features were
dictated in part by the inability of NASA to put the entire station into orbit with a single launch, in contrast to SkyLab, which was launched in its entirety. Because the ISS was modular, the station was able to operate even when it was incomplete. A future private space station would also benefit from modularity, allowing for easy expansion, reconfiguration, and evolution.
Such a station might look like a pier at a yacht club. It would consist of a structural system to which modules could be docked and a power grid connected to solar panels. Pressurized, habitable modules for private and sovereign astronauts and experiments that
C-3
require ECLSS could be placed at the center. Extending from the central module would be a pier-like system where different modules would serve different customers. For instance, satellite manufacturers and assemblers might prefer to have an exposed, open area larger than habitable modules or a docking port for robotic assembly equipment. Modules could be added as demand materializes.
While cargo capsules like Dragon or Cygnus would most likely connect to a pressurized portion of the space station, they could also connect to docking ports placed on other parts of the station if they are filled with cargo that only needs a temporary home in space. These capsules could utilize the power and communications capabilities provided by the space station infrastructure.
Other customers might require higher-quality microgravity or stricter vibration constraints. These customers’ modules could still be connected to the space station to receive power and leverage the supply chain from launch vehicles, but not be rigidly connected to the main structure.
D. String of Pearls Formation Many modules flying in the same orbit but separated could still take advantage of a
single supply chain for launches without compromising on requirements for modules. For instance, a self-sufficient, highly autonomous module that requires ultra-high quality microgravity could orbit hundreds or thousands of meters away from a space station that generates vibrations due to human exercise, robotic assembly and construction, or small satellite deployment. The delta-V required for a supply vehicle to dock with one module, unload equipment, and fly to another one in the same orbit is negligible.
One drawback to this configuration is that separated modules would require their own support systems, so extra mass would be needed on orbit to power and support each module rather than having several modules leverage the same systems. Moreover, modules that require ultra-high microgravity may actually benefit from higher mass because they have more inertia, so perturbative forces have smaller effects on experiments or other operations inside.
E. Expandable Modules The Bigelow Expandable Activity Module (BEAM) is currently being tested on the
ISS. It has a living volume of 16 cubic meters and a mass of 1,413 kg (Figure C-3). The B330, a follow-on module currently under development, has a pressurized volume of 330 cubic meters and an expected mass of 20 metric tons. For comparison, the entire ISS has a pressurized volume of 935 cubic meters; three B330s would provide more pressurized volume than the entire ISS for significantly less mass.
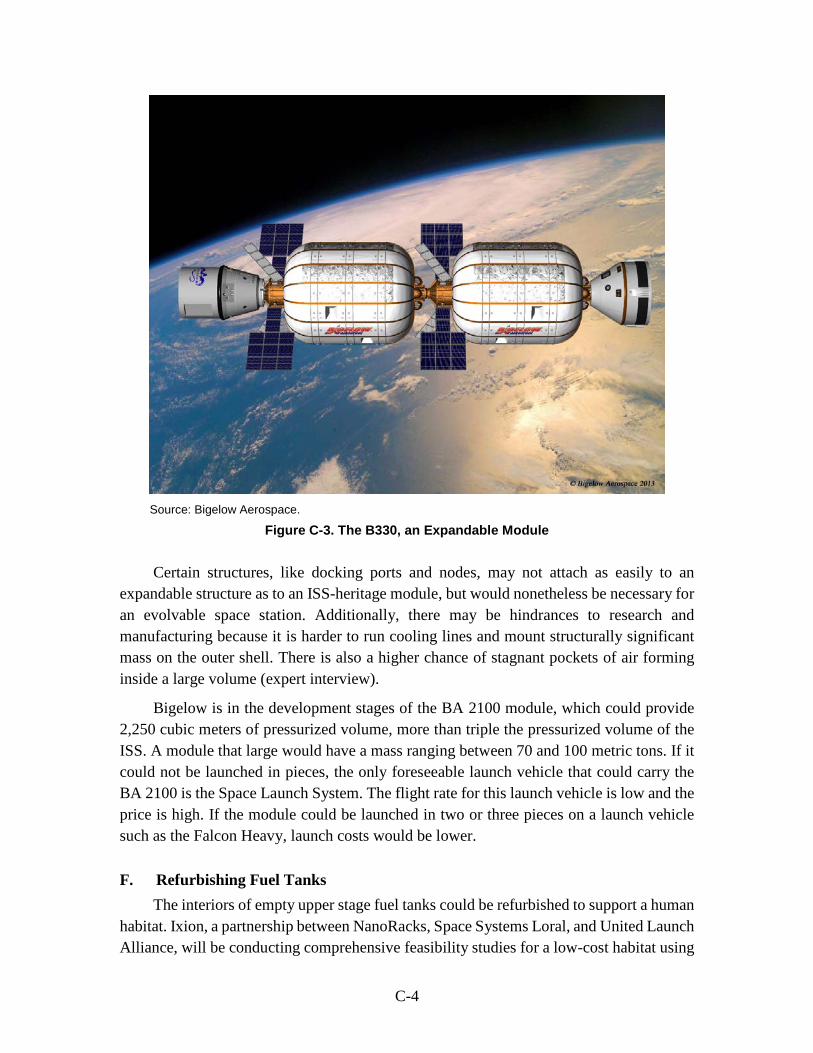
C-4
Source: Bigelow Aerospace.
Figure C-3. The B330, an Expandable Module
Certain structures, like docking ports and nodes, may not attach as easily to an expandable structure as to an ISS-heritage module, but would nonetheless be necessary for an evolvable space station. Additionally, there may be hindrances to research and manufacturing because it is harder to run cooling lines and mount structurally significant mass on the outer shell. There is also a higher chance of stagnant pockets of air forming inside a large volume (expert interview).
Bigelow is in the development stages of the BA 2100 module, which could provide 2,250 cubic meters of pressurized volume, more than triple the pressurized volume of the ISS. A module that large would have a mass ranging between 70 and 100 metric tons. If it could not be launched in pieces, the only foreseeable launch vehicle that could carry the BA 2100 is the Space Launch System. The flight rate for this launch vehicle is low and the price is high. If the module could be launched in two or three pieces on a launch vehicle such as the Falcon Heavy, launch costs would be lower.
F. Refurbishing Fuel Tanks The interiors of empty upper stage fuel tanks could be refurbished to support a human
habitat. Ixion, a partnership between NanoRacks, Space Systems Loral, and United Launch Alliance, will be conducting comprehensive feasibility studies for a low-cost habitat using
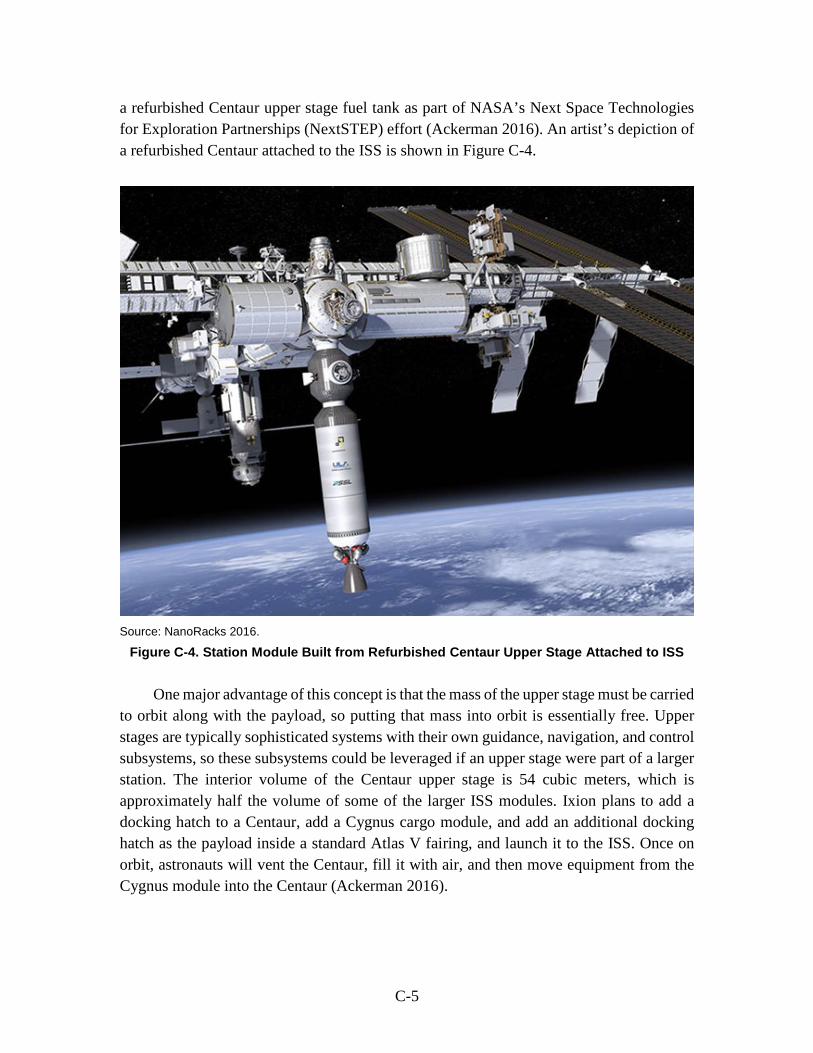
C-5
a refurbished Centaur upper stage fuel tank as part of NASA’s Next Space Technologies for Exploration Partnerships (NextSTEP) effort (Ackerman 2016). An artist’s depiction of a refurbished Centaur attached to the ISS is shown in Figure C-4.
Source: NanoRacks 2016.
Figure C-4. Station Module Built from Refurbished Centaur Upper Stage Attached to ISS
One major advantage of this concept is that the mass of the upper stage must be carried to orbit along with the payload, so putting that mass into orbit is essentially free. Upper stages are typically sophisticated systems with their own guidance, navigation, and control subsystems, so these subsystems could be leveraged if an upper stage were part of a larger station. The interior volume of the Centaur upper stage is 54 cubic meters, which is approximately half the volume of some of the larger ISS modules. Ixion plans to add a docking hatch to a Centaur, add a Cygnus cargo module, and add an additional docking hatch as the payload inside a standard Atlas V fairing, and launch it to the ISS. Once on orbit, astronauts will vent the Centaur, fill it with air, and then move equipment from the Cygnus module into the Centaur (Ackerman 2016).
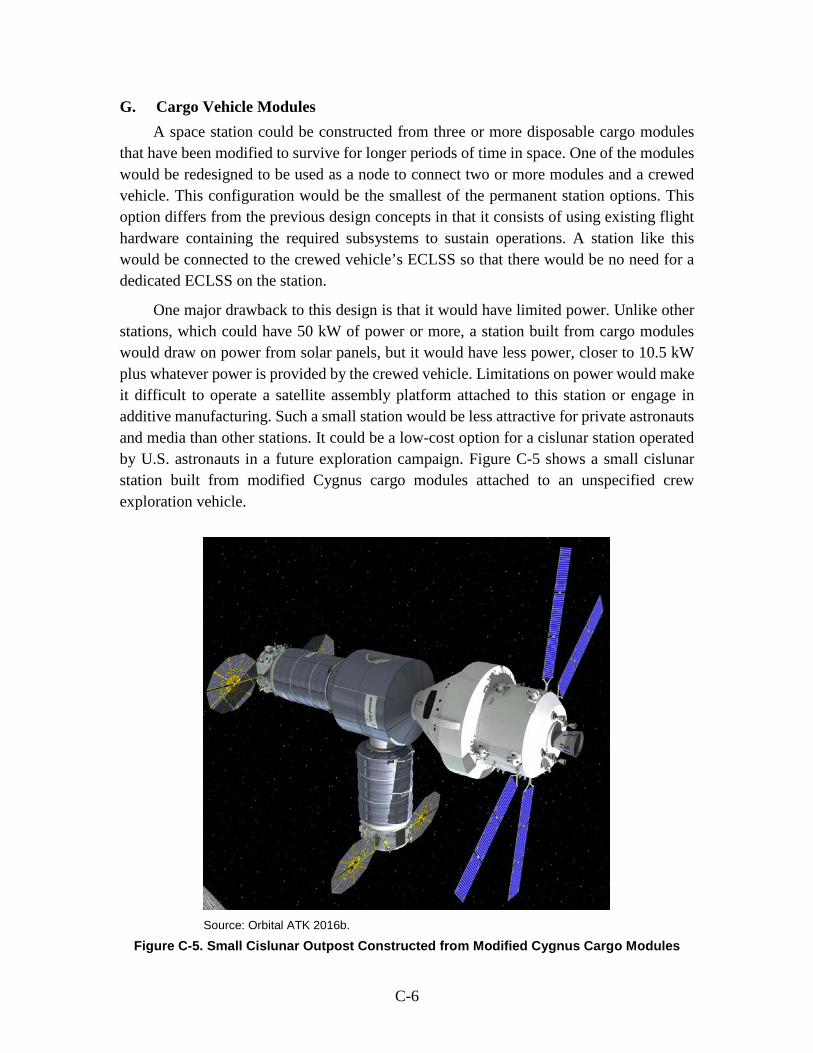
C-6
G. Cargo Vehicle Modules A space station could be constructed from three or more disposable cargo modules
that have been modified to survive for longer periods of time in space. One of the modules would be redesigned to be used as a node to connect two or more modules and a crewed vehicle. This configuration would be the smallest of the permanent station options. This option differs from the previous design concepts in that it consists of using existing flight hardware containing the required subsystems to sustain operations. A station like this would be connected to the crewed vehicle’s ECLSS so that there would be no need for a dedicated ECLSS on the station.
One major drawback to this design is that it would have limited power. Unlike other stations, which could have 50 kW of power or more, a station built from cargo modules would draw on power from solar panels, but it would have less power, closer to 10.5 kW plus whatever power is provided by the crewed vehicle. Limitations on power would make it difficult to operate a satellite assembly platform attached to this station or engage in additive manufacturing. Such a small station would be less attractive for private astronauts and media than other stations. It could be a low-cost option for a cislunar station operated by U.S. astronauts in a future exploration campaign. Figure C-5 shows a small cislunar station built from modified Cygnus cargo modules attached to an unspecified crew exploration vehicle.
Source: Orbital ATK 2016b.
Figure C-5. Small Cislunar Outpost Constructed from Modified Cygnus Cargo Modules

C-7
H. Short-Term Capsules For a subset of customers, “space” is the destination; the location or size of the space
station is unimportant. For private astronauts, for example, it would be cheaper to ride in a capsule for a few days than to go to a space station that charges an additional fee to visit it.
Orbital ATK’s Cygnus, Sierra Nevada’s DreamChaser (Figure C-6), and SpaceX’s Dragon and DragonLab are examples of such platforms. The latter two can realistically support private astronauts for the length of typical spaceflights for these individuals.
Source: Sierra Nevada Corporation.
Figure C-6. Short-Term Capsule, Sierra Nevada’s DreamChaser
Short-term space stations would be inadequate for many of the activities that have been reviewed in this report: they would not serve a large variety of customers that may wish to manufacture in space, create a destination for a supply chain that would result in secure ride shares, leave humans in space continuously, or create a permanent space station. They would provide short-term destinations for private astronauts and could house short-term experiments.
C-8
I. Long-Term Capsules The same capsules used for short-term missions and cargo deliveries could be used
as long-term platforms. An advantage of long-term capsules is they have the potential to serve as architectural elements for a larger station with many nodes to connect them all, as previously discussed. Pressurized, habitable volume could be added with each cargo launch to the station. By connecting many capsules, a space station could be continually enlarged with more habitable volume with each successive cargo delivery. Under this model, a supply chain is preserved, the station can be expanded at lower cost, and several companies can contribute to the station’s expansion.
The capsules currently being used or planned for use for transport to the ISS do not have the life support systems to support humans long-term. These capsules are also too small to comfortably support more than one person for a mission lasting several months. While a small station could be constructed from cargo vehicles, a long-term mission of a single returnable space vehicle would most likely be unmanned and would not carry private astronauts.
D-1
Appendix D. Potential Orbital Inclinations
A. Equatorial (0 Degrees) An equatorial orbit is the ideal place to conduct operations for manufacturing,
assembling, ferrying, and servicing GEO satellites. The change in velocity, or delta-V, to move from an equatorial orbit to GEO is minimized because there is no inclination change. However, no U.S. mainland launch providers can launch to this orbit without incurring a launch penalty in the form of extra energy required to achieve that orbit, leading to a reduced maximum mass that could be sent to that orbit. The primary service providers would have to launch from French Guyana or Kwajalein.
An equatorial orbit does not serve remote sensing or communications customers well because the primary clients for these services are located at higher latitudes. An equatorial orbit is also likely to be less attractive to private and sovereign astronauts who would like to be able to see their hometown or country from space. Most potential space tourists or countries that would pay to put astronauts on a space station are from wealthy countries located at higher latitudes.
B. Low Inclination (~28 Degrees) A slightly higher orbital inclination of 28 degrees would result in the lowest launch
penalty when launching from Kennedy Space Center in Florida. From a U.S. perspective, the inclination lying between 28 and 37 degrees would be the most favorable orbit for political or business reasons. In these orbits, the launch penalty from the Mid-Atlantic Regional Spaceport in Virginia is lessened at the expense of a mild penalty when launching from Kennedy Space Center.32
Although a low inclination orbit is less desirable for activities related to GEO, it is more desirable for activities related to remote sensing, private and sovereign astronauts, and communications providers in LEO. A larger share of the population of Earth can benefit from these services, while the overall mass penalties are reduced.
32 It is possible to launch directly from a low latitude to a high inclination. It is not possible to launch
directly from high latitude to a low inclination without a plane change maneuver.
D-2
C. High Inclination (~51 Degrees) Nearly all current launch providers can access a high inclination orbit, the orbit where
ISS lies, without incurring a severe launch penalty, making it possible for the station owner to use launches by almost all potential partners. This inclination is also attractive for private and sovereign astronauts from higher latitudes. This orbit would facilitate international partnerships.
Another reason for choosing this orbit would be to use the current ISS supply chain and other advantages that come from being in the vicinity of the ISS. A space station in this orbit could be built near the ISS to leverage the existing supply chain, borrow resources such as communication downlinks from the ISS, and take components when the ISS is eventually decommissioned.
This orbit offers expansive, albeit incomplete, coverage for private astronauts, remote sensing, and communications. The only areas that fall outside of the range of coverage of this orbit are most of Canada, Alaska, the Baltic States, Scandinavia, northern Russia, and Antarctica. Nearly all astronauts would be able to see their homes, and nearly all communications customers would have access to satellites launched into this orbit.33
The customers who would experience the worst drawbacks from a high inclination orbit are those who wish to go to GEO. Typically, traveling from LEO (~500 km altitude) to GEO (35,786 km altitude) requires a burn in LEO to transfer to geosynchronous transfer orbit (GTO) and another burn to transfer from GTO to GEO. These burns require 2.83 km/second and 1.45 km/second for a total of 3.83 km/second delta-V when this transfer starts from a zero inclination LEO orbit. Inclination changes are the most efficient when orbital velocity is low, so a burn to change the orbital inclination is best when combined with a second burn that circularizes the orbit. To transfer from a GTO orbit at 28 degrees inclination to a GEO orbit, the first burn still requires 2.83 km/second, but the second burn now requires 1.81 km/second for a total of 4.18 km/second between the two burns. When transferring from 51.3 degrees inclination, the second burn requires 2.42 km/second for a total of 4.79 km/second delta-V.
These delta-Vs are nontrivial. If a spacecraft used chemical propellant (specific impulse of 300 seconds) to transfer from equatorial LEO to GEO, almost 72.7 percent of its total mass would need to be propellant. If the initial inclination is 28 degrees, that mass fraction is 75.9 percent; if the initial inclination is 51.3 degrees, the mass fraction is over 80.4 percent. This means that for every kilogram of spacecraft (not just payload) in LEO,
33 Inclination plane changes are expensive, but plane changes to the right ascension of the ascending node
can be accomplished relatively cheaply, especially if there is time for natural precession to change the orbits.
D-3
another four kilograms of propellant are required to bring it to GEO from ISS’s current orbit.
If electric propulsion (specific impulse of 3,000 seconds) is available, those mass fractions for transfer from 0, 28, and 51.3-degree inclinations become 14.4, 15.9, and 18.4 percent of total mass, respectively.34 In this case, for every four kilograms of spacecraft, less than one kilogram of propellant is needed. Thus, customers using a private space station in a 51.3-degree inclination and a space tug using electric propulsion for travel from LEO to GEO would not be at as much of a disadvantage compared to a space station at 0 or 28 degrees inclination.
D. Polar (90 Degrees) or Sun-Synchronous (~98 Degrees) Polar and sun-synchronous orbits allow for truly global coverage, but there are a
number of drawbacks to these orbits that potentially make them less attractive overall. These orbits would satisfy northern sovereign customers and weather and remote sensing customers. These orbits are also among the most polluted with space debris. It may be difficult to find an orbit with enough clearance to meet today's standards for keeping a space station safe.
Another major drawback is the difficulty of setting up a supply chain to a space station in these orbits. The only U.S. launch site that can reach these orbits is Vandenberg Air Force Base. Kwajalein is an option, but for safety reasons, Kennedy Space Center and the Mid-Atlantic Regional Spaceport cannot launch to these orbits. If a space station were to be located at these inclinations, the heavy investments of many commercial launch providers at these two sites would be wasted.
An advantage of a high-inclination orbit is for entering a polar lunar orbit. Polar lunar orbits are useful for human exploration, remote sensing, resource extraction, and other activities pertaining to the Moon, since a polar orbit permits access to the entire surface of the Moon. However, the problems with the launch supply chain would likely more than outweigh the advantages from this orbit, especially considering how many lower inclination change maneuvers are necessary in cislunar space compared to LEO
.
34 For finite burns over long periods of time, we assume a 20 percent increase in required delta-V
compared to a pure Hohmann Transfer, due to inefficiencies of spiraling out, and up to a 5 percent increase for inefficiencies associated with the inclination change. More precise estimates would require a more detailed spacecraft model and subsystem information.


E-1
Appendix E. Cost Estimates for Cargo Module Stations and
Capsules
A. Cargo Vehicle Module Stations As previously noted, a space station could be constructed from three cargo modules
specifically designed to survive for longer periods of time in space. One of the modules would be redesigned to be used as a node to connect the other two modules and a crewed vehicle. This option would use existing flight hardware containing the required subsystems to sustain operations. A station like this would be connected to the crewed vehicle’s ECLSS so that there would be no need for a dedicated ECLSS on the station.
The price of the cargo modules includes launch, some operations, and the added cost of building the modules for permanent habitation. No additional launches are required because the modules are launched with a full load of cargo.
Several companies, such as Orbital ATK and SpaceX, have proposed redesigned cargo capsule options for habitable elements of a space station. Some cargo capsules will still need to be jettisoned to remove refuse from the station, so not all cargo capsules could be added to a station. Table E-1 lists some commercial options that are available and approximate prices given by the manufacturers.
Table E-1. Cost Estimate for a Cargo Module Space Station
Station Elements Estimate
Enhanced cargo modules (x2) $500 M Enhanced node module $325 M Total cost $825 M
Source: Private correspondence with corporate representatives.
B. Capsules as Temporary Stations Temporary “stations,” or capsules in orbit for a period of time, might house
experiments that would otherwise go to a private station. These capsules would not contribute to a gradual buildup of an in-space infrastructure. They may be able to serve some markets that might otherwise go to a private space station.
E-2
The current options for privately crewed vehicles are not designed for sustained human presence; their advertised crew sizes are for short trips to the ISS, not for extended periods in LEO. A crew of two might be able to tolerate a stay of a month, but this assumes the entire pressurized volume of the spacecraft is habitable and not packed with experiments. For longer-term missions, the capsule would not have a crew; it would only house automated payloads.
The cost of building, launching, and operating such capsules might range from $130 million to $200 million, although prices may fall if the capsules could be reused (expert interview). Reusable capsules may also be subject to additional fees for longer stays due to the lost opportunity cost from not using the capsule more often on top of the added operations costs from a longer mission.
F-1
Appendix F. Cost Estimates for Power Subsystem
The cost of the power subsystem (solar panels and batteries) was estimated using equations from the USCM8. Analogous to the cost estimates for the other subsystems, to generate this cost estimate, we first had to estimate the mass of the power subsystem. To calculate the number of solar panels that a private space station would need, we used an equation for calculating the power required to be generated by the solar arrays Psa during the daylight portion of the orbit:
𝑃𝑃𝑠𝑠𝑚𝑚 =�𝑃𝑃𝑒𝑒𝑇𝑇𝑒𝑒𝑋𝑋𝑒𝑒
+𝑃𝑃𝑑𝑑𝑇𝑇𝑑𝑑𝑋𝑋𝑑𝑑
�
𝑇𝑇𝑑𝑑 , (F-1)
where Pe and Pd are the station’s power requirements during eclipse and daylight, Te and Td are the time spent in eclipse and daylight, and Xe and Xd are the efficiency paths of the solar arrays through batteries (during eclipse) and directly to the station (during daylight). Assuming the station needs 50 kW continuous power (Pe = Pd = 50 kW) and the station is in a 90-minute orbit with 50 minutes of daylight and 40 minutes of eclipse time, with efficiency paths of Xe = 60 percent and Xd = 80 percent, the solar panels must generate 129 kilowatts of power during the daylight portion of the orbit. This does not assume any degradation of the solar panels over their lifetimes.
Assuming a solar irradiance of 1,365 watts per square meter in LEO and a solar panel efficiency of 30 percent, the station would need 315 square meters of solar panels to generate this amount of power. For solar panels with a mass density of 2.8 kg per square meter, 315 square meters of solar panels would have a mass of 883 kg.
The total power capacity required of the batteries CB on the station would be
𝐶𝐶𝑍𝑍 = 𝑃𝑃𝑒𝑒𝑇𝑇𝑒𝑒(𝐷𝐷𝐷𝐷𝐷𝐷)𝑙𝑙
, (F-2)
where Pe and Te are again the power required during the eclipse (50 kW) and the time duration of the eclipse (40 minutes), DOD is the depth of discharge on the battery for each cycle, and n is the transmission efficiency between the battery and the load. Assuming a depth of discharge of 25 percent, the battery has an estimated lifetime of 10 years (tens of thousands of cycles), and a 90 percent transmission efficiency, the station would need battery capacity of 148 kilowatt hours. Discharging the batteries more on each orbit would decrease the required capacity but shorten their lifetimes. Assuming an energy density of
F-2
advanced secondary (rechargeable) batteries of 400 watt hours per kg, the total battery mass would need to be 370 kg. We assume two battery packs for the sake of redundancy for a total of 740 kg in battery mass.
Assuming little mass is needed for power distribution, the total mass of the power system would be 1,623 kg (883 kg plus 740 kg of batteries). USCM8’s nonrecurring cost formula for the power system is Y = 64.3 × X, where X is the mass and Y is the cost in thousands of dollars. This results in non-recurring costs of $104 million for the power system. The recurring cost formula is Y = 32.4 × X, which generates recurring costs for the power system of $52.6 million. Applying the 30 percent discount for savings stemming from private sector involvement, the power system for a station would cost $110 million.
G-1
Illustrations
List of Figures Figure 1. First U.S. Space Station: Skylab...........................................................................2 Figure 2. Russian Mir Space Station....................................................................................3 Figure 3. International Space Station ...................................................................................3 Figure 4. Comparison of Revenue Calculations for Activities on Earth and on Space
Station using an Industrial Park Model ......................................................................6 Figure 5. Space Systems Loral-built JCSat-16 Telecommunications Satellite ..................25 Figure 6. Steps of On-orbit Satellite Assembly .................................................................27 Figure 7. Illustration of Orbital ATK’s MEV ....................................................................36 Figure 8. NanoRacks CubeSat Deployer on ISS ...............................................................38 Figure 9. ZBLAN Fiber Pulled in Microgravity (left) and 1-g (right)...............................47 Figure 10. Astronaut Holds First 3D-printed Ratchet Wrench Manufactured using the
AMF ..........................................................................................................................54 Figure 11. Schematic of AMF on the ISS ..........................................................................55 Figure 12. James Webb Space Telescope’s Backplane Structure ......................................58 Figure 13. Comparison of Crystals Grown in Space (left) and on Earth (right) ................63 Figure 14. Examples of Movies that Simulated Zero-Gravity for Scenes .........................74 Figure 15. Space-Based Advertising..................................................................................77 Figure 16. Naming Rights for a Future Space Station .......................................................80 Figure 17. Red Bull Sponsorship of Suborbital Jump .......................................................82 Figure 18. Four Potential Space Station Configurations ...................................................92 Figure 19. Possible Orbits for a Space Station ..................................................................95 Figure 20. Concept of Orbital Inclination (left) and Inclination of the ISS (right) ...........95 Figure 21. Trade-Offs between Activities, Space Station Configurations, and Orbital
Inclination .................................................................................................................97 Figure 22. Space Station Construction Cost Estimates ....................................................106 Figure 23. Space Station Annual Operations Cost Estimates ..........................................107 Figure 24. Projected Revenues for a Private Space Station (FY15 Millions of Dollars) 113 Figure 25. Projected Revenues for a Private Space Station (FY15 Millions of Dollars) 114 Figure 26. Comparison of Low (left) and High (right) Estimated Annualized Costs of
Three Different Space Station Concepts (FY15 Millions of Dollars) ....................115 Figure 27. Annualized Cost and Revenue Estimates for a Private Space Station ...........116 Figure 28. Internal Rate of Return for Low Cost Scenarios ............................................118
G-2
Figure 29a. Revenues and Costs if Launch Costs Further Reduced/Subsidized .............121 Figure 29b. Profitability Change if Launch Costs Further Reduced/Subsidized .............121
List of Tables Table 1. Space Station Revenues (FY15 dollars) from Private Astronauts .......................17 Table 2. Countries Considered as Potential Private Space Station Customers ..................20 Table 3. High Estimate of Space Station Revenues from Sovereign Astronauts ..............23 Table 4. Low Estimate of Space Station Revenues from Sovereign Astronauts ...............24 Table 5. Potential Annualized Revenues for a Private Space Station from Human
Habitats .....................................................................................................................24 Table 6. Subsystem Cost Model Input Differences between Terrestrial and On-Orbit
Satellite Assembly ....................................................................................................30 Table 7. Potential Cost Savings from Assembling Satellites in Space (FY15 Millions
of Dollars) .................................................................................................................31 Table 8. Additional Costs of Assembling Satellites in Space (FY15 Millions of
Dollars) .....................................................................................................................32 Table 9. Potential Annual Revenues for a Space Station Operator from Hosting a
Satellite Assembly Operation (FY15 Millions of Dollars) .......................................34 Table 10. Potential Annual Revenues for a Private Space Station from Supporting the
Satellite Sector (FY15 Millions of Dollars) ..............................................................41 Table 11. Potential Revenues for a Private Space Station from Manufacturing for Use
on Earth (FY 2015) ...................................................................................................51 Table 12. Potential Revenues for a Private Space Station from Manufacturing Products
in Space (FY 2015) ...................................................................................................56 Table 13. Potential Revenues for a Private Space Station from Additive Manufacturing
for Use in Space (FY 2015) ......................................................................................59 Table 14. Primary Areas for Research and Development on the ISS ................................61 Table 15. Primary Areas for Technology Testing on a Space Station ...............................68 Table 16. Potential Revenues for a Private Space Station from R&D-related Activities
(FY15 Millions of Dollars) .......................................................................................71 Table 17. Annual Payments of Naming Rights for Sport Stadiums (FY15 Millions of
Dollars per Year) ......................................................................................................81 Table 18. Annual Revenues for Sponsored Events (FY 2015 Dollars) .............................83 Table 19. Annual Revenues from Media, Advertising, and Education (FY15 Millions
of Dollars) .................................................................................................................87 Table 20. Requirements for “Company” Astronauts’ Time ..............................................90 Table 21. Estimated Costs of Commercial Modules for a Space Station (FY15
Dollars) ...................................................................................................................100 Table 22. Estimated Subsystem Costs for a Private Space Station ..................................104 Table 23. Comparison of Station Construction Cost Estimates (FY15 Dollars) .............105
G-3
Table 24. Annualized Cost Estimates for Options for a Private Space Station (FY15 Dollars) ...................................................................................................................109
Table 25. Potential Revenues for a Private Space Station (FY15 Millions of Dollars)...112 Table 26. Inputs for Financial Analysis of a Private Space Station (FY15 Millions of
Dollars) ...................................................................................................................117 Table 27. Benefits and Drawbacks of Various Options for Government Participation
in Private Space Station Markets ............................................................................131 Table 28. Early Astronomy Projects ................................................................................133

H-1
References
Ackerman, E. 2016. “NASA Funds Plan to Turn Used Rocket Fuel Tanks Into Space Habitat.” IEEE Spectrum, August 22, 2016. Photo credit: Nanoracks. https://spectrum.ieee.org/tech-talk/aerospace/space-flight/nasa-funds-partnership-to-explore-making-space-habitats-out-of-used-rocket-fuel-tanks.
ACME Advanced Materials. 2016. “Space Wafers Made on Parabolic Flights.” January 28. http://www.a2-m.com/space-wafers-made-on-parabolic-flights/.
Alford, J. M., G. R. Mason, and D. A. Feikema. 2001. “Formation of Carbon Nanotubes in a Microgravity Environment.” NASA/CP—2001-210826. http://ntrs.nasa.gov /archive/nasa/casi.ntrs.nasa.gov/20010074067.pdf.
Allianz Global Corporate & Specialty. 2012. “Space Risks: A New Generation of Challenges.” https://www.allianz.com/v_1342876324000/media/press /document/other/agcs_space_risks_white_paper.pdf.
Amazon. 2016. “Ultra Spec Cables Bulk Fiber Optic Cable Singlemode 9/125 Duplex ON Spool 60M-200 Feet.” https://www.amazon.com/Ultra-Spec-Cables-Singlemode-60M-200/dp/B002BG1O1A.
AMC. n.d. “While Preparing for Zero Gravity, the Actors of Apollo 13 Lost Their Lunch.” http://www.amc.com/talk/2008/07/apollo-13-zero-gravity-training.
Anagenesis. 2015. Micro-Gravity SiC Wafer Processing Value Analysis and Market Impact Estimation.
Apgar, H. 2011. “Cost Estimating.” In Space Mission Engineering: The New SMAD, edited by James R. Wertz, David F. Everett, and Jeffrey J. Puschell. Hawthorne, CA: Microcosm, Inc.
Aron, J. 2016. “China Wants to Share Its New Space Station with the World.” New Scientist, June 21. 2016. https://www.newscientist.com/article/2094636-china-wants-to-share-its-new-space-station-with-the-world.
Associated Press. 2015. “Mayweather-Pacquiao Fight Grossed $600 Million.” New York Post, May 12, 2015. http://nypost.com/2015/05/12/the-absurd-mayweather-pacquiao-money-numbers-roll-in/.
Beatty, K. 2016. “Take a Sat-seeing Tour.” Sky & Telescope, July 23, 2016. http://www.skyandtelescope.com/observing/celestial-objects-to-watch/take-a-sat-seeing-tour.
Beggs, J., J. McLucas, J. Rose, H. Schue, and T. Straeter. 1997. “The International Space Station Commercialization (ISSC) Study.” Arlington, VA: Potomac Institute for Policy Studies, March.
H-2
Belew, L., ed. 1977. Skylab, Our First Space Station, Chapter 2. Washington, DC: NASA. http://www.history.nasa.gov/SP-400/ch2.htm.
Bensoussan, D. 2012. “Satellite Vulnerability to Space Debris Risk.” Presentation to the World Space Risk Forum 2012, Dubai. http://worldspaceriskforum.com/2012/wp-content/uploads/2012/03/25DENI1.pdf.
Besha, P., and A. MacDonald, eds. 2016. Economic Development of Low Earth Orbit. Washington, DC: NASA. https://www.nasa.gov/sites/default/files/atoms/files /economic-development-of-low-earth-orbit_tagged_v2.pdf.
Bigelow Aerospace. 2016. “B330.” https://bigelowaerospace.com/b330/.
Bloomberg. 2011. “NFL Stadiums with the Most-Expensive Naming Rights.” http://www.bloomberg.com/news/photo-essays/2011-08-23/nfl-stadiums-with-the-most-expensive-naming-rights.
Boeing. 2006. “Motion Control Subsystem.” www.boeing.com/assets/pdf /defense-space/space/spacestation/systems/docs/ISS%20Motion%20Control %20System.pdf.
Borg, G. 1996. “Coke, Pepsi Face Off In Outer Space.” Chicago Tribune, May 22, 1996. http://articles.chicagotribune.com/1996-05-22/news/9605220152_1_russian-cosmonauts-mir-space-station-coca-cola.
Box Office Mojo. 2016. http://www.boxofficemojo.com/.
Boyd, I. D., R. Buenconsejo, D. Piskorz, B. Lal, D. Crane, E. De La Rosa Blanco. 2017. “On-orbit Manufacturing and Assembly of Spacecraft.” IDA Paper P-8335. Alexandria, VA: Institute for Defense Analyses.
Boyle, A. 2013. “Movie Tech: How ‘Gravity’ Threw Sandra Bullock Into Zero Gravity.” NBC News. October 4, 2013. http://www.nbcnews.com/science/how-gravity-threw-sandra-bullock-zero-gravity-big-screen-8C11326787.
Briere, M. A. 2012. “So What’s All This GaN Stuff Anyways?” In PSMA Webinar. International Rectifier.
Bruno, S. 2016. ISS R&D Conference, San Diego, California, July 12.
Carroll, C., A. MacDonald, L. D. Harper, and I. Cozmuta. 2014. “Microgravity and Commercial Potential 2015-2024.” Report to Michael T. Suffredini, Manager, ISS Program Office (November).
Center for the Advancement of Science in Space (CASIS). 2015. “CASIS and the National Science Foundation Announce Joint Solicitation in Fluid Dynamics.” http://www.iss-casis.org/NewsEvents/OnStation/tabid/113/ArticleID/193/ArtMID /570/CASIS-and-the-National-Science-Foundation-Announce-Joint-Solicitation-in-Fluid-Dynamics.aspx.

H-3
CASIS. 2016a. “CASIS Announces Series of New Research Awards in Areas of Earth Observation, Education, Physical and Life Sciences.” http://www.iss-casis.org/ NewsEvents/OnStation/tabid/113/ArticleID/224/ArtMID/570/CASIS-Announces-Series-of-New-Research-Awards-in-Areas-of-Earth-Observation-Education-Physical-and-Life-Sciences.aspx.
CASIS. 2016b. “FY15 Annual Report: Powered through Partnership.” http://ww2.iss-casis.org/Annual_Report_2015.
CASIS. n.d. “Factsheet: Particle and Plasma Physics.” http://www.iss-casis.org/Portals /0/docs/Particle%20and%20Plasma%20Physics%20FINAL.pdf.
Christensen, C. 2015. “Commercial Space Station in LEO: Preparing for the Future.” Presented at Secure World Foundation Panel. http://swfound.org/media/204885 /christensen_launch_industry.pdf.
Clery, D. 2016. “Building James Webb: the Biggest, Boldest, Riskiest Space Telescope.” Science, February 18, 2016. https://doi.org/10.1126/science.aaf4080.
Cohen, M. 2008. “Testing the Celentano Curve: An Empirical Survey of Predictions for Human Spacecraft Pressurized Volume.” 2008-01-2027. In Proceedings from the 38th International Conference on Environmental Systems. San Francisco, CA.
Cozmuta, I. 2014. “Considerations for a Robust Economy in Earth’s Orbit.” Presentation to the SSB. http://sites.nationalacademies.org/cs/groups/ssbsite/documents/webpage /ssb_172011.pdf.
Cozmuta, I., and L. D. Harper. 2014. Exotic Fibers Case Study Report. Cozmuta, I., L. D. Harper, D. J. Rasky, R. B. Pittman, and A. C. MacDonald. 2014.
“Microgravity for Economic Growth and Public Benefit.” IAC-14-D9.2.8. In Proceedings from the 65th International Astronautical Congress. Toronto, Canada.
Cynicritics. 2014. “Best Picture Nominee: Gravity.” https://cynicritics.com/tag/gravity/.
David, L. 2013. “‘Sling-Sat’ Could Remove Space Junk on the Cheap.” Space.com, March 1, 2013. https://www.space.com/20024-space-junk-removal-sling-sat.html.
Davidson, H., J. Stone, and I. Fichtenbaum. 2010. “Supporting Commercial Space Development Part 2: Support Alternative versus NASA Commercialization Priorities.” New York: Near Earth LLC. http://www.nasa.gov/sites/default/files /files/SupportingCommercialSpaceDevelopmentPart2.pdf.
de Selding, P. B. 2015a. “China’s Space Station Planners Put out Welcome Mat.” SpaceNews, October 13, 2015. http://spacenews.com/chinas-space-station-planners-put-out-welcome-mat/.
de Selding, P. B. 2015b. “Russia—and Its Modules—To Part Ways with ISS in 2024.” SpaceNews, February 25, 2015. http://spacenews.com/russia-and-its-modules-to-part-ways-with-iss-in-2024/.
H-4
De Weck, O. L., R. De Neufville, and M. Chaize. 2004. “Staged Deployment of Communications Satellite Constellations in Low Earth Orbit.” Journal of Aerospace Computing, Information, and Communication 1, no. 3 (March): 119–136. https://doi.org/10.2514/1.6346.
Department of Energy. 2015. “Technology Assessment: Wide Bandgap Semiconductors for Power Electronics.” Appendix to Chapter 6: Innovating Clean Energy Technologies in Advanced Manufacturing of the 2015 Quadrennial Technology Review. http://energy.gov/sites/prod/files/2016/02/f29/QTR2015-6N-Wide-Bandgap-Semiconductors-for-Power-Electronics.pdf.
Do, S., A. Owens, and O. de Weck. 2015. “HabNet—An Integrated Habitation and Supportability Architecting and Analysis Environment.” In Proceedings from the 45th International Conference on Environmental Systems. Bellevue, Washington, July 12–16, 2015.
D-Orbit. 2016. “D3 Technical Sheet.” http://www.deorbitaldevices.com/wp-content /themes/d-orbit/pdf/d3-technical-sheet.pdf.
Equals Three Communication and Booz Allen Hamilton. 2002. “Commercial Market Outreach Plan for the International Space Station.” http://www.hq.nasa.gov /office/hqlibrary/documents/o49797051.pdf.
Euroconsult. 2014a. “Profiles of Government Space Programs: Analysis of Over 80 Countries and Agencies.” February 2014. Paris, France.
Euroconsult. 2014b. “Satellites to Be Built & Launched by 2023: World Market Survey.” July 2014. Paris, France.
EuroConsult. 2016. “Prospects for the Small Satellite Market: A Global Supply and Demand Analysis for Government and Commercial Satellites up to 500 kg.” July 2016. Paris, France.
European Southern Observatory. 2016. “The European Extremely Large Telescope.” http://www.eso.org/public/usa/teles-instr/e-elt/.
European Space Agency (ESA). 2013a. “Columbus.” February 5. http://www.esa.int /Our_Activities/Human_Spaceflight/Columbus/European_Columbus_laboratory.
ESA. 2013b. “How Much Does It Cost?” May 14. http://www.esa.int/Our_Activities /Human_Spaceflight/International_Space_Station/How_much_does_it_cost.
ESA. 2013c. “JWST Factsheet.” September 4. http://www.esa.int/Our_Activities /Space_Science/JWST_factsheet.
ESA. 2014. “ESA’s International Space Station Barter Agreements.” November 28. http://www.esa.int/Our_Activities/Human_Spaceflight/International_Space_Station/ESA_s_International_Space_Station_barter_agreements.
ESA. 2016. “E.Deorbit.” April 12. http://www.esa.int/Our_Activities /Space_Engineering_Technology/Clean_Space/e.Deorbit.
H-5
Federal Aviation Administration (FAA) Office of Commercial Space Transportation. 2010. “FAA Semi-Annual Launch Report: Second Half of 2009.” http://www.faa.gov/about/office_org/headquarters_offices/ast/media/10998.pdf.
FAA Office of Commercial Space Transportation and the Commercial Space Transportation Advisory Committee. 2015. “2015 Commercial Space Transportation Forecasts.”
FiberLabs. n.d. “ZBLAN Fluoride Glass Fibers & Cables.” https://www.fiberlabs-inc.com/fiber_index/.
Foust, J. 2016. “NASA Seeking Ideas for Use of Space Station Docking Port.” SpaceNews, July 15, 2016. http://spacenews.com/nasa-seeking-ideas-for-use-of-space-station-docking-port/.
Futron Corporation. 2002. “Space Transportation Costs: Trends in Price per Pound to Orbit 1990-2000.” http://www.readbag.com/futron-upload-wysiwyg-resources-whitepapers-space-transportation-costs-trends-0902.
Garriott de Cayeux, R. “Mission Activities.” http://richardinspace.com/mission-activities/.
Georgakas, S. 2011. “ISS Experiment Finds Osteoporosis Drugs Counteract Bone Loss.” Space Safety Magazine, December 5. 2011. http://www.spacesafetymagazine.com /spaceflight/space-medicine/osteoporosis-drugs-reduce-bone-density-loss-micro-gravity/.
Giant Magellan Telescope. 2016. “Quick Facts.” http://www.gmto.org/overview/quick-facts/.
Glover, R. 2016. “Advanced Materials that Change the Cost Curve for Power Electronics.” Available by registering at GoToWebinar. https://attendee.gotowebinar.com/register/5666583135043371522.
Gralla, E. L., and O. L. de Weck. 2007. “Strategies for On-Orbit Assembly of Modular Spacecraft,” Journal of the British Interplanetary Society 60 (2007): 219–27. http://strategic.mit.edu/docs/2_20_JBIS_60_6_219_Tugs.pdf.
Heitner, D. 2012. “Red Bull Stratos Worth Tens of Millions of Dollars in Global Exposure For the Red Bull Brand.” Forbes/Sports Money, October 15, 2012. http://www.forbes.com/sites/darrenheitner/2012/10/15/red-bull-stratos-worth-tens-of-millions-of-dollars-in-global-exposure-for-the-red-bull-brand/#585830d939bc.
Holdren, J. P., and C. Bolden. 2014. “Obama Administration Extends International Space Station until at Least 2024.” White House Blog. https://www.whitehouse.gov/blog /2014/01/08/obama-administration-extends-international-space-station-until-least-2024.
Hsu, J. 2010. “Solar Sails Could Clean Up Space Junk.” Space.com, April 28, 2010. https://www.space.com/8296-solar-sails-clean-space-junk.html.
Hull, B. 2013. “SiC Power Devices—Fundamentals, MOSFETs and High Voltage Devices.” In The 1st IEEE Workshop on Wide Bandgap Power Devices and Applications, Columbus, Ohio, October 27–29, 2013.

H-6
IBISWorld. 2015. “Fiber-Optic Cable Manufacturing in the US: Market Research Report.” http://www.ibisworld.com/industry/fiber-optic-cable-manufacturing.htm.
Intelsat. 2016. “Pioneers In Space: Orbital ATK Announces Intelsat as Anchor Customer For New Satellite Life Extension Service.” April 12, 2016. http://www.intelsat.com /intelsat-news/pioneers-in-space-orbital-atk-announces-intelsat-as-anchor-customer-for-new-satellite-life-extension-service/.
Inspiration Room. 2011. “That Calls for a Carlsberg.” http://theinspirationroom.com /daily/2011/that-calls-for-a-carlsberg/.
JAXA. 2008. “Pressurized Module.” Last updated August 29, 2008. http://iss.jaxa.jp/en /kibo/about/kibo/jpm/.
Johnson, L. 2016. “Paper-Thin Spacecraft Could Take Out the Trash in Space.” June 6, 2016. http://www.aerospace.org/news/highlights/paper-thin-spacecraft-could-take-out-the-trash-in-space/.
Jones, A. 2016. “China Opens Space Station to Rest of the World with United Nations Agreement.” GB Times, June 17, 2016. http://gbtimes.com/china/china-opens-space-station-rest-world-united-nations-agreement.
Kalb, I. 2013. “Putting Brand Names On Stadiums Can Be Extremely Valuable.” Business Insider, April 10, 2013. http://www.businessinsider.com/name-that-venue-and-collect-billions-of-brand-impressions-2013-4.
Keck Observatory. 2016. “About: Keck Observatory.” http://www.keckobservatory.org /about/the_observatory.
Kenna, B. 2016. “The First 3D Printing Facility in Space Is Open for Business!” The Motley Fool, April 29, 2016. http://www.fool.com/investing/general/2016/04/29 /the-first-3d-printing-facility-in-space-is-open-fo.aspx#ixzz48RuZwq5TISS.
Kothari, A., and D. Webber. 2010. “Potential Demand for Orbital Space Tourism Opportunities Made Available via Reusable Rocket and Hypersonic Adventures.” Paper presented at the AIAA SPACE 2010 Conference & Exposition, Anaheim, California, August 30–September 2, 2010. https://doi.org/10.2514/6.2010-8600.
Krebs, G. 2011. “PSLV” Gunter’s Space Page, August 2, 2011. http://space.skyrocket.de /doc_lau/pslv.htm.
Krebs, G. 2016. “Flock-1” Gunter’s Space Page. http://space.skyrocket.de/doc_sdat /flock-1.htm.
Lal, B., E. Sylak-Glassman, M. Mineiro, N. Gupta, L. Pratt, and A. Azari. 2015. “Global Trends in Space Volume 1: Background and Overall Findings.” IDA Paper P-5242. Alexandria, VA: Institute for Defense Analyses.
Laya, P. 2011. “The Most Expensive Commercials of All Time.” Business Insider, June 20, 2011. http://www.businessinsider.com/most-expensive-commercials-2011-6?op=1.
Levin, E. M., and J. A. Carroll. 2012. “The Cost of Future Collisions in LEO.” http://www.star-tech-inc.com/papers/The_Cost_of_Future_Collisions_in_LEO.pdf.

H-7
Lozano, A. n.d. “The Hall of Innovation.” Department of Information and Communication Technologies, Universitat Pompeu Fabra. http://www.dtic.upf.edu/~alozano/innovation/.
MacDonald, A. 2008. “The Remote Space Age: An Economic History of Space Exploration from Galileo to Gagarin.” PhD diss., University of Oxford.
MacDonald, A. 2010. “A Brief Note on the Economic History of Space Exploration in America.” http://www.cmu.edu/silicon-valley/files/pdfs/macdonald-alex/brief-history-space-explore.pdf.
MacDonald, A. C. 2014. “The Microgravity Imperative.” Office of the Chief Technologist, Emerging Space Office, NASA. April 17, 2014.
MacDonald, A. 2017. The Long Space Age. New Haven: Yale University Press.
Made In Space. 2015. “Made In Space, Now Taking Orders.” http://www.spacetechexpo.com/resources/news/2015/04/14/made-in-space,-now-taking-orders.
McKinsey & Company. 2012. “Maximizing the Value of the CASIS Platform – Biosciences Opportunity Map.” October 5, 2012.
MDA Corporation. 2015. 2015 Annual Report. https://mdacorporation.com/docs/default-source/corporate/investor/financial-reports/mda_2015_annualreport.pdf.
Messier, D. 2013. “Bigelow Offering Private Space Station at a Fraction of ISS Cost.” Parabolic Arc, February 4, 2013. http://www.parabolicarc.com/2013/02/04 /bigelow-offering-private-space-station-at-a-fraction-of-iss-cost/.
Messier, D. 2016a. “Axiom Space, Bigelow Outline Plans for ISS Commercial Module.” Parabolic Arc. http://www.parabolicarc.com/2016/10/14/ispcs-iss-module-discussions/.
Messier, D. 2016b. “China, United Nations Sign Cooperation Agreement on Space Station.” Parabolic Arc, June 19, 2016. http://www.parabolicarc.com/2016/06/19 /china-united-nations-sign-cooperation-agreement-space-station/.
Miller, C., A. Wilhite, D. Cheuvront, R. Kelso, H. McCurdy, E. Zapata. 2015. “Economic Assessment and Systems Analysis of an Evolvable Lunar Architecture that Leverages Commercial Space Capabilities and Public-Private-Partnerships.” Arlington, VA: NexGen Space LLC, July 2015. https://www.researchgate.net /publication/280099331_Economic_Assessment_and_Systems_Analysis_of_an_Evolvable_Lunar_Architecture_that_Leverages_Commercial_Space_Capabilities_and_Public-Private-Partnerships.
Morring, F., Jr. 2015. “China Says Space Station Assembly Will Start in 2018.” Aerospace Daily & Defense Report, October 13, 2015. http://aviationweek.com /space/china-says-space-station-assembly-will-start-2018.
Moviefone. 2013. “How Do They Do Weightlessness in Movies?” Last modified October 2, 2013. http://www.moviefone.com/2013/10/02/how-do-they-do-weightlessness-in-movies/.

H-8
Murphy, D. G., and S. A. Deacon. 2012. “Manned GEO Satellite Servicing Mission Environmental Effects Measurements Study.” NASA/CR–2012-217758. Hampton, VA: NASA, Langley Research Center, August 2012.
NASA. 1995. Man-Systems Integration Standards (4 vols.). NASA-STD-3000. Houston, TX: NASA Johnson Space Center.
NASA. 1997. “A History of U.S. Space Stations.” IS-1997-06-ISS009JSC. http://er.jsc.nasa.gov/seh/history.pdf.
NASA. 1998a. “Commercial Development Plan for the International Space Station.” http://history.nasa.gov/31317.pdf.
NASA. 1998b. “Mir Space Station Viewed from Endeavour during STS-89.” https://archive.org/details/STS089-340-035.
NASA. 1998c. “ZBLAN Fiber Comparison.” https://archive.org/details/MSFC-0003771.
NASA. 2001. “STS-98 Shuttle Mission Imagery.” Last updated November 6, 2012. http://spaceflight.nasa.gov/gallery/images/shuttle/sts-98/html/sts098-331-0017.html.
NASA. 2009a. Orbital Debris Quarterly News 13, no. 2 (April). http://www.orbitaldebris.jsc.nasa.gov/Quarterly-News/pdfs/ODQNv13i2.pdf.
NASA. 2009b. “The Threat of Orbital Debris and Protecting NASA Space Assets from Satellite Collisions.” Presentation. April 28, 2009. http://images.spaceref.com/news /2009/ODMediaBriefing28Apr09-1.pdf.
NASA. 2010a. “Destiny Laboratory.” March 8, 2010. http://www.nasa.gov /mission_pages/station/structure/elements/destiny.html.
NASA. 2010b. “International Space Station.” https://spaceflight.nasa.gov/gallery/images /shuttle/sts-132/hires/s132e012208.jpg.
NASA. 2010c. “Reference Guide to the International Space Station: Assembly Complete Edition.” November 2010. https://www.nasa.gov/pdf/508318main_ISS_ref _guide_nov2010.pdf.
NASA. 2011. “Commercial Market Assessment for Crew and Cargo Systems.” NASA. April 27, 2011. https://www.nasa.gov/sites/default/files/files /Section403(b)CommercialMarketAssessmentReportFinal.pdf.
NASA. 2013a. “Dec. 6, 1998, International Space Station Assembly Begins.” NASA. December 6, 2013. https://www.nasa.gov/content/fifteen-years-ago-international-space-station-assembly-begins.
NASA. 2013b. “Earth Remote Sensing from the Space Station—It’s Not Just Handheld Cameras Anymore.” NASA. February 20, 2013. http://www.nasa.gov /mission_pages/station/research/benefits/remote_sensing.html.
NASA. 2013c. “Radiators.” October 18, 2013. https://www.nasa.gov/mission_pages /station/structure/elements/radiators.html#.V6s9IusrJaQ.
NASA. 2013d. “Space Debris and Human Spacecraft.” September 26, 2013. http://www.nasa.gov/mission_pages/station/news/orbital_debris.html.

H-9
NASA. 2013e. “Space Station Illuminates Dusty Plasmas for a Wide Range of Research.” July 10, 2013. http://www.nasa.gov/content/space-station-illuminates-dusty-plasmas-for-a-wide-range-of-research/stationresearch/#.V4AYPOsrJaQ.
NASA. 2014a. “Commercial Orbital Transportation Services: A New Era in Spaceflight.” Johnson Space Center History Office. NASA/SP-2014-617. https://www.nasa.gov /sites/default/files/files/SP-2014-617.pdf.
NASA. 2014b. “Space Station Research: Destiny Laboratory Attached to International Space Station.” http://www.nasa.gov/content/destiny-laboratory-attached-to-international-space-station.
NASA. 2014c. “Emerging Space: The Evolving Landscape of 21st Century American Spaceflight.” https://www.nasa.gov/sites/default/files/atoms/files /emerging_space_report.pdf.
NASA. 2014d. “Extending the Operational Life of the International Space Station until 2024.” IG-14-031 (A-13-021-00). September 18, 2014. https://oig.nasa.gov/audits /reports/FY14/IG-14-031.pdf.
NASA. 2014e. “Space Station 3-D Printer Builds Ratchet Wrench to Complete First Phase of Operations.” December 22, 2014. http://www.nasa.gov/mission_pages /station/research/news/3Dratchet_wrench.
NASA. 2015a. “FY 2015 NASA Operating Budget.” NASA HEOMD. https://www.nasa.gov/sites/default/files/files/7-Budget-Mumford.pdf.
NASA. 2015b. “FY 2016 President’s Budget Request.” https://www.nasa.gov/sites /default/files/files/NASA_FY_2016_Budget_Estimates.pdf.
NASA. 2016a. “Facts and Figures. International Space Station.” Last updated August 6, 2017. http://www.nasa.gov/feature/facts-and-figures.
NASA. 2016b. “FY 2017 Budget Estimates.” http://www.nasa.gov/sites/default/files /atoms/files/fy_2017_budget_estimates.pdf.
NASA. 2016c. “International Space Station: Research and Technology Results by Category.” http://www.nasa.gov/mission_pages/station/research/experiments /results_hardware.html.
NASA. 2016d. “Microgravity Science Glovebox. International Space Station.” June 15, 2016. http://www.nasa.gov/mission_pages/station/research/experiments/350.html.
NASA. 2016e. “Rodent Research Contributes to Osteoporosis Treatments.” NASA Spinoff/Health and Medicine. https://spinoff.nasa.gov/Spinoff2016/hm_1.html.
NASA. 2017a. “About the Hubble Space Telescope.” Last updated December 12, 2017. http://www.nasa.gov/mission_pages/hubble/story/index.html.
NASA. 2017b. “International Space Station.” Last updated October 17, 2017. http://www.nasa.gov/mission_pages/station/main/onthestation/facts_and_figures.html.
H-10
NASA. 2017c. “International Space Station: Kibo Laboratory.” Last updated August 3, 2017. https://www.nasa.gov/mission_pages/station/structure/elements /jem.html#.V2Q-xNUrJaQ.
NASA. n.d. “About JWST Innovations: The Primary Mirror.” http://jwst.nasa.gov /mirrors.html.
NASA. n.d. “Skylab.” https://www.nasa.gov/sites/default/files/skylab1.jpg.
NASA. n.d. “Space Station Research Experiment.” http://www.nasa.gov /mission_pages/station/research/experiments/PCG-HM1.jpg.
NASA Office of the Inspector General. 2013. “NASA’s Efforts to Maximize Research on the International Space Station.” Report No. IG-13-019. https://oig.nasa.gov /audits/reports/FY13/IG-13-019.pdf.
NASA Office of the Inspector General. 2015. “Audit of NASA’s Management of International Space Station Operations and Maintenance Contracts.” Report No. IG-15-021. https://oig.nasa.gov/audits/reports/FY15/IG-15-021.pdf.
NASA Office of the Inspector General. 2016. “NASA’s Commercial Crew Program: Update on Development and Certification Efforts.” Report No. IG-16-028. https://oig.nasa.gov/audits/reports/FY16/IG-16-028.pdf.
National Institutes of Health (NIH) Office of Extramural Research. 2016. “Notice of Intent to Publish a Funding Opportunity Announcement for the NIH-CASIS Coordinated Program in Tissue Chip Systems Translational Research in Space.” July 11, 2016. http://grants.nih.gov/grants/guide/notice-files/NOT-TR-16-018.html.
National Research Council (NRC). 2011. Recapturing a Future for Space Exploration: Life and Physical Sciences Research for a New Era. Washington, DC: The National Academies Press.
NRC. 2012. NASA Space Technology Roadmaps and Priorities: Restoring NASA’s Technological Edge and Paving the Way for a New Era in Space. Washington, DC: The National Academies Press.
NRC. 2014. 3D Printing in Space. Washington, DC: The National Academies Press. https://doi.org/10.17226/18871.
National Academies of Sciences, Engineering, and Medicine. 2016. Achieving Science with CubeSats: Thinking Inside the Box. Washington, DC: The National Academies Press. https://doi.org/10.17226/23503.
NewYork.com. “Secrets of MetLife Stadium.” http://www.newyork.com/articles/wp-content/uploads/2013/12/4-metlife-stadium-eco-friendly_650.jpg.
Nextbigfuture.com. 2013. “Upgraded SpaceX Falcon 9.1.1 Will Launch 25% More than Old Falcon 9 and Bring Price Down to $4109 per Kilogram to LEO.” Nextbigfuture.com, March 22, 2013. https://www.nextbigfuture.com/2013/03 /upgraded-spacex-falcon-911-will-launch.html.
Olympic.org. 2016. “100 Years of Olympic Marketing.” https://www.olympic.org /sponsors/100-years-of-olympic-marketing.
H-11
Onion, A. 2000. “Advertising in Space.” ABC News, July 11, 2000. http://abcnews.go.com/Technology/story?id=120121.
Orbital ATK. 2016a. “Mission Extension Services: Extending the Lives of In-Orbit Satellites: Fact Sheet.” https://www.orbitalatk.com/space-systems/human-space-advanced-systems/mission-extension-services/docs/FS011_15_OA_6062 %20Mission%20Extension%20Services.pdf.
Orbital ATK. 2016b. “Orbital ATK Advocates Cislunar Outpost as America’s Next Step in Human Space Exploration.” https://www.orbitalatk.com/News-Room /PrinterFriendly.asp?prid=150.
Patnaik, P. 2009. Handbook of Inorganic Chemicals. New York: McGraw-Hill.
Pendray, G. 1964. The Guggenheim Medalists. New York: Guggenheim Medal Board of Award of the United Engineering Trustees.
Pittman, B. 2016. “On-Orbit Manufacturing: From Orbital Factories to In-Situ Resource Utilization.” https://attendee.gotowebinar.com/register/5666583135043371522.
ProOrbis, LLC. 2010. “Reference Model for the International Space Station, U.S. National Laboratory.” https://www.nasa.gov/pdf/487816main_10_09_22 %20ISS%20National%20Lab%20ProOrbis%20Reference%20Model.pdf.
Reagan, R. 1984. “State of the Union Address 1984.” Washington, DC. January 25, http://reagan2020.us/speeches/state_of_the_union_1984.asp.
Red Bull Stratos. n.d. “Pressure Suit and Helmet.” http://www.redbullstratos.com /technology/pressure-suit-and-helmet/.
Riebeek, H. 2009. “Catalog of Earth Satellite Orbits.” NASA. https://earthobservatory.nasa.gov/Features/OrbitsCatalog/.
Russo, B. 2016. “Symposium Looks to Future beyond International Space Station.” Las Cruces Sun News, October 13, 2016. http://www.lcsun-news.com/story/news/2016 /10/12/symposium-looks-future-beyond-international-space-station/91976804/.
Saatchi & Saatchi. 2016. “Private Space Station Marketing Revenue.” New York.
Schaul, K., and K. Belson. 2013. “Playing the Stadium Name Game.” The New York Times, July 31, 2013 http://www.nytimes.com/interactive/2013/07/31/sports /playing-the-stadium-name-game.html?_r=0.
Schrimpsher, D. 2006. “Interview: TransHab Developer William Schneider.” The Space Review, August 21, 2006. http://www.thespacereview.com/article/686/1.
Sierra Nevada Corporation. 2014. Spaceflight Insider, October 6, 2014. “A New Partnership: Sierra Nevada and Stratolaunch Join Forces.” http://www.spaceflightinsider.com/organizations/sierra-nevada/new-partnership-sierra-nevada-stratolaunch-join-forces/.
Singleton, M. 2016. “Spotify Hits 30 Million Subscribers.” The Verge, March 21, 2016. http://www.theverge.com/2016/3/21/11220398/spotify-hits-30-million-subscribers.
H-12
Smith, M. S. 2015. “Panel: Seamless Transition to Commercial LEO Space Station Needed.” Space Policy Online.com, September 22, 2015. http://www.spacepolicyonline.com/news/panel-seamless-transition-to-commercial-leo-space-station-needed.
Smith, M. S. 2016. “Gerstenmaier: LEO Commercialization Requires Space Industry to Be Innovative, Nimble.” Space Policy Online.com, February 8, 2016. http://www.spacepolicyonline.com/news/gerstenmaier-leo-commercialization-requires-space-industry-to-be-innovative-nimble.
Space Adventures. 2011. “Space Adventures Concludes Agreement to Offer Commercial Spaceflight Opportunities to the International Space Station.” Press release, January 12, 2011. http://www.spaceadventures.com/press_releases/space-adventures-concludes-agreement-to-offer-commercial-spaceflight-opportunities-to-the-international-space-station/.
Space Adventures. 2015. “Space Adventures Announces Contract with Satoshi Takamatsu for a Future Orbital Spaceflight Mission.” Press release, June 22, 2015. http://www.spaceadventures.com/press_releases/space-adventures-announces-contract-with-satoshi-takamatsu-for-a-future-orbital-spaceflight-mission/.
Space Foundation. 2015. “The Space Report Online: 2015.” Colorado Springs, CO: Space Foundation. http://www.TheSpaceReport.org.
Space Systems Loral. 2016. “MDA Corp. says more HTS satellites coming; pursues repositioning as U.S. entity.” http://spacenews.com/mda-corp-says-more-hts-satellites-coming-pursues-repositioning-as-u-s-entity/.
Space Telescope Science Institute. 2016. “James Webb Space Telescope Sunshield.” http://www.stsci.edu/jwst/overview/design/sunshield.
Spaceflight Insider. 2015. “Structure Wings Deployed.” http://www.spaceflightinsider.com/wp-content/uploads/2015/11 /structurewingsdeployed1.jpg.
SpaceNews Staff. 2012. “Computer Sciences Wins Ames Support Contract.” SpaceNews, July 30, 2012. http://spacenews.com/computer-sciences-wins-ames-support-contract/.
SpaceX. 2016. “Capabilities & Services.” September 2, 2016. http://www.spacex.com /about/capabilities.
Starodubov, D. S., S. Mechery, D. Miller, C. Ulmer, P. Willems, J. Ganley, and D. Tucker. 2014. ZBLAN Fibers: From Zero Gravity Tests to Orbital Manufacturing. Imaging and Applied Optics. https://doi.org/10.1364/AIO.2014.AM4A.2.
The Tauri Group. 2012. “Suborbital Reusable Vehicles: A 10-Year Forecast of Market Demand.” http://www.nss.org/transportation/Suborbital_Reusable_Vehicles _A_10_Year_Forecast_of_Market_Demand.pdf.
The Tauri Group. 2016a. “2016 State of the Satellite Industry Report.” Presentation. https://www.sia.org/wp-content/uploads/2016/06/SSIR16-Pdf-Copy-for-Website-Compressed.pdf.
H-13
The Tauri Group. 2016b. “Start-Up Space: Rising Investment in Commercial Space Ventures.” https://brycetech.com/downloads/Start_Up_Space.pdf.
Taylor, C. R. 2016. “Sponsorship and Advertising Trends in the 2016 Rio Olympic Games: Three Things to Watch For.” Forbes, August 4, 2016. http://www.forbes.com/sites/onmarketing/2016/08/04/sponsorship-and-advertising-trends-in-the-2016-rio-olympic-games-three-things-to-watch-for/#510fff813eba.
Tecolote Research. 2002. “Unmanned Space Vehicle Cost Model (USCM).” El Segundo, CA: U S Air Force, Space and Missile Systems Center.
Tethers Unlimited. 2015. “The Terminator Tape and Terminator Tether Satellite Deorbit Systems: Low-Cost, Low-Mass End-of-Mission Disposal for Space Debris Mitigation.” http://www.tethers.com/TT.html.
Thatcher, A. A., K. Taggart, and S. Dam. 2014. “Building Commercial Space Infrastructure.” Paper presented at the SpaceOps 2014 Conference, Pasadena, California, May 5–9, 2014. https://doi.org/10.2514/6.2014-1898.
Thirkettle, A., B. Patti, P. Mitschdoerfer, R. Kledzik, E. Gargioli, and D. Brondolo. 2002. “ISS: Columbus.” ESA Bulletin 109 (February): 27–33. http://www.esa.int /esapub/bulletin/bullet109/chapter4_bul109.pdf.
Thompson, A. 2010. “How James Cameron’s Innovative New 3D Tech Created Avatar.” Popular Mechanics, January 1, 2010. http://www.popularmechanics.com/culture /movies/a5067/4339455/.
ThorLabs. n.d. “MIR Single Mode Fluoride Fiber Optic Patch Cables.” https://www.thorlabs.com/newgrouppage9.cfm?objectgroup_id=7999.
Torres, A., J. Ganley, and A. Maji. 2014. “Understanding the Role of Gravity in the Crystallization Suppression of ZBLAN Glass.” Journal of Materials Science 49, no. 22 (2014): 7770–81. https//doi.org/10.1007/s10853-014-8488-5.
Wade, M. 2016. “Iridium.” Astronautix.” http://www.astronautix.com/i/iridium.html.
Wattles, J. 2017. “Success! SpaceX launches supercomputer toward International Space Station.” CNN, August 14, 2017. http://money.cnn.com/2017/08/14/technology /spacex-nasa-supercomputer/index.html.
Wertz, J. R., D. F. Everett, and J. J. Puschell, eds. 2011. Space Mission Engineering: The New SMAD. Hawthorne, CA: Microcosm Press.
West Hawaii Today. 2014. “TMT to Begin Construction.” http://westhawaiitoday.com /news/local-news/tmt-begin-construction.
World Space Flight. 2015. “Astronauts and Cosmonauts: List of Names by Nationality.” http://www.worldspaceflight.com/bios/nation_names.php.
Zak, A. 2016. “Uninternational Space Station.” RussianSpaceweb.com, March 23, 2016. http://www.russianspaceweb.com/vshos.html.
Zak, A. 2017. “Science and Power Module, NEM” RussianSpaceWeb.com, November 6, 2017. http://www.russianspaceweb.com/nem.html.
H-14
Zhang, R., Y. Zhang, Q. Zhang, H. Zie, W. Qian, and F. Wei. 2013. “Growth of Half-Meter Long Carbon Nanotubes Based on Schulz-Flory Distribution.” ACS Nano 7, no. 7 (2013): 6156–61. https://doi.org/10.1021/nn401995z.
Zmuda, N. “Red Bull’s Stratos ‘Space Jump’ Wowed the World—While Selling a Lot of Product.” Advertising Age, September 2, 2013. http://adage.com/article/special-report-marketer-alist-2013/red-bull-stratos-space-jump-helped-sell-a-lot-product/243751/.
I-1
Abbreviations
3D Three-Dimensional ABS Acrylonitrile-Butadiene-Styrene ADCS Attitude Determination and Control Subsystem AMF Additive Manufacturing Facility AR Augmented Reality ARISS Amateur Radio on the International Space Station B billion BEAM Bigelow Expandable Activity Module CASIS Center for the Advancement of Science in Space CER Cost Estimating Relationship COTS Commercial Orbiter Transportation Services CRS Congressional Research Service DARPA Defense Advanced Research Projects Agency DOD Depth of Discharge ECLSS Environmental Control and Life Support Subsystem ESA European Space Agency EUMETSAT European Organisation for the Exploitation of
Meteorological Satellites EVA Extravehicular Activity FY Fiscal Year GEO Geosynchronous Earth Orbit GRASP Grapple, Retrieve, and Secure Payload GTO Geosynchronous Transfer Orbit HDPE High Density Polyethylene IDA Institute for Defense Analyses IDIQ Indefinite Delivery, Indefinite Quantity ISS International Space Station ITAR International Traffic in Arms Regulations JAXA Japanese Aerospace Exploration Agency JWST James Webb Space Telescope K Kelvin kg kilogram LEO low Earth orbit M million MEV Mission Extension Vehicle MOU memorandum of understanding MSG Microgravity Science Glovebox NASA National Aeronautics and Space Administration NextSTEP Next Space Technologies for Exploration Partnerships NRC National Research Council

I-2
NSF National Science Foundation R&D research and development RKA Russian Federal Space Agency RSV Robotic Servicing Vehicle SAA Space Act Agreement SARA Southeastern Association for Research in Astronomy SiC Silicon Carbide SLS Space Launch System STEM Science, Technology, Engineering, and Mathematics STPI Science and Technology Policy Institute TRL Technology Readiness Level TT&C Telemetry, Tracking, and Command USCM Unmanned Space Vehicle Cost Model USD U.S. Dollars VR Virtual Reality