
the effectiveness of privately managed marine reserves in
360
THE EFFECTIVENESS OF PRIVATELY MANAGED MARINE RESERVES IN SUSTAINING NEARSHORE FISHERIES IN THE TROPICAL COASTAL ZONE By BJORN PATRIK MIKAEL SVENSSON A thesis submitted to the University of Plymouth in partial fulfilment for the degree of DOCTOR OF PHILOSOPHY School of Biological Sciences Marine Biology and Ecology Research Centre & Centre for Marine and Coastal Policy Research January 2009
-
Upload
khangminh22 -
Category
Documents
-
view
1 -
download
0
Transcript of the effectiveness of privately managed marine reserves in

THE EFFECTIVENESS OF PRIVATELY MANAGED MARINE RESERVES IN
SUSTAINING NEARSHORE FISHERIES IN THE TROPICAL COASTAL ZONE
By
BJORN PATRIK MIKAEL SVENSSON
A thesis submitted to the University of Plymouth
in partial fulfilment for the degree of
DOCTOR OF PHILOSOPHY
School of Biological Sciences
Marine Biology and Ecology Research Centre
& Centre for Marine and Coastal Policy Research
January 2009

This copy of the thesis has been supplied on condition that anyone consults it is understood to recognize that its copyright rests with its author and that no
quotation from the thesis and no information derived from it may be published without the author's prior consent

The effectiveness of privately managed marine reserves in sustaining nearshore fisheries in the tropical coastal zone
by
Bjorn Patrik Mikael Svensson
Abstract There is an emergent need to increase protection of nearshore resources from a growing human population, which is deteriorating coral reef ecosystems through coastal development, overfishing and destructive fishing practices. A possible solution involves increasing the number of smaller Marine Protected Areas (MPAs), creating a network of reserves with greater fisheries potential, while locally remaining small enough not to overly impinge on fishers available fishing grounds. Coral reefs are often found in developing countries, where governments financially struggle to establish successfully managed MPAs. A growing number of Hotel Managed Marine Reserves (HMMRs) have partly therefore, recently been established. Hotels arguably often have adequate funding, resources, and incentive to protect adjacent coastal areas - an HMMR could allow hotels to establish a market niche for a growing environmentally aware tourist.
The principals of an Ecosystem-based Management (EBM) approach was adopted to test protection potential of an HMMR in Vietnam (Whale Island Resort: WIR) from a biological and socioeconomic point of view. Biannual visual fish census surveys (October 2005-April 2007) were conducted at the two marine reserves adjacent to WIR. The 6-year protected Whale Island Bay Reserve (WIB: 11 ha) showed significantly higher fish densities, richness, average size and number of fish >15 cm compared with two unprotected control sites. Fish stocks at the second, newer reserve, Whale Island Bay Peninsula Reserve (WIBP: 5 ha), quickly increased following protection. Fish assemblages at the 5 Artificial Reefs (ARs), made from clay pots (AR areas: 4.2-14.9 m )̂ in WIB, were greater than adjacent area-equivalent Natural Reefs (NRs) (11.15 greater biomass). showing larger fish assemblages with increasing AR size, adding to local fish stocks enhancement.
Surveys were conducted with local fishermen to gauge socioeconomic impacts and management performance of the HMMRs. Fishermen mainly dependent on beach seining mostly opposed the HMMRs, while fishermen using other fishing techniques were generally in favour of the HMMRs, welcoming more protection and confirming spillover of fish, including large food fishes. In a Willingness to Pay (WTP) survey (n=211). 97.5 % of tourists at WIR supported HMMRs and 86.3 % were willing to pay an extra 10 % of the average room rate to stay at such hotels. In a worldwide survey of existing HMMRs, protecting areas from 1-700 ha (average 110 ha +/-13.22 SE), the average management rating attained was high (Good -HMMR is enforced). The accumulated findings from WIR and HMMRs globally, support the great potential of HMMRs as an added tool to protecting a part of our nearshore natural resources.

List of Contents
Abbreviations - 8 -
List of figures -10-
List of tables -16-
Acknowledgements -19 •
Author's declaration - 20 •
1. Introduction and thesis rationale - 21 •
1.1 Thesis aims -23-
1.2 Thesis objectives - 24
1.3 Thesis outline -26-
1.4 Value of coral reefs - 29 -
1.4.1 Tourism -29 1.4.2 Pharmaceuticals - 30 1.4.3 Shoreline protection - 31 1.4.4 Fisheries - 32
1.5 Threats to coral reefs - 33
1.5.1 Overfishing - 34 1.5.2 Destructive fishing - 35 1.5.3 Coral mining - 36 1.5.4 Tourism impacts - 37 1.5.5 Sedimentation - 39 1.5.6 Pollution -41 1.5.7 The effect of climate change on coral reefs - 42
1.6 Mangroves and seagrasses - 47
1.7 Marine Protected Areas - 50
1.7.1 Values of MPAs -52 1.7.2 Governance and MPAs - 55 1.7.3 MPA models -57
1.7.3.1 Centralized management - 58 1.7.3.2 Customary management - 59 1.7.3.3 Community management - 60 1.7.3.4 Co-management - 62
- 4 -
1.7.4 The future - 6 3
1.8 Hotel Managed Marine Reserves -65 1.8.1 User fees -70 1.8.2 Hotel Projects -71 1.8.3 Community Involvement - 73 1.8.4 Hotel awards -75
1.9 Concluding remarks -76
2. Theory and conceptual framework - 78
3. Study site -92
3.1 Vietnam -92 3.1.1 Van Pfiong Bay -94
3.2 Marine Protected Areas in Vietnam -96
3.3 Tourism -97
3.4 Fisheries -98 3.4.1 Legal framework and property rights - 99 3.4.2 Facts and figures - 103 3.4.3 Van Phong Bay fisheries - 105
3.5 Whale Island Resort -107 3.5.1 Resort eco-friendliness and conservation projects - 108 3.5.2 HMMR establishment - 109 3.5.3 HMMR enforcement and poaching - 111 3.5.4 HMMR future - 112
3.6 Summary -113
4. The effectiveness of Whale Island Resort's marine reserves at increasing
fish stocks -115
4.1 Introduction -116
4.2 Study site and methods -121
4.3 Results -124
4.4 Discussion -135
4.5 Conclusion -141
5. Can Hotel Managed Marine Reserves enhance fish stocks by deploying
artificial reefs? -143

5.1 Introduction -144
5.2 Study site -147
5.3 Methods -150
5.4 Results -151
5.5 Discussion -158
6. The perceptions of local fishermen towards a Hotel Managed Marine
Reserve in Vietnam -163 •
6.1 Introduction -164
6.2 Study site and community surveys -167
6.3 Results -171
6.4 Discussion -178
7. Hotel Managed Marine Reserves: A Willingness to Pay survey -189 •
7.1 Introduction -190
7.2 Study site and tourists' willingness to pay -194
7.3 Results -198
7.4 Discussion - 209
7.5 Conclusion -218
8. Hotel Managed Marine Reserves: An analysis of current status - 221
8.1 Introduction -222
8.2 Methodology and study area - 227 8.2.1 HMMR survey -228 8.2.2 HMMR rating - 229 8.2.3 Eco-friendliness - 230
8.3 Results - 233 8.3.1 HMMR survey - 233
8.3.1.1 Basis for reserve establishment - 235 8.3.1.2 Marine conservation projects - 238 8.3.1.3 Finances -238 8.3.1 A Enforcement • 239 8.3.1.5 Objectives -240 8.3.1.6 Advertising - 240 8.3.1.7 Biological status - 241 8.3.1.8 Anthropogenic damaging factors - 243
- 6 -

8.3.2 HfVlMR rating -243 8.3.3 Eco-friendliness survey - 247
8.4 Discussion -249
9. Thesis conclusion - 261
References - 269
Appendix 1. Identified fish species from Whale Island Bay reserve, Whale
Island Bay Peninsula reserve and two Control sites - 312
Appendix 2. Pictures of some fish species mentioned in this thesis, found
around Whale Island (Hon Ong), Vietnam - 317
Appendix 3. Fishers questionnaire - 319
Appendix 4. Tourist questionnaire - 321
Appendix 5. Hotel Managed Marine Reserve questionnaire - 324
Appendix 6. Hotel Managed Marine Reserve rating - 329
Appendix 7. Eco-friendliness rating - 333
Appendix 8. Accepted articles • 336

Abbreviations
ANOSIM Analysis of Similarities
ANOVA Analysis of Variance
CI Control Site 1
C2 Control Site 2
CCEF Coastal Conservation and Education Foundation Inc
CHICOP Chumbe Island Coral Park
CPUE Catch per Unit Effort
CS Consumer Surplus
EAF Ecosystem Approach to Fisheries
EBM Ecosystem-based Management
EEZ Exclusive Economic Zone
ENSO El Nino Southern Oscillation
FAD Fish Aggregating Devices
FAO Food and Agriculture Organization
FEE Foundation for Environmental Education
GDM Gross Domestic Product
HMMR Hotel Managed Marine Reserve
IM Integrated Management
lUCN World Conservation Union
MDS Multidimensional Scaling Ordination
MOFI Ministry of Fisheries
MPA Marine Protected Area

NGO
NM
OECD
PVC
SD
SE
SIMCA
SMMA
SNK
STEP
STSC
TON
UNCED
UNCLOS
VND
W
WIB
WIBP
WIR
WTO
WTP
Non-Government Organization
Nautical Miles
Organization for Economic Cooperation and
Development
Polyvinyl Chloride
Standard Deviation
Standard Error
Sugud Islands Marine Conservation Area
Soufriere Marine Management Area
Student-Newman-Keuls
Sustainable Tourism Eco-Certification Program
Sustainable Tourism Stewardship Council
Total Oxidized Nitrogen
UN Conference on Environment and Development
UN Convention on the Law of the Sea
Vietnamese Dong
Watt
Whale Island Bay
Whale Island Bay Peninsula
Whale Island Resort
World Tourism Organisation
Willingness to Pay

List of figures
Figure 2.1. A DPSIR framework (adapted from (Holman et al. 2005) describing the
main socio-economic drivers exerting pressure on the environment in Vietnam
and the study location. Van Phong Bay, in particular. These pressures in turn
lead to changes in the state of the environment, which may impact human
welfare. Response indicators are formulated to mitigate the damage or
problem, or re-orientate drivers or pressures. Chapters indicate where in the
thesis issues are predominantly addressed - 86 -
Figure 3.1. Google map of Van Phong Bay in Khanh Hoa Province, south-central
Vietnam, showing the location of the study site (Whale Island Resort) and Hon
Mun MPA (bottom left) - 95 -
Figure 3.2. Map showing Hon Ong Island, its reserves (Whale Island Bay reserve:
WIB & Whale Island Bay Peninsula reserve: WIBP), Control sites (CI & C2)
and surrounding villages, located in Van Phong Bay, Khanh Hoa Province,
south-central Vietnam -107 -
Figure 3.3. Picture of part of Whale Island Resort, including the outer marker buoys
for Whale Island Bay reserve (WIB) -108 -
Figure 3.4. Picture of part of Whale Island Bay Peninsula (WIBP: left) and Whale
Island Bay (WIB), Hon Ong Island, south-central Vietnam -111 -
Figure 4.1. Illustration of study area showing Whale Island Resort (WIR), the 11 ha
Whale Island Bay reserve (WIB) and the 5 ha Whale Island Bay Peninsula
reserve (WIBP), plus the locations of the two Control sites (CI & C2) on Hon
Ong (Whale Island), in Van Phong Bay, Khanh Hoa Province, Vietnam . -122 -
10

Figure 4.2. Dendogram illustrating similarities in fish assemblages between Whale
Island Bay reserve (WIB), Whale Island Bay Peninsula reserve (WIBP), and
two Control sites (CI & C2), for surveys conducted biannually between
October 2005 and April 2007 at Whale Island Resort, Hon Ong, Vietnam.
Habitats: Rock (R) and Sand (S) - 127 -
Figure 4.3. Dendogram illustrating similarities (%) in fish assemblages for 3 m
rocky habitats between Whale Island Bay reserve (WIB), Whale Island Bay
Peninsula reserve (WIBP), and two Control sites (C1 & C2), for surveys
conducted biannually between October 2005 and April 2007 at Whale Island
Resort, Hon Ong, Vietnam - 128 -
Figure 4.4. Dendogram illustrating similarities (%) in fish assemblages for 9 m
sandy habitats between Whale Island Bay reserve (WIB), Whale Island Bay
Peninsula reserve (WIBP), and two Control sites (CI & C2), for surveys
conducted btannually between October 2005 and April 2007 at Whale Island
Resort, Hon Ong, Vietnam - 128 -
Figure 4.5. A Multidimensional Scaling Ordination (MDS) showing the similarities in
fish assemblages (square root transformed) between WIB (squares), WIBP
(circles), CI (diamonds) and C2 (pyramids) for surveys conducted biannually
between October 2005 and April 2007 (white to black shading) at Whale Island
Bay, Hon Ong, Vietnam - 129 -
Figure 4.6. The abundance of butterflyfish (Chaetodontidae) found over all survey
periods at Whale Island Bay resen/e (WIB), Whale Island Bay Peninsula
reserve (WIBP) and the two Control sites (CI & C2) (with SE) - 130 -
Figure 4.7. Visual censuses comparing fish species richness, density, number of
fish >15 cm & average size of fish (SE) at the 3 m rocky habitats (1) and the 9

m sandy habitats (2) for Whale Island Bay reserve (WIB), Whale Island Bay
Peninsula reserve (WIBP) and two Control sites (C1 & C2), for surveys
conducted from October 2005 to April 2007 (light to dark grey shading) at
Whale Island Resort, Hon Ong, Vietnam -131 -
Figure 4.8. Seasonality of averaged density and number of fish >15 cm surveyed
at both depths (3 m & 9 m) during time intervals October (2005 & 2006 - light
grey) and April (2006 & 2007 - dark grey) at Whale Island Bay reserve (WIB),
Whale Island Bay Peninsula reserve (WIBP) and two Control sites (CI & C2)
(with SE) -134-
Figure 5.1. Picture of an artificial reef (API), made from clay pots, with long-spine
urchins {Diadema spp.) found amongst transplanted corals, and showing a
school of brown demoiselle (Neopomacentrus filamentosus) and scissortail
sergeants [Abudefduf sexfasciatus) in Whale Island Bay reserve (WIB), Hon
Ong, Vietnam -148 -
Figure 5.2. Illustration of the locations of 5 Artificial Reefs (ARs) and 2 Fish
Aggregating Devices (FADs) found in Whale Island Bay reserve (WIB), Whale
Island Resort (WIR), Hon Ong, Vietnam -149 -
Figure 5.3. A trend analysis of fish stocks for five artificial reefs (ARs) with varying
sizes at Whale Island Bay, Hon Ong, Vietnam -152 -
Figure 5.4. A Multidimensional Scaling Ordination (MDS) showing the similarities in
fish assemblages between 5 artificial reefs (API: circle, AR2: diamond, AR3:
pyramid, AR4: square, AR5: oval) and 4 time periods (October 2005 - April
2007: white to black shading) at Whale Island Bay, Hon Ong, Vietnam.. -153 -
- 12

Figure 5.5. A comparison of fish stocks (standardized for area) between Natural
Reefs (NRs) and Artificial Reefs (ARs) across all survey periods (October
2005 - April 2007) with SE, at Whale Island Bay. Hon Ong, Vietnam -154 -
Figure 5.6. A Multidimensional Scaling Ordination (MDS) showing the similarities in
fish assemblages (fourth root transformed) between artificial reefs (circles) and
natural reefs (squares) for surveys conducted biannually between October
2005 and April 2007 (white to black shading) at Whale Island Bay, Hon Ong,
Vietnam - 157 -
Figure 6.1. Illustration of Whale Island (Hon Ong) showing: Whale Island Resort,
Dam Mon and the nearby fishing villages in Lach Cua Be Channel formed by
Dam Mon Peninsula and Hon Lon Island, in Van Phong Bay, Khanh Hoa
Province, Vietnam - 168 -
Figure 6.2. The fishing techniques and target species of Dam Mon fishermen-173 -
Figure 6.3. Dam Mon fishermen's opinions on the cause of decreasing fish
populations (a.), why coral reefs need protection (b.), why Whale Island Resort
(WIR) enclosed the bay (c), reasons for a change in yearly income brought on
by the establishment of the HMMRs (d.), their perceptions of the fish species
attributing to spillover (<200 m) (e.) and suggestions what WIR and/or
government could do to increase compliance (f.) - 174 -
Figure 7.1. Illustration of Whale Island (Hon Ong) showing the Whale Island Resort
(WIR), the 11 ha Whale Island Bay reserve (WIB) and the 5 ha Whale Island
Bay Peninsula reserve (WIBP) in Van Phong Bay, Khanh Hoa Province,
Vietnam - 195 -
Figure 7.2. Tourists' responses (%) to methods they usually employ to locate and
choose hotels and how they found or heard about Whale Island Resort. - 201 -
- 1 3 -

Figure 7.3. The importance of various criteria to guests when choosing hotels and
choosing Whale Island Resort (%) - 202 -
Figure 7.4. Tourists' graded averages of the biophysical conditions inside Whale
Island Bay reserve (WIB) compared with unprotected areas (n = 86) - 204 -
Figure 7.5. Tourists' reasons for supporting Hotel Managed Marine Reserves
(HMMRs) (n = 163) -206-
Figure 7.6. Tourists' suggestions on Hotel Managed Marine Reserve (HMMR)
advertising and information dissemination (n = 140) - 207 -
Figure 7.7. The percentage of guest rooms willing to pay (US$) extra to stay at an
HMMR, resulting in revenue per year (US$) at 100 % occupancy. Also, the
total revenue per year (US$) based on 60 & 70 % occupancy if all tourists paid
the specified WTP amounts, plus showing the median WTP
(US$ 9.6/room/night) - 208 -
Figure 8.1. World map indicating the locations of 30 Hotel Managed Marine
Reserves (HMMRs) (grey squares) and the 14 which responded (black
squares) - 227 -
Figure 8.2. Details of eco-friendliness requirements of Hotel Managed Marine
Reserves (HMMRs) which need to be satisfactorily fulfilled (broken down to 7
conservation topics) - 232 -
Figure 8.3. The perceived state of species richness, fish abundance, coral diversity
and invertebrate abundance inside the Hotel Managed Marine Reserves
(HMMRs), ranging from high, fairly high, average, fairly low and low. For coral
cover and algae cover: high (>75 % ) , fairly high (50-75 %), average (25-50 %),
fairly low (10-25 %) and low (<10 %) (black - white shading) - 242 -
14

Figure 8.4. The perceived state of species richness, fish abundance, coral diversity,
coral cover, algae cover and invertebrate abundance inside the Hotel
Managed Marine Reserves (HMMRs) compared with unprotected areas,
ranging from much higher, higher, no change, lower and much lower (black -
white shading) - 242 -
Figure 8.5. Anthropogenic factors identified by hotel managers causing damage to
their surrounding coral reef ecosystem - 243 -
Figure 8.6. A break-down of number of hotels fully satisfying Hotel Managed
Marine Reserve (HMMR) management requirements at each level: 1. HMMR
initiated, 2. HMMR established, 3. HMMR enforced, 4. HMMR sustained, 5.
HMMR institutionalised - 245 -
Figure 8.7. Hotels fully satisfying eco-friendliness requirements per environmental
category (average scores expressed as %, including average total score
across all categories, +/- SE) - 247 -
Figure 8.8. A comparison of the hotels' achieved eco-friendliness rating (black) and
Hotel Managed Marine Reserve (HMMR) management rating (Grey) (0: NA, 1:
No pass, 2: Passing, 3: Fair, 4: Good, 5: Very good, 6: Excellent) - 248 -
1 5 -

List of tables
Table 4.1. A biannual breakdown of fish species richness, density (m"^), number of
fish >15 cm and average size of fish (cm) (with SE) found at the 3 m rocky
habitats for Whale Island Bay reserve (WIB), Whale Island Bay Peninsula
reserve (WIBP) and Control sites (CI & C2) -124 -
Table 4.2. A biannual breakdown of fish species richness, density, number of
fish >15 cm and average size of fish (with SE) found at the 9 m sandy habitats
for Whale Island Bay reserve (WIB), Whale Island Bay Peninsula reserve
(WIBP) and Control sites (C1 & C2) -125 -
Table 4.3. A breakdown of coral and rock cover (with SE) across the surveyed
locations: Whale Island Bay reserve (WIB), Whale Island Bay Peninsula
reserve (WIBP) and Control sites (CI & C2) at the 3 m Rocky (R) habitats and
9 m Sandy (S) habitats -126 -
Table 4.4. Fish families contributing most (90 % cut off) to the dissimilarity between
sites: Whale Island Bay reserve (WIB), Whale Island Bay Peninsula reserve
(WIBP), time: (October 2005 (1), 3 biannual survey periods: April 2006 - April
2007 (2-4)), seasonal dissimilarity across sites (including Controls CI & C2)
and habitat dissimilarity across all sites: 3 m rock and 9 m sand (SIMPER, not
transformed data, Diss/SD, dissimilarity/standard deviation, Cum.%,
Cumulative % contribution) -133 -
Table 5.1. ANOVA results of a comparison of fish stocks between artificial reefs
and natural reefs for surveys conducted biannually between October 2005 and
April 2007, in Whale Island Bay, Hon Ong, Vietnam -154 -
- 16

Table 5.2. Fish stocks (standardized for area) found at Artificial Reefs (ARs) and
Natural Reefs (NRs) over 4 survey visits at Whale Island Bay, Hon Ong,
Vietnam -155 -
Table 5.3. SIMPER analysis (fourth root transformed) of fish contributing most
(75 % cut off) to the dissimilarity between reef types: Natural Reefs (NRs) and
Artificial Reefs (ARs) (Diss/SD, dissimilarity/standard deviation, Cum.%,
Cumulative % contribution, *, Pomacentridae) at Whale Island Bay, Hon Ong,
Vietnam - 156 -
Table 6.1. Breakdown of Dam Mon fishermen's responses to the first questionnaire
distributed by the Chairman of the People's Committee (%) and second
interview-based questionnaire, expressed in number of families -172 -
Table 7.1. Breakdown of tourists' demographic and personal data and their
Willingness to Pay (WTP) (US$) extra to stay at an HMMR with Standard
Errors (SE) - 199-
Table 7.2. Breakdown of tourists* environmental awareness, knowledge and their
Willingness to Pay (WTP) (US$) extra to stay at an HMMR (SE) - 203 -
Table 8.1. Details of management requirements of Hotel Managed Marine
Reserves (HMMRs) which need to be satisfactorily fulfilled, (broken down to
levels and time periods) - 230 -
Table 8.2. Operational, reserve and location details of the 14 Hotel Managed
Marine Reserves (HMMRs), listed alphabetically by country - 234 -
Table 8.3. Details of the management strategy, objectives and additional
environmental projects of the 14 Hotel Managed Marine Reserves (HMMRs),
listed alphabetically by country - 236 -
17

Table 8.4. A list of hotels which advertise that have a Hotel Managed Marine
Reserve (HMMR), including the perceived influence of HMMR marketing on
occupancy, average length of stay and number of return guests - 240
Table 8.5. Average scores of fully satisfied Hotel Managed Marine Reserve
(HMMR) management requirements per level (SE), the score range of these
and the average score from the number of questions (%) - 246
- 18

Acknowledgements
Foremost, I would like to thank my supervisors and peers at the University of
Plymouth: Martin Attrill (Professor of Marine Ecology) and Lynda Rodwell (Lecturer
in Ecological Economics) for their continuous support and encouragement
throughout the course of my PhD. Special thanks and praise to Michel Galey
(owner of Whale Island Resort, Vietnam) for his great marine conservation efforts
and for funding my board and accommodation at his hotel during my research
visits. Thanks are also due to the hotel managers (Gerom Di Spigno and Ronan
Roussel) and hotel staff who I became good friends with and who supported and
accommodated my research needs. A great thank you also to Jeremy Stein of
Rainbow Divers for unrestricted use of their SCUBA diving equipment. A final
thanks to my wife, family and friends, particularly Jason Lockwood, for his aid with
several of the thesis' illustrations and figures.
- 19

Author's declaration
At no time during the registration for the degree of Doctor of Philosophy has the
author been registered for any other University award without prior agreement of
the Graduate Committee.
This was a part-time, remote, self-financed study, carried out in collaboration with a
Hotel Managed Marine Reserve (HMMR) in Vietnam (Whale Island Resort).
Relevant courses (e.g. statistics course) were attended and several papers were
prepared for publication.
Publications:
Svensson, P., L. D. Rodwell, and M. J. Attrill. 2008. Hotel managed marine
reserves: a willingness to pay survey. Ocean & Coastal Management
51:854-861
Svensson, P., L. D. Rodwell. and M. J. Attrill. 2009. Privately managed marine
reserves as a mechanism for the conservation of coral reef ecosystems: a
case study from Vietnam. AMBIO. 32:72-78
Svensson, P., L. D. Rodwell, and M. J. Attrill. 2010. The perceptions of local
fishermen towards a hotel managed marine reserve in Vietnam. Ocean &
Coastal Management 53:114-122
Word count: 55,306
Signed /S^^., Date ^,?.0!^</0.
- 2 0 -

1. Introduction and thesis rationale
Coral reefs and related ecosystems are essential elements of the marine
environment. These biologically-rich habitats provide important ecosystem services
(i.e. the benefits human populations derive, directly or indirectly, from ecosystem
functions) on local, regional and global levels (Costanza et al. 1997). Despite their
importance, a large percentage of coral reefs are threatened by human activities,
including overfishing, destructive resource extraction methods, coastline
construction and pollution (Kleypas & Eakin 2007).
To combat increasingly deteriorating marine resources, a large number and
various forms of management tools have been employed, ranging from deploying
Artificial Reefs (ARs) to attract fish and decrease fishermen's Catch per Unit Effort
(CPUE), to establishing Marine Protected Areas (MPAs), which have been very
popular over recent decades. MPAs can potentially provide biodiversity
conservation benefits, as well as fisheries benefits (Sale et al. 2005). Various
management approaches for MPAs have been employed to ascertain reserve
objectives are fulfilled, including top-down, centralized management (covering the
largest area of protection), bottom-up or community-based management, co-
management involving resource users (at times also the private sector) and the
government, which generally focuses on local level protection, as well as private
management. To be effective on a holistic scale, it has been suggested that MPAs
should be embedded within management frameworks such as Integrated
Management (IM) or Ecosystem-Based Management (EBM), which aim to restore

or improve the quality of marine ecosystems and the societies they support
(Christie & White 2007).
The need for more effective marine reserve systems has been recognised at the
World Summit on Sustainable Development (Johannesburg 2002), and later at the
World Parks Congress (Durban, September 2003), suggesting networks of marine
reserves covering 20-30 % of habitats by 2012 (lUCN 2003a). Included in global
concerns is the need to specifically protect nearshore coastal areas, as these are
under heavy pressure from overfishing and coastal development, caused by an
ever growing population migrating to coastal areas (Kleypas & Eakin 2007). It is
suggested that several smaller MPAs could be advantageous in these situations,
as they do not deprive locals of all their fishing grounds (Jennings et al. 1996),
which will have a less significant effect on the socio-economic welfare of
dependent communities, likely to result in a higher level of compliance (Unsworth
et al. 2007). A network of these MPAs could increase important fish stocks over a
larger area (Roberts et al. 2001). Small MPAs can rapidly increase the density,
biomass and average size of target species within their borders following effective
protection (Halpern 2003). The increasing fish stocks within the reserve,
compounded by the favourable size/area ratio of small reserves, could provide
suitable settings for spillover of fish to adjacent fished areas (Kramer & Chapman
1999).
A large majority of MPAs are, however, reported as failing to reach reserve
objectives (Jameson et al. 2002). Securing adequate funding was found to be a
crucial basis to MPA success (Davis & Tisdell 1996). Hotels often have adequate
- 2 2 -

financial backing and resources to practically protect smaller coastal areas (Colwell
1999), with the added incentive of establishing a market niche directed at an
increasingly aware eco-tourist (Weaver & Lawton 2007) to secure future funding
and business. A network of thousands of small Hotel Managed Marine Reserves
(HMMRs) lining tropical coastal countries could perhaps result in a win-win
situation for the environment, local communities and hotel, if effectively managed.
As resource users, especially those under foreign management, it could be implied,
that hotels have a socioeconomic obligation to adjacent communities foremost, but
also to the region and nation.
1.1 Thesis aims
The aims of this thesis were to research whether HMMRs are able to restore or
improve the quality of the marine ecosystem and the adjacent communities they
support, as well as determining support for HMMRs from the general public. An
HMMR In Vietnam (Whale Island Resort: WIR) with two marine reserves (WIB: 11
ha and WIBP: 5 ha) was adopted as a study site. The findings were used to
establish its success in achieving said alms, and these were further extrapolated to
identify the global consequences of promoting HMMRs as an added tool to marine
protection. A worldwide survey of existing HMMRs was additionally conducted to
corroborate local findings.
23

1.2 Thesis objectives
This thesis takes an ecosystems approach to determine HMMR success at
realising the aims set by the author. In order to establish whether the alms were
met, the following objectives were set:
Biological (Chapter 4)
1. Do the HMMRs at WIR successfully compete with other recognised MPA
management regimes with regards to sustaining or improving the
biophysical environment, increasing the diversity of fish assemblages and
enhancing stocks?
2. Can a small HMMR increase fish stocks within Its borders? If so, over what
time period Is there likely to be evidence of fish stock enhancement?
Artificial Reefs (ARs) (Chapter 5)
1. Is there a correlation between the size of ARs and their potential at
increasing fish assemblages?
2. Are the ARs in the HMMR at WIR contributing to Increasing fish stocks to
adjacent fished areas?
3. How do ARs compare with Natural Reefs (NRs) at enhancing fish stocks?
- 2 4 -

Community (Chapter 6)
1. What are the perceived benefits and costs of the HMMR at WIR to local
fishermen?
2. What lessons can be learnt from the experience of HMMRs at WIR and how
can these be transferred to other case studies considering the
establishment of more HMMRs?
Wider public (Chapter 7)
1. Do tourists support the establishment of HMMRs?
2. How much are tourists willing to pay extra to stay at HMMRs?
3. What factors influence their Willingness to Pay (WTP)?
HMMRs worldwide (Chapter 8)
1. What management approaches and marine projects do other HMMRs
pursue?
2. How do hotel managers perceive their HMMR's success In restoring or
improving the quality of adjacent marine ecosystems and the communities
they support?
- 2 5 -

3. How does hotel managers' perceived management method of HMMRs rate
against community or co-managed MPAs in the Philippines?
4. How eco-friendly are HMMRs?
1.3 Thesis outline
This thesis takes an ecosystem-based approach to marine protection. The first
sections provide a thorough literature review describing the values and threats to
coral reef ecosystems. I discuss MPA governance and various management
regimes currently existing, introducing HMMRs as a growing management
approach to coastal resource protection.
In the second chapter, I describe the theoretical and conceptual frameworks this
thesis builds upon, detailing the history and development of frameworks such as
Integrated Management (IM), Ecosystems Approach to Fisheries (EAF), and
Ecosystem-based Management (EBM).
In the third chapter I detail the case study site used for this thesis, starting with
background information on Vietnam, its existing MPAs, tourism potential and
fisheries management capacity and legal framework. I then focus more on the
wider area surrounding the study site (Van Phong Bay), before describing WIR and
its 11 ha and 5 ha marine reserves.
26

The following five chapters are the main analytical chapters, each representing the
backbones of articles which have already been accepted, are currently in review,
or which may still be sent to various journals for publication. Accepted articles can
be found in Appendix 8.
In the fourth chapter, I describe the biological effectiveness of the HMMR In terms
of increasing fish density, species richness and size compared with nearby
geomorphologically similar unprotected areas. This research Involved underwater
visual monitoring over a two-year time span.
In the fifth chapter, I assess the Importance of AR size at Increasing the density
and size of fish, report on their role at increasing fish assemblages, and compare
these results with NRs. These underwater AR surveys were similarly conducted
over a two-year period; the natural reef data for comparison were provided from
the surveys conducted in Chapter 4.
In the sixth and seventh chapters, I consider the socio-economic aspects of the
HMMRs, with regards to local fishermen's perceptions of the management of the
reserves, and tourists' support and WTP extra to stay at HMMRs. The support
attained from these different groups of people could serve as important reference
points when considering promoting HMMRs as an added or alternative tool for
increasing the number, and thereby size of marine resource protection. The results
of these two chapters derive from questionnaires which were either completed
independently by the two target groups or completed through interviews. Tourist
27

surveys were collected over a two-year period, whilst the fishermen surveys were
conducted twice, separated by a six-month interval.
Since thorough analysis of the biological and socioeconomic management
effectiveness of one HMMR does not suggest HMMRs' entitlement to be promoted
as an alternative management approach on a larger level, I attempted to determine
the effectiveness of several HMMRs. In the eighths chapter, I therefore review
existing HMMRs, their conservation projects, objectives, management approaches
and perceived effectiveness at Improving the quality and quantity of local biota, as
well as attempt a rating approach to their marine management and eco-frlendliness.
This concludes the main analytical chapters. These results were similarly, mostly
attained by questionnaires sent to, and returned by hotel managers by email, but
also by telephone, having searched for, and contacted suitable hotels and several
others over a four-year period.
The ninth chapter concludes the thesis with a short summary of my findings,
problems encountered, highlights, recommendations and suggestions for further
research.
2 8 -

1.4 Value of coral reefs
Coral reefs are critical components of the marine ecosystem, not only to the
diverse life they and their affiliated ecosystems support and the vast potential of
curative drugs that can be prospected (Aldridge 2006), but they are also
fundamental to the development of coastal countries providing food, minerals,
construction material and income to local and regional economies, Including
fisheries, tourism and shoreline protection (Dixon et al. 1993). It Is estimated that
coral reefs are providing economic revenues of US$ 30,000 million/year to local
communities (WWF 2003). This study also found that destroying just one kilometre
of reef range costs between US$ 137,000 - 1.2 million over a 25-year period, when
fishery, tourism, and protection values alone are considered.
1.4.1 Tourism
Over recent decades, reef tourism has become a major global industry, attracting
millions of tourists each year wanting to experience the biodiversity and rich
colours of the corals, fish and Invertebrates, contributing to local income generation
and foreign exchange (Cesar 2000). More than 100 countries accommodating
nearly 500 million people living within 100 kilometres of a coral reef, benefit from
the production, protection and recreational values associated with reefs (Bryant et
al. 1998) and the world's population is still growing! It is estimated that the median
predicted world population will reach 9.3 billion by 2050 (United Nations 2001) and
the number of coral reef tourists are increasing. Visitors to the Great Barrier Reef
- 2 9 -

alone increased from 1.1 million in 1985 to over 10 million In 1995 (Spalding et al.
2001). DrimI (1994) estimated the financial value of tourism to this area to US$ 586
million annually, while Caribbean tourism earned US$ 8900 million In 1990 and
employed over 350,000 people (Dixon et al. 1993). The World Tourism
Organization (WTO) estimated that some 1600 million international tourists will visit
the leading destinations by 2020, spending more than US$ 5000 million each day
(IHEI 2003). Forecasts for international tourist arrivals to East Asia and the Pacific,
suggest 397 million arrivals In 2020. This represents an annual growth rate of
6.5 % between the period 1995 - 2020, which Is above the global growth rate of
4.1 % (IHEI 2003). With such a large predicted growth in tourism, it Is vital that we
ensure sustainable development of coastal regions and protect coral reefs. In order
to safeguard revenue from reef tourists.
1.4.2 Pharmaceuticals
As a result of the environmental conditions in which marine organisms are found,
these have developed chemical weapons (i.e. sponges for example produce a
substance to ward off would-be predators), which have evolved into highly potent
inhibitors of physiological processes in the prey, predators or competitors of the
marine organisms that use them (Haefner 2003). The pharmaceutical industry has
discovered the vast potential for making new drugs from these substances to
develop anticancer, AIDS-inhibitIng, antimicrobial, anti-inflammatory and antl-
coagulatlng drugs from seaweeds, sponges, molluscs, corals, sea fans, sea
anemones and gorgonians (Carte 1996; Hunt & Vincent 2006). The Nobel Prize In
- 3 0 -

Chemistry 2008 was awarded to three scientists who initially discovered and
subsequently developed the Green Fluorescent Protein as a tagging tool in
bioscience. It can, for example, illuminate growing cancer tumours, show the
development of Alzheimer's disease in the brain or the growth of pathogenic
bacteria. This glowing green fluorescent protein was first discovered in the jellyfish
Aequorea victoria (The Royal Swedish Academy of Sciences 2008). Marine
bioprospecting, or developing drugs from the marine ecosystem, only started its
evolution in recent decades but as of 2003, over 14,000 new chemical entities
have been identified from marine resources (Proksch et al. 2003), and at least 300
patents have been issued on marine natural products (Kerr & Kerr 1999).
1.4.3 Shoreline protection
One of the functions coral reefs perform is that of self-repairing breakwaters.
Healthy, reef ecosystems tend to be accreting systems or at least in equilibrium
with the eroding power of the waves (Talbot & Wilkinson 2001). These protect the
shoreline from wave action and the impact of storms. The benefits from this
protection are widespread, ranging from maintaining highly productive mangrove
fisheries and wetlands, to supporting local economies by providing sheltered areas
to build protected ports and harbours (Bryant et al. 1998). They also tend to be
sources of sand for the lagoons and beaches they protect (Talbot & Wilkinson
2001). If coral reefs are destroyed or mined, waves will eventually cause erosion
on land, which especially low-lying island nations will hugely suffer from. Land
erosion on the densely populated coastline of Sri Lanka has, for example, led to
-31 -

large-scale evacuations, causing thousands to loose their homes, not to mention
the inevitable high financial strain on the government (Rajasurlya & White 1995).
1.4.4 Fisheries
Over a quarter of the world's marine fish species are found on coral reefs,
comprising over 4000 species (Spalding et al. 2001). According to the UN Food
and Agriculture Organization (FAO) statistics (FAO 1997), 10% of total world
marine fishery landings were composed of reef-associated fisheries In 1997 and in
some parts of the Indo-Pacific region, reef fisheries constituted as much as 25 % of
the total fish catch, providing food for one billion people in Asia alone (HInrichsen
1997; Jameson et al. 1995). As much as 20 % of all animal protein consumed
globally by humans comes from marine environments, representing an annual
catch valued at US$ 50-100 billion (White & Cruz-Trinidad 1998). In Asian
countries, such as Bangladesh, Malaysia. Vietnam, Thailand and the Philippines,
protein from fish contribute to over 30 % of the population's total animal protein
consumption; over 50 % in Indonesia and Sri Lanka (Stobutzki et al. 2006). These
countries together produce 23 million tonnes of fish annually. It is estimated that 1
km^ of healthy reef can produce 10-30 tonnes of fish biomass through sustainable
fishing (White & Cruz-Trinidad 1998). Unfortunately, due to overfishing and other
anthropogenic Influences, most reefs will not reach these levels. Coral reef
fisheries in the Philippines provide livelihood to more than a million small-scale
fishers. These contribute almost US$ 1 million annually to the country's economy
(White et al. 2000), but more important than the actual monetary amount, Is the
- 3 2 -

benefit fishermen receive from open access reef fisheries, providing a safety net in
times of social and economic hardship by securing a source of income and
employment in areas where often few employment alternatives exist (Jameson et
al. 1995; Sadovy 2005).
1.5 Threats to coral reefs
Many human activities directly impact reefs: significant threats are caused by
overfishing (Kleypas & Eakin 2007), coral mining (Rajasuriya & White 1995),
destructive fishing practices (Cesar et al. 1997), trampling and SCUBA diving
(Harriott et al. 1997; Hawkins & Roberts 1993), sedimentation due to deforestation
and coastal development (Davenport & Davenport 2006; Huber 1994; Shackley
1999; Talbot & Wilkinson 2001), industry and agriculture (Corniaux et al. 1997),
and pollution (Davenport & Davenport 2006; Duivy et al. 2003). Indirect impacts of
human activities, such as coral bleaching are the most obvious effect of climate
change on biodiversity (Hoegh-Guldberg 2004; Lough 2008). Natural disasters
such as hurricanes, tsunamis or disease are also threats to coral reefs and may, to
a certain extent, be influenced by climate change (Garcin et al. 2008; Gardner et al.
2005; Jones et al. 2004).
33

1.5.1 Overfishing
Fishing pressure on coral reefs has increased remarkably over the years due to
human population growth, which has the potential of making this ecosystem less
productive and biodiverse and no longer sustainable (McClanahan & Mangi 2004).
McClanahan et al. (2008) estimated high fishing yields (approximately 16 tonnes
km"^ yr'^) along 75 km of Kenya's most populated coastline, but reported declines
in Catch per Unit Effort (CPUE), mean trophic level and functional diversity of
fished taxa over 10 years as a result of an increase in fishing effort and
competitive/destructive gear use, due to population growth and declining resources.
The estimated potential yield of all fishes for Philippines' Exclusive Economic Zone
(EEZ) was estimated at approximately 1.9-2.2 million tonnes in 2000. Coastal
sector catches were, however, already estimated to be double the maximum
sustainable yield in 1994 (White et al. 2000). Similarly, overfishing was reported a
primary threat to approximately 64 % of Southeast Asia's coral reefs (Chou et al.
2002). More effective fishing methods have been developed, as well as
accessibility to reefs through an increase in the number of fishing vessels
(Spalding et al. 2001). Also, trawling fish and storing them in mass refrigerators
makes transportation to overseas markets possible as well as fishing in bulk
(Spalding et al. 2001). A big problem is that in many countries, fish catch is not
adequately managed, funded or monitored, especially for coral reef fishing (Sadovy
2005), so the policies of maximum sustainable yield or maximum economic yield,
defined as the yield which gives the highest possible economic return for the effort
expended, can not be upheld (Cesar et al. 1997; Gibson et al. 1998; Spalding et al.
2001; White et al. 2000). Overfishing has been recognised as one of the three
- 3 4 -

most significant threats to ecosystems (Kleypas & Eakin 2007). It can cause
considerable change in the community structures of fish and other organisms and
there is also the risk of over-exploitation, leading to extinction of certain species or
even functional group (Roberts 1995). Overfishing can also disrupt the natural
ecology of the reef, making these systems less resilient when confronting natural
destructive events such as hurricanes (Roberts 1995).
1.5.2 Destructive fishing
Destructive fishing techniques such as blast fishing or cyanide fishing are
detrimental to the coral reef ecosystem, threatening approximately 56 % of
Southeast Asia's coral reefs (Chou et al. 2002). Blast fishing Is the most
destructive fishing method on reefs (Spalding et al. 2001). One blast can undo the
work of decades of coral growth, with the corals requiring just as long or longer to
recover since coral rubble makes for a poor stable substrate for coral re-growth
(Fox et al. 2003). In a study researching hard coral recovery in rubble fields
created by blast fishing in Konnodo National Park and Bunaken National Park,
Indonesia, there was no significant natural recovery within nine sites after a 5-year
monitoring period (Fox et al. 2003). Explosives are commonly home-made, often
using fertilizers, although dynamite is also used. This fishing practise Is non
selective, the shock waves killing all species with gas-filled swim bladders. There
are also a high number of Individuals lost as they sink to the ocean floor or get
caught among the corals (Spalding et al. 2001). Unfortunately these practices are
still widespread in the Indo-pacific (Fox 2004; White et a!. 2000).
- 3 5 -

Poison fishing (sodium cyanide) used in the illegal capture of live fish also has a
damaging effect on corals. Jones and Steven (1997) demonstrated that at
concentrations which could be accredited to various cyanide fishing techniques,
the corals died in experiments with high concentrations, lost their zooxanthallae at
medium concentrations leading to bleaching, and even lost some zooxanthallae at
low concentrations, but not In sufficient numbers to cause discoloration. The
ornamental fish trade is a large business worth millions each year (Chapman et al.
1997), the main exporters of ornamental fish being Indonesia and the Philippines
(80 7o). It is estimated that the world-wide import value of marine ornamentals Is
US$ 200-330 million annually (Shuman et al. 2004), unfortunately making It a
valuable investment for poor countries.
1.5.3 Coral mining
Specifically in countries with very low levels of income, communities help
themselves to the natural resources surrounding them. Corals can be used in the
production of mortar and cement, as a pH regulator In agriculture (lime - calcium
carbonate) and crushed coral debris can be used as fertilizer (Cesar 1996;
Kuhlmann 1988). When too much coral reef Is extracted, eventually waves will
pound the remaining coral to sand and rubble and cause massive erosion on land.
In the Maldives and Sri Lanka, a large proportion of the reefs have been excavated
over the years as a basis for building materials, and massive erosion has taken
place along the coasts (Clark & Edwards 1994; Rajasuriya & White 1995). Since
- 3 6 -

the population density near the coasts of the Maldives and Sri Lanka is very high,
the habitation of these people has been severely compromised. Thousands of
dollars have therefore been invested in building artificial reefs and detached
breakwaters made of concrete tetrapods (Clark & Edwards 1994; Rajasuriya &
White 1995). In the Maldives, the breakwaters cost US$ 10,000 per linear meter,
indicating the importance of healthy reefs for the economy of the country (Clark &
Edwards 1994).
1.5.4 Tourism impacts
Local communities are not the only reef users who can cause significant damage.
The tourism business is booming. Wherever there are coral reefs, impacts from
tourism through diving, snorkelling or trampling of the coral has caused
considerable damage (Barker & Roberts 2004; Harriott et al. 1997; Hawkins &
Roberts 1993). For example, benthic communities of dived areas were compared
to control sites in Sharm-el-Sheikh, Egypt. In the heavily dived areas, there were
significantly more damaged coral colonies, loose fragments of live coral, fragments
of coral reattached to the substratum and partially dead and abraded coral,
compared with the controls (Hawkins & Roberts 1992). Off the Caribbean Island of
Bonaire, Hawkins et al. (1999) compared fish and coral communities between an
undived reserve and a reserve which hosted a maximum of 6000 divers per year.
They found no difference in fish assemblages but a difference in coral
assemblages. There was a significant decline in old colonies of massive coral
(19.2 % loss) at the dived site compared with 6.7 % loss in the reserve. It is also
- 3 7 -

suggested that background stress can cause a shift In community structures.
Abrasions from divers on massive corals can Increased their susceptibility to
disease, causing a community shift to branching corals at the expense of massive
corals (Hawkins et al. 1999).
A more damaging impact from tourism, rather than mere direct physical contact, is
coastal development to support tourism (Kleypas & Eakin 2007). Infrastructure
needs to be developed, including building roads, airports etc., landfill or beach
enhancements may be needed and resorts need to be built, which may result in
large quantities of sediment to be released into the sea, which can kill corals
directly or reduce their growth rate and ability to settle (Hawkins & Roberts 1994;
Rogers 1990). To be able to accommodate tourists, there will be need for sewage
disposal facilities, which. If insufficiently treated, and/or discharged into the sea, wil
cause nutrient enrichment or eutrophication, which enables algae to thrive,
overgrow and kill corals (Walker & Ormond 1982). Further nutrient enrichments
may also originate from desalination, irrigation or rubbish. Local damage to corals
can be caused by the hot brine effluent produced by desalination plants or
generator cooling water, nutrient seepage from irrigation water of treated
wastewater, which percolates through porous coastal rock and enters the sea, or
plastic bags and other litter, which can smother corals (Hawkins & Roberts 1994).
Already In the early 90's, a part of the Red Sea (Egypt, Israel and Jordon)
experienced a big boom in tourism. As a result, 100 % of Israel's coast containing
coral reefs was affected by tourism (resort development, diving snorkelling or
38

fishing); 50 % and 19 % were affected In Jordon and Egypt respectively (Hawkins
& Roberts 1994).
In fact, coral reef damage starts already when tourists board a plane. The
increasing number of tourists travelling abroad, specifically long flights to warmer
climates, e.g. flying to the Seychelles from northern Europe, Increases the amount
of atmospheric carbon dioxide, contributing to 90 % of a typical journey's
environmental Impact (Gossling 2000; Gossling et al. 2002). High concentrations of
atmospheric carbon dioxide can reduce the concentration of a mineral in the sea
water which corals need to grow, weakening the coral skeleton (Spalding et al.
2001).
1.5.5 Sedimentation
Erosion and sedimentation from land can also have a destructive effect on coral
reefs (Abelson et al. 1994; Brown et al. 2002; Gibson et al. 1998; McLaughlin et al.
2003). As sediment Is suspended In the water column. It reduces or blocks the
amount of light available, preventing growth and even survival. While corals are
able to remove the sediment by secreting mucus, such an activity uses energy and
nutrients, weakening the corals and reducing growth or reproductive potential,
leaving them less able to compete with other benthic organisms such as algae or
filter feeders (Spalding et al. 2001). Sedimentation can be caused by deforestation,
agriculture, raising of cattle and other animals, dredging of ports and marinas,
bottom-fish trawling and cleaning of prawn and fishponds after harvest and coastal
- 3 9 -

development (clearing of land for housing and the now wide-spread tourism
development projects) (Spalding et al. 2001).
Chou et al. (2002) found that 88 % of Southeast Asia's coral reefs were at risk.
Coastal development, defined by dredging, land filling, mining of sand and coral,
coastal construction, and discharge of sewage, threaten 25 % of the coral reefs at
medium to high threat. Reefs of Singapore, Vietnam, Taiwan, the Philippines, and
Japan were the most threatened by coastal development, each with over 40% at
medium or high threat.
Terrestrial runoff of red clay soils is a major threat to Islands in Japan. The Ryukyu
Island corals receive runoff from poor land development and agriculture, road
building, forestry and other coastal developments aiming to attract more tourists. In
2001, there was a mass mortality of Pontes corals caused by heavy runoff of red
clay soil and fresh water from Todoroki River on Ishigaki Island. More than 75 % of
corals died in an 8 ha area; 25 % in another 27 ha area nearer the river. In Sesoko
Island, 5000 m^ of coral reef was destroyed during shoreline construction (Chou et
al. 2002).
McClanahan and Obura (1997) have, however, shown that on shallow coral reefs,
(<5 m) in the Sabaki River catchment basin, Malindi, Kenya, no evidence for
decreased diversity and ecological health of sediment-influenced reefs could be
found. Instead, they found that different genera of corals have different tolerance
levels for sediment, which could alter the community structure. On the other hand,
Yentsch et al. (2002) suggest that light limitation due to high levels of
- 4 0 -

sedimentation forces corals off Florida to grow at very shallow depths. At these
depths, corals are functioning close to the compensation point, where respiration
(of coral polyp and zooxanthellae) consumes the products of photosynthesis of the
zooxanthellae, with little, if any, remaining for growth. The skeleton of the corals
thus become very thin and fragile, often breaking in the higher wave actions of the
shallower regions.
1.5.6 Pollution
In many cases, the influence of sedimentation and pollution are combined (Edinger
et al. 2000). Over 20 % of coral reefs of Southeast Asia are at risk from land-based
sediment and pollution (Burke et al. 2002). Agricultural runoff contains nitrogen-
and phosphorous-enriched sediment from fertilizing efforts, which leads to
eutrophication in water, which in turn provides a more competitive environment for
the growth of planktonic algae and macroalgae (Spalding et al. 2001). Human,
agricultural and industrial wastes contain organic compounds. Marine bacteria
break down this organic pollution and increase inorganic pollution (nitrate, nitrite,
ammonium and phosphate etc.) which also causes eutrophication (Talbot &
Wilkinson 2001). Pollution is common around cities and farms and where
increased population growth has occurred. The South Western Island Nations have
seen rapid population growth and development in rural areas, resulting in loss of
coastal habitats, overfishing, pollution and eutrophication in inshore reefs (Zann
1994). Eutrophication reduces the coral's growth and reproductive potential,
making them less resilient to changing environments and stresses. Wielgus et al.
- 41 -

(2004) demonstrated that levels of 0.4 pM Total Oxidized Nitrogen (T0N:N02, NO3)
showed significantly lower live stony coral cover and abundance per m^ and higher
partial mortality of coral colonies than sites exposed to lower TON. After a mass
mortality of coral reefs following a period of low tide exposing the coral reefs in
Ellat, Israel, In 1970, the coral reefs located further away from sources of pollution
recovered more quickly and retained their coral abundance and diversity, unlike the
corals closer to the source of the pollution (WIelgus et al. 2003).
Apart from pollution from Inland sources, pollution also has a marine-based origin.
In Southeast Asia, pollution from ports, oil spills and leakage, ballast and bilge
discharge, and dumping from ships threaten 7 % of the coral reefs, with Japan and
Taiwan having the highest threats at 15 %. Cambodia and Singapore have few
coral reefs, but most of these are threatened (medium or higher) by marine
pollution (30 and 100 % respectively) (Burke et al. 2002).
Pollution such as oil, heavy metals and pesticides have all been shown to increase
the level of stress In symbiotic cnldarians, which may cause (or at least help cause)
coral bleaching, together with Increasing sea temperatures and irradlance (Brown
2000).
1.5.7 The effect of climate change on coral reefs
A few decades ago, the link between Increased greenhouse gases, climate change,
and regional scale bleaching was not understood, but today the connection Is
- 4 2 -

irrefutable (Hoegh-Guldberg 1999; Hughes et al. 2003). Coral bleaching results
from the expulsion of the symbiotic zooxanthellae by the coral polyps and/or by the
loss of chlorophyll by the zooxanthellae themselves, making them pale or white
(Spalding et al. 2001). It is caused by various types of stresses, mainly related to
climatic change such as sea temperature rises above the corals' tolerance level,
exposure to air, fresh water flooding, sedimentation, disease or pollution (West &
Salm 2003).
Worldwide, corals can survive In temperatures ranging from approximately 16 -
36°C, but on a regional scale, the range within which corals can survive is much
lower. Temperature changes on any given reef slope rarely shifts more than 4°C
(Spalding et al. 2001). There is evidence that corals (especially in cooler areas)
have their bleaching threshold near to the expected upper temperature at that
location, giving them a very narrow spectrum, and suggesting a trade-off between
the risk of mortality and thermal protective mechanisms (e.g. antioxidant enzymes,
heat shock or photoprotective proteins and pigments) (Hughes et al. 2003). Hoegh-
Guldberg (1999) suggested that coral-bleaching events such as the mass
bleaching event following the El Nino Southern Oscillation event (ENSO) In 1997-
98, when in certain areas 90 % of all corals died, will be common place within the
next 20 years. He indicates that the sea temperatures In many tropical locations
have risen by 1°C over the last century and are currently Increasing at the
equivalent of 1-2°C per century; the thermal tolerance of reef-building corals will
therefore be exceeded every year over the next couple of decades.
43

Hughes et al. (2003), however, considered the possibility that bleaching
susceptibility may change over time as a result of phenotypic and genetic
responses. Gene flow varies highly among species (Ayre & Hughes 2000, 2004),
suggesting that, if corals would adapt to higher thermal thresholds, or migrate to
warmer locations at a fast enough pace, there will be a change in the community
structure, but corals will survive.
West and Salm (2003), however, still stress that the single greatest threat to coral
reefs worldwide is rising sea surface temperatures as a result of climate change.
They have compiled a review of existing literature related to resistance and
resilience of corals towards high temperatures, indicating that there are natural
"pockets of resistance" where local environmental conditions boost coral
survivability during large-scale bleaching events. These pockets are, for examples,
in areas of reported small-scale, localized, cold-water upwellings (Goreau et al.
2000); in areas where there is vertical mixing or increased flow rates (Nakamura &
van Woesik 2001); in locations which protect the corals from irradiation, such as
shaded areas (fissures or clouds), or areas of high turbidity (Glynn & Dcroz 1990;
Goreau et al. 2000); finally, in areas that are regularly exposed to high
temperatures, which has been reported to increase thermal tolerance of corals and
thus resistance to bleaching (Craig et al. 2001). West and Salm (2003) suggest
that such described areas should be incorporated into strategic networks of MPAs
designed to maximize conservation of global coral reef biodiversity.
The number of bleaching events and disease outbreaks has greatly increased in
frequency and magnitude over the last two to three decades (Hoegh-Guldberg
- 4 4 -

1999; Keller et al. 2009). There is evidence that temperature increases act as a
trigger for various outbreaks of coral diseases like black-band, white band, black
spots and white plague II disease (Jones et al. 2004; Jordan-Dahlgren et al. 2005;
Kaczmarsky et al. 2005; Santavy et al. 2005). In the summers of 2001-2003, a
disease outbreak of black-band and white plague occurred on the fringing reefs off
Magnetic Island, Australia, simultaneously with a bleaching event, resulting in a 3-4
fold Increase in the mean percentage of partial mortality in the hard coral Montipora
aequituberculata. The reason for the outbreak was attributed to the warmer
summer water temperatures (Jones et al. 2004).
Kaczmarsky et al. (2005) have also attributed the outbreak of coral diseases to the
proximity of sewage discharges. They observed a significantly higher level of coral
impacted by black-band and white plague II disease at Frederiksted (13.6 %)
compared with the upstream site Butler Bay (3.7 %) in St Croix, Caribbean. On the
other hand, Nugues et al. (2004) suggested that the more frequent disease
outbreaks of white plague II over the last decades may have been attributed to the
macroalga Halimeda opuntia: Montastraea faveolata exposed to algal transplants
developed the disease, whereas unexposed colonies did not.
Another type of outbreak, which was first reported in the 1960s around Green
Island, Australia, saw hundreds of thousands of crown-of-thorn starfish
(Acanthaster plana) killing 80 % coral cover. Several of these outbreaks have
since been recorded in the Indo-Pacific but the reasons for their outbreaks are still
not absolutely clear. One theory suggests that it is a behavioural response to
aggregate after storms (Spalding et al. 2001). A later study looking at an outbreak
- 4 5 -

on Lizard Island, Australia (1995-1999), however, suggested that outbreaks result
from a prolonged build-up In starfish numbers through multiple successive
recruitment events (Pratchett 2005).
The frequency and Intensity of hurricanes may increase in some regions because
of climate change, increasing coral decline, and decreasing the amount of time for
recovery between occurrences. Gardner et al. (2005) tried to quantify the
contribution of hurricanes to the loss of coral cover in the Caribbean between
1980-2001. Of 286 sites which had been monitored for variable lengths In this
period, 177 had been hit by hurricanes. Overall statistics showed that coral cover
had declined by 6 % per annum at impacted sites, compared with non-impacted
sites (2 % ) . Full recovery had not been recorded until at least 8 years after a
hurricane event.
The long-term sustainability of coral reefs is also threatened by global climate
change induced by the release of carbon dioxide into the atmosphere from human
activities, such as fossil fuel use and deforestation. Carbon dioxide is readily
absorbed by seawater, Increasing the acidity. This may cause weakening of coral
skeletons and reduce coral animals' ability to construct limestone reefs and the
habitats they provide (Andersson et al. 2007), especially at higher latitudes
(Kleypas et al. 1999).
Periodic natural catastrophes such as earthquakes and hurricanes have taken
place over millennia but coral reefs have been resilient to these disturbances
(Connell et al. 1997). Chronic human disturbances over the last few decades
- 4 6 -

appear to be more damaging to coral reefs, decreasing their resilience (Hughes &
Connell 1999). As a consequence, reef systems often show poor recovery when
affected by natural disturbances if they have already been exposed to chronic
human disturbances (Moberg & Foike 1999). Biological diversity enhances the
resilience of coral reefs, important to sustain the ecological goods and services of
this ecosystem and sustain them from natural and human induced disturbances
(Elmqvist et al. 2003). A loss of resilience may alter the state of the ecosystem
leading to an invasion of non-reef building organisms such as soft corals or
zoanthids, but more often, a change to an algae-Infested state. This changes the
community from a high diversity coral-based ecosystem, to a macroalgae-
dominated system, with diminished genetic, species and functional diversity (Done
1992).
1.6 Mangroves and seagrasses
Mangroves and seagrass beds are highly productive systems, which play a critical
role as part of the Interdependent coral reef ecosystem. They are, however,
disappearing rapidly despite their well-documented biodiversity and the ecosystem
sen/ices they provide (Hogarth 2007).
Global loss of mangrove forests were estimated to exceed 35 % (Valiela et al.
2001). Only approximately 18.000,000 ha mangrove forest still exist in the world
(8 % of the coastline) (Spalding et al. 2001); between 16,000.000 and 50,000,000
ha for seagrass meadows (10 % of the coastline) (Green & Short 2003). By the
- 4 7 -

early 1990's, it was estimated that both Malaysia and Myanmar had lost almost 75
% of their original mangrove cover; Thailand 84 %; Vietnam 37 %. Estimates from
the late 1980's suggested that the Philippines had lost 67 % of its mangroves,
Brunei 20 %, and Indonesia 55 % (Chou et al. 2002).
Similar to coral reefs, Southeast Asia is also a hotspot for mangrove forests and
seagrass beds, containing 51 of the world's 70 mangrove species and 23 of the 50
seagrass species. Approximately 35 % of mangroves are found in Southeast Asia
(Burke et al.2002).
Mangroves and seagrasses bind soft sediment, providing coastal protection and
facilitating the development of coral reefs in areas that might othenwise have too
much silt for coral growth. In turn, reefs buffer wave impacts, helping to minimize
erosion of the soft sediments that mangroves and seagrasses need to grow. They
provide other services such as water purification, and they absorb CO2, while
protecting a vast number of species. Mangroves provide habitat for many
mammals, amphibians, reptiles, unique plants, fish and invertebrates. Seagrasses
also host a large number of species, including threatened species such as
dugongs and seahorses. They not only support substantial fisheries within their
waters, but they also help maintain many commercially important offshore species
that utilize mangrove or seagrass areas as spawning and nursery grounds (e.g.
spiny lobster, snapper, barracuda, jacks) (Spalding et al. 2001). Mangroves
provide nutrients by shedding and dropping about 7.5 tonnes of leaf litter per acre
and year. These are broken down by bacteria and fungi and released into the
water (Hogarth 2007). In California, it was estimated that mangrove-related fish
- 4 8 -

and crab species account for 32 % of the small-scale fisheries in the region
(Aburto-Oropeza et al. 2008).
Mangroves are also suggested to strongly influence the community structure of fish
on neighbouring coral reefs in the Caribbean. Mumby et al. (2004) found that the
biomass of several commercially important species was more than doubled when
adult habitat was connected to mangroves. They also discovered that the largest
herbivorous fish in the Atlantic, Scarus guacamaia, which has a functional
dependency on mangroves, suffered local extinction after mangrove removal.
In a field experiment using artificial seagrass leaves and mangrove roots, Verweij
et al. (2006) found that during daytime, herbivores and diurnally active
zoobenthivores were attracted to mangroves and seagrass beds primarily for food,
and nocturnally active zoobenthivores for structure (in interaction with shade) that
offers shelter from predation. The barracudas were also attracted primarily to
structure, but it was suggested that the larger individuals probably used this to
ambush prey rather than for protection.
In a study conducted by Unsworth et al. (2008), on the importance of Indo-Pacific
seagrass beds as a nursery for juvenile fish, it was discovered that seagrass beds,
which were in close proximity to mangroves, enhanced fish assemblages,
supporting at least twice the fish abundance and species richness, when compared
with seagrass beds that were distant from mangrove habitats. The reason was
attributed to the increased availability of shelter and food in mangroves.
49

Despite several studies indicating the importance of mangroves and seagrass beds
as a nursery habitat for juvenile fish species, offering juveniles additional shelter
and higher food availability than on the reefs alone, there is still controversy to
which extent they influence fish assemblages and growth on coral reefs
(Nagelkerken et al. 2002). In a study conducted by Grol et al. (2008), the growth
rate and preferred food of the juvenile Haemulon flavolineatum was determined in
seagrass, mangrove and coral reef habitats. Copepoda was the most consumed
food items in all three habitats. It was found that the abundance of Copepoda and
growth rates of the juveniles were higher in coral reef habitats, suggesting that
coral reefs would be a more suitable habitat for small juveniles. This finding was,
however, in exclusion of other mangrove and seagrass services, such as shelter
from predation.
Mangroves and seagrasses are being destroyed by many of the same activities
that threaten coral reefs. Seagrasses are being destroyed by land reclamation,
pollution, sedimentation, dredging, and trawling, as well as clearing to enhance the
seascape for tourism development. Clearcutting for timber, fuelwood, and the
creation of aquaculture farms particularly endanger mangroves (Burke et al. 2002).
1.7 Marine Protected Areas
Unfortunately, a high percentage of the coral reefs of the world are at risk. Bryant
et al. (1998) predicted that 58 % of the world's reefs are either medium to highly
threatened by human activity. Coral Reefs of Southeast Asia, the most species-rich
-50-

on Earth, are the most threatened (80 %), mainly attributed to coastal development
and fishing-related pressures. The Caribbean, with its very high dependence on
the tourism industry, has over 60 % under threat.
Marine Protected Areas (MPAs) have long been venerated as a successful
management strategy to increasing species richness, biomass and biodiversity of
coral reef ecosystems leading to higher resilience (Dayton et al. 2000; Grafton &
Kompas 2005; Roberts 2003; Russ & Alcala 1998; West & Salm 2003). A definition
of MPAs provided by The World Conservation Union (lUCN), states that an MPA is
"any area of intertidal or subtldal terrain, together with its overlying water and
associated flora, fauna, historical and cultural features, which has been reserved
by law or other effective means to protect all or part of the enclosed environment".
(Resolution 17.38 of the lUCN general assembly (1988), reaffirmed in Resolution
19.46 (1994)). The earliest marine protected areas may have been some of the
reefs of the Pacific, where local communities or community chiefs placed
restrictions or total bans on fishing. Legally protected marine areas are a more
recent phenomenon, with only a few sites declared by the end of the 19^ century.
Only in the 1960s did MPAs experience a dramatic increase in numbers. In 2005,
the total area of coral reefs was estimated to 527,540 km^. however, only 18.7 %
were covered in the 980 MPAs worldwide; less than 0.01 % were within MPAs
defined as no-take zones with no poaching and at low risk (Mora et al. 2006).
The modern concept of protected areas and, the therefrom evolved, marine
protected areas, likely stems from the last century, when the governments of
industrialising countries began to set aside areas of particular scenic beauty or
-51 -

uniqueness exclusively for conservation. Most of these protected areas excluded
local people however, so that local inhabitants were either forced to move, or
protected areas were established in isolation, away from societies. This concept of
'isolationism' likely stems from a protection model developed for the Yellowstone
National Park in 1872; both the design and management of the park sought to
protect the reserve from the surrounding society. Until quite recently, few plans for
protected area management made any mention of the people living inside forests,
coastal strips, wetlands and other biodiversity-rich areas earmarked for
conservation (Pimbert & Pretty 1995).
1.7.1 Values of MPAs
MPAs are recognised as an important and often crucial management tool to
conserve biodiversity and maintain or increase stock. Protected areas can increase
the animal body size and age, thus increasing the spawning stock size and
reproductive output of (rare) species (Alcala et al. 2005; Friedlander et al. 2003;
Williamson et al. 2004). Fisheries can benefit from this by augmented catches
through the export of offspring to fishing grounds and through the spillover of
juveniles and adults (Ashworth & Ormond 2005; Gell & Roberts 2003; Russ et al.
2003).
Kramer and Chapman (1999) argue that the reserve has to be large enough to
protect the animals from fishing by encompassing their ranges of movement, but
they suggest that for fisheries to benefit, reserves must be small enough so as not
- 5 2 -

to prevent spillover to fished areas. This is because the edge-to-area ratio of a
reserve increases as its size decreases. Some research suggests propagule
dispersal in coral reef organisms to be on the order of a few tens of kilometres
(Mora & Sale 2002; Palumbi 2004; Shanks et al. 2003). It has thus been
recommended that MPAs should be 10 to 20 km in diameter and equally far
spaced from each other (Shanks et al, 2003). Mora et al. (2006) estimated that in
order to obtain an optimal global network of MPAs, each 10 km^ in area and
spaced 15 km apart, an additional 2559 MPAs would be required, protecting
another approximately 25,590 km^ of the world's coral reefs.
Halpern (2003) reviewed 89 studies into the effects of reserves that were at least
partially closed to fishing, revealing significant results for density, biomass, size
and diversity. It was established that 63 % of reserves increased the abundance of
protected animals, 80 % increased their average size, 90 % increased biomass,
and 59 % increased diversity. These findings were unrelated to the size of the
reserve; the size spectrum analysed, ranging between 0.002 - 846 km^; the mean
was 4 km^. Roberts and Hawkins (1997) have also shown that spillover can
increase fish catch from small reserves such as the small Anse Chastanet reserve
in St. Lucia (0.026 km^).
MPAs can also be a great income-generating tool. El Nido, Philippines Is a
renowned tourism location, attracting divers from all over the world, but it is only
thanks to the marine reserve, which was eventually opened after an ecological and
economic study proclaimed that the coral reefs were more valuable than the
destructive large-scale logging of the forest which had been smothering coral and
- 5 3 -

killing them since 1985. The reefs could provide more sustainable income from
fishing and tourism than the income from removing the timber and destroying the
coral reefs by sedimentation (Talbot & Wilkinson 2001).
Coelho and Manfrino (2007), however, suggest that MPAs may not be enough to
effectively protect coral communities from degradation. Coral communities in
protected and unprotected areas around the relatively undeveloped Little Cayman
Island (150 permanent residents) were analysed from 1999 to 2004 to test the
hypothesis that a lack of major local anthropogenic disturbances would be enough
to prevent a decline in coral populations. Their findings suggested no significant
differences in coral reef decline between protected and unprotected areas (each
10 % mean decline in live coral cover). The decline was attributed to disease
outbreaks and bleaching events. They propose that coral communities are under
multiple stresses and therefore, require complex management strategies on top of
merely declaring no-take zones.
Some mechanisms to help slow down the decline have been suggested:
restoration initiatives (Epstein et al. 2003; Rinkevich 2005), shading corals when
water temperatures reach critical levels (West & Salm 2003), identifying corals
particularly resistant to disease and bleaching, harvesting their larvae, and
propagating recruits with this genotype (West & Salm 2003), protecting areas of
historically low bleaching events caused by advantageous hydrodynamic patterns
or other factors,as suggested by West and Salm (2003), establishing international
protected areas that take migratory routes and breeding grounds into account
(Mora et al. 2006; Sale et al. 2005). These initiatives, not in lieu of, but
- 5 4 -

complementary to establishing more effectively managed protected areas, while
enforcing worldwide legal measures to slow down global climate change (CO2
emissions) (Anderson & Newell 2004), reducing pollution sources e.g. sewage, oil,
heavy metal (Bruno et al. 2003; Guzman & Garcia 2002; Negri et al. 2002), will be
required to prevent coral reefs from disappearing in the next decades (Coelho &
Manfrino 2007).
1.7.2 Governance and MPAs
MPA implementation requires supportive legal and jurisdictional frameworks. MPAs
affect resource user behaviour and require large-scale development, which will
require trade-offs. A legal framework describing boundaries and management rules
of any MPA is a fundamental step that legitimates management decisions. Multiple
institutions and various levels of governance will likely become involved in any
MPA implementation process (Christie & White 2007). Governance may be
conceived as '1he formal and informal arrangements, institutions, and mores which
determine how resources or an environment are utilized; how problems and
opportunities are evaluated and analyzed, what behaviour is deemed acceptable or
forbidden, and what rules and sanctions are applied to affect the pattern of
resource and environmental use" (Juda 1999).
Christie and White (2007) argue that the key to successful management of marine
resources is the establishment of appropriate institutions which ensure meaningful
consultation with the public about design and management of MPAs. Hilborn et al.
- 5 5 -

(2005), furthermore, suggest the inclusion of a reward system so that the individual
welfare of fishermen, managers and scientists is maximized. Fundamentally,
however, MPA governance is heavily influenced by the particular socio-political
history, economic well-being, culture, health and education level of the country or
of communities of an affected site (Mascia & Claus 2009).
The system of governance and property laws in Vietnam has changed dramatically
during the 1990s from central planning, towards a market-oriented economic
policy. As part of this trend, certain productive assets such as agricultural land,
forests and marine resources have effectively been privatised. These resources
were previously solely managed through state organised cooperatives or through
complex hybrid organisations, whereby the local government overlaid traditional
common property rights regimes, resulting in local compromises in allocation
struggles for land and livelihoods (Adger et al. 2001). The coexistence of
customary and official systems is a common phenomenon in wetland areas,
resulting from the under-evaluation of these areas and lack of a long history of
ownership, clear tenure rights or any official delineation of property rights (Adger &
Luttrell 2000). More information on Vietnam's marine fisheries reform can be found
in Chapter 3.4.1 Legal framework.
Hughes et al. (2005) propose that in order to restore ecosystems and reduce
fishing pressure to enable the rebuilding of stocks and to improve governance, the
creation of frameworks that align the marketplace and economic self-interest with
environmental stewardship and conservation, will need to be developed. Hence, for
MPAs to be effective on a wide scale, it has been suggested that MPAs should be
- 5 6 -

embedded within frameworks such as Integrated Management (IM) or Ecosystem-
based Management (EBM) (Browman & Stergiou 2004; Forst 2009). Though EBM
is a more recent framework, and largely untested, both these frameworks have
been designed to balance resource management and economic development,
consider ecologically significant processes, and encourage cross-sectoral
planning. Impacts from terrestrial activities, intersectoral conflicts, overfishing and
the management of trophic interactions are central issues being addressed by
these broad models. As a general premise, how these management frameworks
evolve is influenced by whether there are functional common property regimes in
place or resources are open access (Christie & White 2007). Important steps for
applying EBM are to identify management objectives for the ecosystem, including
natural and human goals, and to ensure that the governance structure matches
with the scale over which ecosystem elements are measured and managed
(Ruckelshaus et al. 2008). These and other frameworks and how common property
regimes have evolved in Vietnam will however be covered in more detail in
Chapters 2 and 3.
1.7.3 MPA models
The lUCN has categorized six levels of protection for MPAs: Category l a - Strict
Nature Reserve, managed mainly for research; Category lb-Wilderness area,
managed mainly for wilderness protection; Category II - National Park, managed
mainly for ecosystem protection and tourism; Category III - Natural Monument,
managed mainly for conservation of specific natural features; Category IV -
- 5 7 -

Habitat/Species management Area, managed mainly for conservation through
management intervention; Category V - Protected Landscape/Seascape,
managed mainly for landscape/seascape conservation and recreation; Category VI
- Managed Resource Protected Area, managed mainly for the sustainable use of
natural ecosystems (Salm et al. 2000). There are, however, a number of other
forms of marine protection that are variations of these, or named differently, but
they are all protected individually or through national or regional systems (Salm et
al. 2000). A broader classification differentiates MPAs by which management
regime models they have adopted. These including: top-down, bottom-up, co-
management, and traditional management regimes (Christie & White 1997).
1.7.3.1 Centralized management
Top-down or centralized management is the most common governance regime
adopted by countries with strong national governments and which have
considerable financial resources. Many of these have established fisheries
agencies as policy makers for catch allocations and MPA design and management
(Christie & White 2007). MPAs managed by governments tend to be larger than
other management regimes, and may include multinational agreements, although
linking issues such as vessel-source pollution and catch allowance has proven
difficult (Kaye 2004). Centralized management is perceived as having adequate
resources at hand to employ specialists who have experience with MPA planning
and are able to use modelling software and other scientific data to establish
ecological connectivity, animal migrations and changing climatic conditions to
- 5 8 -

design MPAs (Christie & White 2007). This is, however, not always the case. In
Brazil, da Silva (2004) found that competing societal problems such as health,
economic development and education will often be prioritized over MPA planning
and monitoring, especially when budget cuts are made.
There are limitations of centralized management. The most serious limitations are
associated with how stakeholder groups respond to policies that affect them, but
for which they do not feel responsible. Many examples exist of extraction
limitations or fishing bans being advocated to areas which have historic
precedents, potentially leading to socioeconomic and demographic changes and
inevitable conflicts (Badalamenti et al. 2000; Jentoft 2000; Viteri & Chavez 2007)
1.7.3.2 Customary management
Traditional or customary ocean governance has existed for millennia in the Pacific
Islands, grounded in 'taboos' and social norms, suggesting that these governance
systems are sustainable and effective in some contexts (Christie & White 2007).
They use similar techniques to those used today, but in light of the limited numbers
still existent in today's globalised world, it is suggested that they are potentially
fragile and best suited to support modest, local commercial and subsistence
activities (Johannes 1981). The number of traditional marine resource managed
areas has, however, seen an upsurge lately in a few places in Oceania. In Vanuatu
for example, there were 40 areas in operation in 1993; 86 in 2001. The reasons for
the unexpected recent increase have, amongst others, been attributed to the
- 5 9 -

perception among islanders of the growing scarcity of their marine resources owing
to the demands of growing export markets and local populations, as well as the
income some communities can earn from keeping their reefs healthy in order to
attract tourists (Johannes 2002). Traditional management is based on customary
sea tenure, a situation in which groups of people (e.g. individuals, clans, tribes, etc.)
have informal or formal rights to coastal areas and in which their historical rights to
use and access marine resources are, in principle, exclusionary, transferable, and
enforceable (Ruddle 1996). These customary management practices may limit
extraction by spatial areas, time, gear or harvesting technology, effort (through the
number of participants), types of species that can be harvested and the number of
fishes harvested (e.g. through quotas) (Cinner & Aswani 2007).
1.7.3.3 Community management
Bottom-up or community managed MPAs are widely considered the most effective
reef management system in the tropics (White & Vogt 2000). especially where
there are weak formal institutions, or in countries where resistance to colonialism is
strong. The governments may lack financial or technical resources to effectively
serve the public, suggesting such an approach may be the only feasible option
(Christie & White 2007). In contrast to top-down management approaches, bottom-
up strategies tend to engage resource users more effectively than top-down
strategies since they lead to a sense of trust, collaboration, and ownership among
participants (Christie & White 1997). Local communities can develop a sense of
self-determination, which can engender a sense of pride that attracts participation
-60-

in management and inspires people to educate others in similar situations. Bottom
up management approaches also represent a means to reassert authority over
traditional resources upon which they depend, and their knowledge of local
diversity hotspots and ocean currents in surrounding seas can help provide
information of possible locations for MPAs (Christie & White 2007; Kiss 2004).
There are challenges to be overcome when implementing community-based
management regimes. Some neighbouring communities may not wish to support
MPA implementation, communities which have been largely dependent on
government agencies may not have enough incentive to undertake such time-
consuming and difficult processes, and adequate funding from Non-Government
Organisations (NGOs) are generally not long-term; development of successful
community-based MPAs needs approximately three years of financial support and
ten years of at least part-time external technical support (conflict management,
leadership development etc.) (Christie & White 2007).
Difficulties will also be encountered when trying to address large-scale processes
affecting coastal environments and communities, such as climate change,
overfishing and pollution (Christie & White 2007), Community-managed MPAs, if
carefully implemented can. however, lead to sustainable long-term management
regimes, especially if resource users eventually engage the government (Christie
et al. 2005).
61

1.7.3.4 Co-management
Co-management has been described as the fundamental principle of such
arrangements, where resource users and formal policy makers (e.g. the
government) work together in a process of joint decision-making (Christie & White
1997; Nielsen et al. 2004). It is frequently one of the outcomes of community-based
management regimes, which have matured to the point whereby resource users
and policy makers (and other entities such as the private sector) have comparable
influence and are willing to collaborate. This management regime may represent a
sound framework, as it encompasses the local knowledge and needs of fishermen,
while transparent planning processes are formally recognised and sanctioned by
government officials (Christie & White 2007).
Some research suggests however, that governments can be quite deceitful when
co-management is implemented from the start. Nielsen et al. (2004) found several
cases in Southeast Asia and Southern Africa, where governments have only
involved fishing communities in the implementation process (instrumental co-
management) in order to reach their management objectives, rather than to
introduce more democratic principles into fisheries management.
Similar to community-managed MPAs, in order for co-management to be
successful, long-term funding is required to maintain a multi-sectoral management
board, where mandates are clearly established. They are also relatively resistant to
change, which would be necessary to reconcile local and global management
agendas in the future (Christie & White 1997; Nielsen et al. 2004).
- 6 2 -

There are several cases of private sector involvement in co-managed MPAs
(Christie et al. 2002). In such situations, the private sector is meant to bring capital,
business and marketing know-how and a client base; the community partner
usually brings the location, labour and local knowledge, while an NGO or local
government may mediate negotiations between the private and community
partners, strengthen community capacity, provide basic infrastructure and other
necessities (Kiss 2004).
As with centralized management, private management involvement in MPAs tends
to generate considerable controversies, especially when agreements are breeched
with community-based MPAs, in which case compliance generally declines. There
has also been reported criticism of privately managed MPAs, as they have
privatised areas that have historically been "community-owned" (MPA News 2003).
There are nevertheless several examples of private enterprises pursuing
ecosystem-friendly MPA development (Christie & White 2007)
1.7.4 The future
The success of all MPAs depend on the existence of appropriate legal frameworks,
acceptance by coastal communities, an effective and well-supported management
system and the delineation of areas so their boundaries are clear and they can be
treated as self-contained units (Dharmaratne et al. 2000; Salm et al. 2000). If any
of these factors were to be met by strong opposition, or if enough funding wasn't
secured from the start, it is most likely that the protected area will fail to meet its
- 6 3 -
objectives (Dharmaratne et al. 2000). Such MPAs that have been legally protected
but lack management because of the absence of infrastructure, on-site staff or law
enforcement are frequently known as 'Paper Parks' (Braatz et al. 1992).
The need for more effective marine reserve systems has therefore been
recognised in recent years. At the World Summit on Sustainable Development
(Johannesburg 2002), and later at the World Parks Congress (Durban, September
2003), representatives of protected areas recommended networks of marine
reserves covering 20-30 % of habitats by 2012. The Durban Action Plan (from the
World Parks Congress) also called on the private sector to "financially support the
strategic expansion of the global network of protected areas" and states that
tourism can provide economic benefits, opportunities for communities, create
awareness and greater knowledge of our natural heritage (lUCN 2003a).
Balmford et al. (2004) estimated the running costs of a global MPA network
meeting these targets to be US$ 5-19 billion annually, creating around a million
jobs. The estimate was based on a survey of the running costs of 83 MPAs
worldwide. The countries hosting a large proportion of the world's coral reefs are,
however, generally poor, developing nations where government-funded MPAs are
often not meeting their conservation objectives (Burke et al. 2002). In some
countries, private enterprises (such as hotels or dive operators) have taken the
initiative to protect areas of coral reefs, also recognising their importance to the
hotels* own business.
64

1.8 Hotel Managed Marine Reserves
Similar to privately managed parks on land, many of the established privately
managed or co-managed MPAs - Hotel Managed Marine Reserves (HMMRs) are
believed to have been established because of the government's inability to satisfy
the public's and ecotourists' demands for nature conservation in both quantity and
quality, while creating a potentially profitable market niche for their business
(Langholz & Lassoie 2001; Svensson et al. 2008; Svensson et al. 2009). In these
cases, hotel managers generally pay a lease or tax to the owning authority and
close the area to fishing, often by buoy markers. Such arrangements generally take
the form of fixed-term contracts, which makes long-term conservation initiatives
unpredictable. The contracts however, often last over a decade and are mostly
open for renewal. The stable income which is procured is mostly very well received,
especially in poor, developing countries (Beck et al. 2004). Hotel establishments
can also add to local or regional income generation by providing additional or
alternative employment opportunities (directly or indirectly) and/or they may help
develop local infrastructure, which can strengthen a community.
On the other hand, hotels may try to alienate local communities by hiring foreign
staff, or they may try to retain generated income in-house (e.g. all-inclusive hotels),
which would negate the purpose of such small protected areas, especially if there
was limited or no spillover of fish to adjacent fishing grounds within the first couple
of years after establishment. In such situations, especially where foreign
management is involved, it is not difficult to realise that affected communities would
feel animosity towards the hotel, which could lead to varying degrees of conflict
-65 -

(Christie 2005). Therefore, community involvement and joint decision making is
extremely important when establishing protected areas (Langholz & Lassoie 2001).
Most dive resorts have boats, personnel and other equipment needed to manage
local protected areas and they often have the financial backing and incentive to
protect their assets (Colwell 1999). Hotels' success does however depend on a
relatively stable influx of tourism, which could, amongst other, be influenced by the
political stability of the country, natural disasters and the economy (Dearden et al.
2005).
There has recently, nevertheless, been a shift in governance, leading away from
government-managed protected areas, towards increased participation of
stakeholders, with the private sector, local communities and NGOs having a large
influence on protected area decision-making (Dearden et al. 2005). In a report on a
change in governance of protected area systems between 1992 and 2002 in 41
countries, Dearden et al. (2005) found increasingly more countries, relying on a
broader range of funding sources; the medium and less developed countries
relying significantly more on funds from foreign governments, donations and
concessions paid by the private sector (25 % compared with 14 % of total funding).
Colwell (1999) undertook a preliminary study of hotels and resorts which have
taken over the day-to-day management of a protected area from the government.
These hotels, termed "Entrepreneurial MPAs" had in some cases taken over full
responsibility of the reserve through a performance contract. Riedmiller (1999) also
describes cases where private entities have been able to buy or lease areas of
- 6 6 -

high biodiversity with the aim of protecting the biodiversity of these areas. In
researching the coastal states surrounding the United States. Slade et al. (1997)
found that nearly one third of submerged lands were owned or leased by the
private sector, developing marinas, private docks, fisheries, aquaculture or other
ventures. Some MPAs have also been initiated and managed by hotels, only to be
expanded and relieved of management by a government body, following their
success at increasing fish stocks or sustaining or enhancing biodiversity. These
precursors to government managed MPAs can be seen as costs saved by the
government for or an area, otherwise previously needing protection (Langholz &
Lassoie 2001).
In the northwest corner of Palawan Island, Philippines, blast fishing, cyanide fishing
and other sorts of destructive fishing methods are illegal, but are still practiced. The
resort in Bacuit Bay allowed government patrols to use their boats, facilities and
equipment to protect the area. Staff were also deputised as sanctuary wardens. As
a result, the reefs within the reserve were reported to be in relatively good
condition, while those on the outside, in relatively poor condition. In 1998 the
president of the Philippines proclaimed the El Nido Resort as a Managed Resource
Protected Area (Colwell 1999). Similarly, on the Island of Roatan, Honduras, the
Anthony's Key Resort was the primary force in establishing the Sandy Bay Marine
Reserve in 1989. The resort supplied patrol boats, gas and mooring buoys for the
reserve. Within two years of establishing the reserve, there were dramatic
increases in lobster, grouper and other marine life (Colwell 1999).
-67

The national and local laws of the country in which a resort or community wishes to
manage its own marine reserve have a strong influence on its success. In a study
devoted to researching the health of coral reefs in Fiji and Cook Islands, Hoffmann
(2002) found that the health of the coral reefs declined with economic development
and marine property regimes, rather than increasing population. The Cook Islands
have a property system of common access that is owned by the government. The
tour operators "compete" to access the waters and fishers "compete" to harvest the
fish. This over-competition of multiple stakeholders acting independently, in their
own self-interest, can ultimately destroy reef health. This system, termed 'Iragedy
of commons" (Hardin 1968) is disadvantageous, compared with communities In Fiji,
which have customary tenure of the reefs and who sell access rights to fishers and
dive operators.
This political setting enabled a resort in Fiji to help develop an MPA. The manger of
the Shangri-La Fijian Resort, located on an Island linked to the main Island of Viti-
Levu, contacted a local NGO in 2000, concerned about the degrading state of the
environment surrounding the Island, with declining coral populations and
reductions in the number of fish (MPA News 2002). The resort matched project
funds raised from outside donors and established a 1.7 km2 marine reserve
adjacent to the Island. Destructive fishing practises such as cyanide fishing and
blast fishing were banned, as well as the use of small gill nets and rubbish disposal
directly into the sea. The hotel also updated their pre-existing sewage treatment
plant and constructed a series of artificial wetlands to filter the resort's wastewater
and reused it for irrigation, with wetland plants absorbing nitrates and phosphates
and keeping them from leaching onto the reef. The NGO indicated that fish
- 6 8 -

populations had increased dramatically after two years and local fishers were
getting secure breeding populations of fish to restore stocks to the fishing grounds.
Low-tech reef restoration was foreseen, as were the deployment of marker buoys
and training of reef guides. These costs were to be offset by fees collected from
snorkelling tours of the no-fishing area, a room surcharge fee, and guest donations
(MPA News 2002).
Chumbe Island Coral Park off Zanzibar, Tanzania, is one of few privately managed
MPAs officially recognised by the lUCN. It was established in 1994 following
approval from the government of Zanzibar. Riedmiller (2000) suggested that
privately protected areas can provide important community benefits, particularly in
capacity building, biodiversity conservation and restocking of fisheries resources.
Evidence of adjacent fisheries profiting from the spillover of the reserve (0.3 km^)
was found (Riedmlller 1999). This suggests that it is possible for hotels and resorts
to manage small areas of no-take zones, providing a positive Impact on their
surrounding environment, while at the same time successfully managing a hotel
and engaging the local communities. A hardship related to private protection
compared with other MPAs has, however, been identified. Governments and other
funding bodies are not very willing to help with grants and subsidised management.
Other HMMRs have therefore set up a user fee system for resource-using guests.
69

1.8.1 User fees
It is suggested that MPAs only start to become successfully managed when
funding is secured through self-financing (Davis & Tisdell 1996). The constant
supply of funding from user fees could therefore be a solution to financing and
thereby effectively managing protected areas (Arin & Kramer 2002). Expected
expenses can be associated with various management and maintenance
resources, projects, expert advice and salaries and the lease or tax (Colwell 1999).
Surveys have indicated that user fees or room charges are generally accepted by
tourists, since they are a direct means to contribute to conserving the natural
resources they will enjoy (Chapter 7; Svensson et al. 2008; Svensson et al. 2009;
Tongson & Dygico 2004). Visitors to four marine reserves on Olango Island, Cebu.
Philippines, expressed 'Willingness to Pay' (WTP) for various activities located in
MPAs, such as scuba diving visits to Moalboal Reserve and Siquijor Reserve
(locals: US$ 1.60 and US$ 4.00 respectively, and foreigners: US$ 4.00 and
US$ 25.00 respectively per day). Beach visitors to Moalboal Reserve were willing
to pay US$ 0.80 per day (Rosales 2003). This shows that many tourists are
environmentally conscious and willing to invest beyond the costs of their travelling
expenses to benefit from protected reefs and related activities. White et al. (2000),
in another WTP survey, found that entrance fees to the community-based marine
reserves could easily offset the costs of reef management. They calculated that the
coral reef around Apo Island, covering slightly more than 1 km^to the 60 m isobath,
could support an annual revenue from tourism of between US$ 4,500 - 25,000,
which could offset the annual maintenance costs of US$ 5,000.
-70-

1.8.2 Hotel Projects
With more capital at hotels' disposal, additional projects can be initiated, such as
monitoring the coral reefs and other habitats, monitoring marine mammals/sharks,
starting coral transplantation projects, or developing education or awareness
programs for tourists, staff and local communities.
At the Jean-Michel Cousteau Fiji Island Resort, education programmes are
conducted, highlighting the importance of the interplay between mangroves and
reefs. They have also built artificial wetlands to replace their septic tank, which will
treat waste water, so that it can be used as nutrient-rich irrigation water, while
avoiding the harmful leaching of nutrients. At the Sheraton Soma Bay, Hurghada,
Egyptian Red Sea, divers and snorkellers are given brief sessions on proper
behaviour in the water to protect the fish and corals. Dive boat anchoring has been
forbidden and the hotel has developed zoned areas for its various marine activities
(IHEI 2003). Aside from educating guests about the fragile ecosystem, The Four
Seasons Hotels and Resorts, Maldives, has created the "Adopt-a-Reef Ball" project.
These are artificial concrete structures which facilitate the growth of corals. These
can host approximately 180 kg of plant or animal life and can be adopted by the
guests of the hotel for US$ 250 (Green Hotelier 2002).
Similarly, some hotels have built artificial reefs in their no-fishing area, made out of
various materials such as concrete blocks, clay pots and discarded plastic drums,
as well as Fish Aggregating Devices (FADs) for the local fishermen. Artificial reefs
or FADs are known to be able to significantly increase the number of fish around
-71 -

these structures (Dempster & Taquet 2004; Nelson 2003; Sherman et al. 2002;
Walker et al. 2002). Another method of building artificial reefs is that of the
patented BIOROCK method which Pondok Sari Hotel, Pemuteran, Bali, and the
Aqua Safari Inn, Condumel, Mexico, have adopted. It uses low-voltage electrical
currents connected to a metal reef frame to dissipate minerals found in the water to
build a limestone structure. Broken corals from nearby destructively fished areas
are placed on the reef structure providing a hard substrate for them to grow on.
These artificial reefs also aggregate fish by providing a habitat for them. The
electro-chemically charged conditions stimulate the corals and nearby organisms
to grow. The 'Maldive Barnacle' Biorock reef structure, which was constructed in
1996, showed great resistance to the El Nino event of 1998. Whilst only 1-5 %
corals survived overall, 50-80 % of corals survived on Biorock structures (Goreau &
Hilbertz 2005).
Several hotels have also helped local communities by financing the building of
schools or hospitals, improving infrastructure, or given financial aid to fishermen to
compensate for any fishing grounds lost, some, by using portion of user fees
(Langholz & Lassoie 2001). The Alegre Beach Resort allegedly pays the salaries of
two school teachers (Mar Cruz, aquasports manager, pers. comm.), the manager
of Whale Island Resort professes to financing the building of a temple (Michel
Galey, resort owner, pers. comm.), The manager of Mnemba Island Lodge claims
to have built a small local hospital (Peter Dunning, resort manager, pers. comm.),
and Wakatobi Dive Resort supposedly sponsors school material, gives lectures on
conservation issues, provides funding for wastewater management and public
- 72

projects to 17 affected communities (WakatobI Dive Resort 2008; Lorenz Maeder,
resort owner, pers. comm.).
1.8.3 Community Involvement
HMMRs are mostly relatively small and located adjacent to the hotel, which makes
overseeing and patrolling the area easy and cost effective. Small MPAs are also
more likely to result in a higher level of compliance than large MPAs, as they are
less prone to significantly impacting adjacent communities socio-economlcally
(Unsworth et al. 2007). On the other hand, small MPAs are more vulnerable to
poaching. Only few, major poaching events could destroy several years worth of
protection (Roberts & Hawkins 1997). It Is therefore extremely Important that there
Is unity, trust and common understanding between stakeholders. Benefits should
be equally distributed between stakeholders and amongst the community (Aswani
et al. 2007; White & Vogt 2000).
Shivlani et al. (2002) conducted long-term socio-economic monitoring of the
Sambos Ecological Reserve In the Florida Keys National Marine Sanctuary. They
addressed the Issue whether people who lost the most due to the development of
the reserve, also benefited most from the biological and economic consequences
of protection. They found that all fishers locally experienced Increases in Income
over the study period. Those displaced by the reserve gained an average of 67 %
compared to 22 % gained by fishers further away.
73

There are however many cases where local communities do not benefit greatly
from marine reserves, causing distrust and animosity between stakeholders, which
also increases the likelihood of poaching (Christie 2005). In order to gain
commitment and to prevent non-compliance from local communities, intensive
education programs and involving local fishermen already at the planning stages of
the HMMR to ensure that their inherit cultural precepts and socioeconomic needs
are considered carefully, have been suggested. This will give them decision power,
which will help persuade them that reserve objectives are not only developed for
conservation purposes, but also for long-term fishermen benefits (Aswani et al.
2007; White & Vogt 2000). Financial assistance, prospect of alternative livelihoods,
showing reserve results and strong support from the government would also
increase the likelihood of acceptance of the HMMRs during the first few years of
establishment before a major goal of HMMRs can be realised - the tangible
increase in fish stocks to adjacent fishing grounds (Chapter 6; Fiallo & Jacobson
1995; McClanahan et al. 2005; White & Vogt 2000).
It is possible that hotel investment in MPAs could create a win-win situation for the
environment and biodiversity on one hand, with economic growth for the region
and resort on the other, if joint ecological and socio-economic goals can be
realised.
74

1.8.4 Hotel awards
The World Tourism Organization has predicted continued growth in the tourism
market over the next decade (IHEI 2003). It could be argued that growth on this
scale can only be achieved if the physical and social environment, on which the
tourism industry depends, is sustained or enhanced. It is therefore in the hotels'
and resorts' best interest to sustain the environment in which they are located. The
hotel may be able to market its environmental programmes and enhance its
corporate image and out-compete its competitors. To motivate establishments,
several environmental awards have been introduced to boost corporate image.
There are over 70 sustainable tourism certification programmes in the world, either
currently active or in development, which legitimize eco-friendly hotels and grant
awards after scrutinized inspections (Rainforest Alliance 2008a).
The Green Globe certification is currently, probably the most recognised on a
global level but since the Marrakech Process in 2003, a United Nations-led
initiative to direct a shift towards global sustainable production and consumption,
there has been further development. The Rainforest Alliance produced the
Sustainable Tourism Certification Network of the Americas in 2003, a regional
network including all certification programs as well as NGOs, academic institutions
and other interested parties in the Americas. In February 2007, the Rainforest
Alliance further committed to developing a comparative analysis of different
certification standards from around the world to identify common certification
criteria that can serve as input for the Sustainable Tourism Stewardship Council
75

(STSC) standard, a proposed global accreditation body for sustainable tourism and
ecotourism certification programs (Rainforest Alliance 2008b).
Meanwhile, other certification bodies with environmental awards exist, and include
Ecotourism Australia - the Eco Certification Program, The Foundation for
Environmental Education (FEE) - Green Key & Blue Flag award. Sustainable
Travel International - The Sustainable Tourism Eco-Certification Program (STEP),
International Hotel and Restaurant Association - Environmental Award etc. Most
certifications are however not eco-system specific, unless developed on a local
level (hence by default will be specific In their criteria to respond to the
needs/threats to the local environment), but will Include components, which affect
the eco-system. Blue Flag for example is a certification scheme for beaches and
marinas generally, but some Blue Flag awarded sites are close to hotels, so in a
number of cases the hotel management is in charge of ensuring compliance with
Blue Flag criteria, such as demands for recyclable waste, sewage treatment, beach
clean-ups etc. and in sensitive areas, coral reef monitoring (Blue Flag 2008).
1.9 Concluding remarks
Despite general views, several hotels and resorts are environmentally aware and
actively contribute to reef-related conservation (Svensson et al. 2008, 2009). Some
are Involved In co-managed or community-based MPAs, working together with
local communities and national agencies (Christie & White 2007). Others are
encompassed in government managed MPAs, following these rules and
- 7 6 -

regulations (Colwell 1999), but there are still many hotels and resorts which have
taken the initiative to protect their adjacent 'house reef as a marine reserve,
prohibiting fishing and other destructive practices. Many of these claim to be either
directly helping local communities through jobs with the hotel or its reserve, or
through financial assistance collected from tourists' reef-user fees, or indirectly
through the spillover effect of fish from the marine reserve. Six dive operators In
Indonesia report that they are raising funds to manage and protect the closed off
areas adjacent to their affiliated hotels from over-fishing along the coastline,
creating a network of marine reserves (Jo McFarlane, Vila Ombak Diving Academy
dive guide, pers. comm.). Though these claims can not be substantiated at this
time, their situation would be interesting to research, were they to be accurate,
since it has been suggested that a network of MPAs could have a cumulative
positive effect at increasing fish stocks (Roberts 1998; Roberts et al. 2001).
The countries hosting a large proportion of the coral reefs of the world are
generally poor, where In many cases, government-funded MPAs are not meeting
their objectives of protecting the coral reef ecosystem. Some of these MPAs are
also receiving financial assistance from developed countries (Dearden et al. 2005).
HMMRs may be a solution to increasing the number or reserves and area of
protection and bringing the responsibility of the local marine environment to the
users and profiteers.
7 7 -

2. Theory and conceptual framework
Ecosystem-like concepts have existed in numerous ancient societies across the
globe for centuries (Berkes et al. 1998; Johannes 2002). Many of these
approaches have, however, become forgotten, are no longer practiced, or can no
longer be practiced because of population growth (Berkes et al. 1998). In
Southeast Asia for example, the use of estuarine polyculture fish ponds (tampak)
such as those in Java, Indonesia date back to the 15*̂ century. Often fringed by
mangrove forests, tampaks combined the cultivation of fish, vegetables and tree
crops. Organic-rich outflow from rice-fish systems were often directed into tampaks
to fertilize them. Most of these systems have however fallen into disuse, having
been affected by international markets (displaced by fish-pond monoculture),
impacted by coastal population growth and urbanisation pressures (Berkes et al.
1998). In some contemporary non-western cultures, traditional resource
management, including ecosystem-like thinking, nevertheless continue to exist and
even recently to strive (e.g. part of Oceania) (Johannes 2002). These peoples use
customary sea tenure, described as ancient property rights of individuals, clans or
tribes to restrict and manage access rights to natural resources (Ruddle 1996).
According to the Millennium Ecosystem Assessment (2005), coastal habitats are
some of the most heavily degraded areas in the world. Human activities on land
and sea can negatively impact or threaten coastal marine environments, which is
why alleviating coastal pressures and protecting habitats have been the focus of
interest of marine ecologists, policymakers, managers and resource users in the
- 7 8 -

last decades (Garcia et al. 2003). There is an Increasing International awareness of
the cumulative impacts of sector-based activities on the ecosystem (Jennings &
Kaiser 1998) and the need to take a more holistic or Ecosystem-based
Management (EBM) approach (Kabuta & Laane 2003) to ensure the sustainability
of marine ecosystems. One widely accepted definition of marine EBM is:
... an integrated approach to management that considers the entire ecosystem,
including humans. The goal of ecosystem-based management is to maintain an
ecosystem in a healthy, productive and resilient condition so that it can provide the
services humans want and need. Ecosystem-based management differs from
current approaches that usually focus on a single species, sector, activity or
concern; it considers the cumulative impacts of different sectors (McLeod et al.
2005)
The ecosystem management concept has formally been around since at least the
Introduction of conservation ethics by Aldo Leopold in 1966 (Czech 1995) and has
developed from founding principals of sustainable development and general
systems-based approaches that were developed in ecology, anthropology and
other disciplines In the 1960s and 1970s, aimed at both human and ecosystem
well-being (Garcia et al. 2003; Kappel et al. 2006). Ecosystem approaches aim to
sustalnably develop, enhance and increase natural resources, while
simultaneously fostering a long-term commitment to the welfare of human societies
(Kimball 2001). More formal recognition of EBM can be found in the 1992 UN
Conference on Environment and Development (UNCED) in Rio de Janeiro,
emanating from the 1982 UN Conference on the Law of the Sea, and resulting UN
- 7 9 -

Convention on the Law of the Sea (UNCLOS). UNCED highlighted the need to
consider resource management from a wider biological, socio-economic and
institutional point of view. This led to follow-up conferences and conventions, such
as the 1993 Convention on Biological Diversity, the 1995 Fish Stocks Agreement
and the 1995 Food and Agriculture Organization (FAQ) Code of Conduct for
Responsible Fisheries. The FAO put in place International Plans of Action to meet
UNCED objectives which were reviewed in Johannesburg at the Rio +10 meeting
in August 2002, indicating a growing body of international legislation in support of
EBM (Jamieson & Chang-Ik Zhang 2005).
Meanwhile, in preparation of the FAO, a process of selection and reformulation
was also conducted to formulate a reference framework for sustainable fisheries,
addressing practically all the ecosystem considerations, principles, and conceptual
goals needed for an Ecosystem Approach to Fisheries (EAF) (Garcia & Cochrane
2005; Garcia et al. 2003).The term EAF was adopted by the FAO Technical
Consultation on Ecosystem-based Fisheries Management held in Reykjavik in
September 2002 (Garcia et al. 2003). Kimball (2001) explains that all ecosystem-
based approaches of economic activities rely on similar precepts: the need for
sound science, adaptation to changing conditions, partnerships with diverse
stakeholders and organisations, and a long-term commitment to the welfare of both
ecosystem and human societies. There are many definitions of EAF, but the FAO
has adopted the following, which is more aligned with the general ecosystem
approach concept:
80

...an ecosystem approach to fisheries (EAF) strives to balance diverse societal
objectives, by taking account of the knowledge and uncertainties ofbiotic, abiotic
and human components of ecosystems and their interactions and applying an
integrated approach to fisheries within ecologically meaningful boundaries (De
Young et al. 2008).
The approach was adopted as it became apparent that it was insufficient to
manage, protect and to take single-species stock assessments into consideration.
A broader approach, looking at the surrounding ecosystem - prey and predator
species, oceanographic effects, environmental impacts and other human activities
needed to be factored in. As a consequence, the management of a whole range of
human interactions with the fishery ecosystem, including technical, economic,
social or institutional, had to be incorporated (Garcia et al. 2003). EAF is therefore
an extension of more conventional fisheries management, recognising more
explicitly the interdependence between human well-being and ecosystem health
and the need to maintain ecosystems productivity for present and future
generations, e.g. conserving critical habitats, reducing pollution and degradation,
minimizing waste, and protecting endangered species (Ward et al. 2002).
Unlike EAF which takes a sector-based approach to ecosystems, the scientific
consensus statement on marine EBM (McLeod et al. 2005) specifically:
• emphasizes the protection of ecosystem structure, functioning, and key
processes;
81

• is place-based in focusing on a specific ecosystem and the range of activities
affecting it;
• explicitly accounts for the interconnectedness within systems, recognising the
importance of interactions between many target species or key services and other
non-target species;
• acknowledges interconnectedness among systems, such as between air, land
and sea; and
• integrates ecological, social, economic, and institutional perspectives, recognising
their strong interdependences.
Moving towards a more comprehensive, integrated ecosystem-based approach to
address the current and future management challenges of our oceans, it could be
useful to understand two other major approaches in global discussions relating to
natural resources and spatial area management: the livelihoods approach and the
Integrated Management (IM) approach (De Young et al. 2008).
The livelihoods approach grew from the recognition of the need to place fisheries in
a larger context of households, communities and socio-economic environments. As
an integrated part of an ecosystems approach, this implies that fisheries
management must consider the demographics of fishers, socio-cultural aspects,
fishers' economic situation affecting institutional framework and policies, marine
and community infrastructure and other non-fishing activities (Allison & Ellis 2001).
Ecosystem-related concepts have a lot in common and relate closely to IM. It has
been under development for the past 30 years, but is only recently taking root in
-82-

some countries (Christie & White 2007). IM (whether of oceans, coasts,
watersheds etc.) has been designed to manage multiple (competing) uses of
certain designated areas - uses such as fisheries, aquaculture, forestry, oil and
gas, mining, agriculture, shipping and tourism. This involves the use of a
collaborative/participative approach to managing multiple stakeholders (e.g. local
communities, industries) in a flexible, responsible and transparent process, as well
as managing interactions among people and ecosystems, while dealing with
multiple levels of the government to protect the ecosystem in a sustainable fashion
(De Young et al. 2008; Garcia et aL 2003). The integrated management approach
pays attention to a number of resources (e.g. soil, water, fish stocks, etc.) and
habitats (e.g. open ocean, estuaries, wetlands, beaches, lakes, rivers, etc.), as well
as a range of environmental factors (e.g. changes in water temperature, turbidity
and acidity, chemical pollutants and water flows). It complies with the precautionary
approach and considers the characteristics of the designated area: local climate,
state of the ecosystem, relevant natural resources and the human community
(cultural, economic, social), making use of traditional knowledge and integrating all
data to establish objectives and implement a suitable and adaptable framework
(De Young et al. 2008; Garcia et al. 2003).
EBM makes use of all these models and practices to design an adaptable
framework that balances resource management and socioeconomic development,
considers ecologically significant processes and encourages cross-sectoral
planning. Terrestrial activities, intersectoral conflicts, overfishing and management
of trophic interactions are central issues addressed in EBM. Establishing networks
83

of MPAs, considering social and ecological linkages to provide cumulative positive
interactions are also emphasized (Christie & White 2007).
Taking an EBM approach to marine protection therefore requires an
interdisciplinary approach of traditionally opposing disciplines. Levin (2006) and
others (e.g. (Vincent 2007), more recently, agree that ecologists, economists and
other social scientists have much incentive for interaction since ecological and
socioeconomic systems are interconnected and key to ensuring environmental
protection and economic growth. Combining the teachings of these disciplines and
integrating them into a solid framework, could however be very difficult, since
natural scientists are concerned with the protection of the biological and physical
environment, while social scientists place their focus on the people and human
interests (ThiaEng 1997).
To have any possibility of taking an ecosystems approach to fisheries management,
Hanna (2001) proposes that institutional changes have to be adopted to create
economic incentives (new policies, laws, and regulations) for environmental
protection. One essential necessity is for clearly defined property rights to be in
place. Property rights define the conditions that guide and control human use of
resources, they delineate the population of legitimate owners and define rules and
responsibilities so that expectations are consistent and enforcement is possible
(Bromley 1991). Without property rights, one possible scenario is the creation of a
"tragedy of commons", where, in pursuit of individual's own self-interest, resources
are driven down to low levels and users become impoverished because of the
great effort they expend on harvesting the resource (Hardin 1968).
-84-

The linkages between socio-economic and coastal system dynamics (an
ecosystems approach) can only be effectively understood through an assessment
across ecosystems, social conditions and management approaches (Bowen &
Riley 2003). For the purpose of this thesis, researching the effectiveness of Hotel
Managed Marine Reserves (HMMRs) in sustaining nearshore fisheries, the link
between the science of the change in the status of nearshore fish stocks and the
social and economic responses of people affected by such a policy change, has
been evaluated. Such links are best made by identifying and addressing indicators,
which act as information tools to characterise the status of the specific environment
and social situation (Jennings 2005). A common framework for indicators of
environmental analysis is the DPSIR model (Driving forces - Pressure - State -
Impact - Response) (Figure 2.1), established by the Organization for Economic
Cooperation and Development (OECD) (OECD 1993). This model has recently
also been adopted and modified to review the state of reef fishing activities in
Kenya (Mangi et al. 2007).
Drivers describe large-scale social, demographic and economic conditions and
sectoral developments which exert pressure on the environment, forcing change.
External influences such as climate change can augment this pressure. State
indicators describe observable changes in environmental dynamics, which in turn
can impact social benefit values. Response indicators constitute institutional
responses to changes in the system, mainly influenced by state and impact
indicators (Holman et al. 2005; Mangi et al. 2007).
-85

Socio-economic DRIVERS
• Population increase • Tourism
Chaoters 1 & 3
PRESSURES on environment • Overfishing • Illegal fishing • Pollution
Chapters 1 & 3
RESPONSE • HMMRs • Management • Policy • Education and awareness
Throughout thesis
Environmental STATE change • Decreasing fish stocks • Nutrification • Change in community structure
Chapters 4 & 5
Social and economic IMPACTS • Loss of income • Declining fish catch • Loss of tourist amenities
Chapters 6 - 8
Figure 2.1. A DPSIR framework (adapted from (Holman et al. 2005) describing the main socioeconomic drivers exerting pressure on the environment in Vietnam and the study location, Van Phong Bay, in particular. These pressures in turn lead to changes in the state of the environment, which may impact human welfare. Response indicators are formulated to mitigate the damage or problem, or re-orientate drivers or pressures. Chapters indicate where in the thesis issues are predominantly addressed
86

An overview of some of the key indicators which were considered for this thesis
has been diagrammed in Figure 2.1. A major driver exerting pressure on the
environment in Vietnam is represented by a rise in the human population,
especially the increase in the population rate in fisheries communities, growing
yearly by 2.6-2.8 % (national average: 1,3 %) (FAO 2008). While population growth
increases local government revenues, it also increases the demand for services
provided by local governments, such as public safety, road and street
maintenance, and parks and recreation, which could influence decision making
processes to invest in the protection and sustainability of natural marine resources
(Taylor & Molnar 2006). Fishery rules and regulations in Vietnam are, as such,
limited to a modest number of gear size and type restrictions, but are seldom
enforced due to budgetary constraints (FAO 2008). This driver is compounded by
an increase in tourism. There has been a 3.7 fold increase in tourism from 1997 to
2007 (691,400 - 2,569.150) (GSO 2008). There has also been a major increase in
the amount of tourists to the Province of the Hf̂ /iMR. According to the Khanh Hoa
tourist department, the tourist arrivals to Khanh Hoa Province in 2008 were
1,597,228, of which 315,585 were international, an approximately 12 % increase in
comparison to 2007 (Gasparotti & Nguyen 2009).
These drivers are exerting pressure on the environment (Figure 2.1). Owing to the
increase in the number of mouths to feed, the fishing fleet has increased
dramatically over the last years (6.5 times from 1990-2004) (Nguyen Long 2002).
Since 82 % of national marine catch derives from nearshore fisheries and more
than 75 % of income is derived from fishing activities in Khanh Hoa Province (FAO
2008), fishermen are using any kind of fishing technique, including mesh size
- 8 7 -

under legal limits, harmful methods such as beach seining, blast fishing, poison
fishing and bottom trawling, in order to survive. Juveniles are captured and not
released, fish stocks are being depleted at unsustainable rates and habitats are
being destroyed (Pomeroy et al. 2009; Stobutzki et al. 2006). In addition, the
increase in population size, fishing fleet and tourism is producing an excess
amount of sewage discharge, rubbish dumping, boat pollution and pollution and
sedimentation from coastal development, putting further pressure on the
environment (Pandolfi et al. 2003; Vo et al. 2004). Direct damage to coral reefs
from tourism also includes trampling or handling when swimming, snorkelling or
diving. Michael and Tu (2005) found that the 9 dive operators licensed to operate in
Nha Trang MPA, Vietnam, bring 100 divers to the reserve every day and run
approximately 9800 dive trips annually.
The state of the environment, influenced by these pressures has resulted in
decreasing fish stocks, eutrophication and a change in the community structure
(Figure 2.1). Fisheries maximum sustainable yield in Vietnam has, for example,
been surpassed since 1986 (582,212 tonnes/year). In 2008, fisheries landings had
increased to 3.6 times this amount (Nguyen Long 2002). Monitoring work at the
nearby MPA of Nha Trang from 2002-2005 has also detected a change in
community structure. There has been significant increases in cover of fleshy
seaweeds (indicator of nutrient pollution), and significant declines in fish density,
mainly the families Chaetodontidae and Haemulidae (indicator of overfishing, blast
fishing, poison fishing and aquarium collection), as well as in the density of the
invertebrate Stenopus hispidus (indicator of aquarium collection) and the massive
corals (indicator of blast fishing, poison fishing and nutrient pollution) (Dung 2007;
- 8 8 -

Tuan et al. 2005). Based on these indicators, the state of the marine environment
of Van Phong Bay, specifically the HMMRs and surrounds has been researched in
this thesis. Chapter 4 looks at fish stocks, interconnectivity between reserves and
community structure of fish, as well as changes in benthic habitats, while chapter 5
compares fish assemblages on artificial reefs and natural reefs and explores the
potential of artificial reefs contributing to increasing fish stocks.
The impacts of the change in state of the marine environment has had great
influence on Vietnamese people, specifically, directly affected coastal communities
(Figure 2.1). The average catch is decreasing. From 1985 to 2000, the average
catch per horsepower decreased by 41 %. with a lower percentage of commercial
fish compared with trash fish and a lower average size of fish caught. This
indicates that the income per fishing trip is decreasing (Nguyen Long 2002).
Meanwhile, because of pollution and increased rubbish dumping, 65 % of foreign
tourists suggested that the beaches around Nha Trang MPA were unpleasant,
which diminished the recreational experience of their visit (Lindsey & Holmes 2002).
This could lead to a decrease in tourism, which would create a positive decrease in
pressure on the environment, but also a decrease in foreign income. In chapter 6,1
attempt to establish the positive and/or negative influences the HMMRs have had
on adjacent communities through questionnaires and interviews, considering
amongst others, financial loss or gain, and whether local fishermen perceive any
change in fish stocks in fished areas resulting from the protection. In chapter 7, I
determine tourists' knowledge, interest and concern for marine protection and their
resulting support and Willingness to Pay (WTP) extra to stay at hotels which are
protecting coastal areas. For this survey, I used the stated preference theory,
- 8 9 -

Contingent Valuation Method (CVM) to establish concern and interest, expressed
as an open-ended question for WTP for the use and non-use value of the marine
environment. Direct use value involves the utilization of the reef for swimming,
snorkelling and scuba diving. Non-use value refers to concern, sympathy with, and
respect for marine resources, e.g. conservation for the sake of the environment
without tourists deriving any actual use from the marine resource (Subade 2007).
An overall impact assessment resulting from a change in the state of the
environment was additionally attained from hotel managers across the Indo-Pacific.
Questionnaires reported on perceived pressures on the environment, actions taken
to alleviate such pressures, the costs and perceived social and economic impacts
thereof.
The response, which is ultimately the focus of this thesis, is the potential
establishment of more protected areas, possibly in the form of HMMRs on a more
global scale to help alleviate financial pressure from governments and to act as a
source for the replenishment of fish stocks to nearshore areas (Figure 2.1). For the
hypothetical establishment of an increased number of HMMRs in Vietnam and the
world, there would, however, ultimately be a need to consider management issues
related to MPAs, in terms of existing governance structures, property rights and
policies involving all stakeholders. Christie et al. (2009) suggests that the
management of resources is, by definition, a societal activity, and can as such, not
ignore governance, jurisdictions and societal relationships. Potential changes may
be extremely difficult to implement, however, since many countries, including
Vietnam hold strong traditional beliefs related to property rights and fisheries
policies (Adger & Luttrell 2000). Education and awareness programmes associated
- 9 0 -

with preventing reef decline and responsible fishing are therefore an important part
of developing a better understanding of issues amongst user groups as a means of
creating a change in attitudes and behaviours (Mangi et al. 2007). Such response
indicators will be discussed throughout this thesis.

3. Study site
The site chosen for this study is Whale Island Resort, Vietnam. This hotel was
chosen because it was suitable to test the aims of this study: to determine the
effectiveness of an HMMR holistically, through its ability and potential to fulfilling
predetermined biological and socioeconomic objectives.
In this chapter, I give a brief description of Vietnam, existing Marine Protected
Areas (MPAs), status of fisheries and its legal framework, tourism and its potential,
focusing further on the larger bay (Van Phong Bay) in which Whale Island (Hon
Ong) is found, before describing the hotel and its reserves.
3.1 Vietnam
The Socialist Republic of Vietnam is a country in south-eastern Asia, bordering the
Gulf of Thailand, Gulf of Tonkin, and South China Sea, alongside China, Laos, and
Cambodia. It covers a total area of 329,560 km^ and spans 15 latitudes,
accommodating over 86 million people (July 2008 est. (CIA 2008)). The political
leaders (Communist Party of Vietnam) govern the 59 provinces and 5
municipalities. Most of the population classify themselves as non-religious (80.8 %),
although the majority identify themselves mostly with Buddhism (85 %) (CIA 2008;
Wikipedia 2008a). Approximately 3 million people attended upper secondary
school (86.6 % graduating) in school year 2007-2008 and about 234,000
- 9 2 -

graduated from a university or college education (GSO 2009c). Living standards
are relatively low, with 16.2 % of people living in rural areas falling under the
poverty level (GSO 2009c).
Vietnam has a coastline of 3444 km (CIA 2008), and 3700 km of land borders (Le
Thac Can et al. 2001). The terrain of the country is low and flat in the south and
north deltas, hilly in the central highlands and mountainous in the far north and
northwest. Because of differences in latitude and topographic relief, the climate
varies considerably from region to region. It is tropical in the south; monsoonal in
the north with a hot, rainy season (May to September) and warm, dry season
(October to March). Average yearly rainfall amounts to approximately 2000 mm,
unevenly distributed among areas that receive 4000 mm and others that receive
700 mm. Over 80 % of this precipitation falls in the rainy season (Le Thac Can et al.
2001).
Vietnam enjoys an extraordinary biodiversity, providing habitats for 109 large
mammals (including many rare species), approximately 850 species of birds and
between 9600 and 12000 plant species (Timmins & Duckworth 2001; Vo Quy
1995). This remarkably high diversity and distinct flora and fauna are owed to
overlapping blogeographic realms (the Palaearctic Himalayan and Chinese sub-
regions and the Indo-Malayan Sundaic sub-regions), along with relatively high
variations in climate, soils and topography (ICEM 2003).
The coral reefs of Vietnam cover an area of 1122 m^ (Burke et al. 2002). The 3000
islands belonging to Vietnam all contain a wide range of diversity and structure.
- 9 3 -

There are 5 main marine areas: the western Tonkin Gulf, middle-central, south-
central, south-eastern and south-western Vietnam. The south-central area is the
most diverse, containing more than 300 species of hard coral, belonging to 65
genera (country total: 350 species) (Chou et al. 2002). Most of the coral reefs in
Vietnam are, however, under medium or high threat (96 %: (Burke et al. 2002).
Major threats are attributed to overfishing, causing a decline in marine resources
(50 % threatened); destructive fishing, including poison fishing for the live food fish
and ornamental trades (over 85 % medium or highly threatened); coastal
development (over 40 % at medium or high threat) (Burke et at. 2002). as well as
damage caused by careless anchoring, crown-of-thorn starfish outbreaks and river
runoff (Chou et al. 2002).
3.1.1 Van Phong Bay
Van Phong Bay is a large bay (45,000 ha) in southeast central Vietnam (roughly:
109° 10' E -109° 26' E and 12° 26* N -12° 48' N) (Figure 3.1), Khanh Hoa Province,
which, as of 2006, provided for 1.3 million people; the majority are Kinh (dominant
ethnic group in Vietnam) (Wikipedia 2008b). Fishing and aquaculture accounts for
more than 75 % of the income of fisher households in this area (FAO 2008).
- 9 4

>ion Mun Martn* Protacl*« Ar«a
Figure 3.1. Google map of Van Phong Bay in Khanh Hoa Province, south-central Vietnam, showing the location of the study site (Whale Island Resort) and Hon Mun MPA (bottom lefti
There are approximately 50 km^ of islands in Van Phong Bay and roughly 9
different habitat classifications divided into: river mouth beds, mangrove, sand,
mud. rock, dead coral, live coral, aquaculture ponds and salt beds (Van Dau 2002).
In this region, the months from March through August have the most number of
sunny hours (200 per month); November to February, the least (135 per month),
with an average annual temperature of about 26°C (Van Dau 2002). The rainy
season lasts from August to January (70-80 % total annual rain), with rainy and
cool north-easterly winds from October to February; hot and dry south-easterly
winds from May to August. There is a mixed tidal regime, leaning towards diurnal
tide (20 diurnal days/month), with an average amplitude of 1.25 m. Currents move
south-easterly in summer and north-easterly in winter at approximately 20-40 cm/s.
95

Undenwater visibility is lowest in the winter season and highest in summer, ranging
from approximately 4-14 m (Van Dau 2002).
3.2 Marine Protected Areas in Vietnam
In 2000, the Minister of Fisheries (MOFI) was appointed to prepare a
representative system of MPAs for Vietnam toward year 2010. A network of 15
national MPAs was approved by the Prime Minister to protect 2 % of the sea area
of the country by 2010. The first MPA, Hon Mun Marine Protected Area, was
declared in 2002. It is situated approximately 100 km south of the study site, in
Khanh Hoa Province (Figure 3.1). This relatively small area (160 km^), surrounding
Hon Tre Island and several others, was chosen because it was considered to
harbour the highest diversity of corals in Vietnam, as well as supporting high levels
of biodiversity in a diverse array of coastal and marine habitats (Pomeroy et al.
2009). Vo et al. (2004) described a total of about 800 species of corals, fish,
molluscs, echinoderms, crustaceans and macro algae. Van Nguyen and Phan
(2008) conducted undenwater visual census in the MPA and found a total of 266
species, belonging to 40 families in September-October 2005. The location was
also interesting because of the great tourist expansion in the area (Tuan et al.
2002). The development of this pilot project MPA was monitored closely by
Vietnamese and foreign specialists, performing environmental assessments and
socio-economic analysis before final implementation. The aim was to use the
knowledge gained as a model for the development of a number of MPAs over the
following decade. In the same year, several more MPAs were declared, and in
- 9 6 -

2004, a total of 22 MPAs had been declared, with an additional 7 proposed,
enclosing 11 % coral reefs. Only 8 % of these MPAs are however depicted as
having good management (Tun et al. 2004).
3.3 Tourism
Vietnam has become a very attractive tourist destination in the last decade,
increasing tourist numbers 3.7 fold from 1997 to 2007 (691,400 - 2,569,150) ( G S O
2008), but rising only by approximately 1 % in 2008. Numbers increased mainly
because of visitors from China, Singapore and Thailand ( G S O 2009a). Nha Trang
(population 300,000), in Khanh Hoa Province, 80 km south of the study site (Figure
3.1), is one of the most important vacation destinations in Vietnam. Provincial and
municipal government officials and entrepreneurs view tourism in this area as a
key economic development strategy, investing heavily in tourist accommodations
and attractions. In three years (2001 - 2003), U S $ 35,000,000 was invested in
Promoting the diversification of tourist products and upgrading the standards of
Khanh Hoa Province, especially Nha Trang and surroundings, by increasing public
awareness, developing national character, protecting the environment and
landscape, and building several 5-star hotels (Khanh Hoa Portal 2005). In 2004,
the Khanh Hoa Provincial Government estimated another 10 % increase in visitors
In 2005, up to 690,000 visitors (240,000 foreign visitors), with a future goal of
attracting 1 million visitors (480,000 foreign visitors) in 2010. This goal was partially
met earlier than expected. In 2008 tourist arrivals to Khanh Hoa Province were
97

1,597,228, of which 315.585 constituted foreign visitors, representing a 12 %
increase in comparison to 2007 (Gasparotti & Nguyen 2009). According to the
Khanh Hoa Tourist Department there were a total of approximately 400
accommodation facilities, including resorts and budget hotels, offering a total of
9,850 rooms in 2009. Another 882 rooms within four projects are scheduled to
open by 2011, while an additional 15 other hotel/resort developments are planned
or are in the early construction stage (Gasparotti & Nguyen 2009). Revenue from
tourism in this area in 2005 was estimated to contribute to 36 % of the G D P . Total
revenues in 2010 are estimated to be VND 500 billion (US$ 30,000,000). In 2004.
2870 people were employed in the tourist sector. Total employed is expected to
increase 2.5 fold by 2010 {Khanh Hoa Portal 2005).
3,4 Fisheries
Fishing has a long history in Vietnam. Unlike many other Southeast Asian
countries, however, capture fisheries in Vietnam is not easily classified into small
scale/artisanal or commercial/large scale fishing. Engine s izes, hull length,
distance from shore, depth when fishing, and gear deployed, all contribute to
defining the type of fishing (Pomeroy et al. 2009). In government documents they
are more commonly classified as nearshore and offshore. Nearshore fishing is
classified to <30 m depth from shore for the Tonkin Gulf waters. East and South
West waters and Thailand Bay; <50 m depth for the central coast (F IC 2008). Off
shore fishing vesse ls are defined as those equipped with >90 hp engines, and
which are registered for operating offshore. If engine power is less or the vessel is
- 9 8 -

not registered for fishing beyond the 30 or 50 m depth line, they also belong to the
nearshore fisheries category (FIC 2008). Around 72 % of total mechanised vessels
in Vietnam have less than 45 hp and 84 % have less than 90 hp. In 1990, over
90 % of the country's total catch came from the nearshore area (generally 4-5 nm
from shore) (Han 2007; Nguyen Chu Hoi et al. 2006).
3.4.1 Legal framework and property rights
Management policies and development of marine capture fisheries have changed
dramatically in the last 60 years, shifting from a small-scale industry to an export,
production-oriented industry, which is a major part of the national economy. From
1945-1954, the government's policy was for a small-scale industry to supply local
demand for seafood. During the following 20 years, while the country divided, the
North developed state fishing enterprises, while, in the South, there was a policy
for a more market-based industry through modernisation and mechanisation of the
fleet. Duhng the years Vietnam was working on reunification (1975-1985), there
was continued collectivisation of the fishing industry and the government invested
heavily to increase production and to modernise the fishing fleet through the
establishment of fishing cooperatives and fishing companies. This change was,
however, inefficient and did not meet planned quotas (F IC 2008; H a Xuan Thong
1997; Pomeroy et al. 2009). In 1986, the "doi moi"* (renewal) policy was adopted,
aimed at liberalising trade and moving the country towards a market-oriented
economy, changing traditional common property rights to a hybridization of
property rights (Adger et al. 2001). The fisheries sector moved away from collective
- 9 9 -

harvesting, processing and marketing to private fishing operations and a decrease
in state subsidies. Fishing vesse ls and gear owned by the cooperatives were sold
to private operators. These were allowed to sell fish in the free market, and from
1986 to the beginning of 2000, there was a rapid increase in production and an
even larger increase in fishing effort, both inshore and offshore. Fisheries
management was however given little attention (F IC 2008; Ha Xuan Thong 1997;
Pomeroy et al. 2009).
The legal framework for marine capture fisheries management is a body of
legislative texts, which has evolved over the last four decades. The first policy
addressing fisheries management after the "doi moi", was written in 1987 - the
Regulation on Management and Conservation of Marine Resources , which
declared that all marine resources were under the control of the state. It also
prohibited certain fishing gear and methods, capture of species of economic value,
immature animals, or those ready to spawn (F IC 2008).
In 1989, the government promulgated the ordinance on the Conservation and
Management of Living Aquatic Resources, which consisted of 27 articles, and sets
out the general principals of conservation, development and management of living
resources, and the role of the state therein (e.g. Total Allowable Catch - T A C ,
quotas to be determined by the MOFI, gear restrictions, mangrove clearing
prohibition etc.) (F IC 2008).
-100

In the following years, the government and the MOFI delivered a number of legal
normative documents pertaining to the protection and development of fisheries
resources, aiming at creating an integrated legal framework for sector
management purposes. In 1991, the MOFI declared that any vesse l , no matter
what size or ownership, must be registered with the Department of Fisheries
Resources Conservation. In 1992, lines and regions of fishery production was
established, including the in-shore line (<50 m depth) (F IC 2008). In the mid 1990s
there were reports of over-exploitation of nearshore resources, leading to a ban on
the construction of vesse ls with less than 20 hp in 1997, with the aim of forcing
inshore fishers to build larger vessels and fish offshore. This ban was, however,
most often, not upheld (Ha Xuan Thong 1997). Loans were also offered in the late
1990s to fishers to fish offshore and in 1997, a 5-year tax-free period w a s offered
for all offshore vessels . In February 1998, a directive banned illegal fishing
methods, while resource protection was promoted (F IC 2008).
During the period 1985-2003, fisheries management activity in nearshore waters
was limited, although management structures were in place. There was poorly
reported, under-reported, illegal and unregulated catch in nearshore areas
because of weak management and enforcement regimes, partly due to budgetary
constraints of the provincial governments. The depressed state of the fisheries
resources forced fishermen to use mesh sizes under legal limits and other
techniques to ensure survival, which has resulted in a reduction of productivity and
economic returns from fisheries (Nguyen Long 2003; Pomeroy et al. 2009).
101 -

The National Assembly approved the Fisheries Law in November 2003. It was
administered by the Minister of Fisheries and Is comprised of 10 chapters and 62
articles, including a number of new chapters compared with the 1989 ordinance.
There are additionally a number of decisions, directives, regulations, decrees and
circulars concerning the fisheries legal status. The Fisheries Resources
Conservation Department and a system of 37 sub-departments in localities are
responsible for policy promulgation, direct management, inspection and protection
of the fisheries resources. Between 1997 and 2001, a range of decisions
established Provincial Fisheries Departments in all coastal provinces. They are
under the direction of the Provincial People's Committees and under the
management of the MOFI (FAO 2008). These implement fisheries law. regulations,
licensing and national fisheries policy at the provincial level. The Provincial
People's Committee can make resolutions, decisions, standards and quotas on
fisheries with the province, but not in conflict with the regulations of the Ministry.
The law aims to provide for a stronger, more comprehensive, responsible and
sustainable fisheries management base through ecosystem approaches and
integrated management (Pomeroy et al. 2009). Fishery rules and regulations are,
however, still limited to a modest number of gear size and type restrictions and are
unfortunately seldom enforced due to budgetary constraints. Fishermen also have
to keep a log of fishing operations, but these are. similarly, seldom maintained or
controlled. Fishing licenses are imposed, but many fishermen ignore them (FAO
2008).
102-

Vietnam fisheries is, therefore, nearly uniformly defined by an absence of defined
property rights (Han 2007). From the 1990s. property rights have been vested in
the state, partly in collective property rights and increasingly, rights have been
allocated to individuals (Adger et al. 2001). The move towards effective
privatisation of such resources is, however, enhancing the inequality in the
distribution of income. This increases the heterogeneity within the resource user
group and lessens the likelihood of co-operative management (Adger & Luttrell
2000).
3.4.2 Facts and figures
Seafood is the third major export product of Vietnam after textile-garments and
crude oil. In 2004, Vietnam exported fisheries products to 80 different countries
and territories. The main export markets for fishery products are: U S A (35 % ) ,
Japan (26 % ) , China/Hong Kong (7 %) and Europe (6 %) (FAO 2008). The
fisheries sector was estimated to contribute 4 % of the G D P in 2006 and employ
approximately 3 million people. Around 10 % of the total population derived their
main income directly or indirectly from fisheries. The increase in the population rate
in fisheries communities is around 2.6 - 2.8 %, much higher than the national
average (1.3 % ) , with an average fishery household of 6 - 7 people ( F A O 2008).
The educational level in the fishing communities is low: 68 % do not finish primary
school, more than 20 % do not finish secondary school, about 10 % graduate from
secondary schools and only 0.65 % have certificates or diplomas from vocational
- 103-

schools or universities (Nguyen Long 2002). The demand for fish and fish products
is high in Vietnam. People consume on average 19.4 kg per year, which is more
than half of their animal protein intake. Shrimp, squid and mackerel are the most
favoured products (FAO 2008). Of the more than 1600 species of crustaceans,
2500 species of shellfish and 2000 species of fish, 130 fish species are
commercially important, while the most important commercial species groups are:
shrimp, tuna, squid, s e a bream, snapper, grouper and small pelagics (FAO 2008).
The number of fishermen nearly doubled in Vietnam between 1990 and 2004, from
270,600 to 550,000, and the domestic fishing fleet capacity increased by a factor of
6.5 (with an average increase of 2300 small vesse ls (<45 hp) per year) (Lam 2005;
Pomeroy et al. 2009). The most common fished areas are nearshore areas (<50 m
depth), constituting 82 % of total national marine catch. Results from an
assessment of marine fisheries resources In Vietnam shows that the maximum
sustainable yield (582,212 tonnes/year) has been exceeded since 1986 (Nguyen
Long 2002). Fisheries catch from 2008 was more than 2.1 million tonnes ( G S O
2009b), indicating that most nearshore coastal regions of Vietnam are
overexploited and fishing pressure is still increasing because of the annual
increase of small fishing boats (Pomeroy et al. 2009; Stobutzki et al. 2006). In
1985, the average catch per horsepower was 1.11 tonne/hp but in 2000 it was only
0.45 tonne/hp, or 41 % of the 1985 figure. With a lower percentage of commercial
fish, a higher percentage of trash fish in the catch and the smaller size of fish
caught, the Income per fishing trip Is decreasing (Nguyen Long 2002). A number of
factors have led to overexploitation of in-shore resources, including mesh s izes
under legal limits, high levels of by-catch and incidental catch of small/juvenile fish,
- 104-

harmful fishing gear such as fixed nets, destructive fishing techniques, and trawling,
which has damaged the seabed (Pomeroy et al. 2009).
3.4.3 Van Phong Bay fisheries
Four fishing villages are located close to the study site (Whale Island Resort: WIR)
in Lach C u a Be Channel, formed by Hon Lon Island and the Dam Mon Peninsula in
Van Phong Bay (Figures 3.1). According to Mr. Hung, the Chairman of the
People's Committee for Khanh Hoa Province. Dam Mon is the largest village close
to the resort, accommodating approximately 300 families (approximately 2000
people). Mr Hung informs that the fishing fleet comprises 50-60 vesse ls , which are
all c lassed as nearshore fishing vessels , fishing within a maximum depth of 50 m
(FIC 2008). Approximately half of these are large enough to fish outside the
channel (15 NM distant). The small bamboo basket boats used for fishing close to
home were not included in this estimate.
A wide range of fishing techniques are used, including trawling, purse seining,
beach seining, hook and line, cast net fishing, trap fishing, as well a s illegal and
destructive methods such as bright light fishing (>2000 W), blast and cyanide
fishing, hose and hook fishing and fishing with high volt electricity. The larger
vessels , fishing the deeper waters outside the channel, target larger species,
mainly tuna. Some of the fishing families target anchovy or squid at night using
bright light fishing, but they all fish within the channel; the remainder are less
- 105

selective and often use fish mesh sizes under legal limits ( lUCN 2003b; Van
Nguyen & Phan 2008; van Zwieten et al. 2002).
Observations made at the nearby Hon Mun MPA, show absence or low
abundances of many larger target species, e.g. groupers, snappers and emperors,
consistent with over-harvesting (Van Nguyen & Phan 2008), suggesting that similar
conditions are likely to be found 100 km north of its location, in this similarly over-
populated area. Because of a growing population overexploiting the nearshore
resources, more and more fishermen are turning to lobster, fish or shrimp
aquaculture ( F A O 2008; Ministry of Fisheries and World Bank 2005). Aquaculture
productions has grown tremendously over the last few years in Vietnam, even
surpassing fishery landings in 2007; by the end of 2008 aquaculture production
was even 15 % higher than fish catches, providing 4.6 million tonnes seafood
( G S O 2009b). Aquaculture activity in Van Phong Bay is becoming particularly
important during the winter months when fishing is restricted by weather conditions.
The aquaculture families are, however, still relatively poor, so they use trash fish as
feed, supplemented with low value shellfish. This increases the risk of transmission
of d iseases , which is why they add large amounts of antibiotics. This combination
increases nutrification significantly, creating further imbalance and harm to the
ecosystem ( lUCN 2003b).
106

3.5 Whale Island Resort
Whale Island Resort (WIR) is a Hotel Managed Marine Reserve (HMMR), located
on a small island, Hon Ong (approx. 100 ha) in Van Phong Bay, Khanh Hoa
Province, south-central Vietnam, 80 km north of Nha Trang (Figures 3.1 and 3.2).
South China Sea
Peninsula
yOAm Mdn
aai Tranh
Son Dung
khai Luong
van Phong Bay
Figure 3.2. Map showing Hon Ong Island, its reserves (Whale Island Bay reserve: V\/IB & Whale Island Bay Peninsula reserve: WIBP), Control sites (CI & C2) and surrounding villages, located in Van Phong Bay, Khanh Hoa Province, south-central Vietnam
There are 32 bamboo-built bungalows nested Into the Island acconnmodating a
maximum of 70 guests (Figure 3.3). The average length of stay is 3 nights and the
average yearly occupancy is 60 %. The majority of guests are tourists, who are
either travelling independently, or with organised tours; a small percentage are
businessmen.
07

Figure 3.3. Picture of part of Whale Island Resort, including the outer marker buoys for Whale Island Bay reserve (WIB)
3.5.1 Resort eco-friendliness and conservation projects
The resort is eco-friendly albeit not certified: the only pollution it generates is from
the ferry, transporting guests and supplies to and from the mainland, in addition to
the daily diving and snorkelling boats. Effluent is recycled in a septic tank and used
to irrigate local plant species and inorganic waste is collected daily from the beach
and rooms and burnt in a specially constructed high-heat furnace. Pamphlets are
provided in the bungalows describing proper behaviour towards the local marine
and terrestrial environment. A couple of security guards, who double as reserve
108

wardens, provide for safety during the day and fend off poachers during the night.
Hiking trails have been hewn into the countryside for guest safety and in order to
decrease damage and erosion. Several clusters of artificial reefs, constructed out
of clay pots, have been deployed at approximately 4 m depth, to serve as substrate
for their coral transplantation project, while creating habitat complexity for fish,
increasing fish assemblages. Broken off pieces of coral from the reef damaged
locations are placed on these surfaces to facilitate growth. Fish Aggregating
Devices (FADs) have also been constructed, made from cut-up strips of netting,
bound together, fastened to buoys and anchored to the s e a floor at 9 m depth,
attracting schools of fish, including larger species, such as Snapper (Lutjanidae),
Jacks (Carangidae) and Barracuda (Sphyraenidae) (Appendix 2). T h e manager
ensures that the vast majority of food and drink is purchased from local vendors.
The resort employs approximately 45 staff; the majority of whom reside in the
nearby village of Dam Mon, or they come from other villages in the vicinity.
3.5.2 HMMR establishment
The resort was established in 1997 when the fishing population of the largest
nearby village. Dam Mon, was relatively small. The resort owners became
increasingly concerned when they noticed a decline in fish and coral populations,
They believed that the decline was mainly caused by overfishing and destructive
fishing techniques, such as blast and cyanide fishing, and hose and hook fishing.
This was compounded by rubbish dumping and pollution from an increasing
number of fishing vessels and people in Dam Mon and nearby villages. The
- 109-

owners, therefore, decided they would try to protect a small area of the coastline.
They maintain that they informed their staff and asked them to spread the
suggestion to their local fishing families and others. When there were no negative
responses, they leased a larger area from the authorities of Khanh Hoa Province,
which took the form of a 10-year contract, and included the coastal s e a s up to 600
m from the resort. The adjacent bay (<600 m) w a s marked by the local coast guard
and enclosed with buoys in 2001 to mark the no-take zone, and the 11 ha HMMR
(Whale Island Bay reserve - WIB), was thus created. Since WIB seemed to be
increasing fish stocks, the owners decided to enclose another bay on the other
side of the peninsula in August 2005. creating a 5 ha marine reserve (Whale Island
Bay Peninsula reserve - WIBP) (Figure 3.4). T h e owners conclude that the yearly
costs of maintaining the reserves are relatively low; the marine portion of the lease,
the reserve wardens, material, repair and maintenance cost less than U S $ 10,000
per year; no resen/e user fees are collected.
no
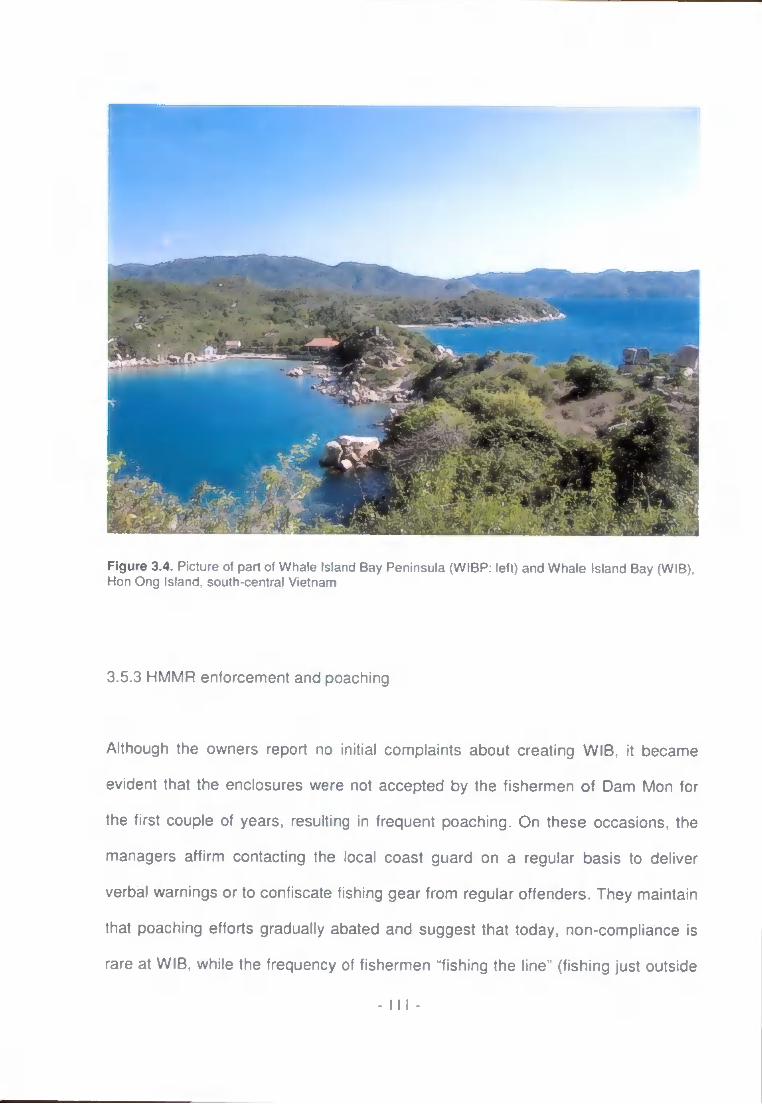
Figure 3.4. Picture of part of Whale Island Bay Peninsula (WIBP: left) and Whale Island Bay (WIB). Hon Ong Island, south-central Vietnam
3.5.3 HMMR enforcement and poaching
Although the owners report no initial complaints about creating WIB, it became
evident that the enclosures were not accepted by the fishermen of Dam Mon for
the first couple of years, resulting in frequent poaching. On these occasions, the
managers affirm contacting the local coast guard on a regular basis to deliver
verbal warnings or to confiscate fishing gear from regular offenders. They maintain
that poaching efforts gradually abated and suggest that today, non-compliance is
rare at WIB. while the frequency of fishermen "fishing the line" (fishing just outside
- I l l -

the marked buoys) during the night is relatively high (2-3 times per week). The
owners and managers indicate that poaching is more common in WIBP
(approximately every two weeks), where night patrols by the reserve wardens are
less frequent. From personally observed occurrences during the night, it seems
that when fishing within the reserves, traditional line and hook fishing is generally
used, but when "fishing the line", more extractive net fishing is employed.
3.5.4 HMMR future
There are plans to build an international trans-shipment seaport in Van Phong Bay.
Although several environmental assessments in favour of building the port have
failed, it is foreseen that a 400 ha site will be finalised by 2020. Initial construction
was originally set for 25*^ January 2008, but this was postponed pending further
inquiries. Van Phong Bay is relatively close to international s e a lanes to Europe,
north Asia, Australia. Southeast Asia and north Asia . The average depth (20-22 m)
of the 45,000 ha bay and the 6 km wide navigational passage are considered ideal
for port accessibility. The port is pan of a broader plan to develop Van Phong into
an economic zone in central Vietnam, which is suggested to focus on such fields
a s tourism, services, industry, aquaculture and others. The Economic Zone is
estimated to cover an area of 150,000 ha, encompassing several provinces (Ha
2008; Thanhnien News 2008; VietnamBusinessFinance 2008).
112

Due to these future developing plans, the owners of WIR were only able to lease
the Island and surrounding seas for one year in 2008 and 2009 and may well be
forced to abandon their hotel in coming years.
3,6 Summary
Whale Island Resort is an excellent choice of study site for this thesis. The owners
and staff are environmentally conscious and concerned and it has two reserves.
One of these was established only 2 months before the first surveys were carried
out, approximating pre-enclosure conditions, ideal to test the potential increase in
fish stocks following protection.
Five related research studies have been conducted and are compiled in this thesis,
Four of these are specific to the study site of Whale Island Resort. Vietnam; the
fifth study has a global dimension to it. The first study is associated with the
effectiveness of the two HMMRs (WIB and WIBP) at increasing the diversity, size
and density of fish within the reserves (Chapter 4). These parameters are
compared with two unprotected Control sites (CI & C2), which have similar
environmental characteristics (Figure 3.2). The second study concentrates on
WIB's effectiveness at increasing fish stocks through deployment of 5 Artificial
Reefs (ARs) (Chapter 5). The third study focuses on the perceptions of local
fishermen from Dam Mon (largest village adjacent to WIR) towards the marine
reserves (Chapter 6); the fourth study conducted at WIR explores the tourists'
1 1 3 -

Willingness to Pay (WTP) extra to stay at HMMRs (Chapter 7). The fifth study
reviews the status of existing HMMRs worldwide (Chapter 8)
The studies carried out in Chapters 4 and 5 (biological effectiveness) were
conducted with the undenwater visual census method. Data for the studies in
Chapters 6, 7 and 8 were collected through questionnaires. Details of these studies
and descriptions of methods employed are provided in the main analytical chapters
that follow.
1 1 4 -

4. The effectiveness of Whale Island Resort's marine reserves at
increasing fish stocks
Contents of this chapter were used to write:
Svensson, P., L D. Rodwell, and M. J. Attrill. 2009. Privately managed marine
reserves as a mechanism for the conservation of coral reef ecosystems: a
case study from Vietnam. Ambio 38:72-78
- 1 1 5 -

4.1 Introduction
Coral reef ecosystems are important for the sustainable development of many
tropical coastal countries, providing food, minerals and income to local fisheries
whilst also offering natural protection against wave erosion (Spalding et al. 2001).
These ecosystems are, however, highly threatened today, despite a growing
number of Marine Protected Areas (MPAs) established over the last three decades,
with proven success at increasing species richness, biomass and biodiversity
(Dayton et aL 2000; Russ & Alcala 1998). Bryant et al. (1998) found that the coral
reefs of Southeast Asia are the most threatened (80 % ) , mainly attributable to
coastal development and fishing-related pressures.
To address this threat, and to reduce loss of biodiversity, the need for more MPAs
has therefore been recognised in recent years. At the World Summit on
Sustainable Development (Johannesburg 2002), and later at the World Parks
Congress (Durban, September 2003), representatives of protected areas
recommended networks of marine reserves covering 20-30 % of habitats by 2012
(lUCN 2003a). Countries have acknowledged the dire consequences of losing
coral reef ecosystems and the worldwide response has been to create each year
for the last decade approximately 40 MPAs which include coral reefs, thus covering
18.7 % of the world's coral reef habitats (Mora et al. 2006). In 2002. 646 MPAs had
been declared in Southeast Asia; however, only 8 % of the countries' reef area is
covered (Burke et al. 2002). Unfortunately, a large majority of MPAs in Southeast
Asia and worldwide is reported as failing because they have not met their
objectives, have been listed as marine reserves but not succeeded in implementing
- 1 1 6 -

management, have failed, or lie dormant at one of the subsequent development
stages (McClanahan 1999). The major barrier to successfully managed reserves
has been attributed to the inability to secure adequate long-term funding for
management costs (Dharmaratne et al. 2000), resulting in inadequate law-
enforcement (Depondt & Green 2006). In a worldwide study of MPAs, only 15.7 %
of respondents reported funding levels to be sufficient for effective conservation
(Balmford et al. 2004).
The private sector, bolstered by tourism, could offer a major source of revenue
allowing MPAs to become self-financing, establishing a truly successful and
economically sustainable MPA, especially in developing countries (Davis & Tisdell
1996; Dharmaratne et al. 2000). The Durban Action Plan (from the World Parks
Congress 2003) also called on the private sector to "financially support the
strategic expansion of the global network of protected areas" and states that
tourism can provide economic benefits, opportunities for communities, create
awareness and greater knowledge of our natural heritage (lUCN 2003a).
Private parks on land are well-known and have been accepted as conservation
areas for over half a century (Langholz & Lassoie 2001), with several large private
parks existing in South America and Africa, some covering over 100,000 ha
(Langholz et al. 2000). While little is still known about the effectiveness of such
private parks at protecting and allowing for growth of plants and animals, they are
still expanding rapidly and number in the thousands, protecting several million
hectares of biologically important habitat (PRN 2007). Privately managed MPAs,
on the other hand, are not well known, despite the private sector's growing
- 1 1 7 -

involvement, and reported higher influence in protected area decision making,
especially in developing countries (Dearden et al. 2005). Privately managed MPAs
are still widely undocumented and insufficiently researched, but similar to terrestrial
private parks, they are believed to have been initiated because of the same three
reasons: government failure to satisfy public demand for nature conservation (both
quality and quantity), growing societal interest in biodiversity conservation and the
rapidly expanding ecotourism industry (Langholz & Lassoie 2001; Riedmiller 1999).
It is traditionally understood that in private-community ecotourism joint ventures,
the private sector provides capital, business, marketing experience and clients; the
local communities provide the location and local knowledge, while the local
government or Non-Government Organisation (NGO) should mediate between the
two, as well as provide basic infrastructure and other necessities (Kiss 2004). It is,
however, a general misconception that submerged lands cannot be owned or
leased by private enterprises (Beck et al. 2004). In researching the coastal states
surrounding the United States of America, Slade et al. (1997) found that nearly one
third of submerged lands were owned or leased by the private sector, developing
marinas, private docks, fisheries, aquaculture or other ventures. US states, in
which ownership of submerged lands is possible, include Florida and Hawaii (Beck
et al. 2004) - tropical states which include coral reef systems. Leasing submerged
lands as a tool for marine conservation has, however, rarely been applied, even
though the costs of leasing such areas are generally orders of magnitude lower
than equivalent schemes in the terrestrial environment. It is, for example, possible
to lease up to half of California's kelp forests, as well as sponge and soft coral
habitats in Florida (Beck et al. 2004).
- 1 1 8 -

A growing number of hotels and dive resorts are discovering the leasing potential
of adjacent coastal areas with or without external stakeholders. The Navini Island
Resort, Fiji, has taken advantage of the customary South Pacific practice of owned,
limited access areas of the sea and its resources, so called tabu areas, by leasing
the sea around the Island up to a depth of 30 m. A monthly fee is paid to the
owners, who enforce fishing restrictions, and in return, the hotel agrees to follow
the tabu, which prohibits any damaging of the coral reef ecosystem or extraction of
its resources (Arthur Reed, resort manager, pers. comm.; Tuxson 2005).
In other cases, resorts which have the financial backing, resources and economic
incentive, have taken over the day-to-day management of an MPA. These are
termed "entrepreneurial MPAs", where the MPA is officially designated, but
resources are lacking to effectively manage the reserve (Colwell 1999). Some
private no-take zones are also precursors to public protection, which could be
viewed as money saved by the government for areas that may otherwise have
needed protection (Langholz & Lassoie 2001). The protected zone adjacent to
Lankayan Island Dive Resort, Sabah, Malaysia, which turned into Sugud Islands
Marine Conservation Area (SIMCA), is such an example (Teh et al. 2007). The
number of officially recognised privately managed MPAs is still small, but there are
reported successes, such as the Chumbe island Coral Park (CHICOP), which
possibly also represents the first fully functioning MPA in Tanzania (Riedmiller
1999).
There is growing literature showing that MPAs can effectively increase diversity,
density and biomass of organisms within protected boundaries, irrespective of the

size of the MPA (Halpern 2003), as well as enhancing fishing yields in the
surrounding fished areas through the process of 'spillover' of fish from the MPA
(McClanahan & Mangi 2000; Mora & Sale 2002; Samoilys et al. 2007). The
biological effectiveness of privately or hotel managed MPAs (Hotel Managed
Marine Reserves: HMMRs), have, however, not yet been adequately researched.
In light of the high financial costs of establishing and maintaining protected areas,
this paper examines an alternative approach to protecting at least a part of the 20-
30 % of the world's seas through private management. HMMRs may offer a
solution to the increasing need for marine conservation by assuming responsibility
for protecting adjacent marine environments, yet also safeguarding the hotels'
future through reputation and return guests. The future of local communities may
also be sustained, by ensuring direct and indirect jobs from tourism activities and
growth, and by providing spillover from increasing the standing fish stocks in the
reserves.
In this chapter, the effectiveness of Whale Island Resort's marine reserves are
researched, in terms of their capacity to increase coral reef fish density, diversity
and size. The findings of this local study are analysed and extrapolated to consider
potential global possibilities.
2 0 -

4.2 Study site and methods
A detailed description of the study site can be found in Chapter 3. The surveyed
areas include the 11 ha Whale island Bay reserve (WIB), the 150 m distant 5 ha
Whale Island Bay Peninsula reserve (WIBP), and two Control sites (CI and C2),
which have similar exposure, slope and morphologic characteristics, located 800 m
along the coast, southeast from WIB and 350 m apart (Figure 4.1). As exact
geographical control replicates were not possible, the manta tow technique
(English 1997) - effective at assessing a large area relatively quickly, was used to
choose control sites, which were as close a fit to conditions of the HMMRs as
feasible, with regards to beach slope gradient and benthic structure. As natural
differences between locations are likely to exist, this study focused on relative
change over time at our tour sites, rather than absolute comparisons of fish
communities. The first survey was conducted in October 2005. two months after
WIBP was enclosed, thus approximating pre-protection conditions for that reserve.
The following three surveys were conducted every six months during a 3-week
period, each time in April and October, with the last survey conducted in April 2007;
two seasons were therefore assessed over two years.
121

South China Sea
Van Phong Bay
Nha Trang
25km
Figure 4.1. Illustration of study area showing Whale Island Resort (WIR), the 11 ha Whale Island Bay reserve (WIB) and the 5 ha Whale Island Bay Peninsula reserve (WIBP), plus the locations of the two Control sites (Cl & C2) on Hon Ong (Whale Island), in Van Phong Bay, Khanh Hoa Province, Vietnam
During all four survey visits (October 2005 - April 2007), replicates of four 50 m
transects were surveyed at 3 m and 9 m depth at each of the four survey sites
(WIB, WIBP, CI & C2), using the visual fish census method described by English et
al. (1997), where the diver swims at a constant speed above the transect and
identifies and counts individual fish and records their size and distance from the
transect. The same transect line was used to survey the benthos using line
intercept transect over 20 m. Here, the benthic habitat and its length is recorded.
Instead of only including fish within a set perpendicular boundary to the transects,
variable distance counting was used to calculate the area (and thereby density)
(Labrosse et al. 2002). The whole fish community was identified to species where
122

possible, but excluded cardinalfish (Apogonidae), lizardfish (Synodontidae) and the
bottom-dwelling species such as the gobies (GobiidaeJ and blennies (Blenniidae)
(Figure 4.2, Appendix 2) because their cryptic lifestyles made accurate
enumeration difficult. The number of individual fish per species, their estimated
size and distance from the transects was recorded. To increase accuracy in length
estimations, I arranged and estimated Polyvinyl Chloride (PVC) fish-models (7 - 49
cm) along a 50 m line, while snorkelling at a constant pace. This exercise was
repeated with varying configurations and distance from the observer before each
survey visit, until 95 % accuracy was achieved.
I analyzed fish density, species richness, average size of fish and number of
fish >15 cm using a 3-way Analysis of Variance (ANOVA) model with site, habitat
and time as factors; benthos cover (i.e. composition of benthic habitat) was
analyzed with a 2-way ANOVA, for site and time. I checked for ANOVA
assumptions using Cochran's test and transformed where necessary; Student-
Newman-Keuls tests (SNK) further investigated the significant interactions between
factors. All ANOVA analyses were undertaken using GMAV5 for Windows. To
explore differences in fish assemblage composition between times and sites,
hierarchical agglomerative cluster analysis was conducted to produce a
dendogram using PRIMER5 software on a similarity matrix (Bray-Curtis similarity
index), calculated from square-root transformed species abundance data (Clarke &
Gorley 2001). Significance tests for differences between site and time were
performed using Analysis of Similarity (ANOSIM) and the fish families contributing
most to dissimilarities were determined by the similarities percentage procedure
SIMPER (Clarke 1993).
- 1 2 3 -

4.3 Results
Over the four visual census surveys, 242 species of fish from 35 different families
were identified; 195 species were observed in WIB reserve, 138 in WIBP reserve,
while 107 and 87 species were recorded at C I and C2 respectively. A full list of
identified fish species can be found in Appendix 1. Over all sites and survey
periods, average species richness and average size of fish were higher at the 3 m
sites compared with the 9 m sites (SNK, p<0,01), as were densities of fish and
average number of fish >15 cm (SNK, p<0.05) (Tables 4.1 & 4.2).
Table 4.1. A biannual breakdown of fish species richness, density (m ), number of fish >15 cm and average size of fish (cm) (with SE) found at the 3 m rocky habitats for V\/hale Island Bay reserve (WIB), Whale Island Bay Peninsula reserve (WIBP) and Control sites (01 & C2)
Species richness Density (m'̂ ) No. fish >15 cm Ave. size (cm)
WIB
October 05 35.75+/- 2.11 1.41 +/-0.30 60.00 +/- 23.77 9.77+/- 2.11
WIB
April 06 45.50+/- 1.89 2.57 +/- 0.44 121.00+/- 49.31 10.28 +/- 1.52
WIB
October 06 46.00 +/- 2.09 3.17+/- 0.79 108.75+/- 32.07 8.95 +/- 0.71 WIB
April 07 54.75 +/- 0.41 2.53 +/- 0.25 195.75 +/- 37.57 10.17+/-0.92
WIB
Total 45.50 +/-1.60 2.42 +/- 0.44 121.38+/- 35.68 9.79+/-1.31
WIB
P
October 05 18.75 +/- 2.16 0.76 +/- 0.06 3.50+/- 1.50 6.36 +/- 0.34
WIB
P April 06 29.50 +/- 4.62 1.58 +/-0.28 48.75+/- 27.85 8.43+/- 1.07
WIB
P
October 06 27.25+/- 2.16 1.59 +/- 0.27 44.50 +/- 20.51 9.17+/- 0.25
WIB
P
April 07 24.75 +/- 0.41 1.81 +/- 0.41 61.25 +/- 34.30 8.58+/-0.49 WIB
P
Total 25.06 +/- 2.34 1.44 +/- 0.26 39.50 +/- 21.04 8.14+/- 0.54
o
October 05 18.25 +/- 2.48 0.54 +/- 0.10 0.00 +/- 0.00 5.08 +/- 0.88
o April 06 27.00+/- 1.73 0.94+/- 0.12 11.25+/- 2.95 7.66 +/- 0.49
o October 06 27.25+/- 2.16 0.86+/- 0.10 7.50 +/- 12.42 7.37 +/- 0.24 o April 07 26.75 +/- 2.04 0.76 +/- 0.06 25.25 +/- 30.52 9.64 +/- 0.86
o
Total 23.19+/-2.48 0.77+/- 0.10 11.00 +/-11.47 7.44 +/- 0.62
CvJ
o
October 05 14.75 +/- 1.85 0.33+/- 0.10 0.75+/- 1.30 6.64 +/- 0.40
CvJ
o
April 06 26.25 +/- 2.46 0.96 +/- 0.08 10.50 +/-8.87 7.79+/- 0.60 CvJ
o October 06 14.00 +/- 0.94 0.54 +/- 0.04 3.50 +/- 4.09 7.94 +/- 0.32 CvJ
o April 07 20.25 +/- 2.65 0.65+/- 0.15 14.75 +/- 9.78 8.60 +/- 0.93
CvJ
o
Total 18.81 +/-1.97 0.62 +/- 0.09 7.38 +/- 6.01 7.75 +/- 0.56 Total averages 28.12+/-2.10 1.31+/- 0.22 44.81 +/- 18.55 8.28 +/- 0.76
124
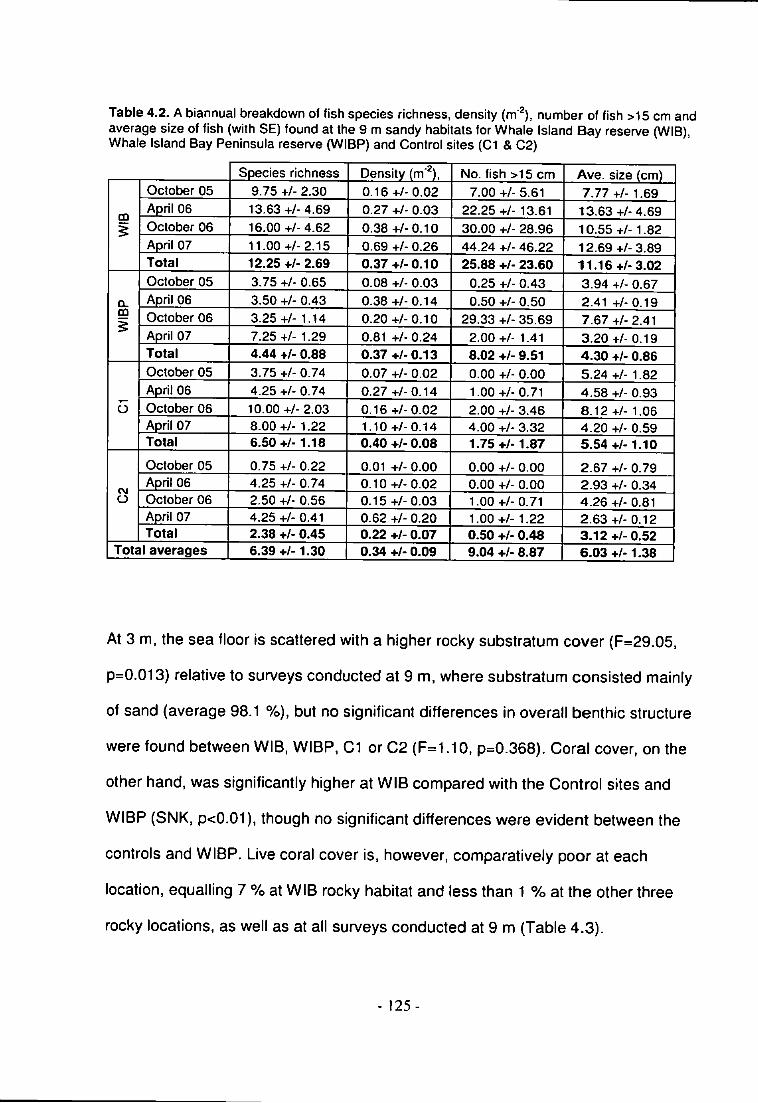
Table 4.2. A biannual breakdown of fish species richness, density (m'^), number of fish >15 cm and average size of fish (with SE) found at the 9 m sandy habitats for Whale Island Bay reserve (WIB), Whale Island Bay Peninsula reserve (WIBP) and Control sites (CI & C2)
Species richness Density (m'^), No. fish >15 cm Ave. size (cm)
WIB
October 05 9.75 +/- 2.30 0.16+/-0.02 7.00 +/- 5.61 7.77 +/- 1.69
WIB
April 06 13.63 +/- 4.69 0.27 +/- 0.03 22.25 +/- 13.61 13.63 +/-4.69
WIB
October 06 16.00 +/-4.62 0.38 +/- 0.10 30.00 +/- 28.96 10.55 +/- 1.82 WIB
April 07 11.00 +/- 2.15 0.69 +/- 0.26 44.24 +/- 46.22 12.69 +/-3.89
WIB
Total 12.25 +/- 2.69 0.37 +/- 0.10 25.88 +/- 23.60 11.16+/- 3.02
WIB
P
October 05 3.75 +/- 0.65 0.08 +/- 0.03 0.25 +/- 0.43 3.94 +/- 0.67
WIB
P April 06 3.50 +/- 0.43 0.38+/- 0.14 0.50 +/- 0.50 2.41 +/- 0.19
WIB
P
October 06 3.25 +/- 1.14 0.20 +/- 0.10 29.33 +/- 35.69 7.67 +/- 2.41 WIB
P
April 07 7.25 +/- 1.29 0.81 +/-0.24 2.00 +/- 1.41 3.20 +/- 0.19
WIB
P
Total 4.44 +/- 0.88 0.37 +/- 0.13 8.02 +/- 9.51 4.30 +/- 0.86
o
October 05 3.75 +/- 0.74 0.07 +/- 0.02 0.00 +/- 0.00 5.24 +/- 1.82
o April 06 4.25 +/- 0.74 0.27+/-0.14 1.00 +/- 0.71 4.58 +/- 0.93
o October 06 10.00 +/- 2.03 0.16 +/-0.02 2.00 +/- 3.46 8.12 +/- 1.06 o April 07 8.00 +/- 1.22 1.10+/-0.14 4.00 +/- 3.32 4.20 +/- 0.59
o
Total 6.50 +/-1.18 0.40 +/- 0.08 1.75 +/-1.87 5.54 +/-1.10
CM O
October 05 0.75 +/- 0.22 0.01 +/- 0.00 0.00 +/- 0.00 2.67 +/- 0.79
CM O
April 06 4.25 +/- 0.74 0.10+/- 0.02 0.00 +/- 0.00 2.93 +/- 0.34 CM O October 06 2.50 +/- 0.56 0.15 +/-0.03 1.00 +/- 0.71 4.26 +/- 0.81 CM O
April 07 4.25 +/- 0.41 0.62 +/- 0.20 1.00 +/- 1.22 2.63 +/- 0.12
CM O
Total 2.38 +/- 0.45 0.22 +/- 0.07 0.50 +/- 0.48 3.12+/- 0.52 Total averages 6.39 W-1.30 0.34 +/- 0.09 9.04 +/- 8.87 6.03 +/-1.38
At 3 m, the sea floor Is scattered with a higher rocky substratum cover (F=29.05,
p=0.013) relative to surveys conducted at 9 m, where substratum consisted mainly
of sand (average 98.1 % ) , but no significant differences in overall benthic structure
were found between WIB, WIBP, C1 or C2 (F=1.10, p=0.368). Coral cover, on the
other hand, was significantly higher at WIB compared with the Control sites and
WIBP (SNK, p<0.01), though no significant differences were evident between the
controls and WIBP. Live coral cover is, however, comparatively poor at each
location, equalling 7 % at WIB rocky habitat and less than 1 % at the other three
rocky locations, as well as at all surveys conducted at 9 m (Table 4.3).
125

Table 4.3. A breakdown of coral and rock cover (with SE) across the surveyed locations: Whale Island Bay reserve (WIB). Whale Island Bay Peninsula reserve (WIBP) and Control sites (CI & C2) at the 3 m Rocky (R) habitats and 9 m Sandy (S) habitats
Coral cover (%) S E Rocky cover (%) S E
WIB R 7.00 0.56 6.86 0.79 W I B S 0.34 0.07 0.78 0.27 WIBP R 0.08 0.02 4.05 0.87 WIBPS 0.56 0.08 0.41 0.14 C1 R 0.98 0.16 14.84 1.90 C1 S 0.07 0.02 1.09 0.22 C 2 R 0.26 0.04 10.27 0.96 C 2 S 0.16 0.05 0.00 0.00
ANOSIM tests confirmed that the fish assemblages between the 9 m sandy
habitats and the 3 m rocky habitats were significantly different (Global R=0.745,
Global P=0.001). The families contributing most to the dissimilarity between
habitats were the Pomacentridae, Nemipteridae and Labridae (Table 4.4, Appendix
2). The dendogram (Figure 4.2) illustrates these findings and additionally shows a
higher level of similarity between rocky sites. For both the sandy and rocky habitats
closest similarities were observed between the two Control sites and WIBP
(approximately 70 % for rocky habitats and 55 % for sandy habitats). Although 35
families were observed, the vast majority of fish found at all sites belong to the
damselfish family (Pomacentridae, 56-68 %) . followed by bream (Nemipteridae,
12-17 %) and wrasse (Labridae, 6-12 %) . The larger predator species, jacks
(Carangidae), barracuda (Sphyraenidae) and milkfish (Chanidae) (Appendix 2)
were, however, exclusively found in WIB and WIBP.
126

40
m 1 ^ 80
100 CM o
01
o
01 CL CD
01 O
CO CSJ o
CO
Figure 4.2. Dendogram illustrating similarities in fish assemblages between Whale Island Bay reserve (WIB). Whale Island Bay Peninsula reserve (WIBP), and two Control sites (Cl & C2), for surveys conducted biannually between October 2005 and April 2007 at Whale Island Resort, Hon Ong. Vietnam. Habitats: Rock (R) and Sand (S)
A more detailed account of the similarities in fish assemblages within each habitat
are shown In Figures 4.3 & 4.4. These again highlight the stronger similarity of fish
assemblages at the rocky habitats, but also the tightly separated grouping for fish
communities found in WIB. After the first survey in October 2005, where WIBP fish
assemblages were very similar to those found at C1 and also, but to a lesser
degree, C2, the fish assemblages developed to create their own separate
community. The fish communities of C1 and C2 seem to be more interlinked. A
near to comparable compact cluster was also found at the sandy habitats for WIB,
while another similarity group was formed by the three remaining sites. The 9 m
- 1 2 7 -

surveys conducted in October 2005 at C2 revealed only one species with low
densities (Amblypomacentrus c/arus), explaining this site's high dissimilarity with
other sites.
OCT 05 WIB APR 06 WIB OCT 06 WIB APR 07 WIB APR 06 WIBP OCT 06 WIBP APR 07 WIBP APR06C1 APR 07 01 APR OS C2 APR 07 02 OCT 06 01 OCT 06 02 OCT 05 02 OCT 05 01 OCT 05 WIBP
40 50 60 70 80 90 100
Figure 4.3. Dendogram illustrating similarities {%) in fish assemblages for 3 m rocky habitats between Whale Island Bay reserve (WIB). Whale Island Bay Peninsula reserve (WIBP), and two Control sites (01 & 02), for surveys conducted biannually between October 2005 and April 2007 at Whale Island Resort, Hon Ong, Vietnam
10 20 30 40 50 60 70 80 90
" OCT 06 01 - O C T 05 WIB • OCT 06 WIB - APR 06 WIB - APR 07 WIB - OCT 05 C1 - APR 06 02 - OCT 06 02 - OCT 05 WIBP - APR 06 WIBP - APR 07 C2 - APR 06 01 - APR 07 01 - APR 07 WIBP ' OCT 06 WIBP - OCT 05 02 100
Figure 4.4. Dendogram illustrating similarities (%) in fish assemblages for 9 m sandy habitats between Whale Island Bay reserve (WIB), Whale Island Bay Peninsula reserve (WIBP), and two Control sites (01 & 02), for surveys conducted biannually between October 2005 and /Vpril 2007 at Whale Island Resort, Hon Ong, Vietnam
128

The differences in fish assemblages between sites across all survey periods can
be visualised from the Multidimensional Scaling Ordination (MDS), whereby the
nearer the points are to each other, the more similar are the assemblages at those
sites and times (Figure 4.5). A strongly clustered and a slightly less clustered group
can be observed, although without any obvious pattern, suggesting similar fish
assemblages can be found at each location when the different habitats are not
considered individually at each site.
stress: 0,14
• • n o 0 • A
A
Figure 4.5. A Multidimensional Scaling Ordination (MDS) showing the similarities in fish assemblages {square root transformed) between WIB (squares), WIBP (circles), C l (diamonds) and C2 (pyramids) for surveys conducted biannually between October 2005 and April 2007 (white to black shading) at Whale Island Bay, Hon Ong, Vietnam
129

WIB contained significantly higher species richness, density, average size of fish
and number of fish >15 cm (SNK, p<0.01), compared with C1, C2 and WIBP over
all survey visits (Tables 4.1 & 4.2, Figure 4.7). The abundance of butterflyfish
(Chaetodontidae), which has been used as an indicator species for healthy reefs
(Dickson 2006), were also significantly higher at WIB (one-factor ANOVA.
F=15.404, p<0.001) (Figure 4.6).
Abundance of Chaetodontidae 350
300
I 250
0 200
1 150
Z 100
50
WIB WIBP CI C2
Figure 4.6. The abundance of butterflyfish (Chaetodontidae) found over all survey periods at Whale Island Bay reserve (WIB). Whale Island Bay Peninsula reserve (WIBP) and the two Control sites (C1 & C2) (with SE)
While there were no significant differences between survey periods for species
richness and average size, significantly higher values were found in the latter two
surveys compared with October 2005 for density (SNK, p<0.01) and number of
fish >15 cm (SNK, p<0.05), as well as density for April 2006 relative to October
2005 (SNK, p<0.05). Figure 4.7 displays a separation of the findings from the two
different habitats, clearly showing higher values at the rocky habitat, and giving
some indication of the significances over different time periods.
- 1 3 0 -

60 n
(0 o 30 A
Fish species richness Fish density
3.0 A
M 2.0
0.5 H
250
20
. g 1 5
o 10
90 80
i= 70 ^ 6 0 o 50
^ 40 § 3 0 2 20
WIBP
Number of fish >15cm Average size of fish
^ 1 5 0
Fish species richness
C1 C2 WIBP WIB
Number of fish >15cm
J
1.4
1.2
- ^ 1 . 0
«' 0.8 m
:i 0.6 0.4
0.2
0.0
18 16 14
^ 1 2 S 10 § 8 M 6
C2 sag WIBP
Fish density
WIB
CI C2 WIBP WIB
Average size of fish
Ml ffHi mil CI C2
Site WIBP WIB C1 C2 WB? WTB
Figure 4.7. Visual censuses comparing fish species richness, density, number of fish >15 cm & average size of fish (SE) at the 3 m rocky habitats (1) and the 9 m sandy habitats (2) for Whale Island Bay reserve (WIB), Whale Island Bay Peninsula reserve (WIBP) and two Control sites (Cl & C2), for surveys conducted from October 2005 to April 2007 (light to dark grey shading) at Whale Island Resort, Hon Ong, Vietnam.

WIBP reserve, established as a no-take zone two months prior to the first survey,
showed no significant differences to controls at baseline for all parameters, except
higher species richness relative to C2 (SNK, p<0.01) (Figure 4.7). Following
enclosure, WIBP increased its fish stock and average size, resulting in higher
overall densities of fish and numbers of fish >15 cm (SNK. p<0.01) compared with
controls and a higher species richness than C2 (SNK, p<0.01). No significant
differences were recorded for average size compared with controls, or species
richness compared with C1. Fish density and fish >15 cm increased significantly
within WIBP (SNK. p<0.01) from the first survey period to the next, but remained
relatively constant thereafter (Figure 4.7), with no significant differences between
the latter three sampling periods; each, however, was significantly different (SNK.
p<0.01) from October 2005 (approximating pre-enclosure). No significant
differences were evident for species richness or size. The families mainly
responsible for the increase, and thus resulting dissimilarity, between the two
survey periods at WIBP were the Pomacentridae, Nemipteridae, Gerreidae and
Scaridae (Table 4.4, Appendix 2). The SIMPER analysis also highlights the
increased average abundances of several fish families in the last three survey
periods at WIBP, approximating averages attained at WIB during the first survey;
averages were surpassed for Nemipteridae, Labridae and Caesionidae.
- 132

Table 4.4. Fish families contributing most (90 % cut off) to the dissimilarity between sites: Whale Island Bay reserve (WIB), Whale Island Bay Peninsula reserve (WIBP), time: (October 2005 (1), 3 biannual survey periods: April 2006 - April 2007 (2-4)), seasonal dissimilarity across sites (including Controls C I & C2) and habitat dissimilarity across all sites: 3 m rock and 9 m sand (SIMPER, not transformed data, Diss/SD, dissimilarity/standard deviation, Cum.%, Cumulative % contribution)
Families Ave.abundances Diss/SD Cum.%
Rocks Sand
Pomacentridae 229.42 55.38 1.90 53.28 Nemipteridae 55.64 3.81 1.67 70.40 Labridae 35.88 0.79 1.50 83.87 Caesionldae 7.45 3.62 0.49 87.37 Gerreidae 7.08 0.52 0.67 89.35 Chaetodontidae 5.23 0.30 1.16 90.99
October April
Pomacentridae 191.27 261.94 1.53 56.13 Nemtpteridae 37.24 72.94 1.28 72.27 Labridae 38.79 31.75 1.16 80.10 Caesionidae 4.12 10.66 0.59 84.14 Gerreidae 6.15 7.81 0.85 87.18 Siganidae 1.03 6.06 0.27 89.37 Scartdae 3.67 3.72 0.68 91.16
1WIBP 2WIBP
Pomacentridae 96.75 295.25 3.30 61.96 Nemipteridae 25.75 76.5 1.18 77.18 Gerreidae 0.50 16.25 0.97 82.04 Scaridae 0.75 14.75 1.24 86.35 Labridae 34.75 33.00 1.28 90.33
1WIBP IWIB
Pomacentridae 96.75 299.75 2.16 60.11 Nemipteridae 25.75 60.00 2.65 71.96 Labridae 34.75 30.75 1.01 77.47 Gerreidae 0.50 14.25 1.74 81.99 Scaridae 0.75 7.25 0.58 85.65 Caesionidae 9.75 2.00 0.73 89.05 Chaetodontidae 1.50 8.25 1.06 91.55
2-4WIBP 2-4WIB
Pomacentridae 289.67 525.67 1.53 58.04 Nemipteridae 73.58 101.25 1.39 69.41 Labridae 42.92 48.67 1.31 75.60 Gerreidae 7.58 19.50 1.01 80.04 Caesionidae 2.42 17.33 0.84 84.42 Scaridae 6.58 5.83 0.91 86.36 Mugilidae 2.08 8.08 0.81 88.28 Lutjanidae 1.92 8.17 0.94 90.11
133

The overall composition of fish assemblages were significantly different across all
sites (ANOSIM, Global R=0.567, Global p=0.001). between sites (all R=0.292-
0.943, p<0.002), across all periods (ANOSIM, Global R=0.502, Global p=0.001)
and between periods (all R=0.323-0.753, p<0.003). Diversity was significantly
higher in April 2007 (SNK. p<0.01) compared with the three previous visits across
all sites. For average fish size, there were no significant differences across sites
and times, in part due to the high percent of small damselfish (Pomacentridae)
(64.5 % ) . There is an apparent seasonal trend for density and fish >15 cm (Figure
4.8): values recorded in April 2006 were significantly higher than October 2005 and
April 2007 values significantly higher than October 2006 (SNK, p<0.01). The
families mostly responsible for the dissimilarity between April and October surveys
were the Pomacentridae and Nemipteridae (Table 4.4).
240 1 220 •
200 •
180
160 • 160 •
140 •
1 120 •
E 100 •
80
60 J
4: 20
c
+ 0 9
0 7 ^
0 6 to
Number of fish >15cm Fish density
Figure 4.8. Seasonality of averaged density and number of fish >15 cm surveyed at both depths (3 m & 9 m) during time intervals October (2005 & 2006 - light grey) and April (2006 & 2007 - dark grey) at Whale Island Bay reserve (WIB). Whale Island Bay Peninsula reserve (WIBP) and two Control sites (C1 & C2) (with SE)
- 134

4.4 Discussion
The objectives of this study were to determine the effectiveness of HMMRs in
terms of increasing the number, size and diversity of fish, and to assess how
rapidly a previously-exploited area can increase fish stocks, once protected from
fishing. The results indicated that these measures of the fish community at WIB
clearly surpassed those of the unprotected Control sites (Tables 4.1 & 4.2, Figure
4.7). Equivalent results have been observed at a number of similar-sized MPAs
(Halpern 2003). Roberts and Hawkins (1997) reported that the small marine
reserve of Anse Chastanet, St. Lucia (2.6 ha), initially established as a protected
zone for snorkellers of the hotel, managed to double the biomass of commercially
important predatory fish species such as the snapper. In the Philippines, the
Sumilon Island Reserve (12.5 ha, 9 year protection) had approximately 1.8 times
higher density than the Control sites and 1.2 times the number of species than the
unprotected Sumilon sites (overall WIB density: 2.9; number of species: 2.6
compared with averaged controls). Apo Island Reserve. Philippines, (11 ha, 1 year
protection), reported approximately 1.4 times higher density and 1.15 times higher
number of species than the unprotected Apo sites (WIBP density: 1.8; number of
species: 1.2) (Russ & Alcala 1989). This comparison between the officially
recognised Philippine reserves and the reserves in Vietnam demonstrates at least
equal effectiveness for these HMMRs. Similarly, the size of fish at WIB were
overall 1.5 times higher than the Control sites (WIBP, 1.3 times) and the number of
fish >15 cm, 22 times higher (WIBP, 4 times. Tables 4.1 & 4.2, Figure 4.7). These
are considerable increases for WIBP in particular, bearing in mind there were
minimal differences between this site and the two Control sites in October 2005.
- 1 3 5 -

This supports the evidence that small HMMRs can, in only a short time, increase
fish populations significantly following protection. Analogous results were produced
by Halpern and Warner (2002), who found that marine reserves can significantly
increase average levels of density, biomass, and diversity within 1-3 years,
independent of the size of the reserve, based on a review of 80 reserves.
Without effective protection, such small reserves can, however, be quite vulnerable.
At the Anse Chastanet reserve, St. Lucia, fish biomass dropped by 20 % following
a period of ineffective protection; however, biomass recovered to double the initial
value within 2 years of re-instatement (Roberts & Hawkins 1997). The increase in
biomass was primarily credited to an increase in fish size, much like WIBP. where
the total number of fish >15 cm increased 13 times from baseline to April 2006 and
by 17 times from baseline to April 2007. This clearly highlights both the benefits
and downfalls of small marine reserves. If small reserves are fully protected, they
can increase the size and density of fish rapidly; however, if poaching does take
place, the detrimental effects can be seen immediately. The magnitude of damage
will depend on the intensity of fishing, the fishing gear/techniques used and the
standing stock prior to the event. If HMMRs become lax in maintaining effective
protection, their image as an eco-friendly resort, where you can dive and snorkel
off the beach, could become compromised. This could possibly result in lower
occupancy rates and decreased profit: why private reserves in particular have an
added incentive to uphold protection.
While WIB is effectively protected, poaching still takes place at WIBP; unlike pre-
protection, however, less extractive fishing methods are used. In Van Phong Bay,
- 1 3 6 -

one fishing method, which does not target specific species, involves dragging nets
from within a small bay onto the beach (beach seining), not only causing serious
damage to living coral, but also extracting a far higher number of fish than post-
protection, where generally hook and line fishing is used. This may explain the
rapid increase in density and number of fish >15 cm from the first survey to the
next, and also why the number and size of fish did not increase further over the
following year (Tables 4.1 & 4.2, Figure 4.7). Unfortunately, the WIBP site is also
currently restricted to tourists, which lessens the incentive for protection.
Beach seining may also account for the low coral cover at WIBP, 01 and 02
(<1 % ) , though coral cover at WIB rocky habitat is also rated low with 7 % (Table
4.3). While there is evidence of more numerous and diverse fish assemblages
associated with coral reef habitats (Roberts & Ormond 1987; Spalding et al. 2001),
it is questionable whether such low levels would add significant value, although
there were significantly more corallivorous butterflyfish (Ohaetodontidae) observed
in WIB (6 x Oontrol sites & 4.5 x WIBP) (Figure 4.6, Appendix 2). This family has
been positively correlated with coral cover and marked as indicator species for
healthy reefs (Bell & Galzin 1984; Khalaf & Orosby 2005). A more likely scenario,
perhaps, for the significantly higher number of butterflyfish and other species, as
well as individual fish size in WIB compared with 0 1 , 02 and WIBP. is the 6-year
protection period and the cessation of large-scale fish netting. This would also
account for the observed differences in fish assemblages for sandy and rocky
habitats of WIB compared with the other sites (Figure 4.2) and the shift to an
individual community after half a year at the WIBP rocky habitat (Figure 4.3).
- 137

Rocky habitats (3 m) evidently have a richer fish assemblage than sandy habitats
(9 m), mainly attributed to higher numbers of Pomacentridae, Nemipteridae and
Labridae (Table 4.4, Appendix 2). This is expected for sites with higher structural
complexity (Roberts & Ormond 1987; Spalding et al. 2001), but both are highly
depauperate in terms of commercially valuable groups of large food fishes:
Serranidae (e.g. Epinephelus, Cephalopholis s p p j , Lethrinidae (Lethrinus sppJ
and Lutjanidae {Lutjanusspp.). especially at C I , C2 and WIBP (Appendix 2). Even
though the abundance of such species was notably higher at WIB, grouper,
emperor bream and snapper only accounted for a small percentage of the fish
population (0.46 %, 1.86 % & 0.94 % respectively). Unlike many small coastal
demersal fishes, which are relatively sedentary, having a home range of <1 km^,
the size and living spaces of such species tend to be larger, consequently requiring
a larger area of protection (Kramer & Chapman 1999).
The number of these species did not increase dramatically once WIBP was
protected, but measures of the fish assemblage increased between October 2005
and April 2006, especially for the number of fish >15 cm, which increased from 2-
9.4 % of the population; number of species and average density also increased. A
3-fold increase in Pomacentridae accounted mostly for the latter, while
Nemipteridae, and to a lesser degree Gerreidae and Scaridae (Appendix 2), were
mainly responsible for an influx of larger fish (Table 4.4). This is consistent with
previous findings, where predatory fish (Nemipteridae) responded strongly to well-
enforced reserves in the Philippines (Samoilys et al. 2007). While this could be
seen as a sign of spillover from WIB, there was no indication of simply a relocation
of WIB stock (Table 4.4, Figure 4.7), While the average abundances increased
- 1 3 8 -

over the following three survey periods for WIB and WIBP, the average contribution
to the dissimilarities for the three major families (Pomacentridae, Nemipteridae,
and Labridae) remained similar to the first survey period (Table 4.4). The average
dissimilarity decreased, however, from 55.53 % to 36.59 %, indicating that some
movement between reserves may be taking place.
The number, size and diversity of fish also increased at C1 and C2 between the
first and second survey, but not as dramatically as at WIBP reserve, the difference
probably related to the absence of larger-scale extractive fishing methods in the
reserve. A seasonal trend is evident for density and number of fish >15 cm across
all sites (Figure 4.8). with higher values reported in April. The main contributors
were species of the Pomacentridae family, followed by a much smaller contribution
from the larger Nemipteridae, Caesionidae, Gerreidae and Siganidae families
(Table 4,4, Appendix 2). The difference could be due to lower fishing intensity over
the northeast monsoon season (October to February), when fishing is restricted by
weather conditions. The higher fish densities could, however, also be related to
seasonal recruitment patterns. Higher peak settlement of several damselfish
species has been recorded during the wet season at San Bias, Panama, believed
to be caused by the strong onshore winds (Robertson 1990). Srinivasan and Jones
(2006). however, found that recruitment densities for Pomacentridae were highest
after the wet season (December-February), in April/May, and again in
October/November, in Kimbe Bay, Papua New Guinea. Pomacentridae was also
the main contributor to the dissimilarities between the two seasons at (Whale
Island Resort's (WIR) reserves (Table 4.4). Without further research into temporal
dynamics of fish recruitment and fish landings in Van Phong Bay throughout the
- 1 3 9 -

year, it is not possible to unequivocally determine the cause of temporal
differences.
Although there was an initial significant increase in fish stock at WIBP, the level
plateaued, showing only minimal temporal differences thereafter (Figure 4.7). Fish
stock and sizes are, however, still increasing 6 years after protection at WIB, and
since the surveys were only conducted during two years, further replenishment is
perhaps still possible at WIBP, but more effective protection will then also be
needed. Fishing the line is observed regularly at WIB, which is a good indicator
that fishermen perceive the reserve to be increasing its fish stock and possibly
producing spillover. Spillover was not researched outside WIB for this study, but
several fishermen confirm that fish stocks have improved adjacent to the reserve
(Chapter 6). The long-term goal of all HMMRs located near fishing villages should
be to compensate or increase their fishing yields to alleviate poverty, increase
standards of living and to repay the debt of compliance to the hotels' no-take zones.
At WIR. fishermen have also been seen fishing extensively between WIB and
WIBP with nets, potentially hindering the replenishment of WIBP fish stocks to its
full capacity from WIB. Whilst this may be a good short-term solution enabling
increasing yields, arguably it may not be a good long-term strategy to allow build
up of fish stocks. A better solution to improve the marine reserve potential would
be to expand both reserves to encompass the peninsula, creating one larger no-
take reserve and to increase protection efforts. This would increase the capability
to self-sustain a larger fish stock, including larger economically important species
with greater fecundity, allowing for greater larval dispersal and adult movement
- 1 4 0 -

across boundaries, which could better compensate, or indeed enhance, adjacent
fisheries (Hilborn et al. 2004; Kramer & Ohapman 1999; Sale et al. 2005). A buffer
zone adjacent to the reserve, where less extractive fishing methods are allowed,
would further enhance coastal resources (White et al. 2005). Such unilateral
protection by WIR and elsewhere (Ohristie 2005) may, however, increase tension
with some local fishermen, who already perceive WIR as a reason for their reduced
catches over the last few years; the reserve protects two beaches inhibiting their
more extractive beach seining method (Ohapter 6). In a survey conducted with
fishermen from the nearby fishing village, Dam Mon, the majority of fishermen
would, however, welcome more protected areas, but some suggest the hotel or
government could help compensate for their loss of fishing grounds by providing
support to develop lobster aquaculture (Ohapter 6)
4.5 Conclusion
This research provides good evidence that, with effective protection, small HMMRs
can increase fish stocks rapidly, matching, or in some cases surpassing, officially
established MPAs of a similar size. This study does not offer conclusive evidence
for the effectiveness of all HMMRs, or whether such small HMMRs can
compensate for the loss of fishing area set aside for the reserve. There is, however,
evidence of spillover from the similar sized Apo Island reserve in the Philippines
(Russ & Alcala 1996) and fishermen statements in this study suggest spillover from
WIB (Ohapter 6). Oertainly, results show the promise of such schemes. One
HMMR may only make a difference very locally, but many hundreds to thousands
- 141 -

of HMMRs lining coastal countries across the tropics could create a network of
marine reserves which, some argue (Dawson et al. 2006; Roberts et al. 2001), can
have a cumulative positive effect on fish and coral growth by providing refugia at
various distances for adult, larval and propagule dispersal and settlement.
Furthermore, hotels have the incentive, and often the resources, to lease and
maintain adjacent coastal areas, to sustain or enhance the environment for their
benefit and that of their guests.
142

5. Can Hotel Managed Marine Reserves enhance fish
stocks by deploying artificial reefs?
143

5.1 Introduction
It is widely known that the coral reef ecosystem is one of the most diverse systems
on our planet, housing vast numbers of fish species, which rely on coral reefs for
food, shelter and living space (Spalding et al. 2O01). Coral reefs are, however,
declining at an alarming rate worldwide due to natural (e.g. coral bleaching, crown-
of-thorns starfish) and anthropogenic disturbances (e.g. pollution, overfishing and
destructive fishing practices, sedimentation) (Pandolfi et al. 2003). Marine reserves
have been designated worldwide to attempt to help preserve coral reef habitats
and to enhance fish stocks, but a variety of other methods are also available to
further boost fish populations (Claudet & Pelletier 2004).
Marine structures have the potential to attract, concentrate and enhance fish
stocks, be they man-made or natural (Bohnsack & Sutherland 1985; Jensen et al.
1994). Artificial Reefs (ARs), defined as "submerged structures placed on the
seafloor deliberately, to mimic some characteristics of a natural reef" (OSPAR
Commission 1999), have been suggested as a potential fisheries enhancement
tool (Pickering & Whitmarsh 1997). The use of ARs can, however, fill a number of
roles beyond this; for example, as tools for restoration and rehabilitation of coastal
ecosystems (e.g. providing a suitable substrate for coral growth) (Clark & Edwards
1994; Pickering et al. 1998), nature conservation, aquaculture/marine ranching
(Seaman 2007) or as an attraction to dive and snorkelling tourists, who can
simultaneously be educated to understand the need for environmental
conservation, while relieving pressure on Natural Reefs (NRs) (Van Treeck &
Schuhmacher 1998).
- 1 4 4 -

In terms of increasing productivity, the deployment of artificial reefs relies on the
assumption that they provide additional critical habitat, which increases the
environmental carrying capacity and. thereby, the abundance and biomass of reef
biota (Bortone et al. 1994; Pickering & Whitmarsh 1997). The AR potentially
provides a suitable substratum for benthic fauna, and, thereby, additional food,
increasing feeding efficiency, shelter from predation and currents and a suitable
habitat for the recruitment of organisms, which would otherwise be lost from the
population (Demartini et ai. 1994; Jan et al. 2003; Lan el al. 2004; Leitao et al.
2008).
The materials used to create ARs vary across the globe. Many countries use
materials of opportunity, such as discarded tyres (Branden et al. 1994) or derelict
vessels (Jan et al. 2003), but can also deploy specially designed ARs, such as
steel reefs (Kim et al. 2008), including BIOROCk™, which uses an electrochemical
process to draw calcium carbonate from the water column (Goreau & Hilbertz
2005). Pulverized fuel ash (Lam 2003) or concrete is favoured in many countries,
including Japan and Taiwan (Pickering et al. 1998), where several thousand units
have been deployed over the decades (Jan et al. 2003; Kim et al. 2008).
The effectiveness of artificial reefs in increasing productivity depends very much on
the design of the reef structure, specifically if they can then mimic the target
species' natural habitat (Spanier 1994). Rugosity, or topographic complexity of ARs
(i.e. the presence and variety of crevices (Anderson et al. 1989), sand cavities,
hole sizes, and secondary biogenic complexity created after algae and sessile
invertebrate growth), has been shown to contribute significantly to species
- 145-

composition and biological productivity for certain species (Aseltine-Neilson et al.
1999; Ferreira et al. 2001). There is significant evidence to suggest that fish
species prefer hole sizes which are near to their body sizes (Hixon & Beets 1989;
Robertson & Sheldon 1979; Shulman 1984), suggesting that if larger commercial
species are being targeted, the hole sizes should be equally large. This was also
duly demonstrated by Hixon and Beets (1989). Similarly, a greater number of small
holes increases the capacity of the reef to provide shelter from predation for small
fish, thus decreasing recruitment and post-settlement mortality of juveniles
(Gladfelter & Johnson 1983; Hixon & Beets 1989). Many ARs have been designed
in Korea and Japan using different materials (mainly steel and concrete), offering a
range of designs to attract species. Korea has focused on a box reef style, which
was designed to meet the biological requirements of both the Korean rockfish
(Sebastes schlegeli) and madai (Pagrus major). These ARs attract more of these
species than do natural reefs (Kim et al. 2008). Japan has developed taller reefs,
which have in some cases also shown to attract a larger number of transient fish
and species, which respond to this visual stimulant and spatial reference
(Anderson et al. 1989; Rilov & Benayahu 1998, 2000).
Apart from the structure of artificial reefs, strong correlations have also been
reported between fish assemblages and the physical location of the artificial reef, in
terms of distance from the shore and depth (Brokovich et al. 2006; Jan et al. 2003),
temperature, visibility, currents and size of the reef (Jan et al. 2003; Sanders et al.
1985). In a study off the coast of southeast Florida, the influence of depth was
investigated: fish diversity, blomass and number of larger fish (>5 cm) were found
to be significantly greater at 21 m than at 7 m (Sherman et al. 1999).
- 146-

The optimal size of an AR for increasing abundance is an ongoing debate, but Jan
et al. (2003) suggest that while larger areas of reef support a higher fish biomass,
they hold fewer individuals. Ogawa et al. (1977) established a direct relationship
between production increase and reef volume up to 4000 m^ and Ambrose and
Swarbrick (1989) suggested that smaller reefs may attract more fish from a
proportionally larger area, due to the higher perimeter-to-area ratio.
ARs, as well as Marine Protected Areas (MPAs), are increasingly regarded as
valuable methods for ecosystem conservation and fish and habitat restoration and
rehabilitation (White et al. 1990). In this study, the effectiveness of variously sized,
but still relatively small, artificial reefs within the Hotel f^anaged Marine Reserve
(HMMR) of Whale Island Resort (WIR), are considered, comparing lish stocks with
natural reefs.
5.2 Study site
A detailed description of the study site can be found in Chapter 3. There are 5 ARs
in Whale Island Bay reserve (WIB), made from glazed clay pots (partially broken),
heaped into relatively round clusters at 4 m depth, which were deployed in 2003
(Figure 5.1).
147

Figure 5.1. Picture of an artificial reef {AR1), made from clay pots, with long-spine urchins {Diadema spp.) found amongst transplanted corals, and showing a school of brown demoiselle {Neopomacentrus filamentosus) and scissortail sergeants (Abudefduf sexfasciatus) in Whale Island Bay reserve (WIB), Hon Ong. Vietnam
The ARs vary in sizes, from approximately 4-15 m^, each containing pots of
different sizes and diameters (roughly 25-70 cm). AR1 (6.2 m^) is found in the
southern side of the bay, 70 m from the beach, situated next to a large boulder. A
cluster of 3 ARs (AR2: 4.2 m^ AR3: 7.5 m^ AR4: 14.9 m^) are located 80 m north
of AR1, parallel to the beach, approximately 7-10 m apart. AR5 (6.5 m^) is
adjacent to the northern coastline, 100 m from the beach (Figure 5.2).
- 148

Two Fish Aggregating Devices (FADs), made from bound-together strips of netting,
which are fastened to surface buoys and anchored to the seafloor at 9 m depth,
are located approximately 75 m from AR1 and AR5.
WBP
F A D o ;
Figure 5.2. Illustration of the locations of 5 Artificial Reefs (ARs) and 2 Fish Aggregating Devices (FADs) found in Whale Island Bay reserve (WIB), Whale Island Resort (WIR), Hon Ong, Vietnam
The ARs were all placed on a sandy substratum within 10 m of existing larger
boulders. Broken coral fragments found at a nearby snorkelling site, which is often
visited by many tourists from local Van Phong Bay tourist companies, have been
transported back to WIB and placed on the pots in the hope they would re-attach
and survive, which several have (Figure 5.1). Many juvenile branching corals of the
species Stylophora pistillata have also colonised pot surfaces.
49

5.3 Methods
Four replicate visual reef fish census surveys (English 1997) were conducted
biannually during the four research trips (October 2005 - April 2007). Surveys were
conducted using SCUBA at high tide, recording the fish species, their size and the
number of larger fish (>15 cm) from a distance of 5 m (only counting species found
within 2 m of the AR), before gradually approaching the AR to survey the small
resident and cryptic fish. Survey replicates of the natural reef (mostly rocky with
patches of coral: 7 % cover), were similarly conducted during these visits at
approximately 3-4 m depth, using a 50 m line transect (Chapter 4: Svensson et al.
2009). All species were recorded to species level, but to standardise with the
surveys conducted on the natural reefs, cardinalfish (Apogonidae), and the bottom-
dwelling species such as the gobies (Gobiidae^, blennies (Blenniidae) and
lizardfish (Synodontidae), were excluded (Chapter 4, Appendix 2).
To allow comparison of fish stocks between the ARs and the NRs, only fish found
within 2 m of the line transect were included and results from the two reef types
were standardised for area. Species richness, average size of fish and number of
fish >15 cm were analyzed using a 2-way analysis of variance (ANOVA) model
with reef type and time as factors. ANOVA assumptions were checked using
Cochran's test and transformed where necessary. All ANOVA analyses were
undertaken using GMAV5 for Windows. A proxy of biomass was attained by
multiplying the average size of fish by abundance for each reef type. To explore
differences in fish assemblage composition between times and reef types, a non-
metric Multidimensional Scaling Ordination (MDS) was performed using PRIMER5
- 150-

software on a similarity matrix (Bray-Curtis similarity index) calculated from fourth
square-root transformed species abundance data (Clarke & Gorley 2001).
Significance tests for differences between reef types and time were performed
using Analysis of Similarities (ANOSIM) and the fish families contributing most to
dissimilarities were determined by the similarities percentage procedure SIMPER
(Clarke 1993). Regression analysis was performed to test for any relationship
between surveyed parameters and AR area. The data for abundance of fish and
the number of fish >15 cm were found to be significantly non-normal (Cochran's
test), so these data were log-transformed to fulfil regression assumptions.
5.4 Results
A total of 20,630 fish was recorded over the 4 survey periods (October 2005 - April
2007) at the 5 ARs (71 %) and 5 NRs (29 %), which comprised 138 species,
belonging to 28 families. The majority of families (96 %) and most species (88 %)
were found on the NRs, while only 85 species (23 families) were present at the
ARs. A few species were only found on the ARs (12), across 9 families, but these
were in relatively low abundances, accounting for 0.52 % of the population.
Significant differences between individual ARs were found for average size,
species richness and number of fish >15 cm (ANOVA All Df = 4, p<0.05) over the
four survey periods, but with no obvious consistent pattern. A significant positive
trend in species richness, abundance and number of fish >15 cm was, however.
151

found with increasing size of the AR (Regression analysis: All Df = 2, p<0.001
p<0.05, p<0.001), but not for average fish size (Figure 5.3).
45 H
40
35
30
g-25 o
5 20
I 15
10
5
0
5.50
5.00
4.50
^4 .00
3 3.50
I 3.00
^2 .50
2.00
,.50 >
1.00
Species richness
I' •
10 12
Number of fish > 15 cm (Log)
4 •
I I r-8 10 12
AR Area
1G
Abundance (Log)
16
6.5
6 A
i 5.5 -k o
4.5
I
V
16
14 -I
_ 12
6
4
2
8 10 12
Average size of fish
4 •
I I r-
8 10 12 ARArea
16
18
Figure 5.3. A trend analysis of fish stocks for five artificial reefs (ARs) with varying sizes at Whale Island Bay. Hon Ong, Vietnam
Fish assemblage composition also varied significantly between ARs (ANOSIM R
Global = 0,387, P<0.001). The three central ARs (2-4) exhibited no significant
differences however, as opposed to fish assemblages found on AR1 & 5 compared
with AR2-4 and between AR1 and ARS (R = 0.438 - 0.823, p<0.05). A comparison
of AR fish assemblages are displayed in Figure 5.4.
- 152-

Stress: 0.12
o
•
Figure 5.4. A Multidimensional Scaling Ordination (MDS) showing the similarities in fish assemblages between 5 artificial reefs (AR1: circle, AR2: diamond, AR3: pyramid, AR4: square, ARS: oval) and 4 time periods (October 2005 - April 2007: white to black shading) at Whale Island Bay, Hon Ong, Vietnam
When data are standardised for area, species richness, density and number of
fish >15 cm were significantly higher on ARs than NRs, while the average size of
fish was not significantly different (Table 5.1, Figure 5.5). Only the number of
fish >15 cm showed significant change over time.
53
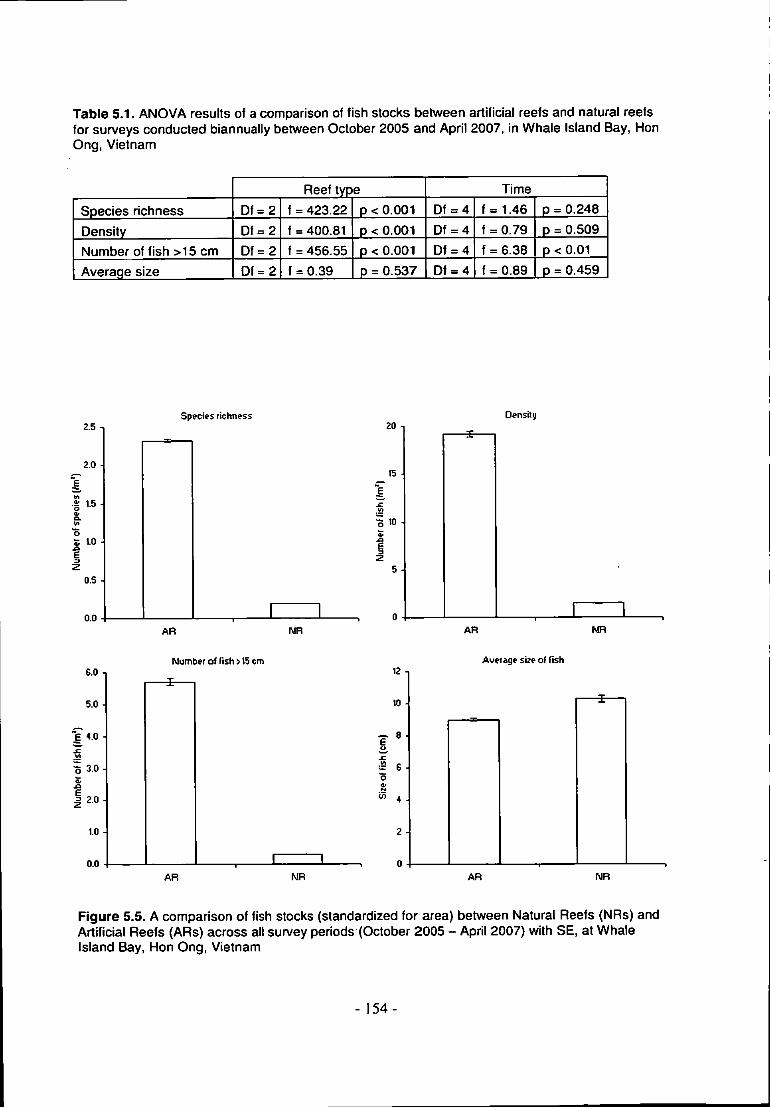
Table 5.1. ANOVA results of a comparison of fish stocks between artificial reefs and natural reefs for surveys conducted biannually between October 2005 and April 2007, in Whale Island Bay, Hon Ong, Vietnam
Reef type Time
Species richness Df = 2 f = 423.22 p < 0.001 Df = 4 f = 1.46 p = 0.248
Density Df = 2 f = 400.81 p < 0.001 Df = 4 f = 0.79 p = 0.509
Number of fish >15 cm Df = 2 f = 456.55 p < 0.001 Df = 4 f = 6.38 p < 0.01
Average size Df=2 f = 0.39 p = 0.537 Df = 4 f = 0.89 p = 0.459
2.5
2.0
I .§ 1.5
o
5 t.0
0.5 0.0
Species richness Density
$.0
5.0
I 4.0
••^
0 3.0
1 2.0
1.0
0.0
AR NR
Number of fish > 15 cm
20
15-̂
AR NR
Average size of fish
AR NR AR NR
Figure 5.5. A comparison of fish stocks (standardized for area) between Natural Reefs (NRs) and Artificial Reefs (ARs) across all sun/ey periods (October 2005 - April 2007) with S E . at Whale Island Bay, Hon Ong, Vietnam
154-

A complete summary of fish stocks for each reef type over time can be found in
Table 5.2, which again highlights the consistently higher values for AR compared
with NRs for species richness, density and the number of fish >15 cm.
Table 5.2. Fish stocks (standardized for area) found at Artificial Reefs (ARs) and Natural Reefs (NRs) over 4 survey visits at Whale Island Bay, Hon Ong, Vietnam
Reef type Spp. richness SE Density SE
No. fish >15 cm
SE Ave. size of fish SE
AR Oct. 05 2.46 0.11 18.81 0.99 5.32 0.61 9.29 0.24 NR Oct. 05 0.18 0.01 0.88 0.11 0.20 0.04 11.93 1.26 AR Apr. 06 2.59 0.07 20.48 1.31 7.67 0.76 10.23 0.48 NR Apr. 06 0.22 0.02 1.56 0.18 0.25 0.04 10.79 0.84 AR Oct. 06 2.16 0.09 15.55 0.57 3.45 0.39 8.37 0.32 NR Oct. 06 0.23 0.01 2.23 0.23 0.40 0.07 10.08 0.75 AR Apr. 07 2.10 0.07 21.96 0.99 6.38 0.33 8.01 0.24 NR Apr. 07 0.14 0.01 1.35 0.05 0.36 0.04 8.33 0.32
ANOSIM analysis revealed significant differences in fish assemblages between the
two reef types (Global R = 0.739, Global P <0.001) as well as between survey
periods (Global R = 0.256, Global P <0.001), a difference only detectable for
fish >15cm in univariate analyses. The damselfish Neopomacentrus filamentosus
contributed most to the dissimilarity between reef types (Table 5.3), and
pomacentrids, as a family, accounted for over 25.4 % of the dissimilarities. The
average dissimilarity between the natural and artificial reefs was 75.2 %.
- 155-

Table 5.3. SIMPER analysis (fourth root transformed) of fish contributing most (75 % cut off) to the dissimilarity between reef types: Natural Reefs (NRs) and Artificial Reefs (ARs) (Diss/SD, dissimilarity/standard deviation. Cum.%. Cumulative % contribution, *, Pomacentridae) at Whale Island Bay, Hon Ong. Vietnam
Species Ave. abundances Diss/SD Cum.7o Species AR NR
Diss/SD Cum.7o
Neopomacentrus filamentosus * 51.51 0.47 2.92 6.86 Abudefduf sexfasciatus * 8.08 0.04 2.44 11.60 Scolopsis ciliatus 11.22 0.14 2.90 16.07 Scolopsis margaritifer 4.19 0.04 2.75 19.08 Abudefduf vaigiensis * 2.52 0.01 1.77 23.19 Halictioeres chloropterus 3.50 0.07 2.54 26.43 Pomacentrus simsiang * 3.77 0.06 1.51 29.57 Pomacentrus cuneatus * 2.44 0.04 1.60 32.69 Chioerodon anctiorago 1.12 0.00 3.10 35.70 Cephialopholis boenak 0.90 0.01 3.52 38.35 Ctiaetodon auriga 0.78 0.01 2.60 40.68 Caesio teres 1.71 0.04 1.01 42.80 Pomacentrus proteus * 1.08 0.05 1.69 44.92 Scolopsis affinis 0.40 0.00 1.46 46.98 Abudefduf bengalensis * 0.35 0.00 1.67 48.99 Cheilinus chlorourus 0.44 0.01 1.75 50.95
The differences in fish assemblages between reefs can be visualised from the
MDS (Figure 5.6). This displays a tight cluster for AR fish assemblages (circles),
with a separate, more loosely clustered, group for NRs (squares). There are three
significant NR outliers from the first survey period (white) and second period (light
grey), which differ in fish assemblages compared with the other surveys (same
time period). This seems to be explained by low average abundances of the
damselfish Neopomacentrus filamentosus and Abudefduf sexfasciatus. or a high
average of the fusilier, Caesio teres, perhaps reflecting temporal population
variability (Appendix 2).
156

Stress: 0,14,
n
i I
• n
•
n
Figure 5.6. A Multidimensional Scaling Ordination (MDS) showing the similarities in fish assemblages (fourth root transformed) between artificial reefs (circles) and natural reefs (squares) for surveys conducted biannually between October 2005 and April 2007 (white to black shading) at Whale Island Bay, Hon Ong, Vietnam
157

5.5 Discussion
The results suggest higher fish densities, species richness and number of fish >15
cm on the ARs within WIB, compared with adjacent area-equivalent NRs (Tables
5.1. 5.2, Figure 5.5) and overall 11.15 times greater biomass. Similar examples of
higher productivity on ARs have been recorded elsewhere. ARs deployed in the
Virgin Islands were found to have 11 times greater biomass compared with NRs
and biomass on an AR off the Marquesas Islands, French Polynesia, showed 8
times higher biomass than that of a nearby NR (Dean 1983). The average size of
fish, conversely, was larger on NRs, which could be explained by the higher
density of small fish on the ARs (Figure 5.5). There were for example, 67.1 times
more pomacentrids found on the ARs than on NRs, the vast majority on both reef
types being the brown demoiselle (Neopomacentrus filamentosus) (47.4 % and
31.4 %) . The scissortail sergeant (Abudefduf sexfasciatus) and the whitestreak
monocle bream (Scolopsis ciliatus) were also found in higher abundances on the
ARs (206.6 and 72.3 times higher). These species contributed most to the
dissimilarities between the reef types (Table 5.3).
The very high density of damselfish on the ARs may be explained by the isolation
of the ARs from other suitable habitats, compounded by the rugosity created by the
clay pots. The partly smashed pots create a greater number of holes than the rocky
reef with its superposition of boulders, offering more refugia from predation and
physical stress for these small, territorial, low-trophic level fish species (Allen et al.
2003; Ferreira et al. 2001). The broken coral reef fragments also add to the
complexity and attractiveness of the habitat, even though many of these do not
- 158-

survive very long. Although coral cover was not estimated, because dead, algae-
infested coral are often replaced with newly-found broken live fragments, it was
apparent that the average coral cover on ARs (dead or alive, Figure 5.1) is higher
than the average 7 % coral cover found on NRs (Chapter 4). A nesting substratum
on the ARs is also present for these species, which spawn demersal eggs; it is
seldom observed that these species migrate once they have settled (Jan et al.
2003; Jan & Ormond 1992). The ARs are however relatively small so, while they
attract very high numbers of fish locally, fish assemblages on NRs are much
greater overall due to their much larger area.
It has been suggested that ARs, when in close proximity to the shore, may become
an extension of the existing habitat, providing potential benefits for fish recruitment
(Danner et al. 1994). This is certainly the case for AR5, which is situated adjacent
to the natural reef (Figure 5.2). None of the other reefs is, however, very far from
the coastline and all are adjacent to one or a few large boulders, which often have
small patches of smaller, layered rocks, increasing complexity and providing a
suitable habitat for small fish. ARs placed near NRs have been found to first attract
fish from their original habitat but, similar to results from this study, the fish
assemblages changed and developed a structure of their own (Dean 1983).
Furthermore, ARs deployed 25 m from an existing coral reef have also been shown
to have the potential to increase recruitment without reducing the population size of
the reef (Stone et al. 1979).
The size of the AR seems to play a significant role in recruiting fish. The larger the
area of the AR, the higher the abundance, species richness and number of
- 159-

fish >15 cm (Figure 5.3), although there is considerable variance around these
trends. These results confirm that of other authors (Ambrose & Swarbrick 1989;
Jan et al. 2003; Ogawa et al. 1977). A range of optimal sizes has been proposed
for fishery enhancement, including suggestions from 400 m^ as a minimum
effective size, to 2000-5700 m^ to ensure peak fish harvests (Bohnsack &
Sutherland 1985; Sato 1985). Jan et al. (2003), on the other hand, calculated the
most effective AR size for resident fish to 4-10 reef units (2 m^ hollow concrete
cubes), which is closer to the size of the largest AR in WIB. To include transient
fish, however, 15 units were recommended. So, although relatively small reef sizes
have been suggested to be more effective at increasing biomass, the smallest
sizes are still larger than the ARs at the HMMR in WIB. These reefs in WIB were,
however, not designed specifically to enhance fisheries, but to add substrate for
coral re-attachment and growth and provide visual stimulus, thereby attracting
snorkellers and relieving pressure from NRs. The number of commercially
important fish species (Serranidae, Lutjanidae, Lethrinidae and Siganidae) are
consequently low (460 specimens found across all AR and time periods,
representing 3 % of the population).
To increase the number of commercially valuable larger fish, another design would
be required: constructing ARs with a greater surface area, while still supporting a
high level of complexity. These would need to include a great number of larger
holes to accommodate larger species and which have to be deployed at greater
depths (at least 20 m) (Rilov & Benayahu 2000; Robertson & Sheldon 1979;
Sherman et al. 1999; Shulman 1984). The larger WIB reefs do support larger fish
assemblages, though, again, mainly due to increased abundances of
- 160-

Neopomacentrus filamentosus, Abudefduf sexfasciatus, Abudefduf vaigiensis and
Scolopsis ciliatus (Appendix 2).
The fish assemblages varied between the different artificial reefs. AR1 for example,
attracted comparatively more fusiliers, possibly drawn to the AR by the 75 m
distant FAD (Figure 5.2). This FAD has on occasion been found to attract larger
schools of fish e.g. fusiliers (Caesionidae), jack's (Carangidae) and emperors
(Lethrinidae) while, during the first two survey periods, schools of barracuda
(Sphyraenidae) (Appendix 2), were found on the northern FAD, but these were not
attracted by AR5. The three central ARs (2-4), on the other hand, exhibit no
significant differences in fish assemblages (Figures 5.2, 5.4), These centrally
located, closely clustered ARs therefore appear to be working as one unit. This
potentially increases the total area of AR, but still does not increase the number of
larger species of interest to fisheries. Therefore, the size of the reef does not seem
to be the sole limiting factor (if the aim of ARs is as a fisheries enhancement tool),
but rather the design, and perhaps the physical location.
The HMMR's artificial reefs seem to contribute significantly to increasing local fish
populations within WIB. They are perhaps not enhancing fisheries (although 97 %
of fishermen did suggest spillover from the reserve; Chapter 6), but they are
providing habitats for thousands of fish, providing a substratum for coral growth,
and increasing the total productivity of the area, while visually enhancing the
otherwise largely featureless sandy seascape. These attract snorkelling tourists,
who subsequently ask questions about the hotel's AR project, adding to
conservation awareness building and insight into the need for marine resource
- 161 -

restoration and protection. Svensson et al. (2008) for instance, showed that
environmentally conscious tourists are significantly more inclined to pay extra to
stay at HMMRs (Chapter 7). SCUBA beginners can also be trained in this bay and
around the ARs. which, while providing visual stimulus, relieves pressure from
natural reefs.
1 6 2 -

6. The perceptions of local fishermen towards a Hotel Managed
Marine Reserve in Vietnam
Contents of this chapter were used to write:
Svensson, P., L. D. Rodwell, and M. J. Attrill. 2010. The perceptions of local
fishermen towards a hotel managed marine reserve in Vietnam. Ocean &
Coastal Management 53:114-122
- 1 6 3 -

6.1 Introduction
Marine Protected Areas (MPAs) have been receiving increasing attention over the
last decades, as an effective management strategy for conservation and fisheries
management (Bohnsack 1998; Roberts et al. 2005; Russ et al. 2003). They have
the ability to significantly increase species richness, biomass and density of fish
relatively quickly (1-3 years), independent of their size (Chapter 4; Halpern &
Warner 2002), and protect coral reef ecosystems from over-exploitation (Boersma
& Parrish 1999), if sufficiently funded and effectively managed (Davis & Tisdell
1996). From a fisheries point of view, it is suggested that MPAs can protect a
greater spawning stock and sedentary species, allowing fish to grow larger and live
longer, greatly enhancing their fecundity. This increased fecundity can in turn
provide new recruits to outside fishing areas and increase the density gradient of
adult species from the reserve, allowing spillover to adjacent fishing grounds
(Hilborn et al. 2004; Russ & Alcala 1996; Russ et al. 2004).
For local fishermen to benefit from the spillover of MPAs, the size and spacing of
MPAs have to be carefully designed and there needs to be compliance with the no-
fishing rule. Several studies of tropical fish species provide evidence of relatively
short larval dispersal distances, indicating that reserves can be relatively small but
should have neighbouring reserves relatively close by, to allow for protected
resettlement (Jones et al. 2005; Jones 2005; Kritzer 2004). Small reserves are,
however, more vulnerable to poaching, so, in order for MPAs to effectively protect
the coastal ecosystem and benefit fisheries, committed cooperation and support
from local populations is essential (Kritzer 2004; Wells & McShane 2004).
- 1 6 4 -

In order to gain commitment and to prevent non-compliance from the local
communities, the best method is to provide intensive education programs and
involve local fishermen already at the planning stages of the MPA, to ensure that
their inherent cultural precepts and socioeconomic needs are considered carefully.
This will give them decision power, which will help convince them that reserve
objectives are not only developed for conservation purposes, but also for long-term
fishermen benefits (Aswani et aL 2007; White & Vogt 2000). This is not to say that
patrolling and enforcement of reserve boundaries are not necessary. If the reserve
is successful at significantly increasing abundance, this will provide strong
incentives for poachers (Sethi & Hilborn 2008). Many poaching incidences may,
however, not be of criminal intent, but rather a misconception of where the
boundary lies (McClanahan 1999), but for regular misdemeanours, it is necessary
that the punishment for poaching outweighs the possible gains brought on by the
fishing activity (Beddington et al. 2007).
Community-based MPAs are, therefore, widely considered the most effective reef
management strategy in the tropics (White & Vogt 2000). Indigenous knowledge of
ecological processes can help identify interconnectivity between habitats and find
potential reserve sites that incorporate biodiversity and include the presence of
vulnerable and exploitable species (Roberts et al. 2003) - these potential sites
would be discussed and a balance is found which would benefit the environment
and local stakeholders. Other parties involved in community-based MPAs may
include the local government, Non-Government Organisations (NGOs) and the
private sector. In these situations, the private sector, often represented by diving
1 6 5 -

operations or hotels and resorts, are meant to supply funding and bring business to
the area (Kiss 2004).
There has been an increase in the reported cases of hotels, in particular resorts
offering diving holidays, which have taken the initiative to establish marine reserves
with varying degrees of participation from other stakeholders (Chapter 8; Svensson
et al. 2008; Svensson et al. 2009). Similar to privately managed parks on land,
many of the privately managed MPAs, termed Hotel Managed Marine Reserves
(HMMRs), have been established because of the government's inability to satisfy
the public's and ecotourists' demands for nature conservation in both quantity and
quality (only 14 % effectively managed in a review of 285 MPAs in Southeast Asia)
(Burke et al. 2002), in addition to creating a potentially profitable market niche for
their business (Gossling et al. 2006; Langholz & Lassoie 2001; Svensson et al.
2008; Svensson et al. 2009). In these cases, HMMRs generally pay a lease or tax
to the owning authority and close the area to fishing, generally by buoy markers.
For example, the owner of Wakatobi Dive Resort, South-eastern Sulawesi,
Indonesia, pays a leasing fee to the chiefs of affected communities for a strip of
coastline covering 200 ha, designated a no-take sanctuary, as well as a 500 ha
adjacent area reserved for traditional fishing practices. Representatives of the
communities patrol the reserve with boats sponsored by the resort and ensure
compliance with agreed extractive bans. If no poaching takes place, the full amount
of the agreed lease is paid out and the money is used to develop local
infrastructure and build schools and other public buildings, in addition to providing
for fishermen whose fishing grounds have been lost (Wakatobi Dive Resort 2008;
Lorenz Maeder, resort owner, pers. comm.).
- 1 6 6 -

In this chapter, the perceptions of local fishermen living adjacent to an HMMR in
Vietnam have been obtained and assessed. These are the people most affected by
established marine reserves. Their perceptions are therefore extremely important
to gauge the effectiveness of the protection in meeting its ecological, economic and
social objectives.
6.2 Study site and community surveys
A detailed description of the study site can be found in Chapter 3. Figure 6.1
illustrates the location of the fishing village, where the fishermen perceptions
surveys were conducted (Dam Mon), as well as other nearby villages of Whale
Island Resort (WIR) and its 11 and 5 ha reserves (Whale Island Bay: WIB & Whale
Island Bay Peninsula: WIBP) in Lach Cua Be channel.
67

South China Sea
Dam Mdn Peninsula
J" •am Mfin
Whale Island
BAi Tranh \ ^
Son Dung
van Phong Bay
10km
khai Luong
Figure 6.1. Illustration of Whale Island {Hon Ong) showing: Whale Island Resort, Dam Mon and the nearby fishing villages in Lach Cua Be Channel formed by Dam Mon Peninsula and Hon Lon Island, in Van Phong Bay. Khanh Hoa Province, Vietnam
Two sets of qualitative and quantitative, open and close-ended anonymous
questionnaires were completed by the fishermen of Dam Mon in October 2006 and
April 2007. In October 2006, 40 questionnaires (translated into Vietnamese) were
given to the Chairman of the People's Committee to distribute to the local
fishermen. When these questionnaires were returned, it was evident that several
sets had been completed in unison with the fannily, providing near duplicate results.
A relatively one-sided positive viewpoint pertaining to the benefit of increasing the
local number of protected areas was also apparent. A follow-up, identical,
interview-based survey was, therefore, conducted with the aid of two local marine
biologists from the Institute of Oceanography in Nha Trang, who acted as
translators. The idea was to check the authenticity of the results from the first
- 1 6 8 -

survey and to examine data from a different angle to improve the legitimacy of the
outcomes of the investigation. The interviews were conducted with another set of
fishermen in April 2007, but singling out individuals in the village was near
impossible, so instead, 10 random fishing families were interviewed at their homes
while they were repairing their nets. 40-50 individuals were involved in this survey.
Complication with singling out individuals is not surprising, considering the
traditional Vietnamese social structure, which can be broadly characterised by a
closely knitted patriarchal extended family system, where family unity is extremely
important (Adger et al. 2001).
Only fishermen from Dam Mon were surveyed since their village is one of the
closest to WIR (1 NM), would be most affected by loss of fishing grounds and
would therefore be able to give the most accurate interpretation of the ecology and
management of the reserves. Fishermen from the other nearby fishing village (Son
Dung; Figure 6.1) predominantly fish within the Lach Cua Be channel, which is why
these fishermen were not surveyed. Overall, the opinions of approximately 5 % of
the fishing village (approx. 2000 people) were represented.
In these semi-structured surveys, fishermen were requested to complete a
demographics section detailing their age, sex and average yearly income; give
their opinion of whether they consider the amount of fish to have increased,
decreased, or stayed approximately the same in the last 10 years; identify the top 5
reasons why the think fish stocks have decreased, if so specified (11 options were
suggested, others could be transcribed); state whether they think the coral reefs
and fish need protection, while given the opportunity to suggest how; state which
- 1 6 9 -

fishing techniques they use (11 methods suggested) and which species they target.
They were then asked to explain why they think WIR had closed off the bay with
buoys and to state whether WIR had had an overall positive, negative or
inconsequential impact on their lives. Subsequently, they were asked whether the
enclosures had had an impact on their lives financially (responding on a 5-point
likert scale from 1 '>20 % increase/year' to 5 '.>20 % decrease/year'). Next, they
were requested to comment on potential fishing gains incurred from the protection,
by stating whether they consider the number of fish, size and diversity of fish to be
from, 1 'much higher/bigger to 5 'much lower/small, to within 200 m of the reserve
boundary, and to specify if an increase in a particular species had been noticed.
The final set of questions enquired whether they themselves, or relatives, ever fish
in the reserves (3-point likert scale from 1 'Yes, often' to 3 'No, never') and, if so,
why they fish there; how the number and diversity of fish, number of invertebrates
and coral cover in the reserves compare to unprotected areas (responding on a 5-
point likert scale from 1 'much higher' to 5 'much lower'), and if they think it would
be a 'good idea' or 'bad idea' if the hotel or government were to close off more
coastal areas around Whale Island.
Since two different survey techniques were used, each with a small sample size,
and comprising some near duplicate results, detailed statistical analysis was not
possible. Instead, qualitative and descriptive analysis is provided, which give some
indication of reserve effectiveness and management performance. These data are,
however, exceptionally valuable in providing an insight into local communities'
attitudes to MPAs and, in particular, to HMMRs, as such information is rare, or the
first of its kind.
- 1 7 0 -

6.3 Results
The 40 respondents of the first survey represented a balanced mix of genders
aged >18 to <65, the majority ranging from 18 to 35 (Table 6.1). The average
fisherman's income totalled VND 9,990,000 per year, or approximately US$ 640
(Apr. 2007 exchange rate: US$ 1 = VND 15,600). Most of the lowest income
earners were the older generations >55 and the one boy under 18, earning <VND
5 million per annum. The lowest income recorded was VND 2.5 million
(US$ 160/year). The highest earners (max VND 60 million, or US$ 3846 per
annum) were between 18 and 25, who target tuna in deeper waters outside the
channel. The large group of middle-ranged income earners use a wide range of
fishing techniques from hose and hook fishing and trap fishing to trawling. They
target shrimps and little lobsters for use in aquaculture, anchovy, squid and
Carangidae spp. inside and outside the channel, or indiscriminately any kind of fish,
often through cast-net fishing or beach seining (Figure 6.2).
71

Table 6.1. Breakdown of Dam Mon fishermen's responses to the first questionnaire distributed by the Chairman of the People's Committee (%) and second inten/iew-based questionnaire, expressed in number of families
Fishemien No. Fishemien No. (%) families (%) families
Sex (n=40) Number of fish within 200m? {n=30) Female 52.5 Much Higher 40.0 1 Male 47.5 Higher 60.0
No change 1 Age (n=37)
<18 2.7 Size of fish within 200m? (n=30) 18-25 27.0 Much Bigger 46.7 26-35 29.7 Bigger 46.7 36-45 18.9 No Change 4.7 1 46-55 10.8 56-65 5.4 Spp. richness within 200m? (n=29) >65 5.4 Much Higher 24.1
Higher 75.9 Yearly Income (n=35) No change 1
s5,000.000 19.0 2 >5,000,000 S7.500,000 26.2 1 Increase in spp. within 200m? (n=30) >7,500,000 SI 0.000.000 16.7 2 Coral reef fish 70.0 >10,000.000 £15,000,000 14.3 1 Mugilidae 36.7 >15.000,000 7.1 1 Serranidae 30.0
Nemipteridae 23.3 No. fish in last decade? (n=40) Carangidae 16.7
Decreased 95.0 9 Squid or Anchovy 13.3 No Change 5.0 1 Invertebrates 6.7
Do corals need protection? (n=40) Fish Inside bay? {n=36) Yes 100.0 6 No, never 97.8 10 No 3 Yes, sometimes 2.2
Why WIR enclosed bay? (n=38) Been inside buoys? (n=40) Protect ecosystem 94.7 4 Yes 67.5 Prevent fishing. Increase No 32.5 10 fish species 86.8 2 Attract tourists 29.0 7 Species richness in HMMR? (n=20)
Much higher 25.0 WIR changed life? (n=39) Higher 75.0
No change 61.5 Overall positive 38.5 1 Number of fish in HMMR? (n=26) Overall negative 9 Much higher 15.4
Higher 84.6 Yearly income changed? (n=39)
No change 53.9 Number of Invertebrates in >20% Increase 35.9 HMMR? (n=25) >10% Increase 5.1 Much Higher 12.0 >20% Decrease 5.1 8 Higher 88.0 >10% Decrease 1
Coral cover in HMMR? (n=25) Fish within 20Qm? (n=40) Much Higher 12.0
Yes 80.0 2 Higher 88.0 No 20.0
Make more MPAs? (n=37) Good Idea 100.0 2 Bad Idea 8
1 7 2 -

Fishing techniques (n=3l) Target species (n=33)
Cast-net fishing
Gill net fishing
Bright light fishing
Trawling
Line fishing
Beach seining
Hose and hook fishing
Trap fishing
0 2 4 6 8 10 12 14 16 18 No. fishermen
Tuna
Non-selective fish
Squid
Anchovy
Carangidae spp.
Invertebrates
aher
0 2 4 6 8 10 12 14 16 18 No. fishermen
Figure 6.2. The fishing techniques and target spec ies of Dam Mon fishermen
The vast majority (95 %) had noticed a decrease in the number of fish in the ocean
in the last decade, the main reason being attributed to better fishing techniques.
Blast fishing was accredited a close second, and overfishing, third place (Figure
6.3). These findings coincide with the resort owners' conclusions as to why fish and
coral populations had declined, and why they decided to protect their adjacent
coastline.
All fishermen suggested coral reef ecosystems should be protected, specifically to
protect from blast fishing and to increase the standing stock. They thought that
protected zones should be strictly enforced and the local communities educated to
understand the value of MPAs (Figure 6.3). When asked why they thought WIR
had enclosed the bays with buoys, all but two mentioned marine protection; instead
these indicated that It was only to attract tourists. In fact, 29 % of all fishermen from
the first survey also suspected the reason was to attract more tourists (Table 6.1).
- 1 7 3 -

Cause of decreasing fish populations (n=40) VMiy coral reefs need protedton (n=38)
Better fishing techniques
Blast fishing
Overfishing
Oil pollution from boats
Sewage outflow
Cyanide fishing
Boat anchor damage
Rubbish dumping
Using corals for building
0 5
Why WIR enctosed bay (n=38)
I I 1 1 1 »
10 15 20 25 30 35
Protect coral reef
ecosystem
Prevent fishing,
increase fish species
Attract tourists
0 5 10 15 20 25 30 35 40
Increase in species within 200 m or the reserves (n=30)
Coral reef fish
Mugilidae
Serranidae
Nemipteridae
Carangidae
Squid or Anchovy
Invertebrates
10 15 No. fishermen
20 25
Protect coral reef ecosystem
Strict enforcement
Educate people
Increase fish production
Protect from blast fishing
— 1 1 1 — I 1 1 1 1
0 5 10 15 20 25 30 35 40
Has WIR changed fishermen's yearly income (n=11)
Secure local jobs
Increased resources to government and people
Helped develop other service industries
Participation in protection
Have to go further for fishing
8
What can WIR or the government do to increase compliance (n=34)
Advertise it more
Educate about MPAs
Strict enforcement
Government Involvement
Show reserve results
10 15 20 No. fishermen
Figure 6.3. Dam Mon fishermen's opinions on the cause of decreasing fish populations (a.), why coral reefs need protection (b.), why Whale Island Resort (WIR) enclosed the bay (c) . reasons for a change in yearly income brought on by the establishment of the HMMRs (d.), their perceptions of the fish species attributing to spillover (<200 m) (e.) and suggestions what WIR and/or government could do to increase compliance (f.)
10
25
174

The responses from the fishermen showed an overall positive attitude towards WIR,
with 41 % boasting an increase in their yearly income (Table 6.1). Those giving a
reason for this suggested that they had secure jobs or could develop other projects
related to tourism since the protection (Figure 6.3). These fishermen are included
in the 80 % who fish within 200 m of the reserve and who have noticed an increase
in the number, size and species richness of fish within this area, regardless of their
fishing techniques. While the majority suggested that coral reef fish in general had
increased within 200 m of the reserve, several fishermen also declared an increase
in commercially valuable groups of large food fishes, e.g. Serranidae and
Carangidae (Table 6.1).
Two fishermen declared a decrease in their yearly income, one of whom admitted
to sometimes fishing inside the reserve (the only one to do so), but did not
comment on which fishing techniques he uses or the state of the reserve compared
with unprotected areas. The second fisherman thought that the size of fish and the
species richness was greater within 200 m of the reserve, but explained that the
fishermen now have to go further for fishing and expenses are increasing (Figure
6.3).
Although only one fisherman admitted to fishing inside the reserves, 68 % had an
opinion on the number of fish and invertebrates, coral cover and species richness
within the reserves compared with unprotected areas. All fishermen who
commented on these attributes rated reserve species as being higher or much
higher (Table 6.1). The fishermen were asked what could be done to improve
compliance. Their suggestions varied from education and advertising the reserve,
- 1 7 5 -

by announcements and showing reserve results, to stricter enforcements and more
government involvement (Figure 6.3). All but three, who did not offer an opinion,
thought that more reserves around the island would be better (Table 6.1); eight
respondents even suggested protecting a coastal area fringing the whole island.
Interestingly, the two who indicated a decrease in yearly salary also recommended
more protection.
These eight respondents, however, belong to one of two larger sets of fishermen
surveys, whose results were mostly identical, minus the demographics section,
suggesting they could have completed the questionnaires in unison with the whole
family. These eight have at least one boat large enough to go outside the channel
to fish for tuna. Seven of them indicated that their income had increased by >20 %
because of the reserve, six of them suggesting it was because they had secure
jobs. They all thought that coral reef fish abundances had increased within 200 m
of the reserve and considered the reserve biota to be higher than unprotected
areas, understanding the value of the protected zone. The other group of 7 with
similar results, all replied identically to the question: what could the hotel or
government do to increase compliance. All suggested more government
involvement and for the hotel to announce reserve achievements. They fish for
squid, anchovy and little lobsters and consider the reserve to be effectively
increasing fish assemblages in and within 200 m of the reserves. Six of them
thought it would be a good idea to increase the number of reserves around Whale
Island and one had noticed a financial increase.
- 1 7 6

The responses of the interviewed famil ies of f ishermen dif fered great ly from those
of the other f ishermen. Their average yearly income, calculated f rom the total
amount earned by the f ishermen of the family, divided by the number of family
f ishermen, equal led VND 7,400,000 or US$ 470 (73.4 % of the average income
from the first survey). Most of these f ishermen had noticed a decl ine in the number
of fish, attributed to better f ishing techniques and overf ishing, but on ly 6 famil ies
thought that the coral reef ecosystem needed protection (Table 6.1). These
f ishermen, living on the outskirts of Dam Mon, fish with bright lights targeting
anchovy (6 famil ies) and squid (4 famil ies), and 8 famil ies also fish b y beach
seining, which is non-selective.
Six families concluded that WIR had erected the f ishing boundar ies to protect the
coral reef ecosystem or to increase fish stocks, but seven famil ies f igured it was
also or only to attract tourists. Only one family thought the efforts of WIR had had a
positive impact on them, and all who commented , stated a financial loss since the
reserves were establ ished (Table 6.1). They impl ied that they had t o go further for
f ishing, which cuts into their profit margin.
Only 2 famil ies fish within 200 m of the reserves, one reporting an increase In
stocks; the other had not noticed any significant changes since the protect ion. Al l ,
however, clearly indicated that they do not fish inside the reserve because they are
afraid of potential repercussions in the form of f ines or gear/vessel conf iscat ions.
Several of these f ishermen had bitter feel ings towards the owners a n d the reserves
and one f isherman thought that the owners had only restricted f ishing in order to be
177

able to catch f ish for themselves and guests. On ly 2 famil ies thought that more
protected areas around Whale Island would be a good idea (Table 6.1).
6.4 D i s c u s s i o n
It has been the strategy of some governments t o relocate whole communi t ies
fo l lowing the establ ishment of an MPA, to reduce pressure on resources and to
increase income potential (Wells & McShane 2004) . Many countr ies do not have
the capital or resources for such act ions, however , and the ethical justi f ication is
quest ionable. Communi ty managed MPAs, where local communi t ies can have a
vo ice in reserve location and object ives, is in th is sense fairer. W h e n establ ished
hotels wish to enclose an area for the sake of conservat ion, and possibly to attract
more tourists, the location is already general ly dec ided: adjacent to the hotel .
Therefore , communi ty involvement and acquiescence is extremely important,
especial ly when foreign ownership is concerned (Langholz & Lassoie 2001) .
The owners of WIR asked the local staff to confer wi th their famil ies, and feedback
to them if they would have any objections for t h e bay adjacent to the hotel to be
enc losed , and f ishing to be prohibited. Whi le al l the respondents f rom the first
survey and 6 f ishing families f rom the second sun/ey now agree that coral reefs
need protect ion, and 100 % from the first survey and 2 famil ies f rom the second,
wou ld we lcome more protected areas around Wha le Island (Table 6.1), it took a
few years upon establ ishment of the HMMR to increase compl iance to the no-
f ishing rule to a level of perceived acceptable loss, where only occasional ly, hook
- 1 7 8 -

and line f ishermen using bamboo basket boats, did not comply (Michel Galey,
resort owner, pers. comm.) . 42 % of the f ishermen from the first survey suggested
that educat ion programs should be establ ished to make people better understand
the value of marine reserves (Figure 6.3).
Although 95 % of f ishermen from the first survey thought that WIR had establ ished
the reserves to protect the coral reef ecosystem or increase fish stocks, only 6
families f rom the second survey believed this, and 4 famil ies thought it was purely
for tourists' benefit. One family addit ionally commented that there had been no
announcements from the hotel. In a survey conducted with owners of private
reserves on land in Costa Rica, it was determined that a sense of conservat ion
ethic was the most powerful motivating force to establ ishing private reserves,
fol lowed by profit (Langholz et a l . 2000). The main concern for the owners of WIR,
when the reserves were established was, and is, protect ing the coral reef
ecosystem, highlighted by the fact that they have not advert ised the reserves to
tourists. It seems, however, that a more widespread and direct announcement by
the hotel when planning the reserves would have been preferred by local
f ishermen, in order to give them a feeling of involvement and to manifest their
position as stakeholders, where their opinions and concerns are taken into
considerat ion. More government involvement and educat ion awareness programs
concerning the benefits of marine reserves, as well as regular updates on reserve
progress, would also have been appreciated after the reserves were establ ished
(Figure 6.4). Such regular communicat ions with the adjacent communi t ies would
have informed f ishermen of the conservat ion efforts the hotel is undertaking, and
1 7 9 -

provide the opportuni ty for open debate on how the hotel and local communi t ies
cou ld work together to achieve mutual goals.
Fishers ' lack of educat ion and knowledge of marine reserves as a method of
sustaining habitats and nearshore fisheries in the long-term has been recognised
in areas of the Phil ippines (White & Vogt 2000). Once an MPA has been
des ignated, providing more information about regulat ions and scientif ic results has
shown to increase local stakeholders' feeling of part icipat ion, signif icantly
increasing compl iance (Vileri & Chavez 2007). In a compl iance analysis with
f ishermen in the Galapagos Marine Reserve, boat owners ' percept ion of the
legi t imacy of regulat ions was a major influence for compl iance (Viteri & Chavez
2007) , suggest ing that the adherence to no-poaching regulat ions for an HMMR
wou ld be better accepted with a more notable presence of a respected body, such
as the local government . Strict and well-control led reserve boundar ies were also
recognised by several f ishermen as a necessary action to increase compl iance.
Aswan i et a l . (2007) inten/iewed f ishermen f rom communi t ies adjacent to reserves
in the So lomon Islands and found that whi le good enforcement equal led less
poach ing , the perceptions of MPA effect iveness was also directly correlated with
the level of enforcement. The costs of enforcennent must, however, be lower than
ga ins attr ibuted to yields from unprotected areas due to spi l lover (Sethi & Hilborn
2008) .
Today , poaching at W I B is very rare. This has led to reduced enforcement . There
has not been a need to contact the coast guard in several years, so enforcement is
now solely control led by the security off icers/night-t ime reserve wardens. It is
- 180-

generally sufficient to shine a bright light on f ishing boats encroaching on reserve
boundaries to deter them from any f ishing activit ies. Somet imes, t h e quieter and
more concealed bamboo basket boats may sl ip by, but then less extractive hook
and line fishing is used. Whi le these occurrences are relatively se ldom, and the
amount of fish caught is limited by their f ishing technique, cont inued non
compliance could be quite harmful and should not be underest imated. Van Zweiten
et al . (2002) est imated that basket boat f ishing could contr ibute to one quarter of
the total catch of the inshore fishery in Nam Dinh province, V ie tnam. However,
biological surveys conducted from 2005-2007, researching the size of f ish, fish
density and species r ichness, still confirm signif icantly higher fish assemblages
within the reserves compared to unprotected areas (Chapter 4) . Spil lover was not
researched during these biological sun/eys, but according to the majori ty of the
f ishermen from both surveys who fish within 200 m of the reserve boundar ies, the
HMMRs are increasing the number, size or species r ichness of fish and providing
spillover of, amongst others, large food f ishes (e.g. Serranidae and Carangidae;
Figure 6.3).
When asked whether they had ever been inside the reserves, 68 % of f ishermen
from the first survey indicated that they had, and suggested that the number of fish
and invertebrates, species richness and coral cover, was higher in the reserves
compared to adjacent unprotected areas. F ishermen f rom the second survey
strongly refuted that they ever cross reserve boundar ies, being concerned of
potential repercussions (Table 6.1). A l though, enforcement is now relatively weak,
strong enforcement in the past by the local coast guard has ingrained in them
knowledge that the expected loss from detect ion outweighs possible gains from
- 181 -

poach ing. This has been described as efficient enforcement (Beddington et al .
2007) . Whi le these f ishing famil ies therefore no longer fish within the reserves, a
feel ing of animosity towards the hotel has g rown, which could perhaps have been
avo ided, had the hotel owners communicated better, descr ibed to the f ishing
communi ty the potential long-term benefits of MPAs and involved local
representat ives in the decision making process f rom the start.
Only one f isherman f rom the first survey actually admit ted to somet imes f ishing in
the reserves, which prompts the quest ion how all the other 26 f ishermen from the
first survey can maintain that f ish and coral assemblages are higher in the reserve
compared with unprotected areas. Eight of these f ishermen noted that they now
have secure jobs but it is not known whether these secured jobs are posit ions
wi thin WIR. The remainder did not comment , so it is unclear whether all the
f ishermen had a legit imate reason for knowing the status of coral and fish
assemblages in the reserves, if they were just trying to be helpful by answering the
quest ion, rather than saying "don't know", or if they were not completely truthful
when maintaining they do not f ish there. It is understandable that even in
anonymous surveys, people do not wish to implicate themselves or family in illegal
activi t ies. A more truthful and accurate answer may have been attained by
chang ing the word ing of the compl iance quest ion to, "whether they know of other
people who fish within the reserves", as was done by Cinner et a l . (2005) to assess
the compl iance of a closure at Ahus Island, Papua New Guinea.
Qui te a large number of f ishermen from the first survey stated that their yearly
income had increased thanks to the hotel (41 % ) and over half of these suggested
- 1 8 2 -

that it was because of secured jobs or other related service industr ies (Figure 6.3).
Members of these fishing famil ies could have posit ions with the hotel , they could
be delivering resources to the hotel, or they could have establ ished other services
thanks to the increasing reputation of the hotel and the result ing tour ism growth.
They could also simply be better off now, due to a constant supply of spillover of
fish from the reserves. Unfortunately, without more detai led comments , this is not
possible to determine. All f ishermen from the second survey c la imed a decrease in
income since reserve inaugurat ion (Table 6.1). Half the f ishing famil ies commented,
and these blame the hotel for their decreased catches, suggest ing that the number
of available fishing grounds have been stripped away from them. One family
argued that, where they once had 5 beaches to fish by beach sein ing, they now
only have 3. Since their f ishing vessels are not large, their possible f ishing grounds
are limited in distance.
It has been suggested that larger marine reserves may be better for biological
reasons, bat that smaller no-take areas are generally better accepted by local
communit ies as they do not significantly affect their socioeconomic welfare
(Unsworth et al . 2007). Whi le theoretically t rue, local f ishing techniques must be
taken into account when establ ishing HMMRs. The loss of two beaches out of 5
seriously impinges on their ability to secure resources for survival .
Several families suggested that the hotel or government could give f inancial
support to invest in lobster aquaculture, or better boats and equipment , in order for
them to be able to extend their f ishing area. At least six famil ies out of both surveys
partake in lobster farming. The hotel or government could provide f inancial aid to
- 1 8 3 -

support lobster aquacul ture, but consequences could be dire if additionally funds
are not invested in quality feed. Most f ishermen currently provide trash f ish, mixed
wi th low value crustaceans, increasing the l ikel ihood of infect ion. This results in
cop ious amounts of antibiotics being used wh ich , in combinat ion, could seriously
increase nutrif ication and harm the environment, especial ly in areas of low water
circulat ion ( lUCN 2003b) .
Open access f ishing has been depicted as a last resort for survival in t imes of
economic crisis (Bene & Tewfik 2003), but when overf ishing has been the constant
for a long t ime, even fishing may not be enough for survival . The bionomic
equi l ibr ium is reached when a sustainable human populat ion is surpassed,
Inducing overf ishing, and f ishing efforts have reduced the f ish populat ion to a level
at which catch rates are barely sufficient to cover the costs of f ishing (Beddington
et a l . 2007). It seems that this equil ibrium could be near, s ince 23 % of the
f ishermen f rom the first survey and 2 fishing fami l ies earn less than the
international poverty l ine of US$ 1 (VND 15,600) per day ( lUCN 2003c; Table 6.1).
Half of these are, however, the very old or the very young , w h o will be taken care
of in their large, closely knitted, extended famil ies.
Unl ike many deve loped countr ies, the famil ies of developing countr ies are of ten
qui te large, often including the extended family that live and work together to
support all members . For this reason, it was diff icult to get individual f ishermen
responses to the surveys conducted and why it is quite probable that 15 responses
f rom the first survey can be traced back to two famil ies. For the second survey, it
proved extremely difficult to interview one f isherman at a t ime, since everyone
- 1 8 4 -

wanted to listen and hear what the white foreigner wanted in their smal l vil lage.
This is why the collective opinions of all members of the family (40-50 individuals)
were taken into account. A possible method to improve the accuracy of the results
of this study would involve quest ionnaires being distr ibuted to each f isherman as
they were returning with their catch, with translators on hand to aid those who were
not literate. This may have increased the number of individual responses and
avoided respected family elders influencing younger family members ' responses.
In Vietnam, ancestor worship highly inf luences the culture and mental i ty of the
people. Children are taught from a young age that they owe everyth ing to their
parents and ancestors (Vietnam-culture.com). As a result, younger generat ions
have profound respect for their parents and elders, suggest ing they may be more
likely swayed by their opinions in their presence. This inevitably b iases such family
group results.
While 9 out of 10 families implied that WIR had had an overal l negat ive effect on
their l ives, 39 % from the first survey thought the opposite (Table 6 .1). The reasons
for these differences could be manifold. The beach seining f ishing technique also
used by several of the families interviewed decreases their potent ia l to catch
enough f ish, since two of five beaches have been occupied by WIR . Also, as a
result of this non-selective catch method, the hotel does not buy f ish from them for
guests. The opposite may also be true for f ishermen from the first survey, since
more of them have larger boats, enabl ing them to fish in deeper waters to catch
tuna and other larger predatory f ish, which the hotel will more readi ly purchase
(Figure 6.2). These f ishermen may consequent ly not be as dependent on
nearshore fishing as the poorer f ishermen from the second survey, suggest ing they
- 1 8 5 -

may not have had any difficulties with the local coast guard in the first years after
the reserve was establ ished, unlike some of the f ishing famil ies, who may therefore
be harbour ing ill feel ings towards the hotel owners .
More posit ive and support ing responses from the f ishermen of the first survey with
regards to the H M M R and the quest ion whether they wou ld welcome more
reserves to the area may also have been inf luenced by the Chairman of the
People's Commit tee. He may have distributed the quest ionnaires to fr iends or
famil ies he knew, perhaps even to people who work for, or who supply the hotel
with their catch (potentially explaining the commen ts f rom some f ishermen,
explaining they have secure jobs: Figure 6.4), o r who may well be 'wealthier'
famil ies, owning larger vessels and who, are therefore, less nearshore dependent.
He will perhaps also have told them what he knows about the hotel, its reserves
and the research being conducted, which wou ld greatly inf luence these f ishermen's
att i tudes and responses.
In account of such uncertainty, it is important to bear in mind possible biases to
certain responses f rom the first surveyed f ishermen and/or to consider a
misrepresentat ion of the opinions of the larger communi ty . Albeit, the results do
suggest posit ive att i tudes towards the HMMRs and towards establishing more
protected areas in a subgroup of the communi ty , but without verifying the
percept ions of a larger populat ion, it may be too soon to conf i rm the effect iveness
of H M M R s f rom a socio-economic point of v iew.
- 186-

6.5 C o n c l u s i o n
The majority of the local f ishermen have not iced a decrease in fish populat ions
over the last decade. They recognise the need to protect coral reef ecosystems,
especially in today's situation where better f ishing techniques are avai lable;
populat ion growth has led to overf ishing, and where a remaining destruct ive
minority still use blast f ishing. A large proport ion of f ishermen have detected
spillover of fish from the reserve, including commercia l ly valuable groups of large
food f ishes; and the previous biological surveys conf i rm signif icantly higher fish
stocks within the protection (Chapter 4). Moreover, in the tourist survey (Chapter 7) ,
results indicated that 97.5 % support HMMRs and 86.3 % would be wil l ing to pay
extra to stay at such hotels. These f indings suggest that this HMMR has achieved
its ecological objectives and has the guests ' support. A fol low-up study to confirm
fishers' perceptions of spillover, however, wou ld be prudent, since current ly, the
social and economic benefits to local f ishermen are ambivalent, and depend mainly
on the target f ishery. More direct and widespread communicat ion, involvement,
education and financial support f rom the hotel could make this H M M R more
effectively managed. By paying greater attention to developing and maintaining a
mutualistic relationship with affected communi t ies , H M M R s could real ise a great
potential as an added alternative to tradit ionally managed MPAs, especial ly if the
government would show a greater presence by aiding in sun/ei l lance, monitoring
and developing appropriate management and policy f rameworks, thereby
confirming the legit imacy of the HMMRs and substantiat ing its support for them as
an important marine conservat ion tool. A network of hundreds to thousands of such
187

H M M R s lining coastal tropical countries could have a cumulat ive posit ive effect on
f ish stocks to nearshore areas (Dawson et al . 2006 ; Roberts et a l . 2001) .
These communi ty surveys provide first indicat ions of the strengths and
weaknesses of the management of an HMMR. However, an individual, singular,
in terv iew-based survey design, involving a larger sample size wou ld give an
improved understanding of the management ef fect iveness of the HMMR. Future
studies of this k ind could be used to help gauge management per formance and
reserve ef fect iveness for a vast number of communi ty and government managed
MPAs wor ldwide.
- 188

7. Hotel Managed Marine Reserves: A Willingness to Pay survey
Contents of this chapter were used to write:
Svensson, P., L. D. Rodwell , and M. J . Attri l l . 2008. Hotel managed marine
reserves: a wil l ingness to pay survey. Ocean & Coastal Management
51 :854-861
- 1 8 9 -

7-1 Introduction
The b o t t o m - u p approach of communi ty -managed marine reserves is widely
cons idered key to effective reef management in the tropics (White & Vogt 2000) .
Local f ishermen's knowledge of the surrounding seas can help provide information
of possible locat ions for the marine reserve and without local communi ty
cooperat ion and participation, reserves may quick ly be confronted with protest and
reject ion, result ing in poaching. Communi ty -managed marine reserves are,
however, not general ly managed by local communi t ies alone but rather as a joint
venture with other stakeholders - the local government , a Non-Government
Organisat ion (NGO) or the private sector (Kiss 2004) .
In several c i rcumstances, private enterprises such as hotels and resorts have
taken over the day-to-day management of a protected area and , in some cases,
full responsibi l i ty for the reserve (Colwell 1999) . In other instances, hotels have
been the initiator and subsequent manager of the reserve (Hotel Managed Marine
Reserve: H M M R ) , wi th varying degrees of part ic ipat ion f rom the local governments
and/or communi t ies . While private parks may b e cover ing a substantial area on
land and growing rapidly, they are only recent ly becoming more popular at sea.
Private parks on land, like those at sea, are stil l widely undocumented and
insuff iciently researched, but both are bel ieved to have been initiated because of
the same reasons. Firstly, the government 's inabil i ty to satisfy public demand for
nature conservat ion, in quality and quantity a l ike (Langholz & Lassoie 2 0 0 1 ;
Riedmil ler 1999), which has led to inefficiently managed parks "paper parks" and
damaged ecosys tems. In the Caribbean and Southeast Asia, it was found that only
- 1 9 0 -

6 and 14 %, respectively, of 285 Marine Protected Areas (MPAs) rev iewed were
effectively managed (Burke & Maidens 2004 ; Burke et a l . 2002). S o m e countr ies
have even become indebted, having to rely on international support (Dearden et al .
2005). In a report on a change in governance of protected area systems between
1992 and 2002 in 41 countries, Dearden et al . (2005) found increasingly more
countr ies, therefore, relying on a broader range of funding sources; the medium
and less developed countr ies relying signif icantly more on funds f rom foreign
governments, donat ions and concessions paid by the private sector (25 %
compared with 14 % of total funding). There is seemingly a trend leading away
from solely government-managed protected areas, towards increased participation
of stakeholders, with the private sector, local communi t ies and N G O s having a
large influence on protected area decis ion-making (Dearden et a l . 2005) .
A second reason for the increasing number of private reserves is a growing
societal interest in biodiversity conservat ion (Langholz & Lassoie 2001) , peaking
with the Wor ld Summit on Sustainable Development (Johannesburg 2002) and,
later, the Wor ld Parks Congress (Durban, September 2003) , where representat ives
of protected areas recommended networks of marine reserves cover ing 2 0 - 3 0 %
of habitats by 2012.
The rapidly growing ecotourism industry is another reason why the pr ivate sector is
pushing for H M M R s , where they can establ ish a market niche. Ecotour ism has
been praised as one of the most promising approaches to sustainable
development and protection of important environmental resources in lesser
developed nations (Gossling 1999). Wi th ecotour ism, it is expected that the impact
- 191 -

f rom tour ism on the environment is kept to a bare min imum and that tour ism
benef i ts a lso profit local communit ies, either by employment or by contr ibut ing to
communi ty projects (Kiss 2004).
Today, the vast majori ty of HMMRs are not recognised as MPAs by The Wor ld
Consen/at ion Union ( lUCN). Chumbe Island Cora l Park (CHICOP) is one exception,
possibly also represent ing the first fully funct ioning MPA in Tanzania (Riedmil ler
1999). Several others have, however, been init iated privately, before public
protect ion was establ ished (Langholz & Lassoie 2001) and recently, a large
number of reported cases of HMMRs lining coasta l tropical countr ies can be found
(Chapter 8) . In these situations, it was the resort managers ' sense of responsibil i ty
to their surroundings, which was the initial dr iv ing force for their conservat ion
efforts.
These hotels have succeeded in establ ishing effect ively protected mar ine reserves
since they have successful ly incorporated the local communi t ies into their hotel
and conservat ion projects. Like many dive resorts they also have boats, personnel
and other equ ipment needed to manage local protected areas and the f inancial
back ing and incent ive to protect their assets (Colwel l 1999), but depending on the
extent of their conservat ion projects, a little f inancial backing f rom guests in the
form of H M M R user fees can go a long way. Tongson and Dygico (2004) found
that tourists can appreciate user fees as they a re a direct means to contr ibute to
conserv ing the natural resources they will en joy. Several studies actually suggest
that tourists and divers are will ing to pay substant ia l user fees to enter MPAs ,
wh ich can f inancial ly supplement or even complete ly cover conservat ion costs
- 1 9 2 -

(Ahmed et al. 2007; Depondt & Green 2006; Tongson & Dygico 2004). It is
suggested that MPAs only start to become successfully managed when funding is
secured through self-financing (Davis & Tisdell 1996). The constant supply of
funding from user fees could, therefore, be a solution to financing and thereby
effectively managing protected areas (Arin & Kramer 2002).
Projects, which may require financial assistance, include monitoring coral reefs,
mangroves or other marine life, including sharks, dolphins or turtles, and
maintaining turtle hatcheries. Projects may also involve creating artificial reefs out
of concrete domes or using mineral accreting technology owned by Biorock™ to
transplant coral. Other HMMRs have developed education or awareness programs
for tourists, staff and local communities (Chapter 8).
In addition to project costs, associated resources and salary costs, HMMRs
generally also need to pay for the area covered by the marine reserve. This can
take the form of a lease or tax to be paid to the local government (Colwell 1999). In
some instances a portion of user fees are delivered to local communities to build
schools, hospitals or to improve Infrastructure, or given to fishermen to
compensate for any fishing grounds lost (Langholz & Lassoie 2001). The costs
accrued to manage HMMRs will ultimately dependent on the conservation projects
they are involved in, their management set-up, location and size.
A Willingness to Pay (WTP) sun/ey was conducted at an HMMR in Vietnam in
order to gauge tourists' knowledge and interest In marine conservation, the
Importance of various factors in choosing and locating hotels, their opinion of
- 193-

HMMRs, and whether tourists would be willing to pay a user fee to support HMMRs.
The consumer surplus (CS) was also calculated with the Intent of establishing the
elasticity of demand for HMMRs, resulting in the optimal user fee.
7.2 Study site and tourists' willingness to pay
A total of 211 questionnaires was completed by tourists visiting the HMMR, Whale
Island Resort (WIR) (Figure 7.1) during the four research visits between Autumn
2005 and Spring 2007 (detailed accounts of the study site can be found in Chapter
3). These qualitative and quantitative, open and close-ended questionnaires were
placed on the reception desk, so the hotel guests could complete them at will, but
usually they were completed during check-out. These questionnaires draw on a
convenience sample restricted to the sample group of the hotel guests, providing a
great range in age, income, environmental knowledge and level of education of
travelling tourists. However, when considering the sample representation for
nationalities of visiting tourists to Vietnam, the representation is more balanced to
European visitors in the sample; a more accurate, larger Asian proportion in the
sample may have been achieved had I conducted surveys with random tourists at
several locations.
194

South China Sea
WIBP
WIB \1WIR Van Phong Bay
Nha Trang
Figure 7.1. Illustration of Whale Island (Hon Ong) showing the Whale Island Resort (WIR), the 11 ha Whale Island Bay reserve {WIB) and the 5 ha Whale Island Bay Peninsula reserve (WIBP) in Van Phong Bay, Khanh Hoa Province, Vietnam.
In this anonymous questionnaire, guests were asked to complete a demographic
and personal questions section; a set of behavioural choice questions relating to
the methods and reasons for choosing hotels; questions related to their
environmental awareness and interests; their opinion of the biophysical state of the
HMMR compared to unprotected areas; their thoughts on hotels or resorts acting
as caretakers and mangers of marine reserves and how this should be advertised;
and lastly, if they would be willing to pay extra for HMMRs, and if so, how much.
For the final WTP questions, a hypothetical scenario was laid out. The respondents
were requested to decide if they would be willing to pay more to stay at a hotel
which is managing a marine reserve, compared to an adjacent hotel, which is not.
95-

all else being equal. The follow-up question asked them to specify how much more
they would be willing to pay per night in either US$ or as percent of the room rate.
The additional choice to provide a WTP amount as percent of the room rate was
added to the fixed US$ option because during the initial interview-based pilot
surveys, the majority of tourists requested this possibility on their own accord. To
convert the percentage value into monetary terms, the room rate of WIR was used
as a model. The average length of stay of three nights was determined as the
actual room rate (US$ 96) since the room rate decreases with the number of nights
stayed. All percentage responses could thereby be converted to US$ and the
median and average WTP calculated for the sample population.
An open-ended WTP Contingent Valuation Method (CVM) question, where
respondents specify the amount themselves, was chosen over a dichotomous
choice question because this is the first survey of its kind and I did not wish to
assume on the distribution of WTP and encourage biased responses by providing
pre-defined ranges (O'Conor et al. 1999). Open-ended questionnaires are also
understood to give a lower WTP (Bateman et al. 1995). This was preferred, since it
is suggested that when people are faced with hypothetical scenarios involving
payment, they are often over-generous (White et al. 2001). While they may
hypothetically agree to pay a certain amount, they would commonly only agree to
half in reality (Loomis et al. 1996).
A stated preference, CVM, was also chosen over other stated preference models
(e.g. Choice Modelling - CM), or a revealed preference model (e.g. Travel-Cost
Method - TCM), because they are both suspected of giving higher valuation
- 196-

estimates than CVM, which follows my continued goal of trying to produce the most
conservative results possible. In a series of experiments involving over 2000
subjects, Boyle et al. (2004) demonstrated that CVM tended to produce much
lower valuation estimates than CM. Similarly, Carson et al. (1996) compared stated
and revealed preference estimates from 83 studies between 1966 and 1994, and
found that CVM estimates were lower (approximately 30 %) than their revealed
preference counterpart, TCM (Whitehead 2006).
In order to determine statistical significance between variables and WTP amounts,
non-parametric tests were employed (Mann-Whitney U and Kruskal-Wallis H) to
test the null-hypothesis that two or more samples were drawn from a single
population. The Chi-square cross-tabulations test was used to reveal significance
between reasons provided for WTP. Tests excluded tourists who did not wish to
comment on their WTP and ignored the final question. One additional sample was
removed from the populations because the WTP was deemed far too high to be
considered serious (200 % of room rale per night).
The CS was calculated based on the amount guests were willing to pay and
calculated the total revenue the resort could make, depending on various user fees
the resort could implement per room for nights stayed.
- 197

7.3 Results
The European community prevailed in this study, the more numerous being the
British, Dutch and then French. While the majority of the visitors resided in their
home countries, one-tenth of the visitors had taken up Vietnamese residency
(included in 'Other', which also includes the rest of Asia, South and Central
America - Table 7.1). University educated visitors dominated and 69 % of the
population were between 26-45 years old. A larger percentage of the sample
comprised women and the income level was split throughout the spectrum.
There were no significant relationships between these variables and WTP.
Although there was a trend in certain categories for higher WTP, such as visitors
aged 36-45 and those with PhD level education (Kruskal-Wallis p=0.273, Df=4; p=
0.168, Df=3), the amount visitors were willing to pay varied widely, resulting in high
variance (Table 7.1).
198

Table 7.1. Breakdown of tourists' demographic and personal data and their Willingness to Pay (WTP) (US$) extra to stay at an HMMR with Standard Errors (SE)
Visitors (%) WTP (S) S E
Naiionaliiy European 69.46 12.55 1.01 Oceanian 16.75 14.88 3.97 North American 8.87 11.37 2.43 Other 4.93 15.49 2.63
Country of Residence Europe 62.07 12.58 1.11 Oceania 15.27 15.66 4.23 North America 6.40 11.60 3.36 Other 16.26 12.53 1.26
Gender Female 56.31 12.46 1.08 Male 43.69 13.44 1.68
Age <26 10.10 9.30 1.74 26-35 44.23 11.73 1.22 36-45 25.00 16.63 2.73 46-55 10.10 12.40 2.44 >55 10.58 12.14 1.51
Education Secondary school 9.52 13.47 2.63 College 21.43 14.76 3.32 University 62.38 11.63 0.89 PhD 6.67 17.80 2.92
Gross Income/year ($) No Income 5.05 11.33 2.77 <15000 4.04 10.71 1.95 15000-30000 15.66 14.01 3.33 30000-45000 18.18 15.31 2.54 45000-60000 20.71 13.78 2.68 60000-75000 14.65 11.84 1.71 75000-90000 9.60 9.76 1.47 >90000 12.12 12.42 1.80
The sample comprises the available data from 211 surveyed guesLs minus 24 unusable samples. The WTP is the average, convened from % room rate where necessary, based on US$96/rooni/night.
199

In the next section, tourists were confronted with behavioural choice questions: top
three methods they use to locate hotels; how they located WIR; the importance of
various factors for choosing hotels and the top three reasons for choosing WIR.
The method most commonly used to find tourist's choice of hotel was the internet
followed by word of mouth and travel guides (Figure 7.2). This was also the order
demonstrated by guests choosing WIR. It seems word of mouth differed the most,
with 5.4 % more tourists attracted to the hotel by recommendation, suggesting
positive experiences by previous guests. The method least chosen for locating
hotels was environmental hotel award sites, which is not so surprising since only
10.95 % of the population said they knew where to look for environmentally friendly
hotels (Table 7.2) and of these, approximately half the tourists' responses were
vague, writing only 'internet'.
On a likert scale from one to five, tourists were asked to rate certain hotel attributes
in order of importance. Location was the most important attribute when choosing a
hotel, followed by price, facilities, service and lastly, environmental awards (Figure
7.3). The importance of 'location' also became apparent when asked why they
chose WIR, the top two reasons being, 'away from mass tourism' and 'island
setting; followed by facilities: SCUBA diving and snorkelling. Eco-friendliness came
in forth place ahead of service and safety (Figure 7.3).
200-

22.9
How tourists commonly locate hotels 2.0 0.7
31.8
Internet hotel search
• Word of mouth
• Travel guides
• Travel agencies
• Travel magazines
m Other
a Environmental hotel award sites
23.0
How tounsts located Whale Island Resort
20.7
• internet
• Word of mouth
• Travel guides
• Tour
• Travel nnagazines
cj Travel agency
Figure 7.2. Tourists' responses (%) to methods they usually employ to locate and choose hotels and how they found or heard about Whale Island Resort
201

The importance of criteria when choosing hotels
12.3
Location
16.2 • Price
• Facilities
• Service
• Environmental awards
The importance of criteria when deciding on Whale Island Resort
No Mass Tourism
18.1
• Island Setting
• SCUBA/Snorkeling
• Eco Fhendly
• Inexpensive
ID Service
s Safety
30.5
Figure 7.3. The importance of various criteria to guests when choosing hotels and choosing Whale Island Resort (%)
2 0 2 -

In the following section dedicated to tourists' environmental awareness, interests
and knowledge, a larger percentage already knew that WIR was an eco-friendly
resort before arriving on the island, while the majority of visitors also knew what
MPAs are and would like to have access to hotels' environmental policies before
staying at a hotel (Table 7.2). The latter two were the only significant Indicators of
WTP found from this survey. While having access to hotels'environmental policies
when agreeing to pay to stay at an HMMR was highly significant (Ghi-square=11.0;
p<0.001), whether the respondent knew what an MPA was, affected significantly
the WTP amount to stay at an HMMR (Mann-Whitney U= 2391.0; p= 0.047).
Table 7.2. Breakdown of tourists' environmental awareness, knowledge and their Willingness to Pay (WTP) (US$) extra to stay at an HMMR (SE)
Visitors (%) W T P ($) S E
Know whai MPAs are? Yes * 78.10 13.69 1.15 No 21.90 9.89 1.41
Know how to find cco-friendly hotels? Yes 10.95 10.77 1.56 No 89.05 13.09 1.40
Would hke to see hotel's environmental policy?
Yes * * 76.19 13.35 1.02 No 23.81 1 1.27 2.34
Know WIR is eco- friendly? Yes 58.57 13.41 1.41 No 41.43 12.47 1.29
Support HMMRs? Yes 97.51 14.31 1.41 No 2.49 4.32 2.58
Willing to pay? Yes 86.27 13.81 1.34 No 13.73 0
The sample comprises the available data from 211 surveyed guests minus 24 unusable samples. The WTP is the average, converted from % room rate where necessary, based on USS96/room/night. Nonparametric Mann-Whitney U lest *p<0.05. Chi-square test **p<0.001
203

Guests were thereupon asked to compare the general state of the marine
environment, the fish diversity, number of fish, number of invertebrates, size of fish
and coral cover within the reserve, with outside fished areas. Only 40.95 % of the
guests had also dived or snorkelled outside the enclosed bay, either on a dive or
snorkelling trip, or if they had rented a canoe or hobby-cat and snorkelled at other
areas around the Island.
I graded tourists' responses, giving ' - 1 ' if the tourists thought the conditions were
poorer in the reserve, '0' for the same and '+1' for better conditions. All variables
apart from coral cover averaged positively for the reserve.
Tourists' perceptions ol the biophysical state inside the WIB reserve compared to unprotected areas
0.5
0.4
0.3
0.2
0.1
0.0
-0.10
-0.20 General state Fish diversity Number of lish . Number ot size ol fish Coral cover
invertebrates
Figure 7.4. Tourists' graded averages of the biophysical conditions inside Whale Island Bay reserve (WIB) compared with unprotected areas (n = 86)
204

In the succeeding questions, tourists were asked if they support the idea of hotels
acting as caretakers and managers of protected areas: 97.51 % did support
HMMRs. Of the rest, nine did not have an opinion, five didn't support the concept,
one of which expressing concern that the hotel would misuse the idea and profit
from it; another was concerned about private ownership of public space becoming
exclusionary. The remainder reserved comment since they did not have enough
details.
In the follow-up, open-ended question, tourists commented on the reason and
conditions for their support of HMMRs. The majority (96.32 %) reasoned HMMRs
would better serve the environment, 13.50 % thought private management would
be better that government management, while some were more reserved In their
opinions, agreeing with HMMRs only if they were supervised and connected to an
environmental agency (12.88 %), or had an agreement with local communities
(3.68 %). A summary of all comments can be found in Figure 7.5.
- 2 0 5

Tourists' comments to reasons tor supporting HMMRs
Envirorvnental protection
Private better than government
Guests benefit
Need to be connected to env. agency
Good for business
Hotels' obligation to protect
Build awareness
Local community agreement needed
The more the better
Especially good in poor countries
Will support fishermen
• • • •
10 20 30 40 50 60 70 80 90 100 Tourists (%)
Figure 7.5. Tourists' reasons for supporting Hotel tVIanaged Marine Reserves (HMMRs) (n = 163)
Most guests agreed that HMMR information should best be available to them over
the internet and on hotels* homepages (92,22 %) . A smaller contingent (17.22 %)
suggested that all hotels protecting marine reserves should have a website of their
own, where you could browse per country for example, or that they were linked to
either country environmental agency websites or dive operation websites. Another
faction (15 %) had the same suggestions but would like the HMMRs to be
incorporated into some kind of environmental standard or award system, overseen
by an environmental agency. A full list of suggestion can be found in Figure 7.6.
2 0 6 -

Tourists' suggestions to HMMR advertising
Internet/homepage | —
Env. agency/Dive operatlon/HMMR j-Internet site J -
Env. agency/Dive operation/HMMR 1 Internet site with award system f-
Brochures [ {
Trave! guide I I j
Country tourism board j 1
Travel agency CH
Magazines Q 1 I
Lonely Planet equivalent (or HMMRs Q I
TV •
0 10 20 30 40 50 60 70 80 90 100
Tourists (%)
Figure 7.6. Tourists' suggestions on Hotel Managed Marine Reserve (HMMR) advertising and information dissemination (n = 140)
In the final WTP question, most tourists agreed they would be willing to pay more
per night to stay at the HMMR (86.27 %), the average being US$ 12.86 extra per
room and night stayed, and the median: US$ 9.6. Of the 159 tourists willing to pay
at least something, 84,28 % decided to give a percent figure of the room rate. The
difference between the averages given in percent (US$ 14.31) and in dollars
(US$ 19.46) was significant (Two-Sample Kolmogorov-Smirnov Z=1.403; p=0.039)
The revenue and CS resulting from a user fee system has been calculated based
on the WTP results from all tourists, willing to pay or not alike, except those who
did not complete the WTP questions (11 %). The results show that 85 % of visitors
were willing to pay at least 1 % of the room rate, equivalent to US$ 0.96/room/night.
- 207 -

Extrapolating this 85 % to the number of rooms willing to pay per annum (9931),
the hotel would make US$ 9534/year (Figure 7.7) at 100 % occupancy, US$ 5719
at 60 % and US$ 6672 at 70 % occupancy. If all guests were to pay 1 % per room
per night, given an average yearly occupancy rate of 60 % (7008 rooms) the resort
would make US$ 6728 per year. If yearly occupancy increased to 70 % due to
HMMR marketing, the total revenue would equal US$ 7849. Similarly, 83.4 % were
willing to pay 5 % of the room rate (US$ 4.8) and 70.1 % were willing to pay 10 %
(US$ 9.6), which would amount to US$ 33,638 and US$ 67.277 per year,
respectively, at 60 % occupancy if all tourists paid (US$ 28,054 and US$ 47,161 if
only willing to pay tourists paid).
\VTP(USS/room 25 / night)
20
u 312 1187 3123 3310 4372 5122 8182 8869 9744 9806 9931
WTP ($) 48 24 1 19.2 16.8 14.4 12 9.6 7 4.8 2 0.96
WTP (%) 2.7 10.2_L26.7 _28.3_ 55,614
_37.4_ 62.960
43.9 7.0.1 75.9 62.085
83.4 46,770
_ e 4 . o _ 19,612
_85.0_ 9534 Revenue ($) 14.990 28.482 1 59,961
_28.3_ 55,614
_37.4_ 62.960 61,461 78,550
75.9 62.085
83.4 46,770
_ e 4 . o _ 19,612
_85.0_ 9534
T. Rev. ($) @ 60 % Occ. 336.384 168.192jl 34,554 117.734 100,915 84.096 67.277 49.056 33.638 14.016 6728
T. Rev. ($ )@70%Occ. 392.448 196.224jl56.979 137,357 117.734 98,112 78.490 57,232 39.245 16.352 7849
Number of guest rooms
Figure 7.7. The percentage of guest rooms willing to pay {US$) extra to stay at an HMMR, resulting in revenue per year (US$) at 100 % occupancy. Also, the total revenue per year (US$) based on 60 & 70 % occupancy if all tourists paid the specified WTP amounts, plus showing the median WTP (US$9.6/room/night).
208-

The WTP and total revenue drops dramatical ly beyond 10 %. Only 37.4 % were
will ing to pay 15 % (US$ 14.4) and 26.7 % were will ing to pay 20 % (US$ 19.2) of
the room rate. Therefore, at 10 % of the room rate and below, the demand for the
HMMR is relatively inelastic and beyond 10 %, the demand becomes relatively
elastic and the revenue starts to decrease (Figure 7.7). The CS, def ined as the
difference between what people are wil l ing to pay for a good or serv ice and what
they actually pay, has been calculated based on tourists' total W T P . The total CS
tourists are willing to pay beyond the normal room rate to enhance their
snorkell ing/diving experience and to contr ibute to coastal conservat ion has been
estimated to US$ 162,437. based on WIR's room rate.
7.4 Discussion
Interestingly, the most common factors influencing W T P for other protected areas:
age, education level and income (Lindberg 1991), were insignif icant when it came
to W T P for an HMMR or deciding the amount, al though there was some inclination
towards higher W T P for tourists educated to PhD level, and those aged 2 6 - 3 5 .
The only significant variables affecting W T P were connected to a person's
environmental knowledge and interest. Whi le wishing to have access to hotels'
environmental policies before slaying at a hotel t r iggered tourists' W T P , knowing
what MPAs are inf luenced the amount. Similar result were elicited by Dharmaratne
et al . (2000), who found that people wil l ing to become members and/or were
already members of an NGO, establ ished to manage Montego Bay Marine Park
209

and Barbados National Park, were will ing to pay more than non-members and
those who showed no interest.
The average and median amounts tourists were wil l ing to pay (US$ 12.86 &
US$ 9.6) to stay at an HMMR were higher than the average and median amounts
charged to divers to enter MPAs in Southeast As ia (both US$ 5) (Depondt & Green
2006) but also lower than some W T P surveys. Divers were wil l ing to pay on
average US$ 27.4 to dive at the Bonaire Mar ine Park (Scura & van't Hof 1993) and
US$ 41 to dive at the Tubbataha Reefs Natural Marine Park (Tongson & Dygico
2004) . Most commonly , MPA access is levied to individual divers, rather than dive
operators, and a l though user fees may be charged either per dive, per day, per
boat or per entry to the park, the t imescale is usual ly per day (Depondt & Green
2006) . The user fee system proposed for H M M R s is similar in terms of access to
the H M M R per day, but it would not be per diver, but rather, per room, which is
more likely to accommodate at least two people, and since guests are paying per
night, it may potential ly include an extra day, depending on arrival and departure
t imes. Based on a median W T P of US$ 9.6, each tourist wou ld then more likely be
paying fees equivalent to US$ 4.8 per day, comparab le to the average and median
registered in Southeast Asia (US$ 5) (Depondt & Green 2006).
Interestingly, 84 % of respondents preferred to give a W T P value represented as
percent of the room rate. The average room rate at WIR for an average length of
stay of three nights amounted to US$ 96 (2006 rate), including meals and
t ransportat ion, wh ich could be considered on the lower end of beach resort
accommodat ions , unless you are back-packing. The median, equivalent to 10 % of
- 2 1 0 -

the room rate per room (US$ 9.6) or quasi equivalent to US$ 4.8 per person per
night could, therefore, be considered conservat ive, al though you do have to
consider that guests possibly kept WIR's room rates in mind when consider ing their
WTP. The amount guests were wil l ing to pay in dollars was, however , significantly
higher than those who gave a W T P in percent, possibly Indicating a higher
believed room rate. This is likely to be inf luenced, however, by responses of an
Australian woman and Engl ishman with average incomes (US$ <45,000 &
US$ <60,000), who gave an exceptional ly high W T P (US$ 75 & US$ 100). They
were either very generous, or had misunderstood the quest ion, possibly thinking it
was for the length of their stay. W h e n guests were asked why they preferred to
give a W T P amount as percent of room rate, rather than a f ixed dol lar amount,
many tourists reasoned that larger, more expensive resorts would require higher
managing costs, but would ult imately also be capable of protecting a larger and
'better' reserve, compared with reserves managed by smal l , inexpensive resorts
and the user fee should be weighted accordingly.
When tourists are actually faced with paying a user fee, they may no longer be
will ing to pay as much as when faced with the theoretical question of WTP . This
over-est imated generous opinion of oneself has been calculated to approximately
double the actual W T P (White et al . 2001). There may, however, be a means to
minimize this discrepancy. Research suggests that the longer tourists spend on
recreational activities by the reef, the more wil l ing they are to pay for improvements
in reef quality, especially if their visit and diving/snorkel l ing exper ience meets or
exceeds their expectat ions (Ahmed et a l . 2007; Lindberg 1991 ; Ross & Wal l 1999).
211

The average guest stays three nights at WIR , wh ich is three to four days guests
can use a n d benef i t f rom the reserve. At other resorts the average length of stay
may wel l be one week or longer, especial ly at d ive resorts. W h e n asked, over 90 %
of guests would choose to return to the resort, wh ich suggests that their stay has
met, or exceeded their expectations. Furthermore, when asked how they would
compare the mar ine environment inside the reserve to areas they had seen when
div ing/snorkel l ing outside the reserve, except for coral cover, the responses were
in favour of the mar ine reserve for general state of the environment, f ish diversity,
size and number of invertebrates (Figure 7.4). These quest ions have their
l imitat ions, however, because tourists are not mar ine biologists using unbiased
monitor ing methods, but rather base their answers on subjective opinions.
Nevertheless, the overal l tourist impression w a s that the hotel was effectively
protect ing the mar ine environment and increasing diversity and b iomass. which
obviously also increases guests' satisfaction a n d makes them more wil l ing to pay
for H M M R s .
The fact that tourists could utilize the reserve for several days and seemed
sat isf ied wi th both the resort and the ef fect iveness of the reserve probably
inf luenced the extremely high support tourists gave HMMRs (97.5 % ) . This,
however, just demonstrates that if HMMRs are managed effectively, and results
are vis ible, at least tourists are in favour of H M M R s and are wil l ing to pay for
privately managed conservat ion efforts. A number of tourists (13.5 % ) even
suggested that private management would be better or more effective than
government management of marine reserves, especial ly in developing countr ies,
where funding is scarce (Figure 7.5). Whi le the vast majority stated that H M M R s
- 2 1 2 -

would better serve the environment, several also conc luded that it wou ld be in the
best interest for tourists and for the hotel al ike. The majority did not object to the
possibility that the hotel could profit f rom market ing the HMMR and increasing
occupancy, as well as protecting the environment, as long as local communi t ies
weren't disturbed, but some expressed the desire for proof, i.e. when market ing the
HMMR. the marine ecosystem should then also be in a "guaran teed" better
condition than unprotected areas through some kind of "off icial s tamp" . It was
proposed that a suitable environmental agency verify and certify that the resort is in
fact dedicated to ecotourism and marine conservat ion and results are favourable
(Figure 7.5).
Tourists concluded that HMMRs could help build awareness for protect ing coral
reef ecosystems on a local and international level. Since the majority of tourists
choose their hotels over the internet (Figure 7.2), most recommended that HMMRs
be advert ised at an easily f indable website either on a country's tour ism site, at a
website of their own, listing all HMMRs per country, or be incorporated in an
existing environmental agency website conf i rming hotels* advert is ing (Figure 7.6).
Word of mouth was the second highest choice for choosing hotels (Figure 7.2), so
the more HMMRs there are providing information through brochures and/or
lectures on the need for protection and the hotel 's conservat ion efforts, the more
environmental awareness will spread. This would be jointly beneficial to HMMRs,
enabling them to maintain a suitable W T P and to increase occupancy and prest ige,
delivering them into a market niche. The third most important resource for choosing
hotels was travel guides (Figure 7.2). In the Lonely Planet guide, there is a capt ion
mentioning WIR and how, through their environmental protect ion efforts, including
- 2 1 3 -

t ransplantat ion of coral , they have successful ly increased the number of marine
species (Florence & Jealous 2004. p. 369). Tour ists suggested trying to
incorporate all H M M R s into travel guides or even create a travel guide solely for
H M M R s and eco-fr iendly hotels (Figure 7.6), wh ich would certainly contr ibute to
awareness bui lding. This brief ment ion in the Lonely Planet, together with word of
mouth are the main reasons why the majority of tourists already knew that WIR
was an eco-fr iendly resort (Table 7.2), since the resort did not advert ise over the
internet when these surveys were conducted.
Unfortunately, choosing hotels according to environmental certif ication or
env i ronmenta l award schemes was the last choice when choosing hotels (Figure
7.3), wh ich is not surprising since the majority of tourists do not know where to look
for eco-fr iendly hotels (89 % ) , despite 76 % wishing to see hotels' environmental
pol ic ies, including awards and certif ications, before booking a room (Table 7.2).
There are over 70 sustainable tour ism certif ication programs in the wor ld
(Rainforest Al l iance 2008a), either currently act ive or in development , which
legit imize eco-fr iendly hotels and grant awards after scrut inized inspect ions. Green
Globe probably being the most recognised on a global level. These and other
specia l ized websi tes such as www.responsib let ravel .com, or more country specif ic:
www.tur ismosostenible.co.cr , are places where tourists can f ind awarded or
envi ronmental ly conscious accommodat ions, but obviously they are not well
enough advert ised, or tourists are not as interested as they indicate.
There is certain concern that tourists aren't as interested in eco-fr iendly hotels (and
H M M R s ) as the high support for HMMRs (97.5 % ) and relatively high W T P seem to
- 2 1 4 -

indicate, since even though 58.6 % of tourists knew beforehand that WIR was eco-
friendly, only 7.9 % considered its eco-fr iendliness to be important w h e n deciding
to stay at WIR (after location and facilit ies; Figure 7.3). This concern is
compounded by the low rating environmental awards attained when tourists
choose their hotels. If there is in fact a lower regard for HMMRs than g leaned, this
could reduce the usefulness and success of the future potential development of
more HMMRs worldwide and the use of a user fee system to secur ing a constant
supply of funding. In such circumstances, HMMRs would be no better than other
failing MPAs, resulting in these being stamped as 'paper parks ' . Before more
research is conducted with a greater number of HMMRs , these results should
therefore be v iewed with a certain amount of caut ion, despite the overwhelming
amount of positive responses.
Despite the current involvement of environmental award systems, the majority of
tourists also do not know how to locate eco-fr iendly hotels, causing both the
environment and potential eco-friendly travellers to be neglected. It may be
possible to increase tourists' awareness and interest in H M M R s conservat ion
practices if managed effectively and certif ied globally through a central accredit ing
body. Such a central body for accredit ing HMMR is currently not avai lable,
however, possibly due to the complexity of management of communi ty , NGO and
government involvement, property rights of the oceans, and the concern about
private ownership of public space becoming exclusionary, but also because of the
relative novelty of such endeavours. Whi le beachfront resorts are dependent on
the 'bottom line', they may not be able to profit in the long term because of the
growing need and environmental concerns of a growing ecotour ism clientele.
- 2 1 5 -

Notwi thstanding, if standards and controls were adopted, there will inevitably be a
per iod when some hotels will try to proliferate on the meri ts of others, but will
hopeful ly fail pending tourists' scrutinized judgment and subsequent word of mouth
advert is ing.
The CS represent ing the total amount tourists were wil l ing to pay on top of the
normal room rate to stay at an HMMR equal led US$ 162,437, based on WIR's
average room rate (US$ 96), which would be equivalent to US$ 23.18 per room per
night at 60 % occupancy. This amount, as well as the average W T P
(US$ 12.86), may be considered too high; a better representat ion is the median
US$ 9.6 (10 % of the room rate), which 70 % of tourists were will ing to pay and
wh ich also amounted to the highest revenue (US$ 78,550) for wil l ing-to-pay
tourists (Figure 7.7), demonstrat ing inelasticity of demand for HMMRs up to 10 %
of the room rate. If all guests were to pay 10 % of the room rate, per room per night
s tayed, total revenues per annum would equal US$ 67,277 based on 60 %
occupancy. This f igure is, however, only an est imate of W T P in monetary terms,
s ince it is an example from WIR's room rate. For a 50-room hotel cost ing US$ 200
per night with 75 % occupancy, total revenues based on 10 % of the room rate
wou ld amount to US$ 273,750, a substantially higher potential fund for the MPA;
even 5 % would still generate US$ 136,875 per a n n u m . Therefore, total revenues
are dependent on the room rate, number of rooms, yearly occupancy and the user
fee percentage.
A user fee of only 1 % per room and night (generat ing US$ 6728/year) would
near ly suff ice to cover the conservat ion costs at WIR , cover ing leasing costs (the
- 2 1 6 -

marine portion equall ing approximately US$ 4000) , moor ings, maintenance and
repairs (US$ 300). management and salar ies (US$ 3800) , total l ing U S $ 8100 per
annum. The high interest for HMMRs expressed in the CS (US$ 162,437) would
cover the running costs of the reserve 20 t imes over. The running cos ts of WIR's ,
area-equivalent 15 ha marine sanctuary on Gi lutongan Island. Phi l ippines, however,
requires a higher yearly budget of US$ 21.000, to pay for surveys a n d
maintenance, community organizing, educat ion and training, law enforcement
(small patrol boat), information disseminat ion and salaries (White et a l . 2000). The
CS from the WIR example would , however, still, easily cover these costs (7.7 fold)
and even if the CS were halved to compensate for a person's over-generosi ty
when deal ing with hypothetical scenarios (Loomis et al. 1996), costs would be
covered with plenty to spare to invest in enhancing reserve ef fect iveness or
provide alternative livelihood support to af fected communi t ies . There fore , a very
achievable, and acceptable, fee of 5 % to support WIR's HMMR wou ld generate
considerable extra income (US$ 33.638 it all tourists paid and US$ 28,054 if only
willing to pay tourists paid), which would , under current c i rcumstances, provide
approximately US$ 20,000-25,000 extra spending money for such future
investment in the MPA and/or local communi t ies.
217

7.5 Conclusion
Based on the results and reasoning from this survey, several recommendat ions
can be made wh ich could potentially increase a hotel 's chances of biological and
social success, whi le staying economical ly secure.
After establ ishing that a hotel can lease an a rea of the coastl ine, the local
communi t ies and government should be consul ted a n d an appropr iate size and
location for the reserve negotiated. The size of the reserve should be large enough
to maximize biological potential, small enough t o al low spil lover and to be
economical ly feasib le and not so large that the loss of f ishing grounds puts an
unmanageab le strain on local communit ies (Hast ings & Botsford 2003). Next, the
hotel , local communi t ies and government shou ld align their reserve object ives with
an env i ronmenta l agency to avoid differing interests (Christ ie 2005) and try to
val idate the MPA internationally. A user fee amount for tourists should also be
calculated based on stakeholders' f ixed expenses. Here it is important that the
needs of al l s takeholders are considered and that the hotel makes every at tempt to
integrate themselves and help the local communi t ies wherever possible, especial ly
in si tuat ions where the hotel owners are foreigners (Langholz & Lassoie 2001).
Tour ists seem to prefer a user fee in the form of a percent of the room rate, with
10 % per room per night representing both the opt imal and max imum amount ,
consider ing revenue versus W T P (Figure 7.7). On ly the absolute necessary
amount should , however, be demanded and the hotel and environmental agency
218

should provide clear information how guests ' money is invested (Depondt & Green
2006).
The hotels should advertise their HMMR and associated projects on their
homepage and with a local environmental agency, since no central body certi fying
HMMRs thus far exists, providing more clarity in operat ions (Depondt & Green
2006) and , if possible, over the country's off icial tour ism website and/or through
dive companies. Addit ional advertising with travel guides, as well as information
dissemination through seminars and brochures avai lable at the hotel , explaining
projects and monitored progress should be avai lable to raise awareness and
interest.
Optimal location of the hotel is important, s ince this is the first thing tourists
consider when choosing their destination (Figure 7.2). From a biological and socio
economic point of view, the farther away the hotel is f rom inhabited land, the better
(Balmford et al . 2004), unless transportat ion costs and resulting pol lut ion negate
the posit ive benefits. Location is, however, only the first step. To assure guests '
user fees are maintained, it is suggested that their stay meets or surpasses their
expectat ions (Ahmed et al . 2007; Lindberg 1991 ; Ross & Wal l 1999), with visible
improvements in HMMR biota compared with unprotected areas. Th is latter
achievement may be difficult in the first few years, even with effect ive management ;
tangible projects may be an opt ion, such as bui ld ing artificial reefs t o attract f ish
and attempting coral transplantations.
219

In some cases , hotels have initiated marine protect ion, only to be incorporated into
government protected areas in the future (Langholz & Lassoie 2001) , including the
areas protected by Lankayan Island Dive Resort and Anse Chastanet , which later
deve loped into Sugud Islands Marine Conservat ion Area (SIMCA) and Soufr iere
Mar ine Management Area (SMMA) (Roberts & Hawkins 1997). The per iod during
wh ich the hotels were protecting these areas could be seen as money saved by
the government for an area which actually needed protecting (Langholz & Lassoie
2001) .
H M M R s are quite recent developments and, therefore, still quite scarce, so further
research into the effectiveness of HMMRs f rom a biological and soc ioeconomic
perspect ive is still necessary. This survey nevertheless proves great interest and
commi tment to H M M R s from predominantly Western countr ies. Further research
involving a more nationali ty-balanced sample wou ld be necessary to conf i rm
results, but they still give indication of the great potential of HMMRs as an
economical ly sustainable conservat ion tool .
- 2 2 0

8. Hotel Managed Marine Reserves: An analysis of current status
221

8.1 Introduction
Coral reefs occur primarily in developing countr ies and play an important role in
provid ing l ivel ihoods, nutrition and food securi ty, especial ly in t imes of economic
a n d social hardship or disturbance (Cesar et a l . 1997; Sadovy 2005) . Wi th an
est imated 746 mill ion people in Asia living under the poverty line (<US$ 1 per day)
(Stobutzki et a l . 2006) , compounded with an ever growing populat ion size, the
impor tance of maintaining or increasing the landings of reef f isheries f rom an
al ready overf ished and damaged resource (Mora 2008; Stobutzki et a l . 2006) will
be crucial to the survival of mill ions.
Mar ine Protected Areas (MPAs) can potential ly help battle the causes of degrading
f ishery resources. They have the potential to protect crit ical spawning stock
b iomass , provide recruits to fishing grounds and produce spil lover of adult species
to surrounding f ished areas (Abesamis & Russ 2005; Polunin & Roberts 1993;
Trexler & Travis 2000) . MPAs can also significantly increase average species
r ichness, density and size of organisms within 1-3 years, independent of the size of
the protected area (Chapter 4; Halpern & Warner 2003).
Protect ion of marine resources is not a new phenomenon. Art icles dat ing back to
the 19'^ century ment ion the widespread presence of customary management
pract ices in the Pacific Islands, which l imited access to mar ine resources, so called
T a b o o s ' (Somervi l le 1897). These customary management practices limit
extract ion by spatial area, t ime, gear or harvest ing technology, effort ( through the
number of part ic ipants), types of species that c a n be harvested and the number of
- 2 2 2 -

fishes harvested (e.g. through quotas) (Cinner & Aswani 2007) . These are
techniques similar to those used today and the 1300 reported MPAs worldwide
(Spalding et al . 2001) further reflect their value as a successful ly proven
management tool. Communi ty-managed marine reserves are another form of
management, often referred to as the most effective management system in the
tropics (White & Vogt 2000). These are often managed in partnership with other
stakeholders, including local governments. Non-Government Organisat ions (NGOs)
or the private sector.
A large percentage of establ ished MPAs is not effectively managed and have thus
been deemed 'paper parks' . Only 6 and 14 % of 285 rev iewed M P A s in the
Caribbean and Southeast Asia respectively, were found to be effectively managed
(Burke & Maidens 2004; Burke et al. 2002). The inability of MPAs to secure
sufficient funding has been identif ied as the most important barrier to successful
MPA implementat ion and long-term success (Dharmaratne et a l . 2000 ; Green &
Donnelly 2003). In several of these c i rcumstances, local hotels have taken over the
day-to-day management of the protected zone and , in some cases, full
responsibility for the reserve (entrepreneurial MPAs) (Colwel l 1999).
Of late, there have been several reported cases of hotels which have taken the
initiative of implementing, and subsequently managing marine reserves, termed
Hotel Managed Marine Reserves (HMMRs) , on their own, or in col laborat ions with
other stakeholders (e.g. (Teh et a l . 2007). They are thought to have been
established for a number of reasons: governments ' inability to satisfy the public
demand for nature conservat ion, in quality and quant i ty al ike; a growing societal
- 2 2 3 -

interest in biodiversity conservat ion; and the rapidly growing ecotour ism industry
(Langholz & Lassoie 2 0 0 1 ; Riedmiller 1999). Hotels also have the resources and
f inancial backing to protect adjacent coastal areas and, with the added incentive of
tak ing responsibi l i ty for the environment, they a re also secur ing a client base and
future business.
In a survey conducted with hotel guests at an HMMR in V ie tnam, it was found that
97.5 % (n=202) support HMMRs and 86.3 % (n=205) wou ld be wil l ing to pay extra
per room and night, to stay at such hotels (Chapter 7; Svensson et a l . 2008).
Severa l MPA managers recognise the value of user fees as an excellent and
accep ted way to ensure that the MPA is suff iciently funded (Arin & Kramer 2002;
Scura & van't Hof 1993). It has also been suggested that MPAs only become truly
successfu l and economical ly sustainable when they reach a self-f inancing status
(Davis & Tisdell 1996). Hotels general ly have the f inancial stability to provide long-
term f inancing (Colwel l 1999), and several HMMRs wor ldwide have implemented a
user fee system for their HMMR to help fund the management and maintenance of
the reserve, as wel l as pay staff, provide money for other mar ine conservat ion
pro jects, and of ten provide financial incentives to affected f ishing communi t ies to
help ensure compl iance.
H M M R s are frequently also required to pay a lease to the area-owning unit, which
cou ld be in the form of yearly contracts, making long-term conservat ion efforts
unpredic table, but they are general ly longer, last ing a decade or more and open for
renewal . Such leases are generally wel l accepted, especial ly in developing
countr ies, since they provide a stable source of income, whi le the effects of tourist
- 2 2 4 -

establishments may provide for additional and alternative livelihoods, which can
strengthen a community (Colwell 1999). Submerged land leasing is not a new
phenomenon, nor is it seldom. In researching the coastal states surrounding the
United States, Slade et al. (1997) found that nearly one third of submerged lands
were owned or leased by the private sector, developing marinas, private docks,
fisheries, aquaculture or other ventures. Leasing submerged lands for conservation
purposes is however relatively rare, even though it is, for example, possible, to
lease up to half of California's kelp forests, as well as sponge and soft coral
habitats in Florida (Beck et al. 2004).
Some protected areas have also been initiated and managed by hotels, only to be
expanded and relieved of management by a government body, after the
effectiveness of their conservation efforts become visible. These precursors to
government managed MPAs can be seen as costs saved by the government for an
area, othenwise previously needing protection (Langholz & Lassoie 2001). An
advantage HMMRs have to several MPAs is their general small size and the fact
that they are mostly adjacent to the hotel, making overseeing and patrolling the
area both easy and cost effective. Small no-take areas are also more likely to
result in a higher level of compliance than large, no-take zones that, by their nature,
will affect the socio-economic welfare of dependent communities (Unsworth et al.
2007). A trade-off is required between maximizing the size of the HMMR for
biological reasons, while still being small enough not to staunch spillover (Hastings
& Botsford 2003), and minimizing negative economic impacts on local communities
(Unsworth et al. 2007). Even though many of the HMMRs may be small in size, this
might not be adequate to deter poachers without patrolling boundaries, especially if
- 2 2 5 -

they realise that the effort of catching fish within the reserve is lower (Sethi &
Hilborn 2008). Small reserves are more vulnerable to poaching, so in order for
HMMRs to be effectively protected, committed cooperation and support from local
populations is essential (Wells & McShane 2004). Some evidence suggests that
while an HMMR may be generally well accepted, a relatively high level of
government involvement to verify the authenticity of the protection would be
preferable (Chapter 6). Advocating the benefits of protected areas, involving
communities from the start of the project, coupled with regular consultations with
local communities to ensure their well-being, as well as making sure promises are
kept, will greatly improve cooperation and compliance (Fiallo & Jacobson 1995;
McClanahan et al. 2005; White & Vogt 2000). The hotel may also be able to add
incentive to adhere to the no-fishing ban, by providing financial assistance to
affected communities or help establish alternative livelihoods by working with the
hotel or reserve, or helping to develop sustainable aquaculture.
In this chapter, the current status of some of the existing HMMRs today is analysed,
Through questionnaires sent to hotel managers, or managers in charge of the
HMMRs, 1:1) investigate some of the management strategies hotels have
employed to develop their HMMR; 2) rate the eco-friendliness of the establishment;
3) give a management rating for the HMMR; and 4) evaluate the acquired findings
to provide an overall assessment of the potential of a more widespread application
of HMMRs as an alternative management tool for protecting a part of our coastal
natural resources.
226

8.2 Methodology and study area
Questionnaires were sent to 56 hotel managers in tropical coral reef areas around
the world. Upon further research, only 30 were found to meet the requirements of
private management of marine reserves (Figure 8,1). The others did, however,
have marine projects and/or education or awareness programs managed by the
hotel. Some were already incorporated into government managed MPAs. After
several reminders in some cases, a total of 17 managers responded: 14 of the 30
hotels matched the HMMR criteria. This represents a response rate o1 47 %
(Figure 8.1).
Figure 8.1. World map indicating the locations of 30 Hotel Managed Marine Reserves (HMMRs) (grey squares) and the 14 which responded (black squares)
Three questionnaires were sent by email to the hotel owners, managers or
reserve-responsible persons. The primary questionnaire focuses on describing the
- 2 2 7

hotel, its reserve, manager perceptions and strategies. The second and third
questionnaires rate the hotel's eco-friendliness and reserve management, based
on satisfactorily fulfilled criteria. The details of each of these are outlined below.
8.2.1 HMMR survey
This questionnaire contained qualitative and quantitative, open and close-ended
questions, which consisted of several loosely defined sections. The first section
requested details on the operational aspects of the hotel, its location and
surroundings. The following section is dedicated to the reserve itself, including size,
protected habitats, HMMR regulations and year of establishment questions. Next,
the history, legal basis for establishment, reserve objectives and management
bodies, followed by HMMR financing details and potential advertising benefits,
were scrutinized. The next four questions refer to the perceived state of the reserve,
whether there is a noticeable change in biological parameters over time, how it
compares to adjacent similar unprotected areas and asks for apparent man-
induced damaging factors. The final question asks whether the hotel managers
think the reserve is effectively protected. The full questionnaire can be found in
Appendix 5.
228

8-2.2 HMMR rating
This questionnaire was modified from a survey created by the Coastal
Conservation and Education Foundation Inc. (CCEF 2006) to be appropriate for
HMMRs. The CCEF survey is an MPA management rating system intended to
assist local governments and communities to improve the management of their
MPA. Managers in this study were informed that the questionnaire is not an
officially legal document and can thus not be treated as such, but that it can give
them an indication of how the management of their HMMR rates compared with
officially established MPAs in the Philippines. They were asked to tick the criteha
which are fully satisfied or accomplished, the sum giving the unofficial rating (Table
8.1). To acquire the different levels, a minimum number of points (or percentage of
all requirements) have to be accumulated: Passing - HMMR is initiated (7 points -
17 %) ; Fair - HMMR is established (14 points - 33 %) ; Good - HMMR is enforced
(22 points - 52 %); Very good - HMMR is sustained (29 points - 69%); Excellent -
HMMR is institutionalised (38 points - 90 %).
The questionnaire is sectioned into five groups of management activities, which
should ideally have been accomplished within certain time periods. If the hotel is
proactive and has managed to complete later, more demanding levels earlier than
required, these would obviously also be included. A summary of requirements can
be found in Table 8.1 and the full questionnaire in Appendix 6.
229

Table 8.1. Details of management requirements of Hotel Managed Marine Reserves (HMMRs) which need to be satisfactorily fulfilled, (broken down to levels and time periods)
Level Reserve status
Time period Criteria fully satisfied
1 Initiated < 1 year
Local acceptance, biophysical baseline surveys, management body tentatively determined, management plan and objectives drafted, HMMR reserve legally established, information disseminated to guests and staff, boundary markers Installed
2 Established < 2 years
Biophysical surveys includes local participation, management body recognised, objectives adopted, education programs for staff, tourists & local community, management activities started e.g. surveillance, managing violators, user fees etc., reserve rules and guidelines posted, anchor buoys placed
3 Enforced > 2 years
Regular biophysical surveys with local participation, management body actively implementing management plan, regular education programs for staff, tourist & local community, funds allocated to maintain enforcement, no poaching events, Illegal fishing reduced by 50 % within 500 m of reserve
4 Sustained > 3 years
Biophysical analysis available, management body successfully runs reserve and management plans updated in a participatory process (e.g. amended with participation stakeholders), education programs for staff, tourist & local community maintained, no poaching events, illegal fishing stopped within 500 m of reserve, hotel is environmentally friendly and/or collects user fees as a sustainable financing strategy
5 Institutionalized > 4 years
Biophysical and socio-economic analyses available, management body capacitated for financial management and fund sourcing, management plan refined for adaptive management, education programs for staff, tourist & local community maintained, budget allocated from various sources, reserve expanded, additional marine conservation activities initiated, reserve used as a study site for public education or scientific research, local communities supported, environmental awards attained, reserve officially and legally recognised as an MPA.
8.2.3 Eco-friendliness
This questionnaire was adapted from Australia's eco-certification program
(Charters et al. 2003), which was established to help identify genuine nature
ecotourism establishments. The original survey was modified and shortened to
reflect only hotels' situations and possibilities. Managers were asked to mark the
230

criteria, which were fully satisfied or accomplished and were also informed that the
survey is not an officially recognised legal document, and they could therefore not
claim eco-certification based on the results. The total number of marks gives an
indication of the hotels' environmental policy and provides a rating on the hotels'
eco-friendliness. The rating system is similar to the HMMR rating, whereby the
level of eco-friendliness is determined by accumulated points, or percentage of the
total number of requirements which need to be fulfilled, although to a tougher rating
system (Passing - 25 points (49 %), Fair - 30 points (59 %) , Good - 35 points
(69 %), Very good - 40 points (78 %); Excellent - 46 points (90 %).
The questionnaire is split into seven categories representing various aspects of
eco-friendly activities hotels could pursue. An illustration of these categories is
provided in Figure 8.2 and the questionnaire can be found in Appendix 7.
23

Waste water management
e.g. secondary treatment, proper discharge of treated effluent
Waste minimization
e.g. recycling organic waste composting, litter management
Nature Disturbance
e.g. pesticides & herbicides pollution avoided land erosion contained
EcO friendliness criteria fully
satisfied Energj
consumption e.g. altemative energy sources, various energy saving activities
erformed
Low impact materials used
e.g. local building materials used, no toxic materials used on structures
Water conservation
e.g. aerated taps low-flush toilets, irrigation water from treated waste water
Noise and air quality
e.g. adequate insulation around noisy machinery C F G emissions avoided
Figure 8.2. Details of eco-friendliness requirements of Hotel l^anaged IVIarine Reserves (HMI\/IRs) which need to be satisfactorily fulfilled (broken down to 7 conservation topics)
The author is fully aware of the limitations of these surveys. The results will be
biased, since hotel managers will most likely embellish certain aspects to make
their establishment look better and under-represent others to create the same
effect. A more reliable approach would have been to travel to these hotels
personally to verify and triangulate the attained data or to employ the services of
local NGOs to conduct the surveys. Unfortunately such a thorough research design
232

was not possible, making the second-best option the only option. The author will
seek to interpret the data bearing these biases in mind.
8.3 Results
8.3.1 HMMR survey
The locations, HMMRs strategies, size and class of hotels, as well as size of the
reserves and different marine conservation projects varied greatly. HMMRs have
been reported across all the Indo-Pacific, protecting reserves as small as 1 ha to
700 ha (average 110 ha +/-13.22 SE) and the full range of coral reef ecosystems
(Table 8.2). The hotels themselves range from no stars to top of class, 5-star
resorts, with as few as 7 bungalows to massive 547 room complexes (average 90
rooms +/- 9.70 SE), with a rack rate ranging between US$ 70 - 960 for a double
room and night (average US$ 309 +/- 15.46 SE). The average yearly occupancy
was 67 % (+/- 0.68 SE), the average length of stay, 6.5 days (+/- 0.40 SE),
average return guests, 26.5 % (+/- 2.11 SE) and 10 of 14 hotels which replied,
employed more than 90 % local staff, with an average workforce of 104 per hotel
(Table 8.2). Most of the hotels are located on Islands (79 %) and from the 9 hotel
managers who answered, the number of resident fishermen within 1 km ranged
widely (0 - 1500), with an average of 200 (+/- 38.72 SE).
233 -

Table 8.2. Operational, reserve and location details of the 14 Hotel Managed Marine Reserves (HMMRs). listed alphabetically by country
Hotel Name Country Area (ha)
Protected latxtats
Protection Star rating
Ave. lengtfi Of stay (days)
occupancy (%)
Return guests
(%)
Rack rate $US
No. Rooms Staff
4o. ocal jtaff
ocation Hotel Name Country Area (ha)
Protected latxtats
Protection Star rating
Ave. lengtfi Of stay (days)
occupancy (%)
Return guests
(%)
Rack rate $US
No. Rooms Staff
4o. ocal jtaff
rhe Rarotongan Beach Resort and S p a
Cook Islands
38 3oral Reefs No take zone (Raui)
4 6 75 30 265 159 160 00 sland
Beachcomber Island Resort
F.J. 245 Zofai reef. >eagrass 5eds
No take zone (Tabu)
3 3.5 67 12 200 38 70 70 sland
^avini Island resort
Fiji 16 Zofa\ reefs No take zone (Tabu)
4 7 50 40 360 10 36 34 sland
Treasure Island Resort
F.,. 270 Zo(a\ reefs No take zone (Tabu)
4 NA NA NA 542 66 112 111 sland
Selayar Dive Resort Indonesia 145
Coral reef. seagrass beds
No take zones
NA 15 70 30 166 8 20 18 sland
Taman S a n Cottages
Indonesia 2 Coral reefs No-take zone
NA NA 50 NA too 39 50 60 Mainlanc
Wakatobt Dtve Resort Indonesia 700
Coral reel. seagrass beds. hiangroves
No-take zor>e / traditional fishing by kx:als permitted
NA 10 NA NA 300 26 149 [l35 islarKi
Four Seasons . Landaa Giravaru
Maldives 15 3oral reefs No-take zor>e 5 5.5 68 NA 960 102 300 too Sland
Palau Paattc Resort Palau 1
Doral reel. >eagrass Deds
No-take zone
5 5 75 25 255 160 225 195 Island
Alegre Beach Resort
Philippines 16
Doral reef. >eagrass aeds. Ttacro algae
No take zone
NA 3 65 NA 315 38 120 116 ^ainlarK
Duka Bay Resort Irx:.
Philippines 40 I ^ a l reefs, nacro algae 3eds
No take zone
NA NA 80 60 70 30 32 32 ^ i n l a n c
Shangri-las ^4actan Resort and Spa
Philippines 5 Doral reefs No-take zone 5 NA NA NA 230 547 NA •JA Islarxj
Chumbe Island Coral Park Lid.
Tanzania 30
: ^ a l reef. >eagrass 3eds. nangroves
No take zone
NA 2 75 400 7 43 41 Sland
iVhale Island Resort
Vietnam 16 Coral reefs No take zone
NA 4 60 c. 160 32 35 32 Island
234

8.3.1.1 Basis for reserve establishment
The oldest reported HMMR (40 years) is the 245 ha reserve, managed by the
owners of Beachcomber Island Resort, Fiji. Several other HMMRs were similarly
found in the South Pacific, where there is a strong tradition of community-level
ownership of marine resources. Here, the fishing rights (Qoliqoli) belong to the
land-owning unit (individual, family, clan, community). The hotels abide by the
customary management rights/bans (Tabu, Raui; no-fishing or extraction of living
organisms, or any activity that could damage the reef), while having the rights to
stop outsiders accessing the inshore marine resources (Ruddle 1996) (Table 8.3).
Apart from the reserve managed by the Four Seasons, Maldives, which only has
an unwritten understanding with local communities to honour the no-take zone, the
remaining HMMRs are reported to being officially recognised by the local, regional
or national authorities. Many of these have financial agreements with the local
governments and some claim to be giving separate financial support or providing
other services to local communities and affected fishermen - also sometimes from
collected user fees (Table 8.3).
235

Table 8.3. Details of the management strategy, objectives and additional environmental projects of the 14 HMMRs, listed alphabetically by country
Hotel Name Country Year EstabI ished
Basis background for reserve establishment Additional projects Objectives Annual reserve costs
Effectively protected
The Rarolongan Beach Resort and Spa
Cook Islands
2000
The area or Raui is owned by a local family, who bought the land rights in 1978 when the government became insolvent The hotel has leased the Raui for 50 years and pays an annual lease > 1 % turnover to the landowning family
Clam reseeding To protect the marine environment and attract tourists
NA Y e s
Beach comber Island Resort
F.,. 1969 Island and seas are leased (2 5 % of turnover). Customary fishing rights Ooliqoir from landowning matagah clan approved no take zone and give the hotel powers to police it
Yearly Crown of Thorn extractions To stop decimation of marine life through fishing and to attract tourists
800 Y e s
Navini Island resort
Fiji 1989 Reef Protection Agreement (lease) with local chief Annual payment (US$ 1500) made upon renewal of agreement Monthly amount paid (US$ 400). provided no take agreement has been upheld
Coral reef monitoring conducted by Coral Cay Conservation and the Mamanuca Environment Society. Educational and awareness building workshops with member resorts, tourism and business operators Yearly donations to local school projects and books
To establish a reef system that would remain in its natural state, to be enjoyed by visitors to the area
5000 Yes
Treasure Island Resort
F.]. 1975
Island and fishing rights Qoliqoir owned by theTokatoka Nakelo from the Matagali clan. Leased (99 years) by Treasure Island Resort Ltd.. which is partly owned (50 %) by their company; Nakelo Ltd. 4 Hunts Investments Ltd Landing fees from non guests collected Wardens report non compliance, who alerts the village head, who alerts the Fisheries Department officials
Coral reef monitoring. Coral transplanting. Giant clam reseeding Green G\6be benchmarked since 2003
1 Save coral communities in order to help increase fish stock 2 Preserve our Marine Biodiversity 3. Help recover community livelihood for the betterment of our future generations
NA
No-poaching takes place
Selayar Dive Resort
Indonesia 2000
45 ha m front of resort and 100 ha 5 km further away Agreement/contract with government, patrolled by local police Island IS owned and taxed. User fees (US$ 13/gue8t & liveaboard visitor diver) split between local tourism organisation (60 %) and local villages (40 %) An additional US$ 13 given to local villages if no fishing takes place in the no take zone during the fishing season
Coral reel monitoring To protect the area NA
Yes but with minimal poaching
Taman San Cottages
Indonesia 2008
Approved by government after betng proactive for several years in the Reef Restoration Project ( B O R O C K ) . established m 2002. 10% of every dollar spent with Bali Diving Academy Pemuteran goes to the local community
BKDROCK (TM) reef regeneration project Involved in training programs, scientific studies and environmental audits Awards attained
To restore damaged coral, re establish marine ecosystem, protect surrounding areas, educate locals
2500
Y e s but with minimal poaching
Wakatobi Dive Resort
Indonesia 2002
A pilot leasing project of the Collaborative Reef Conservation Program concept was approved by the district government and launched in 1998. turning 6 km of reef into a no take zone Protection expanded to include all 17 adjacent communities, stretching over 20 km Community adheres to business agreement, villagers patrol area, enforce and maintain compliance
Coral reef monitoring Sponsoring Schools with education material, waste management facilities m surrounding villages, electhdty to nearby village, scholarships for orphans, credit scheme for small businesses, public awareness meetings atx)ut conservation etc Several environmental awards attained
To maintain and improve long term the most important business asset for the promoted world c lass diving product, by respectir>g the local communities owning the rights to exploit the resources. Cooperation and financial incentives instead of a fence and fine policy* A business approach to conservation
250000 Y e s
Four Seasons. Landaa Giravaru
Maidi\«s NA Island IS leased and surrounding reefs are protected by hotel marine staff Unwritten agreement for no fishing
Coral reef monitoring Established research centre tracking tagged mania rays and monitoring marine mammals, deployment of 300 artificial reefs, awareness building sessions on marine life and conservation, capturing commeraally high valued ornamental pxjst larvae fish, which are grown and exported into the ornamental fish trade
To protect the reefs for ttie tjenefit of the local ecosystem and for our guests
NA
Yes but with some turtle egg poaching
ON

r -J
- J
Palau Pacific Resort Palau 2002
Sanctioned by Koror state government and local communities alter several years negotiation and education programs with the local communities of reserve benefits No tax or lease is paid Resort patrols area and reports to government rangers
Education program lor hotel guests {Clam Planting Program) Education programs for local villagers
Improving and protecting the quality ol the environment around the area lor our luture generations to enjoy
1900 Yes
Alegre Beach Resort Philippines 1995
Municipal Ordnance passed and loreshore lease paid by sister company (US$ 550). Protection accepted after many years of proactive reef conservation work and talks with local fisher folk and public consultations, before being considered at the local barangay level and then the municipal level Passing boats are charged mooring lees (US$ 10 5) and divers (US$ 3.2)
Coral reef monitoring Helped establish, maintain and monitor 8 local government-unil managed MPAs Several research studies conducted with a university Presented in the ITMEMS 2 (International Tropical Marine Ecosystems Symposium 2) as an example ol a resort based marine sanctuary Two teacher salaries paid Artificial reels, sea grass bed planting, desiltalion of reef, reseeding giant clams, mussel culture for alternative livelihoods and others m planning Crown of Thorn and drupe shell extractions Environmental awards attained
Preservation and development ol the environment • both terrestrial ar>d aquatic
50000
Yes but with minimal poaching
Duka Bay Resort Inc Philippines 1997
Municipal ordinance Nr 97-199 Protected and managed by the aqua sports manager Duka reef divers in collaboration with Xavier University and the Philippine army
Coral reef monitoring Coral transplantation activities using Acaniasia Module'. (Silver award in Holcim Sustainable construction competition (Regional) lor Asia Pacific region 2005 Also creating local livelihoods Education programmes established
To restore corals and lish diversity to the area
2100 Yes
ShangrI la's Mactan Resort and Spa
Philippines 2006 Lapu Lapu City Ordinance 425 B 2006. User fees (US$ 3 for divers and US$ 1 5 for snorkellers) are split between the local government, the three managing stewards and local fishermen
Coral reef monitoring with reef check since 2003, coral recovery programs, giant clam program. Proposal to establish a marine learning centre Education programmes established
To attain food security and to enhance marine resources t>ased on ecotourism. consistent with the principle of sustainable development. To enhance optimum ecological biodiversity and protection of the area
NA Yes
Chumbe Island Coral ParK Lid
Tanzania 1994
Fisheries Act 1988, Investment Protection Act 1986 1991-1992 Negotiations on Investment Plan including gazetted MPA & Forest reserve, 1992 Chumbe Island Coral Park Ltd (CHICQP) founded. 1992 Provisional reef closure, first rangers employed, posted and trained, baseline surveys started. 1993 Landlease on Island granted. 1994 Gazettement Advisory committee include government departments, university and representatives of adjacent fishing villages
Coral reef monitoring and research conducted by several research students yearly Crown of Thorn removal The Chumbe Education Program sponsoring children matenals and teacher training (450 teachers up to 2007) Several environmental and awareness awards attained
To manage, for conservation purposes, the Chumbe Island Reef Sanctuary and the Chumbe Island Closed Forest Habitat This includes educational and commercial activities related to the non consumptive use of the above mentioned natural resources and doing all of such other things as are incidental or conducive of the above object
75000 Yes
WhaJe Island Resort Vietnam 2000
Lease from local government (US$ 15.000 for part of Island 600 m radius around resort) Fishtng families consulted before protecting 11 ha. Another 5 ha protected since 2005. Local coast guard can be contacted in case of poachers
Artificial reefs and Fish Aggregating Devices constructed Funded the building of a local temple Funded author lor marine monitoring surveys
Protect the seas and ensure only low impact on land 5000
Yes but With minimal poaching

8.3.1.2 Marine conservation projects
All hotels actively pursue additional marine conservation projects. The number and
complexity of these projects varied from hotel to hotel, ranging from Crown of
Thorn starfish (Acanthasterplana) extractions, to multi-featured research projects,
conducted with researchers from various universities, or on-site marine biologists
(Carran 2003; CHICOP 2008; Duka Bay Resort; Scuba Diver Magazine 2004;
Tuxson 2005; Wakatobi Dive Resort 2008). 10 of 14 hotels constantly monitor the
state of the HMMR on their own or with affiliated environmental agencies and half
have constructed artificial reefs for their coral transplantation projects. Taman Sari
Cottages, Indonesia, even legally established an HMMR, thanks to their many
years of work with their reef restoration project (Scuba Diver Magazine 2004). 9
hotels also report being very active in public awareness programs, both for staff
and tourists, as well as local communities (Table 8.3).
8.3.1,3 Finances
Several hotels were reluctant to provide financial information on the reserve's cash
flow, but the few existing examples provided interesting figures. The Wakatobi Dive
Resort. Indonesia profess to paying US$ 250,000 annually to village councils,
covering the lease for 17 adjacent communities, on top of various other community,
and environment-supporting activities (Table 8.3). The Chumbe Island Coral Park
Ltd (CHICOP), Tanzania, and Alegre Beach Resort, Philippines, equally claim to
be paying large amounts to maintain their HMMRs. The lease on at least the
- 2 3 8 -

Rarotongan Beach Resort and Spa, Cook Islands, and Beachcomber Island Resort,
Fiji, reserves is paid according to the hotels' yearly turnover. Only CHICOP, Four
Seasons, Maldives and Taman Sari Cottages, Indonesia, receive small grants.
CHICOP receives a government grant for their education program, and the latter
two receive funding from private donations. The remaining pay from the revenue
incurred from their business and/or through guest user fees. Most hotels did not
wish to show exactly how expenses are broken down, but all claim to have security,
staff or marine wardens to protect the reserves from poaching.
8.3.1.4 Enforcement
In the South Pacific, a copy of the agreement with the land owning unit showing
extractive bans is shown to poachers. The owners are duly notified and can take
appropriate actions. Most of the other hotels claim to have an official authority
(police, military, coast guard or government wardens), who can be contacted if
poachers are found within the reserves. Selayar Dive Resort has a slightly different
approach, where additional financial incentives are only paid in full if there is
compliance with the no-fishing rule. Patrolling of the Taman Sari HMMR is financed
by local businesses and Wakatobi Dive Resort sponsors patrol boats, and
representatives from the local villages enforce and maintain compliance. All apart
from the manager at Treasure Island Resort perceive the reserve to be effectively
protected, but several do admit to limited instances of poaching (Table 8.3).
-239

8.3.1.5 Objectives
It seems most hotels do not have predetermined objectives for their HMMRs, but
generally the owners and managers suggest that their main concerns are for the
well-being and betterment of the environment. Some maintain awareness and
education objectives, and several affirm a business approach to attracting tourists
(Table 8.3).
8.3.1.6 Advertising
Only half the hotels advertise their HMMR, but nnany that do, report benefits from
their cause-related marketing. The hotel managers were asked to indicate if they
believe that their HMMR status has increased their yearly occupancy, guests"
average length of stay or the number of return guests and if so, by what
percentage (Table 8.4). The managers, who hazarded an estimate, implied
substantial increases for yearly occupancy and number of return guests in
particular.
Table 8.4. A list of hotels which advertise that have a Hotel Managed Marine Reserve (HMMR), including the perceived influence of HMMR marketing on occupancy, average length of stay and number of return guests
Hotel Occupancy {%) Ave length of stay (%) No. return guests {%) The Rarotongan Beach Resort and Spa
5 -10 5 - 1 0 5 - 1 0
Navini Island resort 5 - 1 0 5 - 10 5 -10 Treasure Island Resort >20 Don't know >20 Selayar Dive Resort Don't know Don't know Don't know Wakatobi Dive Resort 10 -20 <5 >20 Duka Bay Resort Inc. Don't know Don't know Don't know Whate Island resort Don't know Don't know <5
240

8.3.1.7 Biological status
Hotel managers were asked how they perceive the state of their reserve in terms of
abundance of organisms, diversity of species and coral and algae cover (Figure
8.3). The majority of hotel managers reported high or fairly high for most
parameters apart from algae cover, which was rated lower. A follow-up question
requested managers to suggest how they perceive these parameters to have
changed since reserve establishment. Only 6 managers partially answered these
questions, often because they themselves had not worked with the hotel since
reserve inauguration. Of the responses received, however, the managers affirmed
an average positive growth of marine life: fish species richness (40 %) , fish
abundance (160 %), coral diversity (27 %) , coral cover (28 %) and invertebrate
abundance (48 %). To conclude the perceived biological effectiveness of HMMRs,
managers were requested to compare their HMMR with similar unprotected areas,
which resulted in extremely favourable results for the HMMRs (Figure 8.4).
241

species richness
Fish abundance
Coral diversity
Coral cover
Algae cover
Invertebrate abundance
3 4
Number of hotels
Figure 8.3. The perceived state of species richness, fish abundance, coral diversity and invertebrate abundance inside the Hotel Managed Marine Reserves (HMMRs), ranging from high, fairly high, average, fairly low and low. For coral cover and algae cover: high (>75 % ) , fairly high (50-75 %) , average (25-50 %) , fairly low (10-25 %) and low (<10 %) (black - white shading)
Species richness
Fish abundance
Coral diversity
Coral cover i
Algae cover
Invertebrate abundance
6 8
Number of hotels
10 12 14
Figure 8.4. The perceived state of species richness, fish abundance, coral diversity, coral cover, algae cover and invertebrate abundance inside the Hotel Managed Marine Reserves (HMMRs) compared with unprotected areas, ranging from much higher, higher, no change, lower and much lower (black - white shading)
242

8.3.1.8 Anthropogenic damaging factors
From a range of proposed options, managers were invited to identify man-induced
damaging factors to their surrounding area, or provide alternative suggestions
(Figure 8.5). Damage from fishing activities and coastal development were the
most reported activities.
Destructive fishing
Coastal development
Sewage discharge
Damage from tourists
Anchor damage
De lor eslation-sedimentation
Fertilizer runoff
Mangrove harvesting
Coral mining
Maricutture
10 1 2 Number of hotels
Figure 8.5. Anthropogenic factors identified by hotel managers causing damage to their surrounding coral reef ecosystem
8.3.2 HMMR rating
Of the 14 hotels that replied, only 12 completed the HMMR rating survey; 10 had
not been in operation long enough to complete all 5 levels (4 years or older). A
break-down of the number of hotels fully satisfying the requirements at each level
(representing stages of HMMR qualification within suggested time periods) can be
2 4 3 -
found in Figure 8.6. A high number of hotels suggest they are providing education
programs for staff, local communities and tourists, while structured management
activities and regular monitoring of the reserve with local participation seem to be
slightly under-managed. Only one hotel has managed to attain funding from the
government or other funding group and half pf the HMMRs actively support local
communities through financial means, on top of the required leasing fees to the
property-owning clan or local government.
2 4 4 -

Biopht^sicdl baseline surveys
Management body tentatively deteimined
Management plan & objectives drafted
Staff awareness programme
Local acceptance
Information disserrdnated to guests
Boundary markers installed
H M M R leagally established
I. n = 12
Biophysical surveys with locals
Management body recognised
Management plan & objectives adopted
Management activities started
Staff education programme
Community education program
Tourist education programme
Anchor buoys placed
Reserve rules and guidelines posted
Regular biophysical surveys with locals
Management body active
Funds allocated to maintain enforcement
Education programmes for staff and locals
Tourists education programme
No poaching events
Illegal fishing ieduced by 50 'A within 500 m
10
I. n = 12
14
3. n = 10
Biophysical analysis available
Management body successfully runs reserve
Management plans updated
Efiviior^mentallg fliendty and/oi uses user fees
Education programmes for staff, locals h tourists
Enforcement system fully operational
No poaching oi illegal activities wUhin 500 m
4. n = 10
Biophysical and socio-economic analyses
Management body responsible (or fund souicing
Management plan refined
Budget allocated from various sources
Enwronmental awards attained
Education programmes for staff, locals & tourists
Local communities supported
Reserve used as a research study site
Reserve eipanded
Additional marine conservation activities
Reserve recognized as an M P A
5. n = 10
Figure 8.6. A break-down of number of hotels fully satisfying Hotel Managed Marine Reserve (HMMR) management requirements at each level: 1. HMMR initiated, 2. HMMR established, 3. HMMR enforced, 4. HMMR sustained, 5. HMMR institutionalised
245 -

As the levels increase, the requirements become more challenging to fulfil, which
has duly led to a decreasing average score per level (Table 8.5). Several hotels,
including CHICOP. Tanzania, Wakatobi Dive Resort. Indonesia and Alegre Beach
Resort, Philippines, scored extremely high (>38 points), awarding them
an "Excellent - marine reserve institutionalized" (Figure 8.8). These three resorts
are also the hotels which have spent most money on their HMMRs (Table 8.3).
There is a larger group of hotels scoring Good' or Very good' (>22 or >29 points):
Navini Island resort, Fiji, Palua Pacific Resort, Palau. Duka Bay Resort Inc.,
Philippines, Taman Sari Cottages, Indonesia and the Rarotongan Beach Resort
and Spa. Cook Islands (Figure 8.8). The final 4 hotels score either passing or fair
(>7 & >14 points), but 2 of these could only complete the first three levels. The
average score of 25 points puts HMMRs in a solid *Good - HMMR is enforced'
category (Table 8.5).
Table 8.5. Average scores of fully satisfied Hotel Managed Marine Reserve (HMMR) management requirements per level (SE). the score range of these and the average score from the number of questions (%)
Level Average score (SE) Range Average score (%)
Initiated (score out of 8) 7.0 +/-0.09 (n=12) 5 - 8 87.5
Established (score out of 9) 6.2 +/-0.17(n=12) 3 - 9 68.5
Enforced (score out of 7) 4.6 +/- 0.17 (n=10) 2 - 7 65.7
Sustained (score out of 7) 4.1 +/- 0.26 (n=10) 0 - 7 58.6
Institutionalised (score out of 11) 5.7 +/- 0.33 (n=10) 0 - 10 51.8
Average total score (42) 25.2 +/- 0.86 11 - 41 59.9
-246-

8.3.3 Eco-friendliness survey
All 14 hotel managers completed the eco-friendliness survey. A total of 51
questions were asked, divided into 7 conservation topics. The results suggest an
average 71 % satisfactorily fulfilled criteria, which gives an average eco-
friendliness rating of 'Good'. Waste water management was best practiced by
hotels; noise and air quality, the least (Figure 8.7).
Waste water management
Waste minimization
Energy consumption
Water conservation
Noise and air quality
Low impact materials used
Nature disturbance
Average total score
3^
3^
3 ^
10 20 30 to 50 60 70 80 90 100
Figure 8.7. Hotels fully satisfying eco-friendlrness requirements per environmental category (average scores expressed as %, including average total score across all categories, +/- SE)
The results from the eco-friendliness survey were compared with the HMMR rating
survey, to give an understanding of how hotels' overall environmental policy
compares with their marine conservation projects (Figure 8.8). The majority of
hotels' environmental concept compared well with HMMR rating results, differing
by one rating or none, apart from 3 hotels, which stand out. Shangri-La's Mactan
Resort and Spa, Philippines and Selayar Dive Resort, Indonesia, scored much
247

higher on their eco-friendliness rating, than their HMMR rating. Vice-versa for
Taman Sari Cottages, Indonesia.
The Rarolongan Beach Resort and Spa
Treasure Island Resort -I Four Seasons, Landaa Giravaru
^ Selayar Di\e Resort f
^ Alegre Beach Resort [
Beachcomber Island Resort
Taman Sari Cottages
Duka Bay Resort Inc. f
Chumbe Island Coral Park Ltd. F
Palua Pacific Resort f
Shangri-la's Mactan Resort and Spa f
Wakatobi Dive Resort H
Whale Island resort F -i
Navini Island resort F -I 1 r -
1 2 3
Figure 8.8. A comparison of the hotels' achieved eco-friendliness rating (black) and Hotel Managed Marine Reserve (HMMR) management rating (Grey) (0: NA, 1: No pass, 2: Passing, 3: Fair. 4: Good, 5: Very good, 6: Excellent)
248

8.4 Discussion
There is no central database for HMMRs, which made finding suitable hotels for
this study difficult. The fact that only half of the hotel managers who responded
advertise their HMMRs suggests that many more HMMRs than the 30 identified in
this study are likely to have been established. Despite the relatively small sample
size, the 14 hotels detailed here provide an insight into the variety of HMMRs, their
basis for legally establishing marine reserves and information on how each is being
managed.
A wide range of hotels, in terms of size, luxury and location, has created HMMRs,
some dating back several decades (Table 8.3). The areas these hotels are
protecting are, in some cases, also relatively large. When comparing the sizes of
these HMMRs with recognised MPAs in the Philippines, only 26 out of 330 of these
MPAs were found to be larger than Wakatobi Dive Resort's HMMR (700 ha); 175
cover an area less than 15 ha (HMMRs: 3) and only 40 are larger than 100 ha
(HMMRs: 4) (CCEF 2008). Due to the low number of HMMRs investigated here, a
representative comparison cannot be accurately made, but it does show that a very
high number of MPAs in the Philippines are in fact relatively small. In contrast,
unlike government managed MPAs, which also protect very large areas (several
thousand ha), it is doubtful you'll currently find HMMRs much larger than Wakatobi
Dive Resort, Indonesia. The average 110 ha protected by these 14 hotels is,
however, a promising start to aid the global expansion of protected areas, if these
are proven capable of increasing fish stocks to sustain local fisheries.
- 2 4 9 -

In order for HMMRs to actively contribute to world conservation, a set of
requirements needs to be fulfilled for them to be more than just 'paper parks'.
Firstly, they need to be legally recognised, which all but one hotel has
accomplished, either by municipal ordinance or lease contract with the land-owning
unit. This ensures that legal steps can be taken in case fishermen are found
poaching in the reserve (Depondt & Green 2006). Results from the community
perceptions surveys (Chapter 6) indicate that fishermen would be more inclined to
respect reserve boundaries if there is a strong government presence legally
validating protected areas.
Guidetti et al. (2008) similarly suggested that adequate enforcement support with
legal representation is necessary to successfully manage MPAs. Most HMMRs
have some kind of boundary marker system in place: several areas are enclosed
with buoys, others have marker buoys, and some have painted markers on the
equivalent coastline. The areas are either kept under surveillance from the resorts
by security staff or reserve wardens if the area is small enough. Others are boat-
patrolled by the hotel or by local communities if the areas are larger. In the Pacific
Islands, the landowning unit, which has the power of legal action, is informed of
poaching activities. For the other hotels, non-compliance is dealt with by
government representatives or local community chieftains. They have the power to
give fines, confiscate gear and in extreme cases, the vessel. How quickly these
can act on individual poaching occurrences is not clear, but all hotels except for
one claimed that their HMMR was effectively protected, although some admit to
infrequent poaching events (Table 8.3). However, only approximately two thirds of
the hotels claimed that poaching and illegal activities had been reduced or stopped
-250-

inside the reserve and within 500 m of the reserve, suggesting that some hotels
are either reporting incidences of fishermen 'fishing the line' (Figure 8.6) or that
managers are under-representation non-compliance incidents, or a combination of
both.
To try and help reduce non-compliance, a few hotels provide additional financial
incentives to local fishermen/communities if the no-fishing ban is upheld, with the
cash amount rewarded decreasing with increasing number of offenders. In the
case of Wakatobi Dive Resort, Indonesia, adjacent villages are financially
protected by the 'Collaborative Community-based Reef Resource Management
Concept' (Wakatobi Dive Resort 2008), giving local communities strong incentive
to protect the reserve from poachers residing inside and outside the reserve
(>US$ 250,000). On top of additional financial support, one hotel even encourages
fishermen to inform on poachers for monetary gain. While this method may help
reduce non-compliance, it is questionable whether it is ethical or helpful in the long-
run, since it may irrevocably damage the hotel/local community relationship.
Francis et el. (2002) suggest that MPAs cannot succeed without support by the
local communities. While the majority of hotel managers clearly consider their
HMMR as being effectively protected, only half are providing additional support to
affected communities (Figure 8.6). Amongst others, added support has been given
in the form of financial compensation, educational funding, infrastructure benefits
or establishing alternative aquaculture (CHICOP 2008; Scuba Diver Magazine
2004; Tuxson 2005; Wakatobi Dive Resort 2008). These projects are additional to
the lease or taxation which is annually paid to the local government or land owning
-251 -

unit, which should ideally be used to help local communities or for Pacific Island
property, be distributed back to clan members. The large local community
workforce employed by hotels must also be taken into account as providing
alternative livelihoods. An average of 77 local people is employed by these hotels,
with 10 out of 14 hotels employing >90 % local staff. Further research into local
community perceptions of other HMMRs, such as described in Chapter 6, would
however be helpful to determine community acceptance and support.
A stable source of sufficient funding has been advocated crucial to MPA success
(Dharmaratne et al. 2000). This is fortunately less of a hindrance for HMMRs,
compared with MPAs, if the hotels continue to attract tourists. The future of tourism
looks promising in light of the ever expanding industry and the growing demand for
eco-tourism (Dharmaratne et al. 2000). While only three hotels receive grants to
aid their projects, a few others collect user fees from hotel guests or mooring and
diving fees from visiting boats and tourists, to help maintain the reserve or support
local communities. User fees are often described as accepted by tourists as a
direct means to contribute to conservation (Depondt & Green 2006; Tongson &
Dygico 2004). In Chapter 7,1 found that the majority of tourists are willing to pay
an extra 10 % of the room rate per room and night to stay at HMMRs, albeit, in
several instances with reservations, wanting third-party, guaranteed better
biophysical conditions in the reserve, transparency in cash flow and benefits to
local communities (Chapter 7; Svensson et al. 2008).
The financial requirements to maintain the various HMMRs differ radically however.
These ranged from approximately US$ 2000 to more than US$ 250,000 per year
-252 -

(Table 8.3), depending on the size of the protected area, the location, management
structure and agreements/contracts, as well as additional community support and
conservation projects. While the three most costly HMMRs to maintain also scored
highest on the HMMR rating survey (Excellent - HMMR is institutionalised) (Figure
8.8), the hotels scoring 'Good - HMMR is enforced' or 'Very Good - HMMR Is
sustained', only pay a few thousand per year to maintain the reserve. Some of
these have, however, smaller areas to protect and most are involved in fewer
supporting projects, or at least less costly.
The effectiveness of the HMMRs in enhancing the biophysical environment should
obviously be of top concern when considering HMMRs as an added potential future
tool for marine resources protection. Figures 8.3 and 8.4 display hotel managers'
perceptions of the biophysical state of their reserve and how it compares with
unprotected areas. While they mostly perceive the state of their reserve as 'high' or
'fairly high', for specifically coral and fish abundance and diversity, some do rate
these parameters as 'average'. When compared with unprotected areas, however,
these parameters are almost unreservedly rated as 'much higher' or 'higher' within
the reserve, suggesting that hotel managers may not necessarily have over
emphasized the state of their reserve, but comparatively, they certainly perceive
the biophysical state in the reserves as better than the surrounding unprotected
areas. These results must however be examined with caution, as they are not
empirical data or even third party data, but mere perceptions, which are likely to be
biased in favour of the hotel and its reserve. Most hotels do report regular reserve
monitoring (Table 8.3), albeit not always with local participation (Figure 8.6), so
physical evidence should be available, which managers could refer to. Copies of
- 253 -

these were, however, not requested for this survey. In addition, more HMMR
undenwater survey results over a time period, such as described in Chapter 4,
would provide more robust biophysical evidence of the ecological status of the
HMMR. The results of surveys dating back to reserve establishment would be
helpful to identify the effectiveness of the HMMR concept. In most cases, even a
perception of HMMR progression was not available here. The few managers who
had been present from the start of the HMMR stated that they had noticed
considerable improvements, especially in fish abundances, which coincidently
agrees with previous findings, where significant increases in fish stocks had been
observed in reserves of all sizes in a relatively short time once the reserve was
enforced (Halpern & Warner 2002). Such observations by hotel managers should,
however, once again be viewed with scepticism before proven objectively and
empirically.
No-fishing zones potentially achieve two things for fisheries management. They
provide insurance against unsustainable declines of species due to overfishing and
they supplement their production of fisheries species in the surrounding fished area
(Sale et al. 2005). This is crucial to achieve in order to justify the promotion of
HMMRs. Further research into the effectiveness of HMMRs at increasing spillover
of fisheries species is needed, but several studies from similarly small MPAs
provide evidence of such activities (Abesamis et al. 2006; Alcala et al. 2005). In
Chapter 6,1 show that the vast majority of fishermen, who fish within 200 m of
Whale Island Resort's HMMR boundary, had noticed a higher abundance of fish in
this area.
254

To further establish the effectiveness of HMMRs, managers were asked to
complete an HMMR rating questionnaire (Figure 8.6). This highlighted areas which
could be improved and the areas where the hotels are generally performing well. A
better structured and organised hotel managing body to implement management
plans and objectives, and which actively seeks funding sources and specifically
manages reserve finances, has been identified as under-developed. According to
the tourist willingness to pay survey discussed in Chapter 7, tourists would more
actively support HMMRs if a separate, or better defined managing body would
represent the marine reserve, especially when requested to pay user fees.
The HMMR management plan and objectives seem ill-defined, suggesting that
many of these had not been previously determined. Nevertheless, all hotel
managers express their wish to help protect the environment. Some objectives
include awareness building, while others also admit to business goals. This does
not seem to overly concern visiting HMMR tourists, as 97.5 % expressed support
for HMMRs, even though 12 % realised, and expressed the view, that the hotel
would also profit (Chapter 7; Svensson et al. 2008).
More of a concern for these tourists was that they required guaranteed better
biophysical conditions in the reserve when the reserve is advertised and when the
hotel demands user fees (chapter 7). An environmental agency with the power to
grant awards was suggested. In this study, it was found that only half the hotels
actually advertise their protected area and only one of these collects user fees. It
would be interesting to survey these tourists, and compare their support for
HMMRs to another hotel in this survey, which collects direct user fees from guests,
- 255 -

but does not advertise. Ahmed et al. (2007) suggest that with more awareness
campaigns, a larger WTP for the management of coral reefs can be attained. From
the few examples of the hotel advertising its reserve and environmental projects,
especially occupancy and number of return guests are perceived to have increased
as a result (Table 8.4), suggesting the effectiveness of cause-related marketing
and the growing interest in ecotourism. These findings can currently, however, not
be objectively confirmed, but they may nevertheless be viewed with optimism.
Advertising, actively involving hotel guests in marine projects and providing
education programs, which several hotels offer, will help raise awareness for the
need to protect our marine resources. Staff and local community awareness
sessions will also ensure added support for the protected areas (Alder 1996). It has
also been suggested that increasing public awareness, and gaining acceptance
from local communities before reserve establishment, will positively influence
hotel/community relations (Bunce et al. 1999). All hotel managers ensured that
local acceptance was sought and attained before reserve inauguration (Figure 8.6)
but, as with WIR, perhaps acceptance was only attained by limited members of
affected local communities. Community surveys, as described in Chapter 6, would
help clarify this, as well as give another, perhaps more accurate measure of
management performance.
The overall average score for the HMMR rating was 25.2 (Table 8.5), which places
the management of HMMRs in a solid 'Good - HMMR is enforced" category. When
compared with the available management ratings for 18 MPAs in the Philippines in
2005, this average score is higher than their average accomplished: 'Fair - HMMR
-256-

is established' (CCEF 2008). These scores can not be compared absolutely,
however, since some questions were changed to reflect an HMMR situation. Also,
the MPA management rating was only given after thorough investigations by a third
party, while the HMMR rating results were provided by resort managers, leaving
room for bias.
In Chapter 7,1 showed that tourists who were interested in hotels' environmental
policy were also willing to pay extra to stay at HMMRs, providing further evidence
of eco-awareness. Hotel managers were asked to complete an eco-friendliness
questionnaire to give an understanding of the hotels' general attitude to
environmental concerns (Figure 8.7). Most environmental categories were
relatively well fulfilled. Noise and air pollution, as well as water conservation
management were slightly under-managed. The low score for these two categories
can be partially explained by inappropriateness of the questions asked. This
questionnaire was constructed for a standard hotel, and does not leave room for
superfluous or alternative eco-friendly processes, which hotels may have,
depending on their specific situations or circumstances. The owners of Selayar
Dive Resort, Indonesia, for example, inform that they have a natural stream
running through the resort. With Its origin in the mountains, it provides a continuous
and high-pressured supply of fresh water. The goal of this questionnaire was,
however, not to go into specifics of hotels eco-friendliness, but to see if the hotels'
eco-friendliness matches their marine reserve management rating (Figure 8.8);
also giving a more holistic impression of the hotels' conservation-mindedness,
which could contribute to determining tourists' impressions of HMMRs. This could
perhaps give an indication of the direction of word-to-mouth advertising for HMMRs
-257 -

and willingness to pay user fees, since it has been recognised that tourists are
more inclined to pay, if they are interested in or provided with information on
environmental efforts and policies (Chapter 7; Dharmaratne et al. 2000) and their
stay surpasses their expectations (Ahmed et al . 2007; Lindberg 1991; Ross & Wall
1999). In most cases the hotels' overall environmental policy closely coincided with
the HMMR rating. Exceptions with two or more separating rating levels were
Shangri-La's Mactan Resort and Spa, Philippines and Selayar Dive Resort,
Indonesia, which scored higher on their eco-friendliness rating, and Taman Sari
Cottages, Indonesia, which scored higher on the HMMR rating survey.
Shangri-La's discrepancy is easily explained by the fact that the HMMR was only
established in 2006, and thus only completed the first two HMMR rating categories.
Selayar Dive Resort is on an island with no reported fishermen nearby; the nearest
city located 40 km away. This seclusion may partly explain the lower perceived
need for structured reserve management. Taman Sari Cottages, on the other hand,
had a higher HMMR rating than eco-friendliness. Here again, the eco-friendliness
questions may not be specific enough for the hotel's situation. The manager
explains that the area Is extremely poor and also very dry. They therefore, by
default, use very little freshwater, but do not have any specific water conservation
programmes. Their recycling efforts entail bringing the material to the mainland,
where it is thoroughly picked through by the local people. Most hotels, however, did
have a relatively high eco-friendliness rating, which tourists may notice, and which,
may potentially help promote the HMMR concept.
-258

These HMMR-related surveys show very positive and promising results. However,
to determine whether HMMRs have the potential to function as an alternative or
complementary tool to protecting at least a part of our degrading marine resources
on a global level, thereby sharing the financial burden with local governments, a
more objectively-conducted survey, and taking an ecosystem-based approach to
marine resources management, involving a greater number of HMMRs, will be
necessary. Albeit, keeping potential biases in mind, several hotels seem to exhibit
an extremely well-structured and well-managed approach to marine conservation,
and often, actively compensate and support local communities and provide job
security for a large number of people. Many hotels also, additionally, manage other
related marine conservation projects, which contribute to further ecosystem
conservation and awareness building. The biophysical state, especially fish stocks,
inside the reserves also seems to be improving, which could potentially lead to
higher catches outside the reserve. Further research into the effectiveness of
HMMRs as a fisheries management tool is, however, still needed. This is extremely
important, since most hotel managers report highest concerns from fishing
activities (Figure 8.5).
The research for this thesis suggests that the number of hotels establishing
HMMRs, or are actively involved in marine conservation, is increasing. Other hotels
have established and managed HMMRs, before another management body
assumed control (e.g. Lankayan Island Dive Resort, Malaysia; Teh et al. 2007),
and some provide resources and support to government-managed MPAs (e.g. El
Nido Resorts: Miniloc Island & Lagan Island, Philippines (Talbot & Wilkinson 2001).
Other private enterprises are also helping to manage protected areas. Managers
- 2 5 9 -

from six dive operations in the Gili Islands, Indonesia, for example, have founded
the Gill EGO Trust, which collects money from divers to fund a patrolling unit to stop
poaching in the 6 protected areas, give monthly cash allowances to local
communities as an incentive to increase compliance, and manage rubbish
collections (Gill Eco Trust 2009).
There is strong evidence of goodwill from the private sector, with many examples
of hotels going the extra mile to protect our environment. Some hotels, however,
have purely a business approach to potential conservation projects. One hotel
manager who was contacted in the course of this research, admitted to only
establishing an artificial reef to impress his clientele and to provide occasional
meals for his guests.
Establishing a centrally governed environmental agency for all HMMRs, or
expanding the award system of an existing, globally recognised environmental
agency (e.g. Green Globe) to monitor HMMR protection and to ensure affected
community involvement and support, may be a solution to sustainably expanding
the HMMR concept and guaranteeing the effectiveness of HMMRs. This could
furthermore, help raise awareness and consequential growth of protected areas,
potentially establishing a network of thousands of marine reserves, which is
suggested to increase fish assemblages and thereby, fisheries yield (Dawson et al.
2006; Roberts et al. 2001).
260

9. Thesis conclusion
More protected areas lining increasingly overpopulated and overfished tropical
coastal countries is considered a very viable option to help sustain nearshore
resources (Kleypas & Eakin 2007). This thesis proposes that hotels may be able to
help local governments protect small areas from fishing and damaging practices,
and help alleviate the financial burden such protections would inevitably entail.
Before such Hotel Managed Marine Reserves (HMMRs) can be considered,
however, an analysis of existing HMMRs is needed, establishing their worth at:
successfully improving the biophysical state inside reserves, increasing fish stocks
and providing spillover, being accepted and supported by the wider public and
especially by local communities.
The interdisciplinary approach of this thesis provides an enlightening holistic view
of the biological effectiveness and socioeconomic aspects related to the
management of an HMMR. It is aligned with the fundamental concepts of an
Ecosystem-based Management (EBM) approach, which is arguably one of the best,
relatively newly-emerged frameworks to successfully establishing and maintaining
Marine Protected Areas (MPAs). This integrated management approach considers
all aspects of the ecosystem, including humans, to maintain an ecosystem in a
healthy, productive and resilient condition so that it can provide the services
humans want and need (McLeod et al. 2005).
26

The Driving force - Pressure - State - Impact - Response (DPSIR) conceptual
framework model was used in this thesis, as it simplifies linkages of environmental
functions, identifying environmental and societal problems and solutions. These
indicators stress the cause and effect relationships between human activities that
exert pressures on the environment, condition of the environment, and the impact
on societies with a resulting policy change addressing these problems (Mangi et al.
2007), In this thesis, the major impact indicators identified livelihood concerns for
coastal communities following the establishment of HMMRs.
Consequently, surveys were conducted with a locally affected community of
fishermen (Chapter 6). The results of these surveys, however, showed ambiguous
results, making the interpretation of the welfare of the communities difficult. In
retrospect, it Is apparent that the survey design could have been improved upon.
Potentially biased, vague or unaccredited results were attained, which could have
been prevented. Instead of conducting two surveys: 1. Surveys distributed to
fishermen by the Chairman of the People's Committee, 2. Interviews conducted
with families at their homes, an individual, singular. Interview-based survey design,
involving a larger sample size (possibly also conducted with fishermen of other
nearby villages), performed by approaching fishermen as they are returning with
their catch, thereby avoiding the influential opinions of their elders at home and
possible biases resulting from the distribution and influence of the Chairman of the
People's Committee, may have provided a greater and more accurate
understanding of the management effectiveness of the HMMRs.
2 6 2 -

Similarly, a more encompassing set of results could have been attained if
interviewed surveys would have been conducted with tourists of the nearby city of
Nha Trang, and not only with guests of the hotel. Although the sample consisted of
a wide range of ages and income earners, the fact that they had all found their way
to the hotel (80 km from Nha Trang), demonstrates a similar mindset, which could
potentially have biased the results. Similarly, interviews with tourists in Nha Trang
may have provided a more nationality-balanced sample; a larger Asian
representation.
Establishing the management effectiveness of HMMRs through surveys completed
by hotel owners and mangers also provides a setting for biased results. The best
approach would have been for the author to travel to each location to conduct the
interviews and biological surveys personally, or for an impartial, third-party member
to do so. As this was not possible, the questionnaires were sent and returned by
email or completed via telephone interviews. Telephone interviews with all
managers would have been preferred, but this was not always possible due to
time-limitation of managers. Further, similar research as conducted in this thesis,
involving biological and socioeconomic surveys, but performed at several HMMRs
around the world, would be necessary to establish HMMR potential on a larger
scale. Such research would also give a better understanding of policy implications
that would need to be adopted for successful implementation and ongoing
management. Results here suggest that at least a nation-wide, preferably, a
globally established and reputed environmental agency, monitoring HMMR
initiation, integration and progress, would be important to make sure that the needs
of the environment, affected communities and hotel are equally considered.
-263 -

The biological surveys had a robust study design, but additional surveys to confirm
spillover of fish to fished areas would have strengthened the perceived convictions
of spillover uttered by many local fishermen, who confirm they fish adjacent to the
reserves. These mentioned an increase in the number of some groups of large
commercially valuable food fishes (e.g. Carangidae, Serranidae), although surveys
within the reserves found only relatively low densities of species belonging to such
families.
Nevertheless, similar to other centralized or community-managed MPAs of
equivalent size (Halpern 2003; Russ & Alcala 1989), the density, species richness,
average size and number of fish >15 cm at the 11 ha and 5 ha reserves at Whale
Island Resort (WIR), were significantly higher than unprotected areas. Particularly,
the 11 ha, 6-year protected Whale Island Bay reserve (WIB) showed successful
results following protection compared with control sites, providing shelter for 22
times the number of fish >15 cm, 2.9 times the density, 2.6 times species richness
and 1.5 times the average size (Chapter 4). Coral cover in the same reserve was
also 7 times higher on the rocky habitats, potentially as a result of inhibiting
destructive fishing techniques, such as hose and hook fishing and beach seining.
All surveyed fishermen whom had been inside the reserve confirmed the higher
abundances of biota in the reserves (Chapter 6).
The speed at which enforced protected areas can increase fish stocks is very
promising when considering establishing many more HMMRs. Already after half a
year, Whale Island Bay Peninsula reserve (WIBP) contained 13 times the number
of fish >15 cm compared with unprotected areas, representing an increase from 2-
- 2 6 4 -
9.4 % of the total fish population. This rapid increase in size following protection
confirms the findings of other authors (Halpern & Warner 2002; Roberts & Hawkins
1997). Enforcement was relaxed soon after this, however, giving rise to non
compliance, compromising earlier successes (Chapter 4). Small reserves are
consequently particularly vulnerable to lax enforcement (Roberts & Hawkins 1997),
where only a few poaching events can cause serious damage, negating many
years of protection, depending on the fishing technique used.
Results from these biological surveys suggest that HMMRs may be able to sustain
fisheries on a local level but more research pertaining to the optimal reserve size
needs to be conducted. PalumbI (2004) suggests that large reserves protect larger-
bodied species better than small reserves because they are more likely to contain
their home ranges, but in order to provide spillover, a larger size is less effective
because of the decreasing edge to area ratio (Hastings & Botsford 2003). Species
within small HMMRs (HMMR average: 110 ha +/-13.22 SE) may equally not be as
resilient to global pressures, such as natural disasters, disease outbreaks, global
warming etc., since they may not contain adequate genetic diversity to recover
from, or adapt to such events (Frankham 2005). However, Jones et al. (2009)
demonstrate that coral and fish populations are often partially self-replenishing,
even on reefs <1 km^, but are also linked to other populations 10-100s of km away
by larval dispersal. A network of HMMRs, though producing fewer larvae due to
their smaller populations, is therefore still likely to contribute to population
resilience and growth (Almany et al. 2009).
265
Privately managed marine reserves contributing to, or creating a network of
protected areas covering tropical coastal countries may be possible, but probably
only if an ecosystem approach to protection is employed and the principals of co-
management are introduced.
Hotels often have the funding, resources and incentive to protect coastal areas
from overfishing and destructive practices (Colwell 1999). These relatively
financially stable enterprises could secure adequate long-term funding (especially if
a user fee system were Introduced); a lack of which has been declared the main
factor leading to inadequate law-enforcement and the ultimate demise of an MPA
(Depondt & Green 2006; Dharmaratne et al. 2000). Private enterprises can lease
submerged lands for conservation purposes, although the leasing contract is time-
limited (mostly open to renewal), but generally well received as a regular income to
the region (Beck et al. 2004). Hotels have the staff and equipment to patrol the
predominantly overseeable boundaries and the legal power to enforce rules and
restrictions as stated in the property rights imposed by the government (Colwell
1999; Depondt & Green 2006). HMMRs can also be seen as money saved by the
government for areas otherwise needing protection (Langholz & Lassoie 2001).
They provide direct and indirect employment and regional income through their
tourism activities, while securing a market niche for their business, potentially
attracting eco-tourists and increasing occupancy and return guests.
The results of this thesis suggest, however, that it is more likely for HMMRs to
succeed if other stakeholders are more actively involved. Several local fishermen
expressed displeasure with the hotel and its reserve, indicating that they had not
- 2 6 6 -

been informed or been given the opportunity to voice their concerns. Many
fishermen would therefore welcome more government involvement, strengthening
the validity of the protected areas and they would appreciate feedback on reserve
progress. A relatively large percentage of tourists would also prefer an external
environmental agency to validate the proclamations of hotels with regards to
hypothetically advertised higher fish and coral diversity and abundances, especially
if they accept to pay a room surcharge to access the HMMR. A co-management
approach involving the hotel, affected communities, an environmental agency and
the government may therefore be a good combination. The environmental agency
and hotel could initially provide education programmes to local communities and
staff, explaining the potential long-term benefits of MPAs in order to gain trust and
support for the project, which should increase compliance. The government would
need to clearly state the property rights of the protection, including penalties for
non-compliance. A management board with stakeholder representatives would
introduce a management plan with objectives that maximises reserve potential for
conservation and fisheries purposes, while minimising the negative impact on local
fishermen. Perhaps an alternative livelihoods plan can be developed, until such
time as the reserve can at least match the losses incurred by the no-take zone.
The environmental agency could also monitor the reserve and provide regular
updates and act as an objective third party to resolve any potential conflicts. With
government involvement, it is also more likely that the lease of the protected area
will be offered on renewable long-term bases; tax reductions may be offered or the
government may even take over the lease completely (Colwell 1999; Riedmiller
1999).
267

With government involvement and an environmental agency (e.g. Green Globe)
setting standards and ensuring that these are adhered to in a large number of
HMMRs lining coastal countries, it may eventually be possible to create an
effective network of protected areas, with HMMRs and other MPAs building the
backbone of the network. By applying an EBM approach, involving all protected
areas, but also looking at protection on a broader, regional/national level, and
involving scientists to model a nation-wide network, taking the direction of currents,
diversity hotspots, larval dispersal distances, resource needs etc. into account, it
may be possible to build upon this backbone and create an effective system of
reserves offering refugia at various distances for adults, larval and propagule
dispersal and settlement, which can have a cumulative positive effect on fish
stocks (Dawson et al. 2006; Roberts et al. 2001).
268

References
Abelson, A., D. Weihs, and Y. Loya. 1994. Hydrodynamic impediments to
settlement of marine propagules, and adhesive-filament solutions.
Limnology and Oceanography 39:164-169.
Abesamis, R. A., A. C. Alcala. and G. R. Russ. 2006. How much does the fishery
at Apo Island benefit from spillover of adult fish from the adjacent marine
reserve? Fishery Bulletin 104:360-375.
Abesamis, R. A., and G. R. Russ. 2005. Density-dependent spillover from a marine
reserve: Long-term evidence. Ecological Applications 15:1798-1812.
Aburlo-Oropeza, O., E. Ezcurra, G. Danemann, V. Valdez, J. Murray, and E. Sala.
2008. Mangroves in the Gulf of California increase fishery yields.
Proceedings of The National Academy of Sciences of The United States of
America 105:10456-10459.
Adger, W. N., P. M. Kelly, and N. H. Ninh 2001. Living with environmental change:
Social vulnerability, adaptation and resilience in Vietnam. Routledge
Research Global, Great Britain (314 pp).
Adger, W. N., and C. Luttrell. 2000. Property rights and the utilisation of wetlands.
Ecological Economics 35:75-89.
Ahmed, M., G. M. Umali. C. K. Ghong, M. F. Rull, and M. C. Garcia. 2007. Valuing
recreational and consen/ation benefits of coral reefs - The case of Bolinao,
Philippines. Ocean & Coastal Management 50:103-118.
Aicala, A. C , G. R. Russ, A. P. Maypa, and H. P. Calumpong. 2005. A long-term,
spatially replicated experimental test of the effect of marine reserves on
269

local fish yields. Canadian Journal of Fisheries and Aquatic Sciences 62:98-
108.
Alder, J. 1996. Costs and effectiveness of education and enforcement. Cairns
section of the Great Barrier Reef Marine Park. Environmental Management
20 :541-551.
Aldridge, S. 2006. Marine bioprospecting, for novel drugs. Genetic Engineering
News 26 :1-+.
Allen, G., R. Steene, P. Humann, and N. Deloach. 2003. Reef fish identification:
Tropical Pacific. New World Publications, Inc., Jacksonville, Florida.
Allison, E. H., and F. Ellis. 2001. The livelihoods approach and management of
small-scale fisheries. Marine Policy 25:377-388.
Almany, G. R., S. R. Connolly, D. D. Heath, J. D. Hogan, G. P. Jones, L. J.
McCook, M. Mills, R. L. Pressey, and D. H. Williamson. 2009. Connectivity,
biodiversity consen/ation and the design of marine reserve networks for
coral reefs. Coral Reefs 28 :339-351.
Ambrose, R. F., and S. L. Swarbrick. 1989. Comparison of Fish Assemblages on
artificial And natural reefs off the coast of Southern-California. Bulletin of
Marine Science 44:718-733.
Anderson, S., and R. Newell. 2004. Prospects for carbon capture and storage
technologies. Annual Review of Environment And Resources 29:109-142.
Anderson, T. W., E. E. Demartini, and D. A. Roberts. 1989. The relationship
between habitat structure, body size and distribution of fishes at a
temperature artificial reef. Bulletin of Marine Science 44:681-697.
270

Andersson, A. J., N. R. Bates, and F. T. Mackenzie. 2007. Dissolution of carbonate
sediments under rising pC0(2) and ocean acidification: Observations from
Devil's Hole, Bermuda. Aquatic Geochemistry 13:237-264.
Arin, T., and R. A. Kramer. 2002. Divers' willingness to pay to visit marine
sanctuaries: an exploratory study. Ocean & Coastal Management 45 :171-
183.
Aseltine-Neilson, D. A., B. B. Bernstein, M. L. Palmer-Zwahlen, L E. Riege, and R.
W. Smith. 1999. Comparisons of turf communities from Pendleton artificial
reef, Torrey Pines artificial reef, and a natural reef using multivariate
techniques. Bulletin of Marine Science 65 :37-57.
Ashworth, J. S., and R. F. G. Ormond. 2005. Effects of fishing pressure and trophic
group on abundance and spillover across boundaries of a no-take zone.
Biological Consen/ation 121:333-344,
Aswani, S., S. Albert, A. Sabetian, and T. Furusawa. 2007. Customary
management as precautionary and adaptive principles for protecting coral
reefs in Oceania. Coral Reefs 26:1009-1021.
Ayre, D. J., and T. P. Hughes. 2O00. Genotypic diversity and gene flow in brooding
and spawning corals along the Great Barrier Reef, Australia. Evolution
54:1590-1605.
Ayre, D. J., and T. P. Hughes. 2004. Climate change, genotypic diversity and gene
flow in reef-building corals. Ecology Letters 7:273-278.
Badalamenti, F., A. A. Ramos, E. Voultsiadou, L. J. S. Lizaso, G. D'Anna, C.
Pipitone, J. Mas, J. A. R. Fernandez, D. Whitmarsh, and S. Riggio. 2000.
Cultural and socio-economic impacts of Mediterranean marine protected
areas. Environmental Conservation 27:110-125.
-271 -

Balmford, A., P. Gravestock, N. Hockley. C. J. McClean, and C. M. Roberts. 2004.
The worldwide costs of marine protected areas. Proceedings of the National
Academy of Sciences of the United States of America 101:9694-9697.
Barker, N. H. L., and C. M. Roberts. 2004. Scuba diver behaviour and the
management of diving impacts on coral reefs. Biological Conservation
120 :481-489.
Bateman, I. J. , I, H. Langford, R. K. Turner. K, G. Willis, and G. D. Garrod. 1995.
Elicitation and truncation effects in contingent valuation studies. Ecological
Economics 12:161-179.
Beck, M. W.. T. D. Marsh. S. E. Reisewitz, and M. L. Bortman. 2004. New tools for
marine conservation: the leasing and ownership of submerged lands.
Conservation Biology 18:1214-1223.
Beddington. J. R., D. J. Agnew, and C. W. Clark. 2007. Current problems in the
management of marine fisheries. Science 316 :1713-1716.
Bell, J. D., and R. Galzin. 1984. Influence of live coral cover on coral-reef fish
communities. Marine Ecology-Progress Series 15:265-274.
Bene. C , and A. Tewfik. 2003. Biological evaluation of marine protected area:
Evidence of crowding effect on a protected population of queen conch in the
Caribbean. Marine Ecology-Pubblioazioni delta Stazione Zoologica di Napoli
I 24 :45-58.
Berkes, F., M. Kislalioglu, C. Foike, and M. Gadgil. 1998. Exploring the basic
ecological unit: Ecosystem-like concepts in traditional societies. Ecosystems
1:409-415.
Blue Flag. 2008. Blue Flag beach criteria and explanatory notes 2008-2009.
Available at:
- 2 7 2 -

www.blueflag.org/publicattachment/explanatory%20notes/BeachCriteriaExpl
anatoryNotes2008.pdt. Accessed: Jan 2008.
Boersma, P. D., and J. K. Parrish. 1999. Limiting abuse: marine protected areas, a
limited solution. Ecological Economics 31:287-304.
Bohnsack, J. A. 1998. Application of marine reserves to reef fisheries management.
Australian Journal of Ecology 23:298-304.
Bohnsack, J. A., and D. L. Sutherland. 1985. Artificial reef research - A review with
recommendations for future priorities. Bulletin of Marine Science 37:11-39.
Borlone, S. A., T. Martin, and C. M. Bundrick. 1994. Factors affecting fish
assemblage development on a modular artificial reef in a northern Gulf-of-
Mexico estuary. Bulletin of Marine Science 55:319-332.
Bowen, R. E., and C. Riley. 2003. Socio-economic indicators and integrated
coastal management. Ocean & Coastal Management 46:299-312.
Boyle, K., M. Morrison, and L. Taylor. 2004. Why value estimates generated using
choice modelling exceed contingent valuation: Further experimental
evidence. Australian Agricultural and Resource Economics Society
Conference, Melbourne.
Braatz, S., G. Davis, S. Shen, and C. Rees. 1992. Conserving biological diversity,
a strategy for protected areas in the Asia-Pacific region. World Bank
Technical Paper, vol. 193. (66 pp).
Branden, K. L., D. A. Pollard, and H. A. Reimers. 1994. A review of recent artificial
reef developments in Australia. Bulletin of Marine Science 55:982-994.
Brokovich. E., A. Baranes, and M. Goren. 2006. Habitat structure determines coral
reef fish assemblages at the northern tip of the Red Sea. Ecological
Indicators 6:494-507.
- 273 -

Bromley, D. W. 1991. Environment and economy: property rights and public policy.
Basil Blackwell, Oxford. UK. (250 pp).
Browman. H. I., and K. I. Stergiou. 2004. Perspectives on ecosystem-based
approaches to the management of marine resources. Marine Ecology-
Progress Series 274:269-270.
Brown, B. E. 2000. The significance of pollution in eliciting the 'bleaching' response
in symbiotic cnidarians. International Journal of Environment And Pollution
13:392-415.
Brown, B. E., K. R. Clarke, and R. M. Warwick. 2002. Serial patterns of biodiversity
change in corals across shallow reef flats in Ko Phuket, Thailand, due to the
effects of local (sedimentation) and regional (climatic) perturbations. Marine
Biology 141:21-29.
Bruno. J. F.. L E. Petes. C. D. Harvell, and A. Hettinger. 2003. Nutrient enrichment
can increase the severity of coral diseases. Ecology Letters 6:1056-1061.
Bryant, D., L. Burke, J. McManus, and M. Spalding 1998. Reefs at risk: A map-
based indicator of threats to the world's coral reefs. World Resources
Institute, Washington DC.
Bunce, L , K. Gustavson, J . Williams, and M. Miller. 1999. The human side of reef
management: a case study analysis of the socioeconomic framework of
Montego Bay Marine Park. Coral Reefs 18:369-380.
Burke, L., and J. Maidens 2004. Reefs at risk in the Caribbean. World Resources
Institute, Washington, DC, USA.
Burke, L.. E. Selig. and M. Spalding 2002. Reefs at risk in Southeast Asia. World
Resources Institute, Washington, DC.
-274

Carran, B. 2003. Treasure Island Resort. Environmental and social sustainability
policy. Board proceedings.
Carson, R. T., N. E. Flores, K. M. Martin, and J. L. Wright. 1996. Contingent
valuation and revealed preference methodologies: Comparing the estimates
for quasi-public goods. Land Economics 72:80-99.
Carte, B. K. 1996. Biomedical potential of marine natural products. Bioscience
46:271-286.
CCEF- 2006. Marine protected coast, reef and management database (MPA
database): MPA report guide. Coastal Conservation and Education
Foundation. Available at: vww.coast.ph. Accessed: Aug. 2007.
CCEF. 2008. Marine protected coast, reef and management database. Coastal
Conservation and Education Foundation, www.coast.ph. Accessed: Nov.
2008.
Cesar, H. 1996. Economic analysis of Indonesian coral reefs. The World Bank.
Cesar, H. 2000. Coral reefs: Their functions, threats and economic value in
Collected essays on the economics of coral reefs. CORDIO, Department of
Biology and Environmental Sciences, Kalmar University, Kalmar, Sweden.
Cesar, H., C. G. Lundin, S. Bettencourt, and J. Dixon. 1997. Indonesian coral reefs
- An economic of a precious but threatened resource. Ambio 26:345-350.
Chapman, F. A., S. A. FitzCoy, E. M. Thunberg, and C. M. Adams. 1997. United
States of America trade in ornamental fish. Journal of The World
Aquaculture Society 28:1-10.
Charters, T., C. Issaverdis, S. McFarlane, S. Pahl, S. Toplis, and P. O'Reilly. 2003.
Ecocertification program. Ecotourism Australia. Brisbane. Available at:
www.ecotourism.orQ.au. Accessed: Feb. 2007.
-275 -

CHICOP. 2008. Chumbe Island Coral Park. Education program, Available at:
www.chumbeisland.CQm. Accessed: Aug. 2008.
Chou, L , S. Vo, Reefs. P, Yeemin. T, Cabanban. A, Kessna. S, and Kessna. I.
2002. Status of Southeast Asia coral reefs. In: Wilkinson C (ed) Status of
coral reefs of the world 2002. Australian Institute of Marine Science,
Townsville. pp 123-152.
Christie, P. 2005. Observed and perceived environmental impacts of marine
protected areas in two Southeast Asia sites. Ocean & Coastal Management
48:252-270.
Christie, P., K. Lowry. A. T. White, E. G. Oracion, L. Sievanen, R. S. Pomeroy, R.
B. Pollnac, J . M. Paths, and R. L. V. Eisma. 2005. Key findings from a
multidisciplinary examination of integrated coastal management process
sustainability. Ocean & Coastal Management 48:468-483.
Christie. P., R. B. Pollnac, D. L. Fluharty, M. A. Hixon. G. K. Lowry, R. Mahon, D.
Pietri, B. N. Tissot, A. T. White, N. Armada, and R. L. Eisma-Osorio. 2009.
Tropical marine EBM feasibility: A synthesis of case studies and
comparative analyses. Coastal Management 37:374-385.
Christie, P., A. White, and E. Deguit. 2002. Starting point or solution? Community-
based marine protected areas in the Philippines. Journal of Environmental
Management 66:441-454.
Christie, P., and A. T. White. 1997. Trends in development of coastal area
management in tropical countries: From central to community orientation.
Coastal Management 25:155-181.
Christie, P., and A. T. White. 2007. Best practices for improved governance of
coral reef marine protected areas. Coral Reefs 26:1047-1056.
- 2 7 6 -

CIA. 2008. The World Factbook: Vietnam. Central Intelligence Agency. Available at:
www.cia.aov. Accessed: Dec. 2008.
Cinner, J. E., and S. Aswani. 2007. Integrating customary management into marine
conservation. Biological Conservation 140:201-216.
Cinner, J. E., M. J. Marnane, and T. R. McClanahan. 2005. Conservation and
community benefits from traditional coral reef management at Ahus Island,
Papua New Guinea. Conservation Biology 19:1714-1723.
Clark, S., and A. J. Edwards. 1994. Use of artificial reef structures to rehabilitate
reef flats degraded by coral mining in the Maldives. Bulletin of Marine
Science 55:724-744.
Clarke, K. R. 1993. Non-parametric multivariate analyses of changes in community
structure. Australian Journal of Ecology:117-143.
Clarke, K. R., and R. N. Gorley 2001. PRIMER v5: User manual/Tutorial. PRIMER-
E, Plymouth, UK.
Claudet, J., and D. Pelletier. 2004. Marine protected areas and artificial reefs: A
review of the interactions between management and scientific studies.
Aquatic Living Resources 17:129-138.
Coelho. V. R., and C. Manfrino. 2007. Coral community decline at a remote
Caribbean island: Marine no-take reserves are not enough. Aquatic
Consen/ation-Marine and Freshwater Ecosystems 17:666-685.
Colwell. S. 1999. Entrepreneurial MPAs: Dive resorts as managers of coral reef
marine protected areas. InterCoast Newsletter.
Connell. J. H., T. P. Hughes, and C. C. Wallace. 1997. A 30-year study of coral
abundance, recruitment, and disturbance at several scales in space and
time. Ecological Monographs 67:461-488.
- 277 -

Corniaux. C , T. Becquer, J. P. Danflous, C. Duwig, P. Vernier, and D. Dulieu. 1997.
Preservation of the environment on coral islands and intensification of
agriculture: Applied study on Mare, Loyalty Islands, New Caledonia.
Applications of Systems Approaches at the Farm and Regional Levels
5:427-437.
Costanza, R., R. dArge, R. deGroot. S. Farber, M. Grasso. B. Hannon, K. Limburg,
S. Naeem, R. V. Oneill, J. Paruelo. R. G. Raskin, P. Sutton, and M.
vandenBelt. 1997. The value of the world's ecosystem services and natural
capital. Nature 387:253-260.
Craig, P., C. Birkeland, and S. Belliveau. 2001. High temperatures tolerated by a
diverse assemblage of shallow-water corals in American Samoa. Coral
Reefs 20:185-189.
Czech, B. 1995. Ecosystem management is no paradigm shift - Lets try
conservation. Journal of Forestry 93:17-23.
da Silva. P. P. 2004. From common property to co-management: lessons from
Brazil's first maritime extractive reserve. Marine Policy 28:419-428.
Danner, E. M., T. C. Wilson, and R. E. Schlotterbeck. 1994. Comparison of rockfish
recruitment of nearshore artificial and natural reefs off the coast of central
California. Bulletin of Marine Science 55:333-343.
Davenport, J., and J. L. Davenport. 2006. The impact of tourism and personal
leisure transport on coastal environments: A review. Estuarine Coastal and
Shelf Science 67:280-292.
Davis, D., and C. Tisdell. 1996. Economic management of recreational scuba
diving and the environment. Journal of Environmental Management 48:229-
248.
-278 -

Dawson, M. N., R. K. Grosberg, and L. W. Botsford. 2006. Connectivity in marine
protected areas. Science 313:43-44.
Dayton, P. K., E. Sala, M. J. Tegner, and S. Thrush. 2000. Marine reserves: Parks,
baselines, and fishery enhancement. Bulletin of Marine Science 66:617-634.
De Young, C , A. Charles, and A. Hjort 2008. Human dimensions of the ecosystem
approach to fisheries: an overview of context, concepts, tools and methods.
FAO, Rome, Italy.
Dean, L. 1983. Undersea oases made by man - Artificial reefs create new fishing
grounds. Oceans 16:27-33.
Dearden, P., M. Bennett, and J. Johnston. 2005. Trends in global protected area
governance, 1992-2002. Environmental Management 36:89-100.
DemartinI, E. E.. A. M. Barnett, T. D. Johnson, and R. F. Ambrose. 1994. Growth
and production estimates for biomass-dominant fishes on a southern
California artificial reef. Bulletin of Marine Science 55:484-500.
Dempster, T., and M. Taquet. 2004. Fish Aggregation Device (FAD) research:
gaps in current knowledge and future directions for ecological studies.
Reviews in Fish Biology and Fisheries 14:21-42.
Depondt, F., and E. Green. 2006. Diving user fees and the financial sustainability
of marine protected areas: Opportunities and impediments. Ocean &
Coastal Management 49:188-202.
Dharmaratne, G. S., F. Y. Sang, and L. J. Walling. 2000. Tourism potentials for
financing protected areas. Annals of Tourism Research 27:590-610.
Dickson, I. 2006. The use of corallivorous butterflyfish (Chaetodontidae) as
indicators of coral reef quality. School of Ocean and Earth Sciences.
University of Southampton, Southampton. (64 pp).
- 2 7 9 -

Dixon, J. A., L. F. Scura, and T. Vanthof. 1993. Meeting ecological and economic
goals - Marine parks In the Caribbean. Ambio 22:117-125.
Done, T. J. 1992. Phase-shifts in coral-reef communities and their ecological
significance. Hydrobiologia 247:121 -132.
DrimI, S. 1994. Protection for profit-economic and financial values of the Great
Barrier Reef World Heritage Area and other protected areas. Great Barrier
Reef Marine Park Authority, Townsville, Australia.
Duka Bay Resort. Duka reef diver projects. Available at: www.dukabav.com.
Accessed: Aug. 2008.
Duivy, N. K., Y. Sadovy, and J. D. Reynolds. 2003. Extinction vulnerability in
marine populations. Fish and Fisheries 4:25-64.
Dung, L. D. 2007. The marine protected area of Nha Trang Bay, Vietnam: Initial
trends in resource status and utilization (2002-2005). Master thesis in
international fisheries management. Department of Aquatic Bioscience,
Norwegian College of Fishery Science, University of Tromso, Nonway.
Edinger, E. N., G. V. Limmon, J. Jompa, W. Widjatmoko, J. M. Heikoop, and M. J.
Risk. 2000. Normal coral growth rates on dying reefs: Are coral growth rates
good indicators of reef health? Marine Pollution Bulletin 40:404-425.
Elmqvist, T., C. Foike, M. Nystrom, G. Peterson, J. Bengtsson, B. Walker, and J.
Norberg. 2003. Responce diversity, ecosystem change, and resilience.
Frontiers in Ecology and the Environment 1:488-494.
English, S., Wilkinson, C , Baker, V. 1997. Survey manual for tropical marine
resources. Australian Institute of Marine Science, Townsville.
280

Epstein, N., R. P. M. Bak, and B. Rinkevich. 2003. Applying forest restoration
principles to coral reef rehabilitation. Aquatic Conservation-Marine and
Freshwater Ecosystems 13:387-395.
FAO 1997. Review of the state of world fishery resources: Marine fisheries. FAO
Fisheries Circular No. 920 FIRM/C920.
FAO. 2008. Fishery and aquaculture country profile: Vietnam. Available at:
www.fao.orq. Accessed: Dec. 2008.
Ferreira. C. E. L., J. E, A. Goncalves. and R. Coutlnho. 2001. Community structure
of fishes and habitat complexity on a tropical rocky shore. Environmental
Biology of Fishes 61:353-369.
Fiallo, E. A., and S. K. Jacobson. 1995. Local communities and protected areas:
Attitudes of rural residents towards conservation and Machalilla National
Park, Ecuador. Environmental Conservation 22:241-249.
FIC, 2008. Fisheries Informatics Centre (FIC). Ministry of Agriculture and Rural
Development. Hanoi,Vietnam. Available at: www.fistenet.qov.vn. Accessed:
May 2009.
Florence, M., and V. Jealous 2004. p. 369. Lonely Planet Vietnam. 7th ed.
Footscray, Australia: Lonely Planet Publications Pty Ltd.
Forst. M. F. 2009. The convergence of integrated coastal zone management and
the ecosystems approach. Ocean & Coastal Management 52:294-306.
Fox, H. E. 2004. Coral recruitment in blasted and unblasted sites in Indonesia:
assessing rehabilitation potential. Marine Ecology-Progress Series 269:131-
139.
Fox, H. E., J. S. Pet, R. Dahuri, and R. L. Caldwell. 2003. Recovery in rubble fields:
long-term impacts of blast fishing. Marine Pollution Bulletin 46:1024-1031.
-281 -

Francis, J., A. Nilsson, and D. Waruinge. 2002. Marine protected areas in the
eastern African region: How successful are they? Ambio 31:503-511.
Frankham, R. 2005. Genetics and extinction. Biological Conservation 126:131-140.
Friedlander, A. M., E. K. Brown, P. L. Jokiel, W. R. Smith, and K. S. Rodgers. 2003.
Effects of habitat, wave exposure, and marine protected area status on coral
reef fish assemblages in the Hawaiian archipelago. Coral Reefs 22:291-305.
Garcia, S. M., and K. L. Cochrane. 2005. Ecosystem approach to fisheries: A
review of implementation guidelines. Ices Journal of Marine Science 62:311-
318.
Garcia. S. M., A. Zerbi, C. Altaume, T. Do Chi, and G. Lasserre. 2003. The
ecosystem approach to fisheries. Issues, terminology, principles,
institutional foundations, implementation and outlook. FAO Fisheries
Technical Paper 443. (71 pp).
Garcin, M., J. F. Desprats, M. Fontaine, R. Pedreros, N. Attanayake, S. Fernando,
C. Siriwardana, U. De Silva, and B. Poisson. 2008. Integrated approach for
coastal hazards and risks in Sri Lanka. Natural Hazards and Earth System
Sciences 8:577-586.
Gardner, T. A., I. M. Cote. J. A. Gill, A. Grant, and A. R. Watkinson. 2005.
Hurricanes and Caribbean coral reefs: Impacts, recovery patterns, and role
in long-term decline. Ecology 86:174-184.
Gasparotti. M., and N. T. Nguyen. 2009. Nha Trang hotel market view 2009. CBRE
Gell, F, R., and C. M. Roberts. 2003, Benefits beyond boundaries: the fishery
effects of marine reserves. Trends in Ecology & Evolution 18:448-455.
282

Gibson, J., M. McField, and S. Wells. 1998. Coral reef management in Belize: an
approach through integrated coastal zone management. Ocean & Coastal
Management 39:229-244.
Gili Eco Trust. 2009. Gili Eco Trust. Available at: www.ailiecotrust.com. Accessed:
Nov. 2009.
Gladfelter, W. B., and W. S. Johnson. 1983. Feeding niche separation in a guild of
tropical reef fishes (Holocentridae). Ecology 64:552-563.
Glynn, P. W., and L. Dcroz. 1990. Experimental-evidence for high-temperature
stress as the cause of El-Nino-coincident coral mortality. Coral Reefs 8:181-
191.
Goreau, T., T. McClanahan, R. Hayes, and A. Strong. 2000. Conservation of coral
reefs after the 1998 global bleaching event. Conservation Biology 14:5-15.
Goreau, T. J., and W. H. Hilbertz. 2005. Biorock Technologies. Biorock Inc.:
www.biorock.net. Accessed: Aug, 2008.
Gossling, S. 1999. Ecotourism: A means to safeguard biodiversity and ecosystem
functions? Ecological Economics 29:303-320.
Gossling, S. 2000. Tourism - Sustainable development option? Environmental
Conservation 27:223-224.
Gossling, S.. M. Bredberg, A. Randow, E. Sandstrom, and P. Svensson. 2006.
Tourist perceptions of climate change: A study of international tourists in
Zanzibar. Current Issues in Tourism 9:419-435.
Gossling, S., C. B. Hansson, O. Horstmeier. and S. Saggel. 2002. Ecological
footprint analysis as a tool to assess tourism sustainability. Ecological
Economics 43:199-211.
-283

Grafton, R. 0 . , and T. Kompas. 2005. Uncertainty and the active adaptive
management of marine reserves. Marine Policy 29:471-479.
Green, E., and R. Donnelly. 2003. Recreational scuba diving in Caribbean marine
protected areas: Do the users pay? Ambio 32:140-144.
Green, E., and F. Short 2003. World atlas of seagrasses. University of California
Press, Berkeley, CA. 298 pp.
Green Hotelier. 2002. Four Seasons Hotels and Resorts. Magazine of the
Internation Hotels Environment Initiative, London (25&26).
Grol, M. G. G., M. Dorenbosch, E. M. G. Kokkelmans, and I. Nagelkerken. 2008.
Mangroves and seagrass beds do not enhance growth of early juveniles of a
coral reef fish. Marine Ecology-Progress Series 366:137-146.
GSO. 2008. Vietnam national administration of tourism. General Statistics Office.
Available at: www.vietnamtourism.Qov.vn. Accessed: Dec. 2008.
GSO. 2009a. Social - economic data 2008. General Statistics Office of Vietnam.
Available at: vtfww.gso.qov.vn. Accessed: May 2009.
GSO. 2009b. Agriculture, forestry and fishery, 2008 statistics handbook. General
Statistics Office of Vietnam. Available at: www.aso.aov.vn. Accessed: May
2009.
GSO. 2009c. Education, health and living standards. 2008 statistics handbook.
General Statistics Office of Vietnam. Available at: www.aso.aov.vn.
Accessed: May 2009.
Guidetti, P., M. Milazzo, S. Bussotti, A. Molinari, M. Murenu, A, Pais, N. Spano, R.
Balzano, T. Agardy, F. Boero, G. Carrada, R. Cattaneo-Vietti, A. Cau, R.
Chemello, S. Greco, A. Manganaro, G. N. di Sciara, G. F. Russo. and L
284

Tunesi. 2008. Italian marine reserve effectiveness: Does enforcement
matter? Biological Conservation 141:699-709.
Guzman, H. M., and E. M. Garcia. 2002. Mercury levels in coral reefs along the
Caribbean coast of Central America. Marine Pollution Bulletin 44:1415-1420.
Ha, V. 2008. Van Phong Bay to become international port terminal. Thanhnien
News, Ho Chi Minh City. Available at: www.thanhniennews.com. Accessed:
Nov. 2008.
Ha Xuan Thong. 1997. The problems facing small-scale fisheries in Vietnam.
Institute of Fisheries Economics and Planning, Ministry of Fisheries, Hanoi.
Vietnam.
Haefner, B. 2003. Drugs from the deep: Marine natural products as drug
candidates. Drug Discovery Today 8:536-544.
Halpern, B. S. 2003. The impact of marine reserves: Do reserves work and does
reserve size matter? Ecological Applications 13:S117-S137.
Halpern, B. S., and R. R. Warner. 2002. Marine reserves have rapid and lasting
effects. Ecology Letters 5:361-366.
Halpern, B. S., and R. R. Warner. 2003. Matching marine reserve design to
reserve objectives. Proceedings of The Royal Society of London series B-
Biological Sciences 270:1871-1878.
Han, M. 2007. Fisheries development in Vietnam: A case study in the exclusive
economic zone. Ocean & Coastal Management 50:699-712,
Hanna. S. 2001. Managing the human-ecological interface: Marine resources as
example and laboratory. Ecosystems 4:736-741.
Hardin, G. 1968. Tragedy of Commons. Science 162:1243-&.
285

Harriott, V., D. Davis, and S. A. Banks. 1997. Recreational diving and its impact in
marine protected areas in eastern Australia. Ambio 26:173-179.
Hastings. A., and L. W. Botsford. 2003. Comparing designs of marine reserves for
fisheries and for biodiversity. Ecological Applications 13:S65-S70.
Hawkins, J . P., and C. M. Roberts. 1992. Effects of recreational scuba diving on
fore-reef slope communities of coral reefs. Biological Conservation 62:171-
178.
Hawkins, J . P., and C. M. Roberts, 1993. Effects of recreational scuba diving on
coral reefs - Trampling on reef-flat communities. Journal of Applied Ecology
30:25-30.
Hawkins, J. P.. and C. M. Roberts. 1994. The growth of coastal tourism in the Red-
Sea - Present and future-effects on coral-reefs. Ambio 23:503-508.
Hawkins, J. P., C. M. Roberts. T. Van't Hof, K. de Meyer, J. Tratalos. and C. Aldam.
1999. Effects of recreational scuba diving on Caribbean coral and fish
communities. Conservation Biology 13:888-897.
Hilborn, R., J. M. Orensanz, and A. M. Parma. 2005. Institutions, incentives and
the future of fisheries. Philosophical Transactions of the Royal Society B-
Biological Sciences 360:47-57.
Hilborn, R.. K. Stokes, J. J. Maguire, T. Smith. L. W. Botsford, M. Mangel, J.
Orensanz, A. Parma, J. Rice, J. Bell, K. L. Cochrane, S. Garcia, S. J. Hall, G.
P. Kirkwood, K. Sainsbury, G. Stefansson, and C. Walters. 2004. When can
marine reserves improve fisheries management? Ocean & Coastal
Management 47:197-205.
Hinrichsen, D. 1997. Requiem for reefs? International Wildlife. March/April 1997.
286

Hixon, M. A., and J. P. Beets. 1989. Shelter characteristics and Caribbean fish
assemblages - Experiments with artificial reefs. Bulletin of Marine Science
44:666-680.
Hoegh-Guldberg, O. 1999. Climate change, coral bleaching and the future of the
world's coral reefs. Marine and Freshwater Research 50:839-866.
Hoegh-Guldberg, O. 2004. Coral reefs in a century of rapid environmental change.
Symbiosis 37:1-31.
Hoffmann, T. C. 2002. Coral reef health and effects of socio-economic factors in
Fiji and Cook Islands. Marine Pollution Bulletin 44:1281-1293.
Hogarth, P. 2007. The Biology of mangroves and seagrasses. 2nd edition. Oxford
University Press, UK. (280 pp).
Holman, I. P., M. D. A. Rounsevell, S. Shackley, P. A. Harrison. R. J . Nicholls, P. M,
Berry, and E. Audsley. 2005. A regional, multi-sectoral and integrated
assessment of the impacts of climate and socio-economic change in the UK.
Climatic Change 71:9-41.
Huber, M. E. 1994. An Assessment of the status of the coral-reefs of Papua-New-
Guinea. Marine Pollution Bulletin 29:69-73.
Hughes, T. P., A. H. Baird, D. R. Bellwood, M. Card, S. R. Connolly, C. Folke. R.
Grosberg, O. Hoegh-Guldberg, J. B. C. Jackson, J. Kleypas, J . M. Lough, P.
Marshall, M. Nystrom, S. R. Palumbi, J. M. Pandolfi, B. Rosen, and J.
Roughgarden. 2003. Climate change, human impacts, and the resilience of
coral reefs. Science 301:929-933.
Hughes, T. P., D. R. Bellwood, C. Folke, R. S. Steneck, and J. Wilson. 2005. New
paradigms for supporting the resilience of marine ecosystems. Trends In
Ecology & Evolution 20:380-386.
- 287 -

Hughes, T. P., and J. H. Connell. 1999. Multiple stressors on coral reefs: A long-
term perspective. Umnology and Oceanography 44:932-940.
Hunt, B., and A. C. J. Vincent. 2006. Scale and sustainability of marine
bioprospecting for pharmaceuticals. Ambio 35:57-64.
ICEM 2003. Vietnam: National report on protected areas and development. ICEM,
Indooroopilly, Australia.
IHEI. 2003. International Hotels Environment Initiative: The Business Case,
Available at: www.ihei.orq. Accessed: Mar. 2008.
lUCN. 2003a. World Parks Congress outputs: The Durban Action Plan. (The World
Conservation Union), Durban. Available at: www.iucn.org. Accessed: July
2004).
lUCN 2003b. Improving local livelihoods through sustainable aquaculture in Hon
Mun marine protected area. Nha Trang bay, Vietnam. A report to the
collaborative APEC Grouper Research and Development Network
(FWG/01/2001). lUCN Vietnam Program.
lUCN 2003c. lUCN Vietnam country programme: The lUCN Vietnam intersessional
programme 2005-2008.
Jameson, S. C , J. W. McManus. and M. D. Spalding 1995. State of the reefs:
Regional and global perspectives, Washington D.C.
Jameson, S. C , M. H. Tupper, and J. M. Ridley. 2002. The three screen doors:
Can marine "protected" areas be effective? Marine Pollution Bulletin
44:1177-1183.
Jamieson, G., and Chang-ik Zhang. 2005. Report on the study group on
ecosystem-based management science and its application to the North
Pacific. North Pacific Marine Science Organization (PICES), Canada.
-288 -

Available at: http://aQuacQmm.fcla.edu/1254/1/Sci Rep 29.Ddf. Accessed:
June 2009.
Jan, R. Q., Y. H. Liu, C. Y. Chen, M. C. Wang, G. S. Song, H. C. Lin, and K. T.
Shao. 2003. Effects of pile size of artificial reefs on the standing stocks of
fishes. Fisheries Research 63:327-337.
Jan, R. Q., and R. F. G. Ormond. 1992. Spawning of damselfishes on the northern
coast of Taiwan, with emphasis on spawning site distribution. Bulletin of The
Institute of Zoology Academia Sinica 31:231-245.
Jennings, S. 2005. Indicators to support an ecosystem approach to fisheries. Fish
and Fisheries 6:212-232.
Jennings, S., and M. J. Kaiser. 1998. The effects of fishing on marine ecosystems.
Pages 201-+. Advances in Marine Biology, Vol 34.
Jennings, S., S. S. Marshall, and N. V. C. Polunin. 1996. Seychelles' marine
protected areas: Comparative structure and status of reef fisfi communities.
Biological Consen/ation 75:201-209.
Jensen, A. C , K. J. Collins, A. P. M. Lockwood, J. J. Mallinson, and W. H.
Turnpenny. 1994. Colonization and fishery potential of a coal-ash artificial
reef, Poole-Bay, United-Kingdom. Bulletin of Marine Science 55:1263-1276.
Jentoft, S. 2000. Legitimacy and disappointment in fisheries management. Marine
Policy 24:141-148.
Johannes, R. E. 1981. Words of the lagoon: fishing and marine lore in the Palau
District of Micronesia. University of California Press, Berkeley CA.
Johannes, R. E. 2002. The renaissance of community-based marine resource
management in Oceania. Annual Review of Ecology and Systematics
33:317-340.
-289-

Jones, G. P., G. R. Almany, G. R. Russ, P. F. Sale, R. S. Steneck, M. J. H. van
Oppen, and B. L. Willis. 2009. Larval retention and connectivity among
populations of corals and reef fishes: History, advances and challenges.
Coral Reefs 28:307-325.
Jones. G. P., S. Planes, and S. R. Thorrold. 2005. Coral reef fish larvae settle
close to home. Current Biology 15:1314-1318.
Jones, K. M. M. 2005. Home range areas and activity centres in six species of
Caribbean wrasses (Labridae). Journal of Fish Biology 66:150-166.
Jones, R. J. , J. Bowyer, 0 . Hoegh-Guldberg, and L L. Blackall. 2004. Dynamics of
a temperature-related coral disease outbreak. Marine Ecology-Progress
Series 281:63-77.
Jones, R. J, , and A. L. Steven. 1997. Effects of cyanide on corals in relation to
cyanide fishing on reefs. Marine and Freshwater Research 48:517-522.
Jordan-Dahlgren, E., M. A. Maldonado, and R. E . Rodriguez-Martinez. 2005.
Diseases and partial mortality in Montastraea annularis species complex in
reefs with differing environmental conditions (NW Caribbean and Gulf of
Mexico). Diseases of Aquatic Organisms 63:3-12.
Juda, L. 1999. Considerations in the development of a functional approach to the
governance of large marine ecosystems. Ocean Development and
International Law 30:89-125.
Kabuta, S. H., and R. Laane. 2003. Ecological performance indicators in the North
Sea: Development and application. Ocean & Coastal Management 46:277-
297.
-290

Kaczmarsky, L. T., M. Draud, and E, H. Williams. 2005. Is there a relationship
between proximity to sewage effluent and the prevalence of coral disease.
Caribbean Journal of Science 41:124-137,
Kappel, C. v., G. M. Marlone, and J. E. Duffy, 2006. Ecosystem-based
management. Available at: www.eoearth.orq/article/Ecosvstem-
based management. Accessed: June 09.
Kaye, S. 2004. Implementing high seas biodiversity conservation: global
geopolitical considerations. Marine Policy 28:221-226.
Keller, B. D., D. F. Gleason, E. McLeod, C. M. Woodley, S. Airame, B. D. Causey,
A. M. Friedlander, R. Grober-Dunsmore, J. E. Johnson, S. L. Miller, and R.
S. Steneck. 2009. Climate change, coral reef ecosystems, and management
options for marine protected areas. Environmental Management 44:1069-
1088.
Kerr, R. G., and S. S. Kerr. 1999. Marine natural products as therapeutic agents.
Expert Opinion on Therapeutic Patents 9:1207-1222.
Khalaf. M., and M. P. Crosby. 2005. Assemblage structure of butterflyfishes and
their use as indicators of Gulf of Aqaba benthic habitat in Jordan. Aquatic
Conservation-Marine and Freshwater Ecosystems 15:S27-S43.
Khanh Hoa Portal. 2005. The Program of tourism development for the period 2001-
2005 and until 2010 of Khanh Hoa Province. Available at:
www.khanhhoa.aov.vn. Accessed: Dec. 2008.
Kim, C. G., H. S. Kim. C. I. Baik, H. Kakimoto, and W. Seaman. 2008. Design of
artificial reefs and their effectiveness in the fisheries of eastern Asia.
Reconciling Fisheries with Conservation, Vols I and II 49:933-942.
291

Kimball, L. A. 2001. International ocean governance. Using international law and
organizations to manage marine resources sustainably. The World
Conservation Union. Gland. Switzerland, and Cambridge, UK. (123 pp).
Kiss, A. 2004. Is community-based ecotourism a good use of biodiversity
conservation funds? Trends in Ecology & Evolution 19:232-237.
Kleypas, J. A., R. W. Buddemeier, D. Archer, J. P. Gattuso, C. Langdon, and B. N.
Opdyke. 1999. Geochemical consequences of increased atmospheric
carbon dioxide on coral reefs. Science 284:118-120.
Kleypas, J. A., and C. M. Eakin. 2007. Scientists' perceptions of threats to coral
reefs: Results of a survey of coral reef researchers. Bulletin of Marine
Science 80:419-436.
Kramer, D. L.. and M. R. Chapman. 1999. Implications of fish home range size and
relocation for marine reserve function. Environmental Biology of Fishes
55:65-79.
Kritzer, J. P. 2004. Effects of noncompliance on the success of alternative designs
of marine protected-area networks for conservation and fisheries
management. Conservation Biology 18:1021-1031.
Kuhlmann, D. H. H. 1988. The sensitivity of coral reefs to environmental-pollution.
Ambio 17:13-21.
Labrosse, P., M. Kulbicki, and J. Ferraris 2002. Underwater visual fish census
surveys: Proper use and implementation. Secretariat of the Pacific
Community, Noumea, New Caledonia.
Lam, K. K. Y. 2003. Coral recruitment onto an experimental pulverised fuel ash-
concrete artificial reef. Marine Pollution Bulletin 46:642-653.
292

Lam. T. D. T. 2005. Vietnamese fishing in troubled waters. Asia Tinnes. Hong-Kong
Available at: www.atimes.com/atimes/Southeast_Asia/GE25Ae01 .html.
Accessed: July 2008.
Lan, C. H., C. C. Chen, and C. Y. Hsui. 2004. An approach to design spatial
configuration of artificial reef ecosystem. Ecological Engineering 22:217-226.
Langholz, J. A., and J. P. Lassoie. 2001. Perils and promise of privately owned
protected areas. Bioscience 51:1079-1085.
Langholz, J. A., J. P. Lassoie, D. Lee, and D. Chapman. 2000. Economic
considerations of privately owned parks. Ecological Economics 33:173-183.
Le Thac Can, Do Hong Phan, and Le Quy An. 2001. Environmental governance in
Vietnam in a regional context. The Mekong Regional Environmental
Governance (MREG) project. Vietnam.
Leitao, F., M. N. Santos, K. Erzini, and C. C. Monteiro. 2008. The effect of
predation on artificial reef juvenile demersal fish species. Marine Biology
153:1233-1244.
Levin, S. A. 2006. Learning to live in a global commons: Socioeconomic challenges
for a sustainable environment. Ecological Research 21:328-333.
Lindberg, K. 1991. Policies for maximizing nature tourism's ecological and
economic benefits. World Resources Institute, New York.
Lindsey, G., and A. Holmes. 2002. Tourist support for marine protection in Nha
Trang, Viet Nam. Journal of Environmental Planning and Management
45:461-480.
Loomis, J., T. Brown, B. Lucero. and G. Peterson. 1996. Improving validity
experiments of contingent valuation methods: Results of efforts to reduce
293

the disparity of hypothetical and actual willingness to pay. Land Economics
72:450-461.
Lough, J. M. 2008. 10th anniversary review: A changing climate for coral reefs.
Journal of Environmental Monitoring 10:21-29.
Mangi, S. C . C. M. Roberts, and L. D. Rodwell. 2007, Reef fisheries management
in Kenya: Preliminary approach using the driver-pressure-state-impacts-
response (DPSIR) scheme of indicators. Ocean & Coastal Management
50:463-480.
Mascia, M. B., and C. A. Claus. 2009. A property rights approach to understanding
human displacement from protected areas: the case of marine protected
areas. Conservation Biology 23:16-23.
McClanahan, T., J. Davies, and J. Maina. 2005. Factors influencing resource users
and managers' perceptions towards marine protected area management in
Kenya. Environmental Conservation 32:42-49.
McClanahan, T. R. 1999. Is there a future for coral reef parks in poor tropical
countries? Coral Reefs 18:321-325.
McClanahan, T. R., C. C. Hicks, and E. S. Darling. 2008. Malthusian overfishing
and efforts to overcome it on Kenyan coral reefs. Ecological Applications
18:1516-1529.
McClanahan, T. R., and S. Mangi. 2000. Spillover of exploitable fishes from a
marine park and its effect on the adjacent fishery. Ecological Applications
10:1792-1805.
McClanahan, T. R., and 8. C. Mangi. 2004. Gear-based management of a tropical
artisanal fishery based on species selectivity and capture size. Fisheries
Management and Ecology 11:51-60.
-294-

McClanahan, T. R., and D. Obura. 1997. Sedimentation effects on shallow coral
communities in Kenya. Journal of Experimental Marine Biology and Ecology
209:103-122.
McLaughlin, C. J., C. A. Smith, R. W. Buddemeier, J. D. Bartley, and B. A. Maxwell,
2003. Rivers, runoff, and reefs. Global and Planetary Change 39:191-199.
McLeod. K. L., J. Lubchenko, S. R. Palumbi, and A. A. Rosenberg. 2005, Scientific
consensus statement on marine ecosystem-based management.
communication partnership for science and the sea. Available at:
wvw.compassonline.orq/pdf files/EBM Consensus Statement v12.pdf.
Accessed: June 2009.
Michael, H., and H. T. N. V. Tu 2005. Report on changes within the tourism
industry affecting Nha Trang Bay Marine Protected Area, Hon Mun MPA
pilot project, Nha Trang, Vietnam.
Millennium Ecosystem Assessment 2005. Ecosystems and human well-being:
synthesis report. World Resources Institute, Washington, DC.
Ministry of Fisheries and World Bank. 2005. Vietnam fisheries and aquaculture
sector study. Final report. Ministry of Fisheries, Hanoi,Vietnam.
Moberg, F., and C. Folke. 1999. Ecological goods and services of coral reef
ecosystems. Ecological Economics 29:215-233.
Mora, C. 2008. A clear human footprint in the coral reefs of the Caribbean.
Proceedings of The Royal Society B-Bioiogical Sciences 275:767-773.
Mora, C . S. Andrefouet, M. J. Costello, C. Kranenburg, A. Rollo, J. Veron, K. J.
Gaston, and R. A. Myers. 2006. Coral reefs and the global network of
marine protected areas. Science 312:1750-1751.
295 -

Mora, C , and P. F. Sale. 2002. Are populations of coral reef fish open or closed?
Trends in Ecology & Evolution 17:422-428.
MPA News. 2002. Involvement of the private sector in a community-based MPA:
Case example from Fiji. Pages 3/4.
MPA News. 2003. Private sector ownership of MPAs: Cases illustrate challenges
and opportunities. 4 (10).
Mumby, P. J., A. J. Edwards, J. E. Arias-Gonzalez, K. C. Lindeman, P. G.
Blackwell, A. Gall, M. I. Gorczynska, A. R. Harborne, C. L. Pescod. H.
Renken, C. C. C. Wabnitz, and G. Llewellyn. 2004. Mangroves enhance the
biomass of coral reef fish communities in the Caribbean. Nature 427:533-
536.
Nagelkerken, I., C. M. Roberts, G. van der Velde, M. Dorenbosch, M. C. van Riel,
E. C. de la Morinere, and P. H. Nienhuis. 2002. How important are
mangroves and seagrass beds for coral-reef fish? The nursery hypothesis
tested on an island scale. Marine Ecology-Progress Series 244:299-305.
Nakamura, T., and R. van Woesik. 2001. Water-flow rates and passive diffusion
partially explain differential survival of corals during the 1998 bleaching
event. Marine Ecology-Progress Series 212:301-304.
Negri, A. P., L. D. Smith, N. S. Webster, and A. J . Heyward. 2002. Understanding
ship-grounding impacts on a coral reef: potential effects of anti-foulant paint
contamination on coral recruitment. Marine Pollution Bulletin 44:111-117.
Nelson, P. A. 2003. Marine fish assemblages associated with fish aggregating
devices (FADs): Effects of fish removal, FAD size, fouling communities, and
prior recruits. Fishery Bulletin 101:835-850.
296
Nguyen Chu Hoi, Le Tran Nguyen Hung, and D. M. Son. 2006. National efforts to
promote the responsibility and the rights of small-scale fisheries and fishing
communities in the inland and marine sector in Vietnam. Powerpoint
presentation available at:
http://icsf.net/icsf2006/ControllerServlet?handler=INTEGSRCH&code=aetAII
ResultsForRecTvpe&searchPhrase=vietnam&lanq=EN&srchTvpe=&recTvp
e=U&subsite=lCSF. Accessed: May 2009.
Nguyen Long 2002. Small-scale fisheries management in Vietnam, In: Asia-Pacific
fishery commission. Interactive mechanisms for small-scale fisheries
management - Report of the regional consultation. RAP Publication 2002/10,
Bangkok: FAO Regional Office for Asia and the Pacific.
Nguyen Long. 2003. A preliminary analysis on the socioeconomic situation of
coastal fishing communities in Vietnam. In: Silvestre G, Garces L.Stobutzki I,
Ahmed M.Valmonte-Santos RA, Luna C, Lachica-Alino L, Munro P,
Christensen V, Pauly D, editors. Assessment, management and future
directions for coastal fisheries in Asian countries. World Fish Center
conference proceedings, Vol. 67. World Fish Center, Penang, Malaysia.
Nielsen, J. R., P. Degnbol, K. K. Viswanathan, M. Ahmed, M. Hara, and N. M. R.
Abdullah. 2004. Fisheries co-management - An institutional innovation?
Lessons from South East Asia and Southern Africa. Marine Policy 28:151-
160.
Nugues, M. M,, G. W. Smith, R. J. Hooidonk. M. I. Seabra, and R. P. M. Bak. 2004.
Algal contact as a trigger for coral disease. Ecology Letters 7:919-923.
297

O'Conor, R. M., M. Johannesson, and P. O. Johansson. 1999. Stated preferences,
real behaviour and anchoring: Some empirical evidence. Environmental &
Resource Economics 13:235-248.
OECD 1993. OECD core set of indicators for environmental performance reviews.
Organization for Economic Cooperation and Development (OECD). Paris.
Ogawa, Y.. S. Takeuchi, and A. Hatton. 1977. An estimate for the optimum size of
artificial reef. Bulletin of the Japanese Society of Fisheries Oceanography
30:39-45.
OSPAR Commission 1999. OSPAR guidelines on artificial reefs in relation to living
marine resources. OSPAR commission, London. OSPAR 99/15/1-E, Annex
6. Available at: www.ospar.oro. Accessed: Nov. 2008.
Palumbi, S. R. 2004. Marine reserves and ocean neighborhoods: The spatial scale
of marine populations and their management. Annual Review of
Environment And Resources 29:31-68.
Pandolfi, J. M., R. H. Bradbury, E. Sala, T. P. Hughes, K. A. Bjorndal, R. G. Cooke,
D. McArdle, L. McClenachan, M. J. H. Newman. G. Paredes, R. R. Warner,
and J. B. C. Jackson. 2003. Global trajectories of the long-term decline of
coral reef ecosystems. Science 301:955-958.
Pickering, H., and D. Whitmarsh. 1997. Artificial reefs and fisheries exploitation: A
review of the 'attraction versus production* debate, the influence of design
and its significance for policy. Fisheries Research 31:39-59.
Pickering, H., D. Whitmarsh, and A. Jensen. 1998. Artificial reefs as a tool to aid
rehabilitation of coastal ecosystems: Investigating the potential. Marine
Pollution Bulletin 37:505-514.
298-

Pimbert, M. P., and J. N. Pretty. 1995. Parks, people and professionals: Putting
participation into protected area management. Discussion Paper 57
UNRISD. WWF.
Polunin. N. V. C , and C. M. Roberts. 1993. Greater biomass and value of target
coral-reef fishes in 2 small Caribbean marine reserves. Marine Ecology-
Progress Series 100:167-176.
Pomeroy, R., K. A. T. Nguyen, and H. X. Thong. 2009. Small-scale marine
fisheries policy in Vietnam. Marine Policy 33:419-428.
Pratchett, M. S. 2005. Dynamics of an outbreak population of Acanthasterplanci at
Lizard Island, northern Great Barrier Reef (1995-1999). Coral Reefs 24:453-
462.
PRN 2007. Private Protected Areas. Available at: www.parksnetwork.org.
Accessed: Apr. 2008.
Proksch, P., R. Edrada-Ebel, and R. Ebel. 2003. Drugs from the sea -
Opportunities and obstacles. Marine Drugs 1:5-17.
Rainforest Alliance. 2008a. Rainforest Alliance. Sustainable Tourism, New York.
Available at: www.rainforest-alliance.ora. Accessed: Jan. 2008.
Rainforest Alliance. 2008b. Sustainable Tourism Stewardship Council. Available at:
www.rainforest-alliance.orQ/tQurism.cfm?id=council. Accessed: June 2008.
Rajasuriya, A., and A. T. White. 1995. Coral-reefs of Sri-Lanka - Review of their
extent, condition, and management status. Coastal Management 23:77-90.
Riedmiller. S. 1999. Private sector management of marine protected areas: The
Chumbe Island case in H. S. J. Cesar, editor. Collected essays on the
economics of coral reefs. CORDIO, Department of Biology and
Environmental Sciences. Kalmar University, Kalmar, Sweden.
-299 -

Riedmiller, S. 2000. Chumbe Island: experience of a private marine conservation
project. In: Salm RV, Clark JR (eds) Marine and coastal protected areas, a
guide for planners and managers. lUCN, Gland, Switzerland, pp 265-270.
Rilov, G., and Y. Benayahu. 1998. Vertical artificial structures as an alternative
habitat for coral reef fishes in disturbed environments. Marine Environmental
Research 45:431-451.
Rilov, G., and Y. Benayahu. 2000. Fish assemblage on natural versus vertical
artificial reefs: The rehabilitation perspective. Marine Biology 136:931-942.
Rinkevich, B. 2005. What do we know about Eilat (Red Sea) reef degradation? A
critical examination of the published literature. Journal of Experimental
Marine Biology and Ecology 327:183-200.
Roberts, C. M. 1995. Effects of fishing on the ecosystem structure of coral-reefs.
Conservation Biology 9:988-995.
Roberts, C. M. 1998. Sources, sinks, and the design of marine reserve networks.
Fisheries 23:16-19.
Roberts, C. M. 2003. Our shifting perspectives on the oceans. Oryx 37:166-177.
Roberts, C. M.. S. Andelman, G. Branch, R. H, Bustamante, J, C. Castilla, J.
Dugan, B. S. Halpern, K. D. Lafferty, H. Leslie, J. Lubchenco, D. McArdle, H.
P. Possingham, M. Ruckelshaus, and R. R. Warner. 2003. Ecological
criteria for evaluating candidate sites for marine reserves. Ecological
Applications 13:S199-S214.
Roberts, C. M., J. A. Bohnsack, F. Gell, J. P. Hawkins, and R. Goodridge. 2001.
Effects of marine reserves on adjacent fisheries. Science 294:1920-1923.
Roberts, C. M., and J . P. Hawkins. 1997. How small can a marine reserve be and
still be effective? Coral Reefs 16:150-150.
-300-

Roberts, C. M., J. P. Hawkins, and F. R. Gell. 2005. The role of marine reserves in
achieving sustainable fisheries. Philosophical Transactions of The Royal
Society B-Biological Sciences 360:123-132.
Roberts, C. M., and R. F. G. Ormond. 1987. Habitat complexity and coral-reef fish
diversity and abundance on Red-Sea fringing reefs. Marine Ecology-
Progress Series 41:1-8.
Robertson, D. R. 1990. Differences in the seasonalities of spawning and
recruitment of some small neotropical reef fishes. Journal of Experimental
Marine Biology And Ecology 144:49-62.
Robertson, D. R., and J. M. Sheldon. 1979. Competitive interactions and the
availability of sleeping sites for a diurnal coral-reef fish. Journal of
Experimental Marine Biology and Ecology 40:285-298.
Rogers, C. S. 1990. Responses of coral reefs and reef organisms to sedimentation,
Marine Ecology-Progress Series 62:185-202.
Resales, R. M. P. 2003. A Survey to estimate the recreational value of selected
marine protected areas: Moalboal-Cebu, Siquijor and Pamilacan Island-
Bohol. Report for MPA project of Coastal Conservation and Education
Foundation, Inc., Cebu Citz, Philippines.
Ross, S., and G. Wall. 1999. Evaluating ecotourism: The case of North Sulawesi,
Indonesia. Tourism Management 20:673-682.
Ruckelshaus, M., T. Klinger, N. Knowlton, and D. R. Demaster. 2008. Marine
ecosystem-based management in practice: Scientific, and governance
challenges. Bioscience 58:53-63.
301

Ruddle, K. 1996. Traditional management of reef fishing. In: Polunin, N.V.C.,
Roberts, C M . (eds.), Reef Fisheries. Chapman and Hall, London, pp 315-
335.
Russ, G. R., and A. C. Alcala. 1989. Effects of intense fishing pressure on an
assemblage of coral-reef fishes. Marine Ecology-Progress Series 56:13-27.
Russ, G. R., and A. C. Alcala. 1996. Do marine reserves export adult fish biomass?
Evidence from Apo Island, central Philippines. Marine Ecology-Progress
Series 132:1-9.
Russ. G. R., and A. C. Alcala. 1998. Natural fishing experiments in marine
reserves 1983-1993: Community and trophic responses. Coral Reefs
17:383-397.
Russ, G. R., A. C. Alcala, and A. P. Maypa. 2003. Spillover from marine resen/es:
the case of Naso vlamingiiaX Apo Island, the Philippines. Marine Ecology-
Progress Series 264:15-20.
Russ, G. R., A. C. Alcala, A. P. Maypa, H. P. Calumpong, and A. T. White. 2004.
Marine reserve benefits local fisheries. Ecological Applications 14:597-606.
Sadovy, Y. 2005. Trouble on the reef: the imperative for managing vulnerable and
valuable fisheries. Fish and Fisheries 6:167-185.
Sale, P. F., R. K. Cowen, B. S. Danilowicz, G. P. Jones, J . P. Kritzer, K. C.
Lindeman, S. Planes, N. V. C. Polunin, G. R. Russ, Y. J. Sadovy, and R. S.
Steneck. 2005. Critical science gaps impede use of no-take fishery reserves.
Trends in Ecology & Evolution 20:74-80.
Salm, R. v., J . R. Clark, and E. Siirila 2000. Marine and Coastal Protected Areas:
A guide for planners and managers. lUCN, Washington DC.
302

Samoilys, M. A., K. M. Martin-Smith, B. G. Giles, B. Cabrera. J. A. Anticamara, E.
O. Brunio, and A. C. J. Vincent. 2007. Effectiveness of five small Philippines'
coral reef reserves for fish populations depends on site-specific factors,
particularty enforcement history. Biological Conservation 136:584-601.
Sanders, R. M., C. R. Chandler, and A. M. Landry. 1985. Hydrological, diel and
lunar factors affecting fishes on artificial reefs off Panama-City, Florida.
Bulletin of Marine Science 37:318-328.
Santavy, D. L., J. K. Summers, V. D. Engle, and L. C. Harwell. 2005. The condition
of coral reefs in South Florida (2000) using coral disease and bleaching as
indicators. Environmental Monitoring and Assessment 100:129-152.
Sato, O. 1985. Scientific rationales for fishing reef design. Bulletin of Marine
Science 37:329-335.
Scuba Diver Magazine. 2004. On the doorstep of Taman Sari Resort, in
Pemuteran Bali, lies the world's newest, biggest and most radical reef
system. The most unique reef system in Southeast Asia. Feb. 2004 issue.
Scura, L. F., and T. van't Hot 1993. The ecology and economics of Bonaire Marine
Park. The World Bank environment department divisional paper; 44:1-48.
Seaman, W. 2007. Artificial habitats and the restoration of degraded marine
ecosystems and fisheries. Hydrobiologia 580:143-155.
Sethi, S. A., and R. Hilborn. 2008. Interactions between poaching and
management policy affect marine reserves as conservation tools. Biological
Conservation 141:506-516.
Shackley, M. 1999. Tourism development and environmental protection in southern
Sinai. Tourism Management 20:543-548.
303

Shanks, A. L , B. A. Grantham, and M. H. Carr. 2003. Propagule dispersal distance
and the size and spacing of marine reserves. Ecological Applications
13:S159-S169.
Sherman, R. L., D. S. Gilliam, and R. E. Spieler. 1999. A preliminary examination
of depth associated spatial variation in fish assemblages on small artificial
reefs. Journal of Applied Ichthyology-Zeitschrift fur Angewandte Ichthyologie
15:116-121.
Sherman, R. L , D. S. Gillian, and R. E. Spieler. 2002. Artificial reef design: Void
space, complexity, and attractants. Ices Journal of Marine Science 59:S196-
S200.
Shivlani, M., V. R. Leeworthy, and T. J. Murray 2002. Socioeconomic monitoring of
commercial fisheries in the Florida Keys National Marine Sanctuary
(FKNMS): major findings from the first four years: 1997-2000. Coastal
Society, Alexandria, USA.
Shulman, M. J. 1984. Resource limitation and recruitment patterns in a coral-reef
fish assemblage. Journal of Experimental Marine Biology and Ecology
74:85-109.
Shuman, C. S., G. Hodgson, and R. F. Ambrose. 2004. Managing the marine
aquarium trade: Is eco-certification the answer? Environmental
Conservation 31:339-348.
Slade, D. C , R. K. Kehoe, and J. K. Stahl 1997. Putting the public trust doctrine to
work. Coastal States Organization, Washington, D.C.
Somerville, B. T. 1897. Ethnological Notes in New Georgia, Solomon Islands.
Journal of the Royal Anthropological Institute 26:357-413.
304

Spalding, M. D., C. Ravilious. and E. P. Green 2001. World atlas of coral reefs.
University of California Press, Berkeley, USA.
Spanier, E. 1994. What are the characteristics of a good artificial reef for lobsters.
Crustaceana 67:173-186.
Srinivasan, M., and G. P. Jones. 2006. Extended breeding and recruitment periods
of fishes on a low latitude coral reef. Coral Reefs 25:673-682.
Stobutzki, I. C, G. T. Silvestre. and L. R. Garces. 2006. Key issues in coastal
fisheries in South and Southeast Asia, outcomes of a regional initiative.
Fisheries Research 78:109-118.
Stone, R. B., H. L. Pratt, R. O. Parker, and G. E. Davis. 1979. Comparison of fish
populations on an artificial and natural reef in the Florida Keys. Marine
Fisheries Review 41:1 -11.
Subade, R. F. 2007. Mechanisms to capture economic values of marine
biodiversity: The case of Tubbataha Reefs UNESCO World Heritage Site,
Philippines. Marine Policy 31:135-142.
Svensson, P., L. D. Rodwell, and M. J. Attrill. 2008. Hotel managed marine
reserves: A willingness to pay survey. Ocean & Coastal Management
51:854-861.
Svensson. P., L. D. Rodwell, and M. J. Attrill. 2009. Privately managed marine
reserves as a mechanism for the conservation of coral reef ecosystems: A
case study from Vietnam. Ambio 38:72-78.
Talbot, F., and C. Wilkinson 2001. Coral Reefs, Mangroves and Seagrasses: A
sourcebook for managers. Australian Institute of Marine Science, Townsville,
Australia.
305

Taylor, C. D., and W. E. Molnar 2006. Population growth and local government
finance: What have we learned? Strom Thurmond Institute of Government
and Public Affairs. Clemson, South Carolina.
Teh, L. C. L., L. S. L. Teh, and F. C. Chung. 2007. A private management
approach to coral reef conservation in Sabah, Malaysia. Biodiversity and
Conservation.
The Royal Swedish Academy of Sciences 2008. The Nobel Prize in Chemistry
2008: How the jellyfish's green light revolutionised bioscience. Kungliga
Vetenskapsakademien. Available at: http://nobelprize.orq/. Accessed: Oct.
2008.
Thanhnien News. 2008. Khanh Hoa's dilemma. Ho Chi Minh City, Available at:
www.thanhniennews.com. Accessed: Nov. 2008.
ThiaEng, C. 1997. The essential elements of science and management in coastal
environmental managements. Hydrobiologia 352:159-166.
Timmins, R. J., and J. W. Duckworth 2001. Priorities for mammal conservation in
the ROA. In Baltzer, M.C., Nguyen Thi Dao, and Shore, R.G. (eds.).
Towards a vision for biodiversity conservation in the forests of the lower
Mekong ecoregion complex. WWF Indochina/WWF US, Hanoi and
Washington D.C.
Tongson, E., and M. Dygico. 2004. User fee system for marine ecotourism: The
Tubbataha Reef experience. Coastal Management 32:17-23.
Trexler, J. C , and J. Travis. 2000. Can marine protected areas restore and
conserve stock attributes of reef fishes? Bulletin of Marine Science 66:853-
873.
306

Tuan, V. S.. L DeVantier, N. V. Long, P. K. Hoang, and H. X. Ben 2005. Ecological
monitoring of Nha Trang Bay Marine Protected Area, Khanh Hoa, Viet Nam.
Reassessment 2002-2005. In Hon Mun Marine Protected Area pilot project,
biodiversity report No.15, Nha Trang Institute of Oceanography, Khanh Hoa.
Tuan, V, S.. H. Tuyen, T., N. X. Hoa. and L. DeVantier 2002. Sublittoral habitats of
Hon Mun protected area, Nha Trang Bay, Vietnam: Distribution, extends
and status 2002. lUCN.
Tun, K., L. M. Chou, A, Cabanban, V. S. Tuan, Philreefs, T. Yeemin, Suharsono, K.
Sour, and D. Lane. 2004. Status of coral reefs, coral reef monitoring and
management in Southeast Asia, 2004. In: Wilkinson C (ed) Status of coral
reefs of the world: 2004, Vol 1. Australian Institute of Marine Science,
Townsville.
Tuxson, T. 2005. Navini Island Resort - A true marine sanctuary. Press release -
Rubine Feature Article. Mamanuca Environment Society.
United Nations. 2001. World populations prospects, the 2000 revision: Highlights.
Population Division. Department of Economic and Social Affairs. Available
at: www.un.ora. Accessed: Nov. 2004.
Unsworth, R. K. F., P. S. De Leon, S, L, Garrard, J. Jompa, D. J. Smith, and J. J.
Bell. 2008. High connectivity of Indo-Pacific seagrass fish assemblages with
mangrove and coral reef habitats. Marine Ecology-Progress Series 353:213-
224.
Unsworth, R. K. F., A. Powell, F. Hukom. and D. J. Smith. 2007. The ecology of
Indo-Pacific grouper (Serranidae) species and the effects of a small scale
no take area on grouper assemblage, abundance and size frequency
distribution. Marine Biology 152:243-254.
- 307 -

Valiela, I., J. L. Bowen, and J. K. York. 2001. Mangrove forests: One of the world's
threatened major tropical environments. Bioscience 51:807-815.
Van Dau, D. 2002. Hon Mun Protected Area pilot project: Biodiversity report No. 10.
Background information for Hon Mun Marine Protected Area. lUCN, Nha
Trang, Vietnam. Available at: wvtfw.nhatranabavmpa.vnn.vn. Accessed: Nov.
2008.
Van Nguyen, L., and H. K. Phan. 2008. Distribution and factors influencing on
structure of reef fish communities in Nha Trang Bay Marine Protected Area,
South-Central Vietnam. Environmental Biology of Fishes 82:309-324.
Van Treeck, P., and H. Schuhmacher. 1998. Mass diving tourism - A new
dimension calls for new management approaches. Marine Pollution Bulletin
37:499-504.
van Zwieten, P. A. M., W. L T. van Densen, and D. Van Thi. 2002. Improving the
usage of fisheries statistics in Vietnam for production planning, fisheries
management and nature conservation. Marine Policy 26:13-34.
Verweij, M. C , I. Nagelkerken. D. de Graaff, M. Peeters, E. J. Bakker, and G. van
der Velde. 2006. Structure, food and shade attract juvenile coral reef fish to
mangrove and seagrass habitats: A field experiment. Marine Ecology-
Progress Series 306:257-268.
Vietnam-culture.com. Family life. Available at: www.vietnam-culture.com.
Accessed: Mar. 2009.
Vietnam Business Finance. 2008. Van Phong Economic Zone attracts many large
investment projects. 18th Aug. 2008. Vietnam Business Finance, Ho Chi
Minh City, Available at: www.vnbusinessnews.com. Accessed: Nov. 2008.
-308

Vincent, J. R. 2007. Spatial dynamics, social norms, and the opportunity of the
commons. Ecological Research 22:3-7.
Viteri, C , and C. Chavez. 2007. Legitimacy, local participation, and compliance in
the Galapagos Marine Reserve. Ocean & Coastal Management 50:253-274.
Vo Quy 1995. Conservation of flora, fauna and endangered species in Vietnam.
Tropical forest ecosystems/BIOTROP special publication. Vol. 55.
Vo, S., L. DeVantier, V. Nguyen, T. Hua, and X. Nguyen. 2004. Coral reefs of the
Hon Mun Marine Protected Area, Nha Trang Bay, Vietnam: Species
composition, community structure, status and management
recommendations. Proceedings of the Scientific Conference "Bien Dong-
2002", Nha Trang, Vietnam, pp 649-690.
Wakatobi Dive Resort 2008. Conservation. A new approach. Available at:
www.wakatobi.com. Accessed: June. 2008.
Walker, B. K., B. Henderson, and R. E. Spieler. 2002. Fish assemblages
associated with artificial reefs of concrete aggregates or quarry stone
offshore Miami Beach, Florida, USA. Aquatic Living Resources 15:95-105.
Walker, D. I., and R. F. G. Ormond. 1982. Coral death from sewage and phosphate
pollution at Aqaba, Red-Sea. Marine Pollution Bulletin 13:21-25.
Ward, T., D. Tarte, E. Hegerl, and K. Short 2002. Ecosystem-based management
of marine capture fisheries. World Wide Fund for Nature Australia, Australia.
(80 pp).
Weaver, D. B., and L. J. Lawton. 2007. Twenty years on: The state of
contemporary ecotourism research. Tourism Management 28:1168-1179.
Wells, M., and T. O. McShane. 2004, Integrating protected area management with
local needs and aspirations. Ambio 33:513-519.
- 3 0 9 -

West, J. M., and R. V. Salm. 2003. Resistance and resilience to coral bleaching:
Implications for coral reef conservation and management. Conservation
Biology 17:956-967.
White, A., and A. Cruz-Trinidad. 1998. The values of Philippine coastal resources:
Why protection and management are critical. Coastal Resource
Management Project, Cebu City, Philippines.
White, A. T., R. L Eisma-Osorio, and S. J. Green. 2005. Integrated coastal
management and marine protected areas: Complementarity in the
Philippines. Ocean & Coastal Management 48:948-971.
White, A. T., C. M. Loke. M. W. R. N. De Silva, and F. Y. Guarin 1990. Artificial
reefs for marine habitat enhancement in Southeast Asia. Manila, Philippines.
ICLARM Educ. Ser. 11.
White, A. T., M. Ross, and M. Flores. 2000. Benefits and costs of coral reefs and
wetland management, Olango Island, Philippines, in Cesar H. (ed.)
Collected essays on the economics of coral reefs, CORDIO, Kalmar
University, Kalmar Sweden.
White, A. T., and H. P. Vogt. 2000. Philippine coral reefs under threat: Lessons
learned after 25 years of community-based reef conservation. Marine
Pollution Bulletin 40:537-550.
White. A. T., H. P. Vogt, and T. Arin. 2000. Philippine coral reefs under threat: The
economic losses caused by reef destruction. Marine Pollution Bulletin
40:598-605.
White. P. C. L., A. C. Bennett, and E. J. V. Hayes. 2001. The use of willingness-to-
pay approaches in mammal conservation. Mammal Review 31:151-167.
310-

Whitehead, J. C. 2006. A comparison of contingent valuation method and random
utility model estimates of the value of avoiding reductions in king mackerel
bag limits. Applied Economics 38:1725-1735.
Wielgus, J., N. E. Chadwick-Furman, and Z. Dubinsky. 2004. Coral cover and
partial mortality on anthropogenically impacted coral reefs at Eilat, northern
Red Sea. Marine Pollution Bulletin 48:248-253.
Wielgus, J.. D. Glassom, and L. Fishelson. 2003. Long-term persistence of low
coral cover and abundance on a disturbed coral reef flat in the northern Red
Sea. Journal of Experimental Marine Biology and Ecology 297:31-41.
Wikipedia. 2008a. Religion in Vietnam. Available at: www.wikipedia.orq. Accessed:
Dec. 2008.
Wikipedia. 2008b. Khanh Hoa Province. Available at: www.wikipedia.ora.
Accessed: Dec. 2008.
Williamson, D. H., G. R. Russ, and A. M. Ayling. 2004. No-take marine reserves
increase abundance and biomass of reef fish on inshore fringing reefs of the
Great Barrier Reef. Environmental Conservation 31:149-159.
WWF. 2003. Conserving nature partnering with people: WWFs global work on
protected area network. WWF International. Available at: www.panda.ora.
Accessed: Aug. 2008.
Yentsch, C. S., C. M. Yentsch, J. J. Cullen, B. Lapointe, D. A. Phinney, and S. W.
Yentsch. 2002. Sunlight and water transparency: cornerstones in coral
research. Journal of Experimental Marine Biology And Ecology 268:171-183.
Zann, L. P. 1994. The status of coral-reefs in South Western Pacific Islands.
Marine Pollution Bulletin 29:52-61.
311

Appendix 1. Identified fish species from Whale Island Bay reserve, Whale island Bay Peninsula reserve and two Control sites
Fish Family
Fish family common
name Rsh species Fish species common name Acanthuridae Surqeonfish Acanthurus qrammoptilus FINE-LINED SURGEONFISH Acanthuridae Surgeonfish Acanthurus mata YELLOWMASK SURGEONFISH Acanthuridae Surqeonfish Acanthurus triostequs CONVICT TANG Acanthuridae Surqeonfish Ctenochaetus striatus LINED BRISTLETOOTH Acanthuridae Surgeonfish Naso lopezi S L E N D E R UNICORN FISH Acanthuridae Surgeonfish Zebrasoma veliferum PACIFIC SAILFIN TANG Antennariidae Froqfish Anntenarius striatus STRIPED FROGFISH Antennariidae Frogfish Antennarius pictus PAINTED FROGFISH Atherinidae Silverside Atherinomorus lacunosus ROBUST S ILVERSIDE
Balistidae Triqqerfish Pseudobalistes flavimarginatus
YELLOWMARGIN T R I G G E R F I S H
Balistidae Trigqerfish Rhinecanthus aculeatus PICASSO TRIGGERFISH Balistidae Triggerfish Sufflamen chrysopterus FLAGTAIL TRIGGERFISH Caesionidae Fusilier Caesio caerulaurea SCISSORTAIL FUSILIER Caesionidae Fusilier Caesio teres BLUE AND YELLOW FUSILIER Caesionidae Fusilier Caesio xanthonota YELLOWBACK FUSILIER Caesionidae Fusilier Pterocaesio digramma DOUBLE-LINED FUSILIER Caesionidae Fusilier Pterocaesio tessellata NARROWSTRIPE FUSILIER Caesionidae Fusilier Pterocaesio tile B L U E S T R E A K FUSILIER Carangidae Jacks Alepes melanoptera BLACKFIN SCAD Carangidae Jacks Caranqoides ferdau BLUE TREVALLY
Carangidae Jacks Carangoides orthogrammus Y E L L O W - S P O T T E D TREVALLY
Caranqidae Jacks Scomberoides commersionnianus TALANG QUEENFISH
Carangidae Jacks Scomberoides lysan DOUBLE-SPOTTED QUEENFISH
Centriscidae Razorfish Aeoliscus strigatus RAZORFISH Chaetodontidae Butterflyfish Chaetodon adiergastos PANDA BUTTERFLYFISH Chaetodontldae Butterftyfish Chaetodon auriga THREADFIN BUTTERFLYFISH Chaetodontidae Butterflyfish Chaetodon auripes ORIENTAL BUTTERFLYFISH Chaetodontidae Butterflyflsh Chaetodon ephippium SADDLED BUTTERFLYFISH Chaetodontidae Butterflyflsh Chaetodon lineolatus LINED BUTTERFLYFISH Chaetodontidae Butterflyfish Chaetodon lunula RACOON BUTTERFLYFISH Chaetodontidae Butterflyfish Chaetodon lunulatus REDFIN BUTTERFLYFISH
Chaetodontidae Butterflyfish Chaetodon melannotus BLACK-BACKED BUTTERFLYFISH
Chaetodontidae Butterflyflsh Chaetodon octofasciatus EIGHT-BANDED BUTTERFLYFISH
Chaetodontidae Butterflyfish Chaetodon raffles! LATTICED BUTTERFLYFISH Chaetodontidae Butterflyfish Chaetodon speculum OVALSPOT BUTTERFLYFISH Chaetodontidae Butterflyfish Chaetodon trifascialis CHEVRONED BUTTERFLYFISH Chaetodonttdae Butterflyfish Chaetodon vagabundus VAGABOND BUTTERFLYFISH Chaetodontidae Butterflyflsh Chaetodon wiebili BLACKCAP BUTTERFLYFISH Chaetodontidae Butterllyflsh Chelmon rostratus LONG-BEAKED CORALFISH
312

Chaetodontidae Butterflyfish Heniochus acuminatus LONGFIN BANNERFISH Chaetodontidae Butterflyfish Heniochus chrysostomus PENNANT BANNERFISH Chanidae Milkfish Chanos Chanos MILKFISH Fistulariidae Cornetfish Fistularia commersonii CORNETFISH Gerreidae Mojarras Gerres erythrourus DEEP-BODIED SILVER BIDDY Gerreidae Mojarras Gerres oyena BLACKTIP S ILVER BIDDY Haemutidae Sweetlip Diagramma pictum SILVER S W E E T L I P
Haemultdae Sweetlip Plectorhinchus chaetodonoides MANY-SPOTTED SWEETLIP
Haemulidae Sweetlip Plectorhinchus chrysotaenia GOLDSTRIPED SWEETL IPS
Haemulidae Sweetlip Plectorhinchus picas DOTTED SWEETLIP Holocentridae Squirrelfish Myripristis violacea VIOLET SOLDIERFISH Holocenlridae Squirrelfish Sarqocentron cornutum T H R E E - S P O T SQUIRRELFISH Labridae Wrasse Cheilinus chlorourus FLORAL W R A S S E Labridae Wrasse Cheilinus fasciatus R E D B R E A S T E D W R A S S E Labridae Wrasse Choerodon anchorage ANCHOR TUSKFISH
Labridae Wrasse Diproctacanthus xanthurus YELLOWTAILTUBELIP
Labridae Wrasse Halichoeres argus ARGUS W R A S S E Labridae Wrasse Halichoeres biocellatus TWOSPOT W R A S S E Labridae Wrasse Halichoeres chloropterus P A S T E L - G R E E N W R A S S E Labridae Wrasse Halichoeres hortulanus C H E C K E R B O A R D WRASSE Labridae Wrasse Halichoeres marginatus DUSKY W R A S S E Labridae Wrasse Halichoeres melanochir BLACK W R A S S E Labridae Wrasse Halichoeres nigrescens GREENBACK W R A S S E Labridae Wrasse halichoeres richmondi TAILSPOT W R A S S E IP Labridae Wrasse Halichoeres vrolikii INDIAN PINSTRIPE W R A S S E Labridae Wrasse Halichores leucurus CHAIN-LINED W R A S S E Labridae Wrasse Hemigymnus melapterus B L A C K E Y E THICKLIP
Labridae Wrasse Labroides dimidiatus BLUESTREAK CLEANER W R A S S E
Labridae Wrasse Macropharyngodon meleagris LEOPARD W R A S S E
Labridae Wrasse Neon Green Wrasse NEON G R E E N W R A S S E Labridae Wrasse Oxycheilinus bimaculatus TWOSPOT W R A S S E
Labridae Wrasse Pseudocheilinus hexataenia SIXSTRIPE W R A S S E
Labridae Wrasse Stethojulis interrupta CUTRIBBON W R A S S E Labridae Wrasse Stethojulis strigiventer THREE-LINE W R A S S E Labridae Wrasse Thalassoma lunare C R E S C E N T W R A S S E Labridae Wrasse Thallassoma hardwicke SIXBAR W R A S S E Lethrinidae Emperor Lethrinus amboninensis AMBON EMPEROR Lethrinidae Emperor Lethrinus erythropterus LONGFIN EMPEROR Lethrinidae Emperor Lethrinus harak THUMBPRINT EMPEROR Lethrinidae Emperor Lethrinus nebulosus SPANGLED EMPEROR Lethrinidae Emperor Lethrinus obsoletus ORANGE-STRIPED EMPEROR Lethrinidae Emperor Lethrinus ornatus ORNATE EMPEROR Lethrinidae Emperor Monotaxis grandoculis HUMPNOSE B I G E Y E BREAM Lutjanidae Snapper Lutjanus bohar RED SNAPPER Lutjanidae Snapper Lutjanus carponotatus SPANISHFLAG SNAPPER Lutjanidae Snapper Lutjanus ehrenbergii BLACKSPOT SNAPPER
313-

Lutjanidae Snapper Lutjanus fulvus BLACKTAIL SNAPPER Lutjanidae Snapper Lutjanus pibbus HUMPBACK SNAPPER Lutianidae Snapper Lutjanus lemnisciatus DARK-TAILED SNAPPER Lutjanidae Snapper Lutjanus quinquelineatus FIVE-LINED SNAPPER Lutianidae Snapper Lutjanus vitta BROWNSTRIPE SNAPPER Lutianidae Snapper Macolor niqer BLACK SNAPPER Monacanthidae Filefish Acreichthys tomentosus BRISTLE-TAILED FILEFISH Monacanthidae Filefish Aluterus scriptus S C R A W L E D FILEFISH
Monacanthidae Filefish Pseudomonacanthus macrurus S T R A P W E E D FILEFISH
Mullidae Goatfish Mulloidichthys flavolineatus Y E L L O W S T R I P E GOATFISH
Mullidae Goatfish Parapeneus multifaciatus MANYBAR GOATFISH Mullidae Goatfish Parupeneus barberinoides BICOLOR GOATFISH Mullidae Goatfish Parupeneus barbehnus DASH-DOT GOATFISH Mullidae Goatfish Parupeneus heptacanthus CINNABAR GOATFISH Mullidae Goatfish Parupeneus indicus INDIAN GOATFISH Mullidae Goatfish Parupeneus macronemua LONGBARBEL GOATFISH Mullidae Goatfish Upeneus tragula F R E C K L E D GOATFISH Muraenidae Moray Echidna nebulosa SNOWFLAKE MORAY Muraenrdae Moray Gymnothorax chilospilus WHITELIP MORAY Nemipteridae Coral Bream Scolopsis affinis PALE MONOCLE BREAM
Nemiptehdae Coral Bream Scolopsis affinis PALE MONOCLE BREAM JUVENILE
Nemipteridae Coral Bream Scotopsis bHineatus BRIDLED MONOCLE BREAM
Nemipteridae Coral Bream Scolopsis ciliatus WHITESTREAK MONOCLE BREAM
Nemipteridae Coral Bream Scolopsis margaritifer P E A R L Y MONOCLE BREAM
Nemipteridae Coral Bream Scolopsis monogramma MONOGRAM MONOCLE BREAM
Ostraciidae Boxfish Lactoria cornuta LONGHORN COWFISH Ostraciidae Boxfish Ostracion cubicus YELLOW BOXFISH Pomacentridae Damselfish Abudefduf bengalensis BENGAL S E R G E A N T
Pomacentridae Damselfish Abudefduf septemfasciatus BANDED S E R G E A N T
Pomacentridae Damselfish Abudefduf sexfasciatus SCISSORTAIL SERGEANT Pomacentridae Damselfish Abudefduf sordidus BLACKSPOT SERGEANT Pomacentridae Damselfish Abudefduf vaigiensis INDO-PACIFIC SERGEANT Pomacentridae Damselfish Abudefduf whitleyi G R E E N S E R G E A N T
Pomacentridae Damselfish Amblyglptiidodon ternatensis TERNATE DAMSEL
Pomacentridae Damselfish Amblyglyphidodon Curacao STAGHORN DAMSEL
Pomacentridae Damselfish Amblypomacentrus clarus BANGGAI DEMOISELLE Pomacentridae Damselfish Amphiprion akallopisos SKUNK ANEMONEFISH Pomacentridae Damselfish Amphiprion clarkii CLARK'S ANEMONEFISH Pomacentridae Damselfish Amphiprion frenatus TOMATO ANEMONEFISH Pomacentridae Damselfish Amphiprion perideraion PINK ANEMONEFISH Pomacentridae Damselfish Amphiprion polymnus SADDLEBACK ANEMONEFISH Pomacentridae Damselfish Amphiprion sandaracinos ORANGE BUTTERFLYFISH Pomacentridae Damselfish Chromis cinerascens G R E E N CHROMIS Pomacentridae Damselfish Chromis fumea SMOKY CHROMIS Pomacentridae Damsetfish Chromis viridis B L U E - G R E E N CHROMIS
314

Pomacentridae Damselfish Chrysiptera bioceUata TWOSPOT DEfVIOISELLE Pomacentridae Damselfish Chrysiptera rollandi HOLLAND'S DEMOISELLE Pomacentridae Damselfish Chrysiptera unimaculata ONESPOT DEMOISELLE Pomacentridae Damselfish Dascyllus aruanus HUMBUG DASCYLLUS Pomacentridae Damselfish Dascyllus flavicaudus YELLOW-TAILED DASCYLLUS Pomacentridae Damselfish Dascyllus melanurus BLACK-TAILED DASCYLLUS Pomacentridae Damselfish Dascyllus reticulatus RETICULATED DASCYLLUS Pomacentridae Damselfish Dascyllus trimaculatus T H R E E - S P O T DASCYLLUS Pomacentridae Damselfish Dischistodus fasciatus BANDED DAMSEL Pomacentridae Damselfish Dischistodus melanotus BACKVENT DAMSEL Pomacentridae Damselfish Dischistodus perspicillatus WHITE DAMSEL
Pomacentridae Damselfish Dischistodus prosopotaenia HONEYHEAD DAMSEL
Pomacentridae Damselfish Dischistodus pseudochrysopoecilus MONARCH DAMSEL
Pomacentridae Damselfish Hemiglyphidodon plagiometopor) LAGOON DAMSEL
Pomacentridae Damselfish Neoglyphidodon melas BLACK DAMSEL
Pomacentridae Damselfish Neopomacentrus filamentosus BROWN DEMOISELLE
Pomacentridae Damselfrsh Pomacentrus alexanderae ALEXANDER'S DAMSEL Pomacentridae Damselfish Pomacentrus coelestis NEON DAMSEL Pomacentridae Damselfish Pomacentrus cuneatus W E D G E S P O T DAMSEL
Pomacentridae Damselfish Pomacentrus grammorhynchus BLUESPOT DAMSEL
Pomacentridae Damselfish Pomacentrus moluccensis LEMON DAMSEL
Pomacentridae Damselfish Pomacentrus opisthostigma BROWN DAMSEL
Pomacentridae Damselfish Pomacentrus pavo BLUE DAMSEL Pomacentridae Damselfish Pomacentrus proteus COLOMBO DAMSEL Pomacentridae Damselfish Pomacentrus simsiang BLUEBACK DAMSEL
Pomacentridae Damselfish Pomacentrus taeniometopon BRACKISH DAMSEL
Pomacentridae Damselfish Pomacentrus tripunctatus T H R E E S P O T DAMSEL Pomacentridae Damselfish Steqastes lividus BLUNTSNOUT G R E G O R Y Pomacentridae Damselfish Stegastus altus JAPANESE G R E G O R Y Scaridae Parrotfish Chlorurus bleekeri B L E E K E R ' S PARROTFISH Scaridae Parrotfish Chlorurus microrhinus S T E E P H E A D PARROTFISH Scaridae Parrotfish Chlorurus sordidus BULLETHEAD PARROTFISH
Scaridae Parrotfish Hipposcarus lonqiceps PACIFIC LONGNOSE PARROTFISH
Scaridae Parrotfish Scarus dimidiatus YELLOW-BARRED PARROTFISH
Scaridae Parrotfish Scarus ghobban BLUE-BARRED PARROTFISH IP Scaridae Parrotfish Scarus rivulatus S U R F PARROTFISH Scorpaenidae Lionfish Dendrochirus zebra ZEBRA LIONFISH Scorpaenidae Lionfish Pterois miles CLEARTAIL LIONFISH Serranidae Grouper Cephatopholis boenak CHOCOLATE G R O U P E R Serrantdae Grouper Diploprion bifasciatum DOUBLEBANDED SOAPFISH Serranidae Grouper Epinephelus bontoides PALEMARGIN G R O U P E R Serranidae Grouper Epinephelus malabaricus MALABAR G R O U P E R Serranidae Grouper Epinephelus merra HONEYCOMB G R O U P E R Serranidae Grouper Epinephelus onqus WHITE-SPECKLED GROUPER
-315

Serranidae Grouper Epinephelus spilotoceps FOURSADDLE G R O U P E R Siqanidae Rabbitfish Siganus canaliculatus WHITE-SPOTTED RABBITFISH Siqanidae Rabbitfish Siganus guttatus GOLDEN RABBITFISH Siganidae Rabbitfish Siganus vermiculatus VERMICULATE RABBITFISH Siqanidae Rabbitfish Siganus virgatus VIRGATE RABBITFISH Soleidae Sole Pardachirus pavoninus P E A C O C K S O L E Sphyraenidae Barracuda Sphyraena barracuda G R E A T BARRACUDA Sphyraenidae Barracuda Sphyraena genie BLACKFIN BARRACUDA Synanceiidae Stonefish Inimicus didactylus SPINY DEVILFISH
Syngnathidae Seahorse Hippocampus taeniopterus COMMON S E A H O R S E
Synodontidae Lizardfish Synodus dermatogenys CLEARFIN LIZARDFISH Tetraodontidae Puffer Arothron hispidus WHITE-SPOTTED P U F F E R Tetraodontidae Puffer Arothron immaculatus IMMACULATE P U F F E R Tetraodontidae Puffer Arothron nigropunctatus BLACKSPOTTED P U F F E R Tetraodontidae Puffer Canthigaster valentini BLACK-SADDLED TOBY Zanctidae Moorish Idol Zanclus comutus MOORISH IDOL
316

Appendix 2. Pictures of some fish species mentioned in this thesis, found around Whale Island (Hon Ong), Vietnam
Orbicular Cardinalfish Sphaeramia orbit, ularis
Apogonidac
Clearfin Lizard fish Shorthead Fangblenny Synodus dennato^eny Petroscirtes hreviceps
Synodonlidae Blcnniidae
Banded Shrimpgoby Cryptoi entrus cim tus
Gohbidae
Blacktip Silver Biddy Gerres oyena
Gerreidae
Threadfin Bultertlyfish Chaetodon aurii^a
Chaerodontidae
Brown Demoiselle Neopomcu cntrus fdumentosu
Pomacentridae
Scissortail Sergeant Ahudefduf sexfasciatus
Pomarentridae
Anchor Tuskfish Choerodon anchora^o
Labridae
Pastel-green Wrasse Hcdi( hoe res chloropterus
Labridae
VV^itesteak Monocle Bream Scolopsis (Hiatus
Nemipteridae
Chocolate Grouper Cephalopholis hoenak
Serranidae
- 3 1 7

BlackspcM Snapper Lutjanus ehrenhergii
Lutjanidae
Spangled Emperor Lethrinus nehulosus
1 -ethrinidae
Blue and Yellow Fuslier Caesio teres r; iesionidae
Golden Rabbitfish Siganus guttatus
Siganidae
Surf Parrotfish Scarus rivulatus
Scaridae
Acute-jawed Mullet Neomyxus leuciscus
Muglidae
Blue Trevally Carangoides ferdau
Carangidae
Double-spotted Queenfish Scomheroides lysan
Carangidae
•
Milkfish Chanos chanos
Chanidae
Blackfin Barracuda Sphyraena qenie
Sphyraenidae
318

Appendix 3. Fishers questionnaire
1. Please state your sex and age. 1[ ]Male 2[ ]Female
i[ ]<18 2( ]18-25 3( ]26-35 4[ ]36-45 5[ ]46-55 6[ ]56-65 7[ ]>65
2. Education attained i[ ]Elementary 2[ ]High School 3[ ]College
3. Please state your household's average monthly income
4. Do you think the amount of fish in the ocean has increased or decreased in the last 10 years? 1[ ]Decreased 2[ ]No change 3[ Jlncreased
5. What do you think are the top 5 reasons why the amount of fish has decreased?
1[ JBetter fishing techniques 2[ ]Boat anchors damaging corals 3[ JBIast fishing 4[ jSewage outflow 5[ JTourists diving, snorkelling 6[ jo i l pollution from boats 7[ jcyanide fishing 8[ jusing coral for building 9[ jpertilizer run-off io[ jOver-fishing i i [ ]Rubbish dumping 12[ jother
6. Do you think the coral reefs and fish need protection? 1[ ]Yes 2[ ]No
If Yes, please suggest how they should be protected?
7. What fishing technique(s) do you use?
i[ ]Line fishing 2[ JTrawling 3[ JDrag net fishing 4[ jcast net fishing 5[ ]Cyanide fishing 6[ ]Trap fishing 7[ ]B!ast fishing 8[ jspear fishing 9[ ]Hose and hook fishing io[ ]Electricity i i [ JBright light fishing 12[ ]Other i3[ ]Other
8. What species do you target when fishing?
9. Please explain why you think Whale Island Resort closed off the bay with buoys?
319-

10. Do you think you and your community have benefited from Whale Island Resort and its marine protected area (marine area inside buoys)? 1[ ]Yes 2[ ]No
If Yes, please explain
11. Please specify if you have noticed a change in the number, size and number of different fish within 200m of the buoys enclosing the bay of Whale Island Resort. 9 9 0 I do not fish within 200m of the marine reserve
1. Number of fish 1[ ]Much Higher 2[ ]Higher 3[ )No change 4[ ]Lower 5[ ]Much Lower
2. Size of fish 1[ ]Much Bigger 2[ IBigger 3[ ]No change 4[ JSmalier 5[ )Much smaller
3. Number different fish i [ ]Much Higher 2[ ]Higher 3[ ]No change 4[ ]Lower 5[ ]Much Lower
12. Please indicate if your monthly income has changed because of Whale Island Resort and its marine protected area.
11 1>20% Increase 2[ ]>107o increase 3[ JNo change 4[ ]>10% decrease 5[ ]>20% decrease
If change, please indicate why
13. Please state if you have found more of any particular species within 200m of the buoys since Whale Island Resort closed the bay from fishing? i[ ]Yes 2[ ]No If Yes. which?
14.Some fishermen sometimes fish inside the buoys. Please suggest what you think the hotel could do so that fishermen agree not to fish inside the bay enclosed by the buoys.
15. Please explain if you think it would be a good idea if the hotel were to close off more coastal areas with buoys around Whale Island (Hon Ong) from fishing. i[ ]Good Idea 2[ ]Bad idea
Please explain
-320

Appendix 4. Tourist questionnaire
Nationality Sex: i D Female 2O Male Country of Residence
1. Please state your age.
i D <18 2n 18-25 3O 26-35 4 0 36-45 SD 46-55 6 ^ 56-65 ? • >65
2. Please indicate your level of education.
i D Secondary School 2 0 College 3 0 University 4 0 PhD
3. Please state your yearly gross income in US$.
i D No income 2n<15000 3n<30000 4D<45000 5n<60000 6n<75000 7 n < 9 0 0 0 0 8 n > 9 0 0 0 0
4. Please choose the top 3 methods you usually use to locate your hotels
1 • Internet hotel search 2 0 Travel Agencies 3 0 Travel Magazines 40 Word of Mouth 5 n Environmental hotel awards sites sO Travel guides y O other
5. Please specify how you found Whale Island Resort?
6. Please specify on a scale from 1 - 5 the Importance of the following in choosing your hotel. 1 being the most important.
Facilities
Service
Environmental Awards 3
Location
Price
7. Please choose the top 3 reasons for choosing Whale Island Resort as your destination?
i D island Setting 3O Inexpensive 5 0 SCUBA Diving/snorkelling ? • Safety
2O Service 4 ^ Eco friendly 6 n Away from Mass Tourism SD Other
- 3 2 1

8. How many dif ferent countries have you visi ted since April 2005 for leisure?
i n i - 5 2 n 6 - 1 0 S D 1 1 - 1 5 4 n 16 -20 5 n >20
9. Do you know what Marine Protected Areas / Marine Reserves are? 1 • Yes 2n No
10. Do you know how to f ind environmental ly fr iendly hotels?
i D Yes 20 No
If Yes, please explain how
11 . Would you like to be able to have access to information on the hotel 's
environmental policies before staying in a hotel? 1 • Yes 2\3 No
12. Did you know that Whale Island Resort is an environmental ly fr iendly hotel which is protecting an area of coast l ine f rom over-use and overf ish ing (marine reserve) to help save the ecosystem? 1 • Yes 20 No
13. Have you snorkeled/dived inside the protected area (Area wi th in the
buoys sur rounding the bay) AND outs ide?
1 • Yes 2 • No Please proceed to question number 14
If so, how wou ld you assess the state of the ecosystem wi th in the reserve
compared wi th surrounding areas?
1. General state ! • Much Better 20 Better sD Same 40 Poorer 2. Fish Diversity iD Much Higher 2 ^ Higher 30 Same 4 ^ Lower 3. Number of Fish iQ Much Higher 20 Higher sH Same 40 Lower 4. No. of Invertebrates i D Much Higher 20 Higher 30 Same 40 Lower 5. Size of Fish i D Much Bigger 20 Bigger sU Same 40 Smaller 6. Coral Cover iD Much Higher 20 Higher Same 40 Lower
14. Please indicate if you have previously stayed at Whale Island Resort.
i D Y e s , once 2nYes 2-3 times 3nYes 4-5 times 4nYes, >5 times s D N O
If Yes, please speci fy the importance of the hotel-managed marine reserve for returning to the hotel and state if you th ink you've seen a change in the number of f ish w i th in the reserve.
iDExtremely important 2nVery important SDlmportant 4nQuite important SDNot important
Number of Fish: 1 • Much Higher 2D Higher 3 0 Same 4 0 Lower
- 3 2 2 -

15. Would you want to return to Whale Island Resort In the future?
i D Yes Please explain 2\3 No Please explain
16. Please explain If you support the concept of hotels managing marine reserves?
1 • Yes Why?
2n No Why?
17. How should information about hotel-managed marine reserves be accessible to you?
18. Were you to choose between two hotels, both hotels being equal except for one hotel having a hotel-managed marine reserve, would you be willing to pay more to stay there?
1 • Yes 2n No (General question: Whale Island Resort not intended!)
If yes, how much more would you be willing to pay per night in US$ or in %
of room rate?
3 2 3 -

Appendix 5. Hotel Managed Marine Reserve questionnaire
Your name:. Position:. Sex:1[ ]Male 2[ ]Female Date: Email Nationality: Hotel star rating_ Hotel name: Hotel homepage:. Rack rate (Db/night - US$) No. rooms Hotel total capacity: (No. guests) No. Staff No. local staff. Ave. length of stay Return guests (%) Ave. yearly occupancy (%) HMMR name: HMMR website? Address:
1. Hotel clientele (%)
1[ ]Tourist 2[ ]Business 3[ ]Other.
2. Marine activities available to guests
3. Hotel's location and surroundings
1 [ ] Mainland 2[ ] Island - Distance to mainland (Km). 3. Estimated number of resident fishers w/in 1 Km 4. No. mariculture within 500m of HMMR 5. Nearest city S.Distance from hotel (Km) 7.Est. Population size (thousands) S.Estimated coast built up with structures (%) 9. Number of ports/factories/industries within 1 Km 10. Distance to next MPA (Km) 11 .Owned by or name
4. Habitat/ecosystem(s) within marine reserve
1[ ] Coral Reef 2[ ] Seagrass bed 3[ ] Sandy bottom 4[ ] Rocky intertidal 5[ ] Mangrove 6[ ] Macro-algal bed 7[ ] Soft bottom 8[ ] Open water
3 2 4 -

5. Type of coral reef
1[ ] Fringing 2[ ] Barrier 3[ ] Pinnacle rock 4[ ] Patch 5[ ] Atoll 6[ ] Offshore reef / Shoal
6. Boundary coordinates if known (Latitude e.g. N 12° 39*20.3" Longitude e.g. E 109° 23'69.3")
Point 1 Point 2 Points Point 4
7. Management zones and size (if unknown - l h a is approx. the size of a soccer field)
1. Core Zone Size (ha) Regulations
2. Buffer Zone Size (ha) Regulations - -
3.Other Zone Size (ha). Regulations
8. Year legally established
9. Basis for legal establishment (laws permitting establishment)
10.HMMR establishment history (brief chronological order of events)
11.HMMR objectives (initiator and reason for establishment)
12. Main managing group of HMMR and responsibilities:
13. Assisting managing group of HMMR and their responsibilities 1. 2, 3.
3 2 5

14. Financial mechanisms/income in place?
Amount ($US) Specifics/Guidelines/Policy 1[ ] User/entry fee
2[ ] Trust Fund
3[ ] Gov't Budget allocation
4[ ] Grants
5[ ] Other
6[ ] Other
15. Who manages the funds
16. How much is the estimated annual gross income of the HMMR ($US)?
17. How much was spent on annual HMMR management/operations ($US)?
18. Expenditures cover what items? Amount per annum ($US)
1[ ] Enforcement support
(e.g. marker buoys/billboards/leaflets/guardhouse/boat)
2[
3[
4[
5[
6[
7[
8[
9[
10[
11[
HMMR ranger salary - Number of rangers?
Other salaries - pis specify
Materials and supplies (e.g. office supplies/gasoline)
Moorings/anchor buoys - Number in possession?
Repairs and maintenance
Education programs - pis specify
Artificial reef/FAD etc. pis specify.
Advertising
Other - pis specify
Other - pis specify
3 2 6

19. Supplemental or alternative livelihoods created as a result of establishing the HMMR?
20. Has advertising that you have established an HMMR increased the number of guests to your hotel over the last year?
1 [ ]Yes 2[ ]No, we do not advertise the MPA - proceed to Q22.
I.Occupancy 1[ ]< 5% 2[ ]5-10% 3[ ]10-20% 4[ ]>20% 5[ ]Don't know
1.Ave. length of stay1[ ]< 5% 2[ ]5-10% 3[ ]10-20% 4[ ]>20%5[ ]Don't know
1.No. return guests 1[ ]< 5% 2[ 15-10% 3[ ]10-20% 4[ ]>20%5[ ]Don*t know
21. Please state how you advertise the HMMR and which method you believe is most effective
22, How would you a s s e s s the state of your HMMR?
LFish Diversity 1[ ]High 2[ JFairly High 3[ ]Average 4[ JFairly Low 5[ ]Low 2.Number of fish 1[ IHigh 2[ ]Fairly High 3[ JAverage 4[ ]Fairly Low 5[ ]Low
3.Coral Diversity n IHigh 2[ ]Fairly High 3[ ]Average 4[ ]Fairly Low 5[ ]Low 4.Coral cover n 1>75% 2[ ]50-75% 3[ ]25-50% 4[ ] 10-25% 5[ ]<10% S.AIgae cover n )>75% 21 ]50-75% 3[ ]25-50% 4[ ] 10-25% 5[ ]<10%
6.No. invertebrates 1[ ]High 21 ]Fairly High 3[ ] Average 4[ ]Fairly Low 5[ ]Low
23. How would you a s s e s s the changes to the HMMR since legal establishment?
% Increase % Decrease % Increase % Decrease 1.Fish Diversity 1[ ] 2[ ] 2.Number of Fish 1[ ] 2[ ]
3.Coral Diversity 1[ ] 2[ ] 4.Coral Cover 1[ ] 2( ]
S.AIgae Cover 1[ ] 2[ ] 6.No. Invertebrates 1[ ] 2[ ]
3 2 7

24. How wou ld you assess the state of the HMMR compared wi th adjacent simi lar unprotected areas?
Much Higher Higher No Change Lower Much Lower
I.Fish Diversity 1[ 1 2[ ] 3[ ] 4( ] 5[ ]
2.Number of Fish 11 1 2[ 1 3( ] 4[ ] 5[ ]
3.Coral Diversity 1[ ] 2[ ] 3[ 1 4[ ] 5[ 1 4.Coral Cover 1[ ] 2[ ] 3[ ] 4[ ] 5[ ]
S.AIgae Cover 1[ 1 2[ ] 3[ 1 4[ ] 5[ ]
6.No. Invertebrates 1[ 1 2[ ] 3[ ] 4[ ] 5[ ]
25. What are the man-induced damaging factors to the marine ecosystem in your area?
1 [ ]Coastai Development 4[ ]Coral Mining 6[ jsewage Discharge 9[ ]Damage from Tourists 11[ JOther 12[ ]Other
2[ ]Fertilizer Runoff 3[ ]Destructive Fishing 5[ ]Deforestation-Sedimentation 7[ ]Mangrove Harvesting 8[ ]Anchor Damage
10[ ]Mariculture
26. Please state If you think your HMMR is effectively protected
1[ ]Yes 21 ]No
If No* please state what the major problems are and how you think they can be rectified
27. Please speci fy other hotels (& manager contact emails if known), which have establ ished an HMMR
328 -
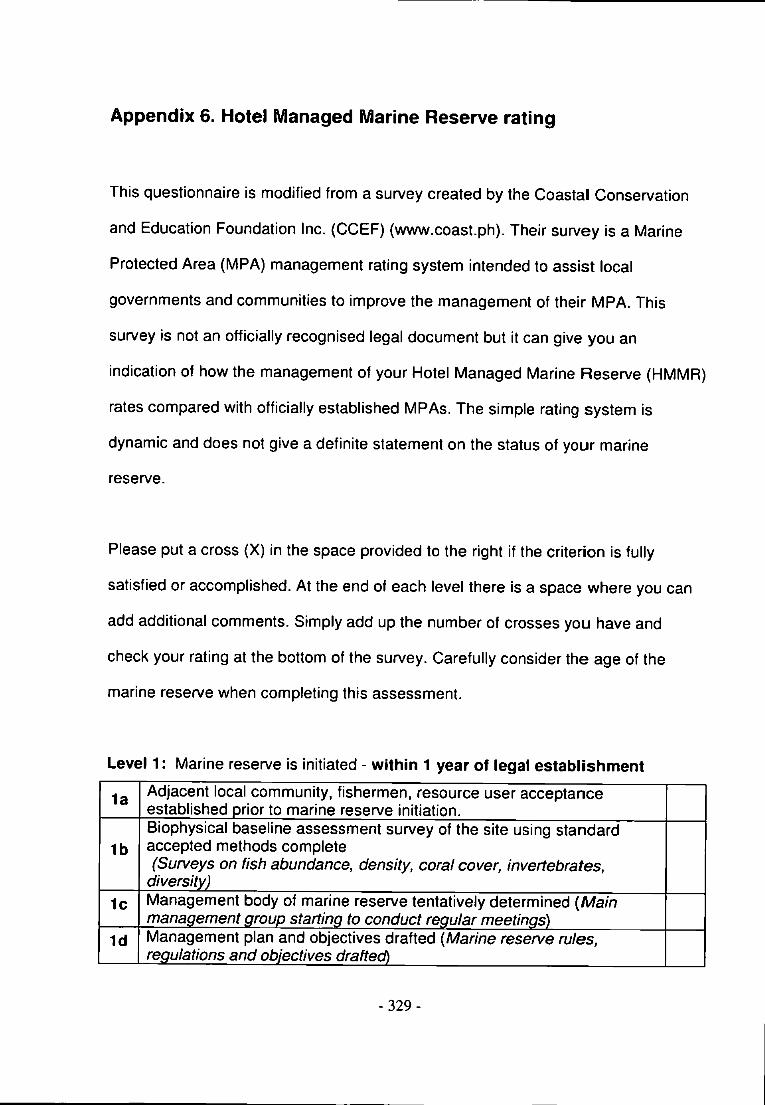
Appendix 6. Hotel Managed Marine Reserve rating
This questionnaire is modified from a survey created by the Coastal Conservation
and Education Foundation Inc. (CCEF) (www.coast.ph). Their survey is a Marine
Protected Area (MPA) management rating system intended to assist local
governments and communities to improve the management of their MPA. This
survey is not an officially recognised legal document but it can give you an
indication of how the management of your Hotel Managed Marine Reserve (HMMR)
rates compared with officially established MPAs. The simple rating system is
dynamic and does not give a definite statement on the status of your marine
reserve.
Please put a cross (X) in the space provided to the right if the criterion is fully
satisfied or accomplished. At the end of each level there is a space where you can
add additional comments. Simply add up the number of crosses you have and
check your rating at the bottom of the survey. Carefully consider the age of the
marine reserve when completing this assessment.
Level 1: Marine reserve Is initiated - within 1 year of legal establishment
l a Adjacent local community, fishermen, resource user acceptance established prior to marine reserve Initiation.
l b Biophysical baseline assessment survey of the site using standard accepted methods complete (Surveys on fish abundance, density, corai cover, invertebrates,
diversity) 1c Management body of marine reserve tentatively determined {Main
management group starting to conduct regular meetings) I d Management plan and objectives drafted (Marine reserve rules,
regulations and objectives drafted)
- 3 2 9

1e Marine reserve legally established (Accepted within the local laws)
I f Leaflets/signs at the hotel informing guests of marine reserve (Information and warning not to damage corals etc.)
i g Marker buoys and/or boundary markers/signs installed
1h Hotel staff awareness program initiated to help raise understanding and support for the marine reserve (Management plan and objectives conveyed and the benefits of marine reserves communicated)
Comment:
Level 2: Marine reserve is established - w i th in 1 or 2 years of legal
establ ishment
2a Local community education programs started to help raise awareness/understanding and support for marine reserve (Conducted a series of public education activities)
2b Management body formally organised and recognised (Main and potential assisting managing group conducting regular documented meetings)
2c Management plan and objectives successfully adopted (Marine reserve rules and regulations disseminated using appropriate and practical means to target all direct users and other stakeholders)
2d
Management activities started (Conducted at least 2 marine reserve activities such as: installation of enforcement support structures, patrolling and surveillance, maintenance of buoys, managing violators, user fees implemented etc.)
2e Biophysical monitoring includes local participation (Locals were trained to do biophysical surveys using standard/accepted methods)
2f Marine reserve rules and guidelines posted at strategic locations
2g Staff education/training programs in place (Marine reserve management plan, objectives and progress of MPA disseminated to staff. Further training given, if applicable to support management plan and objectives)
2h Education programs set up for visiting tourists (Presentations and/or snorkelling/diving tours given addressing the importance and progress of the marine reserve)
2i Anchor buoys placed
Comment:
- 330 -

Level 3: Marine reserve Is enforced legal establishment
only applies for 2 years or older since
3a Local community and staff education programs are now conducted regularly
3b Management body active (Implements tfie management plan; coordinates enforcement activities; members attend meetings regularly)
3c Funds allocated to maintain enforcement support structures (e.g. boundary markers, buoys, signs etc.)
3d Regular biophysical monitoring measuring habitat condition and changes conducted {at least annual monitoring with local participation)
3e Fishing effectively stopped inside the marine reserve (no violations reported in the last year)
3f Illegal and destructive fishing reduced outside of the marine reserve (Violations/apprehensions reported within 500 m from the marine reserve boundary was reduced by 50% for the past year)
3g Tourist education and awareness program active (tourists are actively educated in the importance of marine conservation and encouraged to participate in your conservation activities)
Comment:
Level 4: Marine reserve is sustained legal establishment
only applies for 3 years or older since
4a Local community, staff and tourist education programs maintained over the years
4b Management body runs the marine reserve successfully (Management body supervises management activities i.e. implementation of plans, enforcement, budgeting, monitoring, evaluation, and coordinates activities with eventual partners)
4c Management plan updated in a participatory process (Management plan amended with the participation of various stakeholders: fishermen, local community, local government units, other private enterprises etc.)
4d Annual biophysical monitoring and feedback of results supervised by the managing body (Document is surveyed using standard/accepted methods. Reports are available)
4e Enforcement system fully operational (Enforcement support structure such as guardhouse, buoys and signs maintained and patrolling activities sustained over the years)
4f Illegal and destructive activities stopped inside and within the vicinity of the marine reserve (No violations reported inside and within 500m from the marine reserve boundary in the past year)
4g Environment friendly enterprise and/or user fees collected as a sustainable financing strategy (Se//s environmentally friendly products/goods to tourists; imposes collection of user-fees etc.)
Comment:
- 3 3 1 -
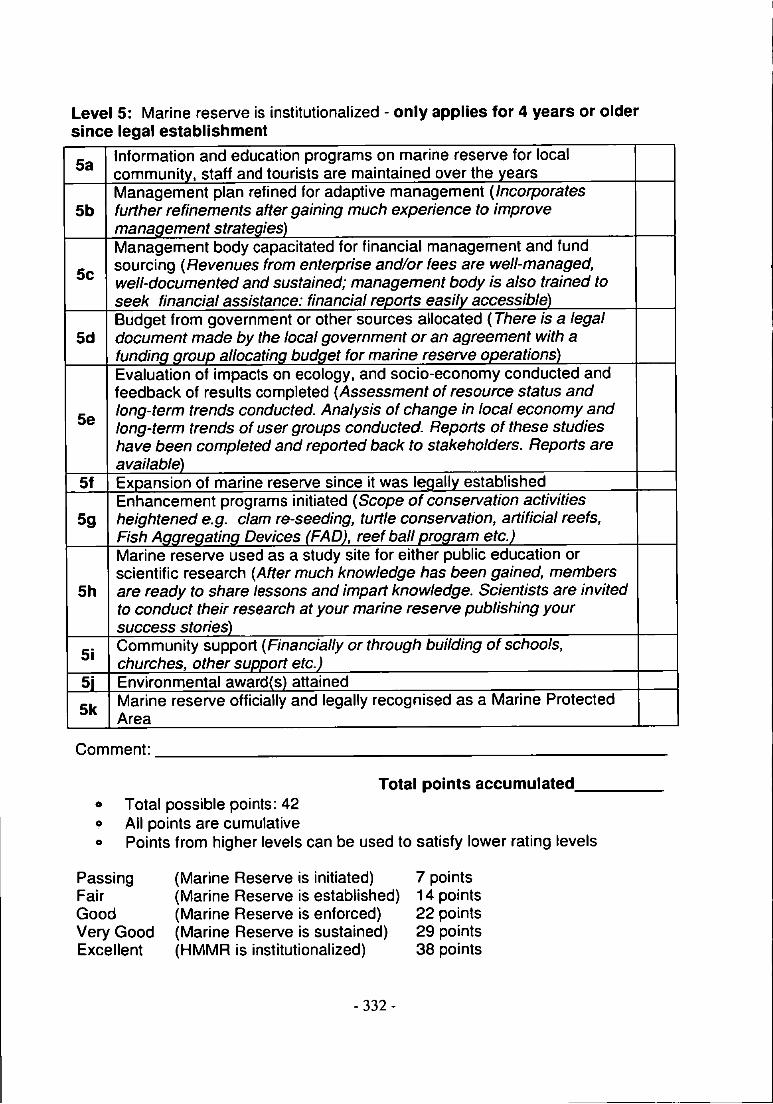
Level 5: Marine reserve is institutionalized - only applies for 4 years or older since legal establishment
5a Information and education programs on marine reserve for local community, staff and tourists are maintained over the years
5b Management plan refined for adaptive management (Incorporates further refinements after gaining much experience to improve management strategies)
5c
Management body capacitated for financial management and fund sourcing (Revenues from enterprise and/or fees are well-managed, well-documented and sustained; management body is also trained to seek financial assistance: financial reports easily accessible)
5d Budget from government or other sources allocated (There is a legal document made by the local government or an agreement with a funding group allocating budget for marine reserve operations)
5e
Evaluation of Impacts on ecology, and soclo-economy conducted and feedback of results completed (Assessment of resource status and long-term trends conducted. Analysis of change in local economy and long-term trends of user groups conducted. Reports of these studies have been completed and reported back to stakeholders. Reports are available)
5f Expansion of marine reserve since it was legally established
5g Enhancement programs initiated (Scope of conservation activities heightened e.g. clam re-seeding, turtle conservation, artificial reefs, Fish Aggregating Devices (FAD), reef ball program etc.)
5h
Marine reserve used as a study site for either public education or scientific research (After much knowledge has been gained, members are ready to share lessons and impart knowledge. Scientists are invited to conduct their research at your marine reserve publishing your success stories)
5i Community support (Financially or through building of schools, churches, other support etc.)
5j Environmental award(s) attained
5k Marine reserve officially and legally recognised as a Marine Protected Area
Comment:
Total points accumulated • Total possible points: 42 o All points are cumulative o Points from higher levels can be used to satisfy lower rating levels
Passing (Marine Reserve Is initiated) 7 points Fair (Marine Reserve is established) 14 points Good (Marine Reserve is enforced) 22 points Very Good (Marine Reserve Is sustained) 29 points Excellent (HMMR Is institutionalized) 38 points
3 3 2

Appendix 7. Eco-friendliness rating
This questionnaire is modified from Australia's EcoCerlification program, which was
established to help identify genuine nature eco-tourism products
(www.ecotourism.org.au/neap.asp). This survey is not an officially recognised legal
document so It does not equal eco-certification but it will give you an indication of
how eco-friendly your hotel is and possibly give you an idea of how to improve your
sustainable activities.
Please put a cross (X) in the space provided to the right if the criterion is fully
satisfied or accomplished. At the bottom of the each section there is space where
you can add comments pertaining to the criteria or comment on other practices
maintained at your hotel.
Wastewater management
1a
Wastewater receives at least secondary treatment or is composted. Where this is not practical, the method of wastewater treatment (direct disposal of sewage or septic system) is justifiable and the ongoing impacts on ground and surface waters have been assessed and judged sustainable
l b All on-site wastewater treatment has breakdown alarms, approved emergency bypass facilities and an ongoing water operations manual that is administered by a trained operator
1c Treated effluent discharged to land or water meets or exceeds statutory requirements
Id Biodegradable cleaning chemicals used
Comments:
3 3 3

Waste minimization and management l a Glass recycling 1b Plastic recycling l c Paper recycling l d Rubbish bins strategically located throughout premises 1e Food and materials purchased in bulk 1f Majority of food/drinks purchased from local vendors/communities i g Organic waste composting 1h Organic kitchen waste given away to be used, e.g. pig farms 1i Cleanup days are organized and tourist participation is encouraged
I j All encountered litter is picked up and removed e.g. daily beach cleanups
Comments:
Energy consumption management
l a Timers/movement detectors used to controlling lights and/or air-conditioner
l b Compact fluorescent bulbs used wherever possible 1c Key-tag used as power switch in rooms 1d Staff trained in energy preservation 1e Alternative energy source available e.g. solar 11 Only natural light used during the day
i g Heat recovered from equipment, e.g. waste heat from diesel generators
Comments:
Water conservation management 1a Aerated taps l b Low pressure shower heads 1c Low flush toilets I d Guests participating in a towel and linen reuse program 1e Staff trained in water preservation I f Irrigation water used from treated wastewater
Rainwater/stormwater collection 1h Low water-volume gardens e.g. native plants 1i Guests advised to use minimal water
Comment:
3 3 4

Noise/Air quality management
l a Chlorofluorocarbons (CFG) emissions avoided from refrigerators, air conditioners etc.
l b No offensive odours 1c Smoking discouraged In public enclosed areas Id Minimal heat and/or steam emissions 1e Adequate insulation around noisy machinery e.g. generators If Noise pollution kept minimal
Comment:
Low environmental impact for construction and maintenance of ecotourism infrastructure
l a Building material sourced from local renewable products where possible
1b Recycled building material has been used wherever possible 1c Water runoff causing siltation is kept to a minimum Id Minimal excavation and dredging
1e No toxic material on structures e.g. copper/arsenic on timber, copper/zinc antifouling paint on boats
Comment:
Minimal nature disturbance management l a Minimal clearing of natural area l b Erosion not evident or actions taken to avoid erosion 1c Herbicides or pesticides leaving residual pollution are avoided
Id Drains/sediment traps/wetlands constructed to impede sediment/nutrient runoff from rainwater/stormwater
1e Low disturbance to local wildlife enforced If The hotel reflects the character of the surrounding natural environment
Defined nature trails if available 1h Avoiding disruption of wildlife movement/breeding sites
11 Divers and snorkelers when on diving trips are lectured to be mindful of the environment and told not to damage the coral or to collect corals or shells etc.
i i Sale of items extracted from the ocean i.e. coral fragments, shells etc. not permitted on the property
Comment:
• Total number of points: Total points accumulated
Passing 25 points Fair 30 points Good 35 points Very Good 40 points Excellent 46 points
- 3 3 5 -

Appendix 8. Accepted articles
- 3 3 6

Oce^n & Coasul Man^emeni 31 (2008) 854-861
ELSEXnER
Contents lists available at ScienceDirect
dceah & Goastal M
j o u r n a l honr>epage: w w w . e l s e v i e r . c o m / l o c a t e / o c e c o a n i a n
Hotel managed marine reserves: A willingness to pay survey Patrik Svensson^ *' *. Lynda D. RodwelI^ Martin J. Attrill^ 'Murine Biology and Ecology Research Centre. Marine Institute. University of Plymouth. Drake Circus. Plymouth. PL4 8AA UK *'Centrefor Marine and Coastal Policy Research, Marine Institute. University of Plymouth. Drake Circus. Plymouth. P14 8J\A UK
A R T I C L E I N F O
Article history: Available online 19 September 2008
A B S T R A C T
The 2003 Marine Pari<s Congress recommended networks of marine reserves to be established covering 20-30% of habitats by 2012. Most marine reserves are. however, faihng to meet their objectives, the main reason being attributed to lack of funding. In light of the growing need for effectively managed marine reserves, a survey ascertaining tourists' support and willingness to pay extra to stay at reserves managed by the private sector - Hotel Managed Marine Reserves (HMMRs) was conducted at Whale Island Resort. Vietnam. A total of 97.5% support HMMR, 86.3% were willing to pay. the median amounting to US$9.6/ room/night, or \Q% of the average room rale, equaling US$67,277 at 60% occupancy.
© 2008 Elsevier Ltd. All rights reserved.
1. Introduction
Marine Protected Areas (MPAs). independent of their size [1], have been recognized as an effective method to sustain or increase species diversity, fish size, density and biomass from an otherwise over-fished coastline and to enhance fishing yields in the surrounding fished area through the process of 'spillover' o f fish from the MPA [2-41. A number of different types of MPAs wi th a variety of managing bodies have been adopted, including: government. Non-Govemment Organisations (NCOs), community and private management, plus various combinations thereof.
The bottom-up approach of community-managed marine reserves is widely considered key to effective reef management in the tropics |5). Local fishermen's knowledge of the surrounding seas can help provide information of possible locarions for the marine reserve and without local community cooperation and participation, reserves may quickly be confronted wi th protest and rejection, resulting in poaching. Community-managed marine reserves are. however, not generally managed by local communities alone but rather as a jo int venture wi th other stakeholders - the local government, an NGO or the private sector in the form of a jo int venture. In such situations, the private sector is meant to bring capital, business and marketing know-how and a client base; the community partner usually brings the location, labour and local knowledge, whi le an NCO or local government may mediate negotiations between the private and community partners.
* Corresponding author. Marine Biology and Ecology Research Centre. Marine Inscituie. University of Plymouth. Drake Orcus. Plymouth. PL4 8AA UK. Tel.: +41 61 3216537.
E-mail address: pairik.svensson@plymouihJcuk (P. Svensson).
Strengthen community capacity, provide basic infrastruCTure and other necessities (6|.
In several circumstances, private enterprises such as hotels and resorts have taken over the day-to-day management of a proterted area and. in some cases, full responsibility for the reserve |7] . In other instances, hotels have been the initiator and subsequent manager of the reserve, termed Hotel Managed Marine Reserve (HMMR). wi th varying degrees of parricipation from the local governments and/or communities. While private parks may be covering a substantial area on land and growing rapidly, they are only recently becoming more popular at sea. Private parks on land, like those at sea. are still widely undocumented and insufficiently researched, but both are believed to have been initiated because of the same reasons. Firstly, the government's inability to satisfy public demand for nature conservation, in quality and quantity alike |8.9i. which has led to inefficiently managed parks "paper parks" and damaged ecosystems. In the Caribbean and Southeast Asia it was found that only 6 and 14%. respeaively, of 285 MPAs reviewed were effecrively managed 110.11]. Some countries have even become indebted, having to rely on international support 112). In a report on a change in governance of protected area systems between 1992 and 2002 in 41 countries. Deardenet al. [12) found increasingly more countries, therefore, relying on a broader range of funding sources; the medium and less developed countries relying significantly more on funds from foreign governments, donations and concessions paid by the private sector(25% compared w i t h 14% of total funding). There is seemingly a trend leading away from solely government-managed protected areas, towards increased participation of stakeholders, w i th the private seaor. local communities and NCOs having a larger influence on proteaed area decision-making 112].
A second reason for the increasing number of private reserves is a growing societal interest in biodiversity conservation |8] , peaking
0964-5691/$ - see front matter © 2008 Elsevier Ud. All rights reserved. doi:10.10I6/j.oceaHman.2008.08.00I

p. Svffisson er oL / Ocean &• Coastal Managemeni 51 (2008) 854-86} 855
wi th the World Summit on Sustainable Development (Johannesburg 2002) and. later, the World Parks Congress (Durban. September 2003). where representatives of protected areas recommended networks of marine reserves covering 20-30% of habitats by 2012.
The rapidly growing ecotourism industry is another reason why the private sector is pushing for HMMRs. where they can establish a market niche. Ecotourism has been praised as one of the most promising approaches to sustainable development and protection of important environmental resources in lesser developed nations [ 13). Wi th ecotourism. it is expected that the impact from tourism on the environment is kept to a bare minimum and that tourism benefits also profit local communities, either by employment or by contributing to community projects |6|.
Today, the vast majority of HMMRs are not recognized as MPAs by The World Conservation Union (lUCN). Chumbe Island Coral Park (CHICOP) is one exception, possibly also representing the first fully functioning MPA inTanzania 19). Several others have, however, been initiated privately, before public protection was established 18). such as: Sugud Islands Marine Conservation Area (SIMCA), which was established as a Category II conservation area under the lUCN Protected Area Management Categoty in 2001. after initially being protected by Lankayan Island Dive Resort [ 14|: the protected zone outside Anse Chastanet Resort. St. Lucia, which was later incorporated into the Soufriere Marine Management Area (SMMA) 115). It was the resort managers' sense of responsibility to their surroundings which was the initial driving force for the effective protection programs. This was compounded by environmental agency and community collaborations to ensure stakeholders' needs were represented.
Several other HMMRs are not officially recognized as MPAs by the lUCN. but nevertheless engage in numerous conservation and education projects. The Alegre Beach Resort. Cebu, Philippines protects a 16 ha marine sanctuary, where they have established a coral reef recovery and disti l lation program aimed at preserving and protecting the reef ecosystem. The program involves regular collection of the coral tissue-feeding Drvpella snails and crown-of-thorns starfish (Acanfhasfer planci). deployment of artificial reefs, reseeding giant clams (Tridacna spp.) and developing mussel farms intended as a source of alternative livelihood for surrounding communities. They also dredge silt from the reef flat to increase coral recruitment and settlement potential, and stabilize the benthos by planting seagrass beds. The projects are overseen and monitored by a marine biologist (Mar Cruz. Alegre aqua sports manager, pers. comm.). The owners of Wakatobi Dive Resort in south-eastern Sulawesi. Indonesia, pay a leasing fee to the affected communities of their 200 ha no-take sanauary and 500 ha buffer zone, where fishing wi th traditional fishing gear is permitted. Representatives of the communities patrol the area and enforce compliance w i th agreed extractive bans. Amongst others, the resort owners sponsor school material, give leaures on conservation issues, provide funding for wastewater management and public projects to 17 affected communities, and employ 135 people locally (Lorenz Maeder. resort owner, pers. comm.).
These hotels have succeeded in establishing effectively protected marine reserves since they have successfully incorporated the local communities into their hotel and conservation projects. Like many dive resorts they also have boats, personnel and other equipment needed to manage local protected areas and the financial backing and incentive to protect their assets |7). but depending on the extent of their conservation projects, a little financial backing from guests in the form of HMMR user fees can go a long way. Tongson and Dygico [16| found that tourists can appreciate user fees as they are a direct means to contribute to conserving the natural resources they w i l l enjoy. Several studies actually suggest that tourists and divers are wi l l ing to pay substantial user fees to
enter MPAs. which can financially supplement or even completely cover conservation costs 116-18). It is suggested that MPAs only start to become successfully managed when funding is secured through self-financing 119]. The constant supply of funding from user fees could, therefore, be a solution to financing and thereby effectively managing protected areas 120).
Projects, which may require financial assistance, include monitoring coral reefs, mangroves or other marine life, including sharks, dolphins or turtles, and maintaining turtle hatcheries. Projects may also involve creating artificial reefs out of concrete domes or using mineral accreting technology owned by Biorock^^ to transplant coral. Other HMMRs have developed education or awareness programs for tourists, staff and local communities.
In addition to project costs, associated resources and salary costs. HMMRs generally also need to pay for the area covered by the marine reserve. This can take the form of a lease or tax to be paid to the local government |7|. In some instances a portion of user fees are delivered to local communities to build schools, hospitals or to improve infrastructure, or given to fishermen to compensate for any fishing grounds lost |8]. The costs accrued to manage HMMRs w i l l ulrimately dependent on the conservation projects they are involved in. their management set-up. location and size.
A willingness to pay (WTP) survey was conducted at an HMMR in Vietnam in order to gauge tourists' knowledge and interest in marine conservation, the importance of various factors in choosing and locating hotels, their opinion of HMMRs. and whether tourists would be wi l l ing to pay a user fee to suppon HMMRs. The consumer surplus was also calculated w i th the intent of establishing the elasticity of demand for HMMRs. resulting in the optimal user fee.
2. Study area
The tourist surveys were conducted wi th the hotel guests of an HMMR bi-annually over a six-week period in March/April and September/October, starting Autumn 2005. ending Spring 2007. The HMMR, Whale Island Resort (WIR), is situated on Hon Ong. a small island (approx. 100 ha), located on the south-central coast of Vietnam. 80 km north of Nha Trang. in Van Phong Bay (Fig. 1). The resort was established in 1997 wi th only a few bungalows. Today. WIR owns 32 bungalows accommodating maximum 70 guests. The average length of stay is three nights and average yeariy occupancy is approximately 60%.
The hotel owners became concerned when they noticed the continued decline in fish and coral populations believed to be caused by over-fishing and destructive fishing techniques, such as hose and hook fishing, blast fishing and cyanide fishing. This was compounded by pollution and rubbish dumping from the nearby village of Dam Mon and other smaller villages wi th in the bay They therefore, decided to enclose the bay around the resort wi th buoys in 2001 (Whale Island Bay. WIS), establishing a no-fishing zone and a de facto 11 ha marine reserve. In August 2005. a second bay was enclosed on the other side of the peninsula (Whale Island Bay Peninsula. WIBP), creating a 5 ha marine reserve (Fig. 1). Local communities were actively consulted before the areas were enclosed. Legal permission to close off these areas was attained from the local authorities of Khanh Hoa Province in the form of a 10-year lease, and initialization was supervised by the local coastguard.
The resort is eco-friendly albeit not certified: it generates low amounts of pollution from the ferry shuttling guests and supplies to the mainland, plus the activities of the daily dive boat. The effluent is collected in a septic tank, filtered, and later used as irrigation water: pamphlets are provided in the bungalows urging guests to be mindful of the environment and to avoid any trampling or damaging of the corals: inorganic wastes are collected from the beach and burned in a specially constructed high-heat furnace. The

p. Svensson et aL / Orwin &• Coastal Managemeni 51 (2008) 854-86 J
South Chtna Sea
Van PtKTtg Bay
Nha Trang
25km
Fig. 1. Illustration of Whale Island (Hon Ong) showing the Resort, the 11 ha Whale Island Bay (WIB) and the 5 ha Whale Island Bay Peninsula (WIBP) reserves in Van Phong Bay Khanh Hoa Province. Vietnam.
hotel has hired security officers who also acts as a reserve wardens, ensuring that no fishing is conducted wi th in the reserves. Furthermore, specific hiking trails have been hewn into the landscape to restrict damage: several clusters of artificial reefs have been constructed out of ceramic pots and concrete domes to serve as substrate for their coral transplantation project, while creatmg habitat complexity for fish, increasing fish assemblages. Fish Aggregating Devices (FADs) have also been constructed, made from cut-up strips of netting, bound together, fastened to buoys and anchored to the sea floor at 9 m depth, attracting schools of fish, including large schools of Snapper (Lutjanidae). Jacks (Carangidae) and Barracuda (Sphyraenidae). It is unclear whether the marine reserve produces spillover of fish to help replenish adjacent fished areas, but the density, size and diversity of fish are significant compared wi th unprotected areas |21 | .
Apart from the managers and owner, the 40-50 staff are all from local villages and are paid above average salaries. The hotel purchases the majority of their food and beverages from local fishermen and other local vendors and the resort owner has built a school and temple. The lease paid to the local government is supposed to help provide for community needs but to what extent It helps individual fishermen more affected by the loss of a part of their fishing ground is unclear. Several fishermen do not have enough money to purchase larger boats to fish outside Van Phong Bay and must, therefore, rely on fishing in smaller bays closer at hand. Some of these families have expressed some displeasure wi th the reserve, whi le other fishermen, family members of staff, and vendors, benefit from the reserve and approve of their conservation efforts (unpublished survey data collected by PS). While the reserves are proteaed by a contract between WIR and the local government ensuring wider compliance to the no-fishing ban. a method for compensation or integration of affected families should perhaps be considered. An amicable relationship wi th local community members wi th agreed goals is important to effectively manage a marine reserve, especially if the HMMRs are owned by foreign investors.
3. Tourists* wil l ingness to pay
A total of 211 questionnaires were completed by tourists during the four, six-week research visits between Autumn 2005 and
Spring 2007. These qualitative and quantitative, open and close-ended questionnaires were placed on the reception desk, so the hotel guests could complete them at wi l l , but usually they were completed during check-out. Although these questionnaires draw on a convenience sample restricted to the sample group of the hotel guests, we feel that whi le a survey conducted wi th random tourists at several locations would ultimately increase population representation, the great range in age. income, environmental knowledge and level of education at the hotel, nevertheless makes this survey representative for travelling tourists.
In this anonymous questionnaire, guests were asked to complete a demographic and personal questions section: a set of behavioural choice questions relating to the methods and reasons for choosing hotels: questions related to their environmental awareness and interests: their opinion of the biophysical state of the HMMR compared to unprotected areas: their thoughts on hotels or resorts acting as caretakers and mangers of marine reserves and how this should be advertised: and lastly, i f they would be wi l l ing to pay extra for HMMRs. and if so. how much.
For the final WTP questions, a hypothetical scenario was laid out. The respondents were requested to decide i f they would be wi l l ing to pay more to stay at a hotel which is managing a marine reserve, compared to an adjacent hotel, which is not. all else being equal. The follow-up question asked them to specify how much more they would be wi l l ing to pay per night in either US$ or as percent of the room rate. The additional choice to provide a WTP amount as percent of the room rate was added to the fixed USS option because during the initial interview-based pilot surveys, the majority of tourists requested this possibility on their own accord. To convert the percentage value into monetary terms, the room rate of WIR was used as a model. The average length of stay of three nights was determined as the actual room rate (USS96) since the room rate decreases wi th the number of nights stayed. All percentage responses could thereby be converted to USS and the median and average WTP calculated for the sample population. An open-ended WTP contingent valuation question, where respondents specify the amount themselves, was chosen over a dichoto-mous choice question because this is the first survey of its kind and we did not wish to assume on the distribution of WTP and encourage biased responses by providing pre-defined ranges (22). Open-ended questionnaires are also understood to give a lower

p. SMPmson et aL / Ocean 6r Coastal Management 5J (2008) 854-861
WTP |23|. This was preferred, since it is suggested that when people are faced w i th hypHDthetical scenarios involving payment, they are often over-generous |24). Whi le they may hypotherically agree to pay a certain amount, they would commonly only agree to half in reality 125).
In order to determine statistical significance between variables and WTP amounts, we employed the non-parametric tests. Mann-Whitney U and Kruskal-Wallis H. to test the null-hypothesis that the two or more samples were drawn from a single population. We used the Chi-square cross-tabulations test to reveal significance between reasons provided for WTP. Tests excluded tourists who did not wish to comment on their WTP and ignored the final question. One additional sample was removed from the populations because the WTP was deemed far too high to be considered serious (200% of room rate per night).
We calculated the consumer surplus based on the amount guests were wi l l ing to pay and calculated the total revenue the resort could make, depending on various user fees the resort could implement per room for nights stayed.
4. Results
The European community prevailed in this study, the more numerous being the British. Dutch and then French. While the majority of the visitors resided in their home countries, one-tenth of the visitors had taken up Vietnamese residency (included in Other', which also includes the rest of Asia. South and Central America - Table 1). University educated visitors dominated and 69% of the population were between 26-45 years old. A larger percentage of the sample comprised women and the income level was split throughout the spectrum.
There were no significant relationships between these variables and WTP Although there was a trend in certain categories for higher WTP. such as visitors aged 36-45 and those wi th PhD level education (Kruskal-Wallis p 0.273. d f 4: p 0.168. df - 3). the amount visitors were wi l l ing to pay varied widely, resulting in high variance (Table 1).
In the next section, tourists were confronted wi th behavioural choice questions: top three methods they use to locate hotels: how they located WIR: the importance of various factors for choosing hotels and the top three reasons for choosing WIR.
The method most commonly used to find tourist's choice of hotel was the internet (31.76%). followed by word of mouth (23.05%) and travel guides (22.87%). This was also the order demonstrated by guests choosing WIR (29.33%. 28.37%. and 20.67%). The method least chosen for locating hotels was environmental hotel award sites (0.73%). which is not so surprising since only 10.9% of the r>opulation said they knew where to look for environmentally friendly hotels (Table 2) and of these, approximately half the tourists' responses were vague, wr i t ing only internet'.
On a Likert scale from one to five, tourists were asked to rate certain hotel attributes in order of importance. Location was the most important attribute when choosing a hotel, followed by price, facilities, service and lastly, environmental awards (Fig. 2). The importance of location' also became apparent when asked why they chose WIR, the top two reasons being, away from mass tourism' and island setting' followed by facilities: SCUBA diving and snorkeling. Eco-friendliness came in forth place ahead of service and safety (Fig. 2).
In the following section dedicated to tourists' environmental awareness, interests and knowledge, a larger percentage already knew that WIR was an eco-friendly resort before arriving on the island, whi le the majority of visitors also knew what MPAs are and would like to have access to hotels' environmental policies before staying at a hotel (Table 2X The latter two were the only significant indicators of WTP found from this survey. While having access to hotels'
Breakdown of tourists' demographic and personal data and their WTP (US$) extra to stay at an HMMR with Standard Errors (SE)
Visitors {%) WTP{$)
Nationahty European Oceanian North American
Other
Country of residence Europe Oceania North America Other
Gender Female Male
Age <26 26 -35 36-45 4 6 - 5 5 >55
Education Secondary school College University PhD
Cross income/year ($) No income < 15.000 15.000-30.000 30.000-45.000 45.000-60.000 60.000-75.000 75.000-90.000 >90.000
69.46 1675 8.87 4.93
62.07 \527 6.40
16.26
56.31 43.69
10.10 44J23 25.00 10.10 10.58
9.52 21.43 6238
6.67
5.05 4.04
15.66 18.18 20.71 14.65 9.60
12.12
12.55 14.88 11.37 15.49
12.58 15.66 11.60 1253
12.46 13 44
9 3 0 11.73 16.63 12.40 1214
13.47 14.76 11.63 17J0
11J3 10.71 14.01 15.31 13.78 11.84 9.76
12.42
1.01 3.97 2.43 2.63
1.11 4.23 3.36 1.26
1.08 1.68
t.74 \22 2.73 2.44 1.51
2.63 332 0.89 232
2.77 1.95 3.33 2 3 4 2.68 1.71 1.47 1.80
The sample comprises the available data from 211 surveyed guests minus 24 unusable samples. The WTP is the average, converted from % room rate where necessary, based on US$96/room/night.
Breakdown of tourists' environmental awareness and knowledge and their WTP (USS) extra to stay at an HMMR with Standard Errors (SE)
Visitors {%) WTP(S)
Know what MPA are? Yes* 78.10 No 2\30
Know how to find eco-friendly hotels? Yes 10S5
Would like to see hotel s environmenul policy? Y e s " 7619 No 23.81
Know WIR is eco-friendly? Yes 58.57 No 4143
Support HMMR7 Yes
Willing to pay? Yes No
9751 2.49
86.27 13.73
13.69 9A9
10.77 13.09
13J5 11.27
1341 12.47
14.31 4 J 2
13.81 0
1.15 1.41
136 1.40
1.02 2 3 4
1.41 1.29
141 2.58
1.34
The sample comprises the available data from 211 surveyed guests minus 24 unusable samples. The WTP is the average, converted from % room rate where necessary, based on US$96/room/night, non-parametric Mann-Whitney U test •p < 0.05. Chi-square test: and "p < 0.001.

p. Svensson et al / Ocean (f Coastal Managemem SJ {2008] 854-861
a
16.2
12 3 3.0 2 8
30 4
Location
Price
Faalit ies
Service
Environmental Awards
21 3
32 5
18 1
30 5
• No M a s s Tourism
• Island Setting
• SCUBA/Snofkel ing
• E c o Friendly B Inexpensive
• Service • Safety
Fig. 2. The importance of various attributes to guests when choosing hotels (a] and choosing Whale Island Resort (b) expressed in % of the sample population.
environmental policies when agreeing to pay to stay al an HMMR was highly significant (Chi-square 11.0: p < 0.001). whether the respondent knew what an MPA was. affected significantly the WTP amount to stay al an HMMR (Mann-Whitney U 2391.0; p 0.047).
Guests were thereupon asked to compare the general state of the manne environment, the fish diversity, number of fish, number of invertebrates, size off ish and coral cover within the reserve, wi th outside fished areas. Only 40.95% of the guests had also dived or snorkelled outside the enclosed bay. either on a dive or snorkelling trip, or if they had rented a canoe or hobby-cat and snorkelled at other areas around the Island.
The authors graded tourists" responses, giving' 1' if the tourists thought the conditions were poorer in the reserve. 0' for the same and - r for better conditions. All variables apart from coral cover (-0.16) averaged positively for the reserve. General state of the environment (^0.48) attained the highest rating, followed by fish diversity (>0.46). number of fish ( -0.39). size of fish (^0.28) and number of invertebrates (-0.19).
In the succeeding questions, tourists were asked if they support the idea of hotels acting as caretakers and managers of proteaed areas: 97.51% did support HMMRs. Of the rest, nine did not have an opinion, five didn't support the concept, one of which expressing concern that the hotel would misuse the idea and profit from it: another was concerned about private ownership of public space becoming exclusionary. The remainder reserved comment since they did not have enough details.
On a follow-up. open-ended question, the majority (96.32%) reasoned HMMRs would better serve the environment. 13.50% thought private management would be better than government management. 12.88% and 12.27% thought it would benefit tourists and businesses, while others thought it would build environmental awareness (4.91%) and support fishermen (3.07%). Some were more reserved in their opinions, agreeing wi th HMMRs only if they were supervised and connected to an environmental agency (12.88%). or had an agreement w i th local communities (3.68%). whi le yet others considered it hotels' obligation to help protect the environment through active protection (9.82%). The remaining tourists thought the more HMMRs the bener (3.68%) or that HMMRs were especially important in poor countries (3.68%).
Most guests agreed that HMMR information should best be available to them over the internet and on hotels' homepages (92.22%). A smaller contingent (17.22%) suggested that all hotels protecting marine reserves should have a website of their own. where you could browse per country for example, or that they were linked to either country environmental agency websites or diving company websites. Another faction (15%) had the same suggestions but would like the HMMRs to be incorporated into some kind of environmental standard or award system, overseen by an environmental agency. Other suggestions included brochures at the hotel (15.56%). travel guides such as Lonely Planet (9.44%). or equivalent for HMMRs (3.33%). on the country's tourism board
website (6.67%). magazines (3.33%). travel agencies (4.44%) or TV advertising (2.78%).
In the final WTP question, most tourists agreed they would be wi l l ing to pay more per night to stay at the HMMR (86.27%). the average being US$12.86 extra per room and night stayed, and the median: US$9.6. Of the 159 tourists wi l l ing to pay at least something. 84.28% decided to give a percent figure of the room rate. The difference between the averages given in percent (US$14.31) and in dollars (US$19.46) was significant (Two-Sample Kolmogorov-SmirnovZ 1.403; p 0.039).
The revenue and consumer surplus resulting from a user fee system has been calculated based on the WTP results from all tourists, wi l l ing to pay or not alike, except those who did not complete the WTP questions (11%). The results show that 85% of visitors were wi l l ing to pay at least 1% of the room rate, equivalent to US$0.96/room/night. Extrapolating this 85% to the number of rooms wi l l ing to pay per annum (9931). the hotel would make US$9534/year (Fig. 3). If all guests were to pay 1% per room per night, given an average yeariy occupancy rate of 60% (7008 rooms) the resort would make US$6728 F>er year. If yeariy occupancy increased to 70% due to HMMR marketing, the total revenue would equal US$7849. Similarly. 83.4% were wi l l ing to pay 5% of the room rate (US$4.8) and 70.1% were wi l l ing to pay 10% (US$9.6). which would amount to US$33,638 and US$67,277 per year, respectively, at 60% occupancy, to be bestowed to the management of the marine reserve, if all rooms occupied by tourists paid.
The WTP and total revenue drops dramatically beyond 10%. Only 37.4% were wi l l ing to pay 15% (US$14.4) and 26.7% were wil l ing to pay 20% (US$19.2) of the room rate. Therefore, at 10% of the room rate and below, the demand for the HMMR is relatively inelastic and beyond 10%. the demand becomes relatively elastic and the revenue starts to decrease (Fig. 3). The consumer surplus, defined as the difference between what people are wi l l ing to pay for a good or service and what they actually pay. has been calculated based on tourists' total WTP. The total consumer surplus tourists are wi l l ing to pay beyond the normal room rate to enhance their snorkeling/ diving experience and to contribute to coastal conservation has been estimated to US$162,437. based on WIR s room rate.
5. Discussion
Interestingly, the most common faaors influencing WTP for other protected areas; age. education level and income |26|. were insignificant when it came to WTP for an HMMR or deciding the amount, although there was some inclination towards higher WTP for tourists educated to PhD level, and those aged 26-35. The only significant variables affecting WTP were connected to a F>erson's environmental knowledge and interest. While wishing to have access to hotels' environmental policies before staying at a hotel triggered tourists' WTP. knowing what MPAs are influenced the amount. Similar result were elicited by Dharmaratne et al. |27).

P Svrnsson « aL / Ocean Sr Coastal Managemeni 51 (2008) 854-861 859
u - 312 1187 3123 3310 4372 6122 8182 8869 9744 9606 9931
WTP($ ) 46 24 192 16 8 1 4 4 12 9 6 7 4 8 2 0 9 6
WTP(%) 2 7 10 2 267 2 8 3 37 4 43 9 701 759 834 8 4 0 85 0
Revenue ($) 14990 28 482 59-961 55614 62-960 61-461 78-550 62D85 46*770 19-612 9534
T Rev ( $ ) @ 6 0 % O c c 336 384 168192 134'554 117T34 100^15 84-096 67-277 49X)56 33-638 14'016 6728
T Rev ( $ ) @ 7 0 % O c c 39244a 196-224 156-979 137-357 117*734 98-112 78-490 5r232 39245 16-352 7&4Q
Number of guest rooms
Fig. 3. The percentage of guest rtjoms willing to pay (USS) extra to stay at an HMMR. resulting in revenue per year (US$) at 100% occupancy: and tocal revenue per year (US$) based on 60 & 70% occupancy if all tourists paid the specified WTP announts: and showing the niedian WTP (USS9.6/room/nighi).
who found that people wi l l ing to become members and/or were already members of an NGO. established to manage Montego Bay Marine Park and Barbados National Park, were wil l ing to pay more than non-members and those who showed no interest.
The average and median amounts tourists were wi l l ing to pay (US$12.86 & US$9.6) to stay at an HMMR were higher than the average and median amounts charged to divers to enter MPAs in Southeast Asia (both US$5) |17| but also lower than some WTP surveys. Divers were wi l l ing to pay on average US$27.4 to dive at the Bonaire Marine Park [281 and US$41 to dive at the Tubbataha Reefs Natural Marine Park I16|. Most commonly. MPA access is levied to individual divers, rather than dive operators, and although user fees may be charged either per dive, per day. per boat or per entry to the park, the timescale is usually per day 117). The user fee system proposed for HMMRs is similar in terms of access to the HMMR per day. but it would not be per diver, but rather, per room, which is more likely to accommodate at least two people, and since guests are paying per night, it may potentially include an extra day. depending on arrival and departure times. Based on a median WTP of US$9.6. each tourist would then more likely be paying fees equivalent to US$4.8 per day. comparable to the average and median registered in Southeast Asia (US$5) 117].
Interestingly. 84% of respondents preferred to give a WTP value represented as percent of the room rate. The average room rate at WIR for an average length of stay of three nights amounted to US$96 ( 2006 rate), including meals and transportation, which could be considered on the lower end of beach resort accommodations, unless you are back-packing. The median, equivalent to 10% of the room rate per room (US$9.6) or quasi equivalent to US$4.8 per person per night could, therefore, be considered conservative, although you do have to consider that guests possibly kept WIR's room rates in mind when considering their WTP. The amount guests were wi l l ing to pay in dollars was. however, significantly higher than those who gave a WTP in percent, possibly indicating a higher believed room rate. This is likely to be influenced, however, by responses of an Australian woman and
Englishman wi th average incomes (US$<45.000 & US$- 60.000). who gave an exceptionally high WTP (US$75 8i US$100). They were either very generous, or had misunderstood the question, possibly thinking it was for the length of their stay. When guests were asked why they preferred to give a WTP amount as percent of room rate, rather than a fixed dollar amount, many tourists reasoned that larger, more expensive resorts would require higher managing costs, but would ultimately also be capable of protecting a larger and better' reserve, compared w i th reserves managed by small, mexpensive resorts and the user fee should be weighted accordingly.
When tourists are actually faced w i th paying a user fee. they may no longer be wi l l ing to pay as much as when faced wi th the theoretical question of WTP. This over-estimated generous opinion of oneself has been calculated to approximately double the actual WTP |24|. There may. however, be a means to minimize this discrepancy. Research suggests that the longer tourists spend on recreational aaivit ies by the reef, the more wi l l ing they are to pay for improvements in reef quality, especially if their visit and diving/ snorkeling experience meets or exceeds their expectations 118.26.29).
The average guest stays three nights at WIR. which is three to four days guests can use and benefit from the reserve. At other resorts the average length of stay may wel l be one week or longer, especially at dive resorts. When asked, over 90% of guests would choose to return to the resort, which suggests that their stay has met. or exceeded their expectations. Furthermore, when asked how they would compare the marine environment inside the reserve to areas they had seen when diving/snorkeling outside the reserve, except for coral cover, the responses were in favor of the marine reserve for general state of the environment, fish diversity, size and number of invertebrates. These questions have their limitations, however, because tourists are not marine biologists using unbiased monitoring methods, but rather base their answers on subjective opinions. Nevertheless, the overall tourist impression was that the hotel was effectively protecting the marine environment and

860 P. Svensson et of. / Ocean &Coasta/ Monagemenf 5/ (2008) 8S4-861
increasing diversity and biomass. which obviously also increases guests' satisfaction and makes them more wil l ing to pay for HMMRs.
The fact that tourists could utilize the reserve for several (jays and seemed satisfied wi th both the resort and the effectiveness of the reserve probably influenced the extremely high support tourists gave HMMRs (97.5%). This, however just demonstrates that if HMMRs are managed effectively, and results are visible, at least tourists are in favor of HMMRs and are wil l ing to pay for privately managed conservation efforts. A number of tourists (13.5%) even suggested that private management would be better or more effective than government management of marine reserves, especially in developing countries, where funding is scarce. While the vast majority stated that HMMRs would better serve the environment, several also concluded that it would be in the best interest for tourists and for the hotel alike. The majority did not object to the possibility that the hotel could profit from marketing the HMMR and increasing occupancy, as well as protecting the environment, as long as local communities weren't disturbed, but some expressed the desire for proof, i.e. when marketing the HMMR. the marine ecosystem should then also be in a "guaranteed" better condition than unprotected areas through some kind of "official stamp". It was proposed that a suitable environmental agency verify and certify that the reson is in fact dedicated to ecotourism and marine conservation and results are favorable.
Tourists concluded that HMMRs could help build awareness for protecting coral reef ecosystems on a local and international level. Since the majority of tourists choose their hotels over the internet, most recommended that HMMRs be advertised at an easily find-able website either on a country's tourism site, at a website of their own, listing all HMMRs per country, or be incorporated in an existing environmental agency website confirming hotels' advertising. Word of mouth was the second highest choice for choosing hotels, so the more HMMRs there are providing information through brochures and/or lectures on the need for protection and the hotel's conservation effons, the more environmental awareness wi l l spread. This would be jointly beneficial to HMMRs. enabling them to maintain a suitable WTP and to increase occupancy and prestige, delivering them into a market niche. The third most important resource for choosing hotels was travel guides. In the Lonely Planet guide, there is a caption mentioning WIR and how, through their environmental protection efforts, including transplantation of coral, they have successfully increased the number of marine species 130]. Tourists suggested trying to incorporate all HMMRs into travel guides or even create a travel guide solely for HMMRs and eco-friendly hotels, which would certainly contribute to awareness building. This brief mention in the Lonely Planet, together with word of mouth are the main reasons why the majority of tourists already knew that WIR was an eco-friendly reson. since the resort does not advertise over the internet.
Unfortunately, choosing hotels according to environmental certification or environmental award schemes was the last choice when choosing hotels, which is not surprising since the majority of tourists do not know where to look for eco-friendly hotels (89%), despite 76% wishing to see hotels' environmental policies, including awards and cenificalions. before booking a room. There are over 70 sustainable tourism certification programs in the world (311, either currently active or in development, which legitimize eco-friendly hotels and grant awards after scrutinized inspections. Green Globe probably being the most recognized on a global level. These and other specialized websites such as www. responsibletravel.com, or more country specific: www.tur ismo-sostenible.co.cr. are places where tourists can find awarded or environmentally conscious accommodations, but obviously they are not well enough advertised, or tourists are not as interested as they indicate.
Despite the current involvement of environmental award systems, the majority of tourists do not know how to locate eco-friendly hotels, causing both the environment and potential eco-friendly travelers to be neglected. It may be possible to increase tourists' awareness and interest in HMMR conservation practices if managed effectively and certified globally through a central accrediting body. Such a central body for accrediting HMMRs is currently not available, however, possibly due to the complexity of management of community, NGO and government involvement, property rights of the oceans, and the concern about private ownership of public space becoming exclusionary, but also because of the relative novelty of such endeavors. While beachfront resorts are dependent on the 'bottom line', they may not be able to profit in the long term because of the growing need and environmental concerns of a growing ecotourism clientele. Notwithstanding, if standards and controls are adopted, there wi l l inevitably be a period when some hotels wi l l try to proliferate on the merits of others, but wi l l hopefully fail pending tourists" scrutinized judgment and subsequent word of mouth advertising.
The consumer surplus represenring the total amount tourists were wi l l ing to pay on top of the normal room rate to stay at an HMMR equaled USS162.437. based on WlR's average room rate (USS96). which would be equivalent to USS23.18 per room per night at 60% occupancy. This amount, as well as the average WTP (USS12.86), may be considered too high: a better representation is the median USS9.6 (10% of the room rate), which 70% of tourists were wi l l ing to pay and which also amounted to the highest revenue (USS78.550) for wi l l ing-to-pay tourists (Fig. 3), demonstrating inelasticity of demand for HMMRs up to 10% of the room rate. If all guests were to pay 10% of the room rate, per room per night stayed, total revenues per annum would equal USS67,277 based on 60% occupancy. This figure is. however, only an estimate of WTP in monetary terms, since it is an example from WlR's room rate. For a 50-room hotel costing USS200 per night wi th 75% occupancy, total revenues based on 10% of the room rate would amount to USS273.750. a substantially higher potential fund for the MPA; even 5% would still generate USS136.875 per annum. Therefore, total revenues are dependent on the room rate, number of rooms, yearly occupancy and the user fee percentage.
A user fee of only 1% per room and night (generating USS6728/ year) would neariy suffice to cover the conservation costs at WIR. covering leasing costs (the marine portion equaling approximately USS4000). moorings, maintenance and repairs (USS300). management and salaries (USS3800). The running costs of the WIR area-equivalent 15 ha marine sanctuary on Gilutongan Island. Philippines, however, requires a yearly budget of USS21.000. to pay for surveys and maintenance, community organizing, education and training, law enforcement (small patrol boat), information dissemination and salaries (321. Therefore, a very achievable, and acceptable, fee of 5% to suppon WlR's HMMR would generate considerable extra income for such future investment in the MPA.
6. Conclusion
Based on the results and reasoning from this survey, several recommendations can be made which could potentially increase a hotel's chances of biological and social success, while staying economically secure.
After establishing that a hotel can lease an area of the coastline, the local communities and government should be consulted and an appropriate size and location for the reserve negotiated. The size of the reserve should be large enough to maximize biological potential, small enough to allow spillover and to be economically feasible and not so large that the loss of fishing grounds puts an unmanageable strain on local communities. Next, the hotel, local communities and government should align their reserve objectives

Aumor s personal copy
p. Svensson et aL / Ocean & Coastal Management 51 (2008) 854-861 861
wi th an environmental agency to avoid differing interests and try to validate the MPA internationally and a user fee amount should be calculated based on stakeholders' fixed expenses. Here it is important that the needs of all stakeholders are considered and that the hotel makes every attempt to integrate themselves and help the local communities wherever possible, especially when the hotel owners are foreigners.
Tourists seem to prefer a user fee in the form of a percent of the room rate, w i t h 10% per room per night representing both the optimal and maximum amount, considering revenue versus WTP. Only the absolute necessary amount should, however, be demanded and the hotel and environmental agency should provide dear information how guests' money is invested.
The hotels should advertise their HMMR and associated projects on their homepage and w i th a local environmental agency, since no central body certifying HMMRs thus far exists, providing more clarity in operations and. i f possible, over the country's official tourism website and/or through dive companies. Additional advertising wi th travel guides, as wel l as information dissemination through seminars and brochures available at the hotel, explaining projects and monitored successes should be available to raise awareness and interest
Oprimal locarion of the hotel is important, since this is the first thing tourists consider when choosing their desrination. From a biological and socio-economic point of view, the farther away the hotel is from inhabited land, the better [331. unless transportation costs and resulting pol lut ion negate the positive benefits. Location is. however, only the first step. To assure guests' user fees are maintained, their stay must meet or surpass their expectarions w i t h visible improvements in HMMR biota compared wi th unpro-teaed areas. This latter achievement may be difficult in the first few years, even w i t h effective management; tangible projects may be an option, such as building artificial reefs to attrart fish and attempting coral transplantations.
In some cases hotels have initiated marine protection, only to be incorporated into government proteaed areas in the future (S|. including the areas proteaed by Lankayan Island Dive Resort and Anse Chastanet. which later developed into Sugud Islands Marine Conservation Area (SIMCA) and Soufriere Marine Management Area (SMMA) |151. The period during which the hotels were pro-tert ing these areas could be seen as money saved by the government for an area which actually needed proteaing [8).
HMMRs are quite recent developments and. therefore, still quite scarce, so further research into the effectiveness of HMMRs from a biological and socioeconomic perspective is still necessary, but this survey certainly proves interest and commitment to HMMRs from a large subset of tourists and thus the great potential of HMMRs as an economically sustainable conservation tool.
References
111 Halpem BS. The impact of marine reserves: do reserves work and does reserve size matter? Ecol Appl 2003 : I3 ( l ) :Sn7 -37 .
12) Sale PF. Cowen RK. Danilowicz BS. Jones C P Kritzer JP. Undeman K C et al. Critical science gaps impede use of no-take fisheiy reserves. Trends Ecol Evol 2005:20{2):74-80.
|3I McCIanahan TR. Mangi S. Spillover of exploitable fishes from a marine park and its ef fea on the adjacent fishery. Ecol Appl 2000:10(6): 1792-805.
| 4 | Samoilys MA. Martin-Smith KM. Giles BC. Cabrera B. Anticamara JA. Brunio EO. et aL Effectiveness of five small Philippines" coral reef reserves for fish populations depends on site-specific factors, particularly enforcement history. Biol Conserv 2a07:135[4):584-601.
15| White AT. Vogt HP Philippine coral reefs under threat: lessons learned after 25 years of community-based reef conservation. Mar Pollut Bull 2000:40(6): 537-50.
|6 ] Kiss A. Is community-based ecotourism a good use of biodiversity conservation funds? Trends Ecol Evol 2004:19(5):232-7.
i 7 | Colweli S. Entrepreneurial MPAs: dive resorts as managers of coral reef marine protected areas. InterCoasi Newsletter 1999.
18} Langholz JA. Ussoie JP. Perils and promise of privately owned protected areas. Bioscience 2001:5I(12);1079-85.
(91 Riedmiller S. Private seaor management of marine protected areas: the Chumbe Island case. In: Cesar HSJ. editor. Collected essays on the economics of coral reefs. Kalmar. Sweden: CORDIO. Department of Biology and Environmental Sciences. Kalmar University; 1999.
|10 | Burke U Maidens J. Reefs at risk in the Caribbean. Washington D.C. (USA): Worid Resources Institute; 2004.
1111 Burke L Selig E. Spalding M. Reefs at risk in southeast Asia. Washington D.C. (USA): Worid Resources InsUlute; 2002.
1121 Dearden P. Bennen M.Johnston J. Trends in global protected area governance. 1992-2002. Environ Manage 200S;36(1):89-100.
(131 Cossling S. Ecotourism: a means to safeguard biodiversity and ecosystem funaions? Ecol Econ 1999;29(2):303-20.
[ I 4 | Teh i r u Teh LSU Chung F C A private management approach to coral reef conservation in Sabah. Malaysia. Biodivers Conserv 2007.
115} Roberts CM. Hawkins JP. How small can a marine reserve be and still be effective? Coral Reefs 1997:16(3):150.
116] Tongson E. Dygico M. User fee system for marine ecotourism: the Tubbataha reef experience. Coast Manage 2004;32{I ) : I7-23.
1171 Depondt F. Green E Diving user fees and the financial sustainability of marine protected areas: opportunities and impediments. Ocean Coast Manage 2006:49(3^) : l88-202 .
[ 18] Ahmed M. Umali CM. Chong CK, Rull MF. Garcia MC. Valuing recreational and conservation benefits of coral reefs - the case of Bolinao. Philippines. Ocean Coast Manage 2007:50(1-2): 103-18.
119] Davis D. Tisdell C. Economic management of recreational scuba diving and the environmenLj Environ Manage 1996;48(3):229-48.
120] Arin T. Kramer RA. Divers' willingness to pay to visit marine sanauaries: an exploratory study. Ocean Coast Manage 2002;45(2-3):171-83.
[21] Svensson P. Rodwell ID. Attrill MJ. Privately managed marine reserves as a mechanism for the conservation of coral reef ecosystems: a case study from Vietnam. Ambio: In Review.
|22] O'Conor RM.Johannesson M.Johansson PO. Stated preferences, real behaviour and anchoring: some empirical evidence. Environ Resour Econ 1999;13(2): 235-48.
[23 | Baieman IJ. Ungford IH. Turner RK. Willis KG. Carrod CD. Elicitation and truncation effects in contingent valuation studies. Ecol Econ 1995;12(2): 161-79.
124] White PCL, Bennett A C Hayes EJV. Tlie use of willingness-to-pay approaches in mammal conservation. Mammal Rev 2001;31(2):151-67.
125] Loomis J . Brown T. Lucero B. Peterson C . Improving validity experiments of contingent valuation methods; results of efforts to reduce the disparity of hypothetical and actual willingness to pay. Land Econ 199e:72(4):450-61.
(26) Lindberg K. Policies for maximizing nature tourism's ecological and economic benefits. New York (USA): WoT\ii Resources Institute; 1991. 37 pp.
[27| Dharmaratne CS, Sang FY. Walling LJ. Tourism potentials for financing protected areas. Ann Tourism Res 2000:27(3):590-610.
)28] Scura LF. van"t Hof T The ecology and economics of Bonaire Marine Park. The Worid Bank Environment Department Divisional Paper 1993:44:1-48.
(29) Ross S. Wall C. Evaluating ecotourism: the case of North Sulawesi. Indonesia. Tourism Manage 1999;20(6):673-82.
(30] Rorence M. Jealous V. Lonely planet Vietnam. 7th ed. Footscray. Australia: Lonely Planet Publications Pty. Ud.; 2004. p. 369.
(311 Sustainable tourism. New York. Available at; <www.rainforest-alliance.org> [accessed 10. Jan 2008].
132] White AT Ross M. Hores M. Benefits and costs of coral reefs and wetland management. Olango Island. Philippines. In: Cesar H. editor. Collected essays on the economics of coral reefs. Kalmar. Sweden: CORDIO. Kalmar University: 2000.
[331 Balmford A, Cravestock P. Hockley N, McCean CJ. Roberts CM. The worldwide costs of marine proteaed areas. P Natl Acad Sci USA 20O4:101(26):9694-7.

Report Patrlk Svensson, Lynda D. Rodwell and Martin J . Attrill
Privately Managed Marine Reserves as a Mechanism for the Conservation of Coral Reef Ecosystems: A Case Study from Vietnam Coral reef ecosystems have been declining at an alarming rate during recent decades, despite increasing numbers of marine protected areas (MPAs) encompassing coral reefs. However, many MPAs have not met reserve objectives, inhibiting effective protection. This study focuses on the potential effectiveness of a Hotel Managed Marine Reserve (HMMR) at enhancing reef fish stocks. Biannual visual fish census surveys were conducted at two manne reserves adjacent to Whale Island Resort, Vietnam, October 2005 to Apnl 2007. The 6-year protected Whale Island Bay Reserve (11 ha) showed significantly higher fish densities, richness, average size, and number of fish -15 cm compared with two unprotected control sites. Fish stocks at a second newer reserve. Whale Island Bay Peninsula (5 ha), quickly increased after protection. This study has demonstrated the effectiveness of HMMRs. suggesting a global network of such pnvately managed reserves could play a part in the conservation of the world's coastal resources, while alleviating financial pressure on governments.
INTRODUCTION Coral reef ecosystems arc fundamental l o the sustainable development o f many tropical coastal countries, prov id ing food, minerals, and income to local fisheries while also of fer ing natural protection against wave erosion ( I ) . These ecosystems arc. however, highly threatened today, despite a growing number of marine protected areas (MPAs) established dur ing the last three decades, w i th proven success at increasing species richness, biomass. and biodiversity (2. 3) Bryant el al. (4) found that the coral reefs of Southeast Asia are the most threatened (80%). mainly because o f coastal development and fishing-rcl.iicd pressures.
Therefore, to address this threat, and to reduce loss o f biodiversity, the need for more MPAs has been recognized in recent years. At the W o r l d Summit on Sustainable DcvelofH mcni (Johannesburg 2002). and later al the Wor ld Parks Congress (Durban . September 2003). representatives o f protected areas recommended networks o f marine reserves covering 20 30% of habitats by 2012 (5). Countries have acknowledged the dire consequences o f losing coral reef ecosystems, and the worldwide response has been l o create each year for ihc last decade approximately 40 M P A s lhal include coral reefs, thus covering 18.7% o f the wor ld 's coral reef habitats (6). In 2002. 646 M P A s had been declared in Southeast Asia; however, only 8% o f the countries* reef area is covered (7). Unfor iunate ly . a large major i ty o f M P A s in Southeast Asia and worldwide are reported as fai l ing because Ihcy have not met their objectives, have been listed as marine reserves bui not succeeded in miplcmcnt ing management, have failed, or lie dormant a l one o f the subsequent development stages (X). The major barrier has been attr ibuted to the inabi l i ty lo secure adequate long-term funding for managemeni costs (9). resulting in inadequate law enforcement (10). In a wor ldwide study o f MPAs . only 15.7% o f
respondents reported funding levels to be sulTicient for efl'cxtive conservation (11).
The private sector, bolstered by tour ism, could offer a major source o f revenue, enabling M P A s lo become self-financing, establishing a truly successful and economically sustainable M P A . especially in developing countr ies (9. 12). The Durban Ac t ion Plan ( f rom the Wor ld Parks Congress 2003) also called on the private sector lo " f inancia l ly support the strategic expansion o f the global network o f protected areas ' and stales that tour ism can provide economic benefits and opportunit ies for communit ies and create awareness and greater knowledge of our natural heritage (5).
Private parks on land are wel l known and have been accepted as conser\at ion areas fo r more than half a century (1 } ) . w i th several large private parks existing in South America and Af r ica , some covermg more than 100 (M)0 ha (14). Whereas l i t t le is known about the elTeciiveness o f such private parks, they are sti l l expanding rapidly and number in the thousands, protect ing several mi l l ion hectares o f biological ly important habitat (15). Privately managed M P A s on the other hand are not well known, despite the private sector s growing involvement and reported higher infiucncc in protected area decision mak ing , especially in developing countr ies (16). Privately managed M P A s are still widely undocumented and insufficiently researched, but similar to terrestrial private parks, they are believed to have been ini t iated because o f the same three reasons: government failure to satisfy public demand for nature conservation (both qual i ty and quant i ty ) , growing scKietal interest in biodiversity conservation, and the rapidly expandinii ecotourism industry (13. 17).
It is t radi t ional ly understood lha l in pr ivate-community ecoiour ism jo in t ventures, the pr ivate sector should bring capi ta l , business, and market ing know-how and a client base: the local communit ies provide the liKation and local knowledge, whereas the local government or nongovernmental organizat ion should mediate between the two . as well as prt>vide basic infrastructure and other necessities (18). It is. however, a general misconception that submerged lands cannot be owned or leased by private enterprises (19). In researching the coastal states surrounding the Un i ted Slates. Slade el al. (20) found that nearly one-third o f submerged lands were owned or leased by the private sector, developing marinas, private docks, fisheries, aquaculture or other ventures. Slates in the United Stales, in which ownership of submerged lands is possible, include Flor ida and Hawai i (19) t ropical stales lha l include coral reef systems. Leasing submerged lands as a tool for marine conservation has, however, rarely been used, even though the costs o f leasing such areas are generally orders o f magnitude lower than equivalent schemes in the terrestrial environment. It is. for example, possible to lease up l o hal f o f Cal i fornia 's kelp forests, as well as sponge and soft coral habitats in Flor ida (19).
A growing number o f hotels and dive resorts are discovering the leasing potential o f adjacent coastal areas wi th or without external stakeholders. The Nav in i Island Resort, F i j i , has taken advantage o f the customary South Pacific practice o f owned, l imi ted access areas o f the sea and its resources, so called luhu
K Roval Swedish Acadcm) of Sciences 2009 hllp amhio kva.w
Ambu. Vol 38. No 2. March 20W

Van Pnong Bay
Figure 1. Illustration of the study area showing the 11 ha Whale Island Bay (WIB) and the 5 ha Whale Is land Bay Pen insu la (WIBP) reserves, plus the locations of the two control sites (CI and C2) on Hon Ong (Whale Island), in Van Phong Bay, Khanh Hoa Province. Vietnam.
areas, by leasing the sea a round the island up to a depth o f .̂ 0 m. A month ly fee is paid to the owners, who enforce fishing restrict ions, and in return the hotel agrees to fol low the lahu. which prohib i ts any damaging o f the coral reef ecosystem or cx i rac i ion o f its resources (A . Reed pers. comm.).
In other cases, resorts that have the financial backing, resources, and economic incentive have taken over the day-today management o f an M P A . These are termed "enireprcneur-ial M P A s . " where the M P A is of f ic ial ly designated, but resources are lacking to efTectively manage the reserve (21). Some pr ivate no-take zones are also precursors to publ ic protect ion, which could be viewed as money saved by the government f o r areas that may otherwise have needed protect ion (13). The protected zone adjacent to Lankayan Island Dive Resort, Sabah, Malays ia, which turned into Sugud Islands Mar ine Conservat ion Area, is such an example (22). The number o f ofTicially recognized privately managed M P A s is still smal l , but there are reported successes, such as the Chumbc Island Cora l Park, which possibly also represents the first ful ly funct ion ing M P A in Tanzania (17).
There is g r o w i n g l i te ra tu re showing that M P A s can effectively increase diversi ty, density, and biomass o f organisms w i th in protected boundaries, irrespective of the size of the M P A (2.^). as well as enhance fishing yields in the surrounding fished areas through the process o f f i s h "spi l lover" f rom the M P A (24 26). The biological effectiveness o f privately or hotel managed M P A s , f rom here termed " H o t e l Managed Mar ine Reserves" ( H M M R s ) , have, however, not yet been adequately researched.
In l ight o f the high financial costs o f establishing and mainta in ing protected areas, this article examines an alternative approach to protect ing at least a part of the 20 30% o f the wor ld 's seas th rough pr ivate management. Hotel managed marine reserves may offer a solut ion to the increasing need for marine conservat ion by assuming responsibility for protect ing adjacent mar ine environments yet also safeguarding the hotels* future th rough reputat ion and return guests. The future o f local communi t ies may also be sustained by ensuring direct and indirect jobs f r o m tour ism activi t ies and growth and by p rov id ing spil lover f r om increasing the standing fish stocks in the reserves. Here we report a local study wi th possible global consequences a imed at assessing the potential o f mar ine conservat ion when managed by the private sector. As part o f an inlcrdiscipHnary project focusing on the ecological and
socio-economic consequences o f H M M R s , this article reports results f rom a study in to the effectiveness o f an H M M R in V ie tnam in terms o f its capacity to increase coral reef fish density, diversity, and size.
METHODS
Stud> Site: Whale Island Resort , N ietnam
Whale Island Resort ( W I R ) is situated on H o n Ong. a small is land (approximately 100 ha), located in Van Phong Bay on the south-central coast o f Vietnam (F ig . 1). SO km north o f Nha T rang . The resort was established in 1997 and today has 32 bungalows accommodat ing a max imum o f 70 guests.
The hotel owners noticed the cont inued decline in local fish and coral populat ions believed to be caused by overf ishing and destructive fishing techniques, such as hose and hook, blast, and cyanide fishing. This was compounded by po l lu t ion and rubbish dump ing f rom small villages w i th in the bay. They therefore asked the 40 50 local staff to inquire wi th their fishing families as t o whether they wou ld have any objections to the hotel enclosing the bay around the resort w i th buoys, thus inhibi t ing fishing in the zone to protect the area and replenish stock. When no objections were made, they enclosed the bay in 2001, establishing a no-f ishing zone and a tic Unto 11 ha marine reserve (Whale Island Bay [WIB ] ) . In August 2005. a second bay was enclosed on the other side o f the peninsula, creating a 5 ha mar ine reserve (Whale Island Bay Peninsula (WIBP)) (F ig. 1). Legal permission to close o f f these areas was attained f rom the local authorit ies of Khanh Hoa Province in the form o f a 10-year lease (open to renewal), and in i t ia l izat ion was supervised by the kx:al coast guard. The added capital f rom the lease is welcomed by local authori t ies, because they can invest in infrastructure, schools, etc. A n y extension o f the lease period is l ike ly to be favored under normal circumstances, making p lanning for long-term protect ion o f coastal areas realistic for H M M R s
The resort is eco-fr iendly. a l though it lacks off ic ial cert i f i ca t ion ; it generates only low amounts o f po l lu t ion to the reserves f rom the ferry shutt l ing guests and supplies to the mamland plus the activities o f the dai ly dive and snorkeling boat . The vast major i ty o f food and dr ink is purchased f rom local vendors, and security guards, who double as reserve wardens, patrol the resort and adjacent reserves dur ing the
Ambt*. Vol M. No 2. March 2009 O Royal Swedish Acailcinv of Scictwes 2009 hup »-vkw amhio.kva.K
73

nighi lo protect against poaching. The costs needed to maintain the reserves arc relatively low: the sea port ion o f the lease, the reserve wardens, plus materials, repair, and maintenance totals les.s than USD 10 000 per annum. No reserve-user fees are collected.
The no-take zone was not accepted by the local communit ies for approx imate ly the f i rst 2 years, despite c o m m u n i t y acquiescence to W I B when it was first enclosed, resulting in frequent poach fishing. Consequently, the local coast guard was contacted on a regular basis lo deliver verbal warnings or to confiscate fishing gear f r o m regular of fenders. Poaching gradually abated, possibly because fishcrtnen realized that the added benefit f rom fishing in ihc reserves did not outweigh the risk of being caught, or they recognized the long-term potentials o f the reserves at provid ing spillover. Poaching is rare today at W I B reserve, but the frequency of fishermen "f ishing the l ine" (fishing just oiilside the marked buoys) dur ing the night is relatively high (2-.^ limc.^ per week). Patrol l ing ihc W I B P reserve is less frequent, and. as a result, poach fishing occurs approximately every 2 weeks dur ing the night. When fishing within the reserves, t radi t ional line and hook fishing is u.sed; when fishing the line or fishing at other coastal locations around the Van Phong Bay. more extractive net or trawl fishing methods are employed.
Surveys
The surveyed areas include W I B . the 150 m distant WIBP . and two control sites (CI and C2). which have similar exposure, slope, and morphologic characteristics, located 800 ni along the coasl f rom W I B and ."̂ 50 m apart (F ig. I ) . As exact geographical control replicates were not po.ssiblc. we used the nianta low technique lo choose control sites, which were as close a fit to conditions o f the I I M M R s as feasible. As natural diflerences between locations are likely to exist, our study focused on relative change over time at our four sites rather than absolute comparisons o f f i sh communit ies. We conducted the first survey in October 2005. 2 months after WIBP was enclosed, thus approximating preprotection conditions for that reserve. The fol lowing three surveys were conducted every 6 months dur ing a 3-week period, each l ime in Apr i l and October, with the last survey conducted in /Npril 2007; two seasons were therefore assessed over 2 years.
Dur ing al l four survey visits (October 2005-Apr i l 2007). replicates of four 50 m transects were surveyed at ?> ni and 9 m depth at each of the four survey sites ( W I B . WIBP. C I . and C2) using the visual fish census tnethod described by English el al. (27); the same transect line was used to survey the benthos using line intercept transect over 20 ni. Instead o f only including fish within a set perpendicular boundary lo the transects, we used variable distance counting to calculate ihe area (and thereby density) (28). We identif ied the whole fish communi ty to species, but excluded cardinalfish (Apogonidac). l izardfish (Synodonl i -dae). and the bot tom-dwel l ing species such as the gobies (Gobi idae; and blennies (Blcnniidae) because their cryptic lifestyles made accurate enumeration dif f icult . We recorded the number of indiv idual fish per species and their size and csi imaied their distance f rom the transects. To increase accuracy in length estimations, wc arranged and estimated polyvinyl chloride fish models (7-49 cm) along a 50 m line while snorkcling at a constant pace. We repeated this exercise wi th varying configurations and distance from the observer before each survey visit unt i l 95% accuracy was achieved.
We analyzed fish density, species richness, average size of fish, and number o f f i s h >15 cm using a three-way analysis o f variance ( A N O V A ) model with site, habitat, and time as factors; benthos cover (i.e. composit ion o f benthic habitat) was
analyzed with a two-way A N O V A for site and lime. Wc checked for A N O V A assumptions using Cochran's test and t ransformed where necessary; Student-Newman-Keuls tests ( S N K ) further invesligaied the signif icant interactions between factors. A l l A N O V A analy.ses were undertaken using G M A V 5 for Windows. T o explore the difference in fish assemblage composi t ion between times and sites, we conducted hierarchical agglomeralive cluster analysis to produce a dendograni using P R I M E R 5 software on a s im i la r i t y matr ix (Bray-Cur t is s imi lar i ty index) calculated f r o m square-root transformed species abundance data (29). Significance tests for differences between site and l ime were performed using A N O S I M . and the fish families contr ibut ing most l o dissimilarities were determined by the similarities percentage procedure S IMPER (30).
RESULTS
Dur ing the four visual census surveys we identif ied 242 species o f fish f rom 35 different famil ies: 195 species were observed in W I B reserve. 138 in W I B P reserve, and 107 and 87 species were recorded al C l and C2. respectively. Over al l sites and survey periods densities o f fish were higher at ihe 3 m sites (1.31 m"") compared with the 9 ni sites (0.34 m " ' ) ( S N K . p < 0.05). as was average size (S.28 cm compared w i th S.71 cm) (SNK. p < 0.01). average number of fish >15 cm (44.81 versus 9.04 individuals) ( S N K . p < 0.05). antl average species richness (28.12 versus 6.39 .species) ( S N K . p < 0.01).
A l 3 m. the seabed is .scattered wi th a higher rocky substrate cover (F = 29.05. p = 0.013) relative lo surveys conducted at 9 m. where substratum consisted main ly o f sand (average 98.1%). but no significant difierences in overal l benthic structure were found berween W I B . W I B P . C I , or C2 ( F = 1.10. p = 0.368). Cora l cover on the other hand was signif icantly higher at W I B compared wi th the contro l sites and W I B P (SNK. p < 0.01). a l though no significant differences were evident between the controls and WiBP , Coral cover is, however, comparatively poor al each location, equaling 7% at W I B rocky habitat and less than 1% at the other locations and depths.
A N O S I M tests conf i rmed that the fish assemblages between the 9 m sandy habitats and the 3 m rocky habitats were signif icantly dilTerenl (Global R = 0.745. Global p = 0.001). The families contr ibut ing most lo the dissimilar i ty between habitats were the Pomaccntridae. Nemipter idae. and Labridae (Table I) . The dendogram (Fig. 2) il lustrates these findings and addit ional ly shows a higher level o f s imi lar i ty between rocky sites. For both the sandy and rocky habitats, closest similarit ies were observed between the two cont ro l siles and W I B P (approximately 70% for rocky habitats and 55% for sandy habitats). A l though 35 families were ob.servcd. the vast major i ty o f species found at all sites belong to the damsclfish family (Pomacen-ir idae. 56-68%). fol lowed by bream (Nemipteridae. 12-17%) and wrasse (Labr idac. 6-12%). The larger predator species, jacks (Carangidae). barracuda (Sphyraenidac), and milkf ish (Chanidae) were, however, exclusively found in W I B and W I B P .
Whale Island Bay contained signif icantly higher species richness, density, average size o f fish, and number o f fish >15 cm ( S N K , p < 6.01). compared w i t h C l . C2. and W I B P over all survey visits (F ig. 3). as well as a signif icantly higher number of bul ler f iy f ish (onc-faclor A N O V A ? F = 15.404. p < 0.001). Whereas there were no signif icant differences between survey periods for species richness and average size, signif icantly higher values were found in the latter two surveys compared with October 2005 for density ( S N K . p < 0.01) and number of fish > ! 5 cm (S.NK. p < 0.05). as wel l as den.sity for Ap r i l 2006 relative to October 2005 (SNK. p < 0.05).
74 Rdval Swcilish At jdcmy tif SciL-ni;c> hiip;,'/www,anihio.kvii.\f
Amhio Vol. .VS. N... 2. March :(HW
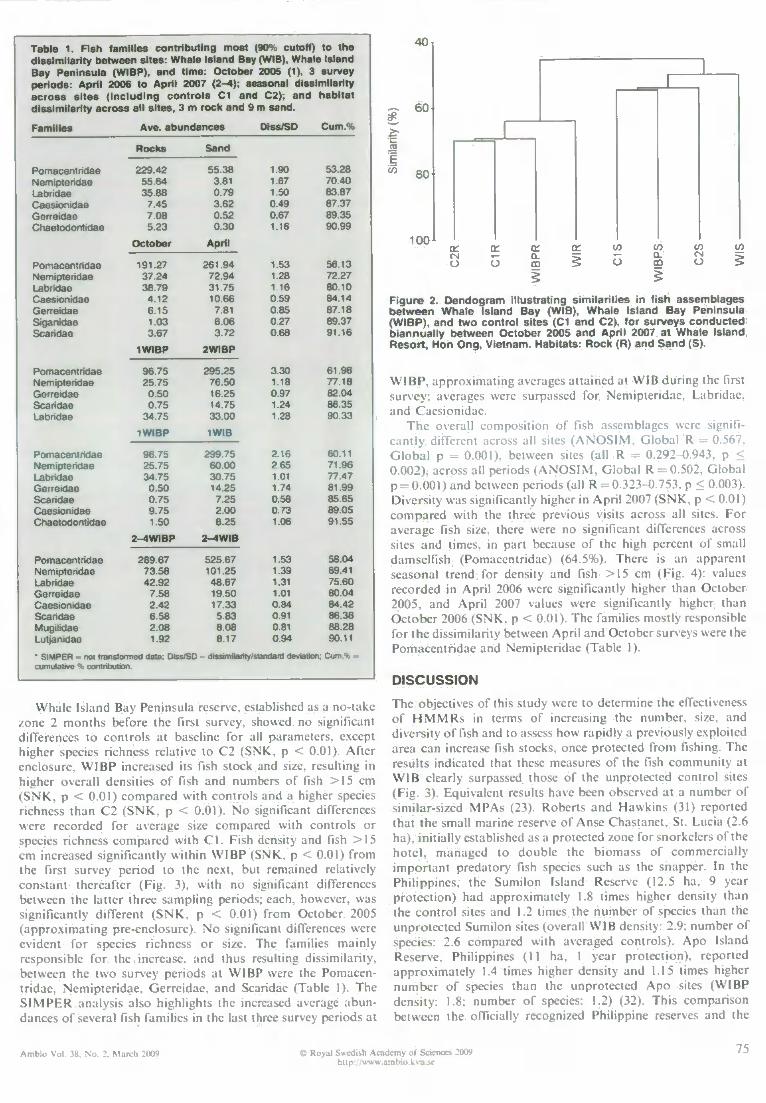
Table 1. Fish families contributing most (90% cutoff) to the dissimilarity between sites: Whale Island Bay (WIB). Whale Island Bay Peninsula (WIBP), and time: October 2005 (1). 3 survey periods: April 2006 to April 2007 (2-4); seasonal dissimilarity a c r o s s si tes (including controls C1 and C2): and habitat dissimilarity across all sites. 3 m rock and 9 m sand.
Ave. abundances Diss/SD Cum.%
Rocks Sand
Pomacentndae 229.42 55 38 Nemiptendae 55 64 3 8 1 l_abridae 35 88 0 79 Caes ion idae 7 4 5 3 6 2 Gerre idae 7 0 8 0.52 Chaetodontidae 5.23 0 3 0
October April
Pomacentndae 191.27 261 94 Nemiptendae 37.24 72 94 Labridae 38 79 31 75 Caestontdae 4 .12 1 0 6 6 Gerre idae 6.15 7 8 1 Siganidae 1 0 3 6 0 6 S c a n d a e 3.67 3 7 2
1WIBP 2W1BP
Pomacentr idae 96.75 295 2 5 NemiptefKlae 2 5 7 5 76 50 Gerretdae 0.50 1 6 2 5 S c a n d a e 0.75 14 75 Labridae 34 .75 33 00
1 W I B P 1WIB
Pomaceotndae 96 .75 299.75 Nemiptendae 25 .75 60 00 LabrHjae 34.75 30 75 Gen^eKlae 0.50 14.25 S c a n d a e 0.75 7 2 5 Caestonidae 9 75 2 0 0 Chaetodontidae 1.50 8 2 5
2-4 WIBP 2-4WIB
Pomacentr idae 289 .67 525 67 Nemiptondae 73.58 101.25 Labndae 4 2 9 2 48 67 Gerre idae 7 58 19.50 Caes ion idae 2 42 17.33 S c a n d a e 6 58 5 8 3 Mugilidae 2 0 8 8 0 8 Lutian.dae 1 92 8 17
1 90 1 67 1.50 0 4 9 0 6 7 1 16
1.53 1 28 1 16 0 5 9 0.85 0 2 7 0 6 8
3.30 1 18 0 9 7 1.24 1 28
2.16 2.65 1 01 1.74 0 5 8 0 7 3 1 06
1 53 1.39 1 31 1 01 0 8 4 0 91 0.81 0 9 4
• SIMPER fK>t cufT>uiaiive %
IranslOfmed cJata Diss. SD
53 28 70.40 83 87 87 37 89 35 90 99
56.13 7 2 2 7 8 0 1 0 84 14 87 18 8 9 3 7 91 16
61 96 77 18 82 04 86 35 90 33
60.11 71.96 77.47 81 99 85 65 89 05 91 55
58 04 69.41 7 5 6 0 80 04 84 42 86 36 88 28 90 11
Cuin.% =
Whale Island Bay Peninsula reserve, established as a no-take zone 2 months before the first survey, showed no significant dilTerences to contro ls a l baseline for all parameters, except higher species richness relative to C2 (SNK, p < 0.01). A f te r enclosure. W I B P increased its fish stock and size, resulting in higher overal l densities o f fish and numbers o f fish > I 5 cm ( S N K . p < 0.01) compared wi th controls and a higher species richness than C2 ( S N K , p < 0.01). N o significant differences were recorded for average size compared wi th controls or species richness compared w i th C I . Fish density and fish >15 cm increased signif icantly w i th in W I B P (SNK. p < 0.01) f rom the first survey per iod to the next, but remained relatively constant thereafter (F ig . 3), w i th no significant differences between the latter three sampling periods: each, however, was signif icant ly di f ferent ( S N K . p < 0.01) f rom October 2005 (approx imat ing pre-enclosure). N o significant differences were evident fo r species richness o r size. The famil ies main ly responsible for the increase, and thus resulting dissimilari ty, between the two survey periods at W I B P were the Pomacentr idae. Nemipter idae, Gerreidae, and Scaridae (Table 1). The S I M P E R analysis also highl ights the increased average abundances o f several fish families in the last three survey periods at
40
^ 80
100 c/j
F i g u r e 2. D e n d o g r a m i l l u s t r a t i n g s i m i l a r i t i e s in f i s h a s s e m b l a g e s b e t w e e n W h a l e I s l a n d B a y ( W I B ) , W h a l e I s l a n d B a y P e n i n s u l a ( W I B P ) , a n d t w o c o n t r o l s i t e s ( C I a n d C 2 ) . fo r s u r v e y s c o n d u c t e d b i a n n u a l l y betw^een O c t o b e r 2 0 0 5 a n d A p r i l 2 0 0 7 a t W h a l e I s l a n d R e s o r t . H o n O n g . V i e t n a m . H a b i t a t s : R o c k ( R ) a n d S a n d ( S ) .
W I B P . approximat ing aNcragcs allamcd at W IB dur ing the first survey; averages were surpassed for Nemipter idae. Labridae. and Caesionidae.
The overal l composi t ion o f fish assemblages were signif icant ly different across al l sites ( A N O S I M , G loba l R = 0.567. G loba l p = 0.001), between sites (al l R = 0.292 0.943. p < 0.002), across al l periods ( A N O S I M , G loba l R = 0.502. Globa l p = 0.001) and between periods (al l R = 0.323 0.753, p < 0.003). Diversi ty was signif icantly higher in Ap r i l 2007 ( S N K , p < 0.01) compared wi th the three previous visits across all sites. For average fish size, there were no significant dilTerences across sites and times, in part bcvause o f the high percent o f small damself ish (Pomacentridae) (64.5%). There is an apparent seasonal trend for density and fish > I 5 cm (F ig . 4): values recorded in Ap r i l 2006 were signif icantly higher than October 2005, and A p r i l 2007 values were signif icantly higher than October 2006 ( S N K . p < 0.01). The families mostly responsible for the dissimilari ty between Apr i l and October sur\eys were the Pomacentridae and Nemipteridae (Table 1).
DISCUSSION
The objectives o f this study were to determine the effectiveness o f H M M R s in terms o f increasing the number, size, and diversity o f fish and to assess how rapidly a previously exploited area can increase fish stocks, once protected f rom fishing. The results indicated that these measures o f the fish communi ty at W I B clearly surpassed those o f the unprotected contro l sites (F ig . 3). Equivalent results have been observed a l a number o f similar-sized M P A s (23). Roberts and Hawkins (31) reported that the small marine reserve o f Anse Chastanet, St. Lucia (2.6 ha), in i t ia l ly established as a protected /one for snorkelers o f the h o t e l , managed to double the biomass o f commerc ia l ly impor tan t predatory fish species such as the snapper. In the Phi l ippines, the Sumi lon Island Reserve (12.5 ha, 9 year protect ion) had approximately 1.8 times higher density than the con t ro l sites and 1.2 times the number o f species than the unprotected Sumilon sites (overall W I B density: 2.9; number o f species: 2.6 compared wi th averaged controls). A p o Island Reserve, Phil ippines ( I I ha, 1 year protect ion) , reported approximate ly 1.4 times higher density and 1.15 times higher number o f species than ihe unprotexted A p o sites ( W I B P density: 1.8; number o f species: 1.2) (32). Th is comparison iKtwecn the off ic ial ly recognized Phi l ippine reserves and the
Ambio Vol 38. No 2. March lOtn O Roy«I Swedish AoKletny of Scicncn 2009 htip wwvk anibto.kvm.9e
75

Figure 3. Visual c e n s u s e s comparing fish species richness, density, number of fish 15 cm. and average size (S .E . ) for Whale Island Bay (WIB), Whale Island Bay Peninsula (WIBP), and two control s i tes ( C l and C2) . for s u r v e y s conducted in October 2005 (light grey), April 2006 (grey). October 2006 (dark grey), and April 2007 (black) at Whale Island Resort , Hon Ong. Vietnam. Striped bars are the 9 m sandy habitats, solid bars the 3 m rocky habitats.
»9* set o tirh
xl5C -
reser\es in Vietnam demi>nstrales at least equal effectiveness for thcsL ' H \1 \1R^ SiiiiiKn K. the M / C O I livli .ii W I B u.is .>\ci.ill 1 > times higher than the cont ro l sites (WIBP. 1.3 times) and the number o f fish >15 cm, 22 times higher ( W I B P . 4 times) (F ig. 3). These are considerable increases for W I B P in part icular, bearing in mind there were min imal differences between this site and the two control sites in OctoK-r 2005 This supports the evidence that small H M M R s can, in only a short time, increase fish populations signif icantly fo l lowing protect ion. Analogous results were produced by Halpern and Warner (33), who found that marine reserves can signif icantly increase average levels o f density, biomass. and diversity w i th in I 3 years, independent o f the si/e o f the reserve.
Wi thou t effective pro tec t ion , such small reserves can. h o u c \ c r . be quite M ih ic iah lc At the An^e ( h.istanel reserve, fish biomass dropped by 20% after a period o f ineffective protect ion; however, biomass recovered to double the init ial value wi th in 2 years o f reinstatement (31). The increase in biomass was pr imari ly credited to an increase in fish size, much like WIBP . where the number o f fish >15 cm increased 13 times lri>m baseline to Apr i l 2006 and by 17 times f rom baseline to Apr i l 2007. This clearly highl ights both the benefits and
C6 I C4 f
•*.mo«^o»^•^ >l5o
Figure 4. Seasonality of averaged density and number of fish >15 cm surveyed at both depths (3 m and 9 m) during time intervals October (2005 and 2006: light grey) and April (2006 and 2007: dark grey) at Whale Island Bay (WIB). Whale Island Bay Peninsula (WIBP). and two control sites (C1 and C2) .
downfal ls o f small marine reserves. I f small reserves are fully protected, they can increase the si/e and density o f fish rapidly; however, i f poaching does take place, the detr imental elTects can be seen immediately. The magnitude o f damage wi l l depend on the intensity o f fishing, the fishing gear t txhniques used, and the standing stock before the event. I f H M M R s become lax in mainta in ing elTcclive protect ion, their image as an eco-fnendly resort, where you can dive and snorkel o f f the beach, could become compromised. This cou ld possibly result in lower iKcupancy rates and decreased pro f i t why private reserves in part icular have an added incentive to uphold protect ion.
A l though W I B is effectively protected, poaching still takes place at W I B P ; unl ike prepro lec l ion, however, less extractive fishing methods are used. In V a n Phong Bay. one fishing method , which does not target specific species, involves dragging nets f rom wi th in a small bay on to the beach (beach seining), not only causing serious damage to l iv ing coral, but also extracting a far higher number o f fish than poslprotecl ion. where generally hook and line fishing is used. This may explain the rapid increase in density and number o f fish >15 cm from the first survey to the next, and also w hy the number and size o f fish d id not increase further over the fo l lowing year (F ig. 3). Unfor tunate ly , the W I B P site is also current ly restricted lo tourists, which lessens the incentive for protect ion.
Beach seining may also account for the low coral cover at W I B P , C l , and C2 ( < l % ) , a l though coral cover at W I B rocky habitat is also rated low w i th 7%. Whereas there is evidence of more numerous and diverse fish assemblages assiKiated wi th coral reef habitats ( I . 34), it is questionable whether such low levels wou ld add signi f icant va lue, a l though there were signif icantly more coral l ivorous but ter f iy f ish (Chaetodonl idac) observed in W I B (6 times more than at cont ro l sites and 4.5 times more than at WIBP) . Th is family has been positively correlated wi th coral cover and marked as indicator species for healthy reefs (35. 36). A more l ikely scenario, perhaps, for the signif icantly higher number o f bul ter f ly f ish and other species, as well as indiv idual fish size in W I B compared wi th C l . C2 and W I B P . is the 6-year protect ion per iod and the cessation o f large-scale fish nett ing This would also account for the observed dilTerences in fish assemblages fo r sandy and rocky habitats of W I B compared wi th the other sites (F ig. 2).
C Royal Swedish AcadcmN of S C I C I K C S 20m hlip vk -̂u amhio kva sc
Ambu> Vol .18. No 2. March :n»

Rocky habitats (3 m) evidently have a richer fish assemblage than sandy habitats (9 m) . main ly attr ibuted to higher numbers o f Pomaccntr idac. Ncmiptcr idae. and Labridae (Table 1). This is expected for sites w i th higher structural complexity ( I . 34). but both arc highly depauperate in terms o f commercial ly valuable groups o f large food fishes: Scrranidae (e.g. Epinephe-lu.s. Cepfialopholis spp.), Lethr in idae {Leihrinus spp.). and Lut jan idac {Lutjanus spp.). especially at C I . C2. and W I B P . Even though the abundance o f such species was notably higher at W I B . grouper, emperor bream, and snapper only accounted for a small percentage o f the fish populat ion (0.46%. 1.86%. and 0.94%. respectively). Un l i ke many small coastal demersal fishes, which arc relatively sedentary, having a home range o f < 1 km~. the size and l iv ing spaces o f such species tend to be larger, requir ing a larger area o f protect ion (37).
The number o f these species did not increase dramatical ly once W I B P was protected, but measures of the fish assemblage increased between October 2005 and Apr i l 2006. especially for the number o f fish > 15 cm. which increased f rom 2-9.4% o f the popu la t ion ; the number o f species and average density also incrca.scd. A threefold increa.se in Pomaceniridae accounted mostly for the latter, whereas Nemipteridae, and to a lesser degree Gerreidac and Scaridac. were mainly responsible for an inf lux o f larger fish (Table 1) . This is consistent with previous findings, where predatory fish (Ncmipier idae) responded strongly to well enforced reserves in the Philippines (26). Whereas this could be seen as a sign o f spil lover f rom W I B . there was no indicat ion o f s imply a relocation o f W I B stock (Table 1. Fig. 3). Whi le the average abundances increased dur ing the fo l lowing three survey periods for W^B and W I B P . the average cont r ibut ion to the dissimilarit ies for the three major families (Pomacen-tr idae. Nemipter idae, and Labr idae) remained similar to the first survey period (Table 1) . The average dissimilarity decreased, however , f r o m 55.53% to 36.59%. ind icat ing that some movement between reserves may be taking place.
The number, size, and diversity o f fish increased at C I and C2 between the first and second survey also, but not as dramat ical ly as at W I B P reserve, the difference probably related to the absence o f larger-scale extractive fishing methods in the reserve. A seasonal trend is evident for density and number o f fish > 1 5 cm across al l sites (F ig. 4), w i th higher values reported in A p r i l . The main cont r ibutors were species o f the Pomaccn-tridae fami ly , fo l lowed by a much smaller contr ibut ion f rom the larger Nemiptcr idac. Cacsionidae. Gerreidac. and Siganidac families (Tabic 1) . The difference could be due to lower fishing intensity over the northeast monsoon season (October to February) , when fishing is restricted by weather condit ions. The higher fish densities cou ld , however, also be related to seasonal recruitment patterns. Higher peak .settlement o f several damselfish species have been recorded dur ing the wet season at San Bias. Panama, believed to be caused by the strong onshore winds (38). Srinivasan and Jones (39). however, found that recruitment densities for Pomaccntridae were highest after the wet season (December-February) , in Ap r i l /May . and again in October /November , in K imbc Bay (PNG) . Pomacentridae was also the main con t r ibu to r to the dissimilarities between the two seasons at W I R ' s reserves (Table 1) . Wi thout further research into temporal dynamics o f fish recruitment and fish landings in Van Phong Bay throughout the year, it is not possible to unequivocal ly determine the cause o f temporal differences.
A l t hough there was an ini t ia l significant increase in fish stock at WMBP. the level plaieaued. showing only minimal temporal differences thereafter (F ig. 3). Fish stock and sizes are. however, sti l l increasing 6 years after protect ion at WIB . and because the surveys were only conducted dur ing 2 years, further replenishment is perhaps stil l possible al W I B P . but more effective protect ion wi l l then also be needed. Fishing the line is observed
regularly at W I B . which is a good indicator that fishermen perceive the reserve to be increasing its fish stock and possibly producing spillover. Spil lover was not researched outside W I B for this study, but several fishermen conf i rm that fish stocks have improved adjacent to the reserve (Svensson. Rodwcl l , and A l t r i l l . submitted). The long-term goal o f all H M M R s located near fishing villages should be to compensate or increase their fishing yields to alleviate poverty, to increase standards o f l iv ing, and to repay the debt o f compliance to the hotels" no-take zones.
A t W I R . fishermen have also been seen fishing extensively between W I B and W I B P wi th nets, potential ly hindering the replenishment o f W I B P fish stocks to its full capacity f rom W I B . A l though this may be a good short- term solution enabling increasing yields, arguably it may not be a good long-term strategy to al low bui ld-up o f fish stocks. A better solution to improve the marine reserve potential would be to expand both reserves to encompass the peninsula, creating one larger no-take reserve and to increase protect ion efforts. This would increase the capabi l i ty to self-sustain a larger fish stock, including larger economical ly impor tant species wi th greater fecundity, enabling greater larval dispersal and adult movement across boundaries, which could better compensate or indeed enhance adjacent fisheries (37, 40. 41). A buffer zone adjacent to the reserve where less extractive fishing methods are al lowed, would further enhance coastal resources (42). Such unilateral protection by W I R and el.scwhcrc (43) may. however, increiisc tension with some local fishermen, who already perceive W I R as a reason for their reduced catches over the last few years; the reserve protects two beaches inhib i t ing their more extractive beach seining method (Svensson. Rodwel l . and A t t r i l l . submitted). In a survey conducted wi th fishermen f rom the nearby fishing village. Dam M o n . the major i ty o f fishermen wou ld , however, welcome more protected areas, but some suggest the hotel or government cou ld help compensate for their loss o f fishing grounds by prov id ing support to develop lobster aquaculture (Sven.sson. Rodwel l . and A t t r i l l . submitted).
CONCLUSION This research provides good evidence that, with effective protect ion, small H M M R s can increase fish stocks rapidly, matching, or in some cases surpassing. oITicially established M P A s of a similar size This study does not offer conclusive evidence for the effectiveness of all H M M R s . or whether such small H M M R s can compensate for the loss of fishing area set aside for the reserve. There is. however, evidence of spillover f rom the similar sized A p o Island reserve in the Philippines (44) and fishermen statements in this study suggest spillover f rom W I B (Svensson. Rodwel l . and A t t r i l l . submitted). Certainly, results show the promise o f such schemes. One H M M R may only make a difference ver\' locally, but many hundreds to thousands of H M M R s l in ing coastal countries across the tropics could create a network o f marine reserves that, some argue (45. 46). can have a cumulat ive positive effect on fish and coral growth by provid ing refuge at various distances for adult, larval , and propagule dispersal and settlement. Furthermore, hotels have the incent ive and often the resources, to lease and maintain adjacent coastal areas to sustain or enhance the environment for their benefit and that o f their guests.
RECOMMENDATIONS In i t ia t ion of I I M M R s should be conducted with approval and commitment f rom local communit ies and have strong government support (Svensson. Rodwel l . and A t t r i l l . submitted) to avo id confi ict and to ensure effective protect ion. Representatives of H M M R s must therefore educate and involve the local
Amhio Vol. 3«. No. 2. March 20(W © Royal Swcdbh Academy of Sciences 2009 hllp;//\vwu.ambio.Wv-a.ic
77

communities and explain the benefits o f long-term no-take zones and perhaps provide certain incentives to compensate for their loss o f fishing grounds, through jobs wi th the hotel or reserve, by financial means, and/or through alternative l ivelihood schemes. The owners o f Alegre Beach Resort, Phil ippines, for instance, have realized the need o f the communit ies for added support and are planning to develop and teach local communities mussel, seaweed, salt, and/or grouper farming (G . Sola, pers. comm.). I f a larger area is set aside for protection, or other more demanding mar ine conservat ion projects are ini t iated, financial assistance in the form of user fees may be an opt ion, which the owners o f the H M M R in turn would have to just i fy to guests, thereby creating greater awareness for marine conservation and our natural heritage. In a willingness to pay sur\'ey at W I R , Svensson ct al. (47) found that 97.5% tourists support H M M R s and 86.3% would be wi l l ing to pay extra to stay at H M M R s . Hotels may thus be in a strong posit ion to help alleviate pressure on governments by prov id ing a continuous source o f funding to protect a port ion o f coastal resources, create awareness, and educate staff/communit ies and tourists alike.
References and Notes
1. Spjiding. M.D., Ravilious. C. and Green. E.P. 2001. HortJ Ailax of Coral Recfi. UnivcrsHy of Olifomia Pnrss. Bcrkcky. CA, 424 pp.
2. Russ. G R. and A k j L i . A .C. I99S. Naiural fishing cxpcrimcnK in marine reserves 1983 1993: communiiy and trophic rcsponics. Coral Reef* 17, 3«3 397.
3. Djyion. P.K.. Sala. E . Tcgncr. M J . and Thrush. S. 2000. Mannc rcscr\tt: parks, basclinci, and fishery cnhanccmcnl. Bull. Mar. Sci- 66, 617 634.
4. Brynnl. D.. Burlc. L.. McManii',. J . and Spalding. M. 199S. Ret/sat Risk: A Mtip-Busftl Indiratnr nj Thrcaii to ihc World's Corul Ret fs. World Resources Insiiluic. Waihinglon, DC. 56 pp.
5. Inicrnational L'nion for Conscrvalion of Nature ( ILCN) . 2003. Wortd Parks Congress Oujputs: The Durhaii Action PUm. (htlp; jU-ww.iucn.org)
6. Mora. C . Andrefoiict. S., Cosiclto, M J . . Kranenhurg. C , Rollo. A.. Veron. J . . Gaston. K.J. and M>cr5. R.A. 2006. Coral reefs and ihc global network of marirtc proiccicd areas. Science 312, 1750 1751.
7. Burke. L.. Sclig. H. and SpaUing. M. 2002. Reefs al Risk in Souiheasf Asia. World Resources Institute. Washington. DC. 72 pp.
8. McCIanahan, T.R. 1999. Is there a future for coral reef parks in poor tropical countries? Coral Reefs 18. 321 325.
9. Dhannarainc. C S.. Sang. F. V. and Walling. L.J. 200O, Tourism potentials for financing pn>tecicd areas. Ann. Tourism Res. 27. 590 610.
10. Depondt, F. and Green. E. 2006. Diving user fees and the financial susLainability of marine protected areas: opportunities and impcdimcnls. Ocean Coast. Maruiee. 49. 188 202.
11. Balmford. A.. Gravcslock. P., Hockley. McCIean. C J . and Roberls. C M . 2004. The uorldttidc costs of marine protected areas. Proc. S'atL Acad. Sri. L'SA 101. 9694 9697.
12. Da\is, D. and Tisdcll. C. 1996. Economic management of Recreational scuha diving and Ihc environment. J. En\iron. .Manag. 48. 229 248.
13 Ungholz. J.A. and Lassoie. J.P. 2001. Perils and promiw of privaiciv o»-ncd protected areas. Bioscience 51. 1079 1085-
14. Langholz. J_A-. Lassoic, J.P.. I J : C , D . ar>d Chapman, D, 2000. Econonuc considerations of privatciv owned parks Ecol. Econ, J3, 173 183.
15. Pnvaic Protected Areas. 2007. (hllp; www-parksnctttork org) 16. Dcarden. P.. Bcnnell, M. and Johnston. J . 2005. Trends in global proicctcd area
governance, 1992 2002. Enxiron. Marag. J6, 89 100. 17. Riedmillcr. S. 1999. Private sector management of marine proiecied areas: ihc Chumbc
island case. In: Collected Essays on the Economics of Coral Reefs. Cesjr. H .SJ. (od). CORDIO. Dcpartmeni of Biolog>- and En%ironmenial Sciences. Ivalmar Lnivcrai>. Kalmar. Sw-cden. 244 pp.
18. Kiss. A. 2004. Is communitj-bascd ccoiounsm a good use of biodiversity conscr\ation funds? Trends Erol. E\ol. 19. 232 237.
19. Beck, M.W.. Mar^h. T.D.. Reiscwiiz. S .E . and Borlman. M.L. 2004. New tools for marine conservation: the leasing and ouncrship of submerged lands. Conser\. Biol. 18. 1214 1223.
20. Slade. D.C.. K c h c K , R.K. and Siahl. J .K. 1997. Putting the Public Trust Doctrine to li'ork. Coastal Stales Organization, Washington. DC. 361 pp.
21. Colwell. S. 1999. Entrepreneurial MPAs: dive resorts as managers of coraJ reef marine protected areas. InierCoasi Sevisletter J4. 4 5.
22. Teh, L.C.L. . Tch. L.S.Land Fung. Chen Chung 2007. A private management approach lo coral reef conservation in Sabah. Malaysia. Biodivers. Conserv. 17. 3061 3077.
23. Halpcm, B,S. 2003. The impact of marine rrscrves: do lescnes uork and docs ^eser^c size matter? Eeol. Appl. IJ. S! 17 S137.
24. Mora, C. and Sale, P.F. 2002. Arc popubtions of coral reef fish open or closed? Trends Ecol. Evol. 17.412 428.
25. McCIanahan. T.R. and Mangi. S. 2000. Spillover of cxploilaWe fishes from a marine park and its effect on ihe adjacent fishery. Ecol. Appl. 10. 1792 1805.
26.
27.
29.
30.
33.
36.
37.
38.
39.
40.
42.
43.
45.
46.
47.
Samoilys, M.A.. Martin-Smith. K.M.. Cites. B.G.. Cabrera. B., Anticamara. J.A., Brunio. E.O. and Vincent, A . C J . 2007. Effectiveness of five .small Philippines* coral rwf rcscrses for fish populations depends on site-specific factors, particularly enforcement history-. Biol. Convrv. IS6. 584 601. English. S.. Wilkinson. C. and Baker. V. (eds). 1997. Surrey .Manualfor Tropical Marine Rescmrces. Australian Insliluic of Marine Science. To*nssillc. 390 pp, Labrossc. P.. Kulbicki. M. and Ferraris. J . 2002. L'ndtnuater t'iiual Fish Census Sur\eys: Proper U.Ke and Implementation. Sccrrtarial of (he Pacific Community. Noumea, New Caledonia. 54 pp. Oarkc. K.R. and Gorley. R.N. 2001. Primer 1'5. User Manual, Tuiorial. PRIMER-E. Plymouth. U K . 91 pp. Clarke. K.R. 1993. Non-parametric multi%-ariatc analyses of changes in community structure. Aust. J. Ecol. 117 143. Robcns. C M . and Hawkins. J.P. 1997. llou- small can a marine rescr>c be and still be cfiTcaivc? Coral Reefs 16. 150 150. Russ. O.R. and Alcala. A .C. 1989. Effects of intense fishing pressure on an assemblage of coral-reef fishes. Mar. Ecol.-Prog. Ser. 56. IJ 27. Halpcm. B.S. and Warner. R.R. 2002. Marine nrscrves have rapid and lasting cfrecis. Eiol. Uit. 5. 361 366. Roberts. C M . and Orniond. R.F.G. 19.S7. Habitat compkr.niiy and coral-reef fish diversity and abundance on Red-Sea fringing reefs. .Mar. Ecol.-Prog. Ser. 41, 1 8. Bell, J.D. and Galzin. R. 1984. Infiucncc of live coral cover on coral-reef fish communities, Mar. Ecol.-Pro/i. Ser. 15. 265 274. KbaUf. M. and Crosby. M.P. 2005. Assemblage structure of but tcrflyfishes and (heir use as indicators of Gulf of Aqaba benthic habitat in Jordan. Aquai. Conserv. 15, S27 S43. Kramer. D.L. and Chapman. M.R. 1999. Implications of fish home range size and relocation for marine reserve function. Enxiron. Binl. Fi\h. 55. 65 79. Robertson. D R. 1990. Differences in the seasonalities of spavining and recruitment of some small neotropical reef fishes. J. Exp. Mar. Biol. Ecol. 144. 49 62. Srinivasan, M. and Jones, G-P. 2006. Extended breeding and recruitment periods of fishes on a low latitude coral reef. Coral Reef\ 25. 673 6S2, Hilbom. R.. Siokcs. K.. Maguire. J J . . Smith, T. , Botsford, L.W., Mangel .M.. Orcnsanz, J . , Parma. A , ct al. 2004. When can marine reserves improve fisheries management? Ocean Coau. .Mamtg. 47. 197 205, Sale. P.F.. Cowcn. R.K., Danilowicz. B.S.. Jones, G.P., Knuer. J.P., Lindcman. K C . Plarjcs, S.. Polunin. N . V C . et al. 2005. Critical sciciicc gaps impede use of no-take fishery rrscn.es. Trendt Ecol. f io/. 20. 74 HO, White. A.T. . Eisma-Osorio. R.L. and Green. S J . 2005. Integrated coastal management and mar i iK protected areas; compkmcniarily in the Philippines, Ocean Coast. Manag. 48, 948 971. Christie. P. 2005. Observed and perceived env ironmental impacts of marine protected areas in two Southeast Asia sites. Ocean Cttau. Manag. 48. 252 270. Russ, G-R- and Alcala. A . C 1996. Do marine reserves export adult fish Nomass? evidence from Apo Island, Central Philippines. Mar. Ecol.-Prog. Ser. 132. I 9. Roberts. C M . . Bohnsack, J.A., Gell. F.. Hawkins. J.P. and Goodndgc. R.200I. EfTccis of marine reserves on adjacent fishcncs. Science 29*. 1920 1923. Dauson. M.N.. Grosberg. R.K. and Botsford. L.VV. 2006. Connectivity in marine protected areas. Science 313. 43 44. Svensson. P,, Roduell, L.D. and Attrill. M.J. Hotel managed marine reserves; a willingness to pay survey . Ocean Coaii. .Manage. 51. 854 861, First sulwnittcd 4 June 2008. Accepted for publication 3 November 200S.
Patrik Svensson's research interests build on the principals of ecosystem-based management. He has recently been researching the effectiveness of privately managed l\/1PAs at sustaining local fisheries in tropical coastal countries. His address: Marine Institute. University of Plymouth, Drake Circus, Plymouth. PL4 8AA. UK. E-mail: [email protected]
Lynda Rodwell is a Lecturer in Ecological Economics. Her main research interest is in the field of fisheries economics and management, specifically, focusing much of her work on the bioeconomic modeling of the interactions between marine reserves and fisheries. Her address: Marine Institute, University of Plymouth. Drake Circus. Plymouth, PL4 8AA, UK. E-mail: [email protected]
Martin Attrill is a Professor of Marine Ecology at the University Of Plymouth. His research interests are broad, but generally involve assessing the factors that influence the distribution and diversity of marine organisms at a range of scales from the role of structural complexity in seagrass beds up to the influence of climate on the open ocean pelagic zone. His address: Marine Institute, University of Plymouth, Drake Circus, Plymouth, PL4 8AA, UK. E-mail: [email protected]
78 Royal Swedish Academy of Sciences 2009 htip: w-vv-vh.amhio.kva.se
Ambio Vol. 38. No. 2. Marrh 2009

or s pe^sc f ' t a t co
Ocean & Coastal Management 53 (2010) 114-122
ELSEVIER
Contents'lists available at ScienceDlrect
. Ocean & Coastal Management
j o u.r n a I h o m e p a g e: w w y y ^ I se y i e r . c o m / l o c a t e / o c e c o a m an
The perceptions of local fishermen towards a hotel managed marine reserve in Vietnam Patrik Svensson Lynda D. Rodwell ̂ Martin J. Attrill ̂ 'Marine Biology and Ecology Research Centre. Marine Institute. University ofPfymoutb. Drake Circus. Plymouth PL4 8AA. UK ^'Centre for Marine and Coastai Policy Research. Marine Institute. University of Plymouth, Drake Circus. Plymouth PL4 8AA. UK
A R T I C L E I N F O
Artide history: Available online 15 January 2010
A B S T R A C T
Marine Protected Areas (MP/Vs) often fall to meet ecological, social or economic objealves due to lack of effective management by government institutions. Partly in response to this failure, a number of marine reserves managed by the private sector. Hotel Managed Marine Reserves (HMMRs). have recently been established. In this study, we investigate changes to the social and economic conditions faced by local fishermen, following the establishment of two small reserves adjacent to a hotel in Vietnam, as well as their perceptions of the reserves' ability to produce spillover. The findings are used to gauge management performance and efTectiveness of the HMMRs. Two surveys with different survey designs, targeting fishermen with different fishing techniques, produced conflicting results. Fishermen mainly dependent on beach seining mostly opposed the HMMRs and the prospect of more proteaed areas being established. Fishermen using other fishing techniques were generally in favor of the HMMRs. welcoming more protection and confirming spillover offish, including large food fishes.
© 2010 Elsevier Ltd. All rights reserved.
1. Introduction
Marine Proterted Areas (MP/Vs) have been receiving increasing attention over the last decades as an effective management strategy for conseivation and fisheries management [1-31. They have the ability to significantly increase species richness, biomass and density of fish relatively quickly (1-3 years), independent of their size (41. and protea coral reef ecosystems from ove rex pi citation (51. if sufficiently funded and effectively managed |6|. From a fisheries point of view, it Is suggested that MPAs can protect a greater spawning stock and sedentary species, allowing fish to grow larger and live longer, greatly enhancing their fecundity. This increased fecundity can In turn provide new recruits to outside fishing areas and increase the density gradient of adult species from the reserve, allowing spillover to adjacent fishing grounds |7-9].
For local fishermen to benefit from the spillover of MPAs the size and spacing of MPAs have to be carefully designed and there needs to be compliance with the no-fishing rule. Several studies of tropical fish species provide evidence of relatively short larval dispersal distances, indicating that reserves can be relatively small but should have neighboring reserves relatively close by. to allow for
* Corresponding author at. Marine Biology and Ecology Research Centre. Marine Institute. University of Plymouth. Drake Circus. Plymouth PL4 8AA. UK.
E-mail address: pairik.svenssonS'plymouih.ac.uk (P. SvenssonX
proteaed resettlement (10-121. Small reserves are. however, more vulnerable to poaching, so. in order for MPAs to effectively protect the coastal ecosystem, committed cooperation and support from local populations is essential 113].
In order to gain commitment and to prevent non-compliance from the local communities, a proposed method is to provide intensive education programs and involve local fishermen already at the planning stages of the MPA, to ensure that their inherent cultural precepts and socioeconomic needs are considered carefully. This will give them decision power, which will help convince them that reserve objectives are not only developed for conservation purposes, but also for long-term fishermen benefits 114.151. This Is not to say that patrolling and enforcement of reserve boundaries are not necessary. If the reserve is successful at significantly increasing abundance, this will provide strong incentives for poachers 1161. Many poaching incidences may. however, not be of criminal intent, but rather a misconception of where the boundary lies 1171. Nevertheless, to deter regular misdemeanors, it is necessary that the punishment for poaching outweighs the possible gains brought on by the fishing aaivity 118|.
Community-based MPAs are, therefore, widely considered the most effeaive reef management strategy in the tropics 1141. Indigenous knowledge of ecological processes can help Idenrify inter-connectivity between habitats and find potential reserve sites that Incorporate biodiversity and include the presence of vulnerable and exploitable species |19| - these potential sites would be discussed
0964-5691/$ - see front matter <0 2010 Elsevier Ud . All rights reserved. doi:l0.1016/j.ocecoaman^010.01.001

p. Smisson et al. / Ocean &• Coastal Management 53 (2010) 114-122 l i s
and a balance found w h i c h w o u l d benef i t the env i ronment and local stakeholders. Other part ies invo lved in commun i t y -based MPAs may inc lude the local g o v e m m e n t . Non-Government Organizat ions (NGOs) and the pnvate sector. In these si tuat ions, the pr ivate sector, o f ten represented by d i v i ng operat ions o r hotels and resorts, are meant to supply fund ing and b r ing business to the area |20).
There has been an increase in the repor ted cases of hotels, in par t icu lar resorts o f fe r i ng d i v i n g ho l idays, w h i c h have taken the in i t ia t i ve to establ ish m a r i n e reserves w i t h va ry ing degrees o f par t ic ipa t ion f r o m o ther s takeholders I21.22|. S imi la r to pr iva te ly managed parks on land , m a n y o f these pr iva te ly managed MPAs. te rmed Hote l Managed M a r i n e Reserves (HMMRs) . have been establ ished because o f t he g o v e r n m e n t s inab i l i t y to satisfy the publ ic 's and ecotourists" d e m a n d s for na ture conserva t ion in b o t h quan t i t y and qua l i ty (on ly 14% ef fec t ive ly managed in a rev iew o f 285 MPAs in Southeast Asia |2i |) . i n add i t i on to creat ing a po tent ia l ly prof i tab le marke t n iche for the i r business 122.241. In these cases. HMMRs genera l ly pay a lease or tax t o the o w n i n g a u t h o r i t y and close t he area f r o m fishing, genera l ly by buoy markers . For example , the owne r o f W a k a t o b i Dive Resort. South-eastern Sulawes i . Indonesia, pays a leasing fee t o the chiefs o f a f f e a e d c o m m u n i t i e s for a s t r i p o f coast l ine cover ing 2 0 0 ha. des ignated a no- take sanctuary, as w e l l as a 500 ha adjacent area reserved fo r t rad i t iona l fishing p raa i ces . Representat ives of t he c o m m u n i t i e s patro l the reserve w i t h boats sponsored by the resort and ensure compl iance w i t h agreed e x t r a a i v e bans. I f no -poach ing takes place, the fu l l a m o u n t o f the agreed lease is pa id ou t and the m o n e y is used to deve lop local i n f r a s t r u a u r e . bu i l d schools and o the r publ ic bui ld ings, in add i t i on t o p r o v i d i n g for fishermen w h o s e fishing grounds have been lost ( |25| . Lorenz Maeder. resort owner , pers. comm. ) .
In this study, the percept ions o f local fishermen l i v ing adjacent to an H M M R in V i e t n a m have been ob ta ined and assessed. These are the people most af fected by establ ished m a r i n e reserves. The i r percept ions are there fore ex t r eme l y i m p o r t a n t to gauge t he effect iveness o f the p ro tec t ion in m e e t i n g its ecological , economic and social ob jea ives .
2 . S t u d y area
W h a l e Is land Resort (WIR) is a n H M M R . located o n a smal l i s land . Hon Ong (approx. 100 ha) , in Van Phong Bay. Khanh Hoa Prov ince, sou th -cen t ra l V i e t n a m . 8 0 k m n o r t h o f Nha Trang ; (Fig. 1). There are 32 b a m b o o - b u i l t b u n g a l o w s o n t he Is land accommod a t i n g a m a x i m u m o f 70 guests. The resor t is eco- f r iendly . p r o d u c i n g o n l y a m i n i m u m a m o u n t o f p o l l u t i o n f r o m the ferry, t r a n s p o r t i n g guests and suppl ies t o and f r o m t he m a i n l a n d , and f r o m the d i ve boat, w h i c h operates o n a da i l y basis. Waste wa te r is recycled i n a sept ic tank and used as i r r i ga t i on wa te r : inorganic was te is co l lec ted da i l y f r o m the beach and rooms and b u r n t in a specia l ly cons t ruc ted h igh-hea t fu rnace . The resor t purchases the vast m a j o r i t y o f food and d r i nk f r o m local vendo rs and employs a r o u n d 4 5 local staff.
The resort was estab l ished in 1997 w h e n t he fishing popu la t ion o f t he nearby v i l lage Dam M o n w a s re la t ive ly smal l . The resort owne rs , however , became increas ing ly concerned as the popu la t ion g r e w and a no tab le dec l ine i n fish and coral popu la t i ons became apparen t . The dec l ine was be l ieved t o be caused by ove r f i sh ing and d e s t r u a i v e fishing techniques, such as blast and cyan ide fishing, and hose and hook fishing. This was c o m p o u n d e d by rubbish d u m p i n g and p o l l u t i o n f r o m an increas ing n u m b e r o f fishing vessels in D a m M o n and nearby v i l lages. The o w n e r s there fore took t he in i t i a t i ve , o u t l i n i n g a p lan to create a no - take m a r i n e reserve to the ho te l staff, and asked t h e m to discuss th is suggest ion w i t h the i r fishing fami l ies . Since there w e r e no c o m p l a i n t s , t hey leased a larger area f r o m t he au tho r i t i es o f Khanh Hoa Province, w h i c h took the f o r m o f a 10-year c o n t r a a . and inc luded t he coastal seas up to 6 0 0 m f r o m the resort . The ad jacent bay (< 6 0 0 m ) was enclosed w i t h buoys in 2001 to m a r k the n o - t a k e zone, and an 11 ha H M M R ( W h a l e Island Bay - WIB) . was t h u s created. I n 2005 . a second bay was enclosed o n the o ther side o f the pen insu la , c rea t ing a 5 ha m a r i n e reserve ( W h a l e Is land Bay Peninsula - W I B P ; Fig. 1).
Four fishing v i l lages are located in Lach Cua Be channe l fo rmed by H on Lon Island and the Dam M o n Peninsula (Fig. 1). w i t h Dam M o n be ing by far the largest and o n e o f the closest v i l lages to the
South China Sea
D4m M6r
Van Phong Bay
"5*
Fig. 1. Illustration of Whale Island (Hon Ong) showing: Whale Island Resort with the two adjacent marine reserves; the fishing village Dam Mon and Lach Cua Be Channel formed by Dam Mon Peninsula and Hon Lon Island; with the locations of nearby fishing villages, in Van Phong Bay. Khanh Hoa Province. Vietnam.

116 P. Svfnsson et ai / Ocean & Coosfal Managemem 53 (2010) IM- I22
resor t , a c c o m m o d a t i n g a p p r o x i m a t e l y 3 0 0 fami l ies or 2 0 0 0 peop le . Its fishing f leet compr i ses 5 0 - 6 0 vessels, w h i c h are all classed as near -shore f i sh ing vessels, fishing w i t h i n a m a x i m u m d e p t h o f 50 m 126). A p p r o x i m a t e l y ha l f o f these are large enough to v e n t u r e ou ts ide t he channe l ( 1 0 - 1 5 N M ) . The smal l bamboo basket boats used for fishing close to h o m e are no t inc luded in th is es t ima te (Mr . H u n g . C h a i r m a n o f t he People's Commi t t ee for Khanh Hoa Prov ince, pers. c o m m . ) .
A l t h o u g h t h e r e w e r e no in i t i a l a r g u m e n t s about c reat ing W I B . i t was n o t accepted by t he fishermen o f D a m Mon for the first coup le o f years, r e s u l t i n g in f requen t poach ing . On these occasions t he local coast g u a r d was con tac ted o n a regular basis to de l iver ve rba l w a r n i n g s , o r to conf iscate fishing gear f r om regular poachers. Poaching g radua l l y abated and today non-comp l iance is rare at W I B . w h i l e t he f requency o f fishermen " f i sh ing the l i ne " ( f i sh ing j u s t ou ts ide the m a r k e d buoys) d u r i n g the n ight is re la t ive ly h i g h ( 2 - 3 t imes per w e e k ) . The secur i ty guards, w h o also serve as reserve w a r d e n s d u r i n g the n igh t , pa t ro l WIBP less f requent ly , s ince i t is o n t he o t h e r s ide o f t he pen insu la , away f rom the resort and . as a resul t , poach ing occurs a p p r o x i m a t e l y every t w o weeks d u r i n g the n igh t . W h e n fishing w i t h i n the reserves, t rad i t i ona l l ine and hook fishing is genera l l y used, bu t w h e n " f i sh ing the l i ne " , m o r e ex t rac t i ve ne t fishing m a y be e m p l o y e d .
The n u m b e r o f fishermen near ly doub led in V i e t n a m b e t w e e n 1990 and 2 0 0 4 f r o m 270 .600 to 550 .000 and the domes t i c fishing fieet capac i ty has increased by fac tor 6.5 ( w i t h an average increase o f 2 3 0 0 sma l l vessels ( < 4 5 h p ) per year ) |27.28|. The mos t c o m m o n fished areas are near -shore areas ( < 5 0 m dep th ) , cons t i t u t i ng 82% o f to ta l na t i ona l m a r i n e catch. Results f rom an assessment o f m a r i n e fisheries resources in V i e t n a m showed tha t the m a x i m u m sus ta inab le y i e l d (582,212 tones /year ) has been exceeded since 1986 |291 . Fisheries ca tch f r o m 2 0 0 8 was more than 2.1 m i l l i o n tones 1301. i n d i c a t i n g tha t mos t near-shore coastal regions o f V i e t n a m are o v e r e x p l o i t e d and fishing pressure is st i l l increas ing because o f t he a n n u a l increase o f smal l fishing boats 128,311.
A n u m b e r o f factors have led to ove rexp lo i ta t i on o f near -shore resources (Van Phong Bay i nc luded ) , such as mesh sizes unde r legal l i m i t s , h i g h levels o f by -ca tch and inc iden ta l catch o f sma l l / j uven i l e fish, h a r m f u l fishing gear such as fixed nets, des t ruc t i ve fishing techn iques , and t r a w l i n g , w h i c h has damaged the seabed | 2 8 | . O t h e r fishing techn iques used in Van Phong Bay. inc lude purse se in ing , g i l l ne t fishing, beach se in ing , hook and l ine, cas t -ne t fishing, t r ap fishing, as w e l l as t he i l legal and dest ruct ive m e t h o d s : b r i g h t l i gh t fishing ( > 2 0 0 0 W ) . b last and cyanide fishing, hose and hook fishing and fishing w i t h h igh vo l t e lect r ic i ty . The larger vessels fishing ou ts ide t he channe l are select ive w i t h thei r catch, t a rge t i ng m a i n l y t una . Some o f the sma l le r vessels target anchovy or squ id at n i g h t us ing b r i g h t l i gh t fishing, b u t stay w i t h i n the channe l ; t he r e m a i n d e r is non -se lec t i ve . Due to overexp lo i ta t ion . mo re and m o r e fishermen are t u r n i n g to lobster aquacul ture. This is par t i c u la r l y t he case d u r i n g t he no r theas t m o n s o o n season f r o m October to February w h e n fishing is res t r ic ted by wea ther cond i t i ons .
3. C o m m u n i t y s u r v e y s
T w o sets o f q u a l i t a t i v e and quan t i t a t i ve , open and c lose-ended a n o n y m o u s ques t i onna i res w e r e c o m p l e t e d by the fishermen o f D a m M o n in Oc tober 2 0 0 6 and Ap r i l 2007. In October 2006 . 40 ques t ionna i res ( t rans la ted i n t o V ie tnamese) w e r e g iven to t he C h a i r m a n o f t h e People's C o m m i t t e e to d is t r ibu te to the local fishermen. W h e n these ques t ionna i res were re tu rned , it was e v i d e n t t ha t several sets had been comp le ted in un ison w i t h the fami ly , p r o v i d i n g near dup l i ca te results. A re lat ive ly one-s ided pos i t i ve v i e w p o i n t p e r t a i n i n g to the benef i t of increasing the local n u m b e r o f p ro tec ted areas was also apparent . A f o l l o w - u p .
i den t i ca l , i n te rv iew-based survey was . therefore, conduc ted w i t h the a id of t w o local m a r i n e b io log is ts f r o m the Ins t i tu te o f Oceano g r a p h y in Nha Trang, w h o acted as t rans la tors . The idea was to check the au then t i c i t y o f the resul ts f r o m the first survey and to e x a m i n e data f r o m a d i f f e ren t angle t o i m p r o v e the leg i t imacy o f the ou t comes of the inves t iga t ion . The i n te rv i ews w e r e conduc ted w i t h ano the r set o f fishermen in A p r i l 2007. bu t s ing l ing o u t i n d i v i dua l s in t he v i l lage was near imposs ib le , so instead. 10 r a n d o m fishing fami l ies w e r e i n t e r v i e w e d at t h e i r homes w h i l e they were repa i r i ng the i r nets. 4 0 - 5 0 i nd i v i dua l s w e r e invo lved in this survey. C o m p l i c a t i o n w i t h s ing l ing o u t i nd i v i dua l s is n o t surpr is ing cons ide r i ng the t r ad i t i ona l V ie tnamese social s t ruc tu re , w h i c h can be b road l y character ised by a closely k n i t t e d pat r ia rcha l ex tended f a m i l y sys tem, w h e r e f am i l y u n i t y is e x t r e m e l y i m p o r t a n t 1321.
On ly fishermen f r o m Dam M o n were surveyed since the i r vi l lage is o n e of the closest to WIR (1 N M ) , w o u l d be most affected by loss o f fishing grounds and w o u l d therefore be able to g ive the most accurate in te rp re ta t ion o f the ecology and management o f the reserves. F ishermen f r o m the o ther nearby fishing v i l lage (Son Dung : Fig. 1) p redominan t l y fish w i t h i n the Lach Cua Be channel , w h i c h is w h y these fishermen were not surveyed. Overal l , t he op in ions o f app rox ima te l y 5% o f the fishing v i l lage were represented.
I n these semi -s t ruc tu red surveys, fishermen w e r e requested to c o m p l e t e a demograph ics sect ion de ta i l i ng thei r age. sex and average year iy i n come ; g ive the i r o p i n i o n o f w h e t h e r they consider the a m o u n t o f fish to have increased, decreased, or stayed a p p r o x i m a t e l y the same in the last 10 years: i den t i f y the top 5 reasons w h y they t h i n k fish stocks have decreased, i f so speci f ied (11 op t i ons w e r e suggested: o t h e r reasons could be added by r e s p o n d e n t ) : state w h e t h e r they t h i n k t he cora l reefs and fish need p ro tec t i on , w h i l e g i ven the o p p o r t u n i t y to suggest h o w ; state w h i c h fishing techn iques they use (11 me thods suggested) and w h i c h species they target. They w e r e t h e n asked t o exp la in w h y they t h i n k WIR had closed o f f the bay w i t h buoys and to express w h e t h e r W I R had had an overa l l pos i t i ve , negat ive or inconsequen t i a l impac t o n t h e i r l ives. Subsequent ly , t hey w e r e asked w h e t h e r the enclosures had had an i m p a c t on the i r l ives financially ( r espond ing o n a 5 -po in t L iker t scale f r o m 1 ' >20% increase/year ' to 5 *>20% decrease/year ' ) . Next , t hey w e r e requested t o c o m m e n t on po ten t i a l fishing gains incur red f r o m the p ro tec t i on , by s ta t ing w h e t h e r they consider the n u m b e r o f fish, size and d ive rs i t y o f fish to be f r om. 1 ' m u c h h igher /b igger ' to 5 ' m u c h lower /smal ler " , w i t h i n 2 0 0 m o f the reserve boundary , and t o speci fy i f a n increase in a pa r t i cu la r species had been no t iced . The final set o f quest ions enqu i r ed w h e t h e r they themselves, o r relat ives, ever fish in the reserves ( 3 - p o i n t L iker t scale f r o m 1 'Yes. o f ten" to 3 No, never ' ) a n d , i f so, w h y they fish t he re ; h o w the n u m b e r a n d d i v e r s i t y o f fish, n u m b e r o f inver tebra tes and coral cover in the reserves compare to unp ro tec ted areas ( respond ing o n a 5 -po in t L iker t scale f r o m 1 m u c h h igher ' to 5 m u c h l o w e r ), and i f t hey t h i n k it w o u l d be
a ' good idea' o r bad idea" i f the ho te l o r g o v e r n m e n t we re to close o f f m o r e coastal areas a r o u n d W h a l e Is land.
Since w e used t w o d i f f e ren t survey techn iques, each w i t h a sma l l sample size, and c o m p r i s i n g some near dup l i ca te results, de ta i l ed stat isr ical analysis was no t possible. Instead, w e p rov ide qua l i t a t i ve and descr ip t ive analysis, w h i c h g ive some ind ica t ion o f reserve ef fect iveness and m a n a g e m e n t per fo rmance . These data are. however , excep t iona l l y va luable in p rov i d i ng a n ins ight in to local c o m m u n i t i e s ' a t t i tudes to MPAs and . in par t icu lar , to H M M R s . as such i n f o r m a t i o n is the first o f its k i n d .
4 . Resul ts
T h e 4 0 respondents o f the first survey represented a balanced m i x o f genders aged > 1 8 to < 6 5 . the m a j o r i t y rang ing f r om 18 to 35

p. SvCTisson et at / Ocean fr Coastal Management 53 (2010) 114-122 117
(Table 1). The average fisherman's i ncome to ta l led VND 9.990.000 per year, o r app rox ima te l y USS 6 4 0 ( A p r 2007 exchange rate: USS 1 = V N D 15.600). Mos t o f the l owes t i ncome earners were the o l de r generat ions > 5 5 and the one boy under 18. ea rn ing < V N D 5 m i l l i o n per a n n u m . The lowes t i ncome recorded was V N D 2.5 m i l l i o n (USS 160/year). The h ighest earners ( m a x V N D 60 m i l l i o n , o r USS 3846 per a n n u m ) were be tween 18 and 25. w h o ta rget tuna ou ts ide the channe l . The large g roup o f m i d d l e - r a n g e d i ncome earners use a w i d e range o f f i sh ing techn iques f r o m hose a n d hook fishing a n d t rap fishing to t r a w l i n g . They ta rge t sh r imps and l i t t le lobsters fo r use i n aquacul ture. anchovy, squ id and Carangidae spp., ins ide and outs ide the channe l , o r i nd i sc r im ina te l y any k i nd o f f ish, o f t en t h rough cast-net fishing o r beach se in ing (Fig. 2 ) .
The vast ma jo r i t y (95%) had not iced a decrease in the n u m b e r o f fish i n t he ocean i n t h e last decade, t h e m a i n reason b e i n g a t t r i b uted to bet ter fishing techn iques. Blast fishing was accredi ted a close second, and over f i sh ing , t h i r d place (Fig. 3) . These findings co inc ide w i t h the resort o w n e r s ' conclus ions as to w h y fish and coral popu la t ions had dec l i ned , and w h y they dec ided t o protect t he i r adjacent coast l ine.
A l l fishermen suggested cora l ree f ecosystems shou ld be p r o tected, speci f ical ly to pro tec t f r o m blast fishing and to increase the s tand ing stock. They t h o u g h t t ha t pro tec ted zones shou ld be s t r ic t ly enforced and the local c o m m u n i t i e s educated to unders tand the value o f MPAs (Fig. 3). W h e n asked w h y they t h o u g h t WIR had enclosed t h e bays w i t h buoys, a l l b u t t w o m e n t i o n e d mar ine p ro tec t ion ; instead these ind ica ted tha t i t was on ly t o at t ract tour is ts . In f a a . 29% o f a l l fishermen f r o m the first survey also suspected tha t a reason was to a t t rac t m o r e tour is ts (Fig. 3).
The responses f r o m the fishermen s h o w e d an overa l l posi t ive a t t i t u d e t o w a r d s WIR . w i t h 41 % boas t i ng an increase in t he i r year ly i n c o m e (Table 1). Those g i v i n g a reason for th is suggested tha t they had secure j o b s o r cou ld deve lop o t h e r p r o j e a s re la ted to tou r i sm s ince t he p ro tec r i on (Fig. 3 ) . These fishermen are i nc luded in the 80% w h o fish w i t h i n 2 0 0 m o f the reserve and w h o have not iced an increase i n t he n u m b e r , size and species r ichness o f fish w i t h i n this area, regardless o f t he i r fishing techn iques. W h i l e t he ma jo r i t y suggested tha t coral ree f fish in genera l had increased w i t h i n 2 0 0 m o f the reserve, several fishermen also dec lared an increase in c o m m e r c i a l l y va luab le g roups o f large food f ishes, e.g. Serranidae and Carangidae (Fig. 3).
T w o fishermen dec lared a decrease in t h e i r yea r l y i ncome, one o f w h o m a d m i t t e d to s o m e t i m e s fishing ins ide the reserve ( t he o n l y one t o d o so), b u t d id n o t c o m m e n t o n w h i c h fishing techn iques he uses o r t he state o f the reserve compa red w i t h unp ro tec ted areas. The second fisherman t h o u g h t t ha t t he size o f fish and t he species richness was greater w i t h i n 2 0 0 m o f the reserve, b u t exp la i ned tha t t he fishermen n o w had to go f u r t h e r for fishing and expenses are inc reas ing (Fig. 3) .
A l t h o u g h on l y one fisherman admi t t ed t o fishing inside the reserves. 68% had an o p i n i o n on t he n u m b e r o f fish and inver tebrates, coral cover and species richness w i t h i n the reserves compared w i t h u n p r o t e a e d areas. A l l fishermen w h o c o m m e n t e d on these a t t r ibu tes rated reserve species as being h igher o r m u c h higher (Table 1). The fishermen w e r e asked w h a t cou ld be done to improve compl iance . The i r suggest ions var ied f r o m educat ion and adver t is ing t he reserve, by announcements a n d s h o w i n g reserve results, to s t r i r t e r en fo rcements and more g o v e r n m e n t i n v o l v e m e n t (Fig. 3 ) . A l l
Table 1 Breakdown of Dam Mon fishermen's responses lo the first questionnaire distributed by the Chairman of the People's Committee {%) and second interview-based questionnaire expressed in number of families (USS I = VND 15.600 - April 2007).
No. families Tishermen (%) No. families Fishermen (%) No 5 ^ (n = 40) Number of fish within 200 m? (n = 30) Female 523 Much higher 40.0 1 Male 47J5 Higher 60.0 Age (n=37) No change 1 <18 2.7 Size of fish within 200 m? (n=30) 18-25 27J0 Much bigger A6.7 26-35 29.7 Bigger 46.7 36-45 183 No change 4.7 1 46-55 10.8 Spp. richnas within 200 m? (n=29) 56-65 5.4 Much higher 24.1 >65 5.4 Higher 753 Yearly income (n = 25) No change 1 <5.ooaooo 223 2 >5.000,000 < 7300.000 31.4 1 >7300.000 < 10.000.000 20.0 2 Fish inside bay? (n = 36) > 10.000.000 < 15.000.000 17.1 1 No. never 97.8 10 > 15.000.000 8.6 1 Yes. sometimes 22 No. fish in fast decade? (n = AO) Been inside buoys? (n = 40) Decreased 95.0 9 Y o 673 No change 5.0 1 No 323 10 Do corals need protection? (n 40) Species richness in HMMRs? (n = 20) Ves 100.0 6 Much higher 25.0 No 3 Higher 75.0 WIR changed life? (n=39) Number of fish in HMMRs? (n = 26) No change 613 Much higher 15.4 Overall positive 383 1 Higher 84.6 Overall negative 9 Yearly inatrrte changed? (n=39) Number of irrvertebrates in HMMRs? (n=25) No change 533 Much higher 12.0 >20X Increase 3S3 Higher 88.0 >10X Increase 5.1 Coral cover in HMMRs? (n^25) >20X Decrease 5.1 S Much higher 12.0 >10X Decrease 1 Higher 88.0 Fish within 200 m? fn =40; Make more MPAs? (n = 37) Yes 80.0 2 Good idea 100.0 2 No 20.0 8 Bad idea 8

Auinor s pr* .sona^ co
118 P. Swnison er aL / Ocean S ' CoasraJ Monogemenr 53 (20W} tM-122
a
Cast-net fishing
Gill net fishing
Bright light fishing
Trawling
Line fishing
B e a c h seining
Hose and hook fishing
Trap fishing
Fishing techniques (n=34) Target s p e d e s (n=33)
Tuna
Non-selective fish
Squid
Anchovy
Carangidae spp.
Invertebrates
Other
2 4 6 8 10 12 14 16 18
No. fishermen
0 2 4 6 8 10 12 14 16 18
No. fishermen
R g . 2. TTie fishing techniques (a) and target species (b) of Dam Mon fishermen.
b u t three, w h o d i d n o t o f fe r an o p i n i o n , t hough t tha t mo re reserves a r o u n d the is land w o u l d be be t te r (Table I ) : e ight respondents even suggested p r o t e a i n g a coastal area f r i ng ing the w h o l e is land. In ter est ingly, t he t w o w h o ind ica ted a decrease in year ly salary also r e c o m m e n d e d m o r e p ro tec t i on .
These e i g h t responden ts , howeve r , be long to one o f t w o larger sets o f fishermen surveys , w h o s e resul ts were mos t l y i den t i ca l , m i n u s t he d e m o g r a p h i c s sec t ion , suggest ing they cou ld have c o m p l e t e d t he ques t i onna i res i n u n i s o n w i t h the w h o l e fami l y . These e i g h t have at least o n e boa t large enough to go ou ts ide t he channe l to fish f o r t u n a . Seven o f t h e m ind icated tha t t he i r i n c o m e had increased b y > 2 0 % because o f t he reserve, six o f t h e m sug ges t ing i t was because t h e y had secure j obs . They al l t h o u g h t t h a t cora l reef fish abundances had Increased w i t h i n 2 0 0 m o f t he reserve and cons ide red t he reserve b io ta t o be h igher t h a n u n p r o t e c t e d areas, u n d e r s t a n d i n g t he va lue o f t he pro tec ted zone. The o t h e r g r o u p o f 7 w i t h s i m i l a r resul ts , a l l rep l ied iden t i ca l l y t o t he q u e s t i o n : w h a t c o u l d t h e ho te l o r g o v e r n m e n t d o to increase c o m p l i a n c e . A l l suggested m o r e g o v e r n m e n t i n v o l v e m e n t and fo r t he ho te l t o a n n o u n c e reserve ach ievements . They fish for squ id , a n c h o v y a n d l i t t l e lobsters and cons ide r t he reserves to be ef fect i ve l y i nc reas ing fish assemblages i n and w i t h i n 2 0 0 m o f t he reserve bounda r i es . Six o f t h e m t h o u g h t i t w o u l d be a good idea t o increase t h e n u m b e r o f reserves a r o u n d W h a l e Is land and one had no t i ced a financial increase.
The responses o f t he i n t e r v i e w e d fami l i es of fishermen d i f f e red g rea t l y f r o m those o f t he o t h e r fishermen. The i r average year l y i n c o m e , ca lcu la ted f r o m the to ta l a m o u n t earned by the fishermen o f t he f am i l y , d i v i d e d b y t he n u m b e r o f f am i l y fishermen, equa l led V N D 7,400,000 o r USS 474 (73.4% o f t he average i ncome f r o m t h e first su rvey ) . M o s t o f these fishermen had not iced a dec l ine i n t he n u m b e r o f fish, a t t r i b u t e d to be t te r fishing techniques and over f i sh ing , b u t o n l y 6 f am i l i es t h o u g h t t h a t the coral reef ecosys tem needed p r o t e c t i o n (Table 1). These fishermen, l i v i ng o n t he ou t sk i r t s o f D a m M o n , fish w i t h b r i g h t l ights t a rge t i ng a n c h o v y (6 f am i l i es ) and squ id (4 f am i l i es ) ; 8 fami l ies p u t equal e f f o r t i n t o beach se in ing , w h i c h is non-se lec t i ve .
Six f am i l i es c o n c l u d e d t h a t W I R had e r e a e d the fishing bounda r i es to p r o t e c t t h e cora l ree f ecosystem or to increase fish stocks, b u t seven fami l i es figured i t was also o r on l y to a t t r a a tou r i s t s . O n l y o n e f a m i l y t h o u g h t t he efforts o f W I R had had
a pos i t i ve i m p a c t o n t h e m , and al l w h o c o m m e n t e d , stated a financial loss since t he reserves w e r e establ ished (Table 1). They i m p l i e d t h a t t h e y had t o go f u r t h e r fo r fishing, w h i c h cuts i n to the i r p r o f i t m a r g i n .
O n l y 2 fami l ies fish w i t h i n 2 0 0 m o f the reserves, one repo r t i ng an increase in s tocks; t he o t h e r had n o t no t iced any s ign i f icant changes since t he p r o t e a i o n . A l l , however , c lear ly ind icated tha t t hey d o n o t fish Ins ide t he reserves because they are a f ra id o f po ten t i a l repercuss ions i n t he f o r m o f fines o r gear/vessel conf is ca t ions . Several o f these fishermen had b i t te r feel ings towards the o w n e r s and t he reserves and one fisherman t h o u g h t t ha t the o w n e r s had on l y r e s t r i a e d fishing i n o r d e r to be able to catch fish fo r themse lves and guests. On ly 2 fami l ies t hough t t h a t mo re p ro -t e a e d areas a r o u n d W h a l e Is land w o u l d be a good idea (Table 1).
5. Discussion
I t has been t he s t ra tegy o f some g o v e r n m e n t s to re locate w h o l e c o m m u n i t i e s f o l l o w i n g t he es tab l i shmen t o f an MPA. to reduce pressure o n resources and t o increase i ncome po ten t ia l . M a n y coun t r i es d o n o t have t he cap i ta l o r resources for such act ions, however , and t he e th ica l j u s t i f i ca t i on is quest ionab le |131. C o m m u n i t y managed MPAs, w h e r e local c o m m u n i t i e s can have a v o i c e in reserve loca t ion and ob ject ives, is i n th is sense fairer. W h e n estab l ished hote ls w i s h to enclose an area f o r the sake o f conse rva t i on , and poss ib ly to a t t rac t m o r e tour is ts , t he loca t ion Is a l ready genera l l y d e c i d e d : ad jacent t o the hote l . Therefore, c o m m u n i t y i n v o l v e m e n t and acquiescence is ex t reme ly i m p o r t a n t , especia l ly w h e n fo re ign o w n e r s h i p is concerned 124).
T h e o w n e r s o f W I R asked the local staf f to confer w i t h t he i r fami l i es , and feedback t o t h e m i f t hey w o u l d have any ob jec t ions fo r t h e bay ad jacen t t o t he ho te l t o be enc losed, and fishing t o be p r o h i b i t e d . W h i l e a l l t h e respondents f r o m the first survey and 6 fishing fami l ies f r o m t h e second survey agreed t h a t coral reefs needed p r o t e a i o n . and \0Q% f r o m the first survey and 2 fami l ies f r o m the second, w o u l d w e l c o m e m o r e p r o t e a e d areas a r o u n d W h a l e Is land (Table 1). i t t o o k a f e w years u p o n es tab l i shment o f the first H M M R t o increase comp l i ance to the no- f i sh ing ru le to a leve l o f perce ived acceptab le loss, w h e r e on l y occasional ly, hook and l i ne fishermen us ing b a m b o o basket boats, d i d no t c o m p l y ( M i c h e l Galey, resor t ovmer , pers. c o m m . ) . A2% o f t h e fishermen

p. Svensson er aL f Ocean & Coasral Manqgemenf 53 {2Q\0) 114-122 119
^ C a u s e of decreasing fish populations (n=40)
Better fishing techniques
Blast fishing
Overfishing
Oil pollution from boats
Sewage outflow
Why coral reefs need protection (n=38)
Cyanide fishing
Boat anchor damage
Rubbish dumping
Using corals for building
0 5 10 15 20 25 30 35
No. fishemien
Why WIR enclosed bay (n=38)
Pnjtect coral reef
ecosystem
Prevent fishing,
increase fish species
Attract tourists
0 5 10 15 20 25 30 35 40 No. fishermen
Increase in species within 200 m or the reserves (n=30)
Coral reef fish
Mugiiidae
Serranidae
Nemtpteridae
Carangidae
Squid or Anchovy
Invertebrates • 5 10 15 20
No. fishermen
25
Protect coral reef ecosystem
Strict enforcement
Educate people
Increase fish production
Protect from blast fishing
0 5 10 15 20 25 30 35 40
No. fishermen
Has WIR changed fishermen's yearly income (n= 11)
Secure local jobs
I n a e a s e d resources to government and people
Helped develop other service industries
Participation in pnstection
Have to go further for fishing
0 2 4 6 8 No. l ishennen
What can WIR or the government do to increase compliance {n=34)
10
Advertise it more
Educate about MPAs
Strict enforcement
Government involvement
Show reserve results
5 10 15 20 No. fishermen
25
Rg. 3. Dam Mon fishermen's opinions on the cause of decreasing fish populations (a), why coral reefs need proteaion (b). why Whale Island Resort (WIR) enclosed the bay (c). reasons for a change in yearly income brought on by the establishment of the HMMRs (d). their perceptions of the fish species attributing to spillover (<200 m) (e) and suggestions what WIR and/or government could do to increase compliance (f).
f r o m the first survey suggested tha t educat ion programs shou ld be
establ ished to make peop le bet ter unders tand the value o f m a r i n e
reserves (Fig. 3) .
A l t h o u g h 95% o f fishermen f r o m the first survey t h o u g h t t ha t
W I R had establ ished t he reserves to pro tec t the coral reef
ecosys tem o r increase fish stocks, o n l y 6 fami l ies f r o m the second
survey be l ieved th is , and 4 fami l ies t h o u g h t i t was pu re l y for
tour is ts ' benef i t . One f am i l y a d d i t i o n a l l y c o m m e n t e d t h a t there had
been no a n n o u n c e m e n t s f r o m the ho te l . In a survey c o n d u a e d w i t h
o w n e r s o f p r i va te reserves o n l and in Costa Rica, i t was de te rm ined
120 P. Svensson ei al. / Ocean ff Coasial Management 53 (2010) 114-122
t ha t a sense o f conse rva t i on e th i c was the most p o w e r f u l m o t i v a t i n g fo rce t o es tab l i sh ing p r iva te reserves, fo l l owed by p ro f i t 1331-The m a i n c o n c e r n fo r the o w n e r s o f WIR . w h e n the reserves w e r e es tab l ished was . and is. p ro tec t i ng the coral reef ecosystem, h i gh l i gh ted by t he fact that t h e y have not adver t ised the reserves to tour is ts . I t seems, however , t ha t a m o r e w idespread and d i rec t a n n o u n c e m e n t by t he ho te l w h e n p l a n n i n g the reserves w o u l d have been p re fe r red by local fishermen, in o rde r to g ive t h e m a sense o f i n v o l v e m e n t and to man i fes t thei r pos i t ion as s takeho lders , w h e r e t h e i r o p i n i o n s and concerns are taken i n t o cons id e ra t i on . M o r e g o v e r n m e n t i n v o l v e m e n t , educat ion and awareness p r o g r a m s c o n c e r n i n g the benef i ts o f m a r i n e reserves, as w e l l as regu la r upda tes o n reserve progress, w o u l d also have been app re c ia ted a f te r t he reserve was es tab l ished (Fig. 3). Such regular c o m m u n i c a t i o n s w i t h the ad jacent c o m m u n i t i e s w o u l d have i n f o r m e d fishermen o f the conservar ion efforts the ho te l is u n d e r t a k i n g , and p r o v i d e d t he o p p o r t u n i t y for open debate o n h o w the ho te l and local c o m m u n i t i e s cou ld w o r k toge ther to achieve m u t u a l goals.
Fishers' lack o f educa t i on and k n o w l e d g e of mar ine reserves as a m e t h o d o f sus ta in ing hab i ta ts and near-shore fisheries in the l o n g - t e r m has been recognized in areas o f the Ph i l ipp ines 114|. Once an MPA has been des ignated, p rov i d i ng m o r e i n f o r m a t i o n abou t regu la t i ons and sc ient i f ic resul ts has s h o w n to increase local s takeho lde rs ' f ee l i ng o f pa r t i c i pa t i on , s ign i f icant ly increas ing c o m p l i a n c e | 3 l | . In a c o m p l i a n c e analysis w i t h fishermen i n the Galapagos M a r i n e Reserve, boat o w n e r s ' percept ion o f the leg i t i macy o f regu la t i ons was a m a j o r i n f l uence for comp l i ance | 34 | . suggest ing t h a t t he adherence to no -poach ing regu la t ions for an H M M R w o u l d be be t te r accepted w i t h a m o r e notab le presence of a respected body , such as t he local g o v e r n m e n t . Str ict and w e l l -c o n t r o l l e d reserve boundar ies w e r e also recognized by several fishermen as a necessary ac t ion to increase comp l iance . Aswan i et a l . | 1 5 | i n t e r v i e w e d fishermen f r o m c o m m u n i t i e s ad jacen t to reserves in t he S o l o m o n Is lands and found tha t w h i l e good e n f o r c e m e n t equa l l ed less poach ing , the percept ions o f MPA en"ectiveness was also d i r ec t l y co r re la ted w i t h the level of e n f o r c e m e n t . The costs o f e n f o r c e m e n t mus t , however , be l o w e r t h a n ga ins a t t r i b u t e d to y ie lds f r o m unpro tec ted areas d u e to sp i l l over 116].
Today, p o a c h i n g at W I B is v e r y rare. This has led to reduced e n f o r c e m e n t . There has no t been a need t o contact the coast guard in several years, so e n f o r c e m e n t is n o w solely con t ro l l ed by the secur i t y o f f i c e r s / n i g h t - t i m e reserve wa rdens . It is genera l ly su f f i c ien t t o sh ine a b r i g h t l i gh t o n fishing boats encroach ing o n reserve bounda r i es to de te r t h e m f r o m any fishing act iv i t ies. Somet imes , t he qu ie te r and m o r e concea led b a m b o o basket boats m a y s l ip by. bu t t h e n less ex t rac t i ve hook and l ine fishing is used. W h i l e these occur rences are re la t i ve ly se l dom, and t he a m o u n t o f fish caugh t is l i m i t e d by t h e i r fishing techn ique , c o n t i n u e d non -comp l i ance cou ld be q u i t e h a r m f u l and shou ld no t be unde res t ima ted . Van Z w e i t e n et al . | 3 5 | es r ima ted tha t basket boat fishing cou ld con t r i bu te to one qua r te r o f t he to ta l ca tch o f the inshore fishery in N a m D i n h p rov ince . V i e t n a m . Howeve r , b io log ica l surveys conduc ted f r o m 2 0 0 5 t o 2007, research ing t he size o f fish, fish dens i t y and species r ichness, s t i l l c o n f i r m s ign i f i can t l y h igher fish assemblages w i t h i n t he reserves c o m p a r e d to unp ro tec ted areas |211- Spi l lover was not researched d u r i n g these b io log ica l surveys, but accord ing to the m a j o r i t y o f t he fishermen f r o m b o t h surveys w h o fish w i t h i n 2 0 0 m o f t he reserve boundar ies , the H M M R s are increasing the number , size o r species richness o f fish and p r o v i d i n g spi l lover of, amongs t o the rs , large f o o d fishes (e.g. Serran idae and Carangidae: Fig. 3).
W h e n asked w h e t h e r they had ever been ins ide the reserves, 68% o f fishermen f r o m the first survey ind icated tha t t hey had. These suggested tha t t he n u m b e r o f f i s h and inver tebrates, species
r ichness and cora l cover was h igher in the reserves compared to ad jacen t unp ro tec ted areas. F ishermen f r o m the second survey s t rong ly re fu ted tha t they ever cross reserve boundar ies , be ing conce rned o f po ten t ia l repercussions (Table 1). A l t h o u g h enforcem e n t is n o w re la t i ve ly w e a k , s t rong en fo rcemen t in t he past by the local coast guard has ingra ined in t h e m k n o w l e d g e tha t the expec ted loss f r o m de tec t ion o u t w e i g h s possib le gains f r o m poach ing . Th is has been descr ibed as e f f i c ien t en fo rcemen t I IS). W h i l e these fishing fami l ies there fore no longer fish w i t h i n the reserves, a fee l ing o f a n i m o s i t y towards t he ho te l has g r o w n , w h i c h c o u l d perhaps have been avo ided , had the ho te l o w n e r s c o m m u n ica ted better , descr ibed to the fishing c o m m u n i t y the po ten t ia l l o n g - t e r m benef i ts o f MPAs and i nvo l ved local representat ives in the dec is ion m a k i n g process f r o m the start .
O n l y one fisherman f r o m the first survey ac tua l ly a d m i t t e d to somer imes fishing in the reserves, w h i c h p r o m p t s the ques t ion h o w al l the o the r 2 6 fishermen f r o m the first survey can ma in ta i n tha t fish and coral assemblages are h igher in the reserves compared w i t h unp ro tec ted areas. E ight of these fishermen no ted that they n o w have secure j obs , bu t i t is no t k n o w n w h e t h e r these secured jobs are pos i t ions w i t h i n WIR . The rema inde r d i d not c o m m e n t , so i t is unc lear w h e t h e r al l the fishermen had a l eg i t ima te reason for k n o w i n g t he status o f coral and fish assemblages in t he reserves, i f t hey w e r e j u s t t r y i n g to be he lp fu l by answer ing the ques t ion , ra the r than saying " d o n t k n o w " , o r i f they w e r e no t comp le te l y t r u t h f u l w h e n m a i n t a i n i n g they do no t fish there . It is unders tandable tha t even in a n o n y m o u s surveys, people d o not w i s h to imp l i ca te themse lves o r f am i l y in i l legal act iv i t ies. A m o r e t r u t h f u l and accurate a n s w e r may have been a t ta ined by chang ing the w o r d i n g o f the comp l i ance ques t ion to " w h e t h e r they k n o w of other people w h o fish w i t h i n the reserves ' , as was done by Cinner et a l . 136| to assess the comp l i ance o f a c losure at Ahus Is land. Papua New Guinea.
Qu i t e a large n u m b e r o f fishermen f r o m the first survey stated tha t t h e i r year iy i n c o m e had increased thanks to t he hote l (41%) and ove r ha l f o f these suggested tha t it was because o f secured jobs or o t h e r re lated service indus t r ies (Fig. 3) . Membe rs o f these fishing fami l ies cou ld have pos i t ions w i t h the ho te l , t hey cou ld be de l i v e r i n g resources to t he ho te l , o r t hey cou ld have establ ished o ther services c red i ted to the increas ing repu ta t i on o f the hote l and the resu l r ing t o u r i s m g r o w t h . They cou ld also s imp l y be be t te r o f f now. due t o a cons tan t supp ly o f sp i l lover o f fish f r o m the reserves. Un fo r t una te l y , w i t h o u t m o r e de ta i led c o m m e n t s , th is is no t poss ib le to d e t e r m i n e . A l l fishermen f r o m the second survey c l a i m e d a decrease i n i n c o m e since reserve i naugu ra t i on (Table 1). Ha l f t h e fishing fami l ies c o m m e n t e d , and these b lame the hote l for t h e i r decreased catches, suggest ing tha t the n u m b e r o f avai lable fishing g rounds have been s t r i pped away f r o m t h e m . One fam i l y a rgued that , w h e r e they once had 5 beaches to fish by beach se in ing , t hey n o w o n l y have 3. Since t h e i r fishing vessels are not large, the i r possible fishing g rounds are l i m i t e d in d istance.
I t has been suggested tha t larger m a r i n e reserves may be bet ter for b io log ica l reasons, bu t t ha t smal ler no - take areas are genera l ly be t te r accepted by local c o m m u n i t i e s as they d o no t s ign i f icant ly a f f e a the i r soc ioeconomic we l f a re |37 | . W h i l e theore t ica l ly t rue , local fishing techn iques m u s t be taken i n to account w h e n establ i sh i ng H M M R s . The loss o f t w o beaches o u t o f 5 ser ious ly imp inges on t h e i r ab i l i t y to secure resources for surv iva l .
Several fami l ies suggested tha t the ho te l o r g o v e r n m e n t cou ld give financial s u p p o r t to invest i n lobster aquacu l tu re . or bet ter boats and e q u i p m e n t , in o r d e r for t h e m to be able to ex tend the i r fishing area. A t least six fami l ies o u t o f bo th surveys par take in lobster f a rm ing . The hote l o r g o v e r n m e n t cou ld p rov ide financial aid t o suppor t lobster aquacu l tu re . bu t consequences cou ld be d i re i f a d d i t i o n a l funds are no t invested in qua l i t y feed. Mos t fishermen

p. Svensson et al. / Ocean €r Coastal Management 53 (20i0) 114-122 121
cur ren t l y p rov ide trash f ish, m ixed w i t h l o w value crustaceans, increasing the l i ke l i hood o f in fec t ion. Th is results in cop ious amoun ts o f ant ib io t ics be ing used, w h i c h , in c o m b i n a t i o n , cou ld ser iously increase nu t r i f i ca t ion and h a r m the e n v i r o n m e n t , especia l ly in areas o f l o w wa te r c i rcu la t ion (38 | .
Open access fishing has been depic ted as a last resort for surv iva l in t imes o f economic crisis 139]. but w h e n over f i sh ing has been the constant for a long r ime , even fishing may not be e n o u g h for surv iva l . The b ionomic e q u i l i b r i u m is reached w h e n a susta inable h u m a n popu la t i on is surpassed, i nduc ing over f i sh ing , and f ish ing ef for ts have reduced the fish popu la t ion to a level at w h i c h catch rates are barely suf f ic ient to cover the costs of f i sh ing [ 18|. It seems that th is e q u i l i b r i u m cou ld be near, since 23% o f the fishermen f r o m the first survey and 2 fishing fami l ies earn less than the in te rna t iona l pover ty l ine of USS 1 (VND 15.600) per day ( |40|: Table I ) . Ha l f o f these are. however , the very o ld or the very young , w h o w i l l be taken care o f in the i r large, closely kn i t t ed , ex tended fami l ies .
Un l ike many deve loped count r ies , the fami l ies o f deve lop ing count r ies are o f ten qu i te large, o f ten i nc lud ing the ex tended fam i l y that l ive and w o r k together to suppor t al l members . For th i s reason, it was d i f f i cu l t to get i nd i v idua l fishermen responses to t he surveys conducted and w h y it is qu i te probable that 15 responses f r o m the f irst survey can be traced back to t w o fami l ies . For t he second survey, it p roved ex t reme ly d i f f i cu l t to i n t e r v i ew one fisherman at a l ime , since everyone wan ted to l isten and hear wha t t he w h i t e fore igner wan ted in the i r smal l v i l lage. This is w h y the co l lec t ive op in ions o f all membe rs of the fami ly ( 4 0 - 5 0 ind iv idua ls ) we re taken in to account. A possible m e t h o d to i m p r o v e the accuracy o f the results of th is s tudy w o u l d invo lve quest ionna i res be ing d is t r ibu ted to each fisherman as they w e r e re tu rn ing w i t h the i r catch, w i t h t rans lators o n hand to aid the i l l i terates. This may have Increased the n u m b e r o f i nd i v idua l responses and avoided respected fam i l y elders in f luenc ing younger fami ly m e m b e r s ' responses. In V i e t n a m , ancestor w o r s h i p h igh l y Inf luences the cu l tu re and men ta l i t y o f the people. Ch i ld ren are taught f r o m a young age that they o w e eve ry th ing to the i r parents and ancestors [41]. As a result , younger generat ions have p ro found respect for the i r parents and elders, suggest ing they may be m o r e l i ke ly swayed by the i r op in ions in the i r presence. This Inev i tab ly biases such fami ly g roup results.
W h i l e 9 out o f 10 fami l ies imp l i ed tha t WIR had had a n overa l l negat ive effect o n the i r l ives. 39% f r om the first survey t hough t the opposi te (Table 1). The reasons for these di f ferences cou ld be man i fo ld . The beach se in ing fishing technique also used by several o f the fami l ies i n te rv iewed decreases the i r potent ia l to catch enough fish, since t w o o f five beaches have been occupied by WIR. Also, as a result o f th is dest ruc t ive , non-se lect ive catch m e t h o d , the hote l does not buy fish f r o m t h e m for guests. The oppos i te may also be t rue for fishermen f r o m the first survey, since more o f t h e m have larger boats, enabl ing t h e m to fish ou ts ide the channe l , w h e r e they can target tuna and o the r larger predatory fish, w h i c h the ho te l w i l l mo re readi ly purchase (Fig. 2). These fishermen may consequent ly not be as dependen t o n near-shore fishing as the poorer fishermen f r o m the second survey, suggest ing they may nor have had any d i f f i cu l t ies w i t h the local coast guard in the first years af ter the reserve was establ ished, un l i ke some o f the fishing fami l ies, w h o may there fore be ha rbou r ing i l l feel ings towards the hotel owners .
More pos i t ive and s u p p o r t i n g responses f r o m the fishermen o f the first survey w i t h regards to the H M M R s and the ques t ion w h e t h e r they w o u l d w e l c o m e more reserves to the area may also have been In f luenced by the Cha i rman of the People's Commi t t ee . He may have d i s t r i bu ted the quest ionnai res to f r iends or fami l ies he knew, perhaps even to people w h o w o r k for. or w h o supp ly the hote l w i t h the i r catch (po ten t i a l l y exp la in ing the c o m m e n t s f r o m some fishermen, exp la in ing they have secure j obs : Fig. 3). or w h o
may w e l l be 'wea l th ie r ' fami l ies , o w n i n g larger vessels and w h o . are there fore , less near-shore d e p e n d e n t . He w i l l perhaps also have to ld t h e m w h a t he k n o w s abou t t he hote l , its reserves and the research be ing conduc ted , w h i c h w o u l d great ly in f luence these fishermen's a t t i t udes and responses.
In account o f such unce r ta in t y , it is i m p o r t a n t to bear In m i n d possible biases to cer ta in responses f r o m the first surveyed fishe r m e n a n d / o r to cons ider a m is rep resen ta t i on o f the op in ions o f the larger c o m m u n i t y . A lbe i t , t h e results do suggest posi t ive a t t i tudes t owa rds the H M M R s a n d towards es tab l ish ing more protected areas in a subg roup o f the c o m m u n i t y , but w i t h o u t ve r i f y i ng the percept ions o f a la rger p o p u l a t i o n . It m a y be too soon to c o n f i r m the ef fect iveness o f H M M R s f r o m a soc ioeconomic po in t o f v iew .
6. Conc lus ion
The m a j o r i t y o f the local fishermen have no t i ced a decrease in fish popu la t i ons ove r t he last decade. They recognize the need to p ro tec t cora l ree f ecosystems, espec ia l l y In today 's s i tua t ion w h e r e be t te r fishing techn iques are ava i lab le ; p o p u l a t i o n g r o w t h has led to o v e r f i s h i n g , and w h e r e a r e m a i n i n g des t ruc t i ve m i n o r i t y s t i l l use blast fishing. A large p r o p o r t i o n o f fishermen have de tec ted sp i l l ove r o f fish f r o m the reserve, i n c l u d i n g c o m m e r c i a l l y va luab le g r o u p s o f la rge food fishes: and prev ious b io log ica l surveys c o n f i r m s i gn i f i can t l y h igher fish stocks w i t h i n t he p ro tec t i on | 2 l |. Moreove r , in a su rvey conduc ted w i t h 211 WIR guests . Svensson et a l . | 2 2 | f o u n d tha t 97.5% s u p p o r t H M M R s and 86.3% w o u l d be w i l l i n g t o pay ex t r a to stay at such hotels. These findings suggest t ha t t h i s H M M R has ach ieved its ecological ob jec t i ves and has the guests" s u p p o r t . A f o l l o w - u p s tudy to c o n f i r m fishers' pe rcep t i ons o f sp i l lover , howeve r , w o u l d be p r u d e n t , s ince cu r ren t l y , t he socia l and economic benef i ts to local fishermen arc a m b i v a l e n t , and d e p e n d m a i n l y o n t he target fishery. M o r e d i rec t and w i d e s p r e a d c o m m u n i c a t i o n , i nvo lve m e n t , educa t ion and financial s u p p o r t f r o m the ho te l cou ld make th is H M M R t r u l y e f fec t i ve ly m a n a g e d . By pay ing g rea ter a t t en t i on to d e v e l o p i n g and m a i n t a i n i n g a m u t u a l l s t i c r e l a t i onsh ip w i t h a f fec ted c o m m u n i t i e s . H M M R s c o u l d real ize a great po ten t i a l as an added a l t e rna t i ve to t r a d i t i o n a l l y managed MPAs. especia l ly i f the g o v e r n m e n t w o u l d s h o w a g rea te r presence by a i d i n g in su rve i l l ance , m o n i t o r i n g and d e v e l o p i n g a p p r o p r i a t e managem e n t and po l i cy f r a m e w o r k s , t h e r e b y c o n f i r m i n g the leg i t imacy o f the H M M R s and s u b s t a n t i a t i n g its suppo r t fo r t h e m as an i m p o r t a n t m a r i n e conse rva t i on t o o l . A n e t w o r k o f h u n d r e d s to thousands o f such H M M R s l i n i n g coasta l t rop ica l coun t r ies cou ld have a c u m u l a t i v e pos i t i ve e f fec t o n fish and cora l g r o w t h by p r o v i d i n g re fug ia at va r ious d is tances for adu l t , larval and p rop -agu le d ispersa l and s e t t l e m e n t (42 .43 | .
These c o m m u n i t y surveys p r o v i d e first ind ica t ions o f the s t rengths and weaknesses o f t h e managemen t o f an H M M R . However , an Ind i v i dua l , s ingular , i n te rv iew-based survey design, i nvo l v i ng a larger sample size w o u l d give an i m p r o v e d unders tand ing o f the m a n a g e m e n t ef fect iveness o f the H M M R . Future studies o f th is k i nd cou ld be used to he lp gauge management pe r fo rmance and reserve e f fec t iveness for a vast n u m b e r of c o m m u n i t y and g o v e r n m e n t m a n a g e d MPAs w o r l d w i d e .
References
Ml Robens CM. Hawkins J P. Cell FR. The role of marine reserves in achieving sustainable fisheries. Philosophical Transjciions of the Royal Society B-Bio-logical Sciences 2005:360( 1453): 123-32.
121 Russ CR. Alcala AC, Maypa AP. Spillover from marine rc.wrvcs: the case of Naso vlamingii at Apo Island, the Philippines. Marine Ecology Progress Series 2003:264:15-20.

A u i f n o r s p e r s o n a l c o p y
122 P. Svmsson et aL / Ocean 6r Coastal Management 53 (2010) 114-122
131 Bohnsack JA. Applicaiion of marine reserves to reef fisheries managemenL Australian Journal of Ecology 1998:23[3):298-304.
14] Halpem BS. Vitamer RR. Marine reserves have rapid and lasting efTeos. Ecology Letters 2002:S(3):36l -6.
| 5 | Boersma PD. Parrish JK. Limiting abuse: marine proteaed areas, a limited solution. Ecological Economics 1999;31(2):287-304.
| 6 | Davis D. Tisdell C Economic management of recreational scuba diving and the environment Journal of Environmental Management 1996:48(3):229-48.
|7I Hilbom R. Stokes K, Maguire JJ, Smith T. Botsford LVJ, Mangel M. et al. When can marine reserves improve fisheries managemem? Ocean 8f Coastal Management 2004:47(3-4): 197-205.
|8 | Russ CR. Alcala A C Do marine reserves expon adult fish biomass? Evidence from Apo Island, central Philippines. Marine Ecology Progress Series 199G:132(l-3): l-9.
|91 Russ CR. Alcala A C Maypa AP, Calumpong HP. White AT. Marine reserve benefits local fisheries. Ecological Applications 20O4:I4(2):S97-606.
110| Jones KMM. Home range areas and aaivi ty centres in six species of Caribbean wrasses (Ubridae). Journal of Fish Biology 2005:66( l):150-66.
1111 Jones CP. Planes S. Thorrold SR. Coral reef fish larvae settle close to home. Current Biology 2005:15(14):1314-8.
1121 Kritzer JP. Effects of noncompliance on the success of aUemative designs of marine protectcd-area networks for conservation and fisheries management Conservation Biology 2004:18(4): 1021-31.
113] Wells M. McShane TO. integrating proteaed area management with local needs and aspirations. Ambio 2004:33(8]:S13-g.
1141 White AT. Vogt HP. Philippine coral reefs under threat lessons learned after 25 years of community-based reef conservation. Marine Pollution Bulletin 2000:40C6):537-50.
1151 Aswan! S, Albert S, Sabetian A. Furusawa T. Customary management as precautionary and adaptive principles for protecting coral reefs in Oceania. Coral Reefs 2007:26:1009-21.
|16| Sethi SA. Hilbom R. Interactions between poaching and management policy affect marine reserves as conservation tools. Biological Conservation 2008:141(2):506-16.
1171 McClanahan TR. Is there a future for coral reef parks in poor tropical countries? Coral Reefs 1999:18(4):321-5.
1181 Beddington JR, Agnew DJ. Oark CW. Current problems in the management of marine fisheries. Science 2007:316(5832): 1713-6.
1191 Roberts CM. Andelman S. Branch C . Bustamante RH. Castilla JC. Dugan J. et al. Ecological criteria for evaluating candidate sites for marine reserves. Ecological Applications 2003:13(1): 199-214.
|201 Kiss A. Is community-based ecotourism a good use of biodiversity conservation funds? Trends in Ecology & Evolution 2004:l9(S):232-7.
|211 Svensson P. Rodwell LD. Attrill MJ. Privately managed marine reserves as a mechanism for the conservation of coral reef ecosystems: a case study from Vietnam. Ambio 2009:38(2):72-8.
|22 | Svensson P. Rodwell LD. Attrill MJ. Hotel managed marine reserves: a willingness to pay survey. Ocean & Coastal Management 200S:51(12):854-61.
|23 | Burke U Selig E. Spalding M. Reefs at risk in southeast Asia. WoT\d Resources Institute: 2002. 72 pp.
(24) LangholzJA. Ussoie JP. Perils and promise of privately owned proteaed areas. Bioscience 2001:51(12):l079-85.
125) Wakatobi Dive Resort. Conservarion. a new approach. Available at: hup:/ / www.wakatobi.com (accessed 20.06.08|.
[261 Ministry of agriculture and rural development Available a t Hanoi. Vietnam: Fisheries Informatics Centre (FlC). Available at: www.fiscenet.gov.vn: 2008 laccessed 23.05.09).
|27) U m T O T Vietnamese fishing in uoubled waters. Asia Times. Available at: http:/ /www.aumes.com/aiimes/Sourheast_Asia/GE25Ae01.html: 2005 laccessed 25.07.08).
128) Pomeroy R. Nguyen KAT Thong HX. Small-scale marine fisheries policy in Vietnam. Marine Policy 20O9:33(2):419-28.
129) Stobutzki I C Silvestre CT. Carces LR. Key issues in coastal fisheries in South and Southeast Asia, outcomes of a regional initiative. Fisheries Research 2006:78(2-3):109-18.
|30| Long Nguyen. Small-scale fisheries management in Vietnam. In: Asia-Pacific Fishery Commission. Interactive mechanisms for small-scale fisheries management - report of the regional consultation 2002.
|31) General Staustics Office of Vietnam (CSO). Agriculture, forestry and fishery. 2008 Statistics Handbook. Available at: www.gso.gov.vn: 2009 [accessed 20.05.09).
132) Adger WN. Kelly PM. Ninh NH. Living with environmental change, social vulnerability, adaptation and reslience in Vietnam. Great Britain: Routledge Research Global: 2001. 314 pp.
|33| Langholz JA. Lassoie JP. Lee D, Chapman D. Economic considerations of privately owned parks. Ecological Economics 2000:33(2): 173-83.
134) Viteri C Chavez C. Legitimacy, local participaiioa and compliance in the Galapagos Marine Reserve. Ocean and Coastal Management 2007:50(3-4): 253-74.
(351 van Zwieten PAM. van Densen WLT, Van Thi D. Improving the usage of fisheries statisrics in Vietnam for produaion planning, fisheries management and nature conservation. Marine Policy 2002:26(1): 13-34.
136| Cinner JE. Mamane MJ. McCanahan TR. Conservation and community benefits from traditional coral reef management at Ahus Island. Papua New Guinea. Conservation Biology 2005:19(6): 1714-23.
|371 Unswonh RKF. Povrell A. Hukom F, Smith DJ. The ecology of Indo-Pacific grouper (Serranidae) species and the effects of a small scale no take area on grouper assemblage, abundance and size frequency distribution. Marine Biology 2007:152(2):243-54.
|381 lUCN. Improving local livelihoods through sustainable aquaculturc in Hon Mun marine protected area. Nha Trang Bay. Vietnam. A report to the collaborative APEC Grouper Research and Development Network (FWG/01/2001) . lUCN Viemam Program. The Streamer Initiative. Network of aquaculture centres in Asia-Pacific (NACA). Bangkok: 2003 {192 pp).
|391 Bene C Tewfik A. Biological evaluation of marine proteaed area: evidence of crowding effea on a proteaed population of queen conch in the Caribbean. Marine Ecology Pubblicazioni Delia Stazione Zoologica Di Napoli [ 2003:24(1 ):45-58.
(40) lUCN Vietnam country programme. The lUCN Vietnam intersessional programme 2005-2008. lUCN: 2003. 32 pp.
(41) Viemam-culture.com. Family life. Available at: http://www.vietnam-culiure. com (accessed 28.04.09).
|42) Roberts CM. Bohnsack JA. Cell F. Hawkins JP. Coodridge R. Effects of marine reserves on adjacent fisheries. Science 2001:294(5548): 1920-3.
(431 Dawson MN. Grosberg RK. Botsford LW. Connectivity in marine proteaed areas. Science 2006:313(5783):43-4.