2021-June-Mineral-Resources-Ore-Reserves-Statement ...
220
Hong Kong Exchanges and Clearing Limited and The Stock Exchange of Hong Kong Limited take no responsibility for the contents of this announcement, make no representation as to its accuracy or completeness and expressly disclaim any liability whatsoever for any loss howsoever arising from or in reliance upon the whole or any part of the contents of this announcement. MMG LIMITED 五礦資源有限公司 (Incorporated in Hong Kong with limited liability) (STOCK CODE: 1208) MINERAL RESOURCES AND ORE RESERVES STATEMENT AS AT 30 JUNE 2021 This announcement is made by MMG Limited (Company or MMG and, together with its subsidiaries, the Group) pursuant to rule 13.09(2) of the Rules Governing the Listing of Securities on The Stock Exchange of Hong Kong Limited (Listing Rules) and the Inside Information Provisions (as defined in the Listing Rules) under Part XIVA of the Securities and Futures Ordinance (Chapter 571 of the Laws of Hong Kong). The Board of Directors of the Company (Board) is pleased to report the Group’s updated Mineral Resources and Ore Reserves Statement as at 30 June 2021 (Mineral Resources and Ore Reserves Statement). The key changes to Mineral Resources and Ore Reserves Statement as at 30 June 2021 are: • The Group’s Mineral Resources (contained metal) have decreased for copper (6%), zinc (1%), molybdenum (8%), silver (0.1%) and gold (3%). Lead (0.4%) and cobalt (0.4%) have increased slightly from 2020. • The Group’s Ore Reserves (contained metal) have decreased for copper (5%), zinc (8%), lead (2%), silver (3%), gold (9%) and molybdenum (8%). For copper metal, the main reasons for changes are depletion at all sites which is partly offset by a small increase in metal price assumption. Reductions at Las Bambas are mostly due to negative impacts of costs and cut off grade adjustments which are only partially offset by positive movements in metal prices. At Dugald River, the change to the geological model of the Inferred copper lens, due to improvements in orebody knowledge, has resulted in a negative variance. Mining and milling depletion accounts for approximately 64% of the total decrease from 2020 Mineral Resources and 68% for Ore Reserves. For zinc metal, the main reasons for the changes are depletion at all sites which is partially offset by additional tonnes from known lenses at Rosebery and Dugald River. Continuing exploration at both Australian sites has partially replaced depletion over the last 12 months. Open Pit Oxide Ore Reserves at Kinsevere have been exhausted, with oxide and mixed ore stockpiles remaining in Ore Reserves. All data reported here are on a 100% asset basis, with MMG’s attributable interest shown against each asset within the Mineral Resources and Ore Reserves tables (pages 4 to 8).
-
Upload
khangminh22 -
Category
Documents
-
view
0 -
download
0
Transcript of 2021-June-Mineral-Resources-Ore-Reserves-Statement ...

Hong Kong Exchanges and Clearing Limited and The Stock Exchange of Hong Kong Limited take no responsibility
for the contents of this announcement, make no representation as to its accuracy or completeness and expressly
disclaim any liability whatsoever for any loss howsoever arising from or in reliance upon the whole or any part
of the contents of this announcement.
MMG LIMITED
五礦資源有限公司
(Incorporated in Hong Kong with limited liability)
(STOCK CODE: 1208)
MINERAL RESOURCES AND ORE RESERVES STATEMENT AS AT 30 JUNE 2021
This announcement is made by MMG Limited (Company or MMG and, together with its subsidiaries, the Group)
pursuant to rule 13.09(2) of the Rules Governing the Listing of Securities on The Stock Exchange of Hong Kong
Limited (Listing Rules) and the Inside Information Provisions (as defined in the Listing Rules) under Part XIVA
of the Securities and Futures Ordinance (Chapter 571 of the Laws of Hong Kong).
The Board of Directors of the Company (Board) is pleased to report the Group’s updated Mineral Resources
and Ore Reserves Statement as at 30 June 2021 (Mineral Resources and Ore Reserves Statement).
The key changes to Mineral Resources and Ore Reserves Statement as at 30 June 2021 are:
• The Group’s Mineral Resources (contained metal) have decreased for copper (6%), zinc (1%),
molybdenum (8%), silver (0.1%) and gold (3%). Lead (0.4%) and cobalt (0.4%) have increased slightly
from 2020.
• The Group’s Ore Reserves (contained metal) have decreased for copper (5%), zinc (8%), lead (2%), silver
(3%), gold (9%) and molybdenum (8%).
For copper metal, the main reasons for changes are depletion at all sites which is partly offset by a small
increase in metal price assumption. Reductions at Las Bambas are mostly due to negative impacts of costs
and cut off grade adjustments which are only partially offset by positive movements in metal prices. At Dugald
River, the change to the geological model of the Inferred copper lens, due to improvements in orebody
knowledge, has resulted in a negative variance. Mining and milling depletion accounts for approximately 64%
of the total decrease from 2020 Mineral Resources and 68% for Ore Reserves.
For zinc metal, the main reasons for the changes are depletion at all sites which is partially offset by additional
tonnes from known lenses at Rosebery and Dugald River. Continuing exploration at both Australian sites has
partially replaced depletion over the last 12 months.
Open Pit Oxide Ore Reserves at Kinsevere have been exhausted, with oxide and mixed ore stockpiles remaining
in Ore Reserves.
All data reported here are on a 100% asset basis, with MMG’s attributable interest shown against each asset
within the Mineral Resources and Ore Reserves tables (pages 4 to 8).
MMG Limited
MINERAL RESOURCES AND ORE RESERVES STATEMENT
30 June 2021
MMG | 2021 Mineral Resources & Ore Reserves Statement Page 2 of 15
MINERAL RESOURCES AND ORE RESERVES STATEMENT
A copy of the executive summary of the Mineral Resources and Ore Reserves Statement is annexed to this
announcement.
The information referred to in this announcement has been extracted from the report titled Mineral Resources
and Ore Reserves Statement as at 30 June 2021 published on 28 October 2021 and is available to view on
www.mmg.com. The Company confirms that it is not aware of any new information or data that materially affects
the information included in the Mineral Resources and Ore Reserves Statement and, in the case of estimates of
Mineral Resources or Ore Reserves, that all material assumptions and technical parameters underpinning the
estimates in the Mineral Resources and Ore Reserves Statement continue to apply and have not materially
changed. The Company confirms that the form and context in which the Competent Person’s findings are
presented have not been materially modified from the Mineral Resources and Ore Reserves Statement.
By order of the Board
MMG Limited
Gao Xiaoyu
CEO and Executive Director
Hong Kong, 28 October 2021
As at the date of this announcement, the Board comprises eight directors, of which one is an executive director,
namely Mr Gao Xiaoyu; four are non-executive directors, namely Mr Guo Wenqing (Chairman), Mr Jiao Jian, Mr
Xu Jiqing and Mr Zhang Shuqiang; and three are independent non-executive directors, namely Dr Peter William
Cassidy, Mr Leung Cheuk Yan and Mr Chan Ka Keung, Peter.

MMG Limited
MINERAL RESOURCES AND ORE RESERVES STATEMENT
30 June 2021
MMG | 2021 Mineral Resources & Ore Reserves Statement Page 3 of 15
EXECUTIVE SUMMARY
Mineral Resources and Ore Reserves for MMG have been estimated as at 30 June 2021 and are reported in
accordance with the guidelines in the 2012 Edition of the ‘Australasian Code for Reporting of Exploration
Results, Mineral Resources and Ore Reserves (2012 JORC Code) and Chapter 18 of the Listing Rules. Mineral
Resources and Ore Reserves tables are provided on pages 4 to 8, which include the 30 June 2021 and 30 June
2020 estimates for comparison. The Measured and Indicated Mineral Resources are inclusive of those Mineral
Resources that have been converted to Ore Reserves. All supporting data are provided within the Technical
Appendix, available on the MMG website.
Mineral Resources and Ore Reserves information in this statement have been compiled by Competent Persons
(as defined by the 2012 JORC Code). Each Competent Person consents to the inclusion of the information in
this report, that they have provided in the form and context in which it appears. Competent Persons are listed
on page 9.
MMG has established processes and structures for the governance of Mineral Resources and Ore Reserves
estimation and reporting. MMG has a Mineral Resources and Ore Reserves Committee that regularly convenes
to assist the MMG Governance and Nomination Committee and the Board of Directors with respect to the
reporting practices of the Company in relation to Mineral Resources and Ore Reserves, and the quality and
integrity of these reports of the Group.
Key changes to the Mineral Resources (contained metal) since the 30 June 2020 estimate relate to depletion1
at all sites together with increased costs, changes in metal price assumptions, increases to cut-off grades and
updates to the models at all sites. Improvements to the geological model at all sites have resulted in both
increases and decreases of which none are material. Relatively small decreases at Chalcobamba and
Sulfobamba have offset a similar magnitude increase at Ferrobamba. A decrease in the Inferred copper lens
at Dugald River has resulted from continuing improvements in orebody knowledge. There are no material
changes at Kinsevere or the regional DRC copper deposits. Zinc metal increased slightly after depletion at
Rosebery while at Dugald River the net reduction is mostly due to depletion.
Key changes to the Ore Reserves (contained metal) since the 30 June 2020 estimate are mostly related to
depletion1. Chalcobamba South West zone has been added to the Chalcobamba Ore Reserves at Las Bambas
for the first time. Increased costs have driven cut off grades higher at Las Bambas which have had a small
negative impact on the results. Illegal artisanal mining at Sulfobamba has been estimated with 19kt of metal
removed from the Ore Reserves. All insitu open pit material has been excluded from the Kinsevere Ore Reserve
due to the prohibitive cost of low volume mining at the site. At Dugald River, a minor increase (net of depletion)
to Ore Reserves has resulted from prior year focus on Reserve Definition drilling uplifting both tonnes and Zn
grades.
Pages 10 and 11 provide further discussion of the Mineral Resources and Ore Reserves changes.
1 Depletion in this report refers to material processed by the mill and depleted from the Mineral Resources and Ore Reserves through
mining and processing.
MMG Limited
MINERAL RESOURCES AND ORE RESERVES STATEMENT
30 June 2021
MMG | 2021 Mineral Resources & Ore Reserves Statement Page 4 of 15
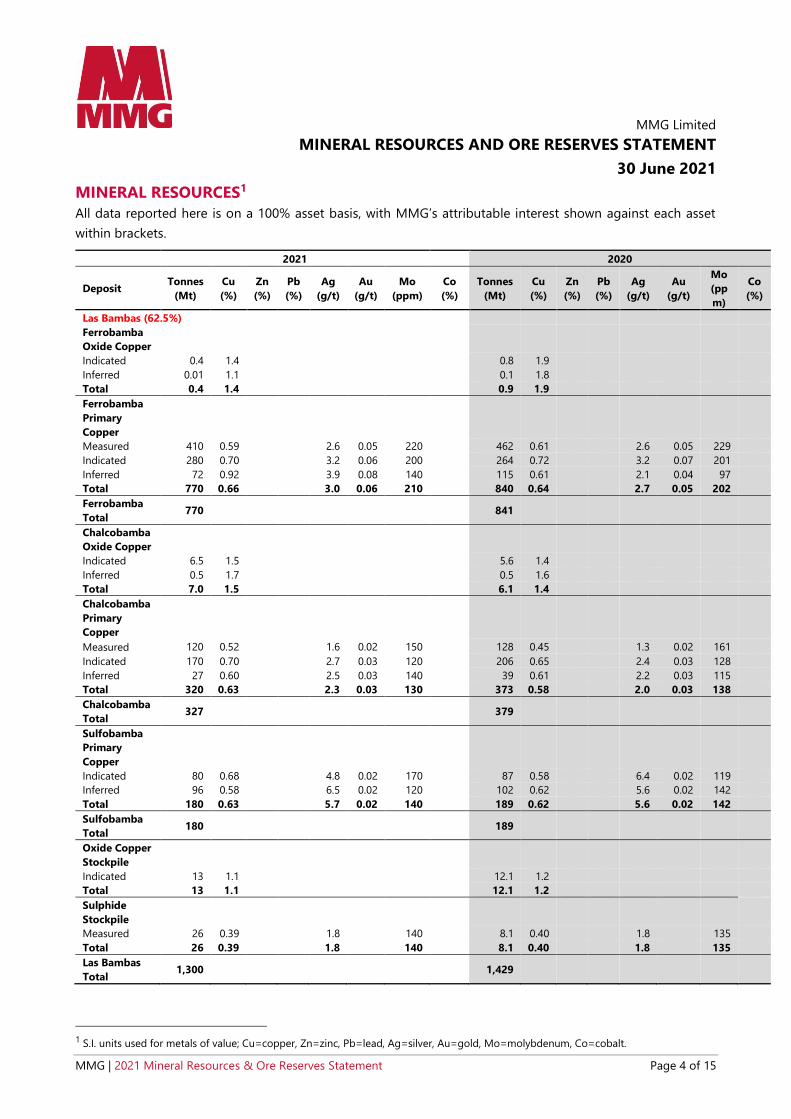
MINERAL RESOURCES1
All data reported here is on a 100% asset basis, with MMG’s attributable interest shown against each asset
within brackets.
2021 2020
Deposit Tonnes
(Mt)
Cu
(%)
Zn
(%)
Pb
(%)
Ag
(g/t)
Au
(g/t)
Mo
(ppm)
Co
(%)
Tonnes
(Mt)
Cu
(%)
Zn
(%)
Pb
(%)
Ag
(g/t)
Au
(g/t)
Mo
(pp
m)
Co
(%)
Las Bambas (62.5%)
Ferrobamba
Oxide Copper
Indicated 0.4 1.4 0.8 1.9
Inferred 0.01 1.1 0.1 1.8
Total 0.4 1.4 0.9 1.9
Ferrobamba
Primary
Copper
Measured 410 0.59 2.6 0.05 220 462 0.61 2.6 0.05 229
Indicated 280 0.70 3.2 0.06 200 264 0.72 3.2 0.07 201
Inferred 72 0.92 3.9 0.08 140 115 0.61 2.1 0.04 97
Total 770 0.66 3.0 0.06 210 840 0.64 2.7 0.05 202
Ferrobamba
Total 770 841
Chalcobamba
Oxide Copper
Indicated 6.5 1.5 5.6 1.4
Inferred 0.5 1.7 0.5 1.6
Total 7.0 1.5 6.1 1.4
Chalcobamba
Primary
Copper
Measured 120 0.52 1.6 0.02 150 128 0.45 1.3 0.02 161
Indicated 170 0.70 2.7 0.03 120 206 0.65 2.4 0.03 128
Inferred 27 0.60 2.5 0.03 140 39 0.61 2.2 0.03 115
Total 320 0.63 2.3 0.03 130 373 0.58 2.0 0.03 138
Chalcobamba
Total 327 379
Sulfobamba
Primary
Copper
Indicated 80 0.68 4.8 0.02 170 87 0.58 6.4 0.02 119
Inferred 96 0.58 6.5 0.02 120 102 0.62 5.6 0.02 142
Total 180 0.63 5.7 0.02 140 189 0.62 5.6 0.02 142
Sulfobamba
Total 180 189
Oxide Copper
Stockpile
Indicated 13 1.1 12.1 1.2
Total 13 1.1 12.1 1.2
Sulphide
Stockpile
Measured 26 0.39 1.8 140 8.1 0.40 1.8 135
Total 26 0.39 1.8 140 8.1 0.40 1.8 135
Las Bambas
Total 1,300 1,429
1 S.I. units used for metals of value; Cu=copper, Zn=zinc, Pb=lead, Ag=silver, Au=gold, Mo=molybdenum, Co=cobalt.

MMG Limited
MINERAL RESOURCES AND ORE RESERVES STATEMENT
30 June 2021
MMG | 2021 Mineral Resources & Ore Reserves Statement Page 5 of 15
MINERAL RESOURCES1
2021 2020
Deposit Tonnes
(Mt)
Cu
(%)
Zn
(%)
Pb
(%)
Ag
(g/t)
Au
(g/t)
Mo
(ppm)
Co
(%)
Tonnes
(Mt)
Cu
(%)
Zn
(%)
Pb
(%)
Ag
(g/t)
Au
(g/t)
Mo
(ppm)
Co
(%)
Kinsevere (100%)
Oxide
Copper
Measured 1.2 3.2 0.11 1.5 3.2 0.10
Indicated 5.5 2.7 0.09 6.1 2.8 0.09
Inferred 2.2 2.1 0.07 2.2 2.2 0.07
Total 8.9 2.7 0.09 9.8 2.7 0.09
Transition Mixed Copper Ore
Measured 0.8 2.0 0.15 0.9 2.1 0.12
Indicated 2.2 2.1 0.12 2.3 2.1 0.08
Inferred 1.1 1.6 0.08 1.1 1.6 0.12
Total 4.1 1.9 0.12 4.3 2.0 0.25
Primary
Copper
Measured 1.5 2.6 0.25 1.5 2.6 0.25
Indicated 19 2.3 0.10 18.7 2.3 0.11
Inferred 9.2 1.7 0.08 9.0 1.8 0.08
Total 29 2.1 0.10 29.3 2.1 0.10
Oxide-TMO Cobalt
Measured 0.02 0.46 0.31 0.03 0.49 0.29
Indicated 0.16 0.35 0.33 0.18 0.33 0.32
Inferred 1.0 0.23 0.32 0.98 0.23 0.32
Total 1.2 0.25 0.32 1.2 0.3 0.32
Primary
Cobalt
Measured 0.01 0.54 0.24 0.02 0.55 0.20
Indicated 0.15 0.57 0.20 0.15 0.57 0.20
Inferred 0.17 0.33 0.25 0.16 0.34 0.25
Total 0.34 0.44 0.22 0.34 0.45 0.22
Stockpiles
Measured
Indicated 16 1.6 15.5 1.6
Total 16 1.6 15.5 1.6
Kinsevere
Total 59 2.0 60.4 2.0
1 S.I. units used for metals of value; Cu=copper, Zn=zinc, Pb=lead, Ag=silver, Au=gold, Mo=molybdenum, Co=cobalt.

MMG Limited
MINERAL RESOURCES AND ORE RESERVES STATEMENT
30 June 2021
MMG | 2021 Mineral Resources & Ore Reserves Statement Page 6 of 15
MINERAL RESOURCES1
2021 2020
Deposit Tonnes
(Mt)
Cu
(%)
Zn
(%)
Pb
(%)
Ag
(g/t)
Au
(g/t)
Mo
(ppm)
Co
(%)
Tonnes
(Mt)
Cu
(%)
Zn
(%)
Pb
(%)
Ag
(g/t)
Au
(g/t)
Mo
(ppm)
Co
(%)
Sokoroshe 2 (100%)
Oxide
Copper
Measured
Indicated 1.7 2.4 0.35 1.9 2.3 0.33
Inferred 0.02 3.4 0.07
Total 1.7 2.4 0.34 1.9 2.3 0.33
Transition Mixed Copper Ore
Measured
Indicated 0.1 0.9 1.50
Inferred 0.2 2.5 0.24
Total 0.3 1.8 0.75
Primary Copper
Measured
Indicated
Inferred 0.67 1.7 0.58 0.83 1.8 0.51
Total 0.67 1.7 0.58 0.83 1.8 0.51
Oxide Cobalt
Measured
Indicated 0.47 0.41 0.56 0.37 0.6 1.03
Inferred 0.10 0.25 0.34
Total 0.57 0.38 0.52 0.37 0.6 1.03
Primary
Cobalt
Measured
Indicated 0.012 0.14 0.34
Inferred 0.004 0.36 0.65 0.10 0.3 0.36
Total 0.016 0.20 0.42
Total 3.3 1.9 0.46 3.2 1.9 0.46
Nambulwa (100%)
Oxide Copper
Measured
Indicated 1.0 2.2 0.11 1.0 2.3 0.12
Inferred 0.09 1.9 0.07 0.1 1.9 0.07
Total 1.1 2.2 0.11 1.1 2.3 0.11
Oxide Cobalt
Measured
Indicated 0.17 0.15 0.27 0.04 0.08 0.40
Inferred
Total 0.17 0.15 0.27 0.04 0.08 0.40
Total 1.3 2.0 0.13 1.1 2.2 0.12
DZ (100%)
Oxide Copper
Measured
Indicated 0.79 2.0 0.13 0.78 2.0 0.12
Inferred 0.04 2.0 0.13 0.04 2.0 0.13
Total 0.82 2.0 0.13 0.82 2.0 0.12
Oxide Cobalt
Measured
Indicated 0.35 0.26 0.27 0.07 0.34 0.39
Inferred 0.01 0.14 0.25 0.00 0.63 0.51
Total 0.35 0.26 0.27 0.07 0.34 0.39
DZ Total 1.2 1.5 0.17 0.89 1.9 0.15
1 S.I. units used for metals of value; Cu=copper, Zn=zinc, Pb=lead, Ag=silver, Au=gold, Mo=molybdenum, Co=cobalt.

MMG Limited
MINERAL RESOURCES AND ORE RESERVES STATEMENT
30 June 2021
MMG | 2021 Mineral Resources & Ore Reserves Statement Page 7 of 15
MINERAL RESOURCES1
2021 2020
Deposit Tonnes
(Mt)
Cu
(%)
Zn
(%)
Pb
(%)
Ag
(g/t)
Au
(g/t)
Mo
(ppm)
Co
(%)
Tonnes
(Mt)
Cu
(%)
Zn
(%)
Pb
(%)
Ag
(g/t)
Au
(g/t)
Mo
(ppm)
Co
(%)
Mwepu (100%)
Oxide Copper
Measured
Indicated 0.86 2.4 0.18 0.95 2.3 0.17
Inferred 0.57 2.4 0.28 0.63 2.3 0.27
Total 1.4 2.4 0.22 1.58 2.3 0.21
Oxide Cobalt
Measured
Indicated 0.10 0.26 0.27 0.08 0.61 0.45
Inferred 0.12 1.5 0.17 0.22 0.44 0.47
Total 0.22 2.4 0.18 0.30 0.49 0.46
Mwepu
Total 1.9 1.9 0.25 1.9 2.0 0.25
Dugald River (100%)
Primary Zinc
Measured 13 13.1 2.4 80 13.5 13.2 2.3 74
Indicated 17 11.6 1.4 21 19.8 11.5 1.2 21
Inferred 36 11.2 0.8 8.7 34.3 11.0 0.8 9
Total 66 11.7 1.3 26 67.6 11.6 1.2 26
Primary Copper
Inferred 4.5 1.5 0.1 19.2 1.4 0.1
Total 4.5 1.5 0.1 19.2 1.4 0.1
Dugald
River
Total
70 86.8
Rosebery (100%)
Rosebery
Measured 6.5 0.22 7.7 3.0 135 1.4 6.7 0.19 8.0 3.0 131 1.5
Indicated 3.1 0.17 6.5 2.3 117 1.2 2.1 0.15 6.6 2.0 98 1.1
Inferred 7.1 0.21 8.6 2.5 91 1.2 6.7 0.26 9.2 3.0 109 1.5
Total 17 0.21 7.9 2.6 113 1.3 15.5 0.21 8.3 2.9 117 1.4
Rosebery
Total 17 15.5
High Lake (100%)
Measured
Indicated 7.9 3.0 3.5 0.3 83 1.3 7.9 3.0 3.5 0.3 83 1.3
Inferred 6.0 1.8 4.3 0.4 84 1.3 6.0 1.8 4.3 0.4 84 1.3
Total 14 2.5 3.8 0.4 84 1.3 14.0 2.5 3.8 0.4 84 1.3
Izok Lake (100%)
Measured
Indicated 13 2.4 13 1.4 73 0.18 13.5 2.4 13.3 1.4 73 0.18
Inferred 1.2 1.5 11 1.3 73 0.21 1.2 1.5 10.5 1.3 73 0.21
Total 15 2.3 13 1.4 73 0.18 14.6 2.3 13.1 1.4 73 0.18
1 S.I. units used for metals of value; Cu=copper, Zn=zinc, Pb=lead, Ag=silver, Au=gold, Mo=molybdenum, Co=cobalt.

MMG Limited
MINERAL RESOURCES AND ORE RESERVES STATEMENT
30 June 2021
MMG | 2021 Mineral Resources & Ore Reserves Statement Page 8 of 15
ORE RESERVES1
All data reported here is on a 100% asset basis, with MMG’s attributable interest shown against each asset
within brackets.
Ore Reserves
2021 2020
Deposit Tonnes
(Mt)
Cu
(%)
Zn
(%)
Pb
(%)
Ag
(g/t)
Au
(g/t)
Mo
(ppm)
Tonnes
(Mt)
Cu
(%)
Zn
(%)
Pb
(%)
Ag
(g/t)
Au
(g/t)
Mo
(ppm)
Las Bambas (62.5%)
Ferrobamba Primary
Copper
Proved 360 0.61 2.7 0.05 220 422 0.61 2.6 0.05 223
Probable 160 0.77 3.5 0.07 190 166 0.74 3.4 0.07 189
Total 520 0.66 2.9 0.06 210 587 0.64 2.8 0.06 214
Chalcobamba
Primary Copper
Proved 83 0.60 1.9 0.02 140 81 0.51 1.6 0.02 156
Probable 140 0.74 2.7 0.03 120 126 0.72 2.8 0.04 123
Total 220 0.69 2.4 0.03 130 207 0.64 2.3 0.03 136
Sulfobamba Primary
Copper
Proved
Probable 56 0.79 5.8 0.03 160 64 0.76 5.5 0.03 163
Total 56 0.79 5.8 0.03 160 64 0.76 5.5 0.03 163
Primary Copper
Stockpiles
Proved 26 0.39 1.8 140 8.14 0.40 1.8 135
Total 26 0.39 1.8 140 8.14 0.40 1.8 135
Las Bambas Total 820 0.67 3.0 180 867 0.65 2.9 191
Kinsevere (100%)
Oxide Copper
Proved 0.0 0.0 0.8 3.5
Probable 0.0 0.0 1.7 3.2
Total 0.0 0.0 2.4 3.3
Stockpiles
Proved
Probable 7.0 1.6 9.3 2.1
Total 7.0 1.6 9.3 2.1
Kinsevere Total 7.0 1.6 11.8 2.3
Dugald River (100%)
Primary Zinc
Proved 12 11.0 2.1 70 10.9 10.8 2.0 64
Probable 12 10.1 1.3 18 14.5 10.1 1.2 20
Total 24 10.6 1.7 44 25.4 10.4 1.5 39
Dugald River Total 24 10.6 1.7 44 25.4 10.4 1.5 39
Rosebery (100%)
Proved 5.3 0.19 6.4 2.6 120 1.3 6.1 0.18 7.0 2.7 121 1.4
Probable 0.84 0.18 5.5 2.0 110 1.1 1.1 0.18 6.1 2.0 100 1.1
Total 6.1 0.19 6.3 2.5 120 1.2 7.2 0.18 6.9 2.6 118 1.3
Rosebery Total 6.1 0.19 6.3 2.5 120 1.2 7.2 0.18 6.9 2.6 118 1.3
1 S.I. units used for metals of value; Cu=copper, Zn=zinc, Pb=lead, Ag=silver, Au=gold, Mo=molybdenum.

MMG Limited
MINERAL RESOURCES AND ORE RESERVES STATEMENT
30 June 2021
MMG | 2021 Mineral Resources & Ore Reserves Statement Page 9 of 15
COMPETENT PERSONS Table 1: Competent Persons for Mineral Resources, Ore Reserves and Corporate
Deposit Accountability Competent
Person
Professional
Membership Employer
MMG Mineral Resources and Ore
Reserves Committee Mineral Resources Rex Berthelsen1 HonFAusIMM(CP) MMG
MMG Mineral Resources and Ore
Reserves Committee Ore Reserves Neil Colbourne1 MAusIMM MMG
MMG Mineral Resources and Ore
Reserves Committee Metallurgy: Mineral
Resources /
Ore Reserves
Amy Lamb1 MAusIMM MMG
Las Bambas Mineral Resources Hugo Rios1 MAusIMM(CP) MMG
Las Bambas Ore Reserves Yao Wu1 MAusIMM(CP) MMG
Kinsevere Mineral Resources Samson Malenga2 Pr.Sci.Nat. MMG
Kinsevere Ore Reserves Dean Basile MAusIMM(CP) Mining One Pty Ltd
Rosebery Mineral Resources Anna Lewin MAusIMM(CP) MMG
Rosebery Ore Reserves Philip Uebergang MAusIMM Ground Control
Engineering Pty Ltd
Dugald River Mineral Resources Richard Bueger MAIG Mining Plus Pty Ltd
Dugald River Ore Reserves Philip Bremner FAusIMM Oreteck Pty Ltd
High Lake, Izok Lake Mineral Resources Allan Armitage3 MAPEG (P.Geo) Formerly MMG
The information in this report that relates to Mineral Resources and Ore Reserves is based on information
compiled by the listed Competent Persons, who are Members or Fellows of the Australasian Institute of Mining
and Metallurgy (AusIMM), the Australian Institute of Geoscientists (AIG) or a Recognised Professional
Organisation (RPO) and have sufficient experience which is relevant to the style of mineralisation and type of
deposit under consideration and to the activity which they are undertaking to qualify as Competent Persons
as defined in the 2012 Edition of the Australasian Code for Reporting of Exploration Results, Mineral Resources
and Ore Reserves. Each of the Competent Persons has given consent to the inclusion in the report of the
matters based on their information in the form and context in which it appears.
1 Participants in the MMG Long-Term Incentive Plans which may include Mineral Resources and Ore Reserves growth as a performance
condition 2 South African Council for Natural Scientific Professions, Professional Natural Scientist
3 Member of the Association of Professional Engineers and Geoscientists of British Columbia

MMG Limited
MINERAL RESOURCES AND ORE RESERVES STATEMENT
30 June 2021
MMG | 2021 Mineral Resources & Ore Reserves Statement Page 10 of 15
SUMMARY OF SIGNIFICANT CHANGES
MINERAL RESOURCES
Mineral Resources as at 30 June 2021 have changed, since the 30 June 2020 estimate, for several reasons with
the most significant changes outlined in this section.
Mineral Resources (contained metal) have decreased for copper (-6%), zinc (-1%), molybdenum (-8%), silver
(-0.1%) and gold (-3%). Lead (0.4%) and cobalt (0.4%) have increased slightly from 2020. Variations to Mineral
Resources (contained metal) on an individual site basis are discussed below:
Increases:
The increases in Mineral Resources (contained metal) are due to:
• continued drilling and improvements in orebody knowledge specifically at Dugald River and Rosebery.
At Rosebery, continued drilling success in the middle and upper mine has further delineated 1.2Mt of
additional resource as extensions to previously mined lenses; and
• metal prices, specifically cobalt, has increased the overall contained cobalt metal in the DRC deposits.
Decreases:
The decreases in Mineral Resources (contained metal) are due to:
• depletion at all producing operations;
• removal of 40kt Cu from Sulfobamba deposit at Las Bambas due to illegal mining over the last 5 years;
• negative impacts of costs and cut off grade adjustments have been partially offset by positive
movements in metal prices and account for 60% of the variance with the remainder due to improved
orebody knowledge and geological modelling has resulted in 156kt metal reduction at Chalcobamba;
• remodelling of the hangingwall copper lens at Dugald River resulted in a decrease to the Inferred
Mineral Resource reported in 2020; and
• an increase in costs and cut off grades at Las Bambas.

MMG Limited
MINERAL RESOURCES AND ORE RESERVES STATEMENT
30 June 2021
MMG | 2021 Mineral Resources & Ore Reserves Statement Page 11 of 15
ORE RESERVES
Ore Reserves as at 30 June (contained metal) have decreased for copper (-5%), zinc (-8%), lead (-2%), silver (-
3%), gold (-9%) and molybdenum (-8%).
Variations to Ore Reserves (contained metal) on an individual site basis are discussed below:
Increases:
• Ore Reserves have increases at Dugald River for lead (4%) and silver (5%) have been realised due to
continued drilling for Reserve Definition, which has increased the lead and silver grades, respectively;
and
• Chalcobamba South West has been included in the Ore Reserve at Las Bambas for the first time, having
contributed 230kt to the 2021 Ore Reserves. This, however, has not offset depletion and other negative
impacts.
Decreases:
Decreases in Ore Reserves (metal) for copper (-5%), zinc (-8%), lead (-3%), silver (-3%) and gold (-9%) are due
to:
• depletion at all producing operations;
• impact of increased costs on cut-off grade and an estimated 19kt of ore attributed to illegal mining at
Sulfobamba;
• a further reduction of copper (-58%) at Kinsevere, due to changes in exclusion of all remaining in-pit
material due to high contract mining costs required to recommence mining and exclusion of the black
shale material from the stockpiles due to having no suitable blending material available; and
• a further reduction of zinc (-5%) at Dugald River, due to lower modelled grades.

MMG Limited
MINERAL RESOURCES AND ORE RESERVES STATEMENT
30 June 2021
MMG | 2021 Mineral Resources & Ore Reserves Statement Page 12 of 15
KEY ASSUMPTIONS
PRICES AND EXCHANGE RATES
The following price and foreign exchange assumptions, set according to the relevant MMG Standard as at
February 2021, have been applied to all Mineral Resources and Ore Reserves estimates. Price assumptions for
all metals have changed from the 2020 Mineral Resources and Ore Reserves statement.
Table 2: 2021 Price (real) and foreign exchange assumptions
Ore Reserves Mineral Resources
Cu (US$/lb) 3.28 3.68
Zn (US$/lb) 1.16 1.41
Pb (US$/lb) 0.93 1.13
Au US$/oz 1,512 1,773
Ag US$/oz 18.90 22.17
Mo (US$/lb) 10.08 12.12
Co (US$/lb) 20.16 30.24
USD:CAD 1.30
As per Ore Reserves AUD:USD 0.75
USD:PEN 3.23

MMG Limited
MINERAL RESOURCES AND ORE RESERVES STATEMENT
30 June 2021
MMG | 2021 Mineral Resources & Ore Reserves Statement Page 13 of 15
CUT-OFF GRADES
Mineral Resources and Ore Reserves cut-off values are shown in Table 3 and Table 4, respectively.
Table 3: Mineral Resources cut-off grades
Site Mineralisation Likely Mining
Method1 Cut-Off Value Comments
Las Bambas
Oxide copper
OP
1% Cu2
Cut-off is applied as a range that varies for each deposit and
mineralised rock type at Las Bambas. In-situ copper Mineral
Resources constrained within US$3.68/lb Cu and US$12.12/lb
Mo pit shell.
Primary copper Ferrobamba 0.18% Cu2
(average)
Primary copper Chalcobamba 0.20% Cu2
(average)
Primary copper Sulfobamba 0.21% Cu2
(average)
Kinsevere
Oxide copper & stockpiles OP 0.6% CuAS3
In-situ copper Mineral Resources constrained within a
US$3.68/lb Cu and US$25.79/lb Co pit shell.
Transition mixed ore copper
(TMO) OP 0.7% Cu2
Primary copper OP 0.7% Cu2
Oxide TMO Cobalt OP 0.2% Co4 In-situ cobalt Mineral Resources constrained within a
US$3.68/lb Cu and US$30.24/lb Co pit shell, but exclusive of
copper mineralisation. Primary cobalt OP 0.1% Co4
Sokoroshe II
Oxide OP 0.73% Cu2 In-situ copper Mineral Resources constrained within a
US$3.68/lb Cu and US$30.24/lb Co pit shell. TMO Copper OP 0.8% Cu2
Primary copper OP 0.8% Cu2
Oxide TMO cobalt OP 0.2% Co4 In-situ cobalt Mineral Resources constrained within a
US$3.68/lb Cu and US$30.24/lb Co pit shell, but exclusive of
copper mineralisation above cut off.
TMO Cobalt OP 0.2% Co4
Primary cobalt OP 0.2% Co4
Nambulwa / DZ
Oxide copper OP 0.76% Cu2 In-situ copper Mineral Resources constrained within a
US$3.68/lb Cu and US$30.24/lb Co pit shell.
Oxide cobalt OP 0.2% Co4
In-situ cobalt Mineral Resources constrained within a
US$3.68/lb Cu and US$30.24/lb Co pit shell, but exclusive of
copper mineralisation.
Mwepu
Oxide and TMO copper OP 0.89% Cu2 In-situ copper Mineral Resources constrained within a
US$3.68/lb Cu and US$30.24/lb Co pit shell.
Oxide cobalt OP 0.2% Co4
In-situ cobalt Mineral Resources constrained within a
US$3.68/lb Cu and US$30.24/lb Co pit shell, but exclusive of
copper mineralisation.
Rosebery Rosebery (Zn, Cu, Pb, Au, Ag) UG A$174/t NSR5 All areas of the mine are reported using the same NSR cut-off
value.
Dugald River Primary zinc (Zn, Pb, Ag) UG A$142/t NSR5
All areas of the mine are reported using the same NSR cut-off
value.
Primary copper UG 1% Cu2 All areas of the mine are reported at the same cut-off grade
High Lake
Cu, Zn, Pb, Ag, Au OP 2.0% CuEq6
CuEq6 = Cu + (Zn×0.30) + (Pb×0.33) + (Au×0.56) + (Ag×0.01):
based on Long-Term prices and metal recoveries at Au:75%,
Ag:83%, Cu:89%, Pb:81% and Zn:93%.
Cu, Zn, Pb, Ag, Au UG 4.0% CuEq6
CuEq6 = Cu + (Zn×0.30) + (Pb×0.33) + (Au×0.56) + (Ag×0.01):
based on Long-Term prices and metal recoveries at Au:75%,
Ag:83%, Cu:89%, Pb:81% and Zn:93%.
Izok Lake Cu, Zn, Pb, Ag, Au OP 4.0% ZnEq7 ZnEq7 = Zn + (Cu×3.31) + (Pb×1.09) + (Au×1.87) +
(Ag×0.033); prices and metal recoveries as per High Lake.
1 OP = Open Pit, UG = Underground 2 Cu = Total copper
3 CuAS = Acid soluble copper 4 Co = Total cobalt 5 NSR = Net Smelter Return 6 CuEq = Copper equivalent 7 ZnEq = Zinc equivalent

MMG Limited
MINERAL RESOURCES AND ORE RESERVES STATEMENT
30 June 2021
MMG | 2021 Mineral Resources & Ore Reserves Statement Page 14 of 15
Table 4 : Ore Reserves cut-off grades
Site Mineralisation Mining
Method
Cut-Off Value Comments
Las Bambas
Primary copper Ferrobamba
OP
0.20% Cu1 (average)2 Range based on rock type recovery.
Primary copper Chalcobamba 0.23% Cu1 (average)3
Primary copper Sulfobamba 0.24% Cu1 (average)4
Kinsevere Copper oxide OP 0.6% CuAS5
Approximate cut-off grades shown in
this table for ex-pit material. Variable
cut-off grade based on net value
script.
OP 0.6% CuAS4 For existing stockpiles reclaim.
Rosebery (Zn, Cu, Pb, Au, Ag) UG A$174/t NSR6
Dugald
River Primary zinc UG A$142/t NSR (average)6
1Cu = Total copper
2 Range from 0.20 to 0.24% Cu
3 Range from 0.22 to 0.29% Cu
4 Range from 0.24 to 0.29% Cu 5 CuAS = Acid Soluble Copper
6 NSR = Net Smelter Return

MMG Limited
MINERAL RESOURCES AND ORE RESERVES STATEMENT
30 June 2021
MMG | 2021 Mineral Resources & Ore Reserves Statement Page 15 of 15
PROCESSING RECOVERIES
Average processing recoveries are shown in Table 5. More detailed processing recovery relationships are
provided in the Technical Appendix.
Table 5: Processing Recoveries
Site Product Recovery
Concentrate
Moisture
Assumptions
Cu Zn Pb Ag Au Mo
Las Bambas Copper Concentrate 86% - - 75% 71% 10%
Molybdenum Concentrate 55.5% 5%
Rosebery
Zinc Concentrate 84% 8%
Lead Concentrate 1.8% 77% 36% 16% 7%
Copper Concentrate 58% 41% 36% 8%
Doré1 (gold and silver) 0.13% 24%
Dugald River Zinc Concentrate − 88% 39% − 10.5%
Lead Concentrate − 66% 47% − 10.0%
Kinsevere Copper Cathode 76%
(96% CuAS2)
The Technical Appendix published on the MMG website contains additional Mineral Resources and Ore
Reserves information (including the Table 1 disclosure).
1 Silver in Rosebery doré is calculated as a constant ratio to gold in the doré. Silver is set to 0.17 against gold being 20.7
2 CuAS = Acid Soluble Copper
MMG Mineral Resources
and Ore Reserves
Statement as at 30 June 2021 Technical Appendix
28 October 2021

1 INTRODUCTION 5 2 COMMON TO ALL SITES 6
2.1 COMMODITY PRICE ASSUMPTIONS 6 2.2 COMPETENT PERSONS 7
3 LAS BAMBAS OPERATION 8 3.1 INTRODUCTION AND SETTING 8 3.2 MINERAL RESOURCES – LAS BAMBAS 9
3.2.1 Results 9 3.2.2 Mineral Resources JORC 2012 Assessment and Reporting Criteria 10 3.2.3 Statement of Compliance with JORC Code Reporting Criteria and Consent to Release 29
3.3 ORE RESERVES – LAS BAMBAS 30 3.3.1 Results 30 3.3.2 Ore Reserves JORC 2012 Assessment and Reporting Criteria 31 3.3.3 Expert Input Table 45 3.3.4 Statement of Compliance with JORC Code Reporting Criteria and Consent to Release 46
4 KINSEVERE OPERATION 47 4.1 INTRODUCTION AND SETTING 47
4.1.1 Results 48 4.1.2 Mineral Resources JORC 2012 Assessment and Reporting Criteria 49 4.1.3 Statement of Compliance with JORC Code Reporting Criteria and Consent to Release 68
4.2 ORE RESERVES - KINSEVERE 69 4.2.1 Results 69 4.2.2 Ore Reserves JORC 2012 Assessment and Reporting Criteria 70 4.2.3 Expert Input Table 76 4.2.4 Statement of Compliance with JORC Code Reporting Criteria and Consent to Release 77
5 DUGALD RIVER MINE 78 5.1 INTRODUCTION AND SETTING 78 5.2 MINERAL RESOURCES – DUGALD RIVER 79
5.2.1 Results 79 5.2.2 Mineral Resources JORC 2012 Assessment and Reporting Criteria 80 5.2.3 Statement of Compliance with JORC Code Reporting Criteria and Consent to Release 103
5.3 ORE RESERVES – DUGALD RIVER 104 5.3.1 Results 104 5.3.2 Ore Reserves JORC 2012 Assessment and Reporting Criteria 105 5.3.3 Expert Input Table 117 5.3.4 Statement of Compliance with JORC Code Reporting Criteria and Consent to Release 118
6 ROSEBERY 119 6.1 INTRODUCTION AND SETTING 119 6.2 MINERAL RESOURCES – ROSEBERY 120
6.2.1 Results 120 6.2.2 Mineral Resources JORC 2012 Assessment and Reporting Criteria 121 6.2.3 Statement of Compliance with JORC Code Reporting Criteria and Consent to Release 135
6.3 ORE RESERVES – ROSEBERY 136 6.3.1 Results 136 6.3.2 Ore Reserves JORC 2012 Assessment and Reporting Criteria 137 6.3.3 Expert Input Table 151 6.3.4 Statement of Compliance with JORC Code Reporting Criteria and Consent to Release 152
7 SOKOROSHE II 153 7.1 INTRODUCTION AND SETTING 153 7.2 MINERAL RESOURCES – SOKOROSHE II 154
7.2.1 Results 154 7.2.2 Mineral Resources JORC 2012 Assessment and Reporting Criteria 155
TABLE OF CONTENTS

7.2.3 Statement of Compliance with JORC Code Reporting Criteria and Consent to Release 170 8 MWEPU 171
8.1 INTRODUCTION AND SETTING 171 8.2 MINERAL RESOURCES – MWEPU 172
8.2.1 Results 172 8.2.2 Mineral Resources JORC 2012 Assessment and Reporting Criteria 173 8.2.3 Statement of Compliance with JORC Code Reporting Criteria and Consent to Release 186
9 NAMBULWA / DZ 187 9.1 INTRODUCTION AND SETTING 187 9.2 MINERAL RESOURCES – NAMBULWA / DZ 188
9.2.1 Results 188 9.2.2 Mineral Resources JORC 2012 Assessment and Reporting Criteria 189 9.2.3 Statement of Compliance with JORC Code Reporting Criteria and Consent to Release 204
10 HIGH LAKE 205 11 IZOK LAKE 205

MMG | 2021 June Mineral Resources and Ore Reserves Statement - Appendix Page 4 of 205
APPROVALS PAGE
Rex Berthelsen Head of Geology 28/10/2021
Signature Name Position Date
Neil Colbourne Head of Mining 28/10/2021
Signature Name Position Date
Sam Rodda
General Manager
Operations and
Technical Excellence
28/10/2021
Signature Name Position Date
The above signed endorse and approve this Mineral Resources and Ore Reserves Statement Technical
Appendix.
MMG | 2021 June Mineral Resources and Ore Reserves Statement - Appendix Page 5 of 205
1 INTRODUCTION
On 20th December 2012 an updated JORC1 Code was released – the previous release being the 2004 Edition.
The JORC Code 2012 Edition defines the requirements for public reporting of Exploration Results, Mineral
Resources and Ore Reserves by mining companies. Reporting according to the JORC Code is a requirement of
the MMG listing on The Stock Exchange of Hong Kong2 as per amendments to Chapter 18 of the Listing Rules
that were announced on 3rd June 2010.
The core of the change to JORC Code is enhanced disclosure of the material information prepared by the
Competent Person with the requirement for the addition of a publicly released detailed Appendix to the
Mineral Resources and Ore Reserves release document, which outlines the supporting details to the Mineral
Resources and Ore Reserves numbers.
This Technical Appendix provides these supporting details.
Under the JORC Code, reporting in compliance with the guidelines of JORC Code 2012 Edition became
compulsory from 1 Dec 2013.
The principles governing the operation and application of the JORC Code are Transparency, Materiality and
Competence:
Transparency requires that the reader of a Public Report is provided with sufficient information, the
presentation of which is clear and unambiguous, to understand the report and not be misled by this
information or by omission of material information that is known to the Competent Person.
Materiality requires that a Public Report contains all the relevant information that investors and their
professional advisers would reasonably require, and reasonably expect to find in the report, for the purpose
of making a reasoned and balanced judgment regarding the Exploration Results, Mineral Resources or Ore
Reserves being reported. Where relevant information is not supplied an explanation must be provided to
justify its exclusion.
Competence requires that the Public Report be based on work that is the responsibility of suitably qualified
and experienced persons who are subject to an enforceable professional code of ethics (the Competent
Person).
1 JORC = Joint Ore Reserves Committee.
2 Specifically, the Updated Rules of Chapter 18 of the Hong Kong Stock Exchange Listing Rules require a Competent Person’s report to comply with standards
acceptable to the HKSE including JORC Code (the Australian code), NI 43-101 (the Canadian code) or SAMREC Code (the South African code) for Mineral
Resources and Ore Reserves. MMG Limited has chosen to report using the JORC Code.

MMG | 2021 June Mineral Resources and Ore Reserves Statement - Appendix Page 6 of 205
2 COMMON TO ALL SITES
The economic analysis undertaken for each Ore Reserves described in this document and for the whole
Company has resulted in positive net present values (NPVs). MMG uses a discount rate appropriate to the size
and nature of the organisation and individual deposits.
2.1 Commodity Price Assumptions
The price and foreign exchange assumptions used for the 2021 Mineral Resources and Ore Reserves estimation
at the date at which work commenced on the Mineral Resources and Ore Reserves are as shown in Table 1.
Table 1 2021 Price (real) and foreign exchange assumptions
Ore Reserves Mineral Resources
Cu (US$/lb) 3.28 3.68
Zn (US$/lb) 1.16 1.41
Pb (US$/lb) 0.93 1.13
Au US$/oz 1,512 1,773
Ag US$/oz 18.90 22.17
Mo (US$/lb) 10.08 12.12
Co (US$/lb) 20.16 30.24
USD:CAD 1.30
As per Ore Reserves AUD:USD 0.75
USD:PEN 3.23

MMG | 2021 June Mineral Resources and Ore Reserves Statement - Appendix Page 7 of 205
2.2 Competent Persons
Table 2 – Competent Persons
Deposit Accountability Competent
Person
Professional
Membership Employer
MMG Mineral Resources and Ore
Reserves Committee Mineral Resources Rex Berthelsen1 HonFAusIMM(CP) MMG
MMG Mineral Resources and Ore
Reserves Committee Ore Reserves Neil Colbourne1 MAusIMM MMG
MMG Mineral Resources and Ore
Reserves Committee
Metallurgy: Mineral
Resources /
Ore Reserves
Amy Lamb1 MAusIMM MMG
Las Bambas Mineral Resources Hugo Rios1 MAusIMM(CP) MMG
Las Bambas Ore Reserves Yao Wu1 MAusIMM(CP) MMG
Kinsevere Mineral Resources Samson Malenga2 Pr.Sci.Nat. MMG
Kinsevere Ore Reserves Dean Basile MAusIMM(CP) Mining One Pty Ltd
Rosebery Mineral Resources Anna Lewin MAusIMM(CP) MMG
Rosebery Ore Reserves Philip Uebergang MAusIMM Ground Control
Engineering Pty Ltd
Dugald River Mineral Resources Richard Bueger MAIG Mining Plus Pty Ltd
Dugald River Ore Reserves Philip Bremner FAusIMM Oreteck Pty Ltd
High Lake, Izok Lake Mineral Resources Allan Armitage3 MAPEG (P.Geo) Formerly MMG
The information in this report that relates to Mineral Resources and Ore Reserves is based on information
compiled by the listed Competent Persons, who are Members or Fellows of the Australasian Institute of Mining
and Metallurgy (AusIMM), the Australian Institute of Geoscientists (AIG) or a Recognised Professional
Organisation (RPO) and have sufficient experience which is relevant to the style of mineralisation and type of
deposit under consideration and to the activity which they are undertaking to qualify as Competent Persons
as defined in the 2012 Edition of the Australasian Code for Reporting of Exploration Results, Mineral Resources
and Ore Reserves (2012 JORC Code). Each of the Competent Persons has given consent to the inclusion in the
report of the matters based on their information in the form and context in which it appears.
1 Participants in the MMG Long-Term Incentive Plans which may include Mineral Resources and Ore Reserves growth as a performance
condition 2 South African Council for Natural Scientific Professions, Professional Natural Scientist 3 Member of the Association of Professional Engineers and Geoscientists of British Columbia

MMG | 2021 June Mineral Resources and Ore Reserves Statement - Appendix Page 8 of 205
3 LAS BAMBAS OPERATION
3.1 Introduction and Setting
Las Bambas is a world class copper (Cu) mine with molybdenum (Mo), silver (Ag) and gold (Au) by-product
credits. It is located in the Andes Mountains of southern Peru approximately 75km south-southwest of Cusco,
approximately 300km north-northwest of Arequipa, and approximately 150km northeast of Espinar (also
named Yauri). Las Bambas is readily accessible from either Cusco or Arequipa over a combination of sealed
and good quality gravel roads. Road travel from Cusco takes approximately 6 hours, while road travel from
Arequipa takes approximately 9 hours.
Figure 3-1 Las Bambas Mine location
Las Bambas is a truck and shovel mining operation with a conventional copper concentrator. Copper
production commenced in the fourth quarter of 2015 with the first concentrate achieved on 26 November. The
first shipment of product departed the Port of Matarani for China on 15 January 2016. Las Bambas is now in its
fifth year of operation.
Las Bambas is a joint venture project between the operator MMG (62.5%), a wholly owned subsidiary of Guoxin
International Investment Co. Ltd (22.5%) and CITIC Metal Co. Ltd (15.0%).
The Mineral Resources and Ore Reserves have been updated with additional drilling completed in 2020 for the
June 2021 report. The 2021 Mineral Resources estimation includes updated geological interpretation and
estimation parameters.
MMG | 2021 June Mineral Resources and Ore Reserves Statement - Appendix Page 9 of 205
3.2 Mineral Resources – Las Bambas
3.2.1 Results
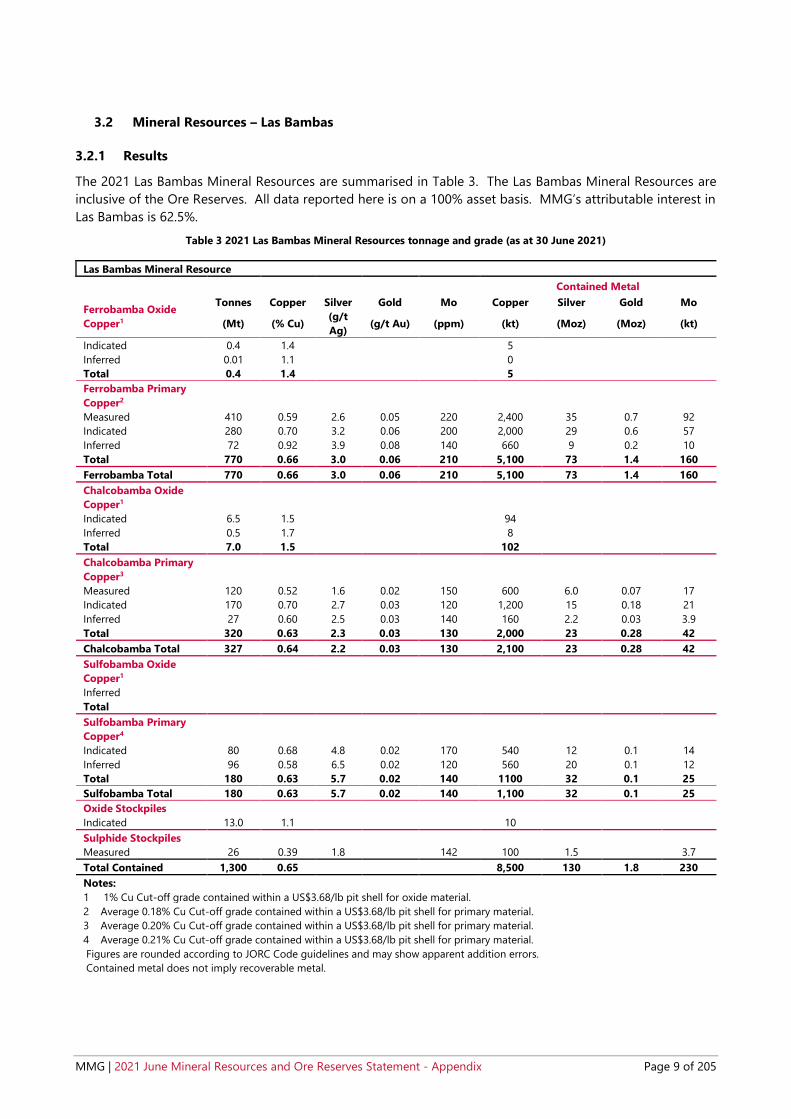
The 2021 Las Bambas Mineral Resources are summarised in Table 3. The Las Bambas Mineral Resources are
inclusive of the Ore Reserves. All data reported here is on a 100% asset basis. MMG’s attributable interest in
Las Bambas is 62.5%.
Table 3 2021 Las Bambas Mineral Resources tonnage and grade (as at 30 June 2021)
Las Bambas Mineral Resource
Contained Metal
Ferrobamba Oxide
Copper1
Tonnes Copper Silver Gold Mo Copper Silver Gold Mo
(Mt) (% Cu) (g/t
Ag) (g/t Au) (ppm) (kt) (Moz) (Moz) (kt)
Indicated 0.4 1.4 5
Inferred 0.01 1.1 0
Total 0.4 1.4 5
Ferrobamba Primary
Copper2
Measured 410 0.59 2.6 0.05 220 2,400 35 0.7 92
Indicated 280 0.70 3.2 0.06 200 2,000 29 0.6 57
Inferred 72 0.92 3.9 0.08 140 660 9 0.2 10
Total 770 0.66 3.0 0.06 210 5,100 73 1.4 160
Ferrobamba Total 770 0.66 3.0 0.06 210 5,100 73 1.4 160
Chalcobamba Oxide
Copper1
Indicated 6.5 1.5 94
Inferred 0.5 1.7 8
Total 7.0 1.5 102
Chalcobamba Primary
Copper3
Measured 120 0.52 1.6 0.02 150 600 6.0 0.07 17
Indicated 170 0.70 2.7 0.03 120 1,200 15 0.18 21
Inferred 27 0.60 2.5 0.03 140 160 2.2 0.03 3.9
Total 320 0.63 2.3 0.03 130 2,000 23 0.28 42
Chalcobamba Total 327 0.64 2.2 0.03 130 2,100 23 0.28 42
Sulfobamba Oxide
Copper1
Inferred
Total
Sulfobamba Primary
Copper4
Indicated 80 0.68 4.8 0.02 170 540 12 0.1 14
Inferred 96 0.58 6.5 0.02 120 560 20 0.1 12
Total 180 0.63 5.7 0.02 140 1100 32 0.1 25
Sulfobamba Total 180 0.63 5.7 0.02 140 1,100 32 0.1 25
Oxide Stockpiles
Indicated 13.0 1.1 10
Sulphide Stockpiles
Measured 26 0.39 1.8 142 100 1.5 3.7
Total Contained 1,300 0.65 8,500 130 1.8 230
Notes:
1 1% Cu Cut-off grade contained within a US$3.68/lb pit shell for oxide material.
2 Average 0.18% Cu Cut-off grade contained within a US$3.68/lb pit shell for primary material.
3 Average 0.20% Cu Cut-off grade contained within a US$3.68/lb pit shell for primary material.
4 Average 0.21% Cu Cut-off grade contained within a US$3.68/lb pit shell for primary material.
Figures are rounded according to JORC Code guidelines and may show apparent addition errors.
Contained metal does not imply recoverable metal.

MMG | 2021 June Mineral Resources and Ore Reserves Statement - Appendix Page 10 of 205
3.2.2 Mineral Resources JORC 2012 Assessment and Reporting Criteria
The following information provided in Table 4 complies with the 2012 JORC Code requirements specified by
“Table-1 Section 1-3” of the Code.
Table 4 JORC 2012 Code Table 1 Assessment and Reporting Criteria for Las Bambas Mineral Resources 2021
Section 1 Sampling Techniques and Data
Criteria Commentary
Sampling
techniques
• Diamond drilling (DD) was used to obtain an average 2m sample that is half core
split, crushed and pulverised to produce a pulp (95% passing 105µm). Diamond core
is selected, marked and numbered for sampling by the logging geologist. Sample
details are stored in an Geobank database for correlation with returned geochemical
assay results.
• Samples for analysis are bagged, shuffled, re-numbered and de-identified prior to
dispatch.
• Whole core was delivered to the Inspectorate Laboratory in Lima (2005-2010) and
Certimin Laboratory in Lima (2014 to 2015) for half core splitting and sample
preparation. From mid-2015 core samples were cut and sampled at an ALS sample
preparation laboratory on-site. Samples are then sent to ALS Lima for preparation
and analysis.
• There are no inherent sampling problems recognised.
• Measures taken to ensure sample representivity include the collection, and analysis
of coarse crush duplicates.
Drilling
techniques
• In 2020, two types of drilling were used. The traditional one with wireline diamond
core drilling and reverse air drilling from surface. Generally, drill core is not oriented,
however, holes drilled for geotechnical purposes are oriented. All drillholes used in
the Mineral Resource estimates have been drilled using HQ size.
• The RC Drilling trial was executed in Ferrobamba Pit to evaluate the viability to use
RC drill chip sampling for Resources purposes in operation area.
Drill sample
recovery
• Recovery is estimated by measuring the recovered core within a drill run length and
recorded in the Geobank database. Run by run recovery has been recorded for
606,342.51m of the total 650,231.98m of diamond drilling in the data used for
Mineral Resources estimation for the Sulfobamba, Chalcobamba and Ferrobamba
deposits. Diamond drill recovery average is about 96% for all deposits (98% for
Sulfobamba, 97% for Chalcobamba and 93% for Ferrobamba deposits).
• Sample quality is acceptable for dry samples, with practical sample recovery per
meter drilled, finding loss of samples during rod changes. The material lost is
interpreted as an operational process to be improved. The Coefficient of Variation
from field duplicate samples is less than 5% for copper.
• The drilling process is controlled by the drill crew, and geological supervision
provides a means for maximising sample recovery and ensures suitable core
presentation. No other measures are taken to maximise core recovery.
• There is no detectable correlation between recovery and grade which can be
determined from graphical and statistical analysis. Preferential loss/gains of fine or
coarse materials are not significant and do not result in sample bias as the nature of

MMG | 2021 June Mineral Resources and Ore Reserves Statement - Appendix Page 11 of 205
Section 1 Sampling Techniques and Data
Criteria Commentary
mineralisation is stockwork veins and disseminated sulphides. Diamond core
sampling is applied, and recovery is considered high.
Logging • 100% of diamond drill core and reverse circulation percussion drilling used in the
Mineral Resource estimates has been geologically and geotechnically logged (DD
only) to support Mineral Resources estimation, mining and metallurgy studies.
• Geological logging is qualitative and geotechnical logging is quantitative. All drill
core is photographed.
Sub-sampling
techniques and
sample
preparation
• All samples included in the Mineral Resource estimates are from diamond drill core
and reverse circulation. Drill core is longitudinally sawn to provide half-core samples
within intervals directed by the logging geologist. The remaining half-core is kept
and stored in the original sample tray. The standard sampling length is 2m for PQ
core (minimum 1.2m) and HQ core (minimum 1.2m, maximum 2.2m) while NQ core
is sampled at 2.5m (minimum 1.5m). Sample intervals do not cross geological
boundaries.
• From 2005 until 2010 geological samples have been processed in the following
manner: Dried, crushed, pulverised to 95% passing 105µm. Sizing analysis is carried
out on 1 in 30 samples.
• From 2010 geological samples have been processed in the following manner: Dried,
crushed, pulverised to 95% passing 106µm. Sizing analyses are carried out on in 30
samples.
• Representivity of samples is checked by duplication at the crush stage one in every
40 samples. No field duplicates are taken.
• Until 2018, a twelve-month rolling Quality Assurance / Quality Control (QAQC)
analysis of sample preparation techniques indicate the process is appropriate for Las
Bambas samples.
• From 2019, monthly and quarterly QAQC Quality Assurance / Quality Control (QAQC)
analysis and sample preparation techniques are reported, following the Geological
Assay Work Quality Requirement.
• The sample types, nature, quality and sample preparation techniques are considered
appropriate for the style of the Las Bambas mineralisation (porphyry and skarn Cu-
Mo mineralisation) by the Competent Person.
• Previous to 2019, the RC sampling was done using a cyclone for dry and wet samples
on one-metre intervals. Samples are collected in buckets, weighted, and split on-site
using a riffle splitter, aiming for 2 to 3 kg subsample, weight taken on-site with an
electronic balance.
• As a rule, if a sample from a cyclone is:
o less than 4-6 kg, no split is undertaken
o 6- 12 kg, two subsamples are taken
o 12-24 kg, a split is undertaken as necessary to get 3 kg sample splits.
• In the case of wet samples, we did not have the proper splitter to process the sample.
The one-meter sample was collected in microporous bags. The sample was divided

MMG | 2021 June Mineral Resources and Ore Reserves Statement - Appendix Page 12 of 205
Section 1 Sampling Techniques and Data
Criteria Commentary
using a wet rotary splitter. Dump samples were let to air dry on the core shack before
splitting using conventional riffle splitter.
• From 2019, the RC sampling is done using a vibrating-cone-rotary-splitter for dry
and wet samples on two metre intervals. Samples are collected in trays, weighted,
getting 3 to 6 Kg. subsample, weight taken on-site with an electronic balance.
• The rotary splitter has a second tray, allowing to obtain duplicate samples.
• The cone splitter has the option for controlling the rotation speed and the tray
aperture, allowing to get the amount of material without overspill, or not getting
enough material
• Until 2018, a twelve month rolling Quality Assurance / Quality Control (QAQC)
analysis of sample preparation techniques indicate the process is appropriate for Las
Bambas samples.
• From 2019, monthly and quarterly QAQC Quality Assurance / Quality Control (QAQC)
analysis and sample preparation techniques are reported, following the Geological
Assay Work Quality Requirement.
• The sample types, nature, quality and sample preparation techniques are considered
appropriate for the style of the Las Bambas mineralisation (porphyry and skarn Cu-
Mo mineralisation) by the Competent Person.
Quality of
assay data and
laboratory tests
• From 2005 until 2010 the assay methods undertaken by Inspectorate (Lima) for Las
Bambas were as follows:
o Digestion by 4-Acids. Cu, Ag, Pb, Zn, Mo - 0.5g of sample, and the
determination was done by Atomic Absorption Spectrometry (AAS).
o Acid soluble - 0.2g sample. Leaching by a 15% solution of H2SO4 at 73°C for
5 minutes. Determination by AAS.
o Acid soluble - 0.2g of sample. Digestion by a citric acid solution at 65°C for
15 minutes. Determination by AAS.
o Au – 30g Fire Assay Cupellation at 950°C. Determination by AAS. Above
detection limit analysis by gravimetry.
o 35 elements - Digestion by aqua-regia and determination by ICP.
• From 2010 to 2015, routine assay methods undertaken by Certimin (Lima) for Las
Bambas are as follows:
o Cu, Ag, Pb, Zn, Mo - 0.5g of sample. Digestion by 4-Acids. Determination by
Atomic Absorption Spectrometry (AAS).
o Acid soluble copper – 0.2g sample. Leaching by a 15% solution of H2SO4 at
73°C for 5 minutes. Determination by AAS.
o Acid Soluble copper - 0.2g of sample. Digestion by a citric acid solution at
65°C for 15 minutes. Determination by AAS.
o Au – 30g Fire assay with AAS finish. Over-range results are re-assayed by
Gravimetric Finish.
o 35 elements - Digestion by aqua-regia and determination by ICP.
• In 2015 ALS (Lima) used the following methods:
o Cu, Ag, Pb, Zn, Mo - 0.5g of sample. Digestion by 4-Acids. Determination by
Atomic Absorption Spectrometry (AAS).

MMG | 2021 June Mineral Resources and Ore Reserves Statement - Appendix Page 13 of 205
Section 1 Sampling Techniques and Data
Criteria Commentary
o Acid soluble copper – 0.5g sample. Leaching by a 5% solution of H2SO4 at
ambient temperature for 1 hour. Determination by AAS.
o Au – 30g Fire assay with AAS Finish. Over-range results are re-assayed by
Gravimetric Finish.
o 52 elements - Digestion by aqua-regia and determination by ICP.
• From 2016 to present routine assay methods undertaken by ALS (Lima) for Las
Bambas are as follows:
o Cu, Ag, Mo. Digestion by 4-Acids and determination by Atomic Absorption
o Cu Sequential: Cu is reported as soluble in sulfuric acid, Soluble in cyanide
and residual. Determination by Atomic Absorption.
o Au – 30g Fire assay with AAS Finish. Over-range results are re-assayed by
Gravimetric Finish.
o 60 elements - Digestion by 4-Acids and determination by ICP, includes a
package of rare earth elements.
• All the above methods except the acid-soluble copper are considered as a quasi-
total digest.
• Until 2017 inclusive, 6-8 meters composite samples were analysed by sequential
copper methods.
• In 2018 and 2019, all unassayed 2m pulps where the original copper grade was >0.1%
were analysed by the sequential copper method by ALS Global Laboratory.
• Currently the pulps are sent for sequential copper analysis in samples that exceed
0.1% Cu.
• The site previously employed a practice of ‘double blind’ sample randomisation at
the laboratory. It essentially guarantees the secrecy of the results from the operating
laboratory. It does however pose a minor risk of compromising sample provenance,
although the risk is probably low. This practice has now ceased.
• No geophysical tools, spectrometers or handheld XRF instruments have been used
to analyse samples external to the ALS laboratory for the estimation of Mineral
Resources.
• Assay techniques are considered suitable and representative; independent umpire
laboratory checks occurred routinely between 2005-2010 using the ALS Chemex
laboratory in Lima. Check samples were inserted at a rate of 1 in every 25 samples
(2005-2007), every 50 samples (2008) and every 40 samples (2010).
• For the 2014 to 2018 sampling programs, duplicated samples were collected at the
sampling time and securely stored. Samples were then sent to the Inspectorate
Laboratory, Lima, for third party (umpire) analysis. The samples were selected at a
rate of 1:40. Analytical results indicated a good correlation between datasets and
showed no significant bias for copper, molybdenum, silver, and gold.
• In 2019, Certimin was selected as the umpire laboratory, using similar rate of sample
selection, 1 in 20 samples, using the criteria to check samples over 0.1% Copper.
• During 2020, we returned to Inspectorate-BV laboratory for umpire assay checks; the
rate of sample selection was 1 in 20 samples, using the criteria to check samples over
0.1% Copper.
MMG | 2021 June Mineral Resources and Ore Reserves Statement - Appendix Page 14 of 205
Section 1 Sampling Techniques and Data
Criteria Commentary
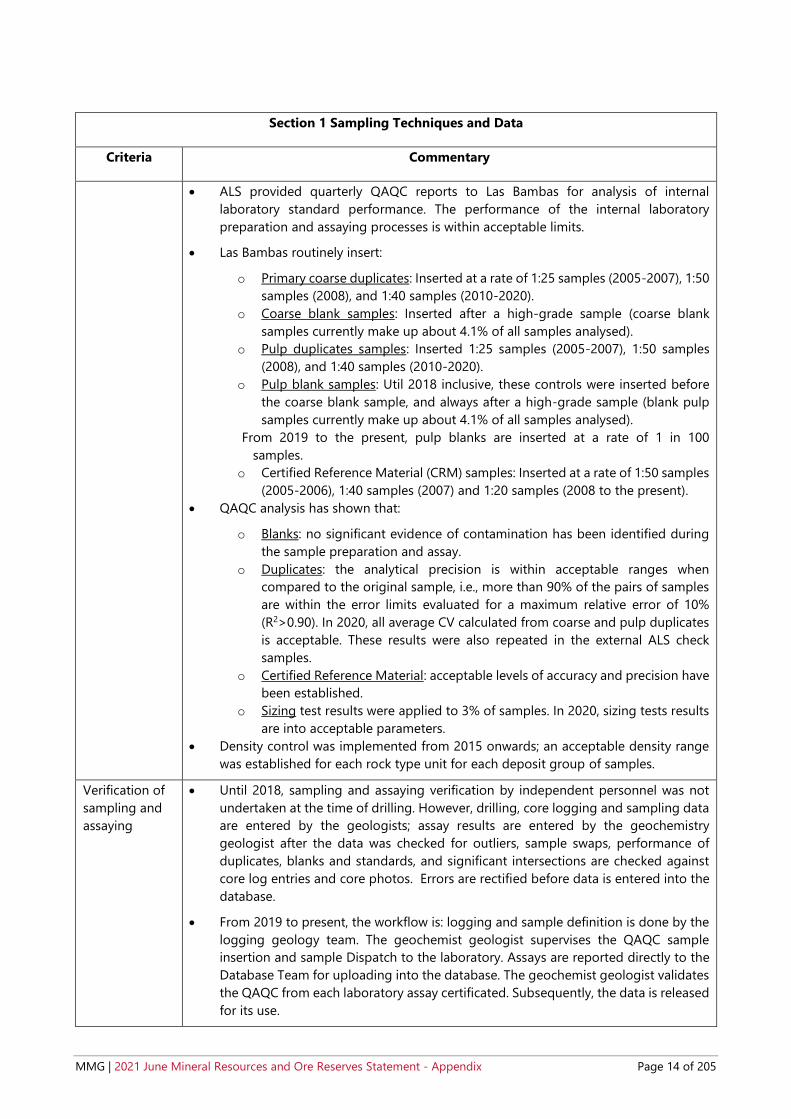
• ALS provided quarterly QAQC reports to Las Bambas for analysis of internal
laboratory standard performance. The performance of the internal laboratory
preparation and assaying processes is within acceptable limits.
• Las Bambas routinely insert:
o Primary coarse duplicates: Inserted at a rate of 1:25 samples (2005-2007), 1:50
samples (2008), and 1:40 samples (2010-2020).
o Coarse blank samples: Inserted after a high-grade sample (coarse blank
samples currently make up about 4.1% of all samples analysed).
o Pulp duplicates samples: Inserted 1:25 samples (2005-2007), 1:50 samples
(2008), and 1:40 samples (2010-2020).
o Pulp blank samples: Util 2018 inclusive, these controls were inserted before
the coarse blank sample, and always after a high-grade sample (blank pulp
samples currently make up about 4.1% of all samples analysed).
From 2019 to the present, pulp blanks are inserted at a rate of 1 in 100
samples.
o Certified Reference Material (CRM) samples: Inserted at a rate of 1:50 samples
(2005-2006), 1:40 samples (2007) and 1:20 samples (2008 to the present).
• QAQC analysis has shown that:
o Blanks: no significant evidence of contamination has been identified during
the sample preparation and assay.
o Duplicates: the analytical precision is within acceptable ranges when
compared to the original sample, i.e., more than 90% of the pairs of samples
are within the error limits evaluated for a maximum relative error of 10%
(R2>0.90). In 2020, all average CV calculated from coarse and pulp duplicates
is acceptable. These results were also repeated in the external ALS check
samples.
o Certified Reference Material: acceptable levels of accuracy and precision have
been established.
o Sizing test results were applied to 3% of samples. In 2020, sizing tests results
are into acceptable parameters.
• Density control was implemented from 2015 onwards; an acceptable density range
was established for each rock type unit for each deposit group of samples.
Verification of
sampling and
assaying
• Until 2018, sampling and assaying verification by independent personnel was not
undertaken at the time of drilling. However, drilling, core logging and sampling data
are entered by the geologists; assay results are entered by the geochemistry
geologist after the data was checked for outliers, sample swaps, performance of
duplicates, blanks and standards, and significant intersections are checked against
core log entries and core photos. Errors are rectified before data is entered into the
database.
• From 2019 to present, the workflow is: logging and sample definition is done by the
logging geology team. The geochemist geologist supervises the QAQC sample
insertion and sample Dispatch to the laboratory. Assays are reported directly to the
Database Team for uploading into the database. The geochemist geologist validates
the QAQC from each laboratory assay certificated. Subsequently, the data is released
for its use.

MMG | 2021 June Mineral Resources and Ore Reserves Statement - Appendix Page 15 of 205
Section 1 Sampling Techniques and Data
Criteria Commentary
• In 2019-2020 a twinning program was completed to test RC drilling against
previously completed Diamond Drill holes. The lithology, grade distribution and
variability between dry and wet samples comparison were made. Nine RC drill holes
twinned existing DDH.
• All drill holes are logged using tablets directly into the drill hole database (Geobank).
Before November 2014, diamond drill holes were logged on paper and transcribed
into the database. Assay results are provided in digital format (both spreadsheet and
PDF) by the laboratories and are automatically loaded into the database after
validation. All laboratory primary data and certificates are stored on the Las Bambas
server.
• The database has internal validation processes which prevent invalid or unapproved
records from being stored. Additional manual data validation occurs in Geobank and
Vulcan software before data is used for interpretation and Mineral Resources
modelling. The unreliable information is flagged and excluded from Mineral
Resources estimation work.
• No adjustments have been made to assay data – if there is any doubt about the data
quality or location, the drillhole is excluded from the estimation process.
Location of
data points
• In 2005 collar positions of surface drillholes were picked up by Horizons South
America using Trimble 5700 differential GPS equipment. From 2006, the Las Bambas
engineering personnel have performed all subsequent surveys using the same
equipment. Since 2014, drillholes are set out using UTM co-ordinates with a hand
held Differential Global Positioning System (DGPS) and are accurate to within 1m.
On completion of drilling, collar locations are picked up by the onsite surveyors using
DGPS (Trimble or Topcon). During the 2019 drilling campaign MMG team undertook
a survey of drillhole collar locations using Differential GPS. But they also used a TN14
Reflex for alignment of the drilling machine. These collar locations are accurate to
within 0.5m.
• During the 2014 due diligence process (2014) RPM independently checked five collar
locations at Ferrobamba and Chalcobamba with a handheld GPS and noted only
small differences and well within the error limit of the GPS used. RPM did not
undertake independent checking of any Sulfobamba drillholes. The collar locations
are considered accurate for Mineral Resources estimation work.
• In 2005 the drilling contractor conducted downhole survey’s using the AccuShot
method for non-vertical drillholes. Vertical holes were not surveyed. If the AccuShot
arrangement was not working, the acid test (inclination only) was used. Since 2006,
all drillholes are surveyed using Reflex Maxibor II equipment units which take
measurements every 3m. The downhole surveys are considered accurate for Mineral
Resources estimation work.
• The datum used is WGS 84 with a UTM coordinate system zone 18 South.
• In 2006 Horizons South America surveyed the topography at a scale of 1:1000 based
on aerophotogrammetric restitution of orthophotos. A digital model of the land was
generated every 10m and, using interpolation, contour lines were obtained every
metre. The maps delivered were drafted in UTM coordinates and the projections
used were WGS 84 and PSAD 56. A triangulated surface model presumably derived

MMG | 2021 June Mineral Resources and Ore Reserves Statement - Appendix Page 16 of 205
Section 1 Sampling Techniques and Data
Criteria Commentary
from this survey is in current use at site and is considered suitable for Mineral
Resources and Ore Reserves estimation purposes.
• Downhole surveys are now routinely completed by modern gyroscope techniques.
Instruments such as Champ Navigator , aligner and Gyro Sprint-IQ are employed.
Data spacing
and
distribution
• The Las Bambas mineral deposits are drilled on variable spacing dependent on rock
type (porphyry vs. skarn). Drill spacing typically ranges from 100m x 100m to 25m x
25m and is considered sufficient to establish the degree of geological and grade
continuity appropriate for Mineral Resources estimation and classifications applied.
• Drillhole spacing of approximately 25m x 25m within skarn hosted material and 50m
x 50m within porphyry hosted is considered sufficient for long term Mineral
Resources estimation purposes based on a drillhole spacing study undertaken in
2015. While the 25m spacing is suitable for Mineral Resource estimation, the Las
Bambas deposits tend to have short scale 5m - 10m variations within the skarn that
are not captured by the infill drilling at this spacing. This localised geological
variability is captured by mapping and drillhole logging.
• Diamond drillhole samples are not composited prior to routine chemical analysis;
however, the nominal sample length is generally 2m.
Orientation of
data in relation
to geological
structure
• Overall drillhole orientation is planned at 90 degrees to the strike of the mineralised
zone for each deposit. Drillhole spacing and orientation is planned to provide evenly
spaced, high angle intercepts of the mineralised zone where possible, thus
minimising sampling bias related to orientation. However, in some areas of
Ferrobamba where skarn mineralisation is orientated along strike, holes orientations
were not adjusted.
• Drilling orientation is not considered to have introduced sampling bias.
Sample security • Measures to provide sample security include:
o Adequately trained and supervised sampling personnel.
o Samples are stored in a locked compound with restricted access during
preparation.
o Dispatch to various laboratories via contract transport provider in sealed
containers.
o Receipt of samples acknowledged by receiving analytical laboratory by email
and checked against expected submission list.
o Assay data returned separately in both spreadsheet and PDF formats.
Audit and
reviews
• In 2015, an internal audit, checking 5% of the total samples contained in the acQuire
database (at that time) was undertaken comparing database entry values to the
original laboratory certificates for Cu, Ag, Mo, As and S. No material issues were
identified.
• Internal audits of the Inspectorate and Certimin laboratories have occurred twice a
month by Las Bambas personnel. Historically, any issues identified have been
rectified. Currently, there are no outstanding material issues.
• An independent third-party audit was completed by AMC Consultants (Brisbane
office) on the 2017 Mineral Resource model in February 2018. The audit identified
some minor improvements to the estimation process but concluded there were not
material issues or risks to long term mine planning.

MMG | 2021 June Mineral Resources and Ore Reserves Statement - Appendix Page 17 of 205
Section 1 Sampling Techniques and Data
Criteria Commentary
• Given to COVID19 pandemic there was no option to visit the laboratory in the year
2020, with the last visit being in 2019.
• AMC Consultants executed a third party independent audit of both the Ferrobamba
and Chalcobamba models in 2020. AMC have reported no material issues from the
audit.
Section 2 Reporting of Exploration Results
Criteria Commentary
Mineral
tenement and
land tenure
status
• The Las Bambas project has tenure over 41 Mineral Concessions. These Mineral
Concessions secure the right to the minerals in the area, but do not provide rights to
the surface land.
• Property of surface land is acquired through a separate process. The below map
outlines the 41 Mineral Concessions and the mine property owned by MMG.
• Tenure over the 41 Concessions is in good standing. There are no known
impediments to operating in the area.

MMG | 2021 June Mineral Resources and Ore Reserves Statement - Appendix Page 18 of 205
Section 2 Reporting of Exploration Results
Criteria Commentary
Exploration
done by other
parties
• The Las Bambas project has a long history of exploration by the current and previous
owners.
• Exploration commenced in 1966 with around 450km of surface diamond drilling
drilled to date.
• Initial exploration was completed by Cerro de Pasco followed by Cyprus, Phelps
Dodge, BHP, Tech, and Pro Invest prior to Xstrata Resources definition drilling which
commenced in 2005. All historical drilling is outlined in the table below.
• Glencore and Xstrata merged to form Glencore plc. In 2013, MMG Ltd, Guoxin
International Investment Corporation Limited and CITIC Metal Co. Ltd enter into an
agreement to purchase the Las Bambas project from Glencore plc.
Company Year Deposit Purpose Type # of DDH Drill size Metres Drilled
Cerro de Pasco Cyprus
1996 Chalcobamba Exploration DDH
6 Unknown
906
1996 Chalcobamba Exploration 9 1 367
Phelps Dodge 1997 Ferrobamba
Exploration DDH 4
Unknown 738
Chalcobamba 4 653
BHP 1997 Ferrobamba
Exploration DDH 3
Unknown 366
Chalcobamba 4 659
Pro Invest 2003 Ferrobamba
Exploration DDH 4
HQ 738
Chalcobamba 7 1 590
Xtrata
2005
Ferrobamba
Resource Evaluation DDH
109
HQ
26 840
Chalcobamba 66 14 754
Sulfobamba 60 13 943
2006
Ferrobamba
Resource Evaluation DDH
125
HQ
51 004
Chalcobamba 95 27 983
Sulfobamba 60 16 972
Charcas 8 2 614
Azuljaja 4 1 969
2007
Ferrobamba
Resource Evaluation DDH
131
HQ
46 710
Chalcobamba 134 36 618
Sulfobamba 22 4 997
2008 Ferrobamba
Resource Evaluation DDH 118
HQ 46 774
Chalcobamba 90 22 097
2010 Ferrobamba Resource Evaluation DDH 91 HQ 28 400
MMG
2014 Ferrobamba Resource Evaluation DDH 23 HQ 12 610
2015 Huancarane Sterilisation DDH 5 HQ 773
2015 Ferrobamba Resource Evaluation DDH 154 HQ 53 772
2016 Ferrobamba Resource Evaluation DDH 114
HQ 31 206
Chalcobamba Resource Evaluation DDH 13 1 880
2017 Ferrobamba Resource Evaluation DDH 49 HQ 1 181
2018 Ferrobamba Resource Evaluation DDH 82
HQ 48 022
Chalcobamba Resource Evaluation DDH 48 10 193
2019
Ferrobamba Resource Evaluation DDH 109 HQ 32 784
RC 52 6 804
Chalcobamba Resource Evaluation DDH 127 HQ 44 870
RC 3 654
2020
Ferrobamba Resource Evaluation DDH 31 HQ 7 854
RC 56 10 259
Chalcobamba Resource Evaluation DDH 105 HQ 20 232
RC 1 300
Total 1933 632 086 • Geology • Las Bambas is located in a belt of Cu (Mo-Au) skarn deposits associated with porphyry
type systems situated in south-eastern Peru. This metallogenic belt is controlled by
the Andahuaylas-Yauri Batholith of Eocene- Oligocene age, which is emplaced in
MMG | 2021 June Mineral Resources and Ore Reserves Statement - Appendix Page 19 of 205
Section 2 Reporting of Exploration Results
Criteria Commentary
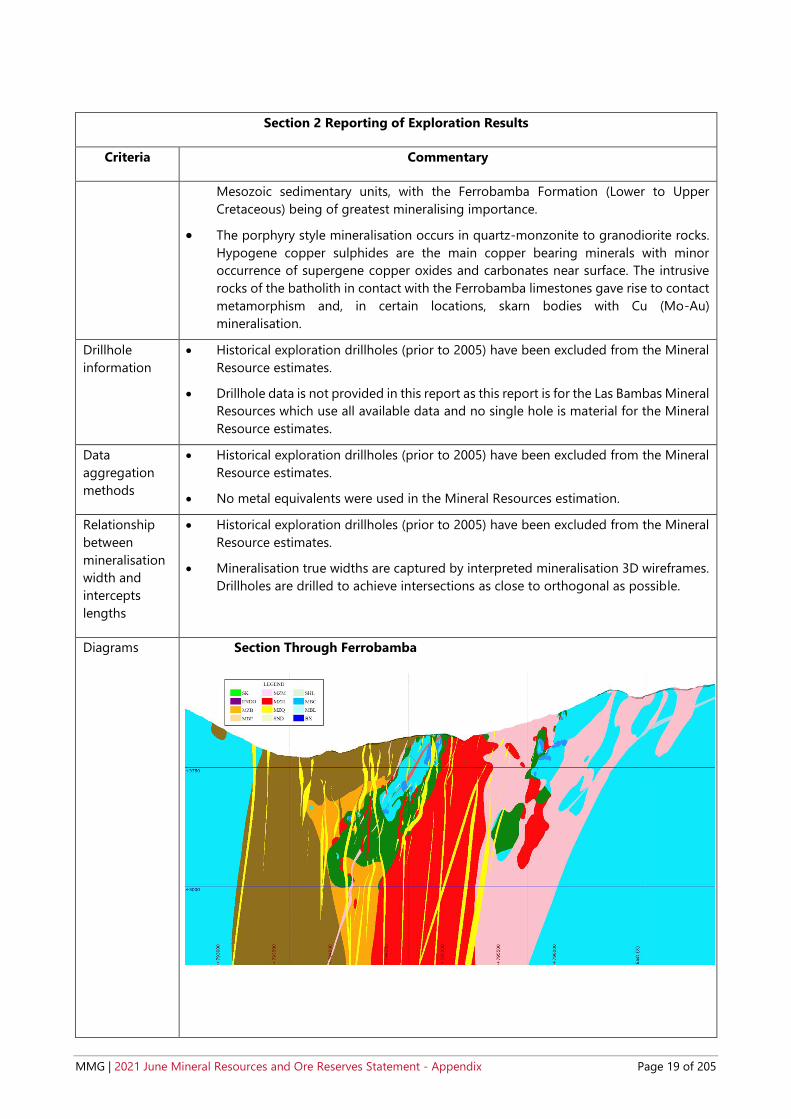
Mesozoic sedimentary units, with the Ferrobamba Formation (Lower to Upper
Cretaceous) being of greatest mineralising importance.
• The porphyry style mineralisation occurs in quartz-monzonite to granodiorite rocks.
Hypogene copper sulphides are the main copper bearing minerals with minor
occurrence of supergene copper oxides and carbonates near surface. The intrusive
rocks of the batholith in contact with the Ferrobamba limestones gave rise to contact
metamorphism and, in certain locations, skarn bodies with Cu (Mo-Au)
mineralisation.
Drillhole
information
• Historical exploration drillholes (prior to 2005) have been excluded from the Mineral
Resource estimates.
• Drillhole data is not provided in this report as this report is for the Las Bambas Mineral
Resources which use all available data and no single hole is material for the Mineral
Resource estimates.
Data
aggregation
methods
• Historical exploration drillholes (prior to 2005) have been excluded from the Mineral
Resource estimates.
• No metal equivalents were used in the Mineral Resources estimation.
Relationship
between
mineralisation
width and
intercepts
lengths
• Historical exploration drillholes (prior to 2005) have been excluded from the Mineral
Resource estimates.
• Mineralisation true widths are captured by interpreted mineralisation 3D wireframes.
Drillholes are drilled to achieve intersections as close to orthogonal as possible.
Diagrams Section Through Ferrobamba

MMG | 2021 June Mineral Resources and Ore Reserves Statement - Appendix Page 20 of 205
Section 2 Reporting of Exploration Results
Criteria Commentary
Section Through Chalcobamba
Section Through Sulfobamba
Balanced
reporting
• All drilling completed during the 2020 reporting period completed at Ferrobamba is
infill in nature. Historical exploration drillholes (prior to 2005) have been excluded
from the Mineral Resource estimates. A small number of holes were drilled at
Ferrobamba and Chalcobamba for the purpose of hydrogeology and geotechnical.
Other
substantive
exploration
data
• The exploration drilling campaign was directed to Chalcobamba SW; in the case of
Ferrobamba exploration has been addressed at depth, looking for geological
continuity particularly in the exoskarn.
• In previous years, several orebody knowledge studies have been carried out including
skarn zonation, vein densities, age dating, deposit paragenesis, clay / talc sampling,
and wall rock control of the skarn mineralisation. Recent work has focused on
relogging and standardizing the logging database, in order to be able to model the
intrusive units and limestone protoliths with greater accuracy and precision, to
benefit resource estimation, geotechnical designs and blast hole modelling.
Limestone protoliths are important for geotechnical characteristics, as inward dipping
slopes on several walls have already caused structural failures.
Further work • An ongoing program of regional and deposit scale mapping, cross sectional studies,
infrared spectral analyses, isotopic and petrographic studies and soil sampling.

MMG | 2021 June Mineral Resources and Ore Reserves Statement - Appendix Page 21 of 205
Section 2 Reporting of Exploration Results
Criteria Commentary
• A program of exploration assessment and targeting is currently underway to identify
exploration options for the Las Bambas leases.
• Permitting for regional exploration drilling is underway.
• Ongoing infill programs are planned to increase deposit confidence to support the
short to medium term mine plan, In addition, the Las Bambas Mineral Resource has
potential to grow to extend the life of the mine and/or support expansions and
replace the annual mined Ore Reserve depletion.
Section 3 Estimating and Reporting of Mineral Resources
Criteria Commentary
Database
integrity
• The following measures are in place to ensure database integrity:
o All Las Bambas drillhole data is stored in a Microsoft SQL Server database
(Geobank_LasBambasRE) on the Las Bambas site server, which is regularly
backedup following IT policies.
o Geological logging is entered directly into laptop computers which are uploaded
to the database. Prior to November 2014, diamond drillholes were logged on
paper logging forms and transcribed into the database. From November 2015
logging was entered directly into a customised interface using portable tablet
computers using AcQuire. From February 2019, logging was entered directly into
Geobank using internal validation rules set in the software.
o Assays are loaded directly into the database from encrypted digital files provided
from the assay laboratory.
o The measures described above ensure that transcription or data entry errors are
minimised.
• Data validation procedures include:
o A database validation project was undertaken in early 2015 checking 5% of the
assayed samples in the database against original laboratory certificates. No
material issues were identified.
o In April 2021, an internal database validation took place to check randomly 5%
of the assayed samples (data from 2020 and previous years) comparing recorded
information vs original laboratory certificates. No material issues were identified.
o The database has internal validation processes which prevent invalid or
unapproved records to be stored.
Site visits • The Competent Person has undertaken numerous site visits to Las Bambas since
acquisition. In the view of the Competent Person there are no material risks to the
Mineral Resources based on observations of the site’s geological practices.
• Several site visits to the Ferrobamba area and the Chalcobamba area have been
conducted but due to local community restrictions, the Competent Person has been
unable to visit Sulfobamba to date.
Geological
interpretation
• There is good confidence on the geological continuity and interpretation of the
Ferrobamba and Chalcobamba deposits. Confidence in the Sulfobamba deposit is
considered moderate due to limited drilling.

MMG | 2021 June Mineral Resources and Ore Reserves Statement - Appendix Page 22 of 205
Section 3 Estimating and Reporting of Mineral Resources
Criteria Commentary
• The 2021 geological interpretation was undertaken on sections orientated
perpendicular to the established structural trend of each deposit, using 3D implicit
modelling with Leapfrog® software. Section spacing for the interpretations varied
between deposits from 25m at Ferrobamba and Chalcobamba to 50m at Sulfobamba.
The geological logging, assay data, blast hole information and surface mapping were
used in the interpretation. The drilling and surface mapping were checked against
each other to ensure they were concordant. The updating of the lithological model
was carried out with the advice and validation of the Principal Exploration Geologist.
• No alternative interpretations have been generated for the Las Bambas mineralisation
and geology.
• Exploratory data analysis (EDA) indicated that the lithological characterisation used for
the 2010 geological interpretation were for the most part valid (with minor changes)
and were applied for the 2020 modelling. Each lithological unit was modelled
according to age, with the youngest modelled first. Structural considerations such as
plunge of the units, folding and faults were taken into consideration (where
information existed). Orthogonal sections were also interpreted to ensure lithological
continuity.
• In 2019, Chalcobamba’s geological model and interpretation was changed based on
a complete relog of the deposit combined with detailed surface mapping.
• Also in Ferrobamba 2020 model, a grade shell domain was updated in each porphyry
and marble based on 0.1% Cu cut off.
• In 2021 the 0.1%Cu gradeshell was extended to ENDO, MBC, MBL, MZB, MZH, MZQ-
MZD, MZM and MBF. These criteria are to better constrain the estimation of grade
and prevent over-smoothing or smearing. This model was constructed with
Leapfrog® using RBF Interpolant transforming numeric data into categoric, with the
use of interval selection.
• Oxidation domains were produced for the Ferrobamba and Chalcobamba models.
Oxidation domains were based on logged mineral species, sequential copper and acid
soluble copper to total copper assay ratios, each of which had a priority to represent
the oxidation field.
• Geological interpretations were then modelled as wireframe solids (based on the
sections) and were peer reviewed with the Principal Exploration Geologist and the
Mineral Resources Competent Person.
• Specific grade domains (copper and molybdenum) were not created, except for
interpreted, spatially coherent high-grade shoots at Sulfobamba. A domain cut-off of
0.8% Cu was used for the high-grade domain, and by Chalcobamba was used a
domain cut-off of 0.5% Cu. The introduction of the high-grade domain was supported
by EDA, contact plots, and change of support analysis.
Dimensions • The Las Bambas Mineral Resources comprise three distinct deposits; each have been
defined by drilling and estimated:
o Ferrobamba Mineral Resources occupies a footprint which is 2500m N-S and
1800m E-W and over 900m vertically.
o Chalcobamba Mineral Resources occupies a footprint of 2300m N-S and 1300m
E-W and 800m vertically

MMG | 2021 June Mineral Resources and Ore Reserves Statement - Appendix Page 23 of 205
Section 3 Estimating and Reporting of Mineral Resources
Criteria Commentary
o Sulfobamba Mineral Resources is 1800m along strike in a NE direction and 850m
across strike in a NW direction and 450m deep.
Estimation
and modelling
techniques
• Mineral Resources estimation for the three deposits has been undertaken in Vulcan
(Maptek) mining software with the following key assumptions and parameters:
• Ordinary Kriging interpolation has been applied for the estimation of Cu, Mo, Ag, Au,
As, Ca, Mg, Fe, S, CuAS (acid soluble copper), CuCN (cyanide soluble copper), CuRE
(residual copper) and density. This is considered appropriate for the estimation of
Mineral Resources at Las Bambas.
• The Ferrobamba, Chalcobamba and Sulfobamba block models utilised sub-blocking.
Models were then regularised for use in mine planning purposes.
• High erratic grade values were managed by upper grade capping based on statistical
assessment evaluated for all variables and domains. Consideration was also given to
the metal content above the top cap value.
• All elements were estimated by lithology domains. At Ferrobamba five different
orientation domains were identified in the skarn and were used in the interpolation.
Copper gradeshell greater than 0.1% Cu by lithology were made. These were used
together with lithology and oxidation domain models as contraints to the block
models.
• At Sulfobamba high-grade skarn shoots were identified and were used in the
interpolation of copper only. The boundaries between the low and the high-grade
skarn were treated as hard boundaries.
• Data compositing for estimation was set to 4m, which matches two times the majority
of drillhole sample lengths (2m), provides good definition across interpreted domains,
and adequately accounts for bench height.
• Variogram analysis was updated for Ferrobamba and Chalcobamba deposits while the
Sulfobamba model was not updated..
• No assumptions have been made about the correlation between variables. All
variables are comparably informed and independently estimated.
• Interpolation was undertaken in three to four passes.
• Check estimates using Discrete Gaussian change of support modelling have been
performed on all models. Block model results are comparable with previous Mineral
Resources estimations after changes due to drilling and re-modelling by the site.
• Assumptions about the recovery of by-products are accounted in the net-smelter
return (NSR) calculation which includes the recovery of Mo, Ag and Au along with the
standard payable terms.
• Arsenic is considered a deleterious element and has been estimated. It is not
considered a material risk. Sulphur, calcium and magnesium are also estimated to
assist in the determination of NAF (non-acid forming), PAF (potentially acid forming)
and acid neutralising material.
• Block sizes for all three deposits were selected based on Quantitative Kriging
Neighbourhood Analysis (QKNA). The Ferrobamba block size was 20m x 20m x 15m
with sub-blocks of 5m x 5m x 5m. Chalcobamba block size was set to 25m x 25m x
15m, with sub-blocks of 5m x 5m x 5m. The block size at Sulfobamba was set to 50m
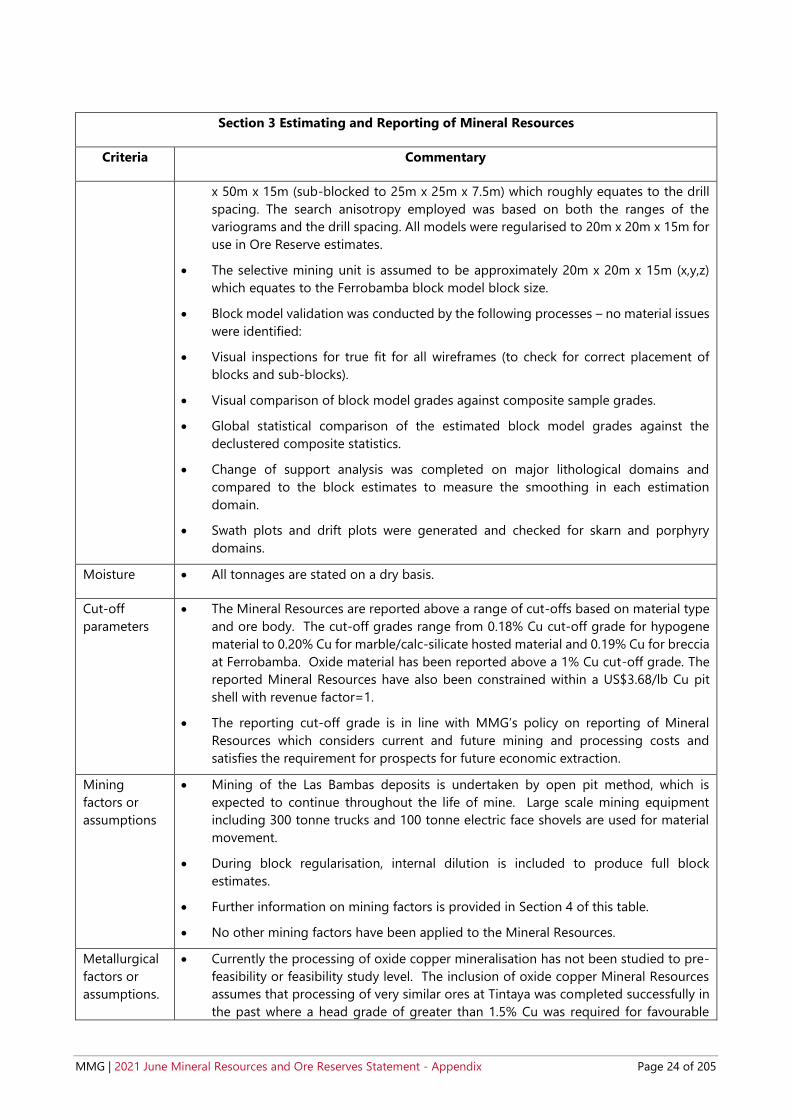
MMG | 2021 June Mineral Resources and Ore Reserves Statement - Appendix Page 24 of 205
Section 3 Estimating and Reporting of Mineral Resources
Criteria Commentary
x 50m x 15m (sub-blocked to 25m x 25m x 7.5m) which roughly equates to the drill
spacing. The search anisotropy employed was based on both the ranges of the
variograms and the drill spacing. All models were regularised to 20m x 20m x 15m for
use in Ore Reserve estimates.
• The selective mining unit is assumed to be approximately 20m x 20m x 15m (x,y,z)
which equates to the Ferrobamba block model block size.
• Block model validation was conducted by the following processes – no material issues
were identified:
• Visual inspections for true fit for all wireframes (to check for correct placement of
blocks and sub-blocks).
• Visual comparison of block model grades against composite sample grades.
• Global statistical comparison of the estimated block model grades against the
declustered composite statistics.
• Change of support analysis was completed on major lithological domains and
compared to the block estimates to measure the smoothing in each estimation
domain.
• Swath plots and drift plots were generated and checked for skarn and porphyry
domains.
Moisture • All tonnages are stated on a dry basis.
Cut-off
parameters
• The Mineral Resources are reported above a range of cut-offs based on material type
and ore body. The cut-off grades range from 0.18% Cu cut-off grade for hypogene
material to 0.20% Cu for marble/calc-silicate hosted material and 0.19% Cu for breccia
at Ferrobamba. Oxide material has been reported above a 1% Cu cut-off grade. The
reported Mineral Resources have also been constrained within a US$3.68/lb Cu pit
shell with revenue factor=1.
• The reporting cut-off grade is in line with MMG’s policy on reporting of Mineral
Resources which considers current and future mining and processing costs and
satisfies the requirement for prospects for future economic extraction.
Mining
factors or
assumptions
• Mining of the Las Bambas deposits is undertaken by open pit method, which is
expected to continue throughout the life of mine. Large scale mining equipment
including 300 tonne trucks and 100 tonne electric face shovels are used for material
movement.
• During block regularisation, internal dilution is included to produce full block
estimates.
• Further information on mining factors is provided in Section 4 of this table.
• No other mining factors have been applied to the Mineral Resources.
Metallurgical
factors or
assumptions.
• Currently the processing of oxide copper mineralisation has not been studied to pre-
feasibility or feasibility study level. The inclusion of oxide copper Mineral Resources
assumes that processing of very similar ores at Tintaya was completed successfully in
the past where a head grade of greater than 1.5% Cu was required for favourable

MMG | 2021 June Mineral Resources and Ore Reserves Statement - Appendix Page 25 of 205
Section 3 Estimating and Reporting of Mineral Resources
Criteria Commentary
economics. This assumption has been used at this stage for the oxide copper
mineralisation.
• Sulphide and partially oxidised material is included in the Mineral Resources which is
expected to be converted to Ore Reserves and treated in the onsite concentrator
facilities.
• No other metallurgical factors have been applied to the Mineral Resources.
Environmental
factors or
assumptions
• Environmental factors are considered in the Las Bambas life of asset work, which is
updated annually and includes provision for mine closure.
• Geochemical characterisation undertaken in 2007, 2009 and 2017 indicate most of the
waste rock from Ferrobamba and Chalcobamba deposits to be Non-Acid Forming
(NAF) and that no acid rock drainage from the waste rock dumps from these two pits
should be expected. Waste rock samples from Sulfobamba were found to contain
higher concentrations of sulphur and that 30% to 40% of waste rock could be
Potentially Acid Forming (PAF). Suitable controls will be implemented for all PAF waste
rock, including investigating opportunities for backfill into pit voids. Additional
geochemical characterisation work is ongoing.
• Tailings generated from processing of Ferrobamba and Chalcobamba were determined
to be NAF. Geochemical characterisation of tailings generated from processing of
Sulfobamba ores is currently under assessment, however for environmental assessment
purposes it was assumed to have PAF behaviour. Current Life of Asset schedules have
Ferrobamba tailings processing scheduled for approximately 3 years after Sulfobamba
tailings are processed. A closure plan was submitted and approved by the regulator in
2016 and describes the encapsulation method for Sulfobamba tailings.
• Further geochemical characterisation studies on waste rock and tailings samples are
currently underway to support the Environmental Impact Study Modification.
• On 13 July 2020, the environmental technical report was submitted to SENACE that
included: Ferrobamba Phase 7A, drilling, processing facilities, truck shop relocation and
ancillary components for Ferrobamba and Chalcobamba. This technical report is under
evaluation by the authorities.
• Las Bambas has started the process for the 4th modification to include: Ferrobamba Pit
expansion, Chalcobamba Phase II, TSF 1 expansion, drilling and others.
• Las Bambas has started the process for new environmental technical report to include:
Ferrobamba Phase 6A, Chalcobamba SW, increase of concentrator plant in 5% (152,230
Tn/d), relocation of overland conveyor (#4) and others.
• In February 2019 the file for the authorisation to start activities for Chalcobamba was
presented to MINEM, the approval of the AIA was planned for 31 July 2020. However,
due to the current situation caused by the health crisis (COVID 19), and now
government related issues, the approval of this permit has been delayed until 31 March
2022. Las Bambas is working in conjunction with the Government to achieve such
approval.
• Based on the current TSF design and the design assumptions for dry settled density
and beach angle, the TSF currently under construction at Las Bambas has a final
capacity of 784Mt of tailings from processing 800Mt. Three studies have been
conducted looking at increasing tailings storage capacity at Las Bambas:
• Tailings characterization test work to assess final settled density and beach slope
in current TSF.
• Options assessment to increase capacity at TSF currently under construction.
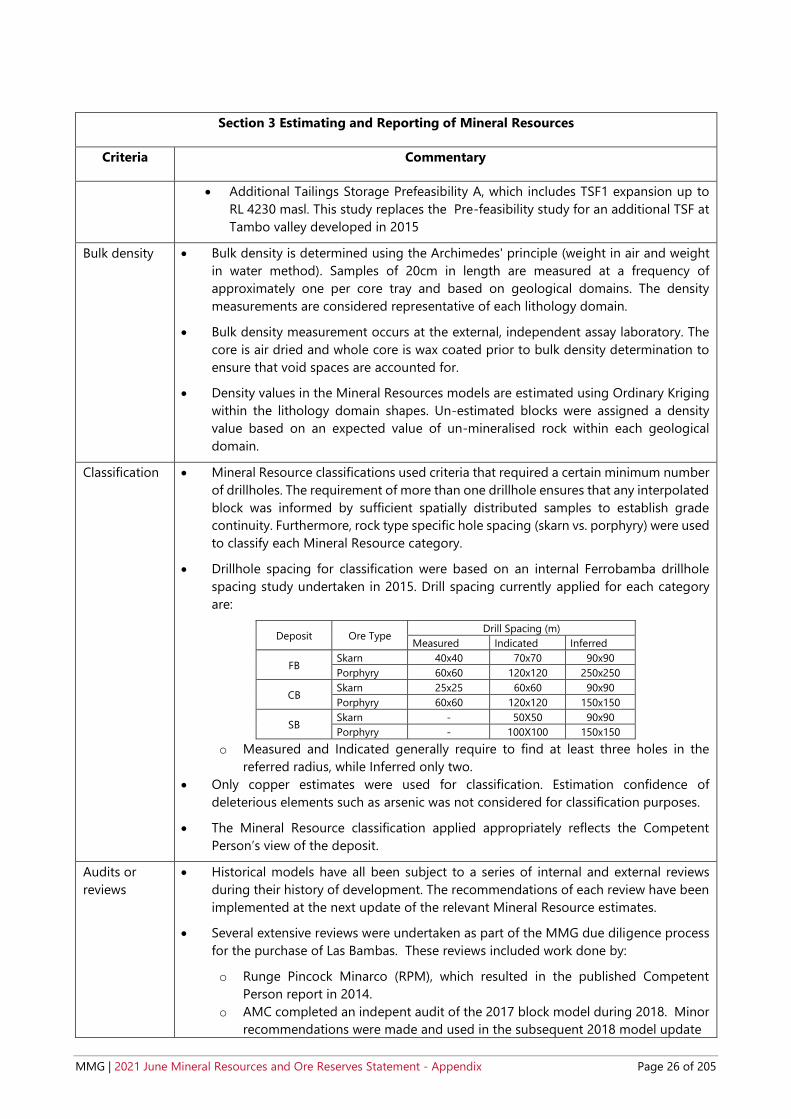
MMG | 2021 June Mineral Resources and Ore Reserves Statement - Appendix Page 26 of 205
Section 3 Estimating and Reporting of Mineral Resources
Criteria Commentary
• Additional Tailings Storage Prefeasibility A, which includes TSF1 expansion up to
RL 4230 masl. This study replaces the Pre-feasibility study for an additional TSF at
Tambo valley developed in 2015
Bulk density • Bulk density is determined using the Archimedes' principle (weight in air and weight
in water method). Samples of 20cm in length are measured at a frequency of
approximately one per core tray and based on geological domains. The density
measurements are considered representative of each lithology domain.
• Bulk density measurement occurs at the external, independent assay laboratory. The
core is air dried and whole core is wax coated prior to bulk density determination to
ensure that void spaces are accounted for.
• Density values in the Mineral Resources models are estimated using Ordinary Kriging
within the lithology domain shapes. Un-estimated blocks were assigned a density
value based on an expected value of un-mineralised rock within each geological
domain.
Classification • Mineral Resource classifications used criteria that required a certain minimum number
of drillholes. The requirement of more than one drillhole ensures that any interpolated
block was informed by sufficient spatially distributed samples to establish grade
continuity. Furthermore, rock type specific hole spacing (skarn vs. porphyry) were used
to classify each Mineral Resource category.
• Drillhole spacing for classification were based on an internal Ferrobamba drillhole
spacing study undertaken in 2015. Drill spacing currently applied for each category
are:
Deposit Ore Type Drill Spacing (m)
Measured Indicated Inferred
FB Skarn 40x40 70x70 90x90
Porphyry 60x60 120x120 250x250
CB Skarn 25x25 60x60 90x90
Porphyry 60x60 120x120 150x150
SB Skarn - 50X50 90x90
Porphyry - 100X100 150x150
o Measured and Indicated generally require to find at least three holes in the
referred radius, while Inferred only two.
• Only copper estimates were used for classification. Estimation confidence of
deleterious elements such as arsenic was not considered for classification purposes.
• The Mineral Resource classification applied appropriately reflects the Competent
Person’s view of the deposit.
Audits or
reviews
• Historical models have all been subject to a series of internal and external reviews
during their history of development. The recommendations of each review have been
implemented at the next update of the relevant Mineral Resource estimates.
• Several extensive reviews were undertaken as part of the MMG due diligence process
for the purchase of Las Bambas. These reviews included work done by:
o Runge Pincock Minarco (RPM), which resulted in the published Competent
Person report in 2014.
o AMC completed an indepent audit of the 2017 block model during 2018. Minor
recommendations were made and used in the subsequent 2018 model update

MMG | 2021 June Mineral Resources and Ore Reserves Statement - Appendix Page 27 of 205
Section 3 Estimating and Reporting of Mineral Resources
Criteria Commentary
o In addition, significant review work was carried out by AMEC in 2019 on the 2018
model.
o AMC completed an independent audit of the 2020 block model from August to
November 2020. Minor recommendations were made and the higher ones were
raised.
o No fatal flaws were detected in any of these reviews and all recommendations
were considered and addressed in the 2021 Mineral Resources update.
• A self-assessment of all 2021 Mineral Resource modelling was completed by the
Competent Person using a standardised MMG template. No fatal flaws were detected
in the review. Areas previously identified for improvement have been addressed and
include:
o Mineral Resource classification for the Ferrobamba block model uses a wireframe
shape to constrain the final Mineral Resource category.
o Sequential copper results are used to model an oxidation type domain. This is
used to constrain the soluble copper in sulfuric acid, cyanidable copper and the
residual in the estimation process.
Discussion of
relative
accuracy /
confidence
• There is high geological confidence of the spatial location, continuity and estimated
grades of the modelled lithologies within the Mineral Resources. Minor, local
variations are expected to occur on a sub-25m scale that is not detectable by the
current drill spacing. Global declustered statistics of the composite databases on a
domain basis were compared against the block model. Block model estimates were
within 10% of the composite database. Local swath plots were undertaken for each
deposit. All plots showed appropriate smoothing of composite samples with respect
to estimated block grades.
• The Las Bambas Mineral Resource estimates are considered suitable for Ore Reserve
estimation and mine design purposes. The Mineral Resources model was evaluated
using the discrete Gaussian change of support method for copper in most domains.
Based on the grade tonnage curves generated, the Mineral Resources model should
be a reasonable predictor of tonnes and grade selected during mining.
• Reconciliation of the last 12 months of production indicates that the mine planning
block model has over-called the ore control model (F1) by 1% for copper metal. This
comprises a 6% over-call of grade and a 5% under-call of tonnage.
Block Model Factor Grade Tonnes Metal
Year to June 2021 2021 F1 1.00 1.02 1.01
F2 0.95 0.97 0.91
F3 0.94 0.98 0.92
1 July 2020 to 30
June 2021
2021 F1 0.94 1.05 0.99
F2 0.95 0.98 0.92
F3 0.89 1.03 0.92
1 July 2019 to 30
June 2020
2021 F1 0.98 0.99 0.98
F2 0.98 0.98 0.96
F3 0.96 0.97 0.94
All (since commercial
production start)
2021 F1 1.00 1.03 1.03
F2 0.96 0.95 0.91
F3 0.96 0.99 0.94
F1 Ore Control / Ore Reserve
F2 Mill / Ore Control
F3 Mill / Ore Reserve

MMG | 2021 June Mineral Resources and Ore Reserves Statement - Appendix Page 28 of 205
Section 3 Estimating and Reporting of Mineral Resources
Criteria Commentary
• The F1 reconciliation indicates that the 2021 model has under-called metal by 1% for
the year to June 2021 compared to over-calling by 2% for the year to June 2020.
• The F3 (Mill / Reserve) reconciliation indicates that the Reserve model has over-called
metal by 8%, and under-called tonnes by 3% for the year ended June 2021. The
project to date reconciliation shows the Reserve has over-called metal production (F3)
by 6% while the F1 metal of 3% under-call is consistent with prior years’ models.
• Further analysis using the F2 reconciliation factor (Mill / Grade Control) for the year
ending June 2021 shows that metal is 8% lower, comprising 2% lower tonnes and 5%
lower grade received by the mill than estimated by the mine. The F2 factor result
indicates that ore loss and dilution are issues that need to be addressed. Both the F2
and F3 factors are affected by ore loss and dilution.
• The accuracy and confidence of the 2021 Mineral Resource estimates are
considered suitable for use as an input to Ore Reserve estimation and public
reporting by the Competent Person. MMG internal procedures for external 3rd
party reviews are triggered upon a 10% variance (excluding depletion) year on year.

MMG | 2021 June Mineral Resources and Ore Reserves Statement - Appendix Page 29 of 205
3.2.3 Statement of Compliance with JORC Code Reporting Criteria and Consent to Release
This Mineral Resources statement has been compiled in accordance with the guidelines defined in the 2012
Edition of the Australasian Code for Reporting of Exploration Results, Mineral Resources and Ore Reserves
(“2012 JORC Code”).
3.2.3.1 Competent Person Statement
I, Hugo Rios, confirm that I am the Competent Person for the Las Bambas Mineral Resources section of this
Report and:
I am a full-time employee of MMG Las Bambas at the time of the estimation.
I have disclosed to the reporting company the full nature of the relationship between myself and the company,
including any issue that could be perceived by investors as a conflict of interest.
I verify that the Las Bambas Mineral Resources section of this Report is based on and fairly and accurately
reflects in the form and context in which it appears, the information in my supporting documentation relating
to the Las Bambas Mineral Resources.
3.2.3.2 Competent Person Consent
Pursuant to the requirements Clause 9 of the JORC Code 2012 Edition (Written Consent Statement)
With respect to the sections of this report for which I am responsible – the Las Bambas Mineral Resources - I
consent to the release of the 2020 Mineral Resources and Ore Reserves Statement as at 30 June 2020 Executive
Summary and Technical Appendix Report and this Consent Statement by the directors of MMG Limited:
_______________________________________________ ____________________________________________
Hugo Rios MAusIMM(CP) (#311727) Date:
_______________________________________________ ____________________________________________
Signature of Witness: Witness Name and Residence: (e.g. town/suburb)
• I have read and understood the requirements of the 2012 Edition of the Australasian Code for Reporting
of Exploration Results, Mineral Resources and Ore Reserves (JORC Code, 2012 Edition).
• I am a Competent Person as defined by the JORC Code, 2012 Edition, having five years’ experience that
is relevant to the style of mineralisation and type of deposit described in the Report, and to the activity
for which I am accepting responsibility.
• I am a Member of The Australasian Institute of Mining and Metallurgy and hold Chartered Professional
accreditation in the field of Geology
• I have reviewed the relevant Las Bambas Mineral Resources section of this Report to which this Consent
Statement applies.
This signature was scanned for the exclusive use
in this document – the MMG Mineral Resources and Ore Reserves Statement as at 30 June 2021 – with the author’s approval. Any other use is not
authorised.
This signature was scanned for the exclusive use in
this document – the MMG Mineral Resources and Ore Reserves Statement as at 30 June 2021 – with the
author’s approval. Any other use is not authorised.
01/10/2021
Jorge Valverde
Lima, Peru

MMG | 2021 June Mineral Resources and Ore Reserves Statement - Appendix Page 30 of 205
3.3 Ore Reserves – Las Bambas
3.3.1 Results
The 2021 Las Bambas Ore Reserves are summarised in Table 5. All data reported here is on a 100% asset basis.
MMG’s attributable interest in Las Bambas is 62.5%.
Table 5 2021 Las Bambas Ore Reserves tonnage and grade (as at 30 June 2021)
Las Bambas Ore Reserves
Contained Metal
Ferrobamba Primary
Copper1
Tonnes Copper Silver Gold Mo Copper Silver Gold Mo
(Mt) (% Cu) (g/t
Ag)
(g/t
Au) (ppm) (kt) (Moz) (Moz) (kt)
Proved 360 0.61 2.7 0.05 220 2,200 31 0.60 80
Probable 160 0.77 3.5 0.07 190 1,200 18 0.38 31
Total 520 0.66 2.9 0.06 210 3,400 49 0.97 110
Chalcobamba Primary Copper2
Proved 83 0.60 1.9 0.02 140 500 5 0.06 12
Probable 140 0.74 2.7 0.03 120 1,000 12 0.15 17
Total 220 0.69 2.4 0.03 130 1,500 17 0.21 28
Sulfobamba Primary
Copper3
Probable 56 0.79 5.8 0.03 160 440 10 0.05 9
Total 56 0.79 5.8 0.03 160 440 10 0.05 9
Sulphide Stockpiles
Proved 26 0.39 1.8 - 140 100 1.5 - 3.7
Total 26 0.39 1.8 - 140 100 1.5 - 3.7
Total Contained Metal 820 0.67 3.0 180 5,500 78 1.2 150
1 0.20% to 0.24% Cu cut-off grade based on rock type and recovery
2 0.22% to 0.29% Cu cut-off grade based on rock type and recovery
3 0.24% to 0.29% Cu cut-off grade based on rock type and recovery
Figures are rounded according to JORC Code guidelines and may show apparent addition errors
Contained metal does not imply
recoverable metal

MMG | 2021 June Mineral Resources and Ore Reserves Statement - Appendix Page 31 of 205
3.3.2 Ore Reserves JORC 2012 Assessment and Reporting Criteria
The following information provided in Table 6 complies with the 2012 JORC Code requirements specified by
“Table-1 Section 4” of the Code. Each of the items in this table has been summarised as the basis for the
assessment of overall Ore Reserves risk in the table below, with each of the risks related to confidence and/or
accuracy of the various inputs into the Ore Reserves qualitatively assessed.
Table 6 JORC 2012 Code Table 1 Assessment and Reporting Criteria for Las Bambas Ore Reserve 2021
Section 4 Estimation and Reporting of Ore Reserves
Criteria Commentary
Mineral Resource
estimates for
conversion to Ore
Reserves
• Mineral Resource block models have been updated by Resource Geology within
Strategic Planning and reviewed by the Mineral Resource Competent Person. The
block models contain descriptions for lithology, Mineral Resources classification,
mineralisation, ore type, and other variables described in model release
memorandums. The ore loss modifying factors have been incorporated in the
block models via a variable. These block models were used for the pit optimisation
purpose using corporately approved assumptions for cost and metal prices.
GEOVIA Whittle was the software package used for this purpose.
MR block models Ferrobamba Chalcobamba Sulfobamba
Previously
Completed by
Helber
Holguino/Andrew
Fowler
Helber
Holguino/Andrew
Fowler
Helber
Holguino/Andrew
Fowler
Updated by Helber Holguino Helber Holguino Helber Holguino
Reviewed by Hugo Rios Hugo Rios Hugo Rios
Memorandum date 17 May 2021 28 Apr 2021 28 Apr 2021
Block model file lb_fe_mor_2104v14.bm
f lb_ch_mor_2103.bmf lb_sb_1704_mor_v2.bmf
Block size (m) 20 x 20 x 15 20 x 20 x 15 20 x 20 x 15
Model rotation 35° 0° 0°
• The Measured and Indicated Mineral Resources quantities are inclusive and not
additional to the Ore Reserves reported.
Site visits • The Competent Person has undertaken numerous site visits to Las Bambas since
commercial production commenced. Among other activities, the visits include
discussions with relevant people associated with Ore Reserve modifying factors
including Geology, Grade Control, Geotechnical, Mine Planning and Mining
Operations, Metallurgy, Tailings and Waste Storage, and Environmental Areas.
The outcomes from the visits have included reaching a common understanding
in those areas, in addition to achieving other specific purposes of each trip. Site
visits were also carried out by contributing experts listed in the expert input table
at the end of this document.
Study status
• The Las Bambas Ore Reserve estimates were prepared based on Feasibility and
Pre-Feasibility level studies that include the following:
o Bechtel Feasibility Study 2010; and
o TSF-1 PFS-A Design Report, Khlon Crippen Berger, 2021;
o PFS-A Hydrogeology Study – TSF-1 Expansion, Flosolutions, 2021; and
o PFS-A Report – Tailings, Ausenco, 2021.
• Additional work/studies include:
o Glencore Mineral Resources and Ore Reserves Report 2013;

MMG | 2021 June Mineral Resources and Ore Reserves Statement - Appendix Page 32 of 205
o Audit of Las Bambas Ore Reserves 2013, by Mintec, Inc in October
2013;
o MMG Competent Person Report prepared by Runge Pincock Minarco
(RPM), June 2014;
o MMG Las Bambas cut-Off Grade Report 2021;
o Rock Mass Model Update by Golder (2017);
o Structural Geology Mode Update by JFSGC (2017);
o Hydrogeology Model Update by Itasca (2018);
o Geotechnical guidance by Piteau (2009-2010);
o Update and validation of detailed slope engineering for waste dumps
1, Anddes Associates SAC, 2017;
o Geotechnical work conducted by site personnel and Itasca, 2015 -
2017;
o 20190711_Memo Ferrobamba Geotechnical Design Guidance for 2019
(Produced by ITASCA 2019 and Las Bambas Geotechnical Personnel) ;
o 20200802_Geotechnical Design Guidance 2020 (produced by Las
Bambas team;
o Geotechnical Slope Design Guidance for Ferrobamba - Sulfobamba
2021;
o Geotechnical Design Guidance - Chalcobamba 2021;
o Sulfobamba Metallurgy Testing, 2015;
o Tailings Storage Facility – Initial review of options to extend filing life,
ATCW, 2015;
o Las Bambas 30 June 2020 Ore Reserve Audit
• 2021 Life of Mine (LoM) Reserve Case was produced as part of the MMG planning
cycle demonstrates this is technically achievable and economically viable and that
material Modifying Factors have been considered
Cut-off
parameters
• MMG Board approved metal prices for the cut-off calculation have been provided
by MMG Group Finance in accordance with the MMG MROR Standard.
• Costs were estimated based on information provided by the Las Bambas Finance
Department.
• The breakeven cut-off (BCoG) 2021 has been calculated with updated metal prices
and costs and is applied to the copper grade. (Source: 2021 Las Bambas CoG
Report).
• Cut-off grade has been determined for each ore-type within each deposit:
Cut-off grades by ore-type for Ferrobamba:
COG Component Ferrobamba by Ore Type
FSSL FSSM FPSL FPSM FMSL FBRE
BCOGinpit 0.20% 0.22% 0.20% 0.24% 0.24% 0.22%
Cut-off grades by ore-type for Chalcobamba:
COG Component Chalcobamba by Ore Type
CSSL CSSM CSML CSMM CPSL CPSM CBRE
BCOGinpit 0.22% 0.26% 0.22% 0.26% 0.22% 0.26% 0.29%
Cut-off grades by ore-type for Sulfobamba:
COG Component Sulfobamba by Ore Type
SSSL SSSM SPSL SPSM SBRE
BCOGinpit 0.24% 0.29% 0.24% 0.28% 0.25%

MMG | 2021 June Mineral Resources and Ore Reserves Statement - Appendix Page 33 of 205
Mining factors
or assumptions
• The method of Ore Reserves estimation included pit optimisation, final pit and
phase designs, consideration of mining schedule and all modifying factors.
Additional information is provided in this section.
• The mining method selected for the Las Bambas operation is open cut mining,
which enables bulk mining of these large low to moderate grade mineral deposits
that are outcropping to sub-cropping. Three deposits, Ferrobamba, Chalcobamba
and Sulfobamba are each mined in separate open pits. Mining is by way of
conventional truck and shovel operation. This method and selected mining
equipment are appropriate for these deposits.
• An extension of Chalcobamba pit in the southwest sector (CBSW) is included in
the reserve, after the completion of various assessments and studies, including
mine planning, geological confirmation and hydrogeological, geotechnical and
metallurgical studies. It also forms part of the Las Bambas permitting plan. .
• The geotechnical recommendations were provided by the Geotechnical &
Hydrogeology team at Las Bambas in coordination with MLB Operational
Excellence and Strategic Planning (OE&SP) and MMG Operational and Technical
Excellence (OTE). These recommendations are based on studies performed by site
personnel and Itasca (2017 to 2021). The pits are sectored by structural domains
and geotechnical sectors.
• Ferrobamba Design sectors NE and E were updated based on the new structural
model released on Oct. 2019. Sectors W1 & W2 were also updated for Phase 5
based on final bench performance. No major changes where incorporated on
Final Phase design parameters.
• Chalcobamba Bench Face Angles for design sectors CH-N, CH-E, CH-SE, CH-S2,
CH-S1 and CH-SW on upper level increased from 65º to 70º as structural and rock
mass conditions on the sectors are favourable. The change will allow an increase
in effective catchment berm. No change to IRA was introduced.
• Geotechnical slope design angles for 2021 were reported on the memorandum
(Geotechnical Slope Design Guidance Ferrobamba - Sulfobamba 2021 and
Geotechnical Design Guidance - Chalcobamba 2021). The summary table for
slope design angles, by pit, is presented below:

MMG | 2021 June Mineral Resources and Ore Reserves Statement - Appendix Page 34 of 205
Geotechnical recommendations for Ferrobamba
Design Parameters
Design
Sector Level (masl)
Bench
height
(m)
Berm
Face
Angle
(BFAº)
Berm
Width
(m)
Interramp
angle
(IRA º)
Interamp
height
(m)
Decoupling
Berm
width (m)
NW (P3) 4080-3900 15 80 14 42
150 25
Below 3900 30 70 13.4 51 30
W1 (P3 / P5)
4140 - 3975 15 80 14 42
150
25
Below
3975mRL 30 70 13.4 51 30
Below Ramp, 02 single benches are maintained with IRA: 45°, BFA: 70° and CB:10.0 m
W2 (P5)** 4110-4035
LMT_S2 15 37 5.0 31 105 20
W2 (P5) 4035 - 3855 15 70 8.5 47 105 25
At main ramp section 3 leave a double decoupling berm on 3865 mrl
SE 4095 - 3750 15 70 11.2 42
150 25
Below 3750 30 70 13.4 51 30
NE (P5 / FP) * 15 70 11.2 42 120 25
NW (P5) * 15 70
9 47 150
25
NW (FP) * 30 12 53 30
W1 (FP) * 15
70 9 47
150 25
* 30 12 53 30
W2 (FP) * 15 70 9 47 105 25
CE (P5) * 30 70 12 53 150 30
SE (FP) Surface -
3750 15
70 9 47
150 25
SE (P5/FP) Below 3750 30 12 53 30
SW (P6 / FP) Use final pit
graph
Above T-6
Channel 15
70
11.2 42 105 30
* 30 13 51 150
30
* 15 9 47 25
E (P5) 4155 - 4035 In-pit Waste dump area. Use BFA=37º and Bench Height of 15m
4030-3660 15 70 12.4 40 60-75 25
E (FP) * 15 70 9 47 105 25

MMG | 2021 June Mineral Resources and Ore Reserves Statement - Appendix Page 35 of 205
Geotechnical recommendations for Chalcobamba:
Chalcobamba Geotechnical Design Parameters
Zone Level (masl) BFA
Bench
Height
(m)
Berm
Width
(m)
IRA (°) Decoupling
Height (m)
Ramp
Width
Decoupling
width (m)
CH-S2 4330 - 4450 70 15 8 48,1
150 43 30 4450 - 4540 70 15 9.5 45,0
CH-SE 4255 - 4465 70 15 8 48,1
150 43
30 4465 - 4555 70 15 9.5 45,0
CH-E 4165 - 4435 70 15 8 48,1
150 43
30 4435 - 4540 70 15 9.5 45,0
CH-N 4165 - 4360 70 15 8 48,1
120 43
30 4360 - 4465 70 15 9.5 45,0
CH-NW 4165 - 4285 70 15 8 48,1
120 43
30 4285 - 4375 65 15 8 45,0
CH-W 4165 - 4330 70 15 8 48,1
120 43
30 4330 - 4420 65 15 8 45,0
CH-SW 4315 - 4435 70 15 8 48,1
150 43
30 4435 - 4525 70 15 9.5 45,0
CH-
SW2
4225 - 4450 70 15 8 48,1 150
43 30
4450 - 4555 70 15 9.5 45,0
All
Quaternary
(QT) &
Overburden
65 10 10.2 34 n/a n/a n/a
Geotechnical recommendations for Sulfobamba
Ore
reserve
sectors
Levels
Bench
Height
(m)
Bench
Face
Angle
(BFA º)
Berm
width
(m)
Interamp
Angle
(IRA º)
Interamp
/ stack
height
(m)
Decoupling
Berm width
(m)
SU-N 4460 – 4310mRL 15 65 8 45 150 30
SU-NE
4420 – 4345mRL 15 65 8 45 150 30
In fresh rock 15 70 8 48.1
SU-E
4565 – 4445mRL 15 65 8 45 150 30
In fresh rock 15 70 8 48.1
SU-S 4565 - 4475mRL 15 65 8 45
150 30 In fresh rock 15 70 8 48.1
SU-W 4565 – 4505mRL 15 65 8 45
150 30 In fresh rock 15 70 8 48.1
• A program of additional geotechnical data collection and analysis is currently
being implemented for 2021 for Ferrobamba and Chalcobamba. This will improve
confidence in the slope design guidance at these deposits. The bulk of the
findings from the data collection and analysis will be available for inclusion in the
2022 Ore Reserve slope design guidance.
• The 2021 Mineral Resources models for Ferrobamba and Chalcobamba, which
incorporated the additional ore loss variable, have been used for the updated
2021 Ore Reserves. The Mineral Resources model for Sulfobamba remained the

MMG | 2021 June Mineral Resources and Ore Reserves Statement - Appendix Page 36 of 205
same as 2019 except for an update of the ore loss variable and incorporation of
ore loss due to the artisanal mining. All models were regularised to 20m x 20m x
15m.
• The pit optimisation was developed for the three open pits based on the 2021
Mineral Resource block models. The strategy for the final pit selection was based
on the NPV by pit shell at revenue factor (RF) 1. Final pit designs that incorporate
more practical mining considerations were carried out using those optimisation
shells.
• Dilution has been accounted for in the regularised block model used for the Ore
Reserves estimate. In addition, the ore loss block model variable has been
populated with the following modifying factors:
o 3% ore loss for all ore types for all pits.
o An additional 2% ore loss for Ferrobamba Phase 03 which are the main
ore sources for 2021.
This is supported by the reconciliation results.
• The reconciliation results summarised in the Mineral Resource section
Block Model Factor Grade Tonnes Metal
Year to June 2021 2021 F1 1.00 1.02 1.01
F2 0.95 0.97 0.91
F3 0.94 0.98 0.92
1 July 2020 to 30
June 2021
2021 F1 0.94 1.05 0.99
F2 0.95 0.98 0.92
F3 0.89 1.03 0.92
1 July 2019 to 30
June 2020
2021 F1 0.98 0.99 0.98
F2 0.98 0.98 0.96
F3 0.96 0.97 0.94
All (since commercial
production start)
2021 F1 1.00 1.03 1.03
F2 0.96 0.95 0.91
F3 0.96 0.99 0.94
F1 Ore Control / Ore Reserve
F2 Mill / Ore Control
F3 Mill / Ore Reserve
• In early June 2019, Las Bambas convened technical stakeholders to develop and
agree to a scheme to apply a modifying mining factor to support construction of
mine plans more closely aligned with reconciliation outcomes. These modifying
factors were introduced to the Resources Models under the additional ore_loss
variable.
• A program to address these issues was set and significant progresses have been
made in the areas of resource estimation, grade control practices, blasting
practices/designs, monitoring blast movement, accurate positioning of shovels,
better design of ore polygons and other remediations. The continuous
improvement program is still on going.
• 2021 reconciliation results have indicated significant progress with the 2020
geological model with regards to ore tonnage estimation (F1t=1.05 or 5% under-
call), this has been addressed by the new 2021 model.
• 2021 reconciliation results support the continuing application of the ore loss
factors as outlined above. The Competent Person considers this to be appropriate
for the 2021 Ore Reserve estimation based on the current information.
• After the internal review which was carried out in 2019 on reconciliation, involving
all the key areas including, geological modelling, ore control, operations, mine

MMG | 2021 June Mineral Resources and Ore Reserves Statement - Appendix Page 37 of 205
planning, and operational excellence, differences were controlled and now
monthly meetings are held to follow up.
• A Midterm model was introduced to inform the ore control process, among other
initiatives.
• Additional studies for mining dilution and recovery will be undertaken when more
reconciliation data is available, and the current improvement programs are
implemented in the mining operation.
• In the pit, the minimum mining width is 70m; the Selective Mining Unit (SMU) has
been set at 20m x 20m x 15m.
• Inferred Mineral Resource material has not been included in the pit optimisation
or in the Ore Reserves estimates.
• The main mining infrastructure includes; crusher, overland conveyor, tailings and
waste storage facilities, stockpiles, roadways/ramps, workshops and so forth.
• All infrastructure requirements are established for Ferrobamba. Further capital
investment is required for infrastructure to support the needs of Chalcobamba
and Sulfobamba.
• The required infrastructure for Chalcobamba pit has been identified and included
in the current approved Environment Impact Assessment (EIA), with 50% of the
north waste dump not located within the property boundary. Another location
that is fully within the property boundary has been identified and used in the LoA
planning; however, it is yet to be evaluated by environmental/legal/exploration
teams. In the 3rd EIA amendment, approval drilling for studies has been included
and the 4th EIA amendment will include principal components for Chalcobamba
(crushing and conveyor), with waste dump fully within the property boundary.
• The planned Sulfobamba infrastructure has been identified within the Las Bambas
mining concession, however the infrastructure and deposit are not located within
the area of MMG land ownership.
Metallurgical
factors or
assumptions
• Metallurgical copper concentration process comprises the following activities;
crushing, grinding and flotation, producing copper and molybdenum
concentrates. Copper concentrates contain gold and silver as by-products. Las
Bambas Project commenced commercial production on 1 July 2016.
• Extensive comminution and flotation test work has been conducted and
metallurgical recoveries determined for different rock types and different mining
areas.
• Bulk samples and pilot-scale tests have been conducted on representative
samples of the deposits. For the Ferrobamba deposit, nearly all of the tests were
completed by the G&T laboratory in Canada as part of Feasibility Study, though
additional confirmatory tests were included from more recent testing by ALS in
Peru. For Chalcobamba, all of the tests were completed by G&T and reported in
the Feasibility Study. For Sulfobamba, the data analysed were those from testing
at G&T in 2015. Metallurgical test work continues as ore body knowledge
increases.
• Arsenic minerals identified in the orebody are being mapped and monitored in
the mining process. The level of Arsenic in Las Bambas concentrates remains low
by market standards, and concentrate quality continues to be very acceptable for
processing by smelters internationally.

MMG | 2021 June Mineral Resources and Ore Reserves Statement - Appendix Page 38 of 205
• The recovery equations have been provided by the Metallurgical Group at Las
Bambas in coordination with MMG Operations and Technical Excellence.
• The equations were generated based on metallurgical test work, from diamond
drilling sample data in each pit. It should be noted that the copper recovery is a
function of the ratio of acid soluble copper (CuAS) to total copper (Cu), which is
a determining factor for the recovery. The copper recovery is determined by the
following equations. All assumptions are validated annually with plant
performance data.
Ferrobamba:
For all the materials except marble:
Cu Recovery (%) = (96.0-94.0*(CuAS/Cu ) + 1.6
For marble:
Cu Recovery (%) = (96.0-94.0*(CuAS/Cu ) -13 + 1.6
Chalcobamba:
Cu Recovery (%) = 94.4-90.0*(CuAS/Cu) + 1.6
Sulfobamba:
Cu Recovery (%) = 89.2 - 80.4*(CuAS/Cu) + 1.6
An improvement in recovery of 1.6% has been added to account for ongoing
metallurgical improvement work since the start of operation.
• The recovery of Mo, Ag, Au, has been provided by Metallurgical Group at Las
Bambas.
Metal Ferrobamba Chalcobamba Sulfobamba
Mo % 55.5 55.5 55.5
Ag % 75.0 75.0 75.0
Au % 71.0 71.0 71.0
• Benchmarking of data from four other mines in South America has been
completed and the recovery algorithms that describe performance at these mines
compared with those used for the three Las Bambas deposits. The four other
mines were Tintaya, Toquepala, Cerro Verde and Antamina.
Environmental
and Legal Permits
• The Environmental Impact Study for the Las Bambas Project was approved on 7
March 2011 by the Peruvian Government with directorial resolution Nº073-2011-
MEM/AAM.
• The construction of the project processing facilities, including the Tailings Storage
Facility at Las Bambas was approved 31 May 2012 by the General Directorate of
Mining through Resolution N°178-2012-MEM-DGM/V.
• The Mine Closure Plan for the Las Bambas Project was approved 11 June 2013
through Directorial Resolution N°187-2013-MEM-AAM. As per the Peruvian
regulatory requirements, an update of the Mine Closure Plan was approved 28
September 2016, through Directorial Resolution N°288-2016-MEM-DGAAM.
• A first amendment to the Environmental Impact Study was approved 14 August
2013 through Directorial Resolution N°305-2013-MEM-AAM, whereby
amendments to the Capacity of the Chuspiri water reservoir and changes to the
environmental monitoring program were approved.

MMG | 2021 June Mineral Resources and Ore Reserves Statement - Appendix Page 39 of 205
• On 26 August 2013 the relocation of the molybdenum circuit (molybdenum plant,
filter plant and concentrate storage shed) from the Antapaccay region to the Las
Bambas project area was approved by the environmental regulator through
Directorial Resolution Nº319-2013-MEM-AAM, after assessment of the technical
report showed that the environmental impacts of the proposed changes were not
significant.
• On 6 November 2013, through Directorial Resolution N°419-2013-MEM-DGM/V,
the General Directorate of Mining approved the amendment of the construction
permit for the processing facilities to allow the construction of the molybdenum
circuit at the Las Bambas project area.
• Minor changes to the project layout were approved 13 February 2014 through
Directorial Resolution N°078-2014-MEM-DGAAM and 26 February 2015, through
Directorial Resolution N°113-2015-MEM-DGAAM.
• On 17 November 2014, the second modification of the Study of Environmental
Impact was approved with Directorial Resolution Nº 559-2014-EM/DGAAM,
whereby changes to the water management infrastructure and changes in the
transport system from concentrate slurry pipeline to bimodal transport (by truck
and train) were approved.
• A second amendment to the construction permit for processing facilities was
approved on 28 April 2015 through Directorial Resolution RD169-2015-MEM-
DGM/V to allow changes to the design of the tailings storage facility and changes
to the water management system and auxiliary infrastructure.
• Environmental approval for minor changes to project layout was approved 1 June
2016 through Directorial Resolution N°177-2016-MEM-DGAAM.
• On 6 October 2018, the third amendment to the Environmental Impact Study was
approved through Directorial Resolution 00016-2018-SENACE-PE-DEAR, to allow
changes to the molybdenum plant, included haul road Ferrobamba to
Chalcobamba, impacts and measure management in public transport, other
ancillary infrastructure and changes to the environmental management plan.
• Environmental changes to include the third ball mill and drilling at Jatun Charqui
and others were approved on 11 February 2019 through Directorial Resolution
N°00030-2019-SENACE-PE-DEAR.
• The permit to discharge treated water to Ferrobamba River was approved on 16
April 2019 through Directorial Resolution N°057-2019-ANA-DCERH.
• On 13 July 2020, the environmental technical report was submitted to SENACE
that included: Ferrobamba Phase 7A, drilling, processing facilities, truck shop
relocation and ancillary components for Ferrobamba and Chalcobamba. This
technical report is under evaluation by the authorities.
• Las Bambas has started the process for new environmental technical report to
include: Ferrobamba Phase 6A, Chalcobamba SW, increase of concentrator plant
in 5% (152,230 Tn/d), relocation of overland conveyor (#4) and others.
• Las Bambas has started the process for the 4th modification to include:
Ferrobamba Pit expansion, Chalcobamba Phase II, TSF 1 expansion, drilling and
others.
• In February 2019 the file for the authorization to start activities for the
Chalcobamba pit was presented to MINEM, the approval of the AIA was planned
for 31 July 2020. However, due to the current situation caused by the health crisis

MMG | 2021 June Mineral Resources and Ore Reserves Statement - Appendix Page 40 of 205
(COVID 19) and multiple changes to government , the approval of this permit has
been delayed until at least July 2021. Las Bambas is working in conjunction with
the Government to achieve such approval.
• Geochemical characterisation studies on waste rock samples were conducted in
2007 and 2009/2010 as part of the Feasibility and Environmental Impact Studies,
conclusions from these studies indicate that it should be expected that less than
2% of the waste rock from the Ferrobamba and Chalcobamba pits should be
Potentially Acid Forming (PAF). No acid rock drainage from the waste rock dumps
from these two pits should be expected. Waste rock samples from Sulfobamba
were found to contain a higher concentration of sulphur and that 30% to 40% of
waste rock could be PAF.
• Further geochemical characterisation studies on waste rock and tailings samples
are currently underway to support the Environmental Impact Study Modification.
• The operation of the Ferrobamba waste rock dump was approved on 29th
September 2015 by the General Directorate of Mining through Directorial
Resolution N°1780-2015-MEM/DGM.
• Currently, Las Bambas has four water use licenses:
o License for underground water obtained with Directorial Resolution
0519-2015-ANA / AAA.XI.PA, for a volume up to 9,460.800 m3 / year.
o License for non-contact water obtained with Directorial Resolution
0518-2015-ANA / AAA.XI.PA, for a volume up to 933.993 m3 / year.
o License for contact water obtained with Directorial Resolution 0520-
2015-ANA / AAA.XI.PA, for a volume up to 4,730,400 m3 / year. License
for contact water obtained with Directorial Resolution 0957-2016-
ANA / AAA.XI.PA, for a volume up to 4,730,400 m3 / year.
o License for fresh water obtained with Directorial Resolution 0778-
2016-ANA / AAA.XI.PA, for a volume up to 23,501,664 m3 / year.
Infrastructure Las Bambas has the following infrastructure established on site:
• Concentrator currently in operation.
• Based on the current TSF design and the design assumptions for dry settled
density and beach angle, the TSF currently under construction at Las Bambas has
a final capacity of 784Mt of tailings from processing 800Mt. Three studies have
been conducted looking at increasing tailings storage capacity at Las Bambas:
o Tailings characterization test work to assess final settled density and
beach slope in current TSF.
o Options assessment to increase capacity at TSF currently under
construction.
o Additional Tailings Storage Prefeasibility A, which includes TSF1
expansion up to RL 4230 masl. This study replaces the Pre-feasibility
study for an additional TSF at Tambo valley developed in 2015.
• Camp accommodation for staff
• Water supply is sufficient for site and processing, sourced from the following:
rainfall and runoff into Chuspiri dam, groundwater wells, contact waters,
recirculating water in the process plant, pump station from Challhuahuacho River
off-take structure.
• Transport of the copper concentrate is performed by trucks, covering 380km, to
the Imata Village, then it is transported by train, covering 330km, up to Matarani
Port in Arequipa region. Transport of the molybdenum concentrate is being

MMG | 2021 June Mineral Resources and Ore Reserves Statement - Appendix Page 41 of 205
performed by trucks from Las Bambas site to Matarani Port, covering 710Km. This
method is also used temporarily for some of the copper concentrate.
• There are principal access roads that connect Las Bambas and national routes,
Cotabambas to Cusco and Cotabambas to Arequipa.
• High voltage electrical power is sourced from the national grid Cotaruse – Las
Bambas, with a capacity of 220kV.
• The majority of staff working at the operation are from the region immediately
surrounding the project.
• Technical personnel are mostly sourced from within Peru. The operation has a
limited number of expatriate workers. Additional support is provided by Las
Bambas office in Lima and MMG Melbourne Head Office personnel.
• Chalcobamba pit operation requires additional purchase of land to the North side
of the lease (Waste dump 2). However, an alternative location is being evaluated
that does not require land purchase; this is what the LoA planning is based on
currently. Sulfobamba pit operation requires additional purchase of land for the
pit and other infrastructure.
• Ferrobamba pit expansion requires additional purchase of land to the North side,
because this expansion impacts Antuyo Hamlet.
Costs • Las Bambas Project commenced commercial production on 1 July 2016; future
additional capital costs such as TSF 01 expansion are mainly based on pre-
feasibility studies, taking into account additional information now available
during four years of operation. The operating costs used for Ore Reserves
estimation are based on the 2021 Budget (2021-2023) and 2020 Life of Asset
(LoA) (2024 onwards) as per Corporate (MMG) guidelines and other
considerations. Specifically:
o Average costs are calculated by using the first 3 years budget plus
remaining LoA estimated costs year by year;
o Necessary adjustments required for the input prices and consumption
rates, updated during the budget process, are made to establish the
connection between the budget and LoA; and
o Approved cost savings from identified initiatives and improvements to
be delivered over the life of mine are incorporated.
• No deleterious elements are expected in the concentrates that would result in
smelter penalties.
• Metal prices and exchange rates are the same as those reported in the section for
cut-off grade parameters. These Board approved prices and rates are provided
by MMG Corporate and are based on external company broker consensus and
internal MMG strategy.
• Transportation charges are based on quotations from local companies.
• Treatment and refining charges (TC/RC’s) are based on marketing actuals and
projections. Royalties payable are based on information provided by the Finance
and Commercial Group at Las Bambas.
• Sustaining capital costs, together with mining costs and processing costs have
been included in the pit optimisation. The sustaining capital costs are principally
related to TSF construction and equipment replacement. The inclusion or
exclusion of these costs in the Ore Reserves estimation process has been done

MMG | 2021 June Mineral Resources and Ore Reserves Statement - Appendix Page 42 of 205
following MMG guidelines according the objective of each capital expenditure in
the operation.
Revenue factors • All mining input parameters are based on the Ore Reserves estimate LoA Reserve
Case production schedule. All cost inputs are based on tenders and estimates
from contracts in place, as with net smelter returns (NSR) and freight charges.
These costs are comparable with the regional averages.
• The gold and silver revenue is via a refinery credit.
• TC/RC’s have been included in the revenue calculation for the project.
Market
assessment
• MMG considers that the outlook for the copper price over the medium and longer
term is positive, supported by further steady demand growth and supply
constraints.
• Global copper consumption growth will continue to be underpinned by rising
consumption in China and the developing countries in Asia. These nations invest
in infrastructure such as power grids, commercial and residential property, motor
vehicles and transportation networks and consumer appliances such as air
conditioners.
• Global copper demand will also rise as efforts are made to reduce greenhouse
gas emissions worldwide through increased adoption of renewable energy
sources for electricity generation and electric vehicles for transportation.
• Supply growth is expected to be constrained by a lack of new mining projects
ready for development and the requirement for significant investment to maintain
existing production levels at some operations.
• Las Bambas has Life of Mine agreements in place with MMG South America and
CITIC covering 100% of copper concentrate production which is sold to these
parties at arms’ length international terms. These agreements ensure ongoing
sales of Las Bambas concentrate.
Economic • The costs are based on the 2020 LoA Reserve Case projections which are based
on actual costs and 2021 Budget information.
• The financial model of the Ore Reserves mine plan shows that the mine has a
substantially positive NPV. The discount rate is in line with MMG's corporate
economic assumptions.
• Various sensitivity analyses on the key input assumptions were undertaken during
mine optimisations and financial modelling. All produce robust positive NPVs.
Social • Las Bambas project is located in the Apurimac region that has a population of
approximately 456,000 inhabitants (Census 2014). The region has a University
located in the city of Abancay, with mining programs that provide professionals
to the operation. The project straddles two provinces of the Apurimac region,
Grau and Cotabambas.
• Las Bambas Project contributes to a fund - “FOSBAM” - that promotes activities
for the sustainable development of the disadvantaged population within the
project’s area of influence, comprising the provinces Grau and Cotabambas –
Apurimac.
• Las Bambas Project and the local community entered into an agreement for the
resettlement of the rural community of Fuerabamba, Convenio Marco. The
construction of the township of Nuevo Fuerabamba was completed in 2014 and
the resettlement of all community families were completed in 2016. Currently, in

MMG | 2021 June Mineral Resources and Ore Reserves Statement - Appendix Page 43 of 205
joint work with the community, MMG are executing the commitments described
in the framework agreement - Convenio Marco.
• During the extraordinary general meeting in January 2010, Fuerabamba
community approved the agreements contained in the so-called "compendium
of negotiating resettlement agreements between the central negotiating
committee of the community of the same name and representatives of Las
Bambas mining project” that considers 13 thematic areas.
• Las Bambas Project provides important support to the community in the areas of
agriculture, livestock and health, education, and other social projects, which is well
received.
• Las Bambas has had periodic social conflict with communities along the public
road used for concentrate transport and logistics. In response to these concerns
Las Bambas has promoted a dialogue process in which the government, civil
society and communities along the road participate. Besides, Las Bambas is also
working to systematically improve the road conditions and reduce the impacts,
while also maximising the social development opportunities available to these
communities.
• Las Bambas, for social management, complies with the national regulations of
Peru and applies the Corporate standards of MMG and ICMM.
• The health emergency generated by COVID-19 has impacted the management of
relations with communities, causing difficulties in accessing activities such as
meetings, monitoring and compliance with commitments, among others.
Other • Las Bambas owns 7,718Ha of land within the mining project.
• The mining concession totals an area of 35,000 hectares, which includes the area
containing the three mineral deposits and their corresponding infrastructures.
According to Directorial Resolution N°187-2013-MEM-DGM/V, dated May 2nd,
2013, the Pit Mining Plan and the waste dump was approved for the Las Bambas
project.
• Approval for the exploitation of the Ferrobamba pit was granted on 30th
September 2015 through Directorial Resolution N° 1780-2015-MEM/DGM.
• The title for the Beneficiation Concession and approval for the operation of the
concentrator plant was granted on November 30th, 2015 through Directorial
Resolution N° 2536-2015-MEM/DGM.
• It is reasonable to expect that the future land acquisition and community issues
will be materially resolved, and government approvals will be granted.
Classification • The classification of Ore Reserves is based on the requirements set out in the
JORC code 2012, based on the classification of Mineral Resources and the cut-off
grade. The material classified as Measured and Indicated Mineral Resources
within the final pits and is above the breakeven cut-off (BCoG Cu%) grade is
classified as Proved and Probable Ore Reserves, respectively.
• The Competent Person considers this appropriate for the Las Bambas Ore
Reserves estimate.
• No Probable Ore Reserves have been derived from Measured Mineral Resources.
Audit or Reviews • The 2014 Ore Reserves were reviewed by Runge Pinock Minarco for the MMG
Competent Person’s Report as part of the MMG due diligence process.

MMG | 2021 June Mineral Resources and Ore Reserves Statement - Appendix Page 44 of 205
• An external third-party audit was undertaken in 2018 on the 2017 Ore Reserve by
AMC Consultants Pty Ltd. The audit concluded that the 30 June 2017 Ore Reserve
was prepared to an acceptable standard at the time it was completed. The
recommendations of the review have been implemented since the completion of
the 2019 Ore Reserve.
• AMC Consultants Pty Ltd completed the second external review on the 2020 Ore
Reserve in 2021 and no material issues were found.
• The 2021 Ore Reserve estimates have been reviewed and validated by Javier E
Ponce, Las Bambas Long Term Planning Superintendent.
Discussion of
relative accuracy/
confidence
• The principal factors that can affect the confidence on the Ore Reserves are:
o Proved Ore Reserves are considered to have a relative accuracy of +/-
15% within a volume equivalent to 3 months of production while
Probable Ore Reserves are considered to have a relative accuracy of
+/- 15% within a volume equivalent to 12 months of production.
o Geotechnical risk related to slope stability (due to uncertainties in the
geo-mechanical domains/hydrology models) or excessive rock mass
blast damage that could increase the mining rate.
o Metallurgical recovery model uncertainty due to operational
variability. In the best-case scenario, this would represent variability of
+/- 2% and in the worst scenario +/- 5% to metal recovery.
o Increases in rising operating costs for mining and processing.
o Increase in selling cost due to the transportation (truck and rail) cost
increases.
o Capital costs variation for the new or expansion of current TSF. Also
land acquisition and/permitting delays for additional TSF needs. The
social-political context impacts the schedule of the approvals of
studies and requires good relationship with the communities and an
ongoing requirement for investment in delivering on social
commitments.
o Future changes in environmental legislation could be more
demanding.
o Current artisanal mining activities at Sulfobamba targeting high -
grade mineralisation above the water table and social access may
impact the timing of mining this pit due to delay in obtaining
permitting and securing surface rights. It is recognised that the cost
of accessing this resource will need to account for some form of
economic resettlement for those community members engaged in the
artisanal mining activities. An assessment has been conducted of the
ore extracted by artisanal mining since it started in 2010 to June 30th,
2021, as a result it is estimated that 1Mt of ore with an assumed grade
of 1.9% have been extracted and are accounted as a loss to the Ore
Reserve.

MMG | 2021 June Mineral Resources and Ore Reserves Statement - Appendix Page 45 of 205
3.3.3 Expert Input Table
A number of persons have contributed key inputs to the Ore Reserves determination. These are listed below
in Table 7.
In compiling the Ore Reserves the Competent Person has reviewed the supplied information for reasonableness
but has relied on this advice and information to be correct.
Table 7 Contributing experts – Las Bambas Ore Reserves
EXPERT PERSON / COMPANY AREA OF EXPERTISE
Hugo Rios, Resource Geologist
Superintendent, MMG Ltd (Lima)
Rex Berthelsen, Head of Geology,
MMG Ltd (Melbourne)
Mineral Resource models
Erika Torres, Principal Metallurgist,
MMG Ltd (Lima)
Amy Lamb, Head of Processing,
MMG Ltd (Melbourne)
Updated processing parameters and production record
Maximiliano Adrove, Principal
Geotechnical, MMG Ltd (Lima) Geotechnical parameters
Jeff Price, Head of Geotech, MMG
Ltd (Melbourne)
Javier E Ponce, Superintendent Long
Term Planning/Studies, MMG Ltd
(Lima)
Cut-off grade calculations Whittle/MineSight optimisation and pit
designs
Jaime Trillo, Technical Services
Manager, MMG Ltd (Las Bambas) Production reconciliation
Olimpia Cabrera (Senior Study
Specialist), Erik Medina (Principal
Tailings), MMG Ltd (Lima),
Tailings Management
Giovanna Huaney, Environmental
Permitting Lead, MMG Ltd (Lima) Environmental/Social/Permitting
Oscar Zamalloa, Business Evaluation
Lead, MMG Ltd (Lima) Economics Assumptions
Hong Yu, Head of Marketing, MMG
Ltd (Beijing) Marketing

MMG | 2021 June Mineral Resources and Ore Reserves Statement - Appendix Page 46 of 205
3.3.4 Statement of Compliance with JORC Code Reporting Criteria and Consent to Release
This Ore Reserve statement has been compiled in accordance with the guidelines defined in the 2012 Edition
of the Australasian Code for Reporting of Exploration Results, Mineral Resources and Ore Reserves (“2012 JORC
Code”).
3.3.4.1 Competent Person Statement
I, Yao Wu, confirm that I am the Competent Person for the Las Bambas Ore Reserve section of this Report and:
I am a full-time employee of MMG Ltd. at the time of the estimation.
I have disclosed to the reporting company the full nature of the relationship between myself and the company,
including any issue that could be perceived by investors as a conflict of interest.
I verify that the Las Bambas Ore Reserve section of this Report is based on and fairly and accurately reflects in
the form and context in which it appears, the information in my supporting documentation relating to the Las
Bambas Ore Reserves.
3.3.4.2 Competent Person Consent
Pursuant to the requirements Clause 9 of the JORC Code 2012 Edition (Written Consent Statement)
With respect to the sections of this report for which I am responsible – the Las Bambas Ore Reserves - I consent
to the release of the 2021 Mineral Resources and Ore Reserves Statement as at 30 June 2021 Executive
Summary and Technical Appendix Report and this Consent Statement by the directors of MMG Limited:
_______________________________________________ ____________________________________________
Yao Wu MAusIMM(CP)(#108391) Date:
_______________________________________________ ____________________________________________
Signature of Witness: Witness Name and Residence: (e.g. town/suburb)
• I have read and understood the requirements of the 2012 Edition of the Australasian Code for Reporting
of Exploration Results, Mineral Resources and Ore Reserves (JORC Code, 2012 Edition).
• I am a Competent Person as defined by the JORC Code, 2012 Edition, having five years’ experience that
is relevant to the style of mineralisation and type of deposit described in the Report, and to the activity
for which I am accepting responsibility.
• I am a Member of The Australasian Institute of Mining and Metallurgy and hold Chartered Professional
accreditation in the field of Mining.
• I have reviewed the relevant Las Bambas Ore Reserve section of this Report to which this Consent
Statement applies.
This signature was scanned for the exclusive use
in this document – the MMG Mineral Resource and Ore Reserve Statement as at 30 June 2021– with
the author’s approval. Any other use is not
authorised.
This signature was scanned for the exclusive use in
this document – the MMG Mineral Resource and Ore Reserve Statement as at 30 June 2021 – with the
author’s approval. Any other use is not authorised.
XX/XX/2021
Jorge Valverde
Lima, Peru

MMG | 2021 June Mineral Resources and Ore Reserves Statement - Appendix Page 47 of 205
4 KINSEVERE OPERATION
4.1 Introduction and setting
Kinsevere is located in the Katanga Province, in the southeast of the Democratic Republic of Congo (DRC). It is
situated approximately 27 kilometres north of the provincial capital, Lubumbashi (Figure 4-1), at latitude S 11°
21’ 30” and longitude E 27° 34’ 00”.
Figure 4-1 Kinsevere Mine location
Kinsevere is a conventional truck and excavator operation with atmospheric leaching of the oxide ore using a
solvent extraction electro-winning (SX-EW) plant. The mine was started in 2006 using heavy media separation
(HMS) and an electric arc furnace operation. The electric arc furnace was put on care and maintenance in 2008
with HMS then producing a direct shipping ore product grading 25% copper. The HMS was decommissioned
in June 2011 when the Stage II SXEW plant was commissioned.

MMG | 2021 June Mineral Resources and Ore Reserves Statement - Appendix Page 48 of 205
4.1.1 Results
The 2021 Kinsevere Mineral Resources are summarised in Table 8. The Kinsevere oxide Mineral Resource is
inclusive of the Ore Reserve.
The reporting cut-off grade applied to the model is 0.6% acid soluble copper (CuAS%) for the oxide Mineral
Resource, 0.7% total copper (Cu%) for the transitional mixed (TMO) Mineral Resource and 0.8% total copper
(Cu%) for the primary sulphide Mineral Resource. The TMO material is defined as having a Ratio (CuAS%/Cu%)
greater than or equal to 0.2 and less than 0.5. The Kinsevere Cobalt Mineral Resource is additionalto the
Kinsevere Copper Mineral Resource. This mineralisation contains very low grade copper which is below the
copper cut-off grade.
Table 8 2021 Kinsevere Mineral Resource tonnage and grade (as at 30 June 2021)
Kinsevere Mineral Resource
Contained Metal
Oxide Copper2
Tonnes
(Mt)
Copper
(% Cu)
Copper
(AS % Cu)
Cobalt (%
Co)
Copper
(kt)
Copper AS
kt
Cobalt
kt
Measured 1.2 3.2 2.6 0.11 39 31 1.3
Indicated 5.5 2.7 2.2 0.09 150 120 5.0
Inferred 2.2 2.1 1.7 0.07 47 39 1.6
Total 8.9 2.7 2.2 0.09 230 190 7.9
Transition Mixed Ore (TMO) Copper3 Measured 0.8 2.0 0.71 0.15 15 5 1.2
Indicated 2.2 2.1 0.69 0.12 46 15 2.7
Inferred 1.1 1.6 0.53 0.08 17 6 0.9
Total 4.1 1.9 0.65 0.12 79 27 4.8
Primary Copper4 Measured 1.5 2.6 0.24 0.25 38 4 3.7
Indicated 19 2.3 0.17 0.10 430 31 20
Inferred 9.2 1.7 0.13 0.08 160 12 7.1
Total 29 2.1 0.16 0.10 630 47 30
Stockpiles Indicated 16 1.6 0.97 240 150
Total 16 1.6 0.97 240 150
Kinsevere Copper Total 58 2.0 0.72 0.07 1,200 420 43
Oxide-TMO Cobalt5
Measured 0.02 0.31 0.07
Indicated 0.16 0.33 0.53
Inferred 0.99 0.32 3.2
Total 1.20 0.32 3.8
Primary Cobalt6
Measured 0.01 0.24 0.03
Indicated 0.15 0.20 0.30
Inferred 0.17 0.25 0.43
Total 0.34 0.22 0.75
Kinsevere Cobalt Total 1.5 0.30 4.5 1 AS stands for Acid Soluble 2 0.6% Acid soluble Cu cut-off grade 3 0.7% Total Cu cut-off grade 4 0.8% Total Cu cut-off grade 5 0.4% Co cut-off grade 6 0.2% Co cut-off grade All Mineral Resources except stockpiles are contained within a US$3.68/lb Cu and $30.24/lb Co pit shell Contained metal does not imply recoverable metal. Figures are rounded according to JORC Code guidelines and may show apparent addition errors.

MMG | 2021 June Mineral Resources and Ore Reserves Statement - Appendix Page 49 of 205
4.1.2 Mineral Resources JORC 2012 Assessment and Reporting Criteria
The following information provided in Table 9 JORC 2012 Code Table 1 Assessment and Reporting Criteria for
Kinsevere Mineral Resource complies with the 2012 JORC Code requirements specified by “Table-1 Section 1-
3” of the Code. The Mineral Resource model used to compile the 2021 Mineral Resource was generated in
2020.
Table 9 JORC 2012 Code Table 1 Assessment and Reporting Criteria for Kinsevere Mineral Resource 2021
Section 1 Sampling Techniques and Data
Criteria Commentary
Sampling
techniques • The Mineral Resource uses a combination of reverse circulation (RC) drilling
diamond drilling (DD). The RC drilling is predominately collected for grade control
and the DD is used for exploration and resource delineation work.
• DD core is sampled mostly as 1m intervals while samples in un-mineralised zones
are sampled over 4m lengths. Sampling is predominantly performed by cutting half
core, with half retained on site for future reference. For PQ drilling undertaken 2015-
2020, quarter core was submitted for sampling.
• Grade control drilling (RC) is composited into 2m samples collected after riffle
splitting.
• Each sample is crushed and pulverised to produce a pulp (>85% passing 75µm) prior
to analysis at the site SGS laboratory.
• Measures taken to ensure sample representativity include orientation of the drill
holes as close as practical to perpendicular to the known mineralised structure. In
addition, field duplicates have been taken and analysed.
• The sample types, nature, quality and sample preparation techniques are considered
appropriate for the style of the Kinsevere mineralisation (sediment hosted base
metal) by the Competent Person.
Drilling
techniques • RC drilling was used to obtain 2m composited RC chip samples. 417,510m or 81%
of the sample data used in the Mineral Resource were from RC samples (5.5-inch
hammer), of that 357,309m (69%) was from Grade Control drilling.
• PQ and HQ sized DD core were used to obtain nominal 1m sample lengths. 2015-
2020 DD core was not routinely oriented. 97,183m or 21% of the sample data used
in the Mineral Resource were from DD samples.
• 53,464m of RC Grade Control drilling was completed since 2019 estimation and
utilised in the 2020 estimate.
• No exploration DD drilling occurred post the 2019 Mineral Resource estimation. The
latest drilling were the 5 holes which were drilled in early 2020 to delineate the
extent and test the continuity of the Resource at the Central Sulphide Extension
(CSE) target between Central and Mashi pits.
• In the view of the Competent Person sampling is of a reasonable quality to estimate
the Mineral Resource.

MMG | 2021 June Mineral Resources and Ore Reserves Statement - Appendix Page 50 of 205
Section 1 Sampling Techniques and Data
Criteria Commentary
Drill sample
recovery • DD core recovery recorded was typically above 90%, with only minor losses in
competent ground (recovery average 97.3% for all drilling, and over 98.7% within
ore zones). As expected, the recovery fell in unconsolidated ground such as
weathered material close to surface and in vuggy zones of dolomitic rocks (average
recovery approximately 85%, in this area). The vuggy zones are generally controlled
by major structures. Triple tube core barrels were used to maximize core recovery.
DD core recovery and run depth are verified and checked by a geological technician
at the drill site. This data is recorded and imported in the Geobank database.
• RC drilling has been observed for sample recovery with adequate sample volume
being returned. However, no quantitative measurements of recovery have been
recorded.
• There is no observed relationship between core loss and mineralisation or grade -
no preferential bias has occurred due to any core loss.
Logging • RC chips are logged by geologists directly into an Excel logging template, geological
information captured includes lithology, stratigraphy, weathering, oxidation, colour,
texture, grain size, mineralogy and alteration. This data is then imported into the
database.
• DD core samples both geological and geotechnical information is logged. (lithology,
stratigraphy, mineralisation, weathering, alteration, geotechnical parameters:
strength, RQD, structure measurement, roughness and infill material)
• All RC chip and DD core samples (100%) have been geologically logged to a level
that can support appropriate Mineral Resource estimation.
• Logging captures both qualitative descriptions such as geological details (e.g. rock
type, stratigraphy) with some quantitative data (e.g. ore mineral percentages). Core
photography is not known to have occurred prior to MMG ownership (2012). Since
MMG took control of the site all DD core is photographed.
• The total length and percentage of the relevant intersections logged is 100%.
Sub-sampling
techniques and
sample
preparation
• DD core was split in half (NQ) or quartered (PQ) using a diamond saw. Sample
lengths were cut as close to 1m as possible while also respecting geological
contacts. Samples were generally 2kg to 3kg in weight.
• RC samples are collected from a cyclone by a trained driller’s assistant. If the sample
was dry the sample was passed through a riffle splitter and collected into a pre-
numbered calico bag. Residual material was sampled and sieved for collection into
chip trays for logging and the remainder returned to the larger poly-weave bag. The
splitter was cleaned using compressed air or a clean brush and tapped using a
rubber mallet. If the sample was wet, then the sample was dried in the laboratory
oven before being split according to the procedure above (for dry samples).
• Samples from individual drill holes were sent in the same dispatch to the preparation
laboratory.
• Representivity of samples was checked by sizing analysis and duplication at the
crush stage.
• Field duplicates were inserted at a rate of approximately 8% to ensure that the
sampling was representative of the in-situ material collected. Field duplicates in
MMG | 2021 June Mineral Resources and Ore Reserves Statement - Appendix Page 51 of 205
Section 1 Sampling Techniques and Data
Criteria Commentary
current RC programs have shown acceptable levels of repeatability across all
elements analysed.
• These practices are industry standard and are appropriate for the grain size of the
material being sampled.
• RC Grade Control samples are prepared on-site by the geology department, who
provide pulp samples to the SGS analytical facility also on site at Kinsevere. The
samples were oven dried at approximately 80°C, crushed to 85% passing -2mm
using a jaw crusher and milled to 85% passing 75μm using one of three single
sample LM2 vibratory pulverising mills.
• Since 2015, Exploration and near-mine DD drilling core and RC chips are processed
at the onsite Exploration core yard. Sample preparation was conducted at this facility
through an ALS managed Containerised Preparation Laboratory (CPL). Pulp samples
where then sent to ALS Johannesburg for analysis.
• The sample size for both RC and DD is considered appropriate for the grain size of
the material being sampled.
Quality of assay
data and
laboratory tests
• RC ore control samples are assayed at the onsite SGS Laboratory, ALS laboratory
and SSM at Lubumbashi.
• Following preparation, 50g pulp samples are routinely analysed for total and acid
soluble copper, cobalt and manganese.
• A 3-acid digest with AAS finish was used to analyse for total values.
• A sulphuric acid digest with AAS finish was used to analyse for acid soluble copper.
• All DD core samples prior to 2011 were assayed at:
• ALS Chemex Laboratory, Johannesburg
• McPhar Laboratory, Philippines
• ACTLabs Laboratory, Perth
• Samples were analysed for total copper and acid soluble copper with some having
a full suite of elements analysed with a four-acid digest and ICP-OES analysis.
• From 2011 to 2015, prepared samples were submitted to the ISO 17025 accredited
SGS Laboratory in Johannesburg with the following assay scheme:
• ICP-OES method with a 4-acid digest analysing 32 elements including copper from
0.5ppm to 1%.
• ICP-OES method using alkali fusion is applied to over-range copper results.
• ICP-AES with a 4-acid digest was used for calcium and sulphur analysis
• XRF was used for uranium analysis.
• Acid soluble copper using a sulphuric acid digest and AAS finish.
• Since 2015 DD drilling, prepared samples were submitted to the ALS Laboratory in
Johannesburg with the following assay scheme:
• ICP-OES (ME-ICP61) method with a 4-acid digest analysing 33 elements plus OG
triggers when Cu greater than 1% (OG62)

MMG | 2021 June Mineral Resources and Ore Reserves Statement - Appendix Page 52 of 205
Section 1 Sampling Techniques and Data
Criteria Commentary
• LECO analysed Total Carbon (C-IR07), Organic Carbon (C-IR17), Total Sulphur (S-
IR08) and Sulphide Sulphur (S-IR07)
• Acid soluble copper using a Sequential Leach (Cu-PKGPH06) finish.
• No geophysical tools, spectrometers or handheld XRF instruments have been used
in the analysis of samples external to the ALS laboratory for the estimation of
Mineral Resources.
• QAQC employs the insertion of Certified Reference Material (CRM) every 25
samples; blanks, field duplicates, coarse duplicates and pulp duplicates are taken/
inserted within every batch of 50 samples; and umpire laboratory checks are
submitted for every batch of 20 samples to check accuracy, precision and
repeatability of the assay result. Acceptable levels of accuracy and precision have
been established. If control samples do not meet an acceptable level the entire
batch is re-analysed.
• The analysis methods described above are appropriate for the style and type of
mineralisation.
Verification of
sampling and
assaying
• Significant intersections are verified by alternate company personnel following
receipt of assay results and during the geological modelling process.
• Twinned pre-collars are present in the database. These were used to confirm and
check geological intervals and/or assay intervals. Twin drill holes are not used in the
Mineral Resource.
• Data is collected in Excel spread sheets and imported into industry standard
databases that have built in validation systems and QAQC reporting systems. Raw
data is imported in the database as received by the laboratory.
• Where data was deemed invalid or unverifiable it was excluded from the Mineral
Resource estimation.
• There are adjustments to the CuAS assay data whenever greater than the Total Cu
assay data.
Location of data
points • Prior to 2011 all drill hole collars were located using a hand-held GPS. Accuracy of
GPS is +/- 5m for x and y coordinates and has poor accuracy of the z (elevation)
coordinates. Elevations of these holes were later adjusted by using a LIDAR survey
method.
• RC and DD holes collared post-2011 are surveyed by qualified surveyors. Down hole
surveys have been carried out using Eastman single-shot cameras or Reflex EZ tools.
Surveys are taken at variable intervals and stored in the database.
• Coordinates are in Kinsevere Mine Grid, which is related to WGS84 by the following
translation: -8000000 m in northing and -22.3 m in elevation.
• A LIDAR survey was used to generate a topographic surface. This surface was also
used to better define the elevation of drill hole collars. The LIDAR survey considered
to be of high quality and accuracy for topographic control.
Data spacing
and distribution • Majority of the Grade control RC drill pattern spacing is 5m x 15m, however in 2018
Grade control RC drill pattern spacing was 10m x 10m and it has been revised back

MMG | 2021 June Mineral Resources and Ore Reserves Statement - Appendix Page 53 of 205
Section 1 Sampling Techniques and Data
Criteria Commentary
to spacing 5m x 15m since 2019 which is enough to adequately define lithology and
mineralisation domain contacts and transition zones.
• The overall DD pattern spacing is between 25m and 75m, which is sufficient to
establish the required degree of geological and grade continuity that is appropriate
for the Mineral Resource. Between 2015 and 2019, diamond drilling aimed to infill
target areas to 40m x 40m spacing and down to 20m x 20m in places.
• DD samples are not composited prior to being sent to the laboratory however the
nominal sample length is generally 1m. RC samples are 2m intervals but
compositing up to 4m has occurred in the past.
Orientation of
data in relation
to geological
structure
• The mineralisation strikes between north and north-west at Mashi / Central pits, and
to, the east south east at Kinsevere Hill. All drill holes are oriented such that drill
holes have a high angle of intersection with the dominant strike and dip of bedding
and structures, with the local scale of mineralisation also considered. All drill holes
are either oriented east or west with dips of 60° to sub-vertical.
• The combination of both east and west orientations likely minimises sampling bias,
which, if present, is not considered material.
Sample security • Measures to provide sample security include:
o Adequately trained and supervised sampling personnel.
o Sea containers used for the storage of samples are kept locked with keys held
by the security department.
o Assay laboratory checks of sample dispatch numbers against submission
documents. Audit and
reviews • An external independent audit has been performed on the grade control sampling
techniques in July 2019, by OBK Consultants. Recommendations for improvements
were provided, no material issues were identified.
• Internal visits by MMG Group Office geologists to the SGS, ALS and SSM
Lubumbashi laboratories are audited on an annual basis. From the most recent audit
by the MMG Senior Geochemist (February 2020) there were no material risks
identified.
• The 2020 Kinsevere Mineral Resource model review was completed by an internal
MMG Group Office geologist in May 2020. The Mineral Resource estimation was
also reviewed by the Competent Person; and was found to be a reasonable global
model with no material errors found.
Section 2 Estimation and Reporting of Mineral Resources
Criteria Commentary
Mineral
tenement and
• The Kinsevere Mining Licence (PE 528) is located approximately 27 km north of
Lubumbashi, the provincial capital of the Katanga Province, in the southeast of the

MMG | 2021 June Mineral Resources and Ore Reserves Statement - Appendix Page 54 of 205
Section 2 Estimation and Reporting of Mineral Resources
Criteria Commentary
land tenure
status Democratic Republic of the Congo (DRC). The PE 528 permit covers the three major
deposits of Tshifufiamashi, Tshifufia and Kinsevere Hill/Kilongo
• MMG has a Contrat d’Amodiation (Lease Agreement) with Gécamines to mine and
process ore from the Kinsevere Project until 2024. A renewal application process for
a 15 year extension shall be submitted to DRC regulatory at least 1 year and no
more than 5 years before the expiry date.
• A Contrat d’Amodiation is provided for under the DRC Mining Code, enacted by
law No 007/2002 of July 11, 2002.
• A conversion of the adjacent PR7274 to an exploitation permit was completed in
2018. Tenement amalgamation (of PE528 and PE7274) was completed in early
March 2019, with PE7274 incorporated into PE528.
• There are no known impediments to operating in the area.
Exploration
done by other
parties
Summary of Previous Exploration Work by Gecamines and EXACO
• In 2004 Anvil Mining carried out intensive exploration drilling to define the deposits
in Kinsevere.
• In 2012 MMG continued exploration aimed at identifying additional mineralisation
beyond the Anvil Mining Mineral Resource.
• In 2013/2014 MMG Exploration conducted works around the Mine Lease within a 50
km radius of the known deposit to explore additional high-grade oxide material.
• In 2015 MMG conducted a Scoping Study on the potential to process the copper
sulphide ore at Kinsevere located beneath the current oxide Ore Reserves. As part of
this study, 5 DD holes were drilled in early 2015. In August 2015, DD drilling re-
commenced as part of a follow up on Pre-Feasibility Study to increase confidence in
the copper sulphide Mineral Resource. This drilling was completed at the end of 2016
and included in the 2017 Resource Estimate.
• Drilling commenced in May 2017 to inform the Sulphide Feasibility Study. This
drilling was used to update the previous 2018 Mineral Resource model.
• Drilling commenced in Jan 2018 to test the link of geological continuity between
Mashi and Central Pit. This was completed in September 2018. Drilling then
continued in 2018 in the south of Kinsevere Hill (south of Kinsevere copper deposit).

MMG | 2021 June Mineral Resources and Ore Reserves Statement - Appendix Page 55 of 205
Section 2 Estimation and Reporting of Mineral Resources
Criteria Commentary
This drilling tested the copper grade mineralisation at depth. These two drilling
programs were used to update the 2020 Mineral Resource model.
• In early 2020, exploration diamond drilling was conducted to delineate and test the
continiutity of the deeper sulphide mineralization between Central and Mashi pits. A
total of 5 holes were drilled targeting the deeper Central Sulphide Extension below
the current final pit Mineral Resource reporting limit. The results of this drilling
programme were not used to update the 2020 block model.
Geology • The Kinsevere deposit is a sediment hosted copper deposit with low-grade cobalt
association.
• The deposit is comprised of the R1, R2 and R3 subgroups of the Neoproterozoic
Roan Group. Copper mineralisation is generally confined to the Mines (R2) subgroup,
however, minor copper-oxide and copper-sulphide development occurs along the
R1-R2 contact and the R2-R3 contact.
• The deposit is located along a major structural element termed the Kinsevere
lineament. Halokenetic and tectonic processes have resulted in the emplacement of
discrete lower Roan (R2) stratigraphic blocks onto younger, upper Roan (R3 and
above) stratigraphy.
• The Kinsevere deposit is comprised of three distinct mineralisation domains: Central,
Mashi and Kinsevere Hill. Central and Mashi form a contiguous sequence of
mineralised Mine Series correlates that host copper-cobalt oxides and sulphides.
Kinsevere Hill represents a structurally isolated occurrence of Mine Series host rocks
containing copper-cobalt oxides with minor copper sulphides.
• Copper oxide mineralisation is defined as material that has CuAS:CuT ratio between
0.5 to 1. The principle copper oxide mineral is malachite with subordinate
chrysocolla, copper clays (Goethite and Mn-WAD), pseudomalachite and rare
azurite. Tenorite, native copper and other minor copper oxide phases (Cu-
intergrows) are also present in minor quantities (~<5% of total Cu oxide mineralogy).
The largest proportion of copper oxide mineralisation is hosted in
weathered/oxidised carbonates (CMN) as fracture fill, void fill, mineral replacement
and coatings. There is a strong preference for copper oxides to develop in CMN
lithologies, especially within strongly weathered, brecciated and karstic zones.
• Transitional and Mixed Ores (TMO) are copper ores that have an CuAS:CuT ratio
between 0.2 and 0.5. Transitional ore zones are classified as zones that contain
dominantly transitional copper species such as chalcocite, covellite, cuprite and
native copper and are likely to have formed during progressive supergene
weathering. Mixed ore zones are defined as containing both sulphide and oxide
copper phases present together - particularly malachite, chalcocite and chalcopyrite
• Sulphide mineralisation at Kinsevere is defined by all material that has an CuAS:CuT
ratio < 0.2. Sulphide mineralisation at Kinsevere has several different modes of
development and styles. The three major types are: 1. Replacement of early
diagenetic pyrite and evaporites by chalcopyrite and carrolite. 2. Replacement of
carbonate minerals by copper and cobalt sulphides. 3. Sulphide bearing veins and
vein replacement.

MMG | 2021 June Mineral Resources and Ore Reserves Statement - Appendix Page 56 of 205
Section 2 Estimation and Reporting of Mineral Resources
Criteria Commentary
Figure 1: Kinsevere Mine Series Stratigraphy
Drill hole
information • Within the database used, there are 1,615 Exploration drill holes (467 DD, 32 RC
with DD tail and 1,116 RC) and 10,980 grade control drill holes (all RC).
• No individual drill hole is material to the Mineral Resource estimate and hence this
geological database is not supplied.
Data
aggregation
methods
• This is a Mineral Resource Statement and is not a report on exploration results
hence no additional information is provided for this section.
• No metal equivalents were used in the Mineral Resource estimation.
Relationship
between
mineralisation
width and
intercepts
lengths
• Mineralisation true widths are captured by interpreted mineralisation 3D
wireframes.
• Most drilling was at 50° to 60° angles in order to maximise true width intersections.
• Geometry of mineralisation is interpreted as sub-vertical to vertical and as such
current drilling allows true width of mineralisation to be determined.
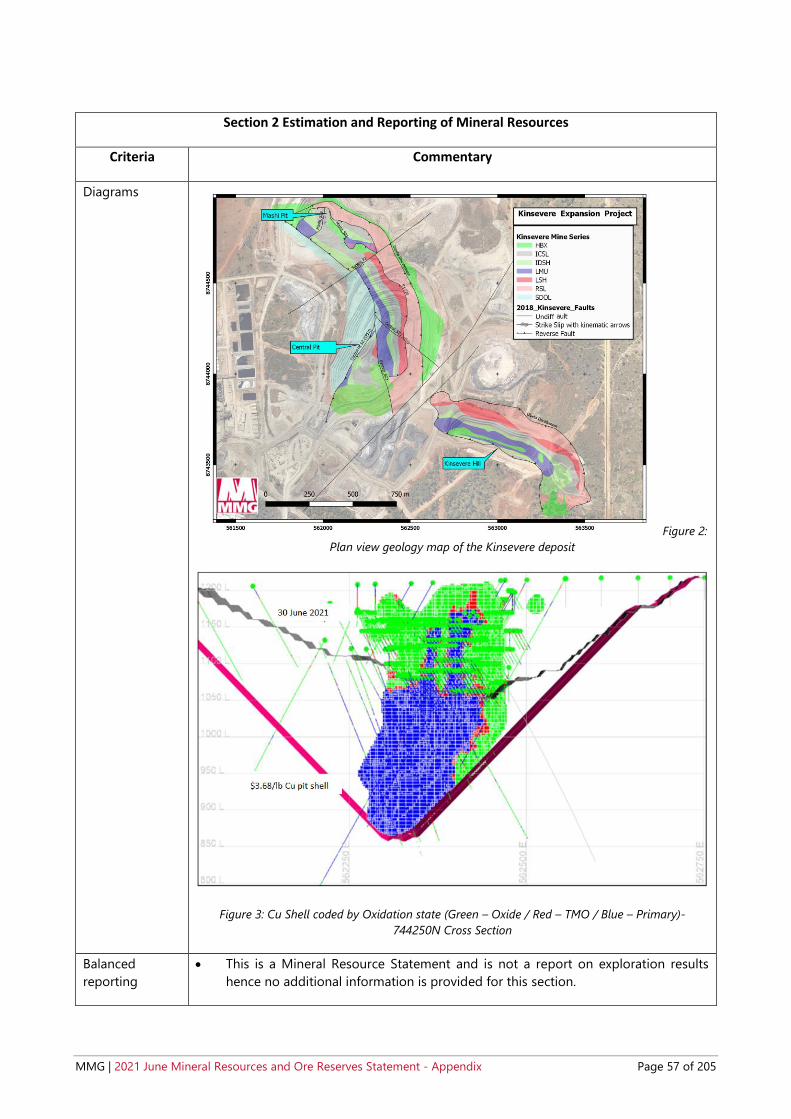
MMG | 2021 June Mineral Resources and Ore Reserves Statement - Appendix Page 57 of 205
Section 2 Estimation and Reporting of Mineral Resources
Criteria Commentary
Diagrams
Figure 2:
Plan view geology map of the Kinsevere deposit
Figure 3: Cu Shell coded by Oxidation state (Green – Oxide / Red – TMO / Blue – Primary)-
744250N Cross Section
Balanced
reporting • This is a Mineral Resource Statement and is not a report on exploration results
hence no additional information is provided for this section.

MMG | 2021 June Mineral Resources and Ore Reserves Statement - Appendix Page 58 of 205
Section 2 Estimation and Reporting of Mineral Resources
Criteria Commentary
Other
substantive
exploration data
• This is a Mineral Resource Statement and is not a report on exploration results
hence no additional information is provided for this section.
Further work • The exploration focus will be within the Mine Lease and within a 50 km radius of
the known deposit to explore for additional high-grade oxide material.
• RC and DD drilling as part of near mine extension is ongoing.
Section 3 Estimating and Reporting of Mineral Resources
Criteria Commentary
Database
integrity
• The following measures are in place to ensure database integrity:
o Drillhole data (RC and DD) is stored in two SQL databases with front end access
provided by Geobank software.
o The grade control logging and assay data (RC) is managed by the onsite
Geology team with support from the Operations and Technical Excellence
database team in Melbourne.
o The exploration/resource logging data (RC and DD) is managed by the onsite
Resource team with assay loading and support provided by the Operations and
Technical Excellence database team in Melbourne.
o Data is entered directly into Geobank or Geobank Mobile using the database
validation rules. These check for data consistency, missing intervals, overlaps,
invalid codes and invalid values, thus maintaining data integrity.
o The databases offer secure storage and consistent data which is exposed to
validation processes, standard logging and data recording lookup codes.
• The measures described above ensure that transcription or data entry errors are
minimised.
o Data validation procedures include:
▪ Internal database validation systems and checks.
▪ Visual checks of exported drill holes in section and plan view,
checking for accuracy of collar location against topography, and
downhole trace de-surveying.
▪ External checks in Vulcan software prior to the data used for
Mineral Resources. Checks on statistics, such as negative and
unrealistic assay values.
• Any data errors were communicated to the Database team to be fixed in Geobank.
Data used in the Mineral Resource has passed a number of validation checks both
visual and software related prior to use in the Mineral Resource.
Site visits • The Competent Person is based at the Kinsevere Mine site and he is in charge of the
mining geology, Resource modelling and near mine exploration. Discussions on the
continuous understanding of the orebody with other geologists (mine and
exploration), mine planning engineers and metallurgists occur on a daily basis.

MMG | 2021 June Mineral Resources and Ore Reserves Statement - Appendix Page 59 of 205
Section 3 Estimating and Reporting of Mineral Resources
Criteria Commentary
Geological
interpretation
• The geological sequences at Kinsevere can be considered correlatives of the
Katangan Mines Subgroup units, albeit with unique features (thick shale sequence)
and notable absences (no RSC or RSF). These subtle differences have resulted in
inconsistent mapping and logging at the deposit-scale. In response to this, a
Kinsevere-specific classification was generated with the aim of; assisting geological
understanding, facilitating consistent logging and mapping between geologists and
improving geological and resource modelling. The local stratigraphy has been termed
the Kinsevere Mine Series (KMS).
• Detailed 3D geological modelling was completed at Kinsevere between 2018-2020
using the new Kinsevere Mine Series framework. Recent PFS and FS related diamond
drilling, mapping/structural observations, photogrammetry and litho-geochemistry
were integrated into the model. The model was last updated in Q1 2020. The resulting
model is considered robust and reliable for mineralisation modelling and
grade/estimation domaining.
• Weathering domains were determined by correlating CuAS:CuT ratio data with
observed copper mineral types. An Indicator Kriging approach was used to construct
weathering domains (within the mineralised zone) based on specific CuAS:CuT ratio
cut-offs.
• Most of the estimated gangue variables were domained to help constrain each
estimation. The following variables were domained using numeric indicator
interpolation methods in Leapfrog Geo: Mg (6%), Ca (9%), Al (2.5%), Org_C (0.5%
and 1.5%) and S (1.5%).
• Cobalt was domained using a numeric indicator interpolant approach. A 0.07% Co
cut-off grade was used to guide the interpolation.
• Copper was domained using a numeric indicator interpolant approach combined
with manual manipulation to align with geological and mineralisation trends and
boundaries. Copper volumes were generated within the oxide and primary zones
respectively and then unified to form one master copper shell. A 0.4% Cu cut-off
grade was used to guide the interpolation in the oxide zone. A 0.3% Cu cut-off grade
was used to guide the interpolation in the primary zone.
• The magnitude of the acid soluble copper/total copper (CuAS /Cu) ratio has been
used as an important criterion for the determination of the oxide, TMO and primary
sulphide zones. The following ratios have been used to delineate the respective
zones:
o Oxide > 0.5
o Transition and mixed (TMO) between 0.3 and 0.5
o Primary < 0.3
• The resulting weathering, lithology, fault, mineralisation domains were combined to
code the drill hole data and the block model used for grade estimation.
• Structural features (faults/fractures) provide an important control on the
mineralisation and grade continuity. This 2020 geology model was used to inform
the 2020 block model which has been used to report the 2021 Mineral Resource
estimate.

MMG | 2021 June Mineral Resources and Ore Reserves Statement - Appendix Page 60 of 205
Figure 4: Plan View of Kinsevere Lithology (top) and Fault Domains (bottom)
Figure 5: Plan View of Kinsevere Cu domain
Dimensions • The mineralisation strike length is approximately 1.3 km for the Tshifufia (Central) and
Tshifufiamashi (Mashi) deposits while Kinsevere Hill has a 1km strike length. The

MMG | 2021 June Mineral Resources and Ore Reserves Statement - Appendix Page 61 of 205
Section 3 Estimating and Reporting of Mineral Resources
Criteria Commentary
mineralisation dips sub-vertically. Mineralisation extends to 400 m at depth, and it
can be up to 300m in width.
• The mineralisation outcropped at Kinsevere Hill and Mashi deposits.
Estimation and
modelling
techniques
• Estimation applied mostly kriging interpolation within domains as outlined further in
this section and is considered appropriate for this style of mineralisation.
• Mineral Resource modelling was conducted using Vulcan software.
• Variograms updated for major elements including Cu, CuAS, Ratio, Ca, and Mg were
based on the combination of weathering, lithology and fault domains. Variogram
modelling in the 2020 Mineral Resource models wwere reviewed and updated based
on new drilling and geological domains.
• The key estimation assumptions and parameters are as follows:
o Cu, CuAS, CuAS/Cu (RATIO), Co, Ca, Fe, Mg, Mn and S were estimated using
Ordinary Kriging (OK). Uranium (U) was estimated by using an Inverse Distance
to the power of 2 method (ID2).
o Local Varying Anisotropy (LVA) grade modelling was applied to capture the
local varying grade distribution and geological continuity.
o Indicator Kriging (IK) was used to determine oxide, mixed and primary sulphide
domains based on the CuAS/Cu ratio. Leapfrog software was used to construct
high grade domains for Cu, Ca, Mg, Al, organic Carbon and Co.
o Extreme grade values were managed by grade capping, which was performed
post compositing. Values greater than the selected cut value were set to the top
cut (cap) value and used in the estimation.
o Wireframes and surfaces of the topography, mineralised domains, lithology and
fault domains, together with IK weathering domain are used to tag the drill
holes and are used for statistical analysis and grade estimation.
o Grade estimation was completed using a hard boundary for Cu, CuAS/Cu
(Ratio), Co, Ca, Fe, S, Mg, Mn and S.
o A composite length of 2m was used applied. Any residual intervals less than half
the composite interval were appended to the previous sample interval.
o No assumptions have been made about the correlation between variables. All
variables are comparably informed and independently estimated.
o Search parameters for Cu, CuAS, RATIO, Co, Ca, Fe, Mg estimate were derived
from mineralisation and waste domain variography and on Quantitative Kriging
Neighbourhood Analysis (QKNA). U search parameters were based on a generic
search of 400m x 400m x 400m, U grades higher than 250 ppm were distance
limited to 20m.
o Three pass estimations were used to estimate the block model with the first and
second estimation passes search radius uses 100% of the variogram range and
the third pass estimation search radius uses 200% of the variogram range. Over
80% of the blocks are informed in the first pass. The second and third pass was
set by reducing to the minimum sample estimated to the blocks.
o Minimum of 2 to 4 and a maximum of 8 to 10 samples (depending on element
and/or domain) for each estimate.
o The search neighbourhood was also limited to a maximum of 3 samples per drill
hole.
o Discretisation was set to 4m x 8m x 2m (X, Y, Z).

MMG | 2021 June Mineral Resources and Ore Reserves Statement - Appendix Page 62 of 205
Section 3 Estimating and Reporting of Mineral Resources
Criteria Commentary
o Kriging variance (KV), kriging efficiency (KE) and kriging regression slope (RS) of
the Cu estimate were calculated during the estimation.
• The 2019 and 2020 in-situ Mineral Resource models have been compared and show
no major material difference, with metal content within 5%. Differences due to the
revision of the Cu and Ratio cut-off grade (COG) for Transition (TMO) and Primary Cu
and the subsequent re-interpretation in Transition and Primary Cu areas.
• The Comparison between the Mineral Resource and the mill feed grade is
complicated by the operational strategy of treating high-grade ore and stockpiling
lower-grade ore for later treatment. In late 2017 a stockpile adjustment occurred
based on detailed survey pick-ups. Generally, there was a volume and metal
reduction.
• Kinsevere does not produce any by-products hence no assumptions regarding the
recovery of by-products are made in the estimate or cut-off and reporting.
• Parent block size of the Kinsevere block model is 10m x 20m x 5m with sub-blocking
down to 2.5m. Estimation was into the parent block. The size of the blocks is
appropriate to the spacing of drill holes.
• No further assumptions have been made regarding modelling of selective mining
units.
• The block model and estimate has been validated in the following ways:
o Visual checks in section and plan view against the drill holes.
o Grade trend plots comparing the model against the drill holes.
o Summary statistics comparing the model to the sample.
o Global Change of support between the model to the sample support.
Moisture • Tonnes in the model have been estimated on a dry basis.

MMG | 2021 June Mineral Resources and Ore Reserves Statement - Appendix Page 63 of 205
Section 3 Estimating and Reporting of Mineral Resources
Criteria Commentary
Cut-off
parameters
• The Oxide Mineral Resource has been reported above an acid soluble copper cut-off
grade of 0.6% and an acid soluble to total copper ratio (Ratio) greater than or equal
to 0.5. This is unchanged from the 2020 Mineral Resource.
• The transitional and mixed ore (TMO) Mineral Resource has been reported above a
total copper cut-off grade of 0.7% and a Ratio (CuAS/Cu) between 0.2 and 0.5. This
is unchanged from the 2020 Mineral Resource.
• The sulphide Mineral Resource 2021 has been reported above a total copper cut-off
grade of 0.7% and a Ratio less than 0.2. This is unchanged from the 2020 Mineral
Resource.
• The reported Mineral Resources have also been constrained within a US$3.68/lb
Whittle pit shell. Both the Sulphide/Primary and TMO cut offs have not changed in
2021 compared to 2020. The reported cut-off grade and the pit-shell price
assumptions are in line with MMG’s policy for reporting of Mineral Resources based
on prospective for future economic extraction.
N744100 Cross-section of Copper Mineral Resource model contained within the US$3.68/lb
pit shell
Mining factors
or assumptions
• Mining of the Kinsevere deposits is undertaken by the open pit method, which is
expected to continue throughout the life of mine.
• Mining selection has been considered in the calculation of cut-off grade parameters
and in the constraint of mineral resources within the US$3.68/lb Cu pit shell.
• No mining factors have been applied to the Mineral Resource.
Metallurgical
factors or
assumptions
• The metallurgical process applied at the current Kinsevere Operation includes H2S04
acid leaching followed by solvent extraction and electro-winning (SXEW) to produce
copper cathode. This process enables processing of oxide ores only.
• TMO and sulphide ores will be processed on the condition the Kinsevere Expansion
Project (KEP) is approved. As such, the criteria impacting the global resource cut-off
grades and reportable pit shell inputs are based on the proposed KEP flowsheet and

MMG | 2021 June Mineral Resources and Ore Reserves Statement - Appendix Page 64 of 205
Section 3 Estimating and Reporting of Mineral Resources
Criteria Commentary
infrastructure upgrades. The upgraded flowsheet will consist of the following
changes:
• Oxide pre-flotation circuit and leach tank modifications 2.2Mtpa
• Oxide leach upgrades to convert to reductive leach conditions
• Sulphide Concentrator 2.2Mtpa capacity
• Roaster circuit including off-gas cleaning, acid plant and concentrate storage
• Cobalt Recovery circuit to produce high grade Cobalt hydroxide
• SX plant modifications
• Estimated plant recoveries are as follows:
• The main deleterious components of the ore are carbonaceous (black) shales which
increase solution losses in the washing circuit and dolomite which increases acid
consumption in the leaching process.
• Consideration of metallurgy and strike price has been included in the cut-off grade
calculation flow sheet material type and in the construction of the US$3.68/lb pit
shell.
• No metallurgical factors have been applied to the Mineral Resource.
Environmental
factors or
assumptions
• Environmental factors are considered in the Kinsevere life of asset work, which is
updated annually and includes provisions for mine closure.
• PAF and NAF criteria is controlled by the acid neutralising capabilities of the dolomitic
CMN unit and the potential acid forming potential of the shale rich SD which is known
to contain pyrite where a sulphur cut off is utilised.
Bulk density • In-situ dry bulk density values are determined from 6,676 diamond core density
measurements, 4 in-pit bulk sample measurements and 12 in-pit measurements from
specific lithologies.
• Bulk sample and in-pit measurements account for void spaces.
• Bulk density was calculated using the wet and dry method:
• Bulk Density = Dry Sample Weight/(Dry Sample Weight – Wet Sample Weight)

MMG | 2021 June Mineral Resources and Ore Reserves Statement - Appendix Page 65 of 205
Section 3 Estimating and Reporting of Mineral Resources
Criteria Commentary
• Average in-situ bulk density values were assigned to the blocks within each lithology-
weathering domain.
• 2020 Mineral Resource density assignments per lithology and weathering domains
Classification • Wireframes used for Mineral Resource classification are based on a combination of
confidence in assayed grade, geological continuity and Kriging output (Kriging
variance, efficiency and slope of regression, and drilling spacing).
• In general, Measured is defined drilling spacing less 20m x 20m with the slope
regression of the kriging estimation greater than 0.8. Indicated is 40m x 40m with the
slope regression of kriging estimation at 0.65 to 0.8. Inferred has ranges up to 80m x
80m and the slope regression less than 0.65
• The Mineral Resource classification reflects the Competent Persons view on the
confidence and uncertainty of the Kinsevere Mineral Resource.

MMG | 2021 June Mineral Resources and Ore Reserves Statement - Appendix Page 66 of 205
Section 3 Estimating and Reporting of Mineral Resources
Criteria Commentary
744,250mN Cross section - showing Kinsevere Mineral Resource classification and drilling
density (Red-Measured, Green-Indicated, Blue-Inferred)
Audits or
reviews • Geological domains and resource estimation parameters were reviewed by internal
MMG personnel and endorsed by the Competent Person. The review stated that the
2020 Mineral Resource Estimation parameters had been compiled in accordance with
the JORC 2012 guidelines and is fit for the purposes of conducting mining studies
and estimating Ore Reserves.
• Recommendations were incorporated into the 2020 Mineral Resource. No significant
issues have been identified.

MMG | 2021 June Mineral Resources and Ore Reserves Statement - Appendix Page 67 of 205
Section 3 Estimating and Reporting of Mineral Resources
Criteria Commentary
Discussion of
relative
accuracy /
confidence
• The estimation within lithology and fault domains and the use of local varying
anisotropy (LVA) is valid to accommodate changes in local dip through the deposit.
• The post June 2019 grade control RC drilling has resulted in some local changes
especially in the transition and primary sulphide zone where the geological
interpretation is now more continuous compared to the 2019 model interpretation.
• A linear regression between Total Cu and CuAS assays has been used to predict
missing CuAS grades in intervals where only Total Cu had been analysed. This was
done to improve the local robustness of the CuAS grade estimation.
• Estimates in the deeper primary copper mineralisation will not be as locally accurate,
due to wider spaced drilling however the geological and grade interpretations are
robust due to a high understanding of geological controls. The level of uncertainty is
captured by the Indicated / Inferred Mineral Resource category.
• Close spaced Resource infill drilling in Kinsevere Hill South is required to gain an
understanding of the complexity of grade distribution and the local mineralisation
controls.
• Due to complexity of the weathering profile it was decided to use an Indicator Kriging
approach based on the “ratio” of acid soluble copper to total copper. The weathering
was defined into three cut-off ratio grades, oxide is defined at above 0.8, primary is
defined below 0.2, and TMO is define between 0.2 – 0.8. A wide spread of “ratio”
grades distribution in the TMO could potentially over smooth the estimate, more
work is needed to control this effect.
• The method of assigning bulk density values is similar to the 2019 Mineral Resource
and is not considered to have any material impact on the reported tonnages.
However, direct estimation of dry bulk density values needs to be evaluated where
enough bulk density data is available.
• Limited number of samples within some of the lithology and fault subdomains have
resulted in a poor estimation. Further analysis on the potential combination between
lithology and fault domains could improve the estimation.

MMG | 2021 June Mineral Resources and Ore Reserves Statement - Appendix Page 68 of 205
4.1.3 Statement of Compliance with JORC Code Reporting Criteria and Consent to Release
This Mineral Resource statement has been compiled in accordance with the guidelines defined in the 2012
Edition of the Australasian Code for Reporting of Exploration Results, Mineral Resources and Ore Reserves
(“2012 JORC Code”).
4.1.3.1 Competent Person Statement
I, Samson Malenga, confirm that I am the Competent Person for the Kinsevere Mineral Resource section of this
Report and:
I am a full-time employee of MMG Limited at the time of the estimation.
I have disclosed to the reporting company the full nature of the relationship between myself and the company,
including any issue that could be perceived by investors as a conflict of interest.
I verify that the Kinsevere Mineral Resource section of this Report is based on and fairly and accurately reflects
in the form and context in which it appears, the information in my supporting documentation relating to the
Kinsevere Mineral Resources.
4.1.3.2 Competent Person Consent
Pursuant to the requirements Clause 9 of the JORC Code 2012 Edition (Written Consent Statement)
With respect to the sections of this report for which I am responsible – the Kinsevere Mineral Resources - I
consent to the release of the 2021 Mineral Resources and Ore Reserves Statement as at 30 June 2021 Executive
Summary and Technical Appendix Report and this Consent Statement by the directors of MMG Limited:
_______________________________________________ Date: ____________________________________________
Samson Malenga, BSc. Hons (Geol.),MBL, Pr.Sci.Nat, FGSSA (No. 965948
_______________________________________________ ____________________________________________
Signature of Witness: Witness Name and Residence: (e.g. town/suburb)
• I have read and understood the requirements of the 2012 Edition of the Australasian Code for Reporting
of Exploration Results, Mineral Resources and Ore Reserves (JORC Code, 2012 Edition).
• I am a Competent Person as defined by the JORC Code, 2012 Edition, having five years’ experience that
is relevant to the style of mineralisation and type of deposit described in the Report, and to the activity
for which I am accepting responsibility.
• I am a Fellow of The Geological Society of South Africa Reg No. 965948 and I am a Registered Professional
Natural Scientist with the South African Council for Natural Scientific Professions (SACNASP) – Reg No
400181/06.
• I have reviewed the relevant Kinsevere Mineral Resource section of this Report to which this Consent
Statement applies.
This signature was scanned for the exclusive use in
this document – the MMG Mineral Resource and Ore Reserve Statement as at 30 June 2021 – with the
author’s approval. Any other use is not authorised.
This signature was scanned for the exclusive use in
this document – the MMG Mineral Resource and Ore Reserve Statement as at 30 June 2021 – with the
author’s approval. Any other use is not authorised.
Serge Djemo
Lubumbashi, DRC
08/10/2021

MMG | 2021 June Mineral Resources and Ore Reserves Statement - Appendix Page 69 of 205
4.2 Ore Reserves - Kinsevere
4.2.1 Results
The 2021 Kinsevere Ore Reserves is based on the 2020 Mineral Resources model.
The 2021 Kinsevere Ore Reserves are summarised in Table 10.
Table 10 Kinsevere Ore Reserves tonnage and grade (as at 30 June 2021)
Kinsevere Ore Reserves
Contained Metal
Tonnes
(Mt)
Copper
(% Cu)
Copper
(% CuAS1)
Copper
(kt)
Copper AS1
(kt)
Stockpiles
Probable 7.0 1.6 1.3 115 88
Kinsevere Total 7.0 1.6 1.3 115 88 1 AS= Acid Soluble
Cut-off grades were calculated at a US$3.28/lb copper price and are based on a Net Value Script considering
gangue acid consumption. The cut-off grade approximates 1.3% CuAS for ex-pit material and 1.0% CuAS for
existing stockpiles reclaim.
Figures are rounded according to JORC Code guidelines and may show apparent addition errors.
Contained metal does not imply recoverable metal.
The main differences from the 2020 Ore Reserves are:
(i) Mining ceased in September 2020, the depletion of Oxide Low Grade stockpiles, since the cessation of
mining, has reduced the availability to suitable stockpiles (material type and grade) to blend with remaining
Black Shale material.
(ii) Potential Ex-Pit Oxide Processable Material would require approximately 6 months mining, however it is
uncertain if the remobilistion of a mining contractor would be cost prohibitive.
(iii) Assumed copper price increased to US$3.28/lb in 2021 from US$3.23/lb in 2020.
(iv) Mine and stockpile depletion.
(v) Insufficient material of economic grade to blend with low ratio (<0.5 CuAS / Cu) Black Shale material.
(vi) Projected cash flows from Ore Reserves do not pay for the existing (30 June 2021) rehabilitation liability.

MMG | 2021 June Mineral Resources and Ore Reserves Statement - Appendix Page 70 of 205
4.2.2 Ore Reserves JORC 2012 Assessment and Reporting Criteria
The following information provided in Table 11 complies with the 2012 JORC Code requirements specified by
“Table-1 Section 4” of the Code. Each of the items in this table has been summarised as the basis for the
assessment of overall Ore Reserves risk in the table below, with each of the risks related to confidence and/or
accuracy of the various inputs into the Ore Reserves qualitatively assessed.
Table 11 JORC 2012 Code Table 1 Assessment and Reporting Criteria for Kinsevere Ore Reserves 2021
Section 4 Estimation and Reporting of Ore Reserves
Criteria Commentary
Mineral Resource
estimates for
conversion to Ore
Reserves
• The Mineral Resources are reported inclusive of the Ore Reserves.
• The Ore Reserves includes Mineral Resources on stockpiles.
• All existing stockpiles have been considered for economic inclusion in the
Mineral Resources and Reserves.
Site visits • The Competent Person visited the site in August 2019 and in February 2020.
The Competent Person has been unable to visit site due to COVID-19
restrictions, however, he has been in regular contact with site personnel
regarding operational performance.
• Each visit consisted of discussions with relevant people associated with Ore
Reserves modifying factors including geology, grade control, mine-to-mill
reconciliation, mine dilution and mining recovery, geotechnical parameters,
mine planning and mining operations, metallurgy, tailings and waste storage,
and environmental and social disciplines. The outcomes from the visits have
confirmed a common understanding of assumptions, calculation of the cut-off
grades and development of the Life-of-Asset mine plan.
Study status • The current mine and processing plant configuration has been in operation
since September 2011. Ore Reserves are based on a combination of actual
historical performance and cost data, lab test work and metallurgical
simulation. This data has been adapted to projected Life-of-Asset planning.
• Life-of-Asset Reserve Estimates were produced as part of the MMG planning
cycle. This Estimate informs the Ore Reserves – it demonstrates it is technically
achievable and economically viable, while incorporating material Modifying
Factors.
Cut-off parameters • Breakeven cut-off grades (COG) were calculated at a US$3.28/lb copper price
and acid soluble to total copper ratio typically greater than or equal to 0.5. At
a variable gangue acid consumption based on the equation GAC (kg/t) =
33.823 x %Ca + 2.713 x %Mg + 2.8. The following approximate COG’s are
applied:
• 1.3% CuAS for ex-pit material.
• 1.0% CuAS for existing stockpiles reclaim.
•
• The ex-pit COG estimates are based on a Net Value Script (NVS) calculation
that incorporates commodity price assumptions, gangue acid consumption
and costs associated with current operating conditions.

MMG | 2021 June Mineral Resources and Ore Reserves Statement - Appendix Page 71 of 205
Section 4 Estimation and Reporting of Ore Reserves
Criteria Commentary
• The NVS routine identifies material that is both suitable and potentially
economic for processing in the Mineral Resources Model. This material is then
considered for inclusion in the Ore Reserves process.
• For the cost assumptions please see the “Costs” section.
• For the price assumptions please see the “Revenue factors” section.
Mining factors
or assumptions
• The method for Ore Reserves estimation included: mine dilution modelling, pit
optimisation, final pit and phase designs, consideration of mine and mill
schedule, all modifying factors and economic valuation.
• Kinsevere mine is an open pit operation that is mining and processing oxide
copper ore. The operation is currently processing existing oxide stockpiles
only, in-pit mining activities have currently ceased.
• This mining method is appropriate for the style and size of the mineralisation.
• No pit optimisation was conducted, as there is no study or mining tender
prices to support the mining cost for mining Oxide Only pits.
• Mining dilution is based on localised mining dilution modelling with an
additional unplanned dilution and ore loss of 5% respectively (unplanned
dilution and ore loss was 7% and 7% respectively in the 2019 Ore Reserves).
The dilution and ore loss modelling were designed to reflect historic
reconciliation data (2020 reconciliation study) of areas that are reflective of
future mining. The combination of the planned and unplanned dilution and
ore loss, effectively result in a reduction in metal of approximately 10%
compared with the Resource Model.
• Minimum mining width (bench size) has historically been typically in excess of
45m but is ~35m in some isolated areas during stage development.
• No Inferred Mineral Resources material has been included in optimisation
and/or Ore Reserves reporting.
• All required infrastructure is in place.
Metallurgical factors
or assumptions
• Kinsevere is an operating mine. The existing metallurgical process is a
hydrometallurgical process involving grinding, tank leaching, counter-current
decantation (CCD) washing, solvent extraction and electrowinning.
• The acid leach process has been operating successfully since start-up in
September 2011.
• Copper recovery is determined by the equation:
Cu recovery (%) = (0.963*CuAS)/TCu
where CuAS refers to the acid soluble copper content of the ore which is
determined according to a standard test. The CuAS value has historically
been around 80 to 90% of the total copper value though the exact
percentage varies with the ore type. Much of the non-acid soluble copper
is present in sulphides which are not effectively leached in the tank leaching
stage.
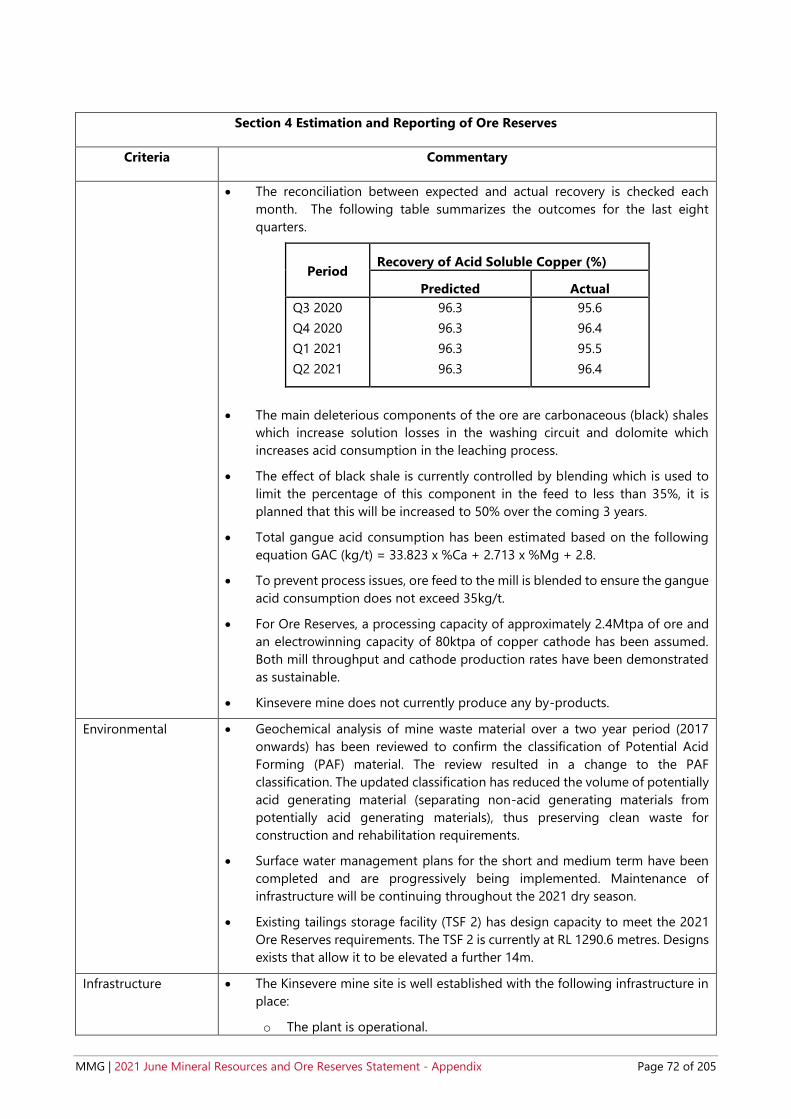
MMG | 2021 June Mineral Resources and Ore Reserves Statement - Appendix Page 72 of 205
Section 4 Estimation and Reporting of Ore Reserves
Criteria Commentary
• The reconciliation between expected and actual recovery is checked each
month. The following table summarizes the outcomes for the last eight
quarters.
Period Recovery of Acid Soluble Copper (%)
Predicted Actual
Q3 2020
Q4 2020
Q1 2021
Q2 2021
96.3
96.3
96.3
96.3
95.6
96.4
95.5
96.4
• The main deleterious components of the ore are carbonaceous (black) shales
which increase solution losses in the washing circuit and dolomite which
increases acid consumption in the leaching process.
• The effect of black shale is currently controlled by blending which is used to
limit the percentage of this component in the feed to less than 35%, it is
planned that this will be increased to 50% over the coming 3 years.
• Total gangue acid consumption has been estimated based on the following
equation GAC (kg/t) = 33.823 x %Ca + 2.713 x %Mg + 2.8.
• To prevent process issues, ore feed to the mill is blended to ensure the gangue
acid consumption does not exceed 35kg/t.
• For Ore Reserves, a processing capacity of approximately 2.4Mtpa of ore and
an electrowinning capacity of 80ktpa of copper cathode has been assumed.
Both mill throughput and cathode production rates have been demonstrated
as sustainable.
• Kinsevere mine does not currently produce any by-products.
Environmental • Geochemical analysis of mine waste material over a two year period (2017
onwards) has been reviewed to confirm the classification of Potential Acid
Forming (PAF) material. The review resulted in a change to the PAF
classification. The updated classification has reduced the volume of potentially
acid generating material (separating non-acid generating materials from
potentially acid generating materials), thus preserving clean waste for
construction and rehabilitation requirements.
• Surface water management plans for the short and medium term have been
completed and are progressively being implemented. Maintenance of
infrastructure will be continuing throughout the 2021 dry season.
• Existing tailings storage facility (TSF 2) has design capacity to meet the 2021
Ore Reserves requirements. The TSF 2 is currently at RL 1290.6 metres. Designs
exists that allow it to be elevated a further 14m.
Infrastructure • The Kinsevere mine site is well established with the following infrastructure in
place:
o The plant is operational.

MMG | 2021 June Mineral Resources and Ore Reserves Statement - Appendix Page 73 of 205
Section 4 Estimation and Reporting of Ore Reserves
Criteria Commentary
o Labour is mostly sourced from Lubumbashi and surrounding villages with
some expatriate support. There is an existing accommodation facility
onsite.
o There is sufficient water for the processing.
o Copper cathode is transported off-site by truck.
o Site has an access road that is partially sealed.
o There is power supply from the national grid and from onsite generators.
o The Ore Reserves do not require any additional land for expansion.
o Tailings Storage Facility is in place and future lifts are planned for.
• Grid power in country can be intermittent; mitigation management is through
diesel-based power generation. Future grid power availability is forecast to
improve.
• Timely dewatering of the mining areas continues to be an important aspect of
mining operations.
Costs • Kinsevere is an operating mine, historical costs have been used to inform the
2020 Kinsevere Budget (January 2021 to December 2021), with the exception
of the contract mining costs and the Sulphide Processing Plant costs.
• Given that mining operations are currently ceased, there is insufficient
information to support a mining cost of the mining of the Oxide Only Pits.
• Transportation charges used in the valuation are based on the actual invoice
costs that MMG are charged by the commodity trading company per the
agreement.
• Royalties charges have been considered, approximating 6% of the Copper
revenue.
• The processing costs include calculated gangue acid consumption.
• The final product contains no deleterious elements.
• US dollars have been used thus no exchange rates have been applied.
• Since the final Copper product is copper cathode (Grade A non LME registered)
there are no additional treatment, refining or similar charges.
• A cash flow model was produced based on the mine and processing schedule
and the aforementioned costs.
• The Ore Reserves estimation has been based on the abovementioned costs.
Revenue factors • For cost assumptions see section above – “Costs”
• The assumed long-term copper price is US$3.28/lb. This price is used to inform
the cut-off parameters (see cut-off section above). These prices are provided
by MMG corporate, approved by the MMG Board, and are based on external
company broker consensus and internal MMG analysis.
• The current practise is to process Black Shale material at a maximum blend of
35% of the total feed. Internal studies are currently in progress, they identify
opportunities whereby black shale is proposed to be processed up to 50% of
the total feed by Q3 2023.

MMG | 2021 June Mineral Resources and Ore Reserves Statement - Appendix Page 74 of 205
Section 4 Estimation and Reporting of Ore Reserves
Criteria Commentary
Market assessment • MMG considers that the outlook for the copper price over the medium and
longer term is positive, supported by further steady demand growth.
• Global copper consumption growth will continue to be underpinned by rising
consumption in China and the developing countries in Asia as these nations
invest in infrastructure such as power grids, commercial and residential
property, motor vehicles and transportation networks and consumer
appliances such as air conditioners.
• Global copper demand will also rise as efforts are made to reduce greenhouse
gas emissions through increased adoption of renewable energy sources for
electricity generation and electric vehicles for transportation.
• Supply growth is expected to be constrained by a lack of new mine projects
ready for development and the requirement for significant investment to
maintain existing production levels at some operations.
• There is a life of mine off-take agreement with a trading company in place for
all Kinsevere’s copper cathode production. The off-take arrangement has
been in place since the commencement of cathode production at site and has
operated effectively. There is no reason to expect any change to this in future..
Economic • The costs are based on historic actual operating costs and the 2020 Kinsevere
Budget.
• Revenues are based on historic and contracted realised costs. prices are based
on MMG’s short term pricing forecast (2021 to 2025) with a long-term forecast
of $3.28/lb Copper.
• The Ore Reserves financial model demonstrates the mine has a positive NPV,
assuming existing rehabilitation liability costs are treated as sunk.
• The discount rate is in line with MMG’s corporate economic assumptions and
is considered to be appropriate for the location, type and style of operation.
• Standard sensitivity analyses were undertaken for the Ore Reserve work and
support that the Ore Reserve estimate is robust.
Social • Social and Security teams are working together to mitigate security threats
resulting from theft and other illegal activities by engaging the community to
raise awareness of issues and garner support, improving security at the site.
• There were some incursions during 2020. Officials continue to be engaged in
the management of artisanal miners from the region and site. Improved
security management has been implemented in response to incursions.
• There was in increase in children entering site. The Social Development team,
authorities and community chiefs continue to engage to address this issue and
training programs were run through the schools to educate children on the
dangers and risks they could be exposed to.
• The Social Development team continue to engage with Community leaders
and government representatives regarding the MMG Social Development Plan
and governance and distribution of funds by the Cashier de’ Charges to better
direct the funds to those in need.
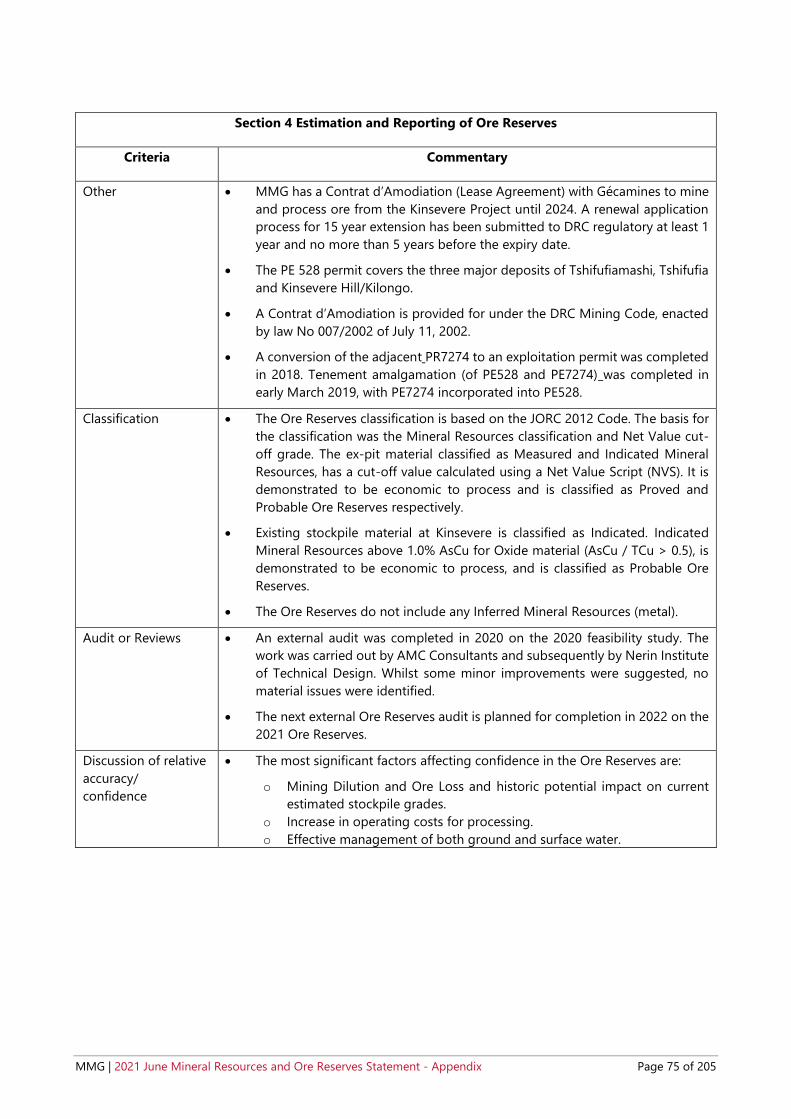
MMG | 2021 June Mineral Resources and Ore Reserves Statement - Appendix Page 75 of 205
Section 4 Estimation and Reporting of Ore Reserves
Criteria Commentary
Other • MMG has a Contrat d’Amodiation (Lease Agreement) with Gécamines to mine
and process ore from the Kinsevere Project until 2024. A renewal application
process for 15 year extension has been submitted to DRC regulatory at least 1
year and no more than 5 years before the expiry date.
• The PE 528 permit covers the three major deposits of Tshifufiamashi, Tshifufia
and Kinsevere Hill/Kilongo.
• A Contrat d’Amodiation is provided for under the DRC Mining Code, enacted
by law No 007/2002 of July 11, 2002.
• A conversion of the adjacent PR7274 to an exploitation permit was completed
in 2018. Tenement amalgamation (of PE528 and PE7274) was completed in
early March 2019, with PE7274 incorporated into PE528.
Classification • The Ore Reserves classification is based on the JORC 2012 Code. The basis for
the classification was the Mineral Resources classification and Net Value cut-
off grade. The ex-pit material classified as Measured and Indicated Mineral
Resources, has a cut-off value calculated using a Net Value Script (NVS). It is
demonstrated to be economic to process and is classified as Proved and
Probable Ore Reserves respectively.
• Existing stockpile material at Kinsevere is classified as Indicated. Indicated
Mineral Resources above 1.0% AsCu for Oxide material (AsCu / TCu > 0.5), is
demonstrated to be economic to process, and is classified as Probable Ore
Reserves.
• The Ore Reserves do not include any Inferred Mineral Resources (metal).
Audit or Reviews • An external audit was completed in 2020 on the 2020 feasibility study. The
work was carried out by AMC Consultants and subsequently by Nerin Institute
of Technical Design. Whilst some minor improvements were suggested, no
material issues were identified.
• The next external Ore Reserves audit is planned for completion in 2022 on the
2021 Ore Reserves.
Discussion of relative
accuracy/
confidence
• The most significant factors affecting confidence in the Ore Reserves are:
o Mining Dilution and Ore Loss and historic potential impact on current
estimated stockpile grades.
o Increase in operating costs for processing.
o Effective management of both ground and surface water.
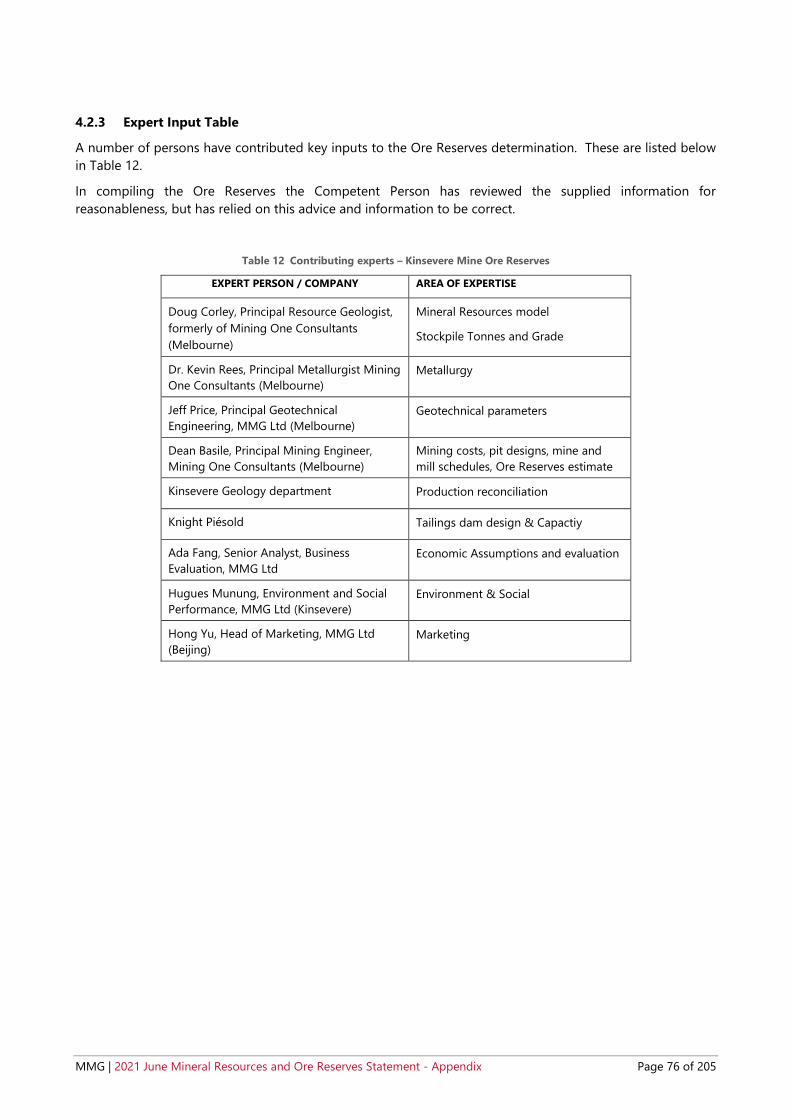
MMG | 2021 June Mineral Resources and Ore Reserves Statement - Appendix Page 76 of 205
4.2.3 Expert Input Table
A number of persons have contributed key inputs to the Ore Reserves determination. These are listed below
in Table 12.
In compiling the Ore Reserves the Competent Person has reviewed the supplied information for
reasonableness, but has relied on this advice and information to be correct.
Table 12 Contributing experts – Kinsevere Mine Ore Reserves
EXPERT PERSON / COMPANY AREA OF EXPERTISE
Doug Corley, Principal Resource Geologist,
formerly of Mining One Consultants
(Melbourne)
Mineral Resources model
Stockpile Tonnes and Grade
Dr. Kevin Rees, Principal Metallurgist Mining
One Consultants (Melbourne)
Metallurgy
Jeff Price, Principal Geotechnical
Engineering, MMG Ltd (Melbourne)
Geotechnical parameters
Dean Basile, Principal Mining Engineer,
Mining One Consultants (Melbourne)
Mining costs, pit designs, mine and
mill schedules, Ore Reserves estimate
Kinsevere Geology department Production reconciliation
Knight Piésold Tailings dam design & Capactiy
Ada Fang, Senior Analyst, Business
Evaluation, MMG Ltd
Economic Assumptions and evaluation
Hugues Munung, Environment and Social
Performance, MMG Ltd (Kinsevere)
Environment & Social
Hong Yu, Head of Marketing, MMG Ltd
(Beijing)
Marketing

MMG | 2021 June Mineral Resources and Ore Reserves Statement - Appendix Page 77 of 205
4.2.4 Statement of Compliance with JORC Code Reporting Criteria and Consent to Release
This Ore Reserve statement has been compiled in accordance with the guidelines defined in the 2012 Edition
of the Australasian Code for Reporting of Exploration Results, Mineral Resources and Ore Reserves (“2012 JORC
Code”).
4.2.4.1 Competent Person Statement
I, Dean Basile, confirm that I am the Competent Person for the Kinsevere Ore Reserves section of this Report
and:
I have read and understood the requirements of the 2012 Edition of the Australasian Code for Reporting
of Exploration Results, Mineral Resources and Ore Reserves (JORC Code, 2012 Edition).
I am a Competent Person as defined by the JORC Code, 2012 Edition, having five years’ experience that is
relevant to the style of mineralisation and type of deposit described in the Report, and to the activity for
which I am accepting responsibility.
I am a Member of The Australasian Institute of Mining and Metallurgy
I have reviewed the relevant Kinsevere Ore Reserves section of this Report to which this Consent Statement
applies.
I am a full time employee of Mining One Pty Ltd.
I have disclosed to the reporting company the full nature of the relationship between myself and the company,
including any issue that could be perceived by investors as a conflict of interest.
I verify that the Kinsevere Ore Reserves section of this Report is based on and fairly and accurately reflects in
the form and context in which it appears, the information in my supporting documentation relating to the
Kinsevere Ore Reserves.
4.2.4.2 Competent Person Consent
Pursuant to the requirements Clause 9 of the JORC Code 2012 Edition (Written Consent Statement)
With respect to the sections of this report for which I am responsible – the Kinsevere Ore Reserves - I consent
to the release of the 2021 Mineral Resources and Ore Reserves Statement as at 30 June 2021 Executive
Summary and Technical Appendix Report and this Consent Statement by the directors of MMG Limited:
_______________________________________________ ____________________________________________
Dean Basile MAusIMM(CP) (#301633) Date:
_______________________________________________ ____________________________________________
Signature of Witness: Witness Name and Residence: (e.g. town/suburb)
This signature was scanned for the exclusive use
in this document – the MMG Mineral Resource and Ore Reserve Statement as at 30 June 2021 – with
the author’s approval. Any other use is not
authorised.
This signature was scanned for the exclusive use in
this document – the MMG Mineral Resource and Ore Reserve Statement as at 30 June 2021 – with the
author’s approval. Any other use is not authorised.
07/10/2021
Davron Lu
Melbourne, VIC

MMG | 2021 June Mineral Resources and Ore Reserves Statement - Appendix Page 78 of 205
5 DUGALD RIVER MINE
5.1 Introduction and Setting
The Dugald River mine is located in northwest Queensland approximately 65km northwest of Cloncurry and
approximately 85km northeast of Mount Isa (Figure 5-1). It is approximately 11km (by the existing access road)
from the Burke Developmental Road, which runs from Cloncurry to Normanton. It is an underground zinc-lead-
silver deposit and a wholly owned by a subsidiary of MMG Limited.
Figure 5-1 Dugald River project location

MMG | 2021 June Mineral Resources and Ore Reserves Statement - Appendix Page 79 of 205
5.2 Mineral Resources – Dugald River
5.2.1 Results
The 2021 Dugald River Mineral Resources are summarised in Table 13. The Mineral Resource has been depleted
to account for mining of ore by way of underground development of ore drives and stope production. The
2021 Mineral Resource has been reported above an A$142/t NSR (net smelter return) cut-off.
Table 13 2021 Dugald River Mineral Resource tonnage and grade (as at 30 June 2021)
Dugald River Mineral Resource
Contained Metal
Tonnes
(Mt)
Copper
(% Cu)
Zinc
(% Zn)
Lead
(% Pb)
Silver
(g/t Ag)
Gold
(g/t Au)
Copper
(kt)
Zinc
(kt)
Lead
(kt)
Silver
(Moz)
Gold
(MoZ)
Primary Zinc1
Measured 13 13.1 2.4 80 1,700 310 34
Indicated 17 11.6 1.4 21 2,000 230 11
Inferred 36 11.2 0.8 9 4,000 280 10
Total 66 11.7 1.3 26 7,700 830 55
Stockpiles
Measured 0.05 10.8 2.1 57 5 1.0 0.08
Total 0.05 10.8 2.1 57 5 1.0 0.08
Total Primary
Zinc 66 11.7 1.3 26 7,700 830 55
Primary Copper2
Inferred 4.5 1.5 0.1 68 0.02
Total 4.5 1.5 0.1 68 0.02
Dugald River Total 68 7,700 830 55 0.02
¹ $142/t NSR Cut-off, in-situ (less depletion and oxide material)
² 1% Cu Cut-off, in-situ (less depletion and oxide material)
Figures are rounded according to JORC Code guidelines and may show apparent addition errors.
Contained metal does not imply recoverable metal

MMG | 2021 June Mineral Resources and Ore Reserves Statement - Appendix Page 80 of 205
5.2.2 Mineral Resources JORC 2012 Assessment and Reporting Criteria
The following information provided in Table 14 complies with the 2012 JORC Code requirements specified by
“Table-1 Section 1-3” of the Code.
Table 14 JORC 2012 Code Table 1 Assessment and Reporting Criteria for Dugald River Mineral Resource 2021
Section 1 Sampling Techniques and Data
Criteria Commentary
Sampling
techniques
• Diamond drilling (DD) methods of varying sizes comprise the majority of samples
collected to define the mineralisation. DD core was sampled to geological contacts
with average sample lengths being 1m through the mineralisation. The DD core,
dependent on core size and type of drilling, was sampled either as whole core, or
cut into ¾, ½, ¼ using a diamond core saw. Once samples were selected by a
geologist, the samples were marked and the allocated sample ID’s stored in the
database.
• Approximately 10% of the dataset was sampled using RC drilling techniques;
however, this was confined to pre-collar surface drilling and generally from regions
outside of the mineralised zone.
• Approximately 24% of the total drilled meters were sampled.
• The Table below shows samples collected at Dugald River for use in the Mineral
Resource model by drill type, hole size and sample type.
Drill Type Hole Size Sample Type Metres % of Total
DD
PQ Whole Core 254.8 0.18% UNK 230.16 0.16%
PQ3 1/2 Core 11 0.01% 1/4 Core 7 0.00%
HQ
Whole Core 2040.83 1.40% 1/2 Core 992.34 0.68% 1/4 Core 295.63 0.20% 3/4 Core 396.28 0.27% UNK 370.5 0.25%
HQ2 1/2 Core 5 0.00% HQ3 1/2 Core 5800.45 3.98%
NQ
Whole Core 2963.4 2.04% 1/2 Core 206.2 0.14% 1/4 Core 42 0.03% UNK 315.8 0.22%
NQ2
Whole Core 66842.25 45.92% 1/2 Core 42998.87 29.54% 1/4 Core 51.19 0.04% UNK 188 0.13%
NQ3 Whole Core 6 0.00% 1/2 Core 1203.35 0.83% UNK 157.8 0.11%
BQ/BQTK Whole Core 216.86 0.15% 1/2 Core 113.65 0.08%
LTK60 Whole Core 3783.19 2.60% 1/2 Core 2902.67 1.99%
UNK Whole Core 1553.4 1.07% 1/2 Core 457.5 0.31%
Total DD 134,406.12 92.33%
RC 100mm & 150mm Chips 1720 1.18% 5.75in Chips 1659.6 1.14% UNK Chips 7792.3 5.35%
Total RC 11,171.90 7.67% Grand Total 145,578.02 100%
• There are no inherent sampling problems recognised.

MMG | 2021 June Mineral Resources and Ore Reserves Statement - Appendix Page 81 of 205
Section 1 Sampling Techniques and Data
Criteria Commentary
• Measures taken to ensure sample representivity include orientation of the drill holes
as close as practical to perpendicular to the known mineralised structure, and the
collection and analysis of field duplicates
Drilling
techniques
• Drilling used for the Mineral Resource started in 1969 and continued until present.
Within the database used there are 3,363 drill holes (591 from surface {combination
of RC and DD} and 2,772 DD underground), summarised in the table below.
• Approximately 6% of the surface drilling data does not have drillhole diameters
recorded.
Drill Type DD Core/ RC Total Metres % of Total
DD
PQ3 18 0.00% HQ 4187.48 0.82% HQ2 5 0.00% HQ3 5800.45 1.14% NQ 3586.1 0.70% NQ2 139925.46 27.44% NQ3 1375.37 0.27% BQ 206.86 0.04% BQTK 123.65 0.02% LTK60 6684.56 1.31%
DD Sub Total 161,912.93 31.75%
RC 100&150 1720 0.34% 5.75in 1659.6 0.33% NQ2 7802.3 1.53%
RC Sub Total 11,181.90 2.19%
No Recovery
HQ 445.7 0.09% HQ3 7169.03 1.41% NQ2 217478.14 42.64% NQ3 736.44 0.14% LTK60 1351.94 0.27%
No Recovery Sub Total 227,181.25 44.55%
No Sampling
5.75in 134.6 0.03% PQ3 169 0.03% HQ 2311.8 0.45% HQ3 1301.56 0.26% NQ 746.5 0.15% NQ2 102313.98 20.06% NQ3 19.75 0.00% BQTK 575.22 0.11% LTK60 2126.68 0.42%
No Sampling Sub Total 109,699.09 21.51% Grand Total 509,975.17 100%
DD = Surface diamond drilling, RC= Reverse circulation drilling
• Some historical holes (drilled prior to 1969) and other listed drill holes were not used
for this estimate due to poor sample quality and reliability.
Drill sample
recovery
• Recovery recorded during core logging was generally 100%, with minor losses in
broken / sheared and faulted ground.
• At times, triple tube drilling from surface has been used to maximise core recovery,
but this is not common.
• RQD (rock quality designation) data was logged and recorded in the database to
measure the degree of jointing or fractures or core loss in the sample.
• Shearing and broken ground zones are located at the edges of the mineralisation
zone and are not associated with locations of good grade intercepts. There is no
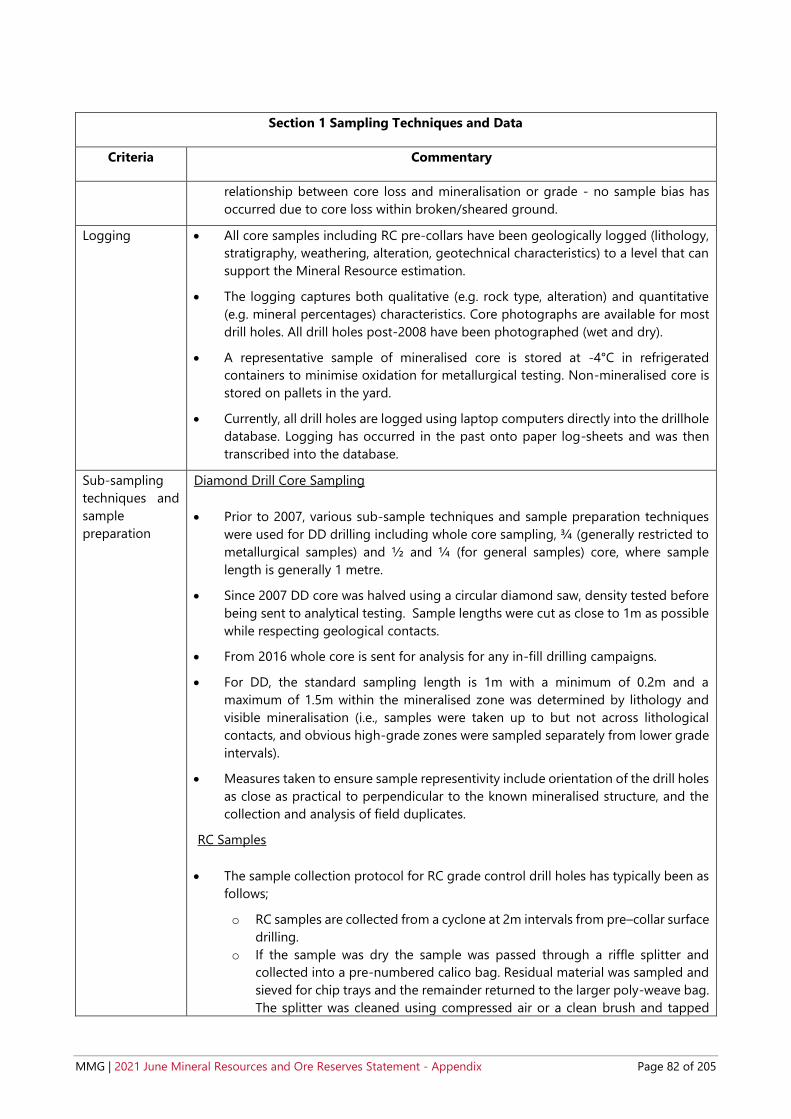
MMG | 2021 June Mineral Resources and Ore Reserves Statement - Appendix Page 82 of 205
Section 1 Sampling Techniques and Data
Criteria Commentary
relationship between core loss and mineralisation or grade - no sample bias has
occurred due to core loss within broken/sheared ground.
Logging • All core samples including RC pre-collars have been geologically logged (lithology,
stratigraphy, weathering, alteration, geotechnical characteristics) to a level that can
support the Mineral Resource estimation.
• The logging captures both qualitative (e.g. rock type, alteration) and quantitative
(e.g. mineral percentages) characteristics. Core photographs are available for most
drill holes. All drill holes post-2008 have been photographed (wet and dry).
• A representative sample of mineralised core is stored at -4°C in refrigerated
containers to minimise oxidation for metallurgical testing. Non-mineralised core is
stored on pallets in the yard.
• Currently, all drill holes are logged using laptop computers directly into the drillhole
database. Logging has occurred in the past onto paper log-sheets and was then
transcribed into the database.
Sub-sampling
techniques and
sample
preparation
Diamond Drill Core Sampling
• Prior to 2007, various sub-sample techniques and sample preparation techniques
were used for DD drilling including whole core sampling, ¾ (generally restricted to
metallurgical samples) and ½ and ¼ (for general samples) core, where sample
length is generally 1 metre.
• Since 2007 DD core was halved using a circular diamond saw, density tested before
being sent to analytical testing. Sample lengths were cut as close to 1m as possible
while respecting geological contacts.
• From 2016 whole core is sent for analysis for any in-fill drilling campaigns.
• For DD, the standard sampling length is 1m with a minimum of 0.2m and a
maximum of 1.5m within the mineralised zone was determined by lithology and
visible mineralisation (i.e., samples were taken up to but not across lithological
contacts, and obvious high-grade zones were sampled separately from lower grade
intervals).
• Measures taken to ensure sample representivity include orientation of the drill holes
as close as practical to perpendicular to the known mineralised structure, and the
collection and analysis of field duplicates.
RC Samples
• The sample collection protocol for RC grade control drill holes has typically been as
follows;
o RC samples are collected from a cyclone at 2m intervals from pre–collar surface
drilling.
o If the sample was dry the sample was passed through a riffle splitter and
collected into a pre-numbered calico bag. Residual material was sampled and
sieved for chip trays and the remainder returned to the larger poly-weave bag.
The splitter was cleaned using compressed air or a clean brush and tapped

MMG | 2021 June Mineral Resources and Ore Reserves Statement - Appendix Page 83 of 205
Section 1 Sampling Techniques and Data
Criteria Commentary
using a rubber mallet. If the sample was wet then the sample was dried before
being split according to the procedure above (for dry samples).
o Historical RC programmes were designed to test the ‘un-mineralised’ hanging
wall material in DD pre-collars. 2m bulk composites stored at the drill site were
sampled using the spear method.
Sample Preparation
• The sample preparation of RC chips and DD core adheres to industry good practice.
• Since 2010, samples were bagged, numbered and dispatched to ALS Mt Isa
laboratory:
o Until 2016, the sample was jaw crushed, 50% split,
o Since 2016, all samples jaw crushed, then 100% re-crushed using a Boyd
crusher, 70% nominal passing 3.15mm
o The sample was rotary split with 500-800g retained and pulverised to 85%
passing 75µm.
o All rejected material was collected and saved (Coarse – jaw crushed product,
collected 2010 to 2016).
o Pulps were then sent to ALS Brisbane for analysis.
• For the 2007/2008 programme, laboratory sample preparations involved drying,
crushing (jaw and Boyd), and pulverising the ½ core sample to 85% passing 75μm.
• No detailed information can be found for laboratory preparation prior to 2007,
however a similar procedure is assumed.
• Various laboratories have been used over time and have been summarised in the
table below (over 89% of all assays have been through the ALS laboratories).
Date Range Laboratory Number of samples % of Total
2020-2021 ALS 22749 15.9%
2019-2020 ALS 16803 11.7%
2010 - 2019
ALS 79828 56.6%
GENALYS 439 0.3%
2001 - 2009
ALS 13142 9.2%
UNK 96 0.1%
Prior to 2000
AAL 234 0.2%
AMDEL 4551 1.3%
Aminya 224 0.2%
ANALABS 1887 1.3%
PILBARA 2175 1.5%
UNE 7 0.0%
UNK 1323 0.9%
Grand Total 143,458 100%
• Prior to 2013, measures taken to ensure sampling is representative of the in-situ
material collected included:
o Field duplicates (quarter core) were sampled at a rate of 1 per 20 samples
(approximately 4 per drill hole).
• Up to 2015 duplicate sampling was performed by selecting from returned coarse
rejects and resubmitted to ALS for analysis.
• Since 2015, duplicates were taken by the laboratory every 20th sample alternating
between a duplicate taken at the primary crushing stage or the pulverisation stage.
Batches that return standard values above three standard deviations (3SD) are failed

MMG | 2021 June Mineral Resources and Ore Reserves Statement - Appendix Page 84 of 205
Section 1 Sampling Techniques and Data
Criteria Commentary
and all or part of the batch is re-analysed by the Laboratory (ALS). Analysis of these
duplicate results indicate no bias and therefore the samples are deemed to be
representative of the mineralisation.
• The sample types, nature, quality and sample preparation techniques are
considered appropriate for the style of the Dugald River mineralisation
(sediment/shear hosted base metal) by the Competent Person.
Quality of assay
data and
laboratory tests
• The assaying methods currently applied at Dugald River are ICP-MS with a 4-acid
digest which is used for the analysis of Zn, Pb, Ag, Fe, S, Mn and Cu which are
estimated in the Mineral Resource. Total carbon (TotC) is analysed by Leco furnace.
All of these analyses are considered total.
o Since 2010, the four acid the digestion process used (ALS Brisbane) is as
follows:
o Approximately 0.25g of sample catch weighed into a Teflon test tube.
o HNO3 and HClO4 are added and digested at 115°C for 15 minutes.
o HF is added and digested at 115°C for 5 minutes.
o The tubes are then digested at 185°C for 145 to 180 minutes. This takes the
digest to incipient dryness (digest is not “baked”)
o 50% HCl is added and warmed
o Made to 12.5ml using 9.5ml 11% HCl.
• The table below summarises the analytical method and digest used for all assays in
the Mineral Resource estimate. Most of the assays have been determined by using
a four-acid digest with an ICP OES read.
Base Metal Analysis
Analytical Method
Total AAS ICP ICP AES
ICP MS
ICP AES MS
XRF Unknown
Four Acid 2,622 403 125,394 49 3471 131,939
Aqua Regia 5 3982 1 7 3,995
Aqua Regia Perchloric
4,290 4,290
Mixed Acid 355 166 521
Perchloric 175 88 98 361
Unknown 309 16 10 2017 2,352
Total 3,111 419 134,109 216 3478 10 1,609 143,458
•
• Gold assaying at Dugald River began in 1988 the hanging-wall copper lode was
discovered. Various different assay methods have been used and are summarised
in the table below. Most gold assays were done by ALS (Townsville), by Fire assay
with an AAS read, with a 50g charge used since 2008. At total of 579 gold assays
were completed using Aqua Regia with an AAS read (completed between 1990 and
1996).
Gold Analysis
Analytical Method
Total AR-AAS
FA-AAS 30g
FA-AAS 40g
FA-AAS 50g
Unknown
Laboratory
AAL 96 96
ALS 12,084 14,504 26,596
AMDEL 413 407 408 57 80 1,365
ANALABS 70 763 1777 2610
PILBARA 212 212
Aminya 12
UNK 144 144
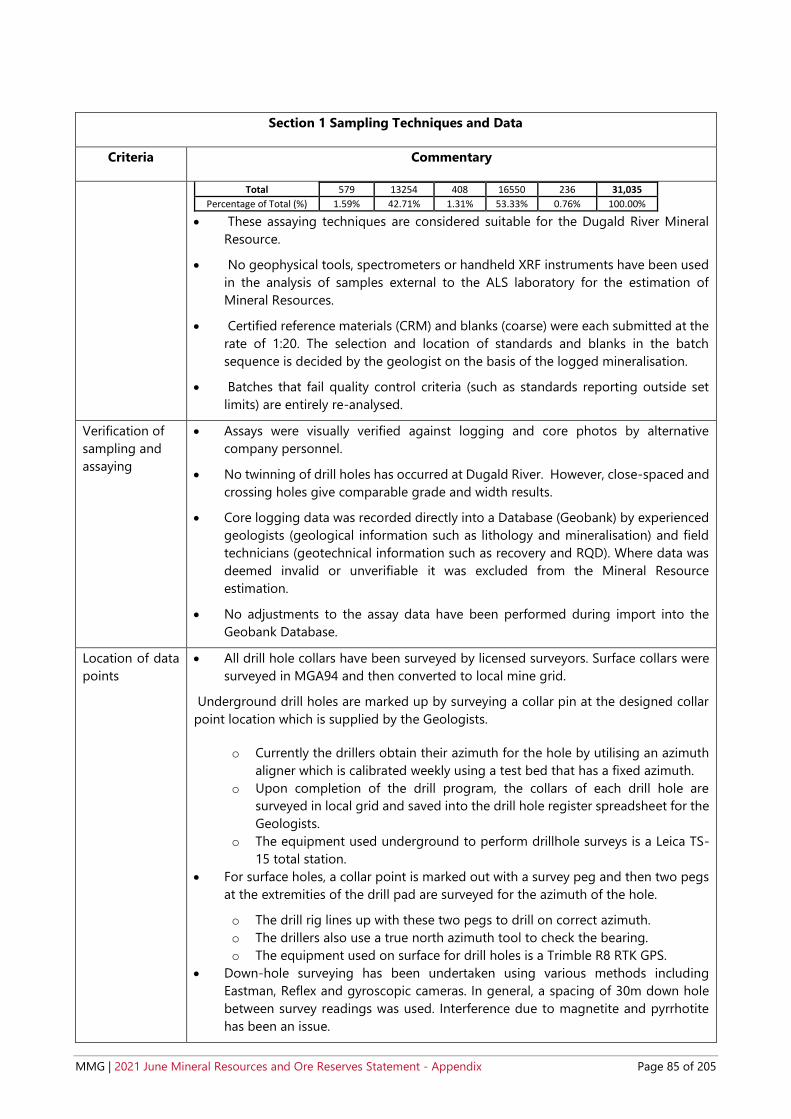
MMG | 2021 June Mineral Resources and Ore Reserves Statement - Appendix Page 85 of 205
Section 1 Sampling Techniques and Data
Criteria Commentary
Total 579 13254 408 16550 236 31,035
Percentage of Total (%) 1.59% 42.71% 1.31% 53.33% 0.76% 100.00%
• These assaying techniques are considered suitable for the Dugald River Mineral
Resource.
• No geophysical tools, spectrometers or handheld XRF instruments have been used
in the analysis of samples external to the ALS laboratory for the estimation of
Mineral Resources.
• Certified reference materials (CRM) and blanks (coarse) were each submitted at the
rate of 1:20. The selection and location of standards and blanks in the batch
sequence is decided by the geologist on the basis of the logged mineralisation.
• Batches that fail quality control criteria (such as standards reporting outside set
limits) are entirely re-analysed.
Verification of
sampling and
assaying
• Assays were visually verified against logging and core photos by alternative
company personnel.
• No twinning of drill holes has occurred at Dugald River. However, close-spaced and
crossing holes give comparable grade and width results.
• Core logging data was recorded directly into a Database (Geobank) by experienced
geologists (geological information such as lithology and mineralisation) and field
technicians (geotechnical information such as recovery and RQD). Where data was
deemed invalid or unverifiable it was excluded from the Mineral Resource
estimation.
• No adjustments to the assay data have been performed during import into the
Geobank Database.
Location of data
points
• All drill hole collars have been surveyed by licensed surveyors. Surface collars were
surveyed in MGA94 and then converted to local mine grid.
Underground drill holes are marked up by surveying a collar pin at the designed collar
point location which is supplied by the Geologists.
o Currently the drillers obtain their azimuth for the hole by utilising an azimuth
aligner which is calibrated weekly using a test bed that has a fixed azimuth.
o Upon completion of the drill program, the collars of each drill hole are
surveyed in local grid and saved into the drill hole register spreadsheet for the
Geologists.
o The equipment used underground to perform drillhole surveys is a Leica TS-
15 total station.
• For surface holes, a collar point is marked out with a survey peg and then two pegs
at the extremities of the drill pad are surveyed for the azimuth of the hole.
o The drill rig lines up with these two pegs to drill on correct azimuth.
o The drillers also use a true north azimuth tool to check the bearing.
o The equipment used on surface for drill holes is a Trimble R8 RTK GPS.
• Down-hole surveying has been undertaken using various methods including
Eastman, Reflex and gyroscopic cameras. In general, a spacing of 30m down hole
between survey readings was used. Interference due to magnetite and pyrrhotite
has been an issue.

MMG | 2021 June Mineral Resources and Ore Reserves Statement - Appendix Page 86 of 205
Section 1 Sampling Techniques and Data
Criteria Commentary
o During the 2007/2008 drilling program routine survey checks were undertaken
on the reflex survey camera using an aluminium calibration stand positioned
in a known orientation.
o Since 2008 all drill holes are gyroscopically surveyed.
o True North seeking azimuth tool has been used since 2017, to limit the effect
of magnetic declination corrections.
• The grid system used is MGA94, the conversion to local mine grid is rotated and
scaled. The grid transformation is undertaken using a formula provided by the
onsite surveyors.
• A LIDAR survey flown in 2010 is used for topographic control on surface drilled drill
holes. In the view of the Competent Person the LIDAR survey provides adequate
topographic control.
Data spacing
and distribution
• Drill spacing varies across the strike and dip of the mineralisation lode. The highest
drill density in the ore body is 20m x 10m while the lowest drill density is greater
than 100m x 100m spacing.
• Locations drilled at 20m x 10m and up to 20m x 15m are adequate to establish both
geological and grade continuity. Wider spaced drilling is adequate for definition of
broader geological continuity but not sufficient for accurate grade continuity.
• Underground mapping of faces is digitised and used in the interpretation and wire-
framing process.
• Drill hole data is concentrated within the upper 500m of the Mineral Resource with
broader-spaced drilling at depth, due to the access restraints, mine schedule
requirements and cost involved in drilling deeper sections.
• Drill spacing and distribution is sufficient to establish the degree of geological and
grade continuity appropriate for the Mineral Resource estimation procedure and
classification applied. For Measured Resources, drill spacing of approximately 20m
x 20m (in addition to other estimation quality criteria) is required. For Indicated
Resources, drill spacing of approximately 50m x 50m is required. For Inferred
Resources, a drill spacing of 100m x 100m is considered acceptable.
• Samples are not composited prior to being sent to the laboratory for analysis.
Orientation of
data in relation
to geological
structure
• Geological mapping (both underground and surface) and interpretation show that
the mineralisation is striking north-south and dips between 85 and 45 degrees
towards the west. Hence drilling is conducted on east-west and west-east directions
to intersect mineralisation across-strike. Underground infill drilling is completed
from stockpile locations underground with drill holes at varying orientations
completed to test the mineralisation. The orientation of these drill holes is no
greater than 40° from orthogonal to the mineralisation and is therefore not
considered to be introducing bias to the sampling.
• Drilling orientation is not considered to have introduced sampling bias. Drill holes
that have been drilled down dip and sub-parallel to the mineralisation have been
excluded from the estimate.

MMG | 2021 June Mineral Resources and Ore Reserves Statement - Appendix Page 87 of 205
Section 1 Sampling Techniques and Data
Criteria Commentary
Sample security • Measures to provide sample security include:
o Adequately trained and supervised sampling personnel.
o Well maintained and ordered sampling sheds.
o Cut core samples stored in numbered and tied calico sample bags.
o Calico sample bags transported by courier to assay laboratory.
o Assay laboratory checks of sample dispatch numbers against submission
documents.
o Assay data is returned as a .sif file via email and processed via the MMG assay
loading software.
Audit and
reviews
• The Dugald River database has been housed in various SQL databases. iOGlobal
managed the database until the end of 2009 when the database was transferred
and migrated to an MMG database using the Micromine Geobank platform.
o Internal audits and checks were performed at this time. Any suspicious data
was investigated and rectified or flagged and excluded.
• No external independent audits have been performed on the database. The
Competent Person has verified the information in the drill hole database back to
source assay, collar and down hole survey data for approximately 10% of the data
collected in the preceding 12 months with no issues identified.
• No external independent audits have been performed on the sampling techniques
or the database.
• Both ALS Mount Isa and Brisbane laboratories are audited on an annual basis by
MMG personnel. From the most recent audit there were no material
recommendations made.
Section 2 Reporting of Exploration Results
Criteria Commentary
Mineral
tenement and
land tenure
status
• The Dugald River Mining Leases are wholly owned by a subsidiary of MMG Limited.
• MMG holds one exploration lease and one mineral development lease in addition
to the 40 mining leases on which the Dugald River Mineral Resource is located.
EPM12163 consists of 3 sub-blocks and covers an area of 20 km2 to the west of the
Dugald River deposit. ML2479 overlaps the eastern area of the EPM12163. The list
of leases includes;
o ML2467-ML2471
o ML2477-ML2482
o ML2496-ML2502
o ML2556-ML2559
o ML2596
o ML2599
o ML2601
o ML2638
o ML2684-ML2685
o ML7496
o ML90047

MMG | 2021 June Mineral Resources and Ore Reserves Statement - Appendix Page 88 of 205
Section 2 Reporting of Exploration Results
Criteria Commentary
o ML90049-ML90051
o ML90211-ML90213
o ML90218
o ML90220
o ML90230
o ML90237
• There are no known impediments to operating in the area and the leases are
maintained in good administrative condition.
Exploration
done by other
parties
• The History of the Dugald river zinc-lead deposit is summarised as follows:
o Discovered in 1881, the first drilling programme in 1936 comprised three drill
holes. The maiden Mineral Resource was reported in 1953 by Zinc
Corporation. Drilling continued from 1970 through 1983 totalling 28 drill
holes. CRA then re-estimated the Mineral Resource in 1987. Between 1989
and 1992 a further 200 drill holes were drilled, resulting from the discovery of
the high-grade, north plunging shoot. Infrastructure, metallurgical and
environmental studies were undertaken during this period. Between 1993 and
1996 irregular drilling was focused on the delineation of copper mineralisation
in the hanging wall. In 1997 the project was transferred to Pasminco, which
had entered a joint venture with CRA in 1990. Recompilation of the database,
further delineation drilling, metallurgical test work, and the check assaying of
old pulps was completed. Continued drilling between 2000 and 2009 with
subsequent metallurgical studies culminated in a Feasibility Study. Structural
analysis and a focused review on the northern copper zone in 2010 were
completed. In 2011 the decline commenced which resulted in trial stoping. In
2014 some underground development was completed and drilling focused on
confirming and extending continuity of the mineralisation within the Dugald
River lode.
Geology • The Dugald River style of mineralisation is a sedimentary and shear hosted base
metal deposit. The main sulphides are sphalerite, pyrite, pyrrhotite and galena with
minor arsenopyrite, chalcopyrite, tetrahedrite, pyrargyrite, marcasite and
alabandite.
• The deposit is located within a 3 km-4 km along strike north-south trending high
strain domain named the Mount Roseby Corridor and is hosted by steeply dipping
mid Proterozoic sediments of the Mary Kathleen Zone in the Eastern Succession of
the Mount Isa Inlier. The host sequence is composed of the Knapdale Quartzite and
the Mount Roseby Schist Group (which includes the Hanging wall calc-silicate unit,
the Dugald River Slate and the Lady Clayre Dolomite). The sequence is an
interbedded package of greenschist to amphibolite grade metamorphosed
carbonate and siliclastic lithologies.
• The main Dugald lode is hosted within a major N-S striking steeply west dipping
shear zone which cross-cuts the strike of the Dugald River Slate stratigraphy at a
low angle. All significant zinc-lead-silver mineralisation is restricted to the main
lens with the hanging wall and footwall lenses being predominantly zinc
mineralised. Three main mineralisation textures/types are recognised, including
banded, slatey breccia, and massive breccia.

MMG | 2021 June Mineral Resources and Ore Reserves Statement - Appendix Page 89 of 205
Section 2 Reporting of Exploration Results
Criteria Commentary
• The geometry of the deposit consists of the boudinaged main lens, which pinches
and swells in thickness along strike and to depth. It is recognised that the previously
modelled hangingwall and footwall domains (1A, 2, 3, 4 and 5) are part of the main
lens which anastomoses, splits and merges. All zinc and associated lead-silver
mineralisation are governed by this geometry.
• The mineralogy of the Dugald lode is typical of a slate-hosted base metal deposit.
The gangue within the lode is composed of quartz, muscovite, carbonates, K-
Feldspar, clays, graphite, carbonaceous matter and minor amounts of calcite, albite,
chlorite, rutile, barite, garnet, and fluorite.
• The mineralised zone extends approximately 2.4 km in strike length and up to 1.4
km down dip.
Drill hole
information
• 3,363 drill holes and associated data are held in the database (combination of RC
and DD).
• No individual hole is material to the Mineral Resource estimate and hence this
geological database is not supplied.
Data
aggregation
methods
• This is a Mineral Resource Statement and is not a report on exploration results
hence no additional information is provided for this section.
Relationship
between
mineralisation
width and
intercepts
lengths
• Mineralisation true widths are captured by three-dimensionally modelled
wireframes with drill hole intercept angles ranging from 90° to 40°.
• The true thickness of the majority of the Mineral Resource is between 3m and 30m
with the thickest zones occurring to the south.

MMG | 2021 June Mineral Resources and Ore Reserves Statement - Appendix Page 90 of 205
Section 2 Reporting of Exploration Results
Criteria Commentary
Diagrams
Schematic cross section looking north – showing thickness variations and distribution

MMG | 2021 June Mineral Resources and Ore Reserves Statement - Appendix Page 91 of 205
Section 2 Reporting of Exploration Results
Criteria Commentary
Inclined cross-section through the South Mine with the 2020 high-grade Zn wireframe
(salmon polygon), drilling (pale grey traces) and development (light grey 3D mesh). A HW
lens can be seen splitting from the main orebody and anastomoses due to the influence of
graphitic shears (not displayed).

MMG | 2021 June Mineral Resources and Ore Reserves Statement - Appendix Page 92 of 205
Section 2 Reporting of Exploration Results
Criteria Commentary
Cross section 14110mN of the South Mine looking north – 1% zinc composite wireframes
(yellow) with 7% zinc composite wireframes (red), development (grey), limestone contact
(blue), calc-silicate contact (purple), mafic porphyry contact (green) with topography (grey).
Cross section 14960mN of the North Mine looking north – 1% zinc composite wireframes
(yellow) with 7% zinc composite wireframes (red), development (grey), limestone contact
(blue), calc-silicate contact (purple), mafic porphyry contact (green) with topography
(grey).

MMG | 2021 June Mineral Resources and Ore Reserves Statement - Appendix Page 93 of 205
Section 2 Reporting of Exploration Results
Criteria Commentary
Balanced
reporting
• This is a Mineral Resource Statement and is not a report on exploration results
hence no additional information is provided for this section.
Other
substantive
exploration data
• This is a Mineral Resource Statement and is not a report on exploration results
hence no additional information is provided for this section.
Further work • MMG plans to continue to improve geological confidence and Mineral Resource
classification through infill drilling programmes ahead of the mining schedule.
Section 3 Estimating and Reporting of Mineral Resources
Criteria Commentary
Database
integrity
• The following measures are in place to ensure database integrity:
o All data is stored in an SQL database that is routinely backed up.
o All logging is digital and directly entered into the onsite Geobank database.
Data integrity is managed by internal Geobank validation checks/routines that
are administered by the Database Group and/or the site Geology Team.
• The measures described above ensure that transcription or data entry errors are
minimised. Data validation procedures include:
o Database validation procedures are built in the database system to manage
accurate data entry during logging and collection of data.
o Prior to use in the Mineral Resource the data was checked externally by
running Datamine macros on the drill hole file to check for end of hole depths,
and sample overlaps.
o Manual checks were carried out by reviewing the drill hole data in plan and
section views.
Site visits • The Competent Person visited site during early 2021 that included the following:
o Review of the geological controls, wireframe interpreation and methodology
as applied in the 2021 Mineral Resource work.
o Review of orebody knowledge advancements since 2017.
o Review of modelling and estimation advancements since 2019.
o Review of the drill hole pacing used to define the Mineral Resource.
o Inspection of geological mapping plans and underground workings.
o Inspection of drill holes and mineralisation intercepts.
o Inspection of data collection, sampling and data management protocols in
place.
o Review and verification of the results of the QAQC program for the previous
12 months.
o Review of the drilling supervision and management processes.
Geological
interpretation
• The mineralisation is modelled as a continuous lenses of zinc mineralisation that
anastomoses, splits and merges. The model is based on zinc grade distribution and
geological logging of mineralisation style. Composites of 1% zinc for the low-grade
wireframe and 7% zinc for the high-grade wireframe form the basis of the model.

MMG | 2021 June Mineral Resources and Ore Reserves Statement - Appendix Page 94 of 205
Section 3 Estimating and Reporting of Mineral Resources
Criteria Commentary
o The mineralisation zone is divided into a high- and low-grade zinc domains.
The high-grade domain is further sub-divided to include an internal waste
domain.
o The high-grade domain is defined by high zinc grades associated with the
massive sulphide assemblages. The high-grade domain boundary was
modelled using the 7% zinc composites and geological continuity.
o The lower grade mineralisation captures an assemblage of sulphide stringers
and shoots of discontinuous massive and breccia sulphide textures. The low-
grade domain boundary was modelled using the 1% zinc composites and
geological continuity.
o An internal dilution domain was created to capture material below 6% zinc
within the high-grade domain boundary.
• Separate domains were modelled for Pb, Ag and Mn mineralisation, after
exploratory data analysis (EDA) have shown these elements are possibly due to a
secondary mineralisation event; and are contained throughout the main zinc lens.
Long section (looking West) of the Pb domains within the Zn orebody with low grade
(blue) and high grade (purple)
Long section (looking West) of the Ag domains (red to yellow) within the Zn low grade
orebody (blue)

MMG | 2021 June Mineral Resources and Ore Reserves Statement - Appendix Page 95 of 205
Section 3 Estimating and Reporting of Mineral Resources
Criteria Commentary
Long section (looking West) of the Mn domains (red to yellow) within the Zn low grade
orebody (blue)
• A reinterpretation of the hangingwall copper domain was carried out to coincide
with the February 2021 Mineral Resource model update. Two types of Cu
mineralisation occur; one occurs in the hangingwall of the South Mine deposit and
HW Zn lens position and is associated with Au and locally high in Au and Mo. The
second type occurs between the South Mine between the main lens and HW lens
with lower Au but associated with Co which is locally very elevated (>1%).
• The hangingwall Cu-Au mineralisation occurs primarily as chalcopyrite within the
mica schist but can extend into the mafic porphyry and black slate. High-grade Cu-
Au occurs as extensive chalcopyrite stringers in the black slate, like the transposed
banded ore and sulphide stringers in the Zn orebody. The most substantial zones
of chalcopyrite occur with albite-chlorite-white mica-epidote-silica altered mica
schist and as matrix cement in milled breccias, (similar to the Zn orebody). Lastly,
chalcopyrite occurs as infill and at the margins of large quartz veins. Rare bornite
is locally disseminated in the altered mica schist, mafic porphyry, and calc-silicate.
• The second Cu-Co type mineralisation occurs at the margins of intensely albite
alteration that contains disseminated pyrite. The margins of the albite are brecciated
with carbonate infill with trace chalcopyrite and arsenopyrite. The deportment of
the Co is unknown but is interpreted to occur in cobaltite, arsenopyrite and/or
cobaltiferous pyrite.

MMG | 2021 June Mineral Resources and Ore Reserves Statement - Appendix Page 96 of 205
Section 3 Estimating and Reporting of Mineral Resources
Criteria Commentary
Long-section (looking East) Dugald River Copper Wireframes. HGCU – Red and LGCU –
Green wireframe.
Cross-section (looking North) from panels 3-4B showing 2021 hanging wall HGCU
wireframe (red outlines) and LGCU wireframe (blue outlines); based on the current
geological understanding of Dugald River deposit. The 2021 HGZN Wireframe
interpretation showing in green outlines.
• Underground mapping of development drives for both access and ore drives were
also used in assisting with the geological interpretation.
• Globally the Dugald River deposit follows a reasonably predictable lens of
mineralisation but with short-range (10m to 20m-scale) variations associated with

MMG | 2021 June Mineral Resources and Ore Reserves Statement - Appendix Page 97 of 205
Section 3 Estimating and Reporting of Mineral Resources
Criteria Commentary
localised structures that are suitably defined by close-spaced drilling within the
Measured Mineral Resources.
Dimensions • The Dugald River lode is hosted within a major N-S striking steeply west dipping
shear zone which cross cuts the strike of the Dugald River Slate stratigraphy at a
low angle.
• The strike length of mineralisation is approximately 2,400 m. Dip varies between 85°
and 40° to the west.
• The true thickness of the majority of the Mineral Resource is between 3 m and 30
m with the thickest zones occurring to the south.
• The mineralisation is open at depth. The deepest drill intersection of mineralised
material is about 1,140 m below the surface.
Estimation and
modelling
techniques
• Mineral Resource modelling was completed using both Isatis and Vulcan software
applying the following key assumptions and parameters:
o The drillhole database was composited to 1m downhole lengths in Vulcan
software with a residual applied during the compositing process. The
composite length selected is considered appropriate for the style of
mineralisation and mining method.
o The grade distributions of the composited samples within each mineralised
domain were analysed for the existence of extreme values using a combination
of log histogram and cumulative log probability plots. For those domains with
extreme values present, grade caps were applied with values greater than the
selected ‘cap value’ being set to the grade cap value and used in the
estimation. The impact of the grade caps on the average grade of the domain
and the CV of the domain were assessed and deemed acceptable
▪ Zn HG domain has a grade cap applied of 35.0% Zn,
▪ The Zn LG domain has a grade cap applied of 15.0% Zn,
▪ The Pb HG domain has a grade cap applied of 15.0% Pb,
▪ The Pb LG domain has a grade cap applied of 2.0% Pb,
▪ The Ag HG domain has a grade cap applied of 600ppm Ag,
▪ The Ag MG and LG domains have a grade cap applied of
200ppm Ag.
o Variograms were modelled within each of the respective domains using the
capped composites, with these variogram ranges then applied to the search
parameters used in the estimation.
o Separate variographic analyses were performed for Zn, Pb, Ag, Mn, Fe, S, bulk
density, Cu, Au and total carbon, within each of their respective mineralised
domains.
o No assumptions have been made about the correlation between variables. All
variables are comparably informed and independently estimated.
o A block model was created in Vulcan 3D modelling software.
▪ A parent block size was set at 2.5m x 12.5m x 12.5m (xyz) with
sub-cells of x=0.5m, y=1.25m, z=1.25m. Sub-cells were
assigned parent block values. The parent block size assumes
mining selectivity at the stope level.
▪ In areas of close-spaced drilling (10 x 20m), the parent block size
was set to 2.5m x 6.25m x 6.25m (xyz) with sub-cells of x=0.5m,

MMG | 2021 June Mineral Resources and Ore Reserves Statement - Appendix Page 98 of 205
Section 3 Estimating and Reporting of Mineral Resources
Criteria Commentary
y=1.25m, z=1.25m. Sub-cells were assigned parent block
values. This block size is used to better estimate local variance
with increased information.
▪ Background waste is estimated with parent block size of 10m x
50m x 50m (xyz), this was to reduce the total block model size.
o Ordinary Kriging interpolation has been applied for the estimation of Zn, Pb,
Ag, Mn, Fe, S, total carbon, Cu, Au and Bulk Density. This is considered
appropriate for the estimation of Mineral Resources at Dugald River.
o Separate estimations were performed for each element within their respective
mineralised domains.
o Hard boundary contacts were used to select samples used to estimate blocks
in each of the mineralised zinc domains (high-grade and low-grade) as well as
into individual domains for Ag, Mn and Pb. Hard boundaries were also used
for the copper domain to estimate Cu, Co and Au.
o Interpolation was undertaken generally in three passes, although a fourth pass
was applied if the third pass failed to adequately fill the blocks within the
mineralisation domains:
▪ Pass 1 was set at approximately half the variogram range in the
major and semi-major directions with a minimum of 6 and a
maximum of 20 samples used.
▪ Pass 2 was set at the variogram range in all three directions
within a minimum of 6 and a maximum of 18 samples used.
▪ Pass 3 was at twice the variogram range with the minimum
number of samples reduced to three and a maximum of 18
samples used.
▪ If required, Pass 4 was set at three times the variogram range
with the same number of samples used as for the third pass.
▪ All four passes had a maximum of 3 samples per drill hole limit
applied.
o Octant or sector method was generally not applied to the Ordinary Kriging
estimate
o Block discretisation of 2 x 8 x 8 was applied.
o Grades within the internal and surrounding waste domains have been
estimated using similar parameters to the mineralisation.
o Grade estimation was performed using a local varying anisotropy (LVA), which
aligns and optimises the search direction of the estimate to the mineralised
domain trend.
o Orientation of the search ellipse was matched to the LVA, that is the dip and
dip direction at the local block was used in the estimation of the model.
o Deleterious elements include manganese and total carbon have been
estimated in the block model. Ancillary elements estimated include Mn, Fe and
S.
• Assumptions have been made regarding the recovery of all by-products in the NSR
used to report the Mineral Resource.
• No external dilution has been applied to block grades. However, parent block size
has assumed mining selectivity at a stope level. No other selective mining unit size
assumptions were made in the estimation process.

MMG | 2021 June Mineral Resources and Ore Reserves Statement - Appendix Page 99 of 205
Section 3 Estimating and Reporting of Mineral Resources
Criteria Commentary
• 2021 block model validation included the following steps:
o Comparison against the previous 2020 block model including visual
comparison of plans and cross-sections, tonnes grade curves, cumulative
probability plots and trend plots.
o Comparison against drillhole data using visual comparison of plans and cross-
sections, statistics by domain, cumulative probability plots and swath plots.
o The most significant changes between the two models involved the copper
estimation. The high and low grade copper mineralisation wireframes used in
the 2021 Mineral Resource estimate utilised a different modelling method
which was developed to minimise the degree of extrapolation during the
modelling and also to treat as zero, the unsampled intervals. This has resulted
in a significant change in mineralised volume for the copper.
Moisture • Tonnes in the model have been estimated on a dry basis.
Cut-off
parameters
• The Mineral Resource is reported above an A$142/t NSR (net smelter return) cut-
off. The selection of the A$142/t NSR cut-off defines mineralisation which is
prospective for future economic extraction. The reporting cut-off grade is in line
with MMG’s policy on reporting of Mineral Resources which is prospective for future
economic extraction.
Mining factors
or assumptions
• Mining at Dugald River is planned to be underground with the long-hole open
stoping method favoured. Currently the deposit is accessed by two declines.
• No external dilution has been applied to block grades. However, parent block size
has assumed mining selectivity at a stope level.
• The Mineral Resource has been depleted to account for mining and any un-minable
stope remnants.
Metallurgical
factors or
assumptions
• The metallurgy process proposed for the Dugald River deposit involves crushing
and grinding followed by flotation and filtration to produce separate zinc and lead
concentrates for sale.
• Deleterious elements include manganese and carbon, which have been estimated
in the block model.
• Manganese percentage in the zinc concentrate is calculated as a post-processing
step to allow the generation of a value that can be used for the Ore Reserve.
Environmental
factors or
assumptions
• Dugald River operates under Environmental Authority EPML00731213 issued by the
Department of Environment Heritage Protection on 12 August 2012 and amended
on 16 September 2016.
• Non-acid forming (NAF) and Potentially Acid Forming (PAF) waste rock are
distinguished by a north-south striking Limestone and Undifferentiated Black Slate
lithological boundary respectively. Volumes are estimated and managed in
accordance with site procedures. Waste rock storage space on surface is limited.
The north mine area will allow for the return of waste rock as backfill and the south
mine is backfilled with paste fill generated from tailings.
• PAF/NAF classification is based on the work by Environmental Geochemistry
International (EGI) in 2010. Subsequent follow-up test work onsite confirms EGI’s
conclusions.
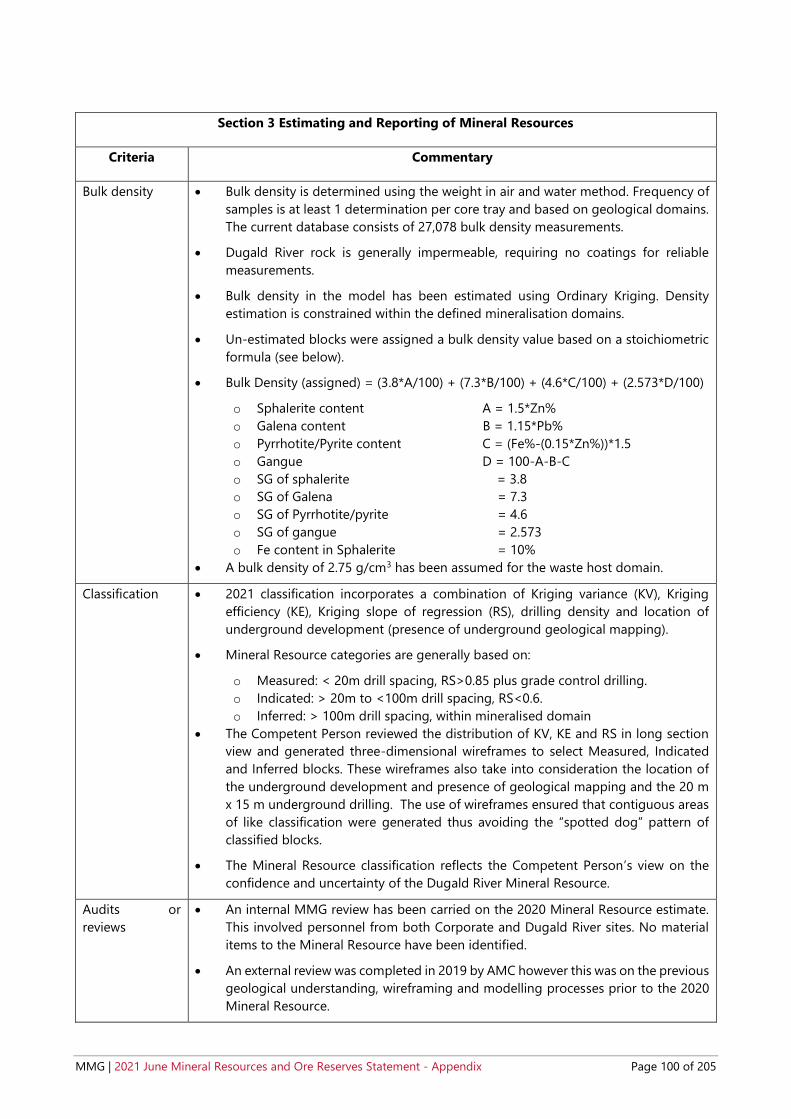
MMG | 2021 June Mineral Resources and Ore Reserves Statement - Appendix Page 100 of 205
Section 3 Estimating and Reporting of Mineral Resources
Criteria Commentary
Bulk density • Bulk density is determined using the weight in air and water method. Frequency of
samples is at least 1 determination per core tray and based on geological domains.
The current database consists of 27,078 bulk density measurements.
• Dugald River rock is generally impermeable, requiring no coatings for reliable
measurements.
• Bulk density in the model has been estimated using Ordinary Kriging. Density
estimation is constrained within the defined mineralisation domains.
• Un-estimated blocks were assigned a bulk density value based on a stoichiometric
formula (see below).
• Bulk Density (assigned) = (3.8*A/100) + (7.3*B/100) + (4.6*C/100) + (2.573*D/100)
o Sphalerite content A = 1.5*Zn%
o Galena content B = 1.15*Pb%
o Pyrrhotite/Pyrite content C = (Fe%-(0.15*Zn%))*1.5
o Gangue D = 100-A-B-C
o SG of sphalerite = 3.8
o SG of Galena = 7.3
o SG of Pyrrhotite/pyrite = 4.6
o SG of gangue = 2.573
o Fe content in Sphalerite = 10%
• A bulk density of 2.75 g/cm3 has been assumed for the waste host domain.
Classification • 2021 classification incorporates a combination of Kriging variance (KV), Kriging
efficiency (KE), Kriging slope of regression (RS), drilling density and location of
underground development (presence of underground geological mapping).
• Mineral Resource categories are generally based on:
o Measured: < 20m drill spacing, RS>0.85 plus grade control drilling.
o Indicated: > 20m to <100m drill spacing, RS<0.6.
o Inferred: > 100m drill spacing, within mineralised domain
• The Competent Person reviewed the distribution of KV, KE and RS in long section
view and generated three-dimensional wireframes to select Measured, Indicated
and Inferred blocks. These wireframes also take into consideration the location of
the underground development and presence of geological mapping and the 20 m
x 15 m underground drilling. The use of wireframes ensured that contiguous areas
of like classification were generated thus avoiding the “spotted dog” pattern of
classified blocks.
• The Mineral Resource classification reflects the Competent Person’s view on the
confidence and uncertainty of the Dugald River Mineral Resource.
Audits or
reviews
• An internal MMG review has been carried on the 2020 Mineral Resource estimate.
This involved personnel from both Corporate and Dugald River sites. No material
items to the Mineral Resource have been identified.
• An external review was completed in 2019 by AMC however this was on the previous
geological understanding, wireframing and modelling processes prior to the 2020
Mineral Resource.

MMG | 2021 June Mineral Resources and Ore Reserves Statement - Appendix Page 101 of 205
Discussion of
relative accuracy
/ confidence
• The Competent Person is of the opinion that the current block estimate provides a
good estimate of tonnes and grades on a global scale. In locations where grade
control drilling of approximately 15mN x 20mRL spacing has been completed, the
Competent Person has a high level of confidence in the local estimate of both
tonnes and grades, which is reflected in the Mineral Resource Classification.
• Mine void data (development pickups and stope CMS’s) were collated for the period
July 2018 to January 2021 to be used to reconcile the block model.
• Development voids were taken from survey as-builts and split by locations trucked
as ore and waste.
• The stope void was determined by CMS and the tonnes and grade split by the
monthly bogging percentages from Pitram.
Long-section looking west. Mined void data by period - July-Dec 2018 in green,
2019 in blue, 2020 in orange and January 2021 in pink.
• F3 factors were produced by dividing the monthly mill tonnes, zinc grade and zinc
metal by the monthly mined void tonnes, zinc grade and zinc metal, including the
change in stockpile material.
• The F3 factors were calculated monthly and as a 6-month rolling average.
F3 reconciliation factors by month and 6 month rolling for mined voids from Jan
2019 to Dec 2020 using the 2021 Mineral Resource estimate.

MMG | 2021 June Mineral Resources and Ore Reserves Statement - Appendix Page 102 of 205
Section 3 Estimating and Reporting of Mineral Resources
Criteria Commentary
• The mine void to mill factors indicate the DR_GMR_2102_V3.bmf is a good predictor
of Zn grade over the two-year period from Jan-2019 to Dec-2020. Monthly deviation
of +/-5% and 6 months rolling within 1% variation for Zn.
• The mine void to mill factors indicate the DR_GMR_2102_V3.bmf is an acceptable
predictor of Pb grade over the two-year period from Jan-2019 to Dec-2020. Monthly
deviation of +/-15% and 6 months rolling within 10% variation for Pb.
• The mined void compilation will be expanded to cover the life of mine as part of
ongoing reconciliation efforts.

MMG | 2021 June Mineral Resources and Ore Reserves Statement - Appendix Page 103 of 205
5.2.3 Statement of Compliance with JORC Code Reporting Criteria and Consent to Release
This Mineral Resource statement has been compiled in accordance with the guidelines defined in the 2012
Edition of the Australasian Code for Reporting of Exploration Results, Mineral Resources and Ore Reserves
(“2012 JORC Code”).
5.2.3.1 Competent Person Statement
I, Richard Buerger, confirm that I am the Competent Person for the Dugald River Mineral Resource section of
this Report and:
I am a full-time employee of Mining Plus Pty Ltd. at the time of the estimation.
I have disclosed to the reporting company the full nature of the relationship between myself and the company,
including any issue that could be perceived by investors as a conflict of interest.
I verify that the Dugald River Mineral Resource section of this Report is based on and fairly and accurately
reflects in the form and context in which it appears, the information in my supporting documentation relating
to the Dugald River Mineral Resources.
5.2.3.2 Competent Person Consent
Pursuant to the requirements Clause 9 of the JORC Code 2012 Edition (Written Consent Statement)
With respect to the sections of this report for which I am responsible – the Dugald River Mineral Resources - I
consent to the release of the 2021 Mineral Resources and Ore Reserves Statement as at 30 June 2021 Executive
Summary and Technical Appendix Report and this Consent Statement by the directors of MMG Limited:
_______________________________________________ Date: ____________________________________________
Richard Buerger MAIG (#6031)
_______________________________________________ ____________________________________________
Signature of Witness: Witness Name and Residence: (e.g. town/suburb)
• I have read and understood the requirements of the 2012 Edition of the Australasian Code for Reporting
of Exploration Results, Mineral Resources and Ore Reserves (JORC Code, 2012 Edition).
• I am a Competent Person as defined by the JORC Code, 2012 Edition, having five years’ experience that
is relevant to the style of mineralisation and type of deposit described in the Report, and to the activity
for which I am accepting responsibility.
• I am a Member of The Australian Institute of Geoscientists.
• I have reviewed the relevant Dugald River Mineral Resource section of this Report to which this Consent
Statement applies.
This signature was scanned for the exclusive use
in this document – the MMG Mineral Resource and Ore Reserve Statement as at 30 June 2021 – with
the author’s approval. Any other use is not
authorised.
This signature was scanned for the exclusive use in
this document – the MMG Mineral Resource and Ore Reserve Statement as at 30 June 2021 – with the
author’s approval. Any other use is not authorised.
01/10/2021
Cael Gniel
Melbourne, VIC

MMG | 2021 June Mineral Resources and Ore Reserves Statement - Appendix Page 104 of 205
5.3 Ore Reserves – Dugald River
5.3.1 Results
The 2021 Dugald River Ore Reserves are summarised in Table 15.
Table 15 2021 Dugald River Ore Reserve tonnage and grade (as at 30 June 2021)
Dugald River Ore Reserves
2021 Contained Metal
Tonnes Zinc Lead Silver Zinc Lead Silver
(Mt) (% Zn) (% Pb) (g/t Ag) (kt) (kt) (Moz)
Primary Zinc1
Proved 12 11.0 2.1 70 1,300 250 26
Probable 12 10.1 1.3 18 1,200 160 7
Total 24 10.6 1.7 44 2,500 410 33
Stockpiles
Proved 0.05 10.8 2.1 57 5 1.0 0.1
Total 0.05 10.8 2.1 57 5 1.0 0.1
Total 24 10.6 1.7 44 2,500 410 33
1 Cut-off grade is based on Net Smelter Return (NSR) after Royalties, expressed as a dollar value ($A) of
dependant on the area of the mine as described in Table 16 ranging from $A130/t to $A150/t
Contained metal does not imply recoverable metal.
The figures are rounded according to JORC Code guidelines and may show apparent addition errors.
• Resource drilling in 2020 focused on material conversion from Indicated to Measured categories and as
a consequence, along with the depletion of 12 months of production, has driven the change in Proved
and Probable Ore Reserves.
• Cut off values across multiple Panel/Block domains reflect fill type, ground support, haulage and
refrigeration costs at increased depths.
• Silver grades in Panel 4B continue to be higher than previously intersected in the wider spaced drilling.

MMG | 2021 June Mineral Resources and Ore Reserves Statement - Appendix Page 105 of 205
5.3.2 Ore Reserves JORC 2012 Assessment and Reporting Criteria
The following information provided in Table 16 complies with the 2012 JORC Code requirements specified by
“Table-1 Section 4” of the Code.
Table 16 JORC 2012 Code Table 1 Assessment and Reporting Criteria for Dugald River Ore Reserve 2021
Section 4 Estimation and Reporting of Ore Reserves
Criteria Commentary
Mineral
Resources
estimate for
conversion to
Ore Reserves
• The Mineral Resources are reported inclusive of the Mineral Resources used to
define the Ore Reserves.
• The Mineral Resources model used the MMG February 2021 Mineral Resources
model. (DR_GMR_2102_V3.dm)
• Risks associated with the model are related to orebody complexity seen
underground, but not reflected in the Mineral Resources model due to the spacing
of the drill holes that inform the model.
• The 2021 Geotechnical Equivalent Linear Overbreak Slough (ELOS) model was
used to estimate the HW thickness, tonnes and grade of the planned dilution
applied to the 2021 stope shapes.
Site visits • The Competent Person for the Dugald River Ore Reserves visited the site during
2020/2021 reporting period in March 2021, prior to Covid19 hot spot interstate travel
restrictions. Communication with site has been via video conferencing and email as
required.
Study status • The mine is an operating site with on-going detailed Life of Asset planning.
Cut-off
parameters
• The breakeven cut-off grade (BCOG) and Mineral Resources cut-off grade (RCOG)
have been calculated using 2021 Budget costs.
• The BCOG has been calculated for 19 discrete areas of the mine reflecting differences
in backfill methodologies, and increased costs at depth, namely ground support and
haulage distances to surface and power requirements for ventilation refrigeration.
• The operating costs, both fixed and variable, have been attributed on a per tonne
basis using the planned mine production rate of 2.05 Mtpa
• The Net Smelter Return (NSR) values are based on metal prices, exchange rates,
treatment charges and refinery charges (TC’s & RC’s), government royalties and a
metallurgical recovery model.
• The NSR value for both BCOG and RCOG is to the mine gate and includes the 2021
sustaining capital for the 2021 Ore Reserves.
• Infill diamond drilling has been included as part of the sustaining capital.
• For 2021 Ore Reserves (OR) and Life of Mine (LoM), the break-even cut-off grades
(BCOG) have been used to create stopes and for the level by level evaluation.

MMG | 2021 June Mineral Resources and Ore Reserves Statement - Appendix Page 106 of 205
Section 4 Estimation and Reporting of Ore Reserves
Criteria Commentary
Mining factors
or
assumptions
• A detailed design of the 2021 OR was used to report Mineral Resources conversion
to an Ore Reserve.
• The 2021 Geotechnical Equivalent Linear Overbreak Slough (ELOS) model was used
to estimate the HW thickness, tonnes and grade of the planned dilution which was
applied to the 2021 stope shapes.
• The orebody access is split into a north and south mine, due to its 2 km strike length
and a low-grade zone at the extremities of the orebody.
• The north mine is narrow (average ~5 m true width) and sub-vertical. The south mine
is wider than the north mine with a flexural zone in the centre. The south mine is
narrow and steep in the upper zone (~top 200 m from surface) and lower zone
(~below 700 m from surface). The central zone is flatter and thicker than the upper
and lower zones.
• Mining methods for the mine are Sub-Level Open Stopes (SLOS) both Longitudinal
and Transverse in the South Mine and modified Avoca stoping or Core & Shell stopes
with rib pillars in the North Mine. Level intervals occur every 25m and stopes have a
strike length of 15m.
• The stopes are broken into the following categories:
o Longitudinal SLOS, for stopes upto 10-15m wide horizontally. (Where the
orebody has thickened adjacent stopes are mined in sequence after paste filling)

MMG | 2021 June Mineral Resources and Ore Reserves Statement - Appendix Page 107 of 205
Section 4 Estimation and Reporting of Ore Reserves
Criteria Commentary
o Transverse SLOS, for stopes where the orebody thickness lends itself to
sequential stope extraction retreating along cross-cuts.
o Crown pillar SLOS, for the top level of each panel where stoping occurs directly
below a previously mined area.
o Modified Avoca stopes/Core & Shell Stopes for the North Mine
• The stopes were created by applying the Mineable Shape Optimiser (MSO) plugin,
within Deswik MineCAD, to the 2021 Mineral Resources model
(DR_GMR_2102_V3_ENG.bmf) which required conversion into a Datamine format.
NSR values were written to each block via a script (validated against an excel
spreadsheet). The macro and spreadsheet considered metallurgical recoveries, metal
pricing, transport costs, royalties TC/RC’s and US/AU exchange rate.
• The parameters used to create the stope shapes were:
o All Mineral Resources categories included
o 25 m level interval
o Variable strike length
o Minimum mining width (MMW) of 2.5 m
o The minimum dip of 52 degrees for Footwall (FWL) and 37 degrees for
Hangingwall (HW)
o Minimum waste pillar between parallel stopes of 7.5m
o A BCOG associated with the appropriate mine zone, applied to create initial
stope shapes.
• Several aspects of dilution were considered, planned dilution, fill dilution and HW
dilution. Planned dilution was included in the MSO stope shapes and covers localised
variations in dip and strike as well as minimum mining width. No additional FW
dilution was applied as the initial stope shapes considered minimum mining widths
and dip.
• The HW dilution was calculated for each stope based on the Geotechnical conditions
and thicknesses of the HW materials. The site has compiled a detailed HW dilution
model as dilution varies across the ore-body according to the HW conditions.
• Fill Dilution and Stope Recovery Factors:
o Floor 0.15 m, Backs 0.5 m and Wall fill ranges from 1 m to 1.5 m dilution.
o Recoveries for stope types were set as Longitudinal 90%, Modified AVOCA /
Core & Shell with rib pillars 75% and Crown stopes 50%-90%,
• Development grades were diluted by the application of a grade factor of 95% to the
development grade estimated from the block model.
• No Inferred Mineral Resource grades have been included in the Ore Reserves.
• The underground (UG) mine is accessed via two separate declines and as such the
mine is split into two – north and south, although both declines are connected via a
link drive approximately every 150m vertically at the base of each production Panel.
As at 30 June 2021, 8,621m of decline has been mined, along with a further 63,011m
m of lateral development (excluding 2264m of paste development).
• Currently, six raise-bored ventilation shafts have connection to the surface:
o The southern Fresh Air Raise (FAR1) – at 3.5 m diameter and 90m depth;

MMG | 2021 June Mineral Resources and Ore Reserves Statement - Appendix Page 108 of 205
Section 4 Estimation and Reporting of Ore Reserves
Criteria Commentary
o The southern Fresh Air Raise (FAR2) – at 5.0 m diameter and 190 m depth; with
a120m and 130m extensions to the 340 level and 490 level respectively
o The southern Return Air Raise (RAR1) – at 5.0 m diameter and 154 m depth; with
a 375m extension (multiple holes) to the 565 level
o The southern Return Air Raise (RAR2) – at 5.0 m diameter and 197 m depth; with
a 270m extension (multiple holes) to the 490 level and a further 135m extension
to 640 level.
o The northern Fresh Air Raise (FAR) at 3.5 m diameter and 165 m depth with a
275m extension (multiple holes) to the 490 level and a further 130m extension
to the 640 level.
o The northern Return Air Raise (RAR) at 5.0 m diameter and 104 m depth with a
310m extension (multiple holes) to the 490 level and a further 140m extension
to the 640 level.
On each return shaft collar there is an exhaust fan drawing approximately 270-
300m3/s.
• There is also a secondary RAR system in the north and south mines comprising of
LHW and 3.0-3.5m raisebored holes that have connections to each production level
where there is access.
• Secondary egress is provided by link drives between the South & North declines.
These link drives are positioned at the base of each production Panel. The lowest
connection to date has been made at the base of Panel 4 on the 640 Level.
• An internal ladderway also exists in the South mine between the 50 and 200 Levels.
In addition, strategically placed refuge chambers are to be found throughout both
mines.
• The current mining mobile fleet includes 3 twin-boom jumbos, 1 cable bolting rig, 6
loaders, 9 dump trucks, 3 long-hole drill rigs, 2 shotcrete rigs, 2 Transmixers, 2 charge-
up vehicles, 3 integrated tool carriers, and a light vehicle fleet.
Metallurgical
factors or
assumptions
• The metallurgical process for treatment of Dugald River ore involves crushing,
grinding followed by sequential carbon/lead/zinc flotation to produce separate lead
and zinc concentrates. The carbon concentrate is a waste product and reports to final
tailings. This process, and the equipment used, is conventional for this style of
mineralisation and used worldwide.
• The Dugald River processing facility was commissioned with production commencing
in October 2017, with nameplate throughput reached after 7 months of operation
(May 2018). Both lead and zinc concentrate produced at Dugald River meet saleable
grade and impurity specifications.
• Production performance has shown good alignment of concentrate grade and
recovery performance to that derived through the project study phases.
• Dugald River plant operating data has been analysed to establish the metallurgical
factors used for Ore Reserve calculations These are detailed herein.
%ZnPF Feed, %PbPF Feed, %FePF Feed, %MnPF Feed, %CPF Feed refer to the relevant assays of the
plant ore feed.
Lead Concentrate Grade Pb% = Long Term (2023+) = 63%

MMG | 2021 June Mineral Resources and Ore Reserves Statement - Appendix Page 109 of 205
Section 4 Estimation and Reporting of Ore Reserves
Criteria Commentary
Lead recovery to lead concentrate accounts for lead lost to the carbon concentrate via the
following equation:
• Pb recovery Pb Conc (%)=
(100 – PF %Pb loss) ∗ Pb cct %Pb Rec ∗ Pb Rec factor
100
• Where
o Lead recovered to carbon concentrate:
PF %Pb Loss = -11.36 + 1.721 x %CPF Feed + 0.2126 x %CPF Recovery
o Carbon recovered to carbon concentrate:
%CPF Recovery = 100 x ( 24/ %CPF Feed ) x (%CPF Feed -2.4)/(24-2.4)
o Lead recovered by the lead circuit:
Pb Cct %Pb Rec = 15.911 ln (Pb/ZnPF Feed) + 96.4953
o Lead recovery factor:
Pb Rec Factor (Long Term 2023+) = 1.012
Silver recovery to lead concentrate accounts for the silver which is lost to the carbon
concentrate, the equation being:
o Ag recovery Pb Conc (%) = (100 − 𝑃𝐹 %𝐴𝑔 𝑙𝑜𝑠𝑠) ∗ 𝑃𝑏 𝑐𝑐𝑡 %𝐴𝑔 𝑅𝑒𝑐 (𝑤𝑟𝑡 𝑃𝐹 𝑡𝑎𝑖𝑙)
100
• Where
o Silver recovered to carbon circuit:
PF %Ag loss = 1.008 + 0.363 x PF %Zn Loss + 0.386 x PF %Pb loss
• Zinc recovered to carbon concentrate:
PF %Zn loss = -9.521 + 1.508 x %CPF Feed + 0.15106 x %CPF Recovery
o Lead recovered to carbon concentrate:
PF %Pb Loss = -11.36 + 1.721 x %CPF Feed + 0.2126 x %CPF Recovery
o Lead circuit silver recovery
Pb cct %Ag Rec (wrt PF tail) = -0.0926 x AgPF Feed + 7.19 x %PbPF Feed + 0.6058 x
% Overall Pb Recovery
Zinc concentrate grade is directly affected by the manganese in the ore feed due to it
being substituted for zinc within the sphalerite mineral, and as such the final concentrate
grade is estimated to account for this.
Zinc Concentrate Grade Zn% =
%ZnZn con = %ZnSphalerite x %SphaleriteZn Con
• Where
o Sphalerite content of zinc concentrate: %SphaleriteZn Con = 93% (Long Term 2024+)
o Zinc in sphalerite:

MMG | 2021 June Mineral Resources and Ore Reserves Statement - Appendix Page 110 of 205
Section 4 Estimation and Reporting of Ore Reserves
Criteria Commentary
%ZnSphalerite = 65.473 – 1.1173 x (%MnSphalerite + %FeSphalerite)
o Manganese in sphalerite:
%MnSphalerite = %MnZn Con x 96.78 / %SphaleriteZn Con
o Manganese in zinc concentrate:
%MnZn Con = 3.4528 x %MnPF Feed
o Iron in the sphalerite:
%FeSphalerite = (6.726 +0.4209 x %MnSphalerite)
Zinc recovery to zinc concentrate accounts for the zinc lost in both the carbon and lead
concentrates by the equation:
Zn recovery Zn Conc (%) =
(100 – 𝑃𝐹 %𝑍𝑛 𝑙𝑜𝑠𝑠 − 𝑃𝑏 %𝑍𝑛 𝑙𝑜𝑠𝑠) ∗ 𝑍𝑛 𝑐𝑐𝑡 %𝑍𝑛 𝑅𝑒𝑐 ∗ 𝑍𝑛 𝑅𝑒𝑐 𝑓𝑎𝑐𝑡𝑜𝑟
100
Where
o Zinc recovered to carbon concentrate:
PF %Zn loss = -9.521 + 1.508 x %CPF Feed + 0.15106 x %CPF Recovery
o Zinc recovered to lead concentrate:
Pb %Zn Loss = 1.682 - 0.06876 x %PbFinal Pb Con + 12.588 x %Pb/ %ZnPF Feed +
0.02642 x %Pb Rec
o Zinc circuit stage recovery:
Zn cct %ZnRec = %ZnFinal Con / %ZnRgher Feed x (%ZnRgher Feed - ZnComb tail)/( %ZnZn Con
- ZnComb tail)
o Zinc in zinc circuit rougher feed: %ZnRgher Feed = 1.0605 x ZnPF Feed
o Zinc in zinc circuit combined tail:
ZnCombined tail = 0.8% if %ZnRgher Feed <= 10.5% or else
ZnCombined tail = 0.08562 x %ZnRgher Feed
o Zinc recovery factor:
Zn Rec Factor = 0.984
• A full check has been completed for possible deleterious elements, and the only two
that are material to economic value are iron and manganese in the zinc concentrate.
It is for this reason that the algorithms to predict these components have been
developed using Dugald River operating data.
• Fluorine has been identified within the orebody and to date has resulted in isolated
elevated levels in the lead concentrate however has been successfully controlled
through the flotation process.
Geotechnical • Ground conditions at Dugald River are generally good to fair with isolated areas of
poor ground associated with shear zones and faults.
• Development ground support at this stage in the mine life of Dugald River focuses
on static stability requirements with surface support matched to the ground
conditions, e.g. mesh for good ground/ short design life and Fibrecrete for poor
ground and long-term design life (e.g. decline, level access and infrastructure).
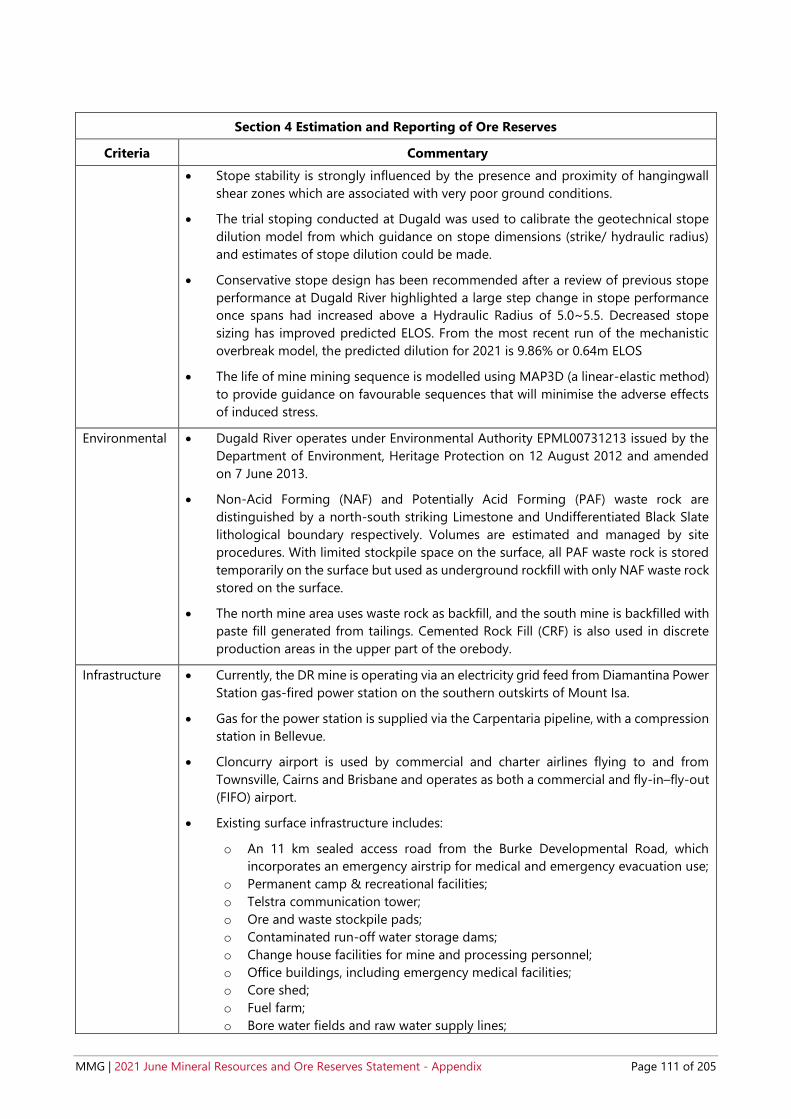
MMG | 2021 June Mineral Resources and Ore Reserves Statement - Appendix Page 111 of 205
Section 4 Estimation and Reporting of Ore Reserves
Criteria Commentary
• Stope stability is strongly influenced by the presence and proximity of hangingwall
shear zones which are associated with very poor ground conditions.
• The trial stoping conducted at Dugald was used to calibrate the geotechnical stope
dilution model from which guidance on stope dimensions (strike/ hydraulic radius)
and estimates of stope dilution could be made.
• Conservative stope design has been recommended after a review of previous stope
performance at Dugald River highlighted a large step change in stope performance
once spans had increased above a Hydraulic Radius of 5.0~5.5. Decreased stope
sizing has improved predicted ELOS. From the most recent run of the mechanistic
overbreak model, the predicted dilution for 2021 is 9.86% or 0.64m ELOS
• The life of mine mining sequence is modelled using MAP3D (a linear-elastic method)
to provide guidance on favourable sequences that will minimise the adverse effects
of induced stress.
Environmental • Dugald River operates under Environmental Authority EPML00731213 issued by the
Department of Environment, Heritage Protection on 12 August 2012 and amended
on 7 June 2013.
• Non-Acid Forming (NAF) and Potentially Acid Forming (PAF) waste rock are
distinguished by a north-south striking Limestone and Undifferentiated Black Slate
lithological boundary respectively. Volumes are estimated and managed by site
procedures. With limited stockpile space on the surface, all PAF waste rock is stored
temporarily on the surface but used as underground rockfill with only NAF waste rock
stored on the surface.
• The north mine area uses waste rock as backfill, and the south mine is backfilled with
paste fill generated from tailings. Cemented Rock Fill (CRF) is also used in discrete
production areas in the upper part of the orebody.
Infrastructure • Currently, the DR mine is operating via an electricity grid feed from Diamantina Power
Station gas-fired power station on the southern outskirts of Mount Isa.
• Gas for the power station is supplied via the Carpentaria pipeline, with a compression
station in Bellevue.
• Cloncurry airport is used by commercial and charter airlines flying to and from
Townsville, Cairns and Brisbane and operates as both a commercial and fly-in–fly-out
(FIFO) airport.
• Existing surface infrastructure includes:
o An 11 km sealed access road from the Burke Developmental Road, which
incorporates an emergency airstrip for medical and emergency evacuation use;
o Permanent camp & recreational facilities;
o Telstra communication tower;
o Ore and waste stockpile pads;
o Contaminated run-off water storage dams;
o Change house facilities for mine and processing personnel;
o Office buildings, including emergency medical facilities;
o Core shed;
o Fuel farm;
o Bore water fields and raw water supply lines;

MMG | 2021 June Mineral Resources and Ore Reserves Statement - Appendix Page 112 of 205
Section 4 Estimation and Reporting of Ore Reserves
Criteria Commentary
o Processing plant and Assay Laboratory;
o Paste plant;
o Tailings storage facility;
o Mobile equipment workshop and supply warehouse
o UG Ventilation Exhaust Fans x 3
Costs • The estimation of capital cost for the Dugald River project was derived from first
principles in the 2021 LoA schedule and is to be refined through operation reviews.
• The MMG commercial department estimated the mining operating costs for the OR
evaluation using first-principles. Costs were inclusive of Operating and Sustaining
Capital. Costs are in Australian dollars and are converted to US dollars at the
applicable exchange rate.
• Deleterious elements Mn. and to a lesser extent Fe, are to be controlled by
metallurgical blending. It is expected that the feed for flotation will be blended to
maintain Mn (and to a lesser extent Fe) within the contractual range for concentrate
sales and thus not expected to attract additional costs and penalties.
• The MMG finance department supplies the commodity price assumptions. The
Dugald River Ore Reserve applied the January 2021 guidance.
• The long-term exchange rate used the January 2021 Long-Term MMG guidance and
assumptions supplied by the MMG Business Evaluation department.
• The road freight and logistics for domestic and export sales have been updated using
the costs from the 2021 budget. The additional costs for storing and ship loading of
concentrate in Townsville are included. For the 2021 Ore Reserves, the storage and
ship loading cost has been added to the freight and logistics cost for export. The
freight and logistics costs for the domestic sale of concentrate includes the sea freight
cost based on an agreement with Sun Metals.
• Treatment and refining charges are based on MMG’s estimate as contracts are
currently under review.
• Queensland State Government royalty’s payable are prescribed by the Minerals
Resources Regulation 2013 and are based on a variable ad valorem rate between
2.5% to 5.0% depending on metal prices. Freehold leases have been identified and
applied to production that falls within them.
Revenue
factors
• Realised Revenue Factors (Net Smelter Return after Royalty)
• As part of the 2021 Ore Reserves process, the net smelter return (after royalty) (NSR)
has been revised with the latest parameters and compared against the previous 2020
NSR calculation that was used for the 2020 Ore Reserve.
• The NSR is used to convert the various zinc, lead and silver grades into a single
number for cut-off estimation and determining if the rock is ore or waste.
• Treatment and refining charges, royalties and transportation costs for different
commodities were supplied by MMG Group Finance and have been included in the
NSR calculation.
• The MMG Group Finance department provides assumptions of commodity prices and
exchange rates and are based on external company broker consensus and internal
MMG analysis.

MMG | 2021 June Mineral Resources and Ore Reserves Statement - Appendix Page 113 of 205
Section 4 Estimation and Reporting of Ore Reserves
Criteria Commentary
Market
assessment • Global zinc consumption contracted in 2020 as the coronavirus pandemic and
the consequences of the actions of governments to contain and mitigate against
its effects dominated all base metal markets, including zinc.
• As the global economy normalises, zinc demand, led by the manufacturing
sector and the energy transition, is forecast to rebound, with growth of 4%
expected for 2021 and demand growth of 1-2% is forecast for the medium-
term.
• As zinc prices recovered during 2020, smelter utilisation and their zinc metal
output increased, allowing global stocks of refined metal to increase from the
historical lows seen in 2018 and 2019.
• Despite the increase in refined stocks, often a bearish impact on the price, the
zinc price has in fact climbed higher, primarily due to the conviction amongst
investors that government stimulus will continue to enable a strong rebound in
economic growth and fuel demand for commodities.
• Zinc mine production has increased during 2020 and is now well above the
COVID-19 impacted lows seen in 2020. Mines around the world have put in place
protocols to control virus infection, but the supply of concentrate remains
exposed to the risk of mine supply disruption from “third-wave lockdown
restrictions at operating mines or in their wider supply chain.
• While concentrate supply appears healthy in the short term, in the medium to
longer term, mine production will decline due to the forecast closure of mines as
ore reserves are depleted. While there are a few new mines at the advanced
stage to replace this depletion, new zinc projects tend to be more economically
and operationally challenging than existing or recently closed operations due to
a range of factors including grade, size and location. Financing for new projects
can also become complicated if there are periods of price uncertainty.
• Smelters have received and accepted Dugald River Zinc concentrate quality in
China, Australia, Japan and Korea during 2020. There is substantial demand from
smelters and traders for long-term contracts for the supply of the product which
underpin sales from 2020 onwards.
Economic • Economic modelling of the total mining inventory shows positive annual operating
cash flows. Applying the revised costs, metal prices and exchange rate (MMG January
2021 Long-Term economic assumptions) returns a positive NPV. MMG uses a
discount rate supported by MMG’s Weighted Average Cost of Capital (WACC) and
adjusted for any country risk premium (as applicable) based on an internal evaluation
of the country risk for the location of the deposit.
• All evaluations were done in real Australian (AU) dollars.
Social • The nearest major population centre for the Mine is Cloncurry with a population of
approximately 3,500, and the largest employers are mining, mining-related services
and grazing.
• Regarding Native Title, the Kalkadoon # 4 People filed a claim in December 2005
covering an area which includes the project area, water pipeline corridor and part of

MMG | 2021 June Mineral Resources and Ore Reserves Statement - Appendix Page 114 of 205
Section 4 Estimation and Reporting of Ore Reserves
Criteria Commentary
the power line corridor. This claim over 40,000 square kilometres of land was granted
in 2011.
• MMG has concluded a project agreement with the Kalkadoon People dated 6 April
2009. Under this agreement, the claimant group for the Kalkadoon are contractually
required to enter into an s31 Native Title Agreement under the Native Title Act 1993.
The agreement sets out the compensation payments and MMG’s obligations for
training, employment and business development opportunities if/when the project is
commissioned. MMG has developed an excellent working relationship with the
Kalkadoon claimant group. MMG has instituted the MMG/KCPL Liaison Committee,
which meets at least twice yearly and addresses the Kalkadoon agreement obligations
for both parties. An official ‘Welcome to Country’ ceremony was held for MMG in late
March 2012.
• The Mitakoodi and Mayi People filed a claim in October 1996 and covered an area
that includes part of the power line corridor. While the Mitakoodi have not yet been
granted Native Title, MMG continues to liaise with them as a stakeholder due to the
‘last claimant standing’ legal tenement.
• MMG has registered an Indigenous Cultural Heritage Management Plan (CHMP)
which covers the entire project area and has undertaken all necessary surveys and
clearances for all disturbed groundwork undertaken on site to date without any issues
or complications. The CHMP was developed in consultation with the Kalkadoon # 4
People.
Other • There is no identified material naturally occurring risks.
• The legal agreements are in place. There are no outstanding material legal
agreements.
• The grade of the zinc concentrate is dependent on the Fe and Mn content of the
sphalerite, but this dependence is taken into account by the algorithms presented
earlier.
• The government agreements and approvals are in place. There are no unresolved
material matters on which the extraction of the Ore Reserves is contingent.
Tailings • The tailings storage facility is constructed within a valley of the Knapdale Range,
enclosed by a 37m high embankment dam wall constructed with rock, clay fill and an
elastomeric BGM liner on the upstream side. The dam was designed and constructed
in accordance with ANCOLD guidelines and the requirements of the site’s
Environmental Authority.
• The dam contains a return water system to enable recycling of the water deposited
with the tailings as well as rainfall run-off back to the processing plant.
• It is proposed that the peak operational throughput of the processing plant now be
2.0 Mtpa, with an average of 40% of the tailings being sent to paste and the
remaining 60% thickened to a solids density of 55% solids.
• Based on current production plans the tailings dam capacity will need to be increased
by 2027, achievable by raising the embankment wall with capital costs incorporated
into the Reserve financial evaluation.

MMG | 2021 June Mineral Resources and Ore Reserves Statement - Appendix Page 115 of 205
Section 4 Estimation and Reporting of Ore Reserves
Criteria Commentary
Classification • Ore Reserves are reported as Proved and Probable.
• Only Measured (19.9%) and Indicated (25.8%) material of the Mineral Resources has
been used to inform the Proved and Probable Ore Reserves. No Inferred Mineral
Resources are included in the Ore Reserves.
Audits or
reviews
• An External Review and Audit was last carried out for the 2018 Ore Reserves.
• No external audits have been undertaken for the 2020 Ore Reserves.
• An External Review and Audit is planned for the 2021 Ore Reserves.

MMG | 2021 June Mineral Resources and Ore Reserves Statement - Appendix Page 116 of 205
Discussion of
relative
accuracy
/confidence
The 2021 reserve has been based on local estimates with diamond drilling assays informing
tonnes and grade to define stopes and associated detailed development design. In
addition, modifying factors have been based on the results of the operating mine with
comparison of actual production data and reconciliations. Therefore, there is high level
confidence in the accuracy of the reserve estimate to within +/- 10%.
The key risks that could materially change or affect the Ore Reserve estimated for Dugald
River include:
Geotechnical Parameters and Mining Dilution:
• Modelled dilution, mining recovery factors are compared during stope reconciliation
allowing for high confidence in factors used for ELOS, mining method and fill type
used. Good understanding and high confidence of recovery factors from
reconciliation data ensures dilution estimation is appropriately considered and
applied to stoping areas.
Cut Off Grade:
• Cut off values are calculated with consideration of ground support and haulage at
depth, fill type and power requirements for refrigeration for defined mining areas.
This has ensured greater confidence in the cutoff value instead of applying global
value for the whole orebody and a low risk in the reserve estimation process.
Ore Reserve Classification:
• Resource Delineation & Reserve Definition drilling informs Proved and Probable
tonnage and grades before mining. Ore Reserves are based on all available relevant
information. Identification and confirmation through diamond drilling of potential
Nexus zones, along strike, may present localised additional material. The Ore Reserve
estimate confidence is high as modifying factors are compared with actual
production data and historical reconciliations.
Infrastructure:
• All major infrastructure has been installed at Dugald and maintained to a high
standard. As mining continues at depth refrigeration is required. A refrigeration plant
will be commissioned during November 2021. Future development and diamond
drilling activities would have been impacted during the summer months if this piece
of infrastructure were not installed. There is high confidence that further refrigeration
expansions and use of ventilation on demand infrastructure will ensure airflow
requirements are met in pre-production areas.
Processing:
• Increase in diluents, carbon and manganese have potential to impact recoveries and
payable penalties. However, blending of high manganese parcels of zinc concentrate
will mitigate any such potential.
Site Operating and Capital Costs:
• Having been in production for several years, the mine’s operating and capital costs
are understood in detail. Allowance for additional support requirements at depth and
rehabilitation of development drives have been made to mitigate any under
estimation of support costs. Significant change in costs is considered a low risk.
Revenue Factors:
• Metal prices are dependent on market sentiment and it is accepted that the zinc price
cycle is uncontrollable and therefore is a moderate risk. Long term forecasts are made

MMG | 2021 June Mineral Resources and Ore Reserves Statement - Appendix Page 117 of 205
Section 4 Estimation and Reporting of Ore Reserves
Criteria Commentary
in consultation with market analysts and the corporate finance team to establish the
most likely future positions.
5.3.3 Expert Input Table
In addition to the Competent Persons, the following individuals have contributed vital inputs to the Ore
Reserves determination. These are listed below in Table 17.
In compiling the Ore Reserves, the Competent Person has reviewed the supplied information for
reasonableness but has relied on this advice and information to be correct.
Table 17 Contributing Experts – Dugald River Ore Reserves
EXPERT PERSON / COMPANY AREA OF EXPERTISE
Richard Buerger, Manager Geology
Mining Plus (Melbourne)
Corey Jago, Senior Geologist – Resources & Orebody
MMG Ltd (Dugald River)
Wesly Randa, Senior Resource Geologist
MMG Ltd (Melbourne)
Geological Mineral Resources
Claire Beresford Senior Analyst Business Evaluation,
MMG Ltd (Melbourne) Economic Evaluations
Simon Ashenbrenner, Manager Zinc/Lead Marketing,
MMG Ltd (Melbourne) Marketing, Sea freight and TC/RC
Iain Goode, Superintendent – Processing Support
MMG Ltd (Dugald River)
Cathy Martin, Senior Metallurgist
MMG Ltd (Dugald River)
Metallurgy
Angus J Henderson, Snr Manager Commercial & Business
Support, MMG Ltd (Australian Operations) Mining capital and Operating Costs
Jeff Price, Principal Geotechnical Engineer,
MMG Ltd (Melbourne) Geotechnical
Peter Willcox, Senior Mining Engineer – Long Term
Planning,
MMG Ltd (Dugald River)
Mining Parameters, Cut-off
estimation, Mine Design and
Scheduling
Jonathan Crosbie, Group Manager - Closure &
Remediation
MMG Ltd (Melbourne)
Mine Closure and Remediation

MMG | 2021 June Mineral Resources and Ore Reserves Statement - Appendix Page 118 of 205
5.3.4 Statement of Compliance with JORC Code Reporting Criteria and Consent to Release
This Ore Reserves statement has been compiled by the guidelines defined in the 2012 Edition of the
Australasian Code for Reporting of Exploration Results, Mineral Resources and Ore Reserves (“2012 JORC
Code”).
5.3.4.1 Competent Person Statement
I, Phil Bremner, confirm that I am the Competent Person for the Dugald River Ore Reserves section of this
Report and:
I have read and understood the requirements of the 2012 Edition of the Australasian Code for Reporting
of Exploration Results, Mineral Resources and Ore Reserves (JORC Code, 2012 Edition).
I am a Competent Person as defined by the JORC Code, 2012 Edition, having more than five years
experience that is relevant to the style of mineralisation and type of deposit described in the Report, and
to the activity for which I am accepting responsibility.
I am a Fellow of The Australasian Institute of Mining and Metallurgy
I have reviewed the relevant Dugald River Ore Reserves section of this Report, to which this Consent
Statement applies.
I am a principal mining consultant at Oreteck Mining Solutions at the time of the estimate.
I have disclosed to the reporting company the full nature of the relationship between myself and the company,
including any issue that could be perceived by investors as a conflict of interest.
I verify that the Dugald River Ore Reserves section of this Report is based on and reasonably and accurately
reflects in the form and context in which it appears, the information in my supporting documentation relating
to the Dugald River Ore Reserves.
5.3.4.2 Competent Person Consent
Pursuant to the requirements Clause 9 of the JORC Code, 2012 Edition (Written Consent Statement)
With respect to the sections of this report for which I am responsible – the Dugald River Ore Reserve - I consent
to the release of the 2021 Mineral Resources and Ore Reserves Statement as at 30 June 2021 Executive
Summary and Technical Appendix Report and this Consent Statement by the directors of MMG Limited:
_______________________________________________ ____________________________________________
Philip Bremner FAusIMM (#105847) Date:
_______________________________________________ ____________________________________________
Signature of Witness: Witness Name and Residence: (e.g. town/suburb)
This signature was scanned for the exclusive use
in this document – the MMG Mineral Resource and
Ore Reserve Statement as at 30 June 2021 – with
the author’s approval. Any other use is not
authorised.
This signature was scanned for the exclusive use in
this document – the MMG Mineral Resource and Ore
Reserve Statement as at 30 June 2021 – with the
author’s approval. Any other use is not authorised.
01/10/2021
Nikki Dickinson
Melbourne, VIC
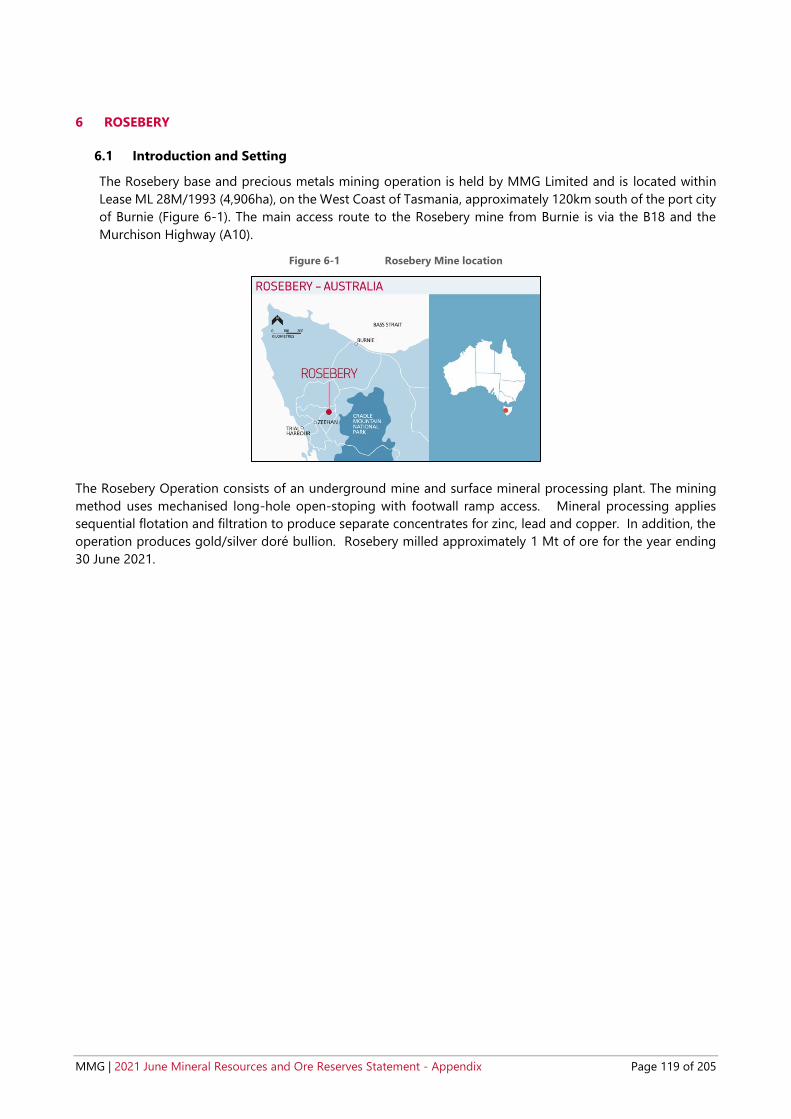
MMG | 2021 June Mineral Resources and Ore Reserves Statement - Appendix Page 119 of 205
6 ROSEBERY
6.1 Introduction and Setting
The Rosebery base and precious metals mining operation is held by MMG Limited and is located within
Lease ML 28M/1993 (4,906ha), on the West Coast of Tasmania, approximately 120km south of the port city
of Burnie (Figure 6-1). The main access route to the Rosebery mine from Burnie is via the B18 and the
Murchison Highway (A10).
Figure 6-1 Rosebery Mine location
The Rosebery Operation consists of an underground mine and surface mineral processing plant. The mining
method uses mechanised long-hole open-stoping with footwall ramp access. Mineral processing applies
sequential flotation and filtration to produce separate concentrates for zinc, lead and copper. In addition, the
operation produces gold/silver doré bullion. Rosebery milled approximately 1 Mt of ore for the year ending
30 June 2021.

MMG | 2021 June Mineral Resources and Ore Reserves Statement - Appendix Page 120 of 205
6.2 Mineral Resources – Rosebery
6.2.1 Results
The 2021 Rosebery Mineral Resources are summarised in Table 18. The Rosebery Mineral Resources is inclusive
of the Ore Reserves.
Table 18 2021 Rosebery Mineral Resources tonnage and grade (as at 30 June 2021)
Rosebery Mineral Resources
Contained Metal
Rosebery1
Tonnes
(Mt)
Zinc
(%
Zn)
Lead
(%
Pb)
Copper
(% Cu)
Silver
(g/t
Ag)
Gold
(g/t Au)
Zinc
(kt)
Lead
(kt)
Copper
(kt)
Silver
(Moz)
Gold
(Moz)
Measured 6.5 7.7 2.9 0.22 130 1.4 500 190 14 28 0.29
Indicated 3.1 6.5 2.3 0.17 120 1.2 200 69 5.2 12 0.11
Inferred 7.1 8.6 2.5 0.21 91 1.2 610 180 15 21 0.27
Total 17 7.9 2.6 0.21 110 1.3 1300 440 34 60 0.67
Stockpiles
Measured 0.03 8.2 3.1 0.27 150 1.7 2.3 0.9 0.08 0.14 0.002
Total 0.03 8.2 3.1 0.27 150 1.7 2.3 0.9 0.08 0.14 0.002
Total
Rosebery 17 7.9 2.6 0.21 110 1.3 1,300 440 34 61 0.68 1Cut-off grade is based on Net Smelter Return (NSR), expressed as a dollar value of A$174/t Figures are rounded according to JORC Code guidelines and may show apparent addition errors. Contained metal does not imply recoverable metal.
Overall, the 2021 Rosebery Mine Mineral Resources has increased by 1.2Mt since last reported in 2020.
Changes affecting the final reporting number include:
• New drilling, mapping and modelling finding an additional 2.47 Mt of Mineral Resource, majority of which
was added in the Middle Mine (RS, V and H lenses).
• 1.02 Mt mining depletion in the Lower Mine between 1st July 2020 and 30th June 2021.
• Additional material in close proximately to remnant voids removed from the Mineral Resource in the
Middle Mine after review and reclassification.
• 2021 metal prices updates and NSR cut off increased from $172 in 2020 to $174.

MMG | 2021 June Mineral Resources and Ore Reserves Statement - Appendix Page 121 of 205
6.2.2 Mineral Resources JORC 2012 Assessment and Reporting Criteria
The following information provided in Table 19 complies with the 2012 JORC Code requirements specified by
“Table-1 Section 1-3” of the Code.
Table 19 JORC 2012 Code Table 1 Assessment and Reporting Criteria for Rosebery Mineral Resources 2021
Section 1 Sampling Techniques and Data
Criteria Commentary
Sampling
techniques
• Diamond drilling (DD) was used to obtain an average 1m sample that is half core split,
crushed and pulverised to produce a pulp (>85% passing 75µm).
• DD core is selected, marked and ID tagged for sampling by the logging geologist.
Sample details and ID are stored in the SQL database for correlation with returned
geochemical assay results.
• Prior to May 2016, pulps were delivered to the ALS laboratory in Burnie, Tasmania for
XRF analysis. Post May 2016 half core samples are delivered to the ALS laboratory in
Burnie for sample preparation and XRF analysis. Analysis moved to the ALS Townsville
laboratory in October, 2016.
• There are no inherent sampling problems recognised.
• Measurements taken to ensure sample representivity include sizing analysis and
duplication at the crush stage.
Drilling
techniques
• The drilling type is diamond core drilling from underground using single or double
tube coring techniques. As of January 2014, drill core is oriented on an ad hoc basis.
• Drilling undertaken from 2012 is LTK48, LTK60, NQ, NQ2, NQTK, BQTK and BQ in size.
Additional drilling in the reporting period is NQ2.
• Historical (pre-2012) drillholes are a mixture of sizes from AQ, LTK (TT), BQ, NQ, HQ
and PQ.
Drill sample
recovery
• Diamond drill core recoveries average 96%. Drill crews mark and define lost core
intervals with blocks. Sample recovery is measured and recorded in the drillhole
database. If excess core loss occurs in a mineralised zone, the hole is re-drilled.
• The drilling process is controlled by the drill crew and geological supervision provides
a means for maximising sample recovery and ensures suitable core presentation. No
other measures are taken to maximise core recovery.
• There is no observable correlation between recovery and grade.
• Preferential loss/gains of fine or coarse materials are not significant and do not result
in sample bias as the nature of mineralisation is massive to semi-massive sulphide,
diamond core sampling is applied, and recovery is very high.
Logging • 100% of diamond drill core has been geologically and geotechnically logged to
support Mineral Resources estimation, mining and metallurgy studies.
• Geological and geotechnical logging is mostly qualitative (some variables are
quantitative). Logging is undertaken using laptop computers which store data directly
to the drillhole database.
• All drill core is photographed, with photos labelled and stored on the Rosebery server.
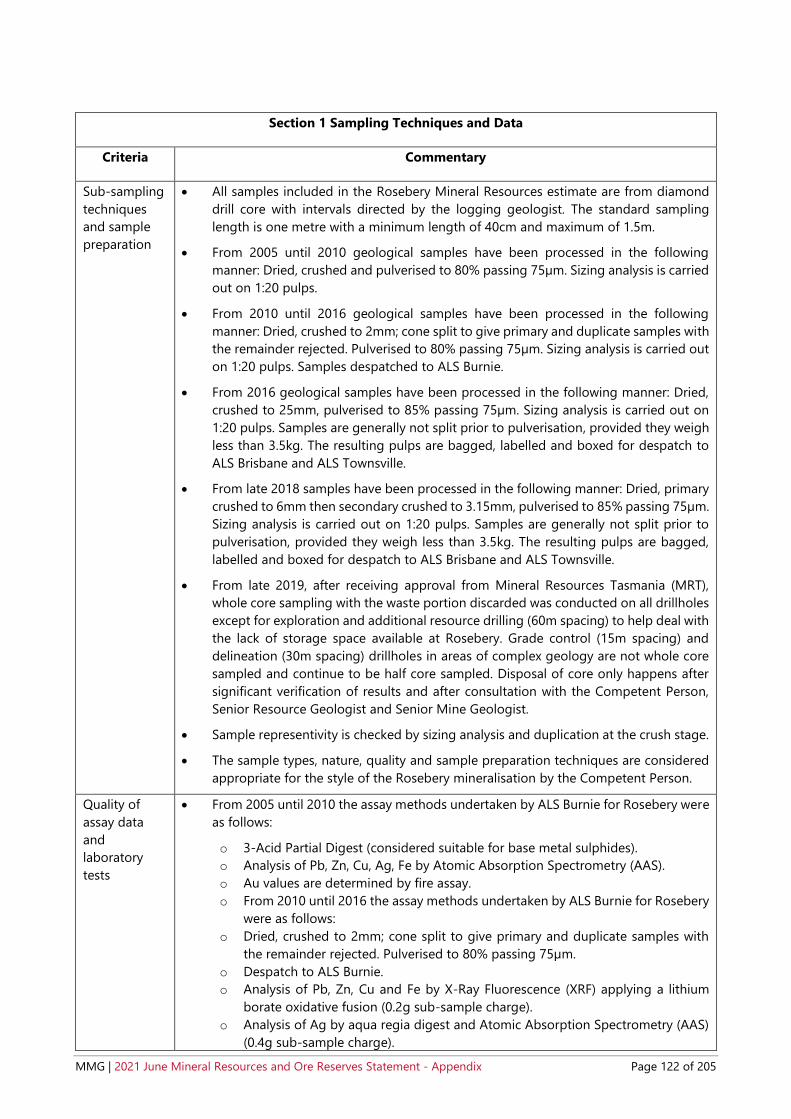
MMG | 2021 June Mineral Resources and Ore Reserves Statement - Appendix Page 122 of 205
Section 1 Sampling Techniques and Data
Criteria Commentary
Sub-sampling
techniques
and sample
preparation
• All samples included in the Rosebery Mineral Resources estimate are from diamond
drill core with intervals directed by the logging geologist. The standard sampling
length is one metre with a minimum length of 40cm and maximum of 1.5m.
• From 2005 until 2010 geological samples have been processed in the following
manner: Dried, crushed and pulverised to 80% passing 75µm. Sizing analysis is carried
out on 1:20 pulps.
• From 2010 until 2016 geological samples have been processed in the following
manner: Dried, crushed to 2mm; cone split to give primary and duplicate samples with
the remainder rejected. Pulverised to 80% passing 75µm. Sizing analysis is carried out
on 1:20 pulps. Samples despatched to ALS Burnie.
• From 2016 geological samples have been processed in the following manner: Dried,
crushed to 25mm, pulverised to 85% passing 75µm. Sizing analysis is carried out on
1:20 pulps. Samples are generally not split prior to pulverisation, provided they weigh
less than 3.5kg. The resulting pulps are bagged, labelled and boxed for despatch to
ALS Brisbane and ALS Townsville.
• From late 2018 samples have been processed in the following manner: Dried, primary
crushed to 6mm then secondary crushed to 3.15mm, pulverised to 85% passing 75µm.
Sizing analysis is carried out on 1:20 pulps. Samples are generally not split prior to
pulverisation, provided they weigh less than 3.5kg. The resulting pulps are bagged,
labelled and boxed for despatch to ALS Brisbane and ALS Townsville.
• From late 2019, after receiving approval from Mineral Resources Tasmania (MRT),
whole core sampling with the waste portion discarded was conducted on all drillholes
except for exploration and additional resource drilling (60m spacing) to help deal with
the lack of storage space available at Rosebery. Grade control (15m spacing) and
delineation (30m spacing) drillholes in areas of complex geology are not whole core
sampled and continue to be half core sampled. Disposal of core only happens after
significant verification of results and after consultation with the Competent Person,
Senior Resource Geologist and Senior Mine Geologist.
• Sample representivity is checked by sizing analysis and duplication at the crush stage.
• The sample types, nature, quality and sample preparation techniques are considered
appropriate for the style of the Rosebery mineralisation by the Competent Person.
Quality of
assay data
and
laboratory
tests
• From 2005 until 2010 the assay methods undertaken by ALS Burnie for Rosebery were
as follows:
o 3-Acid Partial Digest (considered suitable for base metal sulphides).
o Analysis of Pb, Zn, Cu, Ag, Fe by Atomic Absorption Spectrometry (AAS).
o Au values are determined by fire assay.
o From 2010 until 2016 the assay methods undertaken by ALS Burnie for Rosebery
were as follows:
o Dried, crushed to 2mm; cone split to give primary and duplicate samples with
the remainder rejected. Pulverised to 80% passing 75µm.
o Despatch to ALS Burnie.
o Analysis of Pb, Zn, Cu and Fe by X-Ray Fluorescence (XRF) applying a lithium
borate oxidative fusion (0.2g sub-sample charge).
o Analysis of Ag by aqua regia digest and Atomic Absorption Spectrometry (AAS)
(0.4g sub-sample charge).

MMG | 2021 June Mineral Resources and Ore Reserves Statement - Appendix Page 123 of 205
Section 1 Sampling Techniques and Data
Criteria Commentary
o Analysis of Au by fire assay, three acid digest and flame assay AAS (30g sub-
sample charge).
• From 2016 the assay methods undertaken by ALS Brisbane and Townsville were as
follows:
o Analysis of Ag, Zn, Pb, Cu and Fe by four acid ore grade digest, ICPAES finish
with extended upper reporting limits (ALS Brisbane). In addition to these main
elements, another 29 elements are reported as a part of this method.
o Analysis of Au by fire assay, three acid digest and flame assay AAS (30g sub-
sample charge) (ALS Townsville).
• All of the above methods are considered effectively total digestion and are suitable
for Mineral Resources estimation at Rosebery.
• The employed assay techniques are considered suitable and representative; a
comparison study using the Inductively Coupled Plasma (ICP) technique was
completed to check the XRF accuracy in May 2013. Independent umpire laboratory
ICP re-assay of 5% pulps took place in June 2015 and May 2016 using the Intertek
laboratory in Perth. Pulps for analysis were randomly selected from a list of samples
where (Pb + Zn)>5%.
• No data from geophysical tools, spectrometers or handheld XRF instruments have
been used for the estimation of Mineral Resources.
• ALS laboratory Brisbane and Townsville releases its QAQC data to MMG for analysis
of internal ALS standard performance. The performance of ALS internal standards
appears to be satisfactory, with several standards used within the range of MMG
submitted samples.
• Three new matrix-matched standards have been certified (LBM-20, MBM-20 and
HBM-20) and are now routinely used, replacing the 18-series standards.
• MMG routinely insert:
o Matrix-matched standards, dolerite blanks and duplicates at a ratio of 1:20 to
normal assays.
o Blanks are inserted to check crush and pulverisation performance.
o Duplicates are taken as coarse crush and pulp repeats.
o An umpire laboratory (Intertek Perth) is used to re-assay 5% of ore-grade pulps
returned from the ALS laboratory. Analysis of routine sample results and control
sample performance is reported quarterly.
• QA/QC analysis has shown that:
o Au determination issues continue with approximately 10% of the low base metal
standard (LBM-20) failing for Au. One cause of the moderate failure rate of Au
in LBM-20 is thought to be differences in the precision of the analytical method
used by the assaying laboratory (AA; reported to 2 decimal places), compared to
the precision of the method used to certify the CRM (ICP; reported to 3 decimal
places). This means the QAQC analysis undertaken by MMG assesses the assay
results compared to the CRM’s to a degree of precision that the AA method in
unable to achieve. This difference accounts for approximately half of the fails of
Au in LBM-20 leaving a failure rate of ~5%. All of which are all re-assayed if within
the target mineralised zone.
MMG | 2021 June Mineral Resources and Ore Reserves Statement - Appendix Page 124 of 205
Section 1 Sampling Techniques and Data
Criteria Commentary
o For 2020 all elements in each standard are within +/-5% average bias window as
set in the MMG Work Quality Requirement. A consistent 3-4% negative bias was
evident in LBM-20 for Cu, however all results for the year are still within one
standard deviation.
o Minimal blank failures occurred in 2020 (6 for Cu and 16 for Zn) indicating that
only a small amount of levels of grade carryover is occurring. This is an
improvement on the previous year.
o Quartz flushes continue to perform well in 2020 with no results over ten times
detection limit across all elements.
o Pulp duplicates have performed better than crush duplicates in all elements for
2020 as expected. Repeatability is consistent for all pulp and crush duplicates
with all elements within 5% relative difference from their original samples, except
for Au Crush duplicates (6.9%). The average CV % of all duplicates for the year
are below the reference CVs outlined in internal guidelines. R2 values indicate
that Au crush and pulp and Ag crush duplicates show the least amount of
correlation (0.75 and 0.86 respectively). This is attributed to the nuggetty nature
of these elements.
o Reduced Major Axis analysis indicates some bias is present in all duplicate
samples for the year. Au pulp and Zn crush duplicates show a slight negative
bias while all other duplicates show positive CI Interval Ranges but a CI Slope
range greater than 1 or vice versa. Reduced Major Axis is tracked on a monthly
basis and no clear trends of bias for any duplicates can be seen over the year
and is not of concern.
o An umpire laboratory (Intertek Perth) is used to re-assay 5% of ore-grade pulps
returned from the ALS laboratory. Analysis of routine sample results and control
sample performance is reported quarterly and are within acceptable limits. For
2020 umpire duplicates for all elements, except of Au, had a mean percentage
difference within approximately +/-5% of the routine standards, R2 values close
to 1 and low average CV% suggesting repeatability is consistent across labs.
Gold was the worst performing umpire duplicate which is attributed to the
nuggetty nature and no consistent bias between the umpire duplicates and the
original samples are present. In Q4 2020, standard analyses at Intertek shows
poor accuracy for Zn. This issue is currently being investigated.
o Several standards used to assess the quality of Bulk Density measurements were
noted as failing in December 2020. An internal review found the SG cradle was
retaining some water after removal from the bath, which was affecting the
results. This was exacerbated for the standards as the standards used were
approximately 10% of the volume of 1m of core. This problem has been rectified
by modifying the SG machine. No standards failures have occurred since.
• None of the issues described above degrades the Mineral Resources estimation
confidence to any significant extent.
Verification of
sampling and
assaying
• All mineralised intersections are viewed and verified by numerous company personnel
by comparing assay results to core photos and logging.
• Batches of sampling and assay data are entered by geologists; the performance of
duplicates, blanks and standards is checked by the Mine Project Geologist after each
assay batch is loaded to the database; batches with failed standards are flagged and
pertinent samples are sent for re-assay.

MMG | 2021 June Mineral Resources and Ore Reserves Statement - Appendix Page 125 of 205
Section 1 Sampling Techniques and Data
Criteria Commentary
• Close twinning of mineralised intersections is not an intentional part of the
delineation. However, the underground drill pattern often achieves a near-twinning
or scissoring and this confirms individual intersections. In 2020, several programs of
confirmation drilling were successfully conducted to verify the positions and grade of
existing older resources in the Middle Mine.
• Re-assayed data, due to the failure of a standard, is reviewed to determine which batch
is to be used for data export and Mineral Resources estimation. Batch status is
recorded in the database for audit purposes.
• Database validation algorithms are run to check data integrity before data is used for
interpretation and Mineral Resources modelling.
• Unreliable data is flagged and excluded from Mineral Resources estimation work.
Data validation macros are used to identify data errors that are either rectified or
excluded from the estimation process.
• Since August 2014 all data below the detection limit is replaced by half detection limit
values. Prior to this date, the full detection limit was used.
• No adjustments have been made to assay data – if there is any doubt about the data
quality or location, the drillhole is excluded from the estimation process.
Location of
data points
• Historically diamond drillholes have been surveyed using magnetic single shot surveys
at intervals between 20-30m
• A downhole gyro measurement has been recorded from selective drillholes prior to
March 2014 as an independent check of downhole survey accuracy. Analysis
suggested the single shot surveys are accurate to 100m drillhole depth, and then
diverge up to 4m at 400m depth. Given this outcome, gyro downhole surveys are now
standard for all diamond holes.
• Prior to March 2018, all diamond drillholes were downhole surveyed using a single-
shot Reflex Ezi-shot tool at 30m intervals, with a full downhole Reflex gyro survey
completed at end of hole by the drilling contractor. Where a gyro downhole survey is
not practicable due to equipment limitations, then a multi-shot survey was completed.
• Since March 2018, in addition to the Reflex gyro tool, a Champ Gyro north seeking
tool was introduced to survey drillholes. The Champ Gyro uses a north-seeking
function for drillholes outside of the range between -200 and +200. For holes
between -200 and +200 drillholes are surveyed in the continuous mode (gyro using
design azimuth for collar dip and azimuth).
• Selected surface exploration drillholes have been downhole surveyed using a SPT
north seeking gyro (parent holes only).
• Collar positions of underground drillholes are picked up by Rosebery mine surveyors
using a Leica T16, TS15 and MS60 Total stations. Collar positions of surface drillholes
are picked up by surveyors using differential GPS. Historically, surface drillhole collar
locations were determined using a theodolite or handheld GPS.
• Grid system used is the Cartesian Rosebery Mine Grid, offset from Magnetic North by
23°52’47” (as at July 1st, 2020) with mine grid origin at: MGA94 E=
378981.981, N= 5374364.125; mine grid relative level (RL) equals AHD + 1.490m +
3048.000m and is based on the surface datum point Z110.

MMG | 2021 June Mineral Resources and Ore Reserves Statement - Appendix Page 126 of 205
Section 1 Sampling Techniques and Data
Criteria Commentary
• Topographic data derived from LIDAR overflights have been carried out and
correlated with surface field checks to confirm relativity to MGA and Rosebery Mine
Grid.
Data spacing
and
distribution
• The Rosebery mineral deposit is drilled on variable spacing dependent on lens
characteristics and access. Drill spacing ranges from 40m-60m to 10m-25m between
sections and vertically. The final drill pattern varies somewhat due mostly to site
access difficulties in some areas. Mineralisation has short scale structural variations
observable in underground workings. Some of this variation is not discernible from
drill data alone. Observations of mineralisation geometry are made by traditional
geological mapping and more recently using photogrammetry images of mine
development faces and backs. All ore drives and most non-ore development headings
are covered.
• The combination of drillhole and other data is sufficient to establish the degree of
geological and grade continuity appropriate for Mineral Resources and Ore Reserves
estimation and the classifications applied.
• Diamond drillhole samples are not composited prior to being sent to the laboratory
however the nominal sample length is generally 1m. Reverse circulation drill samples
are not used for Mineral Resources estimation.
Orientation of
data in
relation to
geological
structure
• Drillhole orientation is planned orthogonal to lens strike in vertical, radial fans. Drill
fan spacing and orientation is planned to provide evenly spaced, high angle intercepts
of the mineralised lenses where possible, thus minimising sampling bias related to
orientation. Some drill intersections are at low angle to the dipping mineralisation due
to access limitations.
• Where drillholes from surface or older holes longer than 400m exist, attempts are
made to confirm mineralised intercepts by repeat drilling from newly developed
drives. Deep drill intersections are excluded from Mineral Resources modelling where
duplicated by shorter underground drillholes.
• Drilling orientation is not considered to have introduced sampling bias.
Sample
security
• Measures to provide sample security include:
o Samples are stored in a locked compound with restricted access during
preparation.
o Half-core samples for despatch to ALS Burnie are stored in sealed containers
with security personnel at the MMG mine front gate for pick-up by ALS courier.
o Receipt of samples acknowledged by ALS by email and checked against
expected submission list.
o Assay data returned via email as spreadsheet and archived online as a backup.
Audit and
reviews
• An external audit of the Lower Mine Mineral Resource is taking place with preliminary
results not yet released. There have not been any material changes to the Rosebery
Mineral Resource estimation technique since the previous external audit. The audit
was undertaken by AMC on the 2018 Rosebery Mineral Resource. In 2018, AMC
considers the Rosebery Mineral Resource estimate has been completed using usual
industry practises and in accordance with the requirements and guidelines of the JORC
Code 2012. MMG’s approach is to include geological and grade components in
compiling the resource estimates, which AMC considers appropriate. AMC considers
MMG | 2021 June Mineral Resources and Ore Reserves Statement - Appendix Page 127 of 205
Section 1 Sampling Techniques and Data
Criteria Commentary
that the model forms a suitable basis for Mineral Resource reporting and for use in
Ore Reserves and mining studies. No material issues were identified.
• Historically, any issues identified during audits and reviews have been rectified.
Section 2 Reporting of Exploration Results
Criteria Commentary
Mineral
tenement and
land tenure
status
• Rosebery Mine Lease ML 28M/1993 includes the Rosebery, Hercules and South
Hercules polymetallic mines. It covers an area of 4,906 ha.
• ML28M/93 located was granted to Pasminco Australia Limited by the State
Government of Tasmania in May 1994. This lease represents the consolidation of 32
individual leases that previously covered the same area.
• Tenure is held by MMG Australia Ltd for 30 years from 1st May 1994.
• The lease expiry date is 1st May 2024.
• The consolidated current mine lease includes two leases; (consolidated mining leases
32M/89 and 33M/89). These were explored in a joint venture with AngloGold Australia
under the Rosebery Extension Joint Venture Heads of Agreement. This agreement
covered two areas, one at the northern and the other at the southern end of the
Rosebery Mine Lease, covering a total of 16.07 km2.
• The joint venture agreement was between the EZ Corp of Australia (now MMG
Rosebery Mine) and Shell Company of Australia Limited (now AngloGold Australia
Metals Pty. Ltd., formerly Acacia Resources (formerly Billiton)). A Heads of Agreement
was signed on 16th May 1988 with initial participating interest of 50% for each party.
Other partners in the joint venture are Little River Resources Ltd. and Norgold Ltd.
They have a combined net smelter return royalty of 2.3695%, payable on production
from the Rosebery Extension Joint Venture area. AngloGold withdrew from the joint
venture on the 31st December 2001.
• There are no known impediments to operating in the area.
Exploration
done by other
parties
• Tom Macdonald discovered the first indication of mineralisation in 1893 when he
traced alluvial gold and zinc-lead sulphide boulders up Rosebery Creek. Twelve
months later an expedition lead by Tom McDonald discovered the main lode through
trenching operations, on what is now the 4 Level open cut (Easterbrook, 1962; Martin,
2002).
• The Rosebery deposit was operated by several different operations until 1921 when
the Electrolytic Zinc Company purchased both the Rosebery and Hercules Mines.
• Drilling from surface and underground over time by current and previous owners has
supported the discovery and delineation of Rosebery’s mineralised lenses.
Geology • The Rosebery volcanogenic massive sulphide (VMS) deposit is hosted within the Mt
Read Volcanics, a Cambrian assemblage of lavas, volcaniclastics and sediments
deposited in the Dundas Trough between the Proterozoic Rocky Cape Group and the
Tyennan Block.

MMG | 2021 June Mineral Resources and Ore Reserves Statement - Appendix Page 128 of 205
Section 2 Reporting of Exploration Results
Criteria Commentary
• Sulphide mineralisation occurs in stacked stratabound massive to semi-massive base
metal sulphide lenses between the Rosebery Thrust Fault and the Mt Black Thrust
Fault; the host lithology and the adjoining faults all dip approximately 45 degrees east.
Drillhole
information
• The Mineral Resources database consists of 14,889 diamond drillholes providing
~550,000 samples.
• No individual drillhole is material to the Mineral Resources estimate and hence this
geological database is not supplied.
Data
aggregation
methods
• This is a Mineral Resources Statement and is not a report on exploration results hence
no additional information is provided for this section.
• No metal equivalents were used in the Mineral Resources estimation.
Relationship
between
mineralisation
width and
intercept
lengths
• Mineralisation true widths are captured by interpreted mineralisation 3D wireframes.
• Most drilling was at 50° to 60° angles in order to maximise true width intersections.
• Geometry of mineralisation is interpreted as sub- vertical to vertical and as such
current drilling allows true width of mineralisation to be determined.
Diagrams • No individual drillhole is material to the Mineral Resource estimate, and hence
diagrams are not provided.
Balanced
reporting
• This is a Mineral Resources Statement and is not a report on exploration results hence
no additional information is provided for this section.
Other
substantive
exploration
data
• This is a Mineral Resources Statement and is not a report on exploration results hence
no additional information is provided for this section.
Further work • Further underground near mine exploration drilling is being assessed.
Section 3 Estimating and Reporting of Mineral Resources
Criteria Commentary
Database
integrity
• The following measures are in place to ensure database integrity:
o All Rosebery drillhole data is stored in an SQL database on the Rosebery server,
which is backed up at regular intervals.
o Geological logging is entered directly into laptop computers which are uploaded
to the database. Prior to 1996 DD holes were logged using Lotus spreadsheets
or on paper.
o Assays are loaded into the database from spreadsheets provided by the
laboratory.

MMG | 2021 June Mineral Resources and Ore Reserves Statement - Appendix Page 129 of 205
Section 3 Estimating and Reporting of Mineral Resources
Criteria Commentary
• A database upgrade and full data migration was undertaken in November 2014.
Several rounds of data migration checks were undertaken before allowing the
database to go live.
o Data validation procedures include:
o Validation routines in the new database check for overlapping sample,
lithological and alteration intervals.
o Random comparisons of raw data to recorded database data are undertaken
prior to reporting for 5% of the additional drillholes added in any one year. No
fatal flaws have been observed from this random data review.
o Bulk data is imported into buffer tables and must be validated before being
uploaded to the master database
Site visits • The 2021 Competent Person for Mineral Resources has not visited Rosebery Mine
during the reporting period due to the ongoing COVID-19 global pandemic. The
Competent Person has visited the site in previous years and has access to core
photography of new drilling and photogrammetry of underground development.
Video meetings between the Competent Person and site personal happen on a regular
basis.
Geological
interpretation
• Economic Zn-Pb-Ag-Au mineralisation occurs as massive, semi-massive and
disseminated base metal sulphide lenses located within the Rosebery host sequence.
Economic and near-economic mineralisation is easily visually identified in drill core
and underground mine development.
• Drill core is routinely sampled across zones of visible sulphide mineralisation.
• The method used for defining mineralisation domains for the 2021 Mineral Resources
estimate is described below:
o Peer reviewed exploratory data analysis was undertaken for each element of
interest.
o 3D wireframe models of each mineralisation style were created using an
Indicator interpolation similar to kriging (Radial Base Function) in combination
with vein modelling, using Leapfrog Geo v6 software. Key data inputs included
composited drill data converted to Indicators and mineralisation guidelines
from traditional mapping and high quality photo images of development faces
and backs.
o The Radial Base Function interpolation uses a model representing the spatial
variability of each variable and this was chosen on the basis of directional
experimental semi-variograms and drill spacing. The interpolation search
directions are determined by a Structural Trend Model created using
mineralisation trend triangulations created from interpretations looking down
the axis of regional stress.
o The resultant wireframe models were visually compared to mapped or
recorded mineralisation contacts from traditional geological mapping and
Adamtech photo images. A close correlation between the models and points
of observation is noted in most areas where data are available. Differences
occur due to the 5m resolution of wireframes and compared to more detailed

MMG | 2021 June Mineral Resources and Ore Reserves Statement - Appendix Page 130 of 205
Section 3 Estimating and Reporting of Mineral Resources
Criteria Commentary
mapping. Where major differences occur, guideline strings are used to modify
the wireframes to reflect the mapping where appropriate.
o The domain models are broadly consistent with logged and mapped
observations of the main lithology units present at mine scale, namely black
shale, porphyry and the hanging wall and footwall contacts with the host
sequence.
Dimensions • The Rosebery mineral deposit extends from 400mE to 1800mE, 2800mN to -1100mN,
3400mRL-1800mRL (Rosebery Mine grid co-ordinates) and is currently open to the
north, south and at depth. Individual lenses vary in size from a few hundred metres
up to 1000m along strike and/or down-dip.
• The range of minimum, maximum and average thickness of the mineralised lenses are
as follows:
Minimum (m) Maximum (m) Mean (m)
0.2-0.3 12-36 3-6
Estimation
and modelling
techniques
• Grades estimation uses Ordinary Kriging (OK) as implemented in Maptek Vulcan
version 2020. The main inputs and parameters are described below:
o Blocks and 1m composites flagged by domain and estimated individually.
o Parent block size for estimation of 2mE x 7.5mN x 5mRL.
o Block size approximates one half of drillhole spacing in northing and RL, and
is consistent with the primary sampling interval in easting (1m).
o Discretisation is 2x4x2 (X, Y, Z) for a total of 16 points per block.
o Minimum/maximum sample search number depends on domains based on
KNA but is generally 8/24 for most domains.
o Octant search methods were not used.
o A minimum of 3 drillholes is required for a block to be estimated.
o Grade capping was applied to the high grade gold and silver domain in some
lenses.
o High yield restriction has been used in the low grade domains in the U lens to
limit the influence of high grade samples within the low grade domain.
o A second estimation pass was used to estimate blocks in sparsely sampled
areas not estimated in the primary estimation.
• All recoverable elements of economic interest to the Rosebery Operation (Zn, Pb, Cu,
Ag, Au) and Fe have been estimated.
• No deleterious element or non-grade variables of economic significance have been
identified – hence they are not estimated.
• No dilution or recovery factors are taken into account during the estimation of Mineral
Resources. These are addressed in the relevant Ore Reserves statement.
• All metals are estimated individually, and no correlation between metals is assumed
or used for estimation purposes.

MMG | 2021 June Mineral Resources and Ore Reserves Statement - Appendix Page 131 of 205
Section 3 Estimating and Reporting of Mineral Resources
Criteria Commentary
• Block model validation was conducted by:
o Visual inspections for a true fit with the high and low grade wireframes (to
check for correct placement of blocks).
o Visual comparison of block model grades against composite file grades.
o Global statistical comparison of the estimated block model grades against the
declustered composite statistics and raw length-weighted data.
o Visual inspection of Kriging quality statistics such as kriging variance, slope of
regression, Kriging efficiency, sum of positive weights, number of samples
average distance to samples and pass.
o Swath and Drift plots were generated and checked for all lenses. The plots
confirm overall consistency between data and estimates with a reasonable
degree of smoothing.
o Change of Support analysis was undertaken on all elements on a lens by lens
basis.
o Reconciliation with Mill data where available.
Moisture • Tonnes have been calculated on a dry basis, consistent with laboratory grade
determinations.
• No moisture calculations or assumptions are made in the modelling process.
Cut-off
parameters
• Net Smelter Return (NSR) has been calculated for all block model blocks, and accounts
for MMG’s long-term economic assumptions (metal price, exchange rate), metal
grades, metallurgical recoveries, smelter terms and conditions and off-site costs. The
NSR calculation was updated in May 2021.
• Rosebery Mineral Resources were reported above a $174/t NSR block grade cut-off.
An example of minimum grades above $174/t NSR cut-off is as follows: 4.6% Zn, 0.95%
Pb, 15 g/t Ag, 0.75 g/t Au, 0.17% Cu.
Mining factors
or
assumptions
• Mineral Resources block models are used as the basis for detailed mine design and
scheduling and to calculate derived NPV for the life of asset (LoA). Full consideration
is made of the reasonable prospect of eventual economic extraction in relation to
current and future economic parameters. All important assumptions including
minimum mining width and dilution are included in the mine design process.
• Mined voids (stope and development drive shapes) are depleted from the final
Mineral Resources estimate as at 30th June, 2021.
• For Mineral Resources in the Lower Mine, in addition to removing actual mined voids,
an additional 5m across strike has been removed from mined stopes as this near near-
void skins and pillars as these are considered not to have reasonable prospects for
mining.
• For Mineral Resources in the Upper Mine, due to lack of confidence in completion in
the void model, only resources away from outside edges of known stoping and
development have been reported.
MMG | 2021 June Mineral Resources and Ore Reserves Statement - Appendix Page 132 of 205
Section 3 Estimating and Reporting of Mineral Resources
Criteria Commentary
Metallurgical
factors or
assumptions
• Metallurgical processing of ore at Rosebery involves crushing and grinding followed
by flotation and filtration to produce saleable concentrates of copper, lead and zinc.
Additionally, gold is partly recovered as doré following recovery from a gravity
concentrator.
• Metallurgical recovery parameters for all payable elements are included in the NSR
calculation, which is used as the cut-off grade for the Mineral Resources estimate. The
metallurgical recovery function is based on recorded recoveries from the Rosebery
concentrator and monitored in monthly reconciliation reports.
Environmental
factors or
assumptions
• Environmental factors are considered in the Rosebery life of asset work, which is
updated annually and includes provision for mine closure.
• Potentially acid forming (PAF) studies have been completed for sulphide-rich waste at
Rosebery Mine in 2014. Determination of surface treatable and untreatable waste is
currently determined by visual assessment guided by geological modelling and is not
estimated or included in the 2021 Mineral Resources block models.
Bulk density • In the Lower Mine (KNPWXY) bulk density is estimated using Ordinary Kriging of a
combination of specific gravity (SG) measurements and SG predicted values assigned
to the drillhole sample where no SG measurement was taken by a machine learning
algorithm.
• The machine learning algorithm (CatBoost Regressor) was trained by using 23,000 SG
measurements and their associated multi-element assay results as predictor features.
The algorithm consistently gives an average K-folds test r2 results around 0.92, a
significant improvement on the previously used bulk density formula.
• Since introducing the SG estimation in the Lower Mine, tonnes and grades
reconciliation has improved for all elements.
• SG measurements are collected on all delineation drillhole samples. These
measurements will be added to the training data for the machine learning model in
future updates.
• In the Upper and Middle Mine and U lens areas where very few SG measurements
have been collected, an empirical formula is used to determine the dry bulk density
(DBD) based on Pb, Zn, Cu and Fe assays and assuming a fixed partition of the Fe
species between chalcopyrite and pyrite. This formula is applied to the block model
estimations after interpolation has been completed. The formula applied is:
DBD =2.65+0.0560 Pb%+0.0181 Zn%+0.0005 Cu%+0.0504 Fe%
• All new drilling in the Middle Mine and U Lens areas have some SG measurements
taken. When sufficient data is collected in these areas a machine learning algorithm
to predict old drillholes with no SG estimates will be used.
• The Rosebery mineralisation does not contain significant voids or porosity. The DBD
measurement does not attempt to account for any porosity.
Classification • Mineral Resources classifications used criteria that required a minimum number of
three drillholes. The spatial distribution of more than one drillhole ensures that any
interpolated block was informed by sufficient samples to establish grade continuity.

MMG | 2021 June Mineral Resources and Ore Reserves Statement - Appendix Page 133 of 205
Section 3 Estimating and Reporting of Mineral Resources
Criteria Commentary
• Drillhole spacing for classification were based on an internal Rosebery drillhole
spacing study undertaken in 2017. Results from the study indicate:
o Measured Mineral Resources: 15m x 15m drillhole spacing
o Indicated Mineral Resources: 30m x 30m drillhole spacing
o Inferred Mineral Resources are generally defined as twice the spacing of
Indicated Mineral Resources provided there is reasonable geological
continuity.
• Zinc estimated values were used for classification.
• Based on the interpolated block, Resource Category wireframes were then
constructed to ensure spatial continuity.
• The Mineral Resources classification reflects the Competent Persons view on the
confidence and uncertainty of the Rosebery Mineral Resources.
Audits or
reviews
• An external audit of the Mineral Resource is planned for 2021. The last review was
undertaken by AMC on the 2018 Rosebery Mineral Resource. AMC considers the
Rosebery Mineral Resource estimate has been completed using usual industry
practises and in accordance with the requirements and guidelines of the JORC Code
2012. MMG’s approach is to include geological and grade components in compiling
the resource estimates, which AMC considers appropriate. AMC considers that the
model forms a suitable basis for Mineral Resource reporting and for use in Ore
Reserves and mining studies. No material issues were identified.
• The 2021 Mineral Resources estimate was peer reviewed internally with no material
issues identified.

MMG | 2021 June Mineral Resources and Ore Reserves Statement - Appendix Page 134 of 205
Section 3 Estimating and Reporting of Mineral Resources
Criteria Commentary
Discussion of
relative
accuracy/
confidence
• There is high geological confidence that the spatial location, continuity and estimated
grades of the modelled lenses within the Rosebery Mineral Resources.
• The sheet-like, lensoidal nature of mineralisation historically exhibited is expected to
be present in the remaining Mineral Resources at least at global scale.
• Minor local variations are observed at a sub-20m scale; it is recognised that the short
scale variation cannot be accurately captured even at very close drill spacing, and
additional mapping data is important. Short scale geometry variation appears to be
related to the preferential strain around relatively competent units in the mine
sequence; there is little evidence of brittle fault offsets.
• Twelve month rolling reconciliation figures for the Mineral Resources model to the
mill treatment reports are within 5% for all metals an annual basis, suggesting that the
Rosebery Mineral Resources estimation process is sound.
• Mining and development images (including traditional mapping and digital
photographic images) shows good spatial correlation between modelled mineralised
boundaries and actual geology.
• The combination of Mineral Resources model, mapping, stope commentaries and face
inspections provides reasonably accurate grade estimations for mill feed tracked on a
rolling weekly basis, in each end of month report, and on a quarterly and annual basis.
• Remnant mineralisation in close proximity to voids in the upper and lower levels has
been removed from the reported Mineral Resources.
• The accuracy and confidence of this Mineral Resources estimate is considered suitable
for public reporting by the Competent Person.

MMG | 2021 June Mineral Resources and Ore Reserves Statement - Appendix Page 135 of 205
6.2.3 Statement of Compliance with JORC Code Reporting Criteria and Consent to Release
This Mineral Resource statement has been compiled in accordance with the guidelines defined in the 2012
Edition of the Australasian Code for Reporting of Exploration Results, Mineral Resources and Ore Reserves
(“2012 JORC Code”).
6.2.3.1 Competent Person Statement
This Mineral Resources statement has been compiled in accordance with the guidelines defined in the 2012
Edition of the ‘Australasian Code for Reporting of Exploration Results, Mineral Resources and Ore Reserves’
(“2012 JORC Code”).
I have read and understood the requirements of the 2012 Edition of the Australasian Code for Reporting
of Exploration Results, Mineral Resources and Ore Reserves (JORC Code, 2012 Edition).
I am a Competent Person as defined by the JORC Code, 2012 Edition, having more than five years
experience that is relevant to the style of mineralisation and type of deposit described in the Report, and
to the activity for which I am accepting responsibility.
I am a Member of The Australasian Institute of Mining and Metallurgy hold Chartered Professional
accreditation in the field of Geology
I have reviewed the relevant Dugald River Ore Reserves section of this Report, to which this Consent
Statement applies.
I have disclosed to the reporting company the full nature of the relationship between myself and the company,
including any issue that could be perceived by investors as a conflict of interest.
I verify that the Rosebery Mineral Resources section of this Report is based on, and fairly and accurately reflects
the form and context in which it appears the information in my supporting documentation relating to Mineral
Resources. I confirm that I have reviewed the relevant Rosebery Mineral Resources section of this Report to
which this Consent Statement applies.
6.2.3.2 Competent Person Consent
Pursuant to the requirements Clause 9 of the JORC Code 2012 Edition (Written Consent Statement)
With respect to the sections of this report for which I am responsible – the Rosebery Mineral Resources - I
consent to the release of the 2021 Mineral Resources and Ore Reserves Statement as at 30 June 2021 Executive
Summary and Technical Appendix Report and this Consent Statement by the directors of MMG Limited:
_______________________________________________ Date: ____________________________________________
Anna Lewin MAusIMM (CP). (#992405)
_______________________________________________ ____________________________________________
Signature of Witness: Witness Name and Residence: (e.g. town/suburb)
This signature was scanned for the exclusive use in
this document – the MMG Mineral Resource and Ore Reserve Statement as at 30 June 2021 – with the
author’s approval. Any other use is not authorised.
This signature was scanned for the exclusive use in
this document – the MMG Mineral Resource and Ore Reserve Statement as at 30 June 2021 – with the
author’s approval. Any other use is not authorised.
Chis Lewin
Singapore

MMG | 2021 June Mineral Resources and Ore Reserves Statement - Appendix Page 136 of 205
6.3 Ore Reserves – Rosebery
6.3.1 Results
The 2021 Rosebery Ore Reserves are summarised in Table 20.
Table 20 2021 Rosebery Ore Reserve tonnage and grade (as at 30 June 2021)
Rosebery Ore Reserves
Contained Metal
Rosebery
Tonnes (Mt) Zinc
(% Zn)
Lead
(% Pb)
Copper
(% Cu)
Silver
(g/t Ag)
Gold
(g/t Au)
Zinc
('000 t)
Lead
('000 t)
Copper
('000
t)
Silver
(Moz)
Gold
(Moz)
Proved 5.2 6.4 2.6 0.19 120 1.2 340 140 10 20 0.21
Probable 0.84 5.5 2.0 0.18 110 1.1 46 17 1.5 3.1 0.03
Total 6.1 6.3 2.5 0.19 120 1.2 380 150 11 23 0.24
Stockpile
Proved 0.03 8.2 3.1 0.27 150 1.7 2.3 0.89 0.08 0.14 0.002
Total 6.1 6.3 2.5 0.19 120 1.2 380 150 11 23 0.24
Cut-off grade is based on Net Smelter Return (NSR) after Royalties, expressed as a dollar value of A$174/t.
Contained metal does not imply recoverable metal.
The figures are rounded according to JORC Code guidelines and may show apparent addition errors.
The 2021 Reserves have decreased in comparison to 2020 by approximately 1.1Mt which was contributed by
multiple factors, including the below:
• Rosebery’s 2021 Ore Reserves are currently located in the Lower Mine region only, and mining depletion
since 30 June 2020 has decreased the 2020 Ore Reserves estimate by (-1.02Mt). This negative change is
also due to:
o an increase of $2/t in the BCOG to $174/t (used to determine Reserves material)
o changes to the annual long-term strike price estimate to where Zinc price decreased specifically,
along with subsequent differences in timing and input to the mining studies compared with the
inputs for the Mineral Resource estimate.
• Diamond drilling and subsequent geological modelling have resulted in an increase in the Mineral
Resource estimated within the Middle Mine of approximately (2.47Mt). A Prefeasibility Study commenced
on the Middle Mine during July 2021 with the aim of providing confidence to convert appropriate parts
of the Middle Mine Mineral Resource estimate to an Ore Reserve estimate.
• Tailings dam studies completed in the last reporting year have increased the level of certainty in regard
to matching the life of mine schedule with required tailings storage.
o Currently, the 2/5 Dam Stage 2 project is approved for construction by the EPA. Construction is
planned to commence in Q3, 2021.
o The 2/5 Dam also has a pre-feasibility study completed for Stage 3, with a feasibility study to be
completed in 2022.
o Bobadil Stage 10 construction is currently taking place.
o A feasibility study has been completed for Bobadil Stage 11. Construction relies on the
performance of Stage 10 to fully inform the design.

MMG | 2021 June Mineral Resources and Ore Reserves Statement - Appendix Page 137 of 205
6.3.2 Ore Reserves JORC 2012 Assessment and Reporting Criteria
The following information provided in Table 21 complies with the 2012 JORC Code requirements specified by
“Table-1 Section 4” of the Code.
Table 21 JORC 2012 Code Table 1 Assessment and Reporting Criteria for Rosebery Ore Reserve 2021
Section 4 Estimation and Reporting of Ore Reserves
Criteria Commentary
Mineral
Resources
estimate for
conversion to
Ore Reserves
• The Mineral Resource estimate as reported is inclusive of the Ore Reserve
estimate.
• For the Ore Reserve estimate, only Measured and Indicated Resource material is
included.
• The Mineral Resource estimate is based on the MMG March 2021 Mineral
Resource block model, (ros_knpwxy_dpm_2103_v1.dm).
• There is high geological confidence in the spatial location, continuity and
estimated grades of the modelled lenses within the Rosebery Mineral Resources.
The sheet-like, lenticular nature of mineralisation historically exhibited is expected
to be present in the remaining Mineral Resources at a global scale.
Site visits • The Competent Person for the Rosebery Ore Reserves has been engaged as a
contractor through Ground Control Engineering Pty Ltd. He has visited the site on
numerous occasions since 2017 however, due to COVID-19 restrictions on travel,
a site visit has not been practicable since early 2020. All communication has been
via phone calls, video calling and file sharing platforms (MS Teams), and/or email
correspondence.
Study status • The mine is an operating site with an ongoing detailed Life of Asset planning
process. Mining studies of the Upper Mine and Middle Mine are in progress.
Cut-off
parameters
• The 2021 Mineral Resource and Ore Reserve estimates rely on cut-off
grades/values which are based on corporate guidance on metal prices and
exchange rates. The site capital and operating costs, production profile, royalties
and selling costs are based on MMG’s 2021 Budget. Processing recoveries are
based on historical performance.
• The Breakeven Cut-off Grade (BCOG) and Mineral Resource Cut-off Grade (RCOG)
have been calculated using MMG’s 2021 Budget costs.
• The operating costs, both fixed and variable, have been attributed on a per mined
tonne basis using the planned mine production rate of 1.0Mtpa
• The Net Smelter Return (NSR) values are based on metal prices, exchange rates,
treatment charges and refinery charges (TC’s & RC’s), government royalties and
metallurgical recoveries.
• The NSR value for both BCOG and RCOG is estimated to the mine gate and
includes sustaining capital for the 2021 Ore Reserves.
• RCOG is the same value as the calculated BCOG (NSR $174/tonne). However,
there is a difference between the NSR values calculated for the Mineral Resource
estimate and the Ore Reserve estimate, in that different price inputs are used to
calculate each. This discrepancy is due to the time lag between the building of
the geological resource model and the Ore Reserve estimate, which uses more
recent price estimates.

MMG | 2021 June Mineral Resources and Ore Reserves Statement - Appendix Page 138 of 205
Section 4 Estimation and Reporting of Ore Reserves
Criteria Commentary
• Exploration drilling was classed as a one-off OPEX Cost and was excluded from
2021 COV calculations, in accordance with the international accounting guideline,
‘Accounting for Exploration and Evaluation Expenditure – 10699791’. The
guideline distinguishes between exploration drilling, Resource delineation
drilling, and Resource definition drilling. Under the guideline, exploration drilling
is considered to be an operating expense to the business as its material
confidence is lower than that of Resource drilling.
• Resource Drilling is classified as CAPEX and was not classified as Sustaining
Capital, and therefore did not influence the BCOG value.
• This treatment of exploration expenditure as a one-off cost does not capture
whether such costs are being rolled over between years, and therefore become
an ongoing operational expense that should be included in the BCOG estimate.
A procedure is to be developed by MMG to account for these one-off exploration
expenses to ensure that they are captured if required.
• The break-even cut-off grade (BCOG) was used to evaluate the economic
profitability (Level by Level) of mining during the Life of Asset planning process.
The Stope Cut-off Grade (SCOG) was used to limit the creation of stope shapes,
which included estimated waste dilution. Resultant stope shapes that were below
the BCOG value were evaluated for mining on an individual basis, depending on
their location on level or interactions with other mining activities. Accordingly,
some material that is below the BCOG is included in the Ore Reserve estimate, as
it is considered profitable in its own right and/or necessary to be mined for other
reasons.
Mining factors
or assumptions
• Mining production is carried out by long-hole open stoping with decline access.
Stoping is conducted through both longitudinal retreat and transverse methods.
• Mining lenses are divided into panels and are mined using a bottom-up sequence
in a continuous 45 degree retreating sequence, either towards or away from level
access drives. The nature of this mining sequence causes fluctuations in the grade
profile in the short-term. Each stoping panel contains between 3 and 5 sub-levels,
with crown pillars left in-situ between the backs of up-hole stopes and the lowest
ore drive of the panel above.
• Backfilling of stope voids is carried out using two methods; cemented rock fill
(CRF), and rock fill (RF). Up-hole (Crown) retreat stopes are left as an open void
due to lack of access for fill placement.

MMG | 2021 June Mineral Resources and Ore Reserves Statement - Appendix Page 139 of 205
Section 4 Estimation and Reporting of Ore Reserves
Criteria Commentary
• Long-term stope shapes are designed using the Stope Optimizer (SO) process
within the Deswik Software package, using NSR as the optimisation field and
SCOG as the cut-off grade (NSR $154). The length of each block in the SO is set
to 5m. Each scheduled stope is a combination of three or four of the 5m blocks
giving a stope strike length of 15m or 20m.
o Average stope strike lengths of 15m were used in W and X Lens while the
other lenses used 20m. The height was set to 20-25m (floor to floor), with
a minimum true mining width of 4.5m.
• A Mining Recovery factor of 75-90%, depending on the mining zone, is applied
to mined ore tonnes based on historic reconciliations.
• Access to the orebody is through a decline 5.5 mH x 5.5 mW at a 1:7 gradient. The
approximate standoff distance between the stoping footwall and major
infrastructure; ie - stockpiles, vent rises, escape-ways, declines and ancillary
development, is 65-70m.
• For Ore Reserve estimating, only Measured and Indicated Resource material is
included.
• Production of ore is in contained entirely within Measured and Indicated Mineral
Resources. Resource definition drilling programs are scheduled to convert
Indicated Mineral Resources to Measured Mineral Resources before development
or stoping activities commence.
• All mine development is under survey control. Geological development control is
currently not implemented at Rosebery, apart from estimating the ore grades in
development headings and distinguishing between ore and waste material. The
primary ventilation system supplies approximately 660 m³/s (measured at depth)
of air to the underground mine, which is sufficient to allow extraction from
multiple ore lenses.
• The mine has an established dewatering circuit and other services, including
electrical ring main, leaky feeder radio system, compressed air, production water
and potable water.
• Emergency egress is managed by a system of ladderways, drives and fresh air
stations, which provide a means of secondary egress from all major production
fronts. Where required, mobile self-contained rescue chambers are installed.
Geotechnical • Rosebery is one of the deepest and oldest mines in Australia with challenging ground
conditions that result in the closure (squeezing) of development drives and mining
induced seismicity around production fronts.
• Mining induced seismicity at Rosebery is usually related to the proximity of
production to geological structures or contrasting lithological contacts. A geological
structural model that includes the known major intrusions, contact zones and
lithological features has been developed and is routinely updated to guide mine
planning and operations.
• Seismicity can also be attributed to production near highly stressed abutment and
close-out pillars. Permanent infrastructure (declines, stores, substations, etc.) that sit
within these abutments/pillars are managed with appropriate ground support for the
possible conditions experienced.

MMG | 2021 June Mineral Resources and Ore Reserves Statement - Appendix Page 140 of 205
Section 4 Estimation and Reporting of Ore Reserves
Criteria Commentary
• Seismic monitoring, seismic re-entry exclusion periods (following production firings)
and seismic TARPs (mine wide and high-risk area-specific) are used to control
personnel access into potentially high seismic hazard locations.
• High displacement ground support (dynamic support) is selected in locations where
increased seismic risk has been determined by the geotechnical department during
the POI process. Where a large seismic event has occurred (>0.6ML) a review of
ground support capacity and requirements is completed.
• Rock fabric anisotropy results in poorer rock mass quality for drives that strike North-
South compared to drives that strike East-West. As a result, North-South striking
drives often require higher capacity support requirements and increased
rehabilitation costs.
• Just-in-time development, preferential drive orientations and condition specific
ground support capacity designs are combined with multiple stages of rehabilitation
to establish and maintain serviceability of development.
• Rosebery mine use three main extraction methods based on depth, stress and the
presence of mined voids. The table below can be used to select the method of mining
best suited to the expected conditions.
• Method • Diagram
Benching - longitudinal retreat along a single
OD (Ore Drive). Ideally used in low Stress, low
yielding rock masses, where there is a reduced
seismic risk. In some cases, where higher than
expected deformation and seismic hazard are
encountered, additional ground support is
applied; in this case, a change of extraction
sequence may also be considered
Transverse Slashing – longitudinal retreat,
extracted from the XC (Cross-cut) with
minimal equipment or personnel access into
the OD required. This extraction method may
be selected based on drill and blast
requirements (wider ore zone, requiring greater
drilling ability) or to reduce seismic hazard
exposure, where the seismic hazard is present
in the OD. With this method, personnel and
equipment are not exposed to the high seismic
risk, if present in the OD, as most production
activities occur in the XC and FWD (Foot Wall
Drive). In the case where this method has been
selected and a seismic risk has later been
identified in the FWD, higher capacity support
is required as well as just in time development.
This case, where the higher seismic hazard is
present in the FWD, has occurred in several
active lenses and personnel exposure to this
seismic hazard is being controlled with
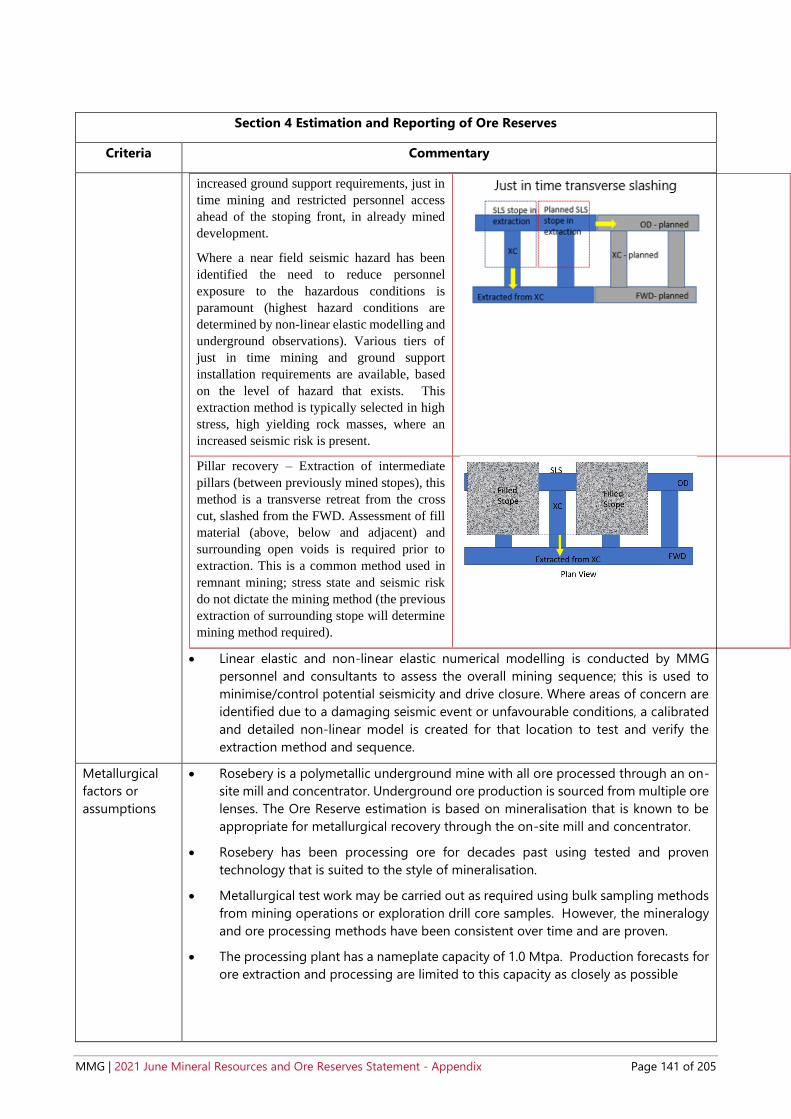
MMG | 2021 June Mineral Resources and Ore Reserves Statement - Appendix Page 141 of 205
Section 4 Estimation and Reporting of Ore Reserves
Criteria Commentary
increased ground support requirements, just in
time mining and restricted personnel access
ahead of the stoping front, in already mined
development.
Where a near field seismic hazard has been
identified the need to reduce personnel
exposure to the hazardous conditions is
paramount (highest hazard conditions are
determined by non-linear elastic modelling and
underground observations). Various tiers of
just in time mining and ground support
installation requirements are available, based
on the level of hazard that exists. This
extraction method is typically selected in high
stress, high yielding rock masses, where an
increased seismic risk is present.
Pillar recovery – Extraction of intermediate
pillars (between previously mined stopes), this
method is a transverse retreat from the cross
cut, slashed from the FWD. Assessment of fill
material (above, below and adjacent) and
surrounding open voids is required prior to
extraction. This is a common method used in
remnant mining; stress state and seismic risk
do not dictate the mining method (the previous
extraction of surrounding stope will determine
mining method required).
• Linear elastic and non-linear elastic numerical modelling is conducted by MMG
personnel and consultants to assess the overall mining sequence; this is used to
minimise/control potential seismicity and drive closure. Where areas of concern are
identified due to a damaging seismic event or unfavourable conditions, a calibrated
and detailed non-linear model is created for that location to test and verify the
extraction method and sequence.
Metallurgical
factors or
assumptions
• Rosebery is a polymetallic underground mine with all ore processed through an on-
site mill and concentrator. Underground ore production is sourced from multiple ore
lenses. The Ore Reserve estimation is based on mineralisation that is known to be
appropriate for metallurgical recovery through the on-site mill and concentrator.
• Rosebery has been processing ore for decades past using tested and proven
technology that is suited to the style of mineralisation.
• Metallurgical test work may be carried out as required using bulk sampling methods
from mining operations or exploration drill core samples. However, the mineralogy
and ore processing methods have been consistent over time and are proven.
• The processing plant has a nameplate capacity of 1.0 Mtpa. Production forecasts for
ore extraction and processing are limited to this capacity as closely as possible

MMG | 2021 June Mineral Resources and Ore Reserves Statement - Appendix Page 142 of 205
Section 4 Estimation and Reporting of Ore Reserves
Criteria Commentary
• From the mill there are four saleable products generated:
o Doré
o Copper Concentrate
o Zinc Concentrate
o Lead Concentrate
• The flow chart below outlines the block flowsheet, products and payable metals.
• The inclusion of deleterious elements is understood from historical analyses, and
these are included in metallurgical recovery estimates. Of particular note is Iron (Fe),
which deleteriously affects the recovery of zinc to the zinc concentrate.
• Recoveries were estimated using the metallurgical model, which uses a regression
analysis of real plant data to enable prediction of future plant performance. These
calculated recoveries are used to forecast payable metal, and also provide a Net
Smelter Return value for the modelled ore blocks used in the Ore Reserve estimate.
• Specific mineralogy domains are not used in metallurgical recovery estimates, which
are based only on the mineralogical head grades of processed ore, including
deleterious elements. The orebody modelling process includes an estimation of the
head grades for all mineralogy known to impact metallurgical recoveries. In this way,
the regression analysis accounts for the various mineralogical domains within the
orebody.
• The average total metallurgical recoveries for the Life of Mine are summarised in the
below table.

MMG | 2021 June Mineral Resources and Ore Reserves Statement - Appendix Page 143 of 205
Section 4 Estimation and Reporting of Ore Reserves
Criteria Commentary
Product Copper
(%)
Zinc
(%) Lead (%) Silver (%)
Gold
(%)
Zinc Concentrate 84%
Lead Concentrate 1.8% 77% 36% 16%
Copper Concentrate 58% 41% 36%
Gold Dore
0.13% 24%
Environmental • The 2/5 Dam Tailings Storage Facility (TSF) was commissioned in April 2018 for
subaqueous tailings deposition. Commissioning included a new pump station,
tailings pipeline and seepage collection ponds. The intention for the 2/5 Dam TSF is
to be converted to subaerial tailing deposition. This would allow for additional
storage of tailings within the TSF. Rosebery is in the process of obtaining regulatory
approvals.
• Currently, an interim/temporal subaerial tailings deposition at the Stage 1 raise has
been approved by the EPA, to allow for additional tailings storage capacity while the
construction of Stage 2 Raise takes place. This includes dust suppression strategies
to mitigate any possible dust events to the surrounding community. (Please Refer
to the Tailings portion for further information)
• Rosebery has proactively been conducting dust monitoring at the 2/5 Dam TSF since
the start of the construction of Stage 1.
• Waste water - The waste water management at Rosebery involves collecting all
potentially contaminated water, including stormwater, mine water and mill tailings
at the Effluent Treatment Plant (ETP), where lime is added before pumping the whole
volume of treated water to the Bobadil TSF via the Flume (an open concrete channel
flowing under gravity to the TSF). After the final polishing stage, water is
subsequently discharged to Lake Pieman.
• The ETP hydraulic capacity is approximately 600 l/sec, and the plant is capable of
receiving 335 l/sec of site mine water with a remaining limited spare capacity of
approximately 265 l/sec to treat the site surface rain or storm water.
• The historic Hercules area has a large impact on the land area along with major water
issues. This area is the most significant “legacy site” for Rosebery management.
Smaller historic legacy sites include the Zeehan Smelter site, South Hercules and
historic mines numbering at least ten known sites, such as Jupiter’s, along with a
number of small historic workings.
• Waste rock - Waste rock is characterised as either NAF, PAF or High PAF. To date
the majority of waste rock produced has been retained underground and used for
stope filling, either as RF or CRF. Previously, surplus waste rock was trucked to the
surface and unloaded at the waste rock dump and was treated by adding a layer of
lime on top and below every layer of waste rock. Recent Life of Asset (LoA) planning
suggests there will be no requirement for waste rock to be trucked to the surface.
Infrastructure • MMG Limited holds title to the Rosebery Mine Lease (ML 28M/1993 – 4,906ha) which
covers an area that includes the Rosebery, Hercules and South Hercules base and
precious metal mines.
• Electric power to the site feeds in through the No. 1 Substation located adjacent to
the Mill Car Park on Arthur Street. There is a contract for the supply to the site with
the Electrical Supply Authority for the region. The Commercial Department manages
this, and all responsibilities (such as notifications to a change in a supply by either

MMG | 2021 June Mineral Resources and Ore Reserves Statement - Appendix Page 144 of 205
Section 4 Estimation and Reporting of Ore Reserves
Criteria Commentary
party), are detailed in this contract. The Electrical Supply Authority's substation
currently has an N+1 arrangement which ensures that supply is maintained in the
event of a loss of critical equipment (e.g. transformer). This also provides the
Electrical Supply Authority with the ability to manage a potential increase in supply
requirement by the site. Further, works are currently underway to provide an
upgrade to the substation infrastructure, the result of which will provide a significant
increase in the security of the supply to the site.
• Freshwater for the site is currently sourced from Lake Pieman and Stitt River, with
allotments of 5,500 ML and 1,647 ML, respectively.
• In total, the Rosebery Mine operation employs 320 permanent staff and an additional
151 contractors, covering all aspects of the operation. Within the mining area, there
are 203 MMG permanent employees.
• Primary communication from the Rosebery Mine site is by phone along with surface
mobile phone coverage, provided by Telstra. Phones are available throughout the
main office building along with the mill and other surface buildings. There is also an
extension of the phone system underground. Along with the phone system, there is
also email and internet services associated with the lines. This is available through
the office area through a wireless system. The wireless system is also extended
throughout part of the underground for the seismic monitoring system.
• The main system for communication underground is through radio via a leaky feeder
and fibre system. The radio system operates on multiple channels with general,
extended discussion, and emergency channels.
• With mining activity taking place underground at Rosebery, access to the operating
areas is by the main decline, “The Fletcher Decline”.
• A single main route is used to access the upper-mid area of K Lens. From this point,
access splits between two declines to the K/N/P Lens area and the W/X/Y Lenses.
Other declines are used to direct primary airflow. The ore is hauled out of the mine
in a fleet of 55-60 tonne haul trucks.
• The Rosebery primary ventilation circuit consists of airflow circuits in series which
accumulate airborne contaminants and heat as pumped air progresses deeper into
the mine. At the 46K Level fresh air is introduced into the circuit via the NDC shaft,
diluting the contaminated air, which finally reports to the return airways and exhausts
to the surface. The current primary ventilation system supplies approximately 660
m³/s of air throughout the mine. The system comprises three primary fan
installations on the surface (PSF1, PSF2 and PSF3) and two booster fan installations
underground (19B Booster Fans and 33P Booster Fan). The specifications of these
fan installations are detailed below:
o PSF1 (New NUC)) are 2 x 1800 kW Howden centrifugal fans. Design duty is 400
m³/s.
o PSF 2 (Old NUC) is a single 550kW centrifugal fan. The duty is 110 m³/s.
o PSF 3 (SUC) is 2 x 550 kW Korfmann KGL 2600 mm axial fans in parallel. The
duty is 154 m³/s.
o The 33P Booster fan is a Flaktwoods 550kW 2600 VP axial fan.
o The 19B Booster fans are 2 x Twin 90kW Zitron secondary fans.

MMG | 2021 June Mineral Resources and Ore Reserves Statement - Appendix Page 145 of 205
Section 4 Estimation and Reporting of Ore Reserves
Criteria Commentary
• The main intake airways of the mine are the decline portal, No.2 Shaft and the NDC
shaft. However, there is also minimal leakage through historic workings from the
surface.
• There is a crib room and workshop facility at the 46K Level which is close to the
current and ongoing production areas.
• The concentrate is transported from site by Tasrail, which is the only railway line
service that connects the West Coast area to the port in Burnie.
• Until April 2018, Tailings from the ore treatment were only placed into a TSF located
to the north of Rosebery, the Bobadil TSF. Tailings have subsequently been
discharged at 2/5 Dam TSF, and sporadically into Bobadil TSF. The new Stage 10
raise construction at Bobadil TSF is expected to be completed by November 2021,
providing Rosebery Mine with an alternative facility for the storage of tailings.
• The 2/5 Dam TSF, located to the south-west of the Rosebery township, was
commissioned in April 2018 for subaqueous tailings deposition. Commissioning
included a new pump station, tailings pipeline and seepage collection ponds. The
2/5 Dam TSF Stage 1 has temporarily been converted to subaerial tailing deposition
to allow for additional storage of tailings, while the construction of Stage 2 raise
takes place.
• The construction of the Stage 2 Raise is expected to start in August 2021, with
fourteen months of expected construction time. The tailings capacity expected for
this facility is presented in the section under tailings.
• Stage 2 at 2/5 Dam TSF is in the process of obtaining regulatory approvals to convert
the facility into a subaerial deposition facility. If this is approved, there is a possibility
of constructing a Stage 3 raise.
• A pre feasibility study for Stage 3 at the 2/5 Dam TSF raise was completed in early
2020, which will be further progressed.
Costs • Costs used in determining the cut-off values used for the Ore Reserves estimation
were based on the 2021 Budget. Costs were inclusive of Operating Expenses and
Sustaining Capital.
• Costs are in Australian dollars and are converted to US dollars at the applicable
exchange rate.
• MMG Group Commercial supplies the commodity price and exchange rate
assumptions. These price assumptions are then applied to the period in which the
ore is scheduled to be produced to determine the extracted NSR.
• All applicable inflation rates, exchange rates, transportation charges, smelting &
refining costs, penalties for failure to meet specification and royalties are included as
part of the NSR calculations evaluated against the annually released geology block
model to estimate projected value.
• Penalties deducting from revenue may be applied where concentrates contain a
higher percentage of unwanted minerals.
• A cash flow model was produced based on the detailed mine schedule and the
aforementioned costs to determine the NPV.

MMG | 2021 June Mineral Resources and Ore Reserves Statement - Appendix Page 146 of 205
Section 4 Estimation and Reporting of Ore Reserves
Criteria Commentary
• The Ore Reserves estimation has been based on these costs.
Revenue
factors
• Commodity prices and the exchange rate assumptions are the same as reported in
the cut-off parameters section. These are provided by MMG Group Commercial,
approved by the MMG Board, and are based on external company broker consensus
and internal MMG analysis.
• Treatment and refining charges, royalties and transportation costs for different
commodities were supplied by MMG Group Commercial and have been included in
the NSR calculation.
• The formulas, regression values and assumptions used in the NSR calculation are
based on the historical data provided by the Rosebery Metallurgy Department.
• Economic evaluations are carried out to verify that mining areas are profitable. The
cost assumptions were applied to the mining physicals, and the revenue was
calculated by multiplying the recovered ore tonnes by the appropriate NSR value.
The profitable and marginal stopes were included in the Ore Reserves.
Market
assessment
• MMG’s market assessment is based on profiling by a leading industry market analyst
which informed the MMG Board of Directors.
• Zinc mine production increased during 2020 to finish the year above the COVID-19
impacted lows seen in early to mid-2020. Mines around the world have put in place
protocols to control virus infection, but the supply of concentrate remains exposed
to the risk of mine supply disruption from further lockdown restrictions at operating
mines or in their wider supply chain.
• In the medium to longer-term, mine production is expected to decline due to the
forecast closure of mines as ore reserves are depleted. While there are a few new
mines at the advanced stage to replace this depletion, new zinc projects tend to be
more economically and operationally challenging than existing or recently closed
operations due to a range of factors, including grade, size and location. Financing
for new projects can also become difficult if there are periods of price uncertainty.
• The recovery of mine output during 2020 resulted in increases in smelter utilisation
and zinc metal output, allowing global stocks of refined metal to increase from the
historic lows seen in 2018 and 2019. Zinc stocks are expected to remain within the
boundaries of historical limits.
• Global zinc consumption contracted in 2020 as the COVID-19 pandemic, and the
consequences of the actions of governments to contain and mitigate against its
effects dominated all base metal markets, including zinc.
• The global economy is expected to normalise in the near-term, rebounding from its
dip in 2020. Manufacturing is expected to provide the impetus for zinc consumption
growth of approximately 4% in 2021. Zinc consumption is forecast to grow at over
1% annually in the medium-term.
• The zinc price has increased in 2021, primarily due to the conviction amongst
investors that government stimulus will continue to enable a strong rebound in
economic growth and fuel demand for commodities. Investor confidence in
commodities is expected to be sustained in the medium term.

MMG | 2021 June Mineral Resources and Ore Reserves Statement - Appendix Page 147 of 205
Section 4 Estimation and Reporting of Ore Reserves
Criteria Commentary
• Rosebery has life of mine agreements in place with Nyrstar covering 100% of zinc
and lead concentrate production, which is sold to them on international terms.
Currently, Rosebery’s precious metals concentrate is sold to China Minmetals for use
by Chinese smelters under a two-year sales contract (2020-21). Dore is sold to the
Perth Mint for refining into gold and silver metal.
Economic • Rosebery is an established operating mine. Costs used in the NPV calculation are
based on historical data. Revenues are calculated based on historical and contracted
realisation costs and realistic long-term metal prices.
• The mine is profitable, and life-of-mine economic modelling shows that the Ore
Reserves are economic. The Life of Mine (LOM) financial model demonstrates the
mine has a positive NPV. MMG uses a discount rate appropriate to the size and
nature of the organisation and deposit.
Social • The West Coast area of Tasmania has a long history of mining. There are a large
number of people employed by the mine from the town of Rosebery and the local
government area.
• Community issues and feedback associated with the Rosebery mine are received
through the MMG Community Liaison Office. All issues are reported on a
Communication and Complaints form and forwarded to the Administration and
Community Assistant for action, per the Site Complaints Procedure. The
Superintendent - Environment and Community, makes direct contact with the
complainant to discuss the issue and, once details are understood, communicates
with the department concerned to resolve the matter.
• During the 2020/2021 reporting period, nil community complaints were received. In
the 2019/2020 reporting period, a total of five community complaints were received:
two linked to noise from the rock breaker, one to the behaviour of an employee, and
one linked to water discharge/ seepage. All complaints were investigated and
resolved in consultation with the complainant.
• The MMG Rosebery Mine – Underground Agreement 2020, is approved by the
Australian Fair Work Commission and became effective 28 January 2021.
• The Rosebery Mine celebrated 85 years of continuous operation In March 2021.
During 2020, Rosebery undertook a range of social performance activities, including
updating the Rosebery social baseline study, a Social Impact and Opportunities
Assessment, and development of a management plan to support future social
performance and impact management activities (SIMP). The final report has been
presented and the SIMP has been developed but a number of the actions have been
delayed due to limited interaction with the community during the COVID-19
restrictions.
Tailings • The table below outlines the expected tailing storage capacities available for the start
of 2021 at Bobadil and 2/5 Dam TSFs. The construction of the 2/5 Dam Stage 2 Raise
is starting in August 2021, with the expected completion date in October 2022.
Bobadil TSF Stage 10 Raise construction is expected to be completed at the end
2021, allowing for tailings to be distributed between the two TSF’s.
Location Tailings Capacity
(Mt)
Comment
Bobadil TSF – Stage 10 1.0 Forecast 2021 Completion

MMG | 2021 June Mineral Resources and Ore Reserves Statement - Appendix Page 148 of 205
Section 4 Estimation and Reporting of Ore Reserves
Criteria Commentary
Bobadil TSF – Stage 11 (FS) (0.8)
2/5 Dam TSF – Stage 1
- Subaerial
(0.5)
2/5 Dam TSF – Stage 2 2.0
Forecast 2022 completion
- Subaqueous
- Subaerial
2/5 Dam TSF – Stage 3
(1.2)
(0.8)
2/5 Dam TSF – Stage 3 (PFS)
- Subaerial
(1.2)
• The 2/5 Dam TSF is a subaqueous facility, but during the construction of Stage 2
Raise, the facility will be operated as a subaerial facility (Stage 1 subaerial) to allow
for the construction to take place. The intention is to continue with Subaerial
deposition after the Stage 2 Raise construction is completed, however, this is
awaiting approvals. The conversion to subaerial deposition will allow for a Stage 3
raise to be constructed if required.
• Bobadil Stage 11 Feasibility Study (FS) was completed in 2019 for a capacity of 0.8Mt.
The 2/5 Dam TSF Stage 3 Raise Pre-Feasibility Study (PFS) was completed in 2020,
for 1.2Mt after subaerial deposition (or 2Mt from subaqueous deposition).
• The current LOM is a collection of the approved, completed, PFS and FS with a total
capacity of 5.5Mt of tailings, at an estimated throughput of 0.8 Mtpa, providing
Rosebery with tailings capacity until the end of 2027.
• The table below details the current surface waste stockpiles, and lists those that
could be used for backfill activities before closure. Some waste rock dumps are
located under existing infrastructure, and may not be fully recoverable.
Estimate
(Tonnes)
Assumed Available*
(Tonnes)
TOTAL 2,410,000 1,590,000
Assumes available for backfill activities before closure, WRD location not impacting the required
infrastructure
Classification • Ore Reserve classifications follow the Mineral Resource classifications, where Proved
Ore Reserves are only derived from Measured Mineral Resources, and Probable Ore
Reserves are only derived from Indicated Mineral Resources.
• Portions of Inferred Mineral Resources have been included in the Ore Reserves, which
unavoidably reside within the stope shapes but are minor inclusions (less than 50%
by mass). These may be classified as either Proved or Probable Reserves.
• Portions of Indicated Mineral Resources have been included in the Proved Ore
Reserves if they unavoidably reside within the same stope shapes, but only if they
are minor inclusions (less than 50% by mass). The reverse of this situation also
applies, with some Measured Mineral Resources being unavoidably classified as
Probable Reserves.
• The Competent Person deems this approach is aligned with the JORC Code and is
appropriate for the classification of the Rosebery Ore Reserves.
• Where stopes contain more than one Mineral Resources category, then the individual
classification components have been treated and reported as outlined above.

MMG | 2021 June Mineral Resources and Ore Reserves Statement - Appendix Page 149 of 205
Section 4 Estimation and Reporting of Ore Reserves
Criteria Commentary
Audit or
Reviews
• The Processing and Mineral Resources competent person at Rosebery reviewed the
NSR script to ensure correct operation for each model. Detail has been added to the
script and a background document to track when and who has made changes. The
2021 NSR script was processed in the Vulcan software. In previous years the
DataMine software was used.
• Mineral Resources block models were validated during the design and evaluation
process.
• There has been an external audit carried out on the Ore Reserves process during
2018 for the 2017 Ore Reserve estimation. (AMC Consultants 20 July 2018). Below
overall comment from AMC;
• In November 2019, AMC carried out a review report for Rosebery’s Underground
Mine Performance. This utilised data spanning between January 2018 to July 2019.
The overall outcome was that the mine was operating satisfactorily along with
suggested areas of improvements to which the mine was already addressing.
• In 2021 MMG commenced an internal audit to review the Life of Mine (LOM) and
Life of Asset (LOA) schedules and assumptions towards mine design practices and
geotechnical aspects.
Discussion of
relative
accuracy/confi
dence
• The key risks that could materially change or affect the Ore Reserves estimate for
Rosebery include:
o Seismicity: The Rosebery mine has had several significant seismic events in the
past. Potential exists for future seismic events to occur that may impact on the
overall recovery of the Ore Reserves.
o Induced stress: the depth of mining at Rosebery leads to drive closure and
difficult mining conditions. This may impact the ability of Rosebery to extract
the ore reserves contained within sill pillars.
o Ventilation/Heat: as Rosebery continues to mine at depth and in multiple areas,
primary ventilation needs to be shared adequately and heat management
practices enforced. This may impact the extraction and haulage of ore and the
advancement of development.
• Resource Delineation & Reserve Definition drilling is applied to define tonnage and
grade before mining locally. Ore Reserves are based on all available relevant
information.
o The Proved Ore Reserve estimate is based on local scale exploration drilling and
mining exposure, and is suitable as a local estimate.
o The Probable Ore Reserve estimate is based on local and global scale
exploration drilling and mining exposure.
• Ore Reserve estimate accuracy and confidence that may have a material change in
modifying factors is as discussed throughout this table.
• The Ore Reserve estimate is based on the results of the operating mine. There is
confidence in the estimate compared with actual production data and historical
production reconciliations.

MMG | 2021 June Mineral Resources and Ore Reserves Statement - Appendix Page 150 of 205
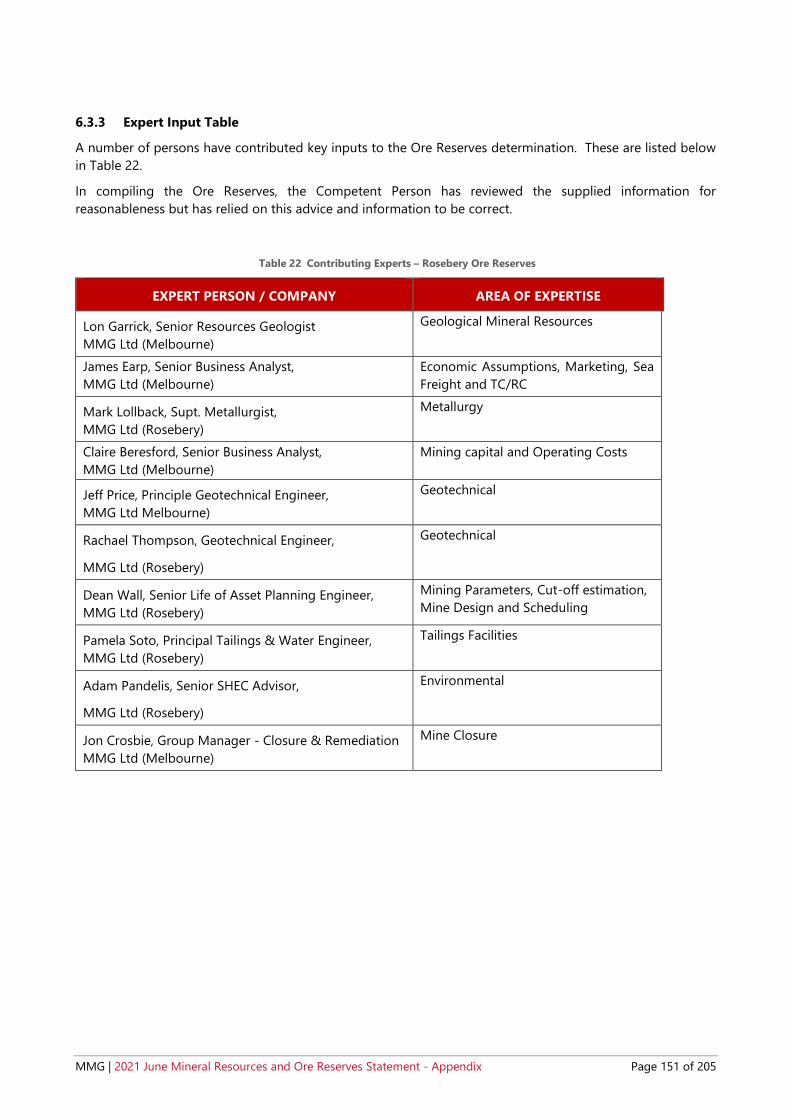
MMG | 2021 June Mineral Resources and Ore Reserves Statement - Appendix Page 151 of 205
6.3.3 Expert Input Table
A number of persons have contributed key inputs to the Ore Reserves determination. These are listed below
in Table 22.
In compiling the Ore Reserves, the Competent Person has reviewed the supplied information for
reasonableness but has relied on this advice and information to be correct.
Table 22 Contributing Experts – Rosebery Ore Reserves
EXPERT PERSON / COMPANY AREA OF EXPERTISE
Lon Garrick, Senior Resources Geologist
MMG Ltd (Melbourne)
Geological Mineral Resources
James Earp, Senior Business Analyst,
MMG Ltd (Melbourne)
Economic Assumptions, Marketing, Sea
Freight and TC/RC
Mark Lollback, Supt. Metallurgist,
MMG Ltd (Rosebery)
Metallurgy
Claire Beresford, Senior Business Analyst,
MMG Ltd (Melbourne)
Mining capital and Operating Costs
Jeff Price, Principle Geotechnical Engineer,
MMG Ltd Melbourne)
Geotechnical
Rachael Thompson, Geotechnical Engineer,
MMG Ltd (Rosebery)
Geotechnical
Dean Wall, Senior Life of Asset Planning Engineer,
MMG Ltd (Rosebery)
Mining Parameters, Cut-off estimation,
Mine Design and Scheduling
Pamela Soto, Principal Tailings & Water Engineer,
MMG Ltd (Rosebery)
Tailings Facilities
Adam Pandelis, Senior SHEC Advisor,
MMG Ltd (Rosebery)
Environmental
Jon Crosbie, Group Manager - Closure & Remediation
MMG Ltd (Melbourne)
Mine Closure

MMG | 2021 June Mineral Resources and Ore Reserves Statement - Appendix Page 152 of 205
6.3.4 Statement of Compliance with JORC Code Reporting Criteria and Consent to Release
This Ore Reserve statement has been compiled in accordance with the guidelines defined in the 2012 Edition
of the Australasian Code for Reporting of Exploration Results, Mineral Resources and Ore Reserves (“2012 JORC
Code”).
6.3.4.1 Competent Person Statement
I, Philip Uebergang, confirm that I am the Competent Person for the Rosebery Ore Reserve section of this
Report and:
I have read and understood the requirements of the 2012 Edition of the Australasian Code for Reporting
Ore Reserves (JORC Code, 2012 Edition).
I am a Competent Person as defined by the JORC Code, 2012 Edition, having five years’ experience that is
relevant to the style of mineralisation and type of deposit described in the Report, and to the activity for
which I am accepting responsibility.
I am a Member of The Australasian Institute of Mining and Metallurgy
I have reviewed the relevant Rosebery Ore Reserve section of this Report, to which this Consent Statement
applies.
I am a contractor to MMG as an employee of Ground Control Engineering Pty Ltd. at the time of the estimation.
I have disclosed to the reporting company the full nature of the relationship between myself and the company,
including any issue that could be perceived by investors as a conflict of interest.
I verify that the Rosebery Ore Reserve section of this Report is based on and fairly and accurately reflects in
the form and context in which it appears, the information in my supporting documentation relating to the
Rosebery Ore Reserve.
6.3.4.2 Competent Person Consent
Pursuant to the requirements Clause 9 of the JORC Code 2012 Edition (Written Consent Statement)
With respect to the sections of this report for which I am responsible – the Rosebery Ore Reserves - I consent
to the release of the 2021 Ore Reserves Statement as at 30 June 2021 Executive Summary and Technical
Appendix Report and this Consent Statement by the directors of MMG Limited:
_______________________________________________ ____________________________________________
Philip Uebergang MAusIMM (#202753) Date:
_______________________________________________ ____________________________________________
Signature of Witness: Witness Name and Residence: (e.g. town/suburb)
This signature was scanned for the exclusive use
in this document – the MMG Mineral Resource and Ore Reserve Statement as at 30 June 2021 – with
the author’s approval. Any other use is not
authorised.
This signature was scanned for the exclusive use in
this document – the MMG Mineral Resource and Ore Reserve Statement as at 30 June 2021 – with the
author’s approval. Any other use is not authorised.
01/10/2021
Dean Wall
Melbourne, VIC

MMG | 2021 June Mineral Resources and Ore Reserves Statement - Appendix Page 153 of 205
7 SOKOROSHE II
7.1 Introduction and Setting
The Sokoroshe II Project is located on the license PE538 in Democratic Republic of Congo, DRC. The PE538
tenement belongs to the DRC state owned mining company GECAMINES and is part of a package of 8
tenements granted to MMG under an amodiation agreement which became effective on 13 May 2014. The
project is situated in the South East part of the Congolese Copperbelt (CCB), located approximately 43Km
northwest of Lubumbashi and is approximately 25Km west of the Kinsevere mine as the crow flies (See Figure
7-1).
Figure 7-1 Sokoroshe II project location
There is currently no mining occurring at the Sokoroshe II mineral deposit, but it was illegally mined from
2010 to 2013 by a small-scale mining cooperative.
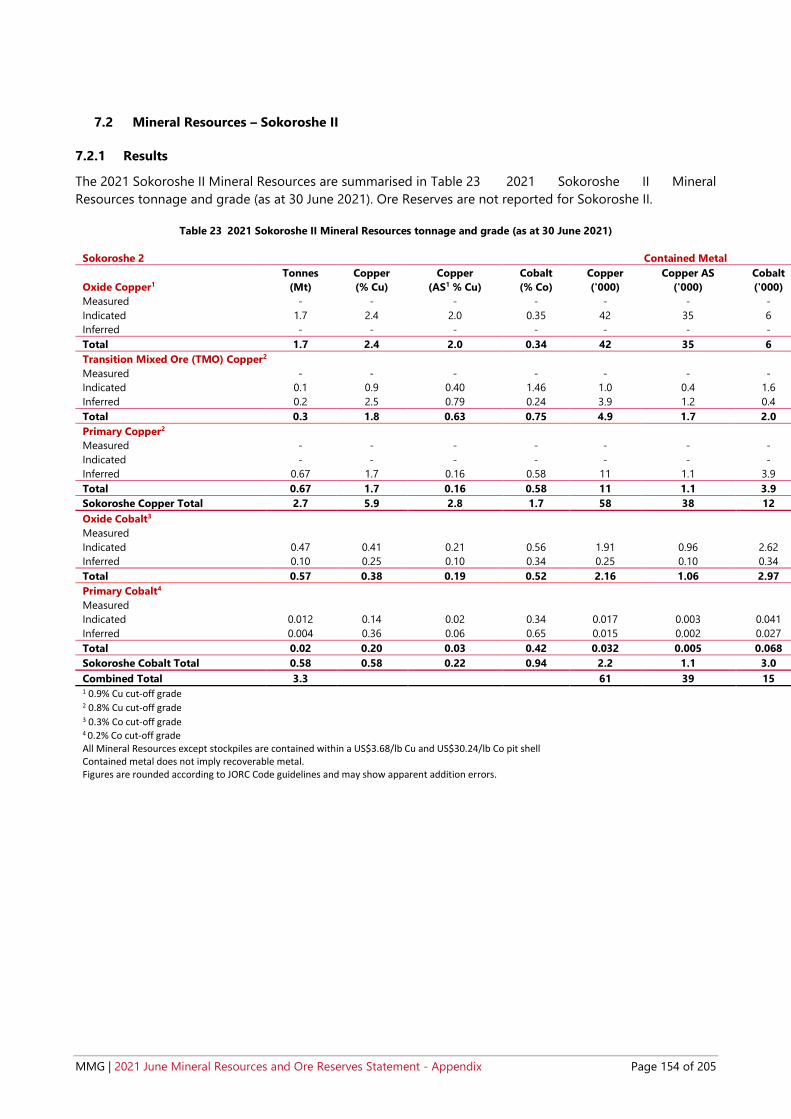
MMG | 2021 June Mineral Resources and Ore Reserves Statement - Appendix Page 154 of 205
7.2 Mineral Resources – Sokoroshe II
7.2.1 Results
The 2021 Sokoroshe II Mineral Resources are summarised in Table 23 2021 Sokoroshe II Mineral
Resources tonnage and grade (as at 30 June 2021). Ore Reserves are not reported for Sokoroshe II.
Table 23 2021 Sokoroshe II Mineral Resources tonnage and grade (as at 30 June 2021)
Sokoroshe 2 Contained Metal
Oxide Copper1
Tonnes
(Mt)
Copper
(% Cu)
Copper
(AS1 % Cu)
Cobalt
(% Co)
Copper
('000)
Copper AS
('000)
Cobalt
('000)
Measured - - - - - - -
Indicated 1.7 2.4 2.0 0.35 42 35 6
Inferred - - - - - - -
Total 1.7 2.4 2.0 0.34 42 35 6
Transition Mixed Ore (TMO) Copper2
Measured - - - - - - -
Indicated 0.1 0.9 0.40 1.46 1.0 0.4 1.6
Inferred 0.2 2.5 0.79 0.24 3.9 1.2 0.4
Total 0.3 1.8 0.63 0.75 4.9 1.7 2.0
Primary Copper2 Measured - - - - - - -
Indicated - - - - - - -
Inferred 0.67 1.7 0.16 0.58 11 1.1 3.9
Total 0.67 1.7 0.16 0.58 11 1.1 3.9
Sokoroshe Copper Total 2.7 5.9 2.8 1.7 58 38 12
Oxide Cobalt3
Measured
Indicated 0.47 0.41 0.21 0.56 1.91 0.96 2.62
Inferred 0.10 0.25 0.10 0.34 0.25 0.10 0.34
Total 0.57 0.38 0.19 0.52 2.16 1.06 2.97
Primary Cobalt4 Measured
Indicated 0.012 0.14 0.02 0.34 0.017 0.003 0.041
Inferred 0.004 0.36 0.06 0.65 0.015 0.002 0.027
Total 0.02 0.20 0.03 0.42 0.032 0.005 0.068
Sokoroshe Cobalt Total 0.58 0.58 0.22 0.94 2.2 1.1 3.0
Combined Total 3.3 61 39 15 1 0.9% Cu cut-off grade 2 0.8% Cu cut-off grade 3 0.3% Co cut-off grade 4 0.2% Co cut-off grade All Mineral Resources except stockpiles are contained within a US$3.68/lb Cu and US$30.24/lb Co pit shell Contained metal does not imply recoverable metal. Figures are rounded according to JORC Code guidelines and may show apparent addition errors.

MMG | 2021 June Mineral Resources and Ore Reserves Statement - Appendix Page 155 of 205
7.2.2 Mineral Resources JORC 2012 Assessment and Reporting Criteria
The following information provided in Table 24 complies with the 2012 JORC Code requirements specified by
“Table-1 Section 1-3” of the Code.
Table 24 JORC 2012 Code Table 1 Assessment and Reporting Criteria for Sokoroshe II Mineral Resource 2021
Section 1 Sampling Techniques and Data
Criteria Commentary
Sampling
techniques
• A combination of reverse circulation drilling (RC) and diamond drilling (DD) were
completed in the Project area.
• Mineralised zones within the drill core were identified based on combined parameters,
including lithological and alteration logging, mineralogical logging and systematic
spot pXRF readings.
• DD core was sampled nominally at 1m intervals within mineralised zones while
unmineralised zones were sampled at to 2m - 5.3m intervals. Sampling was carried
out by longitudinally cutting PQ and HQ drill core using an Almonte automatic
diamond saw and sampling half-core, with half-core retained for future reference. PQ
drill core was quartered and sampled. Three-quarters of the core was retained for
future reference.
• RC drill cuttings were collected in 1m bulk samples from a rig mounted cyclone.
Lithological and mineralogical logging, supported by systematic spot pXRF readings,
were used to identify mineralised and unmineralised zones in the RC chips. Samples
from mineralized zones were riffle split every 1m to obtain a representative (~2.5kg)
sample. Samples from unmineralised zones were riffle split and composited to 2m
intervals. Wet samples were sun dried in ambient air before splitting and compositing.
Overall, 81% of the samples were less than 2m, with mineralised samples taken at
nominal 1m intervals.
• Samples were crushed, split and pulverised (>85% passing 75 µm) at an onsite ALS
laboratory at the MMG core yard facility in Lubumbashi. 100 grams of pulp material
was sent to the SANAS accredited ALS Laboratories in Johannesburg.
• The sample types, nature, quality and sample preparation techniques are considered
appropriate for the nature of mineralisation within the Project (sediment hosted base
metal mineralisation) by the Competent Person.
Drilling
techniques
• Diamond drilling: PQ and HQ sizes, with triple tube to maximise recovery. At the end
of each drilling run the core was marked with an orientation mark by using a REFLEX
ACE tool. An orientation line was then drawn along the axis of the core if two
consecutive orientations marks could be aligned by docking core pieces.
• Reverse circulation drilling: A hammer bit was used for drilling a 5.25-inch (133mm)
diameter hole. The cyclone was manually cleaned at the start of each shift, after any
wet samples, and after each hole. Compressed air from the drilling machine was used
to clean/blow out material from the RC rods, hoses, and cyclone after each rod.
Drill sample
recovery
• DD core recovery was measured using tape measure, measuring actual core recovered
between the core block versus drilled interval. Measured accuracy was down to 1cm.
Overall DD core recovery averaged 85% across the Project area.
• RC chip recovery was measured by weighing each 1m sample bag immediately
following collection from the cyclone. Sample returns for RC drilling has been
calculated at 72%

MMG | 2021 June Mineral Resources and Ore Reserves Statement - Appendix Page 156 of 205
Section 1 Sampling Techniques and Data
Criteria Commentary
• Sample recovery during diamond drilling was maximised using the following methods:
o Short drill runs (~50cm)
o Using drilling additives, muds and chemicals to improve broken ground
conditions.
o Using the triple tube methodology in the core barrel.
o Reducing water pressure to prevent washout of friable material.
• Sample recovery during RC drilling was maximized using the following methods:
o Adjusting air pressures to the prevailing ground condition.
o Using new hammer bits and replacing when showing signs of wear.
• No relationship between sample recovery and grade was demonstrated in diamond
drilling drill results.
Logging • DD core and RC chips have been geologically logged and entered into the MMG
database (Geobank). The level of detail supports the estimation of Mineral Resources.
• Qualitative logging includes lithology, mineralisation type, oxidation type, weathering
type, colour and alteration types. Quantitative logging includes mineralisation mineral
percentage, alteration mineral percentage and in the case of core, RQD and structural
data have been recorded.
• All core and chip samples have been photographed (wet and dry).
• 100% of core and chips have been logged.
Sub-sampling
techniques
and sample
preparation
• DD core was split in half longitudinally (HQ size) or quartered (PQ size) using an
Almonte automatic diamond saw. Sample lengths were cut as close to nominal 1m
intervals as possible while also respecting geological contacts. Samples were generally
~2.5kg in weight.
• RC samples were collected from a cyclone every meter by a trained driller’s assistant.
If the sample was dry the sample was passed through a riffle splitter and a ~2.5kg split
was collected into a pre-numbered clear plastic bag. Residual material was sampled
and sieved for collection into chip trays for logging and the remainder returned to the
larger poly-weave bag (bulk reject). The splitter was cleaned using compressed air or
a clean brush and tapped using a rubber mallet. If the sample was wet, the sample
was sun and air dried before being split according to the above procedure. Field
duplicates were inserted at a rate of approximately 5% to ensure sampling precision
was measured.
• Samples from individual drillholes were sent in a single dispatch to the onsite ALS
laboratory at the MMG core yard facility in Lubumbashi.
• The drill core and drill chip samples are received, recorded on the sample sheet,
weighed, and dried at average temperature of 105◦C for 8 hours (or more) depending
on wetness at the sample preparation laboratory.
• Samples were crushed and homogenised in a jaw crusher to >70% passing 2mm. The
jaw crusher was cleaned with a barren quartz blank after every crushed sample. The
sample size was reduced to 1000g in a riffle splitter and pulverised in an LM2

MMG | 2021 June Mineral Resources and Ore Reserves Statement - Appendix Page 157 of 205
Section 1 Sampling Techniques and Data
Criteria Commentary
pulveriser to >85% passing 75 microns. QC grind checks were carried out using wet
sieving at 75 microns on 1 in 10 samples.
• 100 grams of pulp material were sent to the SANAS accredited ALS Chemex
Laboratories in Johannesburg.
• Crush and pulp duplicates were submitted for QAQC purposes. Certified reference
material (high, medium, and low copper grades) was also inserted and submitted to
ALS for analysis at a rate of 3 per 30 samples.
• The sample size is appropriate for the grain size and distribution of the minerals of
interest.
Quality of
assay data
and
laboratory
tests
• ALS Chemex Laboratory follows the preparation protocol PREP-31B for drill core and
drill chip samples.
• ALS Chemex Laboratory provides 48 Multi-Elements geochemical by HF-HNO3-
HClO4 acid digestion, HCl leach followed by ICP-AES and ICP-MS analysis. Four Acid
digest is considered a total digestion. Acid soluble copper assays were only performed
when the total copper assay was greater than 1,000 ppm.
• No geophysical tools, spectrometers (apart from those used in the assay laboratory)
or handheld XRF instruments have been used for the estimation of the Sokoroshe II
Mineral Resource.
• ~15% QAQC samples were incorporated, including blanks, duplicates (field, crush, and
pulp) and certified reference material per sample analysis batch. Umpires were
selected and analysed at Intertek Genalysis using similar methods as ALS Chemex.
Results indicate that assay analysis has been undertaken at an acceptable level of
accuracy and precision.
• No significant QAQC issues have been found. Standards deliver less than 2% relative
bias. Duplicate results show very good correlation against original results.
Verification of
sampling and
assaying
• Significant intercepts have been verified by comparison against the geological log,
which has been checked by several MMG personnel.
• Twin holes have been drilled on section 536860mE with comparable results being
returned for three closely spaced drill holes.
• Primary data is stored in a Geobank database, which is maintained according to MMG
database protocols. Data is logged, entered and verified in the process of data
management. Database is stored on MMG server and routinely backed up.
• No adjustment has been made to assay data.
Location of
data points
• Planned collar positions for both diamond drilling and RC drilling were located using
handheld GPS devices to ±5m accuracy.
• Post drilling, actual collar positions were surveyed using DGPS (Geomax Zenith 25 Pro
and Topcon Hiper II) and are considered to be of high accuracy.
• Sokoroshe II uses the projected coordinate system: WGS84 Universal Transverse
Mercator (UTM), ellipsoid 35 south.
• The TN14 GYROCOMPASS™ was used to align the drill rig to the correct azimuth and
dip angles.

MMG | 2021 June Mineral Resources and Ore Reserves Statement - Appendix Page 158 of 205
Section 1 Sampling Techniques and Data
Criteria Commentary
• Downhole surveys were done using the REFLEX EZ-TRAC survey instrument. Downhole
surveys were not carried out on RC drillholes. Azimuth and dip were extrapolated from
measurements taken from the surface using compass and clinometer.
• The surface Digital Terrain Model (DTM) for the Project was generated from the
Airborne Geophysics XCalibur surveys carried out in 2015. The dataset was found to
be adequate with topographic control to ±3m accuracy. High resolution DEM for the
Sokoroshe II pit area was surveyed with LiDAR technology in 2017.
Data spacing
and
distribution
• DD and RC drillholes were predominantly drilled with dips of between 50° and 60° to
intersect generally steeply dipping mineralisation.
• Drilling azimuths were as close as practical to orthogonal to the mineralised trend.
Drill hole data are spaced on approximately 40m (N-S oriented) drill sections with
holes on section spaced 40 to 70m.
• Additional drilling is required to satisfy local estimate of tonne and grades to a
Measured classification.
• No additional sample compositing has been applied apart from sample length
selection.
Orientation of
data in
relation to
geological
structure
• The orientation of sampling is across the mineral deposit and is considered to
represent unbiased sampling of the deposit. However, alternate drilling orientations
have not been undertaken to confirm this.
• No sampling bias is thought to have been introduced due to the relationship of
drilling orientation to key mineralised structures.
Sample
security
• Samples were transported from the field and delivered to the sample processing
facility in Lubumbashi for cutting and preparation. A single cab pick-up was used for
the transport. Polyethylene foam, tarpaulins, and cargo nets were used to secure the
load and to avoid possible shifting of core during transport.
• RC chip sampling was conducted in the field. Chip samples were packed in a labelled
plastic bag along with a labelled plastic ID tag.
• The plastic bag was tied with cable ties to secure the sample and to prevent
contamination.
• A set of 15 plastic sample bags were packed into labelled poly-weave bags, ready to
be shipped from the field to the sample preparation laboratory in Lubumbashi.
• Field packing documents and sample sheets were prepared and sent together with
the core trays and poly-weave bags to the sample preparation laboratory in
Lubumbashi.
• After sample preparation, bar-coded envelopes of 100-200g of pulp for each sample
were inserted into boxes of ~35 envelopes each, labelled with dispatch ID and
laboratory destination to be sent by DHL courier to ALS Chemex in Johannesburg.
• Two sets of duplicate pulps of 100-200g were inserted into labelled boxes of ~35
envelopes each to be stored on site in storage containers.
• The shipment of pulps from Lubumbashi to ALS laboratories was done using DHL
Courier services with waybill number for tracking.

MMG | 2021 June Mineral Resources and Ore Reserves Statement - Appendix Page 159 of 205
Section 1 Sampling Techniques and Data
Criteria Commentary
• The Lubumbashi sample preparation laboratory utilizes the ALS-Chemex LIM System
installed at Kinsevere mine site, generating a unique lab workorder for each batch
sample in the analytical chain.
Audit and
reviews
• No external audits or reviews of sampling techniques and data have been conducted
for the Sokoroshe II mineral deposit.
• Data has been reviewed by the Competent Person as part of this Mineral Resource
estimate. No significant issues were identified.
Section 2 Reporting of Exploration Results
Criteria Commentary
Mineral
tenement and
land tenure
status
• The Sokoroshe II project consists of one mining tenement or Permis d’Exploitation,
PE538, with an area of 6 cadastral units (about 5.1 Km2). The mineral rights of PE538
are held by La Générale des Carrierés et des Mines (Gécamines), the DRC state-owned
mining company. MMG rights to the tenement are granted under the terms of the
Mutoshi Swap Framework Agreement.
• MMG declared an Inferred Mineral Resource on 17 March 2017 to retain the lease
holding and transition it from a status of Exploration Period to Development Period
under the terms of the agreement. According to the agreement, the “Development
Period” shall start on the date on which the first Development Work Program has been
agreed between Gecamines and MMG Kinsevere (the Development Period start date).
The Development Period shall have a duration of 5 calendar years (1825 days) from
the Development Period start date. MMG Kinsevere must establish Proved Reserves
to achieve a viable economic exploitation of the deposits contained in the retained
permits viz. PE538 Sokoroshe 2. MMG Kinsevere submitted its first Development Work
Program to Gecamines for approval on 4 July 2017. Pursuant to clause 6.2.4(i),
Gecamines was provided with 30 days to express its comments or disagreement on
the first Development Work Program, which will then be deemed accepted in the
absence of receipt of comments or disagreement of Gecamines within this period.
MMG Kinsevere did not receive any comments or disagreement from Gecamines
within the 30-day period (or any following period). Accordingly, the first Development
Work Program was deemed accepted by Gecamines as from 4 August 2017 and the
Development Period Start Date was also 4 August 2017.
Exploration
done by other
parties
• Soil sampling on 120m x 120m grid and geology mapping were done in 1976 by
Gecamines. No data is available for this work.
• Ruashi Holdings/Metorex carried out unknown exploration work in 2005 at Sokoroshe
II. No data is available for this work.
Geology • A sediment-hosted copper deposit, hosted in the lower part of the Neoproterozoic
Katanga Supergroup in the Roan stratigraphic group.
• Copper mineralisation occurs mainly as oxide fill and replacement, veins and
disseminations in variably weathered, laminated dolomites and carbonaceous
siltstones.

MMG | 2021 June Mineral Resources and Ore Reserves Statement - Appendix Page 160 of 205
Section 2 Reporting of Exploration Results
Criteria Commentary
• Primary copper mineralogy comprises chalcopyrite, bornite, and chalcocite in
decreasing abundance. Oxide copper mineralogy comprises primarily malachite with
trace amounts of chrysocolla.
Drill hole
information
• All drillhole information has been considered in estimating the Mineral Resource, and
as this is a Mineral Resource report and not a public report of individual exploration
results a full listing of results is not provided here.
Data
aggregation
methods
• Several domains and variables have a restriction on grade for the estimate. Top cut
values are based on statistical analysis in effort to reduce the grade variation within
the domain and preventing uncontrolled grade smearing.
• No reporting of metal equivalent values has been undertaken.
Relationship
between
mineralisation
width and
intercept
lengths
• This is a Mineral Resource estimate and no down hole length intervals are reported
separately. All intervals have been considered within mineralised domains for the
estimation of grades within the Mineral Resource.
• Drill holes have been drilled on N-S sections at approximately 60o to the north.
Mineralisation is oriented with an E-W strike and dipping approximately 60o to the
south.
Diagrams
Figure 1: Sokoroshe II project location

MMG | 2021 June Mineral Resources and Ore Reserves Statement - Appendix Page 161 of 205
Section 2 Reporting of Exploration Results
Criteria Commentary
Figure 2: Geology map and drill hole locations for the Sokoroshe II project.
Figure 3: Sokoroshe II geology and copper & cobalt grade shells. The dashed line designated A – A’ is the location of
the cross section shown in the following figure

MMG | 2021 June Mineral Resources and Ore Reserves Statement - Appendix Page 162 of 205
Section 2 Reporting of Exploration Results
Criteria Commentary
Figure 4: Cross section through Sokoroshe II Cu-Co deposit at 536874mE showing:
a. Outline of the copper grade shell with downhole copper assays relative to geology and reporting pit.
b. Outline of the cobalt grade shell with downhole cobalt assays relative to geology and reporting pit.
c. Unified Cu-Co shell coloured by ore type with downhole CuAS:CuT ratio data relative to geology and reporting
pit.
d. Distribution of copper within the 2020 SokII MRE showing blocks > 0.4% CuT. Note* model has been regularised
Section view (537325mE) showing drilling and new Cobalt mineralisation based on the 2019
drill campaign
Figure 5: Section view (537325mE) showing drilling and new Cobalt mineralisation based on the 2019
drill campaign
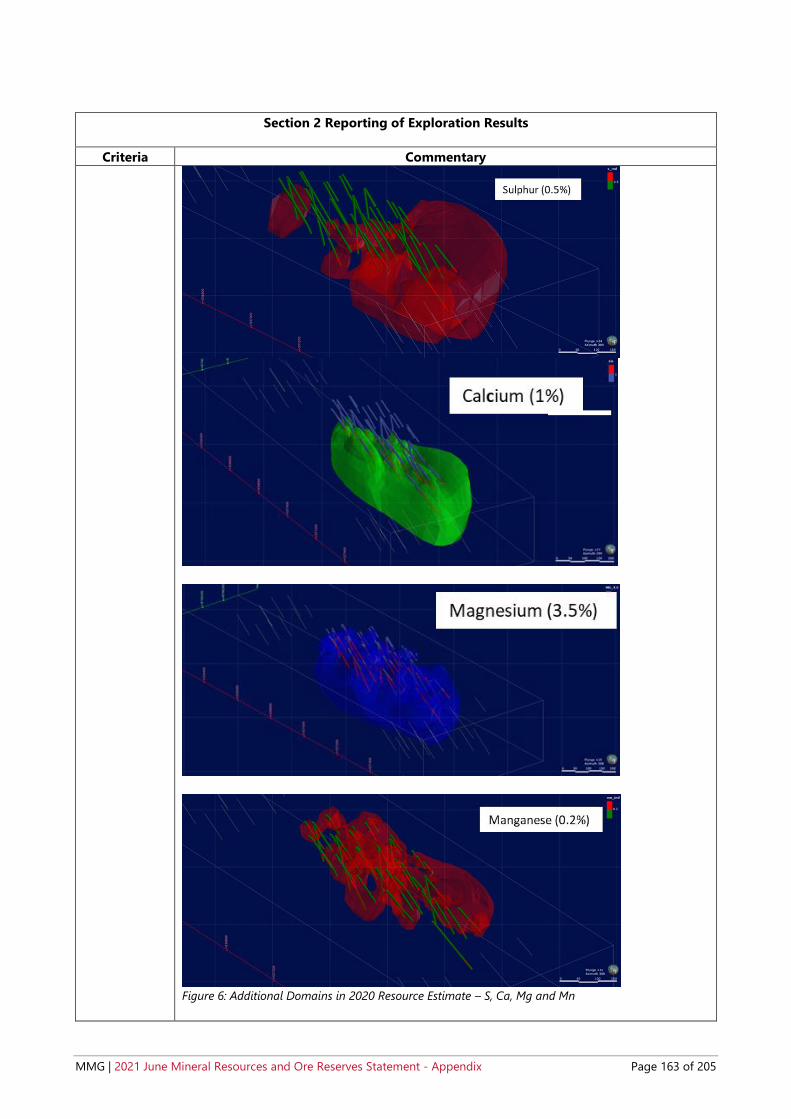
MMG | 2021 June Mineral Resources and Ore Reserves Statement - Appendix Page 163 of 205
Section 2 Reporting of Exploration Results
Criteria Commentary
Figure 6: Additional Domains in 2020 Resource Estimate – S, Ca, Mg and Mn

MMG | 2021 June Mineral Resources and Ore Reserves Statement - Appendix Page 164 of 205
Section 2 Reporting of Exploration Results
Criteria Commentary
Balanced
reporting
• This is a Mineral Resource estimate and not a report of exploration results.
• All drill holes and assay results have been considered in the construction of low- and
high-grade domains for the Sokoroshe II Mineral Resource estimate.
Other
substantive
exploration
data
• Airborne Geophysics - TEMPEST survey
• Airborne EM, magnetics, and radiometric were flown at the end of 2013. A channel 7
EM conductor was identified to the East of Sokoroshe II occurrence.
• Geological mapping was conducted in 2014. Mapping results indicated lithologies
from the Roan stratigraphic unit, the main host rock to the mineralization. Younger
lithologies were also noted from the Nguba and Kundelungu Formations.
• Surface geochemistry:
o Termite mound sampling on 100m x 100m grid was completed in 2014, which
effectively identified copper anomalous zones within the tenement.
o Airborne Geophysics - Xcalibur survey, flown in 2015
o Magnetics – effective at mapping structural and stratigraphic domains
o Radiometrics - effective at mapping lithological contrasts and regolith domains.
Further work • Further activities are planned from 2021 to 2023:
o A total of 9110m are planned to test the down dip and lateral extension of the
mineralization of the Southern Orebody. Detailed mining and investment studies
have been ongoing in 2021.

MMG | 2021 June Mineral Resources and Ore Reserves Statement - Appendix Page 165 of 205
Section 3 Estimating and Reporting of Mineral Resources
Criteria Commentary
Database
integrity
• The MMG Exploration database systems are SQL server and GBis/GeoBank
management software. All geological and analytical data are managed in MMG’s
Corporate Geoscience Database. GIS data are stored in secure shared folders on the
Lubumbashi server.
• All data capture via GM logging profiles having strong internal validation criteria. The
technician/geologist conducts first validation steps by checking intervals, description
and accuracy of records on their respective tough books.
• Validation rules are predefined in each of the database tables. Only valid codes get
imported into the database.
• The sampling and geochemical data are stored in a local version of SQL database that
gets replicated to a similar version on the Head Office server with daily, weekly and
monthly backups.
Site visits • The Competent Person visited the Sokoroshe II site in February 2018 and has visited
the Kinsevere deposit and several other oxide copper deposits in the Katanga
province, which are also similar in style to the Sokoroshe II mineral deposit.
Geological
interpretation
• There is reasonable confidence in the interpretation of geology which forms the
domains used in the Mineral Resource estimate.
• Geological interpretation of the mineral deposit is based on available drilling and
reports of observed geology and structure at surface. Infill drilling has confirmed the
previous geological interpretation.
• Interpreted geology domains have been used to constrain blocks and grades in the
model used for Mineral Resource estimation.
Dimensions • Mineralisation is interpreted to be up to 650m along strike, 180m down dip and 30m
thick. Actual dimensions are expected to vary.
Estimation
and modelling
techniques
• The estimation method is considered appropriate for oxide and transitional copper
mineralisation at Sokoroshe II. The method included Ordinary Kriging for the
estimation of Cu, CuAS, and Ratio (CuAS/Cu) within hard boundaries for copper
domains, where Cu > 0.4%. Maptek Vulcan software was used for estimation.
Quantitative Kriging neighbourhood analysis was applied for the selection of
estimation parameters. A minimum of 4 and maximum of 16 sample composites of
1m length were used. Search neighbourhood was an ellipse with orientation
comparable to geological domains having a major distance of 100 metres, semi major
distance of 100 metres and minor distance of 30 metres, for the first pass. Samples
were composited to 1m interval, which is the same as the nominal sample spacing in
mineralised rock. Discretisation was set to 8x4x4 (x, y, z). Fe and U were included
within Copper domains. Based on drilling during 2019, separate domains were
developed for Cobalt, where Co > 0.1%, and similar estimation parameters, as used
for copper, were utilised.
• Al, Ca, Mg, Mn and S have also been estimated using Ordinary Kriging within
individual hard boundary created using Leapfrog software. The variograms were
individually calculated and modelled using Isatis software and Estimate parameters
set up accordingly.
• Check estimates were undertaken as basic dimensions multiplied by the density to
give tonnes and grades reported from declustered statistics. In addition, a basic

MMG | 2021 June Mineral Resources and Ore Reserves Statement - Appendix Page 166 of 205
Section 3 Estimating and Reporting of Mineral Resources
Criteria Commentary
sectional estimate was conducted prior to block modelling. All results were found to
be comparable.
• No assumed by-product recovery was applied; however, ratio between CuAS and Cu
estimated in the block model.
• Block model is not rotated with block size was 20mE by 10mN by 10mRL with sub-
blocking to 5mE by 2.5mN by 2.5mRL. The block size provides a reasonable
representation of the interpreted mineralised domains. Block size is less than the drill
hole spacing of approximately 40m sections with holes spaced 40 metres on section.
However, samples are spaced at approximately 1 metre intervals down hole.
• Selective mining units have not been modelled.
• No assumptions have been made about correlation of variables
• Geological interpretation is represented by lithological triangulations that have been
used for the construction of block model domains and selection of sample
composites, and used for coding of Bulk Density values
• No grade cutting or capping was applied for mineralised domains Cu and CuAs;
although grade distributions for are positively skewed but the coefficient of variation
is low (0.86) and arguably no grade restriction is required. However, grade capping
was applied to waste domain and several variable such Co Mg and Mn to control the
influence of outlier values into block estimates.
• Block model domains were compared against domain wireframes and found to be
suitably constructed. Estimated block grades were compared against drill hole grades
on sections and plans and found to be comparable. Statistics for composite samples
and blocks were also compered and found to be comparable.
Moisture • Estimated tonnes are on a dry basis.
Cut-off
parameters
• The Mineral Resource has been reported above a total copper cut-off grade of 0.8%.
Additional cobalt Mineral Resource (outside of the copper cut-off of 0.8%), has been
reported above a total cobalt cut-off grade of 0.2%.
• The reported Mineral Resources have also been constrained within a US$3.62/lb
copper and US$25.79/lb cobalt whittle pit shell. The reporting cut-off grade and the
pit-shell price assumption are in line with MMG’s policy on reporting of Mineral
Resources which is prospective for future economic extraction.
Mining factors
or
assumptions
• The mining method is assumed to be open pit with trucks and excavators.
Metallurgical
factors or
assumptions
• Sokoroshe II ore is intended to be processed at Kinsevere Mine shortly after the
implementation of the Kinsevere Expansion Project (currently pending board
approval).
• Sokoroshe II ore is relatively simple in composition (malachite with minor
chalcocite/bornite) and very similar to the oxides and transitional sulphides present at
Kinsevere.

MMG | 2021 June Mineral Resources and Ore Reserves Statement - Appendix Page 167 of 205
Section 3 Estimating and Reporting of Mineral Resources
Criteria Commentary
• At this stage of project development metallurgical recovery assumptions are based
on KEP recoveries.
• As such, the criteria impacting the resource cut-off grades and reportable pit shell
inputs are based on the proposed Kinsevere Expansion Project (KEP) flowsheet and
infrastructure upgrades. The upgraded flowsheet will consist of the following changes:
- Oxide pre-flotation circuit and leach tank modifications 2.2Mtpa
- Oxide leach upgrades to convert to reductive leach conditions
-Sulphide Concentrator 2.2Mtpa capacity
-Roaster circuit including off-gas cleaning, acid plant and concentrate storage
-Cobalt Recovery circuit to produce high grade Cobalt hydroxide
-SX plant modifications
• The estimated plant recoveries are as follows:
* ASCu refers to the sulphuric acid soluble portion of copper content within the sample mass*
‘Ratio’ refers to the ratio of ASCu:TCu
Environmental
factors or
assumptions
• Environmental factors include increased land surface disturbance and required
rehabilitation for this site, including final pit excavation and waste rock storage. All
ore piles are expected to be transported to Kinsevere for treatment.

MMG | 2021 June Mineral Resources and Ore Reserves Statement - Appendix Page 168 of 205
Section 3 Estimating and Reporting of Mineral Resources
Criteria Commentary
Bulk density • Bulk density measurements have been undertaken using weight in air and weight in
water. The samples measured have also included wax immersion to prevent over
estimation due to the porous nature of oxide samples. Samples are also oven dried
prior to measurement.
• However, at this point the number of bulk density data is not sufficient for
interpolation. Investigation of results shows that insufficient information was collected
for the weathered CMN and LOB stratigraphic units. This was due to the material being
too friable for collecting reliable bulk density measurements. As a result, data from
correlative stratigraphy in Nambulwa and DZ was considered, as well as information
from the Anvil bulk sampling program published in the Anvil NI43-101 report. The
Table below shows the bulk densities assigned to each of the weathered and fresh
correlatives of the stratigraphic successions hosting Sokoroshe II mineralisation. The
block model was flagged by weathering and geology domains with each assigned the
relevant bulk density.
• Bulk Density Values used for the Sokoroshe II 2020 Mineral Resource Model

MMG | 2021 June Mineral Resources and Ore Reserves Statement - Appendix Page 169 of 205
Section 3 Estimating and Reporting of Mineral Resources
Criteria Commentary
Classification • The entire Sokoroshe II Mineral Resource has been classified as Indicated and Inferred
and is supported by drill hole spacing and variogram analysis.
• The classification also takes into account the spatial distribution of data as well as
estimation metrics including kriging variance and kriging slope of regression.
• The classification is supported by the Competent Persons view of the deposit and the
available data.
Figure 7: Indicated and Inferred Material – within reporting Mineral Resource Whittle Pit Shell
Audits or
reviews
• No external audits or reviews of this Mineral Resource estimate have been undertaken.
Discussion of
relative
accuracy/
confidence
• Mineral Resource Classification of Indicated and Inferred material is supported by
additional infill drilling and geostatistical analysis including variograms that produce
ranges less than the drill spacing and low values for Kriging slope of regression and
Kriging efficiency along with high Kriging variance.
• The review of tonnage accuracy is required since the bulk density has been assigned
from various sources, due to friable nature of the majority of sample collected at site.
• The estimate relates to global estimation and is not suitable as a local estimate.
Additional drilling is required before a local estimate can be delivered.
• No production data is available for comparison.

MMG | 2021 June Mineral Resources and Ore Reserves Statement - Appendix Page 170 of 205
7.2.3 Statement of Compliance with JORC Code Reporting Criteria and Consent to Release
This Mineral Resource statement has been compiled in accordance with the guidelines defined in the 2012
Edition of the Australasian Code for Reporting of Exploration Results, Mineral Resources and Ore Reserves
(“2012 JORC Code”).
7.2.3.1 Competent Person Statement
I, Samson Malenga, confirm that I am the Competent Person for the Sokoroshe II Mineral Resource section of
this Report and:
I have read and understood the requirements of the 2012 Edition of the Australasian Code for Reporting
of Exploration Results, Mineral Resources and Ore Reserves (JORC Code, 2012 Edition).
I am a Competent Person as defined by the JORC Code, 2012 Edition, having five years’ experience that is
relevant to the style of mineralisation and type of deposit described in the Report, and to the activity for
which I am accepting responsibility.
I am a Fellow Member of The Geological Society of South Africa Reg No. 965948 and I am a Registered
Professional Natural Scientist with the South African Council for Natural Scientific Professions (SACNASP)
– Reg No 400181/06.
I have reviewed the relevant Sokoroshe II Mineral Resource section of this Report to which this Consent
Statement applies.
I am a full-time employee of MMG Limited at the time of the estimation.
I have disclosed to the reporting company the full nature of the relationship between myself and the company,
including any issue that could be perceived by investors as a conflict of interest.
I verify that the Sokoroshe II Mineral Resource section of this Report is based on and fairly and accurately
reflects in the form and context in which it appears, the information in my supporting documentation relating
to the Sokoroshe II Resources.
7.2.3.2 Competent Person Consent
Pursuant to the requirements Clause 9 of the JORC Code 2012 Edition (Written Consent Statement)
With respect to the sections of this report for which I am responsible – the Sokoroshe II Mineral Resources - I
consent to the release of the 2021 Mineral Resources and Ore Reserves Statement as at 30 June 2021 Executive
Summary and Technical Appendix Report and this Consent Statement by the directors of MMG Limited:
_______________________________________________ Date:____________________________________________
Samson Malenga, BSc. Hons (Geol.),MBL, Pr.Sci.Nat, FGSSA
_______________________________________________ ____________________________________________
Signature of Witness: Witness Name and Residence: (e.g. town/suburb)
This signature was scanned for the exclusive use
in this document – the MMG Mineral Resource and Ore Reserve Statement as at 30 June 2021 – with
the author’s approval. Any other use is not
authorised.
This signature was scanned for the exclusive use in
this document – the MMG Mineral Resource and Ore Reserve Statement as at 30 June 2021 – with the
author’s approval. Any other use is not authorised.
8/10/2021
Serge Djemo
Lubumbashi, DRC

MMG | 2021 June Mineral Resources and Ore Reserves Statement - Appendix Page 171 of 205
8 MWEPU
8.1 Introduction and Setting
The Mwepu Project is located within lease PE1052 in Democratic Republic of Congo, DRC. From the Kinsevere
copper (Cu) mine, the Project is located some 40km to the SW (Figure 8-1).
Figure 8-1 Mwepu project location
The lease belongs to the DRC state owned mining company GECAMINES and was granted to MMG under a 3-
year exploration agreement which became effective in March 2017. A 2-year extension to this agreement was
granted by GECAMINES in late 2019, extending the term of the agreement to March 2022.
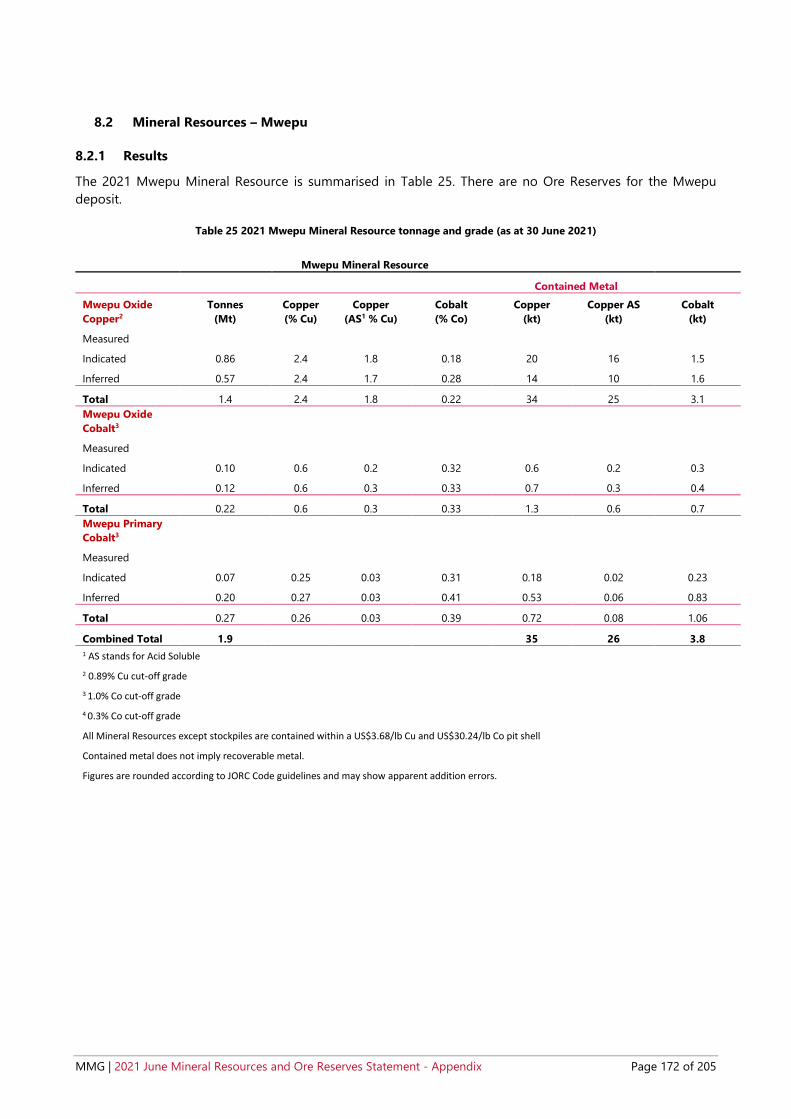
MMG | 2021 June Mineral Resources and Ore Reserves Statement - Appendix Page 172 of 205
8.2 Mineral Resources – Mwepu
8.2.1 Results
The 2021 Mwepu Mineral Resource is summarised in Table 25. There are no Ore Reserves for the Mwepu
deposit.
Table 25 2021 Mwepu Mineral Resource tonnage and grade (as at 30 June 2021)
Mwepu Mineral Resource
Contained Metal
Mwepu Oxide
Copper2
Tonnes
(Mt)
Copper
(% Cu)
Copper
(AS1 % Cu)
Cobalt
(% Co)
Copper
(kt)
Copper AS
(kt)
Cobalt
(kt)
Measured
Indicated 0.86 2.4 1.8 0.18 20 16 1.5
Inferred 0.57 2.4 1.7 0.28 14 10 1.6
Total 1.4 2.4 1.8 0.22 34 25 3.1
Mwepu Oxide
Cobalt3
Measured
Indicated 0.10 0.6 0.2 0.32 0.6 0.2 0.3
Inferred 0.12 0.6 0.3 0.33 0.7 0.3 0.4
Total 0.22 0.6 0.3 0.33 1.3 0.6 0.7
Mwepu Primary
Cobalt3
Measured
Indicated 0.07 0.25 0.03 0.31 0.18 0.02 0.23
Inferred 0.20 0.27 0.03 0.41 0.53 0.06 0.83
Total 0.27 0.26 0.03 0.39 0.72 0.08 1.06
Combined Total 1.9 35 26 3.8
1 AS stands for Acid Soluble
2 0.89% Cu cut-off grade
3 1.0% Co cut-off grade
4 0.3% Co cut-off grade
All Mineral Resources except stockpiles are contained within a US$3.68/lb Cu and US$30.24/lb Co pit shell
Contained metal does not imply recoverable metal.
Figures are rounded according to JORC Code guidelines and may show apparent addition errors.

MMG | 2021 June Mineral Resources and Ore Reserves Statement - Appendix Page 173 of 205
8.2.2 Mineral Resources JORC 2012 Assessment and Reporting Criteria
The following information provided in Table 26 complies with the 2012 JORC Code requirements specified by
“Table-1 Section 1-3” of the Code.
Table 26 JORC 2012 Code Table 1 Assessment and Reporting Criteria for the Mwepu Mineral Resources 2021
Section 1 Sampling Techniques and Data
Criteria Commentary
Sampling
techniques
• A combination of reverse circulation drilling (RC) and diamond drilling (DD) was
completed at the Mwepu Project.
• Mineralized zones within the drill core were identified based on a combination of
lithological, mineralogical, and alteration logging, along with systematic spot pXRF
readings.
• DD core was sampled nominally at 1m intervals within mineralized zones while
unmineralized zones were sampled at up to 2-4m intervals. Sampling was carried out
by longitudinally cutting PQ and HQ drill core using an Almonte automatic diamond
saw. HQ drill core was cut into halves, with half-core retained for future reference. PQ
drill core was quartered and sampled with three-quarters of the core retained for
future reference.
• RC drill cuttings were collected in 1m bulk samples from a rig mounted cyclone.
Lithological and mineralogical logging, along with systematic spot pXRF readings,
were used to differentiate mineralized and unmineralized zones. Samples from
mineralized zones were manually riffle split every 1m to obtain a representative
(~2.5kg) sample. Samples from unmineralized zones were riffle split and composited
to 2m intervals. Wet samples were dried in ambient air before splitting and
compositing.
• 70% of the samples were collected as 1m intervals and 30% were collected as 2m
intervals.
• Samples were crushed, split and pulverized (>85% passing 75 µm) at an ALS
laboratory located at the MMG core yard facility in Lubumbashi. 100 grams of pulp
material was sent to the SANAS accredited ALS Laboratories in Johannesburg.
• The sample types, nature, quality and sample preparation techniques are considered
appropriate for the nature of mineralization within the Project (sediment hosted base
metal mineralization) by the Competent Person.
Drilling
techniques
• Diamond drilling: PQ and HQ core sizes with triple tube to maximize recovery. At the
end of each drilling run the core was marked with an orientation mark by using a
REFLEX ACE tool. An orientation line was then drawn along the axis of the core if two
consecutive orientations marks could be aligned by docking core pieces.
• Reverse circulation drilling: A hammer bit was used for drilling a 5.25-inch (133mm)
diameter hole. The cyclone was manually cleaned at the start of each shift, after any
wet samples, and after each hole. Compressed air from the drilling machine was used
to clean/blow out material from the RC rods, hoses, and cyclone after each rod.
Drill sample
recovery
• Overall DD core recovery averaged 85% across the Project area. As expected, the
recovery dropped in unconsolidated/highly weathered ground. Above 50m, core
recovery averaged 77%, and below 50m, core recovery averaged 87%.
MMG | 2021 June Mineral Resources and Ore Reserves Statement - Appendix Page 174 of 205
Section 1 Sampling Techniques and Data
Criteria Commentary
• Actual vs. recovered drilling lengths were captured by the driller and an onsite rig
technician using a measuring tape. Measured accuracy was down to 1cm. The core
recoveries were calculated in a digital database during export.
• Sample recovery during diamond drilling was maximized using the following
methods:
o Short drill runs (maximum 1.5m)
o Using drilling additives, muds and chemicals to improve broken ground
conditions.
o Using the triple tube methodology in the core barrel.
o Reducing water pressure to prevent washout of friable/unconsolidated material
• Drilling rates varied depending on the actual and forecast ground conditions
• Core loss was recorded at the rig and assigned to intervals where visible loss occurred.
Cavities were noted.
• Bias due to core loss has not been determined.
• RC cuttings recovery was measured by weighing each 1m sample bag immediately
following collection from the cyclone.
• Sample returns for RC drilling have been calculated at 68% recovery.
• Sample recovery during RC drilling was maximized using the following methods:
o Adjusting air pressures to the prevailing ground condition.
o Using new hammer bits and replacing when showing signs of wear.
Logging • All drill samples (DD core and RC chips) were geologically logged using a GeoBank®
Mobile interface and uploaded to a central Geobank® database.
• Qualitative logging includes lithology, mineralization type, oxidation type, weathering
type, color and alteration types. Quantitative logging includes mineralization mineral
percentage, alteration mineral percentage and in the case of core, RQD and structural
data have been recorded.
• All the core and chip samples were photographed both wet and dry.
• 100% of core and chips have been logged with the above information.
Sub-sampling
techniques
and sample
preparation
• DD core was split in half longitudinally (HQ size) or quartered (PQ size) using an
Almonte automatic diamond saw.
• Sample lengths were cut as close to nominal 1m intervals as possible while also
respecting geological contacts. Samples were generally ~2.5kg in weight.
• RC samples were collected from a cyclone every meter by a trained driller’s assistant.
If the sample was dry the sample was passed through a riffle splitter and a ~2.5kg split
was collected into a pre-numbered calico bag. Residual material was sampled and
sieved for collection into chip trays for logging and the remainder returned to a larger
poly-weave bag (bulk reject). The splitter was cleaned using compressed air or a clean
brush and tapped using a rubber mallet. If the sample was wet, the sample was air
dried before being split according to the above procedure.
• For RC drilling, field duplicates were inserted at a rate of approximately 5% to ensure
sampling precision was measured.
MMG | 2021 June Mineral Resources and Ore Reserves Statement - Appendix Page 175 of 205
Section 1 Sampling Techniques and Data
Criteria Commentary
• Samples from individual drillholes were sent in a single dispatch to the onsite ALS
laboratory at the MMG core yard facility in Lubumbashi.
• Samples were received, recorded on the sample sheet, weighed, and dried at 105°C
for 4 to 8 hours (or more), depending on dampness, at the sample preparation
laboratory.
• Samples were crushed and homogenized in a jaw crusher to >70% passing 2mm. The
jaw crusher was cleaned with a barren quartz blank after every crushed sample.
• The sample size was reduced to 1kg in a riffle splitter and pulverized in an LM2
pulverize to >85% passing 75 microns. QC grind checks were carried out using wet
sieving at 75 microns on 1 in 10 samples.
• 100 grams of pulp material were sent to the SANAS accredited ALS Laboratories in
Johannesburg.
• Crush and pulp duplicates were submitted for QAQC purposes.
• Certified reference materials (high, medium, and low copper grades) were also
inserted and submitted to ALS for analysis at a rate of 3 per 30 samples.
• The sample size is appropriate for the grain size and distribution of the minerals of
interest.
Quality of
assay data
and
laboratory
tests
• All samples were sent to ALS Chemex Laboratory in Johannesburg
• Samples were analyzed using a 4-acid digest with ICP MS finish. 48 elements were
analyzed in total.
• Acid soluble copper assays were only performed when the total copper assay was
greater than 1,000 ppm.
• ~15% QAQC samples were incorporated, including blanks, duplicates (field, crush, and
pulp) and certified reference material per sample analysis batch.
• QAQC data have been interrogated with no significant biases or precision issues.
Several acid soluble values of Cu and Co were higher than the Total Copper values.
Lab investigations and re-analyses were completed – all issues were addressed and
rectified and re-assay results accepted.
Verification of
sampling and
assaying
• Significant intersections have been reviewed by competent MMG employees.
• No twin drilling was completed.
• Data are stored in a SQL database with a Geobank® interface.
• No adjustments to assay data were made.
Location of
data points
• Planned collar positions for both diamond drilling and RC drilling were located using
handheld GPS devices to ±5m accuracy.
• Post-drilling, actual collar positions were surveyed using DGPS (Geomax Zenith 25 Pro
and Topcon Hiper II) and are of high accuracy.
• Grid system is in WGS84/UTM35S
• The TN14 GYROCOMPASS™ was used to align the drill rig to the correct azimuth and
dip angles.

MMG | 2021 June Mineral Resources and Ore Reserves Statement - Appendix Page 176 of 205
Section 1 Sampling Techniques and Data
Criteria Commentary
• Downhole surveys were done using the REFLEX EZ-TRAC survey instrument. Downhole
surveys were not carried out on RC drillholes.
• All survey data was approved by the site geologist and stored in the IMBEXHUB-IQ
cloud.
Data spacing
and
distribution
• Drilling sections are spaced at nominally ~50m or ~100m. Down dip drill hole spacing
is nominally ~50m.
• 2m or 4m composites were taken in zones of no visual mineralization.
• Nominal 1m samples were taken in zones of mineralization.
• No other sample compositing has been undertaken.
Orientation of
data in
relation to
geological
structure
• DD and RC drillholes were mainly drilled with dips of between -48° and -55° to
intersect generally steeply dipping mineralization. Drilling azimuths were as close as
practical to orthogonal to the mineralized trend.
• In the view of the Competent Person, no bias has been introduced by the drilling
direction.
Sample
security
• Samples were transported from the field and delivered to the sample processing facility
in Lubumbashi for cutting and preparation. Polyethylene foam, tarpaulins, and cargo
nets were used to secure the load and to avoid possible shifting of core during
transport.
• RC chip sampling was conducted in the field. Chip samples were packed in a labelled
plastic bag along with a labelled plastic ID tag.
• The plastic bag was tied with cable ties to secure the sample and to prevent
contamination.
• A set of 15 plastic sample bags were packed into labelled poly-weave bags, ready to
be shipped from the field to the sample preparation laboratory in Lubumbashi.
• Field packing documents and sample sheets were prepared and sent together with the
core trays and poly-weave bags to the sample preparation laboratory in Lubumbashi.
• After sample preparation, bar-coded envelopes of 100-200g of pulp for each sample
were inserted into boxes of ~40 envelopes each, labelled with dispatch ID and
laboratory destination to be sent by DHL courier to ALS Chemex in Johannesburg.
• Two sets of duplicate pulps of 100-200g were inserted into labelled boxes of ~40
envelopes each to be stored on site in storage containers.
• The shipment of pulps from Lubumbashi to ALS laboratories was done using DHL
Courier services with waybill number for tracking.
• The Lubumbashi sample preparation laboratory utilizes the ALS-Chemex LIM System
installed at Kinsevere mine site, generating a unique lab workorder for each batch
sample in the analytical chain.
Audit and
reviews
• No external audits or reviews of sampling techniques and data have been conducted.

MMG | 2021 June Mineral Resources and Ore Reserves Statement - Appendix Page 177 of 205
Section 2 Reporting of Exploration Results
Criteria Commentary
Mineral
tenement and
land tenure
status
• The Mwepu Project is located within lease PE1052 in the DRC. The lease belongs to
the DRC state owned mining company GECAMINES and was granted to MMG under
a 3-year exploration agreement which became effective in March 2017. A 2-year
extension to this agreement was granted by GECAMINES in late 2019, extending the
term of the agreement to March 2022. The Exploration and project study teams are
currently in the process of compiling the Feasibility Study report to be submitted to
GECAMINES. The report is a requirement for a decision to be made to extend the term
of the agreement beyond March 2022.
Exploration
done by other
parties
• Union Miniere (UMHK) first explored the Mwepu Project in 1925, attempting to define
the stratigraphy and the tectonic framework of the area.
• In 1966, UMHK produced a sketch geology map at 100,000 scale of a region which
included the Mwepu tenement. This survey identified the presence of an NW trending
anticline, comprised of Roan stratigraphy.
Geology • Sedimentary hosted copper and cobalt.
• Mineralization is hosted by the Neoproterozoic Katanga Supergroup within the R3
(Kansuki formation) stratigraphy.
• Copper mineralization is both lithologically and structurally controlled and occurs
predominantly within weathered dolomites and breccia.
• Oxide copper mineralogy includes malachite and copper bearing clays. Oxide cobalt
is often associated with Mn-Fe rich clays.
• Sulphide copper mineralogy includes chalcocite with minor chalcopyrite and bornite.
Sulphide mineralisation occurs below the base of oxidation and does not contribute
significantly to the copper resource.
Drill hole
information
• A complete listing of all drillhole information on the Mwepu Project is provided in
Table 2 below.
Data
aggregation
methods
• Significant copper intersections were reported at a 0.5% total Cu cut-off at a minimum
width of 3m, with up to 3m internal dilution permitted.
• Significant cobalt intersections were reported at a 0.2% total Co cut-off at a minimum
width of 3m, with up to 3m internal dilution permitted.
Relationship
between
mineralisation
width and
intercept
lengths
• All original exploration results were reported in drilled lengths and should not be
considered as true widths of the mineralized zones. This was due to a significant
degree of inherent complexity and the low level of understanding of the geological
model at the time. However, with recent increases of understanding in the geological
model, all future drilling intercepts can be reported as true widths.

MMG | 2021 June Mineral Resources and Ore Reserves Statement - Appendix Page 178 of 205
Section 2 Reporting of Exploration Results
Criteria Commentary
Diagrams
• Collar locations for Mwepu resource delineation drilling.

MMG | 2021 June Mineral Resources and Ore Reserves Statement - Appendix Page 179 of 205
Section 2 Reporting of Exploration Results
Criteria Commentary
Mwepu geology and copper & cobalt grade shells. The dashed line designated A – A’ is the location of
the cross section shown in the following figure.
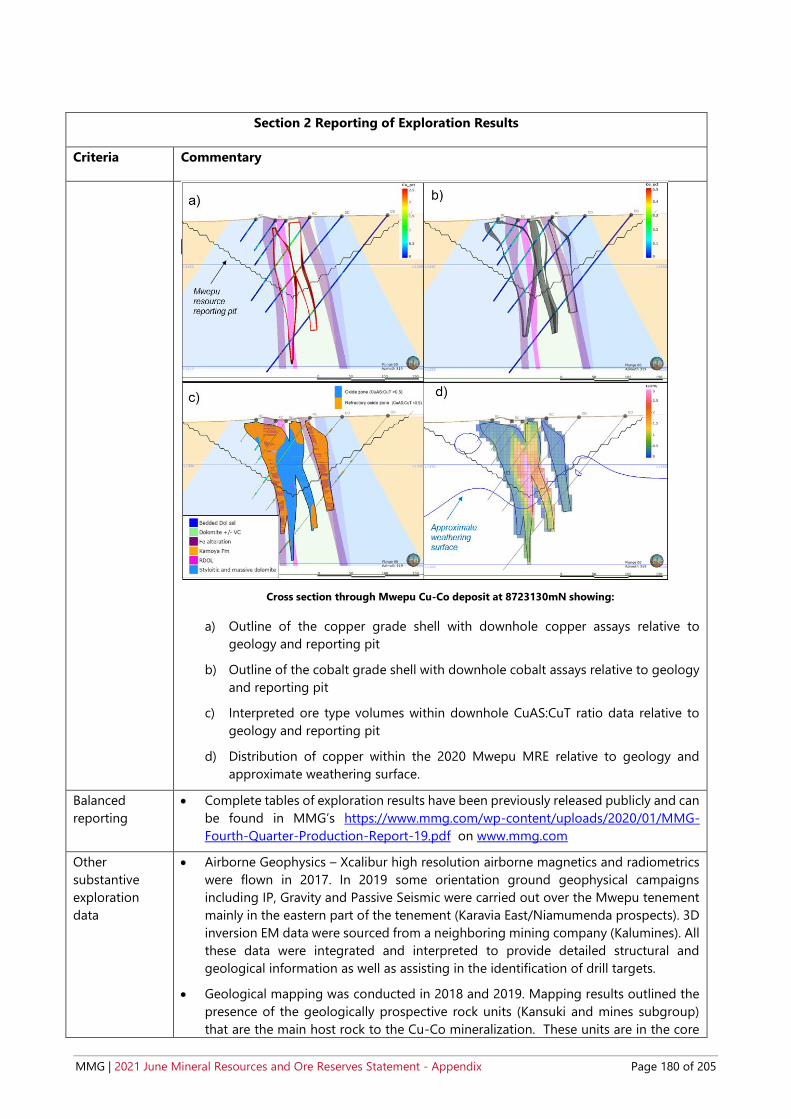
MMG | 2021 June Mineral Resources and Ore Reserves Statement - Appendix Page 180 of 205
Section 2 Reporting of Exploration Results
Criteria Commentary
Cross section through Mwepu Cu-Co deposit at 8723130mN showing:
a) Outline of the copper grade shell with downhole copper assays relative to
geology and reporting pit
b) Outline of the cobalt grade shell with downhole cobalt assays relative to geology
and reporting pit
c) Interpreted ore type volumes within downhole CuAS:CuT ratio data relative to
geology and reporting pit
d) Distribution of copper within the 2020 Mwepu MRE relative to geology and
approximate weathering surface.
Balanced
reporting
• Complete tables of exploration results have been previously released publicly and can
be found in MMG’s https://www.mmg.com/wp-content/uploads/2020/01/MMG-
Fourth-Quarter-Production-Report-19.pdf on www.mmg.com
Other
substantive
exploration
data
• Airborne Geophysics – Xcalibur high resolution airborne magnetics and radiometrics
were flown in 2017. In 2019 some orientation ground geophysical campaigns
including IP, Gravity and Passive Seismic were carried out over the Mwepu tenement
mainly in the eastern part of the tenement (Karavia East/Niamumenda prospects). 3D
inversion EM data were sourced from a neighboring mining company (Kalumines). All
these data were integrated and interpreted to provide detailed structural and
geological information as well as assisting in the identification of drill targets.
• Geological mapping was conducted in 2018 and 2019. Mapping results outlined the
presence of the geologically prospective rock units (Kansuki and mines subgroup)
that are the main host rock to the Cu-Co mineralization. These units are in the core

MMG | 2021 June Mineral Resources and Ore Reserves Statement - Appendix Page 181 of 205
Section 2 Reporting of Exploration Results
Criteria Commentary
of a steeply dipping anticline striking NW-SE. Younger lithologies were also noted
from the Nguba and Kundelungu Formations.
• Surface geochemistry (Soil sampling) on 200m x 200m grid and 200X100m was
completed in 2018 which identified copper and cobalt anomalous zones within the
tenement.
Further work • Further exploration activities are planned for the 2020 exploration season:
o Infill drilling to improve confidence levels of resource estimations.
o Metallurgical test work on drill core and bulk samples to ascertain milling and
processing characteristics.
o Geotechnical drilling to assess pit wall characteristics for mine planning.
o Preliminary economic assessment to evaluate economic viability.
Section 3 Estimating and Reporting of Mineral Resources
Criteria Commentary
Database
integrity
• The MMG Exploration database systems are SQL server and GeoBank management
software. All geological and analytical data are managed in MMG’s Corporate
Geoscience Database. GIS data are stored in secure shared folders on the
Lubumbashi server.
• All data capture via GM logging profiles having strong internal validation criteria. The
technician/geologist conducts first validation steps by checking intervals, description
and accuracy of records on their respective Toughbooks®.
• Validation rules are predefined in each of the database tables. Only valid codes get
imported into the database.
• The sampling and geochemical data are stored in a local version of SQL database
that gets replicated to a similar version on the Head Office server with daily, weekly
and monthly backups.
• A data validation process conducted prior to estimation consisted of:
o Examining the sample assay, collar survey, downhole survey and geology
data to ensure that the data were complete for all of the drillholes.
o Examining the desurveyed data in three dimensions to check for spatial
errors.
o Examination of the assay data in order to ascertain whether they are within
expected ranges, including checks for acid soluble values greater than the
corresponding total assay value.
o Checks for “FROM-TO” errors, to ensure that the sample data did not overlap
one another or that there were no unexplained gaps between samples.
o Checks for excessive mineralised sample lengths.
o Checks for unsampled drillholes.

MMG | 2021 June Mineral Resources and Ore Reserves Statement - Appendix Page 182 of 205
Section 3 Estimating and Reporting of Mineral Resources
Criteria Commentary
Site visits • The Competent Person has not visited the site but has visited the Kinsevere deposit
and several other oxide copper deposits in the Katanga province, which are also
similar in style to the Mwepu mineral deposit.
Geological
interpretation
• There is a moderate to high degree of confidence in the lithological model and
geological setting.
• Grade shells have been constructed sub-vertically, in close association with the
favourable dolomitic horizons and iron alteration zones. Mineralisation is not strata
bound but it is sub-parallel to the stratigraphy.
• A 0.4% total copper threshold was used for the copper grade shells and a 0.08% total
cobalt threshold was used for the cobalt grade shells. These thresholds allowed for
continuity of mineralisation from one drilling section to the next.
• An alternative interpretation for the third copper mineralised fracture may exist,
however more exploration would need to be carried out to gain better
understanding in this area.
Dimensions • Strike length is approximately 1,055 m.
• The modelled copper mineralisation is between approximately 10 m and 70 m wide.
• Mineralisation generally occurs 10 m to 40 m below surface along most of the strike
length, with it outcropping in some locations. The mineralisation extends from 80 m
to 220 m below surface.
Estimation and
modelling
techniques
• A 0.4% total copper threshold was used for the copper grade shells and a 0.08% total
cobalt threshold was used for the cobalt grade shells.
• Grade estimation was completed using ordinary kriging for total copper and cobalt
and inverse distance weighting for Ca, Mg, Mn, S and acid soluble ratios using
Datamine RM software. Data were composited to 1 m.
• Top cuts were applied to statistical outliers where necessary.
• The wireframe models were filled within a rotated block model (320 degrees), with
parent cells of 5 mX by 20 mY by 10 mZ. The parent cells were split to sub-cells to a
minimum of 1 mX by 1 mY by 1 mZ. The blocks were rotated to align with the
mineralisation trend. The optimum block size was determined using KNA.
• A minimum of 10 and a maximum of 20 composites were found to be optimal for
estimation through KNA.
• Search distances at 90% of the variogram ranges were used for the estimation.
• A similar neighbourhood was used in the estimation of grade attributes, except for
the estimation of acid soluble to total ratios due to lesser data.
• Each lithological and grade shell wireframe was filled and coded for zonal estimation
of TCu, TCo, Ca, Mg, Mn and S.
• Calcium and magnesium showed a good correlation with each other. Thus, Ca and
Mg were estimated using the same domains. Acid soluble copper showed good
correlation to the total copper assay. The oxidation of rocks has been observed to
be along mineralisation fractures, and hence the spatial overlap between the copper
mineralisation wireframe and the leachability wireframe. Total cobalt and cobalt
soluble assays also showed good correlation with one another. The acid soluble

MMG | 2021 June Mineral Resources and Ore Reserves Statement - Appendix Page 183 of 205
Section 3 Estimating and Reporting of Mineral Resources
Criteria Commentary
copper estimates were controlled by domains based on the leachability and copper
domain wireframe. The leachability wireframe correlated fairly well with the
weathering wireframe. The acid soluble cobalt estimates were controlled by cobalt
domain wireframe.
• The rest of the variables did not show good correlation with each other and were
estimated independent of each other.
• A soft boundary was used in the estimation of the high-grade domain where
composites located up to 1 m outside its boundary were used in the estimation. All
the other estimates used hard boundaries within relevant wireframe boundaries.
• A waste model was created that covered an area to 200 m from the mineralisation
to enable pit planning.
• No SMU was considered
• The block model grade was compared to drillhole data visually, statistically and by
comparing average grades of the drillhole data and model in 50 m slices through the
deposit.
• No reconciliation data is available as no mining has occured.
Moisture • Estimated tonnes are on a dry basis.
Cut-off
parameters
• The Mineral Resource has been reported above a total copper cut-off grade of 1.1%.
Additional cobalt Mineral Resource (outside of the copper cut-off), has been
reported above a total cobalt cut-off grade of 0.3%.
• The reported Mineral Resources have also been constrained within a US$3.62/lb
copper and US$25.79/lb cobalt whittle pit shell. The reporting cut-off grade and the
pit-shell price assumption are in line with MMG’s policy on reporting of Mineral
Resources which is prospective for future economic extraction.
Mining factors
or assumptions
• The mining method is assumed to be open pit with trucks and excavators
Metallurgical
factors or
assumptions
• Mwepu ore is intended to be processed at Kinsevere Mine shortly after the
implementation of the Kinsevere Expansion Project (currently pending board
approval).
• Preliminary metallurgical tests have been conducted and results indicate similar
recoveries to those used in the Kinsevere Expansion Project (KEP) for CuAS and CoT.
However, at Mwepu, the non-CuAS component is comprised of copper hosted in
clays, Mn-Fe WAD, silicates and sulphides. As such, recovery of the non-CuAS
component is complex. Further met test work is currently being undertaken to
optimise recovery of the non CuAS.
• At this early stage of project development, metallurgical recovery assumptions are
based on KEP recoveries. This is subject to change as additional mettalurgical test
work is completed and as ore body understanding improves.
• KEP recoveries are based on the proposed Kinsevere Expansion Project (KEP)
flowsheet and infrastructure upgrades. The upgraded flowsheet will consist of the
following changes:

MMG | 2021 June Mineral Resources and Ore Reserves Statement - Appendix Page 184 of 205
Section 3 Estimating and Reporting of Mineral Resources
Criteria Commentary
o Oxide pre-flotation circuit and leach tank modifications 2.2Mtpa
o Oxide leach upgrades to convert to reductive leach conditions
o Sulphide Concentrator 2.2Mtpa capacity
o Roaster circuit including off-gas cleaning, acid plant and concentrate storage
o Cobalt Recovery circuit to produce high grade Cobalt hydroxide
o SX plant modifications
• Predicted plant recoveries are as follows:
• * ASCu refers to the sulphuric acid soluble portion of copper content within the
sample mass.
• * ‘Ratio’ refers to the ratio of ASCu:TCu
Environmental
factors or
assumptions
• Environmental factors include increased land surface disturbance and required
rehabilitation for this site, including final pit excavation and waste rock storage. All
ore piles are expected to be transported to Kinsevere for treatment.
Bulk density • Bulk density measurements were undertaken on each hole within specific lithological
units and on mineralised intersections.
• Samples were dipped in molten wax.
• In-situ bulk density were assigned to the block model based on stratigraphy and
weathering.
Classification • The model was classified as Indicated and Inferred where informed by a grid of
mineralised intersections.
• Indicated Mineral Resources were within a grid spacing of 40m and extrapolated to
a maximum of 20 m from the nearest drillhole.
• Inferred Mineral Resources were within a grid spacing of 100m extrapolated and a
maximum of 50 m from the nearest drillhole.
• Mineralisation outside the modelled grade shells was not classified as Mineral
Resource.
• No Measured Mineral Resources were reported due to uncertain grade continuity.
Audits or
reviews
• No external audits or reviews of this Mineral Resource estimate have been
undertaken.

MMG | 2021 June Mineral Resources and Ore Reserves Statement - Appendix Page 185 of 205
Section 3 Estimating and Reporting of Mineral Resources
Criteria Commentary
Discussion of
relative
accuracy/
confidence
• The Indicated Mineral Resources are informed by a drill grid of 40 m spacing. The
Inferred Mineral Resources are informed by drilling and extrapolation is minimal.
Mineral Resources informed by sparse drilling are considered to be low confidence
estimates that may change significantly with additional data. It cannot be assumed
that all or part of an Inferred Mineral Resource will necessarily be upgraded to an
Indicated Mineral Resource as a result of continued exploration.
• Inferred Mineral Resources are not suitable for detailed technical and economic
evaluation.
• Although block model estimates have been carried out, local estimates are likely to
be inaccurate for Inferred Mineral Resources.

MMG | 2021 June Mineral Resources and Ore Reserves Statement - Appendix Page 186 of 205
8.2.3 Statement of Compliance with JORC Code Reporting Criteria and Consent to Release
This Mineral Resource statement has been compiled in accordance with the guidelines defined in the 2012
Edition of the Australasian Code for Reporting of Exploration Results, Mineral Resources and Ore Reserves
(“2012 JORC Code”).
8.2.3.1 Competent Person Statement
I, Samson Malenga, confirm that I am the Competent Person for the Mwepu Mineral Resource section of this
Report and:
I have read and understood the requirements of the 2012 Edition of the Australasian Code for Reporting
of Exploration Results, Mineral Resources and Ore Reserves (JORC Code, 2012 Edition).
I am a Competent Person as defined by the JORC Code, 2012 Edition, having five years’ experience that is
relevant to the style of mineralisation and type of deposit described in the Report, and to the activity for
which I am accepting responsibility.
I am a Fellow Member of The Geological Society of South Africa Reg No. 965948 and I am a Registered
Professional Natural Scientist with the South African Council for Natural Scientific Professions (SACNASP)
– Reg No 400181/06.
I have reviewed the relevant Mwepu Mineral Resource section of this Report to which this Consent
Statement applies.
I am a full-time employee of MMG Limited at the time of the estimation.
I have disclosed to the reporting company the full nature of the relationship between myself and the company,
including any issue that could be perceived by investors as a conflict of interest.
I verify that the Mwepu Mineral Resource section of this Report is based on and fairly and accurately reflects
in the form and context in which it appears, the information in my supporting documentation relating to the
Mwepu Resources.
8.2.3.2 Competent Person Consent
Pursuant to the requirements Clause 9 of the JORC Code 2012 Edition (Written Consent Statement)
With respect to the sections of this report for which I am responsible – the Mwepu Mineral Resources - I
consent to the release of the 2021 Mineral Resources and Ore Reserves Statement as at 30 June 2021 Executive
Summary and Technical Appendix Report and this Consent Statement by the directors of MMG Limited:
_______________________________________________ Date:____________________________________________
Samson Malenga, BSc. Hons (Geol.),MBL, Pr.Sci.Nat, FGSSA
_______________________________________________ ____________________________________________
Signature of Witness: Witness Name and Residence: (e.g. town/suburb)
This signature was scanned for the exclusive use
in this document – the MMG Mineral Resource and Ore Reserve Statement as at 30 June 2021 – with
the author’s approval. Any other use is not
authorised.
This signature was scanned for the exclusive use in
this document – the MMG Mineral Resource and Ore Reserve Statement as at 30 June 2021 – with the
author’s approval. Any other use is not authorised.
8/10/2021
Serge Djemo
Lubumbashi, DRC

MMG | 2021 June Mineral Resources and Ore Reserves Statement - Appendix Page 187 of 205
9 NAMBULWA / DZ
9.1 Introduction and Setting
The Nambulwa and DZ Projects are located on the license PE539 in Democratic Republic of Congo, DRC. The
tenement was acquired by MMG as part of the Anvil Mining acquisition in 2012. From the Kinsevere copper
(Cu) mine, the Projects are located some 30km to the NNW (Figure 9-1).
Figure 9-1 Nambulwa and DZ project location
MMG begun exploring tenement PE539 in 2014 with regional to semi-regional exploration work including
geological mapping, surface geochemistry, airborne geophysical survey (magnetics, radiometrics, and EM).
However, MMG was unable to continue exploring the tenement due to security threats by artisanal miners.
Following this, MMG negotiated its exploration rights over PE539 with various government agencies and
subsequently managed to regain full control over the tenement. As a result, all mining cooperatives and
artisanal miners were evicted from the tenement and the area was secured by about 40 Mine Police under
contract from MMG.

MMG | 2021 June Mineral Resources and Ore Reserves Statement - Appendix Page 188 of 205
9.2 Mineral Resources – Nambulwa / DZ
9.2.1 Results
The 2021 Nambulwa/DZ Mineral Resources are summarised in Table 27 2021 Nambulwa/DZ Mineral Resources
tonnage and grade (as at 30 June 2021). There are no Ore Reserves for Nambulwa/DZ deposits.
Table 27 2021 Nambulwa/DZ Mineral Resources tonnage and grade (as at 30 June 2021)
Nambulwa and DZ Mineral Resources
Contained Metal
Nambulwa Oxide
Copper2
Tonnes
(Mt)
Copper
(% Cu)
Copper
(AS1 % Cu)
Cobalt
(% Co)
Copper
(kt)
Copper AS
(kt)
Cobalt
(kt)
Measured - - - - - - -
Indicated 1.0 2.2 2.0 0.1 23 21 1.2
Inferred 0.1 1.9 1.7 0.1 1.7 1.5 0.1
Total 1.1 2.2 2.0 0.1 25 23 1.3
Nambulwa Oxide
Cobalt3
Measured
Indicated 0.17 0.15 0.12 0.27 0.25 0.20 0.46
Inferred - - - - - - -
Total 0.17 0.15 0.12 0.27 0.25 0.20 0.46
DZ Oxide Copper2
Measured - - - - - - -
Indicated 0.79 2.0 1.8 0.13 16 14 1.0
Inferred 0.036 2.0 1.8 0.13 0.73 0.63 0.05
Total 0.82 2.0 1.8 0.13 17 15 1.0
DZ Oxide Cobalt3
Measured - - - - - - -
Indicated 0.35 0.26 0.19 0.27 0.90 0.65 0.94
Inferred - - - - - - -
Total 0.35 0.26 0.19 0.27 0.90 0.65 0.94
Combined Total 2.5 43 38 3.7
1 AS stands for Acid Soluble
2 0.76% Cu cut-off grade 3 0.2% Co cut-off grade
All Mineral Resources except stockpiles are contained within a US$3.68/lb Cu and US$30.24/lb Co pit shell
Contained metal does not imply recoverable metal.
Figures are rounded according to JORC Code guidelines and may show apparent addition errors.

MMG | 2021 June Mineral Resources and Ore Reserves Statement - Appendix Page 189 of 205
9.2.2 Mineral Resources JORC 2012 Assessment and Reporting Criteria
The following information provided in Table 28 complies with the 2012 JORC Code requirements specified by
“Table-1 Section 1-3” of the Code.
Table 28 JORC 2012 Code Table 1 Assessment and Reporting Criteria for Nambulwa/DZ Mineral Resources 2021
Section 1 Sampling Techniques and Data
Criteria Explanation
Sampling
techniques
• The Mineral Resources uses a combination of reverse circulation (RC) and drilling
diamond drilling (DD) to inform the estimates.
• Mineralised zones within the drill core were identified based on combined
parameters, including lithological and alteration logging, mineralogical logging and
systematic spot pXRF readings. DD core was sampled nominally at 1m intervals
within mineralised zones while unmineralised zones were sampled at up to 2-4m
intervals. Sampling was carried out by longitudinally cutting PQ and HQ drill core
using an Almonte automatic diamond saw and sampling half-core, with half-core
retained for future reference. PQ drill core was quartered and sampled. Three-
quarters of the core was retained for future reference.
• RC drill cuttings were collected in 1m bulk samples from a rig mounted cyclone.
Lithological and mineralogical logging, supported by systematic spot pXRF
readings, were used to identify mineralised and unmineralised zones in the RC
chips. Samples from mineralised zones were riffle split every 1m to obtain a
representative (~2.5kg) sample. Samples from unmineralised zones were riffle split
and composited to 2m intervals. Wet samples were dried in ambient air before
splitting and compositing.
• Air core (AC) drill cuttings were collected in 1m bulk samples from a rig mounted
cyclone. Samples from zones of mineralisation were riffle split to obtain a
representative (~2.5kg sample). Samples from visually unmineralised, lithologically
similar zones were riffle split and composited to 3m sample intervals (~2.5kg
weight). Wet samples were dried in ambient air before splitting and compositing.
• Overall, 54% of the samples were less than 2m, with mineralised samples taken at
nominal 1m intervals.
• Samples were crushed, split and pulverised (>85% passing 75 µm) at an onsite ALS
laboratory at the MMG core yard facility in Lubumbashi. 100 grams of pulp material
was sent to the SANAS accredited ALS Laboratories in Johannesburg.
• The sample types, nature, quality and sample preparation techniques are
considered appropriate for the nature of mineralisation within the Project (sediment
hosted base metal mineralisation) by the Competent Person.
Drilling
techniques
• DD: PQ and HQ sizes, with triple tube to maximise recovery. At the end of each
drilling run the core was marked with an orientation mark by using a REFLEX ACE
tool. An orientation line was then drawn along the axis of the core if two consecutive
orientations marks could be aligned by docking core pieces.
• AC drilling: A blade bit was used for drilling a 3.23-inch (82mm) hole. The cyclone
was manually cleaned at the start of each shift, after any wet samples, and after
each hole. Compressed air from the drilling machine was used to clean/blow out
material from the AC rods, hoses, and cyclone after each rod.

MMG | 2021 June Mineral Resources and Ore Reserves Statement - Appendix Page 190 of 205
Section 1 Sampling Techniques and Data
Criteria Explanation
• RC drilling: A hammer bit was used for drilling a 5.25-inch (133mm) diameter hole.
The cyclone was manually cleaned at the start of each shift, after any wet samples,
and after each hole. Compressed air from the drilling machine was used to
clean/blow out material from the RC rods, hoses, and cyclone after each rod.
Drill sample
recovery
• Overall DD core recovery averaged 83% across the Project area. As expected, the
recovery dropped in unconsolidated/highly weathered ground. Below 50m, core
recovery averaged 85%, and below 100m, core recovery averaged 89%.
• Actual vs. recovered drilling lengths were captured by the driller and an onsite rig
technician using a tape measure. Measured accuracy was down to 1cm. The core
recoveries were calculated during the database exports.
• Sample recovery during diamond drilling was maximised using the following
methods:
o Short drill runs (~50cm)
o Using drilling additives, muds and chemicals to improve broken ground
conditions.
o Using the triple tube methodology in the core barrel.
o Reducing water pressure to prevent washout of friable material
• Drilling rates varied depending on the actual and forecast ground conditions
• Core loss was recorded through the core and assigned to intersections where visible
loss occurred. Cavities were noted.
• Bias due to core loss has not been determined.
• RC and AC cuttings recovery was measured by weighing each 1m sample bag
immediately following collection from the cyclone.
• Sample returns for RC and AC drilling have been calculated at 62% and 63%
respectively.
• Sample recovery during RC drilling was maximized using the following methods:
o Adjusting air pressures to the prevailing ground condition.
o Using new hammer bits and replacing when showing signs of wear.
Logging • DD core, RC chips and AC chips have been geologically logged and entered into
the MMG database (Geobank). The level of detail supports the estimation of
Mineral Resources. Additional geotechnical logging is required for further studies
of the deposit.
• Qualitative logging includes lithology, mineralisation type, oxidation type,
weathering type, colour and alteration types. Quantitative logging includes
mineralisation mineral percentage, alteration mineral percentage and in the case of
core, RQD and structural data have been recorded.
• All the core and chip samples were photographed both wet and dry.
• 100% of core and chips have been logged with the above information.
Sub-sampling
techniques and
• DD core was split in half longitudinally (HQ size) or quartered (PQ size) using an
Almonte automatic diamond saw.

MMG | 2021 June Mineral Resources and Ore Reserves Statement - Appendix Page 191 of 205
Section 1 Sampling Techniques and Data
Criteria Explanation
sample
preparation
• Sample lengths were cut as close to nominal 1m intervals as possible while also
respecting geological contacts. Samples were generally ~2.5kg in weight.
• RC and AC samples were collected from a cyclone every meter by a trained driller’s
assistant. If the sample was dry the sample was passed through a riffle splitter and
a ~2.5kg split was collected into a pre-numbered calico bag. Residual material was
sampled and sieved for collection into chip trays for logging and the remainder
returned to the larger poly-weave bag (bulk reject). The splitter was cleaned using
compressed air or a clean brush and tapped using a rubber mallet. If the sample
was wet, the sample was air dried before being split according to the above
procedure.
• For RC and AC methods, field duplicates were inserted at a rate of approximately
5% to ensure sampling precision was measured.
• Samples from individual drillholes were sent in a single dispatch to the onsite ALS
laboratory at the MMG core yard facility in Lubumbashi.
• Samples were received, recorded on the sample sheet, weighed, and dried at 105°C
for 4 to 8 hours (or more) depending on dampness at the sample preparation
laboratory.
• Samples were crushed and homogenised in a jaw crusher to >70% passing 2mm.
The jaw crusher was cleaned with a barren quartz blank after every crushed sample.
• The sample size was reduced to 1000g in a riffle splitter and pulverised in an LM2
pulveriser to >85% passing 75 microns. QC grind checks were carried out using wet
sieving at 75 microns on 1 in 10 samples.
• 100 grams of pulp material were sent to the SANAS accredited ALS Laboratories in
Johannesburg.
• Crush and pulp duplicates were submitted for QAQC purposes.
• Certified reference materials (high, medium, and low copper grades) were also
inserted and submitted to ALS for analysis at a rate of 3 per 30 samples.
• The sample size is appropriate for the grain size and distribution of the minerals of
interest.
Quality of assay
data and
laboratory tests
• All samples were sent to ALS Chemex Laboratory in Johannesburg
• Samples were analysed using a 4-acid digest with ICP MS finish. 48 elements were
analysed in total.
• Acid soluble copper assays were only performed when the total copper assay was
greater than 1,000 ppm.
• ~15% QAQC samples were incorporated, including blanks, duplicates (field, crush,
and pulp) and certified reference material per sample analysis batch.
• QAQC data has been interrogated with no significant biases or precision issues.
• No geophysical tools, spectrometers, or portable XRF instruments have been used
for estimation purposes.
MMG | 2021 June Mineral Resources and Ore Reserves Statement - Appendix Page 192 of 205
Section 1 Sampling Techniques and Data
Criteria Explanation
Verification of
sampling and
assaying
• Significant intersections have been reviewed by competent MMG employees.
• No twin drilling was completed.
• Primary data is stored in a Geobank database, which is maintained according to
MMG database protocols. Data is logged, entered and verified in the process of
data management. Database is stored on MMG server and routinely backed up.
• No adjustment has been made to assay data.
Location of data
points
• Planned collar positions for both diamond drilling and RC drilling were located
using handheld GPS devices to ±5m accuracy.
• Post drilling, actual collar positions were surveyed using DGPS (Geomax Zenith 25
Pro and Topcon Hiper II) and are of high accuracy.
• Grid system is in WGS84/UTM35S
• Topographic control was by a detailed aerial drone survey.
• The TN14 GYROCOMPASS™ was used to align the drill rig to the correct azimuth
and dip angles.
• Downhole surveys were done using the REFLEX EZ-TRAC survey instrument.
Downhole surveys were not carried out on RC & AC drillholes.
Data spacing
and distribution
• Drill spacing is variable between prospects. Average drill hole data are spaced at
~50 to 100m between drill sections. Holes on sections are spaced at ~25-50m apart.
• 2 m or 4 m composites were taken in zones of no visual mineralisation (3 m
composites for AC drilling)
• Nominal 1m samples were taken in zones of mineralisation.
• No other sample compositing has occurred.
Orientation of
data in relation
to geological
structure
• DD and RC drillholes were predominantly drilled with dips of between 45° and 60°
to intersect generally steeply dipping mineralisation. Drilling azimuths were as close
as practical to orthogonal to the mineralised trend. The AC drillholes were drilled
vertically.
• In the view of the Competent Person, no bias has been introduced by the drilling
direction.
Sample security • Samples were transported from the field and delivered to the sample processing
facility in Lubumbashi for cutting and preparation. A single cab pick-up was used
for the transport. Polyethylene foam, tarpaulins, and cargo nets were used to secure
the load and to avoid possible shifting of core during transport.
• RC chip sampling was conducted in the field. Chip samples were packed in a
labelled plastic bag along with a labelled plastic ID tag.
• The plastic bag was tied with cable ties to secure the sample and to prevent
contamination.
• A set of 15 plastic sample bags were packed into labelled poly-weave bags, ready
to be shipped from the field to the sample preparation laboratory in Lubumbashi.

MMG | 2021 June Mineral Resources and Ore Reserves Statement - Appendix Page 193 of 205
Section 1 Sampling Techniques and Data
Criteria Explanation
• Field packing documents and sample sheets were prepared and sent together with
the core trays and poly-weave bags to the sample preparation laboratory in
Lubumbashi.
• After sample preparation, bar-coded envelopes of 100-200g of pulp for each
sample were inserted into boxes of ~40 envelopes each, labelled with dispatch ID
and laboratory destination to be sent by DHL courier to ALS Chemex in
Johannesburg.
• Two sets of duplicate pulps of 100-200g were inserted into labelled boxes of ~40
envelopes each to be stored on site in storage containers.
• The shipment of pulps from Lubumbashi to ALS laboratories was done using DHL
Courier services with waybill number for tracking.
• The Lubumbashi sample preparation laboratory utilizes the ALS-Chemex LIM
System installed at Kinsevere mine site, generating a unique lab workorder for each
batch sample in the analytical chain.
Audit and
reviews
• No external audits or reviews of sampling techniques and data have been
conducted.
• Data has been reviewed by the Competent Person as part of this Mineral Resource
estimate. No significant issues were identified.
Section 2 Reporting of Exploration Results
Criteria Status
Mineral
tenement and
land tenure
status
• The Nambulwa and DZ Projects are located within lease PE539 (100% Gecamines)
in the DRC. The lease was acquired by MMG as part of the Kinsevere Amodiation
agreement with Gecamines. The tenement is valid through to April 3, 2024.
Exploration
done by other
parties
• Union Miniere (UMHK) explored the Nambulwa Project during the 1920s. UMHK
conducted trenching, pitting and tunnelling, mainly at Nambulwa Main.
• Gecamines explored the Nambulwa Project during the 1990s. Work completed
included mapping, pitting, and limited drilling at Nambulwa Main.
• Anvil Mining explored the Nambulwa Project between September and December
2007 and was the first company to effectively define a resource. Anvil’s initial phase
of exploration included geological mapping, termite mound sampling, AC drilling
(11,830m), RC drilling (6,268m), and DD drilling (668m) focussed on PE539 and the
surrounding tenements. An unclassified resource of 1.1Mt of ore @ 3.3% Cu or
35,000 t of copper metal was estimated for Nambulwa Main.
Geology • Sedimentary hosted copper and cobalt oxide deposits.
• Mineralisation is hosted by the Neoproterozoic Katanga Supergroup within R2 and
R1 stratigraphic rock types.

MMG | 2021 June Mineral Resources and Ore Reserves Statement - Appendix Page 194 of 205
Section 2 Reporting of Exploration Results
Criteria Status
• Copper mineralisation mainly occurs in oxide form (malachite) in vugs, fractures and
as mineral replacement. Chalcocite and minor bornite are present in veins and as
fine-grained disseminations within shaley host rocks.
• Cobalt oxides tend to concentrate near surface in Fe-Mn rich clays and within
Drill hole
information
• All drillhole information has been considered in estimating the Mineral Resource,
and as this is a Mineral Resource report and not a public report of individual
exploration results a full listing of results is not provided here.
Data
aggregation
methods
• This is a Mineral Resource Statement and is not a report on exploration results hence
no additional information is provided for this section.
• No metal equivalents were used in the Mineral Resource estimation.
Relationship
between
mineralisation
width and
intercept
lengths
• This is a Mineral Resource estimate and no down hole length intervals are reported
separately. All intervals have been considered within mineralised domains for the
estimation of grades within the Mineral Resource.
• DD and RC drillholes were predominantly drilled with dips of between 45° and 60°
to intersect generally steeply dipping mineralisation. Drilling azimuths were as close
as practical to orthogonal to the mineralised trend. The AC drillholes were drilled
vertically.

MMG | 2021 June Mineral Resources and Ore Reserves Statement - Appendix Page 195 of 205
Diagrams
Figure 1: Nambulwa project location map.
Figure 2: Geology map and drill hole locations on the Nambulwa Main prospect.

MMG | 2021 June Mineral Resources and Ore Reserves Statement - Appendix Page 196 of 205
Figure 3: Nambulwa Main geology and copper & cobalt grade shells. The dashed line designated A – A’ is
the location of the cross section shown in the following figure.
Figure 4: Cross section through Nambulwa Main Cu deposit at 8768415mN (30m slice) showing:
a. Outline of the copper grade shell with downhole copper assays relative to geology and reporting pit
b. Outline of the copper grade shell (no cobalt shell at Nam) with downhole cobalt assays relative to
geology and reporting pit
c. Copper shell coloured by ore type with downhole CuAS:CuT ratio data relative to geology and
reporting pit
d. Distribution of copper within the 2020 Nambulwa MRE showing blocks > 0.4% CuT. Note* model
has been regularised.

MMG | 2021 June Mineral Resources and Ore Reserves Statement - Appendix Page 197 of 205
Figure 5: Geology map and drill hole locations on the DZ (Diazenza) prospect.
Figure 6: DZ geology and copper & cobalt grade shells. The dashed line designated A – A’ is the location of
the cross section shown in the following figure.

MMG | 2021 June Mineral Resources and Ore Reserves Statement - Appendix Page 198 of 205
Section 2 Reporting of Exploration Results
Criteria Status
Figure 7: Cross section through DZ Cu deposit at 8767930mN, showing:
a. Outline of the copper grade shell with downhole copper assays relative to geology and reporting pit
b. Outline of the cobalt grade shell with downhole cobalt assays relative to geology and reporting pit
c. Unified Cu-Co shell coloured by ore type with downhole CuAS:CuT ratio data relative to geology
and reporting pit
d. Distribution of copper within the 2020 DZ MRE showing blocks > 0.4% CuT. Note* model has been
regularised.
Balanced
reporting
• This is a Mineral Resource estimate and not a report of exploration results.
• All drill holes and assay results have been considered in the construction of Cu and
Co domains for the Nambulwa and DZ Mineral Resource estimates.
Other
substantive
exploration data
• Airborne Geophysics - TEMPEST survey, Airborne EM, magnetics, and radiometric
were flown at the end of 2013. 3D inversion of the EM data identified a prominent
conductor body over the western, central and eastern section of the Project.
• Geological mapping was conducted in 2014 and 2017. Mapping results outlined the
presence of the geologically prospective rock units that are the main host rock to
the mineralisation. Younger lithologies were also noted from the Nguba and
Kundelungu Formations.
• Surface geochemistry: Termite mound sampling on 100m x 100m grid was
completed in 2014, which effectively identified copper anomalous zones within the
tenement. Additional geochemical surveys include 50m x 50m soil sampling
conducted in 2017.
• Airborne Geophysics - Xcalibur survey, flown in 2015
• Magnetics – effective at mapping structural and stratigraphic domains
• Radiometrics - effective at mapping lithological contrasts and regolith domains.
• Ground IP and AMT survey – helped in mapping the conductive and resistive bodies
at depth.

MMG | 2021 June Mineral Resources and Ore Reserves Statement - Appendix Page 199 of 205
Section 2 Reporting of Exploration Results
Criteria Status
Further work • Further work on Nambulwa and DZ will focus on advancing the project to Pre-
feasibility level study. This will include drilling to convert Inferred to Indicated and
Measured Mineral Resources, mining design and scheduling, metallurgical testing
and analysis along with all other Ore Reserve modifying factors.
Section 3 Estimating and Reporting of Mineral Resources
Criteria Status
Database
integrity
• The MMG Exploration database systems are SQL server and Geobank (Micromine)
management software. All geological and analytical data are managed in MMG’s
Corporate Geoscience Database. GIS data are stored in secure shared folders on the
Lubumbashi server.
• All data capture via Microsoft Excel logging templates.
• Multiple data validation steps conducted by the geologist and database team.
Validation rules are predefined in each of the database tables. Only valid codes get
imported into the database.
• The sampling and geochemical data are stored in a local version of SQL database
that gets replicated to a similar version on the Head Office server with daily, weekly
and monthly backups.
Site visits • The Competent Person visited the Nambulwa and DZ sites in July 2018 and January
2019 and has visited the Kinsevere deposit and several other oxide copper deposits
in the Katanga province, which are also similar in style to the Nambulwa and DZ
mineral deposit.
Geological
interpretation
• High degree of confidence in the lithological model and geological setting.
• Grade shell have been constructed aligned with the stratigraphy although they can
cross cut stratigraphic contacts.
• A 0.5% total copper threshold was used for copper grade shell and a 0.1% total cobalt
threshold was used for the cobalt grade shells. These thresholds allowed for
continuity of mineralisation from one drilling section to the next.
• Alternative interpretations of the mineralisation controls exist and there may be a
structural control in addition to the stratigraphic control. These are unlikely to
significantly affect the total quantity of Mineral Resources.
• The grade shells appear to have been offset in places by faulting. Structures trending
at a close angle to the mineralisation may occur.
Dimensions Nambulwa
• Strike length is approximately 1.1 km.
• The modelled copper mineralisation is between approximately 2 m and 15 m wide.
Cobalt mineralisation reached 40 m wide.

MMG | 2021 June Mineral Resources and Ore Reserves Statement - Appendix Page 200 of 205
Section 3 Estimating and Reporting of Mineral Resources
Criteria Status
• Mineralisation occurs from surface along most of the strike length. In some areas
drilling did not identify mineralisation near surface, despite artisanal mining, and the
mineralisation extends from as deep as 60 m below surface.
• The host rocks are terminated by a low angle fault at depths of between 50m and
150m.
• The mineralisation is subvertical over most of the area but flattens to the southeast.
DZ
• Strike length is approximately 500m (Adjacent to Nambulwa).
• The modelled copper mineralisation is between approximately 5m and 80m wide,
reaching a maximum thickness in the centre (bulge area).
• Mineralisation occurs from surface along most of the strike length. In some areas
drilling did not identify mineralisation near surface.
• The mineralisation is subvertical over most of the area, with a bulging shape in the
middle of the grade shells.
Estimation and
modelling
techniques
• A similar estimation strategy was used for both Nambulwa and DZ and is summarised
below:
• A 0.4% total copper threshold was used for copper grade shell and a 0.1% total cobalt
threshold was used for the cobalt grade shells.
• Grade estimation was completed using ordinary kriging for total copper and cobalt
and inverse distance weighting for density, Ca, Mg and acid soluble ratios using
Datamine Studio RM software. Samples were composited to 1 m.
• Top cuts were applied to statistical outliers where necessary.
• Search distances used based on multiples of the variogram ranges.
• The wireframe models were filled with parent cells 5m x 5m x 5m (X,Y,Z). The parent
cells were split to sub-cells of a minimum of 1m x 1m x 1m (X,Y,Z). The drillhole
spacing is approximately 25m (Nambulwa) and 50m (DZ) strike at by 25m on dip. The
small block size was chosen due to the orientation of the grade shells rather than on
a geostatistical basis.
• Each lithological and grade shell wireframe was filled and coded for zonal estimation
so that the model contains lithological codes and grade shell codes. The coding
included a code for the low Ca volume that represents the base of deep weathering.
• Ca and Mg were estimated by lithology separately within volumes defining low,
moderate and high levels of Ca and Mg.
• Insitu bulk dry density was estimated within each lithology and below and above the
low Ca volume, which defines the deep weathering.
• A waste model was created that covered the area containing any elevated copper
and/or cobalt grades.
• No SMU was considered
MMG | 2021 June Mineral Resources and Ore Reserves Statement - Appendix Page 201 of 205
Section 3 Estimating and Reporting of Mineral Resources
Criteria Status
• Bivariate analysis was carried out to determine relationships between the attributes
of interest. All elements were estimated individually there being no discernible
relationship between copper and cobalt and acid soluble values.
• Hard boundaries were used so that estimation was within grade shells.
• The block model grade was compared to drillhole data visually and statistically.
• No reconciliation data were available.
• The latest estimate compares well with the first estimate and wherever differences
occur, significant deviations are justified. The block model grade was compared to
drillhole data visually, statistically and by comparing average grades of the drillhole
data and model in 50m slices through the deposit.
• No modern mining occurred and therefore, no reconciliation data is available.
• Previous maiden resource estimate was also completed by MSA of Johannesburg and
was compared to the current estimate.
Moisture • Estimated tonnes are on a dry basis with density measurements being in-situ dry bulk
densities.
Cut-off
parameters
• The Mineral Resources has been reported above a total copper cut-off grade of 0.8%.
Additional cobalt Mineral Resource (outside of the copper cut-off of 0.8%), has been
reported above a total cobalt cut-off grade of 0.2%.
• The reported Mineral Resources have also been constrained within a US$3.62/lb
copper and US$25.79/lb cobalt whittle pit shell. The reporting cut-off grade and the
pit-shell price assumption are in line with MMG’s policy on reporting of Mineral
Resources which is prospective for future economic extraction.
Mining factors
or
assumptions
• The mining method is assumed to be open pit with trucks and excavators.
Metallurgical
factors or
assumptions
• Nambulwa and DZ ore is intended to be processed at Kinsevere Mine shortly after
the implementation of the Kinsevere Expansion Project (currently pending board
approval).
• Nambulwa and DZ ore is relatively simple in composition (malachite with minor
chalcocite/bornite) and very similar to the oxides and transitional sulphides present
at Kinsevere.
• At this stage of project development metallurgical recovery assumptions are based
on KEP recoveries.
• As such, the criteria impacting the resource cut-off grades and reportable pit shell
inputs are based on the proposed Kinsevere Expansion Project (KEP) flowsheet and
infrastructure upgrades. The upgraded flowsheet will consist of the following
changes:
o Oxide pre-flotation circuit and leach tank modifications 2.2Mtpa
o Oxide leach upgrades to convert to reductive leach conditions
o Sulphide Concentrator 2.2Mtpa capacity
o Roaster circuit including off-gas cleaning, acid plant and concentrate storage

MMG | 2021 June Mineral Resources and Ore Reserves Statement - Appendix Page 202 of 205
Section 3 Estimating and Reporting of Mineral Resources
Criteria Status
o Cobalt Recovery circuit to produce high grade Cobalt hydroxide
o SX plant modifications
• The estimated plant recoveries are as follows:
* ASCu refers to the sulphuric acid soluble portion of copper content within the sample mass* ‘Ratio’
refers to the ratio of ASCu:TCu
Environmental
factors or
assumptions
• Environmental factors include increased land surface disturbance and required
rehabilitation for this site, including final pit excavation and waste rock storage. All
ore piles are expected to be transported to Kinsevere for treatment.
Bulk density • Bulk density measurements have been undertaken using weight in air and weight in
water. The samples measured have also included wax immersion to prevent over
estimation due to the porous nature of oxide samples. Samples are also oven dried
prior to measurement.
• Measurements are undertaken on each hole within specific lithological units and on
mineralised intersections.
• In-situ bulk density estimated into each block using inverse distance squared
Classification • The model was classified as Indicated and Inferred where informed by a grid of
mineralised intersections.
• Indicated Mineral Resources were extrapolated a maximum of 25 m from the nearest
drillhole.
• Inferred Mineral Resources were extrapolated a maximum of 60 m from the nearest
drillhole.
• Where an unmineralised intersection occurs within the drillhole grid, the Mineral
Resource was constrained to a distance half way between the nearest mineralised
intersection and the unmineralised intersection.
• The Mineral Resource was constrained above the interpreted basal fault.
• Mineralisation outside the modelled grade shells was not classified as Mineral
Resource.
• No Measured Mineral Resources were reported due to uncertain grade continuity.
Audits or
reviews
• No external audits or reviews of this Mineral Resource estimate have been
undertaken.

MMG | 2021 June Mineral Resources and Ore Reserves Statement - Appendix Page 203 of 205
Section 3 Estimating and Reporting of Mineral Resources
Criteria Status
Discussion of
relative
accuracy/
confidence
For both Nambulwa and DZ
• The Indicated Mineral Resources are informed by drilling spaced 25 m along strike.
The Inferred Mineral Resources are informed by drilling and extrapolation is minimal.
Mineral Resources informed by sparse drilling are considered to be low confidence
estimates that may change significantly with additional data. It cannot be assumed
that all or part of an Inferred Mineral Resource will necessarily be upgraded to an
Indicated Mineral Resource as a result of continued exploration.
• Inferred Mineral Resources are not suitable for detailed technical and economic
evaluation.
• Although block model estimates have been carried out, local estimates are likely to
be inaccurate.

MMG | 2021 June Mineral Resources and Ore Reserves Statement - Appendix Page 204 of 205
9.2.3 Statement of Compliance with JORC Code Reporting Criteria and Consent to Release
This Mineral Resource statement has been compiled in accordance with the guidelines defined in the 2012
Edition of the Australasian Code for Reporting of Exploration Results, Mineral Resources and Ore Reserves
(“2012 JORC Code”).
9.2.3.1 Competent Person Statement
I, Samson Malenga, confirm that I am the Competent Person for the Nambulwa/DZ Mineral Resource section
of this Report and:
I have read and understood the requirements of the 2012 Edition of the Australasian Code for Reporting
of Exploration Results, Mineral Resources and Ore Reserves (JORC Code, 2012 Edition).
I am a Competent Person as defined by the JORC Code, 2012 Edition, having five years’ experience that is
relevant to the style of mineralisation and type of deposit described in the Report, and to the activity for
which I am accepting responsibility.
I am a Fellow Member of The Geological Society of South Africa Reg No. 965948, and I am a Registered
Professional Natural Scientist with the South African Council for Natural Scientific Professions (SACNASP)
– Reg No 400181/06.
I have reviewed the relevant Mwepu Mineral Resource section of this Report to which this Consent
Statement applies.
I am a full-time employee of MMG Limited at the time of the estimation.
I have disclosed to the reporting company the full nature of the relationship between myself and the company,
including any issue that could be perceived by investors as a conflict of interest.
I verify that the Nambulwa and DZ Mineral Resource section of this Report is based on and fairly and accurately
reflects in the form and context in which it appears, the information in my supporting documentation relating
to the Nambulwa and DZ Mineral Resources.
9.2.3.2 Competent Person Consent
Pursuant to the requirements Clause 9 of the JORC Code 2012 Edition (Written Consent Statement)
With respect to the sections of this report for which I am responsible – the Nambulwa and DZ Mineral
Resources - I consent to the release of the 2021 Mineral Resources and Ore Reserves Statement as at 30 June
2021 Executive Summary and Technical Appendix Report and this Consent Statement by the directors of MMG
Limited:
_______________________________________________ Date:____________________________________________
Samson Malenga, BSc. Hons (Geol.),MBL, Pr.Sci.Nat, FGSSA
_______________________________________________ ____________________________________________
Signature of Witness: Witness Name and Residence: (e.g. town/suburb)
This signature was scanned for the exclusive use
in this document – the MMG Mineral Resource and Ore Reserve Statement as at 30 June 2021 – with
the author’s approval. Any other use is not
authorised.
This signature was scanned for the exclusive use in
this document – the MMG Mineral Resource and Ore Reserve Statement as at 30 June 2021 – with the
author’s approval. Any other use is not authorised.
8/10/2021
Serge Djemo
Lubumbashi, DRC

MMG | 2021 June Mineral Resources and Ore Reserves Statement - Appendix Page 205 of 205
10 HIGH LAKE
This Mineral Resources remains unchanged since reporting in 2013. This information can be found in the 2013
MMG Mineral Resources and Ore Reserves Statement as at 30 June 2013 Technical Appendix.
11 IZOK LAKE
This Mineral Resources remains unchanged since reporting in 2013. This information can be found in the 2013
MMG Mineral Resources and Ore Reserves Statement as at 30 June 2013 Technical Appendix.