EVALUATION OF ALTERNATE ORE AND WASTE HAULAGE ...
90
The intention of this report is to provide a high-level comparison of a few alternative hauling technologies, which can guide future work with the Original Equipment Manufacturers (OEM’s) and Operators to further investigate them. The report is a high level screening study based on a generalized and simplified mine plan and, as such, forward looking assumptions should not be based on it. The cost estimates are high-level (-50% to +100%) and the mining cost is in undiscounted nominal terms. Based on the information available at the time and the limited engagement from OEMs, Stantec made several assumptions to help guide the study. As technologies are tested and proven in the oil sands, the results from the study may change. Technical risks of the technologies in the oil sands mining environment and Alberta’s cold climate also need to be assessed and addressed -Canada’s Oil Sands Innovation Alliance Greenhouse Gas Environmental Priority Area
-
Upload
khangminh22 -
Category
Documents
-
view
1 -
download
0
Transcript of EVALUATION OF ALTERNATE ORE AND WASTE HAULAGE ...

The intention of this report is to provide a high-level comparison of a few alternative hauling technologies, which can guide future work with the Original Equipment Manufacturers (OEM’s) and Operators to further investigate them. The report is a high level screening study based on a generalized and simplified mine plan and, as such, forward looking assumptions should not be based on it.
The cost estimates are high-level (-50% to +100%) and the mining cost is in undiscounted nominal terms. Based on the information available at the time and the limited engagement from OEMs, Stantec made several assumptions to help guide the study. As technologies are tested and proven in the oil sands, the results from the study may change. Technical risks of the technologies in the oil sands mining environment and Alberta’s cold climate also need to be assessed and addressed
-Canada’s Oil Sands Innovation Alliance Greenhouse Gas Environmental Priority Area

EVALUATION OF ALTERNATE ORE
AND WASTE HAULAGE
TECHNOLOGIES
December 12, 2019
Prepared for:
Canada’s Oil Sands Innovation Alliance (COSIA)
Prepared by:
Stantec Consulting Ltd. 200, 325 – 25 Street SE Calgary, Alberta T2A 7H8
Project Number 129500171

EVALUATION OF ALTERNATE ORE AND WASTE HAULAGE TECHNOLOGIES
This document entitled EVALUATION OF ALTERNATE ORE AND WASTE HAULAGE TECHNOLOGIES was
prepared by Stantec Consulting Ltd. (“Stantec”) for the account of COSIA (the “Client”). Any reliance on this
document by any third party is strictly prohibited. The material in it reflects Stantec’s professional judgment in
light of the scope, schedule and other limitations stated in the document and in the contract between Stantec
and the Client. The opinions in the document are based on conditions and information existing at the time the
document was published and do not take into account any subsequent changes. In preparing the document,
Stantec did not verify information supplied to it by others. Any use which a third party makes of this document
is the responsibility of such third party. Such third party agrees that Stantec shall not be responsible for costs
or damages of any kind, if any, suffered by it or any other third party as a result of decisions made or actions
taken based on this document.
Prepared by (signature)
Keith Wilson, P.Eng.
EVALUATION OF ALTERNATE ORE AND WASTE HAULAGE TECHNOLOGIES
Table of Contents
EXECUTIVE SUMMARY ............................................................................................................ I
1.0 INTRODUCTION .......................................................................................................... 1.1
1.1 PURPOSE OF THE STUDY ......................................................................................... 1.1
1.2 STUDY APPROACH .................................................................................................... 1.2 1.2.1 Virtual Mine Site Description and Basis ....................................................... 1.3 1.2.2 Ore and Waste Haulage Technologies ........................................................ 1.9
1.3 ORGANIZATION OF THIS REPORT............................................................................ 1.9
2.0 OPTIONS SELECTION ................................................................................................ 2.1
2.1 INITIAL OPTIONS REVIEW ......................................................................................... 2.1
2.2 FINAL OPTION SELECTION ....................................................................................... 2.2
3.0 BASE CASE - CONVENTIONAL HAUL TRUCK ......................................................... 3.1
3.1 HAUL TECHNOLOGY OVERVIEW .............................................................................. 3.1
3.2 ANALYSIS METHODOLOGY ....................................................................................... 3.1
3.3 ASSUMPTIONS ........................................................................................................... 3.1 3.3.1 General Assumptions .................................................................................. 3.1 3.3.2 Costing Assumptions .................................................................................. 3.3 3.3.3 GHG Emission Assumptions ....................................................................... 3.4
3.4 TRUCK HOURS ........................................................................................................... 3.4
3.5 CAPITAL AND OPERATING COSTS ........................................................................... 3.7 3.5.1 Site Infrastructure ........................................................................................ 3.7 3.5.2 Equipment ................................................................................................... 3.7 3.5.3 Base Case Cost Summary .......................................................................... 3.7
3.6 PREDICTED GHG EMISSIONS ................................................................................... 3.8
3.7 CONCLUSIONS REGARDING THE BASE CASE ........................................................ 3.9
4.0 TROLLEY ASSIST CASE ............................................................................................ 4.1
4.1 HAUL TECHNOLOGY OVERVIEW .............................................................................. 4.1
4.2 ANALYSIS METHODOLOGY ....................................................................................... 4.1
4.3 ASSUMPTIONS ........................................................................................................... 4.2 4.3.1 General Assumptions .................................................................................. 4.2 4.3.2 Costing Assumptions .................................................................................. 4.2 4.3.3 GHG Emission Assumptions ....................................................................... 4.3
4.4 PRELIMINARY TROLLEY SYSTEM ANALYSIS .......................................................... 4.3
4.5 TRUCK HOURS ........................................................................................................... 4.5
4.6 CAPITAL AND OPERATING COSTS ........................................................................... 4.5 4.6.1 Site Infrastructure ........................................................................................ 4.5 4.6.2 Equipment ................................................................................................... 4.6 4.6.3 Trolley Assist Case Cost Summary ............................................................. 4.7
4.7 PREDICTED GHG EMISSIONS ................................................................................... 4.8
4.8 CONCLUSIONS REGARDING THE TROLLEY ASSIST CASE.................................... 4.9

EVALUATION OF ALTERNATE ORE AND WASTE HAULAGE TECHNOLOGIES
5.0 LNG SUBSTITUTION CASE ........................................................................................ 5.1
5.1 HAUL TECHNOLOGY OVERVIEW .............................................................................. 5.1
5.2 ANALYSIS METHODOLOGY ....................................................................................... 5.1
5.3 ASSUMPTIONS ........................................................................................................... 5.1 5.3.1 General Assumptions .................................................................................. 5.1 5.3.2 GHG Emission Assumptions ....................................................................... 5.2
5.4 TRUCK HOURS ........................................................................................................... 5.2
5.5 CAPITAL AND OPERATING COSTS ........................................................................... 5.2 5.5.1 Site Infrastructure ........................................................................................ 5.2 5.5.2 Equipment ................................................................................................... 5.4 5.5.3 LNG Substitution Case Cost Summary ....................................................... 5.4
5.6 PREDICTED GHG EMISSIONS ................................................................................... 5.6
5.7 CONCLUSIONS REGARDING THE LNG SUBSTITUTION CASE ............................... 5.7
6.0 REAR DUMP TRAILER CASE..................................................................................... 6.1
6.1 HAUL TECHNOLOGY OVERVIEW .............................................................................. 6.1
6.2 ANALYSIS METHODOLOGY ....................................................................................... 6.1
6.3 ASSUMPTIONS ........................................................................................................... 6.2 6.3.1 General Assumptions .................................................................................. 6.2 6.3.2 Costing Assumptions .................................................................................. 6.4 6.3.3 GHG Emission Assumptions ....................................................................... 6.4
6.4 TRUCK HOURS ........................................................................................................... 6.4
6.5 CAPITAL AND OPERATING COSTS ........................................................................... 6.6 6.5.1 Site Infrastructure ........................................................................................ 6.6 6.5.2 Equipment ................................................................................................... 6.6 6.5.3 Rear Dump Trailer Cost Summary .............................................................. 6.6
6.6 PREDICTED GHG EMISSIONS ................................................................................... 6.7
6.7 CONCLUSIONS REGARDING THE REAR DUMP TRAILER CASE ............................ 6.8
7.0 COMPARISON OF CASES .......................................................................................... 7.1
7.1 CAPTAL AND OPERATING COSTS ............................................................................ 7.1
7.2 PREDICTED GHG EMISSIONS ................................................................................... 7.3
7.3 RISK ANALYSIS .......................................................................................................... 7.4
8.0 CONCLUSIONS ........................................................................................................... 8.1
8.1 BASE CASE ................................................................................................................. 8.1
8.2 TROLLEY ASSIST CASE ............................................................................................. 8.1
8.3 LNG DIESEL SUBSTITUTION CASE ........................................................................... 8.1
8.4 REAR DUMP TRAILER ................................................................................................ 8.2
8.5 CONCLUSION ............................................................................................................. 8.3
9.0 REFERENCES ............................................................................................................. 9.1
APPENDIX A ............................................................................................................................. 1

EVALUATION OF ALTERNATE ORE AND WASTE HAULAGE TECHNOLOGIES
LIST OF TABLES
Table 1.1 VM3 Conventioal Case Annual Mine and Tailings Production Schedule ............................... 1.4 Table 1.2 VM3 Conventional Case Mine Waste Disposal Schedue (Mbcm) ......................................... 1.7 Table 3.1 Haul Segment Properties ....................................................................................................... 3.2 Table 3.2 Ultra Class Truck Fuel Burn ................................................................................................... 3.2 Table 3.3 Fixed Cycle Time Components .............................................................................................. 3.3 Table 3.4 Truck Time Usage Model ....................................................................................................... 3.3 Table 3.5 Base Case Ultra Class Truck Operating Cost Assumptions .................................................. 3.3 Table 3.6 Base Case Energy Cost Estimate .......................................................................................... 3.3 Table 3.7 Ultra Class Truck Purchase Price........................................................................................... 3.4 Table 3.8 Diesel Combustion GHG Emissions ....................................................................................... 3.4 Table 3.9 Base Case Cost Summary ..................................................................................................... 3.6 Table 4.1 Substation Operating Time Per Number of Simultaneous Trucks ......................................... 4.2 Table 4.2 Trolley Assist System Infrastructure Costs ............................................................................. 4.2 Table 4.3 Trolley Assist Ultra Class Truck Operating Cost .................................................................... 4.3 Table 4-4 Trolley Assist Case GHG Emission Assumptions .................................................................. 4.3 Table 4-5 Trolley Assist Case Site Infrastructure Capital Costs ............................................................. 4.5 Table 4.6 Trolley Assist Case Equipment Capital Costs ........................................................................ 4.5 Table 4.7 Trolley Assist Case LOM Cost Summary ............................................................................... 4.6 Table 4.8 Trolley System Benefit Analysis Summary ............................................................................. 4.8 Table 5.1 LNG Substitution Case GHG Emission Assumptions ............................................................ 5.2 Table 5.2 LNG Fugitive Emissions Assumptions ................................................................................... 5.2 Table 5.3 LNG Substitution Case Infrastructure Capital Cost Estimate ................................................. 5.3 Table 5.4 LNG Substitution Case Infrastructure Operating Cost Estimate ............................................ 5.3 Table 5.5 LNG Substitution Case Equipment Operating Csot Estimate ................................................ 5.4 Table 5.6 LNG Substitution Case GHG Emissions ................................................................................ 5.5 Table 6.1 Theoretical 793F Rear Dump Trailer Configureation ............................................................. 6.2 Table 6.2 793F Fuel Consumption ......................................................................................................... 6.3 Table 6.3 Rear Dump Trailer Fixed Cycle Times ................................................................................... 6.3 Table 6.4 250t Haul Truck and 400t Trailer Capital Cost ....................................................................... 6.4 Table 6.5 Rear Dump Trailer Operating Costs ....................................................................................... 6.4 Table 6.6 Rear Dump Trailer LOM Costs ............................................................................................... 6.6 Table 7.1 LOM CapEx and OpEx Cost Summary .................................................................................. 7.1 Table 7.2 LOM Energy Cnsumption and GHG Emisssion Summary ..................................................... 7.3 Table 7.3 Risk Analysis Summary .......................................................................................................... 7.4
LIST OF FIGURES
Figure 1-1 VM3 Conventioal Case Overburden Crest Advances ............................................................ 1.5 Figure 1-2 VM3 Conventional Case Site Layout ...................................................................................... 1.6 Figure 3-1 Base Case Truck Hours and Fleet Size ................................................................................. 3.5 Figure 3-2 Base Case Mining Cost Timeline ........................................................................................... 3.7 Figure 3-3 Base Case GHG Emissions Timeline ..................................................................................... 3.8 Figure 4-1 Trolley Assist Case Truck Hours ............................................................................................ 4.4 Figure 4-2 Trolley Assist Case Cost Timeline .......................................................................................... 4.6 Figure 4-3 Trolley Assist Case GHG Emissions Timeline ....................................................................... 4.7 Figure 4-4 Relationship Between Trolley System Length and Cost Savings by Road Type ................... 4.9 Figure 4-5 Average Trucks per Trolley Assist Substation ...................................................................... 4.10 Figure 5-1 50% LNG Substitution Case Cost Timeline ............................................................................ 5.5 Figure 5-2 90% LNG Substitution Case Cost Timeline ............................................................................ 5.5

EVALUATION OF ALTERNATE ORE AND WASTE HAULAGE TECHNOLOGIES
Figure 5-3 LNG Substitution Case GHG Emissions ................................................................................ 5.6 Figure 6-1 Rear Dump Trailer .................................................................................................................. 6.1 Figure 6-2 Average Cycle Time Comparison ........................................................................................... 6.5 Figure 6-3 Rear Dump Trailer Case Truck Hours .................................................................................... 6.5 Figure 6-4 Rear Dump Trailer Case Cost Timeline ................................................................................. 6.7 Figure 6-5 Rear Dump Trailer Case Emissions Timeline ........................................................................ 6.8 Figure 7-1 Comparison of CapEx and OpEx Costs ................................................................................. 7.2

EVALUATION OF ALTERNATE ORE AND WASTE HAULAGE TECHNOLOGIES
i
Executive Summary
Study Purpose and Cases
The purpose of this study was to assess the impacts on costs, mine site infrastructure requirements, and
GHGs for alternative or and waste haul technologies over a base mine plan. For the haulage technologies
listed below, full life of mine plans with relative costing were developed for the mine site conditions
described in the “Fines Management Study: Report Issued for Review February 2, 2017” submitted to the
COSIA DPL Group by Norwest Corporation (Norwest) in 2017 and in Table ES.1 below.
Table ES.1 VM3 Conventional Case Annual Mine and Tailings Production Schedule
Ore Grade Wt% Bitumen
Fines Wt% of Mineral
Waste to Ore Volume Ratio
Out of Pit Area Overburden
Type In-Pit
Foundation
10.7 22 1.6 Un-Constrained Dominant Clearwater
Poor (Basal Clays)
The alternative ore and waste hauling technologies assessed based on the VM3 site conditions include:
1. Base Case – Conventional Ultra Class (400t) haul trucks operating on diesel fuel
2. Trolley Assist Case – Ultra Class (400t) haul trucks with electric trolley assist on pre-determined
haul segments
3. LNG 50% Substitution Case – Ultra Class (400t) haul trucks with fumigated injection technology
resulting in a 50% LNG to diesel substitution rate
4. LNG 90% Substitution Case – Ultra Class (400t) haul trucks in direct injection technology
resulting in a 90% LNG to diesel substitution rate
5. Rear Dump Trailer Case – Utilizing smaller 250t haul trucks set up as tractor units to pull a trailer
with ultra class (400t) payload capacity.
For each of the cases, estimates of costs, site infrastructure, and GHG emissions were developed.
Mining Cost Results
Figure ES-1 illustrates the incremental undiscounted costs over the base case for each of the alternative
haulage technologies. Only costs related to the mine haul fleet which vary between the technologies were
estimated. All other costs were understood to be the same between the cases and were not considered
for the purpose of this study.

EVALUATION OF ALTERNATE ORE AND WASTE HAULAGE TECHNOLOGIES
ii
Figure ES-1 Estimated Incremental Costs Compared to the Base Case
• All cases resulted in decreased mining costs except for the rear dump trailer case which resulted
in increased life of mine cost. This assumes there are no extraordinary costs associated with
developing, testing, and implementing each technology.
• The LNG Case at 90% diesel substitution resulted in the lowest undiscounted cost. This assumes
that LNG is produced on-site using existing in-place natural gas service. LNG at 50% diesel
substitution and the trolley assist cases were essentially equivalent in cost over the life of mine.
Discussion of Mining Costs
Based on the assumptions for energy cost, diesel was the most expensive fuel used for the mine truck
fleet. Therefore, substitution of diesel for alternative energy sources reduced overall life of mine cost. The
trolley assist case reduced engine load on uphill gradients where the trolley system was installed by
powering the electric drive motors directly from the electrical grid. Additionally, fewer haul trucks are
required over the life of mine due to a significant increase in speed along trolley segments. The rear
dump trailer case increased the overall truck gross weight leading to increased cycle times. The
additional truck hours and truck units over the life of mine added cost despite the lower hourly operating
cost and capital purchase cost of the mine trucks themselves. As a truck using this configuration is not
currently in production, high level assumptions regarding truck performance and cost were required for
analysis. Fixed cycle time components including spot and dump times were increased to consider the
complexity and inefficiencies related to dump trailer operation. Additionally, this truck configuration was
applied to all mine material. There may be an opportunity to apply this technology to specific hauls where
rolling resistances and haul road gradients are limited and truck performance is not reduced significantly;
however, there were no haul routes that had reduced cycle times in the analysis. The LNG substitution
cases resulted in significantly reduced life of mine costs due to the relatively inexpensive cost of LNG
when compared to diesel. These cases assumed LNG would be produced on-site in an LNG plant using

EVALUATION OF ALTERNATE ORE AND WASTE HAULAGE TECHNOLOGIES
iii
existing natural gas service. Depending on technology development and overall LNG demand in the
Athabasca region, a regional LNG supplier may reduce the requirement for an on-site LNG plant;
however, the unit cost of LNG may increase from this analysis.
GHG Emission Results
Figure ES-2 shows the incremental GHG emissions compared to the base case conventional diesel-
powered truck fleet.
Figure ES-2 Estimated Incremental GHG Emissions Compared to the Base Case
All cases reduced life of mine GHG emissions with the exception of the LNG 50% substitution case. For
each case with electricity consumption, emissions were calculated using both the Alberta grid average
GHG intensity values found in the Carbon Offset Emission Factors Handbook published by the Alberta
Government and a GHG intensity for on-site co-gen power generation provided by COSIA.
GHG Emission Discussion
Due to Alberta’s reliance on coal, the GHG intensity factor for the Alberta grid average is significantly
higher than alternative electrical generation technologies. As shown, co-gen power generation can
significantly reduce the GHG emissions of an operation; therefore, two values are shown for the trolley
assist and LNG substitution cases. Trolley assist technology reduces diesel consumption significantly on
up-hill gradients where engine load factors are expected to be 100%. The GHG emission results are
highly sensitive to the GHG intensity of power generation due to the power demands associated with the
trolley assist technology. The rear dump trailer utilizes a smaller chassis and engine size to transport the
equivalent payload of an ultra-class truck. The increased payloads lead to longer cycle times and
increased truck hours over the life of the mine. However, the decreased fuel consumption of the smaller
engine offsets the increase in truck hours to slightly reduce diesel consumption over the life of mine. This
truck configuration was highly conceptual, and the assumptions made on truck performance and fuel

EVALUATION OF ALTERNATE ORE AND WASTE HAULAGE TECHNOLOGIES
iv
economy may be refined through further development altering the results of this study. LNG substitution
may reduce life of mine GHG emissions due to the lower GHG intensity associated with the combustion of
LNG. However, fugitive emissions, the release of methane gas into the environment during the transport
and storage of LNG, may offset the benefit of the lower combustion GHG intensity. Methane’s global
warming potential (GWP) is estimated to be 25 times that of carbon dioxide; therefore, direct release into
the environment is especially harmful. This is shown with the LNG 50% substitution case using fumigated
injection technology which is understood to suffer from fugitive emissions exceeding 4% of total fuel
usage. When accounting for fugitive emissions, the fumigated injection technology increased the overall
GHG emissions over the life of the mine. Direct injection technology associated with the 90% substitution
case has a much lower estimate of fugitive emissions of just 0.75%. Based on the assumptions in this
study, 90% diesel substitution would significantly reduce the GHG emissions over the life of the mine.
Further development of the LNG substitution technologies limiting or eliminating fugitive emissions would
provide further benefit on top of this analysis.

EVALUATION OF ALTERNATE ORE AND WASTE HAULAGE TECHNOLOGIES
Introduction
wn v:\1295\active\129500171\reports\final\alternate ore and waste technologies_final.docx 1.1
1.0 INTRODUCTION
Stantec Consulting Ltd. (Stantec) was commissioned by Canada’s Oil Sands Innovation Alliance (COSIA)
to complete a high-level study of selected alternative haulage technologies to further understand the
environmental and cost impacts for use in oil sands mining. This work was intended to build on the results
of studies prepared by AECOM and GTI Corporation (GTI Corp) which focused on less energy intensive
alternatives for ore handling in an oil sands mine.
Increased focus on reducing greenhouse gas emissions (GHG) from mine operations while reducing or
optimizing mine operating costs has resulted in the development of several alternative waste and ore
haulage technologies. Additionally, existing haulage technologies and methods which have been
implemented throughout the mining industry should be assessed for their viability for use in an oil sands
setting. The desire to advance the development and implementation of technologies that result in
decreased GHG intensity and cost is primarily due to the increased focus of regulators and the
communities on GHG emissions and the prolonged period of depressed prices of crude oil which began
in in 2014.
The operating oil sands open pit mines primarily utilize 400 short ton ultra-class mining trucks paired with
large electric cable or hydraulic shovels to haul material. The GHG emissions from diesel combustion in
mine haul trucks is considerable. Alternative technologies and methods of transporting ore and waste can
be assessed for environmental impacts following their implementation. Cost, equipment productivity, and
required mine infrastructure for operating diesel powered mine haul trucks is well understood by the oil
sands operators, with minor variation between operations. The alternative methods and technologies
available have been developed, to varying degrees, for full scale implementation which often results in
less confidence in the cost estimate and indirect impacts to the operation. Implementation of alternative
technologies in other global regions may be necessary or applicable due to factors such as limited
resources, mine geometry and geology, and weather that may differ in open pit oil sand scenarios.
GHG emissions can vary significantly between technologies as the combustion of LNG or the use of
electric trolley assist systems typically results in decreased GHG intensity as compared to diesel
combustion. However, it is necessary to understand the current development of the technology, the direct
and indirect consequences of implementing alternative technologies, and the overall impact to GHG
emissions.
1.1 PURPOSE OF THE STUDY
The primary purpose of the Study was to estimate, at a conceptual level, how selected ore and waste
haulage technologies could incrementally impact mining capital and operating costs (CapEx and OpEx)
and mine fleet GHG emissions.

EVALUATION OF ALTERNATE ORE AND WASTE HAULAGE TECHNOLOGIES
Introduction
wn v:\1295\active\129500171\reports\final\alternate ore and waste technologies_final.docx 1.2
1.2 STUDY APPROACH
The basis of the Study used a conceptual life of mine (LOM) plan completed on a virtual mine site
prepared for the “Fines Management Study: Report Issued for Review February 2, 2017” submitted to the
COSIA DPL Group by Norwest Corporation (Norwest) in 2017. The current Study focused on the costs
and emissions related to the mine haulage fleet only, no consideration was given to any other aspects of
mine development, cost, or impacts outside of this scope.
Work completed for the Study was primarily composed of the development of a conceptual life of mine
haul network, assessed for each status map period of the Fines Management Study. Haul routes were
drawn between source and destination centroids following a consistent process. The conceptual mine
plan used as a basis of this Study should be regarded as a pre-scoping level of detail as noted in the
Fines Management Study. Therefore, equipment hours, costs, and GHG emissions are considered
comparable to each other for identification of trends; however, cost estimates may not be directly
comparable to those based on more detailed engineering work such as pre-feasibility or feasibility
studies.
The Study focused on existing technologies that may be available for implementation at an oil sands mine
in the near future. A total of five cases were identified for evaluation listed below.
• Base Case – Conventional Ultra Class (400t) haul trucks operating on diesel fuel
• Trolley Assist Case – Ultra Class (400t) haul trucks with electric trolley assist on pre-determined
haul segments
• LNG 50% Substitution Case – Ultra Class (400t) haul trucks with fumigated injection technology
resulting in a 50% LNG to diesel substitution rate
• LNG 90% Substitution Case – Ultra Class (400t) haul trucks in direct injection technology
resulting in a 90% LNG to diesel substitution rate
• Rear Dump Trailer Case – Utilizing smaller 250t haul trucks set up as tractor units to pull a trailer
with ultra class (400t) payload capacity
In each case, the conceptual mine plan was unchanged, with the mine advance, ore and waste
movements, and placement constant. All cases were analyzed for incremental changes to the base case.
Each case was analyzed in the following order:
• Calculate mine truck fleet equipment hours
• Calculate mine truck fleet energy consumption and resulting GHG emissions
• Estimate mine CapEx and OpEx based on mine truck fleet and supporting energy technology
only

EVALUATION OF ALTERNATE ORE AND WASTE HAULAGE TECHNOLOGIES
Introduction
wn v:\1295\active\129500171\reports\final\alternate ore and waste technologies_final.docx 1.3
This evaluation was completed at a concept level and as such the associated cost estimates are
expected to be in the range of -50% to +100%.
In order to simulate the effects of a carbon tax on the selected technologies, a tax of $30/t for GHG
emissions was applied to years 1 – 4 of the planning cycle. This tax was increased to $50/t in year 5 and
onward.
1.2.1 Virtual Mine Site Description and Basis
The virtual mine site used for this Study was based on the VM3 Conventional Case (VM3) found in the
Fines Management Study. The conceptual mine plan was based on a recovery of 200,000 barrels of
whole bitumen per calendar day. The VM3 case annual mine and tailings production schedule is found in
Table 1.1.

EVALUATION OF ALTERNATE ORE AND WASTE HAULAGE TECHNOLOGIES
Introduction
wn v:\1295\active\129500171\reports\final\alternate ore and waste technologies_final.docx 1.4
Table.1 VM3 Conventional Case Annual Mine and Tailings Production Schedule
Period Ore (Mt)
Ore (Mbcm)
Mine Waste (Mbcm)
Ore Rejects (Mbcm)
FTT Deposit (Mm3)
Flot Tails Deposit (Mm3)
PSV U/F Deposit (Mm3)
FFT Inventory
(Mm3)
1 30.5 14.5 23.2 0.4 0.6 1.2 13.0 13.3
2 61.0 29.0 46.4 0.9 1.2 2.4 26.0 35.6
3 91.4 43.5 69.7 1.3 1.8 3.7 39.0 65.3
4 121.9 58.1 92.9 1.7 2.4 4.9 51.9 101.9
5 121.9 58.1 92.9 1.7 2.4 4.9 51.9 131.8
6 121.9 58.1 92.9 1.7 2.4 4.9 51.9 158.6
7 121.9 58.1 92.9 1.7 2.4 4.9 51.9 183.9
8 121.9 58.1 92.9 1.7 2.4 4.9 51.9 207.7
9 121.9 58.1 92.9 1.7 2.4 4.9 51.9 230.5
10 121.9 58.1 92.9 1.7 2.4 4.9 51.9 252.5
11 121.9 58.1 92.9 1.7 2.4 4.9 51.9 273.9
12 121.9 58.1 92.9 1.7 2.4 4.9 51.9 294.7
13 121.9 58.1 92.9 1.7 2.4 4.9 51.9 315.3
14 121.9 58.1 92.9 1.7 2.4 4.9 51.9 335.6
15 121.9 58.1 92.9 1.7 2.4 4.9 51.9 355.8
16 121.9 58.1 92.9 1.7 2.4 4.9 51.9 375.9
17 121.9 58.1 92.9 1.7 2.4 4.9 51.9 395.9
18 121.9 58.1 92.9 1.7 2.4 4.9 51.9 415.8
19 121.9 58.1 92.9 1.7 2.4 4.9 51.9 435.7
20 121.9 58.1 92.9 1.7 2.4 4.9 51.9 455.4
21 121.9 58.1 92.9 1.7 2.4 4.9 51.9 475.1
22 121.9 58.1 92.9 1.7 2.4 4.9 51.9 494.7
23 121.9 58.1 92.9 1.7 2.4 4.9 51.9 514.3
24 121.9 58.1 92.9 1.7 2.4 4.9 51.9 533.8
25 121.9 58.1 92.9 1.7 2.4 4.9 51.9 553.2
26 121.9 58.1 92.9 1.7 2.4 4.9 51.9 572.6
27 121.9 58.1 92.9 1.7 2.4 4.9 51.9 592.0
28 121.9 58.1 92.9 1.7 2.4 4.9 51.9 611.3
29 121.9 58.1 92.9 1.7 2.4 4.9 51.9 630.5
30 121.9 58.1 92.9 1.7 2.4 4.9 51.9 649.8
31 121.9 58.1 92.9 1.7 2.4 4.9 51.9 668.9
32 121.9 58.1 92.9 1.7 2.4 4.9 51.9 688.1
33 121.9 58.1 92.9 1.7 2.4 4.9 51.9 707.1
34 121.9 58.1 92.9 1.7 2.4 4.9 51.9 726.1
35 121.9 58.1 92.9 1.7 2.4 4.9 51.9 745.1
36 121.9 58.1 92.9 1.7 2.4 4.9 51.9 763.9
37 121.9 58.1 92.9 1.7 2.4 4.9 51.9 782.8
38 121.9 58.1 92.9 1.7 2.4 4.9 51.9 801.6
39 121.9 58.1 92.9 1.7 2.4 4.9 51.9 820.3
40 121.9 58.1 92.9 1.7 2.4 4.9 51.9 839.0
Totals 4,693.5 2,235.0 3,576.0 67.1 93.9 187.7 1,999.5
The layout for ex-pit and in-pit waste and tailings disposal areas was based on a high level mine face
advance schedule as shown on Figure 1-1. Tailings and waste disposal areas were designed to provide
sufficient containment based on the volumes in Table 1.1 and constructed to minimize waste haulage.

EVALUATION OF ALTERNATE ORE AND WASTE HAULAGE TECHNOLOGIES
Introduction
wn v:\1295\active\129500171\reports\final\alternate ore and waste technologies_final.docx 1.5
Figure 1-1 VM3 Conventional Case Overburden Crest Advances
The mine advances from the northeast corner of the pit to minimize distances to the External Tailings
Area (ETA) starter dyke and the Ore Preparation Plant (OPP). Mining progresses southward to open in-pit
tailings capacity before mining westward to expose the footprint for Dyke 1 to Dyke 3. For this Study, the
relocation of the ore crushers C1 and C2 to the locations identified as C3 and C4 was not incorporated.
The basis for this decision was to provide the largest distribution of hauls throughout the mine life for the
analysis of each technology. The site layout shown on Figure 1-2 shows the ex-pit and in-pit waste and
tailings disposal areas used in this Study. The Fines Management Study VM3 case truck hours were
based on adjusted straight-line centroid to centroid distances.

EVALUATION OF ALTERNATE ORE AND WASTE HAULAGE TECHNOLOGIES
Introduction
wn v:\1295\active\129500171\reports\final\alternate ore and waste technologies_final.docx 1.6
Figure 1-2 VM3 Conventional Case Site Layout
Mine waste disposal is typically hauled to the location resulting in the shortest haul, optimizing estimated
mine fleet truck hours. The mine waste disposal schedule is shown in Table 1.2. Average annual haul
distances for both ore and waste are shown in Table 1.3.
Additional details and descriptions of the conceptual mine plan and structures are available in the Fines
Management Study report.

EVALUATION OF ALTERNATE ORE AND WASTE HAULAGE TECHNOLOGIES
Introduction
wn v:\1295\active\129500171\reports\final\alternate ore and waste technologies_final.docx 1.7
Table 1.2 VM3 Conventional Case Mine Waste Disposal Schedule (Mbcm)
Period MWD
1 MWD
2 MWD
3 MWD
4 MWD
5 MWD
6 MWD
7 MWD
8
ETA Starter Dyke
ETA SD d/s
Buttress
Dyke 1
Dyke 2
Dyke 3
Dyke 4
ITA 1 ITA2 Total
PP
64.6
64.6
129.2
01
1.1
2.5
3.6
02
2.3
5.0
7.3
03
2.9
8.0
10.9
04 76.9 2.0
2.3
81.2
05 86.9 3.0 3.0
92.9
06 42.9 5.2 44.8
92.9
07 25.0 3.0 49.9
15.0
92.9
08
92.9
92.9
09
92.9
92.9
10
92.9
92.9
11
43.9 39.0
-
10.0
92.9
12 5.0
16.9 18.0
6.0
47.0
92.9
13
40.2
-
52.7
92.9
14
10.0
82.9
92.9
15
5.0
87.9
92.9
16
8.0
8.4
76.5
92.9
17
13.0
79.9
92.9
18
92.9
92.9
19
12.0
80.9
92.9
20
30.0
62.9
92.9
21
82.9
10.0
92.9
22
81.9
11.0
92.9
23
82.9
10.0
92.9
24
83.9
9.0
92.9
25
54.0
23.0
15.9 92.9
26
40.0
52.9 92.9
27
25.0 27.9
40.0
92.9
28
63.9
29.0
92.9
29
92.9
92.9
30
92.9
92.9
31
31.0
59.0 2.9
92.9
32
31.0
59.0 2.9
92.9
33
67.9
25.0
92.9
34
22.6 52.7
17.6
92.9
35
92.9
92.9
36
92.9
92.9
37
92.9
92.9
38
92.9
92.9
39
92.9
92.9
40
92.9
92.9
Total 236.7 84.1 437.2 105.2 - 514.6 368.1 610.1 64.6 17.8 42.4 - 290.0 48.4 688.6 68.8 3,576.6

EVALUATION OF ALTERNATE ORE AND WASTE HAULAGE TECHNOLOGIES
Introduction
wn v:\1295\active\129500171\reports\final\alternate ore and waste technologies_final.docx 1.8
Table 1.3 VM3 Conventional Case Mine Average Haul Distance (km one-way)
Period Ore Average Haul Distance
(km one-way) Waste Average Haul Distance
(km one-way)
PP 0.00 6.66
01 1.37 7.88
02 1.37 7.83
03 1.32 8.09
04 1.30 5.79
05 2.65 2.95
06 3.06 2.90
07 3.06 2.35
08 4.20 1.91
09 4.20 1.91
10 5.14 2.67
11 3.02 4.73
12 4.12 3.50
13 4.12 3.94
14 4.49 2.59
15 6.20 3.46
16 6.20 3.83
17 6.19 3.75
18 6.19 3.75
19 4.38 3.15
20 4.38 2.69
21 3.80 2.30
22 2.69 2.30
23 5.89 3.91
24 5.89 3.93
25 4.22 2.73
26 7.10 1.72
27 4.73 2.86
28 4.73 1.58
29 4.90 2.19
30 4.90 2.19
31 1.31 4.33
32 1.31 4.33
33 5.27 3.65
34 5.27 2.00
35 6.83 2.01
36 6.83 2.01
37 4.08 3.09
38 4.08 3.09
39 4.09 4.55
40 4.09 4.55

EVALUATION OF ALTERNATE ORE AND WASTE HAULAGE TECHNOLOGIES
Introduction
wn v:\1295\active\129500171\reports\final\alternate ore and waste technologies_final.docx 1.9
1.2.2 Ore and Waste Haulage Technologies
A total of four alternative haulage technologies were compared to conventional diesel powered rear dump
haul trucks typically used in the oil sands. These consisted of:
• Trolley Assist – Ultra Class (400t) haul trucks with electric trolley assist on pre-determined haul
segments
• LNG 50% Substitution – Ultra Class (400t) haul trucks
• LNG 90% Substitution – Ultra Class (400t) haul trucks
• Rear Dump Trailer – Utilizing smaller 250t haul trucks set up as tractor units to pull a trailer with
ultra class (400t) payload capacity.
All analyses were completed using the same conceptual mine plan described in the previous section, no
changes were made to the production or placement schedules between the cases.
1.3 ORGANIZATION OF THIS REPORT
This report is organized as follows:
• Section 1: This section describes the background for the Study, the approach and methodology,
and the design basis for cases evaluated.
• Section 2: This section provides details on the option selection process.
• Section 3 to Section 6: These sections provide the details for the Alternative Technology Cases.
Each case is described in similar sequential steps.
• Section 7: This section provides a comparison of the results from a cost, GHG emissions, and
risk perspective.
• Section 8: This section provides conclusions from the Study.

EVALUATION OF ALTERNATE ORE AND WASTE HAULAGE TECHNOLOGIES
Options Selection
wn v:\1295\active\129500171\reports\final\alternate ore and waste technologies_final.docx 2.1
2.0 OPTIONS SELECTION
2.1 INITIAL OPTIONS REVIEW
Stantec reviewed the range of alternate haulage technologies as identified previously by AECOM and
GTI. During the project kick-off meeting with the COSIA working group, these alternate technologies
were discussed.
AECOM had identified three non-haulage options that offered potential for reducing GGG emissions:
• Troughed belt conveyors
• Slurry pipeline
• RopeCon
AECOM also identified two haulage options that outperformed their base case which consisted of
conventional diesel haulage:
• Belly dump haulage
• Trolley Assist
The non-haulage options were deferred as they were considered to be beyond the scope of this
evaluation. The meeting attendees, which included representatives from current oil sands operators,
concluded that the belly dump haulage option was not suited for implementation in the oil sands and was
therefore excluded from further study.
GTI identified over forty technologies that were further subdivided into four categories:
• Alternative fuels
• Electrification
• Powertrain
• Miscellaneous Improvements
The meeting attendees identified the following options as meriting another level of review in determining
which 3 options would be carried forward in the technology review process.
• CNG powered haulage with regenerative breaking
• LNG powered haulage with regenerative breaking
• Trolley Assist technologies

EVALUATION OF ALTERNATE ORE AND WASTE HAULAGE TECHNOLOGIES
Options Selection
wn v:\1295\active\129500171\reports\final\alternate ore and waste technologies_final.docx 2.2
• Renewable fuels
• Diesel Hybrid technologies
• Other novel haul truck designs
2.2 FINAL OPTION SELECTION
Stantec had originally envisioned engaging the major equipment manufacturers to provide support related
to the selected haulage technologies. This assumption proved to be incorrect as the manufacturers were
unwilling to engage Stantec with advice or input related to future haulage technology or support related to
expected CapEx or OpEx.
This reluctance on the part of the major equipment manufacturers limited the ability to explore alternate
technology options related to specific CNG/LNG, renewable fuel, regenerative breaking, or diesel hybrid
powered haul trucks. As a result, Stantec and the COSIA working group chose to evaluate two LNG
powered technologies with diesel substitutions of 50% and 90% without delving into the details of the
specific engine technologies. It was agreed that this range of potential diesel substitutions would be
reasonable given the state of current and near future technologies.
A Trolley Assist technology remained as one of the options for review along with a rear dump trailer that
could potentially haul an Ultra-Class payload with a smaller tractor unit. In summary the four alternate
technologies consisted of:
• Trolley Assist – Ultra Class (400t) haul trucks
• LNG 50% Substitution – Ultra Class (400t) haul trucks
• LNG 90% Substitution – Ultra Class (400t) haul trucks
• Rear Dump Trailer – Utilizing smaller 250t haul trucks set up as tractor units to pull a trailer with
Ultra Class (400t) payload capacity

EVALUATION OF ALTERNATE ORE AND WASTE HAULAGE TECHNOLOGIES
Base Case - Conventional Haul Truck
wn v:\1295\active\129500171\reports\final\alternate ore and waste technologies_final.docx 3.1
3.0 BASE CASE - CONVENTIONAL HAUL TRUCK
Most currently operating open pit oil sands mines operate diesel fueled ultra class rear dump haul trucks
with a payload of approximately 400 short tons. The conventional case uses assumptions typical of an
existing operating oil sands open pit mine.
3.1 HAUL TECHNOLOGY OVERVIEW
Diesel fueled haul trucks are deployed in open pit mines throughout the world, including mineable oil
sands. Trucks are powered by a large diesel combustion engine and can be electric or mechanically
driven. Infrastructure is relatively simple, with on site fueling stations located within the mine site limiting
impact to operations when fueling is required. A stable supply of diesel and a comprehensive supply
network in Alberta results in a relatively low risk and low complexity operating environment.
3.2 ANALYSIS METHODOLOGY
The base case analysis was completed following a conventional truck hour estimation methodology.
Typical haul routes were drawn in Hexagon’s MineSight software between source and destination
centroids, following a simplistic road network accounting for ramp grades, on-bench haul segments, and
long term pit access ramps. Lines were exported and processed in Microsoft Excel, attributing haul
segments with properties such as road grade, rolling resistance, and speed restrictions as shown in Table
3.1. The processed haul routes were imported into RPM’s Talpac software where an estimate of empty
and loaded travel times and engine duty cycle was simulated using the current CAT 797F haul truck from
the Talpac equipment database.
Talpac data was exported for individual segments where diesel consumption was estimated based on
engine duty cycle. Assumptions regarding estimated fuel burn of an ultra-class truck are shown below in
Table 3.2. Total cycle time was estimated as the combination of the Talpac travel times and the fixed
cycle time components shown in Table 3.3.
Capital and operating costs were then calculated based on annual total fleet truck hours and time usage
assumptions detailed in Tables 3.4 - 3.7.
Greenhouse gas emissions were then estimated based on the diesel fuel combustion and the GHG
intensity factor for diesel shown in Table 3.8.
3.3 ASSUMPTIONS
3.3.1 General Assumptions
Talpac import data was prepared based on MineSight string data with segments attributed with the below
properties.
EVALUATION OF ALTERNATE ORE AND WASTE HAULAGE TECHNOLOGIES
Base Case - Conventional Haul Truck
wn v:\1295\active\129500171\reports\final\alternate ore and waste technologies_final.docx 3.2
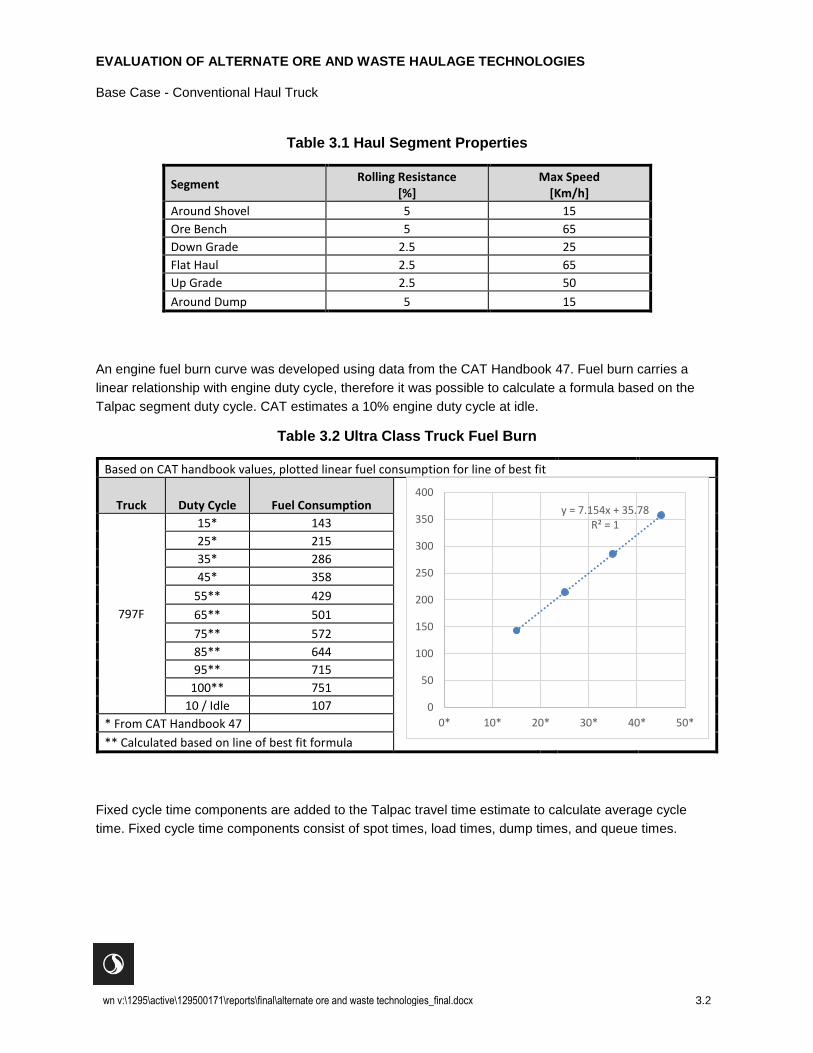
Table 3.1 Haul Segment Properties
Segment Rolling Resistance
[%] Max Speed
[Km/h]
Around Shovel 5 15
Ore Bench 5 65
Down Grade 2.5 25
Flat Haul 2.5 65
Up Grade 2.5 50
Around Dump 5 15
An engine fuel burn curve was developed using data from the CAT Handbook 47. Fuel burn carries a
linear relationship with engine duty cycle, therefore it was possible to calculate a formula based on the
Talpac segment duty cycle. CAT estimates a 10% engine duty cycle at idle.
Table 3.2 Ultra Class Truck Fuel Burn
Based on CAT handbook values, plotted linear fuel consumption for line of best fit
Truck Duty Cycle Fuel Consumption
797F
15* 143
25* 215
35* 286
45* 358
55** 429
65** 501
75** 572
85** 644
95** 715
100** 751
10 / Idle 107
* From CAT Handbook 47
** Calculated based on line of best fit formula
Fixed cycle time components are added to the Talpac travel time estimate to calculate average cycle
time. Fixed cycle time components consist of spot times, load times, dump times, and queue times.
y = 7.154x + 35.78R² = 1
0
50
100
150
200
250
300
350
400
0* 10* 20* 30* 40* 50*

EVALUATION OF ALTERNATE ORE AND WASTE HAULAGE TECHNOLOGIES
Base Case - Conventional Haul Truck
wn v:\1295\active\129500171\reports\final\alternate ore and waste technologies_final.docx 3.3
Table 3.3 Fixed Cycle Time Components
Segment Segment Time
Spot @ Shovel 0.5
Spot @ Dump 0.5
Load 2.0
Dump 1.3
Queue Total 2.0
Total Fixed Cycle Time 6.3
Truck fleet hours were based on a time usage model including physical availability (PA), use of availability
(UA), and operating efficiency (OE).
Table 3.4 Truck Time Usage Model
Truck KPI's
Truck UA 90%
Truck PA 82%
Truck OE 90%
NOH / Truck 5,818 per year
Lifetime 70,000
3.3.2 Costing Assumptions
Operating costs were based on annual total truck fleet hours and diesel consumption.
Table 3.5 Base Case Ultra Class Truck Operating Cost Assumptions
Expense Cost (C$/NOH)
Parts 350.00
Lube 30.00
Tires 90.00
Maintenance Labour 216.87
Operator Labour 86.70
Total 773.57
Table 3.6 Base Case Energy Cost Estimate
Energy Cost (C$/L)
Diesel 0.90
Capital costs are based on a truck lifetime of 70,000 hours, increasing to 100,000 hours towards end of
mine life to reduce truck purchases in the final operating years of the mine. The truck purchase price is

EVALUATION OF ALTERNATE ORE AND WASTE HAULAGE TECHNOLOGIES
Base Case - Conventional Haul Truck
wn v:\1295\active\129500171\reports\final\alternate ore and waste technologies_final.docx 3.4
estimated in Table 3.7, this value is considered reasonable for comparison between the cases, however,
actual purchase cost for an ultra-class truck varies with the specific truck model, features, and the
operators negotiation with the manufacturer.
Table 3.7 Ultra Class Truck Purchase Price
Truck Purchase Price (C$)
Ultra Class 6,700,000
3.3.3 GHG Emission Assumptions
Greenhouse gas emissions for diesel consumption are based on the Carbon Offset Emission Factors
Handbook published by the Alberta Government in March 2015. CO2eq intensity for diesel was calculated
by incorporating the Global Warming Potential of Methane and N2O as shown in Table 3.8.
Table 3.8 Diesel Combustion GHG Emissions
Emission Factor Emissions
CO2 Emissions 2.663 x 10⁻³ t/L
CH4 Emissions 0.133 x 10⁻³ t/L
N2O Emissions 0.400 x 10⁻³ t/L
CH4 GWP 25
N2O GWP 298
CO2eq Emissions 2.786 x 10⁻³ t/L
3.4 TRUCK HOURS
Truck hours for the base case fleet were calculated with the conceptual mine material balance and total
cycle times. Minor waste smoothing was performed to reduce truck hour requirement spikes in Year 6, 23,
24, and 26. Total fleet truck hours averaged approximately 400,000 NOH/yr with a total fleet size of
approximately 70 ultra class trucks as illustrated on Figure 3-1.
For this study, haul strings were drawn from each source centroid to each structure source destination for
the specific status map. Haul strings were created to account for source and destination elevations, ramp
locations, and advancing face configurations to simulate realistic haul profiles for analysis. As shown in
Table 3.9, haul distances have consistently increased when compared to the VM3 Conventional Case
from the Fines Management Study which estimated straight line centroid to centroid distances. As the
Fines Management Study was focused on fluid fines inventory, this method was applicable and provided
a reasonable estimate of truck hours to compare incremental variance between the cases. However, this
Study required further analysis of the truck haul profile segments in order to simulate conditions in a
typical operating oil sands mine. As shown, haul distances have increased most significantly for in-pit

EVALUATION OF ALTERNATE ORE AND WASTE HAULAGE TECHNOLOGIES
Base Case - Conventional Haul Truck
wn v:\1295\active\129500171\reports\final\alternate ore and waste technologies_final.docx 3.5
mine waste structures where the haul would be required to either ramp down to pit bottom for access to
dyke and low level in-pit dumps or use a waste bench access road along the pit wall for waste dumps at
higher elevations. Life of mine haul profile maps are shown in Appendix A.
Figure 3-1 Base Case Truck Hours and Fleet Size

EVALUATION OF ALTERNATE ORE AND WASTE HAULAGE TECHNOLOGIES
Base Case - Conventional Haul Truck
wn v:\1295\active\129500171\reports\final\alternate ore and waste technologies_final.docx 3.6
Table 3.9 Base Case vs VM3 Fines Study Haul Distances
Period
VM3 Fines Study Base Case
Ore Average Haul Distance
(km one-way)
Waste Average Haul Distance
(km one-way)
Ore Average Haul Distance
(km one-way)
Waste Average Haul Distance
(km one-way)
PP 0.0 6.7 0.0 8.9
01 1.4 7.9 3.0 10.9
02 1.4 7.8 3.0 10.9
03 1.3 8.1 2.9 11.1
04 1.3 5.8 2.9 7.3
05 2.6 2.9 2.9 7.2
06 3.1 2.9 3.5 5.1
07 3.1 2.3 3.5 4.5
08 4.2 1.9 4.2 3.4
09 4.2 1.9 4.2 3.4
10 5.1 2.7 5.4 2.8
11 3.0 4.7 4.4 6.7
12 4.1 3.5 4.0 6.8
13 4.1 3.9 4.0 6.8
14 4.5 2.6 5.1 6.0
15 6.2 3.5 6.3 8.2
16 6.2 3.8 6.3 8.2
17 6.2 3.8 8.1 3.9
18 6.2 3.8 8.1 3.8
19 4.4 3.2 6.2 10.0
20 4.4 2.7 6.2 8.9
21 3.8 2.3 5.5 6.0
22 2.7 2.3 5.5 6.0
23 5.9 3.9 8.7 6.1
24 5.9 3.9 8.7 6.1
25 4.2 2.7 7.5 5.4
26 7.1 1.7 10.4 8.7
27 4.7 2.9 8.6 5.3
28 4.7 1.6 8.6 4.2
29 4.9 2.2 9.5 4.5
30 4.9 2.2 9.5 4.5
31 1.3 4.3 8.2 4.5
32 1.3 4.3 8.2 4.5
33 5.3 3.7 10.3 6.5
34 5.3 2.0 10.3 5.1
35 6.8 2.0 11.9 3.7
36 6.8 2.0 11.9 3.7
37 4.1 3.1 9.6 7.5
38 4.1 3.1 9.6 7.5
39 4.1 4.5 9.1 7.1
40 4.1 4.5 9.1 7.1

EVALUATION OF ALTERNATE ORE AND WASTE HAULAGE TECHNOLOGIES
Base Case - Conventional Haul Truck
wn v:\1295\active\129500171\reports\final\alternate ore and waste technologies_final.docx 3.7
3.5 CAPITAL AND OPERATING COSTS
Capital and Operating Costs are estimated based on fleet truck hours. The Base Case is assumed to
have no incremental capital infrastructure planned as the infrastructure is required in all cases.
3.5.1 Site Infrastructure
No additional site infrastructure is required in the base case.
3.5.1.1 Capital Cost
No additional site infrastructure is required in the base case.
3.5.1.2 Operating Expenses
No additional site infrastructure is required in the base case.
3.5.2 Equipment
Equipment for the base case consists entirely of the conventional ultra class mining trucks.
3.5.2.1 Capital Cost
Capital cost is based on the annual required fleet hours and replacement schedule for each truck. Total
truck CapEx is estimated at $1,434M.
3.5.2.2 Operating Expenses
Operating cost includes operator and maintenance labour, parts, tires, and lube applied per net operating
hour. Mine haulage fleet fuel consumption is based on estimated fuel consumption by truck cycle and is
included in the OpEx estimate. Total OpEx over the 40-year mine life is estimated to be $17,233M.
3.5.3 Base Case Cost Summary
Total costs are $19,500M over the 40-year mine life for the base case. Truck operating costs make up
61% of the total estimated cost, with diesel accounting for nearly 28% of total mine cost. The base case
cost estimate includes capital cost for mining truck purchases and related operating expenses as shown
in Table 3.9. Annual cost varies with truck fleet hours based on length and profile of hauls and the
replacement schedule for mine haul trucks as shown on Figure 3-2.
Table 3.9 Base Case Cost Summary
Costs Total Cost ($M) Unit Cost ($/BCM)
Truck CAPEX 1,434 0.25
Truck OPEX 11,854 2.04
Diesel 5,379 0.93
Carbon Tax 811 0.14
Total 19,477 3.35

EVALUATION OF ALTERNATE ORE AND WASTE HAULAGE TECHNOLOGIES
Base Case - Conventional Haul Truck
wn v:\1295\active\129500171\reports\final\alternate ore and waste technologies_final.docx 3.8
Figure 3-2 Base Case Mining Cost Timeline
3.6 PREDICTED GHG EMISSIONS
Greenhouse gas emissions are estimated for the energy consumed by the truck fleet only. Emissions
from other parts of the operation such as other mobile equipment and processing are assumed to be
constant between all cases and were not considered. GHG emissions are calculated solely on the
consumption of diesel fuel which varies with the truck fleet hours and average engine duty cycle. The total
GHG emissions over the LOM was estimated to be 16.6 Mt CO2eq. The annual emission diesel
consumption and corresponding emissions are shown on Figure 3-3.

EVALUATION OF ALTERNATE ORE AND WASTE HAULAGE TECHNOLOGIES
Base Case - Conventional Haul Truck
wn v:\1295\active\129500171\reports\final\alternate ore and waste technologies_final.docx 3.9
Figure 3-3 Base Case GHG Emissions Timeline
3.7 CONCLUSIONS REGARDING THE BASE CASE
The base case is a conventional open pit mining estimate. Truck hours are generated from a simplistic
haul network simulated by the Talpac software. Fuel burn rates are typically applied as an average per
net operating hour and therefore fuel burn by duty cycle remains theoretical and is difficult to verify. Diesel
consumption could, therefore, vary with a more detailed analysis or with operator data. However, this
methodology is applied consistently to the other cases and provides a fair comparison.
The base case provides the basis of analysis for the remaining cases.

EVALUATION OF ALTERNATE ORE AND WASTE HAULAGE TECHNOLOGIES
Trolley Assist Case
wn v:\1295\active\129500171\reports\final\alternate ore and waste technologies_final.docx 4.1
4.0 TROLLEY ASSIST CASE
Trolley assist systems have been implemented in several open pit mines throughout the world; however,
are relatively rare in North America.
4.1 HAUL TECHNOLOGY OVERVIEW
Trolley assist systems provide electric current from an overhead wire directly to the electric drive motors
in a diesel-electric haul truck, bypassing the diesel engine and therefore reducing the engine duty cycle to
idle for the period the truck is connected to the system. The trolley assist system typically consists of an
electric substation connected to a high voltage cable strung along a semi-permanent haul route. Mine
haul trucks must have a pantograph and control system installed to facilitate connection to the trolley
cable.
Trolley assist systems provide benefits to conventional diesel-powered operations by reducing engine
duty cycle and therefore diesel consumption which may be advantageous in regions where diesel supply
is limited. In most regions, GHG emissions from electrical generation are of lower intensity than that of
diesel combustion, leading to an overall reduction to GHG emissions. However, this is highly dependent
on the method of electrical generation as GHG intensity between coal, natural gas, and renewable
electrical generation may significantly alter the results of analysis.
4.2 ANALYSIS METHODOLOGY
Using the base case haul strings and material balance as a basis, opportunities for trolley assist systems
was assessed based on haul road lifespan and extent of use. Typically, waste hauls primarily operate
along overburden benches that are part of the active mining face, and there is limited opportunity to install
a trolley assist system. Pit floor access ramps, such as ore haul ramps, are the primary candidate as they
are typically long term roads that are used consistently throughout their lifespan.
Specific haul segments that were candidates for a trolley assist system were identified for each haul
system. The base case engine duty cycle was reduced to idle along these segments, and the segment
cycle time was reduced to account for an estimated 40% increase in loaded uphill speed as per
discussions with suppliers. Diesel consumption for each segment was recalculated and electrical usage
was estimated by assuming an energy consumption equal to the gross engine power over the segment
time connected to the trolley system.
Truck hours, diesel and electricity consumption, GHG emissions, and costs were then re-estimated using
the same logic as utilized in the base case. Infrastructure cost was estimated based on the active trolley
system in each year and required truck infrastructure for truck fleets assigned to the trolley assist haul
systems.

EVALUATION OF ALTERNATE ORE AND WASTE HAULAGE TECHNOLOGIES
Trolley Assist Case
wn v:\1295\active\129500171\reports\final\alternate ore and waste technologies_final.docx 4.2
4.3 ASSUMPTIONS
4.3.1 General Assumptions
The majority of assumptions apply from the base case. Truck productivities on the haul segments where
trolley assist was installed were increased to account for the 40% increase in truck speed. Power
consumption while on the trolley system was estimated to be equal to the gross output power of a CAT
797 engine, or 2,983 KW.
The Siemens E-House 11 MW substation was understood to be the most powerful system available at
the time of the Study. The substation is capable of powering between one and four haul trucks over a
maximum trolley length of 850 m, the maximum time the trolley system is capable of powering a given
number of trucks is shown in Table 4.1.
Table 4.1 Substation Operating Time per Number of Simultaneous Trucks
Simultaneous Trucks Operating Time
1-2 Continuously
3 10 minutes
4 1 minute
4.3.2 Costing Assumptions
Additional cost assumptions in the trolley assist case primarily consist of the cost to purchase and install
the required mine site and haul truck infrastructure. Quotes were provided by a supplier familiar with the
system. Infrastructure costs are defined in Table 4.2. Due to cable expansion and contraction due to heat
and cable wear, it was assumed that cable could not be reused following trolley system decommissioning.
However, it was assumed that the substations could be reused, at an estimated 40% of the cost of a new
substations, accounting for pad prep, equipment moves, and rehabilitation and maintenance of the unit.
Table 4.2 Trolley Assist System Infrastructure Costs
Infrastructure Component Cost (C$)
Cable Length / Substation 850 m
Cable Cost 1,600,000
Cable Reuse None
Substation Cost 3,500,000
Substation Relocation Cost 1,400,000
Truck Pantograph Cost 54,000
Truck Controls Cost 380,000
Due to the reduced duty cycle on engine components and the theoretical improvement in road
maintenance required to operate a trolley assist system, it was assumed that maintenance costs would
decrease from the base case. A 10% reduction in parts and maintenance labour per net operating hour
was estimated as shown in Table 4.3.

EVALUATION OF ALTERNATE ORE AND WASTE HAULAGE TECHNOLOGIES
Trolley Assist Case
wn v:\1295\active\129500171\reports\final\alternate ore and waste technologies_final.docx 4.3
Table 4.3 Trolley Assist Ultra Class Truck Operating Cost
Expense Cost (C$/NOH)
Parts 315.00
Lube 30.00
Tires 90.00
Maintenance Labour 195.18
Operator Labour 86.70
Total 716.88
4.3.3 GHG Emission Assumptions
Diesel combustion emissions are considered the same as the base case. Electrical generation emissions
are estimated from the Carbon Offset Emission Factors Handbook published by the Alberta Government
in March 2015 as shown in Table 4.4. The Alberta electrical grid still consists of significant coal fired
generation; as a sensitivity, the GHG emissions related to a site-based co-generation system have been
calculated based on a GHG intensity factor of 0.100 x 10⁻³ t/KWh as provided by the COSIA group.
4.4 Trolley Assist Case GHG Emission Assumptions
Energy Type CO2eq Emissions
Diesel 2.786 x 10⁻³ t/L
Electricity AB Average 0.640 x 10⁻³ t/KWh
Electricity Co-Gen 0.100 x 10⁻³ t/KWh
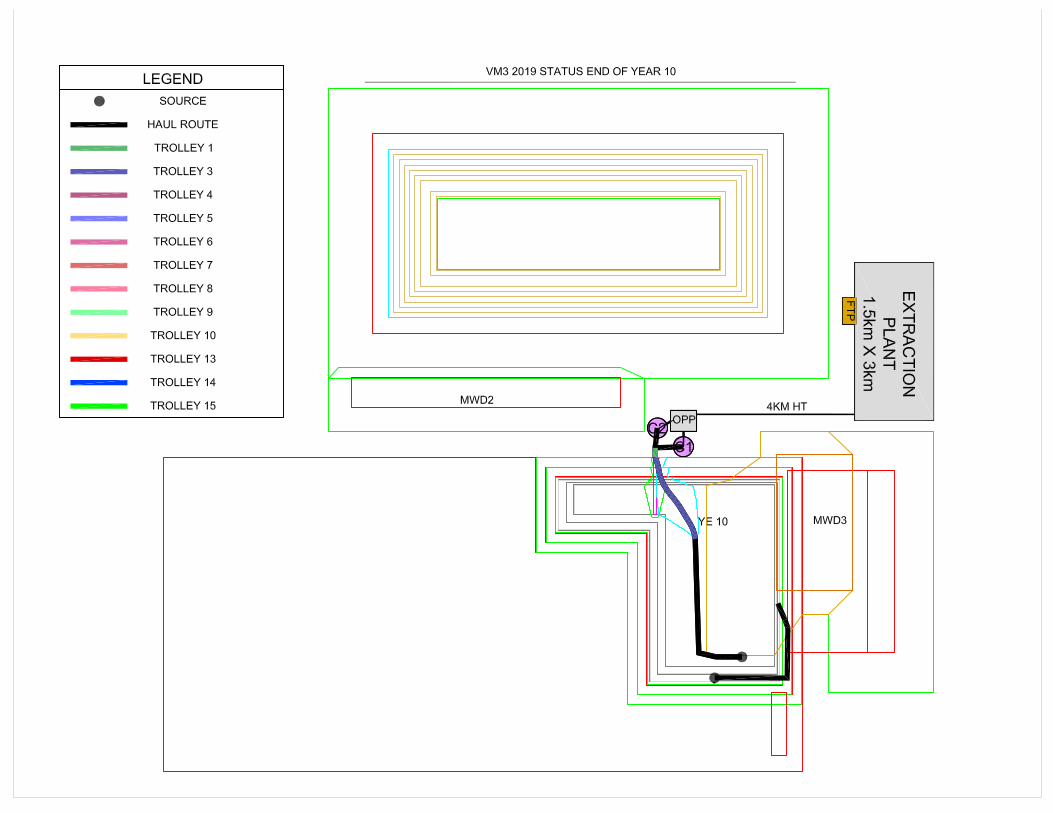
4.4 PRELIMINARY TROLLEY SYSTEM ANALYSIS
A high-level analysis of the haulage routes was completed to identify routes which provide the highest
benefit to GHG emissions and system cost. This analysis assessed each trolley system independently,
assuming the full capital cost for substations and cable for each system. Equipment capital cost was not
considered as this was understood to be relatively insignificant and applied to all systems throughout the
mine life. As shown in Table 4.5, typically, long term ore hauls along pit access ramps provide the highest
return on investment. Waste hauls such as trolley systems 2, 4, 5, 11, and 12 are often found on
overburden benches requiring limited uphill haulage and waste is assigned to several disposal areas
reducing the overall usage of any given haul system resulting in near break even or negative returns. Flat
hauls such as trolley systems 7, 9, and 14 can provide significant benefits if the total utilization of the
system is high enough over an extended lifetime. All trolley systems with any incremental savings
compared to the base case were selected for the LOM analysis as the primary focus of the scenario is to
reduce GHG emissions. The relationship between trolley length and cost savings, by type of haul is
shown on Figure 4-4.

EVALUATION OF ALTERNATE ORE AND WASTE HAULAGE TECHNOLOGIES
Trolley Assist Case
wn v:\1295\active\129500171\reports\final\alternate ore and waste technologies_final.docx 4.4
Table 4.5 Trolley System Benefit Analysis Summary
Trolley System
ID Material Type
First Year of Operation
LifeSpan (Years)
Length (Km)
Incr Savings to Base Case ($M)
Incr Emissions (CO2eq kt)
1 Ore Ramp 1 20 1.3 $ 65.9 -97
2 Waste Ramp 6 2 0.7 $ (4.0) -1
3 Ore Ramp 8 4 1.8 $ 41.5 -71
4 Waste Ramp 11 3 0.7 $ 3.0 -10
5 Waste Ramp 11 3 0.9 $ 1.3 -13
6 Ore Ramp 12 9 1.8 $ 90.9 -135
7 Ore Flat 15 4 3.1 $ 18.3 -45
8 Ore Ramp 21 12 1.3 $ 100.3 -142
9 Ore Flat 21 20 2.8 $ 115.2 -155
10 Ore Ramp 23 10 0.7 $ 42.0 -60
11 Waste Ramp 25 5 1.2 $ (1.4) -10
12 Waste Flat 25 5 1.6 $ (5.1) -4
13 Ore Ramp 32 9 2.1 $ 110.0 -161
14 Ore Flat 32 9 2.2 $ 42.6 -73
15 Ore Ramp 38 3 0.5 $ 6.4 -14
Figure 4-1 Relationship Between Trolley System Length and Cost Savings by Road Type

EVALUATION OF ALTERNATE ORE AND WASTE HAULAGE TECHNOLOGIES
Trolley Assist Case
wn v:\1295\active\129500171\reports\final\alternate ore and waste technologies_final.docx 4.5
4.5 TRUCK HOURS
Truck hours are largely comparable to the base case, the 40% increase in truck speed when on trolley
assist segments resulted in a decrease of overall truck hours by 3.5%. Over the life of mine, seven fewer
mine haul trucks are required to meet the total material movement. Total fleet truck hours are shown on
Figure 4-2. Appendix A shows the annual mine status maps with the trolley assist systems in place.
Figure 4-2 Trolley Assist Case Truck Hours
4.6 CAPITAL AND OPERATING COSTS
The main expenses involved in a trolley assist system are the infrastructure components including the
substation, cable, truck pantographs, and the electricity required to operate the trucks when attached to
the system. The cost of these components is offset by the reduced diesel consumption, reduced
operating cost per operating hour, and reduced fleet truck hours requiring less trucks overall.
4.6.1 Site Infrastructure
In general, the majority of the site infrastructure required for trolley assist systems would already exist in
an operating oil sands mine. Additional infrastructure consists of substations and the overhead DC
catenary system along the selected haul route. As discussed above, the Siemens 11MW substation was
selected as Siemens is currently believed to be one of the industry leaders in trolley assist technology.

EVALUATION OF ALTERNATE ORE AND WASTE HAULAGE TECHNOLOGIES
Trolley Assist Case
wn v:\1295\active\129500171\reports\final\alternate ore and waste technologies_final.docx 4.6
4.6.1.1 Capital Cost
Capital costs for the trolley assist infrastructure were estimated based on the mine development.
Substations were purchased in the year required or reused if decommissioned in the previous year. It was
assumed that no reuse of the poles or cable is possible based on discussions with the provider. It is
believed that cable reuse is challenging due to cable wear and effects of repetitive expansion and
contraction resulting from cable heat. Life of mine infrastructure capital costs are shown in Table 4.6.
Table 4.6 Trolley Assist Case Site Infrastructure Capital Costs
Expense Unit Cost (C$M) Cost (C$M)
Cable Installation 1.6 / km 30.5
Substation Purchase 3.5 45.5
Substation Relocation 1.4 22.4
Total 98.4
4.6.1.2 Operating Expenses
Incremental site operating expenses were not calculated. It was assumed the existing line crews on site
have the capability to maintain the equipment.
4.6.2 Equipment
Equipment costs are dominated by the truck purchase cost and operating cost. Pantographs and control
systems were assumed to be installed as required, and energy costs recalculated based on diesel and
electricity consumption.
4.6.2.1 Capital Cost
The trolley assist system was assumed to be active beginning in the first year of production throughout
the entire mine life. Capital costs were assumed to occur in the year required with no lead time. As costs
are undiscounted, this has limited impact on the Study.
Overall, fewer trucks were required to be purchased over the LOM as total fleet truck hours were reduced
due to increased travel speeds on the trolley segments. Pantographs and control systems were installed
on the number of trucks required to operate on the trolley assist haul systems. Trucks were retrofitted with
the trolley assist equipment as required based on the annual truck requirements and replacement
schedules. This may provide a slightly conservative estimate as equipment optimization may ensure
trolley assist equipment is not installed on a truck nearing its lifetime hours. However, the pantographs
and control systems were assumed to have the same replacement schedule as the haul trucks
themselves. Equipment was not reused on a replacement truck nor were the pantographs assumed to
require replacement either due to limited life expectancy or anticipated damage. The assumptions may be
refined with further investigation; however, the total cost of the pantographs and control systems is
estimated to be less than 5% of the total life of mine CAPEX and adjustments to these assumptions

EVALUATION OF ALTERNATE ORE AND WASTE HAULAGE TECHNOLOGIES
Trolley Assist Case
wn v:\1295\active\129500171\reports\final\alternate ore and waste technologies_final.docx 4.7
would not be expected to impact the findings of the Study. The equipment capital cost components over
the LOM are shown in Table 4.7.
Table 4.7 Trolley Assist Case Equipment Capital Costs
Expense Cost (C$M)
Truck Purchases 1,386.9
Pantographs and Controls 76.4
Total 1,463.3
4.6.2.2 Operating Expenses
Operating cost includes operator and maintenance labour, parts, tires, and lube applied per net operating
hour plus the fuel and energy costs required for truck operation. Total OpEx over the 40-year mine life is
estimated to be $15,059M.
4.6.3 Trolley Assist Case Cost Summary
Total LOM costs for the trolley assist case were estimated at $17,279M as compared to $19,477M in the
base case, an 11% decrease. Diesel consumption was reduced by 21% or 1.25 billion litres of fuel. Truck
operating costs not including fuel made up a comparable 64% of total LOM costs. The total cost of the
trolley system equipment including substations, cable and poles, and truck equipment only account for
1.1% of the total LOM cost as shown in Table 4.8. A timeline of costs over the LOM is shown on Figure 4-
3.
Table 4.8 Trolley Assist Case LOM Cost Summary
Costs Total Cost (C$M) Unit Cost (C$/BCM)
Truck CAPEX 1,387 0.24
Trolley CAPEX 175 0.03
Truck OPEX 10,609 1.83
Diesel 4,254 0.73
Power 196 0.03
Carbon Tax 658 0.11
Total 17,279 2.97

EVALUATION OF ALTERNATE ORE AND WASTE HAULAGE TECHNOLOGIES
Trolley Assist Case
wn v:\1295\active\129500171\reports\final\alternate ore and waste technologies_final.docx 4.8
Figure 4-3 Trolley Assist Case Cost Timeline
4.7 PREDICTED GHG EMISSIONS
As in the base case, greenhouse gas emissions are estimated for the energy consumed by the truck fleet
only. Emissions from other parts of the operation such as other mobile equipment and processing are
assumed to be constant between all cases and were not considered. GHG emissions were the product of
diesel combustion and energy consumption. The total GHG emissions over the LOM was estimated to be
15.7 Mt CO2eq using the Alberta average GHG intensity for electrical generation and 13.6 Mt using a co-
gen power source with diesel emissions making up 84% and 97% of emissions, respectively. The annual
emissions from the mine haul fleet are shown on Figure 4-4.
Annual emissions decreased by between 3% and 8% using the Alberta average GHG intensity for
electrical generation and 9% to 25% using a co-gen electrical generating system. Annual GHG reduction
due to trolley assist systems vary depending on several compounding factors. As shown on Figure 4-4,
annual GHG emissions vary considerably between certain years. This is due to variances in total truck
hours either based on total material moved or the average haul profile based on mine development and
mine waste placement locations. Fleet emissions are a function of the total fleet hours and the average
engine duty cycle; again, a factor of the average haul profile. In years where the mine waste haul diesel
consumption makes up a smaller proportion of the total fleet consumption, trolley assist systems have a
larger impact on fleet emissions. This is seen in years 1 through 3 where mine waste is hauled to nearby
ex-pit dumps and when in-pit waste disposal is possible avoiding large elevation changes utilizing top

EVALUATION OF ALTERNATE ORE AND WASTE HAULAGE TECHNOLOGIES
Trolley Assist Case
wn v:\1295\active\129500171\reports\final\alternate ore and waste technologies_final.docx 4.9
waste bench pit wall roads throughout the mine life. Larger incremental impacts to the fleet GHG
emissions are also realized when the waste destinations allow for utilization of the trolley assist system as
seen in years 23 and 24. Similarly, decreased impacts to GHG emissions are seen in years where the
haul profile results increased engine duty cycles where the diesel savings are proportionally smaller. This
is seen most evidently in years 19 and 20 where total diesel consumption increased by up to 25% of
preceding years due to changes in the mine waste haul profile.
Figure 4-4 Trolley Assist Case GHG Emissions Timeline
4.8 CONCLUSIONS REGARDING THE TROLLEY ASSIST CASE
Trolley assist systems provide significant benefit by reducing diesel demand and can provide net benefits
to GHG emissions and mine operating costs if deployed where most effective. Trolley assist systems are
currently deployed in several mines globally, these mines often have further benefits as the diesel fuel
supply may be limited or more cost intensive than in the Canadian oil sands.
Challenges of successful deployment of a trolley assist system in the oil sands include:
• Weather - icing of cables and pantographs resulting in reduced efficiency or increased
maintenance of the system
• Poor road conditions – limited tolerance vertically and horizontally along the trolley system to
maintain connection may be a challenge to successful implementation of a trolley assist system
due to the soft ground conditions found in the oil sands. Increased road maintenance may be
required to maintain the haul road within tolerance of the overhead trolley infrastructure. A cost
for increased road maintained was not estimated

EVALUATION OF ALTERNATE ORE AND WASTE HAULAGE TECHNOLOGIES
Trolley Assist Case
wn v:\1295\active\129500171\reports\final\alternate ore and waste technologies_final.docx 4.10
GHG emissions are reduced by utilizing the trolley assist technology over the life of mine. This analysis
was completed using an Alberta average GHG intensity for electricity generation of 640 g/KWh and a co-
gen GHG intensity factor of 100 g/KWh. The Alberta electricity generation consists of a variety of
technologies including coal, natural gas, and renewable sources. As Alberta transitions towards greener
electricity generation, the GHG intensity would be expected to decrease resulting in further GHG
emissions reduction.
As discussed above, the substations are capable of powering a limited number of trucks attached to the
trolley system simultaneously. Oil sands mines typically have larger truck fleets and it was necessary to
estimate the average number of trucks per trolley system to assess if this may cause a limitation to the
implementation of trolley assist technology. However, as shown on Figure 4-5, the average trucks along a
single 850m length of trolley system in any period rarely exceeds two trucks, which the Siemens 11 MW
system can power indefinitely. Additionally, the average time spent attached to a trolley system is 2.2
minutes limiting the likelihood of exceeding the peak usage times. No consideration has been given for
haul congestion or truck bunching due to operational inefficiencies.
Figure 4-5 Average Trucks per Trolley Assist Substation
Trolley assist technology is proven in the full-scale mining environment and may provide significant
benefits to oil sands mine operators through both cost and GHG emissions.

EVALUATION OF ALTERNATE ORE AND WASTE HAULAGE TECHNOLOGIES
LNG Substitution Case
wn v:\1295\active\129500171\reports\final\alternate ore and waste technologies_final.docx 5.1
5.0 LNG SUBSTITUTION CASE
LNG substitution technology allows a diesel combustion engine to use LNG as an alternative fuel source,
often at a lower unit cost.
5.1 HAUL TECHNOLOGY OVERVIEW
A review of both previous studies mentioned above, and current industry literature, point to LNG engine
technologies with varying engine architectures, diesel substitution rates, projected rates of methane slip,
and timelines to full commercial readiness at the ultra-class scale. Stantec has applied LNG substitution
factors of 50% and 90% for the purposes of examining the cost and GHG reduction impacts of
incorporating LNG engine technology in oil sands ore and waste haulage fleets.
5.2 ANALYSIS METHODOLOGY
The base case was used as the basis for this analysis. Diesel consumption was reduced by the
substitution factors of 50% and 90% and LNG use was estimated based on the heating value ratio of
1.68:1.
Annual LNG usage was used to calculate a daily demand that was the basis for site infrastructure sizing.
GHG emissions were then recalculated and a CapEx and OpEx estimate was completed.
5.3 ASSUMPTIONS
GFS Corporation provided support through discussions and conceptual costing data related to their
fumigated LNG technology. Stantec was unable to engage either Caterpillar or Westport in relation to
their HPDI technology for Ultra Class haul fleets.
5.3.1 General Assumptions
The primary assumptions for the LNG substitution cases are the substitution rates themselves.
Substitutions rates vary significantly based on the selected technology and the ability to scale the
technology to a commercial mining operation. For the basis of the Study a 50% substitution rate was
assumed for fumigated LNG technology and 90% substitution for a direct injection (HPDI) system. Diesel
consumption was reduced by the substitution factor and replaced by LNG at an equivalency factor of
1.68:1 based on the lower heating value of LNG when compared to diesel fuel.
LNG site infrastructure is based on the total annual LNG demand for each case. LNG storage facilities
were sized to maintain a minimum of 2 days of LNG capacity. In practice, actual LNG storage size would
be based on the supply system and risk tolerance of the operation.

EVALUATION OF ALTERNATE ORE AND WASTE HAULAGE TECHNOLOGIES
LNG Substitution Case
wn v:\1295\active\129500171\reports\final\alternate ore and waste technologies_final.docx 5.2
Fumigated LNG technology has been tested and implemented at mining operations with substitution rates
typically in the 35%-50% range. Direct injection technology is still in development and assumptions from
the fumigated case were used to close any data gaps, primarily for costing purposes.
It was assumed that no performance reduction results from LNG substitution.
5.3.2 GHG Emission Assumptions
GHG emissions for LNG is based on the GHG Emissions from natural gas combustion found in the
Carbon Offset Emission Factors Handbook published by the Alberta Government in March 2015. Diesel
and electricity emissions are based on the same source and are consistent with the other cases, co-gen
power emissions have also been estimated for comparative purposes. GHG emission intensity factors are
shown in Table 5.1.
Table 5.1 LNG Substitution Case GHG Emission Assumptions
Energy Type CO2eq Emissions
Diesel 2.786 x 10^-3 t/L
Electricity AB Average 0.640 x 10⁻³ t/KWh
Electricity Co-Gen 0.100 x 10⁻³ t/KWh
LNG 1.192 x 10⁻³ t/L
LNG combustion is less GHG intensive than conventional diesel combustion; however, fugitive emissions
resulting from the evaporation of methane during the storage and transportation of LNG can offset the
lower GHG intensity from LNG combustion. An estimate of fugitive emissions (i.e. methane slip) per unit
combusted for each of the two substitution technologies is shown in Table 5.2.
Table 5.2 LNG Fugitive Emissions Assumptions
Fumigated 50% Direct Injection HPDI
Fugitive Emissions 4.00% 0.75%
5.4 TRUCK HOURS
Truck hours are assumed to be unchanged from the base case.
5.5 CAPITAL AND OPERATING COSTS
5.5.1 Site Infrastructure
The site infrastructure required to support an LNG ultra-class haulage fleet includes an LNG production
plant, LNG storage facilities, LNG fueling depot(s), and mobile LNG refueling equipment. Stantec has
assumed that the infrastructure required to deliver and store natural gas to the virtual mine would be
included in the base case and therefore has not been considered as an additional cost for the LNG
substitution cases.

EVALUATION OF ALTERNATE ORE AND WASTE HAULAGE TECHNOLOGIES
LNG Substitution Case
wn v:\1295\active\129500171\reports\final\alternate ore and waste technologies_final.docx 5.3
5.5.1.1 Capital Cost
Stantec estimated the capital and operating costs associated with the required LNG site infrastructure
based on information provided by Plum Energy and Chart Industries.
Two LNG production modules, each with a daily production capacity of 100,000 gallons (~380,000 litres),
will be required for both substitution cases. LNG storage units with capacities of 100,000 gallons
(~380,000 litres) and 50,000 gallons (~190,000 litres) have been utilized. Stantec has incorporated a 2-
day storage requirement in the planning assumptions. As such the 50% substitution case will require
200,000 gallons of storage over the life of mine plan while the 90% substitution case will require 250,000
gallons.
The infrastructure assumptions have also included the requirements for two 8-bay LNG/diesel
combination fuel depots and two LNG mobile fuel trucks.
Capital cost for site infrastructure for the two cases is shown in Table 5.3.
Table 5.3 LNG Substitution Case Infrastructure Capital Cost Estimate
Capital Infrastructure LNG 50% (C$M) LNG 90% (C$M)
Truck Outfitting 110.4 110.4
LNG Plant 67.2 67.2
LNG Fuel Storage 2.8 3.5
8-Bay LNG Fuel Depot 4.0 4.0
LNG Mobile Fuel Truck 0.7 0.7
Total 185.1 185.8
5.5.1.2 Operating Expenses
Operating expenses include natural gas supply, LNG plant and fuel depot electrical power consumption,
annual maintenance costs, and operating labour. Total operating cost over the LOM is shown in Table
5.4.
Table 5.4 LNG Substitution Case Infrastructure Operating Cost Estimate
Operating Cost Fumigated 50% (C$M) Direct Injection HPDI (C$M)
LNG Plant Maintenance Cost 45.7 50.4
LNG Fuel Depot and Storage Maintenance Cost 5.0 5.2
Labour Cost 57.5 57.5
Power 73.2 80.3
Total 181.5 193.4

EVALUATION OF ALTERNATE ORE AND WASTE HAULAGE TECHNOLOGIES
LNG Substitution Case
wn v:\1295\active\129500171\reports\final\alternate ore and waste technologies_final.docx 5.4
5.5.2 Equipment
GFS Corp. provided support through discussions and conceptual costing data related to their fumigated
LNG technology. It was assumed that all mine haul trucks would be equipped with the LNG equipment
when commissioned.
5.5.2.1 Capital Cost
As the technology does not currently exist for Ultra Class 400t haulage fleets, GFS Corp. assisted
Stantec with estimating costs of outfitting the trucks with LNG equipment at $516,000.
Total cost for outfitting trucks with the required equipment was $110.4 M in both cases. Stantec was not
able to attain an estimate from a supplier for the HPDI case; therefore truck equipment capital costs were
assumed to be the same as the cost for a fumigated system.
5.5.2.2 Operating Expenses
Operating costs include operator and maintenance labour, parts, tires, and lube applied per net operating
hour plus the fuel and energy costs required for truck operation. Aside from the fuel and energy costs,
Stantec has assumed that the remainder of the operating costs are equivalent to the base case haulage
estimate.
Total OpEx over the 40-year mine life for both cases is shown in Table 5.5.
Table 5.5 LNG Substitution Case Equipment Operating Cost Estimate
Fumigated 50% Direct Injection HPDI 90%
Consumables
Diesel (L) 2,988 598
LNG (L) 5,020 9,036
Operating Cost
Diesel ($M) 2,689 538
LNG ($M) 251 452
Operating Cost ($M) 11,854 11,854
Total ($M) 14,795 12,844
5.5.3 LNG Substitution Case Cost Summary
Total LOM costs for the LNG substitution cases were estimated at $17,401M and $15,305M for the 50%
and 90% substitution rates, respectively, as compared to $19,477M in the base case. This represents an
11% and 21% reduction in total costs for the 50% and 90% substitution rates, respectively. Fuel costs
are reduced from 29% of the base case total costs to 18% in the 50% substitution case down to 6% of
total costs for the 90% substitution case. Infrastructure costs are estimated to be just over 1% of total

EVALUATION OF ALTERNATE ORE AND WASTE HAULAGE TECHNOLOGIES
LNG Substitution Case
wn v:\1295\active\129500171\reports\final\alternate ore and waste technologies_final.docx 5.5
LOM costs in both cases. A timeline of costs over the LOM are shown on Figure 5-1 and Figure 5-2 for
the 50% substitution case and 90% substitution case, respectively.
Figure 5-1 50% LNG Substitution Case Cost Timeline
Figure 5-2 90% LNG Substitution Case Cost Timeline

EVALUATION OF ALTERNATE ORE AND WASTE HAULAGE TECHNOLOGIES
LNG Substitution Case
wn v:\1295\active\129500171\reports\final\alternate ore and waste technologies_final.docx 5.6
5.6 PREDICTED GHG EMISSIONS
GHG emissions are based on the diesel and LNG use for the mine truck operating fleet, the power
required to operate the additional site infrastructure, and the fugitive emissions for each technology. For
the 50% Substitution Case, the reduction in GHG emissions from LNG combustion is more than offset by
the fugitive emissions due to the high rate of methane slip of 4% associated with the fumigated
technology. This results in a net increase of CO2eq emissions by over 4% when compared to the base
case. Due to the lower rate of fugitive emissions in the HPDI technology, the 90% substitution case
benefits from the lower GHG intensity of LNG combustion and therefore results in a 15% reduction in
CO2eq emissions over the LOM as shown in Table 5.6. If the LNG technologies continue to develop and
reduces or eliminates fugitive emissions, Figure 5-3 shows that both cases would result in significant
reductions in mine fleet GHG emissions.
Table 5.6 LNG Substitution Case GHG Emissions
Fumigated 50%
(Mt CO2eq) Direct Injection HPDI 90%
(MT CO2eq)
Diesel 8.3 1.7
LNG 6.0 10.8
Power 0.9 1.0
Fugitive Emissions 2.1 0.7
Total 17.4 14.2
Figure 5-3 LNG Substitution Case GHG Emissions Timeline

EVALUATION OF ALTERNATE ORE AND WASTE HAULAGE TECHNOLOGIES
LNG Substitution Case
wn v:\1295\active\129500171\reports\final\alternate ore and waste technologies_final.docx 5.7
5.7 CONCLUSIONS REGARDING THE LNG SUBSTITUTION CASE
LNG substitution technology is currently deployed at varying substitution rates throughout the mining
industry. Cost reduction is possible due to the low cost of natural gas in Alberta; however, GHG emission
reductions may only be realized if the technology development limits or eliminates the impacts of fugitive
emissions. Site infrastructure and equipment would be similar to existing operations; however, this would
introduce another plant and storage site to the operation.
As Stantec was unable to attain specific data from suppliers, further discussions with manufacturers
would be required to assess the development and deployment costs of direct injection technology.

EVALUATION OF ALTERNATE ORE AND WASTE HAULAGE TECHNOLOGIES
Rear Dump Trailer Case
wn v:\1295\active\129500171\reports\final\alternate ore and waste technologies_final.docx 6.1
6.0 REAR DUMP TRAILER CASE
6.1 HAUL TECHNOLOGY OVERVIEW
Tractor trailer arrangements are typically used in the coal mining industry with articulating bottom dump or
rear dump trailers. The trailer usually has a larger payload than the equivalent conventional rear dump
truck due a change in load dynamics primarily due to the additional axle. Material is loaded, hauled, and
dumped in a similar way as the base case; however, a similar ultra-class payload can be achieved with a
smaller haul truck. The rear dump trailer utilizes large hydraulic rams connected to the front of the trailer
to lift the box, as shown on Figure 6-1.
Figure 6-1 Rear Dump Trailer
6.2 ANALYSIS METHODOLOGY
For the purposes of the Study, Stantec discussed the rear dump trailer technology with a supplier that
currently provides smaller models to the mining industry. A theoretical truck was assumed to have ultra
class payload capacity while using a smaller mining truck for propulsion. Simulations of truck travel times
for this theoretical configuration were calculated in Runge’s Talpac software. It was expected that the
additional payload would lead to increased travel times where the trucks were limited to rimpull such as
on long up-grades and along ore benches which have higher rolling resistances. Travel times combined
with fixed times were used to generate cycle times and truck hours. The same process was followed as
the base case to estimate cost and GHG emissions.

EVALUATION OF ALTERNATE ORE AND WASTE HAULAGE TECHNOLOGIES
Rear Dump Trailer Case
wn v:\1295\active\129500171\reports\final\alternate ore and waste technologies_final.docx 6.2
6.3 ASSUMPTIONS
A rear dump trailer at ultra-class scale has not been developed or designed; therefore, most assumptions
were based on professional judgement and scaled up from relevant existing data. This analysis should be
considered as high-level and further discussions and trials with manufacturers would be required to
increase confidence in the estimates provided.
6.3.1 General Assumptions
Rear dump trailers typically have a payload capacity equal to 1.6 to 1.7 times that of the equivalent rear
dump haul truck. Initially, the Study considered the use of an ultra-class truck with a rear dump trailer with
a capacity of up to 640 short tons, however, following discussions with a manufacturer of smaller rear
dump trailers, concerns regarding trailer stability and the ability to successfully scale up the hydraulic
rams to this size it was decided to assume equivalent ultra-class payload of 400 short tons using a
smaller mining truck as the tractor unit. A 400 short ton trailer payload was estimated to be equivalent to a
250 short ton mining truck, therefore, the CAT 793F was selected as the tractor unit.
The theoretical 793F tractor trailer unit was set up in Talpac software for haul simulations using the same
haul systems as in the base case. The Talpac equipment database was used to identify a rear dump and
tractor trailer example to be the basis the theoretical truck. The example identified was the relationship
between the CAT 767C bottom dump trailer and the CAT 777C rear dump haul truck. The necessary
inputs into the Talpac software include empty and full weight axle weight distribution. Empty truck weight
was estimated based on the incremental empty truck weight of the 767C per kg of payload increase when
compared to the 777C. Using this ratio of 0.52kg incremental trailer weight per kg of increased payload,
an empty truck weight of 234,093 kg was used to set up the truck. Axle weight distributions were
assumed be the same as the 767C. The Talpac 793F rear dump trailer truck was given the properties
shown in Table 6.1.
Table 6.1 Theoretical 793F Rear Dump Trailer Configuration
Axle Full
Distribution Empty
Distribution Full Weight Empty Weight Payload
1 17% 30% 102,708 70,254 32,454
2 39% 37% 229,897 87,752 142,145
3 44% 33% 264,488 76,087 188,401
Total 100% 100% 597,093 234,093 363,000
793F fuel consumption was based on the same methodology as the base case 797F, where the
relationship between duty cycle and fuel consumption in the CAT Handbook was used to develop a
formula for fuel consumption. 793F fuel consumption is assumed to be approximately 66% of that of a
797F at 100% duty cycle as shown in Table 6.2.

EVALUATION OF ALTERNATE ORE AND WASTE HAULAGE TECHNOLOGIES
Rear Dump Trailer Case
wn v:\1295\active\129500171\reports\final\alternate ore and waste technologies_final.docx 6.3
Table 6.2 793F Fuel Consumption
Based on CAT handbook values, plotted linear fuel consumption for line of best fit
Truck Duty Cycle Fuel Consumption
793F
15* 95
25* 143
35* 190
45* 238
55** 285
65** 333
75** 380
85** 428
95** 475
100** 499
10 71
* From CAT Handbook 47
** Calculated based on formula
Due to the inefficient nature of operating and maneuvering a truck and trailer when compared to a
convention rear dump box, and the extended hydraulic rams required to lift the trailer to height, certain
fixed time haul components have been increased as shown in Table 6.3.
Table 6.3 Rear Dump Trailer Fixed Cycle Times
Segment Segment Time
(Rear Dump Truck) Segment Time
(Rear Dump Trailer)
Spot @ Shovel 0.5 1.0*
Spot @ Dump 0.5 1.0*
Load 2.0 2.0
Dump 1.3 2.6*
Queue Total 2.0 2.0
Total Fixed Cycle Time 6.3 8.6
*Increased by a factor of 2 to account for trailer inefficiency
y = 4.753x + 23.685R² = 1
0
50
100
150
200
250
0* 10* 20* 30* 40* 50*

EVALUATION OF ALTERNATE ORE AND WASTE HAULAGE TECHNOLOGIES
Rear Dump Trailer Case
wn v:\1295\active\129500171\reports\final\alternate ore and waste technologies_final.docx 6.4
6.3.2 Costing Assumptions
Truck purchase price and trailer incremental cost were estimated as proportional to the ultra-class base
case costs. As shown in Table 6.4, the total cost for the unit is $5.7M compared to the ultra-class truck
purchase price of $6.7M.
Table 6.4 250t Haul Truck and 400t Trailer Capital Cost
Component Purchase Price
250t Truck $ 4,400,000
400t Trailer (Incremental) $ 1,300,000
Total $ 5,700,000
Operating costs include operator and maintenance labour, parts, lube, and tires. Hourly rates for parts
and maintenance labour were ratioed to 80% of those for an ultra class truck based on the ratio of
payload for the rear dump trucks (62.5%) plus 25% for maintenance of the trailer system. As shown in
Table 6.5, operating costs per net operating hour are estimated to be $660/NOH compared to $716/NOH
for the ultra-class trucks
Table 6.5 Rear Dump Trailer Operating Costs
Expense Cost (C$/NOH)
Parts $ 280.00
Lube $ 30.00
Tires $ 90.00
Maint Labour $ 173.50
Operator Labour $ 86.70
Total $ 660.20
Trucks were assumed to have a similar operating life of 70,000 hours extending to 100,000 hours within
the last 5 years of mine life as in the base case. Road construction costs were assumed to be
comparable to the Base Case; however, road running width and berm heights may be reduced if these
trucks were the largest trucks used at the operation.
6.3.3 GHG Emission Assumptions
Emissions assumptions for diesel combustion are consistent with those used in the previous sections.
6.4 TRUCK HOURS
Due to the increased payload and load on the truck engines, travel times along segments with
acceleration or uphill grades increased significantly. Overall, cycle times increased by an average of 24%
when compared to the cycle times of the ultra-class truck as shown on Figure 6-2.

EVALUATION OF ALTERNATE ORE AND WASTE HAULAGE TECHNOLOGIES
Rear Dump Trailer Case
wn v:\1295\active\129500171\reports\final\alternate ore and waste technologies_final.docx 6.5
Figure 6-2 Average Cycle Time Comparison
As a result of the increased travel times and fixed times as discussed above, total fleet truck hours over
the LOM increased by 24%, or an average of 18 trucks as can be seen on Figure 6-3.
Figure 6-3 Rear Dump Trailer Case Truck Hours

EVALUATION OF ALTERNATE ORE AND WASTE HAULAGE TECHNOLOGIES
Rear Dump Trailer Case
wn v:\1295\active\129500171\reports\final\alternate ore and waste technologies_final.docx 6.6
6.5 CAPITAL AND OPERATING COSTS
Capital and operating costs have been estimated consistently with the base case.
6.5.1 Site Infrastructure
No additional site infrastructure is required compared to the base case.
6.5.1.1 Capital Cost
No additional site infrastructure is required compared to the base case.
6.5.1.2 Operating Expenses
No additional site infrastructure is required compared to the base case.
6.5.2 Equipment
The reduced equipment CapEx and OpEx costs are cancelled out by the increased truck hours due to
increased cycle times resulting in higher equipment costs overall.
6.5.2.1 Capital Cost
An average of 80 trucks are required compared to the base case of 62. Total truck CapEx is estimated to
be $1,516M compared to $1,434M in the base case, an increase of 6%.
6.5.2.2 Operating Expenses
Despite the decreased operating cost per hour, the increased truck hours result in total operating costs of
$17,869M including fuel, an increase of over 3% to the base case.
6.5.3 Rear Dump Trailer Cost Summary
Total costs over the LOM increased nearly 4% from the base case due to the increased truck hours. No
consideration was given to potential congestion or increased infrastructure required to maintain and
support the additional truck fleet which would further inflate costs. The LOM cost estimate is shown in
Table 6.6 with the cost timeline shown on Figure 6-4.
Table 6.6 Rear Dump Trailer LOM Costs
Costs Total Cost ($M) Unit Cost ($/BCM)
Truck CAPEX 1,516 0.26
Truck OPEX 12,590 2.17
Diesel 5,279 0.91
Carbon Tax 795 0.14
Total 20,181 3.47

EVALUATION OF ALTERNATE ORE AND WASTE HAULAGE TECHNOLOGIES
Rear Dump Trailer Case
wn v:\1295\active\129500171\reports\final\alternate ore and waste technologies_final.docx 6.7
Figure 6-4 Rear Dump Trailer Case Cost Timeline
6.6 PREDICTED GHG EMISSIONS
Like the Base Case, GHG Emissions are based solely on the combustion of diesel fuel for the haul truck
fleet. Due to the decreased fuel consumption of the 793F engine, total diesel usage is comparable to the
base case despite a 24% increase in total fleet truck hours. GHG emissions for the LOM of the rear dump
trailer case are estimated to be 16.3Mt, a timeline is shown on Figure 6-5.

EVALUATION OF ALTERNATE ORE AND WASTE HAULAGE TECHNOLOGIES
Rear Dump Trailer Case
wn v:\1295\active\129500171\reports\final\alternate ore and waste technologies_final.docx 6.8
Figure 6-5 Rear Dump Trailer Case Emissions Timeline
6.7 CONCLUSIONS REGARDING THE REAR DUMP TRAILER CASE
Rear dump trailers are an effective way of increasing the payload capacity of an equivalent rear dump
truck. This technology has been implemented in mining operations elsewhere, typically in flat lying
thermal coal deposits. The increased payload leads to increased cycle times where significant change in
elevation is encountered as the truck speed is limited by the engine duty cycle. Therefore, these trucks
are more effective on longer hauls along top waste benches than on hauls that must climb from pit
bottom. It may be beneficial to assess the implementation of the rear dump trailer technology restricted to
top waste bench mining which avoid larger elevation changes.
Rear dump trailers have been developed at a smaller scale; however, no operational examples have
been developed at the ultra-class payload scale. Concerns regarding trailer stability, ease of operations,
efficiency for loading at the face, and mechanical limitations of the lifting hydraulics remain. This case was
assessed primarily on assumptions that were scaled from the base case and therefore the level of
accuracy should be considered lower than that of the base case.

EVALUATION OF ALTERNATE ORE AND WASTE HAULAGE TECHNOLOGIES
Comparison of Cases
wn v:\1295\active\129500171\reports\final\alternate ore and waste technologies_final.docx 7.1
7.0 COMPARISON OF CASES
All cases may be directly compared based on CapEx, OpEx, and GHG Emissions. However, the current
level of development and therefore accuracy of analysis varies between the technologies. All other costs
and factors related to the operations is assumed to be consistent throughout the cases.
7.1 CAPTAL AND OPERATING COSTS
Capital and operating costs between the cases vary with the technology, primarily due to fuel costs. Truck
CapEx and OpEx are decreased in the trolley assist case due to the increased ramp speeds resulting in
decreased overall truck hours and assumed maintenance benefits of improved road conditions. The
opposite is true for the rear dump trailer case as cycle times increased due to the additional payload
resulting in a 24% increase to truck hours resulting in an overall cost increase of 4%. The LNG
substitution cases assume equivalent truck hours and truck CapEx and OpEx as the base case and only
differentiated on cost of fuel and LNG infrastructure. Both cases resulted in decreased cost due to the low
natural gas prices, resulting in a total decrease in LOM costs of up to $4 billion in the 90% direct injection
case. A detailed comparison of CapEx and OpEx costs between the cases is shown on Table 7.1 and
Figure 7-1.

EVALUATION OF ALTERNATE ORE AND WASTE HAULAGE TECHNOLOGIES
Comparison of Cases
wn v:\1295\active\129500171\reports\final\alternate ore and waste technologies_final.docx 7.2
Table 7.1 LOM CapEx and OpEx Cost Summary
Base Case Trolley Assist Rear Dump
Trailer LNG 50% LNG 90%
Costs ($M)
Truck CAPEX 1,434 1,387 1,516 1,434 1,434
LNG CAPEX - - - 185.1 185.8
Trolley CAPEX - 175 - - -
Truck OPEX 11,854 10,609 12,590 11,854 11,854
LNG OPEX - - - 108 113
Diesel 5,379 4,254 5,279 2,689 538
Power - 196 - 73 80
LNG - - - 251 452
Carbon Tax 811 658 795 806 648
Total 19,477 17,279 20,181 17,401 15,305
Unit Cost ($/BCM)
Truck CAPEX 0.25 0.24 0.26 0.25 0.25
LNG CAPEX - - - 0.03 0.03
Trolley CAPEX - 0.03 - - -
Truck OPEX 2.04 1.83 2.17 2.04 2.04
LNG OPEX - - - 0.02 0.02
Diesel 0.93 0.73 0.91 0.46 0.09
Power - 0.03 - 0.01 0.01
LNG - - - 0.04 0.08
Carbon Tax 0.14 0.11 0.14 0.14 0.11
Total 3.35 2.97 3.47 2.99 2.63

EVALUATION OF ALTERNATE ORE AND WASTE HAULAGE TECHNOLOGIES
Comparison of Cases
wn v:\1295\active\129500171\reports\final\alternate ore and waste technologies_final.docx 7.3
Figure 7-1 Comparison of CapEx and OpEx Costs
7.2 PREDICTED GHG EMISSIONS
Alternative energy sources for the mine truck fleet result in decreased GHG emission intensity. The trolley
assist case uses power from the electrical grid to reduce the engine duty cycle along trolley segments
from 100% down to idle or around 10%. Emissions related to electricity generation in Alberta still include
coal power plants and therefore the GHG intensity from the electricity usage may be reduced if alternative
or renewable sources are used for electricity generation; therefore, an alternate case assuming co-
generation power is included in the analysis. With that considered, the trolley assist Case still results in
decreased emissions of 5.5% and 18% for the Alberta average and co-gen generation GHG intensities,
respectively.
The rear dump trailer case did result in increased truck hours, however, the reduced fuel consumption of
the 793F engine counterbalances the increased hours. Diesel consumption and therefore GHG emissions
are comparable to the base case and due to the level of accuracy with this scenario, should be
considered equivalent.
LNG combustion does result in lower GHG emissions and intensity; however, fugitive emissions during
the transport and injection of the fuel into the engine may offset any gains. As shown in the LNG 50%
Substitution Case where fugitive emissions were estimated to be 4%, the impact of fugitive emissions
eliminate any potential gains from the combustion of natural gas and increased overall emissions by over
4%. However, the improved direct injection technology of the LNG 90% substitution case may result in
fugitive emissions of approximately 0.75% resulting in a net decrease of GHG emissions of 15% when
compared to the base case. Direct injection technology is currently being developed by a number of
manufacturers; however, these manufacturers were not willing to share details of the technology with
Stantec at this time. As discussed in section 5.3, volumetrically, more LNG is consumed than the

EVALUATION OF ALTERNATE ORE AND WASTE HAULAGE TECHNOLOGIES
Comparison of Cases
wn v:\1295\active\129500171\reports\final\alternate ore and waste technologies_final.docx 7.4
equivalent units of diesel based on the lower heating value at a ratio of 1.68:1. Electrical emissions
related to the operation of the on-site LNG plant due to were estimated and accounted for in the analysis.
A detailed comparison of GHG emissions between the cases is shown in Table 7.2.
Table 7.2 LOM Energy Consumption and GHG Emission Summary
Units Base Case Trolley Assist
Rear Dump Trailer LNG 50% LNG 90%
Energy Consumption
Diesel [Million L] 5,976 4,726 5,866 2,988 598
Power [Million KWh] - 3,916 - 1,465 1,606
LNG [Million L] - - - 5,020 9,036
GHG Emissions CO2e
Diesel [CO2eq Mt] 16.65 13.17 16.34 8.32 1.66
Electricity AB Avg (Co-Gen) [CO2eq Mt] -
2.5 (0.4) -
0.9 (0.1)
1 (0.2)
LNG [CO2eq Mt] - - - 5.98 10.77
Fugitive Emissions [CO2eq Mt] - - - 2.11 0.71
Total AB Avg (Co-Gen) [CO2eq Mt] 16.65 15.7 (13.6) 16.34 17.4 (16.6) 14.2 (13.3)
GHG Intensity
Diesel [Kg/bcm] 2.86 2.27 2.81 1.43 0.29
Electricity AB Avg (Co-Gen) [Kg/bcm] -
0.43 (0.07) -
0.16 (0.03)
0.18 (0.03)
LNG [Kg/bcm] - - - 1.03 1.85
Fugitive Emissions [Kg/bcm] - - - 0.36 0.12
Total AB Avg (Co-Gen) [Kg/bcm] 2.86
2.7 (2.33) 2.81
2.99 (2.85)
2.44 (2.29)
7.3 RISK ANALYSIS
Stantec prepared a risk analysis between the cases and reviewed this with the COSIA advisory group at
the May 30th review meeting. Risks were assessed in the following categories:
• Technology Development
• Operational Complexity
• Safety and Environmental
• Cost Estimate Certainty
• GHG Estimate Certainty
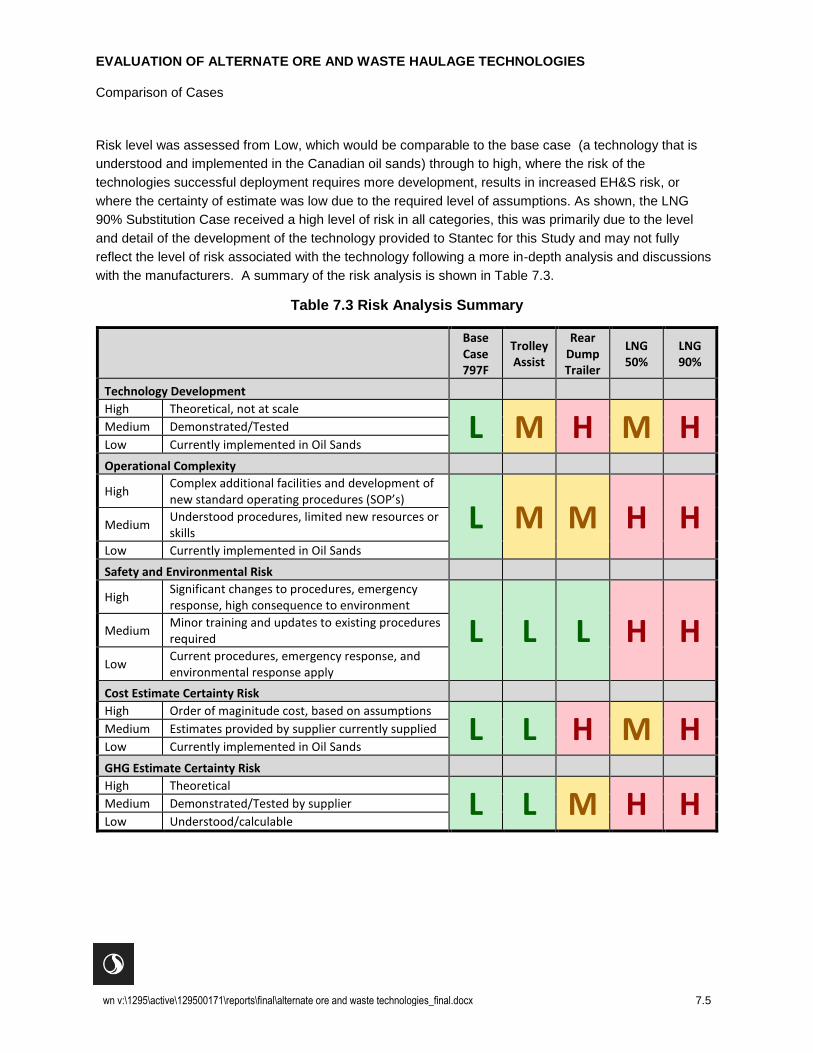
EVALUATION OF ALTERNATE ORE AND WASTE HAULAGE TECHNOLOGIES
Comparison of Cases
wn v:\1295\active\129500171\reports\final\alternate ore and waste technologies_final.docx 7.5
Risk level was assessed from Low, which would be comparable to the base case (a technology that is
understood and implemented in the Canadian oil sands) through to high, where the risk of the
technologies successful deployment requires more development, results in increased EH&S risk, or
where the certainty of estimate was low due to the required level of assumptions. As shown, the LNG
90% Substitution Case received a high level of risk in all categories, this was primarily due to the level
and detail of the development of the technology provided to Stantec for this Study and may not fully
reflect the level of risk associated with the technology following a more in-depth analysis and discussions
with the manufacturers. A summary of the risk analysis is shown in Table 7.3.
Table 7.3 Risk Analysis Summary
Base Case 797F
Trolley Assist
Rear Dump Trailer
LNG 50%
LNG 90%
Technology Development
High Theoretical, not at scale
L M H M H Medium Demonstrated/Tested
Low Currently implemented in Oil Sands
Operational Complexity
High Complex additional facilities and development of new standard operating procedures (SOP’s)
L M M H H Medium Understood procedures, limited new resources or skills
Low Currently implemented in Oil Sands
Safety and Environmental Risk
High Significant changes to procedures, emergency response, high consequence to environment
L L L H H Medium Minor training and updates to existing procedures required
Low Current procedures, emergency response, and environmental response apply
Cost Estimate Certainty Risk
High Order of maginitude cost, based on assumptions
L L H M H Medium Estimates provided by supplier currently supplied
Low Currently implemented in Oil Sands
GHG Estimate Certainty Risk
High Theoretical
L L M H H Medium Demonstrated/Tested by supplier
Low Understood/calculable

EVALUATION OF ALTERNATE ORE AND WASTE HAULAGE TECHNOLOGIES
Conclusions
wn v:\1295\active\129500171\reports\final\alternate ore and waste technologies_final.docx 8.1
8.0 CONCLUSIONS
8.1 BASE CASE
The base case hauls ore and waste using conventional ultra class mining trucks. Costs, productivities,
and GHG emissions are understood by operators in the Canadian oil sands; this was considered the
baseline for the Study.
8.2 TROLLEY ASSIST CASE
Trolley assist provides electric power directly to the wheel motors on a diesel-electric mining truck when
the truck connects to overhead cables. Significant infrastructure planning and cost is required to
implement a trolley assist system. As the truck is connected to the trolley assist system, the engine load
can be reduced to idle leading to fuel savings of up to 20%. Increased productivity due to increased
speeds along the trolley assist system and improved road maintenance may decrease overall LOM costs.
GHG emissions were shown to decrease by almost 6%, with further opportunity if electricity generation is
less GHG intensive than the Alberta average such as that of a co-generation plant resulting in an 18%
reduction in GHG emissions.
Trolley assist technology is well developed, implemented in the mining industry, and the technology itself
is of fairly low risk. Further analysis would be required regarding cost, infrastructure planning, and the
probability of success in the Canadian oil sands. Decreased diesel demand is often a benefit for mining
operations that have implemented a trolley assist system as these areas typically have supply
constraints. Soft ground conditions may make it difficult to maintain the roads within the tolerances
required to effectively operate a trolley assist system.
Trolley assist systems may benefit from an autonomous haul system as they would be expected to
operate within the horizontal tolerance better than human operated trucks. Road maintenance would
remain key to the success of the system as vertical tolerance is limited.
8.3 LNG DIESEL SUBSTITUTION CASE
LNG substitution provides an opportunity for mining operators to drastically lower their costs by using
natural gas supply lines to supply methane to an LNG plant. The cost of LNG is approximately 10% of the
cost of diesel, not including LNG plant CapEx and OpEx which are relatively small compared to the cost
of fuel.
Fumigated LNG technology with substitution rates of up to 50% is currently deployed in various stages
throughout the mining industry. The Study estimates that mining costs can be reduced by approximately
10% over the LOM. GHG emissions from LNG combustion is less intensive; however, fumigated
technology results in up to 4% fugitive emissions from the transportation, storage, and injection of LNG
resulting in a net increase to GHG emissions over the LOM.

EVALUATION OF ALTERNATE ORE AND WASTE HAULAGE TECHNOLOGIES
Conclusions
wn v:\1295\active\129500171\reports\final\alternate ore and waste technologies_final.docx 8.2
Direct injection technology is still under development by a number of manufacturers and suppliers. This
technology allows substitution rates of up to 90%. At this substitution rate, LOM costs may decrease by
up to 20%; however, the cost estimate certainty remains low as Stantec was unable to receive support
from OEM’s on cost estimates. Fugitive emissions are reduced to just 0.75% resulting in significant GHG
emissions reductions, indicated as up to 15% by the Study.
Environmental, health, and safety risks to LNG substitution are understood to be higher than that of
conventional diesel fuel. Aside from fugitive emissions, fuel spills and damage to the LNG fuel and
storage tanks may result in serious hazards. LNG fuel will begin to evaporate when outside of the
containment tank and fumes are highly flammable increasing the risk of a fire or explosion. Methane
carries a global warming potential of 25 times that of carbon dioxide; therefore, evaporating methane from
a spill is more difficult to contain and more harmful to the environment than that of a diesel spill.
Operational complexities of constructing and operating an LNG plant will require additional footprint and
expertise on oil sands sites. This may be avoided if a regional LNG supplier was to be set up to provide
LNG to the mines.
Economics may be altered as demand for LNG and natural gas increase, replacing diesel as the primary
fuel source for the mining fleet. With decreased demand, if the price of LNG increases and the price of
diesel decreases, the economic benefit of the technology may be decreased.
LNG technology provides a variety of opportunities to reduce both cost and GHG footprint. Further
studies and investigations should be carried out; and, include discussions with suppliers and
manufacturers to understand the challenges, cost, and timelines related to the implementation of direct
injection systems.
8.4 REAR DUMP TRAILER
Rear dump trailers provide an opportunity to increase the payload of a mining haul truck by a factor of 1.6
to 1.7. While successfully utilized in flat lying coal deposits with longer hauls, site wide implementation of
the rear dump trailer haul technology was not beneficial in this Study, and increased costs by 4%.
Increased cycle times due to longer travel times along grades, during acceleration, and spot and dump
times increased LOM truck hours by 24%. Haul road congestion and decreased productivities may be
expected; however, they were not evaluated at this level of Study.
GHG Emissions were effectively the same as the base case as the decreased fuel consumption of the
smaller truck engines was completely offset by the increased fleet size and truck hours.
A rear dump trailer with ultra-class truck payloads does not currently exist, as far as Stantec’s high level
research indicated. Therefore, the cost, productivity, and GHG emissions estimates are based on a
variety of assumptions and therefore they should be assumed to carry a greater margin of error than the
base case. The viability of scaling this technology to ultra-class payloads remains unproven and further
investigation and trial would be required to assess further.

EVALUATION OF ALTERNATE ORE AND WASTE HAULAGE TECHNOLOGIES
Conclusions
wn v:\1295\active\129500171\reports\final\alternate ore and waste technologies_final.docx 8.3
8.5 CONCLUSION
The Study evaluated alternative ore and waste haulage technologies related to haulage by mine trucks.
These technologies primarily focused on alternative energy sources whether that be electricity, LNG, or
increasing payload of a smaller, more efficient powertrain. Development of the technologies varies, which
impacted Stantec’s ability to attain operational data for this assessment. The Study indicates that further
assessment of trolley assist systems and LNG substitution using direct injection technology would be both
economically and environmentally beneficial.
As shown in Table 8.1, all cases resulted in a reduction in GHG emissions when compared to the base
case except for the LNG 50% substitution case when fugitive emissions were considered. As discussed,
further development of the fumigated technology limiting or eliminating fugitive emissions is
recommended. GHG emissions may be reduced by up to nearly 20% using the trolley assist or direct
injection LNG technologies coupled with co-gen electrical supply.
Table 8.1 GHG Emissions Summary
Units Base Case Trolley Assist
Rear Dump Trailer LNG 50% LNG 90%
GHG Emissions CO2e
Diesel [CO2eq Mt] 16.6 13.2 16.3 8.3 1.7
Electricity AB Avg (Co-Gen) [CO2eq Mt] - 2.5 (0.4) - 0.9 (0.1) 1 (0.2)
LNG [CO2eq Mt] - - - 6.0 10.8
Fugitive Emissions [CO2eq Mt] - - - 2.1 0.7
Total AB Avg (Co-Gen) [CO2eq Mt] 16.6 15.7 (13.6) 16.3 17.4 (16.6) 14.2 (13.3)
GHG Intensity
Diesel [Kg/bcm] 2.86 2.27 2.81 1.43 0.29
Electricity AB Avg (Co-Gen) [Kg/bcm] - 0.43 (0.07) - 0.16 (0.03) 0.18 (0.03)
LNG [Kg/bcm] - - - 1.03 1.85
Fugitive Emissions [Kg/bcm] - - - 0.36 0.12
Total AB Avg (Co-Gen) [Kg/bcm] 2.86 2.7 (2.33) 2.81 2.99 (2.85) 2.44 (2.29)
Capital costs incurred depend on the selected technology. The trolley assist case results in fewer truck
purchases due to increased truck speeds while connected to the trolley assist system; however,
additional mine and equipment infrastructure is required when compared to the base case. The additional
capital cost is offset by a decrease in mine operating costs resulting from reduced truck maintenance
costs and the benefit of powering the mine fleet off of the electrical grid compared to diesel along high
engine load road segments. The LNG substitution cases result in additional capital and operating costs
due to the installation and operation of the on-site LNG plant, storage, fueling equipment, and haul truck
outfitting. These additional costs are more than offset by fuel cost savings as the cost of LNG produced
from an in-place natural gas supply line is estimated to be $0.05 per litre compared to the assumed $0.90
per litre of diesel fuel. Increased cycle times accompanying the rear dump trailer case resulted in 52
additional truck units purchased throughout the life of mine; and, despite the decreased truck capital cost
and reduced hourly operating costs, life of mine costs increased by nearly 4%. Table 8.2 shows the total
life of mine costs of implementing each technology.

EVALUATION OF ALTERNATE ORE AND WASTE HAULAGE TECHNOLOGIES
Conclusions
wn v:\1295\active\129500171\reports\final\alternate ore and waste technologies_final.docx 8.4
Table 8.2 GHG Emissions Summary
Units Base Case Trolley Assist
Rear Dump Trailer LNG 50% LNG 90%
LOM Cost
Truck CAPEX [Million's $] 1,434 1,387 1,516 1,434 1,434
LNG CAPEX [Million's $] - - - 185 186
Trolley CAPEX [Million's $] - 175 - - -
Truck OPEX [Million's $] 11,854 10,609 12,590 11,854 11,854
LNG OPEX [Million's $] - - - 108 113
Diesel [Million's $] 5,379 4,254 5,279 2,689 538
Power [Million's $] - 196 - 73 80
LNG [Million's $] - - - 251 452
Carbon Tax [Million's $] 811 658 795 806 648
Total [Million's $] 19,477 17,279 20,181 17,401 15,305 Unit Cost
Truck CAPEX [$/BCM] 0.25 0.24 0.26 0.25 0.25
LNG CAPEX [$/BCM] - - - 0.03 0.03
Trolley CAPEX [$/BCM] - 0.03 - - -
Truck OPEX [$/BCM] 2.04 1.83 2.17 2.04 2.04
LNG OPEX [$/BCM] - - - 0.02 0.02
Diesel [$/BCM] 0.93 0.73 0.91 0.46 0.09
Power [$/BCM] - 0.03 - 0.01 0.01
LNG [$/BCM] - - - 0.04 0.08
Carbon Tax [$/BCM] 0.14 0.11 0.14 0.14 0.11
Total [$/BCM] 3.35 2.97 3.47 2.99 2.63
The above results can be used to evaluate the unit cost savings per GHG emission reductions as shown
on Figure 8-1. As shown, the rear dump trailer results in a higher incremental cost while reducing GHG
intensity slightly. LNG at 50% substitution rates results in $0.36/BCM cost saving but increases GHG
intensity on the Alberta electrical grid; or, slightly reduces GHG intensity with co-gen power. Trolley assist
reduces unit cost by approximately $0.37/BCM; however, due to the reliance on electrical power, the
GHG intensity reduction is highly dependent on the power source. Using co-gen power, trolley assist may
provide a significant reduction in GHG intensity. LNG at 90% substitution provides the largest unit cost
reduction at $0.71/BCM while also providing the largest reduction in GHG intensity when using co-gen
power.

EVALUATION OF ALTERNATE ORE AND WASTE HAULAGE TECHNOLOGIES
Conclusions
wn v:\1295\active\129500171\reports\final\alternate ore and waste technologies_final.docx 8.5
Figure 8-1 GHG Intensity Reduction vs. Mining Unit Cost Reduction
Based on the data presented, the trolley assist and LNG 90% technologies appear to provide the most
opportunity to reduce both mining unit costs and GHG intensity. LNG at 50% substitution rates may
provide an opportunity to reduce GHG intensity if the technology development can limit or eliminate
fugitive emissions. Due to the high GHG intensity of the Alberta electrical grid, an alternative energy
source such as a co-gen power unit is required to maximize the benefit from the trolley assist technology.

EVALUATION OF ALTERNATE ORE AND WASTE HAULAGE TECHNOLOGIES
9.1 9.1
9.0 REFERENCES
Caterpillar; 2007. Caterpillar Performance Handbook; a publication by Caterpillar, Peoria, Illinois,
U.S.A. January 2017.
Norwest Corporation; 2015. Fluid Fine Tails Thermal Drying versus Consolidated Tailings; a High
Level Assessment of Cost Impacts. Submitted to COSIA March 5, 2015.
Alberta Government; 2015. Carbon Offset Emission Factors Handbook; ESRD Climate Change,
2015, No. 1.
Prometheus Energy. LNG Quick Facts. Retrieved from
:http://www.prometheusenergy.com/_pdf/LNGQuickFacts.pdf
Gti; Technology Scan, Ultra-Class Mine Haul Truck GHG Reduction Study, Gas Technology
Institute. A PowerPoint presentation provided by COSIA.

EVALUATION OF ALTERNATE ORE AND WASTE HAULAGE TECHNOLOGIES
1 1
APPENDIX A