Evidence log - CRMF 2015 - ORE Catapult
337
Evidence log CRMF 2015 14/03/2015
-
Upload
khangminh22 -
Category
Documents
-
view
1 -
download
0
Transcript of Evidence log - CRMF 2015 - ORE Catapult
Evidence log
CRMF 2015
14/03/2015

ORE Catapult PN000113-FRT-002
CRMF 2015 Evidence log Issue: FINAL 2
Document History
Field Detail
Report Title Evidence log
Report Sub-Title CRMF 2015
Client OWPB
Status FINAL
Project Reference PN 000113 – CRMF 2015
Document Reference PN000113-FRT-002
Report Issue Date of Issue Author(s) Reviewer(s) Authoriser
DRAFT1 11/11/2015 Owen Murphy,
Mike Newman
DRAFT2 30/11/2015 Owen Murphy,
Mike Newman
Raul Prieto,
Ander
Madariaga,
Hyunjoo Lee,
Chong Ng,
Gavin Smart,
DRAFT3 22/11/2015 Owen Murphy,
Mike Newman
DRAFT4 13/01/2015 Owen Murphy,
Mike Newman Taylor McKenzie Andy Lewin

ORE Catapult PN000113-FRT-002
CRMF 2015 Evidence log Issue: FINAL 3
Disclaimer: Whilst the information contained in this report has been prepared and collated in
good faith. ORE Catapult makes no representation or warranty (express or implied) as to the
accuracy or completeness of the information contained herein nor shall we be liable for any loss
or damage resultant from reliance on same.
FINAL 14/03/2016 Andy Lewin

ORE Catapult PN000113-FRT-002
CRMF 2015 Evidence log Issue: FINAL 4
Contents
1 Introduction........................................................................................................... 19
1.1 Notes ............................................................................................................. 19
2 List of abbreviations ............................................................................................ 21
3 FEED (optimisation & use of multi-variable array layout tools) ....................... 23
3.1 Summary Analysis ......................................................................................... 23
3.2 Milestone scorecard ....................................................................................... 24
3.3 Evidence ........................................................................................................ 25
3.4 Additional comments ...................................................................................... 32
3.5 Recommendations ......................................................................................... 32
4 Site selection ........................................................................................................ 33
4.1 Summary Analysis ......................................................................................... 33
4.2 Milestone scorecard ....................................................................................... 33
4.3 Evidence ........................................................................................................ 34
4.4 Additional comments ...................................................................................... 34
4.5 Recommendations ......................................................................................... 34
5 Site investigation (optimisation & use of multi-variable array layout tools) ... 35
5.1 Summary Analysis ......................................................................................... 35
5.2 Milestone scorecard ....................................................................................... 36
5.3 Evidence ........................................................................................................ 36
5.4 Additional comments ...................................................................................... 39
5.5 Recommendations ......................................................................................... 39
6 Development phase project management .......................................................... 40
6.1 Summary Analysis ......................................................................................... 40
6.2 Milestone scorecard ....................................................................................... 40
6.3 Evidence ........................................................................................................ 41

ORE Catapult PN000113-FRT-002
CRMF 2015 Evidence log Issue: FINAL 5
6.4 Additional comments ...................................................................................... 42
6.5 Recommendations ......................................................................................... 42
7 Floating lidar ......................................................................................................... 43
7.1 Summary Analysis ......................................................................................... 43
7.2 Milestone scorecard ....................................................................................... 44
7.3 Evidence ........................................................................................................ 44
7.4 Additional comments ...................................................................................... 47
7.5 Recommendations ......................................................................................... 47
8 Drivetrain concept ................................................................................................ 48
8.1 Summary Analysis ......................................................................................... 48
8.2 Milestone scorecard ....................................................................................... 50
8.3 Evidence ........................................................................................................ 50
8.4 Additional comments ...................................................................................... 55
8.5 Recommendations ......................................................................................... 55
9 Rating .................................................................................................................... 56
9.1 Summary Analysis ......................................................................................... 56
9.2 Milestone scorecard ....................................................................................... 57
9.3 Evidence ........................................................................................................ 57
9.4 Additional comments ...................................................................................... 63
9.5 Recommendations ......................................................................................... 63
10 AC power take off design .................................................................................. 64
10.1 Summary Analysis ...................................................................................... 64
10.2 Milestone scorecard .................................................................................... 65
10.3 Evidence ..................................................................................................... 65
10.4 Additional comments ................................................................................... 66
10.5 Recommendations ...................................................................................... 66
11 Optimisation of rotor diameter to rated capacity ............................................ 67

ORE Catapult PN000113-FRT-002
CRMF 2015 Evidence log Issue: FINAL 6
11.1 Summary Analysis ...................................................................................... 67
11.2 Milestone scorecard .................................................................................... 68
11.3 Evidence ..................................................................................................... 69
11.4 Additional comments ................................................................................... 73
11.5 Recommendations ...................................................................................... 73
12 Blade Design and Manufacture......................................................................... 74
12.1 Summary Analysis ...................................................................................... 74
12.2 Milestone scorecard .................................................................................... 75
12.3 Evidence ..................................................................................................... 77
12.4 Additional comments ................................................................................... 80
12.5 Recommendations ...................................................................................... 80
13 Control ................................................................................................................ 81
13.1 Summary Analysis ...................................................................................... 81
13.2 Milestone scorecard .................................................................................... 82
13.3 Evidence ..................................................................................................... 83
13.4 Additional comments ................................................................................... 85
13.5 Recommendations ...................................................................................... 85
14 Integrated design ............................................................................................... 86
14.1 Summary Analysis ...................................................................................... 86
14.2 Milestone scorecard .................................................................................... 87
14.3 Evidence ..................................................................................................... 87
14.4 Additional comments ................................................................................... 90
14.5 Recommendations ...................................................................................... 90
15 66kV .................................................................................................................... 91
15.1 Summary Analysis ...................................................................................... 91
15.2 Milestone scorecard .................................................................................... 92
15.3 Evidence ..................................................................................................... 92

ORE Catapult PN000113-FRT-002
CRMF 2015 Evidence log Issue: FINAL 7
15.4 Additional comments ................................................................................... 96
15.5 Recommendations ...................................................................................... 96
16 Improvement in array cable standards and specifications ............................ 97
16.1 Summary Analysis ...................................................................................... 97
16.2 Milestone scorecard .................................................................................... 98
16.3 Evidence ..................................................................................................... 98
16.4 Additional comments ................................................................................... 99
16.5 Recommendations ...................................................................................... 99
17 Extended (XL) monopiles and improved design standards ......................... 100
17.1 Summary Analysis .................................................................................... 100
17.2 Milestone scorecard .................................................................................. 101
17.3 Evidence ................................................................................................... 102
17.4 Additional comments ................................................................................. 104
17.5 Recommendations .................................................................................... 104
18 Optimised jacket design and manufacture .................................................... 105
18.1 Summary Analysis .................................................................................... 105
18.2 Milestone scorecard .................................................................................. 106
18.3 Evidence ................................................................................................... 107
18.4 Additional comments ................................................................................. 108
18.5 Recommendations .................................................................................... 108
19 Suction bucket ................................................................................................. 109
19.1 Summary Analysis .................................................................................... 109
19.2 Milestone scorecard .................................................................................. 110
19.3 Evidence ................................................................................................... 110
19.4 Additional comments ................................................................................. 112
19.5 Recommendations .................................................................................... 112
20 Standardisation of offshore AC substation ................................................... 113

ORE Catapult PN000113-FRT-002
CRMF 2015 Evidence log Issue: FINAL 8
20.1 Summary Analysis .................................................................................... 113
20.2 Milestone scorecard .................................................................................. 114
20.3 Evidence ................................................................................................... 115
20.4 Additional comments ................................................................................. 118
20.5 Recommendations .................................................................................... 119
21 Overplanting and use of dynamic rating ....................................................... 120
21.1 Summary Analysis .................................................................................... 120
21.2 Milestone scorecard .................................................................................. 121
21.3 Evidence ................................................................................................... 121
21.4 Additional comments ................................................................................. 123
21.5 Recommendations .................................................................................... 123
22 Booster stations (additional reactive power compensation platforms midway
to shore) .................................................................................................................... 124
22.1 Summary Analysis .................................................................................... 124
22.2 Milestone scorecard .................................................................................. 125
22.3 Evidence ................................................................................................... 125
22.4 Additional comments ................................................................................. 127
22.5 Recommendations .................................................................................... 127
23 Compact HV DC systems ................................................................................ 128
23.1 Summary Analysis .................................................................................... 128
23.2 Milestone scorecard .................................................................................. 129
23.3 Evidence ................................................................................................... 129
23.4 Additional comments ................................................................................. 130
23.5 Recommendations .................................................................................... 131
24 Lifting conditions for blades ........................................................................... 132
24.1 Summary Analysis .................................................................................... 132
24.2 Milestone scorecard .................................................................................. 133
24.3 Evidence ................................................................................................... 133

ORE Catapult PN000113-FRT-002
CRMF 2015 Evidence log Issue: FINAL 9
24.4 Additional comments ................................................................................. 135
24.5 Recommendations .................................................................................... 135
25 Feeder vessels ................................................................................................. 136
25.1 Summary Analysis .................................................................................... 136
25.2 Milestone scorecard .................................................................................. 137
25.3 Evidence ................................................................................................... 137
25.4 Additional comments ................................................................................. 138
25.5 Recommendations .................................................................................... 139
26 Whole turbine installation ............................................................................... 140
26.1 Summary Analysis .................................................................................... 140
26.2 Milestone scorecard .................................................................................. 141
26.3 Evidence ................................................................................................... 141
26.4 Additional comments ................................................................................. 142
26.5 Recommendations .................................................................................... 142
27 Lifted GBS with turbine pre-installed ............................................................. 143
27.1 Summary Analysis .................................................................................... 143
27.2 Milestone scorecard .................................................................................. 144
27.3 Evidence ................................................................................................... 144
27.4 Additional comments ................................................................................. 145
27.5 Recommendations .................................................................................... 145
28 Improvements in the installation process for monopiles through better
vessels ....................................................................................................................... 146
28.1 Summary Analysis .................................................................................... 146
28.2 Milestone scorecard .................................................................................. 147
28.3 Evidence ................................................................................................... 148
28.4 Additional comments ................................................................................. 153
28.5 Recommendations .................................................................................... 153
29 Improvements in operational weather windows for monopile installation . 154

ORE Catapult PN000113-FRT-002
CRMF 2015 Evidence log Issue: FINAL 10
29.1 Summary Analysis .................................................................................... 154
29.2 Milestone scorecard .................................................................................. 155
29.3 Evidence ................................................................................................... 155
29.4 Additional comments ................................................................................. 157
29.5 Recommendations .................................................................................... 157
30 Purpose built jacket installation vessels ....................................................... 158
30.1 Summary Analysis .................................................................................... 158
30.2 Milestone scorecard .................................................................................. 159
30.3 Evidence ................................................................................................... 160
30.4 Additional comments ................................................................................. 163
30.5 Recommendations .................................................................................... 163
31 Flexible sea fastenings .................................................................................... 164
31.1 Summary Analysis .................................................................................... 164
31.2 Milestone scorecard .................................................................................. 165
31.3 Evidence ................................................................................................... 165
31.4 Additional comments ................................................................................. 166
31.5 Recommendations .................................................................................... 166
32 Floating GBS .................................................................................................... 167
32.1 Summary Analysis .................................................................................... 167
32.2 Milestone scorecard .................................................................................. 168
32.3 Evidence ................................................................................................... 168
32.4 Additional comments ................................................................................. 169
32.5 Recommendations .................................................................................... 169
33 Optimised cable pull in and hang off processes ........................................... 170
33.1 Summary Analysis .................................................................................... 170
33.2 Milestone scorecard .................................................................................. 171
33.3 Evidence ................................................................................................... 172

ORE Catapult PN000113-FRT-002
CRMF 2015 Evidence log Issue: FINAL 11
33.4 Additional comments ................................................................................. 173
33.5 Recommendations .................................................................................... 173
34 Improvements in operational weather limits for cables (installation) ......... 174
34.1 Summary Analysis .................................................................................... 174
34.2 Milestone scorecard .................................................................................. 175
34.3 Evidence ................................................................................................... 175
34.4 Additional comments ................................................................................. 176
34.5 Recommendations .................................................................................... 177
35 Optimised cable installation vessels and tooling ......................................... 178
35.1 Summary Analysis .................................................................................... 178
35.2 Milestone scorecard .................................................................................. 179
35.3 Evidence ................................................................................................... 179
35.4 Additional comments ................................................................................. 181
35.5 Recommendations .................................................................................... 181
36 Turbine condition based maintenance .......................................................... 182
36.1 Summary Analysis .................................................................................... 182
36.2 Milestone scorecard .................................................................................. 183
36.3 Evidence ................................................................................................... 184
36.4 Additional comments ................................................................................. 186
36.5 Recommendations .................................................................................... 186
37 Access solutions from vessel to turbine ....................................................... 187
37.1 Summary Analysis .................................................................................... 187
37.2 Milestone scorecard .................................................................................. 188
37.3 Evidence ................................................................................................... 188
37.4 Additional comments ................................................................................. 191
37.5 Recommendations .................................................................................... 191
38 Improvements in transfer from shore to turbine ........................................... 192
ORE Catapult PN000113-FRT-002
CRMF 2015 Evidence log Issue: FINAL 12
38.1 Summary Analysis .................................................................................... 192
38.2 Milestone scorecard .................................................................................. 193
38.3 Evidence ................................................................................................... 193
38.4 Additional comments ................................................................................. 198
38.5 Recommendations .................................................................................... 198
39 Inventory management .................................................................................... 199
39.1 Summary Analysis .................................................................................... 199
39.2 Milestone scorecard .................................................................................. 200
39.3 Evidence ................................................................................................... 200
39.4 Additional comments ................................................................................. 202
39.5 Recommendations .................................................................................... 202
40 Offshore crew accommodation ...................................................................... 203
40.1 Summary Analysis .................................................................................... 203
40.2 Milestone scorecard .................................................................................. 204
40.3 Evidence ................................................................................................... 204
40.4 Additional comments ................................................................................. 206
40.5 Recommendations .................................................................................... 206
41 OFTO O&M ....................................................................................................... 207
41.1 Summary Analysis .................................................................................... 207
41.2 Milestone scorecard .................................................................................. 208
41.3 Evidence ................................................................................................... 208
41.4 Additional comments ................................................................................. 209
41.5 Recommendations .................................................................................... 210
42 Increased design life ....................................................................................... 211
42.1 Summary Analysis .................................................................................... 211
42.2 Milestone scorecard .................................................................................. 212
42.3 Evidence ................................................................................................... 212

ORE Catapult PN000113-FRT-002
CRMF 2015 Evidence log Issue: FINAL 13
42.4 Additional comments ................................................................................. 215
42.5 Recommendations .................................................................................... 215
43 UK Market ......................................................................................................... 216
43.1 Summary Analysis .................................................................................... 216
43.2 Milestone scorecard .................................................................................. 217
43.3 Evidence ................................................................................................... 218
43.4 Additional comments ................................................................................. 223
43.5 Recommendations .................................................................................... 223
44 EU Market (including UK) ................................................................................ 224
44.1 Summary Analysis .................................................................................... 224
44.2 Milestone scorecard .................................................................................. 225
44.3 Evidence ................................................................................................... 225
44.4 Additional comments ................................................................................. 229
44.5 Recommendations .................................................................................... 229
45 Turbines (competition within the industry) ................................................... 230
45.1 Summary Analysis .................................................................................... 230
45.2 Milestone scorecard .................................................................................. 231
45.3 Evidence ................................................................................................... 231
45.4 Additional comments ................................................................................. 237
45.5 Recommendations .................................................................................... 238
46 Support structures (competition within the industry) .................................. 239
46.1 Summary Analysis .................................................................................... 239
46.2 Milestone scorecard .................................................................................. 240
46.3 Evidence ................................................................................................... 241
46.4 Additional comments ................................................................................. 244
46.5 Recommendations .................................................................................... 244
47 HV Topside equipment (competition within the industry) ............................ 245

ORE Catapult PN000113-FRT-002
CRMF 2015 Evidence log Issue: FINAL 14
47.1 Summary Analysis .................................................................................... 245
47.2 Milestone scorecard .................................................................................. 246
47.3 Evidence ................................................................................................... 246
47.4 Additional comments ................................................................................. 249
47.5 Recommendations .................................................................................... 249
48 HV cables (competition within the industry) ................................................. 250
48.1 Summary Analysis .................................................................................... 250
48.2 Milestone scorecard .................................................................................. 250
48.3 Evidence ................................................................................................... 251
48.4 Additional comments ................................................................................. 253
48.5 Recommendations .................................................................................... 253
49 Competition in turbine installation ................................................................. 254
49.1 Summary Analysis .................................................................................... 254
49.2 Milestone scorecard .................................................................................. 255
49.3 Evidence ................................................................................................... 256
49.4 Additional comments ................................................................................. 261
49.5 Recommendations .................................................................................... 261
50 Competition in foundation installation .......................................................... 262
50.1 Summary Analysis .................................................................................... 262
50.2 Milestone scorecard .................................................................................. 263
50.3 Evidence ................................................................................................... 263
50.4 Additional comments ................................................................................. 270
50.5 Recommendations .................................................................................... 271
51 Competition in cable installation .................................................................... 272
51.1 Summary Analysis .................................................................................... 272
51.2 Milestone scorecard .................................................................................. 274
51.3 Evidence ................................................................................................... 274

ORE Catapult PN000113-FRT-002
CRMF 2015 Evidence log Issue: FINAL 15
51.4 Additional comments ................................................................................. 279
51.5 Recommendations .................................................................................... 279
52 Contracting packages / interface management............................................. 280
52.1 Summary Analysis .................................................................................... 280
52.2 Milestone scorecard .................................................................................. 281
52.3 Evidence ................................................................................................... 282
52.4 Additional comments ................................................................................. 286
52.5 Recommendations .................................................................................... 286
53 Supply chain involvement ............................................................................... 287
53.1 Summary Analysis .................................................................................... 287
53.2 Milestone scorecard .................................................................................. 288
53.3 Evidence ................................................................................................... 288
53.4 Additional comments ................................................................................. 289
53.5 Recommendations .................................................................................... 289
54 Standard contracts .......................................................................................... 290
54.1 Summary Analysis .................................................................................... 290
54.2 Milestone scorecard .................................................................................. 291
54.3 Evidence ................................................................................................... 291
54.4 Additional comments ................................................................................. 293
54.5 Recommendations .................................................................................... 293
55 Knowledge sharing .......................................................................................... 294
55.1 Summary Analysis .................................................................................... 294
55.2 Milestone scorecard .................................................................................. 295
55.3 Evidence ................................................................................................... 296
55.4 Additional comments ................................................................................. 300
55.5 Recommendations .................................................................................... 300
56 Technical standards ........................................................................................ 301

ORE Catapult PN000113-FRT-002
CRMF 2015 Evidence log Issue: FINAL 16
56.1 Summary Analysis .................................................................................... 301
56.2 Milestone scorecard .................................................................................. 302
56.3 Evidence ................................................................................................... 303
56.4 Additional comments ................................................................................. 305
56.5 Recommendations .................................................................................... 305
57 Introduction to Finance indicators ................................................................. 307
58 Capital availability ............................................................................................ 308
58.1 Summary Analysis .................................................................................... 308
58.2 Milestone scorecard .................................................................................. 309
58.3 Evidence ................................................................................................... 309
58.4 Additional comments ................................................................................. 311
58.5 Recommendations .................................................................................... 311
59 Regulatory risk premium ................................................................................. 312
59.1 Summary Analysis .................................................................................... 312
59.2 Milestone scorecard .................................................................................. 312
59.3 Evidence ................................................................................................... 312
59.4 Additional comments ................................................................................. 313
59.5 Recommendations .................................................................................... 313
60 Construction risk premium ............................................................................. 314
60.1 Summary Analysis .................................................................................... 314
60.2 Milestone scorecard .................................................................................. 314
60.3 Evidence ................................................................................................... 315
60.4 Additional comments ................................................................................. 316
60.5 Recommendations .................................................................................... 316
61 Operations risk premium ................................................................................ 317
61.1 Summary Analysis .................................................................................... 317
61.2 Milestone scorecard .................................................................................. 317

ORE Catapult PN000113-FRT-002
CRMF 2015 Evidence log Issue: FINAL 17
61.3 Evidence ................................................................................................... 318
61.4 Additional comments ................................................................................. 318
61.5 Recommendations .................................................................................... 318
62 Developer risk premium .................................................................................. 319
62.1 Summary Analysis .................................................................................... 319
62.2 Milestone scorecard .................................................................................. 319
62.3 Evidence ................................................................................................... 320
62.4 Additional comments ................................................................................. 320
62.5 Recommendations .................................................................................... 320
63 Gearing ............................................................................................................. 321
63.1 Summary Analysis .................................................................................... 321
63.2 Milestone scorecard .................................................................................. 322
63.3 Evidence ................................................................................................... 323
63.4 Additional comments ................................................................................. 325
63.5 Recommendations .................................................................................... 325
64 Debt margins .................................................................................................... 326
64.1 Summary Analysis .................................................................................... 326
64.2 Milestone scorecard .................................................................................. 327
64.3 Evidence ................................................................................................... 327
64.4 Additional comments ................................................................................. 328
64.5 Recommendations .................................................................................... 328
65 Insurance .......................................................................................................... 329
65.1 Summary Analysis .................................................................................... 329
65.2 Milestone scorecard .................................................................................. 330
65.3 Evidence ................................................................................................... 330
65.4 Additional comments ................................................................................. 332
65.5 Recommendations .................................................................................... 332

ORE Catapult PN000113-FRT-002
CRMF 2015 Evidence log Issue: FINAL 18
66 General comments ........................................................................................... 333
66.1 Evidence ................................................................................................... 333
66.2 Additional comments ................................................................................. 336
66.3 Recommendations .................................................................................... 336

ORE Catapult PN000113-FRT-002
CRMF 2015 Evidence log Issue: FINAL 19
1 Introduction
This document provides a structured log of evidence gathered as part of the industry
engagement phase of the Cost Reduction Monitoring Framework (CRMF) study for 2015.
Each section provides details of the response received from industry stakeholders. Evidence
was gathered by circulation of electronic questionnaires and by interviews. Some interviews
were conducted face to face and others by teleconference. Interviewees were asked to review
and approve interview minutes. Where additional public domain information is relevant or adds
insight it has been included as market intelligence.
1.1 Notes
Important notes about this evidence log:
1. Some evidence (rated by participants as “commercial in confidence”) has not been
included in this evidence log. The summary and findings described in CRMF 2015 have
been shaped by all evidence collected, but it has not been possible to include some
evidence marked as confidential by respondents in this public document.
2. Responses have not been edited, other than where necessary to anonymise participants
primarily by removing [PROJECT], [PRODUCT] and [COMPANY] names. Editing by
ORE Catapult is denoted by the use of square brackets. As such terminology,
vocabulary and jargon used is as found in industry responses.
3. It is important to be aware that terminology can have different meaning when taken out
of context or when comparing one response with another. For example what each
participant considers to be a ‘near shore site’ may vary significantly. ORE Catapult
suggests the following definition but does not guarantee that all responses reference this
terminology:
Near shore < 40km;
Mid shore 40 – 70km;
Far shore > 70km.
4. The 2015 assessment of indicators (whether they are ahead of, on, behind or have
missed the target) presented has been completed by calibrating industry responses
against defined milestone scorecards and using review workshop sessions to agree
status for each indicator based on available evidence.
5. Outlook is a fundamentally more subjective metric, and was arrived at by either:
1. Asking participants to rate their confidence in achieving the 2020 target for the
particular indicator on a scale of 1 – 10 then averaging responses to arrive at a
score. In which cases averages for all respondents in a category (for example

ORE Catapult PN000113-FRT-002
CRMF 2015 Evidence log Issue: FINAL 20
‘Developers’) and an overall average are presented. The number of samples
contributing to each score varies by indicator.
2. An industry average as in 1. (above) but with a justified modification to the score by
ORE Catapult. Where they have been adjusted, scores are described as such.
3. ORE Catapult derived scores which were subsequently checked by consultation with
industry experts.
6. Evidence has been reported in three primary categories for each indicator:
1. Questionnaire responses: typed responses to electronic questionnaires;
2. Interview responses: noted minutes of a structured interview conversation, which
have been reviewed for accuracy and approved by interview participants;
3. Market intelligence: information sourced from public domain sources such as
journals, industry press or internal (ORE Catapult) and external knowledge
databases.

ORE Catapult PN000113-FRT-002
CRMF 2015 Evidence log Issue: FINAL 21
2 List of abbreviations
BLEEP: Blade leading edge erosion programme
BoP: Balance of plant
CBM: Condition based maintenance
CFD: Computational fluid dynamics
CfD: Contract for difference
CMS: Condition monitoring system
CRMF: Cost reduction monitoring framework
CRP: Cost reduction pathways
CTV: Crew transfer vessel
EoW: End of warranty
FEED: Front end engineering design
FID: Final investment decision
FiT: Feed in tariff
GBS: Gravity base structure
HLV: Heavy lift vessel
IMCA: International Marine Contractors Association
ITT: Invitation to tender
KSF: Knowledge sharing forum
LCCC: Low carbon contracts company
LCOE: Levelised cost of energy
LEC: Levy exemption certificates
O&M: Operations and maintenance
OEM: Original equipment manufacturer
OWA: Offshore wind accelerator
OWPB: Offshore wind programme board

ORE Catapult PN000113-FRT-002
CRMF 2015 Evidence log Issue: FINAL 22
PPE: Personal protective equipment
PQQ: Pre-qualification questionnaire
TCE: The Crown Estate
TRL: Technology readiness level
WTG: Wind turbine generator
WTIV: Wind turbine installation vessel

ORE Catapult PN000113-FRT-002
CRMF 2015 Evidence log external Issue: FINAL 23
3 FEED (optimisation & use of multi-variable array layout tools)
CRMF workstream Level 1 indicator Level 2 indicator Level 3 indicator
Technology Project management and development Project management and development FEED (optimisation & use of multi-variable array
layout tools)
3.1 Summary Analysis
Finding: On target
The 2015 score for this indicator is 'on target' because although there have been some improvements in the efficient use of data and tools/models, there is not a substantial increase in input from the supply chain
on last year. Depending on the developers' strategy, the supply chain is more often than not, only asked to provide costs.
Last year noted the diversity in approaches by developers to involve the supply chain in FEED studies and this continues to be the case. Although there are some improvements, there are limited improvements
in the way in which sites are developed and there has been limited improvement over the last 12 months, partly due to the limited number of projects in the FEED stage. Questionnaire and interview evidence
suggests that there has been:
Improvements in multi-variable array layout modelling through improved models (e.g. wakes) and smarter use of input data (metocean, geotechnical etc.)
Moves towards standardisation of tools across the wind farm and particularly in the electrical area, which enables more efficient data sharing
Continued efforts by OEMs to offer modelling and design services for FEED studies, although limited uptake by some project developers.
Greater use of data from previous projects to inform project designs e.g. commercial data from tenders and offshore logistics data as input to new models
Improvements in existing CFD and modelling tools (such as WindModeler and Fuga) have been facilitated by support as part of the OWA programme, and these are now available for use as commercial
products.
Tension between delivering detailed work pre-CfD award vs. the need to commit from supply chain in greater detail in a shorter time, continues to be a common theme following last year's study. The supply chain
appears to be beginning to adapt to this.
Outlook: ORE Catapult amended score of 7
Input during FEED from turbine OEMs is commonplace and is increasing. BoP OEMs are slowly increasing involvement. Between developers however there is an issue around exclusivity on technology
innovation in a now more competitive bidding environment i.e. Developers see risk in sharing too much information with the OEMs as this may affect turbine/product pricing or information may be shared with
competitors. Uncertainty around the effect of increased competition between developers places downward pressure on the outlook score.
An outlier in the response from industry is considered an unfair skew so amended result up to 7.

ORE Catapult PN000113-FRT-002
CRMF 2015 Evidence log external Issue: FINAL 24
Please indicate your level of
confidence in the industry
achieving the following by
2020 for this indicator (1 Low
confidence, 10 High
confidence)
Developers average WTG OEM average Electrical OEM average Installation average Overall average
More detailed FEED design
studies optimising on LCOE at
system level, with input from
component designers and
installers from early in project
development and computer
design tools used that assist
with the optimisation of the wind
farm layout, considering multiple
variables.
7.8 7.2 4.5 7.7 6.8
3.2 Milestone scorecard
Milestone scorecard FID 2015 FID 2016 FID 2017 FID 2018 FID 2019
Ahead of target Improved FEED studies with
greater input from supply chain.
Good progress in optimising site
layout based on multi-variable
modelling, with limited
verification of models
Improved FEED studies with
greater input from supply chain.
Computer design tools used that
assist with the optimisation of
the wind farm layout,
considering multiple variables.
More detailed FEED design
studies optimising at system
level, with input from component
designers and installers.
Computer design tools used that
assist with the optimisation of
the wind farm layout,
considering multiple variables.
More detailed FEED design
studies optimising at system
level, with input from component
designers and installers.
Computer design tools used that
assist with the optimisation of
the wind farm layout,
considering multiple variables.
More detailed FEED design
studies optimising at system
level, with input from component
designers and installers from
early in project development.
Computer design tools used that
assist with the optimisation of
the wind farm layout,
considering multiple variables.
On target Further improvements in FEED
studies. Some optimisation of
site layout based on multi-
variable modelling, with limited
verification of models
Improved FEED studies with
input from supply chain. Some
optimisation of site layout based
on multi-variable modelling, with
limited verification of models
Improved FEED studies with
greater input from supply chain.
Good progress in optimising site
layout based on multi-variable
Improved FEED studies with
greater input from supply chain.
Computer design tools used that
assist with the optimisation of
More detailed FEED design
studies optimising at system
level, with input from component
designers and installers.
Computer design tools used that
assist with the optimisation of

ORE Catapult PN000113-FRT-002
CRMF 2015 Evidence log external Issue: FINAL 25
modelling, with limited
verification of models
the wind farm layout,
considering multiple variables.
the wind farm layout,
considering multiple variables.
Behind target Some improvements in FEED
studies. Some optimisation of
site layout based on multi-
variable modelling, with limited
verification of models
Some improvements in FEED
studies. Some optimisation of
site layout based on multi-
variable modelling, with limited
verification of models
Improved FEED studies with
input from supply chain. Some
optimisation of site layout based
on multi-variable modelling, with
limited verification of models
Improved FEED studies with
input from supply chain. Some
optimisation of site layout based
on multi-variable modelling, with
limited verification of models
Improved FEED studies with
greater input from supply chain.
Good progress in optimising site
layout based on multi-variable
modelling, with limited
verification of models
Missed target FEED studies are getting less
effective
No improvements Some improvements in FEED
studies. Some optimisation of
site layout based on multi-
variable modelling, with limited
verification of models
Some improvements in FEED
studies. Some optimisation of
site layout based on multi-
variable modelling, with limited
verification of models
Improved FEED studies with
input from supply chain. Some
optimisation of site layout based
on multi-variable modelling, with
limited verification of models
3.3 Evidence
3.3.1 Questionnaires
Category Questionnaire response
Which (if any) modelling tools do you use to support your FEED study?
Dev • Combination of industry standard and in-house tools for assessing wind and met ocean data • Specialist consultancy support used for assessing geophysical and geotechnical data • In-house tools for assessment I&L and O&M logistics • All significant design scenarios tested using in-house financial model • Design of turbine foundations, OSS platforms, electrical infrastructure and all associated electrical studies are generally carried out externally by consultants or the main contractors. • However, the design of the electrical OFTO scope for [PROJECT] is to be undertaken by [COMPANY] division, who have more significant engineering tools and resources in-house.
Dev Modelling tools include Wind and Energy capture modelling, Structural analysis, and economic modelling to optimise the selected concept.
Dev Wind Farmer for wind yields Dij Silence LCOE Model External Companies – Modelling tendered
Dev - LCOE modelling tool - Wind yield assessments - Different optimizers (i.e. for cabling layout) - Financial model - Logistic & O&M models
Dev [COMPANY] has a number of in house models to support FEED study work for areas such as electrical design, foundation design and ground modelling, installation & logistics etc

ORE Catapult PN000113-FRT-002
CRMF 2015 Evidence log external Issue: FINAL 26
Category Questionnaire response
In addition we also use external industry software where applicable In some cases we will use external consultants to support FEED work
Designer ASAS / ANSYS primarily Various in-house proprietary tools
Describe any improvements (over the past year) in the way in which you undertake your FEED studies. Provide specific examples where possible.
Dev • With more operational data across the industry, there has been a gradual reduction in uncertainty of wind resource and assessment of wake effects • Generally better use of site data (wind, met ocean, geotechnical), e.g. - More rigorous assessment and targeted provision of met ocean operating conditions - Implementation of geotechnical ground model and more staged collection of data - Scoping of geotechnical campaigns better informed by preliminary design • More construction and operational data and improved I&L and O&M tools has led to more optimised I&L and O&M logistics set-up • Industry tools are becoming more standardised, e.g. for electrical system studies, enabling more efficient sharing of data • Increased commercial data from previous tenders means design choices are more informed • Programme more focussed on design optimisation, e.g. - Combined turbine/foundation design started earlier, pre-FID - More time for fabrication and installation optimisation prior to design freeze and order of materials • Continuous improvement as lessons learnt are transferred from one project are passed to the next, e.g. experiences from jacket design and fabrication at [PROJECT] passed to [PROJECT], electrical platform designs are evolution of previous generations
Dev In our role as operator of the [PROJECT], [Dev] are currently reviewing contractor proposals for our first FEED studies, having completed a concept selection process with support from various engineering consultants.
Dev No changes – Standard process
Dev In general we have tried to be clearer on our project design requirements at commencement of FEED studies and introduced more standardisation where possible
WTG OEM No significant improvement seen – limited participatory involvement from OEMs by developers
WTG OEM Improvement in optimisation for Wake studies and improved methods of optimising tower / substructure
WTG OEM Limited number of offshore projects at FEED stage
WTG OEM - Closer collaboration with foundation designers and installers - Customers now wanting tenders with WTG + Foundation scopes within consortia
Electrical OEM The effect of the CfD process has encouraged developers to conduct FEED studies on a competitive or exclusive basis as a means to enable early system optimization prior to the CfD subsidy application. However, whilst the supply chain supports this earlier engagement, both developers and the supply chain remain challenged by the need to conduct these FEED studies in advance of the CfD award given the added uncertainty in the Pre-FID phase of the project of whether a project will be successful in the CfD process.
Designer Various fixed structure wind farm developments including [PROJECT] and [PROJECT].
Installation We see a somewhat more functional approach, rather than technical. This improves more freedom for a contractor enabling a more cost efficient solution.
Installation [Installation] has seen more involvement of early installation thinking in the design process. This is beneficial from cost and safety perspective. More generally, however, we have not seen an improvement in FEED studies. This is partly due to the CFD process where developers seem less willing to invest in front end engineering when there is little certainty of obtaining funding. Then if they do obtain a contract there is insufficient time to properly develop the engineering in the current timescale. What has tended to happen in recent times is that developers are carrying out EPCI design competitions which has increased cost for the supply chain. Also the developers have not been willing to share LCOE data, especially operational data with designers to be able to help them to find the optimum balance between capital investment and operational expenditure.

ORE Catapult PN000113-FRT-002
CRMF 2015 Evidence log external Issue: FINAL 27
Category Questionnaire response
Installation Not Applicable
Describe how the supply chain is involved in the design of your wind farms / At what point in the wind farm design process are you involved?
Dev Significant engagement with supply chain takes place throughout the project development to understand the technology options, including the next generation or new innovative solutions. The supply chain companies, particularly Tier 1, are invited to comment on preliminary designs or submit their own outline proposals using site data provided, e.g. • Foundation fabricators have reviewed foundation options from a fabrication perspective • Installation contractors have reviewed foundation options from an installation perspective and provided operating limits • Potential foundation suppliers have priced concept solutions • Electrical contractors have submitted outline electrical configurations and OSS solutions The tendering process is then implemented in parallel with FEED and detail design activities, including options on scope, to ensure the most cost-effective solutions are selected. For example, [PROJECT] is currently progressing the design of a range of jacket sizes, with a view to optimising the overall cost of fabrication and installation when initial tender returns are received.
Dev The FEED Studies will be undertaken by Contractors with supply chain capability, who will subsequently have the opportunity to tender for the construction work.
Dev We do a concept design but then supply chain does almost all of the detail. Design of turbines and foundations is an iterative process between the turbine manufacturers and the foundation designers, which are dependent on the site conditions. Electrical design is based on the array and the number of turbines within the array.
Dev Technical clarification meetings are held with potential suppliers during the concept phase. Only one concept is selected; in the future, more concepts may be selected after this phase. In the FEED phase suppliers are requested to participate in the OWP design via FEED studies. Commonly, one concept is brought forward into the detailed design phase.
Dev [COMPANY] maintains relationships with all participants in the supply chain to ensure that technology development is fully reflected in our project designs. Close monitoring of costs and prices is maintained. We expect the supply chain to take a leading role in innovation and cost reduction initiatives. We aim to channel our active participation via industry lead initiatives such as the OWA
WTG OEM Initial involvement is after EIA submission but real involvement only starts during initial procurement phase (e.g. RFI) and typically involves substructure design interface.
WTG OEM It is different according to the market (the BSH process requires relatively early involvement for example). In the UK we are asked a large number of technical questions at various stages which input to developers designs, but it only becomes a continuous mutual exchange at the preferred bidder stage.
WTG OEM As a turbine OEM we are involved significantly in pre-FID activity, assisting developers in identifying the most appropriate turbine, rotor and siting arrangement to maximize AEP and thus reduce LCOE
WTG OEM We should become involved as early as possible. For example, during the optioneering phase when different foundation types are being assessed.
Electrical OEM Usually after some conceptual work has been done by the Developer in the case of turnkey projects. Much later for equipment supply contracts
Electrical OEM This varies depending on a developers' procurement process but tends to be (formally) at FEED stage. Where a project is more technology driven (e.g. HVDC projects) this involvement may be earlier at Feasibility or Concept Development phase.
Designer From early concept through to completion of detailed design
Installation [Installation] is involved from conceptual studies through to installation engineering and project execution. In the UK [Installation] is currently engaged in the FEED for [PROJECT] and will perform EPCI for cables and structures if the project achieves FID. [Installation] has performed tender engineering for [PROJECT] and [PROJECT] in recent months. Transportation and installation studies have been performed for a number of projects in the UK.
Installation Early stage involvement with the installation vessel sea fastening design process. Concept stage through to FEED and construction
Discuss whether you think you are more involved in the design of wind farms than three years ago.

ORE Catapult PN000113-FRT-002
CRMF 2015 Evidence log external Issue: FINAL 28
Category Questionnaire response
WTG OEM No
WTG OEM Yes, partly this is because we are working with different clients, and partly because we are more knowledgeable ourselves.
WTG OEM Varies by Customer. Some entering more long-term 'framework type agreements which allows for earlier design input as opposed to others who remain fixed on a 'procurement' model where design is largely finalized then tendered later to retain competitive tensions between turbine providers
WTG OEM We've not noticed a significant change. It really depends on the end customer and their experience of handling multicontracting. As a WTG manufacturer, we will be more inclined to commit resources for the design if we have been nominated as the preferred contractor vs if we are still competing with other WTG suppliers. Having said that, we are seeing a slight trend towards EPC contracting where you form a consortium to bid for a project.
Installation Yes we have. What we see is that developers seem to seek EPC solutions where the contractor also has a significant influence in the overall design. To our opinion this will bring better and leaner designs, ultimately saving costs. Also the cost for installing are considered in the design and also save installation costs.
Installation [Installation] scope on [PROJECT] has increased from T&I to EPCI so we have taken over design responsibility for the major scopes within the alliance. [Installation] has also been short listed on a number of competitively tendered EPCI projects. [Installation] has actively engaged with a number of sub-contract designers in the UK and overseas.
Describe any planned future changes to the design process that may impact LCOE.
Dev Extension of above. Increasing data and experience makes design tools more and more effective.
Dev WE currently see that supplier with offshore wind experience have the bet knowledge base to drive down LCOE. So involvement of suppliers in the design process, with the incentive of continuing into the equipment supply and installation phase, should facilitate this.
Dev The process is already quite aggressive. The process may require the wind data to be delivered earlier in the future.
Dev In the future, final investment decisions may more be based on FEED or even only on conceptual designs; compared to the current approach to base it on detailed design. This will result in higher risks being taken by the developer in green-field developments.
Dev In general [COMPANY] maintains a constant review of process to ensure that low LCOE is achieved. This includes increasing standardisation and increasing of specialist engineering resource
WTG OEM Not aware of any planned changes.
WTG OEM From a turbine OEM perspective we expect our focus to be on optimisation of structures, and interface improvements.
WTG OEM Solely dependent on Developer approach.
WTG OEM The earlier the WTG manufacturer can get involved in the design process, the greater the chance of finding solutions to lower LCOE for the project.
Electrical OEM None. Unless we are constrained by a prescriptive client specification, we will always challenge the design to identify the most cost effective solution.
Electrical OEM Early supplier selection to enable FEED study outputs will in itself enable a more efficient and project relevant design process and therefore improved system optimization with the requisite cost reduction.
OFTO Recently work has been undertaken to promote the use of offshore substations mounted on the wind turbine foundation. This included work to clarify the SQSS via working group GSR020 on single transformer platforms.

ORE Catapult PN000113-FRT-002
CRMF 2015 Evidence log external Issue: FINAL 29
3.3.2 Interview
Category Interview response
Which (if any) modelling tools do you use to support your FEED study?
Dev Yield modelling, and other models are almost all internally created. Developer is keen to keep control of these by keeping them in house.
Dev • Using tool developed under the OWA - FUGA - to look at site layout. Seen as advanced tool using CFD to verify array layout.
Describe any improvements (over the past year) in the way in which you undertake your FEED studies. Provide specific examples where possible.
Dev • [Dev] model may be considered different to some other developers in that thy involve the supply chain early • They believe they may be one of the earliest to engage, and are reliant on the supply chain to be the innovators • Still run as a competitive procurement process, but they tend to select their preferred bidder earlier than most developers would, • 3 packages: turbines, offshore BoP, onshore BoP +export cables. • Plan was to remain competitive up to post consent/pre CfD
Dev • Not much change from questionnaire last year, minor adjustments only in past year. • [Dev] are adjusting the way they approach things in order to function in an auction based world. • Throughout the organisation there is a 'strategic review' where in general [Dev] are looking to backload obligations as much as possible. This will impact many areas.
Dev • Are handing over raw data as much as possible • Contractors work on the basis that design is not interactive, and that competency in design is on designers. • Scope of contractors is to deliver viable designs, they are the experts. [Dev] see their task as primarily the judging of their competence.
Dev - Have taken the approach of supplier led FEED. Unrealistic to spend many millions on design which would then have to be taken to the supply chain to work with, overly prescriptive and unlikely the most cost efficient method of project delivery. - Have pushed a lot of the engineering work onto suppliers, view that drives this is pragmatic – suppliers can generally be considered to be the experts. - Overall strategy is to have individual EPCI packages, which does have synergies with supply chain led design work. - As would be perhaps be considered natural progression, the industry does appear to have learned and improved significantly over last 4 – 5 years.
Dev Need to spend more upfront on development now ahead of certainty in getting support award - Regulatory environment (not just CfD rounds but budgets that the rounds will contain) is definitely a big risk and unknown at the moment - Must have a site sufficiently developed to be able to bid into the CfD process, and hence must have certainty in what is going into bid, but to do this will have to have spent significantly on development
WTG OEM - From a technical point of view the optimal may be to have more access to data and have it provided further in advance than is ordinarily the case now. - However in general there probably is sufficient sharing and collaboration to be classed as adequate for the purposes of the WTG OEM.
WTG OEM • [WTG OEM] have described that involvement has been late in development process in UK. • This has been both regulatory and developer led • Moving towards CfD developers are more wary of not having accurate cost estimates up front.
Designer There has been noticeable improvement in operating machines (WTG), and understanding loadings. Close relationship between fabricators, installers and designers is essential to smooth projects and cost reduction. [Designer] are now starting to tune design to optimise other areas with cost impact, e.g. installation.
Installation Often turbine locations surveyed are not finalised and so there is an element of risk for the installation contractor who must take what early survey data they can get, and subsequently conduct installation at a different location once layout is finalised.
Installation Not involved but would like to be involved earlier in the design process.
Describe how the supply chain is involved in the design of your wind farm(s). / At what point in the design process do you become involved?

ORE Catapult PN000113-FRT-002
CRMF 2015 Evidence log external Issue: FINAL 30
Category Interview response
Dev - 50% UK content target - Looking to drive tier 1 suppliers to procure locally (from tier 2’s) where local content is possible - New government requirement brought in along with CfD regime - Not in a position to pay a premium based on requirement for local content, and are expecting the supply chain to help them find cost efficient ways to include sufficient UK content. - Projects are more ripe for UK content in some phases of project/areas rather than perhaps big tier 1 suppliers, for example offshore substation fab, secondary steel, O&M etc all help to contribute towards UK content and are areas where using UK suppliers or sub-suppliers are likely to be most cost effective. - Challenge is that the methodology for UK content is quite new, and perhaps is not as well understood by suppliers/the industry as it might be
Dev - Have pushed a lot of the engineering work onto suppliers, view the drives this is pragmatic – suppliers can generally be considered to be the experts. - Overall strategy is to have individual EPCI packages, which does have synergies with supply chain led design work.
Dev Have gone for an early contractor enagement strategy in the past - There is an improving visibility of CfD rounds, but early contractor involvement will now always have to have a bit of competition in the mix, which may cost slightly more at the development phase
WTG OEM • The UK market has limited early engagement of the supply chain. This seems to be driven by hesitance around sharing information before a CfD auction. • There tends to be a fairly one way exchange of some data, but not much of substance at early stages. • In other markets this may be slightly different, driven by the economics of those. • Competition is a reliable way to get the most out of the supply chain, but tendering can be resource intensive. • OEMS taking a much harder view of risk before entry now, they cannot devote infinite resources to all projects. • The French market for example is different, as there is an expectation that early bids are required from the supply chain, but that there is a more open dialogue with developers in finding a way to make such projects work. • The various other European support mechanisms are generally more generous/less competitive in contrast to the UK and increasingly attracting investor interest.
WTG OEM - Do [WTG OEM] feel they are as involved as much as they would like to be sufficiently early in the development phase? - This is very much dependant on their customers
WTG OEM • The big driver for front loading FEED is having cost certainty before bidding. They are typically involved before auction bids. • Difference UK to DK market, government is taking on considerable amount of early development work (in Europe). This generally means that there is more geo/met ocean data available for the project in DK, whereas in the UK system the developer has to spend a fairly large amount on preliminary assessments before they are able to submit a bid. They have no certainty whether they will win or not. • DK approach puts pre-development work on government and reduces risk for developer in the event that they don’t win. • There is likely to be some link between developer and government in defining scope of these surveys.
Electrical OEM - Certain clients seem to misunderstand the aim/methodology of FEED studies - There is an opportunity for offshore wind to learn from oil and gas industry who spend more (but consequently get more value) by conducting more appropriate FEED studies
Designer - Gestation period of projects means that designer gets a changing scope of requirements as they go through the design. Late information and project deadlines reduce the opportunity to optimise some of their designs. This may be mostly as a result of a rapidly evolving sector, e.g. turbine design moves so quickly that new information will come to the designer throughout the design process. - Could say that an alternative arrangement where projects are “all under one roof” the information sharing would perhaps improve, but it is unlikely that there would be a significant impact on capital cost by working this way. - Designer and fabricator are now in a mature relationship, as they have completed a number of projects and so each better understand each other.
Installation - Not involved but would like to be involved earlier in the design process. - Do try to get involved in the design process. Most of time get asked to deliver equipment yesterday. Trying to tie up with developers to make more aware of working conditions offshore. Tend to become involved just before installation campaign starts, which is far too late
WTG OEM [WTG OEM] have mostly answered questions from a fully European context BSH vs UK structure - There is a drive for early involvement in BSH in Germany
Discuss whether you think you are more involved in the design of wind farms than three years ago.

ORE Catapult PN000113-FRT-002
CRMF 2015 Evidence log external Issue: FINAL 31
Category Interview response
WTG OEM - Some customers work very closely with [WTG OEM] at an early stage and hence see benefits in cost reduction. - Other customers prefer to retain a competitive tension between turbine suppliers and see this increased competition as more effective in driving cost reduction than the benefits or potentially earlier involvement/collaboration. - Competitive auctions have made it harder for developers to drive cost reductions through collaboration. - It is easier as an OEM to look at a pipeline, and be insulated from the particulars of a single geography, as they are not tied only to the success of a single process.
WTG OEM • [WTG OEM] have described that involvement has been late in development process in UK.
Installation [Installation] have a good flow of technical and research work with [COMPANY] and [COMPANY].
Installation Feels like moving in the right direction and they are more involved than previously
Electrical OEM The last 5 – 6 years, early days of offshore wind industry has been a massive learning experience This increased experience has in general lead to more consistency in pricing and delivery
Foundation - Early involvement of supply chain is now happening, there is positive progress here. - Perhaps a few years ago the supply chain was involved later than it is today. - Reasonably far out – 4 to 6 years away projects are starting to come from developers seeking experts in the supply chain to get involved. - From what [Foundation] see there does seem to be reasonably good early engagement of developers with supply chain
WTG OEM - [PROJECT] and [PROJECT] were economic with 5MW but had to change since scheme has changed - In some ways changes to BSH are good as have changed to reduce project risk as a result of being much more focused earlier on what the precise combination of the project will actually be - In the BSH system you have much less choice – [COMPANY] and [COMPANY] turbines can compete, but cannot compare directly with [COMPANY]/[COMPANY] etc because you are doing site investigation/detailed planning based on very specific know selection of turbines etc - First selection will have intensive competition in Germany, but then you do detailed design earlier (3 years out) vs in UK where detailed design might be completed 1 year ahead of construction.
Describe any planned future changes to the design process that may impact LCOE.
Dev • [Dev] do see auction mechanism as a strong driver of cost reduction. Evidence is there in extremely low prices being bid. • However, [Dev] suggests that there is a need to find a tender system that does not kill suppliers. They think that bidding/auctioning will use up a lot of supply chain interaction and may be a source of inefficiencies, as suppliers may bid several times to have only the chance of winning a single project.
Dev • 3 scopes of work/contract packages
Dev When a project moves from consenting development to more of an engineering style of phase there may be a something of a change in attitude and approach.
WTG OEM • Moving towards CfD developers are more wary of not having accurate cost estimates up front.
Electrical OEM There is an opportunity to disseminate the learning from some experienced developers and/or the oil and gas industry for cost saving and collective benefit.
Designer Debate with fabricators; example: designer wants more complex manufacturing (welding) as they see the benefits, but fabricator can reduce CAPEX by using an alternative. There is something of a tension here and not always clear that lowest LCOE paths are chosen.
Foundation -Developers and Tier 1 EPCI do at times start to compress tender cycles and perhaps unreasonably accelerate quotes from their supply chain in only a small number of weeks. -Not certain what precisely drives such periods of urgency, could be award of consent, could be award of CfD etc. -Considering the 2x CfD projects by way of example: [PROJECT] has already gone out to tender and should have a good amount of project information in hand (tenders etc.) before winning CfD whereas [PROJECT] has not gone out to tender yet, and so when they do ask for example for foundation quotes in near future they will probably ask for a 4 week turnaround, which will be challenging for some and not achievable for others in the supply chain.

ORE Catapult PN000113-FRT-002
CRMF 2015 Evidence log external Issue: FINAL 32
3.3.3 Market intelligence
3.4 Additional comments
A consequence of the CfD regime is the development risk of multiple projects being priced into single project bids, which may drive up cost on the development timeline to 2020.
3.5 Recommendations
CfD pushes development cost beyond CfD award but there is also a need to reduce costs through acquiring more information during development. The Dutch system for wind farm development has been
referenced as successful in getting over this hurdle.
Evidence Source
None for this indicator

ORE Catapult PN000113-FRT-002
CRMF 2015 Evidence log external Issue: FINAL 33
4 Site selection
4.1 Summary Analysis
The calculation for the average of weighted scores (water depth, distance to shore, wind speed) for sites reaching FID in the EU in 2015 is 1.27, meaning this indicator is ahead of target.
A higher score means an overall more attractive site (combination of low water depth, not far from shore and high wind speed). Developers continue to focus on the most economically viable projects and the
revival of Galloper over the last 12 months is testament to this.
Outlook: ORE Catapult score 5
No industry rating for this outlook was gathered. ORE Catapult rate the outlook on achieving a score of 1.0 by 2020 as 8.The competitive auction process gives even more importance to selection of the most
economically attractive sites and the weighted scores should decline from 2015 level as the “easiest” sites achieve FID, leaving more challenging sites (with lower scores) to reach FID next. This suggests scores
will tend towards the target of 1.0 by 2020 and the site characteristics for consented or consent-pending sites in the pipeline to 2020 support this. However, there is a possibility that sites outwith this group, with
higher site selection scores, are able to gain consent in time for 2020 FID.
CfD likely to lead to the most economically advantageous sites being developed first, rather than those sites that are needed to justify a further strategic investment (e.g. round 3).
4.2 Milestone scorecard
Milestone scorecard FID 2015 FID 2016 FID 2017 FID 2018 FID 2019
Ahead of target Average of weighted scores for
all sites = 1.12
Average of weighted scores for
all sites = 1.08
Average of weighted scores for
all sites = 1.02
Average of weighted scores for
all sites = 1.02
Average of weighted scores for
all sites = 1.02
On target Average of weighted scores for
all sites = 1.06
Average of weighted scores for
all sites = 1.04
Average of weighted scores for
all sites = 1.01
Average of weighted scores for
all sites = 1.01
Average of weighted scores for
all sites = 1.01
Behind target Average of weighted scores for
all sites = 1.03
Average of weighted scores for
all sites = 1.02
Average of weighted scores for
all sites = 1.00
Average of weighted scores for
all sites = 1.00
Average of weighted scores for
all sites = 1.00
Missed target Average of weighted scores for
all sites = 0.98
Average of weighted scores for
all sites = 0.98
Average of weighted scores for
all sites = 0.98
Average of weighted scores for
all sites = 0.98
Average of weighted scores for
all sites = 0.98

ORE Catapult PN000113-FRT-002
CRMF 2015 Evidence log external Issue: FINAL 34
4.3 Evidence
The physical characteristics (based on information available via 4C Offshore) of utility-scale wind farms reaching FID in 2015 have been scored individually, with 2015 receiving a MW-weighted aggregate score
of 1.27 as shown in the table below.
Site MW Average Water depth (m) Distance from shore (km) Wind speed (m/s) Score
Race Bank 565 13 30 9.11 1.20
Galloper Wind Farm 340 31.5 32.5 9.87 1.26
Rampion 400 29.5 14.5 9.76 1.40
Walney Extension Phase 1 330 38 24 9.78 1.26
Walney Extension Phase 2 330 38 24 9.78 1.26
Weighted average 1,931 1.27
4.4 Additional comments
It should be noted that this milestone assumes a higher score to mean more attractive sites are developed in that period (shallower, nearer to shore). As such, ahead of target implies that the 'easier' sites are
those being assessed in this period. There is a potential conflict between a target lower score for 2020 (implies more challenging sites) and continued cost reduction. However, the ambition is that cost reduction
will be achieved in a mix of sites. If cost reduction is being achieved, but only in the current, attractive site conditions, then the challenges which must be faced eventually (as the “easy” are already built) are being
stored up for the future.
4.5 Recommendations
CfD regime likely to push further from shore sites back in favour of first rounds completing. As well as innovation funding to secure the cost reduction to 2020, R&D initiatives should focus on solutions which will
be required to make deeper water, further from shore sites economically viable in order to allow continuity between construction of the current pipeline up to 2020 and the post-2020 sites which are likely to
include a mix of challenges not yet faced.

ORE Catapult PN000113-FRT-002
CRMF 2015 Evidence log external Issue: FINAL 35
5 Site investigation (optimisation & use of multi-variable array layout tools)
CRMF workstream Level 1 indicator Level 2 indicator Level 3 indicator
Technology Project management and development Project management and development Site investigation
5.1 Summary Analysis
Finding: Behind target
Marked as 'behind target' because there does not appear to be consistent improvements in the quantity of site investigations beyond last year.
Although surveying techniques are improving and costs are coming down, there is not clear evidence that this translates into improved quality/quantity of data during the development phase.
Supply chain see no improvements in data provision. There is only improvement in volume of data, driven largely by the size of sites.
Significantly greater amount of variation in geotechnical conditions on current and future rounds of sites. Larger sites have more variable geotechnical conditions and borehole depths have increased due to larger
foundations in greater water depths.
There is evidence of some use of methods that optimise the borehole process.
Majority of developers do not undertake detailed geotechnical investigation until after FID generally due to risk. Consultees stated this has not improved following the introduction of the CfD process.
Outlook: Industry score of 5.7
Industry score of 5.7 for the outlook although ORE Catapult believes this is overoptimistic as evidence suggests that there is likely to be cost compression on development expenditure going forward.
Oil and gas industry decline has led to a much more competitive market currently for survey vessels. However, this is not measured as it is outside of control of the industry, and therefore considered a cost
driver.
Please indicate your level of confidence in the
industry achieving the following by 2020 for
this indicator (1 Low confidence, 10 High
confidence)
Developers average Installation average Overall average
Supplier designs optimised based on increased
level of geotech and geophysical surveys with
greater surveying of cable route and landfall.
5.8 5.3 5.5

ORE Catapult PN000113-FRT-002
CRMF 2015 Evidence log external Issue: FINAL 36
5.2 Milestone scorecard
Milestone scorecard FID 2015 FID 2016 FID 2017 FID 2018 FID 2019
Ahead of target Increased surveying of site,
cable route and landfall.
Information being used
effectively in supplier designs
Optimum amount and coverage
of surveys now understood and
applied. Information being used
in suppliers' designs.
Optimum amount and coverage
of surveys now understood and
applied. Information being used
in suppliers' designs.
Supplier designs optimised
based on increased level of
geotech and geophysical
surveys with greater surveying
of cable route and landfall. 70%
of potential benefits captured for
a typical project.
Supplier designs optimised
based on increased level of
geotech and geophysical
surveys with greater surveying
of cable route and landfall. 80%
of potential benefits captured for
a typical project.
On target Increased surveying of site,
cable route and landfall.
Increased surveying of site,
cable route and landfall.
Information being used in
suppliers' designs.
Greatly increased surveying of
site, cable route and landfall.
Information being used in
suppliers' designs.
Optimum amount and coverage
of surveys now understood and
applied. Information being used
in suppliers' designs.
Optimum amount and coverage
of surveys now understood and
applied. Information being
extensively used in suppliers'
designs.
Behind target Recognising the opportunity for
additional surveys missed
Increased surveying of site,
cable route and landfall.
Increased surveying of site,
cable route and landfall.
Information being used in
suppliers' designs.
Greatly increased surveying of
site, cable route and landfall.
Information being used in
suppliers' designs.
Optimum amount and coverage
of surveys now understood and
applied. Information being used
in suppliers' designs.
Missed target No awareness of the benefits of
improved site surveys
Recognising the opportunity for
additional surveys missed
Opportunity for additional
surveys mainly missed by FID
2017 projects
Increased surveying of site,
cable route and landfall.
Increased surveying of site,
cable route and landfall.
Information being used in
suppliers' designs.
5.3 Evidence
5.3.1 Questionnaires
Category Questionnaire response
Describe any recent changes to the way in which you collect geotechnical and geophysical data?
Dev No recent changes, however, previously we have recognised the importance of much increased focus on quality control for data collection. It is also extremely beneficial to undertake high quality interpretation, particularly of geophysical data.
Dev No recent changes

ORE Catapult PN000113-FRT-002
CRMF 2015 Evidence log external Issue: FINAL 37
Category Questionnaire response
Dev No detailed geotech until after the CfD has been awarded. Prior to CfD, greater reliance on modelling and limited data available.
Dev This depends on the project type (i.e. a tender vs a permit project). But there seems to be a general trend to more improvise or interpolate between various locations.
Dev More recently we have reviewed the scope of geotechnical/geophysical surveys to reduce cost, but at an acceptable level of increased risk. More innovation is required to look at techniques for investigation.
Has the level/scope/resolution of surveys increased over the past year? / Explain whether you think the quality of site investigation has improved over the last year and whether you are able to use this to improve your designs.
Dev No. Increasing size of windfarms means investigations need to be carried out in stages with gradually increasing focus and resolution.
Dev It has increased as the project needs more data as we move towards FEED and Detailed Design
Dev Yes, larger sites with more variable geotechnical conditions. Borehole depths have had to be increased to deal with larger foundations due to greater water depths.
Dev No.....more generally to decrease to reduce costs. But this brings additional risk and the possibility of increasing LEC
Electrical OEM This has been mixed but in general there has been no perceived improvement given the uncertainty of the CfD outcome for a project naturally influences a developers' desire to invest of expensive pre-FID activities of this nature.
Designer I don't see any evidence that it has. What is clearly the case is that the quality of site investigation is critical to achieving a cost effective design.
Installation No. Still developers seem to keep costs for site investigation low as they do not know if they win consent. If they don't the investment is lost (and costs for good investigation is very high, like in millions). This is a paradigma because the lack of information, will drive contingencies at a later stage where contractors might claim the soil differs from the information relied upon.
Installation The quality of site investigation has not improved. The volume of site investigation has increased a little. The timing of the majority of the site investigation is still very late in the design process. Too late to be really useful. The current CFD award process is not helping this. The ground models produced to date have been of relatively little value in terms of usefulness to the design process. This is partly down to the special variability of the conditions on UK projects.
How do you survey the cable route and landfall?
Dev Significant investigation along export cable route, albeit intrusive tests have to be over quite large intervals due to the distance. Survey scope typically includes: • Bathymetry • Ground penetrating radar • Magnetometer • Vibrocores • Additional boreholes and cone penetration tests at landfall Landfall is recognised as a risk location and additional survey works are undertaken there. One difficulty is that detailed works are generally undertaken later than preferred as a consequence of project uncertainty.
Dev Cable route with side scan sonar, and shallow geotech inc CPTs. Landfall with borehole surveys.
Dev Geophysical study Geotechnical study Site walk – especially at pinch points

ORE Catapult PN000113-FRT-002
CRMF 2015 Evidence log external Issue: FINAL 38
Category Questionnaire response
Dev An offshore geophysical survey is initially conducted to identify any physical and/or environmental constraints on the seabed. After the survey results are analysed, a preliminary cable route is selected avoiding any major constraints. Following this a separate contract is required to carry out offshore geotechnical tests (shallow CPTs and Vibro-cores) at regular intervals along the cable route to verify the ground conditions and the selection of suitable cable burial tools. Depending on the site, UXO and/or boulder clearance may be required prior to installation of the cables. A similar process is executed for the landfall. However, a geophysical survey is not usually required since access will usually be available for land surveyors to survey the location. Deeper boreholes may be required if Horizontal Directional drilling is required under roads, beaches, etc at the landfall location.
Dev Bathymetric, side scan sonar and grab samples are typical survey methods.
5.3.2 Interview
Category Interview response
Describe any recent changes to the way in which you collect geotechnical and geophysical data?
Dev • [Dev] were really focused on trying to achieve sufficient site investigations at the right time, challenging to align these two (conflicting) requirements
• In principle not willing to invest in detailed geotech until CfD, but this is in conflict with the requirements of an auction based system, particularly as it is currently designed
• Decision about making reservation payments to pre-book vessels.
• Geotech campaign will take a while for size of projects, so won’t have confirmed design on all BOP before FID
• Project finance might need certainty earlier.
• 12 months from CfD is probably not sufficient, lack of visibility also adds to the difficulty in planning, as dates are really unknown and have no control.
Dev • Since the landscape is now one of setting a price and bidding into an auction, [Dev] plan therefore to just enough site investigation to make the minimum amount of information
available before placing an auction bid.
• This is not necessarily a problem, just something they need to face and work out.
Dev • [COMPANY] [PRODUCT]. Historic boreholes, geophys, preliminary. CPT at every location and along cable route.
Dev - Market capacity has generally increased, and hence costs of geotech/geophys has tended to come down over last few years.
- Have an agreement with key suppliers that pre-agrees quality and granularity of survey work to give price certainty.
Designer - Biggest impact on cost is non homogeneity across sites. - Therefore if designers could be involved in projects earlier (e.g. assist in site selection) significant cost savings could be expected. - The way that the UK has site selection, competition in auction then later design is likely not the optimum way to reduce costs, or at least it increases the barriers to the ways in which designers can help cost reduction. - The Dutch system appears to have learned from the lessons of the way sites are investigated and developed in the UK and can expect a tangible benefit in overall cost.
Has the level/scope/resolution of surveys increased over the past year? / Explain whether you think the quality of site investigation has improved over the last year and whether you are able to use this to improve your designs.
Dev • UK is different to Europe as sites compete against sites so they need to know it well, and consequently probably spend more on preparatory investigation than they would for ‘government prepared’ sites in NL/DK

ORE Catapult PN000113-FRT-002
CRMF 2015 Evidence log external Issue: FINAL 39
Category Interview response
O&M Hard to comment on UK as currently working a lot in Germany. In general the industry does seem to be improving logistics and project planning. Experienced project teams are building on their experiences to find more efficient ways to do things. Less about site investigation and more about project management generally. Much more onshore assembly included in typical RFQs now.
Installation - Soil investigation is very important for cable burial. To give an accurate price contractors need to have detailed soil information to be prepared for the conditions that will be encountered. - However a large soil investigation will cost the developer millions, and all of this must be done before they have certainty of getting a CFD. - If contractors do not get adequate information upfront then the developer then could have a very expensive vessel/hold up during installation which is at risk of developer who was forced to strike a balance of cost at risk and comprehensive site investigation. - In NL authorities do site investigation and pay the cost, then share same information with all developers and contractors, so there is a reduced risk from the outset and all parties are competing on a level ‘risk’ playing field – all parties are well informed about ground conditions. - Logically there is more value to be had by using this approach rather than the way it is done (competitively) in the UK. As spending relatively small amounts on site investigation up front will reduce risk of much larger costs later on. If the project is to be built, it will have to be dealt with, much better to be dealing with it early by spending smart.
Installation [Installation] find that they are able to give more accurate costs earlier when more geotech information is available. Certain developers do very thorough geotech early, others are conducting only the minimum of site investigations. This may be a function of their project stage gating approach to development. - Developers are fundamentally putting a cost on the line to collect geotech data before award of CfD, various developers will have different approaches to how early (and therefore how much they want to spend at risk) at what stages. The implication is that site investigation is not always designed and conducted with the whole project in mind, rather it is a balance of how much to spend whilst ‘at risk’.
Installation No, not at all, would help with designs to help reduce the tendency to over engineer designs - there tends to be a difference between what developers need and what they want.
How do you survey the cable route and landfall?
Dev • [Dev] have invested money into cable landfall for [PROJECT], [PROJECT] gives specific technical challenges. • This is not a cost reduction, rather a way to overcome technical challenges without being overly expensive.
5.3.3 Market intelligence
5.4 Additional comments
None for this indicator
5.5 Recommendations
In other European support systems, authorities do site investigation and pay the cost, then share same information with all developers and contractors, so there is a reduced risk from the outset and all parties are
competing on a level ‘risk’ playing field – all parties are well informed about site conditions. Consider engaging with regulators on lessons learned from implementing mechanisms for reducing development risk
such as those in other EU countries. Establish if there is learning for the UK in sharing information with all developers and contractors predevelopment.
Evidence Source
None for this indicator

ORE Catapult PN000113-FRT-002
CRMF 2015 Evidence log external Issue: FINAL 40
6 Development phase project management
CRMF workstream Level 1 indicator Level 2 indicator Level 3 indicator
Technology Project management and development Project management and development Development phase project management
6.1 Summary Analysis
Finding: Ahead of target
Marked as 'ahead of target' because majority of participants provided evidence of a bespoke development phase management system. All developers are highly likely to have development phase system in place
due to scale of projects being developed.
Systems vary in origin but in general are tailored to the needs of the project.
Outlook: Industry score of 8.3
An industry score of 8.3 for the outlook.
Please indicate your level of confidence in the industry
achieving the following by 2020 for this indicator (1 Low
confidence, 10 High confidence)
Developers average Overall average
Effective project and risk management tools and procedures are in
place including offshore wind specific management systems,
comparable to the oil and gas sector, with effective risk and change
management systems.
7.5 7.5
6.2 Milestone scorecard
Milestone scorecard FID 2015 FID 2016 FID 2017 FID 2018 FID 2019
Ahead of target 50% of developers have specific
offshore management system
with effective risk and change
management systems
Majority of developers have
specific offshore management
system with effective risk and
change management systems
All major developers have
specific offshore management
system with effective risk and
change management systems
Effective project, change and
risk management tools and
procedures in place including
offshore wind specific
management systems,
Effective project, change and
risk management tools and
procedures in place including
offshore wind specific
management systems,

ORE Catapult PN000113-FRT-002
CRMF 2015 Evidence log external Issue: FINAL 41
comparable to the oil and gas
sector.
comparable to the oil and gas
sector.
On target Quarter have specific offshore
management system with
effective risk and change
management systems
50% of developers have specific
offshore management system
with effective risk and change
management systems
Majority of developers have
specific offshore management
system with effective risk and
change management systems
All major developers have
specific offshore management
system with effective risk and
change management systems
Effective project, change and
risk management tools and
procedures in place including
offshore wind specific
management systems
Behind target One or two developers have
offshore wind specific
management systems in place
with emerging risk and change
management approaches. Other
developers have plans to
develop system
Quarter have specific offshore
management system with
effective risk and change
management systems
Quarter of developers have
specific offshore management
system with effective risk and
change management systems
Some developers have specific
offshore management system
with effective risk and change
management systems
50% of developers have specific
offshore management system
with effective risk and change
management systems
Missed target No improvements No improvements One or two developers have
offshore wind specific
management systems in place
with emerging risk and change
management approaches
Quarter have specific offshore
management system with
effective risk and change
management systems
Some developers have specific
offshore management system
with effective risk and change
management systems
6.3 Evidence
6.3.1 Questionnaires
Category Questionnaire response
Do you have a specific offshore wind development phase management system? (YES/NO )
Dev Yes
Dev Yes
Dev Yes
Dev No
Dev Yes
Describe any major improvements to this management system that have been implemented over the past three years.

ORE Catapult PN000113-FRT-002
CRMF 2015 Evidence log external Issue: FINAL 42
Category Questionnaire response
Dev Development phase management system alongside wider project management systems have been replaced by new products brought in for this new area of business. Gradual improvement in the quality and functionality of systems over the past 5 years. Examples include updates to management systems for H&S, Environmental, Quality Management and Document Control. There have also been some updates to standard Technical Specifications for bathymetry and geophysical investigation.
Dev The management system is modified to suit developing requirements of the sector, CfD process, consenting process etc.
Dev There is a management system for onshore projects and this is being applied to offshore. A project board now sit between the directors and the project team which is made up of enough senior people to make fast accurate decisions.
Dev A benchmarking process has been implemented over the past years in order to compare projects across borders. This process is based on internal LCOE targets and country-specific scopes.
Dev Our development phase management system is part of our standard project management model which is applied across our business for all projects. This system is currently under review to reduce complexity and simplify 'paperwork' and make it more relevant for the unique risks of offshore wind
6.3.2 Interview
Category Interview response
Describe any major improvements to this (development phase) management system that have been implemented over the past three years.
Dev • [Dev] are generally adapting what the systems they already have, no plans to introduce dramatic changes. • Looking to risk profile, but this is specifically linked to construction phase.
Dev • No step changes in this area.
6.3.3 Market intelligence
6.4 Additional comments
Last year it was noted that it is challenging to establish if developers have effective risk and change management systems in place and that the milestone needs to be revisited. Also, it was recommended to
consider the KM system being developed by TCE through their 'Community in Practice' initiative.
6.5 Recommendations
It would be highly unlikely a developer would proceed without the correct system in place. Establish if there is uptake of TCE KM system.
Evidence Source
None for this indicator

ORE Catapult PN000113-FRT-002
CRMF 2015 Evidence log external Issue: FINAL 43
7 Floating lidar
CRMF workstream Level 1 indicator Level 2 indicator Level 3 indicator
Technology Project management and development Project management and development Floating lidar
7.1 Summary Analysis
Finding: ahead of target
Marked as 'ahead of target' because there is evidence that the Burbo Bank Extension project completed financing based on energy yield calculations from wind resource data collected from a floating lidar unit.
This is well beyond the 'on target' milestone for 2015 which anticipated that the technology will still be in the demonstration phase.
There are also a number of floating lidar systems on the market at a fairly mature stage of technology development, evidenced by announcements below.
Evidence from developers suggested that providing a robust verification is included, floating lidar has proven itself an acceptable and lower cost way to acquire site wind data. There was evidence of developers
who continue to rely on offshore met masts but this is tempered by an almost universal agreement that the majority of future projects look likely to use floating lidar over fixed met mast as their primary source of
wind data and achieve cost reduction as a result.
Outlook: Industry score of 8
Floating lidar has progressed faster than envisaged.
Industry view is positive about the outlook for floating lidar technology with many citing the likelihood of the technology substituting traditional met masts in the next 2 years.
Please indicate your level of confidence in the industry
achieving the following by 2020 for this indicator (1 Low
confidence, 10 High confidence)
Developers average Overall average
Floating lidar units are proven and used to offset the use of met
masts on a small number of sites, and are being used in the
operations phase.
8.0 8.0

ORE Catapult PN000113-FRT-002
CRMF 2015 Evidence log external Issue: FINAL 44
7.2 Milestone scorecard
Milestone scorecard FID 2015 FID 2016 FID 2017 FID 2018 FID 2019
Ahead of target First floating lidar unit deployed
as a standalone device on a
wind farm
Second floating lidar unit
deployed.
First use of floating lidar on
operational projects
Floating lidar units are proven
and used to offset the use of
met masts on a small number of
sites, and being used in the
operations phase.
Floating lidar units are proven
and used to offset the use of met
masts on a small number of
sites, and being used in the
operations phase.
On target Successful testing and
verification of multiple floating
lidar units at pre-commercial
scale
First floating lidar unit deployed
on a wind farm
Floating lidar units are proven.
Second floating lidar unit
deployed
First use of floating lidar on
operational projects
Floating lidar units are proven
and used to offset the use of met
masts on a small number of
sites, and being used in the
operations phase.
Behind target floating lidar still pre-commercial
with trials underway
Successful testing and
verification of floating lidar units
First floating lidar unit deployed
on a wind farm
Floating lidar units are proven.
Second floating lidar unit
deployed
First use of floating lidar on
operational projects
Missed target Trials unsuccessful with no
further development
Trials unsuccessful with no
further development
Trials unsuccessful with no
further development
Trials unsuccessful with no
further development
Trials unsuccessful with no
further development
7.3 Evidence
7.3.1 Questionnaires
Category Questionnaire response
Are you using floating lidar on your projects?
Dev Yes
Dev No
Dev Yes
Dev No
Dev No
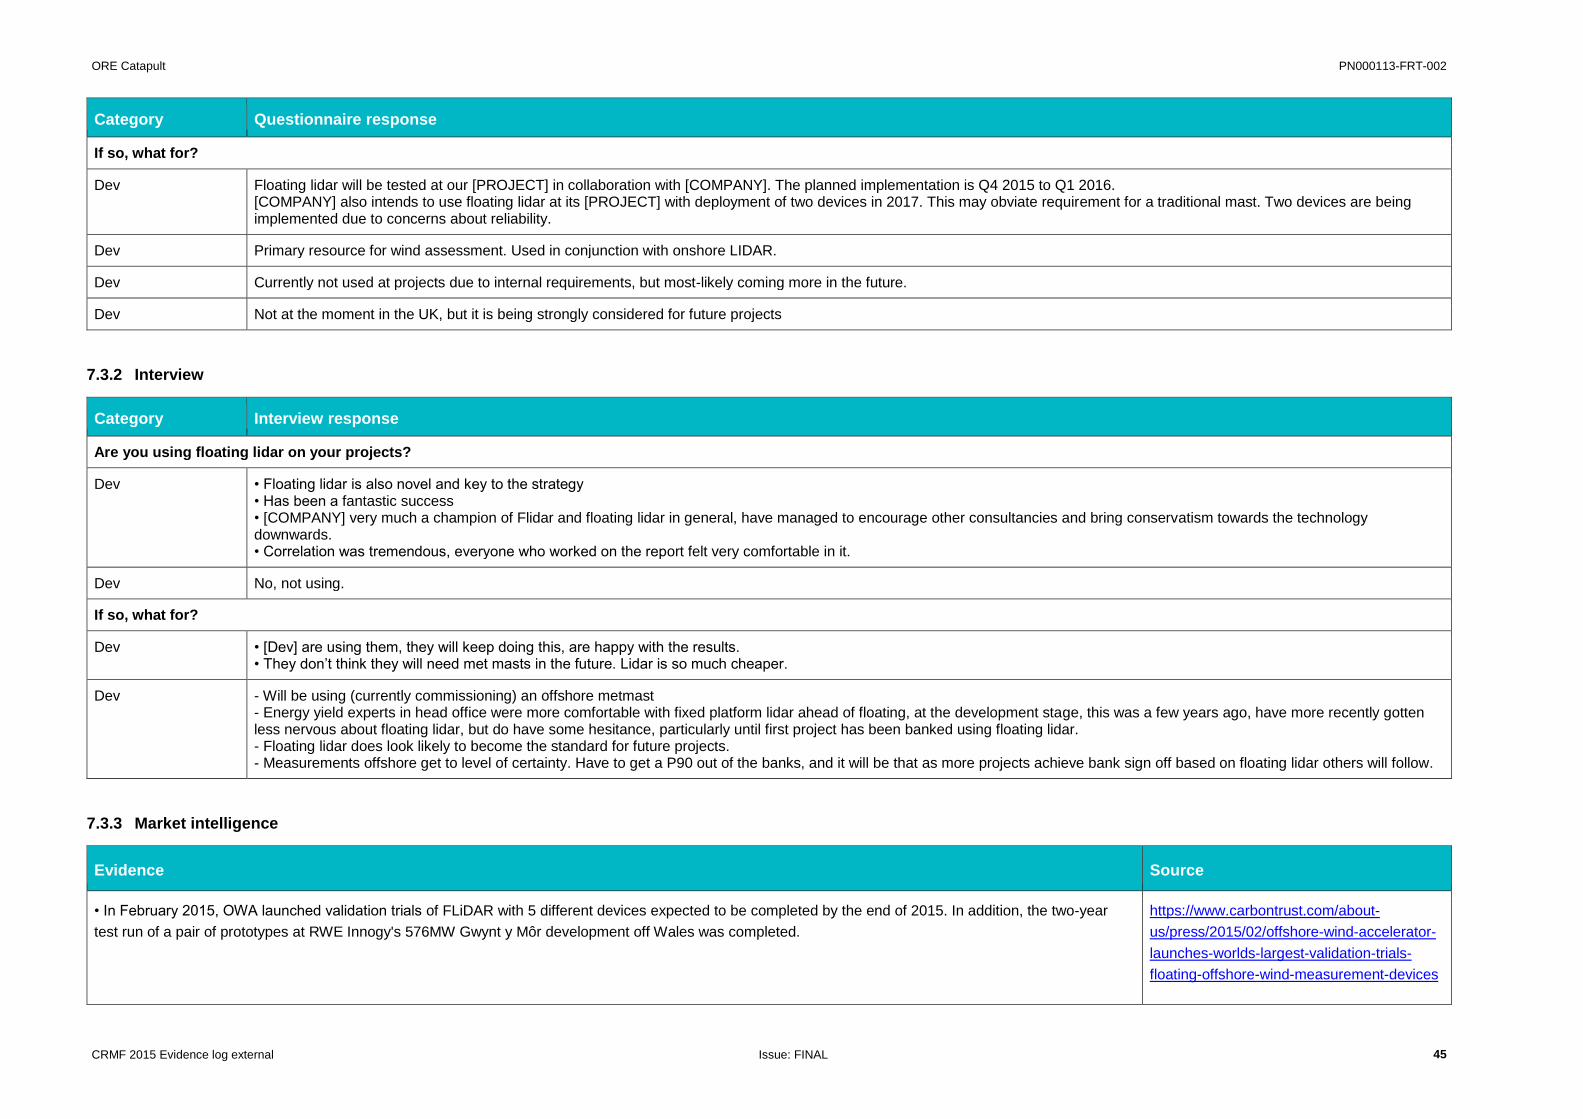
ORE Catapult PN000113-FRT-002
CRMF 2015 Evidence log external Issue: FINAL 45
Category Questionnaire response
If so, what for?
Dev Floating lidar will be tested at our [PROJECT] in collaboration with [COMPANY]. The planned implementation is Q4 2015 to Q1 2016. [COMPANY] also intends to use floating lidar at its [PROJECT] with deployment of two devices in 2017. This may obviate requirement for a traditional mast. Two devices are being implemented due to concerns about reliability.
Dev Primary resource for wind assessment. Used in conjunction with onshore LIDAR.
Dev Currently not used at projects due to internal requirements, but most-likely coming more in the future.
Dev Not at the moment in the UK, but it is being strongly considered for future projects
7.3.2 Interview
Category Interview response
Are you using floating lidar on your projects?
Dev • Floating lidar is also novel and key to the strategy • Has been a fantastic success • [COMPANY] very much a champion of Flidar and floating lidar in general, have managed to encourage other consultancies and bring conservatism towards the technology downwards. • Correlation was tremendous, everyone who worked on the report felt very comfortable in it.
Dev No, not using.
If so, what for?
Dev • [Dev] are using them, they will keep doing this, are happy with the results. • They don’t think they will need met masts in the future. Lidar is so much cheaper.
Dev - Will be using (currently commissioning) an offshore metmast - Energy yield experts in head office were more comfortable with fixed platform lidar ahead of floating, at the development stage, this was a few years ago, have more recently gotten less nervous about floating lidar, but do have some hesitance, particularly until first project has been banked using floating lidar. - Floating lidar does look likely to become the standard for future projects. - Measurements offshore get to level of certainty. Have to get a P90 out of the banks, and it will be that as more projects achieve bank sign off based on floating lidar others will follow.
7.3.3 Market intelligence
Evidence Source
• In February 2015, OWA launched validation trials of FLiDAR with 5 different devices expected to be completed by the end of 2015. In addition, the two-year
test run of a pair of prototypes at RWE Innogy's 576MW Gwynt y Môr development off Wales was completed.
https://www.carbontrust.com/about-
us/press/2015/02/offshore-wind-accelerator-
launches-worlds-largest-validation-trials-
floating-offshore-wind-measurement-devices

ORE Catapult PN000113-FRT-002
CRMF 2015 Evidence log external Issue: FINAL 46
http://www.rechargenews.com/wind/1392477
/floating-lidar-advances-as-gwynt-y-mor-
trials-wrap-up
• In April 2015, Burbo Bank Extension announced that is the world’s first offshore wind project to be built using energy yield calculations based on wind resource
data collected from a floating lidar (FLiDAR), FLiDAR N.V. Also, Fugro lidar deployed a floating lidar buoy at Navitus Bay.
http://www.offshorewind.biz/2015/04/24/burbo-bank-extension-first-flidar-calculated-owf-to-be-built/ http://www.windpoweroffshore.com/article/1343348/fugro-lidar-deployed-navitus-bay
• In September 2015 FLiDAR NV acquired by AXYS Technologies. In April 2015, wind lidar technology company ZephIR Lidar has released a fully-marinised
wind lidar – ZephIR 300M – for the offshore wind and meteorological industries, founded on the company’s remote wind measurement device, ZephIR 300.
http://www.zephirlidar.com/world-first-and-new-standard-achieved-in-floating-lidar-as-axys-selects-zephir-300/
• In the same month, Axys made a deal for the provision of dual ZephIR 300s on WindSentinel floating lidar buoy. In May 2015, EOLOS Floating lidar solutions
received a European innovation award for its buoy-mounted light detection and ranging (LIDAR) system using ZephIR's LIDAR technology.
http://www.offshorewind.biz/2015/10/14/zephir-launches-300m-offshore-wind-lidar/ http://optics.org/news/6/5/13
• In September 2014 Mainstream Renewable Power completed validation of a FLiDAR device at the ORE Catapult offshore meteorological mast off the coast of
Blyth, UK. This validation was part of the Neart na Gaoithe offshore wind campaign.
• In March 2015 Mainstream Renewable Power said it had completed wind measurements at its 448-MW Neart na Gaoithe offshore wind project off Scotland
using a floating LiDAR buoy
http://mainstreamrp.com/new-floating-offshore-wind-measurement-device-completes-validation/ http://renewables.seenews.com/news/axys-to-test-dual-lidar-buoys-against-ore-catapult-met-mast-467508
• In March 2015 AXYS technologies deployed two dual lidar WindSentinel floating lidar systems at the ORE Catapult offshore meteorological mast off the coast
of Blyth, UK. This validation took place ahead of the devices moving to conduct a ‘bankable’ energy yield assessment for two commercial wind farms in France.
http://www.4coffshore.com/windfarms/two-dual-lidar-buoys-deployed-at-blyth-nid1503.html
• In March 2015 RWE Innogy, in partnership with the operator of Eneco Luchterduinen offshore wind farm, has installed a floating LiDAR off the Dutch coast http://www.offshorewind.biz/2015/03/18/rwe-deploys-additional-lidar-at-eneco-luchterduinen/
• In November 2015 Ocean Tech Services (OTS) has deployed an AXYS WindSentinel buoy based LIDAR system near offshore wind development areas along
the coast of New Jersey. Data collected by these buoys will be available to interested users, and access to these data sets is expected to enhance public and
industry understanding of offshore wind resources in the U.S.
http://www.offshorewind.biz/2015/11/13/doe-windsentinel-buoy-in-full-swing-off-new-jersey/
• In June 2015 FLiDAR Reduced Costs in Combined Operation, the FLiDAR buoy owned by DONG Energy was moved from its measurement position on
Walney Extension offshore wind farm to the West of Duddon Sands met mast for a validation period. http://www.offshorewind.biz/2015/06/24/flidar-reduces-costs-in-combined-operation/
• In September 2015 UK company SeaLidar has completed tests of its floating wind measurement device and is now marketing it to the offshore industry. http://renews.biz/95483/sealidar-is-ready-for-action
• In March 2015 Nass&Wind Offshore achieved DNV GL certification for its M3EA floating wind measurement platform which features a lidar system. http://renews.biz/85212/nasswind-met-buoy-makes-grade
http://www.offshorewind.biz/2015/04/24/burbo-bank-extension-first-flidar-calculated-owf-to-be-built/
http://www.offshorewind.biz/2015/04/24/burbo-bank-extension-first-flidar-calculated-owf-to-be-built/

ORE Catapult PN000113-FRT-002
CRMF 2015 Evidence log external Issue: FINAL 47
7.4 Additional comments
None for this indicator
7.5 Recommendations
None for this indicator
• In the published supply chain plan for the Neart na Gaoithe project Mainstream Renewable Power describe how the project has successfully avoided the use of
a fixed met mast and has relied solely on floating lidar data for project financing. The benefits are claimed to include: 1. The avoidance of £15 – 30m of direct
costs to the project associated with a fixed offshore met mast, and; 2. The wider industry benefit of ‘being the first’ and demonstrating the projects can be
successful in the CfD process whilst avoiding the use of a fixed met mast.
https://www.gov.uk/government/uploads/syst
em/uploads/attachment_data/file/429410/UK
02-1701-005-MRP-SUPPLY_CHAIN_PLAN-
RPT-A2_-_final_redaction_applied.pdf

ORE Catapult PN000113-FRT-002
CRMF 2015 Evidence log external Issue: FINAL 48
8 Drivetrain concept
CRMF workstream Level 1 indicator Level 2 indicator Level 3 indicator
Technology Turbines Nacelle Drivetrain concept
8.1 Summary Analysis
Finding: Ahead of target
Marked as 'ahead of target' because mid-speed represent 20%, and turbines using direct drive represent 53% of the MW capacity contracted for EU projects reaching FID in 2015, up from approximately 1/3 in
2014.
Market is heading towards direct drive and mid speed drive trains although step changes in generators is required to push boundaries of direct drive, otherwise there is still a requirement for mid-speed drive
trains.
Due to consolidation in the market, a number of changes have occurred within turbine manufacturers over the last year that are impacting product development:
MHI Vestas continuing with mid-speed drive train in the V164 8MW and also trialling the 7MW SeaAngel prototype which contains the Artemis hydraulic drivetrain in Hunterston and Japan. They will not take the
SeaAngel turbine forward but the hydraulic drivetrain may well be incorporated into future designs.
Areva has entered into a joint venture with Gamesa to form Adwen. The DyNaLab drive train test facility opened in October 2015 and has signed a contract of supply to Adwen with the type testing of its AD 8-180
8MW turbine, with mid speed gearbox configuration.
Alstom was purchased by General Electric and the renewable energy businesses have been renamed GE Renewables. The future of the Haliade turbine product, containing a direct drive concept, is unclear but it
is assumed initial focus will be on their French wind farm sites.
This indicator could have been marked as ‘behind target’ for 2015 because of the scorecard statement “Mix of direct drive and mid-speed gearboxes on the market”. Based on the outlook below this indicator is
expected to move down from ahead of target next year.
Outlook: Industry score of 2.2
Score is low due to the 2020 milestone assuming the uptake of superconducting technology for generators in direct drive turbines. Direct-drive turbine products in development currently are not looking at
superconducting technology due to the maturity of the technology. Some research and development programmes initiated this year suggest a development of superconducting drivetrain technology to technology
readiness level (TRL) 5 or 6 after 3 or 4 years of research and development activity.
A step change in technology is required by 2020, to achieve the CRP target. Once technology is sufficiently developed, new technologies, including superconducting drivetrains, will need to be evaluated by
laboratory, full scale test rig, and field testing. Based on a successful completion of current development programmes (currently at initiation stages) prototype superconducting drivetrains look likely to be
introduced in around 3 to 4 years, with commercial deployment following some years subsequently.
The results of early tests on the MHI Vestas SeaAngel hydraulic drive train could impact this analysis.
As noted last year, there continues to be a trajectory towards a variety of drive train concepts on the market in 2020.

ORE Catapult PN000113-FRT-002
CRMF 2015 Evidence log external Issue: FINAL 49
Please indicate your level of confidence in the industry
achieving the following by 2020 for this indicator (1 Low
confidence, 10 High confidence)
WTG OEM average Overall average
First use of superconducting and variable speed direct-drive drive
trains, but with the market dominated by direct-drive and mid-speed
generator solutions. Brought to market following improvements in
workshop verification testing.
2.2 2.2

ORE Catapult PN000113-FRT-002
CRMF 2015 Evidence log external Issue: FINAL 50
8.2 Milestone scorecard
Milestone scorecard FID 2015 FID 2016 FID 2017 FID 2018 FID 2019
Ahead of target Mid-speed gearbox designs and
direct-drive turbines roughly
equal in numbers
Range of drive train solutions
available to the market.
Introduction of variable speed
drive train
Mid-speed gearbox designs in
majority, still substantial direct-
drive turbines
Mid-speed gearbox designs in
majority, still substantial direct-
drive turbines
First use of superconducting and
continuously variable direct-drive
drive trains, but with the market
dominated by direct-drive and
mid-speed generator solutions
On target Increasing use of mid-speed
gearboxes for more recent
(larger) turbine designs. Direct
drive machines building
operational experience
Mid-speed gearbox designs and
direct-drive turbines roughly
equal in numbers. Testing of
super-conducting and variable
speed direct drive gearboxes
begins on test rigs
Range of drive train solutions
available to the market.
Introduction of variable speed
drive train
Mid-speed gearbox designs in
majority, still substantial direct-
drive turbines
Mid-speed gearbox designs in
majority, still substantial direct-
drive turbines
Behind target Mix of direct drive and mid-
speed gearboxes on the market
Increasing use of mid-speed
gearboxes for more recent
(larger) turbine designs
Mid-speed gearbox designs and
direct-drive turbines roughly
equal in numbers
Range of drive train solutions
available to the market.
Introduction of variable speed
drive train
Mid-speed gearbox designs in
majority, still substantial direct-
drive turbines
Missed target No significant drivetrain
development
First concepts only entering the
market now
Increasing use of mid-speed
gearboxes for more recent
(larger) turbine designs
Mid-speed gearbox designs and
direct-drive turbines roughly
equal in numbers
Mid-speed gearbox designs and
direct-drive turbines roughly
equal in numbers
8.3 Evidence
8.3.1 Questionnaires
Category Questionnaire response
Describe your current turbine offering to the market in terms of MW size, rotor diameter, drive train concept, tip speed, design life and operational experience.
WTG OEM [PRODUCT] [specific turbine information removed to maintain anonymity]
WTG OEM [PRODUCT] [specific turbine information removed to maintain anonymity]

ORE Catapult PN000113-FRT-002
CRMF 2015 Evidence log external Issue: FINAL 51
Category Questionnaire response
WTG OEM [PRODUCT] [specific turbine information removed to maintain anonymity]
WTG OEM [PRODUCT] [specific turbine information removed to maintain anonymity]
WTG OEM [PRODUCT] [specific turbine information removed to maintain anonymity]
8.3.2 Interview
Category Interview response
Describe your current turbine offering to the market in terms of MW size, rotor diameter, drive train concept, tip speed, design life and operational experience.
WTG OEM
• Superconducting tech is not mature enough
• Difficult to define what may be holding this tech back, partly R&D, partly supply chain, partly no breakthrough into market.
8.3.3 Market intelligence
Evidence Source
• Siemens has increased the generator capacity of its direct drive offshore wind turbines from six to seven megawatts. Siemens is to manufacture nacelles for
offshore wind turbines at the North Sea port of Cuxhaven in Germany. The company will invest €200m in what it called the “most significant new Siemens
production facility in years” in the country.
• Nacelles will feature in next-generation 7MW turbines and the factory will create 1000 jobs. Ground breaking is due to take place later this year with the
production of the first components to kick off mid-2017.
http://www.offshorewind.biz/2015/08/05/germany-siemens-to-build-eur-200-mln-offshore-wind-turbine-factory/ http://www.siemens.com/press/en/feature/2015/windpower-renewables/2015-08-cuxhaven.php
• In July 2015 the Mitsubishi heavy industries offshore hydraulic drive 7MW floating wind turbine was installed at the Fukushima floating offshore wind farm
demonstration project in Japan. It is the largest turbine with a hydraulic drive in the world. A second MHI hydraulic drive 7MW turbine has been installed and was
fully commissioned in February 2015 at the Hunterston onshore test site in Scotland. Future plans for application of hydraulic drive remain uncertain following the
MHI joint venture with Vestas and the active marketing of the MHI Vestas V164 8MW turbine, which has a conventional medium speed drivetrain layout.
http://www.fukushima-forward.jp/english/news_release/news150730.html http://www.4coffshore.com/windfarms/turbine-mitsubishi-power-systems-europe-7mw-offshore-hydraulic-drive-turbine-formerly-seaangel-7-mw-tid83.html
• Adwen and Fraunhofer IWES have signed an agreement to test the drivetrain for Adwen’s next generation 8MW [medium speed geared] offshore wind turbine.
Under the terms of the agreement, the 8MW drivetrain will be tested at IWES’s dynamic nacelle testing laboratory or ‘DyNaLab’ in Bremerhaven, Germany.
http://www.owjonline.com/news/view,adwen-to-test-drivetrain-for-8mw-turbine_39421.htm

ORE Catapult PN000113-FRT-002
CRMF 2015 Evidence log external Issue: FINAL 52
8.3.4 Market share by drivetrain layout
• In July 2015, following the decision by Samsung Heavy Industries to exit the offshore wind market, the Offshore Renewable Energy (ORE) Catapult announced
that it is in discussions with Samsung Heavy Industries about acquiring the 7MW offshore wind turbine at Methil for research purposes. Upon completion of the
agreement, the Methil turbine will become the world’s most advanced, open access, offshore wind turbine dedicated to research. The SHI 7.0MW 171 features a
compact medium speed geared drivetrain layout.
https://ore.catapult.org.uk/-/ore-catapult-in-
discussions-to-acquire-samsung-s-next-
generation-7mw-demonstration-offshore-
wind-turbine-at-methil-fife
http://www.hvnplus.co.uk/news/samsung-
heavy-industries-announces-exit-from-
fife/8685729.article
• GE has completed the acquisition of Alstom, and has created a new GE Renewable Energy business unit. http://www.genewsroom.com/press-
releases/ge-expands-wind-portfolio-
introduction-new-renewable-energy-
business-282324
Turbine Model Drivetrain layout EU FID 2015 Capacity (MW) Percentage of EU FID 2015
MW
Number of turbines Percentage of EU FID 2015
turbines
6.2M 126 (Senvion) High speed 443 11.69 72 10.89
V112-3.3 MW Offshore (MHI Vestas Offshore Wind)
High speed 165 4.35 50 7.56
V112-3.45 MW Offshore (MHI Vestas Offshore Wind)
High speed 400 10.56 116 17.55
Subtotal (High speed) 26.60 36.01
V164-8.0 MW (MHI Vestas Offshore Wind)
Medium speed 768 20.27% 96 14%
Subtotal (Med speed) 20.27 14.52
Haliade 150-6MW (Alstom Power)
Direct drive 400 10.56 67.00 9.98
SWT-6.0-154 (Siemens) Direct drive 1,284 33.89 219.00 32.38
SWT-7.0-154 (Siemens) Direct drive 329 8.68 47.00 7.11

ORE Catapult PN000113-FRT-002
CRMF 2015 Evidence log external Issue: FINAL 53
Figure 1 - Market share by drive train technology (EU FID 2015 only)
6.15
3.33.45
8
6 6
7
0
1
2
3
4
5
6
7
8
9
10
Ra
ting
(M
W)
Market share by drivetrain (EU FID 2015 only)
High speed Medium speed Direct drive
Area of circle represents share of market
Subtotal (Direct drive) 53.13 49.47

ORE Catapult PN000113-FRT-002
CRMF 2015 Evidence log external Issue: FINAL 54
Figure 2 - Turbine rating by drive train concept (including 'proven' and market available)
3.303.60 3.60
4.00 4.00
6.15
3.45
6.00 6.006.15
5.0 5.0
6.0
6.5
8.0 8.0
6.0
3.6
6.0
7.0
0
1
2
3
4
5
6
7
8
9
10
Rating
(M
W)
Turbine rating by drivetrain (proven and market available)
High speed Medium speed Direct drive
Area of circle represents swept area of turbine

ORE Catapult PN000113-FRT-002
CRMF 2015 Evidence log external Issue: FINAL 55
8.4 Additional comments
None for this indicator
8.5 Recommendations
Consider amending milestones to amend the requirement for superconducting technology from the study because it is too specific a variant of the technology.

ORE Catapult PN000113-FRT-002
CRMF 2015 Evidence log external Issue: FINAL 56
9 Rating
CRMF workstream Level 1 indicator Level 2 indicator Level 3 indicator
Technology Turbines Nacelle Rating
9.1 Summary Analysis
Finding: Ahead of target
Marked as 'ahead of target' because 5MW+ turbines are leading the market for projects in FID 2015.
By percentage of EU project MW capacity reaching FID, 56% of turbines contracted are in the 5-7MW range, up from 31% last year. 29% of turbines contracted were in the 7-9MW range.
In line with the technology acceleration story from TCE CRP study, the market penetration of 4MW-Class Turbines is expected to be low.
There is a framework agreement in place between DONG and Siemens, representing 1.8GW of EU supply to 2017 which shows a strong commitment to increase in turbine size in the short term.
DONG signed a contract for supply of Vestas V164 8MW turbines for Walney extension in February 2015, highlighting that the industry is ahead of target for increase in turbine size against the CRP study
forecast of 2017 for projects to contract 7-9MW turbines.
Outlook: Industry score of 8.2
The market is unlikely to demand a 5MW in 2020 because the majority are already at 6MW+. This is for wind farms with bottom-fixed foundations.
There are 10MW+ drivetrains in the design stage, with the dominant OEM (Siemens) having alluded publicly to a turbine of at least 10MW capacity being the likely successor to the 7MW direct drive turbine once
that product line reaches maturity. The timescale for the next large step up in rated capacity remains unclear.
MHI Vestas also mentioned a 10MW turbine, in a planning application in Denmark. The application gave details of plans to install turbines up to 10MW (V200) with rotor diameters of up to 200 metres. This
highlights the continued progress that turbine OEMs are making in developing turbines with increased rating.
Please indicate your level of confidence in the industry
achieving the following by 2020 for this indicator (1 Low
confidence, 10 High confidence)
WTG OEM average Overall average
40% of projects contract 7-9MW class turbines in 2020. 9MW+
turbines on the market. 8.2 8.2

ORE Catapult PN000113-FRT-002
CRMF 2015 Evidence log external Issue: FINAL 57
9.2 Milestone scorecard
Milestone scorecard FID 2015 FID 2016 FID 2017 FID 2018 FID 2019
Ahead of target 5-7MW Class Turbines
dominate, some 7-9 MW
contracted
5-7MW Class Turbines
dominate, some 7-9 MW
contracted
No turbines below 5-7 MW. 7-9
MW class reaches 20%. 9MW +
being tested
A third of projects reaching FID
use 7-9MW
Half of projects contract 7-9MW
class turbines in 2020. 9MW+
turbines available on market
On target Even split between 3-5 MW and
5-7 MW turbines. 7-9MW being
demonstrated
5-7MW Class in majority. 7-
9MW available to market
5-7MW Class Turbines
dominate. First project contracts
using 7-9 MW turbines
No 3-5MW turbines being
installed, with 2/3rds 5-7MW.
1/3rd of projects use 7-9MW.
9MW + being tested offshore
A third of projects reaching FID
use 7-9MW. 9MW+ turbines on
the market
Behind target Even split between 3-5 MW and
5-7 MW turbines being
contracted.
Even split between 3-5 MW and
5-7 MW turbines. 7-9MW being
demonstrated
5-7MW Class in majority. 7-
9MW available to market
5-7MW Class Turbines
dominate, some 7-9 MW
contracted
No turbines below 5-7 MW. 7-9
MW class reaches 20%. 9MW +
being tested
Missed target No testing of 7-9MW turbines
underway. No 5-7MW being
contracted
No testing of 7-9MW turbines
underway. No
Even split between 3-5 MW and
5-7 MW turbines. 7-9MW being
demonstrated
5-7MW Class in majority. 7-
9MW available to market
5-7MW Class Turbines
dominate, some 7-9 MW
contracted
9.3 Evidence
9.3.1 Questionnaires
Category Questionnaire response
What orders for offshore wind turbines do you think you will sign this year in Europe and for which of your turbine products? Provide details of projects and any framework agreements that you have signed.
WTG OEM
[PROJECT] [PRODUCT]
[PROJECT] [PRODUCT]
[PROJECT] [PRODUCT]
[PROJECT] [PRODUCT]
[PROJECT] [PRODUCT]

ORE Catapult PN000113-FRT-002
CRMF 2015 Evidence log external Issue: FINAL 58
Category Questionnaire response
WTG OEM
[PROJECT] [PRODUCT]
[PROJECT] [PRODUCT]
9.3.2 Interview
Category Interview response
What orders for offshore wind turbines do you think you will sign this year in Europe and for which of your turbine products? Provide details of projects and any framework agreements that you have signed.
WTG OEM
• Orders in united states
• Good pipeline of projects likely to go ahead in [PROJECT]
WTG OEM
• Prototype installed
• Provisionally agreed several contracts
• [PROJECT] contract is firm
9.3.3 Market intelligence
Evidence Source
• According to 4c Offshore, in Europe 39 projects reached financial close since August 2014. 34 have already decided a model of turbine with 2 of them (5%)
planning orders of <3MW turbines (Nobelwind, Rampion windfarms). 44% of projects were in the 5-7 MW class and the rest 38% in 8-10MW. There is a
constant increase to larger MW turbines in terms of power output.
4c offshore database
• In USA the Block Island Windfarm is the only project outside Europe which will use larger power output turbines (6MW).
• In 2015, Siemens developed its new 7MW (SWT-7.0-154) offshore wind turbine and begun testing in Denmark. http://cleantechnica.com/2015/08/12/siemens-new-7-mw-offshore-wind-turbine-delivers-10-higher-yield/
• The Fraunhofer Institute for Wind Energy and Energy System Technology IWES in Bremerhaven has developed a test centre, the Dynamic Nacelle Testing
Laboratory (DyNaLab). DyNaLab is a nacelle test rig where, from spring 2015, primarily gearless nacelles with up to 8 megawatts of electrical capacity,
including both prototypes and serial production nacelles, can be tested for onshore and offshore applications.
http://www.bine.info/en/publications/publikation/gondeln-im-schnelldurchlauf-testen/
• In October 2015, Adwen the joint venture between Areva and Gamesa has agreed to test the drivetrain for its next generation 8MW offshore wind turbine
at DyNaLab.
http://renewables.seenews.com/news/adwen-to-test-8-mw-offshore-wind-turbine-drivetrain-in-germany-496154
http://cleantechnica.com/2015/08/12/siemens-new-7-mw-offshore-wind-turbine-delivers-10-higher-yield/
http://cleantechnica.com/2015/08/12/siemens-new-7-mw-offshore-wind-turbine-delivers-10-higher-yield/

ORE Catapult PN000113-FRT-002
CRMF 2015 Evidence log external Issue: FINAL 59
9.3.4 Market share by turbine capacity
• In May 2015, at the Hunterston Test Centre on the west coast of Scotland, a 7MW wind turbine using digital hydraulic power system went in operation. http://businesslife.ba.com/Ideas/Features/Winds-of-change-The-revolutionary-7MW-turbine-.html
• In June 2015, A Marubeni-led consortium has completed the assembly of the world's largest oil pressure drive-type wind power, as part of the Fukushima
experimental floating offshore wind project. The 7MW turbine was put together on a three-column semi-submerged platform at Onahama port. Along with the
7MW turbine, the project includes a 5MW downwind-type floating wind turbine. Parts procurement and construction of the unit is in progress, the consortium
reported. Installation of chains and anchors at the testing area will be underway toward the end of July.
http://www.breakbulk.com/fukushima-floating-turbine-installed-on-platform/
• In August 2015, confirmation of planning of the Siemens manufacturing facility of nacelles for 6MW and 7MW turbines at the port of Cuxhaven, Germany.
Facility is due to be ready for production by 2017.
http://www.businessgreen.com/bg/news/2420842/siemens-confirms-plans-for-eur200m-wind-turbine-production-facility-in-germany
• DONG and Siemens have signed a framework agreement that will see Siemens supply 300 of its 6MW offshore turbines to offshore wind-farm projects
planned by DONG for UK waters between 2014 and 2017 http://www.theguardian.com/environment/2012/jul/19/siemens-dong-offshore-wind-deal
• DONG signed a contract for supply of Vestas V164 8MW turbines for Walney extension in February 2015, http://www.dongenergy.co.uk/news/press-
releases/articles/dong-energy-chooses-8mw-
turbine-for-walney-extension
MHI Vestas may be planning a 10MW turbine, after a planning application letter for the Velling Mærsk project in Denmark has been revealed. The
application gave details of plans install turbines between 6MW (V160) and 10MW (V200) with rotor diameters of between 160 metres and 200 metres.
http://www.windpoweroffshore.com/article/13023
19/vestas-v200-10mw-turbine-application-
revealed
Turbine Model Rating EU FID 2015 Capacity (MW) % of EU FID 2015 MW Number of WTG % of EU FID 2015 turbines
V112-3.3 MW Offshore (MHI Vestas Offshore Wind)
3.3 165.00 4.35 50.00 7.56
V112-3.45 MW Offshore (MHI Vestas Offshore Wind)
3.45 400.00 10.56 116.00 17.55
Subtotal (3 – 5MW) 14.91 25.11
Haliade 150-6MW (Alstom Power)
6.0 400.00 10.56 66.00 9.98
SWT-6.0-154 (Siemens) 6.0 1284.00 33.89 214.00 32.38
6.2M 126 (Senvion) 6.15 442.80 11.69 72.00 10.89

ORE Catapult PN000113-FRT-002
CRMF 2015 Evidence log external Issue: FINAL 60
Subtotal (5 – 7MW) 56.13 53.25
SWT-7.0-154 (Siemens) 7.0 329.00 8.68 47.00 7.11
V164-8.0 MW (MHI Vestas Offshore Wind)
8.0 768.00 20.27 96.00 14.52
Subtotal (7 – 9MW) 28.95 21.63

ORE Catapult PN000113-FRT-002
CRMF 2015 Evidence log external Issue: FINAL 61
Figure 3 - Market share by turbine rated capacity (EU FID 2015 only)
3.33.45
6 66.15
7
8
0
1
2
3
4
5
6
7
8
9
10
Rating
(M
W)
Market share by capacity (EU FID 2015 only)
3 – 5MW 5 – 7MW 7 – 9MW
Area of circle represents share of market

ORE Catapult PN000113-FRT-002
CRMF 2015 Evidence log external Issue: FINAL 62
Figure 4 - Turbine rating by drive train concept (EU FID 2015 only)
6.15
3.303.45
8
6 6
7
0
1
2
3
4
5
6
7
8
9
10
Rating
(M
W)
Turbine rating by drivetrain (EU FID 2015 only)
High speed Medium speed Direct drive
Area of circle represents swept area of turbine

ORE Catapult PN000113-FRT-002
CRMF 2015 Evidence log external Issue: FINAL 63
9.4 Additional comments
None for this indicator
9.5 Recommendations
None for this indicator

ORE Catapult PN000113-FRT-002
CRMF 2015 Evidence log external Issue: FINAL 64
10 AC power take off design
CRMF workstream Level 1 indicator Level 2 indicator Level 3 indicator
Technology Turbines Nacelle AC power take off design
10.1 Summary Analysis
Finding: On target
The 2015 score for this indicator is 'on target' although limited evidence has been provided by participants. Incremental improvements are however being made on AC power take-off design for new turbines,
leading to some improvements in size and cost.
In the CRMF 2014, the evidence log stated that converters are similar in turbines below 6MW class and as rating increases to 7-10MW, it becomes more appealing to jump from Low voltage (typically 690V) to
medium voltage (typically 3.3kV). The evidence log also noted rapid development in technology over the last few years. This year, there is no clear evidence of significant new converter architecture and given the
maturity of converter technology and its widespread use in other markets, innovation is unlikely to be driven by the wind industry.
There has also been a limited response from Tier 1 suppliers to questions on this particular indicator. However, some context has been provided by ORE Catapult’s exposure to activity in this area. The offshore
wind market is not the largest market for power electronic manufacturers at tier 2 or 3 in the supply chain. As a result power electronics manufacture and testing are not currently optimised for the needs of the
offshore wind industry. Power electronics are known to be a significant driver of maintenance costs for offshore wind. Common failure modes can be driven by either fatigue or assembly issues. Testing at present
is often generalised, factory acceptance and not at full load, with assembly issues not being detected until initial wind farm commissioning.
There is an opportunity for process and system level improvements to reduce the cost impact of manufacturing defects for offshore wind. Fatigue issues associated with lifespan of semiconducting materials are
related to the application of technology intended for consistent load to the offshore wind industry where operating conditions are inherently more variable. Increasing life by reducing sensitivity to fatigue issues will
require development of semiconductor technologies, which may not be particularly incentivised because of the size of the wind industry market. Consequently it may deliver a limited impact by 2020. A more
immediate impact of cost reduction may be available by increasing the understanding of operational performance and better planning of maintenance activities, for example by applying health monitoring
technology.
Outlook: Industry score of 5.6
The future development of this technology is a difficult area to get information on due to high levels of competition in the market and a reluctance of the supply chain to share potential competitive advantage.
As above, several sources describe the operational cost associated with converter maintenance as a significant cost driver for offshore wind maintenance. Improved understanding of fatigue induced failure and
more optimised maintenance strategies could lead to a relatively near term cost reduction impact. Improvements in testing is an area which could reduce failures on the early stages of a bathtub failure curve.
Longer term developments will be dependent on the improvement of materials and development of technologies better suited to variable load operation.
Please indicate your level of confidence in the industry
achieving the following by 2020 for this indicator (1 Low
confidence, 10 High confidence)
WTG OEM average Overall average
More efficient, smaller and faster-switching power conditioning
electronics, with greater reliability and self-health-monitoring, made
from new materials.
5.6 5.6

ORE Catapult PN000113-FRT-002
CRMF 2015 Evidence log external Issue: FINAL 65
10.2 Milestone scorecard
Milestone scorecard FID 2015 FID 2016 FID 2017 FID 2018 FID 2019
Ahead of target 40% of projects with 6 MW class
turbines and larger use
improved technology. New
converter architectures appear
on commercial turbines
New converter architectures
may take significant market
share. Continued improvement
in power-electronic device
efficiency, size and cost.
New converter architectures
may take significant market
share. Continued improvement
in power-electronic device
efficiency, size and cost.
Almost all projects with 6MW+
turbines use better power take
off technology
Almost all turbines installed used
advanced converter
architectures and devices, with
substantial improvements in
efficiency, size and cost.
On target Power-electronic device
improvements in efficiency, size
and cost. No significant new
converter architecture.
Power-electronic device
improvements in efficiency, size
and cost. No significant new
converter architecture.
A third of projects with 6 MW
class turbines and larger use
improved technology. New
converter architectures appear
on commercial turbines
A third of new turbines have new
converter architectures.
Continued improvement in
power-electronic device
efficiency, size and cost.
New converter architectures
may take significant market
share. Continued improvement
in power-electronic device
efficiency, size and cost.
Behind target Improvements starting to be
used on new turbine designs
Power-electronic device
improvements in efficiency, size
and cost. No new converter
architecture.
Power-electronic device
improvements in efficiency, size
and cost. No significant new
converter architecture.
Half of projects with 6 MW class
turbines and larger use
improved technology. New
converter architectures appear
on commercial turbines
New converter architectures
may take significant market
share. Continued improvement
in power-electronic device
efficiency, size and cost.
Missed target Costs increase for this element no improvements Power-electronic device
improvements in efficiency, size
and cost. No new converter
architecture.
Power-electronic device
improvements in efficiency, size
and cost. No significant new
converter architecture.
Half of projects with 6 MW class
turbines and larger use
improved technology. New
converter architectures appear
on commercial turbines
10.3 Evidence
10.3.1 Questionnaires
Category Questionnaire response
Are you seeing any improvement in your power take off design in terms of efficiency, size and cost? Provide examples where possible.
WTG OEM No design changes are anticipated
WTG OEM
Yes, when operational date is gained the room for optimizing can be evaluated and used to improve the turbine. No details can be shared

ORE Catapult PN000113-FRT-002
CRMF 2015 Evidence log external Issue: FINAL 66
Category Questionnaire response
Does this involve any new converter architecture?
WTG OEM n/a
WTG OEM No comment
10.3.2 Interview
Category Interview response
Are you seeing any improvement in your power take off design in terms of efficiency, size and cost? Provide examples where possible.
WTG OEM • Not much comment. A particularly detailed technical area.
Does this involve any new converter architecture?
10.3.3 Market intelligence
10.4 Additional comments
None for this indicator
10.5 Recommendations
Tier 2 suppliers should be consulted routinely through this study in future.
Evidence Source
None for this indicator

ORE Catapult PN000113-FRT-002
CRMF 2015 Evidence log external Issue: FINAL 67
11 Optimisation of rotor diameter to rated capacity
CRMF workstream Level 1 indicator Level 2 indicator Level 3 indicator
Technology Turbines Rotor Optimisation of rotor diameter to rated capacity
11.1 Summary Analysis
Finding: On target
The 2015 score for this indicator is 'on target' although there are a number of considerations when measuring progress against 'optimised' rotor diameters.
It has been the status quo for turbine OEMs to deliver turbines to market with a rotor diameter below 'optimum' for the power output. Turbine OEMs have then released a second version of the product with up-
scaled rotor sizes. Evidence from participants in the study suggests this trend is likely to continue and the reason why there is not a higher penetration of 'optimised' rotors in the 2015 FID projects is the relative
newness of many turbine models that have not yet had their second release.
The optimised rotor diameter methodology was developed for the 2012 CRP study, published by TCE. The methodology seeks to establish whether rotor sizes are optimised for the turbine power rating.
Last year it was established that the Siemens SWT 6.0-154 was the only turbine to use an 'optimised' rotor diameter. The Siemens SWT 6.0-154 represents 34% of MW capacity of projects reaching FID in 2015.
In 2014, the CRMF study marked this indicator as 'on target,' based on a sample size of two turbines used on projects reaching FID in 2014: Siemens SWT 6.0-154 and the SWT 4.0-130, both of which could
have what is considered to be an 'optimised' rotor diameter. This year the sample is more representative, covering a wider range of turbine models but omitting the Siemens SWT 4.0-130. The only turbines in the
4MW range to be contracted for projects reaching FID in 2015 were the Vestas V112, which are not considered by the CRP methodology to have 'optimised' rotor diameter.
To assess the indicator for this year, there is neither 100% of turbines in the 4MW class using ‘optimised’ rotor diameter or the majority of the 6MW class turbines using 'optimised' rotor diameter (only 47% of 6-
8MW class turbines), as stated in the ‘on target’ milestone. ORE Catapult has however scored this indicator as on target given the anticipated progress in this space over the next 12 months and attribute the
apparent lag in turbines used on FID 2015 projects to a natural gap in the technology offered to the market, as existing models gain track record.
Outlook: Industry score of 8.4
It is highly likely that up-scaled rotors will be released on this generation of 6-8MW turbines. While there is evidence to suggest rotor diameter increase is likely for next generation turbines (MHI Vestas mentioned
a 10MW turbine, in planning (V200) with rotor diameters of up to 200 metres), there are currently a number of challenges associated with very long blade technology. Adwen announced that it’s working on the
AD 8MW 180 with power density 0.31kW/m2.
As blade size increases, weight will increase which will increase risk of fatigue for larger blades. Designers will need to invest in aggressive development to achieve reductions in weight through:
Selective use of high performance materials. Increased use of carbon fibre
Slender blades in order to limit extreme loads, lower solidity in combination with thicker aerofoils and aerodynamic add-ons
Increased use of aero-elastic tailoring for passive load alleviation
Integrated design (aerodynamics, aero elastic, structural)
Reduction of design margins due to better understanding of material behaviour and failure modes in the blades
Improved manufacturing techniques

ORE Catapult PN000113-FRT-002
CRMF 2015 Evidence log external Issue: FINAL 68
The risks to the trend of rotor diameter increases continuing are the validity of current design and manufacturing methods, the increases in weight and issues such as blade erosion (which is related to tip speed)
and the requirement for new materials to solve these issues. The industry continues to push the envelope of coatings resistance to erosion, supported by research and development programmes, including the
ORE Catapult BLEEP which contribute to the development of effective solutions.
Please indicate your level of confidence in the industry
achieving the following by 2020 for this indicator (1 Low
confidence, 10 High confidence)
WTG OEM average Overall average
Rotor diameter optimised for capacity on 6MW and 8MW turbines. 8.4 8.4
11.2 Milestone scorecard
Milestone scorecard FID 2015 FID 2016 FID 2017 FID 2018 FID 2019
Ahead of target Majority (60%) of turbines use
optimised specific rotors for
4MW, 6MW and 8MW (assumed
to be 176m)
70% of turbines have optimised
rotor diameter
80% of turbines have optimised
rotor diameter
Almost all turbines (90%) have
optimised rotor diameter
All turbines have optimised rotor
diameter
On target <50% of turbines contracted
have optimised rotor diameter
>50% of turbines contracted
have optimised rotor diameter
Majority (60%) of turbines
contracted use optimised
specific rotors for 4MW, 6MW
and 8MW (assumed to be
176m)
70% of turbines have optimised
rotor diameter
80% of turbines have optimised
rotor diameter
Behind target All 4MW turbines contracted use
optimised rotor diameters
(assumed to be 132m). Most
6MW turbines use optimised
diameter (assumed to be 158m)
<50% of turbines contracted
have optimised rotor diameter
50% of turbines have optimised
rotor diameter
Majority (60%) of turbines use
optimised specific rotors for
4MW, 6MW and 8MW (assumed
to be 176m)
70% of turbines have optimised
rotor diameter
Missed target No 4MW turbines have
optimised diameter
No 6MW turbines being
designed have optimised rotor
diameter
No 6MW turbines planned to
have optimised rotor diameter
No 6MW turbines planned to
have optimised rotor diameter
No 6MW turbines planned to
have optimised rotor diameter

ORE Catapult PN000113-FRT-002
CRMF 2015 Evidence log external Issue: FINAL 69
11.3 Evidence
11.3.1 Questionnaires
Category Questionnaire response
Provide details of plans to release updated versions of the existing turbine (e.g. increased rotor diameter)
WTG OEM No comment
WTG OEM We have plans to develop, design and manufacture the next generation of offshore wind turbines for installation post 2020. These plans will be revealed in 2016.
What is your next generation of turbine offering likely to be in terms of MW size, rotor diameter, drive train concept, tip speed, design life? What stage of development is this turbine at? (e.g. design, prototype, etc.)
WTG OEM We are currently evaluating the options for our next generation of machines. Further details will be released in 2016.
11.3.2 Interview
Category Interview response
Provide details of plans to release updated versions of the existing turbine (e.g. increased rotor diameter)
WTG OEM • Key focus at the moment is on ensuring that the existing machine is as good as it can be.
WTG OEM
[PRODUCT] is being actively being investigated for China where it looks more attractive/suited to potential market - Has a real potential as a floating turbine due to low head mass and ~5MW size [PRODUCT] [Product specifics removed to maintain anonymity]
What is your next generation of turbine offering likely to be in terms of MW size, rotor diameter, drive train concept, tip speed, design life? What stage of development is this turbine at? (e.g. design, prototype, etc.)
WTG OEM • No specific [WTG OEM] comment. • Market view that the next generation, for R3 and beyond will likely have to have a capacity of 10MW or beyond, this may be driven by the economic requirements of larger sites.
WTG OEM
- New generation of turbines (6, 7, 8MW) are all at the early stages, e.g first or second projects completed only. As such these products should be viewed very much as in the early phases of their project lifecycle. - Certainly won’t see a subsequent generation of turbine technology until at least 2020, with the (political) uncertainty not helping to incentivise OEMs to invest considerably in the R&D that would make this happen – the available market scale cannot be sufficiently demonstrated to justify it at present. - Evolution and ever upwards trend in turbine capacities is not necessarily guaranteed, for example as Asia pacific and US markets open up, post 2020 it may be a good move for OEMs to sell by then proven products in new markets rather than devising new products for a comparatively small(er) UK market. - There is a general feeling that potential gains in cost reduction moving beyond 7MW may not be as significant as move from previous generation ~3MW machines to the technology we have now. - The offshore wind industry is now more mature, and decisions are more carefully analysed, and financially scrutinised, this is partly due to maturity, but also to the level of investments (Billions rather than millions). The evolution of the OEMs offerings may be less technology driven and rather more financially driven. OEMS like [WTG OEM] will be increasingly asking themselves “what LCOE do we need to offer our customers to ensure that we can work with them on their new projects” - Financial and risk targets have changed. As they have come to play a more important role in decision making, and become (relatively) more important, technology evolution and improvement continues, but is less of a sole driving force. It is still important but consequently may be lower priority as it makes up less of the overall consideration for investment and future development/growth plans. - Industry has a lot to learn in O&M and could likely squeeze out some cost reductions here. It is expected that this will continue to be a growth area.

ORE Catapult PN000113-FRT-002
CRMF 2015 Evidence log external Issue: FINAL 70
Category Interview response
WTG OEM
• If simply scale existing costs you can continue to predict cost reductions by economies of scale and larger capacity units. • Pushing individual machine capacities is also an engineering challenge and would put a lot of demands on supply chain • Tip speed/LEE, blades, electrical convertors are all potential technical challenges to upscaling
11.3.3 Market intelligence
11.3.4 Turbine rotor diameters
Evidence Source
The Offshore wind CRP study (technology workstream) in 2012 defined an optimum rotor diameter for turbines with 4, 6 and 8MW ratings. The tables below show:
1. The percentage of turbines selected for EU projects reaching FID in 2015 which are considered by the pathways definition to have optimum (or close to
optimum) rotor diameter for their rating alongside the percentage that are considered by the pathways definition to have a below optimum rotor diameter.
2. The definitions of optimum rotor diameter from the 2012 CRP study.
* Source: Page 70, Table 7.7 and Figure
7.5, Offshore wind cost reduction pathways,
Technology work stream, BVG associates,
June 2012
MHI Vestas may be planning a 10MW turbine, after a planning application letter for the Velling Mærsk project in Denmark has been revealed. The application
gave details of plans install turbines between 6MW (V160) and 10MW (V200) with rotor diameters of between 160 metres and 200 metres.
http://www.windpoweroffshore.com/article/1
302319/vestas-v200-10mw-turbine-
application-revealed
Turbine Model Rating Contracted rotor
diameter (m)
Optimum rotor
diameter (m) *
EU FID 2015 Capacity
(MW)
% of EU FID 2015 MW Number of WTG % of EU FID 2015
turbines
SWT-6.0-154 (Siemens)
6.0 154 158 1284 33.89 214 32.38
Subtotal (Optimum) 33.89 32.38
V164-8.0 MW (MHI Vestas Offshore Wind)
8.0 164 176 442.8 11.69 72 10.89
Haliade 150-6MW (Alstom Power)
6.0 150 158 400 10.56 66 9.98
SWT-7.0-154 (Siemens)
7.0 154 164 165 4.35 50 7.56
6.2M 126 (Senvion) 6.15 126 160 400 10.56 116 17.55

ORE Catapult PN000113-FRT-002
CRMF 2015 Evidence log external Issue: FINAL 71
Figure 5 - Trend of increasing rotor diameter versus turbine rated power (MW) for selected turbines where larger rotor versions have been announced subsequent to launch. Source: Page 70, Table 7.7 and Figure 7.5, Offshore wind cost reduction pathways, Technology work stream, BVG
associates, June 2012
V112-3.3 MW Offshore (MHI Vestas Offshore Wind)
3.3 112 120
329 8.68 47 7.11
V112-3.45 MW Offshore (MHI Vestas Offshore Wind)
3.45 112 121
768 20.27 96 14.52
Subtotal (Below Optimum)
66.11 67.62
Turbine MW class Baseline rotor diameter (all the baseline rotor
diameters have the same specific rating of
around 350 (W/m²))
Indicative optimum rotor diameter (m)
Indicative optimum specific rating (W/m2)
4MW 120 132 292
6MW 147 158 306
8MW 169 176 329

ORE Catapult PN000113-FRT-002
CRMF 2015 Evidence log external Issue: FINAL 72
Figure 6 - Rotor diameter vs Rating (proven and market available turbines)
80
100
120
140
160
180
200
2 3 4 5 6 7 8 9
Roto
r D
iam
ete
r (m
)
Rating (MW)
Rotor diameter versus rating V112-3.3 MW Offshore (MHI Vestas)
V112-3.45 MW Offshore (MHI Vestas)
SWT 3.6 107 (Siemens)
SWT 3.6 120 (Siemens)
E128-3.6MW PP 2B (Envision)
G4 120 (Siemens)
G4 130 (Siemens)
Adwen AD 5-135 (Areva M5000)
Adwen AD 5 -132 (Gamesa 5MW)
SL 6000 128 (Sinovel)
2B6 (2B Energy)
SCD 6.0 (MingYang)
SWT 6.0 154 (Siemens)
Haliade 150-6MW (Alstom Power)
6.2M 126 (Senvion)
6.2M 152 (Senvion)
SCD 6.5 (MingYang)
SWT 7.0 154 (Siemens)
V164 8.0 MW (MHI Vestas)
AD 8-180 (Adwen)

ORE Catapult PN000113-FRT-002
CRMF 2015 Evidence log external Issue: FINAL 73
11.4 Additional comments
None for this indicator
11.5 Recommendations
OEMs should continue to improve their component cost models to reduce the risk. The deployment of cost effective larger rotors will require significant research effort in order to validate the new technologies
required. This research effort should be undertaken by OEMs in cooperation with research and development centres.
OEMs should also challenge and improve the wind turbine certification standards, using the better understanding of component behaviour and failure modes to improve the fidelity of validation tests which will
drive more optimised designs through the reduction of design margins.
The improvements in erosion protection technology will allow reduction of erosion related performance costs, repair costs, and will enable to improve the efficiency by operating at higher tip speed ratios

ORE Catapult PN000113-FRT-002
CRMF 2015 Evidence log external Issue: FINAL 74
12 Blade Design and Manufacture
CRMF workstream Level 1 indicator Level 2 indicator Level 3 indicator
Technology Turbines Rotor Blade Design and Manufacture
12.1 Summary Analysis
Finding: On target
Following on from progress last year in reaching FID on the Siemens blade production facility, it is now under construction and is set to open in September 2016. It was developed with LEAN principles.
Additionally an Alstom/LM facility in Cherbourg is still in planning.
MHI Vestas will produce blades for the V164 from the Isle of Wight blade R&D facility.
Tip speeds are still up to 89-90 m/s on most turbines.
There is evidence of the implementation of weight reduction strategies in blade design and the increased use of carbon fibre in manufacture.
Blade Dynamics is testing a 78m modular blade at ORE Catapult and turbine OEMs have tested a number of blades of this magnitude in continental Europe. The modular blade concept could lead to a step
change in manufacturing processes. Testing blades of this scale is a major leap forward for the industry and the introduction of advanced testing methods such as biaxial testing is positive.
Market split between optimising aerodynamics to improve blade design and manufacture "clean blades" and providing an upgrade market to offer physical add-ons to the blade that improve aerodynamics
retrospectively. Proving performance of add-ons is something of a grey area. As there is improvements in power curve testing the application and understanding of enhancements will also improve.
Self-healing coatings are not yet widely available on the market but there has been progression in demonstration of remedial solutions for blade leading edge erosion, with a number of campaigns to apply
coatings on wind farms across the EU (e.g. Horns Rev 2 rubber leading edge blade upgrade from Siemens). There is also a number of R&D initiatives across the EU that are developing new materials for use on
the blade leading edge (e.g. ORE Catapult’s BLEEP programme and EU funded projects HIPPOCAMP and INNWIND).
Outlook: Industry score 5.6
Industry score of 5.6 for the outlook, which is due to lack of conformity around the industry's approach to blade design (Market split between clean and upgraded blades).
In general, there is the view that we cannot rely on clean blade solutions because they are not behaving as expected in the field.
Blade erosion is a key issue currently and there are a number of remedial solutions on the market but none of these are proven as yet. A number of turbine OEMs are pushing for the solution to come from the
coatings supply chain.
Methods that have been developed to test blades have not been implemented yet but these should show improvements to the value chain in time. E.g. biaxial testing.

ORE Catapult PN000113-FRT-002
CRMF 2015 Evidence log external Issue: FINAL 75
Please indicate your level of confidence in the industry
achieving the following by 2020 for this indicator (1 Low
confidence, 10 High confidence)
WTG OEM average Overall average
Blades with improved aerodynamics (aerofoils, modelling, passive
devices), materials and coatings, manufactured in improved
processes and to improved standards. Tip speeds will increase to
100m/s on half of the market.
5.6 5.6
12.2 Milestone scorecard
Milestone scorecard FID 2015 FID 2016 FID 2017 FID 2018 FID 2019
Ahead of target Ongoing improvement to
aerodynamic performance of
blades. New self-healing
coatings widely available
Continuous improvement in
aerodynamics through refined
aerofoils and passive devices.
Greater understanding of fatigue
loading. Turbines with tip
speeds of 90m/s + available on
market. New coatings, materials
and self-healing composites
being used on blades
contracted. First full scale
demonstration of modular
blades
Continuous improvement in
aerodynamics through refined
aerofoils and passive devices.
New blade manufacturing
facilities now operation leading
to manufacturing cost savings.
Holistic design tools well
established and greater
understanding of fatigue loading.
Turbines with tip speeds of
90m/s + available on market.
New coatings, materials and
self-healing composites being
used on blades contracted. First
full scale demonstration of
modular blades
Blades with improved
aerodynamics (aerofoils,
modelling, passive devices)
contribute a 1.3% improvement
in AEP, materials and coatings,
manufactured in improved
processes and to improved
standards. Turbines with tip
speeds of 100m/s have a third of
the market. Advanced coatings
and materials on all turbines.
On target New blade facilities under
construction. Turbines with tip
speed of 80m/s + on market.
Large test rigs are testing larger
blades.
Ongoing improvement to
aerodynamic performance of
blades. New self-healing
coatings widely available
Continuous improvement in
aerodynamics through refined
aerofoils and passive devices.
Greater understanding of fatigue
loading. Turbines with tip
speeds of 90m/s + available on
market. New coatings, materials
and self-healing composites
Continuous improvement in
aerodynamics through refined
aerofoils and passive devices.
New blade manufacturing
facilities now operation leading
to manufacturing cost savings.
Holistic design tools well
established and greater
Continuous improvement in
aerodynamics through refined
aerofoils and passive devices.
New blade manufacturing
facilities now operation leading
to manufacturing cost savings.
Holistic design tools well
established and greater

ORE Catapult PN000113-FRT-002
CRMF 2015 Evidence log external Issue: FINAL 76
being used on blades
contracted. First full scale
demonstration of modular
blades
understanding of fatigue loading.
Turbines with tip speeds of
90m/s + available on market.
New coatings, materials and
self-healing composites being
used on blades contracted. First
full scale demonstration of
modular blades
understanding of fatigue loading.
Turbines with tip speeds of
90m/s + available on market.
New coatings, materials and
self-healing composites being
used on blades contracted. First
full scale demonstration of
modular blades
Behind target Limited improvement on 4MW
turbines. Common use of
aerofoils and passive devices.
New blade manufacturing
facilities reaching FID use
improved layout design and
automation. Some use of
holistic, design optimisation
tools and characterisation of the
blades. Turbines with tip speed
of 80m/s + available on market.
New test rigs for 100m + blades
operational. New coatings being
tested
New blade facilities under
construction. Turbines with tip
speed of 80m/s + on market.
Large test rigs are testing larger
blades.
Ongoing improvement to
aerodynamic performance of
blades. New self-healing
coatings widely available
Ongoing improvement to
aerodynamic performance of
blades. New self-healing
coatings widely available
Ongoing improvement to
aerodynamic performance of
blades. New self-healing
coatings widely available
Missed target Cost increases and/or
decreases in efficiency
Limited improvement on 4MW
turbines. Common use of
aerofoils and passive devices.
New blade manufacturing
facilities reaching FID use
improved layout design and
automation. Some use of
holistic, design optimisation
tools and characterisation of the
blades. Turbines with tip speed
of 80m/s + available on market.
New test rigs for 100m + blades
operational. New coatings being
tested
New blade facilities under
construction. Turbines with tip
speed of 80m/s + on market.
Large test rigs are testing larger
blades.
Ongoing improvement to
aerodynamic performance of
blades. New self-healing
coatings widely available
Ongoing improvement to
aerodynamic performance of
blades. New self-healing
coatings widely available

ORE Catapult PN000113-FRT-002
CRMF 2015 Evidence log external Issue: FINAL 77
12.3 Evidence
12.3.1 Questionnaires
Category Questionnaire response
Does your next generation turbine product have design features that seek to optimise aerodynamics? Please detail. / Does your current turbine product have design features that seek to optimise aerodynamics? Please detail.
WTG OEM The [PRODUCT] blade features a root spoiler.
WTG OEM That is always the case for wind turbines
WTG OEM
Yes. No details available as of today. Yes. The blade design has been carried out in-house and is optimised with the use of vortex generators for example.
Where will the blades for your offshore turbine product(s) be manufactured and is this a purpose built facility for this size of turbine?
WTG OEM Blades initially manufactured in Denmark. A dedicated serial production facility is being built in [PROJECT]
WTG OEM [WTG OEM] has a purpose built blade manufacturing facility for its offshore turbines located at [PROJECT]. We also have the option of buying in blades from 3rd party suppliers. Blade manufacturing locations depend on the future market requirements.
Are you developing any coatings for blades? If so, what are these and when will these be ready for the offshore market?
WTG OEM [WTG OEM] are not directly developing coatings but are watching the development process from the supply chain carefully.
Discuss any other ongoing cost reductions in the design and manufacture of blades.
12.3.2 Interview
Category Interview response
Where will the blades for your offshore turbine product(s) be manufactured and is this a purpose built facility for this size of turbine?
WTG OEM • Blades are manufactured by [COMPANY] for both onshore and offshore • Nothing planned that would change this
Are you developing any coatings for blades? If so, what are these and when will these be ready for the offshore market?
WTG OEM • General industry concern about blade erosion is a significant problem, expensive and challenging to solve.
WTG OEM Yes [WTG OEM] are involved in working on improvements in this area. These and others are ways to find subtle percentage point reductions in LCOE, and [WTG OEM] are working on these benefits for the operations phase of projects equally to finding CAPEX reductions
Discuss any other ongoing cost reductions in the design and manufacture of blades.
WTG OEM
• Manufacturing facility will be effectively a JV with [COMPANY], who will take the expert lead on manufacturing aspects. • Consider talking to [COMPANY] for more technical details and context.

ORE Catapult PN000113-FRT-002
CRMF 2015 Evidence log external Issue: FINAL 78
Category Interview response
Does your next generation turbine product have design features that seek to optimise aerodynamics? Please detail.
WTG OEM
- There are certain things that you can do for vortex shedding, inserts etc to try and manage blade aerodynamics
- For example [COMPANY] talking about slats/raised profiles on blades etc
- 3 advisors looking at [PRODUCT] rotor design have all said that best solution is a ‘clean blade’
- That is to say a highly tuned, sophisticated/optimised blade profile/design which does not require add ons or enhancements.
Where will the blades for your offshore turbine product(s) be manufactured and is this a purpose built facility for this size of turbine?
WTG OEM
- [COMPANY] link possibly for early prototypes if at all.
- [PROJECT] factory was acquired by [COMPANY] as was an independent blade maker
12.3.3 Market intelligence
Evidence Source
• Blade Dynamics is testing its 78 meter offshore wind turbine blade in ORE Catapult's blade testing facility. http://maritime-executive.com/article/modular-offshore-wind-turbine-ready-to-test
• STRUCTeam in association with DNV GL unveiled a new wind turbine blade design portfolio featuring a hybrid glass-carbon composite blade design created for
offshore wind turbines. http://www.nawindpower.com/e107_plugins/content/content.php?content.14590
• Increasing interest of wind industry for high-performance and lightweight blade materials, such as fibre, resins and core foam materials that can be used to
increase blade length while keeping blade weight to a minimum. http://renews.biz/90556/blade-manufacturers-thrive/
• In March 2015, LM Wind Power unveiled a new concept for standard basic blades on which the rotor diameter can be extended with variable tip lengths. In
November 2014, Blade extension packages, new hybrid materials and wireless sensor technology are all being deployed by leading blade manufacturer LM Wind
Power in the drive to improve turbine efficiency and cut wind power costs.
http://www.windpowermonthly.com/article/1323567/new-blade-technology-makes-wind
• Hull's Siemens wind turbine factory set to open in September 2016. http://renews.biz/92906/siemens-to-build-cuxhaven-plant/ http://www.bbc.co.uk/news/uk-england-humber-33623490

ORE Catapult PN000113-FRT-002
CRMF 2015 Evidence log external Issue: FINAL 79
• In September 2015, Hitachi announced its plans of adding a line to produce nacelles for 5MW wind-power systems by the end of March 2016. http://www.bloomberg.com/news/articles/2015-09-02/hitachi-plans-to-add-production-line-for-offshore-wind-parts
• In May 2015, Siemens launched SWT-2.3-120 which is the first wind turbine designed by Siemens to specifically meet the demands of its North and South
American customers. The powerful new turbine features a 120-meter rotor, enabling it to achieve an industry-leading capacity factor. Serial production of the
SWT-2.3-120 will commence in the U.S. in 2017. In October 2015, Siemens received its first order for the new 7MW offshore wind turbine and will supply, install
and commission 47 direct drive wind turbines, each with a rotor diameter of 154 meters in the Walney Extension East project.
http://www.siemens.com/press/en/pressrelease/?press=/en/pressrelease/2015/windpower-renewables/pr2015050227wpen.htm&content[]=WP
• New design idea from GE which designed a new dome-shaped ecoROTR able to boost wind turbine performance by 3% http://www.techinvestornews.com/Green/Latest-Green-Tech-News/ges-new-dome-shaped-ecorotr-boosts-wind-turbine-performance-by-3 http://phys.org/news/2015-06-ge-unveils-experimental-ecorotr-turbine.html
ORE Catapult and LM partnering to demonstrate new biaxial blade testing concepts https://ore.catapult.org.uk/-/lm-wind-power-
and-the-offshore-renewable-energy-ore-
catapult-announce-collaboration-on-an-
innovative-blade-testing-method-reducing-
fatigue-test-time-b
The Offshore Renewable Energy (ORE) Catapult is asking offshore wind industry leaders to join a £1 million project aimed at tackling turbine blade leading edge
erosion, one of the key operations and maintenance challenges facing the offshore wind sector.
The innovation and research body is inviting expressions of interest from industry to be involved in the 18 month collaborative project consisting of six work
packages:
A measurement campaign to quantify the impact of leading edge erosion on yield.
Wind farm data analysis and tool development to inform operational decisions around blade leading edge repair and replacement.
Offshore environment characterisation, where environmental data from operational wind farms will be combined with ocean and wind data to characterise
site conditions that are related to leading edge erosion.
Erosion damage measurement to improve inspection techniques and allow robust research and assessment of repair and protection solutions.
Developing erosion test methods to generate repeatable, accurate and representative test methodologies that reflect realistic environmental conditions and
erosion damage mechanisms.
Repair and protection innovation challenges – utilising ORE Catapult’s expertise, testing facilities and market reach to support the development, testing
and commercialisation of novel blade inspection, repair and protection solutions.
https://ore.catapult.org.uk/-/catapult-
launches-joint-industry-project-to-tackle-
turbine-blade-erosion
The overall objectives of the INNWIND.EU project are the high performance innovative design of a beyond-state-of-the-art 10-20MW offshore wind turbine and
hardware demonstrators of some of the critical components. http://www.innwind.eu/

ORE Catapult PN000113-FRT-002
CRMF 2015 Evidence log external Issue: FINAL 80
12.4 Additional comments
None for this indicator
12.5 Recommendations
The OEMs continue to advance in the development of blade technology with a focus in integrated blade design, development and validation of novel materials, manufacturing process, and integration of systems
with a potential to reduce the blade impact on LCOE. This effort should be supported through collaborative research and development in order to reduce the risk associated to the validation of novel technology.
At the same time, OEMs should continue to challenge existing certification methods, collaborating with test centres and certification bodies to implement new validation tests which are more representative of
actual operation, and may anticipate a reduction the associated design margins. Need to progress in improved validation of new blade testing methods e.g. biaxial testing.
The HIPPOCAMP project focuses on a novel manufacturing process required to develop nanocomposites and use them as embedded reinforcements to improve
the functional properties of products made of engineered metallic material such as structural components for automotive, aerospace, manufacturing and wind
turbine applications.
http://www.hippocamp.eu/
Horns Rev 2. Total of 273 blades will be inspected, repaired with Siemens’ rubber coating and upgraded with new aerodynamic components increasing the power
production by between 1% and 1.5%.
http://www.offshorewind.biz/2015/01/28/don
g-schedules-horns-rev-2-blades-makeover/
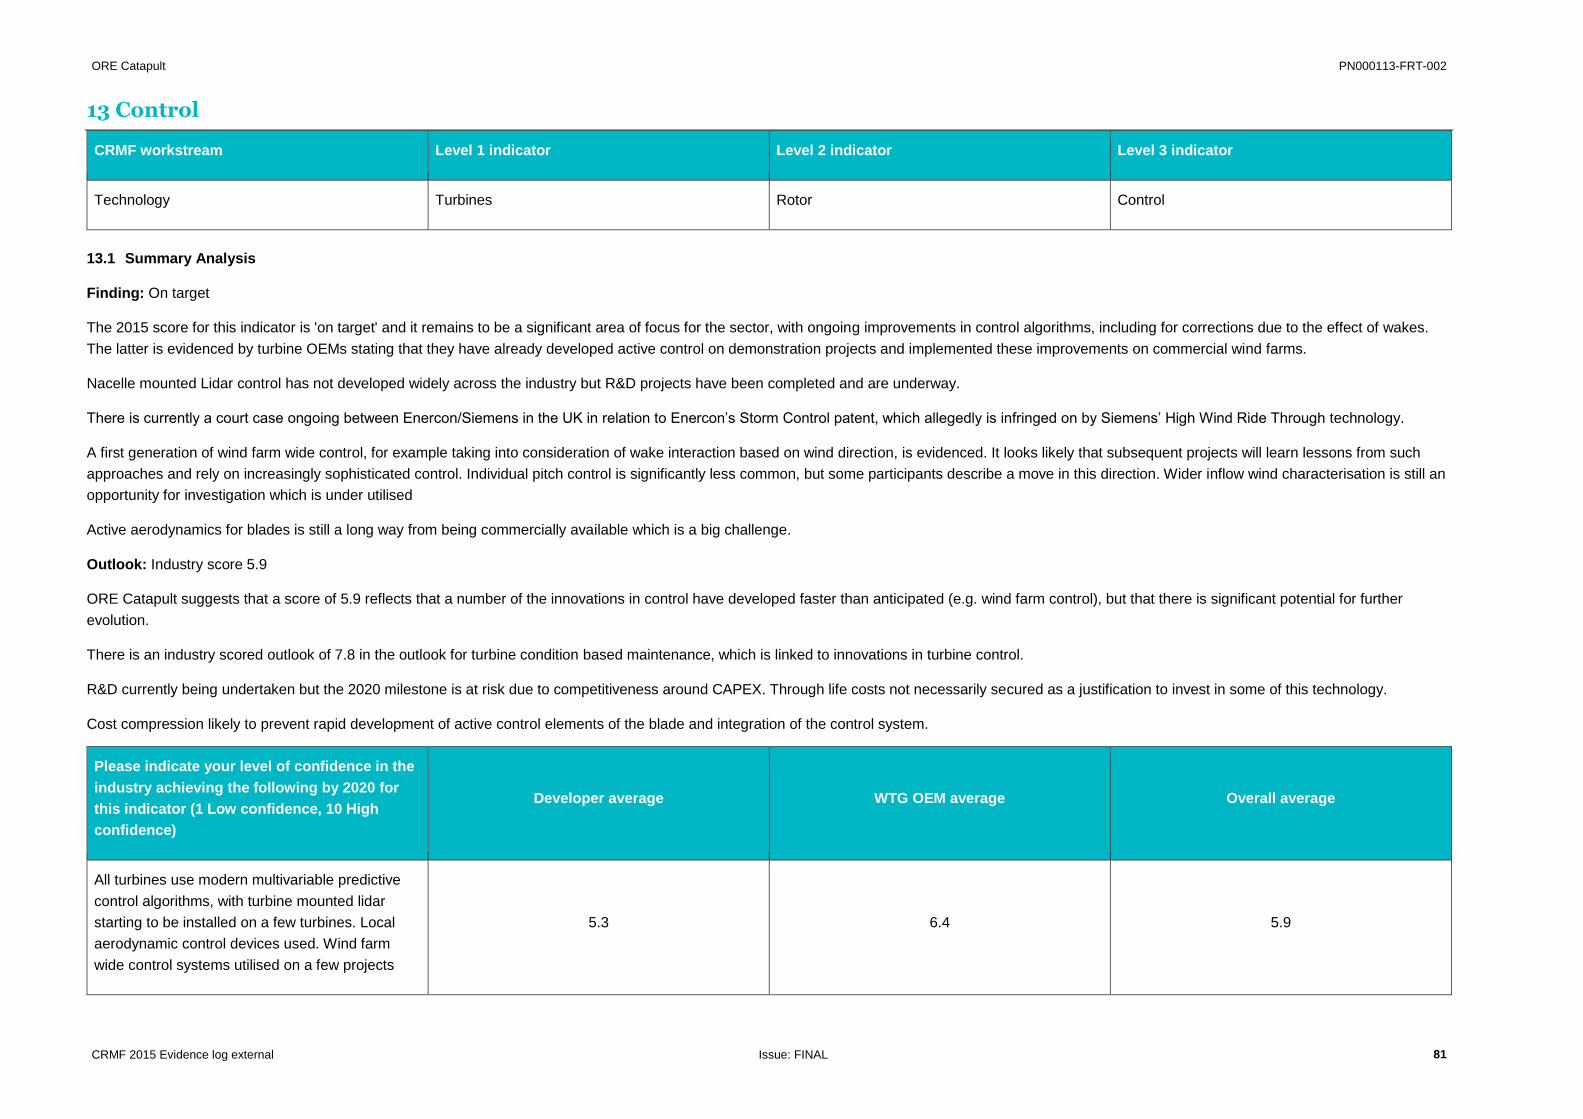
ORE Catapult PN000113-FRT-002
CRMF 2015 Evidence log external Issue: FINAL 81
13 Control
CRMF workstream Level 1 indicator Level 2 indicator Level 3 indicator
Technology Turbines Rotor Control
13.1 Summary Analysis
Finding: On target
The 2015 score for this indicator is 'on target' and it remains to be a significant area of focus for the sector, with ongoing improvements in control algorithms, including for corrections due to the effect of wakes.
The latter is evidenced by turbine OEMs stating that they have already developed active control on demonstration projects and implemented these improvements on commercial wind farms.
Nacelle mounted Lidar control has not developed widely across the industry but R&D projects have been completed and are underway.
There is currently a court case ongoing between Enercon/Siemens in the UK in relation to Enercon’s Storm Control patent, which allegedly is infringed on by Siemens’ High Wind Ride Through technology.
A first generation of wind farm wide control, for example taking into consideration of wake interaction based on wind direction, is evidenced. It looks likely that subsequent projects will learn lessons from such
approaches and rely on increasingly sophisticated control. Individual pitch control is significantly less common, but some participants describe a move in this direction. Wider inflow wind characterisation is still an
opportunity for investigation which is under utilised
Active aerodynamics for blades is still a long way from being commercially available which is a big challenge.
Outlook: Industry score 5.9
ORE Catapult suggests that a score of 5.9 reflects that a number of the innovations in control have developed faster than anticipated (e.g. wind farm control), but that there is significant potential for further
evolution.
There is an industry scored outlook of 7.8 in the outlook for turbine condition based maintenance, which is linked to innovations in turbine control.
R&D currently being undertaken but the 2020 milestone is at risk due to competitiveness around CAPEX. Through life costs not necessarily secured as a justification to invest in some of this technology.
Cost compression likely to prevent rapid development of active control elements of the blade and integration of the control system.
Please indicate your level of confidence in the
industry achieving the following by 2020 for
this indicator (1 Low confidence, 10 High
confidence)
Developer average WTG OEM average Overall average
All turbines use modern multivariable predictive
control algorithms, with turbine mounted lidar
starting to be installed on a few turbines. Local
aerodynamic control devices used. Wind farm
wide control systems utilised on a few projects
5.3 6.4 5.9

ORE Catapult PN000113-FRT-002
CRMF 2015 Evidence log external Issue: FINAL 82
Please indicate your level of confidence in the
industry achieving the following by 2020 for
this indicator (1 Low confidence, 10 High
confidence)
Developer average WTG OEM average Overall average
All turbines contracted have fully integrated
control, condition monitoring and SCADA systems
and are maintained using condition based
maintenance
7.3 8.2 7.8
13.2 Milestone scorecard
Milestone scorecard FID 2015 FID 2016 FID 2017 FID 2018 FID 2019
Ahead of target Ongoing improvements with
control algorithms. R&D
initiatives underway testing wind
farm wide control systems. New
aerodynamic control actuators
are included in turbine design.
First turbine mounted LiDAR
installed on an offshore turbine
for testing
Ongoing improvements with
control algorithms. At least three
wind farms using wind farm wide
control systems. First blades
using local aerodynamic control
devices are contracted.
Ongoing improvements with
control algorithms. First blades
using local aerodynamic control
devices are operational
Ongoing improvements with
control algorithms. Wind farm
wide control systems becoming
standard practice and delivering
benefits. First blades using local
aerodynamic control devices are
operational.
All turbines use modern
multivariable predictive control
algorithms, which contribute to
wind farm wide control
approaches. Turbine mounted
LiDAR installed on a significant
number of turbines. At least two
turbines have novel
aerodynamic control actuators.
On target Ongoing incremental
improvements with control
algorithms. First wind farms start
controlling at wind farm level.
LiDAR tests planned on offshore
turbines
Ongoing incremental
improvements with control
algorithms. R&D initiatives
underway testing wind farm wide
control systems. New
aerodynamic control actuators
are included in turbine design.
First turbine mounted LiDAR
installed on an offshore turbine
for testing
Ongoing incremental
improvements with control
algorithms. At least three wind
farms using wind farm wide
control systems. First blades
using local aerodynamic control
devices are contracted.
Ongoing improvements with
control algorithms. First blades
using local aerodynamic control
devices are operational. Wind
farm wide control being used on
75% of projects
Ongoing improvements with
control algorithms. Wind farm
wide control systems becoming
standard practice and delivering
benefits. First blades using local
aerodynamic control devices are
operational.

ORE Catapult PN000113-FRT-002
CRMF 2015 Evidence log external Issue: FINAL 83
Behind target Limited improvements with
control algorithms. Control at a
wind farm level being
considered. Turbine mounted
LiDAR tests underway on
onshore turbines
Limited improvements with
control algorithms. First wind
farms start controlling at wind
farm level. LiDAR tests planned
on offshore turbines
Limited ongoing improvements
with control algorithms. R&D
initiatives underway testing wind
farm wide control systems. New
aerodynamic control actuators
are included in turbine design.
First turbine mounted LiDAR
installed on an offshore turbine
for testing
Ongoing improvements with
control algorithms. At least three
wind farms using wind farm wide
control systems. First blades
using local aerodynamic control
devices are contracted.
Ongoing improvements with
control algorithms. First blades
using local aerodynamic control
devices are operational
Missed target Control algorithms get worse No improvements with control
algorithms
No improvements with control
algorithms
Ongoing improvements with
control algorithms. R&D
initiatives underway testing wind
farm wide control systems. First
blades using local aerodynamic
control devices are contracted.
First turbine mounted LiDAR
installed on an offshore turbine
for testing
Ongoing improvements with
control algorithms. R&D
initiatives underway testing wind
farm wide control systems. First
blades using local aerodynamic
control devices are contracted.
First turbine mounted LiDAR
installed on an offshore turbine
for testing
13.3 Evidence
13.3.1 Questionnaires
Category Questionnaire response
Describe any improvements in wind turbine control systems that you have implemented within the past year.
WTG OEM Improvement to Algorithms largely made available from the greatly extended operating hours at a wider variety of sites with different wind conditions.
Dev WTG suppliers are offering enhancements to control systems to optimise performance to site conditions
Dev High wind ride through. Remote reset instead of onsite reset of yaw errors of turbines.
Dev Our current wtg employers requirements ask that turbine controllers be modified to enable LEC to be widely optimised
Is your organisation moving towards utilising wind farm wide control systems (i.e. using the individual WTG control systems to minimise loads/wakes across the wind farm)? If so, please detail your progress.
WTG OEM Yes
WTG OEM Wake control systems has always been a part of the control logic algorithms, and improvements are still being made
Dev Yes. Wind farm to be typically controlled by OEM wind farm management system although individual WTG´s controls are equipped with load reduction control features.

ORE Catapult PN000113-FRT-002
CRMF 2015 Evidence log external Issue: FINAL 84
Category Questionnaire response
Dev This has been considered but not yet implemented.
Dev No. [COMPANY] has the warranty for the control systems so out of our hands
Please detail any other novel approach to control which you are introducing.
13.3.2 Interview
Category Interview response
Describe any improvements in wind turbine control systems that you have implemented within the past year.
WTG OEM
• Not fully aware of technical details • Do have R&D programmes on SCADA and control. • Active control will help to reduce costs by reducing loadings.
WTG OEM [WTG OEM] do have condition monitoring of individual turbines. Standard.
WTG OEM
- Wake control has always been an option - Were looking at wake control from the beginings [] and did put wake control into [PROJECT] - [WTG OEM] concept right from the start was that you need much better condition monitoring from the start to be most suitable for offshore applications - Offshore should get a much less turbulent environment, which make it look much more straightforward to with a clean sheet of paper design wake control into projects than others who have built up from an onshore turbine/track record. - Now built into turbine models at [PROJECT] and [PROJECT] – wake control - Learning from these for [PROJECT]
Dev
• Wind farm wide control systems are being looked at. • [Dev] are preparing to implement wind farm wide control it and are moving that way generally. • No plans to retrofit to existing sites, not cheap and not likely to be commercially viable on an out of warranty/older site.
Dev
• Do have a SCADA specialist starting soon who will be working on this, • Not necessarily anything hugely innovative planned in terms of whole wind farm control. • Innovation may be around trying to use cameras and other sensors for bird strike. • MCA request for search and rescue lane if helicopters will be entering site. Only limit is that they lose generation capacity. Unknowns around yawing blades in extreme weather. • Good potential for interesting work to be done here. MCA are potentially looking for some guidance in general around offshore wind.
Dev • [Dev] tended to approach almost as a black box
Is your organisation moving towards utilising wind farm wide control systems (i.e. using the individual WTG control systems to minimise loads/wakes across the wind farm)? If so, please detail your progress.
WTG OEM
- They are working on developing projects where this will be considered. But has not been implemented at this stage. - it is just the beginning of trying to create concrete actions behind the idea that wind farm wide control can be part of the optimisation of layout, control and AEP. - To an extent this will require the collaboration of a cooperative developer who can see benefit to specifying/using more sophisticated design optimisation including control strategies.
WTG OEM - were looking at wake control from the beginings [] did put wake control into [PROJECT] - [WTG OEM] concept right from the start was that you need much better condition monitoring from the start to be most suitable for offshore applications
ORE Catapult PN000113-FRT-002
CRMF 2015 Evidence log external Issue: FINAL 85
Category Interview response
- offshore should get a much less turbulent environment, which make it look much more straightforward to with a clean sheet of paper design wake control into projects than others who have built up from an onshore turbine/track record. - Now built into turbine models at [PROJECT] and [PROJECT] – wake control - Learning from these for [PROJECT]
Please detail any other novel approach to control which you are introducing.
WTG OEM Are discussing layout optimisation/energy generation optimisation.
13.3.3 Market intelligence
13.4 Additional comments
None for this indicator
13.5 Recommendations
Nacelle mounted lidar has a specific mention in the indicator milestones. This may be too specific a reference to the technology as it is not clear that there is enough interest in application of nacelle mounted lidar
versus other forms of intelligent or wind farm wide control.
Evidence Source
Court case over core control IP between Enercon and Siemens. The patent, identified as EP 0 847 496, is owned by Wobben Properties, part of the Enercon
group, which was placed in the Aloys-Wobben Foundation in October 2012. Siemens calls the storm-control facility used in its turbines high-wind ride-through.
http://www.windpowermonthly.com/article/1329818/analysis-enercon-pressures-siemens-wind-tech-ip-case
http://www.windpowermonthly.com/article/1329818/analysis-enercon-pressures-siemens-wind-tech-ip-case

ORE Catapult PN000113-FRT-002
CRMF 2015 Evidence log external Issue: FINAL 86
14 Integrated design
CRMF workstream Level 1 indicator Level 2 indicator Level 3 indicator
Technology Turbines Integrated design Integrated design (of turbine and support
structure)
14.1 Summary Analysis
Finding: Behind target
The 2015 score for this indicator is 'behind target' because there is yet to be a commercial project that reaches FID with a fully integrated design. There is however clear understanding of the benefits and it is
considered at the FEED stage of a wind farm lifecycle.
Last year, it was stated that OWA will launch an ITT to look into this area.
Although outside of scope of the study, floating wind farms have a greater requirement for integrated design. Alstom and DCNS are going ahead with an integrated design on their floating platform.
Integrated design is not yet happening on commercial scale projects, partially due to current contracting structures and the squeeze on cost reduction due to the CfD process.
Some designs for more flexible installation have been implemented.
Outlook: Industry score of 5.5
Industry score of 5.5 shows some uncertainty about future developments in this space but many show clear intent to begin using this methodology to remain competitive in the CfD process.
A driver for this in the future may be the move towards full EPC contracts & project finance requirements. Conversely, if turbine OEMs don’t take on more risk of the balance of plant infrastructure, progression in
integrated design will be limited.
There is a willingness from turbine OEMs to take on more of the design risk associated with the balance of plant, supporting a move towards integrated design.
Please indicate your level of
confidence in the industry achieving
the following by 2020 for this
indicator (1 Low confidence, 10 High
confidence)
Developer average WTG OEM average Designer average Overall average
All projects will use fully integrated
design from blade tip to pile, including
turbine and support structure
6.8 4.6 5.0 5.5

ORE Catapult PN000113-FRT-002
CRMF 2015 Evidence log external Issue: FINAL 87
14.2 Milestone scorecard
Milestone scorecard FID 2015 FID 2016 FID 2017 FID 2018 FID 2019
Ahead of target One project under construction
using integrated design. Others
looking to contract using the
approach
First project under construction
using integrated design. At least
one other project contracts using
the approach.
First project operational using
integrated design. Integrated
design used for 50% of
contracted projects
Integrated design used for more
than half of projects
Integrated design used for 80%
of projects reaching FID
On target One project uses integrated
design principles and reaches
FID
One project under construction
using integrated design. Others
looking to contract using the
approach
First project under construction
using integrated design. At least
one other project contracts using
the approach.
First project operational using
integrated design. Integrated
design used for 50% of
contracted projects
Integrated design used for more
than half of projects
Behind target Principles understood and
considered in FEED.
One project uses integrated
design principles and reaches
FID
One project under construction
using integrated design. Others
looking to contract using the
approach
First project under construction
using integrated design. At least
one other project contracts using
the approach.
First project operational using
integrated design. Integrated
design used for 50% of
contracted projects
Missed target Principles largely ignored. Principles understood and
considered in FEED.
One project used integrated
design principles
One project under construction
using integrated design. Others
looking to contract using the
approach
First project built using
integrated design. At least one
other project contracts using the
approach.
14.3 Evidence
14.3.1 Questionnaires
Category Questionnaire response
Please note any FEED studies you have been involved with that have considered fully integrated design of the turbine and support structure? i.e. full numerical models from tip to pile with modifications to the turbine to save costs in the support structure.
WTG OEM None
WTG OEM All the FEED studies we have carried out so far include a fully integrated design of the WTG + tower + support structure. [WTG OEM] has a lot of experience in this field.
Designer We will do the coupled analysis for the turbine / foundation. However, we rely on boundary conditions from the turbine manufacturer.

ORE Catapult PN000113-FRT-002
CRMF 2015 Evidence log external Issue: FINAL 88
Category Questionnaire response
Are you doing much work around integrated design? (e.g. developing your own support structure design)
WTG OEM Yes - small in-house team
WTG OEM [WTG OEM] generally works with external foundation designers.
Do you plan to integrate the design of the turbine and support structure on your projects?
Dev Foundation design will be integrated however WTG design will be kept in OEM side.
Dev Coupled analysis of Turbine Loads on Tower, substructure and piles are part of the design process. However this is performed separately by WTG and Substructure suppliers on an iterative basis, as WTG supplier are reluctant to allow others access to their structural models.
Dev Yes but it is still done through an iterative process between foundation designer and tower designer.
Dev Design integration of the generator nacelle, tower, and foundation will become key differentiator for future engineering companies. This has been identified as a cost saving measure. Whereas current projects are still developed with the “conventional” method, future projects will be developed using the new integrated design methodology. Turbine suppliers will have to deliver their data to external design companies.
Dev Yes
Do you have plans to introduce this methodology on future projects?
Dev Being considered, however, as indicated in response Q6A (Foundation design will be integrated however WTG design will be kept in OEM side.) this is unlikely. OEM´s are very reluctant to take into foundation design.
Dev Yes
Dev Yes
Dev Yes
Dev Yes
14.3.2 Interview
Category Interview response
Please note any FEED studies you have been involved with that have considered fully integrated design of the turbine and support structure? i.e. full numerical models from tip to pile with modifications to the turbine to save costs in the support structure.
WTG OEM
• They almost always get involved in optimisation of foundation and substructure design • This would be an iteration of load cases • Possibly an integrated analysis of soil conditions, turbines, and foundations acting as a system • There are many ways to do that, but very seldom that they just hand out a spec of loads and do no development • Level of detail in optimisation will depend on maturity of developers, size of project and so on.
WTG OEM - Assume that there will be a consultant who will take OEM model for tower loads, and work to develop appropriate foundations. - Have exchanged iterations with foundation designer in a design loop, but not a single fully integrated design of turbine tower/support structure.
Are you doing much work around integrated design? (e.g. developing your own support structure design)

ORE Catapult PN000113-FRT-002
CRMF 2015 Evidence log external Issue: FINAL 89
Category Interview response
WTG OEM
• Early collaboration can give some benefit on costs, • Market wide they would always like to be able to offer to customers. • Do expect to continue to work on this, and whilst it is early days they do see that this is something that customers will expect and they do have plans to be able to offer more.
WTG OEM
OEMs, including [WTG OEM] are getting more interested in extending their scope to take on Some design responsibility, [WTG OEM] see this as a market pull being required before they will do much more in way of getting involved in integration of turbine and substructure design. - Some economics/general project structures may be anticipated to have an impact on this. For example: Change of market from technical utility type developers (who have significant in house engineering expertise) to investor consortia (who have less) may be expected to drive OEMs to include more design/design integration in their offer. - may be more scope for improvements/optimisation/steel mass reduction in deeper water and/or jacket foundation solution. Or at least the savings may be more evident than say a fully structurally integrated and optimised ‘standard’ monopile foundation, where even a highly optimised design may not demonstrate significant steel savings.
Do you plan to integrate the design of the turbine and support structure on your projects?
Dev • [Dev] do have an internal research project looking at getting rid of transition piece, this is not an easy task. • [Dev] thinks that this will come in the future, they are building relationships with towers etc. rather than just buying a standard contract package. • There is an obvious synergy to use their expertise in conjunction with their own engineers who work on the monopiles, there is a lot of potential for cost savings here and in the area of more integrated design generally.
Dev - They do seek to structure contracts to enable sharing and design loop with turbine OEM and other packages. - In an auction based world projects now have to seek to optimise on cost and conduct design loops earlier. To succeed a project needs to be designed/costed to be ‘optimised’ at an earlier stage. - Generally [Dev] are asking suppliers to provide more accurate information earlier. - Supply chain also do have the capability to standardise or understand well some design synergies across projects and consider optimising.
Do you have plans to introduce this methodology on future projects?
Dev • Removal of personnel from underneath lowering of tower sections during installation is planned and actively being worked on.
Designer - It is unlikely that fully integrated design will happen for fixed offshore substructures. A function of where the cost centres for this type of project lie. - Floating structures may be different, as there may be effectively a full package of turbine and foundation developed and offered to market as a single item. - [COMPANY] [COMPANY] are an example of foundation and turbine tie up (i.e. fully integrated design) but this is for floating wind, not fixed substructure. - There has been noticeable improvement in operating machines (WTG), and understanding loadings. - Close relationship between fabricators, installers and designers is essential to smooth projects and cost reduction. - [Designer] are now starting to tune design to optimise other areas with cost impact, e.g. installation.
Dev Supply chain also do have the capability to standardise or understand well some design synergies across projects and consider optimising.
14.3.3 Market intelligence
Evidence Source
• The only new integrated design proposed last year was from 2-B Energy to build 2B6, a prototype two-bladed offshore wind turbine with a 6 megawatt capacity.
The scope of its deployment falls out the 2020 scope.
http://maritime-executive.com/article/two-blade-turbines-the-future-of-offshore-wind-energy http://www.offshorewind.biz/2015/09/21/two-bladed-turbine-to-be-tested-in-eemshaven/

ORE Catapult PN000113-FRT-002
CRMF 2015 Evidence log external Issue: FINAL 90
14.4 Additional comments
None for this indicator
14.5 Recommendations
Extend this scope into electrical etc.
Consider whether any project is likely to complete with a truly ‘integrated design’ in the spirit of the CRP vision given the agenda of each of the members of the supply chain/contract structures.
• Alstom and DCNS have joined forces and pooled their respective competences as a wind turbine manufacturer and a naval architect to manufacture a floating
offshore wind turbine able to withstand the most extreme sea conditions and will constitute a tremendous technological leap. The first “made in France” pre-
production turbine is scheduled for 2017. This turbine is based on Alstom’s offshore wind turbine Haliade TM 150-6MW technology. It will have a rated power of 6
MW and will be installed on an anchored, light floating structure developed by DCNS. This turbine also features the exclusive ALSTOM PURE TORQUE®
technology which protects the generator from unwanted wind buffeting and side-effects of the floating system, deflecting them towards the tower. Other innovative
design with low probability of large scale deployment until 2020 is the Vortex bladeless, a wind turbine without blades.
http://www.alstom.com/Global/Power/Resources/Documents/Brochures/wind-floating-wind-turbines-haliade-dcns.pdf?epslanguage=en-GB http://www.reuters.com/article/2015/06/11/us-renewables-wind-bladeless-idUSKBN0OR1ML20150611
• 2B Energy propose an integrated tower and foundation design in a truss structure. An onshore demonstrator has been installed in Eemshaven. http://2benergy.com/windturbine/developme
nt-principle/

ORE Catapult PN000113-FRT-002
CRMF 2015 Evidence log external Issue: FINAL 91
15 66kV
CRMF workstream Level 1 indicator Level 2 indicator Level 3 indicator
Technology Balance of plant Array cables 66kV
15.1 Summary Analysis
Finding: Behind target
The 2015 score for this indicator is 'behind target' because there is no evidence of a project reaching FID in 2015 that will use 66kV.
While the majority of project developers are looking at the technology none have taken FID to date, with the most commonly cited reason that the product requires demonstration before they can take forward.
Neart Na Gaoithe is a good example of this in the UK, stating that they will use the technology only if validation testing is successful as cited below. The delay in uptake of the technology is described by industry
as a combination of lack of supply chain, certification and track record.
Although there is a race to be second to use 66kV, it is likely to happen first on the continent, with TenneT mandating its use on projects in Holland. It is possible that the Navitus Bay wind farm would have been
the first to use it in the UK if it had succeeded in achieving planning consent. The East Anglia ONE project has also stated in the published supply chain plan an intention to use 66kV with construction scheduled
to start in 2017.
Turbine OEMs are preparing for deployment of the technology with most turbines offering capability to integrate currently. As noted in the CRMF 2014 evidence log, a 66kV cable development competition was
launched between 3 cable manufacturers through the OWA. The final results of this competition should now be available for developers that participate in the joint industry programme with extended test
programmes complete by 2017.
Outlook: Industry score of 6.2
The score of 6.2 reflects some uncertainty over the rate future deployment of the technology. Manufacturing capacity for 66kV is however limited and it will take time for this type of cable to become
commoditised. The results of first demonstration projects will define future uptake of the technology.
There is some industry opinion that 66kV standards tend to be something of a restriction.
Please indicate your level of
confidence in the industry achieving
the following by 2020 for this
indicator (1 Low confidence, 10 High
confidence)
Developer average WTG OEM average Electrical OEM average Overall average
60% of projects will use 66kV cables at
FID 2020 7.5 4.8 6.0 6.1

ORE Catapult PN000113-FRT-002
CRMF 2015 Evidence log external Issue: FINAL 92
15.2 Milestone scorecard
Milestone scorecard FID 2015 FID 2016 FID 2017 FID 2018 FID 2019
Ahead of target 20-30% Quarter of market using 66kV 40-50% 60-70% 80-90%
On target Further projects reach FID using
66kV
A third of the projects which
contract use 66kV cables
First project using 66kV cables
operational. A third of projects
which contract use 66kV
30-45% 40-60%
Behind target FID reached on EU project using
66kV cables
FID reached on EU project using
66kV cables
Second EU project reaches FID <20% Quarter of market using 66kV
Missed target Not technically feasible No FID using 66kV FID reached on first EU project
using 66kV cables
0% 0%
15.3 Evidence
15.3.1 Questionnaires
Category Questionnaire response
Are you considering 66kV array cables on your wind farm? / Explain whether you are able to offer 66kV array cables to the market
Dev Yes
Dev Yes
Dev Yes
Dev Yes
Dev Yes

ORE Catapult PN000113-FRT-002
CRMF 2015 Evidence log external Issue: FINAL 93
Category Questionnaire response
Electrical OEM Not applicable.
Electrical OEM Not applicable to [Electrical OEM]
What are the barriers? E.g. lack of supply, technology demonstration. / Discuss any barriers to your turbine being used with 66kV array cabling.
Dev • Certification timing and Supplier readiness for projects with planned FID in 2016
Dev None, we are evaluating on an overall economic basis.
Dev Having a certified supply chain of 66kV cables - there is a limited number right now but positive outlook for 6-12 months time. ORE Catapult could be more transparent with their work and also more open in their support for developers.
Dev Regulatory constraints (i.e. in Germany)
Dev delivery lead times, quality
WTG OEM Trade off between increased cost of turbine switchgear and cost reduction in cabling requirement and substation.
WTG OEM For [PRODUCT] - none
WTG OEM
We have a design ready for the [PRODUCT] to be used with 66kV arrays. The main barrier is market visibility. It is still unclear which offshore project will be the first to use 66kV arrays.
Please describe any related R&D projects you are involved with.
Dev • OWA Cable Technical Working Group: [Dev] is part of this work group focused on array cable innovation. This project aims to qualify a number of 66kV cables so they are commercially available by the end of 2015. • OWA Dynamic cable project – [Dev] is an active contributor to an OWA project to examine how a typical static cable reacts to application in dynamic conditions (when subjected to wave and tidal motion). Dynamic cable applications include free hanging cables from existing foundation technology, which has the potential to reduce installation costs, or can be used to connect floating WTG or wave and tidal generation devices
Dev Mitigation of interference to Air Defence Radar systems
Dev 66kV is a potential Demowind project Also trialling condition monitoring and a cable fault detection system on [PROJECT]
WTG OEM Design of housing for different switchgear configurations and for Transformer locations
When do you expect the first wind farm to reach FID using 66kV cables?
Dev 2016
Dev 2019
Dev Q1 2016 – [PROJECT]
Dev 2017
Dev 2016
WTG OEM 2022 if at all

ORE Catapult PN000113-FRT-002
CRMF 2015 Evidence log external Issue: FINAL 94
Category Questionnaire response
WTG OEM 2019 is best guess, depends on timing of CfD calls, as technically could be sooner.
WTG OEM This is unclear. Our feeling is that we won't see 66kV on any projects before 2018 or 19.
Electrical OEM 2017 albeit it is now more likely that the first project will be outside the UK.
15.3.2 Interview
Category Interview response
Are you considering 66kV array cables on your wind farm? / Explain whether you are able to offer 66kV array cables to the market
Dev • From comparison with 33kv, 66kv looked technically attractive, particularly for larger e.g.~8MW machines • Some concern around standards for 66kv, some uncertainty around this area.
Dev • [Dev] are planning to use this in future. • There are some issues in supply chain but not particularly insurmountable. • Progress towards using 66kv is not flagged as a major hurdle internally.
Dev • CRMF 2014 cited (last year) that 66kV cable report from CT will be out by 2015 & extended test programmes complete by 2017. • [COMPANY] did look at 66kV and engaged with quite a few cable suppliers. Undertook cost benefit analysis for 66kV and technology only came out slightly more advantageous. For turbine sizes ~6MW, cost netural. For ~7MW, slightly more advantageous. Feedback from cable suppliers that no type certified cables available until just before construction of [PROJECT] so supply chain restrictions present too high a risk to adopt technology.
WTG OEM
There is an implicit assumption that 66kv is the right way to go, but on all projects the economics may not necessarily point this way at the moment. - Not necessarily just a technology barrier to adoption of 66 over 33.
WTG OEM
• 66kv has been slow moving • Uncertainty around grid code compliance, there is scope for optimisation of this – it’s a regulatory issue • 33kv – 66kv shift is not a technical constraint, but rather industry standards are perhaps not strongly relevant
What are the barriers? E.g. lack of supply, technology demonstration. / Discuss any barriers to your turbine being used with 66kV array cabling.
Electrical OEM
• [Electrical OEM] do not supply array cables • Would typically partner if array cables were included in a specification • That being said, from an electrical point of view, 66kV is the technologically obvious choice • The main barriers appear to be lack of accredited 66kV cables from the supply chain. • [Electrical OEM] are starting to see evidence that clients/tenderers considering the use of 66kV, although they have not seen to expressly specified • Switchgear for 66kV is already commercially available from networks/other industries
Dev
Barriers to 66kv include combination of supply chain, certification and track record. Main driver is that supply chain would not have enough certainty in being able to deliver on time. However [Dev] do have to look at each individual option in order to be certain of competitive advantage, or at least have to be certain that competing projects do not have a significant advantage over theirs.
Please describe any related R&D projects you are involved with.
When do you expect the first wind farm to reach FID using 66kV cables?

ORE Catapult PN000113-FRT-002
CRMF 2015 Evidence log external Issue: FINAL 95
Category Interview response
WTG OEM
• Market view is that this is still several years out commercially • Availability and volumes of qualified 66kv cabling is likely to be the main limiting factor • Switchgear is not off the shelf, and will require some adaption and development. Up front effort is required, which requires a market pull. There is therefore a tendency to stick with known solutions. Hesitance to be the first, or take risks with relatively unknown/unproven technology.
WTG OEM Will see projects with 66kv in next few years, not a huge technology risk, more a case of finding a project where the particular economics stack up.
Electrical OEM
- Mostly ‘market comment’ not core area of business: - 66kv is now a question of who will be the first. It will happen. - Decision at the moment is at or near the tipping point, where it makes the most sense for a particular project - Looks likely that [COMPANY] may be the first on [PROJECT].
15.3.3 Market intelligence
Evidence Source
The proposed Navitus Bay project could have been the first in the UK to use 66kv array cables had it been granted planning consent. “for the inter-array cables
grid designs at voltage levels of 33kV and 66kV were prepared”.
http://renews.biz/59454/ecofys-fine-tunes-navitus-bay/ https://www.competefor.com/sorec/wp-content/uploads/sites/2/2015/04/Presentation-SOREC-Supplier-Readiness-D-Fallon-for-website.pdf
In May 2013 the Carbon Trust, as part of its Offshore Wind Accelerator (OWA), launched a new competition to fast track the development of new 66kV cables to
be used by the offshore wind industry.
https://www.carbontrust.com/news/2013/05/carbon-trust-launch-race-for-next-generation-of-offshore-wind-cables
The supply chain plan published by Mainstream for the Neart na Gaoithe states that “Neart will adopt 66kV inter array cables subject to the validation testing
success.”
https://www.gov.uk/government/uploads/system/uploads/attachment_data/file/429410/UK02-1701-005-MRP-SUPPLY_CHAIN_PLAN-RPT-A2_-_final_redaction_applied.pdf
In March 2015 TenneT published documentation comparing the use of 66kv to 33kv array cables for the Borssele offshore wind farm project. This demonstrates
that Borssele Hollandse Kust Zuid 1 and Zuid 2 are being considered for 66kv array cabling.
http://www.tennet.eu/nl/fileadmin/afbeeldingen/grid-projects/Net_iop_zee/Documentatie/T1._Enclosure_nr_1b_-_66_kV_systems_for_Offshore_Wind_Farms_by_DNV_GL.pdf http://www.tennet.eu/nl/fileadmin/afbeeldingen/grid-projects/Net_iop_zee/Ronde3/15-0896-v2_66kV_Additional_answers_20150421.pdf http://www.tennet.eu/nl/fileadmin/afbeeldingen/grid-projects/Net_iop_zee/Ronde_2/ONL_15-058-T1_Voltage_level_PP_v2.1.pdf

ORE Catapult PN000113-FRT-002
CRMF 2015 Evidence log external Issue: FINAL 96
15.4 Additional comments
As with last year, the benefits of 66kV are viewed as relatively marginal and site specific compared to 33kV.
15.5 Recommendations
66kV likely to happen in EU before UK at commercial scale. A project developer needs to take the leap in order to progress, else risk being in same place next year.
The DONG Energy project Walney extension has publicly stated that it may use either 33 or 66kv cables http://www.walneyextension.co.uk/en/about-walney-extension/the-project http://infrastructure.planninginspectorate.gov.uk/wp-content/ipc/uploads/projects/EN010027/2.%20Post-Submission/Application%20Documents/Environmental%20Statement/10.3%20Non-Technical%20Summary.pdf
In November 2015 Prysmian Group completed the successful testing on its 66kV complete submarine cable system http://renews.biz/100499/prysmian-tests-66kv-cables
In July 2014 Nexans was among the winners of Offshore Wind Accelerator (OWA) program in the UK. Within this program Nexans aims to expand the
development of its new 66kV 3-core submarine inter-array cables and accelerate their time to market.
http://www.offshorewind.biz/2014/07/30/nexans-among-owa-program-winners/
In October 2014 ORE catapult hosted a free and open seminar and workshop tomorrow to discuss some of the perceived risks and tackle the issues around
implementing higher voltage inter-array systems, specifically focussing on transformers, cables, switchgear and terminations.
http://www.offshorewind.biz/2014/10/08/ore-catapult-to-host-seminar-on-66kv-inter-array-cables/
Holland moves to use of 66kV for offshore wind farms due to increase in turbine ratings used. http://www.tennet.eu/nl/fileadmin/afbeeldingen/grid-projects/Net_iop_zee/Documentatie/T1._Enclosure_nr_1b_-_66_kV_systems_for_Offshore_Wind_Farms_by_DNV_GL.pdf
Prysmian Group has recently completed the successful testing on its 66kV complete submarine cable system. The company said the tested solution – that
includes also factory, field joints and click-fit terminations – combined EPR insulation with wet design and aluminium conductors (copper conductors are also
available).
http://renews.biz/100499/prysmian-tests-66kv-cables

ORE Catapult PN000113-FRT-002
CRMF 2015 Evidence log external Issue: FINAL 97
16 Improvement in array cable standards and specifications
CRMF workstream Level 1 indicator Level 2 indicator Level 3 indicator
Technology Balance of plant Array cables Improvement in array cable standards and
specifications
16.1 Summary Analysis
Finding: On target
This indicator is assessed ‘on target,’ evidenced by a joint industry programme delivering cable specifications over the last year. In February 2015, new guidance has been published by the Carbon Trust’s OWA
to give the offshore wind industry a unified, systematic approach to the risk management of cable burial. This supports delivery of standards for cable burial but we still await delivery of a broader array cable
standard.
Some developers evidenced that they are working on their own standards and best practice in house because the IEC doesn’t cover subsea cabling and CIGRE has no standard for subsea cables. ORE Catapult
has been contributing to work on standards in this space.
As stated last year, manufacturers often only provide high level specification which can lead to diversity on requirements across the sector for what should be a commoditised product.
For 66kV, there is work ongoing on an improved XLPE for a wet design.
Outlook: Industry score of 7.3
The positive industry score highlights optimism that sufficient cable specifications and standards are in development to meet the project specific needs of sites in 2020. Optimal size of every cable is unlikely to be
achieved because the precise diameter of cable offering theoretically the most attractive technical solution is unlikely to be the most cost effective solution.
Please indicate your level of confidence in the industry
achieving the following by 2020 for this indicator (1 Low
confidence, 10 High confidence)
Developer average Overall average
Array cables always optimally specified for the site and project
conditions 7.3 7.3

ORE Catapult PN000113-FRT-002
CRMF 2015 Evidence log external Issue: FINAL 98
16.2 Milestone scorecard
Milestone scorecard FID 2015 FID 2016 FID 2017 FID 2018 FID 2019
Ahead of target Joint industry project delivers . First project contracts with
optimised cable specs and
standards
Further projects contract using
optimised array specs
Most projects contract using
refined specs
All array cables optimally
specified for the site and project
conditions
On target Joint industry collaboration
underway to explore cable
specs
Joint industry project delivers First project contracts with
optimised cable specs and
standards
Further projects contract using
optimised array specs
Most projects contract using
refined specs
Behind target No improvements Joint industry collaboration
underway to explore cable
specs
Joint industry project delivers . First project contracts with
optimised cable specs and
standards
Further projects contract using
optimised array specs
Missed target Array cable specs are getting
worse
No improvement Joint industry collaboration
underway to explore cable
specs
Joint industry project delivers . First project contracts with
optimised cable specs and
standards
16.3 Evidence
16.3.1 Questionnaires
Category Questionnaire response
Describe any improvements made over the past year to array cable specifications
Dev Manufacturers taking the possibility to move to 66kV much more seriously.
Dev Improved XLPE for wet design 66kV should lead to cheaper 33kV options using the same technology.
Dev We are part of the working group UK Cigre which are looking at 66kV cables and agreeing testing standards. Catapult has also done good work over the past year on cable specifications and will hopefully share the results
Dev Offshore Wind Accelerator Internal studies

ORE Catapult PN000113-FRT-002
CRMF 2015 Evidence log external Issue: FINAL 99
Category Questionnaire response
Dev OWA 66kV discretionary project participant
Electrical OEM Not applicable to [Electrical OEM]
Explain whether you think further improvements are possible and detail any current/future industry projects that seek to support this.
Electrical OEM Not applicable to [Electrical OEM]
16.3.2 Interview
Category Interview response
Describe any improvements made over the past year to array cable specifications
Dev • Main cost driver on array cables is switch from 33 – 66kv. Not a lot of cost reduction to be found in other cabling areas in [Dev] opinion. There is a need to get the specification and standards for 66kv over the line, but after this the LCOE impact of technology developments in cables is estimated to be very small. • Suppliers manufacturing capability may limit the potential for technical advancement to make small savings. For example if they find a technical improvement for cost saving with cable manufacturer X, cable manufacturer Y can’t implement it or vice versa. Some of the small savings come from design for manufacturing, and the capabilities of cable manufacturing equipment.
Dev • Consideration between copper and aluminium, but no specific known LCOE innovations or changes recently.
Explain whether you think further improvements are possible and detail any current/future industry projects that seek to support this.
Dev - [Dev] do have to look at each individual option in order to be certain of competitive advantage, or at least have to be certain that competing projects do not have a significant advantage over theirs.
16.3.3 Market intelligence
16.4 Additional comments
None for this indicator
16.5 Recommendations
None for this indicator
Evidence Source
• In February 2015, new guidance has been published by the Carbon Trust’s Offshore Wind Accelerator (OWA) to give the offshore wind industry a unified,
systematic approach to the risk management of cable burial.
http://subseaworldnews.com/2015/02/27/new-guidance-on-offshore-wind-farm-cable-burial/
• TUV SUD provided solutions to Export & Inter-array specification for NPower Renewables http://www.tuv-sud.co.uk/uk-en/about-tuev-sued/tuev-sued-in-the-uk/tuev-sued-pmss/projects/offshore-wind

ORE Catapult PN000113-FRT-002
CRMF 2015 Evidence log external Issue: FINAL 100
17 Extended (XL) monopiles and improved design standards
CRMF workstream Level 1 indicator Level 2 indicator Level 3 indicator
Technology Balance of plant Support structures Extended (XL) monopiles and improved design
standards
17.1 Summary Analysis
Finding: Ahead of target
The finding for this indicator is ‘ahead of target’. Progress in the evolution and deployment of monopiles appears to be continuing. Developers described adequate provision of noise mitigation technologies and
particular note was made to potential improvements in installation offered by trials of the vibropile system. A recent project (Galloper) has described contracted plans to deploy 1100t monopiles. Diameters of
7.5m (Westernmost Rough, Gode wind) and 7.8m (Veja Mate) have been used on projects, and prototyping of larger (10m) diameters were described.
Last year this indicator was rated as on target, with a caveat that it was very close to progressing to ahead of target, noting the advanced trajectory of monopile size, R&D and technology advance since the CRP
study.
Evidence from industry engagement suggested that the applicable envelope for monopile foundations continues to expand. Monopile foundations for 8MW turbines are planned for the Burbo Bank Extension
project and monopiles weighing over 1000t are being discussed for several projects at the concept and design phases. Respondents described an increasing focus on mass restrictions of monopiles (rather than
the commonly used metric of diameter) particularly because of the limited pool of capable installation vessels. Publication of results from the PISA project and Vibropiling studies are both anticipated in early 2016
and R&D work has also been undertaken in the Offshore Wind Structural Lifecycle Industry Collaboration (SLIC) project.
Outlook: Industry score of 6.3
The industry score is a reasonable reflection of the outlook in this area. Whilst there may be an increase in market share of other (particularly jacket) foundation types, and some limited use of suction buckets,
monopile foundations are expected to retain a majority share of the foundation market to 2020. Plans are well progressed to achieve the 2020 vision early, for example the Burbo Bank Extension project will use
monopile foundations for 8MW turbines.
Please indicate your level of confidence in the
industry achieving the following by 2020 for
this indicator (1 Low confidence, 10 High
confidence)
Developer average Designer average Overall average
XL monopiles are used for 6MW turbines on sites
up to 35m water depth and 40km from shore and
used for some 8MW turbines on selected sites.
Revised monopile design standards introduced
reducing steel mass requirements
5.5 7.0 6.3

ORE Catapult PN000113-FRT-002
CRMF 2015 Evidence log external Issue: FINAL 101
17.2 Milestone scorecard
Milestone scorecard FID 2015 FID 2016 FID 2017 FID 2018 FID 2019
Ahead of target First projects contract with 8m+
diameter piles. New design
standards being adopted on
projects
Novel piling and noise mitigation
methods contracted for 8m
diameter piles on commercial
project
10m monopiles can now be
manufactured and installed
Novel piling and noise mitigation
demonstrated at 10m+ scale
and associated design
standards under development
First project contracted using
10m monopiles
Novel piling and noise mitigation
methods contracted for 10m
diameter piles on commercial
project
More projects contract 10m
monopiles
Novel piling and noise mitigation
methods contracted for 10m
diameter piles on more than one
commercial project
50% plus of 6MW projects use
monopiles with a quarter of
8MW projects. New design
standards common practice
Novel piling and noise mitigation
methods contracted for 6 and 8
MW turbines commercially
On target Successful trials of larger
diameter monopiles. Additional
FID on 7m+ monopiles
Novel piling and noise mitigation
methods contracted for 6MW,
7m+ commercial project
First projects contract with 8m
diameter piles. New design
standards being adopted on
projects
Novel piling and noise mitigation
methods contracted for 8m
diameter piles on commercial
project
10m monopiles can now be
manufactured and installed
Novel piling and noise mitigation
demonstrated at 10m+ scale
and associated design
standards under development
First project contracted using
10m monopiles
Novel piling and noise mitigation
methods contracted for 10m
diameter piles on commercial
project
More projects contract 10m
monopiles
Novel piling and noise mitigation
methods contracted for 10m
diameter piles on more than one
commercial project
Behind target Projects contract 6MW turbines
on 7m diameter monopiles.
Testing and trials ongoing for
larger diameter piles. New
design standards emerge
Novel piling and noise mitigation
methods demonstrated but no
commercial contracts placed yet
Successful trials of larger
diameter monopiles. Additional
FID on 7m+ monopiles
Novel piling and noise mitigation
methods contracted for 6MW,
7m+ commercial project
First projects contract with 9m
diameter piles. New design
standards being adopted on
projects
Novel piling and noise mitigation
methods contracted for 8m
diameter piles on commercial
project
10m monopiles can now be
manufactured and installed
Novel piling and noise mitigation
demonstrated at 10m+ scale
and associated design
standards under development
First project contracted using
10m monopiles
Novel piling and noise mitigation
methods contracted for 10m
diameter piles on commercial
project
Missed target No R&D work looking at larger
diameter piles
No further development of novel
piling and noise mitigation
methods
No further FID on 7m + diameter
monopiles
Novel piling and noise mitigation
methods demonstrated but no
commercial contracts placed yet
No further FID on 8m + diameter
monopiles
Novel piling and noise mitigation
methods contracted for 6MW,
7m+ commercial project
First projects contract with 9m
diameter piles. New design
standards being adopted on
projects
Novel piling and noise mitigation
methods contracted for 8-9m
diameter piles on commercial
project
First projects contract with 10m
diameter piles. New design
standards being adopted on
projects
Novel piling and noise mitigation
demonstrated at 10m+ scale
and associated design
standards under development

ORE Catapult PN000113-FRT-002
CRMF 2015 Evidence log external Issue: FINAL 102
17.3 Evidence
17.3.1 Questionnaires
Category Questionnaire response
How large in diameter do you think monopiles will become?
Designer I don't think they will go much larger than we are currently seeing as jacket design efficiencies should start to make that substructure more competitive at the water depths >35m.
What is the largest diameter monopile that you have incorporated into a wind farm design to date?
Dev 6 metres
Dev We are not considering monopiles in our sites 40- 55m water depth,
Dev 8m
Dev 6m installed. 8m in design
Are you considering using monopiles for 7 or 8MW turbines?
Dev no
Dev Considered but not shortlisted
Dev Yes
Designer Yes.
Are piling and noise mitigation measures available for large diameter monopiles?
Dev Yes
Dev not applicable
Dev Yes, bubble curtains.
Dev Yes
Dev Under development
If so, which methods are you implementing?
Dev Not applicable - not used for our MP installations to date. Jacket pile installations generally adopt bubble curtain solutions.
Dev not applicable
Dev Nothing
Dev Base-case: Upside case: avoidance of hammer-piling by using vibrating or drilling
Dev Under development

ORE Catapult PN000113-FRT-002
CRMF 2015 Evidence log external Issue: FINAL 103
Category Questionnaire response
Finally, please describe any recent revisions in monopile design standards that have affected you.
Dev Pending design standards updates will make monopiles a more likely solution for larger turbines, e.g. improvements to p-y curves, optimisation of fatigue design.
Dev not applicable
Dev None
Dev Integrated design FEEDs; use of alternative corrosion protection, i.e. impressed currents; integration of research projects (SLIC, WIFI, etc)
17.3.2 Interview
Category Interview response
How large in diameter do you think monopiles will become?
Foundation - Monopiles: Up to 800 – 900 tons there may be ~4 installation vessels capable. 1000 – 1400t (where monopiles are starting to go) the availability of capable vessels for installation are a significant restriction and will impact the LCOE. - Have done cost vs benefit studies that show from around 35m or more water depth a jacket structure is more efficient/desirable. In particular that standardisation of jacket production (robot welding, standard pipe etc.) can get cost competitive with monopile. - Over 60m water will probably require a new foundation technology
What is the largest diameter monopile that you have incorporated into a wind farm design to date?
Dev • 1100t is largest monopiles installed by [Dev] to date – 7.5m diameter
Installation Current size of monopile is no longer an [Installation] vessel market due to size/weight. - Market comment: one of the biggest limitations is the transit of ~1000t monopiles through the splash zone where significant energy must be damped and absorbed – this is a big technical challenge and is often what defines the weather limits for monopile installation - XL monopiles and foundations in general there is a potential for a market pinch in vessel supply as very few of current fleet of vessels are capable.
Are you considering using monopiles for 7 or 8MW turbines?
Dev • Monopiles were considered for [PROJECT], but latterly moved to jackets and hybrid GBS
Dev • [Dev] will definitely use monopiles for 7 or 8 mw turbines.
Are piling and noise mitigation measures available for large diameter monopiles?
Dev • Noise mitigation solutions are available; marine life protection using bubble curtains have worked very well. [PROJECT] in [] has used another technique to keep marine life away, but not applicable for [] rules.
If so, which methods are you implementing?
Dev • On [PROJECT] they faced a new issue with onshore complaints – layers in geography can transmit noise and vibration very far ~25km. they will have this knowledge for future but does not change SOP. This is likely to be a fairly unique situation.
Foundation - Vibropile project- were an equity partner, participated with [COMPANY]/[COMPANY] etc. This has a dramatic improvement in piling noise – huge reduction in noise. Final report towards end of the year. More interest in this is expected, particularly as anticipated noise constraints get stricter/start to come in.

ORE Catapult PN000113-FRT-002
CRMF 2015 Evidence log external Issue: FINAL 104
Category Interview response
Finally, please describe any recent revisions in monopile design standards that have affected you.
Dev • Not changed since last CRMF • For UK R3 [Dev] will probably design bespoke for each position. Complex/deep projects probably still on balance benefit from having a specific monopile design for the conditions at each turbine location. • In general for [PROJECT] will probably use standardised monopiles, in sand/easy geography
Foundation - Would like to be involved in developing design codes. - Have developed some standards in consultation with other industry stakeholders (e.g. turbine OEMs) - Are actively engaged with [COMPANY] for certification of [PROJECT].
17.3.3 Market intelligence
17.4 Additional comments
None for this indicator
17.5 Recommendations
None for this indicator
Evidence Source
• Offshore projects face vessel shortage for large turbines until 2018, according to Wind Energy Update’s Offshore Foundations and Supporting Structures Report
2015 (September 2015). The European offshore wind industry has a fleet of more than 75 vessels to support it, but almost half of the jack-up vessels in use are
not capable of installing the 8MW turbines now planned for some projects, according to the newly-published study.
http://analysis.windenergyupdate.com/construction/offshore-projects-face-vessel-shortage-large-turbines-until-2018
The Galloper offshore wind farm has announced a contract to supply monopile foundations weighing 1100t. http://www.deme-group.com/news/geosea-deme-group-sprints-galloper-epci-foundations-win-uk?lang=en
The PISA working group has described positive initial findings and conservative existing design methods. The final project report is due to be published in early
2016.
http://www.owjonline.com/news/view,monopile-tests-demonstrate-potential-for-cost-reduction_39053.htm
Offshore Wind Structural Lifecycle Industry Collaboration (SLIC) project http://www.ewea.org/offshore2015/conference/allposters/PO081.pdf
http://www.owjonline.com/news/view,monopile-tests-demonstrate-potential-for-cost-reduction_39053.htm
http://www.owjonline.com/news/view,monopile-tests-demonstrate-potential-for-cost-reduction_39053.htm

ORE Catapult PN000113-FRT-002
CRMF 2015 Evidence log external Issue: FINAL 105
18 Optimised jacket design and manufacture
CRMF workstream Level 1 indicator Level 2 indicator Level 3 indicator
Technology Balance of plant Support structures Optimised jacket design and manufacture
18.1 Summary Analysis
Finding: Behind target
This indicator has been assessed as behind target. Whilst the indicator is ahead considering the number of purpose built facilities (e.g. Bilfinger, Bladt), there are at present insufficient projects to demand full
production.
Last year this indicator was also scored as ‘behind target’, noting particularly that jacket foundations had been squeezed by the continued ‘stretching’ of monopiles into deeper water. Serialised production of
jackets was noted as slowly progressing but facilities were opening and academic studies were underway.
Evidence from interview and questionnaire responses suggested that:
A number of near term projects which are currently in the pipeline are planning to use jacket foundations, including UK projects such as Neart na Goithe and Beatrice,
As such, respondents described a potential squeeze in jacket manufacturing in the coming years, with the possibility of demand challenging the available supply; a change to the current situation,
Tension remains between the optimisation for cost of design, weight of steel, manufacture and installation,
It was not clear that the lowest potential cost jacket foundations will be achieved, as for example, a designer may be tasked with achieving the most structurally efficient foundation, whilst a fabricator
would prefer a design which is optimised for automated manufacture.
Outlook: Industry score 5.5
In the near future there are a number of projects of significant scale planning to use jacket foundations. If all planned EU projects proceed there could be significant demand for jacket foundations in the coming
years, although a number of projects could yet revert to monopile foundations. The ORE Catapult view is that the outlook is likely more positive than the industry score would suggest. A number of facilities
already exist, and plans were described to use automated fabrication, standard components and even the potential for increased UK manufacture. The main barrier to achieving the 2020 target will be an
achievable and consistent demand for jacket foundations sufficient to maintain existing facilities and provide visibility of a sufficient pipeline of projects to justify continued investment. It is still possible that this
indicator could slip further behind to target missed next year.
Please indicate your level of confidence in the
industry achieving the following by 2020 for
this indicator (1 Low confidence, 10 High
confidence)
Developer average Designer average Overall average
A number of purpose built jacket manufacturing
facilities, fabricating optimised designs, using
standardised pipes, lengths and tools
4.0 7.0 5.5

ORE Catapult PN000113-FRT-002
CRMF 2015 Evidence log external Issue: FINAL 106
18.2 Milestone scorecard
Milestone scorecard FID 2015 FID 2016 FID 2017 FID 2018 FID 2019
Ahead of target Improvements in design and
standards continue. Second
advanced jacket manufacturing
facility is open
30% of jackets make full use of
improved design methodologies
and standards, competing with
monopiles at 35m with 6MW
wind turbines
50% of jackets make full use of
improved design methodologies
and standards
70% of jackets make full use of
improved design methodologies
and standards
Almost all jackets use standard
elements, including new design
standard
On target Improvements in design and
standards continue. R&D
projects report on p-y
interactions
Improvements in design and
standards continue. Second
advanced jacket manufacturing
facility is open
30% of jackets make full use of
improved design methodologies
and standards, competing with
monopiles at 35m with 6MW
wind turbines
50% of jackets make full use of
improved design methodologies
and standards, competing with
monopiles at 35m
70% of jackets make full use of
improved design methodologies
and standards, competing with
monopiles at 30m
Behind target New jacket manufacturing
facility operational with
refinements in design using
standard pipes, nodes and
component lengths being used
by market. Additional advanced
jacket facility reaches FID.
Studies underway to review p-y
interaction
Improvements in design and
standards continue. R&D
projects report on p-y
interactions
Improvements in design and
standards continue. Second
advanced jacket manufacturing
facility is open
30% of jackets make full use of
improved design methodologies
and standards, competing with
monopiles at 35m with 6MW
wind turbines
50% of jackets make full use of
improved design methodologies
and standards
Missed target jackets increase in cost New jacket manufacturing
facility operational with
refinements in design using
standard pipes, nodes and
component lengths being used
by market. Additional advanced
jacket facility reaches FID.
Studies underway to review p-y
interaction
Improvements in design and
standards continue. R&D
projects report on p-y
interactions
Improvements in design and
standards continue. Second
advanced jacket manufacturing
facility is open
30% of jackets make full use of
improved design methodologies
and standards, competing with
monopiles at 35m with 6MW
wind turbines

ORE Catapult PN000113-FRT-002
CRMF 2015 Evidence log external Issue: FINAL 107
18.3 Evidence
18.3.1 Questionnaires
Category Questionnaire response
Are you aware of any purpose-built jacket manufacturing facilities reaching (or about to reach) financial close (other than Bladt at Lindo and Bilfinger at Szczecin)?
Dev No
Dev Information not available
Dev Yes, Smulder - Belgium
Dev No
Describe the results of any studies looking at p-y interaction or improved design methodologies for jackets that you have been involved with.
Dev We are supporting an R&D project into assessing larger annuli grouted connections, and are also interested in optimising fatigue design of jacket nodes where significant savings could be made. We have also carried out pile testing on a specific wind farm project to assess real capacities in chalk.
Dev Information not available
Dev Results N/A but from the results the foundation supplier proposed a jacket and pin-pile design. The p-y interaction was based on the geotechnical investigation.
Dev n/a
18.3.2 Interview
Category Interview response
Are you aware of any purpose-built jacket manufacturing facilities reaching (or about to reach) financial close (other than Bladt at Lindo and Bilfinger at Szczecin)?
Dev Q- Smulders – Belgium • Likely only to be for substations • Have capability to manufacture jackets – vision and aims of this organisation is not clear/known
Dev - Competition in jacket supply depends on market factors. - Local content is a big issue, but competitive pricing is also rules the decision making. There is therefore a balance to found for all developers. - Jackets are highly sensitive to labour costs. Exchange rates may also make European supply more attractive. - There could be bottlenecks to come, but this depends on what projects get delivered. For example if [PROJECT or [PROJECT] etc. go jackets or monopiles this will influence capacity in the market, as relatively large projects remain undecided on foundation type. - Many macroeconomic situations have influenced the market and the prices that are sustainable at the moment, particularly price of steel/oil etc. - Although saving material saves costs, this does not necessarily mean that manufacture is cheaper. Small savings, e.g in steel from jacket structure is insignificant in grander scheme as market will change, and in particular installation costs will likely be the same. - There is across the industry a drive for achieving every small efficiency that can possibly be found.
Dev • [PROJECT] jackets which are all the same at the bottom so have standard design for the project
Foundation - Have built a new manufacturing plant, will produce standard monopiles and various sizes of TP. Jackets will come later (next year). - 30% cost can come out of jacket manufacturing by designing for robot welding

ORE Catapult PN000113-FRT-002
CRMF 2015 Evidence log external Issue: FINAL 108
18.3.3 Market intelligence
18.4 Additional comments
The question of sufficient pipeline/market capacity was a common theme in responses when questioned about this indicator. It remains unclear what volume represents sufficient certainty in the market to drive
sensible level of development in supply chain.
18.5 Recommendations
It remains unclear what volume represents sufficient certainty in the market to drive sensible level of development in supply chain. The OWPB supply chain work group should continue to monitor impact of a
reduced market volume on the supply chain. A simple tool that tracks this could be used by the group (in essence tracking demand and manufacturing capacity) to help inform specific actions.
- They would like to share this standard with the industry as there is a need to serialise production. They would therefore welcome the opportunity to share best practice for development of industry and also learn from others. Have shared with [COMPANY] / [COMPANY] etc. - Would like to develop a UK partner for final assembly/some manufacture in the UK. Are actively looking at this, and are seeking to up their UK content. - There is some advantage to final assembly of jackets on UK east coast. May need another 6 months or so to be certain that this would be highly cost competitive, but would help with UK content. - TP’s could come as rolled parts and complete final fit out in UK – but this is expensive, and could developers do not want to pay substantially more. - There is a judgement for a developer in the differential of cost and local content. Supply chain plan and UK content have been made higher priority for developers under the new regime – they are actively asking about this.
Designer - There is capacity for jacket manufacture, but it is not based in the UK. Fabrication of jackets, and particularly serialised production will require an international supply chain - [Designer] are also engaged with European substructure fabricators on other projects.
Describe the results of any studies looking at p-y interaction or improved design methodologies for jackets that you have been involved with.
Foundation - Have developed some standards in consultation with other industry stakeholders (e.g. turbine OEMs) - Are actively engaged with [COMPANY] for certification of [PROJECT]. - Potential for standardisation of foundations and particularly jackets would offer lower cost. - If the design could be frozen it would allow all tenderers/supply chain to work together on taking cost out - Feasibility of such standardisation is unknown, but if there was stability of a design for 1 – 2 years at a time then each generation of jackets would likely be cheaper.
Evidence Source
None for this indicator

ORE Catapult PN000113-FRT-002
CRMF 2015 Evidence log external Issue: FINAL 109
19 Suction bucket
CRMF workstream Level 1 indicator Level 2 indicator Level 3 indicator
Technology Balance of plant Support structures Suction bucket
19.1 Summary Analysis
Finding: On target
This indicator is currently ‘on target’. A number of demonstrations of this concept have been installed. A met mast foundation (installed as an early trial) has also been successfully decommissioned, completing
that programme of R&D work. Some projects are known to be seriously considering deployment of suction bucket foundations during FEED.
The CRMF 2014 study also rated this indicator as on target. As rapid progress had been made in technology demonstration. It was noted that suction buckets had not yet been contracted commercially, and the
prediction of no commercial contracts made in the previous study for 2015 was accurate.
Evidence from interviews and questionnaire responses suggested that a number of developers were planning to deploy suction bucket foundations on projects in the near future although this technology is not
applicable to all soil conditions. Developers look likely to continue to build on demonstration scale projects by installing suction buckets in gradually increasing numbers once the pool of experience has increased
sufficiently.
Outlook: Industry score of 7.3
The use of suction buckets more widely in the future looks likely. There seems to be enough development to substantiate this level of confidence. There is general positivity across industry that suction buckets
will be applied where relevant by 2020 when discussing this indicator during interview. The technology has yet to be contracted on a commercial project but, building on trial deployments, it looks likely that
commercial projects will contract suction buckets, where applicable, by 2020.
Please indicate your level of confidence in the industry
achieving the following by 2020 for this indicator (1 Low
confidence, 10 High confidence)
Developer average Overall average
Suction bucket technology proven and being used on sites with
suitable soil characteristics 7.3 7.3

ORE Catapult PN000113-FRT-002
CRMF 2015 Evidence log external Issue: FINAL 110
19.2 Milestone scorecard
Milestone scorecard FID 2015 FID 2016 FID 2017 FID 2018 FID 2019
Ahead of target First commercial scale project
contracts using technology
Suction buckets competitive at
certain sites
Suction buckets competitive at
certain sites, taking
First suction bucket project
operational. Suction buckets
competitive at certain sites
picking up at least a second
order
Suction buckets dominant
foundation type
On target Demo installed. Actively being
considered in FEED studies
First commercial scale project in
EU contracts using technology
Suction buckets competitive at
certain sites
Suction buckets competitive at
certain sites, taking market
share
First suction bucket project
operational. Suction buckets
competitive at certain sites
picking up at least a second
order
Behind target One demo installed One demo operational First commercial scale project
contracts using technology
Suction buckets competitive at
certain sites
Suction buckets competitive at
certain sites, taking
Missed target No demo installed One demo installed One demo in place First commercial scale project
contracts using technology
Suction buckets competitive at
certain sites
19.3 Evidence
19.3.1 Questionnaires
Category Questionnaire response
Are any of your wind farms suitable for suction bucket foundations?
Dev Future [PROJECT] are likely to be suitable for suction buckets
Dev We do not consider this an option.
Dev Not for entire sites. Dependent on ground conditions.
Dev Yes
Explain whether you are considering the use of suction buckets in your FEED study and the rationale for or against.

ORE Catapult PN000113-FRT-002
CRMF 2015 Evidence log external Issue: FINAL 111
Category Questionnaire response
Dev Suction buckets are being considered as a potential solution for future [PROJECT], due to the theoretical cost saving over jackets and MPs, and the avoidance of noise issues.
Dev Suction piles are suitable for homogenous material, e.g. all sand or all clay, but risky in soils such as glacial or alluvial till.
Dev Yes early engagements with tier 2 suppliers.
Dev Suction foundations in general, and the suction bucket in specific are viable options to replace the monopile foundation. Use of suction buckets for cost reduction purposes (no noise reduction scope), fast installation, decommissioning advantages / less HSSE risks.
19.3.2 Interview
19.3.3 Market intelligence
Category Interview response
Are any of your wind farms suitable for suction bucket foundations?
Dev • Yes – may use on [PROJECT], a percentage of the [PROJECT] foundations may also use suction buckets.
Dev • Does not apply
Explain whether you are considering the use of suction buckets in your FEED study and the rationale for or against.
Dev • In procurement strategy suggested there was a credible supply chain • [PROJECT] would not have whole site ground conditions applicable to use of these
Dev • They are likely to bring them in as a phased approach to gain knowledge about supply chain and installation etc. % of projects for now, even where technically they would be applicable to the whole site. [Dev] see this approach as a methodical/logical way to gradual bring new technologies into their portfolio.
Evidence Source
• In September 2014, DONG Energy has sunk the first suction bucket jacket into the seabed of the North Sea. The new foundation structure will be tested at the
wind farm Borkum Riffgrund 1.
http://www.offshorewindindustry.com/news/first-suction-bucket-jacket-complete
• Universal Foundation has decommissioned a suction bucket substructure originally installed at the Horns Rev 2 offshore wind farm in 2009. The company
removed the mono bucket foundation, which supported a met mast at the Danish wind farm that was no longer required by owner DONG Energy. http://renews.biz/91643/suction-bucket-resurfaces-off-dk/
• In March 2015, Universal Foundation announced that its mono buckets technology is ready for commercial deployment and later this years revealed its plans to
use this design in LEEDCo project in US.
http://universal-foundation.com/mono-buckets-ready-for-commercial-deployment-will-bring-down-lcoe/ http://universal-foundation.com/media/news/#100124

ORE Catapult PN000113-FRT-002
CRMF 2015 Evidence log external Issue: FINAL 112
19.4 Additional comments
None for this indicator
19.5 Recommendations
None for this indicator
• HR Wallingford is helping DONG Energy refine the design of one such alternative – the suction bucket foundation – as part of a research project to determine
how these structures interact with, and impact upon, the hydrodynamic conditions and the seabed.
http://www.hrwallingford.com/news/researching-next-generation-wind-turbine-foundations-for-dong-energy
• In May 2015 SPT Offshore has been contracted by Sembmarine to supply its suction pile foundation for use on the substation at the 402MW Dudgeon project." http://www.windpoweroffshore.com/article/1348284/suction-buckets-set-dudgeon-substation

ORE Catapult PN000113-FRT-002
CRMF 2015 Evidence log external Issue: FINAL 113
20 Standardisation of offshore AC substation
CRMF workstream Level 1 indicator Level 2 indicator Level 3 indicator
Technology OFTO CAPEX HV AC (near / mid shore) Standardisation of offshore AC substation
20.1 Summary Analysis
Finding: On target
While the evidence suggests that suppliers are not offering standardised designs, the ITT by DONG for 5 standardised offshore substations has come to fruition with some sites reaching FID in 2015. TenneT has
also released a tender for a further five standardised designs in the EU market. This raises the indicator from behind target last year to on target this year. As stated last year, it continues to be difficult for
developers to make an investment into standardised designs without a pipeline of wind farms to justify the investment. Progress has been made towards acceptance of distributed transmission through
amendments to standards.
OFTO regime does not support moves to a standardised design due to complexity and longevity of the asset disposal process within OFGEM defined process. This has been cited as an obstacle to progression
of standardised designs.
Subsystems are however commonly standardised.
There is evidence that distributed transmission has now been introduced in project FEED studies and projects currently looking for finance are considering use of the technology. The technology has a positive
response from the finance community. A variety of deployment concepts exist, along with varying descriptions or terminology, which are reflected in the industry engagement quotes below. It looks likely that the
least radical of these concepts will see use in a commercial project first.
Distributed systems however are based on only one product currently and integration into turbine architecture from a variety of OEMs is not yet widely available. SQSS have now accepted grid code changes
required to allow distributed transmission.
Related; there is evidence that some are moving towards standardised jacket for the wind farm including the substation foundation.
ORE Catapult expect projects to reach FID with use of distributed transmission over the next year.
Outlook: Industry score of 3.3
A key barrier to standardisation is the need for country specific solutions.
TenneT have tendered for another 5 standard substations and it has stated that it will not progress with distributed transmission. However the outlook for UK sites which are delivered individually or consecutively
(as distinct from developers capable of applying a portfolio approach) using standardised substations is less certain, as reflected in the industry score.
There is evidence of concerns around increased OPEX due to de-centralised solutions like distributed transmission. There is also a clear difference between a step change in technology, such as distributed
transmission, achieving contract award and subsequently being deemed successfully technically proven after successful delivery and operation of the first commercial application.

ORE Catapult PN000113-FRT-002
CRMF 2015 Evidence log external Issue: FINAL 114
Please indicate your level of
confidence in the industry achieving
the following by 2020 for this
indicator (1 Low confidence, 10 High
confidence)
Developer average Electrical OEM average OFTO average Overall average
All substations have standard rating
and voltage, substantial standardisation
of other features.
4.5 2.5 3.0 3.3
20.2 Milestone scorecard
Milestone scorecard FID 2015 FID 2016 FID 2017 FID 2018 FID 2019
Ahead of target Further projects reaching FID
achieve some form of
standardisation on voltage,
rating or size. Work ongoing on
'reference design' for offshore
substation
First project contracts with
lightweight transmission system
Half of projects use standard
rating and voltage. Industry
'reference design' is available to
market. First project delivered
using standardised design enter
construction phase.
First project contracts with
lightweight transmission system
and > 2 market ready products
Almost all projects use standard
rating and voltage. Some other
features in process. First project
using standardised design is
delivered and shows significant
benefits.
First project contracts with
lightweight transmission system
and > 2 market ready products
Almost all projects use standard
rating and voltage. Some other
features in process. Benefits of
standardised design on real
projects highlighted in industry.
third project contracts with
lightweight transmission system
and > 2 market ready products
All substations have standard
rating and voltage, substantial
standardisation of other features
Three projects contract with
lightweight transmission system,
at least 1 in operation and > 2
market ready products
On target First projects reach FID using
some form of standardisation on
voltage, rating or size
Initial discussions to include
lightweight transmission
systems ongoing
Further projects reaching FID
achieve some form of
standardisation on voltage,
rating or size. Work ongoing on
'reference design' for offshore
substation
First project contracts with
lightweight transmission system
Half of projects use standard
rating and voltage. Industry
'reference design' is available to
market. First project delivered
using standardised design enter
construction phase.
First project contracts with
lightweight transmission system
and > 2 market ready products
Almost all projects use standard
rating and voltage. Some other
features in process. First project
using standardised design is
delivered and shows significant
benefits.
Second project contracts with
lightweight transmission system
and > 2 market ready products
Almost all projects use standard
rating and voltage. Some other
features in process. Benefits of
standardised design on real
projects highlighted in industry.
Second project contracts with
lightweight transmission system
and > 2 market ready products

ORE Catapult PN000113-FRT-002
CRMF 2015 Evidence log external Issue: FINAL 115
Behind target Designers aim for
standardisation of major
characteristics of substation
platforms: transformer rating,
voltage, size
No development of lightweight
transmission system
infrastructure
First projects reach FID using
some form of standardisation on
voltage, rating or size
Initial discussions to include
lightweight transmission
systems ongoing
Further projects reaching FID
achieve some form of
standardisation on voltage,
rating or size. Work ongoing on
'reference design' for offshore
substation
Initial discussions to include
lightweight transmission
systems ongoing
Half of projects use standard
rating and voltage. Industry
'reference design' is available to
market. First project delivered
using standardised design enter
construction phase.
First project contracts with
lightweight transmission system
Almost all projects use standard
rating and voltage. Some other
features in process. First project
using standardised design is
delivered and shows significant
benefits.
First project contracts with
lightweight transmission system
Missed target No awareness of the benefits of
standardisation
No development of lightweight
transmission system
infrastructure
0%
No development of lightweight
transmission system
infrastructure
Designers aim for
standardisation of major
characteristics of substation
platforms: transformer rating,
voltage, size
No development of lightweight
transmission system
infrastructure
First projects reach FID using
some form of standardisation on
voltage, rating or size
No development of lightweight
transmission system
infrastructure
Further projects reaching FID
achieve some form of
standardisation on voltage,
rating or size. Work ongoing on
'reference design' for offshore
substation
No development of lightweight
transmission system
infrastructure
20.3 Evidence
20.3.1 Questionnaires
Category Questionnaire response
Describe any steps you are taking to standardise offshore substations. / Discuss any ways in which you are seeking to deliver standardisation in the Offshore AC substation. / Discuss any ways in which you have seen the industry seeking to deliver standardisation in the Offshore AC substation
Dev We are not currently looking for standardised offshore substations. We following some industry initiatives to minimise equipment requirements on offshore substations
Dev We have looked at it – [PRODUCT]. Most likely would have been used on [PROJECT]
Dev The substation standardization is country-specific. We are trying to find a lowest common denominator for standardizations; ideally this is on a component side, which requires multi-lot contracting
Electrical OEM [Electrical OEM] has standardized its multi-deck OHVS solution in a "Reference Design" and has also developed a modular distributed substation concept, the [PRODUCT], which is a standardized solution whilst retaining project specific flexibility. This solution has the potential to save up to 40% CAPEX when compared to an equivalent multi-deck OHVS solution.
OFTO From the perspective of an OFTO owner, standardisation is not the focus but more value engineering to ensure capital costs are minimised whilst meeting the requirements of the codes and operational requirements. Naturally standardisation, for the OFTO, allows spares and maintenance practices to be optimised.
Are you implementing a standardised substation design on suitable sites? / Detail any projects which have contracted a standardised design within the last year.
Dev No, as we are only developing a single site.

ORE Catapult PN000113-FRT-002
CRMF 2015 Evidence log external Issue: FINAL 116
Category Questionnaire response
Dev Yes if [PROJECT] went ahead.
Dev Yes, this is the target (country-specific)
Electrical OEM Standardization will only occur currently where there are repeat contracts by one developer where he controls the design. The only developer doing this to date is [COMPANY].
Electrical OEM Both the [PROJECT] and [PROJECT] have publicly stated that the [PRODUCT] [distributed transmission] solution is the base case technology for their wind farm transmission systems subject to project FID.
What saving do you expect to make from implementing a standardised design?
Dev We do not yet see equipment suppliers offering standardised designs.
Dev 40% savings
Also, are you considering distributed transmission systems i.e. no standalone structure for the sub station? / are you witnessing the take up of distributed transmission systems i.e. no standalone structure for the transmission system?
Dev No
Dev No however if suitable project presented itself would be considered.
Electrical OEM This is being investigated. This will involve some compromises by Developers in respect of functionality and offshore facilities and if the specifications were relaxed in this sense there is no reason why such an arrangement could not be provided. However, there is still 800 to 1000 tonnes of electrical equipment to be supported on several structures rather than one, which would require some reinforcement of the WTG foundation if they are combined. We therefore see this more as a structural challenge than an electrical one in respect of any cost savings that are achievable. We believe more work is necessary to establish whether many small jackets or one large jacket, especially in deep water, is the most economical life time solution.
Electrical OEM Yes. [Electrical OEM] has developed a modular distributed substation concept, the Offshore Transformer Module (OTM), which is a standardized solution whilst retaining project specific flexibility. This solution has the potential to save up to 40% CAPEX when compared to an equivalent multi-deck OHVS solution. This solution can be offered either as a stand alone solution with its own foundation(s) or as a solution which shares the wind turbine generator foundation.
OFTO Some industry information that developers are considering this solution but unaware of this being implemented yet.
When do you foresee that the first distributed transmission systems will be contracted on a commercial wind farm?
Electrical OEM This is dependent on Developers specifying such an arrangement, but should that be the case and the economics proven, then in the next couple of years
Electrical OEM Subject to projects reaching FID we expect this to happen in 2016.
OFTO Dependant on the developers
20.3.2 Interview
Category Interview response
Describe any steps you are taking to standardise offshore substations.
Dev - Challenge is that developers must constantly reassure themselves that they can justify that the way they are procuring the OFTO asset will stand up to subsequent scrutiny - OFTO transaction is a long process, not like a typical corporate finance transaction - Mandated gated process from ofgem can take years to proceed through

ORE Catapult PN000113-FRT-002
CRMF 2015 Evidence log external Issue: FINAL 117
- Have gone for a fairly conventional AC transmission solution - Challenge is getting a view from ofgem, tend to be non-committal, particularly in the early phases, perhaps driven by a lack of specific standards to rely on for definition/descriptions
Dev • Yes- currently building 5x topsides to the same [COMPANY] design
Dev · If like [COMPANY] that have a pipeline of similar sites, possible to standardise. Bigger issue is for round 3 projects where further offshore and there is a need for a bespoke solution for each project. Limited by cable instead because reactive power and harmonics issues increase as get longer so need less power per cable.
Electrical OEM • The same or very similar switchgear has gone into all projects to date, and as such a certain degree of the substations that [Electrical OEM] offer may already be considered standardised • Even different clients will have similar requirements for the electrical design of substations, again evidence that designs are converging/standardising • However there remain, and will likely continue to remain, site specifics that are not necessarily electrical but do influence substation design • SCADA and comms solution offered by [Electrical OEM] is common and adapted to each project – close to standardised • There is a lack of OFTO specification. • The default is therefore that developers rely on national grid spec and are discouraged/not incentivised to move away from these • Relying on alternative (and still adequate) specification would offer the potential for significant cost savings (CAPEX) • Some European players may be closer to taking the leap away from National Grid specifications as they are well used to relying on IEC etc. • The UK regime of OFTOs is unique in Europe
Designer - Working on designs for distributed transmission, and also on ‘classic’ OSP AC substations. Different clients are taking different views, meaning that OSP is still most attractive for some sites. Expects that there will continue to be people who develop using both [distributed transmission] and OSP.
Are you implementing a standardised substation design on suitable sites?
Dev • Other approaches with larger pipelines made a decision to standardise some time ago, and are now progressing with it, would they make the same decision now or with a different portfolio? Perhaps not.
Dev • [PROJECT] will have 3x identical offshore + 1 reactor – big offshore reactor station. • It is not possible to use a standardised design across markets, as requirements and standards are not the same UK – Germany. [Dev] would like to be able to, as cost savings can be made by standardising substations.
What saving do you expect to make from implementing a standardised design?
Dev • 2 biggest step changes in cost reduction are move to larger (7MW) turbines, and to a distributed substation system [PRODUCT] • See supply chain plan for more detail • Government and regime is currently the biggest barrier. Majority of cost reduction is coming from contractors: [COMPANY], [COMPANY] etc.) • Cost reduction has to come from supply chain, but if they do not see a pipeline in the UK they will not invest the necessary to make this happen. Will treat every project as bespoke and therefore are not incentivised to really drive at reducing LCOE.
Electrical OEM - There will continue to be some bespoke designing. - There are some developers in the market who are committed to their own/existing designs - Looking outside UK, Tennet will not build distributed modular substations, could be that this is because they are not privately financed. - [COMPANY] are the only single developer with a large enough portfolio to standardise, so a supply chain provided standardised solution allows individual sites/developers to benefit from costs reductions associated with standardisation despite only having a few projects. This is what makes modularised/standardised substations attractive for the UK. - [Electrical OEM] can also can offer a standard multi deck topside where this is the most appropriate solution, and there will still be projects where these remain the best fit.
Also, are you considering distributed transmission systems i.e. no standalone structure for the sub station?
Dev • Have gone for a modular substation design • Simplifying and using [PRODUCT] adds significantly to flexibility and also helps significantly in reduction of LCOE
Electrical OEM • This is largely a structural issue as the electrical subsystems is not significantly changed. • Some of the benefits of co-located equipment are lost such as redundancy via cross-connects on platform.

ORE Catapult PN000113-FRT-002
CRMF 2015 Evidence log external Issue: FINAL 118
20.3.3 Market intelligence
20.4 Additional comments
Individual questionnaire and interview responses use varying terminology, and caution should be exercised when seeking to directly compare individual responses or statements, as particularly in the area of
distributed transmission systems a common vocabulary is yet to be defined.,
• Is interesting as it will have implications that span contract packages, for example saving costs in the electrical BoP/supply by removing substation platform, but adds costs to turbine and possibly other packages • Onshore this type of system would again be relevant, at least technically, but offshore the impact on cost of energy from distributed transmission is not clear, or at least it is not as simple as removing the cost of a substation • OPEX implications are another area of trade off – centralised locations for maintenance may be more cost effective may be saving CAPEX at the expense of OPEX • May be additional safety implications • [Electrical OEM] are looking at the electrical aspects of distributed transmission
Dev - Distributed transmission has a lot of technical details to be ironed out. It may be that these cost savings will only be optimal for certain projects, but where they can be used they will probably deliver a cost saving. Any innovation like this will also have unforeseen costs – e.g design, installation etc. which will all have cost impacts and will need to be considered in the round and weighed up against the savings to be had from avoiding a classic offshore substation platform.
Dev • For the [COPMANY] [PRODUCT], there was a thorough DD exercise, which identified possible concepts and looked at regulations – SQSS. Reduced redundancy was a key issue. Worked with OFGEM to sort these issues. • Cost benefit outweighted potential losses of the [PRODUCT]. • [PROJECT] is bank financed so had to undertake similar DD exercise with lenders engineers. • Considering the [PRODUCT] combined with turbine on platform was a potential issue because the vibration from turbine could impact [PRODUCT] operation. Some cost reduction lost because could not install at base of the turbine. Decision was made not to include because cost saving did not outweigh risk – [COMPANY] would have had the commercial liability for the interface. This was a low probability, high impact risk due to potential lost revenue. - Technology is a new concept and project finance structure means that lenders tech advisers had to be made comfortable with the concept for it to be adopted on a project - A lot of work has gone into getting [PRODUCT] adopted into their project but well worth it for cost reduction. - Helps to reduce OFTO costs too - Standardisation of foundation designs is also a benefit here
Evidence Source
• In March 2015, Offshore wind market leader DONG Energy has awarded a contract to Atkins for engineering design services for three offshore substations at
DONG Energy's proposed Hornsea Project One offshore wind farm.
http://www.dongenergy.co.uk/news/press-releases/articles/dong-energy-awards-substation-design-contract-to-atkins
• In September 2015, TenneT started the tender process for 5 offshore substations and 5 marine cables. The requirements are 5 standardised substations of 700
MW connecting a total of 3450 MW of offshore wind and planning to be realised by 2023.
• In November 2015 the OWPB completed its report Lightweight Offshore Substation Designs, which contrasts lightweight and distributed substation concepts with
traditional offshore substation platform designs.
• The ORE Catapult and other industry representatives have participated in a review of clauses in GSR020 to ensure that the most economic and efficient
solutions for offshore wind farm connections can be facilitated.
http://www2.nationalgrid.com/UK/Industry-information/Electricity-codes/SQSS/Modifications/GSR020/

ORE Catapult PN000113-FRT-002
CRMF 2015 Evidence log external Issue: FINAL 119
20.5 Recommendations
Review how this indicator is structured in the future, in particular the step changes that are required to make progress, for example the demonstration of proven technology or prototype can represent a big leap.

ORE Catapult PN000113-FRT-002
CRMF 2015 Evidence log external Issue: FINAL 120
21 Overplanting and use of dynamic rating
CRMF workstream Level 1 indicator Level 2 indicator Level 3 indicator
Technology OFTO CAPEX HV AC (near / mid shore) Overplanting and use of dynamic rating
21.1 Summary Analysis
Finding: On target
Evidence in 2014 suggested that there was an uptake in use of overplanting by developers, hence was rated ahead of target. This year, none of the projects that reached FID evidenced use of overplanting.
There is evidence of widespread use of dynamic rating. This indicator is therefore on target due to a lack in progress over the last 12 months of the use of overplanting.
It is uncommon to reach maximum MW generating capacity due to routine maintenance etc. so overplanting can be used to reduce the size (and cost) of the transmission equipment substantially. There is
evidence that some consider the benefit to be significant.
Outlook: Industry score of 4.6
The outlook is below average for this indicator largely due to lack of consensus between supply chain and developers that we will reach a scenario where there is "substantial" use of overplanting or dynamic
rating.
Since this indicator seeks to track two related but distinct design principles it is important to understand that the interested audience is different for each. While overplanting is more of an issue for developers,
dynamic rating is more of an issue for the OFTO. Overplanting requires wind farm control and dynamic rating requires condition monitoring.
Please indicate your level of
confidence in the industry achieving
the following by 2020 for this
indicator (1 Low confidence, 10 High
confidence)
Developer average Electrical OEM average OFTO average Overall average
Substantial use of overplanting and/or
dynamic rating of cables 5.7 4.0 4.0 4.6

ORE Catapult PN000113-FRT-002
CRMF 2015 Evidence log external Issue: FINAL 121
21.2 Milestone scorecard
Milestone scorecard FID 2015 FID 2016 FID 2017 FID 2018 FID 2019
Ahead of target Use of overplanting and/or
dynamic rating on 50% of
projects.
Use of overplanting and/or
dynamic rating on 50% of
projects.
Use of overplanting and/or
dynamic rating on 75% of
projects.
Use of overplanting and/or
dynamic rating on 75% of
projects.
Use of overplanting and/or
dynamic rating on all projects.
On target First project contracts using
overplanting and/or dynamic
rating. IEC cable rating for wind
generation being developed
First project under construction First project operational using
overplanting and/or dynamic
cables rating. IEC publishes
'wind generating' cable rating
standard. At least another
project contracts using the
approach
over 25% of projects use the
approach
Over 50% of projects contract
using the approach
Behind target Awareness of benefits from
overplanting/dynamic cables.
Considered in FEED studies
First project contracts using
overplanting and/or dynamic
rating. IEC cable rating for wind
generation being developed
First project under construction First project operational using
overplanting and/or dynamic
cables rating. IEC publishes
'wind generating' cable rating
standard. At least another
project contracts using the
approach
over 25% of projects use the
approach
Missed target Cables oversized for wind farm
capacity
Some use of overplanting and/or
dynamic rating on at least one
project.
Some use of overplanting and/or
dynamic rating on at least one
project.
Some use of overplanting and/or
dynamic rating on at least two
projects.
Some use of overplanting and/or
dynamic rating on at least two
projects.
21.3 Evidence
21.3.1 Questionnaires
Category Questionnaire response
Describe any steps you are taking to use dynamic cable ratings and/or optimise the electrical system in relation to generating capacity (e.g. 518MW wind farm with 500MW export infrastructure).
Dev The [PROJECT] FEED stage will investigate constrained energy production, overplanting, and dynamic cable rating together in order to find the economically efficient CEC and TEC ratio for the project. We expect the dynamic rating and overplanting to result in a main export cable half the size of the cross section on a cable brochure and that the HDD and OSP may have a larger cross section to account for hot spots.

ORE Catapult PN000113-FRT-002
CRMF 2015 Evidence log external Issue: FINAL 122
Category Questionnaire response
Dev Yes it was looked into. Both fully rated and dynamic cable ratings were being taken forward into the commercial exercise. There is a limit to using the dynamic rating however under SQSS. Also looked into the emergency rating of the transformers.
Are you aware of any projects considering over-sizing the wind farm generation capacity to the export infrastructure? If so, please detail.
Electrical OEM No. We assume that the overriding factor is to export all power that is generated on a "good" wind day and any moderate savings on say the transformer are offset by lost revenue on such occasions.
Electrical OEM Yes. Several projects are considering this.
OFTO Yes we are aware of cables that are 90% rated
Discuss whether you think dynamic rating of cables and transformers will be introduced over the next few years.
Electrical OEM This an area that needs to be explored, particularly for cables where the csa and then overall cost is reduced. This would require more monitoring of the network. Transformers is less clear cut as you still need the transformer offshore and a modest saving on the rating is only going to give a modest saving on cost.
Electrical OEM Yes, Dynamic rating of cables in particular is being actively discussed on several projects.
OFTO Dynamic cable rating is already used on cables via the DTS systems
21.3.2 Interview
Category Interview response
Describe any steps you are taking to use dynamic cable ratings and/or optimise the electrical system in relation to generating capacity (e.g. 518MW wind farm with 500MW export infrastructure).
Dev • SQSS compliance – large standard covering transmission systems in the UK • National grid classify each offshore substation as a grid entry point, which requires you to build in at least 50% contingency. Single transformer and one cable therefore does not comply with SQSS • Could go through a design variation with national grid, several months, cost, and uncertainty • Heavily involved in a working group to help re-interpretation of existing text to allow offshore substations to cost less/be simplified • Only early days involvement with OFTOs. Expect that some OFTOs would be willing to consider dynamically rated cables, but did not get to a firm agreement with this for [PROJECT]
Dev • Dynamic ratings are very much used. Can get more bang for buck – export cables • [Dev] are actively interested in seeing if they can squeeze more out of the export cables, optimising the value for money from export cables. • [Dev] are not aware of whether there is a problem with handing over dynamically rated cables to OFTOs
Electrical OEM • How to define % of capacity rating of electrical system is really a question for the developer • [Electrical OEM] only ever see 100% rating of transformers etc. in tenders • They therefore assume that relatively small CAPEX savings in, for example, driving a transformer hard/rating it for only a % of potential windfarm output would be insignificant when compared to the lost revenue for not being able to export 100% of rated power when wind conditions allow • An exception may be where projects are extended (e.g. not an extension built as a completely new suite of infrastructure) • Cable over rating, particularly over long distances may be more worthwhile, but is outside of [Electrical OEM] typical scope
Electrical OEM - Very site specific
Dev - All developers probably have to look at these options to try to optimise costs. - Overplanting and dynamic rating should not be coupled as a single question. - Decision around dynamic rating is being looked at, but there is hesitance about jeopardising a future OFTO transmission by making decisions early in the project.

ORE Catapult PN000113-FRT-002
CRMF 2015 Evidence log external Issue: FINAL 123
21.3.3 Market intelligence
21.4 Additional comments
Several participants noted the significant differences between the two areas which comprise this indicator. Consider a revision in subsequent studies.
21.5 Recommendations
None for this indicator
- To a certain extent the OFTO regime could be considered to reduce scope for innovation. In particular if contrasted with European system where grid is brought offshore to you. That being said, there is still scope for some innovation, reference [COMPANY] new approaches for example. But in general because there is a competitive tender they will be looking for the optimum balance of OFTO transaction risk and CAPEX cost
Evidence Source
The Carbon trust has launched a call for entries from companies interested to undertake a detailed assessment, including modelling and simulation, on subsea
cable de-rating factors with focus on windfarm array and export cables.
https://www.carbontrust.com/about-us/tenders/offshore-wind-accelerator-dynamic-thermal-rating-of-subsea-cables/

ORE Catapult PN000113-FRT-002
CRMF 2015 Evidence log external Issue: FINAL 124
22 Booster stations (additional reactive power compensation platforms midway to shore)
CRMF workstream Level 1 indicator Level 2 indicator Level 3 indicator
Technology OFTO CAPEX Far shore Booster stations (additional reactive power
compensation platforms midway to shore)
22.1 Summary Analysis
Finding: On target
There are no perceived barriers to the technology being deployed. ORE Catapult is aware of two projects currently looking at this technology in the FEED stage and Hornsea 1 has contracted Ramboll to supply
the design for an AC reactive power compensation platform. As no projects reaching FID have contracted a booster station, this indicator is 'on target'. It should also be noted that ‘technically proven’ as required
by the later part of the on target milestone may or may not have been achieved, depending on whether ‘proven’ requires a detailed design (which may exist) or a project deployment (which does not) or some
other achievement between the two.
Outlook: Industry score of 5
The use of booster stations is project specific and future confidence in the technology hinges on one project installing successfully in the coming years. There is also concern that regulatory barriers, around
ensuring competition is included in the procurement of an OFTO asset, will hinder deployment of the technology.
The outlook is consistent across electrical OEMs and developers, with electrical OEMs having a more positive outlook.
Please indicate your level of confidence in the
industry achieving the following by 2020 for
this indicator (1 Low confidence, 10 High
confidence)
Developer average Electrical OEM average Overall average
HVAC booster station(s) deployed on at least one
offshore project 4.5 5.5 5

ORE Catapult PN000113-FRT-002
CRMF 2015 Evidence log external Issue: FINAL 125
22.2 Milestone scorecard
Milestone scorecard FID 2015 FID 2016 FID 2017 FID 2018 FID 2019
Ahead of target First project contracts using
booster stations
First project under construction First project under construction First project operational using
booster stations
First project built using booster
stations
On target Considered in detail in FEED
studies. Technically proven
First project contracts using
booster stations
First project under construction First project under construction First project operational using
booster stations
Behind target R&D task Considered in detail in FEED
studies
Considered in detail in FEED
studies
Considered in detail in FEED
studies
Considered in detail in FEED
studies
Missed target Not considered technically
possible
R&D task R&D task R&D task R&D task
22.3 Evidence
22.3.1 Questionnaires
Category Questionnaire response
Describe your approach to AC transmission infrastructure (e.g. HVAC with booster)
Dev We will be using HVAC transmission design.
Dev SQSS compliance – minimum to meet the standards. Choose the most cost effective design. Look to remove offshore power requirements or have the turbines providing the reactive power. No approach to a booster however as the transmission distance has not been great enough on our projects
Discuss whether you are able to offer AC booster stations (additional platforms midway to shore, to reduce the reactive power problem for AC transmission) and whether these offer a competitive alternative to HVDC.
Electrical OEM Yes, [Electrical OEM] can offer AC booster platforms as part of an overall solution

ORE Catapult PN000113-FRT-002
CRMF 2015 Evidence log external Issue: FINAL 126
Category Questionnaire response
We expect these to be a competitive alternative at medium distances. The exact distances at which simple AC, AC with booster stations or HVDC are appropriate solutions cannot be determined with out some analysis of project specifics, but we generally see AC being pushed to its technical limits to avoid the costs of a HVDC link.
Electrical OEM [Electrical OEM] can offer AC booster stations either onshore or offshore. Whether these are cost effective versus HVDC depends on project specific factors such as wind farm rating, cable routing constraints, consent parameters etc. Noting the introduction of different HVDC transmission solutions will also impact upon this comparison.
Have you considered AC reactive power compensation technology in your FEED studies?
Dev Yes, the FEED study will seek to optimise the balance of reactive power between turbines, cabling and substations, with consideration of providing ancillary reactive power services to NGET.
Dev Yes - onshore technology
If so, which project have you considered it for?
Dev Each project is reviewed on a case by case basis for most economic and efficient design.
Dev [PROJECT] and [PROJECT]
Have you taken any orders for AC booster stations over the last year?
Electrical OEM No
22.3.2 Interview
Category Interview response
Describe your approach to AC transmission infrastructure (e.g. HVAC with booster)
Dev • Yes- currently building 5x topsides to the same [COMPANY] design • [PROJECT] will have 3x identical offshore + 1 reactor – big offshore reactor station. • It is not possible to use a standardised design across markets, as requirements and standards are not the same UK – Germany. [Dev] would like to be able to, as cost savings can be made by standardising substations. • Overall the [Dev] approach is to have as big an overlap as possible between what is possible with HVAC and HVDC to drive competition. They see an extension of AC technology into DC distances as being attractive due to number of potential suppliers competing in the market.
Electrical OEM - There is some underlying reticence for developers in being able to demonstrate to ofgem that engagement with suppliers has been a truly competitive process. It could be that there are restrictions (or perceived restrictions) stifling progress in this area. - Some assurance or guidance from ofgem on what level of transparency/proof of value is required would perhaps be useful and unlock some cost reductions by allowing developers to choose technology/suppliers more freely.

ORE Catapult PN000113-FRT-002
CRMF 2015 Evidence log external Issue: FINAL 127
22.3.3 Market intelligence
22.4 Additional comments
Caution should be exercised when comparing responses describing distances from shore in non-numerical terms. For instance what is considered near, mid and far from shore sites will vary between
organisations.
22.5 Recommendations
There is some underlying reticence for developers in being able to demonstrate to OFGEM that engagement with suppliers has been a truly competitive process. It could be that there are restrictions (or
perceived restrictions) stifling progress in this area. Some assurance or guidance from OFGEM on what level of transparency/proof of value is required would perhaps be useful and unlock some cost reductions
by allowing developers to choose technology/suppliers more freely.
Evidence Source
Ramboll have been contracted to design a mid-way to shore reactive power compensation platform for the proposed Hornsea 1 offshore wind farm. The design is
said to be the first of its kind.
http://www.ramboll.co.uk/news/rgr/ramboll-delivers-unprecedented-substation-design-for-hornsea-one

ORE Catapult PN000113-FRT-002
CRMF 2015 Evidence log external Issue: FINAL 128
23 Compact HV DC systems
CRMF workstream Level 1 indicator Level 2 indicator Level 3 indicator
Technology OFTO CAPEX Far shore Compact HV DC systems
23.1 Summary Analysis
Finding: Behind target
Remaining behind target, as with last year due to a lack of HVDC platforms planned in the UK. Those that had considered HVDC technology are not likely to any longer. There is also limited competition in the
space, although electrical OEMs are beginning to offer new products to the market that incorporates learning from platforms built in Germany.
The distance from shore at which a developer might consider HVDC is changing as AC technology is stretched. This is evidenced in the advancement of indicators for AC technology in this study.
Hub and spoke approach is looking increasingly unlikely under the OFTO regime.
Outlook: Industry score of 4.2
Outlook reflects the low probability of any projects in the UK using the technology by 2020, although other markets such as Germany, are likely to continue development. Slowdown and cost increase in HVDC is
placing extra pressure on projects further from shore in the UK and they must now compete on an uneven playing field in transmission technology.
A developer noted the need for competition in the supply chain for both AC and DC but with limited providers of technology to the market, the outlook for this remains uncertain.
Please indicate your level of confidence in the
industry achieving the following by 2020 for
this indicator (1 Low confidence, 10 High
confidence)
Developer average Electrical OEM average Overall average
HVDC equipment competitive with other options
at 70km 3.3 5.0 4.2
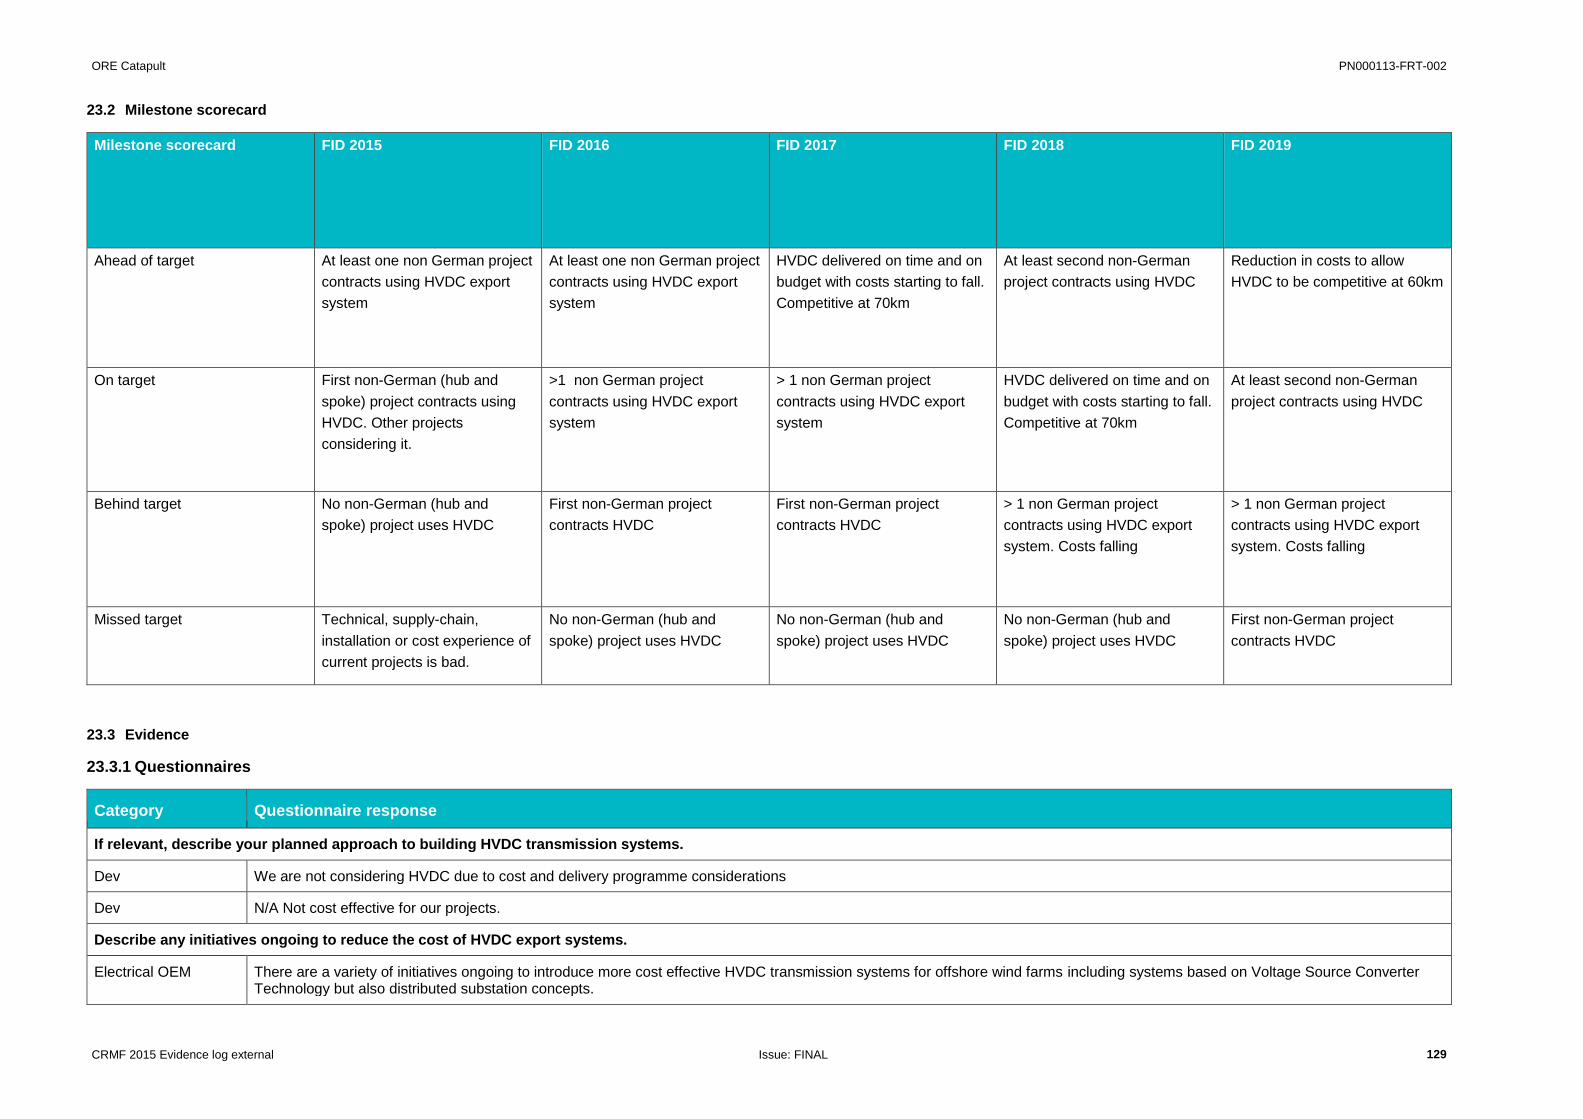
ORE Catapult PN000113-FRT-002
CRMF 2015 Evidence log external Issue: FINAL 129
23.2 Milestone scorecard
Milestone scorecard FID 2015 FID 2016 FID 2017 FID 2018 FID 2019
Ahead of target At least one non German project
contracts using HVDC export
system
At least one non German project
contracts using HVDC export
system
HVDC delivered on time and on
budget with costs starting to fall.
Competitive at 70km
At least second non-German
project contracts using HVDC
Reduction in costs to allow
HVDC to be competitive at 60km
On target First non-German (hub and
spoke) project contracts using
HVDC. Other projects
considering it.
>1 non German project
contracts using HVDC export
system
> 1 non German project
contracts using HVDC export
system
HVDC delivered on time and on
budget with costs starting to fall.
Competitive at 70km
At least second non-German
project contracts using HVDC
Behind target No non-German (hub and
spoke) project uses HVDC
First non-German project
contracts HVDC
First non-German project
contracts HVDC
> 1 non German project
contracts using HVDC export
system. Costs falling
> 1 non German project
contracts using HVDC export
system. Costs falling
Missed target Technical, supply-chain,
installation or cost experience of
current projects is bad.
No non-German (hub and
spoke) project uses HVDC
No non-German (hub and
spoke) project uses HVDC
No non-German (hub and
spoke) project uses HVDC
First non-German project
contracts HVDC
23.3 Evidence
23.3.1 Questionnaires
Category Questionnaire response
If relevant, describe your planned approach to building HVDC transmission systems.
Dev We are not considering HVDC due to cost and delivery programme considerations
Dev N/A Not cost effective for our projects.
Describe any initiatives ongoing to reduce the cost of HVDC export systems.
Electrical OEM There are a variety of initiatives ongoing to introduce more cost effective HVDC transmission systems for offshore wind farms including systems based on Voltage Source Converter Technology but also distributed substation concepts.

ORE Catapult PN000113-FRT-002
CRMF 2015 Evidence log external Issue: FINAL 130
23.3.2 Interview
23.3.3 Market intelligence
23.4 Additional comments
None for this indicator
Category Interview response
If relevant, describe your planned approach to building HVDC transmission systems.
Dev German experience has shown very publicly that there is significant risk for utilities and developers of expecting to connect to one of the grid provided hubs
Dev • [Dev] are at present not building any HVDC. • Overall the [Dev] approach is to have as big an overlap as possible between what is possible with HVAC and HVDC to drive competition. They see an extension of AC technology into DC distances as being attractive due to number of potential suppliers competing in the market. • [Dev] have retreated somewhat from HVDC but it looks like [PROJECT] would need a DC link. That project is still only ‘on the drawing board.’ • [Dev] are in Germany and have seen the German issues with it, this is the primary reason that [Dev] are not keen to press ahead with HVDC until it is absolutely necessary.
Dev • Good engagement with DC and AC suppliers to help with decision making but prohibitive lead times for DC vs. AC. Now moving into CfD regime there is no chance of DC choice due to lead times. Lead times need to come down to be considered on a CfD project.
Electrical OEM • Self installing (HVDC) platforms having huge associated costs, for example due to classification as a vessel – used in Germany but would not be cost effective in UK regime. • No HVDC in UK soon.
Electrical OEM - Business case AC vs DC has changed. - Over 100km is now possible for AC, AC with booster AC with booster stations and/or shoreline compensation. Over 200km will still have to go to HVDC. - UK market will not build HVDC platforms like Germany has. - The cost of DC will have to come down, as a far offshore DC project may always compete for CfD with a 30km offshore project using an AC link. - [Electrical OEM] have launched modular DC solution to market. - DC will inherently still be more expensive than AC. How to compete on a level playing field against a closer AC connected project is a big unknown for developers.
OFTO - At present it looks likely that the only possible project in the UK is [PROJECT] which may use HVDC - Experience in Germany has been a disaster and has scared the industry. - [COMPANY] and [COMPANY] are already working with the technology, and hence feel that they are more experienced in the technology and hence may be able to deliver it better. - Very difficult to make an argument for HVDC links based on what industry has seen so far.
Evidence Source
The awarding procedure for the 900MW Borwin4 North Sea offshore wind grid link has been halted, and project links reallocated. http://www.windpoweroffshore.com/article/1376471/borwin-4-contracts-halted?bulletin=windpower-offshore-weekly&utm_medium=EMAIL&utm_campaign=eNews%20Bulletin&utm_source=20151214&utm_content=www_windpoweroffshore_com_3

ORE Catapult PN000113-FRT-002
CRMF 2015 Evidence log external Issue: FINAL 131
23.5 Recommendations
None for this indicator

ORE Catapult PN000113-FRT-002
CRMF 2015 Evidence log external Issue: FINAL 132
24 Lifting conditions for blades
CRMF workstream Level 1 indicator Level 2 indicator Level 3 indicator
Technology Installation Turbines Lifting conditions for blades
24.1 Summary Analysis
Finding: Ahead of target
This indicator has been assessed to be ‘ahead of target’. There is consensus across industry that the ‘ahead of target’ milestone of 9m/s for this year has comfortably been achieved. In many cases the 2020
target of 12m/s has already been achieved, despite the ongoing increase in the size of blades.
The CRMF 2015 also rated this indicator as ‘ahead of target’, for similar reasons.
Evidence this year was perhaps tempered slightly in the average upper limits quoted compared to last year. This year, upper limits of 10 – 14m/s were commonly described. Rather than representing a backward
step it is likely that this is a reflection of the opportunity for more comprehensive engagement in 2015, where installation contractors, turbine OEMs and developers have all provided comment on the working
blade lift limits; as such there is high confidence that these limits are reflective of current industry practice.
Outlook: Industry score 7.8
ORE Catapult view is that this score could be justifiably higher, as almost universally the 2020 target has already been achieved, and there is a clearly described technology path which will allow this limit to
steadily increase. However, some projects do continue to use rotor star lifts, the limits for which are known to be lower. The outlook assumes that rotor star lifts will be phased out, as lifting tools continue to
advance and as rotor diameter continues to increase. The technology pathway and/or the potential benefit to installation weather windows of moving beyond 15m/s are not certain.
Please indicate your level of
confidence in the industry achieving
the following by 2020 for this
indicator (1 Low confidence, 10 High
confidence)
Developer average WTG OEM average Installation average Overall average
Blades can be installed in 12m/s at hub
height 7.8 8.6 7.0 7.8

ORE Catapult PN000113-FRT-002
CRMF 2015 Evidence log external Issue: FINAL 133
24.2 Milestone scorecard
Milestone scorecard FID 2015 FID 2016 FID 2017 FID 2018 FID 2019
Ahead of target 9m/s 9.75m/s 10.5m/s 11m/s 12m/s
On target 8.5m/s 9m/s 9.75m/s 10.5m/s 11m/s
Behind target 8m/s 8.5m/s 9m/s 9.75m/s 10.5m/s
Missed target Operational experience with
current practice proves worse
than expected, especially with
larger blades.
Operational experience with
current practice proves worse
than expected, especially with
larger blades.
8m/s 9m/s 10m/s
24.3 Evidence
24.3.1 Questionnaires
Category Questionnaire response
What wind speed (m/s) do you think the industry can currently install blades at now?
Dev 10-12 m/s (10 minute average) @ 100 m LAT for single blade installation.
Dev We are assuming that for WTGs being installed 2019 this can be done at 12m/s.
Dev 12m/s. Equipment capable of 15m/s.
Dev 12

ORE Catapult PN000113-FRT-002
CRMF 2015 Evidence log external Issue: FINAL 134
Category Questionnaire response
WTG OEM Don't know
WTG OEM
Rotor install 8 m/s Single blade install 12 m/s Depending on gustiness of the wind
WTG OEM At around 10-12 m/s
O&M Not able to comment much on blade installations - this would be elsewhere in the business.
Installation Not our core business
Installation Not sure this is the right question? Substructure installation is currently more expensive than wind turbine installation. There are more gains to be had on substructure installation than turbine installation. Blade installation is currently between 8 and 14 m/s depending on directionality, tooling, vessel and procedures.
If there is a range then please provide details.
WTG OEM n/a
Discuss any initiatives you are aware of that aim to increase this limit.
WTG OEM Yes, the [PRODUCT] designed by [COMPANY] which can be used to increase the installation window for WTG components.
24.3.2 Interview
Category Interview response
What wind speed (m/s) do you think the industry can currently install blades at now?
Dev • Comfortably up to 12m/s for classic (~3.6MW) machines, but there is a learning curve to be able to handle larger blades. • Expect that after a couple of years the standard limits even for larger new machines will continue to increase • But there will always be weather risk
Dev • [COMPANY] promise 14m/s part of framework agreement with [COMPANY] as their customer. This has been increasing steadily. Are already installing at these speeds.
Dev • Using specialist crane tool to maximise weather lifting windows
Installation - Wind limit for blades will typically be a function of the turbine OEM’s specification and equipment. - There is some dialogue with OEMs, but mostly in a supplier/client relationship for [Installation] - There is a potential for This to improve, and it is known that OEMs are working on technology developments in This area to increase the Wind limits for safe blade lifting.
WTG OEM - Rotor star at 8m/s - Single blade at 12m/s - A team are working on looking at new blade lifting devices. - Expect that as projects get underway and gain experience the limits will tend to increase as all get comfortable and seek to optimise the process. Once the developer is comfortable that the OEM knows what they are doing weather limits in general do tend to increase as project progresses.
Discuss any initiatives you are aware of that aim to increase this limit.
WTG OEM - There is a clear technology route to move current 12 m/s to 13m/s near future and can see 14 m/s on horizon based only on technology improvements - Generally amount of additional time and flexibility that further increase will give to installation schedules may be a route of diminishing returns

ORE Catapult PN000113-FRT-002
CRMF 2015 Evidence log external Issue: FINAL 135
24.3.3 Market intelligence
24.4 Additional comments
None for this indicator
24.5 Recommendations
None for this indicator
WTG OEM • Smart lifting equipment • Tool to lift blades in efficient and safe manner, already being used
Evidence Source
• In February 2015, A2SEA has been working with Siemens Wind Power’s sophisticated tool for installing single blades at higher wind speeds and with greater
safety. The tool can be used in winds with sustained speeds of up to 14 m/s and gusts of up to 19 m/s. So far, however, the safe working limit for the tool is a
more modest 12 m/s.
http://a2seanews.editionmanager.com/2015/02/27/call-transformer/
• In March 2015, High Wind NV announced the start of the commercialisation of its Boom Lock allowing the safe installation of all wind turbine components in
winds of up to 15 m/s. The Boom Lock is a system that is mounted on an offshore crane, and is designed to control the movement of the crane hook and the
payload in such a way that installation time can be drastically reduced. The first Boom Lock was completed in January, installed on GeoSea Neptune.
http://www.deme-group.com/news/most-important-innovation-wind-turbine-installation-years-drastically-increases-safety-and
• In July 2015, Eltronic developed a new standard for mounting/dismounting blade increasing offshore blade installation to 12-14 m/s. http://www.eltronic.dk/business-units/heavy-industries/products/lifting-and-transport-equipment
In November 2015 GeoSea’s jack-up vessel Apollo was prepared for a Boom Lock system engineered and designed by lifting specialists High Wind. The system
outperformed the design specification by keeping a 6MW-turbine blade steady in wind speed of 15 m/s with gusts of up to 20 m/s. http://renews.biz/100522/boom-lock-bound-for-apollo

ORE Catapult PN000113-FRT-002
CRMF 2015 Evidence log external Issue: FINAL 136
25 Feeder vessels
CRMF workstream Level 1 indicator Level 2 indicator Level 3 indicator
Technology Installation Turbines Feeder vessels
25.1 Summary Analysis
Finding: Behind target
This indicator has been rated as ‘behind target’ because while considered by some developers, the use of feeder vessels or orders for fast feeder vessels are not evident.
In the CRMF 2014, this indicator was rated as ‘on target’ because while the concept was not being used there was, as with this year, some evidence of developers considering it.
Questionnaire and interview evidence has established that:
At a concept stage some developers do consider this methodology, but;
There was limited evidence of serious consideration or integration at a more detailed planning stage and has not as yet been employed on a project.
An exception to this rule may be the use of feeder barges supplying floating foundation installation vessels, which do not represent the majority of the market or play a significant role in turbine installation
which this indicator specifically seeks to track.
There was not a consensus that the use of feeder vessels would actually result in cost savings for all projects as they may reduce transit of costly installation vessels but at present the technology
available may significantly increase the sensitivity of installation to weather limits (significant wave height).
Outlook: Industry score of 5.0
The outlook for this indicator highlights uncertainty in the future use of feeder vessels. It does not look likely that a feeder vessel order will be placed in 2016, therefore this indicator is likely to remain behind
target in subsequent years. Feeder vessels may become more relevant if larger round 3 sites move into construction. The opportunity for feeder vessels to offer cost reduction is when the distance of sites from
port significantly increases. The trend for increasing turbine size may also have an impact on the benefits offered by the feeder vessel concept, for example delivering a large round 3 project with 3MW turbines
would perhaps see greater benefit than the same project using fewer 6 – 8MW turbines.
Please indicate your level of confidence in the
industry achieving the following by 2020 for
this indicator (1 Low confidence, 10 High
confidence)
Developer average Installation average Overall average
Use of floating feeder vessels has been proven by
2020 and gained significant market share for far
offshore sites
4.8 5.3 5.0

ORE Catapult PN000113-FRT-002
CRMF 2015 Evidence log external Issue: FINAL 137
25.2 Milestone scorecard
Milestone scorecard FID 2015 FID 2016 FID 2017 FID 2018 FID 2019
Ahead of target First feeder vessel ordered First feeder vessel under
construction
First feeder vessel delivered Feeder vessel operating
effectively
Feeder vessels proven and
significant market share for Site
D (assume used on 70% of Site
D projects)
On target Feeder vessels considered in
FEED studies for far offshore
wind farms. Effectively zero use
First feeder vessel ordered First feeder vessel under
construction
First feeder vessel delivered Feeder vessel operating
effectively
Behind target No consideration in FEED
studies
Considered in FEED studies and
vessel design emerging
First feeder vessel ordered First feeder vessel under
construction
First feeder vessel delivered
Missed target concept rejected No designs or consideration in
FEED studies
No designs or consideration in
FEED studies
First feeder vessel ordered First feeder vessel under
construction
25.3 Evidence
25.3.1 Questionnaires
Category Questionnaire response
Are you considering in FEED the use of fast feeder vessels to transport parts to site and then transfer to installation vessel to install? / Discuss whether you or your customers are considering the use of feeder vessels during installation? i.e. fast floating vessel with large deck space which transports components to site which are then transferred to the jack up using ship-to-ship transfer
Dev Yes
Dev Shuttle Barge transportation is being considered for Jacket and Piling.
Dev No not for offshore. Wind farms close to the shore. More appropriate for projects further offshore.
Dev No

ORE Catapult PN000113-FRT-002
CRMF 2015 Evidence log external Issue: FINAL 138
Category Questionnaire response
WTG OEM Not aware of this.
WTG OEM The main focus on this has come from our clients and partners. It appears that the heave compensation systems to lift turbine components from a moving feeder vessel deck are not yet good enough to avoid undue weather disruptions.
WTG OEM Yes. [WTG OEM] considers all scenarios in collaboration with the chosen vessel provider and will choose the most cost-effective one.
Installation no
Installation Yes. We've used feeder vessel on a number of projects. Floating installation is much more suited to using feeder vessels than jack-up installation. Generally at the moment the market isn't strong enough to justify investment in fast feeder vessels.
25.3.2 Interview
25.3.3 Market intelligence
25.4 Additional comments
None for this indicator
Category Interview response
Are you considering in FEED the use of fast feeder vessels to transport parts to site and then transfer to installation vessel to install? / Discuss whether you or your customers are considering the use of feeder vessels during installation? i.e. fast floating vessel with large deck space which transports components to site which are then transferred to the jack up using ship-to-ship transfer
Dev • No feeder vessels planned, will use jack up for transport • Distributed substation equipment has reduced deck weight sufficiently to avoid specialist lifting vessels
Installation A couple of companies work with feeder vessels that work with jack up vessels - can be cost effective but not for floating installation vessels.
Evidence Source
Van Oord have confirmed that they have been awarded the contract for installing foundations at the Burbo Bank Extension offshore wind farm, Van Oord will use
its heavy lift vessel Svanen. The installation strategy is based on the feeder concept bringing foundation components floating to the Svanen at the installation site.
http://www.vanoord.com/news/2015-van-oord-signs-contract-burbo-bank-extension-offshore-wind-farm
Scira have confirmed that monopile and the transition piece for the installation of the Sheringham Shoal wind farm were brought to the site from the Netherlands
on the 87m “Toisa Sonata”. The foundations will continue to arrive in a sequential order, and be installed in a pre-determined pattern, each one having been
designed and fabricated specifically for its installation site. This represents the repurposing of a multi-purpose vessel as a feeder transporting components to the
installation site.
http://scira.co.uk/newsdownloads/Downloads/SSOWFissue6.pdf

ORE Catapult PN000113-FRT-002
CRMF 2015 Evidence log external Issue: FINAL 139
25.5 Recommendations
None for this indicator

ORE Catapult PN000113-FRT-002
CRMF 2015 Evidence log external Issue: FINAL 140
26 Whole turbine installation
CRMF workstream Level 1 indicator Level 2 indicator Level 3 indicator
Technology Installation Turbines Whole turbine installation
26.1 Summary Analysis
Finding: Behind target
This indicator has been assessed as ‘behind target’. The evaluation is difficult because the industry has moved away from whole turbine installation concepts. There are no demonstrations of this concept (with
the exception of the Beatrice demonstrator and some non-EU demonstrator projects) that have taken place and none are known to be planned.
Evidence backed up the view that this methodology is now rather out of date as the industry has changed significantly since the time of the pathways study. Impact of this innovation is likely to be seen post-2020
and hence is given a zero weighting for cost reduction in this study.
Outlook: Industry score 4.0
This methodology may become more relevant as floating projects move closer to deployment on a commercial scale. It is unlikely that any whole turbine installations will take place before 2020.
Please indicate your level of confidence in the
industry achieving the following by 2020 for
this indicator (1 Low confidence, 10 High
confidence)
Developer average Installation average Overall average
20% of market installs using whole turbine
installation concept. 3.3 4.7 4.0
Float out and sink installation is used by 10% of
projects in 2020 4.8 4.8

ORE Catapult PN000113-FRT-002
CRMF 2015 Evidence log external Issue: FINAL 141
26.2 Milestone scorecard
Milestone scorecard FID 2015 FID 2016 FID 2017 FID 2018 FID 2019
Ahead of target Further/continuing trials of whole
turbine installation
Innovation available to market.
First project contract using
whole-turbine installation
One project progressing to build Second project contracts using
whole turbine installation
At least 2 projects contract using
whole turbine installation
On target First trials of whole turbine
installation
Further/continuing trials of whole
turbine installation
Innovation available to market.
First project contract using
whole-turbine installation
One project progressing to build Second project contracts using
whole turbine installation
Behind target First trials of whole turbine
installation
Further/continuing trials of whole
turbine installation
Innovation available to market.
First project contract using
whole-turbine installation
One project progressing to build
Missed target n/a No discussions on going First trials of whole turbine
installation
Further/continuing trials of whole
turbine installation
Innovation available to market.
First project contract using
whole-turbine installation
26.3 Evidence
26.3.1 Questionnaires
Category Questionnaire response
Have you begun any trials of whole turbine installation methods yet? / Have you been involved in any R&D or trials of whole turbine installation methods? If so, please detail.
Dev No
Dev Whole turbine installation methods we used on [PROJECT], but are not currently being considered for our larger wind farm.
Dev No, just the standard method currently
Dev No
Installation no

ORE Catapult PN000113-FRT-002
CRMF 2015 Evidence log external Issue: FINAL 142
Category Questionnaire response
Installation Yes, we've developed methods for installing turbines from floating vessels. Generally the wind turbine suppliers are not interested in pursuing this. The best chance is possibly floating
offshore wind where you may need to change out turbine components after installation.
26.3.2 Interview
26.3.3 Market intelligence
26.4 Additional comments
None for this indicator
26.5 Recommendations
For the CRMF 2016, consider a different approach for assessing innovations that may have an impact post-2020.
Category Interview response
Have you begun any trials of whole turbine installation methods yet? / Have you been involved in any R&D or trials of whole turbine installation methods? If so, please detail.
Dev • No trials of this. Can’t do it currently. This question is now a little out of date. • A more relevant question would be how much more assembly and preparatory work is done onshore, now compared with previous years. • It was stated that it is possible to save with a factor of 7 by doing work onshore vs offshore. [COMPANY] and [Dev] have therefore been working hard on this as an area for making cost savings.
Installation they see that the weather limitations on This are likely to be very severe, which is likely to result in unworkable programmes
Evidence Source
None for this indicator

ORE Catapult PN000113-FRT-002
CRMF 2015 Evidence log external Issue: FINAL 143
27 Lifted GBS with turbine pre-installed
CRMF workstream Level 1 indicator Level 2 indicator Level 3 indicator
Technology Installation Support structures Lifted GBS with turbine pre-installed
27.1 Summary Analysis
Finding: Behind target
This indicator has been assessed as ‘behind target’ for 2015. There has been some work on gravity foundations, but no projects have completed where the GBS is lifted with a turbine pre-installed.
Demonstration sites for GBS are known to be at the concept stage.
Last year this indicator was also assessed as ‘behind target’. It was noted that some work was being undertaken but that lack of test and demonstration facilities was acting as a barrier.
Evidence suggests that some developers are considering GBS for some sites. The met mast installations that have used GBS have been towed out with tower pre-installed. There is limited evidence of projects
considering lifted GBS with turbine pre-installed. There are no recent projects where complete turbines are moved in a single lift. However there are still a number of players in the market and as such the
potential for cost reduction through deployment of gravity foundations is not yet thought to be a ‘missed target’.
Outlook: Industry score 4.8
It is noted that the sample size of responses for this indicator is low, and as such the ORE Catapult view is that this indicator is less likely to achieve the 2020 target than the score of 4.8 would suggest. GBS is
not anticipated to be an area of significant activity for future UK projects. Due to the increasing size of turbines (and hence foundations) it is unlikely that any concept requiring the single lift of a complete turbine
will take place without significant investment and testing of new vessels or installation methodologies.
Please indicate your level of confidence in the industry
achieving the following by 2020 for this indicator (1 Low
confidence, 10 High confidence)
Developer average Overall average
Float out and sink installation is used by 10% of projects in 2020 4.8 4.8

ORE Catapult PN000113-FRT-002
CRMF 2015 Evidence log external Issue: FINAL 144
27.2 Milestone scorecard
Milestone scorecard FID 2015 FID 2016 FID 2017 FID 2018 FID 2019
Ahead of target First project contracts using
float-out-and-sink
Another single project uses
float-out-and-sink
5% of market uses float-out-and-
sink.
10% of market 20% of market
On target First demo sites are under
construction/operational
First demo sites are operational First project contracts using
float-out-and-sink
First project under construction At least a second projects
contracted using float out and
sink
Behind target Demo sites secured and
progressing to FID
First demo projects reach FID Demo sites under construction Demo sites operational First project contracts using
GBS
Missed target all GBS suppliers pull out of
market
No progress on demo sites Demo sites secured/underway Demo sites secured/underway First use of float-out-and-sink
27.3 Evidence
27.3.1 Questionnaires
Category Questionnaire response
Have you been involved with any trials of floating or lifted concrete gravity base structures? If so, please provide details.
Dev No
Dev We have recently installed a concrete gravity based Met Mast.
Dev No but [COMPANY] have. [PROJECT] plans to trial floating concrete gravity bases.

ORE Catapult PN000113-FRT-002
CRMF 2015 Evidence log external Issue: FINAL 145
27.3.2 Interview
27.3.3 Market intelligence
Evidence Source
• Three technologies use single operation; GBF gravity base Vinci Construction UK/Freyssinet International, CGF Vici Ventus Concrete Gravity Foundation,
STRABAG gravity base.
http://www.4coffshore.com/windfarms/gravity-
based-support-structures-aid274.html
http://www.vinci-offshorewind.co.uk/VFOW.pdf
http://www.viciventus.no/
http://www.strabag-
offshore.com/en/projects/strabag-serial-
system/strabag-terminal.html
RenewableUK Offshore Wind Project Intelligence
monthly reports
• The Spanish company Esteyco S.A.P. awarded a £2.5 million funding under H2020 for ELISA project aiming to develop and demonstrate a full scale
prototype for a self-installing precast concrete telescopic tower allowing crane-free offshore installation of foundations, towers and turbines.
https://ec.europa.eu/easme/en/sme/5274/self-
bouyant-precast-concrete-foundation-craneless-
installation-complete-offshore-wind
27.4 Additional comments
None for this indicator
27.5 Recommendations
It is recommended that floating and lifted GBS indicators could be combined in subsequent studies as the technology, in general, has a small market share for UK projects. Having a more generic GBS indicator
may be more relevant as whole turbine lift installations do not look likely before 2020. There are opportunities for GBS technologies and they are considered for some UK sites, but single operation installations
look unlikely in the near future.
Category Interview response
Have you been involved with any trials of floating or lifted concrete gravity base structures? If so, please provide details.
Dev • Are looking at GBS for [PROJECT]
Dev • No comment or relevant projects.

ORE Catapult PN000113-FRT-002
CRMF 2015 Evidence log external Issue: FINAL 146
28 Improvements in the installation process for monopiles through better vessels
CRMF workstream Level 1 indicator Level 2 indicator Level 3 indicator
Technology Installation Support structures Improvements in the installation process for
monopiles through better vessels
28.1 Summary Analysis
Finding: Missed target
This indicator is assessed as ‘missed target’. There is, at present, no evidence of new build floating DP installation vessels being on order or likely to enter the market in the near future. This may have been
driven by a lack of sufficient market pull, and the extension of the operating envelope of jack up vessels including through new builds.
Last year this indicator was rated as ‘behind target’ as no evidence of new build floating installation vessels entering the market had been seen. There is no change to this situation this year.
Evidence suggests that:
Developers are planning to adapt the ideal logistics concept for their project to suit market availability of vessels with capability. The availability of vessels remains variable.
Projects have, to date, used a combination of existing floating DP installation vessels (such as SHL) and high capacity jack up WTIV.
This trend looks likely to continue in the near future, with the new generation of WTIV being used for installation of XL monopiles alongside existing floating installation vessels.
There is some indication of manufacturing trials of monopile sections with diameters up to 10m, and projects (Galloper) have published plans to install monopiles with weights of 1100t, which will be a
significant challenge for installation vessel supply.
Outlook: Industry score 5.3
The outlook is uncertain. Concepts for a new generation of wind turbine foundation installation vessels do exist but look unlikely to be taken forward for investment and construction in the near future. It is unlikely
that the 2020 target will be met as no evidence of appetite to invest in new floating DP vessels. The pipeline of future projects in Europe looks likely to contain an increased proportion of jacket foundations in the
next few years. However XL monopiles do still show a strong trend towards continuing to be used on larger (at least up to 8MW) turbines and in ever increasing weights. The use of a few capable jack up vessels
to install these monopile foundations may represent continuing extension of the envelope of jack up vessel use beyond what was envisaged in the CRP study.
Please indicate your level of
confidence in the industry achieving
the following by 2020 for this
indicator (1 Low confidence, 10 High
confidence)
Developer average WTG OEM average Installation average Overall average
Range of purpose built foundation
installation vessels, including floating
DP vessels, capable of installing largest
monopiles, and use of fast feeder
vessel concepts for far offshore sites
5.3 5.2 5.3
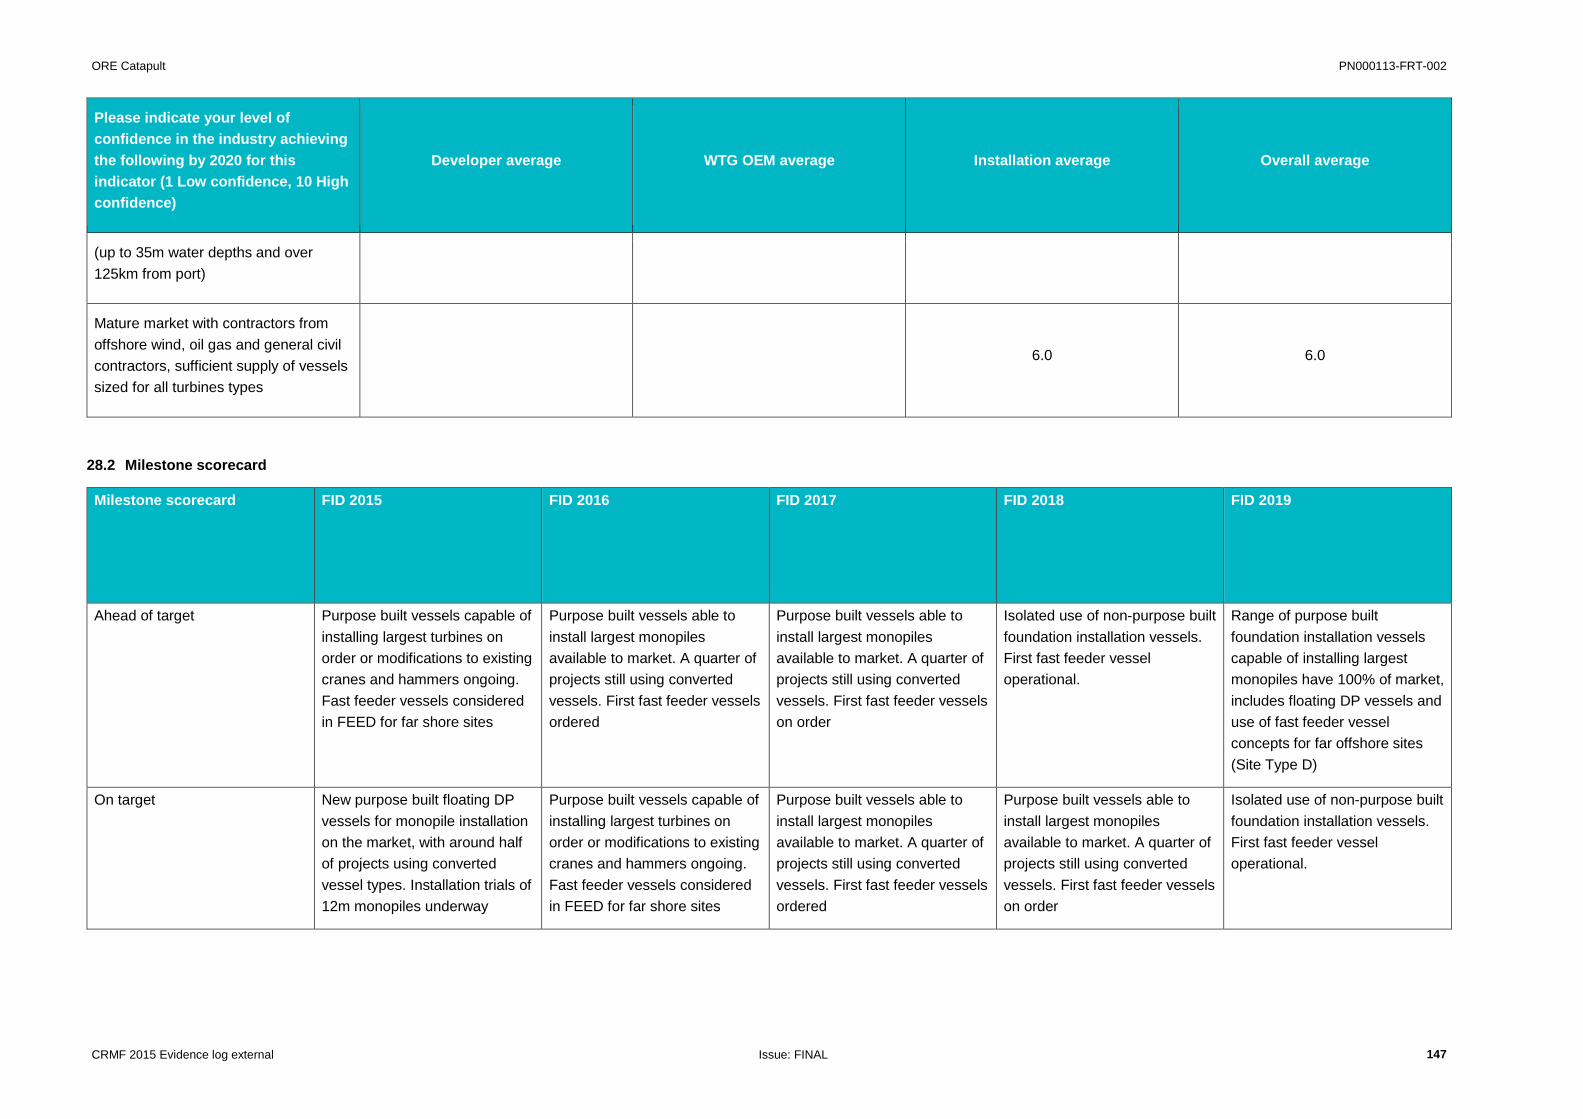
ORE Catapult PN000113-FRT-002
CRMF 2015 Evidence log external Issue: FINAL 147
Please indicate your level of
confidence in the industry achieving
the following by 2020 for this
indicator (1 Low confidence, 10 High
confidence)
Developer average WTG OEM average Installation average Overall average
(up to 35m water depths and over
125km from port)
Mature market with contractors from
offshore wind, oil gas and general civil
contractors, sufficient supply of vessels
sized for all turbines types
6.0 6.0
28.2 Milestone scorecard
Milestone scorecard FID 2015 FID 2016 FID 2017 FID 2018 FID 2019
Ahead of target Purpose built vessels capable of
installing largest turbines on
order or modifications to existing
cranes and hammers ongoing.
Fast feeder vessels considered
in FEED for far shore sites
Purpose built vessels able to
install largest monopiles
available to market. A quarter of
projects still using converted
vessels. First fast feeder vessels
ordered
Purpose built vessels able to
install largest monopiles
available to market. A quarter of
projects still using converted
vessels. First fast feeder vessels
on order
Isolated use of non-purpose built
foundation installation vessels.
First fast feeder vessel
operational.
Range of purpose built
foundation installation vessels
capable of installing largest
monopiles have 100% of market,
includes floating DP vessels and
use of fast feeder vessel
concepts for far offshore sites
(Site Type D)
On target New purpose built floating DP
vessels for monopile installation
on the market, with around half
of projects using converted
vessel types. Installation trials of
12m monopiles underway
Purpose built vessels capable of
installing largest turbines on
order or modifications to existing
cranes and hammers ongoing.
Fast feeder vessels considered
in FEED for far shore sites
Purpose built vessels able to
install largest monopiles
available to market. A quarter of
projects still using converted
vessels. First fast feeder vessels
ordered
Purpose built vessels able to
install largest monopiles
available to market. A quarter of
projects still using converted
vessels. First fast feeder vessels
on order
Isolated use of non-purpose built
foundation installation vessels.
First fast feeder vessel
operational.

ORE Catapult PN000113-FRT-002
CRMF 2015 Evidence log external Issue: FINAL 148
Behind target New purpose built floating DP
vessels for monopile installation
on the market, with around half
of projects using converted
vessel types
New purpose built floating DP
vessels for monopile installation
on the market, with around half
of projects using converted
vessel types. Installation trials of
12m monopiles underway
Purpose built vessels capable of
installing largest turbines on
order or modifications to existing
cranes and hammers ongoing.
Fast feeder vessels considered
in FEED for far shore sites
Purpose built vessels able to
install largest monopiles
available to market. A quarter of
projects still using converted
vessels. First fast feeder vessels
ordered
Purpose built vessels able to
install largest monopiles
available to market. A quarter of
projects still using converted
vessels. First fast feeder vessels
on order
Missed target Slow introduction of new
vessels, with significant teething
issues and no increase in Hs
Slow introduction of new
vessels, with significant teething
issues and no increase in Hs.
No designs for larger vessels
being developed.
New purpose built floating DP
vessels for monopile installation
on the market, with around half
of projects using converted
vessel types. Installation trials of
12m monopiles underway
Purpose built vessels capable of
installing largest turbines on
order or modifications to existing
cranes and hammers ongoing.
Fast feeder vessels considered
in FEED for far shore sites
Purpose built vessels able to
install largest monopiles
available to market. A quarter of
projects still using converted
vessels. First fast feeder vessels
ordered
28.3 Evidence
28.3.1 Questionnaires
Category Questionnaire response
Do you plan to charter purpose built (e.g. DP) vessels for monopile installation? If so, state when supply contracts are likely to be placed.
Dev • N/A – we are not installing monopiles on any of our near term projects
Dev We are not planning Monopile installation.
Dev N/A. No monopiles
Dev No
What is the operational weather window (m Hs) that you would consider reasonable for installation now for jack up vessels to install monopiles?
Dev 1.5
Installation Not our core business
Installation Weather window is a combination of weather conditions and time. On weather conditions you need to consider both wave height and period as well as tidal conditions, wind conditions, directionality, etc. [Installation] is one of the industry’s leading players for monopile installation and we are doing it from floating vessels not jack-ups. The latest XL monopiles for the new generation of larger turbines in slightly deeper water are proving too heavy for most jack-ups to install.
Do you believe that the vessel characteristics offered by the supply chain meet your current and future monopile installation needs? Please explain your answer.
Dev • N/A – we are not installing monopiles on any of our near term projects
Dev not applicable
Dev Most monopile vessels would not be appropriate for heavy monopiles
Dev No. There are only a few vessels capable of installing later MPs

ORE Catapult PN000113-FRT-002
CRMF 2015 Evidence log external Issue: FINAL 149
Category Questionnaire response
What foundation installation vessels are your customers considering for their project(s)? Are these requirements driving innovation in new vessels?
Installation To my opinion the one that has the best balance in reasonable day rate and prove track record.
Installation Not seeing a lot of innovation in new vessels in the recent times. The offshore wind market has not materialised as those companies that invested in jack-ups in 2010-2013 expected. There has been almost no investment in specialised installation vessels since them. At the same time the size of foundations has increased to the point where many of the vessels that were built in 2010-2013 are effectively redundant for foundation installation. At the same time vessel owners with an oil and gas background are now mostly in survival mode and likely to be so for the next couple of years.
28.3.2 Interview
Category Interview response
Do you plan to charter purpose built (e.g. DP) vessels for monopile installation? If so, state when supply contracts are likely to be placed.
Dev • Yes [Dev] already charter these.
What is the operational weather window (m Hs) that you would consider reasonable for installation now for jack up vessels to install monopiles?
Installation Current size of monopile is no longer an [Installation] vessel market due to size/weight. - Market comment: one of the biggest limitations is the transit of ~1000t monopiles through the splash zone where significant energy must be damped and absorbed – this is a big technical challenge and is often what defines the weather limits for monopile installation - XL monopiles and foundations in general there is a potential for a market pinch in vessel supply as very few of current fleet of vessels are capable.
Dev • No specific comment on a hard limit. • In general the capability of the vessel will drive this weather limit. • In the present climate 2m Hs is about standard, and while it is possible to go beyond this, a significantly increased capability in weather for installation probably means that the vessel has been over-specified (and hence is not the most cost efficient way to complete the installation).
Dev • Main constraint for construction is seen to be wave height during transit to site.
Do you believe that the vessel characteristics offered by the supply chain meet your current and future monopile installation needs? Please explain your answer.
Dev • Yes they do, there might be some room for improvements in small areas, cranes etc. but generally they do not struggle to obtain adequate vessels. • However when considering the largest monopiles it does limit field of players in vessel supply. • In general everything around the market for vessels has over supply (and hence strong competition) at the moment. • If this does not increase when activity picks up then cost reduction will result, but it is foreseeable that vessel rates may climb again as more projects look for installation windows 2017 and beyond.
Dev - Market is more competitive now than it was. There is always a challenge to find the availability for a vessel that you need, but in general vessel capacity is there. Have to be willing to commit quite far in advance to get the vessel you need at a time you need. - There may be some competition with Germany, France etc. for vessels (and other supply chain key pieces) now, which was not there when UK was such a dominant market. Demand growth in the wider European industry may make the picture for UK projects slightly different in near future.
What foundation installation vessels are your customers considering for their project(s)? Are these requirements driving innovation in new vessels?
Installation See a very strong change into floating foundations - A couple of developers are pushing this for commercial scale wind farms. DP vessels requested and standard anchor handlers.

ORE Catapult PN000113-FRT-002
CRMF 2015 Evidence log external Issue: FINAL 150
28.3.3 Market intelligence
28.3.4 Monopile installation vessels
This table lists vessels known to have installed monopile foundations since 2010. Earlier projects are not included as significantly smaller and lighter foundations were used which are of limited relevance to the
market today. Floating and jack-up vessels are included. The listed project experience has not been limited to monopile installation, several vessels have been used for both turbine and foundation installation.
Evidence Source
None for this indicator
Vessel Type Company Vessel Name Crane max Working depth / leg
length (m)
Windfarm Experience Year built
Heavy Lift Vessel (self-
Propelled)
Van Oord
(acquired vessel in 2015
from Ballast Needam)
Svanen 8,200t n/a Sheringham Shoal (2010),
Anholt (2011), London
Array Phase 1 (2011),
Walney Phase 2 (2011),
Amrumbank West (2013),
EnBW Baltic 2 (2013),
Belwind (2010), Gunfleet
Sands, Butendiek (2014),
Westermeerwind (2015).
Planned for Burbo Bank
Extension foundations
(2016)
1991
Heavy Lift Vessel (self-
Propelled)
Seaway Heavy lifting Stanislav Yudin 2,500t n/a Global Tech 1, Sandbank
2016), Borkum Phase1,
Baltic 2, Anholt, Greater
Gabbard, Gwnt y Mor,
Westernmost Rough,
1985
Heavy Lift Vessel (self-
Propelled)
Seaway Heavy Lifting Oleg Strashnov 5,000t n/a Sheringham Shoal (2010)
Trianel Borkum Phase 1 (
2011), Riffgat (2012), Dan
Tysk, Meerwind Ost/Sud,
Borkum Phase 1, Greater
Gabbard, Walney
2011

ORE Catapult PN000113-FRT-002
CRMF 2015 Evidence log external Issue: FINAL 151
Extension. Planned for
Dudgeon (2016)
Jack up vessel (self-
propelled)
DEME/ Geosea Innovation 1,500t Xx / 89 Global Tech I,
Westernmost Rough
(2014), Gode Wind 1 & 2
(2015) - foundations,
WODS, Westernmost
Rough,
2012
Jack up vessel (self-
propelled)
DEME/ Geosea Goliath 400t Xx / 78.8 Thornton Bank Phase 3
(2013) - Turbines
Walney Phase 1 (2010) -
Foundations
2009
Jack up vessel (self-
propelled)
DEME / Geosea Neptune 600t Xx / 80 (extendable to 92) Thornton Bank Phase 3
(2013), Northwind (2013- T
& F), Trianel Borkum
Phase 1(2013), EnBW
Baltic 2 (2014), Kentish
Flats Extension (2015 - T &
F)
2012
Jack up vessel (self-
propelled)
MPI MPI Adventure 1,000t 40m / xx London Array Phase 1
(2011 - Foundations),
Teesside (2012), Humber
Gateway, Borkum Phase 1
, Amrumbank West (2015),
Sandbank (2015)
2011
Jack up vessel (self-
propelled)
MPI MPI Discovery 1,000t 40m / xx London Array Phase 1
(2011), Lincs (2012),
Amrumbank West (2013 -
Foundations), Karehamn
(2013), Humber Gateway
(2013/14 F & T)
2011
Jack up vessel (self-
propelled)
MPI MPI Resolution 600t 35m / xx Lincs (2011/12 - F & T),
Humber Gateway (2013 -
Foundations)
2004

ORE Catapult PN000113-FRT-002
CRMF 2015 Evidence log external Issue: FINAL 152
Jack up vessel (self-
propelled)
MPI MPI Enterprise (was
RWE’s Victoria Mathias)
800t 45m / xx Amrumbank West (2015) ,
Nordsee Ost (2012)
2011
Jack up vessel (self-
propelled)
SeaJacks Seajacks Leviathan 400t Greater Gabbard (2010),
Sheringham Shoal (2011),
Walney Phase 2(2011),
Meerwind Ost/Sud (2013),
Humber Gateway
2009
Jack up vessel (self-
propelled)
SeaJacks Seajacks Zaratan 800t Meerwind Ost/Sud (2013 -
F & T), Gunfleet Sands
2012
Jack up vessel (self-
propelled)
SeaJacks Seajacks Hydra 400t Global Tech 1 2014
Jack up vessel (self-
propelled)
SeaJacks Seajacks Scylla 1,500t 65m / 105m Scheduled for Veja Mate
(2016 F) and Walney
Extension (2017 T)
2015
Jack up vessel (self-
propelled)
Swire Blue Ocean Pacific Orca 1,200t 65m / 105m WoDS (2013 ), Borkum
Riffgrund 1 (2014) -
foundations Sandbank
2012
Jack up vessel (self-
propelled)
Swire Blue Ocean Pacific Osprey 1,200t 65m / 105m Belwind Haliade Demo
(2013) - foundations, Dan
Tysk (2014) - Turbines
Horns Rev , Gemini, Burbo
Bank, Rhyl Flats, Walney I
& II
2012
Jack up vessel (self-
propelled)
Van Oord Aeolus 990t 55 / 81m Eneco Luchterdein (2015 -
F & T), Gemini (2015 - F &
T)
2014
Jack up vessel (self-
propelled)
Workfox BV Seafox 5 1,200t 65m / xx Dan Tysk (2013 F) 2012

ORE Catapult PN000113-FRT-002
CRMF 2015 Evidence log external Issue: FINAL 153
Note: this table does not include installation projects prior to 2010 where monopole foundations were typically significantly smaller and lighter.
28.4 Additional comments
None for this indicator
28.5 Recommendations
None for this indicator
Jack up vessel (self-
propelled)
Jan De Nuul Vidar 1,200t 50m / 90m Global Tech 1, EnBW
Baltic 2, planned for
Nobelwind (2016/17 F & T)
2013

ORE Catapult PN000113-FRT-002
CRMF 2015 Evidence log external Issue: FINAL 154
29 Improvements in operational weather windows for monopile installation
CRMF workstream Level 1 indicator Level 2 indicator Level 3 indicator
Technology Installation Support structures Improvements in operational weather windows for
monopile installation
29.1 Summary Analysis
Finding: Ahead of target
This indicator has been assessed as ‘ahead of target’ for 2015. The operational weather limit target of 1.7m Hs for 2015 appears to have been met and likely exceeded on some projects.
Last year this indicator was also rated as ‘ahead of target’ noting reasonable consensus that 1.5m Hs was achievable.
Questionnaire and interview evidence gave several references to limits of 1.5 – 2.0m Hs already being considered ‘standard practice’. A subtlety was also described; projects are unlikely to operate to a single
fixed limit for the duration, typically construction will start with a conservative limit of 1.0m Hs or even lower and the safe working limit will gradually increase as team and equipment gain project specific
experience. The various tasks associated with the installation process may also have differing weather limits, e.g. transit, jacking, splash zone entry, and pile driving.
Outlook: Industry score 6.3
The cautiously optimistic score is sensible for this indicator. While there has been good progress to date, further increases are less likely because:
A significant increase may require investment in new vessels, which at present looks unlikely. See section 28 and 50 for more information on installation vessels.
Some of the improvements through innovation may be required to ‘break even’ and maintain existing limits as monopile size and weights continue to increase. There remains a significant technical
challenge in damping the energy as XL monopile foundations are lowered from vessels through the splash zone, it is likely that this will continue to challenge available technology and require new
technology in future.
Developers see diminishing returns available from pushing vessel significant wave height limits, as several other factors also limit installation weather windows. A working limit of between 2.0 – 2.5m Hs
may be sufficient to offer adequate installation weather windows as, above this, other factors (e.g. wind speed) may drive the operational limit for lifting operations.
Please indicate your level of confidence in the industry
achieving the following by 2020 for this indicator (1 Low
confidence, 10 High confidence)
Developer average WTG OEM average Installation average Overall average
Operational weather window limit for monopile installation will Increase to near 2.5m Hs
6.3 6.3
Mature market with contractors from offshore wind, oil gas and
general civil contractors, sufficient supply of vessels sized for all
turbines types
6.0 6.0
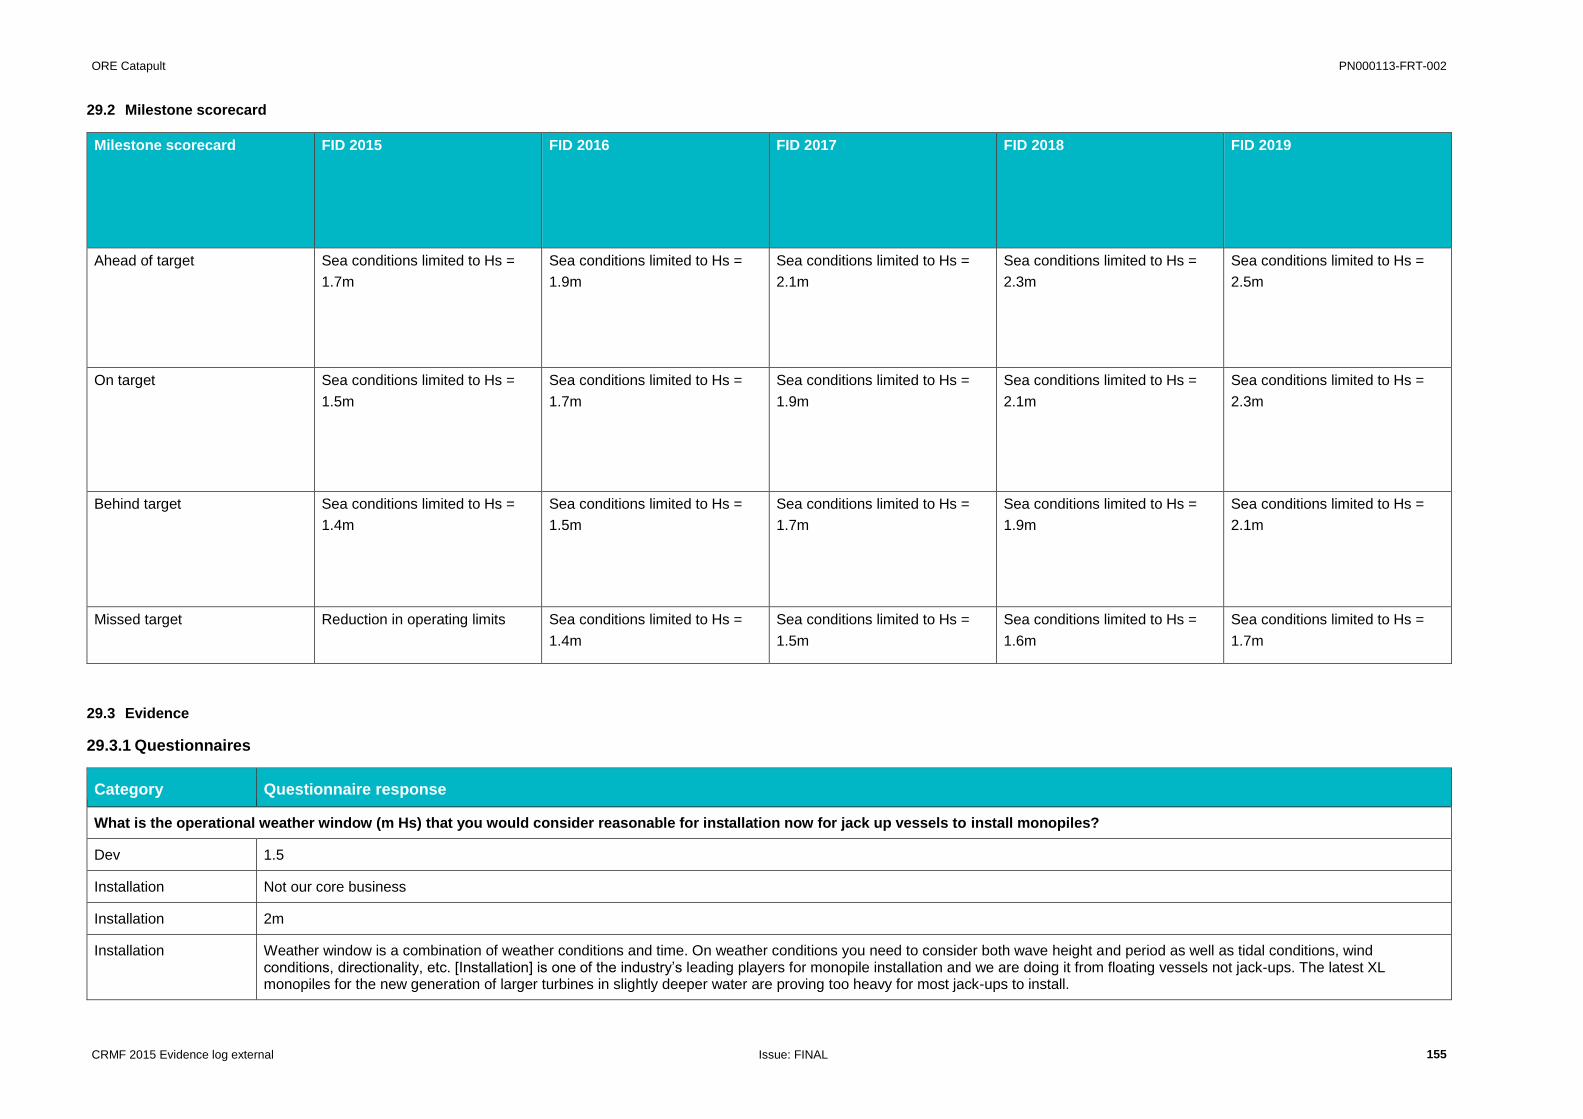
ORE Catapult PN000113-FRT-002
CRMF 2015 Evidence log external Issue: FINAL 155
29.2 Milestone scorecard
Milestone scorecard FID 2015 FID 2016 FID 2017 FID 2018 FID 2019
Ahead of target Sea conditions limited to Hs =
1.7m
Sea conditions limited to Hs =
1.9m
Sea conditions limited to Hs =
2.1m
Sea conditions limited to Hs =
2.3m
Sea conditions limited to Hs =
2.5m
On target Sea conditions limited to Hs =
1.5m
Sea conditions limited to Hs =
1.7m
Sea conditions limited to Hs =
1.9m
Sea conditions limited to Hs =
2.1m
Sea conditions limited to Hs =
2.3m
Behind target Sea conditions limited to Hs =
1.4m
Sea conditions limited to Hs =
1.5m
Sea conditions limited to Hs =
1.7m
Sea conditions limited to Hs =
1.9m
Sea conditions limited to Hs =
2.1m
Missed target Reduction in operating limits Sea conditions limited to Hs =
1.4m
Sea conditions limited to Hs =
1.5m
Sea conditions limited to Hs =
1.6m
Sea conditions limited to Hs =
1.7m
29.3 Evidence
29.3.1 Questionnaires
Category Questionnaire response
What is the operational weather window (m Hs) that you would consider reasonable for installation now for jack up vessels to install monopiles?
Dev 1.5
Installation Not our core business
Installation 2m
Installation Weather window is a combination of weather conditions and time. On weather conditions you need to consider both wave height and period as well as tidal conditions, wind conditions, directionality, etc. [Installation] is one of the industry’s leading players for monopile installation and we are doing it from floating vessels not jack-ups. The latest XL monopiles for the new generation of larger turbines in slightly deeper water are proving too heavy for most jack-ups to install.

ORE Catapult PN000113-FRT-002
CRMF 2015 Evidence log external Issue: FINAL 156
Category Questionnaire response
Do you believe that the vessel characteristics offered by the supply chain meet your current and future monopile installation needs? Please explain your answer.
Dev • N/A – we are not installing monopiles on any of our near term projects
Dev not applicable
Dev Most monopile vessels would not be appropriate for heavy monopiles
What foundation installation vessels are your customers considering for their project(s)? Are these requirements driving innovation in new vessels?
Installation To my opinion the one that has the best balance in reasonable day rate and prove track record.
Installation crane capacity >1200t
Installation Not seeing a lot of innovation in new vessels in the recent times. The offshore wind market has not materialised as those companies that invested in jack-ups in 2010-2013 expected. There has been almost no investment in specialised installation vessels since them. At the same time the size of foundations has increased to the point where many of the vessels that were built in 2010-2013 are effectively redundant for foundation installation. At the same time vessel owners with an oil and gas background are now mostly in survival mode and likely to be so for the next couple of years.
29.3.2 Interview
Category Interview response
What is the operational weather window (m Hs) that you would consider reasonable for installation now for jack up vessels to install monopiles?
Installation Current size of monopile is no longer an [Installation] vessel market due to size/weight. - Market comment: one of the biggest limitations is the transit of ~1000t monopiles through the splash zone where significant energy must be damped and absorbed – this is a big technical challenge and is often what defines the weather limits for monopile installation - XL monopiles and foundations in general there is a potential for a market pinch in vessel supply as very few of current fleet of vessels are capable.
Dev • No specific comment on a hard limit. • In general the capability of the vessel will drive this weather limit. • In the present climate 2m Hs is about standard, and while it is possible to go beyond this, a significantly increased capability in weather for installation probably means that the vessel has been over-specified (and hence is not the most cost efficient way to complete the installation).
Do you believe that the vessel characteristics offered by the supply chain meet your current and future monopile installation needs? Please explain your answer.
Dev • Yes they do, there might be some room for improvements in small areas, cranes etc. but generally they do not struggle to obtain adequate vessels. • However when considering the largest monopiles it does limit field of players in vessel supply. • In generally everything around the market for vessels has over supply (and hence strong competition) at the moment. • If this does not increase when activity picks up then cost reduction will result, but it is foreseeable that vessel rates may climb again as more projects look for installation windows 2017 and beyond.
Dev - Market is more competitive now than it was. There is always a challenge to find the availability for a vessel that you need, but in general vessel capacity is there. Have to be willing to commit quite far in advance to get the vessel you need at a time you need. - There may be some competition with Germany, France etc. for vessels (and other supply chain key pieces) now, which was not there when UK was such a dominant market. Demand growth in the wider European industry may make the picture for UK projects slightly different in near future.
What foundation installation vessels are your customers considering for their project(s)? Are these requirements driving innovation in new vessels?
Installation See a very strong change into floating foundations - A couple of developers are pushing this for commercial scale wind farms. DP vessels requested and standard anchor handlers.

ORE Catapult PN000113-FRT-002
CRMF 2015 Evidence log external Issue: FINAL 157
29.3.3 Market intelligence
29.4 Additional comments
The specific weather limits for transit, jacking, pile gripper and pile driving activities will all vary and will have different impacts on overall weather windows and programme.
29.5 Recommendations
None for this indicator
Evidence Source
The MPI enterprise is stated as being capable of jacking operations in a significant wave height of 2m, note that this is distinct from installation task (such as crane
operations) limits.
https://www.vroon.nl/Files/VesselParticulars
/MPI%20ENTERPRISE20150506115830.p
df

ORE Catapult PN000113-FRT-002
CRMF 2015 Evidence log external Issue: FINAL 158
30 Purpose built jacket installation vessels
CRMF workstream Level 1 indicator Level 2 indicator Level 3 indicator
Technology Installation Support structures Purpose built jacket installation vessels
30.1 Summary Analysis
Finding: Behind target
This indicator is found to be ‘behind target’. This reflects the fact that vessels available on the market are able to take up to 3 jackets for 6MW turbines, and while new large jack up vessels (e.g. Scylla) are
coming into the market, the move to next generation floating DP vessels has not materialised and the foundation installation vessel market remains largely unchanged from last year.
Last year this indicator was found to be ‘on target’ and it was noted that as there was no visibility of a change to the situation, this indicator would be likely to fall behind this year. Existing concepts were
highlighted (W3G OWTIS).
Questionnaire and interview evidence confirmed:
That there is a limited selection of vessels available with the capacity to install several jacket foundations and/or to operate in deeper (>40m) water.
Existing vessels (floating and jack up) are known to have carried 3 tripod foundations simultaneously.
Concepts for larger floating DP vessels which would be capable of taking more jackets exist, including W3G OWTIS and the Global Maritime Hexabase system.However, there is no evidence of these
concepts moving beyond the concept stage. There is some evidence that vessel designers and manufacturers are interested in progressing larger floating DP vessels, pending investment by a vessel
operator.
Outlook: Industry score 5.8
ORE Catapult opinion is that this industry score is optimistic. In order for new vessels to be serving the market in 2020 detailed designs and construction contracts would be required in the near future and there is
no evidence of progress beyond concept stage at present.
Due to visibility of only a small pipeline of potential projects, the investment required to commission a new generation of floating DP foundation installation vessels looks unlikely. As such this indicator is expected
to slip further to ‘missed target’ next year. If all planned projects proceed, there is likely to be a spike in demand for jacket installation vessels in the European market in 2017 – 2019. Looking further ahead, the
trend for increasing foundation dimensions may eventually necessitate a new installation vessel, once the capabilities of the existing fleet are exceeded. It looks likely that the industry will continue to rely on
existing vessels up to 2020.
Please indicate your level of confidence in the
industry achieving the following by 2020 for
this indicator (1 Low confidence, 10 High
confidence)
Developer average Installation average Overall average
Large floating DP vessels able to take around six
jackets for 6MW class turbines 5.8 5.8

ORE Catapult PN000113-FRT-002
CRMF 2015 Evidence log external Issue: FINAL 159
Please indicate your level of confidence in the
industry achieving the following by 2020 for
this indicator (1 Low confidence, 10 High
confidence)
Developer average Installation average Overall average
Mature market with contractors from offshore
wind, oil gas and general civil contractors,
sufficient supply of vessels sized for all turbines
types
6.0 6.0
30.2 Milestone scorecard
Milestone scorecard FID 2015 FID 2016 FID 2017 FID 2018 FID 2019
Ahead of target Large floating DP vessel
ordered able to take 6 x 6MW
jackets
At least one more large floating
DP vessels ordered able to carry
6 jackets for 6MW turbines
New large floating DP vessels
commissioned and successfully
completes first season of
installation
Second large floating DP
vessels commissioned and
successfully completes first
season of installation. First large
vessel operating well.
Large floating DP vessels able
to take around six jackets for
6MW class turbines used by
over half of projects constructed
this year
On target Designs for large floating DP
vessels well progressed.
Ongoing installation using
vessels which can carry 4
jackets suitable for 6MW
turbines
Large floating DP vessel
ordered able to take 6 x 6MW
jackets
At least one more large floating
DP vessels ordered able to carry
6 jackets for 6MW turbines
New large floating DP vessels
commissioned and successfully
completes first season of
installation
Second large floating DP
vessels commissioned and
successfully completes first
season of installation. First large
vessel operating well.
Behind target New vessels available able to
take 3 jackets suitable for 6MW
turbines
Designs for large floating DP
vessels well progressed.
Ongoing installation using
vessels which can carry 4
jackets suitable for 6MW
turbines
Large floating DP vessel
ordered able to take 6 x 6MW
jackets
At least one more large floating
DP vessels ordered able to carry
6 jackets for 6MW turbines
New large floating DP vessels
commissioned and successfully
completes first season of
installation
Missed target No progress. Only vessels available are able
to take 3 jackets suitable for
6MW turbines
Designs for large floating DP
vessels well progressed.
Ongoing installation using
vessels which can carry 4
Only one large floating DP
vessel ordered able to take 6 x
6MW jackets
At least one more large floating
DP vessels ordered able to carry
6 jackets for 6MW turbines

ORE Catapult PN000113-FRT-002
CRMF 2015 Evidence log external Issue: FINAL 160
jackets suitable for 6MW
turbines
30.3 Evidence
30.3.1 Questionnaires
Category Questionnaire response
Do you plan to charter purpose built jacket vessels? If so, state when supply contracts are likely to be placed. Do you believe that the vessel characteristics offered by the supply chain meet your current and future jacket installation needs? Please explain your answer.
Dev • Potentially, subject to live tender process which will conclude in 2016 • There is limited capability within the existing vessel fleet to install jacket foundations in water depths exceeding 40 metres
Dev Yes, early engagement before CfD and then contract completed during final investment decision. Yes, installation and manufacturer are the same so the vessel was incorporated into the design of the jacket.
Dev No n/a
What foundation installation vessels are your customers considering for their project(s)? Are these requirements driving innovation in new vessels?
Installation To my opinion the one that has the best balance in reasonable day rate and prove track record.
Installation crane capacity >1200t
Installation Not seeing a lot of innovation in new vessels in the recent times. The offshore wind market has not materialised as those companies that invested in jack-ups in 2010-2013 expected. There has been almost no investment in specialised installation vessels since them. At the same time the size of foundations has increased to the point where many of the vessels that were built in 2010-2013 are effectively redundant for foundation installation. At the same time vessel owners with an oil and gas background are now mostly in survival mode and likely to be so for the next couple of years.
30.3.2 Interview
Category Interview response
What is the operational weather window (m Hs) that you would consider reasonable for installation now for jack up vessels to install monopiles?
Installation Current size of monopile is no longer an [Installation] vessel market due to size/weight. - Market comment: one of the biggest limitations is the transit of ~1000t monopiles through the splash zone where significant energy must be damped and absorbed – this is a big technical challenge and is often what defines the weather limits for monopile installation - XL monopiles and foundations in general there is a potential for a market pinch in vessel supply as very few of current fleet of vessels are capable.
Dev • No specific comment on a hard limit. • In general the capability of the vessel will drive this weather limit. • In the present climate 2m Hs is about standard, and while it is possible to go beyond this, a significantly increased capability in weather for installation probably means that the vessel has been over-specified (and hence is not the most cost efficient way to complete the installation).
Do you believe that the vessel characteristics offered by the supply chain meet your current and future monopile installation needs? Please explain your answer.

ORE Catapult PN000113-FRT-002
CRMF 2015 Evidence log external Issue: FINAL 161
30.3.3 Market intelligence
30.3.4 Jacket installation vessels
This table lists vessels known to have installed jacket foundations. Floating and jack-up vessels are included. The listed project experience has not been limited to jacket installation, several vessels have been
used for both turbine and foundation installation.
Do you believe that the vessel characteristics offered by the supply chain meet your current and future jacket installation needs? Please explain your answer.
Dev • Yes they do, there might be some room for improvements in small areas, cranes etc. but generally they do not struggle to obtain adequate vessels. • However when considering the largest monopiles it does limit field of players in vessel supply. • In generally everything around the market for vessels has over supply (and hence strong competition) at the moment. • If this does not increase when activity picks up then cost reduction will result, but it is foreseeable that vessel rates may climb again as more projects look for installation windows 2017 and beyond.
Dev - Market is more competitive now than it was. There is always a challenge to find the availability for a vessel that you need, but in general vessel capacity is there. Have to be willing to commit quite far in advance to get the vessel you need at a time you need. - There may be some competition with Germany, France etc. for vessels (and other supply chain key pieces) now, which was not there when UK was such a dominant market. Demand growth in the wider European industry may make the picture for UK projects slightly different in near future.
Dev • Offshore wind alliance from the beginning, where framework of suppliers working on pipeline of [COMPANY] projects, [COMPANY] to undertake marine installation. Intial development went well but then financial setup demanded to reduce number of interfaces so changed to 3 EPC – [COMPANY] now installation contractor for BoP. [COMPANY] selecting vessels for wind turbine installation but only 2 vessels possible to install the [PRODUCT] Confident that more competition would enable the wider industry but already know using [COMPANY] vessels. • Difficult change to 3 EPC and still feeling effects. Sole sourced to the EPCs now so big changes organisationally and tone of engagement with contractors. Still feeling effects of this. Short term focus (no big pipeline of projects) means that no commercial leverage over the alliance so fewer contract packages has led to less risk but likley pushed down supply chain in form of cost.
What foundation installation vessels are your customers considering for their project(s)? Are these requirements driving innovation in new vessels?
Installation See a very strong change into floating foundations - A couple of developers are pushing this for commercial scale wind farms. DP vessels requested and standard anchor handlers.
Evidence Source
Samsung Heavy Industries Co. Ltd. (SHI) is designing an innovative vessel for Wind Turbine (WT) service/installation which aims to significantly reduce LCOE.
The development is in progress and patent applications have been filed for certain elements of the design. SHI and ORE Catapult are collaborating to initiate a
project of design, research and development activities needed for the development of this new WT installation concept. The R&D project will involve several of the
main WT installation/vessel operators.
Vessel Type Company Vessel Name Crane max Working depth / leg
length (m)
Windfarm Experience Year built
Heavy Lift Barge (un
propelled)
DEME (was Scaldis) Rambiz 3000 3,300t n/a Thornton Bank Phase 1, 2
& 3, Borkum Riffgrund,
Amrumbank West, Nordsee
Ost, Butendiek, Baltic 2,
1976
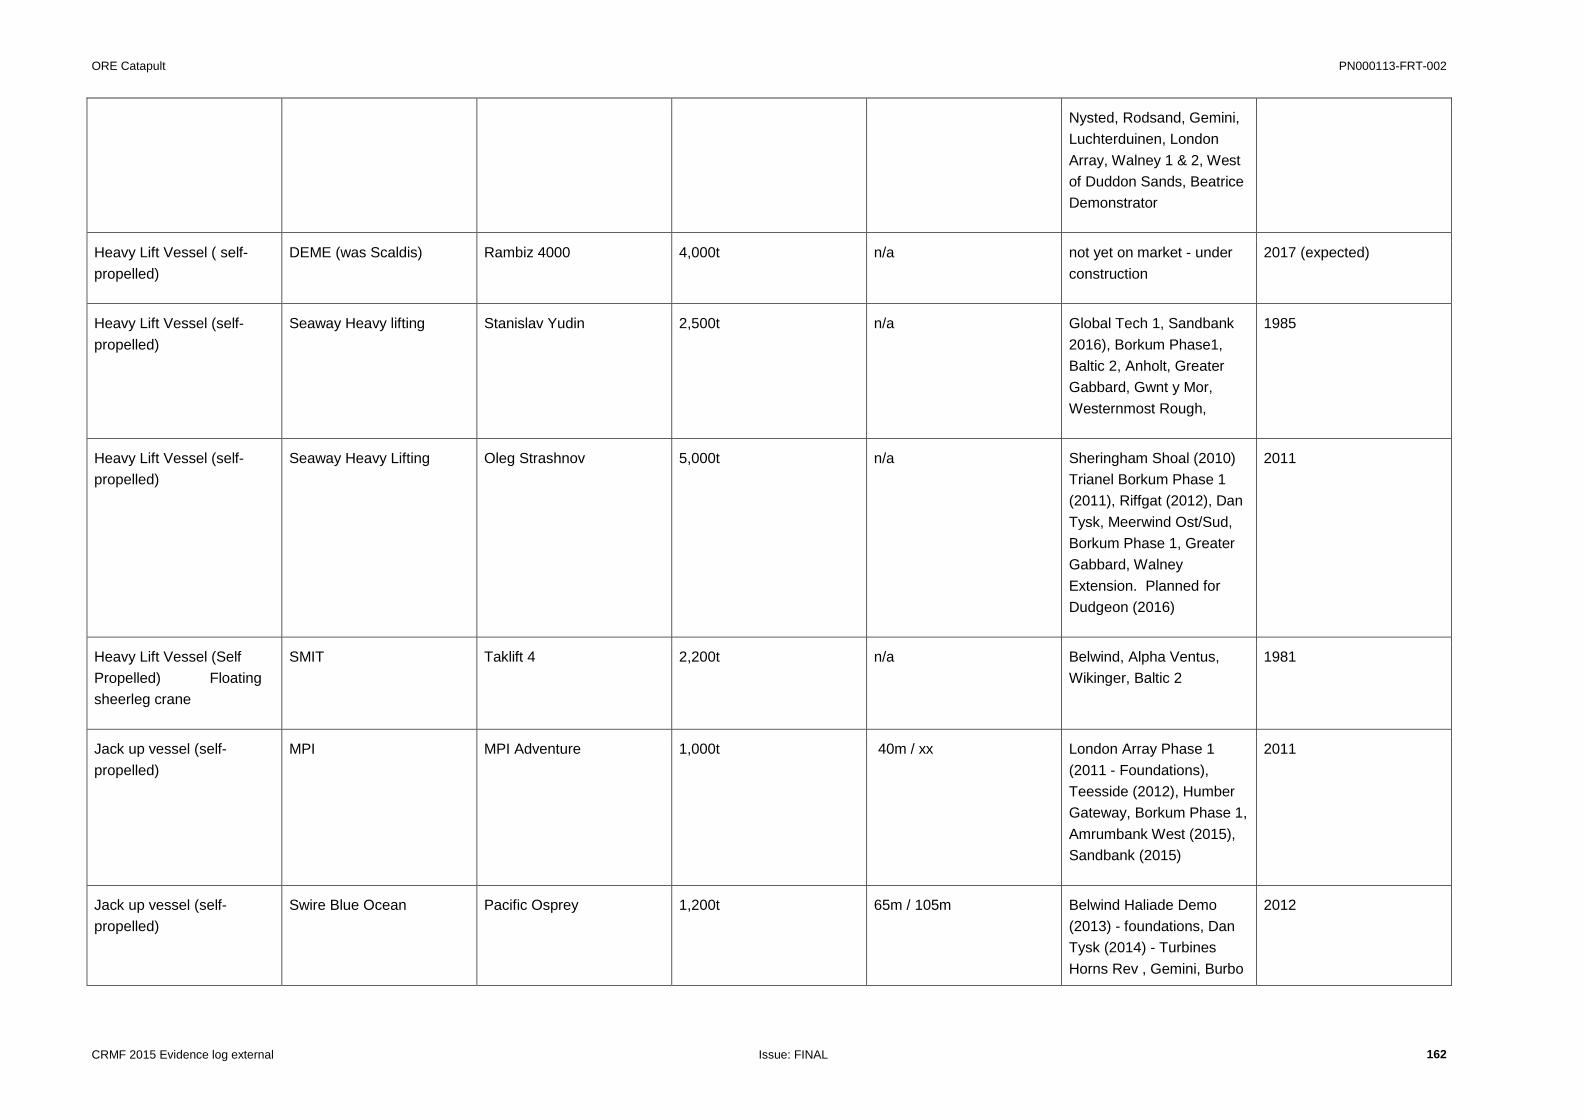
ORE Catapult PN000113-FRT-002
CRMF 2015 Evidence log external Issue: FINAL 162
Nysted, Rodsand, Gemini,
Luchterduinen, London
Array, Walney 1 & 2, West
of Duddon Sands, Beatrice
Demonstrator
Heavy Lift Vessel ( self-
propelled)
DEME (was Scaldis) Rambiz 4000 4,000t n/a not yet on market - under
construction
2017 (expected)
Heavy Lift Vessel (self-
propelled)
Seaway Heavy lifting Stanislav Yudin 2,500t n/a Global Tech 1, Sandbank
2016), Borkum Phase1,
Baltic 2, Anholt, Greater
Gabbard, Gwnt y Mor,
Westernmost Rough,
1985
Heavy Lift Vessel (self-
propelled)
Seaway Heavy Lifting Oleg Strashnov 5,000t n/a Sheringham Shoal (2010)
Trianel Borkum Phase 1
(2011), Riffgat (2012), Dan
Tysk, Meerwind Ost/Sud,
Borkum Phase 1, Greater
Gabbard, Walney
Extension. Planned for
Dudgeon (2016)
2011
Heavy Lift Vessel (Self
Propelled) Floating
sheerleg crane
SMIT Taklift 4 2,200t n/a Belwind, Alpha Ventus,
Wikinger, Baltic 2
1981
Jack up vessel (self-
propelled)
MPI MPI Adventure 1,000t 40m / xx London Array Phase 1
(2011 - Foundations),
Teesside (2012), Humber
Gateway, Borkum Phase 1,
Amrumbank West (2015),
Sandbank (2015)
2011
Jack up vessel (self-
propelled)
Swire Blue Ocean Pacific Osprey 1,200t 65m / 105m Belwind Haliade Demo
(2013) - foundations, Dan
Tysk (2014) - Turbines
Horns Rev , Gemini, Burbo
2012

ORE Catapult PN000113-FRT-002
CRMF 2015 Evidence log external Issue: FINAL 163
30.4 Additional comments
None for this indicator
30.5 Recommendations
None for this indicator
Bank, Rhyl Flats, Walney I
& II

ORE Catapult PN000113-FRT-002
CRMF 2015 Evidence log external Issue: FINAL 164
31 Flexible sea fastenings
CRMF workstream Level 1 indicator Level 2 indicator Level 3 indicator
Technology Installation Support structures Flexible sea fastenings
31.1 Summary Analysis
Finding: Behind target
This indicator is ‘behind target’, concepts for flexible sea fastenings for jackets do exist, but roll out and use has not happened.
Last year this indicator was also rated as ‘behind target’, noting that the jacket market has to date remained small, and that existing concepts for flexible systems were yet to be deployed.
Industry engagement provided evidence of:
A consensus that existing sea fastening practice is not efficient,
Sea fastenings are typically the property of vessel suppliers, as they are fastened to the vessel. Unless the vessel supplier has visibility of a pipeline of subsequent projects for which the fastenings would
be useable, they are not incentivised to retain the sea fastening and they are usually scrapped,
Some members of the supply chain have described work to investigate improvements, but widespread adoption would require cross industry collaboration,
The long term pipeline for jacket foundations is still relatively uncertain.
Outlook: Industry score of 4.8
It is unlikely that the 2020 target for this indicator will be met, driven partly by lack of incentive to standardise and/or by the scale of the jacket foundation market.
An opportunity for cost reduction does remain, as developers, OEMs and the supply chain almost universally agreed that existing sea fastening arrangements are inefficient and wasteful. Technology is not a
major hurdle, and if there was a sufficiently empowered owner driving collaboration, flexible sea fastenings could be used on future projects.
Please indicate your level of confidence in the
industry achieving the following by 2020 for
this indicator (1 Low confidence, 10 High
confidence)
Developer average Installation average Overall average
All jacket installations use flexible sea fastenings 4.3 5.3 4.8

ORE Catapult PN000113-FRT-002
CRMF 2015 Evidence log external Issue: FINAL 165
31.2 Milestone scorecard
Milestone scorecard FID 2015 FID 2016 FID 2017 FID 2018 FID 2019
Ahead of target Flexible sea fastenings being
used by 50% of jacket market
Flexible sea fastenings being
used by 2/3rds of jacket market
90% of jacket market uses
flexible sea fastenings
90% of jacket market uses
flexible sea fastenings
90% of jacket market uses
flexible sea fastenings
On target Flexible sea fastenings have
been developed and are
deployed on a quarter of jacket
installation vessels
Flexible sea fastenings have
been developed and are
deployed on over half of jacket
installation vessels
Flexible sea fastenings being
used by 2/3rds of jacket
installation vessels
90% of jacket installations use
flexible sea fastenings
90% of jacket market use
flexible sea fastenings
Behind target Flexible sea fastenings starting
to be used
Flexible sea fastenings being
used by quarter of the market
Flexible sea fastenings being
used by 50% of jacket market
Flexible sea fastenings being
used by 60% of jacket market
70% of jacket market uses
flexible sea fastenings
Missed target Jacket market very small so very
little use.
Flexible sea fastenings being
used by 20% of jacket market
Flexible sea fastenings being
used by 30% of jacket market
Flexible sea fastenings being
used by 40% of jacket market
Flexible sea fastenings being
used by 50% of jacket market
31.3 Evidence
31.3.1 Questionnaires
Category Questionnaire response
If you are installing jackets, have you used flexible sea fastenings on your chosen installation vessel?
Dev We believe that the use optimized sea fastenings will be beneficial for the project, but expect the supply chain to deliver such improvement.
Dev To be determined during FEED
Dev No just the standard used
Dev n/a
Have you or your customers used flexible sea fastenings on a chosen installation vessel?

ORE Catapult PN000113-FRT-002
CRMF 2015 Evidence log external Issue: FINAL 166
Category Questionnaire response
Installation Don't know.
Installation Yes, we've used all kinds of different sea fastening.
31.3.2 Interview
31.3.3 Market intelligence
31.4 Additional comments
None for this indicator
31.5 Recommendations
The opportunity for industry wide collaboration and improvement in sea fastening may merit investigation. For example, what scale of market would be required to adequately incentivise the
widespread use of flexible sea fastenings?
Category Interview response
Have you or your customers used flexible sea fastenings on a chosen installation vessel?
Dev • Standardisation – need flexible solution as an industry but can only undertake alone if portfolio approach ca be adopted.
Installation [Installation] do design sea fastening to clients requirements - An issue in this area is that sea fastening are typically owned by the vessel owner, and because the vessel owner may or may not have a clear pipeline of future work to use the same equipment subsequently they are usually seen as a one off investment. This probably reduces efficiencies. Cost of sea fastening could be shared across projects if there was more visibility of a future pipeline and/or standardisation in the design.
Installation Minor part of the process - deck layouts is part of the service they offer. Have designed flexible sea fastenings for jackets but not sure if design has been used on vessel
Designer - [Designer] are actively involved in the area of designing alternative or novel installation strategies to better utilise the available vessel fleet/reduce installation barriers/costs.
Evidence Source
None for this indicator

ORE Catapult PN000113-FRT-002
CRMF 2015 Evidence log external Issue: FINAL 167
32 Floating GBS
CRMF workstream Level 1 indicator Level 2 indicator Level 3 indicator
Technology Installation Support structures Floating GBS
32.1 Summary Analysis
Finding: Missed target
The finding for this indicator is that the target has been missed. Whilst offshore met masts are known to have been installed using a floating concrete GBS, no contracts are known to have been placed for trial
tests of floating GBS with turbines. The concept of floating GBS foundations remains one which is actively discussed but there is little evidence of progress towards full scale demonstration in 2015.
Last year pointed to:
The use of (lifted) GBS for certain projects in the Baltic sea;
An OWA study into GBS, the results of which are yet to be published, and;
The ITT issued by EDF for 83 GBS structures in France, the outcome of which is unknown.
Evidence from industry engagement suggested that developers see GBS as being relevant to limited numbers of projects only, but that in at least one instance it is being actively considered where site conditions
are suitable.
The three offshore met masts known to have been installed using a floating concrete GBS are Fecamp (France), Inch Cape (UK) and Moray (UK).
Outlook: Industry score 4.8
ORE Catapult view the outlook score of 4.8 to be optimistic at present (based on current public evidence). In order for a number of commercial scale projects to adopt a floating GBS foundation by 2020,
demonstration and initial project contracts will be required in the near future. Whilst many concepts exist there is limited evidence of developers who are willing to ‘take the plunge’ and commit to GBS
foundations. Commitment will be required soon to achieve the 2020 target, which at present is uncertain. However GBS may be more attractive in future as a means of increasing local content for the benefit of a
projects supply chain plan, and the technology is commonly deployed in other industries.
Please indicate your level of confidence in the industry
achieving the following by 2020 for this indicator (1 Low
confidence, 10 High confidence)
Developer average Overall average
Float out and sink installation is used by 10% of projects in 2020 4.8 4.8

ORE Catapult PN000113-FRT-002
CRMF 2015 Evidence log external Issue: FINAL 168
32.2 Milestone scorecard
Milestone scorecard FID 2015 FID 2016 FID 2017 FID 2018 FID 2019
Ahead of target Successful trial deployment First commercial project
contracts using GBS
First commercial project
contracts using GBS
First commercial project
contracts using GBS
Second project contracts using
GBS, with GBS competitive in
certain site types
On target GBS tests with turbine underway Successful trial deployment with
turbine
First commercial project (outside
Baltic) contracts using GBS
First commercial project
contracts using GBS
GBS starting to be installed on
first commercial, non Baltic
project.
Behind target GBS tests contracted GBS tests underway Successful trial deployment First commercial project
contracts using GBS
First commercial project
contracts using GBS
Missed target GBS tests under discussion GBS tests contracted GBS tests underway Successful trial deployment First commercial project uses
GBS
32.3 Evidence
32.3.1 Questionnaires
Category Questionnaire response
Have you been involved with any trials of floating or lifted concrete gravity base structures? If so, please provide details.
Dev No
Dev We have recently installed a concrete gravity based Met Mast.
Dev No but [COMPANY] have. [PROJECT] plans to trial floating concrete gravity bases.
Dev No

ORE Catapult PN000113-FRT-002
CRMF 2015 Evidence log external Issue: FINAL 169
32.3.2 Interview
32.3.3 Market intelligence
32.4 Additional comments
None for this indicator
32.5 Recommendations
This indicator has continued to slip behind. More detailed analysis may be justified into the applicability of GBS to sites; for example is a goal of 10% of UK sites realistic based on the current projects in
development? The barriers to market entry may also be worthy of investigation and quantification.
Category Interview response
Have you been involved with any trials of floating or lifted concrete gravity base structures? If so, please provide details.
Dev • No comment or relevant projects.
Dev • Are looking at GBS for [PROJECT]
Evidence Source
• In February 2015, Seatower Cranefree foundation for offshore wind turbines has been successfully installed at the Fécamp site in the British Channel. The GBS
was towed out to its desired position by two tugs and then deployed by letting seawater flow into the hollow foundation. The foundation was thereby fixed to the
seabed by its own ballasted weight.
http://seatower.com/news/
• In August 2015 ABB has announced the installation of DolWin beta, the world’s most powerful offshore converter station capable of supplying 1,000,000 homes
with wind-sourced electricity. The structure was anchored using a self-installing gravity-based structure (GBS) concept. The platform was slowly ballasted down to
the seabed by filling the six columns of the structure with water and in the weeks ahead, the water will be replaced with gravel."
http://www.energymatters.com.au/renewable-news/abb-offshore-converter-em4987/

ORE Catapult PN000113-FRT-002
CRMF 2015 Evidence log external Issue: FINAL 170
33 Optimised cable pull in and hang off processes
CRMF workstream Level 1 indicator Level 2 indicator Level 3 indicator
Technology Installation Support structures Optimised cable pull in and hang off processes
33.1 Summary Analysis
Finding: Ahead of target
The 2015 score for this indicator is ‘ahead of target’. At least one high profile UK project has committed to using a new generation of cable installation/mechanical protection technology representing a significant
share of the projects reaching FID in 2015. It is therefore reasonable to assume that the 25% target has been met. Although it should be noted that the number of UK projects where cable installation work has
taken place in 2015 is small.
Last year it was noted that an industry player, who had invested in making significant advances in cable pull in to improve speed and safety (Technip), had announced an exit from the offshore wind industry
pending completion of active projects. Tekmar were also highlighted as a company succeeding through innovation and their product offering continues to evolve.
Evidence did describe some continuing progress in this area, and there does appear to be industry consensus that cable pull in and hang off processes do represent a significant opportunity for cost reduction
through improved processes. An increased use of ‘walk to work’ systems from installation support vessels is also related to this indicator as the transfer of personnel to/from foundations using CTV has been
highlighted in other indicators as having significant impact on cable installation schedule and cost. Siem Offshore are a contractor using this crew transfer strategy in conjunction with new generation of ROV
based pull in techniques.
Outlook: Industry score 6.3
The outlook is reasonably positive, as the supply chain continues to propose improved and innovative products. It looks likely that future projects will learn lessons from the past and will not move backwards to
more labour or risk intensive systems. However, the long term prospects for the continued use of the Technip system or the entry of similarly disruptive innovative solutions are at present uncertain.
Please indicate your level of confidence in the industry
achieving the following by 2020 for this indicator (1 Low
confidence, 10 High confidence)
Developer average Designer average Installation average Overall average
New cable installation technologies are standard practice. New
connector technologies and hang off approaches in widespread
use
6.3 6.3
Majority of projects will use new cable installation processes
offering distinct advantages over current technology 4.0 6.5 5.3

ORE Catapult PN000113-FRT-002
CRMF 2015 Evidence log external Issue: FINAL 171
33.2 Milestone scorecard
Milestone scorecard FID 2015 FID 2016 FID 2017 FID 2018 FID 2019
Ahead of target New cable installation processes
used on a quarter of market
New cable installation processes
used on half of projects. New
connector technologies
available. First foundations
installed with improved hang off
technologies, reducing
installation times.
New cable installation processes
used on majority of projects.
New connector technologies
used on 1 project. New hang off
techniques used on a quarter of
projects.
New cable installation processes
become standard practice. New
connector technologies used on
3 projects. New cable hang off
approaches used on majority of
projects
New cable installation
technologies are standard
practice. New connector
technologies and hang off
approaches in widespread use.
On target New cable installation process
used on 1 project. First project
contracts using improved hang
off approaches. Free hanging
cables being tested
New cable installation processes
used on a quarter of market.
New cable installation processes
used on half of projects. New
connector technologies
available. First foundations
installed with improved hang off
technologies, reducing
installation times. Free hanging
cables contracted by project.
New cable installation processes
used on majority of projects.
New connector technologies
used on 1 project. New hang off
techniques used on a quarter of
projects.
New cable installation processes
become standard practice. New
connector technologies used on
3 projects. New cable hang off
approaches used on majority of
projects
Behind target New cable installation processes
available. Support structure
designs incorporate new hang
off approaches
New cable installation process
used on 1 project. First project
contracts using improved hang
off approaches
New cable installation processes
used on a quarter of market
New cable installation processes
used on half of projects. New
connector technologies
available. First foundations
installed with improved hang off
technologies, reducing
installation times.
New cable installation processes
used on majority of projects.
New connector technologies
used on 1 project. New hang off
techniques used on a quarter of
projects.
Missed target No new designs emerging No new designs emerging New cable installation processes
trialled
New cable installation processes
available. Support structure
designs incorporate new hang
off approaches
New cable installation process
used on 1 project. First project
contracts using improved hang
off approaches

ORE Catapult PN000113-FRT-002
CRMF 2015 Evidence log external Issue: FINAL 172
33.3 Evidence
33.3.1 Questionnaires
Category Questionnaire response
Describe any improvements to cable pull in and hang off processes that have emerged over the past year
Dev Information not available
Dev Standardised designs of offshore platforms have allowed for better cable pull designs. Transition piece designs improved giving better access.
Dev n/a
Electrical OEM Not applicable
Electrical OEM Not applicable to [Electrical OEM]
OFTO n/a
O&M n/a
Installation They get saver. [safer]
Installation [Installation] has talked to most of the CPS manufacturers regarding [PROJECT]. We haven't seen any significant improvements in design and hang-off in the last year.
33.3.2 Interview
33.3.3 Market intelligence
Category Interview response
Describe any improvements to cable pull in and hang off processes that have emerged over the past year
Installation Yes, a continuous improvement in the safety of these operations, this is a general approach. - Related to this, is the issue of personnel transfer, which is something that the whole industry is working on, [PRODUCT] etc., but there is perhaps not a universal method at present
Dev • Not much change in this area recently, if there has been they would be really small things. In the big scope of cost reduction there have been no significant developments. • There is a potential saving at the moment as oil and gas players are keen to enter the market for renewables to find work whilst the oil price is low.
Dev • Substrcuture has been designed to allow flexibility in cable installation. Cable can be pulled in with or without turbine and/or substation. • As long as jackets are installed cable can be pulled
Evidence Source
• First Subsea announces new connector systems that revolutionise the speed of installation and engineering integrity of power cable connections to offshore wind
turbine monopiles, at EWEA Offshore 2015. The Monopile Interface Connector (MIC) and Hang-Off Connector (HOC) provide quicker, simpler, less manpower
intensive, and thus safer cable connections offshore.
http://www.firstsubsea.com/news.php?actio
n=article&artid=25

ORE Catapult PN000113-FRT-002
CRMF 2015 Evidence log external Issue: FINAL 173
33.4 Additional comments
The level of engagement in this area was lower than in some other indicators
33.5 Recommendations
Future review of this indicator should directly address the revision of designs and procedures to reduce working time offshore or complete more work onshore ahead of installation.
• In March 2015, Onsagers AS received the European Patent Specification for an invention The invention providing a cable pull-in system for offshore structures
(1) of the type having a hollow interior extending from the sea bed to above the surface of the water and an entry hole (2) in the external wall of the structure.
https://data.epo.org/publication-
server/rest/v1.0/publication-
dates/20150318/patents/EP2569564NWB1/
document.html
• In September 2015 Tekmar announced that it had been awarded a contract to supply to provide its sixth generation TekLink mechanical latch systems at the
Burbo Bank Extension offshore wind farm.
http://www.tekmar.co.uk/news/2015/8/25/te
kmar-awarded-burbo-bank-extension-cable-
protection-contract
• In January 2015 DONG energy published Methodology Description for the Installation of Pre-terminated Subsea Cables which seeks to describe potential
improvements in cable installation processes, specifically with a focus on conducting as much work onshore as possible to achieve cost savings.
https://assets.dongenergy.com/DONGEner
gyDocuments/Wpopa/Pre-
terminated_Subsea_Cables_Installation_M
ethodology_Publication.pdf
http://www.tekmar.co.uk/news/2015/8/25/tekmar-awarded-burbo-bank-extension-cable-protection-contract
http://www.tekmar.co.uk/news/2015/8/25/tekmar-awarded-burbo-bank-extension-cable-protection-contract

ORE Catapult PN000113-FRT-002
CRMF 2015 Evidence log external Issue: FINAL 174
34 Improvements in operational weather limits for cables (installation)
CRMF workstream Level 1 indicator Level 2 indicator Level 3 indicator
Technology Installation Support structures Improvements in operational weather limits for
cables (installation)
34.1 Summary Analysis
Finding: On target
The target of 1.5m Hs weather limit for cable installations has been comfortably met.
Last year this indicator was also assessed as on target as the capability of the cable installation fleet had shown steady improvement.
Evidence suggests that the industry sees 1.5m Hs as an achievable current standard and there is a clear technology pathway for this limit to continue to gradually increase, for example as new vessels and
tooling become available. Some respondents were already comfortable using a 2.0m Hs limit for cable installation, whilst some still referenced limits below 1.5m. It was also noted that limits may vary over both
the duration of an installation project (as experience is gained) and for specific operations which may be more (or less) sensitive to weather limits, for example cable laying vs burial. For more information on cable
installation vessels see section 51.
Outlook: Industry score 7.3
The positive industry outlook is validated by some responses stating that a limit of 2.0m Hs may already be achievable, at least for certain operations/vessel combinations. With the increased use of bespoke new
cable installation vessels and a corresponding reduction in reliance on older vessels or re-purposed barges it is foreseeable that the average weather limit for cable installation will continue to steadily increase.
Whether the upwards trajectory of this limit is likely to be halted by either technology development reaching a limit or by the gains of increases beyond 2.0 – 2.5m Hs becoming ever more marginal remains to be
proven. It seems unlikely that a continued upwards trajectory will continue indefinitely but the 1.8m Hs target looks achievable.
Please indicate your level of
confidence in the industry achieving
the following by 2020 for this
indicator (1 Low confidence, 10 High
confidence)
Developer average Designer average Installation average Overall average
90% of all sites will have operational
access limit of 1.8Hs for cable
installation
7.3 7.3
New cable installation technologies are
standard practice. New connector
technologies and hang off approaches
in widespread use
6.3 6.3

ORE Catapult PN000113-FRT-002
CRMF 2015 Evidence log external Issue: FINAL 175
34.2 Milestone scorecard
Milestone scorecard FID 2015 FID 2016 FID 2017 FID 2018 FID 2019
Ahead of target Sea conditions limited to Hs =
1.6m
Sea conditions limited to Hs =
1.6m
Sea conditions limited to Hs =
1.7m
Sea conditions limited to Hs =
1.8m
Sea conditions limited to Hs =
1.8m
On target Sea conditions limited to Hs =
1.5m
Sea conditions limited to Hs =
1.5m
Sea conditions limited to Hs =
1.6m
Sea conditions limited to Hs =
1.7m
Sea conditions limited to Hs =
1.8m
Behind target Sea conditions limited to Hs =
1.4m
Sea conditions limited to Hs =
1.4m
Sea conditions limited to Hs =
1.5m
Sea conditions limited to Hs =
1.6m
Sea conditions limited to Hs =
1.7m
Missed target Sea conditions limited to Hs =
1.3m, experience worse than
expected.
Sea conditions limited to Hs =
1.3m
Sea conditions limited to Hs =
1.4m
Sea conditions limited to Hs =
1.5m
Sea conditions limited to Hs =
1.6m
34.3 Evidence
34.3.1 Questionnaires
Category Questionnaire response
What is the operational weather window (in Hs) that you would consider achievable for cable installation now?
Dev Hs = 1.5 m, but should be increased to around 2.0 m soon
Majority of projects will use new cable
installation processes offering distinct
advantages over current technology
4.0 6.5 5.3

ORE Catapult PN000113-FRT-002
CRMF 2015 Evidence log external Issue: FINAL 176
Category Questionnaire response
Dev Our current assumption is that Array Cable installation limits are 2m Hs.
Dev 1.5m
Dev 1
Electrical OEM Not applicable to [Electrical OEM]
OFTO n/a
Installation 1,5
Installation Cables & umbilical’s in oil & gas are already being installed in up to Hs = 4.0m. However, for most deck operations it is safer to limit activities to less than Hs = 2.5m. The critical activities for cable installation in offshore wind are the transfers on and off the structure for pull-ins. Generally this is around 1.5m Hs for normal CTV operations and a little higher for walk to work operations. Actually for most offshore windfarms you get little benefit in terms of increase operational availability above 2.5m Hs.
34.3.2 Interview
34.3.3 Market intelligence
34.4 Additional comments
None for this indicator
Category Interview response
What is the operational weather window (in Hs) that you would consider achievable for cable installation now?
Dev • Not much change in this area recently, if there has been they would be really small things. In the big scope of cost reduction there have been no significant developments. • There is a potential saving at the moment as oil and gas players are keen to enter the market for renewables to find work whilst the oil price is low.
Installation - Also oil and gas vessels try to enter the renewables industry and competing with specialists. - There may be some slight improvements in future, but currently step change in this limit is difficult to envisage. - Quite sure that there could be technology improvements if there was a larger market pull/unserved capacity
Installation Not their core market, but can say that there are different phases to cable installation, some phases are very wave sensitive, some are not. For cable lay limit may be 1.5m but burial may be 2.5m. not a simple single metric - [COMPANY] may have more to say here
Installation Potentially going to getting involved via [PRODUCT]. Currently at 1-1.2 Hs. But [PRODUCT] could open this up.
Evidence Source
CT Offshore have published operating limits for the cable installation vessel MV Sia of between 1.3 and 1.5m Hs http://www.ctoffshore.dk/media/6557/datasheet_clv_sia.pdf

ORE Catapult PN000113-FRT-002
CRMF 2015 Evidence log external Issue: FINAL 177
34.5 Recommendations
Industry engagement has highlighted that different aspects of the cable installation process are sensitive to weather limits in different ways, and as such it may be relevant to consider targets for laying, burial, pull
in as separate weather limits. This indicator is also strongly related to the weather limits for personnel transfer to foundations during the cable installation process.
The actual operational advantage of ever increasing weather (Hs) limits should also be considered. For example pushing cable burial limits to 3m Hs may offer little or no LCOE benefit if other dependant or
related operations are subject to lower weather (Hs or wind speed) limits.

ORE Catapult PN000113-FRT-002
CRMF 2015 Evidence log external Issue: FINAL 178
35 Optimised cable installation vessels and tooling
CRMF workstream Level 1 indicator Level 2 indicator Level 3 indicator
Technology Installation Support structures Optimised cable installation vessels and tooling
35.1 Summary Analysis
Finding: On target
A number of new build cable installation vessels have recently and will come onto the market in the near future. Of the 6 UK projects which have reached, or are expected to reach FID in 2015 3 are known to
have placed contracts with installation contractors to use new build cable installation vessels, 1 is known to have contracted existing vessels with new tools and 2 remain to be confirmed. This suggests that the
target of “Purpose built cable installation vessels, using advanced tools, install over half of projects” has been comfortably met.
Last year the indicator was also marked as on target noting that both new vessels and new trenching tools were becoming available.
Evidence generally supports view that improvement and technology development continues to deliver better results, and hence LCOE reductions in this area.
Outlook: Industry score 5.3
Perhaps the industry score is overly cautious as some older technology may continue to find work but there is generally a steady technology evolution. It does look likely that the majority of 2020 projects will use
new vessels and tooling which would be considered to be a significant improvement of technology that was commonplace only a few years ago.
It has been assumed that new vessels (see section 51 for more detail on cable installation vessels) will imply the use of new tools/ROV etc. The outlook is therefore positive as new vessels are being ordered and
delivered.
Cross over of renewables technology in this area with other industries may offer an opportunity for continued sharing of innovations both ways.
Please indicate your level of confidence in the industry
achieving the following by 2020 for this indicator (1 Low
confidence, 10 High confidence)
Developer average Designer average Installation average Overall average
90% of all sites will have operational access limit of 1.8 Hs for
cable installation 7.3 7.3
New cable installation technologies are standard practice. New
connector technologies and hang off approaches in widespread
use
6.3 6.3
Majority of projects will use new cable installation processes
offering distinct advantages over current technology 4.0 6.5 5.3

ORE Catapult PN000113-FRT-002
CRMF 2015 Evidence log external Issue: FINAL 179
35.2 Milestone scorecard
Milestone scorecard FID 2015 FID 2016 FID 2017 FID 2018 FID 2019
Ahead of target Purpose built cable installation
vessels, using advanced tools,
install over half of projects
Isolated use of non-purpose built
vessels. Three quarters of
installations undertaken by
purpose built vessels with new
cables installation tools.
Isolated use of non-purpose built
vessels. Three quarters of
installations undertaken by
purpose built vessels with new
cables installation tools.
Isolated use of non-purpose built
vessels. Three quarters of
installations undertaken by
purpose built vessels with new
cables installation tools.
Optimised purpose built cable
installation vessels have 100%
of the market
On target Purpose built cable installation
vessels, using advanced tools,
install over half of projects
Purpose built cable installation
vessels, using advanced tools,
install over half of projects
Three quarters of installations
undertaken by purpose built
vessels with new cables
installation tools.
Three quarters of installations
undertaken by purpose built
vessels with new cables
installation tools.
Three quarters of installations
undertaken by purpose built
vessels with new cables
installation tools.
Behind target First new purpose built cable
installation vessels are
commissioned. New
trenching/ploughing/recovering
tools start to become available.
Purpose built cable installation
vessels, using advanced tools,
install over half of projects
Purpose built cable installation
vessels, using advanced tools,
install over half of projects
Isolated use of non-purpose built
vessels. Three quarters of
installations undertaken by
purpose built vessels with new
cables installation tools.
Isolated use of non-purpose built
vessels. Three quarters of
installations undertaken by
purpose built vessels with new
cables installation tools.
Missed target No new build vessels ordered No new build vessels
commissioned
No new build vessels
commissioned
First use of purpose built cable
installation vessels
First use of purpose built cable
installation vessels
35.3 Evidence
35.3.1 Questionnaires
Category Questionnaire response
Discuss any new trenching, ploughing and recovery tools which have been introduced.
Dev No specific improvements noted
Dev Information not available
Dev New ploughs coming on to the supply chain. Multi-tools now available which are tools which require less changes when entering a new environment (soils). The equipment is now more reliable.
Dev n/a

ORE Catapult PN000113-FRT-002
CRMF 2015 Evidence log external Issue: FINAL 180
Category Questionnaire response
Electrical OEM Not applicable to [Electrical OEM]
OFTO n/a
O&M n/a
Designer [Designer] has now used successfully our [PRODUCT] on several wind farm projects with variable soil conditions, we can change out from a jetting to a cutting system offshore
Installation We can trench deeper, through stronger soil and combine it with cable laying (speed).
Installation There is almost constant development in the size of jetting tools available to the market but we haven't seen much in the way of tooling technology in the last year.
35.3.2 Interview
35.3.3 Market intelligence
Category Interview response
Discuss any new trenching, ploughing and recovery tools which have been introduced.
Installation - Simultaneous laying and burial is an advancement that is being worked on and could offer cost reductions. - At the moment the techniques and technology for recording/monitoring of correct installation of cables is Not fully developed. There could be a need for some technology development here. It would reduce costs as might avoid cost of remedial work if all parties could have greater certainty in quality of installation as it was happening.
Installation Not involved
Installation Not core business
Evidence Source
• Van Oord deployed the Nexus, its first cable-laying vessel for constructing offshore wind parks equipped with a cable carousel (capacity 5,000 tonnes). http://www.vanoord.com/news/2015-van-oords-cable-laying-vessel-nexus-operational#sthash.NQBz5l6y.dpuf.
• Likewise, ABB invested in most advanced cable-laying vessel for subsea installation and service. Orange Marine developed the Pierre de Fermat vessel able to
manage the installation and maintenance of all kinds of submarine cable.
http://www.yoursubseanews.com/abb+inve
sts+in+most+advanced+cable-
laying+vessel+for+subsea+installation+and
+service_121624.html
http://vessels.offshorewind.biz/vessels/sear
ch?category=2&page=2
Fugro has been awarded the contract for the installation and burial of array cables at the Rampion offshore wind farm. http://www.fugro.com/media-centre/press-
releases/fulldetails/2015/09/08/fugro-wins-

ORE Catapult PN000113-FRT-002
CRMF 2015 Evidence log external Issue: FINAL 181
35.3.4 Cable installation vessels
This table provides evidence (where available) of the expected cable installation for projects which have reached (or are expected to reach) financial close in 2015 which can be used for assessing the
percentage of projects using advanced tools.
35.4 Additional comments
None for this indicator
35.5 Recommendations
None for this indicator
cable-installation-contract-at-rampion-
offshore-wind-farm
DeepOcean 1 UK has been awarded the contract for cable installation at the Walney extension project. It will use the new build vessel Maersk Connector. http://www.4coffshore.com/windfarms/uk's-
deepocean-awarded-walney-extension-
cable-laying-nid2551.html
Site name Vessel (contractor) Status Tools
Race Bank Isaac Newton (Jan De Nuul) New build, new tools
Galloper Wind Farm Unknown (VBMS) TBC
Rampion Fugro Symphony and Fugro Saltire (Fugro) Existing vessels, new tools TSM Q1400 Trenching system
Walney Extension Phase 1 Maersk Connector (DeepOcean) New build, new tools Several advanced tools available
Walney Extension Phase 2 Maersk Connector (DeepOcean) New build, new tools Several advanced tools available
Blyth Offshore Wind Demonstration site TBC TBC

ORE Catapult PN000113-FRT-002
CRMF 2015 Evidence log external Issue: FINAL 182
36 Turbine condition based maintenance
CRMF workstream Level 1 indicator Level 2 indicator Level 3 indicator
Technology Operations and maintenance Operations and maintenance Turbine condition based maintenance
36.1 Summary Analysis
Finding: Ahead of target
This indicator has been assessed as ahead of target. This is based on the number of EU projects reaching FID in 2015 which are expected to use integrated turbine condition based maintenance exceeding the
20% threshold required to be rated ahead of target. Turbine OEMs and the industry generally described an increased awareness of the power of enhanced data and analytics, and described a general trend
towards the increasing use of condition monitoring systems.
Last year this indicator was scored as on target, noting that this area was a focus for the industry and that continuing progress looked likely.
Industry evidence suggests that turbine OEMs have invested significantly in prognostics and the analysis of condition monitoring data, and that skills and experience in this area are increasing. There was a
requirement during engagement for clarification of what is defined as condition based maintenance. The CRP and previous CRMF study anticipated high frequency sampling and prognostics based service
scheduling. There is limited evidence of such a radical approach forming the basis of O&M strategies on commercial projects at present, but it does look possible in future. Noteworthy R&D projects are active in
this area. The future development of appropriate data driven maintenance strategies represent, through collaboration, the opportunity to:
Increase service intervals;
Reduce the number of maintenance visits and;
Increase mean time between failures.
Outlook: Industry score 7.8
The outlook in this area is positive. Development in the area of condition monitoring and analytics is ongoing, OEMs have described a desire to increase activity in this area in coming years, with reference to
similar trends in other industries. Maintenance strategies informed by analysis of high frequency condition monitoring data is not common at present but does look possible in the future.
Please indicate your level of confidence in the
industry achieving the following by 2020 for
this indicator (1 Low confidence, 10 High
confidence)
Developer average WTG OEM average Overall average
All turbines contracted have fully integrated
control, condition monitoring and SCADA systems
and are maintained using condition based
maintenance
7.3 8.2 7.8

ORE Catapult PN000113-FRT-002
CRMF 2015 Evidence log external Issue: FINAL 183
36.2 Milestone scorecard
Milestone scorecard FID 2015 FID 2016 FID 2017 FID 2018 FID 2019
Ahead of target 20% of turbines contracted have
fully integrated control, condition
monitoring and SCADA systems
and are maintained using CBM.
50% of turbines contracted have
fully integrated control, condition
monitoring and SCADA systems
and are maintained using CBM.
70% turbines contracted have
fully integrated control, condition
monitoring and SCADA systems
and are maintained using CBM.
All turbines contracted have fully
integrated control, condition
monitoring and SCADA systems
and are maintained using CBM.
All turbines contracted have fully
integrated control, condition
monitoring and SCADA systems
and are maintained using CBM.
On target 10% of turbines contracted have
fully integrated control, condition
monitoring and SCADA systems
and are maintained using CBM.
20% of turbines contracted have
fully integrated control, condition
monitoring and SCADA systems
and are maintained using CBM.
50% of turbines contracted have
fully integrated control, condition
monitoring and SCADA systems
and are maintained using CBM.
70% turbines contracted have
fully integrated control, condition
monitoring and SCADA systems
and are maintained using CBM.
All turbines contracted have fully
integrated control, condition
monitoring and SCADA systems
and are maintained using CBM.
Behind target Improvements in the automatic
integration and interpretation of
all turbine operational data. This
includes low frequency (1Hz)
data from the control system
and the SCADA system, high
frequency (500Hz) condition
monitoring data, turbine design
data and turbine maintenance
histories from technician
records.
10% of turbines contracted have
fully integrated control, condition
monitoring and SCADA systems
and are maintained using CBM.
20% of turbines contracted have
fully integrated control, condition
monitoring and SCADA systems
and are maintained using CBM.
30% of turbines contracted have
fully integrated control, condition
monitoring and SCADA systems
and are maintained using CBM.
50% turbines contracted have
fully integrated control, condition
monitoring and SCADA systems
and are maintained using CBM.
Missed target Limited improvements in the
automatic integration and
interpretation of all turbine
operational data.
Improvements in the automatic
integration and interpretation of
all turbine operational data. This
includes low frequency (1Hz)
data from the control system
and the SCADA system, high
frequency (500Hz) condition
monitoring data, turbine design
data and turbine maintenance
histories from technician
records.
10% of turbines contracted have
fully integrated control, condition
monitoring and SCADA systems
and are maintained using CBM.
20% of turbines contracted have
fully integrated control, condition
monitoring and SCADA systems
and are maintained using CBM.
30% of turbines contracted have
fully integrated control, condition
monitoring and SCADA systems
and are maintained using CBM.

ORE Catapult PN000113-FRT-002
CRMF 2015 Evidence log external Issue: FINAL 184
36.3 Evidence
36.3.1 Questionnaires
Category Questionnaire response
Describe your approach to implementing condition monitoring equipment and CBM methodologies into turbine O&M
Dev On our projects in development we consider structural condition monitoring important for the foundations – where this is required (as in Germany) we meet the obligations but also seek to ensure the data obtained will be useful in reducing OPEX and integrity risk. Where it is not required by regulation (e.g. the UK) we still consider it important. We expect the data to be integrated into our maintenance approach. For the WTG itself we rely on the WTG OEM to specify the vibration monitoring system but we are considering our options for “a second pair of eyes” be that either in –house or contracted out. We also have an in-house developed [PRODUCT] system that performs statistical analysis of the WTG population to identify those WTG components that are behaving differently to their peers (e.g. the gear oil is statistically hotter than the population). We are using Cable temperature monitoring in export cables and considering it for array cables.
Dev This is not yet defined, but for [PROJECT] the approach to monitoring will most likely be on-line (and hence provide instantaneous feedback of condition) and off-line (data being collected at regular time intervals using measurement systems that are not integrated with the equipment). Condition based techniques such as vibration analysis, acoustics, oil analysis, strain measurement and thermography, are dependent on of component and technology developments which we are monitoring.
Dev All turbines contracted have fully integrated control, condition monitoring and SCADA systems and are maintained using CBM.
Dev Focus on OEM’s CMS as given systems to be purchased as an integral part of the turbines, but to be optimized further and utilized in the best way.
Describe your approach to condition monitoring and note any improvements which you have implemented over the past year on your turbine products.
WTG OEM
[WTG OEM] had a fully integrated Condition Monitoring and SCADA system from the start. The system has included many redundant and remotely switchable components from the start. Many minor improvements have been made this year as a rapid increase in operating systems provide new information.
WTG OEM Our offshore turbines feature full condition monitoring using a variety of sensors for factors such as vibration and temperature.
Do you have fully integrated control, condition monitoring and SCADA systems available in your turbine product?
WTG OEM Yes
WTG OEM Yes
How many contracts for products containing integrated systems did you sign over the last year?
WTG OEM One - [PROJECT]
Do you plan to introduce a fully integrated control, condition monitoring and SCADA system on your next generation turbine product?
WTG OEM Yes

ORE Catapult PN000113-FRT-002
CRMF 2015 Evidence log external Issue: FINAL 185
36.3.2 Interview
36.3.3 Market intelligence
Category Interview response
Describe your approach to implementing condition monitoring equipment and CBM methodologies into turbine O&M
Dev • Fairly standard – for specifics it really needs to come from turbine OEMs. • [Dev] do use some monitoring on foundations.
Dev • Turbine manufacturer will guarantee availability of turbines. • CBM etc. is all the responsibility of turbine supplier, developer does not have much visibility here.
O&M CBM is an interesting area. Impression is that OEM and particularly operators tend not to rely on this as much as they could. Anecdotal evidence that planned maintenance regimes are often driving unnecessary visits and activities. This may become more relevant as more of the turbine fleet moves out of warranty and people start to get smarter in how they flag, plan, and conduct maintenance. There is a perception of risk when not sticking to a rigid service schedule.
WTG OEM
A lot of interest in sophisticated analytics of data and sensor data. This is likely to be a key area for future improvements and reduction in LCOE - Sensor data is used to control turbine, bandwidth limit on what is stored and returned. - Aim is to have effective maintenance and also use control and monitoring to avoid having to conduct technician visits. - This is a growing area and an area with more scope for advanced technology and related potential reductions in LCOE.
Dev
- O&M is a large area of unknowns for offshore wind project planning. - It is difficult to forecast what very far out (20 year) O&M costs will be, but it is considered in the modelling. - Banks like an element of OEM involvement in O&M, which to an extent drives choice of how O&M will be conducted. Bank financed projects will tend towards longer OEM involvement as they want the developer to conduct maintenance in this way due to perceived reduction in risk.
Evidence Source
• A Fraunhofer report on Condition Monitoring of wind turbines released on January 2015, states that: "... the most developed and widely applied condition-
monitoring technique for wind turbines is vibration-based monitoring of the drivetrain components. Gearbox-oil based CMS are gaining importance as
complimentary systems but are still at an early stage with respect to the sensor technology and validation as well as to their fault-detection capability. The same
applies for rotor-blade SHM, for which an increasing number of commercial products is commercially available, but the fault-detection performance of which is not
considered sufficient to fully replace the regular inspection of rotor blades yet. SHM for monitoring the integrity of onshore and offshore support structures are
mostly in the development phase. First systems are available on the market. Condition monitoring based on 10min-averaged SCADA data is found unsuitable as a
standalone solution, but is considered a valuable complement for purpose-designed CMS to achieve better fault-detection performance. Among the topics
recommended for future work, evaluating the fault-detection capabilities of the CMS and SHM systems experiences in the field as well as investigating the
potential of high resolution SCADA data for condition monitoring are considered to be particularly relevant to practice."
https://www.vgb.org/vgbmultimedia/383_Final+report-p-9786.pdf

ORE Catapult PN000113-FRT-002
CRMF 2015 Evidence log external Issue: FINAL 186
36.4 Additional comments
None for this indicator
36.5 Recommendations
The implementation of condition based maintenance strategies offers significant potential for cost of energy impact on both future and existing projects. The availability to develop condition monitoring techniques
and demonstrate innovative maintenance strategies is important and requires collaboration. Implementation of condition monitoring equipment and the resulting increased understanding of asset performance is
valuable, but tracking the role of truly condition based maintenance strategies should be considered – having the technology is one thing, targeted use is more demanding but equally more rewarding in terms of
potential cost reduction.
• Operations and maintenance in offshore wind: key issues for 2015/16, September 2015. “Wind turbine control is currently undertaken on a turbine-by-turbine
basis to achieve the optimal performance of that turbine. There are, however, factors that act at the wind farm scale, such as grid curtailment requests, wake
propagation and variation in asset health. At present, turbine control systems do not take these cumulative impacts into account, potentially resulting in main
component failure when individual turbines experience conditions that are beyond their expected design life. Some commercial offshore wind farms are beginning
to move towards fully integrated systems, with a controller that uses condition monitoring and SCADA data from all turbines and environmental site data to
continuously update the operating state of each turbine. This enables more flexible control at a wind farm level, optimising performance across all turbines to meet
the objective of increasing the life of wind turbine components while optimising energy production. At present, there is a lack of incentive for turbine manufacturers
to introduce whole wind farm control systems that take into account different factors affecting the asset at a wind farm level. A move towards yield-based
warranties may facilitate that development, providing an incentive for turbine manufacturers to improve yield, rather than optimising the wind farm solely on an
availability target."
https://www.catapult.org.uk/documents/10619/205342/pdf/0f8ac1f2-c08b-4033-9f88-90721cca635f
• OPTIMUS is a 36 month EU funded FP7 project with 12 partners participating from 6 countries across Europe. The project follows on from the recently
completed NIMO FP7 project. OPTIMUS will develop and demonstrate, in the field, novel methods and tools for prognosis of the remaining lifetime of key
components based on data acquired by a cost-effective wind turbine condition monitoring system, implemented by custom-designed dependable computing
systems. This technology will reduce the total cost of energy and advance the deployment of large scale offshore and onshore wind energy by increasing
availability and reducing downtime due to unplanned maintenance. Predictive maintenance will also reduce costs incurred from secondary damage to
components and enable maintenance activities (and the associated costs) to be optimised with respect to forecast revenue from power generation. The results of
this project will lead to a significant step-change over the current capability of commercial condition monitoring systems.
http://optimusfp7.eu/project-background/
• In a survey conducted by Wind Energy Update this year, 80% of wind turbine owners indicated they take either a predictive or preventative approach to
maintenance. Furthermore, 77% indicated that they deploy Condition Monitoring Systems (CMS). Operators have a variety of data-monitoring options to choose
from, including SCADA data, inspection and lab data. However, CMS is the most common data source. The system uses vibrations to detect faults in equipment
and its continuous monitoring helps pick up faults associated with intermittent output.
http://analysis.windenergyupdate.com/operations-maintenance/continuous-centralized-monitoring-drives-om-optimization

ORE Catapult PN000113-FRT-002
CRMF 2015 Evidence log external Issue: FINAL 187
37 Access solutions from vessel to turbine
CRMF workstream Level 1 indicator Level 2 indicator Level 3 indicator
Technology Operations and maintenance Operations and maintenance Access solutions from vessel to turbine
37.1 Summary Analysis
Finding: On target
This indicator is rated as on target, based on a limit of 1.5m Hs being widely quoted as standard practice. Another common theme from industry was the difference between a written target and actual operating
limits, which tend to be lower. This is consistent with findings in the evidence log from last year’s study.
Last year this indicator was also rated as on target, noting that the significant wave height for transfer is influenced by conditions as well as vessel specific limits, and that although 1.5m Hs is commonly quoted,
limits in practice can be lower.
Evidence from industry engagement suggested that:
1.5m Hs is a very widely quoted written limit for both for UK and EU projects, and is almost a de facto standard for projects using CTV,
However there was also a thread that commonly limits achieved will be lower in practice,
There is particular interest in the area of crew transfer from HSE, G9 and RenewableUK,
Related; this is an area which is particularly sensitive to health and safety concerns, and there is an increasing body of evidence suggesting that experience of vessel crew and other site conditions can
have a strong influence on the safe working limits,
A step change to larger service vessels is on the horizon, and imply the inclusion of walk to work systems, enabling an increase to 2.5 – 3.0m Hs limit for transfer,
However, the economics of such vessels are such that they can only be justified when a project is far from shore, with the avoidance of significant CTV transfer time playing at least as significant a role in
their justification as an increase in the significant wave height limits for access,
Related; increasing transfer limits to 2.5m Hs and beyond implies that other factors (not least wind speed) that typically coincide may become a limiting factor.
Outlook: Industry score 6
The outlook for achieving an increase to 2.5m Hs by 2020 is uncertain. Projects that currently rely on CTV (that tend to be near shore) look unlikely to change in the short to medium term. Despite significant
innovation and work in this area, noticeable increases in transfer limits have not been forthcoming. Access technology, associated typically with larger semi-permanently stationed service vessels can offer an
increase in safe transfer limit, but with significant additional costs, which cannot be justified for all projects. Better optimised utilisation through experience gained of vessels and transfer opportunities may still
represent a significant area for improvement on near shore sites relying on traditional style CTV.
Please indicate your level of confidence in the industry
achieving the following by 2020 for this indicator (1 Low
confidence, 10 High confidence)
Developer average Overall average
Transfers up to 2.5m Hs on 90% of wind farms 6.0 6.0

ORE Catapult PN000113-FRT-002
CRMF 2015 Evidence log external Issue: FINAL 188
37.2 Milestone scorecard
Milestone scorecard FID 2015 FID 2016 FID 2017 FID 2018 FID 2019
Ahead of target Transfer up to Hs=1.7m is
standard practice.
Transfer up to Hs=1.9m is
standard practice.
Transfer up to Hs=2.1m is
standard practice.
Transfer up to Hs=2.3m is
standard practice.
Transfer up to Hs=2.5m is
standard practice.
On target Transfer up to Hs=1.5m is
standard practice.
Transfer up to Hs=1.7m is
standard practice.
Transfer up to Hs=1.9m is
standard practice.
Transfer up to Hs=2.1m is
standard practice.
Transfer up to Hs=2.3m is
standard practice.
Behind target Transfer up to Hs=1.4m is
standard practice.
Transfer up to Hs=1.5m is
standard practice.
Transfer up to Hs=1.7m is
standard practice.
Transfer up to Hs=1.9m is
standard practice.
Transfer up to Hs=2.1m is
standard practice.
Missed target Transfer up to Hs=1.4m is
considered standard practice,
but some poor experience and
minor accidents as volume of
transfers increases.
Transfer up to Hs=1.4m is
standard practice.
Transfer up to Hs=1.4m is
standard practice.
Transfer up to Hs=1.5m is
standard practice.
Transfer up to Hs=1.7m is
standard practice.
37.3 Evidence
37.3.1 Questionnaires
Category Questionnaire response
What types of crew transfer vessels do you use on your operations projects and you plan to change these?
Dev SWATH, catamarans and monohull CTVs. No immediate plans to change from these although there is potential to include trimarans.
Dev not applicable

ORE Catapult PN000113-FRT-002
CRMF 2015 Evidence log external Issue: FINAL 189
Category Questionnaire response
Dev Crew CAT Survey/Support Vessel from [COMPANY]. Length 16m. 22 tonnes. 22 knots. No plan to change.
Dev Rarely monohull, usually catamaran and SWATH coming up. Looking into faster and saver transfer in the future or even alternative logistics set-ups to optimize crew transfer to the turbines, e.g. offshore service vessel (OSV) or multi-purpose offshore vessel (MPSV) as an alternative to CTV transfer for far offshore sites. To ensure safe transfer and higher accessibility [Dev] is also looking at the upcoming propulsion systems pitch propellers and [Volvo IPS ](Previously, all vessels had fixed props or water jets.) At the moment many people seem to be focused on higher transfer speeds only, but high speed is no good if the vessel cannot safely dock to the turbine because low speed manoeuvrability at the turbine is poor. It is the total sum of the vessels abilities that counts, not the performance in a single area.
WTG OEM Mix of CTV & Offshore Service Vessels with motion stability. We have helicopter options for unplanned visits.
WTG OEM We use all types - monohulls, catamarans etc
What types of crew transfer vessels do you plan to use on your next project?
Dev information not available
Dev Most likely same specification as above, definitely no smaller.
Dev Depends on location and distance to shore. North Sea: catamaran / SWATH Baltic Sea: most likely catamaran Depends on location of wind farm and distance to shore. Enhanced CTVs yes, but using purely CTVs might not be the best option for all wind farms / clusters anymore.
WTG OEM This depends on a combination of factors - price, accessibility, availability, O&M strategy adopted, etc
What significant wave height would you consider reasonable for technician transfer with a standard crew boat without access technology?
Dev 1.5
WTG OEM 1.5m
WTG OEM Wave height up to 2m significant - but depends on levely of shorter wave length waves in addition to main swell
WTG OEM Around 2m Hs. However, this call is entirely dependent on the captain of the vessel.
What significant wave height would you consider reasonable for more advanced access technology? (e.g. motion compensation/walk to work).
Dev 2.5
WTG OEM 3m
WTG OEM Typically 3m but the limitation may be more related to wind speed
WTG OEM Up to 3m Hs
"What significant wave height would you consider reasonable for technician transfer with a standard crew boat without access technology? What significant wave height would you consider reasonable for access technology?"

ORE Catapult PN000113-FRT-002
CRMF 2015 Evidence log external Issue: FINAL 190
Category Questionnaire response
Installation Don't know.
Installation There is a big debate on this topic between NWA/IMCA/G9 and HSE in the UK at the moment.
37.3.2 Interview
Category Interview response
What types of crew transfer vessels do you use on your operations projects and you plan to change these? What types of crew transfer vessels do you plan to use on your next project?
Dev • O&M phase was considering classic CTV • There were some options available for O&M port, which would have relied on slightly larger vessels, but most likely outcome for O&M exercises would be a fairly standard vessel • Comment that in general that there is not much improvement / innovation in this area which is have an impact on operational sites?. • A technically ideal vessel may not fit where cost still drives the selection of transfer vessels, think that this area needs significant effort expending
Dev • Regular CTVs are the main method of transfer right now. These are generally on standard leases • [Dev] are switching for [PROJECT] and [PROJECT] to an SOV which will be leased/rented/bought, more like an Oil and gas set up with support vessels on station. • O&M cost per MW will not be reduced, but cost versus using long CTV transfers will be lower, which is what drives the economy of SOVs for far shore sites. This is a result of reduced commuting time.
Dev • Turbine O&M vessels will be 3x CTV 12PAX. • Potential use of helicopters for emergency maintenance to back up CTV. • 1x CTV for BoP – will be shared with OFTO.
WTG OEM Generally more H&S driven than some areas, and will always be a balance of what project economics will support
WTG OEM
• Has not seen the much talked of step change in access technologies • The additional cost for more advanced access systems are not necessarily offset by more advanced access times • Generally [WTG OEM] will use classic CTVs • The time in transit can be more of a challenge than ‘making the step’ • There is variance, but generally [WTG OEM] will provide CTVs for their projects
WTG OEM • Have seen that what’s available in the market is tending to improve, and they are watching closely what comes forward as this is a potentially very significant area.
WTG OEM Far shore farms will require different solutions, CTV will not be possible
O&M Currently rely on 20 - 22m CTVs. have learned how to work well with these are comfortable and expect these to continue to be the mainstay in near future. have some trials of wavecraft but there are questions of both technical viability, which may be mostly in hand, but also of commercial viability and applicability to specific sites, particularly recent sites. Expect that SOV may become more viable as the industry develops far shore R3 type sites, but for now O&M industry tends to rely on classic CTV.
What significant wave height would you consider reasonable for technician transfer with a standard crew boat without access technology?
WTG OEM • 1.5m hs is generally industry wide standard (including non-UK)

ORE Catapult PN000113-FRT-002
CRMF 2015 Evidence log external Issue: FINAL 191
37.3.3 Market intelligence
37.4 Additional comments
Although relatively uncommon in the UK, further offshore EU projects are using helicopter transfer regularly, the implications of these strategies on cost reduction is likely to be complex, and are not reflected in
the scoring of this indicator at present.
37.5 Recommendations
None for this indicator
Installation 1.5m hs is not necessarily a technology limit, mostly this is driven by HSE - There are devices and technology to increase this but it is always a question of striking the right balance in how conservative you are, particular towards HSE
Installation Certifying [PRODUCT] - will be making 2.5 Hs - motion compensation will depend on this. Can very easily increase. Could go up to 4Hs by increasing size of arms.
WTG OEM Walk to work systems are very effective but cost balance vs access benefits do not always stack up
WTG OEM - Not the expert on this. Generic understanding only - Access can be helicopter, CTV, walk to work.
Dev • 1.5 – 2m for regular crew boats.
What significant wave height would you consider reasonable for more advanced access technology? (e.g. motion compensation/walk to work).
WTG OEM
- Walk to work will work in the worst (2 – 2.5mhs) conditions but is better suited to large team in one place than small teas across the farm - Approach to O&M is getting more confusing and there are many different technologies/options available and any single one is not always likely to be optimal for every project/site/situation
Dev • Have trialled transfer systems but not impressed, particularly on small crew boats
Evidence Source
None for this indicator

ORE Catapult PN000113-FRT-002
CRMF 2015 Evidence log external Issue: FINAL 192
38 Improvements in transfer from shore to turbine
CRMF workstream Level 1 indicator Level 2 indicator Level 3 indicator
Technology Operations and maintenance Operations and maintenance Improvements in transfer from shore to turbine
38.1 Summary Analysis
Finding: On target
This indicator has been assessed as ‘on target’, but is close to being rated ‘ahead of target’ as there continues to be significant innovation in crew transfer vessels (CTV). The average length of CTV used on EU
projects reaching first power in 2014 – 2015 is 22.37m (according to 4C offshore data). Assuming length is a reasonable indicator of the generation of CTV only 47% of CTV used on projects reaching first power
in the last year have a length greater than 22m. The use of small, or ‘first generation’ CTV on new projects is decreasing and new ‘second generation’ vessels continue to come to market. Third generation
designs (World Marine Offshore Windserver and Umoe Mandal Wavecraft) have been used on commercial projects, with other developments in novel vessel designs such as SWATH CTV increasing in
popularity.
Last year this indicator was rated as ahead of target, noting a trend for the majority of CTV to be greater than 18m in length.
Evidence from industry consultation supported these findings, with a general trend towards increasing vessel size (and capability) with some companies having no plans to change, and those that did plan to
change looking to larger CTV. Mention of larger offshore support vessels was also common in relation to this indicator, with several projects basing offshore logistics on this concept. The commercial implications
of moving to larger support vessels were also discussed, and it is apparent that they are not likely to be commercially viable for sites relatively near shore.
A theme which was also commonly described but is not tracked in the milestones for this indicator is the increased sophistication in planning of offshore logistics, and a focus on maximising utilisation or efficiency
of use of CTV assets. This was described by respondents as an areas of increased activity, particularly related to the level of experience in offshore logistics increasing. The menu of transfer methods and options
is growing, and the optimum strategy is unlikely to be the same across all projects.
Outlook: Industry score 5.5
The outlook for this indicator is perhaps more positive than the industry score would suggest, as demonstrations of third generation CTV are well progressed for a number of concepts. This general positivity
should be tempered by the reluctance to change strategies on existing operational projects, the marginal gains which may be achieved by deploying cutting edge CTV on future relatively near shore projects, and
the significant cost associated with a service vessel concept.
Please indicate your level of confidence in the
industry achieving the following by 2020 for
this indicator (1 Low confidence, 10 High
confidence)
Developer average WTG OEM Average Overall average
90% of market uses enhanced crew transfer
vessels 6.0 5.0 5.5
Bespoke offshore wind operations using large
offshore service vessels for all far offshore sites,
supported by two or more daughter vessels. This
6.0 6.4 6.2

ORE Catapult PN000113-FRT-002
CRMF 2015 Evidence log external Issue: FINAL 193
38.2 Milestone scorecard
Milestone scorecard FID 2015 FID 2016 FID 2017 FID 2018 FID 2019
Ahead of target 70% using 2nd gen. First
operational use of 3rd gen
70% using 2nd gen. 10% 1st
gen, 20% 3rd gen
60% using 2nd gen. 30% using
3rd gen. 10% using 1st gen.
100% 2nd or 3rd gen 100% 2nd or 3rd gen, with
majority of 3rd gen
On target 60% using enhanced 2nd Gen,
40% using 1st gen. First 3rd gen
vessels are ordered
70% using 2nd gen. First
operational use of 3rd gen
70% using 2nd gen. 10% 1st
gen, 20% 3rd gen
60% using 2nd gen. 30% using
3rd gen. 10% using 1st gen.
100% 2nd or 3rd gen
Behind target 50% using 1st gen and 50%
using 2nd gen vessels. Designs
and R&D work on 3rd Gen
underway
60% using enhanced 2nd Gen,
40% using 1st gen. First 3rd gen
vessels are ordered
70% using 2nd gen. First
operational use of 3rd gen
70% using 2nd gen. 10% 1st
gen, 20% 3rd gen
60% using 2nd gen. 30% using
3rd gen. 10% using 1st gen.
Missed target No new designs for enhanced
crew transfer vessels on the
market
No new crew transfer vessels
operational with few designs on
order
Only small number of enhanced
crew transfer vessels on order
Only small number of enhanced
crew transfer vessels on order
60% using enhanced crew
transfer vessels
38.3 Evidence
38.3.1 Questionnaires
Category Questionnaire response
What types of crew transfer vessels do you use on your operations projects and you plan to change these?
Dev SWATH, catamarans and monohull CTVs. No immediate plans to change from these although there is potential to include trimarans.
will be combined with new processes to maximise
the efficiency of the vessels and personnel.

ORE Catapult PN000113-FRT-002
CRMF 2015 Evidence log external Issue: FINAL 194
Category Questionnaire response
Dev not applicable
Dev Crew CAT Survey/Support Vessel from [COMPANY]. Length 16m. 22 tonnes. 22 knots. No plan to change.
What types of crew transfer vessels do you plan to use on your next project?
Dev Tri-Swath vessel and/or catamarans.
Dev information not available
Dev Most likely same specification as above, definitely no smaller.
What significant wave height would you consider reasonable for technician transfer with a standard crew boat without access technology?
WTG OEM 1.5m
WTG OEM Wave height up to 2m significant - but depends on level of shorter wave length waves in addition to main swell
WTG OEM 1.5m/s is a 'guideline' but always at discretion of ships master and subject to many factors (vessel, wind direction, experience of crew, landing design etc.)
WTG OEM Max Hs 1.5 m, working on vessels that can do 1.8m
WTG OEM Around 2m Hs. However, this call is entirely dependent on the captain of the vessel.
What significant wave height would you consider reasonable for more advanced access technology? (e.g. motion compensation/walk to work).
WTG OEM 3m
WTG OEM Typically 3m but the limitation may be more related to wind speed
WTG OEM
Dependent on vessel type and system. Large SOV vessels (above 60m ) equipped with [PRODUCT] can transfer in far higher wave heights (but balance of cost)
WTG OEM +2m Hs
WTG OEM Up to 3m Hs
"What significant wave height would you consider reasonable for technician transfer with a standard crew boat without access technology? What significant wave height would you consider reasonable for access technology?"
Installation Don't know.
Installation 1.5m 1.8m
Installation There is a big debate on this topic between NWA/IMCA/G9 and HSE in the UK at the moment.

ORE Catapult PN000113-FRT-002
CRMF 2015 Evidence log external Issue: FINAL 195
38.3.2 Interview
Category Interview response
What types of crew transfer vessels do you use on your operations projects and you plan to change these? What types of crew transfer vessels do you plan to use on your next project?
Dev • O&M phase was considering classic CTV • There were some options available for O&M port, which would have relied on slightly larger vessels, but most likely outcome for O&M exercises would be a fairly standard vessel • Comment that in general that there is not much improvement / innovation in this area which is have an impact on operational sites?. • A technically ideal vessel may not fit where cost still drives the selection of transfer vessels, think that this area needs significant effort expending
Dev • Regular CTVs are the main method of transfer right now. These are generally on standard leases • [Dev] are switching for [PROJECT] and [PROJECT] to an SOV which will be leased/rented/bought, more like an Oil and gas set up with support vessels on station. • O&M cost per MW will not be reduced, but cost versus using long CTV transfers will be lower, which is what drives the economy of SOVs for far shore sites. This is a result of reduced commuting time.
Dev • Turbine O&M vessels will be 3x CTV 12PAX. • Potential use of helicopters for emergency maintenance to back up CTV. • 1x CTV for BoP – will be shared with OFTO.
WTG OEM Generally more H&S driven than some areas, and will always be a balance of what project economics will support
WTG OEM
• Has not seen the much talked of step change in access technologies • The additional cost for more advanced access systems are not necessarily offset by more advanced access times • Generally [WTG OEM] will use classic CTVs • The time in transit can be more of a challenge than ‘making the step’ • There is variance, but generally [WTG OEM] will provide CTVs for their projects
WTG OEM • Have seen that what’s available in the market is tending to improve, and they are watching closely what comes forward as this is a potentially very significant area.
WTG OEM Far shore farms will require different solutions, CTV will not be possible
O&M Currently rely on 20 - 22m CTVs. have learned how to work well with these are comfortable and expect these to continue to be the mainstay in near future. have some trials of wavecraft but there are questions of both technical viability, which may be mostly in hand, but also of commercial viability and applicability to specific sites, particularly recent sites. Expect that SOV may become more viable as the industry develops far shore R3 type sites, but for now O&M industry tends to rely on classic CTV.
What significant wave height would you consider reasonable for technician transfer with a standard crew boat without access technology?
WTG OEM • 1.5m hs is generally industry wide standard (including non-UK)
Installation 1.5m hs is not necessarily a technology limit, mostly this is driven by HSE - There are devices and technology to increase this but it is always a question of striking the right balance in how conservative you are, particular towards HSE
Installation Certifying [PRODUCT] - will be making 2.5 Hs - motion compensation will depend on this. Can very easily increase. Could go up to 4Hs by increasing size of arms.
WTG OEM Walk to work systems are very effective but cost balance vs access benefits do not always stack up

ORE Catapult PN000113-FRT-002
CRMF 2015 Evidence log external Issue: FINAL 196
38.3.3 Market intelligence
38.3.4 CTV greater than 22m length project usage
Vessel Length (m)
Estimated Project Uses in 2015
MCS Taku CPP 26 1
MCS Coromell 25.75 2
MCS Pampero 25.75 1
Kem 1 28.17 1
FOB SWATH 1 27 2
Lina 25.7 1
Channel Chieftain VI
27.7 1
CarboClyde 24 2
Bull Bay 26 1
Church Bay 26 1
World Golf 23.65 2
World Mistral 23.65 1
Mill Bay 26 1
MO 2 25 1
Evidence Source
The first wavecraft has been chartered under an initial 8 month trial to serve the Borkum Riffgrund 1 offshore wind farm. http://www.motorship.com/news101/ships-and-shipyards/umoe-wave-craft-enhances-windfarm-access
The carbon trust OWA has encouraged significant work on CTV development through their competition. http://www.carbontrust.com/news/2015/04/charting-the-course-for-offshore-access-systems/
Seacat Services launched a 26m CTV in February 2015. http://www.offshorewind.biz/2015/02/19/seacat-services-launches-second-26m-ctv/
CTRUK has announced a 26m semi swatch CTV vessel design in March 2015. http://www.4coffshore.com/windfarms/ctruk-new-design-ctv-nid1498.html

ORE Catapult PN000113-FRT-002
CRMF 2015 Evidence log external Issue: FINAL 197
World Bora 31.32 1
Seacat Ranger 24 1
Sure Pride 22 1
CWind Sword 22 1
World Calima 31.31 1
MV Advancer 22.4 1
Kem 2 28.17 2
Windea Three 25.75 2
Windea Two 25.75 2
SeaZip 4 25.75 2
Rix Lion 26 1
Seagull 25.75 2
Offshore Wielingen
25.75 1
Marineco Stingray 25.75 1
Marineco Mariah 25.75 1
MCS Boreas 25.75 1
World Passat 23.65 1
Sure Shamal 25.75 1
Natalia Bekker 26.18 1
Marineco Dignity 25.75 1
Marineco Thunderbird
25.75 1
Windea One 25.75 2
Njord Alpha 25.75 1
Total calculated proportion of 2015 market
47%

ORE Catapult PN000113-FRT-002
CRMF 2015 Evidence log external Issue: FINAL 198
38.4 Additional comments
Similarly to the indicator in section 37 further offshore EU projects are using helicopter transfer regularly, the implications of these strategies on cost reduction is likely to be complex, and are not reflected in the
scoring of this indicator at present.
38.5 Recommendations
None for this indicator

ORE Catapult PN000113-FRT-002
CRMF 2015 Evidence log external Issue: FINAL 199
39 Inventory management
CRMF workstream Level 1 indicator Level 2 indicator Level 3 indicator
Technology Operations and maintenance Operations and maintenance Inventory management
39.1 Summary Analysis
Finding: On target
This indicator has been assessed as on target. All developer and WTG OEM respondents claimed, with credibility, to use sophisticated inventory management. There was a lack of highly detailed evidence but it
appears that progress in this area continues. A particular point of note is that a number of operational projects are reliant on more than one inventory system, where turbine OEM and utility or operator inventories
are run in tandem, it is anticipated that the significance of this approach will increase as more projects reach end of warranty.
Last year this indicator was also rated as on target, again citing a challenge in obtaining sufficiently detailed information to be able to quantifiably asses the proportion of projects using sophisticated techniques.
Evidence from consultation suggested that:
All respondents who were at the stage of working with inventory management felt that they had reasonably sophisticated systems already in place,
Generally the industry appears to have a sophisticated approach,
It was difficult to establish whether the level of sophistication is consistent across the industry,
There was limited evidence of integration of systems, or information sharing.
Outlook: Industry score 7
A reasonably positive outlook, as most operators appear to already consider their inventory management systems sophisticated. An area for future consideration is the integration of OEM/operator systems and
the likely direction of projects after end of warranty.
Please indicate your level of confidence in the
industry achieving the following by 2020 for
this indicator (1 Low confidence, 10 High
confidence)
Developer average WTG OEM Average Overall average
90% of projects use sophisticated inventory
management techniques. 6.5 7.4 7.0

ORE Catapult PN000113-FRT-002
CRMF 2015 Evidence log external Issue: FINAL 200
39.2 Milestone scorecard
Milestone scorecard FID 2015 FID 2016 FID 2017 FID 2018 FID 2019
Ahead of target 80% of projects use techniques 80% of projects use techniques 80% of projects use techniques 90% of projects use techniques 100% of projects use techniques
On target 70% of projects use techniques 70% of projects use techniques 80% of projects use techniques 80% of projects use techniques 80% of projects use techniques
Behind target 50% of projects use techniques 60% of projects use techniques 60% of projects use techniques 70% of projects use techniques 70% of projects use techniques
Missed target Only two operational projects
use sophisticated inventory
management techniques
50% of projects use techniques 50% of projects use techniques 60% of projects use techniques 60% of projects use techniques
39.3 Evidence
39.3.1 Questionnaires
Category Questionnaire response
Describe your approach to inventory management and the systems you have put in place. E.g. Systems that keep records of part numbers and variants including serial numbers of key components, build a history of spares usage, track the timescales required for replacements, track the cost of the component, detail the maintenance requirements for components that are held in storage and track the cost of transporting components.
Dev Our inventory management is currently performed on our operational project by [COMPANY] – who use [PRODUCT] for this purpose. In the back office we track the usage of spare parts using our [PRODUCT] (a Failure Mode Analysis and Predictive Maintenance Tool) – this allows us to: build a history of spares usage, track the timescales required for replacements, track the cost of the component, On future projects we will use the in-house [PRODUCT] inventory management used for our [PROJECT] portfolio which matches the functionalities described in the question.
Dev Inventory management systems have not yet been identified or implemented

ORE Catapult PN000113-FRT-002
CRMF 2015 Evidence log external Issue: FINAL 201
Category Questionnaire response
Dev Turbines – service agreement in place with manufacturer. There is a small operations and maintenance building nearby for low cost replacements. Key components (e.g. blade) brought in from O&M operator. Systems that keep records of part numbers and variants including serial numbers of key components – O&M provider offers this.
Dev Electronic inventory management using [PRODUCT], which includes all the mentioned details. Could be further standardized throughout the industry by applying standard reference designation systems like the latest RDS-PP standard for wind turbines from 2014 (published by VGB).
WTG OEM A standardised component number system is used by [WTG OEM], (RDS PP - Reference Designation System for Power Plants). This system is probably of medium complexity
WTG OEM [WTG OEM] does all of this at the Moment.
39.3.2 Interview
39.3.3 Market intelligence
Category Interview response
Describe your approach to inventory management and the systems you have put in place. E.g. Systems that keep records of part numbers and variants including serial numbers of key components, build a history of spares usage, track the timescales required for replacements, track the cost of the component, detail the maintenance requirements for components that are held in storage and track the cost of transporting components.
Dev • Tracking of components and spares has not changed. Some sites have been ISO certified and has driven an improvement in inventory management. • No plans for significant changes here. • Can currently track each component.
WTG OEM
[PRODUCT] type system for inventory management - Barcoding/RFID tracking etc., considered ‘industry standard’ but is fairly sophisticated. - Management in and out of port/service for major components is also highly sophisticated - Sharing of inventory across OEMs would be possible, but likely to be led by a single developer and a single OEM. - As the fleet gets bigger it is possible to conceive that SOV etc. can be made more attractive by sharing/working across sites. But in general not at this stage yet, and not a sufficient size of installed fleet to make this really work.
WTG OEM • Integration with owner operators systems? Most of the time, they will have a separate inventory management to their customers. i.e. two distinct systems
O&M
Not sufficiently close to inventory by site operators to comment on their relative sophistication may be getting more involved as an integrated contractor in future.
Evidence Source
None for this indicator

ORE Catapult PN000113-FRT-002
CRMF 2015 Evidence log external Issue: FINAL 202
39.4 Additional comments
None for this indicator
39.5 Recommendations
The percentage based scoring of this indicator could be reviewed for future studies.

ORE Catapult PN000113-FRT-002
CRMF 2015 Evidence log external Issue: FINAL 203
40 Offshore crew accommodation
CRMF workstream Level 1 indicator Level 2 indicator Level 3 indicator
Technology Operations and maintenance Operations and maintenance Offshore crew accommodation
40.1 Summary Analysis
Finding: On target
This indicator is assessed as on target. There is evidence of some projects using (or planning to use) offshore service vessels with crew accommodation for larger/further offshore sites. There was some
hesitance around the commercial viability of this type of logistics concept for projects in the operations phase, but there was some evidence that for major campaigns of maintenance intervention the concept is
already in use. Several projects have stated that service vessels will be a key part of their strategy in the future, with the recent introduction of the two ESVAGT vessels for Siemens and a similar contract with
MHI Vestas: an indication of the trend in this direction.
Last year this indicator was scored as ahead of target noting that whilst there had been some initial uses, launch and recover concepts were yet to be progressed. The step down to on target reflects the fact that
whilst service vessels exist and are starting to be used the concept is still far from standard practice for projects in the operations phase.
Evidence gathered in interview and questionnaire engagement suggested that the majority of operators were aware of and actively considering the concept of offshore crew accommodation (using service
vessels) in planning O&M strategies for future offshore projects, but that use on projects to date has been limited. Increasing focus on the service vessel concept is part of an overall picture of increasing
complexity in the O&M logistics concept. Operators now have a wide selection of options to consider when developing a logistics concept, and are seeking to strike the optimum balance of cost and accessibility
selecting from a combination of options including CTV, service vessel, fixed accommodation and helicopters. A particular example of complexity is the differing PPE requirements when transferring by vessel or
by helicopter hampering logistics efficiency. However it was clear that service vessels offering offshore crew accommodation look most relevant to projects further from shore.
Outlook: Industry score 6.2
There is uncertainty in the outlook for this indicator. On the one hand there is positivity in development and initial deployment of bespoke offshore service vessels for operational projects, however, the use on
existing projects which are already into their operational phase looks unlikely to be justifiable commercially, excepting major component replacement or other significant O&M campaigns. Hence a continuing
increase in the application of bespoke offshore wind service vessels will be directly linked to the development of sites which are further from shore sufficient to drive demand.
Please indicate your level of confidence in the
industry achieving the following by 2020 for
this indicator (1 Low confidence, 10 High
confidence)
Developer average WTG OEM Average Overall average
Bespoke offshore wind operations using large
offshore service vessels for all far offshore sites,
supported by two or more daughter vessels. This
will be combined with new processes to maximise
the efficiency of the vessels and personnel.
6.0 6.4 6.2

ORE Catapult PN000113-FRT-002
CRMF 2015 Evidence log external Issue: FINAL 204
40.2 Milestone scorecard
Milestone scorecard FID 2015 FID 2016 FID 2017 FID 2018 FID 2019
Ahead of target Use of floatels without high-
capability access methods
Partial use of purpose-built
motherships that can remain
permanently stationed at far
from shore sites and undertake
larger component replacement
Motherships for 50% of far-
offshore projects
Motherships for 90% of far-
offshore projects
Universal take up for far offshore
sites
On target Use of floatels without high-
capability access methods
Use of floatels without high-
capability access methods.
Designs emerging for high
capability access method
Partial use of purpose-built
motherships that can remain
permanently stationed at far
from shore sites and undertake
larger component replacement
Motherships for 50% of far-
offshore projects
Motherships for 90% of far-
offshore projects
Behind target Initial use of floatels Use of floatels without high-
capability access methods
Use of floatels without high-
capability access methods
Partial use of purpose-built
motherships that can remain
permanently stationed at far
from shore sites and undertake
larger component replacement
Motherships for 40% of far-
offshore projects
Missed target No interest in floatels First use of floatels Floatels unsuccessfully
deployed.
No designs for purpose built
motherships emerge.
First use of purpose-built
motherships that can remain
permanently stationed at far
from shore sites and undertake
larger component replacement
40.3 Evidence
40.3.1 Questionnaires
Category Questionnaire response
Describe your approach to floatels and/or offshore accommodation during the operational phase of your projects.
Dev None used nor planned.
Dev Still under consideration
Dev None

ORE Catapult PN000113-FRT-002
CRMF 2015 Evidence log external Issue: FINAL 205
Category Questionnaire response
Dev No experience yet, but under investigation.
WTG OEM No current projects using floatels.
WTG OEM The [WTG OEM] O&M strategy is a function of the size of the windfarm, distance from shore, service harbour capability, vessel availability, synergies with neighbouring projects etc. We will use floatels and offshore accommodation vessels when it makes economic and technical sense to do so.
40.3.2 Interview
Category Interview response
Describe your approach to floatels and/or offshore accommodation during the operational phase of your projects.
WTG OEM
• Using floating accommodation makes working time more efficient – more working hours on the turbine available • Has not seen the much talked of step change in access technologies • The additional cost for more advanced access systems are not necessarily offset by more advanced access times • Generally [WTG OEM] will use classic CTVs • The time in transit can be more of a challenge than ‘making the step’ • There is variance, but generally [WTG OEM] will provide CTVs for their projects
Dev • O&M phase was considering classic CTV • There were some options available for O&M port, which would have relied on slightly larger vessels, but most likely outcome for O&M exercises would be a fairly standard vessel • Comment that in general that there is not much improvement / innovation in this area which is have an impact on operational sites?. • A technically ideal vessel may not fit where cost still drives the selection of transfer vessels, think that this area needs significant effort expending
Dev • Regular CTVs are the main method of transfer right now. These are generally on standard leases • [Dev] are switching for [PROJECT] and [PROJECT] to an SOV which will be leased/rented/bought, more like an Oil and gas set up with support vessels on station. • O&M cost per MW will not be reduced, but cost versus using long CTV transfers will be lower, which is what drives the economy of SOVs for far shore sites. This is a result of reduced commuting time.
Dev • Turbine O&M vessels will be 3x CTV 12PAX. • Potential use of helicopters for emergency maintenance to back up CTV. • 1x CTV for BoP – will be shared with OFTO.
WTG OEM Generally more H&S driven than some areas, and will always be a balance of what project economics will support Far shore farms will require different solutions, CTV will not be possible
WTG OEM • Have seen that what’s available in the market is tending to improve, and they are watching closely what comes forward as this is a potentially very significant area.
O&M Currently rely on 20 - 22m CTVs. have learned how to work well with these are comfortable and expect these to continue to be the mainstay in near future. have some trials of wavecraft but there are questions of both technical viability, which may be mostly in hand, but also of commercial viability and applicability to specific sites, particularly decent sites. Expect that SOV may become more viable as the industry develops far shore R3 type sites, but for now O&M industry tends to rely on classic CTV.

ORE Catapult PN000113-FRT-002
CRMF 2015 Evidence log external Issue: FINAL 206
40.3.3 Market intelligence
40.4 Additional comments
Continued progress in this area will depend on farther from shore sites being developed.
40.5 Recommendations
This indicator could focus not only on just the availability of the asset but also how they are employed (the support strategy around them). It could also consider the impact or benefit on turbine availability (and
hence LCOE) that may be anticipated to result from varying offshore logistics strategies.
A broader recommendation from industry consultation, which is related, was the need for standardisation of HSE requirements both in terms of working practices but also across different countries representing
the EU market.
Evidence Source
In May 2015 it was announced that Tuco Marine Group will supply its 11m ProZero Wind Farm Service Vessel daughter crafts to the two Ulstein X-stern vessels
ordered by the German based Bernhard Schulte affiliate WINDEA Offshore GmbH. The vessels will go into charter for Siemens. And the daughter crafts will be
delivered from Tuco Marine in Q2 and Q3 2016.
http://maritime-executive.com/pressrelease/windea-chooses-tuco-marines-daughter-crafts

ORE Catapult PN000113-FRT-002
CRMF 2015 Evidence log external Issue: FINAL 207
41 OFTO O&M
CRMF workstream Level 1 indicator Level 2 indicator Level 3 indicator
Technology Operations and maintenance OFTO O&M OFTO O&M
41.1 Summary Analysis
Finding: Behind target
While OFTOs are actively considering options for cost reduction, there is limited evidence that the first incremental improvements are starting to be implemented.
Improvements such as vessel sharing happens naturally where operators have contracts to provide O&M services to the OFTO but no vessel sharing between OFTOs is evident.
A single OFTO evidenced use of condition monitoring to justify movement from OEM recommendations to reliability centred maintenance, which is an important first step but does not represent a full shift to a
condition-based maintenance approach to O&M. This places the indicator in the same place as last year, with some progress but not enough progress to maintain its 'on target' trajectory from last year, hence
falling 'behind target'.
There is significant progress in OFTOs awarding O&M contracts to 3rd party providers.
There is, however, slow progression in the provision of specifications and standards.
Outlook: Industry score of 6
There is a requirement to develop standards and specifications quickly to advance development of OFTO O&M. Currently, an OFTO asset is purchased as an integrated set of components, rather than a system
integrated based on its through life cost and integration of CBM approach. An increased focus on the operating cost of OFTO assets at the design stage would offer the potential for cost reduction but is not
incentivised by the current regime.
The OFTO regime in place in the UK is relatively unique in comparison to other countries with established offshore wind markets. Evidence suggests that the regime is cost competitive and drives reduction in
LCOE. However developers see the OFTO asset as one of the biggest risks and are exposed to being left with no recourse, this risk does not exist under alternative regimes. The possibility of OFTO build looks
fairly unlikely before 2020.
Please indicate your level of confidence in the
industry achieving the following by 2020 for
this indicator (1 Low confidence, 10 High
confidence)
OFTO average Electrical OEM Average Overall average
OFTOs utilise condition monitoring on majority of
assets, with some sharing of vessels and spares,
leading to cost savings of 10%
7.0 5.0 6.0

ORE Catapult PN000113-FRT-002
CRMF 2015 Evidence log external Issue: FINAL 208
41.2 Milestone scorecard
Milestone scorecard FID 2015 FID 2016 FID 2017 FID 2018 FID 2019
Ahead of target First improvements implemented
leading to cost reductions. Plans
for sharing of vessels discussed
Further improvements are
implemented on projects,
particularly in condition
monitoring. Vessels starting to
be shared
OFTOs able to demonstrate cost
savings. Vessels and spares
starting to be shared.
Enhanced sharing of vessels
and spares. Condition
monitoring being used on over
30% of OFTO assets.
OFTOs utilise condition
monitoring on majority of assets,
with some sharing of vessels
and spares, leading to cost
savings of 10%
On target First incremental improvements
starting to be implemented,
including enhanced condition
monitoring of assets.
First improvements implemented
leading to cost reductions. Plans
for sharing of vessels discussed
Further improvements are
implemented on projects,
particularly in condition
monitoring. Vessels starting to
be shared
OFTOs able to demonstrate cost
savings. Vessels and spares
starting to be shared.
Enhanced sharing of vessels
and spares. Condition
monitoring being used on over
30% of OFTO assets.
Behind target OFTOs actively investigating
options for cost reduction
First incremental improvements
starting to be implemented,
including enhanced condition
monitoring of assets.
First improvements implemented
leading to cost reductions. Plans
for sharing of vessels discussed
Further improvements are
implemented on projects,
particularly in condition
monitoring. Vessels starting to
be shared
OFTOs able to demonstrate cost
savings. Vessels and spares
starting to be shared.
Missed target n/a No cost reducing options
identified
No investigation by OFTOs into
savings
No improvements implemented First improvements implemented
41.3 Evidence
41.3.1 Questionnaires
Category Questionnaire response
Discuss any options you have witnessed or planning to implement for reducing the O&M cost for the OFTOs. e.g. condition monitoring technologies
Electrical OEM Although these are available on for example transformers, we see no specification requirements for condition monitoring. We believe this is driven by the desire to reduce CAPEX rather than later OPEX costs. We are not aware of any suggestions to share spares or vessels between wind farm projects.
Electrical OEM Whilst [Electrical OEM] can deploy condition monitoring technologies the primary focus has been to design out high maintenance items such as cranes, moving parts (e.g. fans, pumps etc.). This is a key design principle of the Offshore Transformer Module which will reduce OPEX costs by at least 15% as a result.
OFTO Recent efforts have focused on the enhancement of the supply chain by encouraging a number of tier 1 suppliers to enter the market and compete with the developer. Additionally examining synergy effects and sharing of spares.
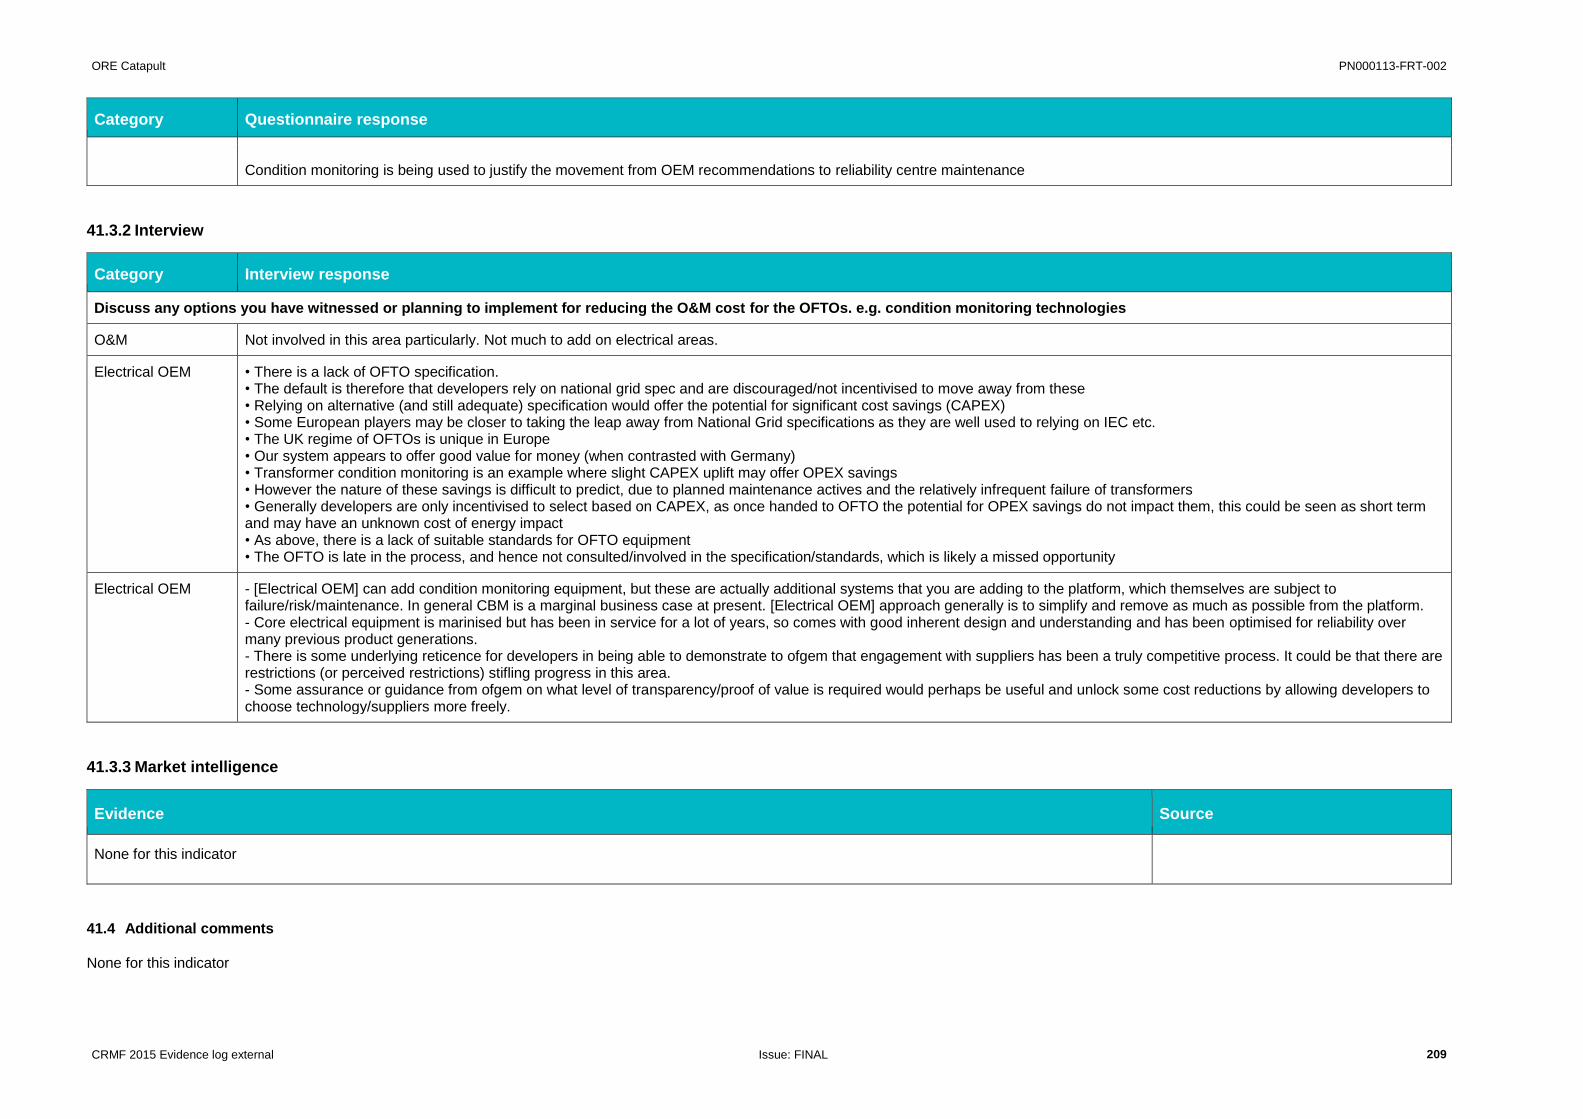
ORE Catapult PN000113-FRT-002
CRMF 2015 Evidence log external Issue: FINAL 209
Category Questionnaire response
Condition monitoring is being used to justify the movement from OEM recommendations to reliability centre maintenance
41.3.2 Interview
41.3.3 Market intelligence
41.4 Additional comments
None for this indicator
Category Interview response
Discuss any options you have witnessed or planning to implement for reducing the O&M cost for the OFTOs. e.g. condition monitoring technologies
O&M Not involved in this area particularly. Not much to add on electrical areas.
Electrical OEM • There is a lack of OFTO specification. • The default is therefore that developers rely on national grid spec and are discouraged/not incentivised to move away from these • Relying on alternative (and still adequate) specification would offer the potential for significant cost savings (CAPEX) • Some European players may be closer to taking the leap away from National Grid specifications as they are well used to relying on IEC etc. • The UK regime of OFTOs is unique in Europe • Our system appears to offer good value for money (when contrasted with Germany) • Transformer condition monitoring is an example where slight CAPEX uplift may offer OPEX savings • However the nature of these savings is difficult to predict, due to planned maintenance actives and the relatively infrequent failure of transformers • Generally developers are only incentivised to select based on CAPEX, as once handed to OFTO the potential for OPEX savings do not impact them, this could be seen as short term and may have an unknown cost of energy impact • As above, there is a lack of suitable standards for OFTO equipment • The OFTO is late in the process, and hence not consulted/involved in the specification/standards, which is likely a missed opportunity
Electrical OEM - [Electrical OEM] can add condition monitoring equipment, but these are actually additional systems that you are adding to the platform, which themselves are subject to failure/risk/maintenance. In general CBM is a marginal business case at present. [Electrical OEM] approach generally is to simplify and remove as much as possible from the platform. - Core electrical equipment is marinised but has been in service for a lot of years, so comes with good inherent design and understanding and has been optimised for reliability over many previous product generations. - There is some underlying reticence for developers in being able to demonstrate to ofgem that engagement with suppliers has been a truly competitive process. It could be that there are restrictions (or perceived restrictions) stifling progress in this area. - Some assurance or guidance from ofgem on what level of transparency/proof of value is required would perhaps be useful and unlock some cost reductions by allowing developers to choose technology/suppliers more freely.
Evidence Source
None for this indicator

ORE Catapult PN000113-FRT-002
CRMF 2015 Evidence log external Issue: FINAL 210
41.5 Recommendations
Consider revision of assessment methodology to include risk weighted cost element as only 0.1% for OFTO O&M whereas risk of stranded asset is much greater potential cost.

ORE Catapult PN000113-FRT-002
CRMF 2015 Evidence log external Issue: FINAL 211
42 Increased design life
CRMF workstream Level 1 indicator Level 2 indicator Level 3 indicator
Technology Increased design life Increased design life Increased design life
42.1 Summary Analysis
Finding: Ahead of target
This indicator has been assessed to be well ahead of target, with the 2020 target of 25 years almost universally adopted already.
Last year also scored this indicator as ahead of target with similar justification.
Evidence from industry engagement suggested that:
Some 20 year design life projects were still talked about, however,
The majority of designs are being based on a 25 year design life,
Some mention was made to tax depreciation rates limiting potential further extension (a finding common to last year’s study),
Life extension based on an increased understanding of real world performance is a possibility in future,
Structural health monitoring is increasing and an area which could unlock cost savings through design efficiencies and/or life extension,
The importance of full system (e.g. nacelle) endurance or lifetime testing as an opportunity to increase overall and individual subsystem design life, including gearboxes and power electronics.
Outlook: Industry score 8.3
The outlook for this indicator is positive, as the 2020 milestone has been met for the majority of projects already. However, significant progress beyond 25 year design life may be more challenging, with a
requirement for increased monitoring, particularly structures for fatigue life and of prognostics based remaining life predictions. The additional capital cost, and design practices may both be barriers to further
significant extension. Furthermore, design life is likely to be influenced as the first projects achieve their design life and experience around life extension and decommissioning are gained.
Please indicate your level of confidence in the industry
achieving the following by 2020 for this indicator (1 Low
confidence, 10 High confidence)
Developer average Overall average
Increase in the design life of wind farms from 20 years to 25 years 8.3 8.3

ORE Catapult PN000113-FRT-002
CRMF 2015 Evidence log external Issue: FINAL 212
42.2 Milestone scorecard
Milestone scorecard FID 2015 FID 2016 FID 2017 FID 2018 FID 2019
Ahead of target First projects designed for 25
years, with range of turbines for
this lifetime.
First project contracts for 25
years. Range of turbines on
market with longer design life
More projects contract using 25
year design life
Over 50% of projects contract
using longer design life
Over 75% of projects designed
for 25 years
On target Wind farms designed and
financed on basis of 20 years.
Turbine OEMs start to offer
longer design life products on
the market
First projects designed for 25
years, with range of turbines for
this lifetime.
First project contracts for 25
years. Range of turbines on
market with longer design life
More projects contract using 25
year design life
Over 50% of projects contract
using longer design life
Behind target Wind farms designed and
financed on basis of 20 years.
Wind turbines start to be offered
for 25 years
Wind farms designed and
financed on basis of 20 years.
Turbine OEMs start to offer
longer design life products on
the market
First projects designed for 25
years, with range of turbines for
this lifetime.
First project contracts for 25
years. Range of turbines on
market with longer design life
More projects contract using 25
year design life
Missed target No interest in longer design life Wind farms designed and
financed on basis of 20 years.
Wind turbines start to be offered
for 25 years
Wind farms designed and
financed on basis of 20 years.
Turbine OEMs start to offer
longer design life products on
the market
First projects designed for 25
years, with range of turbines for
this lifetime.
First project contracts using 25
year design life
42.3 Evidence
42.3.1 Questionnaires
Category Questionnaire response
What is the design life of your wind farms? Describe your approach to determining the design life of your wind farms.
Dev 20 to 25 years Design life is largely determined by WTG OEMs. Standards usually require a 20 year design life however most suppliers are now starting to offer 25 years. Rest of BOP is designed to meet and extend these figures.
Dev We are currently basing design on a minimum of 25 years design life, although some components may have a linger design life,

ORE Catapult PN000113-FRT-002
CRMF 2015 Evidence log external Issue: FINAL 213
Category Questionnaire response
There are some conflicts between the current standard of 20-25 year design life of turbines and the requirement for 40 year design life for transmission assets. We consider 25 years is appropriate for wind farm substructures at this point in time. At that point we would expect decisions to be made on extending the use of the facilities based on turbine technology available at that time, and the condition at that time of other windfarm components.
Dev 25 years Based on turbine design life and also the subsidy length.
WTG OEM Time value of money may not make that feasible. More steel to support +25 years life must be payed at year 0, with high impact on developers business case (IRR, NPV).
WTG OEM The 25 yr. design life of the [PRODUCT] is already market leading. We're not certain if the market requires a further increase in design life.
Explain what the current design life of your technology is and whether you are seeking to increase this?
Electrical OEM
General requirement for design life of substation equipment is 25 years. Extending life out to 40 years is possible and we see transformers of this age and older still on the UK grid. Similar life expectancy for primary equipment may be possible offshore although exposed elements such as transformer radiators sited outside are unlikely to survive this long in an offshore environment but could be changed during outages. It would be expected that computer and electronic components could be re-planted when they become obsolete and unsupported by the manufacturer. The above is standard practice for substation plant
Electrical OEM Design life varies by electrical asset. Increased design life has been discussed with several developers and OFTOs given its potential to reduce other costs such as insurances.
What are the barriers/challenges to increasing the design life?
Electrical OEM
It has to be accepted that the offshore wind application is a relatively small market for substation plant, most of which is sold into traditional onshore applications. Design life will therefore be led by the requirements for the larger market which is 25 years for primary plant. Making equipment specifically for offshore is unlikely to be economically viable. Standard equipment can be customized i.e. special paint finishes for offshore, but remains primarily conventional plant and this instance the special paint is to maintain the 25 years in a harsh environment
Electrical OEM Typically increasing design life means high standards and specifications which whilst technically feasible has the impact of increasing CAPEX. For the supply chain this is problematic when developers consider only the CAPEX of the transmission system as opposed to the LCOE of the asset as a whole.
42.3.2 Interview
Category Interview response
What is the design life of your wind farms? Describe your approach to determining the design life of your wind farms.
Dev • 30 years for structures • 28 years for turbines
• Has to take into consideration installation time. 25 years of operational time from completion of commissioning • Fatigue life has to take into consideration transport loadings.
Designer - 20 and 25 years have both been used as design life on specific projects. Detailed design for 20 underway, concept study for 25 years.
- Do not expect significant further design life extension to come in at the design phase.
- However life extension and overplanting in the future – 10 – 15 years is likely and foreseeable.

ORE Catapult PN000113-FRT-002
CRMF 2015 Evidence log external Issue: FINAL 214
42.3.3 Market intelligence
Dev - Extending design life beyond 25 years is not likely to make much difference in potential bid price.
- 20 – 25 years is likely to be optimal balance of CAPEX and consequent strike price
Discuss what you see as the main barriers to increasing the design life of your turbines.
WTG OEM
• Don’t believe that direct drive has any specific features or peculiarities that would particularly limit design life. • Nothing in design that has a feature or obvious barrier to running beyond 20 years, the industry standard of design life is minimum 20 years, although can acknowledge that every OEMs design life predictions at the moment are just that, as these machines have not been in the water for 20 years… yet. • Design life is not a topic which has really pressured them, in general it may be considered and investigated by customers, but is not likely to be a key risk consideration
WTG OEM
• Extension could be done, adding design life is fairly inexpensive • May need to change material (steel) quality or add material and have this be paid for at day one • Adding significant CAPEX to gain increased design life would have impact on LCOE but also on project finances/viability • From a purely engineering perspective it would not be a problem to add 5 years, but will most likely make the machine more expensive up front.
WTG OEM
- Foundations and towers are designed with ultimate load, fatigue load and natural frequencies as constraints. - Can clearly achieve a greater fatigue life with a more expensive foundation - If you wanted a higher life (35 years) this would fundamentally require more material - Is a 25 year turbine going to last 35 years? Could foresee that 80% or so might have no major incidents that could allow them to continue to economically operate - Highly optimised designs for a specific life is coming into other industries, e.g. consumer products last only their design life, not much more. Offshore wind is likely not near this at the moment but it would probably imply optimisation of components for design life if it did. - There are some bearings that shouldn’t fail at 25 years, but there are others that are reaching the start of a bathtub curve at 28 years etc…
Evidence Source
Atkins have been awarded the design contract for Dudgeon offshore windfarm. The design life is publicly stated as 25 years. http://www.atkinsglobal.com/en-gb/media-centre/news-releases/2014/march/2014-03-24
The Siemens SWT 6.0 turbine has obtained type certification by DNV GL this included testing and subsequent certification for 25 years lifetime http://www.siemens.com/press/en/pressrelease/?press=/en/pressrelease/2014/energy/wind-power/ewp201407059.htm&content[]=EW&content[]=WP
The Senvion 6.2M152 has been announced to have a design life of 25 instead of 20 years. https://www.senvion.com/global/en/press-media/press-releases/detail/senvion-successfully-commissions-its-largest-wind-turbine/
In the published supply chain plan for the East Anglia One project it is stated that operations and maintenance personnel will be required for the lifetime of the
assets, which is currently envisaged to be 25 years.
https://www.gov.uk/government/uploads/system/uploads/attachment_data/file/429411/EA1_SC_plan_600MW_DECC_Shortened_19.3.15.pdf
In the published supply chain plan for the Neart na Gaoithe project it is stated that there is a predicted 25 year operational life of the Neart Project https://www.gov.uk/government/uploads/system/uploads/attachment_data/file/429410/

ORE Catapult PN000113-FRT-002
CRMF 2015 Evidence log external Issue: FINAL 215
42.4 Additional comments
Real life experience needs to begin feeding into designs to achieve this trajectory, for example instrumentation and monitoring of gravity based foundations. In general there remains an opportunity to better
predict the end of life through better monitoring.
42.5 Recommendations
An increasing amount of structural health monitoring is taking place, which is likely to influence any further increase in design life, but is not specifically tracked by indicators at present.
UK02-1701-005-MRP-SUPPLY_CHAIN_PLAN-RPT-A2_-_final_redaction_applied.pdf
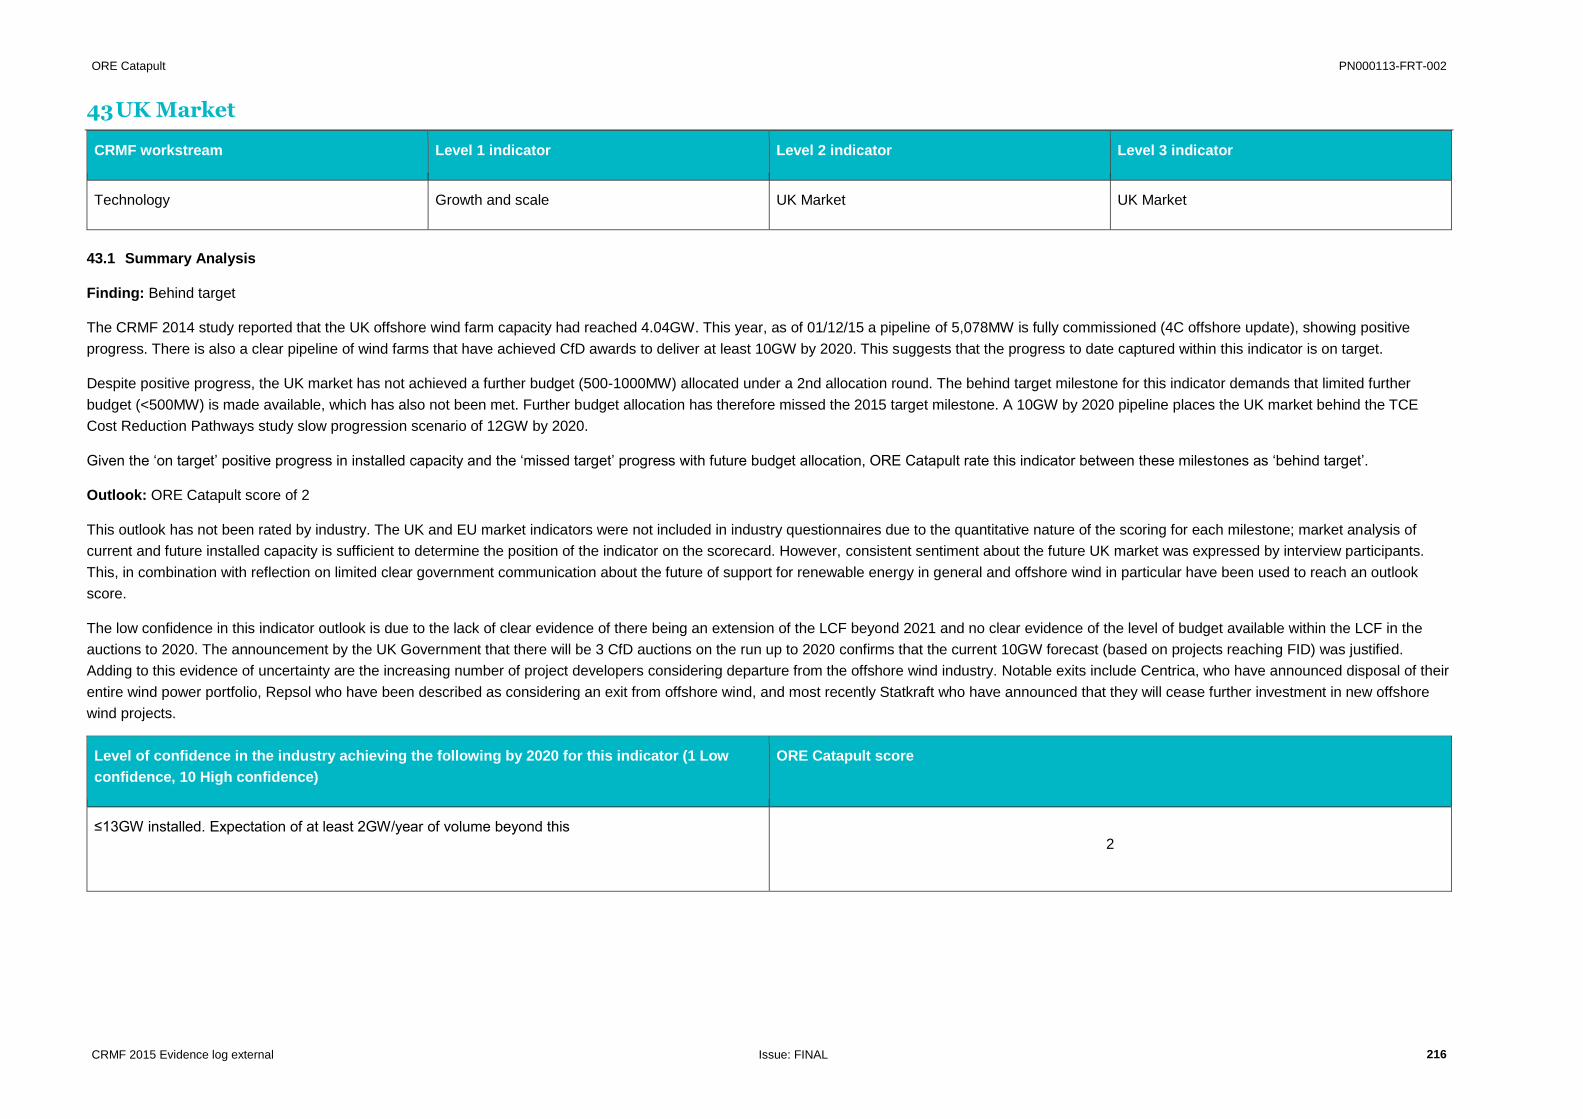
ORE Catapult PN000113-FRT-002
CRMF 2015 Evidence log external Issue: FINAL 216
43 UK Market
CRMF workstream Level 1 indicator Level 2 indicator Level 3 indicator
Technology Growth and scale UK Market UK Market
43.1 Summary Analysis
Finding: Behind target
The CRMF 2014 study reported that the UK offshore wind farm capacity had reached 4.04GW. This year, as of 01/12/15 a pipeline of 5,078MW is fully commissioned (4C offshore update), showing positive
progress. There is also a clear pipeline of wind farms that have achieved CfD awards to deliver at least 10GW by 2020. This suggests that the progress to date captured within this indicator is on target.
Despite positive progress, the UK market has not achieved a further budget (500-1000MW) allocated under a 2nd allocation round. The behind target milestone for this indicator demands that limited further
budget (<500MW) is made available, which has also not been met. Further budget allocation has therefore missed the 2015 target milestone. A 10GW by 2020 pipeline places the UK market behind the TCE
Cost Reduction Pathways study slow progression scenario of 12GW by 2020.
Given the ‘on target’ positive progress in installed capacity and the ‘missed target’ progress with future budget allocation, ORE Catapult rate this indicator between these milestones as ‘behind target’.
Outlook: ORE Catapult score of 2
This outlook has not been rated by industry. The UK and EU market indicators were not included in industry questionnaires due to the quantitative nature of the scoring for each milestone; market analysis of
current and future installed capacity is sufficient to determine the position of the indicator on the scorecard. However, consistent sentiment about the future UK market was expressed by interview participants.
This, in combination with reflection on limited clear government communication about the future of support for renewable energy in general and offshore wind in particular have been used to reach an outlook
score.
The low confidence in this indicator outlook is due to the lack of clear evidence of there being an extension of the LCF beyond 2021 and no clear evidence of the level of budget available within the LCF in the
auctions to 2020. The announcement by the UK Government that there will be 3 CfD auctions on the run up to 2020 confirms that the current 10GW forecast (based on projects reaching FID) was justified.
Adding to this evidence of uncertainty are the increasing number of project developers considering departure from the offshore wind industry. Notable exits include Centrica, who have announced disposal of their
entire wind power portfolio, Repsol who have been described as considering an exit from offshore wind, and most recently Statkraft who have announced that they will cease further investment in new offshore
wind projects.
Level of confidence in the industry achieving the following by 2020 for this indicator (1 Low
confidence, 10 High confidence)
ORE Catapult score
≤13GW installed. Expectation of at least 2GW/year of volume beyond this
2

ORE Catapult PN000113-FRT-002
CRMF 2015 Evidence log external Issue: FINAL 217
43.2 Milestone scorecard
Milestone scorecard FID 2015 FID 2016 FID 2017 FID 2018 FID 2019
Ahead of target ≤6GW operational. Clear
pipeline of projects able to
deliver at least 12GW by 2020,
with reasonable certainty of
financial support. Significant
(1GWe+) further budget
allocated under 2nd allocation
round.
≤7GW operational. ≤50g/kwh
2030 decarbonisation target set.
Extension of LCF beyond 2021.
≤8Gw installed. An additional
5GW expected to deliver out to
2020, with clear expectation of
at least 2GW/year of volume
beyond this
≤9.5Gw. expectation of at least
2GW/year of volume beyond this
≤11GW installed. Expectation of
at least 2GW/year of volume
beyond this
On target ≤5GW operational. Clear
pipeline of projects able to
deliver at least 10GW by 2020,
with reasonable certainty of
financial support. Further budget
(500-1000MWe) allocated under
2nd allocation round.
≤6GW. ≤100g/kwh 2030
decarbonisation target set.
Extension of LCF beyond 2021.
≤7Gw installed. An additional
4GW expected to deliver out to
2020, with clear expectation of
at least 1GW/year of volume
beyond this
≤8GW. Expectation of at least a
1GW/year market 2020-2023
≤9.5GW. Expectation of at least
1Gw/year market 2020-2024
Behind target ≤4GW operational. Clear
pipeline of projects able to
deliver at least 8GW by 2020,
with reasonable certainty of
financial support. Limited further
budget (<500MWe) allocated
under 2nd allocation round.
≤6GW. No decarbonisation
target or ≤200g/kwh 2030
decarbonisation target set.
Extension of LCF beyond 2021.
≤6GW installed. An additional
3GW expected to deliver out to
2020, with clear expectation of
at least 0.5GW/year of volume
beyond this
≤7Gw. Expectation of at least a
0.5GW/year market 2020-2023
≤9GW. Expectation of at least a
0.5GW/year market 2020-2023
Missed target Financial support available likely
to support 6GW by 2020
Financial support available likely
to support 6GW by 2020. No
visibility beyond that
No 2030 decarbonisation target
set. Financial support available
likely to support 6GW by 2020.
No visibility beyond that
Financial support available likely
to support 6GW by 2020. No
visibility beyond that
Financial support available likely
to support 6GW by 2020. No
visibility beyond that

ORE Catapult PN000113-FRT-002
CRMF 2015 Evidence log external Issue: FINAL 218
43.3 Evidence
43.3.1 Questionnaires
Category Questionnaire response
None for this indicator None for this indicator
43.3.2 Interview
Category Interview response
Electrical OEM • The potential savings associated with economy of scale are only partly being realised, and there is a lot more scope for cost reduction based on this • [Electrical OEM] are willing to engage and see the value in CRMF • They are as a company invested in the success of offshore wind • However, if their business was dependant on offshore wind alone (not supported by consistent grid/other work) it would not survive • Offshore wind is seen as an unreliable/volatile market to serve
Dev - Positive message is that the cost of energy has been decreasing and can be shown in evidence, the industry should be confident in describing the good work that has happened so far. - Positive message about UK content, RUK are looking at a local content report, and there are some positive messages that can be found (case studies?) where it can be demonstrated that supply chain plan requirement is driving positive outcomes for jobs/skills etc in the UK. - Timescales of CfD are a very short turnaround. Suppliers are being asked to produce a number of tender rounds while design advances, developers cannot go out to market with a final design, - Auction mechanisms should logically drive whole of supply chain to sharpen their offer - Each auction process should also logically be expected to see a continuing reduction in cost. - There is an opportunity to show what the next/further reduced target price should be. - £100/MWh may not be sufficiently attractive to encourage a government appetite at present. - Tipping point for significant jacket manufacture investment is likely bigger than a single [PROJECT] size project, but difficult to say exactly what would be sufficient to attract the necessary investment in the supply chain to encourage new entrants, industrialisation etc.
Dev • Opinion statement that if there is a CfD round in 2017 it looks likely that the £100/MWH barrier will be broken.
Dev • Government and regime is currently the biggest barrier. Majority of cost reduction is coming from contractors: [COMPANY], [COMPANY] • Cost reduction has to come from supply chain, but if they do not see a pipeline in the UK they will not invest the necessary to make this happen. Will treat every project as bespoke and therefore are not incentivised to really drive at reducing LCOE.
WTG OEM • Postponing of CfD, uncertainty about market volume in the UK is a concern and is generally already being communicated by the industry. • No stability or certainty about when next round may happen. • Stop and go in policy is not helpful. Slight increase in volume may be beneficial but real challenge is consistency
Dev • [Dev] would agree that auction process and uncertainty is most important thing now • Ripples of the effect of this process travel right through the supply chain • Supply chain generally are perhaps less interested/focused on UK market as a result of uncertainty/peaks and troughs • Having recently had a project refused consent [Dev] see visibility and continuation of auction process as the main issue for the UK industry at the moment
WTG OEM - There is a big issue around market certainty, what was referred to as ‘industrialisation’ of the industry in the pathways report has not happened. [WTG OEM] developing [PROJECT] is more or less a one off, in terms of industrialisation of offshore wind in the UK. The potential for some cost reductions in supply chain (foundations, jackets in particular) have therefore probably been missed or at least delayed. - The fact that LCOE has continued to decrease shows that missing out on ‘industrialisation’ has been compensated for by moving faster than was projected on turbines, in particular the development and deployment of the new generation of turbines. - The larger turbines are a one off win, whereas industrialisation would have been a continuing process and would have been delivering more cost reductions now. - Cost reduction is a long journey, and there should be recognition that the industry and particular the supply chain are focused and collectively driving hard work to reduce costs.

ORE Catapult PN000113-FRT-002
CRMF 2015 Evidence log external Issue: FINAL 219
- UK over next few years will install another 5GW. Technology and projects can easily cope with this as it represents no acceleration of the capacity for new installations already happening at present. This means no growth, which will not incentivise the supply chain. Additionally there is no visibility to encourage long term investment to gain work post 2020 – as market is unknown. - Round 3 has really evolved into developing the most round 2 like (e.g. easiest) projects first. More challenging (farther offshore) sites have consequently remained on the drawing board. - It would be much harder for those in the supply chain to make investment decisions of 5 years ago in UK facilities (for example) today, as the potential market size and unserved capacity is no longer there.
Installation - We need a clear view of what is beyond current tranche of projects, This would allow [Installation] to take a longer term view of return on investment.
Electrical OEM - Certainty is the main comment. There is a requirement for more certainty from the whole industry. - The industry does not know when next CfD round will be. How much funding will be available, and what the outlook beyond 2020 will be. - There is concern being caused by some of the recent/short term political messaging around the future for the industry. - The lack of UK certainty means that [Electrical OEM] look to push into other markets. - Lack of certainty makes investment decisions for R&D a lot more difficult. The only way to justify developing the next innovation or next generation of any technology for offshore wind is currently to look away from the UK and base decisions on the potential for global markets/no UK potential. - Reference previous ‘OFTO gap’ situation for downsides associated with uncertainty. - New entrants looking to make investment decisions to get into the industry will be discouraged from doing so at present.
Foundation - Like everybody else, the view from 2020 onwards is important. If CfD regime is going to change, the sooner the industry is aware the better they will be able to react. Even if it is bad news, better to know now and be able to deal with consequences. - Some members of supply chain may yet consolidate (as a result of O&G price slump) fabricators would really be interested in offshore wind work now, not in 17/18. - Similarly if oil price recovers in conjunction with 17/18 uptick in offshore wind work there could be a market capacity crunch – particularly in jacket manufacture some developers are considering this as a significant risk.
Dev - Developers would like to deliver the UK an offshore wind farm as cheaply as possible. At present they are not able to do this, because they do not have a CfD mechanism. - If government want to drive efficiency and have the UK remain as number 1 in offshore wind the decision to deliver capacity has to be made, committed to, and not just one year at a time, longer term visibility is required. - People have to see the investability of the UK, not much more is coming beyond those currently projects in the pipeline, i.e. there is no real long term vision. - Further offshore and deeper waters will also be in the mix on the journey of costs, and will have their own implications. - Without visibility and security a subsequent vision, a single further auction round does not really help the industry. It’s a sticking plaster, very short term appeasement, but gives minimal supply chain innovation and other indirect participants in the industry will not be motivated. - Current Dutch system gives visibility of what capacity will be coming year on year. This really delivers buy in from the industry in that country as everyone has visibility of what is coming in the future. - Government can control ultimate liability by setting targets on strike price. - Equity IRRs are reducing. This is reasonable, but they can only go so far without losing investors.
Designer - Certainty is required for the industry. [Designer] are less exposed than some in supply chain but have suffered from cancelled projects when they have invested in skills and equipment to be able to serve projects which have subsequently been cancelled. - If the supply chain have to chase more projects harder to win one (as is now the case under auction based regime) it will tend to mean that when they do win, individual projects will have to cost more to support all of the tendering effort. - Spending the time and effort doing upfront work will certainly reduce costs. Designers do have strategies which can optimise on costs, but they can only achieve maximum cost reduction when a project fully engages with them at an early stage, which developers cannot do at present. - In the industry in general, the way things are being driven at the moment is that very little work will be done upfront, as a result of the significant risk that a project will not get consent and/or CfD. Whilst the auction mechanism will squeeze developers on price, it is likely that they could have designed lower cost projects if they were able to interact with designers and the supply chain at an earlier stage.

ORE Catapult PN000113-FRT-002
CRMF 2015 Evidence log external Issue: FINAL 220
43.3.3 Market intelligence
Evidence Source
Centrica have announced disposal of its entire wind power portfolio http://renews.biz/92654/centrica-offloads-
wind-portfolio/
Repsol have been described as considering an exit from offshore wind. They failed to secure a CfD for their Inch Cape project in the first auction round and have
been reported to be considering sale of both Inch cape and their share (25%) in the Beatrice offshore wind project.
Renews issue 325
Statkraft have announced that they will halt any further future investment in new offshore wind. They have stated that “Offshore wind power is capital intensive.
The reduced financial terms from the owner entail that it is not possible for Statkraft to invest in new offshore wind projects”
http://renews.biz/100883/statkraft-pulls-
plug-on-offshore
5078 MW fully commissioned in the UK. 4COffshore_MarketOverview_20151130
Speech by Amber Rudd, Energy Minster, announcing 3 more CfD auctions to 2020. https://www.gov.uk/government/speeches/a
mber-rudds-speech-on-a-new-direction-for-
uk-energy-policy
Fully commissioned capacity in the UK now stands at 5,054MW RUK Offshore wind project intelligence,
October 2015

ORE Catapult PN000113-FRT-002
CRMF 2015 Evidence log external Issue: FINAL 221
Figure 7 - UK and EU commissioning profile
0
5,000
10,000
15,000
20,000
25,000
30,000
0
500
1,000
1,500
2,000
2,500
3,000
3,500
4,000
4,500
5,000
2015 2016 2017 2018 2019 2020
Cum
ula
tive M
W
Annual M
W
UK and EU commissioning profile
UK Annual Other EU Annual
UK Cumulative Total EU Cumulative

ORE Catapult PN000113-FRT-002
CRMF 2015 Evidence log external Issue: FINAL 222
Figure 8 - Cumulative capacity by windfarm status
5.15.6
7.2
9.4
10.4
11.5
13.0
0
2
4
6
8
10
12
14
2015/16 2016/17 2017/18 2018/19 2019/20 2020/21 2021/22
Capacity (
GW
)Cumulative capacity by windfarm status
Existing capacity Current Construction Projects
ROC Accreditation Grace Period FID Enabling Projects
CfD Contracted Unspecified

ORE Catapult PN000113-FRT-002
CRMF 2015 Evidence log external Issue: FINAL 223
43.4 Additional comments
Whilst this indicator seeks to track the scale of the market, it is apparent from industry feedback that visibility of future market is also closely related, and is of critical importance when considering the potential for
cost reduction.
43.5 Recommendations
None for this indicator
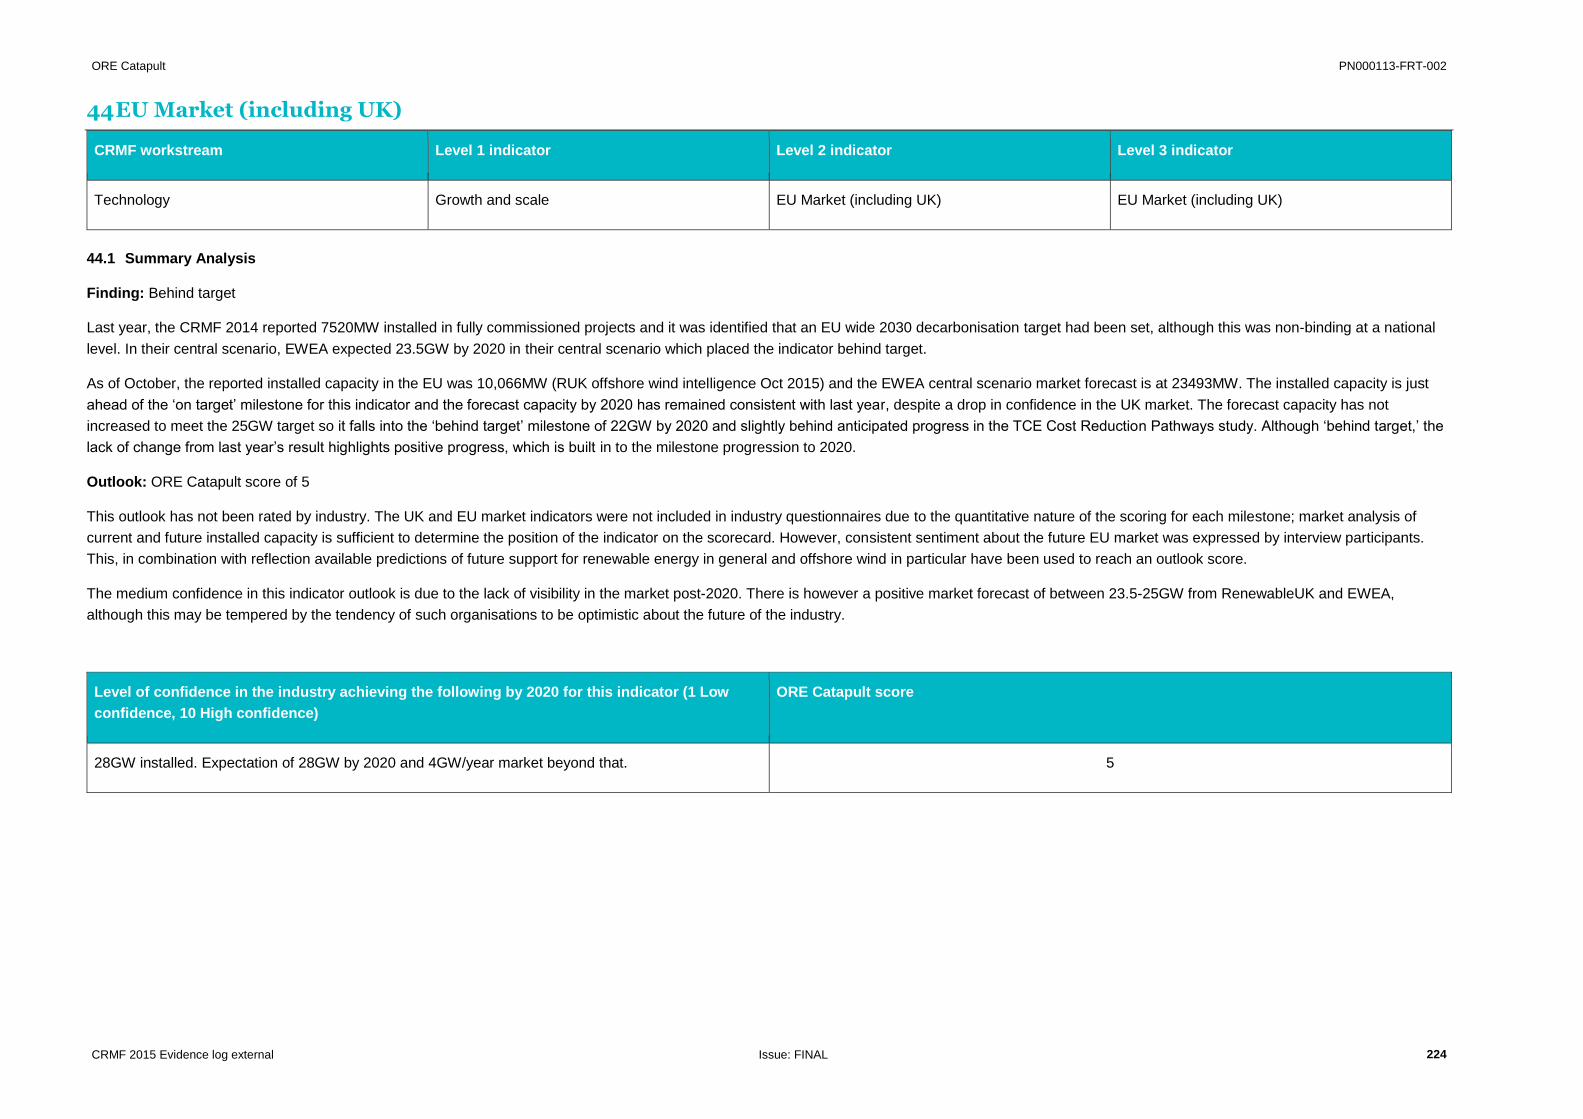
ORE Catapult PN000113-FRT-002
CRMF 2015 Evidence log external Issue: FINAL 224
44 EU Market (including UK)
CRMF workstream Level 1 indicator Level 2 indicator Level 3 indicator
Technology Growth and scale EU Market (including UK) EU Market (including UK)
44.1 Summary Analysis
Finding: Behind target
Last year, the CRMF 2014 reported 7520MW installed in fully commissioned projects and it was identified that an EU wide 2030 decarbonisation target had been set, although this was non-binding at a national
level. In their central scenario, EWEA expected 23.5GW by 2020 in their central scenario which placed the indicator behind target.
As of October, the reported installed capacity in the EU was 10,066MW (RUK offshore wind intelligence Oct 2015) and the EWEA central scenario market forecast is at 23493MW. The installed capacity is just
ahead of the ‘on target’ milestone for this indicator and the forecast capacity by 2020 has remained consistent with last year, despite a drop in confidence in the UK market. The forecast capacity has not
increased to meet the 25GW target so it falls into the ‘behind target’ milestone of 22GW by 2020 and slightly behind anticipated progress in the TCE Cost Reduction Pathways study. Although ‘behind target,’ the
lack of change from last year’s result highlights positive progress, which is built in to the milestone progression to 2020.
Outlook: ORE Catapult score of 5
This outlook has not been rated by industry. The UK and EU market indicators were not included in industry questionnaires due to the quantitative nature of the scoring for each milestone; market analysis of
current and future installed capacity is sufficient to determine the position of the indicator on the scorecard. However, consistent sentiment about the future EU market was expressed by interview participants.
This, in combination with reflection available predictions of future support for renewable energy in general and offshore wind in particular have been used to reach an outlook score.
The medium confidence in this indicator outlook is due to the lack of visibility in the market post-2020. There is however a positive market forecast of between 23.5-25GW from RenewableUK and EWEA,
although this may be tempered by the tendency of such organisations to be optimistic about the future of the industry.
Level of confidence in the industry achieving the following by 2020 for this indicator (1 Low
confidence, 10 High confidence)
ORE Catapult score
28GW installed. Expectation of 28GW by 2020 and 4GW/year market beyond that. 5
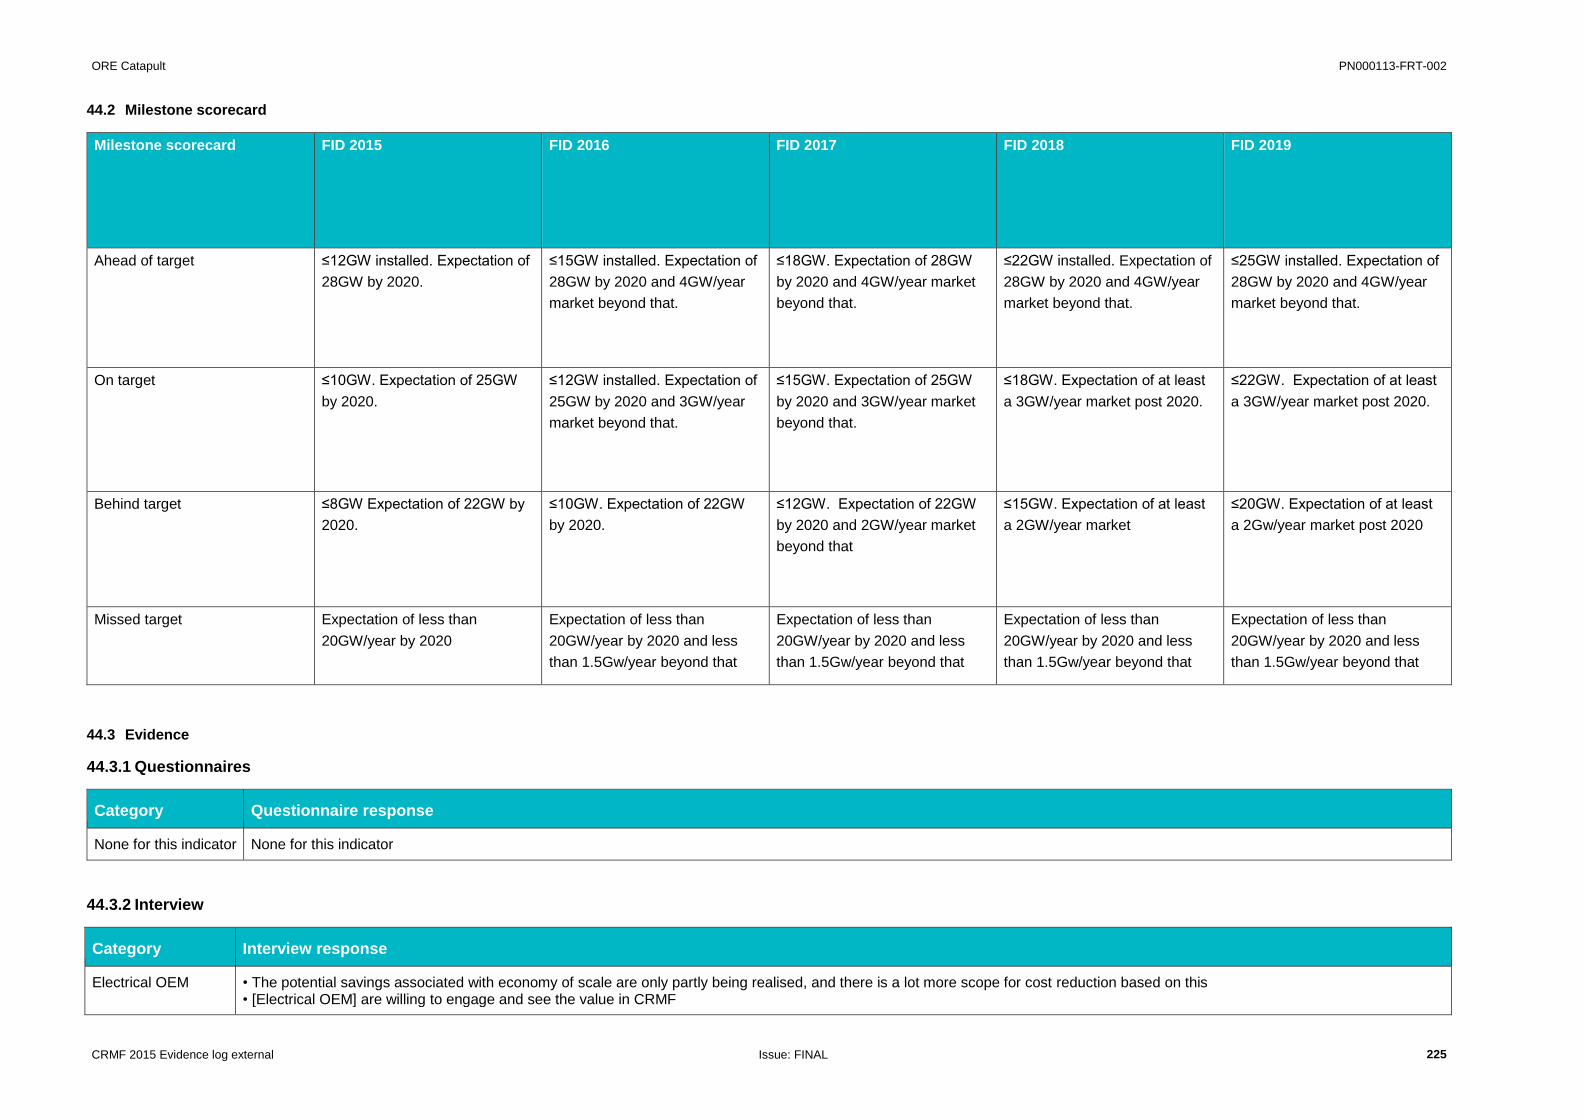
ORE Catapult PN000113-FRT-002
CRMF 2015 Evidence log external Issue: FINAL 225
44.2 Milestone scorecard
Milestone scorecard FID 2015 FID 2016 FID 2017 FID 2018 FID 2019
Ahead of target ≤12GW installed. Expectation of
28GW by 2020.
≤15GW installed. Expectation of
28GW by 2020 and 4GW/year
market beyond that.
≤18GW. Expectation of 28GW
by 2020 and 4GW/year market
beyond that.
≤22GW installed. Expectation of
28GW by 2020 and 4GW/year
market beyond that.
≤25GW installed. Expectation of
28GW by 2020 and 4GW/year
market beyond that.
On target ≤10GW. Expectation of 25GW
by 2020.
≤12GW installed. Expectation of
25GW by 2020 and 3GW/year
market beyond that.
≤15GW. Expectation of 25GW
by 2020 and 3GW/year market
beyond that.
≤18GW. Expectation of at least
a 3GW/year market post 2020.
≤22GW. Expectation of at least
a 3GW/year market post 2020.
Behind target ≤8GW Expectation of 22GW by
2020.
≤10GW. Expectation of 22GW
by 2020.
≤12GW. Expectation of 22GW
by 2020 and 2GW/year market
beyond that
≤15GW. Expectation of at least
a 2GW/year market
≤20GW. Expectation of at least
a 2Gw/year market post 2020
Missed target Expectation of less than
20GW/year by 2020
Expectation of less than
20GW/year by 2020 and less
than 1.5Gw/year beyond that
Expectation of less than
20GW/year by 2020 and less
than 1.5Gw/year beyond that
Expectation of less than
20GW/year by 2020 and less
than 1.5Gw/year beyond that
Expectation of less than
20GW/year by 2020 and less
than 1.5Gw/year beyond that
44.3 Evidence
44.3.1 Questionnaires
Category Questionnaire response
None for this indicator None for this indicator
44.3.2 Interview
Category Interview response
Electrical OEM • The potential savings associated with economy of scale are only partly being realised, and there is a lot more scope for cost reduction based on this • [Electrical OEM] are willing to engage and see the value in CRMF

ORE Catapult PN000113-FRT-002
CRMF 2015 Evidence log external Issue: FINAL 226
• They are as a company invested in the success of offshore wind • However, if their business was dependant on offshore wind alone (not supported by consistent grid/other work) it would not survive • Offshore wind is seen as an unreliable/volatile market to serve
Dev - Are operating in different geographies with different technologies, e.g. most appropriate turbines for market may differ by projects. Not much opportunity to standardise internationally. But there would be a good opportunity to further drive down costs by using experience of one UK project to directly feed into improvements for the next, but cannot do this proactively at the moment as there is no visibility of what is coming next
Dev • Opinion statement that if there is a CfD round in 2017 it looks likely that the £100/MWH barrier will be broken.
Dev • Government and regime is currently the biggest barrier. Majority of cost reduction is coming from contractors: [COMPANY], {COMPANY] etc. • Cost reduction has to come from supply chain, but if they do not see a pipeline in the UK they will not invest the necessary to make this happen. Will treat every project as bespoke and therefore are not incentivised to really drive at reducing LCOE.
WTG OEM • Postponing of CfD, uncertainty about market volume in the UK is a concern and is generally already being communicated by the industry. • No stability or certainty about when next round may happen. • Stop and go in policy is not helpful. Slight increase in volume may be beneficial but real challenge is consistency
Dev • [Dev] would agree that auction process and uncertainty is most important thing now • Ripples of the effect of this process travel right through the supply chain • Supply chain generally are perhaps less interested/focused on UK market as a result of uncertainty/peaks and troughs • Having recently had a project refused consent [Dev] see visibility and continuation of auction process as the main issue for the UK industry at the moment
WTG OEM - There is a big issue around market certainty, what was referred to as ‘industrialisation’ of the industry in the pathways report has not happened. [WTG OEM] developing [PROJECT] is more or less a one off, in terms of industrialisation of offshore wind in the UK. The potential for some cost reductions in supply chain (foundations, jackets in particular) have therefore probably been missed or at least delayed. - The fact that LCOE has continued to decrease shows that missing out on ‘industrialisation’ has been compensated for by moving faster than was projected on turbines, in particular the development and deployment of the new generation of turbines. - The larger turbines are a one off win, whereas industrialisation would have been a continuing process and would have been delivering more cost reductions now. - Cost reduction is a long journey, and there should be recognition that the industry and particular the supply chain are focused and collectively driving hard work to reduce costs. - UK over next few years will install another 5GW. Technology and projects can easily cope with this as it represents no acceleration of the capacity for new installations already happening at present. This means no growth, which will not incentivise the supply chain. Additionally there is no visibility to encourage long term investment to gain work post 2020 – as market is unknown. - Round 3 has really evolved into developing the most round 2 like (e.g. easiest) projects first. More challenging (farther offshore) sites have consequently remained on the drawing board. - It would be much harder for those in the supply chain to make investment decisions of 5 years ago in UK facilities (for example) today, as the potential market size and unserved capacity is no longer there.
Installation - We need a clear view of what is beyond current tranche of projects, This would allow [Installation] to take a longer term view of return on investment.
Electrical OEM - Certainty is the main comment. There is a requirement for more certainty from the whole industry. - The industry does not know when next CfD round will be. How much funding will be available, and what the outlook beyond 2020 will be. - There is concern being caused by some of the recent/short term political messaging around the future for the industry. - The lack of UK certainty means that [Electrical OEM] look to push into other markets. - Lack of certainty makes investment decisions for R&D a lot more difficult. The only way to justify developing the next innovation or next generation of any technology for offshore wind is currently to look away from the UK and base decisions on the potential for global markets/no UK potential. - Reference previous ‘OFTO gap’ situation for downsides associated with uncertainty. - New entrants looking to make investment decisions to get into the industry will be discouraged from doing so at present.
Foundation - Like everybody else, the view from 2020 onwards is important. If CfD regime is going to change, the sooner the industry is aware the better they will be able to react. Even if it is bad news, better to know now and be able to deal with consequences. - Some members of supply chain may yet consolidate (as a result of O&G price slump) fabricators would really be interested in offshore wind work now, not in 17/18. - Similarly if oil price recovers in conjunction with 17/18 uptick in offshore wind work there could be a market capacity crunch – particularly in jacket manufacture some developers are considering this as a significant risk.
ORE Catapult PN000113-FRT-002
CRMF 2015 Evidence log external Issue: FINAL 227
44.3.3 Market intelligence
Dev - Developers would like to deliver the UK an offshore wind farm as cheaply as possible. At present they are not able to do this, because they do not have a CfD mechanism. - If government want to drive efficiency and have the UK remain as number 1 in offshore wind the decision to deliver capacity has to be made, committed to, and not just one year at a time, longer term visibility is required. - People have to see the investability of the UK, not much more is coming beyond those currently projects in the pipeline, i.e. there is no real long term vision. - Further offshore and deeper waters will also be in the mix on the journey of costs, and will have their own implications. - Without visibility and security a subsequent vision, a single further auction round does not really help the industry. It’s a sticking plaster, very short term appeasement, but gives minimal supply chain innovation and other indirect participants in the industry will not be motivated. - Current Dutch system gives visibility of what capacity will be coming year on year. This really delivers buy in from the industry in that country as everyone has visibility of what is coming in the future. - Government can control ultimate liability by setting targets on strike price. - Equity IRRs are reducing. This is reasonable, but they can only go so far without losing investors.
Designer - Certainty is required for the industry. [Designer] are less exposed than some in supply chain but have suffered from cancelled projects when they have invested in skills and equipment to be able to serve projects which have subsequently been cancelled. - If the supply chain have to chase more projects harder to win one (as is now the case under auction based regime) it will tend to mean that when they do win, individual projects will have to cost more to support all of the tendering effort. - Spending the time and effort doing upfront work will certainly reduce costs. Designers do have strategies which can optimise on costs, but they can only achieve maximum cost reduction when a project fully engages with them at an early stage, which developers cannot do at present. - In the industry in general, the way things are being driven at the moment is that very little work will be done upfront, as a result of the significant risk that a project will not get consent and/or CfD. Whilst the auction mechanism will squeeze developers on price, it is likely that they could have designed lower cost projects if they were able to interact with designers and the supply chain at an earlier stage.
Evidence Source
• Five projects worth €7.1bn in total reached final investment decision stage, financing 1.8 GW of new gross capacity (Veja Mate, Rampion, Race Bank, Innogy
Nordsee, and Nordergrunde).
http://www.ewea.org/fileadmin/files/library/p
ublications/statistics/EWEA-European-
Offshore-Statistics-H1-2015.pdf .
• Refusal of Navitus Bay development consent on 11/09/2015. https://www.gov.uk/government/uploads/sy
stem/uploads/attachment_data/file/460324/
navitus_decision.pdf
EWEA scenarios for market forecasts to 2030 at 23493MW http://www.ewea.org/fileadmin/files/library/p
ublications/reports/EWEA-Wind-energy-
scenarios-2030.pdf
The European offshore wind industry key trends and statistics: EWEA July 2015 stated that As of 30 June 2015, cumulatively, there are 3,072 offshore wind
turbines with a combined capacity of 10,393.6 MW fully grid connected in European waters in 82 wind farms across 11 countries, including demonstration sites.
http://www.ewea.org/fileadmin/files/library/p
ublications/statistics/EWEA-European-
Offshore-Statistics-H1-2015.pdf
http://www.ewea.org/fileadmin/files/library/publications/reports/EWEA-Wind-energy-scenarios-2030.pdf
http://www.ewea.org/fileadmin/files/library/publications/reports/EWEA-Wind-energy-scenarios-2030.pdf

ORE Catapult PN000113-FRT-002
CRMF 2015 Evidence log external Issue: FINAL 228
Figure 9 - EU commissioning activity and forecast by country (MW). Source: RenewableUK Offshore wind project intelligence, October 2015

ORE Catapult PN000113-FRT-002
CRMF 2015 Evidence log external Issue: FINAL 229
44.4 Additional comments
None for this indicator
44.5 Recommendations
None for this indicator

ORE Catapult PN000113-FRT-002
CRMF 2015 Evidence log external Issue: FINAL 230
45 Turbines (competition within the industry)
CRMF workstream Level 1 indicator Level 2 indicator Level 3 indicator
Technology Competition within the industry Turbines Turbines
45.1 Summary Analysis
Finding: On target
This indicator has been scored as ‘on target’ for 2015. There are currently 4 OEMs with products on the market and offshore turbine track record (Siemens, MHI Vestas, Adwen and Senvion), however the market
is dominated by Siemens and only 3 of these OEMs have signed contracts to supply turbines for EU projects reaching FID in 2015. Similarly, if applying the CRP definition of a ‘proven’ turbine, only 3 OEMs are
actively marketing ‘proven’ turbine products. There is judged to be reasonable competition in offshore turbine supply, but the level of competition decreases for higher capacity machines, e.g. in the 7 – 8MW
range.
Last year the study also rated this indicator as on target, noting the dominance of Siemens, consolidation (JV’s above and GE Alstom) a pronounced pulling back by Samsung Heavy Industries, and a risk posed
by barriers to new entrants.
Evidence from industry engagement suggested that:
Several developers see the only real competition as between Siemens and MHI Vestas with 7MW and 8MW turbines respectively, with the signing of contracts for the V164 being an encouraging
development for competition,
The CfD process may be seen as discouraging developers to take a chance by selecting less experienced OEMs or new entrants due to perceived or actual increased risk,
There was some reference to the financing structure of a project having the potential to influence turbine OEM selection.
Outlook: ORE Catapult score of 6
The outlook for this indicator is positive, as despite consolidation and exit, a number of turbine OEMs are active in the market. The number of players in the market is consistent with the trajectory set by TCE
CRP study in 2012. New entrants, including with radical designs (e.g. 2B Energy, Kite Power Solutions) have begun to demonstrate prototypes but without a route to industrialisation, they face a significant
challenge in being selected to supply a commercial project in the UK by 2020. If the cost reduction promised by these novel designs is achieved, market penetration of novel designs is more likely post-2020. The
existing pipeline of EU projects looks likely to be sufficient to sustain around the current number of OEMs, but in general turbine supply is seen as less competitive than tier 1 suppliers in other industries, a
situation that looks unlikely to change significantly before 2020.
Please indicate your level of confidence in the industry achieving the following by 2020 for this
indicator (1 Low confidence, 10 High confidence)
ORE Catapult Average
Competitive market including entry of low cost competitors 6

ORE Catapult PN000113-FRT-002
CRMF 2015 Evidence log external Issue: FINAL 231
45.2 Milestone scorecard
Milestone scorecard FID 2015 FID 2016 FID 2017 FID 2018 FID 2019
Ahead of target >3 OEMs with "proven" products
active in the market
>3 OEMs with "proven" products
active in the market
>4 OEMs with "proven" products
active in the market
>4 OEMs with "proven" products
active in the market
>4 OEMs with "proven" products
active in the market
On target 3 OEMs with "proven" products
active in the market. At least one
other OEM starts construction of
turbines
4 OEMs with "proven" products
active in the market. At least one
other OEM starts to install new
turbines
4 OEMs with "proven" products
active in the market, including
successful commissioning and
operation of new OEMs product
4 OEMs with "proven" products
active in the market
4 OEMs with "proven" products
active in the market
Behind target 2 OEMs with "proven" products
active in the market. At least one
other OEM starts manufacturing
turbines at commercial scale
2 OEMs with "proven" products
active in the market. At least one
other OEM starts installing
turbines on commercial project
3 OEMs with "proven" products
active in the market, including
new entrant having
commissioned commercial scale
project
3 OEMs with "proven" products
active in the market
3 OEMs with "proven" products
active in the market
Missed target 1 OEM with "proven" products
active in the market
1 OEM with "proven" products
active in the market
1 OEM with "proven" products
active in the market
1 OEM with "proven" products
active in the market
1 OEM with "proven" products
active in the market
45.3 Evidence
45.3.1 Questionnaires
Category Questionnaire response
How many WTG OEMs would you consider to have proven offshore wind turbines available to the market?
Dev 4 – [COMPANY], [COMPANY], [COMPANY], [COMPANY]
Dev We consider 2 dominant players and some established players with offshore track record.
Dev 3
Dev 2 to 3
How would you rate competition in this market on the scale above? (1 Low competition to 4 High competition)

ORE Catapult PN000113-FRT-002
CRMF 2015 Evidence log external Issue: FINAL 232
Category Questionnaire response
Dev 3
Dev 2
Dev 3
Dev 2
Do you see this improving over the next three years?
Dev No
Dev With the current UK government approach to renewable generation, previous optimism about widening the supply chain has been diminished.
Dev Yes 3 proven but 4 new players emerging in the market
Dev Partly, mainly depending on market stability and planning security.
45.3.2 Interview
Category Interview response
How many WTG OEMs would you consider to have proven offshore wind turbines available to the market?
Dev • Market for turbine supply at the moment is quite limited, on paper it looks like there are a number of suppliers, but really only limited to 2 main suppliers • Because of the market volume there is not much innovation being driven in turbine design as there is not a lot of work to go around • Barrier in the UK to other entrants is getting worse; developers cannot afford to be carrying risk, the competitive nature of CfD process means that confidence proven designs is the key, and unproven designs have higher risk and as such are unlikely to get the head start they need. • Chicken and egg – new entrants need to prove themselves to get certainty and demonstrate track record, but can’t demonstrate without a track record • UK content requirement – it is not entirely clear what the consequences would be for using suppliers with varying levels of proven UK content.
Dev • 4 proven, would only buy from 2. • Not likely to look into Asian/cheaper turbines.
Dev - There are ~5 suppliers, which on paper looks like a competitive industry - But in reality, there are really only 2 suppliers who will be taken seriously - Samsung exit is poignant. - 5 players should in theory be enough to create competition, but in reality all projects in near future are likely to be either [COMPANY] or [COMPANY]. It is very unlikely that outside of French projects using French turbines anyone else will sign contracts for turbines other than [COMPANY] or [COMPANY]. - Chinese turbine OEMs will struggle to get a foothold in the European market, the potential method for entry could be Chinese banks backing a Chinese turbine to gain a track record. So whilst it is foreseeable that Chinese OEMs could gain a foothold it would be much further out, and the appetite for Chinese suppliers to plan to enter the UK market at present would likely be low because of lack of vision/certainty.
Dev Market is fairly narrow, but competition is slightly better that was the case last year - Reference to the 2x JVs: [COMPANY] / [COMPANY] - [COMPANY] on their own - [COMPANY] coming in to take over [COMPANY] - Probably means there are more capable and competitive organisations overall - Competition between [COMPANY] and [COMPANY] looks like things are more healthy than they were in terms of turbine OEM competition

ORE Catapult PN000113-FRT-002
CRMF 2015 Evidence log external Issue: FINAL 233
45.3.3 Market intelligence
45.3.4 Offshore turbines available
This table lists ‘Market available’ turbines, including those meeting the CRP definition of proven and available others.
Proven is defined (using the same methodology as CRP and CRMF 2014) as having all three of:
• 250 to 400 turbine-months of satisfactory accrued operational experience;
• 24 to 36 month of satisfactory operational experience on first prototype and;
• 12 to 24 month of satisfactory operational experience from a high energy site.
How would you rate competition in this market on the scale above? (1 Low competition to 4 High competition)
Dev • Competition in supply of turbines – 2
Evidence Source
None for this indicator
Turbine Model Rating (MW) Rotor diameter (m) Projects citing use Drivetrain Notes
‘Proven’ market available turbines
V112-3.3 MW Offshore (MHI Vestas Offshore Wind)
3.3 112 Kentish Flats Extension (UK)
Nobelwind (Belgium)
High speed geared
Siemens SWT 3.6 (107) 3.6 107 Lynn and Inner Dowsing (UK)
Burbo Bank (UK)
Gunfleet sands (UK)
Greater Gabbard (UK)
Gwynt y mor (UK)
Rhyl Flats (UK)
Sheringham Shoal (UK)
High speed geared

ORE Catapult PN000113-FRT-002
CRMF 2015 Evidence log external Issue: FINAL 234
Walney phase 1 (UK)
Siemens SWT 3.6 (120) 3.6 120 Lincs (UK)
London Array (UK)
Walney phase 2 (UK)
West of Duddon Sands (UK)
Arumbank West (Germany)
Butendiek (Germany)
Dan Tysk (Germany)
Baltic 2 (Germany)
Meerwind (Germany)
Riffgat (Germany)
Anholt (Denmark)
High speed geared
Siemens G4 (120) 4.0 120 Borkum Rifgrund 1 (Germany)
Formosa Demonstrator (Taiwan)
High speed geared
SWT-6.0-154 (Siemens) 6.0 154 Westernmost Rough (UK)
Gode wind (Germany)
Veja Mate (Germany)
Direct drive
6.2M 126 (Senvion) 6.15 126 Nordsee Ost (Germany)
Nordergrunde (Germany)
Nordsee One (Germany)
Thornton Bank phase 2 & 3
(Belgium)
High speed geared The 6M is an evolution of the 5M
turbine platform.
Other market available turbines

ORE Catapult PN000113-FRT-002
CRMF 2015 Evidence log external Issue: FINAL 235
V112-3.45 MW Offshore (MHI Vestas Offshore Wind)
3.45 112 Rampion (UK) High speed geared
Envision E128-3.6MW PP 2B 3.6 128 Osterlid prototype (Denmark) Direct drive Upwind, 2 bladed
Siemens G4 (130) 4.0 130 Sandbank (Germany)
Gemini (Netherlands)
High speed geared
Adwen AD 5-135 (Areva M5000) 5.0 135 Wikinger (Germany) Medium speed geared Although it has a track record of
several offshore projects the
Adwen AD 5-116 is not currently
marketed by Adwen.
Evidence suggests there is only
one prototype of the AD 5-135.
Wikinger have reached FID with
the AD 5-135 but this does not
meet the definition of ‘proven’ by
the assessment criteria.
Adwen AD5 -132 (Gamesa 5MW)
5.0 132 Arinaga quay prototype (Spain) Medium speed geared
SL 6000 128 (Sinovel) 6.0 128 High speed geared
2B6 (2B Energy) 6.0 140 Eemshaven prototype
(Netherlands)
High speed geared Downwind, 2 bladed
Haliade 150-6MW (Alstom Power)
6.0 150 Fecamp (France)
Saint Nazaire (France)
Calvados (France)
Block Island (USA)
Direct drive
6.2M 152 (Senvion) 6.15 152 High speed geared
SCD 6.0 (MingYang) 6.0 140 Medium speed geared
SCD 6.5 (MingYang) 6.5 130 Medium speed geared

ORE Catapult PN000113-FRT-002
CRMF 2015 Evidence log external Issue: FINAL 236
SWT-7.0-154 (Siemens) 7.0 154 Walney extension (UK)
Beatrice (UK)
East Anglia 1 (UK)
Direct drive
V164-8.0 MW (MHI Vestas Offshore Wind)
8.0 164 Burbo Bank extension (UK)
Dudgeon (UK)
Galloper (UK)
Race Bank (UK)
Walney extension (UK)
Borkum Riffgrund 2 (Germany)
Horns Rev 3 (Denmark)
Medium speed geared
AD 8-180 (Adwen) 8.0 180 Baie de Saint-Brieuc (France) Medium speed geared

ORE Catapult PN000113-FRT-002
CRMF 2015 Evidence log external Issue: FINAL 237
Figure 10 - Rating of proven and market available turbines
45.4 Additional comments
None for this indicator
3.303.60 3.60
4.00
6.006.15
3.453.60
4.00
5.00 5.00
6.00 6.00 6.006.15
6.00
6.50
7.00
8.00
0
1
2
3
4
5
6
7
8
9
10
Rating
(M
W)
Rating of proven and market available turbines
Proven Market available
Area of circle represents swept area of turbine

ORE Catapult PN000113-FRT-002
CRMF 2015 Evidence log external Issue: FINAL 238
45.5 Recommendations
None for this indicator

ORE Catapult PN000113-FRT-002
CRMF 2015 Evidence log external Issue: FINAL 239
46 Support structures (competition within the industry)
CRMF workstream Level 1 indicator Level 2 indicator Level 3 indicator
Technology Competition within the industry Support structures Support structures
46.1 Summary Analysis
Finding: On target
This indicator has been assessed as ‘on target’ for 2015. There are a large number of monopile suppliers, although the number of suppliers capable of delivering XL monopile is lower. There are a number of
jacket foundation fabricators and two of which have invested in production facilities for wind turbine jacket foundations.
Last year this indicator was also rated as ‘on target’, noting generally adequate levels of competition in both jacket and monopile supply.
Questionnaire and interview evidence indicated that:
• Competition in monopile supply is good, but the number of potential monopile suppliers is reduced substantially when considering the supply of XL monopiles, potentially as few as 3 European
competitors.
• There remains a hesitance around the entry of a low cost (non-European) suppliers, but there are several references to macroeconomic changes (of the price of steel) being likely to shift this sooner or
later.
• The cost of investment in steel rolling equipment is disproportionate to the level of industry demand, which may continue to act as a barrier to new monopile suppliers entering the market.
• If all possible projects move to construction there is a possibility of a highly competitive (tending towards under supply) serial jacket manufacturing market in the coming few years.
• Many respondents spoke of using split contracts for foundation supply, particularly for jacket foundations.
• Low levels of activity in UK foundation fabrication.
• Some responses consider fabricators with a strong track record in larger (oil and gas) jacket foundations as capable, or at least of relevance, when considering offshore wind turbine foundations.
Outlook: Industry score 5.5
The ORE Catapult view is that an outlook of around 5 is more appropriate for this indicator as between now and 2020 this market could go either way. Whilst there is a reasonably positive outlook for levels of
competition and future project pipeline, there remains uncertainty about the volume and long term stability of the foundation fabrication market. Potential influences include the low level of demand from the oil and
gas industry for foundation (particularly jacket) fabrication at present, a lack of continued investment in the supply chain, and the current and future direction of raw materials (steel) markets.

ORE Catapult PN000113-FRT-002
CRMF 2015 Evidence log external Issue: FINAL 240
46.2 Milestone scorecard
Milestone scorecard FID 2015 FID 2016 FID 2017 FID 2018 FID 2019
Ahead of target >5 active monopile suppliers
with 1 low cost competitor. 4 or
more jacket suppliers
>5 active monopile suppliers
with 1 low cost competitor. 4 or
more jacket suppliers
>6 active monopile suppliers
with 1 low cost competitor with 4
or more jacket suppliers
>6 active monopile suppliers
with 1 low cost competitor with 4
or more jacket suppliers
>6 active monopile suppliers
with 1 low cost competitor with 4
or more jacket suppliers and 2
GBS manufacturing facilities
with proven designs
On target 3-5 active monopile suppliers
with 1 low cost competitor. 2-3
jacket suppliers
3-5 active monopile suppliers
with 1 low cost competitor.
Another monopile supplier
develops capability to enter
market through expanding
factory. 2-3 jacket suppliers
4-6 active monopile suppliers
capable of manufacturing larger
monopiles with 1 low cost
competitor. 2-3 jacket suppliers
with purpose built factories
4-6 active monopile suppliers
capable of manufacturing larger
monopiles with 1 low cost
competitor. 2-3 jacket suppliers
with purpose built factories. GBS
manufacturing facility reaches
FID
4-6 active monopile suppliers
capable of manufacturing larger
monopiles with 1 low cost
competitor. 2-3 jacket suppliers
with purpose built factories. GBS
facility under construction
Behind target <3 active monopile suppliers
with no low cost competition. 2
jacket suppliers with purpose
built factories
<3 active monopile suppliers
with no low cost competition. 2
jacket suppliers with purpose
built factories
<4 active monopile suppliers
with no low cost competition. 2
jacket suppliers with purpose
built factories
<4 active monopile suppliers
with no low cost competition. 2
jacket suppliers with purpose
built factories
<4 active monopile suppliers
with no low cost competition. 2
jacket suppliers with purpose
built factories. No manufacturing
facility for GBS
Missed target 2 active monopile supplier. 1
active jacket supplier
3 active monopile supplier. 1
active jacket supplier
<3 active monopile suppliers. 1
jacket supplier
<3 active monopile suppliers. 1
jacket supplier
<3 active monopile suppliers. 1
jacket supplier
Please indicate your level of confidence in the
industry achieving the following by 2020 for
this indicator (1 Low confidence, 10 High
confidence)
Developer Average Designer Average Overall Average
A number of purpose built jacket manufacturing
facilities, fabricating optimised designs, using
standardised pipes, lengths and tools
4.0 7.0 5.5

ORE Catapult PN000113-FRT-002
CRMF 2015 Evidence log external Issue: FINAL 241
46.3 Evidence
46.3.1 Questionnaires
Category Questionnaire response
How many suppliers of monopiles would you consider are active in the market?
Dev Around 6 (Bladt/ Smulders/ EEW/ Ambau/ G&G International/ Arslef Bilfinger)
Dev We are not considering monopiles for any of our projects in 40-60m water depths.
Dev 4
Dev 9
How would you rate competition in this market on the scale above? (1 Low competition to 4 High competition)
Dev 3
Dev 3
Dev 3
Dev 3
Do you see this improving over the next three years?
Dev No – market volumes unlikely to be adequate enough to attract new competition
Dev This depends on the success of projects overcoming challenges to consents, being successful in winning electricity support price contracts and achieving FID.
Dev No if anything decline.
Dev Yes, current supplier investments indicate further development; however, this may be constrained by technical limitations.
How many suppliers of jackets would you consider are active in the market?
Dev Around 11 (Bifab, Bladt, Bilfinger, Daewoo, Dragados, G&G, Navantia, Nordesewerke, OGN, Smulders, STX)
Dev We currently see 6- 8 suppliers of jackets in Europe and Middle East. Of these only 3 have track record of serial production of jackets for offshore wind farms, but others have credible investment plans.
Dev 3
Dev 6 to 8

ORE Catapult PN000113-FRT-002
CRMF 2015 Evidence log external Issue: FINAL 242
46.3.2 Interview
Category Interview response
How many suppliers of monopiles would you consider are active in the market?
Dev • A handful, 5 – 8 • Can’t buy XL from many people.
Dev Less directly involved here
- Continual supply chain analysis and have been involved in the past
- Slightly greater competition in market for monopiles than for jackets
How many suppliers of jackets would you consider are active in the market?
Dev - Yes there is a possibility of a challenge for the industry in the supply chain around jacket supply - There are a relatively small number of experienced serial producers of jackets - Other players would like to take part but do not have experience, particularly of serialised production
Dev • Many can do • Only 1 bespoke serial manufacturer • Competition – 1 • Tendered for [PROJECT], and have seen the prices. • Outlook: will change, but others are well behind market leaders so may take some time to catch up.
Dev - Competition in jacket supply depends on market factors. - Local content is a big issue, but competitive pricing is also rules the decision making. There is therefore a balance to found for all developers. - Jackets are highly sensitive to labour costs. Exchange rates may also make European supply more attractive. - There could be bottlenecks to come, but this depends on what projects get delivered. For example if [PROJECT] or [PROJECT] etc go jackets or monopiles this will influence capacity in the market, as relatively large projects remain undecided on foundation type.
Dev There is reasonable competition here for jacket manufacture - Large fabricators had gone out of business in the past after large projects finished/dryed up - There 4 – 5 good fabricators out there, and so there looks to be reasonable competition - Jacket manufacture are expensive projects and generally suppliers will need a strong parent company to be able to survive through peaks and troughs of demand - Are hoping to see a benefit in commodity market price of steel continuing to reduce
How would you rate competition in this market on the scale above? (1 Low competition to 4 High competition)
Dev • Competition – 3 – 4
Do you see this improving over the next three years?
Dev - Foundations is an area which may be ripe for some innovation. Deeper water market is still somewhat up for grabs as there is not a clear ‘winner’ of the ideal solution for deeper water foundations. There is an opportunity for the supply chain to demonstrate industrialisation and subsequent cost reduction of foundation technologies for deeper water. Opportunity for improvement through innovation. - Tipping point for significant jacket manufacture investment is likely bigger than a single [PROJECT] size project, but difficult to say exactly what would be sufficient to attract the necessary investment in the supply chain to encourage new entrants, industrialisation etc.

ORE Catapult PN000113-FRT-002
CRMF 2015 Evidence log external Issue: FINAL 243
46.3.3 Market intelligence
Dev • Outlook: not much change
Foundation - Some larger projects will use split contracts for jacket supply. - There could well be a capacity constraint in the industry if all possible projects in pipeline do go ahead. - It is difficult to know how much of planned pipeline will go ahead, but if it does then most jacket manufacturers can expect plenty of work. - O&G market has declined, there is a chance that this will cause some capacity to come out of market before jacket manufacture really picks up (anticipated to be in a few years time).
Designer - There is certainly competition, but in general the market has some high barriers to entry. - Considering the design sector of the offshore wind market, [Designer] have fewer direct competitors in offshore wind than in other comparable industries. This is not to say that it is a dysfunctional market, rather than significant resource is required to be able to compete. - The offshore wind sector is not competitive in the same way as a long established industry e.g. conventional CCGT power where there are a larger number of players with longer track record/experience - There is capacity for jacket manufacture, but it is not based in the UK. Fabrication of jackets, and particularly serialised production will require an international supply chain
Dev - Many macroeconomic situations have influenced the market and the prices that are sustainable At the moment, particularly price of steel/oil etc. - Although saving material saves costs, This does Not necessarily mean that manufacture is cheaper. Small savings, e.g in steel from jacket structure is insignificant in grander scheme as market will change, and in particular installation costs will likely be the same. - There is across the industry a drive for achieving every Small efficiency that can possibly be found."
Evidence Source
• In late July 2014, 77 monopile foundations were installed in Borkum Riffgrund 1 having 6m diameter and 750 tonnes weight each. In addition, a new foundation
suction bucket jacket was installed for testing in the challenging sandy seabed as part of the cooperation of DONG Energy with the Carbon Trust OWA. All
foundations were manufactured by Bladt Industries.
http://analysis.windenergyupdate.com/construction/monopiles-remain-dominant-offshore-foundation-europe-consultant http://www.power-technology.com/projects/borkum-riffgrund-1-offshore-wind-farm/ http://www.4coffshore.com/windfarms/project-dates-for-borkum-riffgrund-i-de04.html http://www.4coffshore.com/windfarms/contracts-on-borkum-riffgrund-i-de04.html
• In February 2015, the developers of Fecamp have chosen to demonstrate and install Seatower's patented Cranefree Gravity foundation design. Bladt Industries
fabricated a series of XL monopile foundations which were installed at the Gode Wind Offshore Wind Farm in Germany. The foundation has 7.5 metres diameter,
67m length (33 metres water depth) and a maximum weight of 939 tonnes. Steelwind will provide 91 XL monopiles of 10m diameter, 120m length and weight 1500
tonnes. The first foundation is expected to be installed in July 2016.
http://analysis.windenergyupdate.com/construction/monopiles-remain-dominant-offshore-foundation-europe-consultant http://renews.biz/95641/last-one-in-at-gode/ http://www.dongenergy.com/en/media/newsroom/news/articles/first-foundation-successfully-installed1
• In March 2015, DONG Energy has awarded Ramboll the design of a reactive compensation substation for the Hornsea Project One offshore wind farm
development considering the concept of a traditional steel jacket and topside.
http://www.offshorewind.biz/2015/03/11/ramboll-to-design-innovative-substation-for-hornsea-one/

ORE Catapult PN000113-FRT-002
CRMF 2015 Evidence log external Issue: FINAL 244
46.4 Additional comments
None for this indicator
46.5 Recommendations
In future years this indicator could perhaps bring additional insight by being more prescriptive about the type of product and/or competition being assessed (e.g. monopile and jacket subcategories). It may also
become increasingly important to reflect on more novel foundation technologies (e.g. floating structures and suction bucket jackets).
• In February 2015, SPT Offshore has been awarded a design, fabrication and installation contract for an innovative four-legged jacket suction pile substation
foundation at Statoil’s 402MW Dudgeon offshore wind farm in the UK North Sea.
http://www.volker-stevin.com/en/about-us/news/detail/suction-pile-substation-foundation-contract-for-spt-offshore
• In June 2015, Spanish yard Navantia and partner Windar were to build the spar foundations for Statoil's 30MW Hywind 2 floating offshore wind project in
Scotland. Navantia started fabricating turbine jackets, and substation foundation and topsides for developer Iberdora's €1.4bn Wikinger project in the Baltic Sea. In
the same month, Universal Foundation’s suction bucket technology has been lined up for deployment at LEEDCo’s proposed 18MW Icebreaker offshore wind
project in the US Great Lakes. The foundation consists of a monopile with bucket and ice cone to protect it from ice flows.
http://renews.biz/89513/mono-bucket-lands-icebreaker-role/
• In late July, the first jacket foundation installed in Deepwater's farm in Block Island, US. Each steel latticework foundation for the Block Island Wind Farm has
been assembled in two main sections: the jacket, which measures 33.5m tall and will be secured to the ocean floor with piles, and the deck, which stands 18.3m
tall and will sit on top of the jacket. Each foundation weighs 400 tonnes. A wind turbine will be bolted onto a cylinder in the centre of the deck.
http://www.providencejournal.com/article/20150629/NEWS/150629272
• It has been reported that Mainstream Renewable Power will use Siemens' new offshore transformer module (OTM), instead of a traditional offshore substation,
at its 448MW Neart Na Gaoithe project in Scotland. Construction of the wind farm is estimated to begin in Q2 2018.
http://www.windpoweroffshore.com/article/1342475/neart-na-gaoithe-use-siemens-turbine-transformer
• Bilfinger received a EUR 25 million grant for foundation plant in Poland which will produce monopiles used in the offshore wind farms for water depth of 30
meters, jacket foundations for water depth of 50 meters and transition pieces, with a direct shipping route to the Baltic Sea and the North Sea.
http://www.cleantechnology-business-review.com/news/bilfinger-mars-offshore-to-provide-foundations-for-race-bank-wind-farm-in-uk-090715-4618578 http://www.4coffshore.com/windfarms/contracts-on-race-bank-uk18.html http://subseaworldnews.com/2015/03/18/bilfinger-secures-eur-25-mln-grant-for-foundations-plant-in-poland/

ORE Catapult PN000113-FRT-002
CRMF 2015 Evidence log external Issue: FINAL 245
47 HV Topside equipment (competition within the industry)
CRMF workstream Level 1 indicator Level 2 indicator Level 3 indicator
Technology Competition within the industry Electrical HV Topside equipment
47.1 Summary Analysis
Finding: On target
The 2015 finding for this indicator is ‘on target’. As there are at least 4 main suppliers of electrical equipment for HV topsides and significantly more fabricators working on substation platform design/integration
and manufacture. Last year the study also scored this indicator as ‘on target,’ finding 3 players with another notable entrant.
Evidence suggests that the main players in HV electrical equipment supply remain:
Siemens
ABB
Alstom
CG Systems
There was some variance in responses where some respondents clearly addressed the level of competition within HV topside fabrication, which appears generally high, and where others described competition in
electrical HV equipment supply, which is the area intended to be covered by this indicator. HV equipment supply still has a level of competition which remains lower than HV topside fabrication. There were also
descriptions of dynamics that suggested the number of participants does not always correlate directly with the level of competition. For example, suppliers can sometimes leverage engagement across a number
of contract packages (e.g. turbines and HV electrical).
Outlook: Industry score 8.5
As above, some respondents were optimistic about reaching this 2020 target due to misinterpretation of the indicator being about the substation fabrication market which is more competitive than HV electrical
supply. The ORE Catapult view is therefore that an outlook closer to 5 is more realistic for the 2020 outlook for this indicator. There remains a possibility that non-EU suppliers may enter the market, particularly
from Japan which could drive increased levels of competition. Commitment of potential new market entrants is uncertain.
Please indicate your level of confidence in the industry
achieving the following by 2020 for this indicator (1 Low
confidence, 10 High confidence)
Electrical OEM average Overall average
5-6 suppliers of HV topsides active in market 8.5 8.5

ORE Catapult PN000113-FRT-002
CRMF 2015 Evidence log external Issue: FINAL 246
47.2 Milestone scorecard
Milestone scorecard FID 2015 FID 2016 FID 2017 FID 2018 FID 2019
Ahead of target >6 suppliers of HV topsides
active in market
>6 suppliers of HV topsides
active in market
>6 suppliers of HV topsides
active in market
>6 suppliers of HV topsides
active in market
>6 suppliers of HV topsides
active in market
On target 4-5 suppliers of > HV Topsides
active in market. Developers
seeking to bring in new entrant
4-5 suppliers of > HV Topsides
active in market. Developer
helping bring in new entrant
5-6 suppliers of HV topsides
active in market
5-6 suppliers of HV topsides
active in market
5-6 suppliers of HV topsides
active in market
Behind target 2-3 suppliers of >120kV HV
topsides active in market
2-3 suppliers of >120kV HV
topsides active in market
3-4 suppliers of >120kV HV
topside equipment
3-4 suppliers of HV topsides
cables active in market
3-4 suppliers of HV topsides
cables active in market
Missed target <2 suppliers of HV topsides
active in market
<2 suppliers of HV topsides
active in market
<2 suppliers of HV topsides
active in market
<2 suppliers of HV topsides
active in market
<2 suppliers of HV topsides
active in market
47.3 Evidence
47.3.1 Questionnaires
Category Questionnaire response
How many suppliers of HV topside equipment do you think are active in the market?
Dev Between 10 - 15 suppliers for main component supply Fewer suppliers for topside fabrication
Dev Around 6 major supplies of HV equipment,
Dev 5
Dev 7
Electrical OEM We assume this means fabricators. We are aware of:

ORE Catapult PN000113-FRT-002
CRMF 2015 Evidence log external Issue: FINAL 247
Category Questionnaire response
Harland and Wolff, Bifab, Heerema, OGN, TAG, Babcock as current UK. Camel Laird is a possible Overseas, Europe: Bladt, Nordic Yards, Keppel Verolme, STX All except TAG, OGN and Camel Laird have substation experience, giving 8 fabricators with a track record
Electrical OEM Varies by equipment type but typically 6-8
How would you rate competition in this market on the scale above? (1 Low competition to 4 High competition)
Dev 4
Dev 3
Dev 3
Dev 2
Do you see this improving over the next three years?
Dev No change.
Dev HV equipment supplier are probably less dependent of offshore wind industry than WTG and substructure suppliers, so supply may grow with demand from other generation technologies and from growth demand for long distance offshore transmission interconnectors.
Dev Yes [COMPANY] brought out [PRODUCT] solution which we demand a response from competitors
Dev No
Electrical OEM Appetite amongst fabrication yards is dependent on the oil price. Currently this is low so there is a shortage of work in the oil and gas industry. An upturn in oil price would make wind farm projects less attractive - the margins they can make are not as good. This is completely outside of the control of the offshore wind industry.
47.3.2 Interview
Category Interview response
How many suppliers of HV topside equipment do you think are active in the market?
How would you rate competition in this market on the scale above? (1 Low competition to 4 High competition)
Dev • Competition 3 – 4
Dev - Electrical BOP is less competitive – maybe 3 – 4 suppliers only - If one of these was to exit it would be at risk of very low levels of competition - Other EU markets getting busy (Germany etc) could provide a stretch for these suppliers - [COMPANY], [COMPANY], [COMPANY]– only comfortable with these three for sharing tender information. - [COMPANY] [PRODUCT] an innovation, development benefit, expect others to offer something similar sooner or later
Do you see this improving over the next three years?
Electrical OEM • Generally this area has reasonable levels of competition • There is the realistic prospect of relevant new entrants (from Asian markets) but generally they are discouraged/unable to deal with UK/European standards

ORE Catapult PN000113-FRT-002
CRMF 2015 Evidence log external Issue: FINAL 248
47.3.3 Market intelligence
Evidence Source
• In October 2014, Sembmarine SLP Limited (SLP) a member of the Sembcorp Group of Companies announced that it has been awarded a contract to design
and build the offshore substation platform for the Dudgeon Offshore Wind Farm. DONG Energy Wind Power is developing the Hornsea Project One offshore wind
farm in the UK with estimated FID in Q2 2016.
http://sembmarineslp.com/news/sembmarine-slp-awarded-contract-offshore-transformer-station/
• Ramboll carried out the design of a reactive compensation substation for the wind farm, as well as technical assistance during tendering, fabrication and
installation. Ramboll also designed the topside layout to accommodate for utilities, equipment, SCADA systems, cable deck, laydown area, heli deck and
emergency accommodation area etc. The Hornsea One offshore reactive compensation substation will be standing in 23 m (75 ft.) of water.
http://www.ramboll.co.uk/projects/rog/hornsea-one-offshore-wind-farm
• Contract awarded to HSM offshore on November 2014 to conduct a detailed design (partly), procurement, construction, commissioning, load-out, transport and
hook-up of the AC transformer topside. As part of the establishment of the 400 MW Horns Rev C offshore wind farm, Energinet.dk has been appointed by the
Danish authorities to provide the AC transformer and the associated connection to the grid via high voltage submarine cable. The purpose of the offshore AC
transformer platform is to collect the electrical energy from the offshore wind farm, transform it to a higher voltage level and bring it to shore.
http://www.hsm.nl/index.php?category0=hsm_offshore&category1=en&category2=projects&category3=wind_energy&category4=horns_rev_c_offshore_high_voltage_substation
• In June 2015 Babcock confirmed that it had been contracted to design and fabricate the offshore substation topside and jacket for the Rampion offshore wind
farm. ABB will provide HV electrical equipment for this offshore substation.
http://www.4coffshore.com/windfarms/babc
ock-to-supply-rampion-substation-
nid1903.html
http://www.offshorewind.biz/2015/06/03/abb
-to-supply-set-up-rampions-electrical-
infrastructure/
• In June 2015 DONG Energy installed two offshore substations at the Gode Wind 1 and 2 wind farms in the German North Sea. The separate high-voltage
facilities for the 330MW and 252MW wind farms were built by a joint venture of Cofely Fabricom and Iemants yards in Hoboken, Belgium. Components were
supplied by DONG and the firms worked to DONG’s designs.
http://renews.biz/90628/dong-installs-gode-
substations/
• In June 2015 The FICG consortium of Cofely Fabricom, Iemants and CG, which was selected by Van Oord for the Gemini offshore wind project in the
Netherlands, finalised the construction of the two HV offshore substations. This is the sixth offshore project the consortium has shipped out since the first
collaboration in 2009. Other offshore wind projects finalised by the consortium are Belwind, Butendiek, Amrumbank, Luchterduinen and Humber Gateway.
http://www.offshorewind.biz/2015/08/17/ge
mini-offshore-substations-sail-out/
• In July 2015 STX announced that it had received orders for 2x 500MW offshore wind farm substations. STX also fabricated the topside and jacket foundation for
the Westernmost Rough offshore win farm.
http://www.offshorewind.biz/2015/07/07/stx-
france-announces-substation-orders-at-
facility-inauguration/
http://www.stxeurope.com//UK/stxfrance-
reference-39-Westermost%20Rough.awp

ORE Catapult PN000113-FRT-002
CRMF 2015 Evidence log external Issue: FINAL 249
47.4 Additional comments
None for this indicator
47.5 Recommendations
None for this indicator
• In October 2015 Alstom Grid completed commissioning of the Baltic 2 offshore substation. http://www.alstom.com/press-
centre/2015/10/alstom-completes-
commissioning-of-offshore-substation-for-
windpark-enbw-baltic-2-in-germany/

ORE Catapult PN000113-FRT-002
CRMF 2015 Evidence log external Issue: FINAL 250
48 HV cables (competition within the industry)
CRMF workstream Level 1 indicator Level 2 indicator Level 3 indicator
Technology Competition within the industry Electrical HV cables
48.1 Summary Analysis
Finding: On target
The 2015 finding for this indicator is ‘on target.’ While there are a number of suppliers active in the market, the level of competition has not increased since CRMF 2014.
Last year this indicator was also scored as ‘on target’ with a similar justification; while there are a sufficient number of suppliers to meet the ‘ahead of target’ rating, the level of competition, particularly in higher
voltage cables was thought to be low. This situation has not changed significantly since last year’s study.
7 HV export suppliers are found to have been contracted for EU projects reaching FID in 2015: Prysmian Powerlink, NKT Cables, ABB, NSW, Nexans France, J-Power Systems, LS Cable & System.
Evidence from developers confirmed that there is not a high level of competition in this market and that they would welcome low cost players entering the market to increase competition.
Outlook: Industry score of 7
The 2020 target for this indicator looks reasonably likely to be met, based on the number of suppliers, however the level of competition is unlikely to increase unless low cost entrants enter the market, which at
present is not guaranteed.
48.2 Milestone scorecard
Milestone scorecard FID 2015 FID 2016 FID 2017 FID 2018 FID 2019
Ahead of target >5 suppliers of >120kV HVAC
cables active in market
>5 suppliers of >120kV HVAC
cables active in market
>6 suppliers of >120kV HVAC
cables active in market
>6 suppliers of >120kV HVAC
cables active in market
>6 suppliers of >120kV HVAC
cables active in market
Please indicate your level of confidence in the industry
achieving the following by 2020 for this indicator (1 Low
confidence, 10 High confidence)
Electrical OEM average Overall average
5-6 suppliers of >120kV HVAC cables active in market 7.0 7.0

ORE Catapult PN000113-FRT-002
CRMF 2015 Evidence log external Issue: FINAL 251
On target 4-5 suppliers of >120kV HVAC
cables active in market.
Developers engaging with
potential new entrants
4-5 suppliers of >120kV HVAC
cables active in market.
Developers seeking to bring in
new entrant
5-6 suppliers of >120kV HVAC
cables active in market
5-6 suppliers of >120kV HVAC
cables active in market
5-6 suppliers of >120kV HVAC
cables active in market
Behind target 2-3 suppliers of >120kV HVAC
cables active in market
2-3 suppliers of >120kV HVAC
cables active in market
3-4 suppliers of >120kV HVAC
cables active in market
3-4 suppliers of >120kV HVAC
cables active in market
3-4 suppliers of >120kV HVAC
cables active in market
Missed target <2 suppliers of >120kV HVAC
cables active in market
<2 suppliers of >120kV HVAC
cables active in market
<2 suppliers of >120kV HVAC
cables active in market
<2 suppliers of >120kV HVAC
cables active in market
<2 suppliers of >120kV HVAC
cables active in market
48.3 Evidence
48.3.1 Questionnaires
Category Questionnaire response
How many suppliers of HV AC cables (>120kV) equipment do you think are active in the market?
Dev Around 6
Dev 7 or 9 depending on risk appetite for some new entrants. Also depends on cable length and cross section required as some can only offer higher voltages at shorter lengths which may result in unacceptable number of factory joints. Competition is better at the 132/150kV level but less so at the higher voltage up to 400kV 3 core XLPE designs where the number of suppliers are less. This also depends on the cable design required, aluminium of copper, solid or stranded, turnkey or supply only, etc. Cable is not a commodity and can lead to specific designs only available with a few suppliers.
Dev 5
Dev 9
Electrical OEM 4
How would you rate competition in this market on the scale above? (1 Low competition to 4 High competition)
Dev 3
Dev 2
Dev 2
Dev 3
Do you see this improving over the next three years?
Dev No

ORE Catapult PN000113-FRT-002
CRMF 2015 Evidence log external Issue: FINAL 252
Category Questionnaire response
Dev HV cable supplier are probably less dependent of offshore wind industry than WTG and substructure suppliers, so supply may grow with demand from other generation technologies and from growth demand for long distance offshore transmission interconnectors.
Dev No, not unless the Chinese taken seriously.
Dev No
Electrical OEM We are aware of several newly commissioned vessels in the market which should improve competition
48.3.2 Interview
48.3.3 Market intelligence
Category Interview response
How many suppliers of HV AC cables (>120kV) equipment do you think are active in the market?
Dev • There is an issue: plenty of supplier of array cables, but one is way ahead of others on price
Dev Both array cable and export cables have good competition in the market. Not all suppliers have the capability to do both however - Have seen improvements in companies like [COMPANY] who have stepped up and are winning more work – good for UK context - Willingness in market for JV between cable and electrical systems suppliers – this is quite healthy for competition
How would you rate competition in this market on the scale above? (1 Low competition to 4 High competition)
Dev • Competition – 2 – 3
Do you see this improving over the next three years?
Electrical OEM • Generally this area has reasonable levels of competition • There is the realistic prospect of relevant new entrants (from Asian markets) but generally they are discouraged/unable to deal with UK/European standards
Evidence Source
• Major competitors in global market are ABB Ltd., NKT Cables, Prysmian Group, Finolex Cables Ltd., Brugg Kabel AG, Nexans, General Cable Corporation,
Sumitomo Electric Industries, Ltd., Encore Wire Corporation and Kerite. In the end of 2014, NKT Cables has been awarded the order for delivery of export cable
systems (supply of more than 150 kilometres of 220 kV high voltage submarine cables) to the Race Bank Offshore Wind farm by DONG Energy.
http://www.power-technology.com/news/newsjdr-to-provide-subsea-technology-to-rampion-offshore-wind-project-in-uk-4605277 http://www.firstsubsea.com/news.php?action=article&artid=21 http://www.nktcables.com/news/2014/12/race-bank-order-confirmed/
• A collaboration between the ORE Catapult and GnoSys Global Ltd is supporting the development of a new insulation material for power cables to improve their
performance in the onshore and offshore renewable energy industries and drive down whole life network costs. In the end of 2014, First Subsea, has been

ORE Catapult PN000113-FRT-002
CRMF 2015 Evidence log external Issue: FINAL 253
48.4 Additional comments
There was limited willingness from cable manufacturers to participate in this study and hence limited evidence gathered directly from cable manufacturers has been included, although insight from their customers
has contributed to the assessment.
48.5 Recommendations
None for this indicator
awarded £130,000 of Process Technology Innovation Funding under the Government’s GROW:OffshoreWind programme. The award is for development of a
monopile interface connector and hang off cable connector for offshore wind farms; and top tension mooring connector for floating wind turbines. These
developments will place the UK at the forefront of offshore wind cable connector and mooring technology.
• In February 2015, ABB won $100 million subsea HVAC cable system order for Denmark’s largest offshore wind farm. In March 2015, the Belgian Transmission
System Operator (TSO) decided to rely on Nexans extra-high voltage cable systems for the Stevin project in order to reinforce Belgium's high voltage power grid.
The project will require Nexans to manufacture, supply and install around 60 km of 380 kV extra-high voltage cable, as well as supplying accessories and on-site
services.
http://www.abb.co.uk/cawp/seitp202/f362f938a7672371c1257de80033d028.aspx http://www.4coffshore.com/windfarms/belgian-cable-upgrades-to-support-offshore-wind-nid1578.html
• In June 2015, JPS won contract to supply & install world first use HVDC XLPE insulated cable at DC 400 kV with transmission capacity of 1,000 MW and approx.
140-km cable route between Kent in the UK and Zeebrugge in Belgium. In the same month, JDR was awarded a contract for supplying subsea cabling technology
and services for the 400MW Rampion offshore wind project in the UK.
http://global-sei.com/company/press/2015/06/prs044.html
• In July 2015, contracts totalling €1.5billion have been awarded to Prysmian, Nexans, ABB to build the NSN link – the first electricity link between UK and
Norway. The link is expected to be operational by 2021.
http://www.offshorewind.biz/2015/07/14/prysmian-nexans-abb-become-nsn-link-dream-team/

ORE Catapult PN000113-FRT-002
CRMF 2015 Evidence log external Issue: FINAL 254
49 Competition in turbine installation
CRMF workstream Level 1 indicator Level 2 indicator Level 3 indicator
Technology Competition within the industry Installation Competition in turbine installation
49.1 Summary Analysis
Finding: Ahead of target
The 2015 score for this indicator is ‘ahead of target’ because there are significantly more than 15 wind turbine installation vessels (WTIV) active in the European market. Last year the study also found this
indicator to be ‘ahead of target’ for a similar reason; generally sufficient vessels tending towards over-supply.
Questionnaires and interviews evidenced that installation contractors and developers continue to see an ample supply of WTIV for projects at present.
There is evidence of at least 2 new build WTIVs forecast to enter the market in the next 1 – 2 years. This is lower than the number of new builds forecast as ‘on target’ for both 2015 and 2016. So whilst the
industry has surpassed targets for total number of vessels, the number of new builds remain limited. This could manifest in a shortage of suitable vessels as the demand for new vessels with greater lifting
capacities and working depths increases. The indicator could drop down from “ahead of target” for this reason in subsequent years.
Outlook: Industry score of 6
The cautiously optimistic outlook for this indicator is justified. On the one hand, in the immediate and near future it looks likely that there will continue to be ample WTIV availability tending towards over supply.
However in the medium and longer term other factors are likely to influence the level of competition in turbine installation:
The number of projects forecast to enter construction in 2 – 3 years’ time may mean that developers are challenged (as was the case in the past) by limited vessel availability during an increase in levels
of projects in construction.
Water depths may continue to increase, limiting the pool of capable vessels.
Turbine sizes may increase beyond 8MW, limiting the pool of capable vessels.
The demand for foundation installation projects may cause the highest capacity jack up vessels to be in demand predominantly for foundation installation, reducing the pool of vessels available for turbine
installation.
There is some evidence of European players looking for (and winning) work in non-EU markets, which may in the longer term impact vessel availability for European projects, depending on the rate of
progress in far eastern and north American markets.
As turbine size and water depth continue to increase it looks likely that vessels with lower lifting capabilities and/or leg lengths will not be able to compete for work on all projects.

ORE Catapult PN000113-FRT-002
CRMF 2015 Evidence log external Issue: FINAL 255
49.2 Milestone scorecard
Milestone scorecard FID 2015 FID 2016 FID 2017 FID 2018 FID 2019
Ahead of target >15 WTIVs active in European
market
>15 WTIVs active in European
market
>20 WTIVs active in European
market
>20 WTIVs active in European
market
>20 WTIVs active in European
market
On target 10-15 WTIVs active in European
market. Another 3-5 vessels are
ordered
10-15 WTIVs active in European
market. Another 3-5 vessels are
under construction
15-20 WTIVs active in European
market
15-20 WTIVs active in European
market
15-20 WTIVs active in European
market
Behind target 5-9 WTIVs active in European
market
5-9 WTIVs active in European
market
10-14 WTIVs active in European
market
10-14 WTIVs active in European
market
10-14 WTIVs active in European
market
Missed target <5 WTIVs active in European
market
<5 WTIVs active in European
market
<10 WTIVs active in European
market
<10 WTIVs active in European
market
<10 WTIVs active in European
market
Please indicate your level of confidence in the industry
achieving the following by 2020 for this indicator (1 Low
confidence, 10 High confidence)
Installation average Overall average
Mature market with contractors from offshore wind, oil gas and
general civil contractors, sufficient supply of vessels sized for all
turbines types
6.0 6.0

ORE Catapult PN000113-FRT-002
CRMF 2015 Evidence log external Issue: FINAL 256
49.3 Evidence
49.3.1 Questionnaires
Category Questionnaire response
How many proven turbine installation vessels would you consider active in the market?
Dev Around 15
Dev We currently see 2 or 3 WTG specific vessels available, but a number of other Oil and Gas HLVs and jackups capable of doing the job.
Dev 12
Dev 5 Suppliers (some of which have more than 1 suitable vessel)
Installation Don’t know.
Installation That is difficult to say. There are around 20 that have installed turbines but not all those will play a part in the future as turbines get larger and projects are developed further offshore.
How would you rate competition in this market on the scale above? (1 Low competition to 4 High competition)
Dev 3
Dev 2
Dev 4
Dev 2
Do you see this improving over the next three years?
Dev Not significantly
Dev Some potential improvement.
Dev No remain constant
Dev No
49.3.2 Interview
Category Interview response
How many proven turbine installation vessels would you consider active in the market?
Dev • Plenty of installation vessels right now (see comments on oil and gas and market pressure on vessels generally).
Dev Turbine installation vessels have good availability in the market - Have done recent study with [COMPANY] as turbine installation contractor – good enagement with supply chain and a number of options, including new vessels, slightly improving position - Medium term there are sufficient vessels available to manage the level of work available.
Installation In near term there may be an oversupply of installation vessels (1 – 2 years) longer term this is likely to balance out and once again there will be a reasonable supply and demand. - Vessels in the market are already capable for 8MW size turbines

ORE Catapult PN000113-FRT-002
CRMF 2015 Evidence log external Issue: FINAL 257
49.3.3 Market intelligence
49.3.4 Turbine installation vessels
This table lists vessels active or capable of competing in the turbine installation market. The listed project experience has not been limited to turbine installation because several vessels have been used for both
turbine and foundation installation. Some jack up barges (un-propelled) have been used for turbine installation in the past but have not been included in the table because they have limited relevance to the
current or future turbine installation market.
- 2020 - 2022 may be a time where vessels start to struggle, e.g turbines moving to 10MW+ at present nobody is seen to be investing in a new generation of vessels that would be capable of such capacities. - Significant number of current vessels which would be efficient at installing 6 – 8MW turbines will actually be booked up for foundations. Due to weights/capacities. - There is a complex trade off of what vessel is the perfect vessel (deck capacity, leg length etc.) and so some projects will get what is optimum for them, and others will have to make do. This is a function of the variety and number of vessels available in the market. - European nature of the market has insulated [Installation] somewhat from uncertainty in UK market right now. They would like to see some clarity, particularly about what will come after 2020. The pipeline for the next few years already looks fairly certain. - There may be next generation vessel designs in existence, which could be built in 2 – 2.5 years if the market does get certainty/picks up in demand again. Investment at the moment looks unlikely.
Evidence Source
In September 2015 A2SEA signed a contract to install turbines and foundations on the Taiwanese project Formosa 1. http://www.a2sea.com/a2sea-signs-
contract-for-first-project-in-asia-formosa-1/
Fred. Olsen Windcarrier has secured a contract for the installation of wind turbines at Block Island Wind Farm, one of the first offshore wind farms in the United
States
http://fredolsen-energy.com/the-bold-tern-
awarded-u-s-installation-contract-with-
deepwater-wind?WAF_IsPreview=true
Vessel Type Company Vessel Name Crane max Working depth / leg
length (m)
Windfarm Experience Year built
Jack up vessel (self-
propelled)
SeaJacks Seajacks Scylla 1,500t 65 / 105 Scheduled for Veja Mate
(2016 F) and Walney
Extension (2017 T)
2015
Jack up vessel (self-
propelled)
DEME/ Geosea Innovation 1,500t xx / 89 Global Tech I,
Westernmost Rough
(2014), Gode Wind 1 & 2
(2015) - foundations, West
of Duddon Sands,
Westernmost Rough,
2012

ORE Catapult PN000113-FRT-002
CRMF 2015 Evidence log external Issue: FINAL 258
Jack up vessel (self-
propelled)
Swire Blue Ocean Pacific Orca 1,200t 65 / 105 West of Duddon Sands,
(2013 ), Borkum Riffgrund
1 (2014) - foundations
Sandbank
2012
Jack up vessel (self-
propelled)
Swire Blue Ocean Pacific Osprey 1,200t 65 / 105 Belwind Haliade Demo
(2013) - foundations, Dan
Tysk (2014) - Turbines
Horns Rev , Gemini, Burbo
Bank, Rhyl Flats, Walney I
& II
2012
Jack up vessel (self-
propelled)
Workfox BV Seafox 5 1,200t 65 / xx Dan Tysk (2013 F) 2012
Jack up vessel (self-
propelled)
Jan De Nuul Vidar 1,200t 50 / 90 Global Tech 1, EnBW
Baltic 2, planned for
Nobelwind (2016/17 F & T)
2013
Jack up vessel (self-
propelled)
MPI MPI Adventure 1,000t 40 / xx London Array Phase 1
(2011 - Foundations),
Teesside (2012), Humber
Gateway, Borkum Phase 1,
Amrumbank West (2015),
Sandbank (2015)
2011
Jack up vessel (self-
propelled)
MPI MPI Adventure 1,000t 40 / xx London Array Phase 1
(2011 - Foundations),
Teesside (2012), Humber
Gateway, Borkum Phase 1,
Amrumbank West (2015),
Sandbank (2015)
2011
Jack up vessel (self-
propelled)
MPI MPI Discovery 1,000t 40 / xx London Array Phase 1
(2011), Lincs (2012),
Amrumbank West (2013 -
Foundations), Karehamn
(2013), Humber Gateway
(2013/14 F & T)
2011

ORE Catapult PN000113-FRT-002
CRMF 2015 Evidence log external Issue: FINAL 259
Jack up vessel (self-
propelled)
Van Oord Aeolus 990t 55 / 81 Eneco Luchterdein (2015 -
F & T), Gemini (2015 - F &
T)
2014
Jack up vessel (self-
propelled)
A2SEA Sea Challenger 900t 60 / 82 Gode Wind 1 & 2, Anholt,
Burbo Bank, Greater
Gabbard, Westernmost
Rough (2014). Contracted
for Burbo Bank Extension
in 2016 and Race Bank in
2017
2013
Jack up vessel (self-
propelled)
A2SEA Sea Installer 900t 60 / 82 Anholt (2012), WoDS
(2013), Gunfleet Sands 3
Demo (2013), Borkum
Riffgrund (2014), Meerwind
Ost/Sud, Walney Phase 2,
WoDS (2014), Gode Wind
1 & 2 (2015). Scheduled
for Dudgeon in 2016
2012
Jack up vessel (self-
propelled)
MPI MPI Enterprise (was
RWE’s Victoria Mathias)
800t 45 / xx Amrumbank West (2015) ,
Nordsee Ost (2012)
2011
Jack up vessel (self-
propelled)
SeaJacks Seajacks Zaratan 800t Meerwind Ost/Sud (2013 -
F & T), Gunfleet Sands
2012
Jack up vessel (self-
propelled)
Fred Olsen Bold Tern 800t 78 / 45 Belwind Alstom
Demonstration (2013),
Riffgat (2013), Global Tech
I (2014), Butendiek
(2014/15)
2012
Jack up vessel (self-
propelled)
Fred Olsen Brave Tern 800t 78 / 45 Bard (2013), Global Tech I
(2014)
2011
Jack up vessel (self-
propelled)
DEME / Geosea Apollo 800t 70 / 84 (extendable to 106) 2017

ORE Catapult PN000113-FRT-002
CRMF 2015 Evidence log external Issue: FINAL 260
Jack up vessel (self-
propelled)
DEME / Geosea Neptune 600t Xx / 80 (extendable to 92) Thornton Bank Phase 3
(2013), Northwind (2013- T
& F), Trianel Borkum
Phase 1(2013), EnBW
Baltic 2 (2014), Kentish
Flats Extension (2015 - T &
F)
2012
Jack up vessel (self-
propelled)
MPI MPI Resolution 600t 35 / xx Lincs (2011/12 - F & T),
Humber Gateway (2013 -
Foundations)
2004
Jack up vessel (self-
propelled)
Otto Wulf Gmbh Wind Lift 1 500t 45 / 71 Bard (2013) 2010
Jack up vessel (self-
propelled)
DEME/ Geosea Goliath 400t xx / 78.8 Thornton Bank Phase 3
(2013) - Turbines
Walney Phase 1 (2010) -
Foundations
2009
Jack up vessel (self-
propelled)
SeaJacks Seajacks Leviathan 400t 41 / xx Greater Gabbard (2010),
Sheringham Shoal (2011),
Walney Phase 2(2011),
Meerwind Ost/Sud (2013),
Humber Gateway
2009
Jack up vessel (self-
propelled)
SeaJacks Seajacks Hydra 400t 48 / xx Global Tech 1 2014
Jack up vessel (self-
propelled)
SeaJacks Seajacks Kraken 300t Greater Gabbard (2010),
Walney Phase 1 (2010),
Walney Phase 2 (2011)
2009
Jack up vessel (self-
propelled)
Gulf Marine GMS Endeavour 300t 65 / 94 Sheringham Shoal (2011)
2010

ORE Catapult PN000113-FRT-002
CRMF 2015 Evidence log external Issue: FINAL 261
49.4 Additional comments
None for this indicator
49.5 Recommendations
None for this indicator

ORE Catapult PN000113-FRT-002
CRMF 2015 Evidence log external Issue: FINAL 262
50 Competition in foundation installation
CRMF workstream Level 1 indicator Level 2 indicator Level 3 indicator
Technology Competition within the industry Installation Competition in foundation installation
50.1 Summary Analysis
Finding: On target
This indicator considers the number of WTIVs and heavy lift vessels (HLV) active in the European market. It also addresses the pipeline of ordered/new build WTIV and HLV. At present there are more than 15
WTIV active in the European market with 2 new vessels (Scylla, Apollo) on order. Around 5 HLV are active in the European market. One new build HLV (Rambiz 4000) is on order but may be anticipated to work
primarily on substation installation as it is over specified for turbine foundation installation. The indicator is therefore both ‘ahead of target’ (for WTIV) and ‘behind target’ (for HLV). Taken together, the indicator is
assessed as ‘on target’.
Last year this indicator was marked as ‘on target’ with a similar justification. There has not been a significant change in the availability or orders placed for new build WTIV/HLV since the previous study.
Evidence suggests that wind turbine foundations have been installed by floating heavy lift vessels or barges, and by jack up vessels. At the upper end of the lifting capacity scale HLV used for turbine foundation
(jacket or monopile) installation have also been used for offshore substation foundation and topside installation. There is limited evidence of floating heavy lift vessels being used to install turbines (excepting the
Beatrice demonstrator and some non-EU demonstrator projects). At the lower end of the lifting capacity scale several jack up WTIV have been used for both foundation and turbine installation.
Outlook: Industry score 5.4
The uncertain outlook for this indicator appears justified as there are a small number of new build vessels and no floating DP installation or fast feeder vessels on order. There is no evidence of investment
decisions to commission new vessels, particularly floating DP/HLV, in the near future which are required if this indicator is to avoid falling behind target in subsequent years. Concepts (Deepwater Installer, Inwind
Installer) exist but orders have not materialised.
The newest (and highest lifting capacity) generation of jack up vessels are capable of installing both turbines and foundations, but look likely to be in demand for foundation installation as the forecast remains that
foundation weights will continue to increase. Despite some notable new jack up WTIV the number of vessels capable of lifting the next generation (over 1000t) monopile foundations remains small. A further
consequence of this trend is that jack up vessels with lower lifting capacities which have previously been used for foundation installation are likely to be limited to only turbine installation in future. Jack up vessel
applicability is further restricted by maximum operating depths, which look likely to be challenged as projects move to deeper waters, again this will restrict the pool of available vessels.
The new build vessel targets may also be missed as a result of insufficient certainty and/or market capacity to justify the investment in new vessels. The foundation installation market in future may be smaller
than was anticipated by the Pathways To Cost Reduction study.
Please indicate your level of confidence in the
industry achieving the following by 2020 for
this indicator (1 Low confidence, 10 High
confidence)
Electrical OEM average WTG OEM average Overall average
Range of purpose built foundation installation
vessels, including floating DP vessels, capable of
installing largest monopiles, and use of fast feeder
5.5 5.2 5.4

ORE Catapult PN000113-FRT-002
CRMF 2015 Evidence log external Issue: FINAL 263
50.2 Milestone scorecard
Milestone scorecard FID 2015 FID 2016 FID 2017 FID 2018 FID 2019
Ahead of target >10 HLVs active in European
market
>15 WTIVs active in European
market
>10 HLVs active in European
market
>15 WTIVs active in European
market
>15 HLVs active in European
market >20 WTIVs active in
European market
>15 HLVs active in European
market >20 WTIVs active in
European market
>15 HLVs active in European
market >20 WTIVs active in
European market
On target 7-10 HLVs active in European
market 10-15 WTIVs active in
European market. 3-5 new HLV
are ordered and 3-5 WTIV
7-10 HLVs active in European
market 10-15 WTIVs active in
European market. 3-5 new HLV
are ordered and 3-5 WTIV
12-15 HLVs active in European
market
15-20 WTIVs active in European
market
12-15 HLVs active in European
market
15-20 WTIVs active in European
market
12-15 HLVs active in European
market
15-20 WTIVs active in European
market
Behind target 4-6 HLVs active in European
market 5-9 WTIVs active in
European market
4-6 HLVs active in European
market 5-9 WTIVs active in
European market
7-11 HLVs active in European
market 10-14 WTIVs active in
European market
7-11 HLVs active in European
market 10-14 WTIVs active in
European market
7-11 HLVs active in European
market 10-14 WTIVs active in
European market
Missed target <4 HLVs active in European
market <5 WTIVs active in
European market
<4 HLVs active in European
market <5 WTIVs active in
European market
<7 HLVs active in European
market <10 WTIVs active in
European market
<7 HLVs active in European
market <10 WTIVs active in
European market
<7 HLVs active in European
market <10 WTIVs active in
European market
50.3 Evidence
50.3.1 Questionnaires
Category Questionnaire response
How many proven foundation installation vessels would you consider active in the market?
Dev Around 10 – 15 for monopile installation. This number decreases to around 5-8 for Jacket installation.
vessel concepts for far offshore sites (up to 35m
water depths and over 125km from port)

ORE Catapult PN000113-FRT-002
CRMF 2015 Evidence log external Issue: FINAL 264
Category Questionnaire response
Dev Some are planned but we are not aware of any bespoke jacket installation vessels currently operational. However there a number of Oil and Gas HLV's and jackups capable of doing the job.
Dev 10
Dev 7 Suppliers (some of which have more than 1 suitable vessel)
Installation Similar to above. There are probably around 20. Although most of the foundations have been installed from just a handful of vessels. Again larger structures in the future mean fewer vessels can handle them.
Monopiles How would you rate competition in this market on the scale above? (1 Low competition to 4 High competition)
Dev Monopiles -4
Dev -
Dev 4
Dev 2
Jackets How would you rate competition in this market on the scale above? (1 Low competition to 4 High competition)
Dev Jackets -2
Dev 2
Dev -
Dev 2
Do you see this improving over the next three years?
Dev Not significantly
Dev Depends on sector growth and how the offshore oil and gas market develops
Dev No remain the same
50.3.2 Interview
Category Interview response
How many proven foundation installation vessels would you consider active in the market?
Dev - Jacket installation in deeper waters is a market that is not well catered for by current fleet of available vessels - Jackups currently limited by deck space (for large jackets) and operating water depth - Some new vessels are on the horizon but whether they appear or not remains uncertain
Dev • Offshore wind alliance from the beginning, where framework of suppliers working on pipeline of [COMPANY] projects, [COMPANY] to undertake marine installation. Intial development went well but then financial setup demanded to reduce number of interfaces so changed to 3 EPC – [COMPANY] now installation contractor for BoP. [COMPANY] selecting vessels for

ORE Catapult PN000113-FRT-002
CRMF 2015 Evidence log external Issue: FINAL 265
50.3.3 Market intelligence
50.3.4 Foundation installation vessels
This table lists vessels active or capable of competing in the foundation installation market. The listed wind farm experience is not limited to foundation installation and several vessels have been used for both
turbine and foundation installation. Some vessels have also been used for substation foundation and topside installation. Some jack up barges (un-propelled) have been used for foundation installation in the past
but may have limited relevance to current or future foundation installation market.
wind turbine installation but only 2 vessels possible to install the [PRODUCT]. Confident that more competition would enable the wider industry but already know using [COMPANY] vessels. • Difficult change to 3 EPC and still feeling effects. Sole sourced to the EPCs now so big changes organisationally and tone of engagement with contractors. Still feeling effects of this. Short term focus (no big pipeline of projects) means that no commercial leverage over the alliance so fewer contract packages has led to less risk but likely pushed down supply chain in form of cost. - Foundation installation – focussed on jacket side of things, long term negotiations with particular supplier of floating heavy lift installation vessels - Have had a number of analyses and views from in house and other consultants about what capabilities of vessels are – seems to be a stable availability of vessels at the moment.
Installation We need a clear view of what is beyond current tranche of projects, This would allow [Installation] to take a longer term view of return on investment.
Evidence Source
In November 2015 Seajacks took delivery of Seajacks Scylla, a self-propelled jack up vessel with a 1,500t lifting capability. http://www.offshorewindindustry.com/news/
seajacks-take-delivery-seajacks-scylla
In December 2014 DEME ordered a new build jack up vessel, Apollo with an 800t lifting capability. http://renews.biz/81212/apollo-to-shine-for-
geosea/
Vessel Type Company Vessel Name Crane max Working depth / leg
length (m)
Wind farm Experience Year built
Heavy Lift Vessel (self-
Propelled)
Van Oord
(acquired vessel in 2015
from Ballast Needam)
Svanen 8,200t n/a Sheringham Shoal (2010),
Anholt (2011), London
Array Phase 1 (2011),
Walney Phase 2 (2011),
Amrumbank West (2013),
EnBW Baltic 2 (2013),
Belwind (2010), Gunfleet
Sands, Butendiek (2014),
Westermeerwind (2015).
Planned for Burbo Bank
1991

ORE Catapult PN000113-FRT-002
CRMF 2015 Evidence log external Issue: FINAL 266
Extension foundations
(2016)
Heavy Lift Vessel (self-
propelled)
DEME (was Scaldis) Rambiz 4000 4,000t n/a not yet on market - under
construction
2017 (expected)
Heavy Lift Barge (un
propelled)
DEME (was Scaldis) Rambiz 3000 3,300t n/a Thornton Bank Phase 1, 2
& 3, Borkum Riffgrund,
Amrumbank West, Nordsee
Ost, Butendiek, Baltic 2,
Nysted, Rodsand, Gemini,
Luchterduinen, London
Array, Walney 1 & 2, West
of Duddon Sands, Beatrice
Demonstrator
1976
Heavy Lift Vessel (self-
propelled)
Seaway Heavy Lifting Oleg Strashnov 5,000t n/a Sheringham Shoal (2010)
Trianel Borkum Phase 1
(2011), Riffgat (2012), Dan
Tysk, Meerwind Ost/Sud,
Borkum Phase 1, Greater
Gabbard, Walney
Extension. Planned for
Dudgeon (2016)
2011
Heavy Lift Vessel (self-
propelled)
Seaway Heavy lifting Stanislav Yudin 2,500t n/a Global Tech 1, Sandbank
2016), Borkum Phase1,
Baltic 2, Anholt, Greater
Gabbard, Gwnt y Mor,
Westernmost Rough,
1985
Heavy Lift Vessel (Self
Propelled) Floating
sheerleg crane
SMIT Taklift 4 2,200t n/a Belwind, Alpha Ventus,
Wikinger, Baltic 2
1981
Jack up vessel (self-
propelled)
SeaJacks Seajacks Scylla 1,500t 65 / 105 Scheduled for Veja Mate
(2016 F) and Walney
Extension (2017 T)
2015

ORE Catapult PN000113-FRT-002
CRMF 2015 Evidence log external Issue: FINAL 267
Jack up vessel (self-
propelled)
DEME/ Geosea Innovation 1,500t xx / 89 Global Tech I,
Westernmost Rough
(2014), Gode Wind 1 & 2
(2015) - foundations, West
of Duddon Sands,
Westernmost Rough,
2012
Jack up vessel (self-
propelled)
Swire Blue Ocean Pacific Orca 1,200t 65 / 105 West of Duddon Sands,
(2013 ), Borkum Riffgrund
1 (2014) - foundations
Sandbank
2012
Jack up vessel (self-
propelled)
Swire Blue Ocean Pacific Osprey 1,200t 65 / 105 Belwind Haliade Demo
(2013) - foundations, Dan
Tysk (2014) - Turbines
Horns Rev , Gemini, Burbo
Bank, Rhyl Flats, Walney I
& II
2012
Jack up vessel (self-
propelled)
Workfox BV Seafox 5 1,200t 65 / xx Dan Tysk (2013 F) 2012
Jack up vessel (self-
propelled)
Jan De Nuul Vidar 1,200t 50 / 90 Global Tech 1, EnBW
Baltic 2, planned for
Nobelwind (2016/17 F & T)
2013
Jack up vessel (self-
propelled)
MPI MPI Adventure 1,000t 40 / xx London Array Phase 1
(2011 - Foundations),
Teesside (2012), Humber
Gateway, Borkum Phase 1,
Amrumbank West (2015),
Sandbank (2015)
2011
Jack up vessel (self-
propelled)
MPI MPI Adventure 1,000t 40 / xx London Array Phase 1
(2011 - Foundations),
Teesside (2012), Humber
Gateway, Borkum Phase 1,
Amrumbank West (2015),
Sandbank (2015)
2011
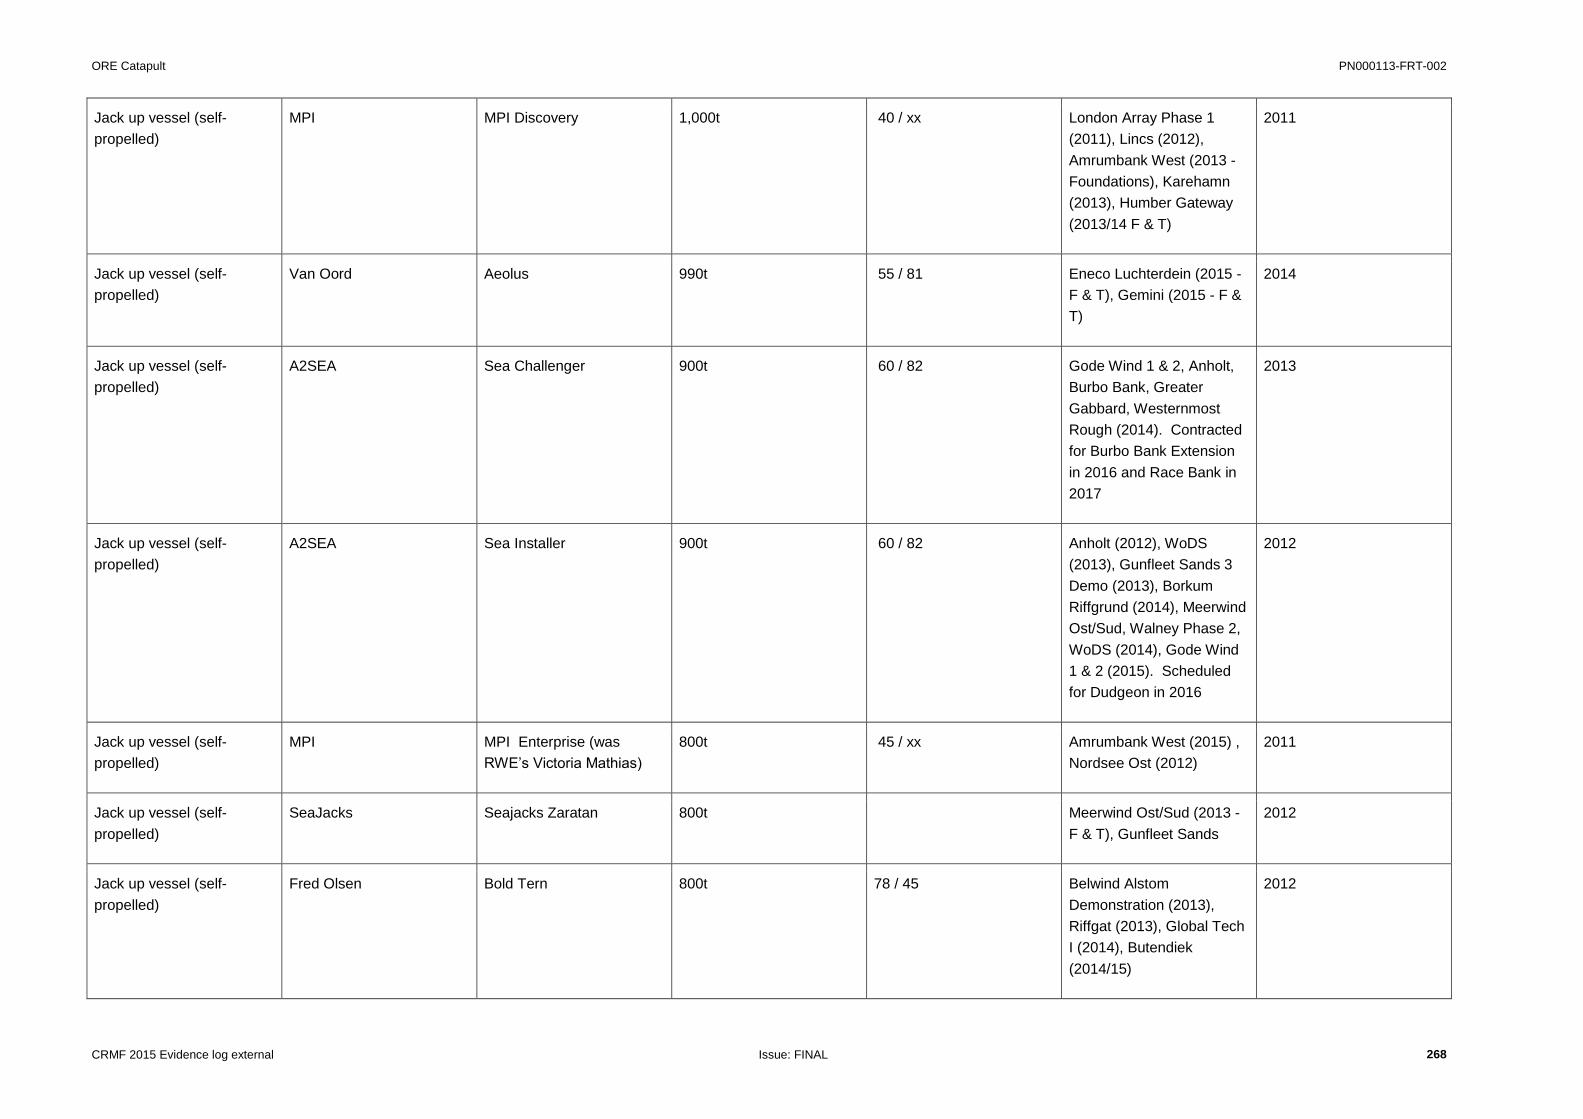
ORE Catapult PN000113-FRT-002
CRMF 2015 Evidence log external Issue: FINAL 268
Jack up vessel (self-
propelled)
MPI MPI Discovery 1,000t 40 / xx London Array Phase 1
(2011), Lincs (2012),
Amrumbank West (2013 -
Foundations), Karehamn
(2013), Humber Gateway
(2013/14 F & T)
2011
Jack up vessel (self-
propelled)
Van Oord Aeolus 990t 55 / 81 Eneco Luchterdein (2015 -
F & T), Gemini (2015 - F &
T)
2014
Jack up vessel (self-
propelled)
A2SEA Sea Challenger 900t 60 / 82 Gode Wind 1 & 2, Anholt,
Burbo Bank, Greater
Gabbard, Westernmost
Rough (2014). Contracted
for Burbo Bank Extension
in 2016 and Race Bank in
2017
2013
Jack up vessel (self-
propelled)
A2SEA Sea Installer 900t 60 / 82 Anholt (2012), WoDS
(2013), Gunfleet Sands 3
Demo (2013), Borkum
Riffgrund (2014), Meerwind
Ost/Sud, Walney Phase 2,
WoDS (2014), Gode Wind
1 & 2 (2015). Scheduled
for Dudgeon in 2016
2012
Jack up vessel (self-
propelled)
MPI MPI Enterprise (was
RWE’s Victoria Mathias)
800t 45 / xx Amrumbank West (2015) ,
Nordsee Ost (2012)
2011
Jack up vessel (self-
propelled)
SeaJacks Seajacks Zaratan 800t Meerwind Ost/Sud (2013 -
F & T), Gunfleet Sands
2012
Jack up vessel (self-
propelled)
Fred Olsen Bold Tern 800t 78 / 45 Belwind Alstom
Demonstration (2013),
Riffgat (2013), Global Tech
I (2014), Butendiek
(2014/15)
2012

ORE Catapult PN000113-FRT-002
CRMF 2015 Evidence log external Issue: FINAL 269
Jack up vessel (self-
propelled)
Fred Olsen Brave Tern 800t 78 / 45 Bard (2013), Global Tech I
(2014)
2011
Jack up vessel (self-
propelled)
DEME / Geosea Apollo 800t 70 / 84 (extendable to 106) 2017
Jack up vessel (self-
propelled)
DEME / Geosea Neptune 600t Xx / 80 (extendable to 92) Thornton Bank Phase 3
(2013), Northwind (2013- T
& F), Trianel Borkum
Phase 1(2013), EnBW
Baltic 2 (2014), Kentish
Flats Extension (2015 - T &
F)
2012
Jack up vessel (self-
propelled)
MPI MPI Resolution 600t 35 / xx Lincs (2011/12 - F & T),
Humber Gateway (2013 -
Foundations)
2004
Jack up vessel (self-
propelled)
Otto Wulf Gmbh Wind Lift 1 500t 45 / 71 Bard (2013) 2010
Jack up vessel (self-
propelled)
DEME/ Geosea Goliath 400t xx / 78.8 Thornton Bank Phase 3
(2013) - Turbines
Walney Phase 1 (2010) -
Foundations
2009
Jack up vessel (self-
propelled)
SeaJacks Seajacks Leviathan 400t 41 / xx Greater Gabbard (2010),
Sheringham Shoal (2011),
Walney Phase 2(2011),
Meerwind Ost/Sud (2013),
Humber Gateway
2009
Jack up vessel (self-
propelled)
SeaJacks Seajacks Hydra 400t 48 / xx Global Tech 1 2014

ORE Catapult PN000113-FRT-002
CRMF 2015 Evidence log external Issue: FINAL 270
Figure 11 - Jack up WTIV with crane capacity greater than 800t
50.4 Additional comments
None for this indicator
Zartan
Brave tern
Sea Installer
Bold Tern
Aeolus
Sea Installer
Adventure
Discovery
Victor Mathias
JB-117
Freidrich Ernneste
JB-118
Pacific Orca
Seafox 5
Pacific Osprey
Vidar
Innovation 1
Scylla
0
5
10
15
20
01/01/2011 01/01/2012 31/12/2012 31/12/2013 31/12/2014 31/12/2015
Num
ber
of vessels
in s
erv
ice
Handover date
Jack up WTIV with crane capacity greater than 800t
800
900
1000
1200
1500
Area of circle vessel crane capacity

ORE Catapult PN000113-FRT-002
CRMF 2015 Evidence log external Issue: FINAL 271
50.5 Recommendations
None for this indicator

ORE Catapult PN000113-FRT-002
CRMF 2015 Evidence log external Issue: FINAL 272
51 Competition in cable installation
CRMF workstream Level 1 indicator Level 2 indicator Level 3 indicator
Technology Competition within the industry Installation Competition in cable installation
51.1 Summary Analysis
Finding: Ahead of target
The 2015 score for this indicator is ‘ahead of target’. The market is well served by a variety of capable and proven vessels. Alongside a fleet of at least 20 vessels or barges with offshore wind project experience,
one operator recently launched a new purpose-built cable installation vessel and at least two others are on order for delivery in the next 1 – 2 years.
Last year this indicator was also rated as ‘ahead of target,’ with attention drawn to the noteworthy exit of a significant player; Technip.
Questionnaire and interview evidence suggests that:
There is in general an oversupply of capable cable installation vessels, resulting in a competitive market at present.
A number of references were made to the effect that the significant reduction in oil price has had on the demand for vessels in general. This appears to have had some effect on the availability of cable
installation vessels as there is some cross over between offshore wind, oil and gas, and other market sectors for cable installation vessels. Some contractors may see work on interconnector projects as
more stable than depending solely on offshore wind projects.
Whilst many installation contractors/vessels can be rated as proven, having installed cable for at least one commercial scale project, the level of experience can still vary significantly across the market.
Outlook: Industry score of 8
The 2020 target of 8 proven cable installation vessels appears to have already been met, suggesting that optimism is justified. Two areas are highlighted as having the potential to influence the ongoing level of
competition within this market:
The competitiveness of the vessel supply market appears closely related to the general downturn in the oil and gas market. The influence of oil price on vessel availability is a macroeconomic factor
outside the control of the offshore wind industry.
The willingness of current players and potential new market entrants to invest in new vessels remains dependent on the potential future pipeline of work for cable installation vessels in offshore wind. A
lack of certainty can influence investment decisions as demonstrated by the exit of Technip.
Please indicate your level of confidence in the industry
achieving the following by 2020 for this indicator (1 Low
confidence, 10 High confidence)
Installation average Overall average
Mature market with contractors from offshore wind, oil gas and
general civil contractors. 5-8 'proven' cable installation vessels.
Proven defined as installation of at least one commercial scale
project export or array cables.
8.0 8.0

ORE Catapult PN000113-FRT-002
CRMF 2015 Evidence log external Issue: FINAL 273

ORE Catapult PN000113-FRT-002
CRMF 2015 Evidence log external Issue: FINAL 274
51.2 Milestone scorecard
Milestone scorecard FID 2015 FID 2016 FID 2017 FID 2018 FID 2019
Ahead of target >6 proven subsea cable vessels >6 proven subsea cable vessels >8 proven subsea cable vessels >8 proven subsea cable vessels >8 proven subsea cable vessels
On target 4-6 proven subsea cable
vessels. At least another one
new build vessel is ordered
4-6 proven subsea cable
vessels. At least one new build
vessel is ordered
5-8 proven subsea cable
vessels
5-8 proven subsea cable
vessels
5-8 proven subsea cable vessels
Behind target 3-4 proven subsea cable
vessels
3-4 proven subsea cable
vessels
4-5 proven subsea cable
vessels
4-5 proven subsea cable
vessels
4-5 proven subsea cable vessels
Missed target <3 proven subsea cable vessels <3 proven subsea cable vessels <4 proven subsea cable vessels <4 proven subsea cable vessels <4 proven subsea cable vessels
51.3 Evidence
51.3.1 Questionnaires
Category Questionnaire response
How many proven cable installation vessels would you consider active in the market?
Dev Around 20
Dev There are a larger number of cable installation vessels available.
Dev 42282
Dev 11 Suppliers (some of which have more than 1 suitable vessel)
OTFO 1 Not sure

ORE Catapult PN000113-FRT-002
CRMF 2015 Evidence log external Issue: FINAL 275
Category Questionnaire response
Installation 10
Installation There are more than 20 if you include vessels that currently work solely in oil in gas. It will be interesting to see how many of these transfer to renewables. As projects move in to deeper water >20m then all the oil & gas umbilical installation vessels could come in to play.
How would you rate competition in this market on the scale above? (1 Low competition to 4 High competition)
Dev 4
Dev 3
Dev 3
Dev 3
OTFO 1 2
Do you see this improving over the next three years?
Dev No
Dev May the same.
Dev Yes it is a growth market. However not in the UK with the current government approach. Definitely in Europe and globally.
Dev No
Electrical OEM We are aware of several newly commissioned vessels in the market which should improve competition
OTFO 1 Probably as the need for services and cable repairs increases
51.3.2 Interview
Category Interview response
How many proven cable installation vessels would you consider active in the market?
Dev • Plenty of installation vessels right now (see comments on oil and gas and market pressure on vessels generally).
Dev Cable installation – has in the past been some challenge around array cable installation, not just the installation vessel but also the support vessels that are important - Good use of experience from other projects, and feeding lessons learned into procurement and subsequent strategies. Some lessons learned may even push up initial costs but could be a cheaper way to address potential issues in the longer term – e.g. avoiding expensive construction issues
Installation Oversupply of vessels as Oil and Gas contractors are entering the market. - But a vessel from another industry also needs equipment and competent people with experience to operate it

ORE Catapult PN000113-FRT-002
CRMF 2015 Evidence log external Issue: FINAL 276
51.3.3 Market intelligence
51.3.4 Cable installation vessels
This table lists vessels known to have project experience on either export or array cable installation for offshore wind projects.
Evidence Source
In March 2015 Van Oord launched a new build cable installation vessel – Nexus. http://www.vanoord.com/news/2015-van-
oords-cable-laying-vessel-nexus-
operational
In March 2015 Jan de Nul was awarded cable installation contract for Race bank and will use its new cable laying vessel Isaac Newton http://www.offshorewind.biz/2015/04/21/jan-
de-nul-wins-burbo-bank-extension-wires/
Vessel Type Vessel (Owner or Operator) DP Class Windfarm experience Constructed in
Cable lay barge Henry P Lading (JD Contractor) n/a Horns Rev 1 & 2, Middelgrunden,
Rodsand 2, Anholt 1930, rebuild 1964, converted 2009
Cable lay barge Pontra Maris (Stemat Marine) chartered
by VSMC n/a
Horns Rev 2, Q7, Ormonde, Barrow,
Gwynt y mor, Kentish Flats, London
Array, North Hoyle, Scroby Sands
1970
Cable lay vessel CS Pleijel (Baltic Offshore) 1 Lilgrund, Karehamn 1972, last converted 2015
Cable Lay vessel (conversion) Atlantic Carrier (Atlantic Marine &
Aviation) 2
Baltic 2, Humber Gateway 1974, converted 2001
Cable Lay Vessel / Multipurpose Cable One (JD Contractor) n/a Baltic 1, Horns Rev 1 & 2, Arklow Bank 1975, last converted 2001
Cable lay vessel Nexans Skagerrak (Nexans) n/a Belwind 1976, last converted 2010
Cable Lay Vessel / Multipurpose CLV Sia (CT Offshore) 2
Borkum Riffgrund, Gode Wind, Greater
Gabbard, Gwynt y mor, Lincs, Inner
Dowsing, London Array, Thanet,
Walney, West of Duddon Sands
1978

ORE Catapult PN000113-FRT-002
CRMF 2015 Evidence log external Issue: FINAL 277
Cable lay barge Eide Barge 28 n/a Thronton Bank, Gunfleet Sands 1978
Cable Lay barge Caspian Spider (Caspian Services)
Formerly "coastal spider" n/a
Arklow Bank 1981, last converted 2008
Cable lay barge Bodo Installer (Bolen & Doyen). Was
Oceanteam Installer n/a
Alpha Ventus, Riffgat, Burbo Bank,
Scroby Sands, Kentish Flats Extension 1982, converted 2005
Cable lay vessel Giulio Verne (Prysmian/VSMC) 2 Alpha ventus, Amrumbank West, Dan
Tysk, Nordsee Ost, Walney Phase 2 1984
Cable lay barge AMT Explorer (Global Marine) n/a London Array, Rhyl Flats
Vessel sank July 2014 1985
Cable lay barge AMT Discoverer (Technip) n/a Greater Gabbard, Lincs, Rhyl Flats,
Gunfleet Sands 3 Demo project 1985, Converted 2009
Cable Lay Vessel CS Sovereign (Global Marine) 2
Thornton Bank 1,2 & 3, Belwind,
Global Tech 1, Wikinger, Horns Rev 2,
Barrow, London Array, Beatrice
Demonstrator
1991
Cable Lay barge Eide Barge 32 (Nexans) n/a Eneco Q7 1993
Cable lay barge UR101 n/a Lincs, Lynn, Inner Dowsing, Robin
Rigg, Sheringham Shoal, Thanet 1993, last converted 2007
Cable Lay vessel Cable Innovator (Global Marine) 2 Thornton Bank Phase 2, Global Tech 1,
London Array 1995
Adapted CSV Aethra - was Polar Prince (GC
Riebder) 2
Greater Gabbard, Gwynt y mor, Thanet 1999
Cable lay vessel / multipurpose Normond Pioneer (Solstad Offshore) 2 Borkum, Westernmost Rough 1999
Cable lay vessel Topaz Installer (was Team Oman) 2
Alpha Ventus, Butendiek, Borkum,
Horns Rev 2, Sheringham Shoal,
Thanet
1999, last converted 2012
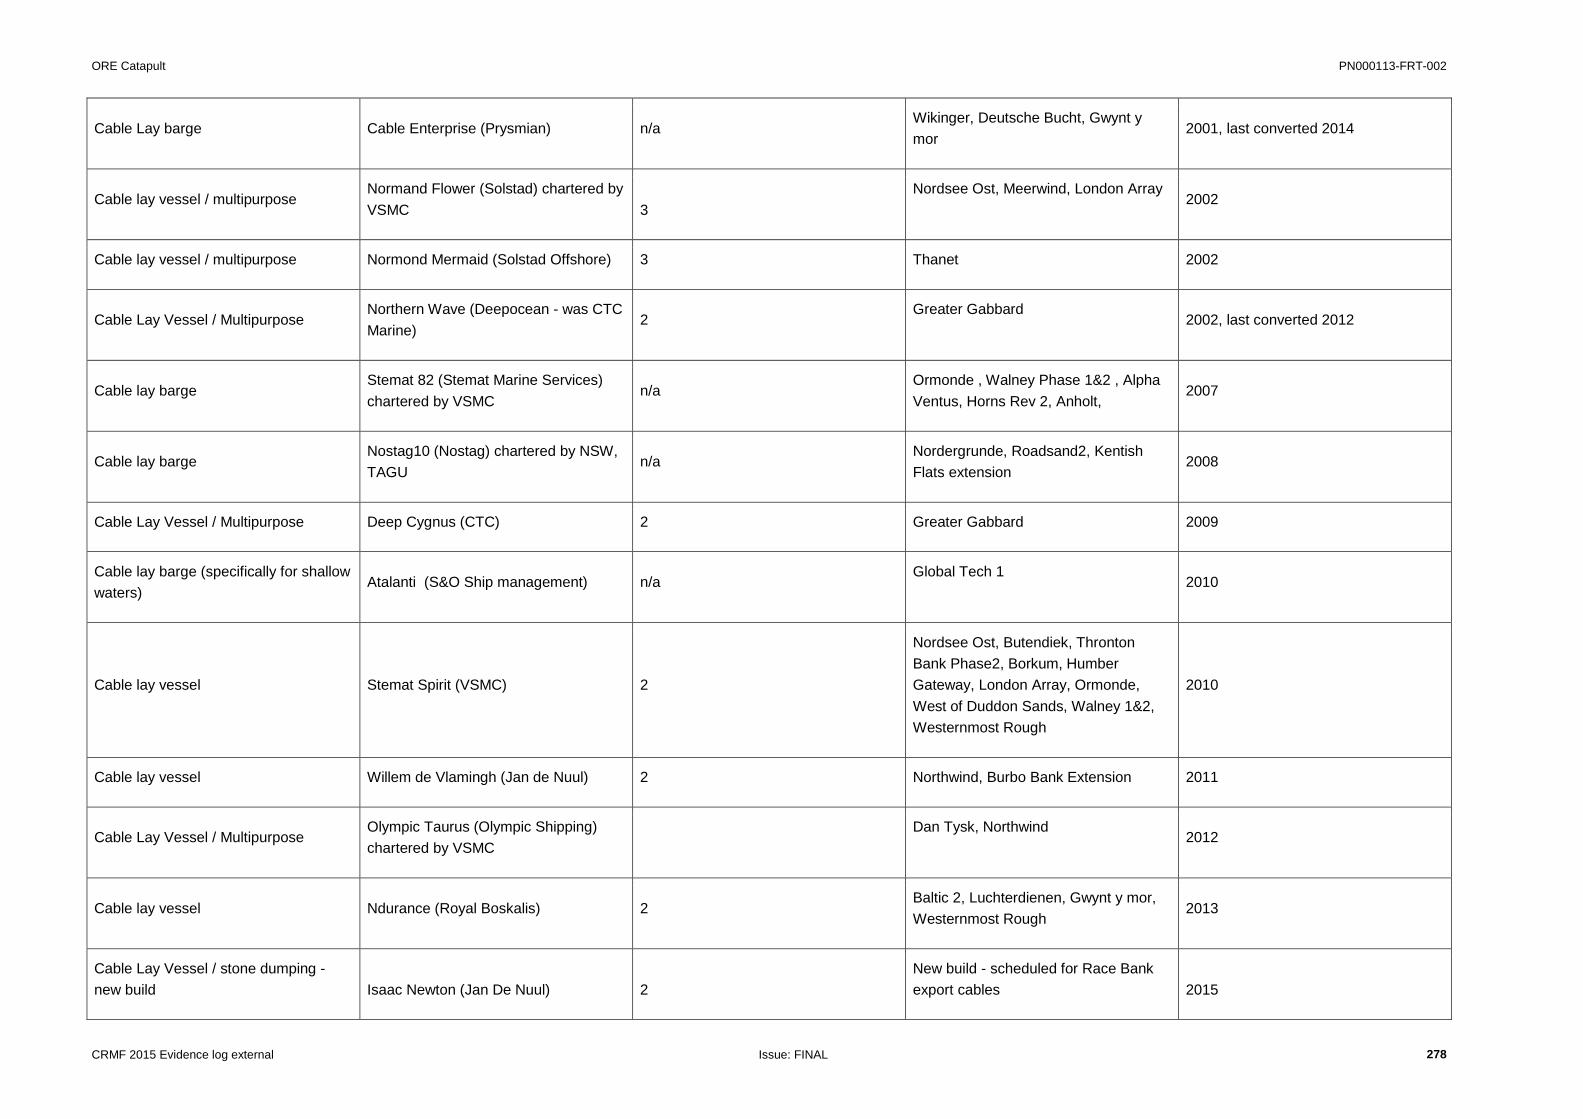
ORE Catapult PN000113-FRT-002
CRMF 2015 Evidence log external Issue: FINAL 278
Cable Lay barge Cable Enterprise (Prysmian) n/a Wikinger, Deutsche Bucht, Gwynt y
mor 2001, last converted 2014
Cable lay vessel / multipurpose Normand Flower (Solstad) chartered by
VSMC 3
Nordsee Ost, Meerwind, London Array 2002
Cable lay vessel / multipurpose Normond Mermaid (Solstad Offshore) 3 Thanet 2002
Cable Lay Vessel / Multipurpose Northern Wave (Deepocean - was CTC
Marine) 2
Greater Gabbard 2002, last converted 2012
Cable lay barge Stemat 82 (Stemat Marine Services)
chartered by VSMC n/a
Ormonde , Walney Phase 1&2 , Alpha
Ventus, Horns Rev 2, Anholt, 2007
Cable lay barge Nostag10 (Nostag) chartered by NSW,
TAGU n/a
Nordergrunde, Roadsand2, Kentish
Flats extension 2008
Cable Lay Vessel / Multipurpose Deep Cygnus (CTC) 2 Greater Gabbard 2009
Cable lay barge (specifically for shallow
waters) Atalanti (S&O Ship management) n/a
Global Tech 1 2010
Cable lay vessel Stemat Spirit (VSMC) 2
Nordsee Ost, Butendiek, Thronton
Bank Phase2, Borkum, Humber
Gateway, London Array, Ormonde,
West of Duddon Sands, Walney 1&2,
Westernmost Rough
2010
Cable lay vessel Willem de Vlamingh (Jan de Nuul) 2 Northwind, Burbo Bank Extension 2011
Cable Lay Vessel / Multipurpose Olympic Taurus (Olympic Shipping)
chartered by VSMC
Dan Tysk, Northwind 2012
Cable lay vessel Ndurance (Royal Boskalis) 2 Baltic 2, Luchterdienen, Gwynt y mor,
Westernmost Rough 2013
Cable Lay Vessel / stone dumping -
new build Isaac Newton (Jan De Nuul) 2
New build - scheduled for Race Bank
export cables 2015
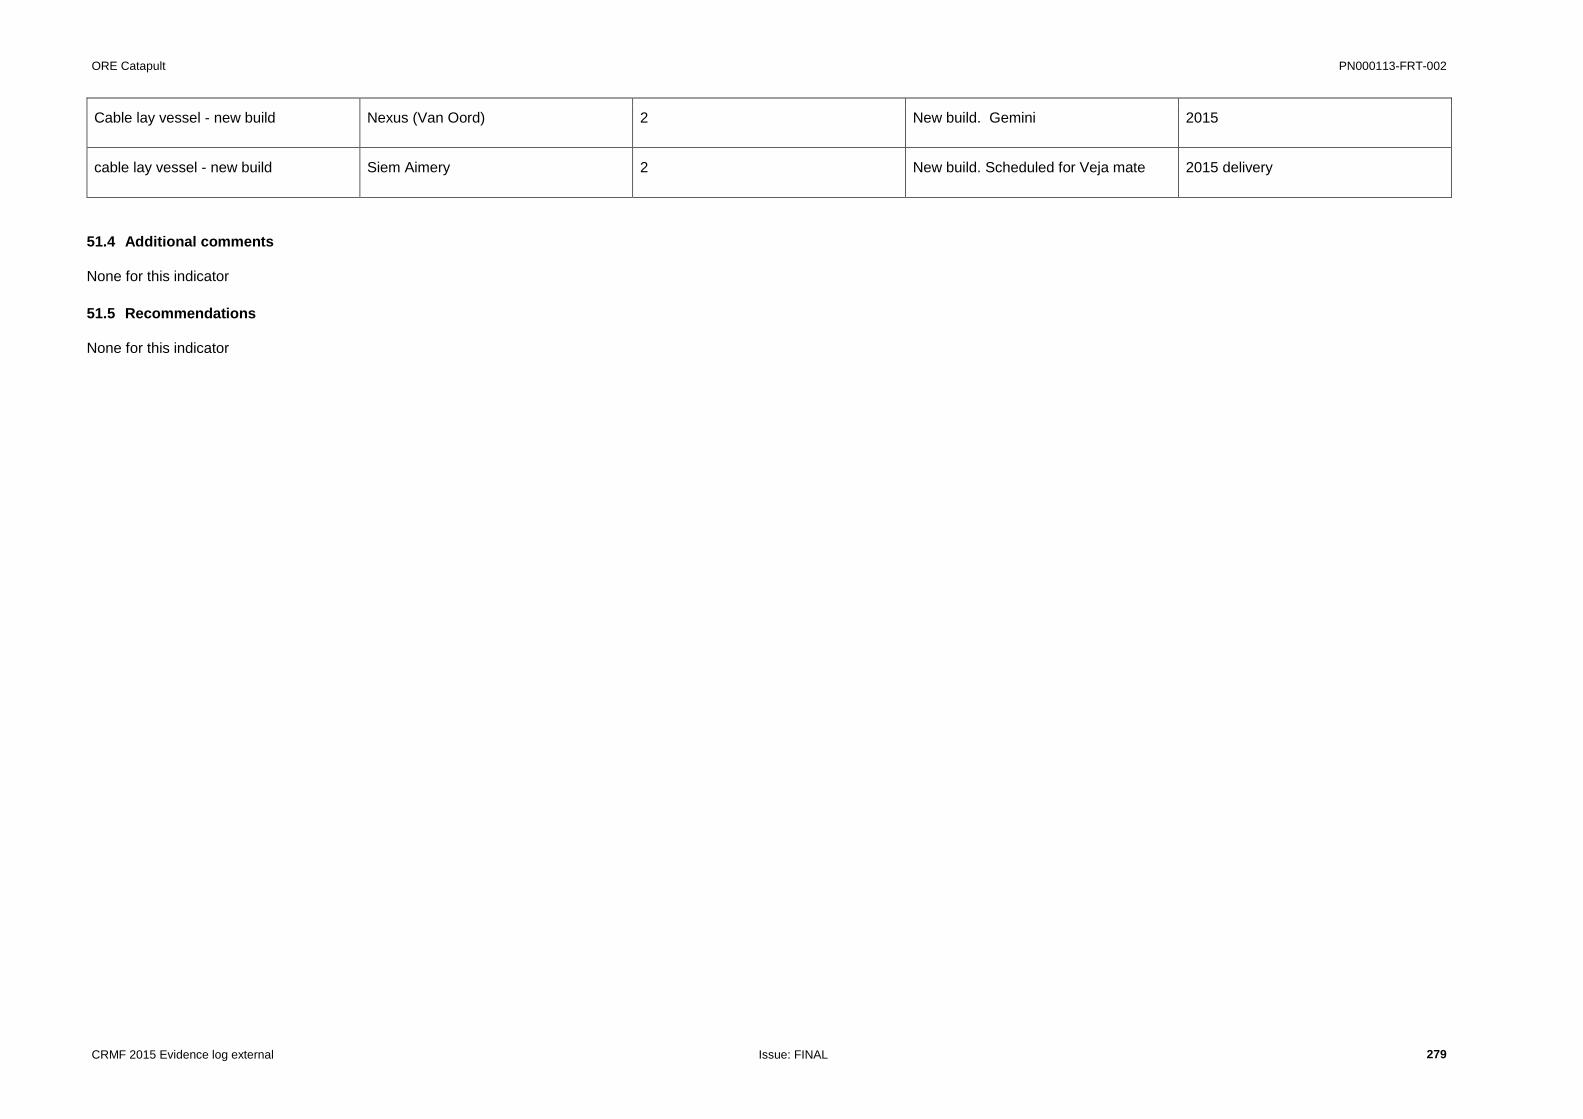
ORE Catapult PN000113-FRT-002
CRMF 2015 Evidence log external Issue: FINAL 279
51.4 Additional comments
None for this indicator
51.5 Recommendations
None for this indicator
Cable lay vessel - new build Nexus (Van Oord) 2 New build. Gemini 2015
cable lay vessel - new build Siem Aimery 2 New build. Scheduled for Veja mate 2015 delivery

ORE Catapult PN000113-FRT-002
CRMF 2015 Evidence log external Issue: FINAL 280
52 Contracting packages / interface management
CRMF workstream Level 1 indicator Level 2 indicator Level 3 indicator
Technology Collaboration Vertical Contracting packages / interface management
52.1 Summary Analysis
Finding: On target
The 2015 score for this indicator is 'On target.' The industry has surpassed the 'ahead of target' milestone in part by achieving fewer packages in projects reaching FID in the EU in 2015 but it is not clear that
contingencies are reducing quickly, hence a more cautious scoring.
Galloper recently closed with 6 packages.
The table below shows the number of contracts used on each of the 12 projects that reached FID in the EU in 2015.
Number of contracts Number of Windfarms
1-5 3
6-10 6
11-20+ 3
As illustrated above 6-10 packages was the most common approach for projects over the last year. Some developers consistently maintain a multiple contract approach and the efficient management of these is
viewed as a competitive advantage. The approach is also heavily influenced by the project finance strategy and many that seek bank finance will feel pressures to move to fewer contracts. There is therefore
likely to be a divide in the market between multi contract and single or multiple EPC (I).
As identified last year, there is still no evidence of a move towards the oil and gas type approach of alliancing.
Outlook: Industry score of 6.9
The relatively high confidence in the outlook highlights that the industry has already surpassed the target set for 2020 for number of contract packages more than 3 projects close with less than 5 packages with
contingencies reducing steadily. There are currently a number of schools of thought on contracting strategies in the industry currently and it is likely we will continue to see some developers with multiple contracts
and others with a smaller number of contracts, delivering with less in-house capability. It is, however, unclear from the evidence whether either of these approaches has a positive impact on contingencies.
The 2020 milestone assumes reduction in contracting package is optimal for cost reduction but this is not always the case in practice.

ORE Catapult PN000113-FRT-002
CRMF 2015 Evidence log external Issue: FINAL 281
52.2 Milestone scorecard
Milestone scorecard FID 2015 FID 2016 FID 2017 FID 2018 FID 2019
Ahead of target >1 project closed with <5
packages. Contingencies
reducing quickly.
>1 project closed with <5
packages. Contingencies
reducing quickly.
>2 projects closed with <5
packages. Contingencies
reducing quickly.
>2 projects closed with <5
packages. Contingencies
reducing quickly.
>2 projects closed with <5
packages. Contingencies
reducing quickly.
On target 1 project closed with <5
packages. Contingencies
reducing steadily.
1 project closed with <5
packages. Contingencies
reducing steadily.
2 projects closed with <5
packages. Contingencies
reducing steadily.
2 projects closed with <5
packages. Contingencies
reducing steadily.
2 projects closed with <5
packages. Contingencies
reducing steadily.
Behind target 0 project closed with <5
packages. Contingencies flat.
0 project closed with <5
packages. Contingencies flat.
0 project closed with <5
packages. Contingencies flat.
0 project closed with <5
packages. Contingencies flat.
0 project closed with <5
packages. Contingencies flat.
Missed target >1 project closed with >15
packages. Contingencies
increasing.
>1 project closed with >15
packages. Contingencies
increasing.
>1 project closed with >15
packages. Contingencies
increasing.
>1 project closed with >15
packages. Contingencies
increasing.
>1 project closed with >15
packages. Contingencies
increasing.
Please indicate your level of confidence in the
industry achieving the following by 2020 for
this indicator (1 Low confidence, 10 High
confidence)
Developer average WTG OEM average Overall average
3 projects closed with <5 packages.
Contingencies reducing steadily. 7.0 6.2 6.6

ORE Catapult PN000113-FRT-002
CRMF 2015 Evidence log external Issue: FINAL 282
52.3 Evidence
52.3.1 Questionnaires
Category Questionnaire response
Describe your current contracting approach (i.e. multi-contract or two main packages etc.). / Describe the current contracting approach you encounter (i.e. multi-contract or two main packages etc.). How do you expect this to change over the next few years? / Are you seeing any move towards standard contracts in the industry? What proportion of the contracts you sign could be considered “standardised”?
Dev • Multi contracting approach employed. 6 – 10 major contracts. • Transmission package broken down into a greater number of discreet component supply packages to accompany larger fabrication and installation packages. • Major packages, in the majority, let on EPC basis.
Dev We consider 3 main packages, Wind Turbines, Wind Farm (Substructures and Array Cables), and Transmission Works (Substations and Export Cables)
Dev Split in to 3-4 packages; Turbine with installation option, Foundation and infield cables and Transmission Assets.
Dev Multi-Contract
Electrical OEM We have seen no evidence of this
Installation We see more supply and install packages and the trend towards EPC packages (for us: electrical BoP). We expect the dredging companies will consolidate the market and be able to fulfil full EPC demand.
Installation We have bid for both multi-contract T&I packages and 2 package EPCI projects in the last year. Developers seem split on this. We expect it to remain like this for the foreseeable future.
Are you starting to see consolidation of contracting packages? / Are you planning to consolidate your contract packages?
Dev Yes
Dev No
Dev Yes
WTG OEM not visible to turbine OEM
WTG OEM Yes. As stated previously, we have started to see customers ask for WTG + Foundation consortia to bid for offshore Projects.
Explain whether you are seeing any reduction in contingencies included on projects?
WTG OEM not visible to turbine OEM
WTG OEM No. This is a function of the lack of certainty in the market and the pipeline ahead.

ORE Catapult PN000113-FRT-002
CRMF 2015 Evidence log external Issue: FINAL 283
52.3.2 Interview
Category Interview response
Are you starting to see consolidation of contracting packages? / Describe your current contracting approach (i.e. multi-contract or two main packages etc.).
O&M Yes - in some ways. However often always in different bundles. [O&M] have now an in house commercial team who work on contracts. They do often see contracts being based on logic/nec3/bimco etc. but there is not a single defining standard,
Dev • [Dev] current contracting approach – multi contract • Management of interfaces is a [Dev] competitive advantage.
Dev • Have three main contract packages o Turbine supply o BoP o EBoP (electrical)
WTG OEM
• Do not see that they can offer significant value in taking on risk of, for example, providing vessels. • Depends on project structure, project financed projects do tend to desire very few (2) main contract packages. • There is an issue around balancing cost of risk, there may not be a balance of share of cost and risk in a consortia seeking to join together and offer a single package to customer. • To an extent customers are taking the lead on this, and the way things are structured depends on the market pull. • Market view is that there is a conflict between minimising risk (and hence appealing to investors) and the truly multi contract approach to manage interface risk.
WTG OEM Are seeing that developers generally seek to consolidate contracts, although there are high profile exceptions to this rule. - Consortium led/finance developers are very nervous about structures where there are more than 3 – 4 main contract packages, as they seek to reduce risk in interfacing.
WTG OEM
• Has been normally done in multi-contracting • There doesn’t seem to be much consolidation • Can be more cost efficient for developer to procure vessels etc.
Installation Contracting at the moment is definitely not optimal. - There is a lot of work in modification of contracts to make fidic (an onshore contract) suitable for offshore - Significant hours spent and cost added by continuous modification, negotiation and re-drafting of contracts project to project. - The entire offshore wind market desperately need dedicated offshore wind specific contracts. - The future should look towards something more like a logic contract, where supplier and contractor are compelled to work together and are equally invested in getting the most effective/lowest contingency result. Basis that both must work together on risk analysis. So if the contractor sees a risk, which is not likely to affect them but will affect the client he should still work on mitigating the risk, and has a certain notification period as well as a certain period to work with the client on a solution. Each side tries to improve the chances of success for themselves and also for the other party in the contract.
Installation Somewhat a function of existing relationships. Where there is repeat business there may be some scope for standardisation of contracts which can lead to more efficient contracting. - Bimco windtime contract is often used as a base, the principles of this are usually re-created with the addition of some very project specific terms and conditions.
WTG OEM - Consolidation depends on developer - Rumour is that more people seem to be moving from ~20 packages to 5 or 7.
Explain whether you are seeing any reduction in contingencies included on projects
O&M They feel they tend to run reasonably lean on contingencies already. [O&M] looks to optimise scopes and find synergistic contingency reductions. There is generally a more open perception of risk in the industry, with contractors expecting and being expected by their clients to be more willing to take a chance and share risk.

ORE Catapult PN000113-FRT-002
CRMF 2015 Evidence log external Issue: FINAL 284
52.3.3 Market intelligence
52.3.4 Contract packages
Name Country Name
Fin
an
cia
l
Clo
se
Turbines Substations Foundations Array Cabling Export Cabling Total
Demonstrationsprojekt Frederikshavn
Denmark 31-Oct-15 Vestas Fred Olsen Renewables Ltd
Universal Foundation Fred Olsen Renewables Ltd
4
Galloper Wind Farm
United Kingdom 30-Oct-15 Siemens JV,Alstom Petrofac Palfinger
GeoSea VBMS BV, JDR VBMS BV, NKT Cables
6
Horns Rev 3 Denmark 27-Feb-15 MHI Vestas
COWI (Substations Foundations) HSM Offshore
Hollandia ABB Prysmian
6
Hywind Scotland Pilot Park
United Kingdom 03-Nov-15 Siemens 1
Are you starting to see consolidation of contracting packages?
Dev • On a standard windfarm will have 150 – 175 contracts • Not planning to consolidate, if anything will make them smaller to gain cost savings. • They are aware that they are not like other developers who would like to have 4 contracts max.
Dev • Contractors are generally standardising – this is a driver of cost reduction
Evidence Source
• In July 2015, SgurrEnergy's report in 'Emerging risks in offshore wind' states that in the past utilities generally implemented their projects under multi-contracting
structures. Lenders tend to prefer more consolidated contracting structures and all construction contracts need to be finalised to achieve financial close.
http://www.sgurrenergy.com/wp-content/uploads/2015/06/Final-Interview.pdf
• In November 2014, TCE released a report in The UK Offshore Wind Supply Chain: A Review of Opportunities and Barriers referring to contracting packages
trends. Developers and tier one suppliers could consider breaking down big contracts into smaller ‘bite‐size’ contracts, providing opportunities for more firms with
smaller facilities, or without a track record, to bid for orders they are confident of delivering. Helping firms to enter the supply chain should lead to increased
competition and lower prices for developers, and increased security of supply of vital components. Larger supply chain companies could look to partner with some
of their smaller UK competitors where it is advantageous to do so. While the UK supplier might not have the balance sheet to secure an order, it will often have a
strong understanding of UK HSE laws, UK labour experience, appropriate competencies and port‐side land. In such circumstances partnering brings mutual
benefits.
http://www.thecrownestate.co.uk/media/389763/owic-uk-offshore-wind-supply-chain-review-opportunities-barriers.pdf

ORE Catapult PN000113-FRT-002
CRMF 2015 Evidence log external Issue: FINAL 285
Merkur Offshore Germany 30-Oct-15
GeoSea (Installer Foundation & Turbines) Alstom
NSW 3
Nobelwind Belgium 23-Oct-15 MHI Vestas
ISC Radgivende Ingeniorer Bladt Industries, Semco Maritime
Ramboll EEW Special Pipe Constructions
DeepOcean Prysmian
Nexans 8
Nordergründe Germany 03-Jun-15 Senvion Palfinger
BVT Brenn- und Verformtechnik Bremen, Technologiekontor Bremerhaven
Ambau, Ramboll Bilfinger Construction Bladt Industries
NSW ABB, VBMS 8
Nordsee One Germany 19-Mar-15 Senvion Bladt Industries, Semco Maritime, ISC Radgivende
Ambau, ISC Radgivende Ingeniorer, IMS Ingenieurgesellschaft GeoSea
Siem Offshore Contractors, JDR
Siem Offshore Contractors, J-Power
6
Race Bank United Kingdom 24-Jun-15 A2Sea Siemens
Atkins (Substation & Foundation) Palfinger Cofely, Lemants Seaway Heavy Lifting
SPT Offshore Steelwind Nordenham Bilfinger Palfinger
DeepOcean JDR
Jan de Nul NKT Cables
12
Rampion United Kingdom 18-May-15 MPI Offshore MHI Vestas
Babcock ABB
LICengineering Swire Blue Ocean Sif Group Palfinger Euskal Forging Smulders Group
Fugro Marine Services JDR
VBMS VolkerInfra Carillion LS Cable System
16
Veja Mate Germany 30-Jun-15 Siemens, Fred Olsen
CGGlobal, Cofely Fabricom, Lemants, Overdick
Offshore Wind Force (Boskalis, Volker Wessels), EEW Special Pipe Constructions, Bladt Industries
Siem Offshore Contractors JDR
Prysmian 6
Walney Extension Phase 1 and 2
United Kingdom 28-Oct-15 Seajacks MHI Vestas Siemens
Seaway Cofely, Lemants Palfinger
Van Oord EEW Special Pipe Constructions Bladt Industries Offshore Structures
CT Offshore DeepOcean ABB
13

ORE Catapult PN000113-FRT-002
CRMF 2015 Evidence log external Issue: FINAL 286
52.4 Additional comments
Fewer packages do not always lead to cost reduction. The number of contracting packages are not always linked with lower contingencies because the supply chain may still include contingencies in their bids.
Due to the OFTO regime in the UK, it is unlikely that the number of contracting packages will reduce to much less than 3.
52.5 Recommendations
The number of projects rather than % of MW can be misleading when assessing contract packages. A future approach could include scaling the results to the market size.
The OWPB supply chain group should consider the impact of number of contracts on contingencies and enable sharing of best practice across the industry.

ORE Catapult PN000113-FRT-002
CRMF 2015 Evidence log external Issue: FINAL 287
53 Supply chain involvement
CRMF workstream Level 1 indicator Level 2 indicator Level 3 indicator
Technology Collaboration Vertical Supply chain involvement
53.1 Summary Analysis
Finding: On target
The 2015 score for this indicator is 'on target,' although it is only marginally ahead of the 'behind target' milestone with many of the projects reaching FID in 2015 not fully involving the supply chain pre-PQQ.
"Substantive involvement" centres around design and analysis work undertaken in conjunction with other disciplines. Projects considered are those that reach FID across the EU. The evidence uncovered a
number of trends that impact this indicator:
There is currently a split in approaches by project developers in their involvement of the supply chain. Those who are seeking to consolidate contracting packages are also seeking to involve the supply
chain earlier and in more detailed design work. Those that are increasing the number of packages are undertaking more of the detailed design work in house.
Existing frameworks agreements are a vehicle for securing more commitment from the supply chain early but this is not representative of the whole industry.
While turbine OEMs are experiencing substantive involvement pre-PQQ, the balance of plant and installation areas of the supply chain are becoming involved but less for design work and instead
reporting pressure for more accurate costs in less time with less information. This is increasing as a result of the CfD regime.
There is also some concern from the balance of plant and installation parts of the supply chain in taking on excess liability by providing design services pre-PQQ, without guarantee of winning the project.
There is also now a further layer of regulatory risk to supply chain; the CfD regime. The presence of an auction based environment was also described as having the potential to increase tendering costs
as developers seek to make decisions later (post award).
Although evidence was provided by project developers, limited evidence was provided by the supply chain.
Outlook: Industry score of 6.3
The relatively positive outlook for the 2020 milestone in this indicator highlights that there is likely to be an increase in collaboration vertically in the supply chain on the run up to 2020. This may be driven in part
by a reduction in horizontal collaboration between project developers due to the competitive nature of the CfD regime.
There is currently a move towards greater pre-PQQ involvement of suppliers on projects in development beyond those that reached FID in 2015. ORE Catapult therefore views 6.3 as a fair assessment of the
outlook to 2020.
Please indicate your level of confidence in the industry
achieving the following by 2020 for this indicator (1 Low
confidence, 10 High confidence)
Developer average Overall average
Companies in the supply chain have pre-PQQ involvement on 50-
90% of projects 6.3 6.3

ORE Catapult PN000113-FRT-002
CRMF 2015 Evidence log external Issue: FINAL 288
53.2 Milestone scorecard
Milestone scorecard FID 2015 FID 2016 FID 2017 FID 2018 FID 2019
Ahead of target >50% projects: SC pre-PQQ
involvement
>50% projects: SC pre-PQQ
involvement
>75% projects: SC pre-PQQ
involvement
>75% projects: SC pre-PQQ
involvement
>75% projects: SC pre-PQQ
involvement
On target 25-50% projects: SC pre-PQQ
involvement
25-50% projects: SC pre-PQQ
involvement
50-75% projects: SC pre-PQQ
involvement
50-75% projects: SC pre-PQQ
involvement
50-75% projects: SC pre-PQQ
involvement
Behind target 1-25% projects: SC pre-PQQ
involvement
1-25% projects: SC pre-PQQ
involvement
25-50% projects: SC pre-PQQ
involvement
25-50% projects: SC pre-PQQ
involvement
25-50% projects: SC pre-PQQ
involvement
Missed target 0% projects: SC pre-PQQ
involvement
0% projects: SC pre-PQQ
involvement
<25% projects: SC pre-PQQ
involvement
<25% projects: SC pre-PQQ
involvement
<25% projects: SC pre-PQQ
involvement
53.3 Evidence
53.3.1 Questionnaires
Category Questionnaire response
Do you involve your supply chain partners in developing your PQQ or project requirements?
Dev Yes
Dev No
Dev To a limited extent.

ORE Catapult PN000113-FRT-002
CRMF 2015 Evidence log external Issue: FINAL 289
53.3.2 Interview
53.3.3 Market intelligence
53.4 Additional comments
53.5 Recommendations
The OWPB Supply chain group should consider how to consistently articulate the consequence of the CfD regime on supply chain involvement to the regulator.
Category Interview response
Do you involve your supply chain partners in developing your PQQ or project requirements?
Dev - Yes the supply chain plan it is influencing how they chose contractors, they are looking for suppliers to provide their own supply chain plans to ensure that they can demonstrate they have also considered innovation, skills, local supply etc. - Will be maintaining a track of UK content on their project going forward and will be monitoring suppliers to ensure that they keep to promises - Local content may not have been explicit in early days of supply chain plan, but it has now been widely referenced. Q- supply chain involvement PQQ - There has been significant market engagement through the project so far - Discussions will typically have been a sense check of different chains of through are credible with the suppliers and designers - Engagement has been relatively good as there has been a function of a number years of development process - The CfD situation has accelerated behaviour, as there is a limited 12 month window. This has accelerated a lot of milestones, as developers don’t get a lot of time to mature design and procurement strategy until there is certainty in CfD award. - There will always have to be a deadline by which decision on what new innovation can/cannot be included, but it is likely that the 12 month window is faster that would have ordinarily have been considered optimal. - Timescales of CfD are a very short turnaround. Suppliers are being asked to produce a number of tender rounds while design advances, developers cannot go out to market with a final design, as the design process is still ongoing. Contractors may be tendering based on incomplete information or subject to design change, which may be subject to variations at a later stage. - There is a possibility of not having closure on some areas before being forced to make an investment decision
Dev • Yes involved in developing PQQ requirements • Whilst awaiting award of CfD the potential to gain savings in LCOE from collaboration was closed down. The CfD auction process drives a quick win in cost reduction, but reduces the possibility for cost reductions to be driven by collaboration, as effectively all collaboration must be stopped during the auction process. • Synergies with other sites is an interesting topic, and does offer the potential for some LCOE reduction to be discovered, particularly by the main contractors/supply chain, but is made difficult because of the auction system. • Cost reduction has to come from supply chain, but if they do not see a pipeline in the UK they will not invest the necessary to make this happen. Will treat every project as bespoke and therefore are not incentivised to really drive at reducing LCOE.
Evidence Source
On July 19, 2012, the companies signed a framework agreement for the supply of a total of 300 wind turbines with a capacity of 1,800 megawatts (MW). The
agreement is based on the new SWT-6.0-154 direct drive wind turbine that will be installed in wind power plants off the British coast between 2014 and 2017.
http://www.siemens.co.uk/en/news_press/index/news_archive/siemens-to-supply-300-wind-turbines-to-dong-energy.htm

ORE Catapult PN000113-FRT-002
CRMF 2015 Evidence log external Issue: FINAL 290
54 Standard contracts
CRMF workstream Level 1 indicator Level 2 indicator Level 3 indicator
Technology Collaboration Horizontal Standard contracts
54.1 Summary Analysis
Finding: On target
For projects that reached FID across the EU in 2015, the evidence supports the use of a number of contract forms including adaptations of FIDIC contracts. The 2015 score for this indicator is therefore 'on target'
because standardised contracting encompasses framework agreements, alliancing and/or use of standard contract forms such as LOGIC or FIDIC or industry-specific versions of same. The evidence gathering
process also highlighted a number of insights:
Many developers have created standardised approaches based on a set of standardised clauses internally and have used learning from previous wind farms rounds. Many of these are adapted FIDIC.
There is now a BIMCO specific to wind.
LOGIC is also suggested as a good approach but there is mixed feedback.
Use of NEC 3 for onshore assets is becoming more common.
Outlook: ORE Catapult score of 6.0
Industry score of 4.0 is much more pessimistic than ORE Catapult believe and as such we raise this score to 6.0.
It is unrealistic to aim for a completely standardised approach and the view from industry is that time spent negotiating a standard approach that fits all parties is likely more wasteful than continuing business as
usual. Approaches need to be suited to each organisation and its approach to contracting because of the disparity between developers, for example on number of contract packages.
We may see approaches such as standard clauses rather than full standard contracts continuing to increase in popularity.
A fully standardised contract approach like we see in oil and gas is unlikely but there is the promise of systems like BIM.
Please indicate your level of
confidence in the industry
achieving the following by
2020 for this indicator (1 Low
confidence, 10 High
confidence)
Developer average Electrical OEM average OFTO average Installation average Overall average
50-90% projects use
standardised contracts 5.8 1.5 3.0 5.7 4.0

ORE Catapult PN000113-FRT-002
CRMF 2015 Evidence log external Issue: FINAL 291
54.2 Milestone scorecard
Milestone scorecard FID 2015 FID 2016 FID 2017 FID 2018 FID 2019
Ahead of target >50% projects: standardised
contracts
>50% projects: standardised
contracts
>50% projects: standardised
contracts
>50% projects: standardised
contracts
>50% projects: standardised
contracts
On target 0-25% projects: standardised
contracts
25-50% projects: standardised
contracts
25-50% projects: standardised
contracts
25-50% projects: standardised
contracts
25-50% projects: standardised
contracts
Behind target Industry activity is maturing First standard contracts emerge First projects contract using
standard contracts
1-25% projects: standardised
contracts
1-25% projects: standardised
contracts
Missed target No activity No industry activity Industry activity is maturing First standard contracts emerge No projects have used standard
contracts
54.3 Evidence
54.3.1 Questionnaires
Category Questionnaire response
Are you developing an approach to standardising contracts for your projects?
Dev Yes
Dev Yes
Dev No
Dev Yes
Please provide details on your approach to standardising contracts for your projects?

ORE Catapult PN000113-FRT-002
CRMF 2015 Evidence log external Issue: FINAL 292
Category Questionnaire response
Dev If this question refers to standard contact forms e.g. NEC or FIDIC, the answer is yes,
Dev Contracting strategy dependent on nature of the project, e.g., size, funding and appetite of contractors.
Dev Standardised specifications, conditions of contract and tender formats have been developed.
Are you seeing any move towards standard contracts in the industry? What proportion of the contracts you sign could be considered “standardised”?
Electrical OEM None, although some are based on standard models such as FIDIC and Logic/CRINE but then extensively modified by the Developer. The Developer sees this as a way of controlling his risk and each has his own view and preference based on past experience. This is normal across all construction sectors and we see no reason why standard contracts would be adopted for offshore wind.
Electrical OEM We have seen no evidence of this
OFTO Our experience is on the O&M side, so I am not sure if this question refers to O&M or construction. Due to a small number of contracts the possibility for standardisation is limited. Some use of model form contract for equipment procurement, but each uniquely modified for the specific requirements of the scope.
Installation None.
54.3.2 Interview
Category Interview response
What proportion of the contracts you sign could be considered “standardised”?
Dev • Procurement takes a very long time, especially where a developer must run an EU tender. • There is a big opportunity for making this leaner, as much resource is consumed and not all procurement merits such detailed contracting, e.g. making level of procurement complexity appropriate for the level of spend.
Installation Where there is repeat business there may be some scope for standardisation of contracts which can lead to more efficient contracting
Installation Not involved in legal stuff
Installation Bimco windtime contract is often used as a base, the principles of this are usually re-created with the addition of some very project specific terms and conditions.
Installation - Contracting at the moment is definitely not optimal. - There is a lot of work in modification of contracts to make fidic (an onshore contract) suitable for offshore - Significant hours spent and cost added by continuous modification, negotiation and re-drafting of contracts project to project. - The entire offshore wind market desperately need dedicated offshore wind specific contracts. - The future should look towards something more like a logic contract, where supplier and contractor are compelled to work together and are equally invested in getting the most effective/lowest contingency result. Basis that both must work together on risk analysis. So if the contractor sees a risk, which is not likely to affect them but will affect the client he should still work on mitigating the risk, and has a certain notification period as well as a certain period to work with the client on a solution. Each side tries to improve the chances of success for themselves and also for the other party in the contract.

ORE Catapult PN000113-FRT-002
CRMF 2015 Evidence log external Issue: FINAL 293
54.3.3 Market intelligence
54.4 Additional comments
None for this indicator
54.5 Recommendations
Consider effectiveness or wording of indicator as standard contracting can imply a number of different approaches.
Are you developing an approach to standardising contracts for your projects? / Please provide details
Dev - Largely based on Fidic yellow book modified to suit their purposes - Will be amended and tailored to suit nuances of each individual contract packages - NEC used, typically for some transmission works - Have gained some familiarity with fidic from previous projects - Fidic can be used for EU projects also - With larger ‘wrapped’ contract packages contingencies may be pushed down into the supply chain. - A smaller number of contract packages may have lower contingencies applied by the developer, but the overall contingency will still be there, as it will be pushed down the supply chian - Contingency in future look likely to be increasingly held by suppliers, but difficult to say what impact this may have on overall cost.
Evidence Source
The International Marine Contractors Association (IMCA) has published a variety of guides, templates and discussion documents aimed at raising awareness on
contracting issues, promoting discussion and providing tools that may be useful for its contractor members, their clients and sub-contractors.
http://www.imca-int.com/news/2015/9/22/imca-publishes-renewables-contracting-principles.aspx

ORE Catapult PN000113-FRT-002
CRMF 2015 Evidence log external Issue: FINAL 294
55 Knowledge sharing
CRMF workstream Level 1 indicator Level 2 indicator Level 3 indicator
Technology Collaboration Horizontal Knowledge sharing
55.1 Summary Analysis
Finding: On target
The 2015 assessment of this indicator is ‘on target’. A number of structured knowledge sharing forums exist at varying stages in the lifecycle of maturity. Examples of industry benefit from knowledge sharing can
be seen and in general the industry appears to derive clear benefit from sharing of knowledge. However, the introduction of a competitive auction process (CfD) has been described as a disincentive to
information sharing, particularly ahead of contract award.
Last year this indicator was assessed as on target, specifically noting initiatives such as SPARTA, OWA, and the project developer community of practice. It was also stated that the majority of knowledge sharing
forums (KSFs) were still in a start-up phase and as such there was still room for improvement in knowledge sharing.
Evidence gathering has indicated that:
Many respondents were actively participating in a number of KSFs, including OWA, OWPB, OWIC, SPARTA, ORE Catapult O&M forum, BLEEP and G9
Some respondents were able to describe tangible operational benefits and cost reductions gained as a result of knowledge gained through knowledge sharing
The G9 has been established and has so far published two good practice guides, covering working at height and safe use of small vessels
Almost all respondents described a trend for reduced intercompany knowledge sharing in future, driven by a competitive (CfD) auction system
There are varying levels of participation in KSFs, for example being listed as a supporter or participant is different from actively driving and contributing to groups
Knowledge sharing will always be a balance between competition and collaboration but the shift in support mechanisms has created more competition to build projects and legal constraints relating to
procurement strategies and has pushed focus onto internal knowledge sharing mechanisms. There may also be some reluctance to invest in shared infrastructure or solutions for cost reduction when
projects must compete through an auction process.
Outlook: Industry score of 5.3
The outlook for this indicator is uncertain. A number of knowledge sharing forums exist, and more are in the planning and start-up phases. As such progress in the number of KSFs looks likely to continue.
However there remains scope to improve in both the number of KSFs that are in operation but more specifically in the level of activity and engagement in them. It looks likely that the amount of industry
knowledge sharing (and hence the benefit in cost reduction that may be derived) will be reduced by the competitive nature of an auction system in future.

ORE Catapult PN000113-FRT-002
CRMF 2015 Evidence log external Issue: FINAL 295
55.2 Milestone scorecard
Milestone scorecard FID 2015 FID 2016 FID 2017 FID 2018 FID 2019
Ahead of target KSFs for majority of disciplines
in mature phase
3 developers evidence the
benefits of feedback from
knowledge sharing into
operational processes
KSFs for majority of disciplines
in mature phase
4 developers evidence the
benefits of feedback from
knowledge sharing into
operational processes
KSFs for all disciplines in mature
phase
5 developers evidence the
benefits of feedback from
knowledge sharing into
operational processes
KSFs for all disciplines in mature
phase
6 developers evidence the
benefits of feedback from
knowledge sharing into
operational processes
KSFs for all disciplines in mature
phase
All developers evidence the
benefits of feedback from
knowledge sharing into
operational processes
On target KSFs for at least 2 major
package areas (e.g. installation,
etc) in start-up phase) Others in
planning phase
2 developers evidence the
benefits of feedback from
knowledge sharing into
operational processes
KSFs for at least 3 major
package areas (e.g. installation,
etc) in start-up phase.
3 developers evidence the
benefits of feedback from
knowledge sharing into
operational processes
KSFs for majority of disciplines
in mature phase. Remaining
areas in start-up phase
4 developers evidence the
benefits of feedback from
knowledge sharing into
operational processes
KSFs for majority of disciplines
in mature phase. Remaining
areas in start-up phase
5 developers evidence the
benefits of feedback from
knowledge sharing into
operational processes
KSFs for majority of disciplines
in mature phase. Remaining
areas becoming mature
6 developers evidence the
benefits of feedback from
knowledge sharing into
operational processes
Behind target KSFs for majority of disciplines
in planning phase
1 developer evidences the
benefits of feedback from
knowledge sharing into
operational processes
Pioneer KSF in mature phase
but KSFs for majority of
disciplines in start-up phase
2 developers evidence the
benefits of feedback from
At least one other KSF in mature
phase but KSFs for majority of
disciplines in start-up phase.
Some KSF struggling to gain
traction
3 developers evidence the
Pioneer KSF in mature phase
but KSFs for majority of
disciplines in start-up phase.
Some KSF struggling to gain
traction
4 developers evidence the
Pioneer KSF in mature phase
but KSFs for majority of
disciplines in start-up phase.
Some KSF struggling to gain
traction
5 developers evidence the
Please indicate your level
of confidence in the
industry achieving the
following by 2020 for this
indicator (1 Low
confidence, 10 High
confidence)
Developer average WTG OEM average Electrical OEM average OFTO average Installation average Overall average
Knowledge sharing forums established for majority of all appropriate disciplines
6.3 5.8 3.0 5.0 6.3 5.3

ORE Catapult PN000113-FRT-002
CRMF 2015 Evidence log external Issue: FINAL 296
knowledge sharing into
operational processes
benefits of feedback from
knowledge sharing into
operational processes
benefits of feedback from
knowledge sharing into
operational processes
benefits of feedback from
knowledge sharing into
operational processes
Missed target Little or no KSF activity for
majority of disciplines
No developers evidence the
benefits of feedback from
knowledge sharing into
operational processes
Little or no KSF activity for
majority of disciplines
No developers evidence the
benefits of feedback from
knowledge sharing into
operational processes
Little or no KSF activity for
majority of disciplines
No developers evidence the
benefits of feedback from
knowledge sharing into
operational processes
KSFs for majority of disciplines
in planning phase
1 developer evidences the
benefits of feedback from
knowledge sharing into
operational processes
Pioneer KSF in mature phase
but KSFs for majority of
disciplines in start-up phase
2 developers evidence the
benefits of feedback from
knowledge sharing into
operational processes
55.3 Evidence
55.3.1 Questionnaires
Category Questionnaire response
Focussing on changes in the recent year, describe your company’s approach to sharing knowledge internally
Dev Matrix organisational structure allows key staff/ senior management to have input into portfolio of projects and transfer learning from one to the next Each project has review checkpoints to allow peers in other projects to share experiences and challenge decisions/ options Lessons learned presentations take place between different project teams Work underway to establish a lessons learned database to more formally capture lessons learned and share across the business
Dev Internally knowledge sharing is essential to learn from other projects.
Dev Make sure fundamental project information, e.g. safety, is easily available to everyone. Lessons learnt on previous projects available.
WTG OEM Sharing with our Joint Venture partner has greatly increased, and has dominated how internal information is used - with parallel IT systems and new people there are cases both of more knowledge sharing and less
WTG OEM Very high. We form cross-functional Teams all the time.
Electrical OEM We have a formalized return on experience procedure where learning on a previous project can be passed on to the team working on current projects.
Electrical OEM [Electrical OEM] shares technical knowledge internally between business units involved in offshore wind to enable cost reduction. The [PRODUCT] is an example of this collaboration.
OFTO Information is shared internally via lessons learnt and peer reviews. We have a centralised knowledge store with a wide access within the company
Installation We have a focussed commercial team and adjust our strategy on a yearly basis.
Installation [Installation] is very active in groups like IMCA which is working hard to share knowledge and improve industry practices. [NAME] from [Installation] chairs the IMCA renewable energy workgroup. This group is very active with G9, Renewable UK, NWA, IJUBOA, Carbon Trust and others on sharing knowledge and best practice across the industry.

ORE Catapult PN000113-FRT-002
CRMF 2015 Evidence log external Issue: FINAL 297
Category Questionnaire response
Focussing on changes in the recent year, describe your company’s approach to sharing knowledge amongst the wider industry. i.e. Are you involved in any schemes such as the Offshore Wind Accelerator (OWA) or the Blade Leading Edge Erosion Programme (BLEEP) etc.?
Dev Involved in multiple industry workgroups including the OWA, SPARTA, ORE Catapult Industry Advisory Group amongst others. We have also been involved in discussions to date to define the BLEEP project’s aims, methods and participation Open to knowledge sharing, however, notable that the CFD auction process can have an adverse effect on the willingness of developers to share insights to preserve a competitive advantage in future auction rounds.
Dev We are happy to engage with wider industry schemes, although the increasingly competitive nature of the electricity price support contracts has worked against knowledge sharing across the industry.
Dev BLEEP. Regular contact and open for discussions with OWA. Active in RenewableUK forums. Involved with the Offshore Wind Industry Council.
WTG OEM Participation in R&D + other industry initiatives such as CRMF/OWPB + technical presentation at industry events
WTG OEM
[WTG OEM] is an active participant in OWIC, contributing strongly to cross-industry initiatives and chairing two of the key OWPB working groups. We strongly believe that to keep costs reducing some collaboration on common issues is required
WTG OEM High. We speak at conferences and participate in Joint Industry Projects such as BLEEP.
Electrical OEM We are generally in competition with other suppliers so our ability and willingness to share our learning openly with others is limited where this may give our competition an advantage.
Electrical OEM The development of the [PRODUCT] has involved substantial industry stakeholder consultation ranging from certification and standards bodies to insurers, developers and supply chain partners.
OFTO As an OFTO owner we are members of the ENA OFTO forum (which share non-commercial information between the members and interested 3rd parties) and have participated with variation industry consultation. However, due to our small organisation our ability to interact with the wider industry is resource limited.
Installation We are not sharing our developments with the industry where can make the difference.
Installation See above.
Have you any examples whereby knowledge sharing has been used to drive operational improvements in your organisation or on an offshore wind farm?
Dev Knowledge sharing is being used constantly within the Company and in external forums: - Value Engineering is now a established discipline and lessons learned and process are shared between the Projects. This is allowing to take better decision that improves the economics of the Projects and to have a better definition and control of the budgets. - R&D Projects like the floating lidar is starting to shape the way we are going to measure the wind in new sites. - Consenting lessons learnt has proven to be a key factor to drive operational improvements.
Dev We do have examples where knowledge sharing between project partners in the development phase can improve project development processes.
Dev Lessons learnt from [PROJECT]. Also from the Met Mast gravity based foundations at [PROJECT] Used health and safety for offshore industry put in place by RenewableUK
WTG OEM no

ORE Catapult PN000113-FRT-002
CRMF 2015 Evidence log external Issue: FINAL 298
Category Questionnaire response
Electrical OEM No examples
OFTO As this tends to be incremental continual improvement it is difficult to be specific; however, we have used information from the wider industry to examine our working practices.
Installation no
Installation Yes, we use IMCA guidelines, safety flashes, etc. in our daily operations.
55.3.2 Interview
Category Interview response
Focussing on changes in the recent year, describe your company’s approach to sharing knowledge internally
Dev • [Dev] have spent a couple of years working on developing a detailed structure for knowledge sharing, where project organisations will interact with lessons learned then being applied portfolio wide in order to gain benefits. • [Dev] do have a specific organisation set up to drive these portfolio benefits, they can benefit as they consistently have 3 – 5 projects in construction. • They are also setting up an internal division which will share O&M best practice as well. • Suction buckets are an example of taking some upfront cost away from projects to drive long term organisational gain. • [Dev] deliberately take some of these knowledge sharing activities away from individual project budgets into a portfolio benefit division. The attractive feature is that this removes barriers to innovation internally and encourages all projects to gain benefit from trials or other knowledge which can be shared.
WTG OEM • Internal knowledge sharing is an integrated part of processes • Existing processes will be designed to collect and share experience as an integrated part of project executions
O&M Heads of revenue streams share experience and best practice across disciplines. [O&M] can draw on a wide scope of projects to gain experience, but do not have a single or structured lessons learned process internally
Focussing on changes in the recent year, describe your company’s approach to sharing knowledge amongst the wider industry. i.e. Are you involved in any schemes such as the Offshore Wind Accelerator (OWA) or the Blade Leading Edge Erosion Programme (BLEEP) etc.?
Dev In the future could forsee a lot of collaboration with key supply chain partners ahead of auction round. If there was better visibility of what subsequent auction rounds may be coming and when, there would be a possibility to develop ways to more formally engage across the supply chain before the CfD award
Dev • [Dev] have a large enough portfolio that they can get away without knowledge sharing. They have participated in external knowledge sharing in the past, but are likely to be doing less in the future. • Where there are well defined specific technical issues they will work with the industry, but since it is a competitive world there will be things that they have to keep to themselves. • This has probably changed as cost is now the only competitive parameter (in an auction based world) therefore the likelihood to share and interact openly will be reducing. • There will also be less informal exchanges of knowledge of in future.
Dev • Are in OWA – Flidar, twisted jacket programmes etc. • Participate in Crown estate knowledge hub for developers
Dev There are probably sufficient different industry bodies, there may even be an opportunity for some consolidation of industry bodies to enhance focus of knowledge sharing forums

ORE Catapult PN000113-FRT-002
CRMF 2015 Evidence log external Issue: FINAL 299
- Challenge for developers is that they all want to make cost reductions ahead of each other to make chances of winning auction more likely
- Knowledge sharing therefore may come predominantly from interchange of contract staff etc
- Auction environment may make knowledge sharing more challenging
- There will be a drive from a business need to be better than competing bids, but must still find a way to make things profitable
WTG OEM • There is potentially scope for more knowledge sharing, but it must be focussed • Cost reduction task force was structured well and arduous to set up, but was the best example of collaboration seen to date.
WTG OEM There are a lot of forums and collaborative projects, likely that there are already sufficient methods of collaborating. But the challenge is always there to find the balance of what can and cannot be shared in a competitive market, but generally collaboration is happening.
WTG OEM • Industry forums exist and have a fairly good level of interaction with competitors • But as this is a competitive market so don’t think there is a strong need for more forums/mechanisms
O&M [O&M] have facilitated some industry workshops/forums They are keen to collaborate with the catapult on programmes. are happy to do things for the wider benefit of the industry
Installation - Contractors may be reluctant to share information – This is natural - However, it can be seen how standards will drive cost reduction. - Ideally it should Not fall to the bottom of the supply chain to expend all the effort on standards, developers for example will get the benefit from improvements, and really should be driving the development of standards. - There is a balance to be found on what they can share and what gives individual competitive advantage. - the most cost can be saved in supply chain solutions, if the supply chain is allowed to innovate then it will, and This will likely be where the largest cost savings will tend to be found.
Installation [Installation] Are on RUK offshore wind delivery group and OWPB supply chain group. Some technical colleagues are involved in G9 HSE, also heavily involved in wind organisations in Denmark. - There is actually quite a lot going through these groups, accepting the limits of commercial companies. The main comment is that improvement through such collaboration necessarily takes time. - Have provided comment/input to some guidelines for best practice.
Installation Information normally needed is input by client only and they don’t get data more widely in the industry to develop products.
Foundation - Could be interested in participating in an appropriate/specific forums/committees/projects etc. - Would like to develop a UK partner for final assembly/some manufacture in the UK. Are actively looking at this, and are seeking to up their UK content.
Dev - Sharing information these days is about finding the right balance between information sharing and competitive advantage. - Knowledge sharing is on the whole a good thing, and it is beneficial for others to learn from previous projects. - There has probably been a reduction in knowledge sharing as industry has passed through learning phase, so whilst CfD has accelerated the close down of knowledge sharing it could also be viewed that this is a natural progression of an industry being more mature in lessons learned and particularly positive routes to competitive advantage not being shared between competitors, or at least being shared less than when the industry was very new.
Designer - BLEEP is known, understood, and seen as valuable - There is room for increased collaboration on boat landing, HSE, O&M etc. Offshore renewables lacks cross industry sharing of lessons learned, best practice and so on. This could also include linking up with experience in Oil and Gas to improve offshore operations.
WTG OEM - OWA should be very good – kind of thing that [COMPANY] would look at much more avidly than [COMPANY], therefore [COMPANY] may be opening up more to knowledge sharing - Are all of the models that have been developed for steam/gas turbines etc applicable to offshore wind? - Inherent number of variables makes things like SPARTA a challenge for offshore wind.

ORE Catapult PN000113-FRT-002
CRMF 2015 Evidence log external Issue: FINAL 300
55.3.3 Market intelligence
55.4 Additional comments
None for this indicator
55.5 Recommendations
The OWPB supply chain work group should consider whether an appropriate balance between competition and collaboration is being achieved, and whether the actual situation represents purely an industry
becoming more mature or whether the increased barriers to knowledge sharing have been introduced too quickly and will hence have a detrimental effect. Consider how the potential cost reductions achievable
through cross industry knowledge sharing can be achieved when companies are incentivised to reduce external knowledge sharing.
- However a lot of the unknowns in offshore wind are becoming more measureable.
Have you any examples whereby knowledge sharing has been used to drive operational improvements in your organisation or on an offshore wind farm?
Dev • SPARTA is a good example
Dev • Have contributed to and benefited from participation in OWA
Evidence Source
Wind farm owners representing 12% of global turbine assets have founded o2o Wind, a peer-to-peer online platform exchanging knowledge and experience on
operation and maintenance issues.
Members, including EDPR, Vattenfall, RWE, DONG Energy, Statoil and Acciona Energia, say the objective is to optimise turbine yields through the exchange of
information.
http://renews.biz/100664/knowledge-is-power-for-om/

ORE Catapult PN000113-FRT-002
CRMF 2015 Evidence log external Issue: FINAL 301
56 Technical standards
CRMF workstream Level 1 indicator Level 2 indicator Level 3 indicator
Technology Collaboration Horizontal Technical standards
56.1 Summary Analysis
Finding: Ahead of target
This indicator is ahead of target, as the number of industry specific guidelines and standards continues to increase.
Last year this indicator was also assessed as ahead of target, giving reference to 15 offshore wind specific standards or guidelines with more in development.
Evidence from interview and questionnaire responses suggested that:
Several respondents were actively involved in contributing to the development of standards,
References were made to SQSS, OWA, G9, IEA tasks, CIGRE, DNV standards, OSIG, Ofgem, IEC, IMCA, and National grid in relation to the development of standards and guidelines,
As a result of a rapidly maturing industry there are several areas where standards are actively being developed, improved or where further standards would be of benefit,
Related; some standards have been inherited or are not well suited to the offshore wind industry and as such may offer the opportunity for cost reduction benefit from further development,
Cross industry and cross market standardisation still represents a significant opportunity for cost reduction through standardisation, particular references were made to electrical and health and safety
standards as areas where, for example UK and German offshore wind projects are not aligned to a common standard,
Particularly for the Electrical subsystems and components, general standards from other industries are relied upon by the wind industry, however for large offshore wind turbine, the introduction of more
specific or relevant standards offer the opportunity for cost reduction.
Outlook: Industry score 5.8
The outlook for this indicator is reasonably positive. The trend for an increasing number of standards and guidelines to be published looks likely to continue. Opportunities exist for improvements in the targeting of
areas where new standards would be of benefit and in the dissemination of new guidelines and standards across the industry to drive rapid acceptance and uptake. This is particularly relevant where the standard
may offer the benefit of cost reductions, i.e. through standardisation.

ORE Catapult PN000113-FRT-002
CRMF 2015 Evidence log external Issue: FINAL 302
56.2 Milestone scorecard
Milestone scorecard FID 2015 FID 2016 FID 2017 FID 2018 FID 2019
Ahead of target 11-15 industry guidelines /
standards in use. 4 - 9 other
ones at various stages of
development with industry
11-15 industry guidelines /
standards in use. 4 - 9 other
ones at various stages of
development with industry
13-17 industry guidelines /
standards in use. 2 - 6 other
ones at various stages of
development with industry
16-20 industry guidelines /
standards in use
>18 industry guidelines /
standards in use
On target 5-10 industry guidelines /
standards in use. 2-5 under
development with input/buy in
from industry
5-10 industry guidelines /
standards in use. 2-5 nearly
complete with input/buy in from
industry. 2-5 others in planning
phase
11-15 industry guidelines /
standards in use. 4 - 9 other
ones at various stages of
development with industry
11-15 industry guidelines /
standards in use. 4 - 9 other
ones at various stages of
development with industry
13-17 industry guidelines /
standards in use. 2 - 6 other
ones at various stages of
development with industry
Behind target 1-4 industry guidelines /
standards in use. A few others
proposed with limited buy in
5-10 industry guidelines /
standards in use. 2-5 in start-up
phase seeking input/buy in from
industry
5-10 industry guidelines /
standards in use. 2-5 under
development with input/buy in
from industry
5-10 industry guidelines /
standards in use. 2-5 nearly
complete with input/buy in from
industry. 2-5 others in planning
phase
11-15 industry guidelines /
standards in use. 4 - 9 other
ones at various stages of
development with industry
Missed target No industry guidelines /
standards in use. A few in
planning phase
No industry guidelines /
standards in use. 1-4 under
development
1-4 industry guidelines /
standards in use
5-10 industry guidelines /
standards in use. 2-5 in start-up
phase seeking input/buy in from
industry
5-10 industry guidelines /
standards in use. 2-5 in start-up
phase seeking input/buy in from
industry
Please indicate your
level of confidence in
the industry achieving
the following by 2020
for this indicator (1
Low confidence, 10
High confidence)
Developer average WTG OEM average Electrical OEM
average OFTO average Designer average Installation average Overall average
16-20 industry guidelines / standards in use.
7.7 6.5 4.0 5.0 6.0 5.5 5.8

ORE Catapult PN000113-FRT-002
CRMF 2015 Evidence log external Issue: FINAL 303
56.3 Evidence
56.3.1 Questionnaires
Category Questionnaire response
Describe any technical standards which your company is involved in developing and/or refining? E.g. Recommended Practice on Power Cables in Shallow Water Renewable Energy Applications.
Dev FOUNDATIONS : Development of new p–y curves for lateral pile design (‘OWA ‘PISA’ project) Validation of guidelines for OPC grouted connections (OWA ‘GOAL’ project) Development of improved guidance for pile design in chalk Under development: Demonstration of suitability of less conservative fatigue curves for jacket nodal design WIND RESOURCE OWA Roadmap for the commercial acceptance of the Floating LIDAR technology International Energy Agency (IEA) Annex 32 Work Package 1.5 Recommended Practice for Floating LIDAR Systems , through the OWA Project IEC TC88 61400-3 Edition 2: Design requirements for offshore wind turbines ELECTRICAL More involved in providing input and evidence to guidelines rather than standards. Including DNV/KEMA cable installation and HVDC offshore platforms etc. We are also interested in supporting the UK CIGRE 66kV cable guideline. We also feed into [PROJECT] Grid Codes and UK grid code
Dev We are involved in Joint Industry Project on Subsea cables, and G9 development of Offshore Wind Industry Safety Standards.
Dev Updated 66kVsubmarine cable standards with CIGRE Heavily involved with SQSS to allow for single transformer platforms. Worked on SQSS-GSR-014-17 OFGEM’s commercial study on offshore transmission systems
Electrical OEM Security and Quality of Supply Standard (SQSS): [Electrical OEM] has made an application of the modification of this standard to allow single transformer offshore substations (e.g. modular distributed substations) to be used without the need for a design variation. This has been approved through the GSR020 working group.
OFTO As a OFTO owner we have been participated in System Operator -Transmission Owner Code reviews and SQSS changes. We have also provided responses on industry consultation such as those from the Crown Estate. Our focus is to concentrate on those that can impact future operations
Installation We have been in a number of DNV studies. Recently we have done a study on standards of rock dump on a HV subsea cable.
Installation [Installation] & [COMPANY] are involved in numerous workgroups and have responded to most of the recommended practice guidance that has been produced in recent years, either directly or via IMCA.
Designer OSIG Site investigation best practice for marine renewable projects - completed BOEM best practice guidelines for surveys on US offshore marine energy projects – [Designer] awarded the project not started OFGEM Best practice guide for surveys and installation of export power cables - completed
Are there any areas where you think technical standards need developing?
WTG OEM Cannot think of any

ORE Catapult PN000113-FRT-002
CRMF 2015 Evidence log external Issue: FINAL 304
Category Questionnaire response
Installation Personally, I think that we should develop functional requirements rather than technical ones. Parallel to this we should agree on an integrated way (between Client and contractor) how the contractor validates and verifies his design to enable freedom of a more cost efficient project outcome.
Installation There is actually a lot out there at the moment. More guidance is needed on where to fine existing guidelines. Where we've spotted gaps we have worked with groups such as IMCA to try to close them. For example IMCA is currently working on diver guidelines and ROV guidelines for offshore renewables.
Electrical OEM There are no OFTO standards so the tendency is for developers to adopt National Grid Technical Specifications and ENA approvals in the absence of anything else, on the assumption that whoever the OFTO is when appointed cannot object to the specification. This stifles innovation and prevents for example IEC standards being adopted.
Electrical OEM Technical standards for integrated distributed substation solutions where the turbine and substation share a foundation. Currently there are two conflicting standards, J201 for substations and J101 for wind turbine foundations.
OFTO Whilst this is ongoing there needs to be clarity in planning levels of harmonic distortion G5/4 (National Grid working group - GC0036 Review of Harmonics Assessment Standards and Processes)
56.3.2 Interview
Category Interview response
Describe any technical standards which your company is involved in developing and/or refining? E.g. Recommended Practice on Power Cables in Shallow Water Renewable Energy Applications.
Dev • Engineering department is doing quite a lot of work on helping to develop and define standards. • [Dev] do believe that we need some more uniform standards, at least at EU level to drive industry benefit.
Dev • Not much involvement or development to mention.
Dev · In February 2015, new guidance has been published by the Carbon Trust’s Offshore Wind Accelerator (OWA) to give the offshore wind industry a unified, systematic approach to the risk management of cable burial. This standard has been utilised. · J101, grouted design standards. This has been a difficult change to get through on the project and it is making it more difficult to get grouted connections to use. The same design standards are used on jackets/monopiles. It enforces a more rigorous design approach to insure not under designed e.g. while grout is curing, need to guarantee that won’t move by more than 1mm – adding cost & complexity to projects.
WTG OEM There is some good international collaboration on technical standards
WTG OEM • [WTG OEM] are mostly focussed on activity to develop technical standards for wind turbines specifically.
O&M scope for optimisation around specific site requirements being repetitive and lack of sharing hse inductions etc. between sites/operators
Foundation Have developed some standards in consultation with other industry stakeholders (e.g. turbine OEMs)
Are there any areas where you think technical standards need developing?
WTG OEM H&S standards across geographies/markets are not the same. There is added cost to the industry at a pan European level from duplication and inefficiencies in having to deal with differing legislations/regimes/requirements.
WTG OEM • What willingness is there in the industry to engage in moving areas of lacking standards? – not sure. • Significant variability of HSE standards across sites, is likely to lead to increased costs and could probably be standardised.

ORE Catapult PN000113-FRT-002
CRMF 2015 Evidence log external Issue: FINAL 305
56.3.3 Market intelligence
56.4 Additional comments
None for this indicator
56.5 Recommendations
None for this indicator
O&M some specific hse, such as inductions and isolations do still have scope for standardisation. Interested in standardising/sharing of expensive (jack up etc.) vessels by groups of operators
Installation TPs standard needed - every project has different design. With minor adjustments could be used on a number of projects
Foundation
- 30% cost can come out of jacket manufacturing by designing for robot welding - They would like to share this standard with the industry as there is a need to serialise production. They would therefore welcome the opportunity to share best practice for development of industry and also learn from others. Have shared with [COMPANY] / [COMPANY] etc.
Evidence Source
• ISO 29400:2015, Ships and marine technology – Offshore wind energy – Port and marine operations, provides comprehensive requirements and guidance for
the planning and engineering of port and marine operations, encompassing all related documents and works necessary for the installation and maintenance of
offshore wind farms. This includes the design and analysis of the components, systems, equipment and procedures required to perform port and marine
operations, as well as the methods or procedures developed to carry them out safely.
http://www.offshorewind.biz/2015/06/18/iso-sets-up-new-international-standard-for-owf-ports/
http://www.iso.org/iso/home/store/catalogue
_tc/catalogue_detail.htm?csnumber=60906
In May 2015 DNV GL issued the standard DNVGL-ST-0076 Design of electrical installations for wind turbines https://rules.dnvgl.com/docs/pdf/DNVGL/ST
/2015-05/DNVGL-ST-0076.pdf
In November 2015 RenewableUK published H&S Guidelines: Vessel Safety Updated Guide for Offshore Renewable Energy Developers http://www.renewableuk.com/en/publication
s/index.cfm/vessel-safety-guide
In April 2015 The British Standards Institution PD 6900 Environmental impact assessment for offshore renewable energy projects – Guide http://www.bsigroup.com/en-GB/about-
bsi/media-centre/press-
releases/2015/april/Offshore-renewable-
energy-guide-published/#.Vk3gBnbhBhE
A revision of the existing standard for the power performance testing of wind turbines IEC 61400-12-1:2005 Part 12-1 is known to be currently in an advanced
draft phase and is forecast to be published in 2016.
https://webstore.iec.ch/publication/5429&pr
eview=1

ORE Catapult PN000113-FRT-002
CRMF 2015 Evidence log external Issue: FINAL 306
ORE Catapult PN000113-FRT-002
CRMF 2015 Evidence log external Issue: FINAL 307
57 Introduction to Finance indicators
Following challenges in acquiring information in the debt indicators in the CRMF 2014, the OWPB finance group and its extended network were approached to support engagement and evidence gathering
activities for CRMF 2015. Subsequently evidence for these indicators was gathered by conducting group workshop engagement sessions and one to one interviews. Questionnaires were not used and as such
evidence from workshop and interview discussions appear by topic in the interview evidence section for each indicator.

ORE Catapult PN000113-FRT-002
CRMF 2015 Evidence log external Issue: FINAL 308
58 Capital availability
CRMF workstream Level 1 indicator Level 2 indicator
Finance Cost of equity Capital availability (operations and construction)
58.1 Summary Analysis
Finding: On target (construction)
Finding: On target (operation)
Concerns were raised in the CRMF 2014 about the potential scarcity of equity on the lead up to 2016/17 due to the large number of projects being squeezed through the pipeline in order to meet subsidy
milestones. Evidence this year from interviewees suggests that liquidity has increased well beyond the demands of the market and that there is now much less concern about equity becoming available during the
construction phase.
A number of private finance institutions have entered the market. Equity availability has improved due to the attractiveness of the returns for construction phase equity compared to other infrastructure sectors
currently and the fact that technology and construction risk are becoming better understood. Financial institutions entering the market has created inertia that has also encouraged others to enter.
Interviewees noted the scarcity of capital available to take on Development phase risk, particularly in light of the introduction of the CfD regime, which adds a further layer of risk to capital in this phase. It remains
only utilities and project developers, who are already active in the market, that are prepared to risk capital for this phase of development. The entrance of China Three Gorges to support its subsidiary EDPR with
development equity on the condition that a CfD is secured highlights a reluctance to risk capital for the development phase.
Equity availability for operational projects has also improved. The GIB's announcement of reaching their £1bn milestone for equity investment in their equity fund for operational projects is considered to be a
positive move forward for the sector. Throughout the interview process, we received consistently positive feedback across the sector about the GIB's involvement in wind farm deals and their ability to act as a
trusted partner when introducing equity to the market.
Utilities continue to sell down stakes in operational projects to recycle capital in further development rounds. Other sectors have seen utilities sell down entire projects and this is possible for offshore wind but
unlikely in the short term. It is likely that some retention (at least 15-25%) by utilities will be required in the near term in order to satisfy other equity shareholders in a deal.
Outlook: 5 (construction)
Outlook: 8 (operation)
The outlook for this indicator is scored by ORE Catapult and validated with industry experts, including those on the OWPB finance sub group.
Although there is relatively positive progress for equity availability, there are a number of factors which still could potentially block progress.
The trend to build offshore wind farms and then sell down to equity partners will continue in Europe. It was however noted by interviewees that the ability for utilities to spread risk through their corporate facilities
will become more difficult as offshore wind becomes a core asset in the context of their wider portfolio.
The increase in diversity of the equity market offers more certainty than before that it won’t fall away in the short term, bar any major global financial crisis or a major serial defect reducing confidence of investors.
As noted in the CRMF 2014, there is a bubble in the UK pipeline on the run up to 2020 and this could prove challenging for getting projects to financial close. During interview, the bottleneck for this was cited as
the ability to process transactions, rather than the availability of capital. There is split opinion on which of these issues could materialise. Some utilities do raise equity themselves and don’t always wait for the
market but this may become more challenging as the size of the projects increases.

ORE Catapult PN000113-FRT-002
CRMF 2015 Evidence log external Issue: FINAL 309
There is appetite in the finance market for a tranche of mezzanine funds, such as the fund from EIG Global Energy Partners.
Floating wind farm projects were also cited in interviews as currently looking at raising finance for the second and third projects after initial demonstrators. Whilst floating wind technology is outside the remit of
this study, considerable progress has been made in Scotland in securing arrays of floating turbines, notably Buchan Deep and Kincardine, but it is unlikely that banks will finance initial development and
construction of these projects.
58.2 Milestone scorecard
58.2.1 Capital Availability - Bridge Equity (Construction) (% of total funding)
Milestone scorecard FID 2015 FID 2016 FID 2017 FID 2018 FID 2019
Ahead of target 0.00% <20.00% <20.00% <20.00% 0.00%
On target 0.00% 20.00% 20.00% 20.00% 0.00%
Behind target 0.1% - 40.00% 20.1% - 40.00% 20.1% - 35.00% 20.1% - 30.00% 0.1% - 10.00%
Missed target >40.00% >40.00% >35.00% >30.00% >10.00%
58.2.2 Capital Availability - Bridge Equity (Operation) (% of total funding)
Milestone scorecard FID 2015 FID 2016 FID 2017 FID 2018 FID 2019
Ahead of target 0.00% <10.00% <10.00% <10.00% 0.00%
On target 0.00% 10.00% 10.00% 10.00% 0.00%
Behind target 0.1% - 40.00% 10.1% - 40.00% 10.1% - 35.00% 10.1% - 20.00% 0% - 10.00%
Missed target >40.00% >40.00% >35.00% >20.00% >10.00%
58.3 Evidence
58.3.1 Interview
Topic Interview response
Increase in liquidity in construction and operation
Liquidity has improved further since last year and remains high. Equity during construction phase has come earlier than may have been expected. It is more of an issue that equity isn't available in the development phase. As construction is now better understood and is perhaps less competitive than complete projects so, from a margin point of view, more attractive. Investors not likely to put up devex money at such a high risk. Earliest they are likely to come in is at construction. There has been a shift away from a utility dominated market.
To an extent this is because offshore wind is an active area (European market in general) or is more active than other infrastructure markets. Also, EU offshore wind may be seen as a slightly higher yield than traditional major infrastructure projects.
Pension funds etc. who are conservative towards risks usually have moved from post construction into equity with construction risk But availability of equity is linked to behaviour of world market, which can move rapidly and are outwit control of the sector Currently 70/30 gearing is likely. Deals in the EU are capped.

ORE Catapult PN000113-FRT-002
CRMF 2015 Evidence log external Issue: FINAL 310
58.3.2 Market intelligence
Scarcity of DEVEX
Should differentiate what is available before financial close, equity available for construction and what is available post construction for recycling. Chances of equity putting 50m EUR on risk of consent and CfD to invest in offshore wind post 2020 in UK is low.
Selling down
Utilities have sold down to 15% previously Could see a situation where the common 20% sell down will increase to utilities selling out completely. Other sectors have seen utilities sell down entire projects, so
this is possible for offshore wind. Investors do typically expect development and construction to have an established (utility) name involved, but other new entrants (e.g. [COMPANY]) have built credibility and could now conceivable step in, certainly after construction. Partnership models becoming more commonplace at 20/25% ownership level and introducing other investors into the consortium, largely driven by the size of the transactions in the market.
Investors are not necessarily looking for utility involvement as projects sell down
Outlook
Diversification of equity in market offers more certainty than before that it won’t fall away in the short term There is a bubble in the UK pipeline and this could present a problem in getting projects to financial close. This is not due to the availability of money but the ability to
document everything and process transactions. Organisations like [COMPANY] and [COMPANY] raise equity themselves and don’t always wait for the market. Financial investors are not being putting off by new technologies and the regulatory risk is viewed as a much bigger issue. Floating projects are looking at what aspects they need to address to raise financing of second and third projects after initial demonstrators. Unlikely that banks will
finance initial development and construction of these projects. [COMPANY]- Spreading risk through corporate facilities would be difficult if wind gets bigger in the context of their wider portfolio. Still a question over how many deals banks can physically close over the next few years with an expected bubble in the pipeline. Trend to build and then sell down will continue in Europe. High appetite in finance market for tranche of mezzanine funds. This is something that has an overall positive impact on financing and something which is a recent
move in the market. Sized around 100m on each project, with a total available for European offshore wind of more than 1bn.
Evidence Source
UK Green Investment Bank plc (GIB) has today announced that it has now committed £2.3bn to 58 green infrastructure projects with
a total value of £10.1bn. The announcement was made almost three years to the day that the organisation was officially declared
open.
http://www.greeninvestmentbank.com/news-and-insight/2015/uk-green-investment-bank-helps-mobilise-10bn-of-capital-into-uk-green-infrastructure/
Moray Firth. October 2015: Under the agreement, CTG would acquire up to 30% of the "equity and shareholder loans" owned by the
project's developing company, Moray Offshore Renewable Limited (MORL), a wholly owned subsidiary of EDPR. Upon the
announcement of a second auction round, CTG will acquire between 10%-20%.
If MORL wins a CfD subsidy, CTG will invest another 10%. EDPR said the 1.1GW project may be divided into phases to make it
more competitive in the auction.
http://www.windpoweroffshore.com/article/1369072/ctg-plans-30-moray-
firth-stake
Canadian energy group Enbridge has taken a 24.9 percent stake in E.ON's 1.9 billion euro ($2.1 billion) offshore wind project
Rampion, the latest in a wave of deals that has boosted the European wind power sector.
http://globenewswire.com/news-
release/2015/09/10/767504/10148964/en/DONG-ENERGY-AND-
GLOBAL-INFRASTRUCTURE-PARTNERS-TO-FORM-50-50-
PARTNERSHIP-TO-BUILD-GERMAN-OFFSHORE-WIND-FARM-
GODE-WIND-1.html

ORE Catapult PN000113-FRT-002
CRMF 2015 Evidence log external Issue: FINAL 311
58.4 Additional comments
None for this indicator
58.5 Recommendations
There were actions last year for the OWPB finance group to work on further involvement of the GIB and to support the increase in appetite for equity during construction. This has progressed however the impact
of a major technical issue could reset the market and pricing of finance overnight. The OWPB finance group should work to ensure that the balance between innovation and risk is well understood to ensure
financing cost is appropriate and trajectory is sustainable.
October 2015: A new partnership heralds a green light for the construction of the 336MW Galloper project. RWE Innogy announced
three new project partners for Galloper Wind Farm Ltd., each becoming 25% joint equity partners: UK Green Investment Bank,
Siemens Financial Services and Macquarie Capital. The debt financing for Galloper has also been closed with a consortium of 12
commercial banks and the European Investment Bank providing 1.37 billion in debt facilities.
http://www.4coffshore.com/windfarms/project-dates-for-galloper-wind-
farm-uk62.html
Private equity firm Global Infrastructure Partners has agreed to pay €780 million ($875 million) in the period 2015 to 2016 for a 50
percent stake in a German offshore wind farm being developed by Danish energy giant DONG Energy AS.
http://www.law360.com/articles/701237/gip-to-pay-875m-for-german-
offshore-wind-project-stake

ORE Catapult PN000113-FRT-002
CRMF 2015 Evidence log external Issue: FINAL 312
59 Regulatory risk premium
CRMF workstream Level 1 indicator Level 2 indicator
Finance Cost of equity Regulatory risk premium
59.1 Summary Analysis
Finding: On target
Delayed announcements, changes to policy and the recent removal of LECs has had a negative impact on investor confidence. There is however no clear evidence that regulatory risk premiums have increased.
Target milestones predict that regulatory risk premiums remain unchanged for projects reaching FID from 2014-2016, hence the indicator is 'on target'. There is progress in set up of the LCCC and although first
CfD payments are yet to be made, there are no indications yet of any specific risks emerging. There is an awareness, but no apparent concern, of the chance of retroactive change to policy.
Outlook: 5
The outlook for this indicator is scored by ORE Catapult and validated with industry experts, including those on the OWPB finance sub group.
Although there is progress for regulatory risk premiums (premiums not increasing is considered positive progress in the milestones), there are a number of factors which still could potentially block progress.
There has been no clear view on whether developers and financial institutions will see regulatory risk premium drop by 2020 and they consistently view the regulatory risk as greater than any perceived
technology risk.
59.2 Milestone scorecard
59.2.1 Regulatory risk premium (Asset beta)
Milestone scorecard FID 2015 FID 2016 FID 2017 FID 2018 FID 2019
Ahead of target <0.6 <0.6 <0.5 <0.5 <0.5
On target 0.6 0.6 0.5 0.5 0.5
Behind target 0.61 - 0.9 0.61 - 0.9 0.51 - 0.7 0.51 - 0.6 0.51 - 0.6
Missed target >0.9 >0.9 >0.7 >0.6 >0.6
59.3 Evidence
59.3.1 Interview
Topic Interview response
Low confidence in CfD and government The longer that government leave to announce next steps with CfD, the greater the risk. Government has generally been quite effective except for delaying the next auctions. Confident that will be government money for offshore auctions in future (Post current LCF in 2020/21).
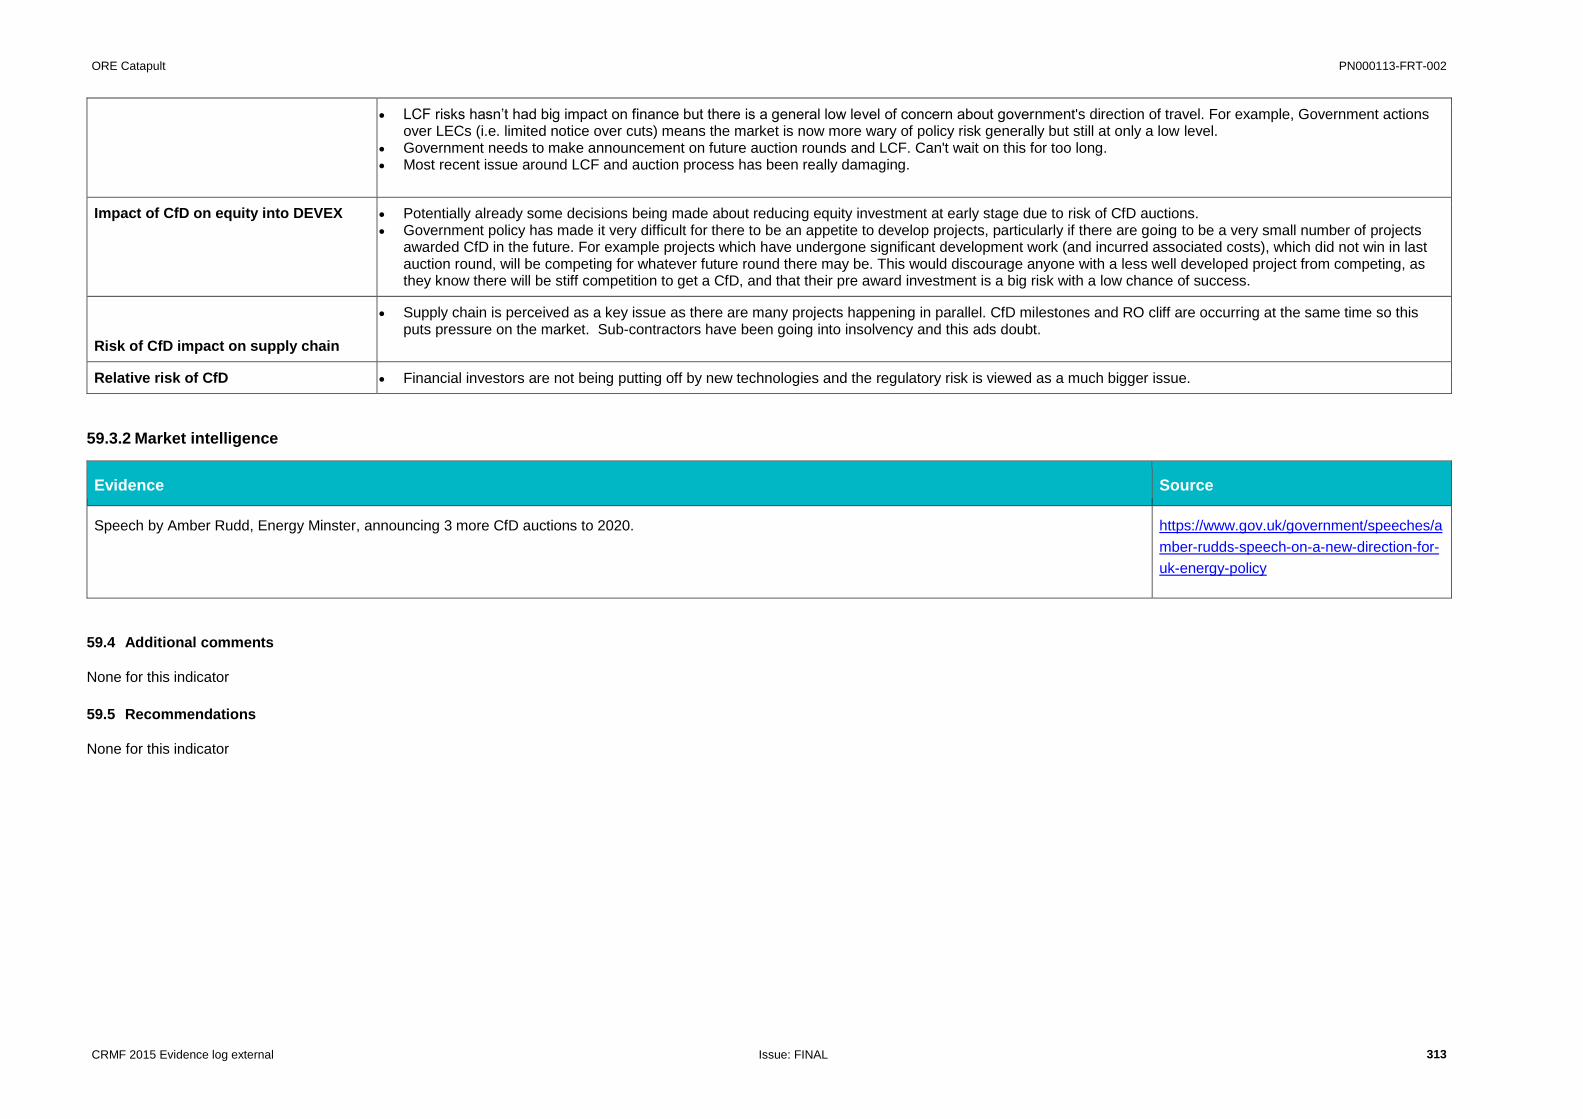
ORE Catapult PN000113-FRT-002
CRMF 2015 Evidence log external Issue: FINAL 313
59.3.2 Market intelligence
59.4 Additional comments
None for this indicator
59.5 Recommendations
None for this indicator
LCF risks hasn’t had big impact on finance but there is a general low level of concern about government's direction of travel. For example, Government actions over LECs (i.e. limited notice over cuts) means the market is now more wary of policy risk generally but still at only a low level.
Government needs to make announcement on future auction rounds and LCF. Can't wait on this for too long. Most recent issue around LCF and auction process has been really damaging.
Impact of CfD on equity into DEVEX Potentially already some decisions being made about reducing equity investment at early stage due to risk of CfD auctions. Government policy has made it very difficult for there to be an appetite to develop projects, particularly if there are going to be a very small number of projects
awarded CfD in the future. For example projects which have undergone significant development work (and incurred associated costs), which did not win in last auction round, will be competing for whatever future round there may be. This would discourage anyone with a less well developed project from competing, as they know there will be stiff competition to get a CfD, and that their pre award investment is a big risk with a low chance of success.
Risk of CfD impact on supply chain
Supply chain is perceived as a key issue as there are many projects happening in parallel. CfD milestones and RO cliff are occurring at the same time so this puts pressure on the market. Sub-contractors have been going into insolvency and this ads doubt.
Relative risk of CfD Financial investors are not being putting off by new technologies and the regulatory risk is viewed as a much bigger issue.
Evidence Source
Speech by Amber Rudd, Energy Minster, announcing 3 more CfD auctions to 2020. https://www.gov.uk/government/speeches/a
mber-rudds-speech-on-a-new-direction-for-
uk-energy-policy

ORE Catapult PN000113-FRT-002
CRMF 2015 Evidence log external Issue: FINAL 314
60Construction risk premium
CRMF workstream Level 1 indicator Level 2 indicator
Finance Cost of equity Construction risk premium
60.1 Summary Analysis
Finding: Behind target (This indicator is only weighted at level 1).
Findings in the CRMF 2014 highlighted that although this indicator was rated as 'on target' last year, it was likely to move behind target this year. This does not reflect a worsening of progress in this indicator,
only a fall behind assumed progress by 2015.
It is still generally viewed that progress in technology innovation (e.g. purpose built vessels to increase weather windows, improved practices for cable burial etc.) has provided a targeted approach to risk
reduction. This is evident particularly in the shift of cable issues down the agenda for many respondents across the industry. This improvement is still offset by the risk of working in a new market environment
(deeper water, further from shore, larger potential cost overruns or lost revenues).
The availability of additional sources of equity (other than that from utilities) into the construction phase has arrived sooner than expected in the baselines set by the TCE Cost Reduction Pathways study. The
industry is also building a track record in delivering projects on time which is positive progress. These factors may have a positive effect on construction premiums in the near future but there was no clear
evidence that they have reduced yet. As forecast last year, this indicator falls behind target this year but we expect progress in the near future.
Outlook: 6
The outlook for this indicator is scored by ORE Catapult and validated with industry experts, including those on the OWPB finance sub group.
Interviewees suggested that construction phase risk premium is likely to reduce but that track record will need to continue to build in order for this to happen, particularly as projects move further offshore,
combined with the complexity of deploying larger turbines - all in an environment of more projects being constructed in parallel which could put the supply chain under pressure.
The variety in contracting approaches by developers also makes it more difficult to understand where there risk premium is being placed.
60.2 Milestone scorecard
60.2.1 Construction specific risk premium (P90 contract value multiple)
Milestone scorecard FID 2015 FID 2016 FID 2017 FID 2018 FID 2019
Ahead of target <1.8x <1.8x <1.7x <1.7x <1.7x
On target 1.8x 1.8x 1.7x 1.7x 1.7x
Behind target 1.81 - 2.8x 1.81 - 2.8x 1.71 - 2.5x 1.71 - 2.2x 1.71 - 2.0x
Missed target >2.8 >2.8 >2.5 >2.2 >2.0

ORE Catapult PN000113-FRT-002
CRMF 2015 Evidence log external Issue: FINAL 315
60.3 Evidence
60.3.1 Interview
Topic Interview response
Increase in project finance Project finance started in Europe and has been modified/copied in UK market.
Liquidity
GIB £1bn deal Institutional investors are not as interested in taking construction risk and may be undercut by banks.
Construction & technology risk perception
Contingency levels and how these are structured in the deal is important. Generally, deeper water seen as a key risk. Construction risk does not differ by country. Construction starts before financing deal closes for utilities but on the continent, finance is needed first. There are risks around the construction phase but also seeing a new turbine for every project, with an increase in rating. One of the hot topics was cabling last year but now much lower on the agenda. Projects are being delivered on time, and some real improvement in
planning. Project finance banks will look at construction without a problem, they do not split construction from operational. This is different for equity (with some
investors having a clear preference for operational phase projects). e.g. monopiles which are so large as to be considered new foundation technologies in their own right (e.g. a significant departure from and/or more
complex than what has built up a track record in offshore oil and gas) Risk is not seen as wind, not seen as technology, most of financiers are happy with taking technology of new turbines etc., the key risks are still seen as
being in construction. Finance will have to learn to live without a single full wrap EPC contract, they are getting more comfortable but it is still challenging Anything between 2 – 6 contractual packages is something that has been acceptable for banks, most investors are now moving on and aligning
themselves to this ‘new standard’ in the market. Most of the players are the same in UK and EU market, but the UK has been learning from continental European approach. Banks have in general been accepting of technology in offshore wind. Likely more so than in other sectors. [PROJECT] had a multi-contract approach and a utility was needed to manage this. Sponsors generally have to put up more contingent equity to cover
potential cost overruns on multi-contract projects to cover the risks. IPP industry trended towards single EPC, which is strong preference from bank perspective. A range of structures have been applied on European offshore wind projects: provided the risk can be identified and allocated appropriately then banks
can usually get comfortable with the structure. Companies that look for debt at holding company level: not preferable although banks are willing to finance but may offer a slightly lower gearing. Most are starting to see that there are financial cost implications of using full wrap EPC.
Outlook As the market matures, it will depend on who develops the projects. [COMPANY] is the developer and the EPC so serves as a multi-contract for the developer whilst also offering a single contract approach to the investor.
The market will naturally move towards the risk being pushed out to contractors.

ORE Catapult PN000113-FRT-002
CRMF 2015 Evidence log external Issue: FINAL 316
60.3.2 Market intelligence
60.4 Additional comments
None for this indicator
60.5 Recommendations
Reducing packages/interfaces/risk during construction is a positive way to go for equity and finance, but is not particularly incentivised by current policy.
Evidence Source
October 2015: Under the agreement, CTG would acquire up to 30% of the "equity and shareholder loans" owned by the project's developing company, Moray
Offshore Renewable Limited (MORL), a wholly owned subsidiary of EDPR. Upon the announcement of a second auction round, CTG will acquire between 10%-
20%.
If MORL wins a CfD subsidy, CTG will invest another 10%. EDPR said the 1.1GW project may be divided into phases to make it more competitive in the auction.
http://www.windpoweroffshore.com/article/1
369072/ctg-plans-30-moray-firth-stake
Canadian energy group Enbridge has taken a 24.9 percent stake in E.ON's 1.9 billion euro ($2.1 billion) offshore wind project Rampion, the latest in a wave of
deals that has boosted the European wind power sector.
http://globenewswire.com/news-
release/2015/09/10/767504/10148964/en/D
ONG-ENERGY-AND-GLOBAL-
INFRASTRUCTURE-PARTNERS-TO-
FORM-50-50-PARTNERSHIP-TO-BUILD-
GERMAN-OFFSHORE-WIND-FARM-
GODE-WIND-1.html

ORE Catapult PN000113-FRT-002
CRMF 2015 Evidence log external Issue: FINAL 317
61 Operations risk premium
CRMF workstream Level 1 indicator Level 2 indicator
Finance Cost of equity Operations risk premium
61.1 Summary Analysis
Finding: On target
Findings in the CRMF 2014 highlighted that this indicator was 'on target' last year and it was likely to remain on target this year. The TCE Cost Reduction Pathways study originally anticipated a reduction in
operations risk premium in projects reaching FID from 2015 onwards. There is no clear evidence that operations risk premiums have dropped below 9.7% in warranty and 33% outside of warranty but we have
reason to believe the situation has not worsened since the CRMF 2014.
Developers noted that the ORE Catapult's SPARTA project is a great step forward in achieving visibility of performance and in sharing operational experience. There has also been good traction with the ORE
Catapult administered O&M forum and set up of new forums such as o2o wind, enabling good sharing of knowledge of operational assets.
Outlook: 6
The outlook for this indicator is scored by ORE Catapult and validated with industry experts, including those on the OWPB finance sub group.
Progress such as SPARTA and the creation of the o2o forum is having an impact on improving confidence in wind farm operations and should in time lead to a reduction in the operations risk premium. Despite
this progress, the rapid increase in turbine size for projects reaching FID up to 2017 means that demonstrable track record will need to be proven once again, placing upward pressure on premiums, hence there
is some uncertainty around the outlook of this indicator.
There is a large amount of diversity in approaches by operators across Europe towards O&M post warranty (in house vs. LTSA) and this is likely to continue. It was noted in interview that compared to other
industries, the turbine OEMs have been particularly good at delivering in accordance with their warranty agreements. Should this trend continue, it could place downward pressure on in-warranty risk premiums.
61.2 Milestone scorecard
61.2.1 Operations risk premium (P90 risk premium)
Milestone scorecard FID 2015 FID 2016 FID 2017 FID 2018 FID 2019
Ahead of target IW <9.7% / PW <33% IW <9.3% / PW <31% IW <9% / PW <30% IW <8.5% / PW 28% IW <7.5% / PW <25%
On target IW 9.7% / PW 33% IW 9.3% / PW 31% IW 9% / PW 30% IW 8.5% / PW 28% IW 7.5% / PW 25%
Behind target IW 9.71 - 14.7%; PW 33.01 -
50%
IW 9.31 - 14.3%; PW 31.01 -
45%
IW 9.01 - 12.5%; PW 30.01 -
45%
IW 8.51 - 10.5%; PW 28.01 -
40%
IW 7.51 - 9%; PW 25.01 - 35%
Missed target IW >14.7% / PW >50% IW >14.3% / PW >45% IW >12.5% / PW >45% IW >10.5% / PW >40% IW >9.0% / PW >35%

ORE Catapult PN000113-FRT-002
CRMF 2015 Evidence log external Issue: FINAL 318
61.3 Evidence
61.3.1 Interview
61.3.2 Market intelligence
61.4 Additional comments
None for this indicator
61.5 Recommendations
None for this indicator
Topic Interview response
Operational project cost
Terms are less competitive for operational projects, due to competition in the market. CfD regime is pushing the price asked by the investors downwards, investors more comfortable with CFD than ROC Operational risk of 2.25-2.75 last year. This may have come down slightly. Seeing quite a mix of LTSA vs in house O&M currently. There is less interest in equity and retaining
25% is what investors want but not what the utilities necessarily want.
Evidence Source
All UK offshore wind farm owner/operators commit to the continued operation and development of the data platform aimed at boosting performance and bringing down costs.
http://www.thecrownestate.co.uk/news-and-media/news/2015/pioneering-sparta-system-for-offshore-wind-farms-goes-live/
Wind farm owners representing 12% of global turbine assets have founded o2o Wind, a peer-to-peer online platform exchanging knowledge and experience on
operation and maintenance issues. Members, including EDPR, Vattenfall, RWE, DONG Energy, Statoil and Acciona Energia, say the objective is to optimise
turbine yields through the exchange of information.
http://renews.biz/100664/knowledge-is-
power-for-om/
Offshore Renewable Energy Catapult (ORE Catapult) and eight major offshore operators have created a new forum group aimed at driving down the costs of
operations and maintenance (O&M) for offshore projects.
http://www.windpoweroffshore.com/article/1
307876/major-offshore-firms-launch-o-m-
forum

ORE Catapult PN000113-FRT-002
CRMF 2015 Evidence log external Issue: FINAL 319
62 Developer risk premium
CRMF workstream Level 1 indicator Level 2 indicator
Finance Cost of equity Developer risk premium
62.1 Summary Analysis
Finding: On target
Developer phase risk premium remains ‘on target.’
Developer risk premium captures risks not covered by the specific risk premiums and which cannot be diversified away. Examples include extreme downside risks, technology and refinancing risk. The application
of an additional risk premium is not uncommon within the infrastructure asset class, having been witnessed previously for example in the UK’s PFI sector.
CRMF 2014 qualitative summary highlighted that technology and innovation and capital availability are two major drivers of development phase risk premiums and this continues to be the case. Recent
announcements about the CfD allocation have provided some confidence in future subsidy rounds but have not provided insight as to the quantity of capital available to offshore within the LCF. There is therefore
still quite a lot of uncertainty around regulatory factors that impact development phase risk premiums.
Technology is advancing, particularly in respect to turbines, as noted last year. There is good progress since last year around perceived risk of increased size of turbines with the finance community showing
higher levels of comfort with technology risk in turbines since last year.
Given that there no evident shortage of equity or debt capital and that there has not (yet) been any major technical issues, this indicator is ‘on target’.
Outlook: 2
The outlook for this indicator is scored by ORE Catapult and validated with industry experts, including those on the OWPB finance sub group.
As the offshore wind sector develops over time, this risk premium could change depending on developers’ perceived risk of the sector and the regulatory environment in which it operates.
The size of projects as we head into round 3 is however an order of magnitude larger and the quantity of capital at risk is in excess of £50m for a single project. Any confidence provided by higher visibility of the
regulatory process are predicted to be outweighed by the increase in quantities of capital at risk by developers.
62.2 Milestone scorecard
62.2.1 Developer risk premium (% premium)
Milestone scorecard FID 2015 FID 2016 FID 2017 FID 2018 FID 2019
Ahead of target <2.5% <2.5% <2.5% <2.2% <2.0%
On target 2.50% 2.50% 2.50% 2.20% 2.00%
Behind target 2.51 - 4.0% 2.51 - 4.0% 2.51 - 3.5% 2.21 - 3.0% 2.01 - 2.3%
Missed target >4.0% >4.0% >3.5% >3.0% >2.3%

ORE Catapult PN000113-FRT-002
CRMF 2015 Evidence log external Issue: FINAL 320
62.3 Evidence
62.3.1 Interview
62.3.2 Market intelligence
62.4 Additional comments
None for this indicator
62.5 Recommendations
In other markets, the development cost is socialised, which could has been expressed as a possible solution to the current potential bottleneck in wind farm development. OWPB finance group should work to
understand lessons learned that can be shared from approaches on the continent.
Topic Interview response
CFD introduces new risk
Organisations have risked a large amount of capital to date to get the projects to FID, with a great amount of uncertainty. Mechanisms in CfDs need to change to provide visibility much earlier.
Finance community is not willing to take a risk on financing pre-construction cost on projects that do not have CfD.
Evidence Source

ORE Catapult PN000113-FRT-002
CRMF 2015 Evidence log external Issue: FINAL 321
63 Gearing
CRMF workstream Level 1 indicator Level 2 indicator
Finance Cost of debt Change in gearing (operations and construction)
63.1 Summary Analysis
Finding: Ahead of target (construction)
Finding: Ahead of target (operation)
There were challenges last year in CRMF 2014 gathering information in the debt indicators due to the project-specific nature of financial transactions. Last year Westernmost Rough was cited as one of the few
examples in the UK where debt has entered into the offshore wind market in the UK during the construction phase. In October 2015, Galloper reached FID with debt finance making up part of the funding through
the construction phase. Nordsee 1 also secured 70% debt for the construction phase, due to begin in 2016. This year interviewees stated that it is becoming commonplace for levels of gearing for debt during
both operation and construction to be around 70-75%.
The increase in gearing is in part due to increased liquidity in the debt market and the relative attractiveness of offshore wind in the financial markets for infrastructure, where offshore wind currently offers a
higher return for banks. With continued strengthening in European bank balance sheets, an increasing number of banks becoming comfortable with offshore construction and operational risk (particularly with the
introduction of the CfD in the UK market) and a general lack of transactions in other sectors, this resulted in increasing levels of debt capital being available for the sector.. This scenario is positive for offshore
wind but the sector remains vulnerable (as do other infrastructure sectors) to external market shocks which could lead to a change in current market conditions.
To meet the needs of the sector (deals >£1bn), banks’ offers are increasing in size where there is a willingness to place much larger stakes into projects. This trend was apparent in part last year, with syndication
of debt in response to single banks not offering more than £150m in debt funding for a particular deal. This trend continues, as evidenced through interviews with the finance community and the composition of the
Nordsee 1 construction deal with 10 commercial lenders.
The role of the EIB in financing offshore wind farms has consistently been cited as crucial to development of the sector in its current stage of development. For attracting finance to projects in excess of £1.5bn,
the need for EIB is considered particularly strong. Its role has both increased liquidity (lent credibility to the sector which has given banks that are new to the sector additional comfort) and reduced the cost of debt
within deals.
Gearing for offshore wind farms in both construction and operation is cited as currently reaching up to 75% with OFTO assets reaching as high as 90% debt during operation. The evidence highlights advances in
the sector in the availability of debt and places the indicator 'ahead of target' and already showing that it has surpassed the 2020 targets.
Outlook: 7 (construction)
Outlook: 7 (operation)
The outlook for this indicator is scored by ORE Catapult and validated with industry experts, including those on the OWPB finance sub group.
The outlook for this indicator is positive, and the trends in the sector, highlighted above, are likely to continue, with some of the finance community confident that it may be possible to reach gearings of 80% by
2020. It was cited that levels in the thermal power generation sector reached 95% but it is not clear that this trend will be supported in offshore wind. There is a great amount of interest in the market currently but
the risk of debt gearing decreasing hinges on the following:
The introduction of Basel III has meant that a number of European banks have not been able to offer tenor required for the deals in offshore wind and this has given room for Asian banks to enter the
market. Interest from Asian banks will continue but there is an increase in interest from UK banks.

ORE Catapult PN000113-FRT-002
CRMF 2015 Evidence log external Issue: FINAL 322
As wind energy concentration increases in proportion within banks portfolios, it becomes a core asset and the ability for banks to take on more projects will decrease. While syndication of debt is, in part, a
solution to this, these may lead to a slowdown in liquidity for future deals. Some respondents also cited concerns around restricted supply of experienced human resource to physically process the number
of deals required over the next 5 years.
Due to the relatively high risk of construction and operation of offshore wind assets, it is likely that financial institutions will remain to mandate ownership by utilities to a factor of at least 15%. The need for
this retention may place strain on the availability of equity from utilities, particularly as projects get larger in size.
Construction and technology risk are still very high on the finance communities’ agenda. A single serial default or a long delay due to a construction issue could be detrimental to current high confidence in
the sector.
While turbine size increasing is viewed as a key risk, the warranties provided by the OEMs have to date been very capable of delivering results. There is an increasing uptake in LTSAs but some are
shifting to in-house O&M. The cost savings associated with this will have to be proven to convince financiers of the benefits.
Yield compression is also a key feature of the current market condition. As interest rates stay low, there is a downward pressure on returns so the supply of cheap finance is high. While this is outside the
industry's control, we should remain cognisant of the effects of the impact of the global finance market on the offshore wind sector.
63.2 Milestone scorecard
63.2.1 Gearing – construction (% of total funding)
Milestone scorecard FID 2015 FID 2016 FID 2017 FID 2018 FID 2019
Ahead of target >20% >20% >40% >40% >40%
On target 20% 20% 40% 40% 40%
Behind target 0 - 19.99% 0 - 19.99% 0 - 39.99% 20 - 39.99% 30 - 39.99%
Missed target <0% <0% <0% <20% <30%
63.2.2 Gearing- operations (% of total funding)
Milestone scorecard FID 2015 FID 2016 FID 2017 FID 2018 FID 2019
Ahead of target >40% >40% >40% >40% >40%
On target 40% 40% 40% 40% 40%
Behind target 0 - 39.99% 0 - 39.99% 10 - 39.99% 20 - 39.99% 30 - 39.99%
Missed target <0% <0% <10% <20% <30%

ORE Catapult PN000113-FRT-002
CRMF 2015 Evidence log external Issue: FINAL 323
63.3 Evidence
63.3.1 Interview
Topic Interview response
Gearing
[PROJECT] structure successful, with gearing up to around 65% last year. Gearing for CfD is up to 75% and maybe around 85-90% for transmission. Operational cash flows will limit the gearing moving up. 40% gearing target set by CRMF has already been met. Common now to see a project with 75% debt. Construction gearing currently at 60-70% Thermal industry got down to 95% debt, but offshore wind probably won’t get to this level. 70/30 or 70/25 is common level of gearing but this will differ depending on the project structure. If financed at an Opco level, will see this level but
if project financed at Holdco, will depend on the financing partners e.g. may have 3 equity sponsors, where 1 is financing against balance sheet. A number of lenders have not completed Holdco lending and likely to see more Opco lending going forward as utilities hold equity stakes through project financing.
CfD mechanism should support trends in raising gearing but can't be 100% sure if it will. CfD PPA risk.
Bonds & syndication of debt
Buoyant market currently, driven by deeper understanding of previous issues, improving and lengthening track record and a general inertia of new financial institutions entering the market. This includes institutional debt providers and now the bond market.
There is increasing levels of "retail liquidity" - secondary trading of debt (e.g. to institutional investors). In different industries, large deals would be struck historically and then they would sell down the debt.
[PROJECT] – closed this year in March, main lesson is that [COMPANY] bought 80%, financed it by raising 70% of debt at project level and were pleased with the whole process. Financed it by issuing corporate bonds in their home market. Whole finance chain was involved. This shows appetite in broader market, it was not a small team who made the decision to invest.
Bank debt has been available on 17-18 year loans etc. but there is limited evidence yet of an emerging bond market for offshore wind. In Germany, [PROJECT] was an interesting example of a bond setup but all of the stakeholders are German and not typical for the sector. Likely
that the big rating agencies wouldn’t give this project set up a good rating. Some view Bond financing - no necessity to introduce. Institutional debt is coming into the market. Project bonds have been issued on offshore wind for a single project. This is creating quite a lot of
competition compared to two years ago Even if no agreed syndication there is confidence that over time deals will be able to sell down and reduce their exposure. It is becoming typical for banks to enter the market and then undertake a coordinated sell down process for this capital to enable them to recycle
back into the market. Average size of a deal for holding/recycling could be £100-300m but will not always be set up for the financial institution to hold. There is a
willingness to commit this but the hold amount is more likely to be around the 50-75m level.
Asian debt liquidity
Liquid market for debt from commercial banks. In the EU market, there are around 30 banks, with around 25 with sterling availability and prepared to take on construction risk.
Asian banks are more liquid and EU banks are becoming more relaxed so are now entering the market. UK debt providers are beginning to provide Long term debt, whether they hold for lifetime of project or not. Banks are currently keen to put assets back on their books, after recent sell offs, so currently keen to be cooperative and very flexible.
Increase in liquidity and particularly in construction
An increase in the size of deals and an increase in the number of banks in a single deal is very common, driven by more interest in the sector and their being fewer transactions available
Banks are currently bringing much larger sums to the market e.g. £150-200m. Currently a large amount of liquidity in the market – significant levels of capital available from commercial banks. [PROJECT] closing imminently
with around a dozen commercial banks and EIB. The consortium had also lined up export credit agencies ([COMPANY] and [COMPANY]) but these were not needed. Simpler process to proceed without as enough liquidity in the project without them. EIB played a strong role.
Yield compression is also a feature. As interest rates stay low, there is a downward pressure on returns. Anything that offers higher returns looks great, which is where offshore wind is now.
There has been an emergence of institutional lenders in offshore wind because yields on existing asset classes are low. Traditional asset classes aren't providing the yield that meets lender's targets.

ORE Catapult PN000113-FRT-002
CRMF 2015 Evidence log external Issue: FINAL 324
Plenty of appetite for offshore wind but there hasn’t been the deals to evidence this.
Role of EIB
EIB play a very strong role in giving commercial bank comfort when they enter a deal. EIB sits pari passu, which provides comfort to others in consortium. EIB plays a strong role in the sector and is advantageous for the sponsors - EIB offers cheaper cost of funding and also plays a role in creating
competition by enabling rejection of the most expensive finance. Deals would still continue without the EIB but at a higher cost of finance. If looking to raise £1.5 – 2bn of debt, do need to use EIB. A fund 10 basis points over Libor and looking to continue to be active. Even with large liquidity in market, EIB still has a place as it reaches the
limit that commercial banks can play.
Continued liquidity
Expect to see more of this in the future barring global economic slowdown or events outwith control of industry. On the global market, there is currently limited infrastructure elsewhere to invest in….but this could change The introduction of CfD could lead to European banks getting more involved, as our scheme now looks more like a FiT is a support mechanism
institutions understand well. As size of projects and industry in general increases, there will be a requirement for a fairly large amount of liquidity, coupled with harmonisation
of support schemes, will lead to increased syndication of the debt. Lenders are managing liquidity position to ensure funding of projects going forward, however there are narrow windows of time to fund project
going forward.
Gearing
BUT…progress in debt ratio indicator will be interrupted if there is a construction/technical issue on a high profile project. If there is no event that upsets confidence, could see 80% debt by 2020. Trend is towards larger gearing.
Macroeconomic factors
It is a trend that energy market lags the infrastructure market. Institutional investors entering offshore wind because infrastructure market has had reduction in margin due to oversupply of finance and undersupply of projects. Offshore wind offers more competitive rate so investors are turning to it but this process is cyclical.
In market where projects are getting larger, relative liquidity will depend on redundancy in the market. Basel III has not had major impact on banks in this space yet. Some (European) Institutions have been hit by Basel III. Last year, tenor and
gearing regulations were making constraints but not currently an issue. There are currently strict regulatory regimes for UK banks so capital weighting isn't competitive [not as robust a balance sheet as in other
countries]. Japanese players entering market more. FCA is introducing ring fencing and infrastructure and energy is an area that may have limits going forward. Likely to still be lots of liquidity going forward, withstanding any major macroeconomic or physical catastrophe.
Outstanding project risk
There is some uncertainty in O&M contracts that are provided, which is increasingly important as more turbines are installed. The risk of the OFTO regime is not having a direct effect on the cost of finance. There is a more relaxing (because of increasing competition) approach to having strong (OEM) long term service agreements. However the
preference is still to have OEM underpinning long term risk by involvement in long term O&M deals, as this ultimately means less risk for the bank.
Capacity of supply chain is of interest to lenders, particularly when it is clear that they are working on a number of projects and can see constraints - it is the same contractors on many of the deals. Shortage of supply chain has placed constraints in the past.
Delay risk is a big focus and ideally would like to see risks appropriated. Concern that a part of the supply chain may not be able to cover the breadth of the market. Sometimes hear that one party gets priority access to
a facility e.g. new foundations. This raises questions when financing the projects using the same supply chain. Turbine rating risk is relatively easy to address e.g. by providing long term availability warranty. Regarding the risks of O&M costs after EoW, the
outlook a few years ago was that 3rd party contractors would enter the market and drive down costs but this hasn’t really happened yet so OEMs have not driven down the cost of LTSAs.
Wind as a core asset
Investors generally don’t want to get into an asset class where they only have 1 asset because there is a necessity to build expertise in the process.

ORE Catapult PN000113-FRT-002
CRMF 2015 Evidence log external Issue: FINAL 325
63.3.2 Market intelligence
63.4 Additional comments
None for this indicator
63.5 Recommendations
If the industry hopes to continue to expand, it will have to avoid major technical issues, which could impact confidence in the finance sector. Impact of technical issues could reset the market and pricing of finance
overnight and institutions are not afraid to step away from a market if it looks like it is overheating. The OWPB finance group should work to share experience and understanding of technology to ensure
consistent assessments of risk are applied to projects.
Offshore wind particularly becomes more of a core sector now. This is largely because there are not many other options in the EU for energy - e.g. no coal, gas, nuclear. Offshore wind is not yet a core asset
but it is certainly getting closer to being part of the main portfolio. Banks will have limits on sector levels of investment, 3 – 4 deals in offshore wind could take them close to these exposure limits, as offshore wind
becomes a core market (moving that way) there is the possibility of a bottleneck here. Again this links to selling down of debt and getting more players involved.
Evidence Source
October 2015: A new partnership heralds a green light for the construction of the 336MW Galloper project. RWE Innogy announced three new project partners for
Galloper Wind Farm Ltd., each becoming 25% joint equity partners: UK Green Investment Bank, Siemens Financial Services and Macquarie Capital. The debt
financing for Galloper has also been closed with a consortium of 12 commercial banks and the European Investment Bank providing 1.37 billion in debt facilities.
http://www.4coffshore.com/windfarms/project-dates-for-galloper-wind-farm-uk62.html
In-water construction of Nordsee 1 is anticipated in 2016 and completion is slated for the end of 2017. September 2014: Northland acquired an 85% stake in the
wind farm from RWE Innogy while RWE retained 15%.
An €840m non-recourse secured construction and term loan and related loan facilities from 10 commercial lenders will cover some 70% of the €1.2bn project’s
costs.
http://renews.biz/85903/nordsee-1-wraps-
up-financing/

ORE Catapult PN000113-FRT-002
CRMF 2015 Evidence log external Issue: FINAL 326
64 Debt margins
CRMF workstream Level 1 indicator Level 2 indicator
Finance Cost of debt Change in debt margins (operations and construction)
64.1 Summary Analysis
Finding: Ahead of target (construction)
Finding: Ahead of target (operation)
Cost of debt in both construction and operation was marked as 'ahead of target' in the CRMF 2014 and it remains 'ahead of target' in 2015. Evidence from interviews suggests that during operation, debt margins
could be as low as 200 basis points, rising to around 235 towards the end of the debt tenor.
For construction projects, similar levels of debt margin were cited with some indication that they could reach lower than this on some of the smaller wind farm projects. This places the indicator well ahead of the
target set in TCE Cost Reduction Pathways study.
The reasons for such positive progress are: increased volumes of available debt (as more banks enter the market); the learnings available from previous transactions; a lack of other transactions. Participation by
the EIB has also helped bring down margins as a result of its lower costs of funding.
Outlook: 7 (construction)
Outlook: 7 (operation)
The outlook for this indicator is scored by ORE Catapult and validated with industry experts, including those on the OWPB finance sub group.
The outlook for this indicator is positive, and the trends in the sector, highlighted above and in the gearing indicator in section 63, are likely to continue. There is a great amount of interest in the market currently
but the risk of debt gearing decreasing hinges on the following:
The introduction of Basel III has meant that a number of European banks have not been able to offer tenor required for the deals in offshore wind and this has given room for Asian banks to enter the
market, improving liquidity. Interest from Asian banks will continue but there is an increase in interest from UK banks.
As wind energy concentration increases in proportion within banks portfolios, it becomes a core asset and the ability for banks to take on more projects will decrease. While syndication of debt is in part a
solution to this, these may lead to a slowdown in liquidity for future deals.
Construction and technology risk are still very high on the finance communities’ agenda. A single serial default or a long delay due to a construction issue could be detrimental to current high confidence in
the sector.
While turbine size increasing is viewed as a key risk, the warranties provided by the OEMs have to date been very capable of delivering results. There is an increasing uptake in LTSAs but some are
shifting to in-house O&M. The cost savings associated with this will have to be proven to convince financiers of the benefits.
Yield compression is also a key feature of the current market condition. As interest rates stay low, there is a downward pressure on returns so the supply of cheap finance is high. While this is outside the
industry's control, we should remain cognisant of the effects of the impact of the global finance market on the offshore wind sector.

ORE Catapult PN000113-FRT-002
CRMF 2015 Evidence log external Issue: FINAL 327
64.2 Milestone scorecard
64.2.1 Construction debt margin (basis points margin, bps)
Milestone scorecard FID 2015 FID 2016 FID 2017 FID 2018 FID 2019
Ahead of target <350 <350 <350 <325 <325
On target 350 350 350 325 325
Behind target 351 - 550 351 - 550 351 - 475 326 - 425 326 - 375
Missed target >550 >550 >475 >425 >375
64.2.2 Operations debt margin (basis points margin, bps)
Milestone scorecard FID 2015 FID 2016 FID 2017 FID 2018 FID 2019
Ahead of target <300 <275 <250 <230 <215
On target 300 275 250 230 215
Behind target 301 - 500 276 - 475 251 - 375 231 - 330 216 - 265
Missed target >500 >475 >375 >330 >265
64.3 Evidence
64.3.1 Interview
Topic Interview response
Increased liquidity drives down costs
Continued downward pressure on pricing as more lenders enter the offshore wind market because they have seen other lenders do it. This is also because other industries have compressed margins.
Banks generally expecting fewer projects so paradoxically driving debt price down as banks rush in.
Debt margin
225 in construction, 200 minimum in operations and agreement that this seems to be consistent with broader industry trend. Part of this reduction comes from offshore wind being better known, but mostly comes from macroeconomic effects and downward pressure from wider finance
market. Maybe 20% (small part) comes from better understanding of risk in offshore wind. Back in 2012, pricing was assumed to be 350bps by 2015, down to 300 by 2020. In Germany, there has been cheaper pricing. Have seen much lower on
[PROJECT]. Substantially sub 300 is now common. Most projects refinance in the operational phase. This is typically below-200s for onshore. The current pricing is as much a feature of liquidity as of risk. It could
reverse if see reduction in liquidity. Major issue on wind farm or global issue could initiate this. SWAP rate 3 years ago 3.8% and has now dropped to 1.8% Pricing 12 months ago was around 325bp, now 225bp for construction Debt is typically lower in the early stages of the project e.g. 215bp in early operations and then back up later on e.g. 235bp at back end of project life. Base points for operational phase is likely 235 bps towards end of project life and 220 bps at the beginning.

ORE Catapult PN000113-FRT-002
CRMF 2015 Evidence log external Issue: FINAL 328
64.3.2 Market intelligence
64.4 Additional comments
None for this indicator
64.5 Recommendations
None for this indicator
Industry at 225-250bps for construction currently and if EIB move in with 25% stake, their share would for example be at 150bps. If EIB move away from deals, the entire project cost of finance will be greater.
At £500m deal, likely to require 200bps, and if £1bn, would likely raise to 225bps. >£1bn institution would either need to be able to do the deal or not but there is a certain point where there are a limited amount of lenders that could raise this.
On small projects, sub 200bps for construction is possible. For deals on operational projects, pricing could be 180-200bps, with 225bps out the back end of the project life Close to 220 basis points for construction 220 – 250 depending on project. Heading below 200 for operations Estimates are around 225bp for construction and 200bp w/230bp at back end of operational phase.
Outlook
Long term trend should continue but is starting to slow down, may in short term indicate that it will not move much further downwards. Difficult to answer at what point is bank making an unreasonable offer, could be seen as a bit of grey area as margin of basis points gets closer.
Evidence Source
None for this indicator

ORE Catapult PN000113-FRT-002
CRMF 2015 Evidence log external Issue: FINAL 329
65 Insurance
CRMF workstream Level 1 indicator Level 2 indicator
Finance Insurance Insurance (operations and construction)
65.1 Summary Analysis
Finding: Ahead of target (construction)
Finding: Ahead of target (operation)
The insurance indicator is 'ahead of target' across insurance for both construction and operations, which is consistent with anticipated progress since the CRMF 2014. The construction premiums cost indicator
has advanced from 'on target' to ' ahead of target' and the operations premium cost indicator has remained 'ahead of target.'
Responses from interviewees have been used to calculate a value (per MW installed) to benchmark this year's review of insurance costs against the work completed in CRMF 2014. The evidence suggests that
constructions premiums have dropped from around £33.3k/MW (including DSU) to as low as £26k/MW but cautioned that £30k/MW would allow us to remain conservative. This highlights that premiums continue
to track lower than the milestone of £40k/MW in the TCE Cost Reduction Pathways study. Calculated as a % of project costs, the size of wind farms is likely to be in part responsible for this reduction.
For the operations phase, and using the methodology described above, insurance premiums for the operations phase have remained consistent with last year, at £13-14k/MW/annum, highlighting positive
progress in this indicator and keeping it ahead of target. Operational insurance is normally the second largest cost after the maintenance contracts for a utility.
Outlook: 7 (construction)
Outlook: 7 (operation)
The outlook for this indicator is scored by ORE Catapult and validated with industry experts, including those on the OWPB finance sub group.
The outlook for this indicator is positive, and the trends in the sector are likely to continue but there are a number of risks to progress:
The relative attractiveness of offshore wind is high compared to other insurance market sectors (e.g. gas, aerospace). Should there be greater interest in other markets, supply may be squeezed in
offshore wind. Equally, a major catastrophe elsewhere in the world could place pressure on insurers to pay out, which has not happened since the tragedy in New York on 9/11/01.
Concern was expressed from insurers at the fact that a major claim in offshore wind (such as a BI claim due to export cable failure) could change the relative attractiveness of the sector and suddenly
increase pricing dramatically.
Turbines are not perceived as the highest risk area for insurers because warranties from OEMs have to date been effective. There is however quite a lot of technology risk around foundation design
liability and OFTO, where there is not always a clear relationship between the generating asset insurer and the OFTO. The insurers also have no clear recourse against the OFTO in case it does not meet
its obligations. This disconnect leaves the sector open to future risk.
The end of warranty period is challenging for the insurance company serving a wind farm. Insurers urged asset owners to get the insurer involved at the end of warranty period to provide confidence to the
insurer that the post warranty strategy is secure and that the operational data from the asset proves its reliability. This will in turn lead to insurance cost reduction. Insurer will look at warranty extensions
for inclusion of logistics, demob etc.

ORE Catapult PN000113-FRT-002
CRMF 2015 Evidence log external Issue: FINAL 330
65.2 Milestone scorecard
65.2.1 Construction phase insurance (£/MW)
Milestone scorecard FID 2015 FID 2016 FID 2017 FID 2018 FID 2019
Ahead of target <39,250 <38,500 <38,000 <38,000 <38,000
On target 39,250 38,500 38,000 38,000 38,000
Behind target 39,251 - 49,250 38,501 - 48,500 38,001 - 48,000 38,001 - 43,000 38,001 - 41,000
Missed target >49,250 >48,500 >48,000 >43,000 >41,000
65.2.2 Operations phase insurance (£/MW)
Milestone scorecard FID 2015 FID 2016 FID 2017 FID 2018 FID 2019
Ahead of target <14,000 <14,000 <14,000 <14,000 <13,000
On target 14,000 14,000 14,000 14,000 13,000
Behind target 14,001 - 19,000 14,001 - 19,000 14,001 - 17,000 14,001 - 15,500 13,001 - 14,000
Missed target >19,000 >19,000 >17,000 >15,500 >14,000
65.3 Evidence
65.3.1 Interview
Topic Interview response
Lender preference for DSU
Lenders always want DSU insurance but don’t necessarily apply too much value to it. Projects have been funded without it but normally when someone else has taken the risk.
Relative attractiveness of offshore wind
The return for insurers is far better for other areas e.g. terrorism, gas etc. Loss ratio is quite high for offshore wind (in particular around construction phase). Premiums have come down but there is not enough risk sharing amongst stakeholders given that insurers are taking bigger risks. Declining premium is due
to greater capacity in the wider insurance market. This is cyclical and may change in the event of a major catastrophe of global scale. There has been roughly 20-25% drop in insurance costs in the last 12 months due to effects of global insurance market. Currently waiting for the rates to
increase because there is a 2 year lag until current deals pass through the construction phase.
Warranty
To its credit, the sector has taken big issues in its strides, and the market absorbed these. Wind speed, foundations, gearbox etc. warranty. A big unexpected event could lead to a big issue.
Operational insurance cost
Operational insurance normally second largest cost after the maintenance contracts. Cost of insurance impacted by number of claims, number of insurers. 65-70% is rough loss ratio for operational phase The operating losses and premiums are a lot lower. Insurers compete in this space heavily. They are however unable to access the market unless they take
some construction risk.

ORE Catapult PN000113-FRT-002
CRMF 2015 Evidence log external Issue: FINAL 331
65.3.2 Market intelligence
65.3.3 Estimates and calculations for average insurance costs
Construction 2014 2015
Property damage only 8,125,000
6,875,000
Delay in start up 8,584,800
6,132,000
£pa 16,709,800
13,007,000
£/MW 33,420
26,014
Construction insurance cost
For construction, insurers are typically facing a loss ratio of 80% of premium being paid back in claims. This really is the tipping point because 20% margin really only covers cost. The ratio is worse than the onshore market.
Deductible levels and negotiation with contractors, suppliers and owners decides price. Technical risk rating is largely based on the turbine, location and design of the foundations. New lenders are beginning to come in during the construction phase and they require delay and start up and business interruption cover, which can double
insurance costs. 3% on annual revenue 0.5 on capex - same number likely.
Claims
Regarding claims / issues, there is no trend in construction, and still experiencing the same reasons for claims (cable pull in, prang etc.) For 7-8MW turbines, contractors want the same deductibles but this is not realistic because potential losses from larger turbine outage and failure is order of
magnitude larger. For 3-4MW class turbine, it could a £2m claim vs a 7-8MW claim of >£10m.
Risks to future progress
The absence of a significant claim in offshore wind has helped to drive insurance premiums downwards. Should such a claim crystallise then this is likely to have a negative impact on premiums.
Every project coming in has different foundation design - more challenging ground conditions, deeper water etc. Warranties under foundation designs are likely to be less robust so who is taking the design risk? - Some insurers taking more of this risk but will limit serial loss limitation.
OFTO risk is the largest risk for business interruption claims. Germany and Denmark don’t have this risk because protected under statute from TSO. In UK there is no recourse against the OFTO. There has been quite a few export cable failures over the last few months for projects only 2-3 years into operation. e.g. 1 out of 4 cables operating. OFTO has no incentive to keep asset available. Cable scour is an issue but OFTO not acting. This could be subject to a very large insurance claim in the future and will impact chance of new finance to the market.
No major catastrophe yet. New capital has come in which depressed the pricing, 25 insurers, 6-7 making money and have big premium building up but one major catastrophe and they may leave the market.
Evidence Source
Cable claims are the highest claim by number in offshore wind http://www.ewea.org/offshore2015/conference/allposters/PO223.pdf

ORE Catapult PN000113-FRT-002
CRMF 2015 Evidence log external Issue: FINAL 332
Operations 2014 2015
Property damage only 3,125,000
3,125,000
Delay in start up 3,679,200
3,433,920
£pa 6,804,200
6,558,920
£/MW 13,608
13,118
65.4 Additional comments
None for this indicator
65.5 Recommendations
The OWPB finance group should ensure that consistent messaging is provided from insurers to developers and contractors to ensure continued focus on bottleneck areas that help reduce premiums e.g.
standardisation and universal joints, vessels, models, spares strategies, vessel pooling, spares clubs, redundancies in the wind farm, buffers in construction schedule and EoW inspections.

ORE Catapult PN000113-FRT-002
CRMF 2015 Evidence log external Issue: FINAL 333
66 General comments
During each interview, interviewees were given the opportunity to include any ‘general comments’ which they felt were either particularly relevant to cost reduction and/or addressed areas not otherwise covered
by questioning structured around the particular CRMF indicators.
This section includes ‘general comments’ recorded during interviews. While some indicator specific evidence above does contain ‘general comments’ which have been identified and aligned to the relevant
indicators all ‘general comment’ has been included in this section. As a result some evidence may be duplicated in this evidence log.
66.1 Evidence
66.1.1 Interview
Category Interview response
Electrical OEM • The last 5 – 6 years, early days of offshore wind industry has been a massive learning experience • This increased experience has in general lead to more consistency in pricing and delivery • So while there may be a perception of increased costs, this may actually be more realistic expectations being set based on experience • The potential savings associated with economy of scale are only partly being realised, and there is a lot more scope for cost reduction based on this • [Electrical OEM] are willing to engage and see the value in CRMF • They cannot give away information or competitive advantage • They are as a company invested in the success of offshore wind • However, if their business was dependant on offshore wind alone (not supported by consistent grid/other work) it would not survive • Offshore wind is seen as an unreliable/volatile market to serve
O&M Interested in standardising/sharing of expensive (jack up etc) vessels by groups of operators
Dev
• [Dev] do see auction mechanism as a strong driver of cost reduction. Evidence is there in extremely low prices being bid. • However, [Dev] suggests that there is a need to find a tender system that does not kill suppliers. They think that bidding/auctioning will use up a lot of supply chain interaction and may be a source of inefficiencies, as suppliers may bid several times to have only the chance of winning a single project. • As mentioned during last year’s study, [Dev] feel that this methodology is too heavily based on cost reduction pathways report. • [Dev] sees huge improvement in cost reduction is in big changes like larger turbines. • The opinion is that too many of our questions are focussed on very small technical wins, which do contribute to cost reduction but only in very small ways. • Opinion that ORE Catapult are not asking enough about the potentially ‘big wins’ in cost reduction: - 0.5m/s gain by better site selection – big win - Technical improvements in cables – small win - Intelligent structuring of contingencies portfolio wide – big win • Opinion statement that if there is a CfD round in 2017 it looks likely that the £100/MWH barrier will be broken.
Dev
• 2 biggest step changes in cost reduction are move to larger (7MW) turbines, and to a distributed substation system [PRODUCT]
• See supply chain plan for more detail
• Government and regime is currently the biggest barrier. Majority of cost reduction is coming from contractors: [COMPANY] / [COMPANY] etc
• Cost reduction has to come from supply chain, but if they do not see a pipeline in the UK they will not invest the necessary to make this happen. Will treat every project as bespoke and therefore are not incentivised to really drive at reducing LCOE.
• 7MW also beneficial as can use fewer foundations.
• Construction is an area where it is hard to see scope for further innovation, but is a significant cost.

ORE Catapult PN000113-FRT-002
CRMF 2015 Evidence log external Issue: FINAL 334
• Consider including decommissioning question in CRMF in future.
• Surprising how cheap decommissioning is forecast to be. There will be a requirement to supply DECC with a bond or some other financial mechanism to give confidence that it will be dealt with responsibly.
OFTO - Lightweight substation should be considered. - Distributed substation should be considered. - Cable rating is a significant driver and is not fully considered - Next generation of export cables, e.g 5 – 600 MW from a cable is a potential indicator. - Big/dominant market for AC cables is offshore wind. - Comparison to other country transmission assets would be illuminating and could be done.
WTG OEM
• Postponing of CfD, uncertainty about market volume in the UK is a concern and is generally already being communicated by the industry. • No stability or certainty about when next round may happen. • Stop and go in policy is not helpful. Slight increase in volume may be beneficial but real challenge is consistency
Dev
• [Dev] would agree that auction process and uncertainty is most important thing now • Ripples of the effect of this process travel right through the supply chain • Supply chain generally are perhaps less interested/focused on UK market as a result of uncertainty/peaks and troughs • Having recently had a project refused consent [Dev] see visibility and continuation of auction process as the main issue for the UK industry at the moment
WTG OEM - There is a big issue around market certainty, what was referred to as ‘industrialisation’ of the industry in the pathways report has not happened. [WTG OEM] developing [PROJECT] is more or less a one off, in terms of industrialisation of offshore wind in the UK. The potential for some cost reductions in supply chain (foundations, jackets in particular) have therefore probably been missed or at least delayed. - The fact that LCOE has continued to decrease shows that missing out on ‘industrialisation’ has been compensated for by moving faster than was projected on turbines, in particular the development and deployment of the new generation of turbines. - The larger turbines are a one off win, whereas industrialisation would have been a continuing process and would have been delivering more cost reductions now. - Cost reduction is a long journey, and there should be recognition that the industry and particularly the supply chain are focused and collectively driving hard work to reduce costs. - UK over next few years will install another 5GW. Technology and projects can easily cope with this as it represents no acceleration of the capacity for new installations already happening at present. This means no growth, which will not incentivise the supply chain. Additionally there is no visibility to encourage long term investment to gain work post 2020 – as market is unknown. - Round 3 has really evolved into developing the most round 2 like (e.g. easiest) projects first. More challenging (farther offshore) sites have consequently remained on the drawing board. - It would be much harder for those in the supply chain to make investment decisions of 5 years ago in UK facilities (for example) today, as the potential market size and unserved capacity is no longer there.
Installation - We need a clear view of what is beyond current tranche of projects, This would allow [Installation] to take a longer term view of return on investment. - Cost of risk is gradually chipping away as clients and contractors gain experience, maturity and confidence, which is another positive.
Electrical OEM - Certainty is the main comment. There is a requirement for more certainty from the whole industry. - The industry does not know when next CfD round will be. How much funding will be available, and what the outlook beyond 2020 will be. - There is concern being caused by some of the recent/short term political messaging around the future for the industry. - The lack of UK certainty means that [Electrical OEM] look to push into other markets. - Lack of certainty makes investment decisions for R&D a lot more difficult. The only way to justify developing the next innovation or next generation of any technology for offshore wind is currently to look away from the UK and base decisions on the potential for global markets/no UK potential. - Reference previous ‘OFTO gap’ situation for downsides associated with uncertainty. - New entrants looking to make investment decisions to get into the industry will be discouraged from doing so at present.
Foundation - Potential for standardisation of foundations and particularly jackets would offer lower cost. - If the design could be frozen it would allow all tenderers/supply chain to work together on taking cost out - Feasibility of such standardisation is unknown, but if there was stability of a design for 1 – 2 years at a time then each generation of jackets would likely be cheaper. - Perhaps an element of innovative design (twisted jacket) may be design efficient but not necessarily optimised for manufacture, reducing costs somewhere but increasing them somewhere else.

ORE Catapult PN000113-FRT-002
CRMF 2015 Evidence log external Issue: FINAL 335
- The industry appears not to have a fully standard approach to installation (sea fastenings, load out etc) and there is definitely rooms for improvement in this area, with perhaps the most optimum solution or most capable vessels not yet finished/defined/refined. - Like everybody else, the view from 2020 onwards is important. If CfD regime is going to change, the sooner the industry is aware the better they will be able to react. Even if it is bad news, better to know now and be able to deal with consequences. - Some members of supply chain may yet consolidate (as a result of O&G price slump) fabricators would really be interested in offshore wind work now, not in 17/18. - Similarly if oil price recovers in conjunction with 17/18 uptick in offshore wind work there could be a market capacity crunch – particularly in jacket manufacture some developers are considering this as a significant risk.
Dev - Developers would like to deliver the UK an offshore wind farm as cheaply as possible. At present they are not able to do this, because they do not have a CfD mechanism. - If government want to drive efficiency and have the UK remain as number 1 in offshore wind the decision to deliver capacity has to be made, committed to, and not just one year at a time, longer term visibility is required. - People have to see the investability of the UK, not much more is coming beyond those currently projects in the pipeline, i.e. there is no real long term vision. - Further offshore and deeper waters will also be in the mix on the journey of costs, and will have their own implications. - Without visibility and security a subsequent vision, a single further auction round does not really help the industry. It’s a sticking plaster, very short term appeasement, but gives minimal supply chain innovation and other indirect participants in the industry will not be motivated. - Current Dutch system gives visibility of what capacity will be coming year on year. This really delivers buy in from the industry in that country as everyone has visibility of what is coming in the future. - Government can control ultimate liability by setting targets on strike price. - Equity IRRs are reducing. This is reasonable, but they can only go so far without losing investors.
Designer - Certainty is required for the industry. [Designer] are less exposed than some in supply chain but have suffered from cancelled projects when they have invested in skills and equipment to be able to serve projects which have subsequently been cancelled. - If the supply chain have to chase more projects harder to win one (as is now the case under auction based regime) it will tend to mean that when they do win, individual projects will have to cost more to support all of the tendering effort. - Spending the time and effort doing upfront work will certainly reduce costs. Designers do have strategies which can optimise on costs, but they can only achieve maximum cost reduction when a project fully engages with them at an early stage, which developers cannot do at present. - In the industry in general, the way things are being driven at the moment is that very little work will be done upfront, as a result of the significant risk that a project will not get consent and/or CfD. Whilst the auction mechanism will squeeze developers on price, it is likely that they could have designed lower cost projects if they were able to interact with designers and the supply chain at an earlier stage.
Installation - Standardisation could drive cost reductions. - Much cost is attributed with clarifications/queries and so on, if there was greater technical standardisation and the contractor was able to work more autonomously then both they and the customer may achieve cost savings. - Procurement could get the costs down by asking the supply chain to do more. This would be by “smart” and/or value procurement. - Procurement from other industries could teach the offshore wind industry about best value or better strategies, e.g. automotive have gotten very good at this. No need for offshore wind to reinvent things that already exist.
Dev - Positive message is that the cost of energy has been decreasing and can be shown in evidence, the industry should be confident in describing the good work that has happened so far. - Positive message about UK content, RUK are looking at a local content report, and there are some positive messages that can be found (case studies?) where it can be demonstrated that supply chain plan requirement is driving positive outcomes for jobs/skills etc in the UK. - Timescales of CfD are a very short turnaround. Suppliers are being asked to produce a number of tender rounds while design advances, developers cannot go out to market with a final design, as the design process is still ongoing. Contractors may be tendering based on incomplete information or subject to design change, which may be subject to variations at a later stage. - There is a possibility of not having closure on some areas before being forced to make an investment decision - In the future could foresee a lot of collaboration with key supply chain partners ahead of auction round. If there was better visibility of what subsequent auction rounds may be coming and when, there would be a possibility to develop ways to more formally engage across the supply chain before the CfD award - Are operating in different geographies with different technologies, e.g. most appropriate turbines for market may differ by projects. Not much opportunity to standardise internationally. But there would be a good opportunity to further drive down costs by using experience of one UK project to directly feed into improvements for the next, but cannot do this proactively at the moment as there is no visibility of what is coming next - Auction mechanisms should logically drive whole of supply chain to sharpen their offer - Each auction process should also logically be expected to see a continuing reduction in cost. - There is an opportunity to show what the next/further reduced target price should be. - £100/MWh may not be sufficiently attractive to encourage a government appetite at present.

ORE Catapult PN000113-FRT-002
CRMF 2015 Evidence log external Issue: FINAL 336
66.1.2 Market intelligence
66.2 Additional comments
None for this indicator
66.3 Recommendations
None for this indicator
Dev - Further clarity on what cost reductions government will require to continue to support would be beneficial, as this is not clear at the moment. - The variety of shallow to deep water sites will inevitably mean that these projects have differing commercial structures/costs - Lenders are maturing in their approach as they gain experience of offshore wind projects - Key challenges that they see is that a long development timeline for their projects - Therefore the appetite from larger OEMs etc. may have been reduced/dissuaded by the length of project development lifecycle - Opportunities to industrialise have in general been missed - The plan for offshore wind as was of ~5 years ago, with UK manufacturers and UK supply chain has not materialised, and a big opportunity has not been realised - CfD impact has driven a slow down on a number of fronts, developers have backed away, and the supply chain have been pressed - All in the industry understand that there is only so much support money to go around, but a smaller pipeline will fundamentally be more difficult to drive/incentivise supply chain industrialisation and/or cost reduction - A lot of good existing UK based expertise for onshore cabling and substation etc, this is a positive opportunity for UK content on projects and something the UK can demonstrate good skills in.
Evidence Source
None for this indicator

ORE Catapult PN000113-FRT-002
CRMF 2015 Evidence log external Issue: FINAL 337
Contact ORE Catapult Inovo 121 George Street Glasgow, G1 1RD
T +44 (0)333 004 1400 F +44 (0)333 004 1399
[email protected] www.ore.catapult.org.uk