Food Reserves Working Paper #8 March 2019 Rice Reserves ...
37
Food Reserves Working Paper #8 March 2019 Rice Reserves, Policies and Food Security: The Case of the Philippines Ramon L. Clarete Study funded by the European Commission, Directorate-General for Development and Cooperation, Unit C1
-
Upload
khangminh22 -
Category
Documents
-
view
3 -
download
0
Transcript of Food Reserves Working Paper #8 March 2019 Rice Reserves ...

Food Reserves
Working Paper #8
March 2019
Rice Reserves, Policies and Food Security:
The Case of the Philippines
Ramon L. Clarete
Study funded by the European Commission,
Directorate-General for Development and Cooperation, Unit C1

DAI Europe Ltd. 3rd Floor Block C Tel: +44 (0) 1442 202 400
Westside, Fax: +44 (0) 207 420 8601
London Road, www.dai-europe.com
Apsley
HP3 9TD
United Kingdom
About this working paper
This working paper is one of the products of a study conducted by DAI at the request of the European Commission as part of the advisory
service ASiST managed by the unit in charge of rural development, food security and nutrition (C1) within the Directorate General for
International Cooperation and Development (DEVCO).
The study has aimed at clarifying the potential role of food reserves in enhancing food and nutrition security in developing countries, and
at making recommendations on how to use food reserves (in complement to other tools), taking into account the specificities on the
context and the constraints of World Trade Organisation (WTO) disciplines.
The study was conducted based on i) an extensive review of the existing literature (both theoretical and empirical) and ii) 10 case studies
analysing national or regional experiences in Africa, Asia and South America.
All the products of the study (including other working papers, a compilation of case study summaries, and a synthesis report) are available
at: https://europa.eu/capacity4dev/hunger-foodsecurity-nutrition/discussions/how-can-food-reserves-best-enhance-food-and-nutrition-
security-developing-countries.
Acknowledgements
Franck Galtier (CIRAD) coordinated the overall study. This working paper was written by Ramon L. Clarete (University of the Philippines). It
benefited from the review of Franck Galtier, Ralph Cummings (consultant, ex IFPRI), Kalanidhi Subbarao (consultant, ex World Bank), and
Steve Wiggins (Overseas Development Institute).
Disclaimer
The authors accept sole responsibility for this report. The contents of this publication do not necessarily reflect the official position or
opinion of the European Commission. Neither the European Commission nor any person acting on behalf of the Commission is responsible
for the use that might be made of the following information.

iv
Table of Contents
List of Abbreviations and Acronyms ...................................................................................................... vi
Introduction .................................................................................................................................... 1
Policies Enabling Rice Reserves ....................................................................................................... 2
2.1 Early years ........................................................................................................................... 2
2.2 From National Grains Authority to National Food Authority.............................................. 4
2.3 The National Food Authority Since 1985 ............................................................................ 5
Rice Reserves and Prices ................................................................................................................. 7
3.1 Rice stocks and price volatility ............................................................................................ 7
3.2 Intra-year rice reserves ..................................................................................................... 10
3.3 Multi-year rice reserves .................................................................................................... 11
3.4 Public-private sector mix of rice reserves ......................................................................... 12
3.5 Price stabilisation role of public stocks ............................................................................. 13
3.6 Local price formation ........................................................................................................ 15
NFA’s Effectiveness in Stabilising and Subsidising Rice Supply and Use ....................................... 17
4.1 Stabilising rice prices ......................................................................................................... 17
4.2 Farm price support ............................................................................................................ 19
4.3 Leakages ............................................................................................................................ 22
Concluding Observations and Suggestions ................................................................................... 23
5.1 Rice price band .................................................................................................................. 25
5.2 Tariffying the Rice Quantitative Restriction ...................................................................... 26
References ............................................................................................................................................ 31
List of Tables
Table 1: Distribution of fluctuations of monthly rice prices, 1990 to 2014 9
Table 2: Composition of average monthly rice stocks (%) 12
Table 3: NFA Intervention in the Rice Market (thousand MT) 19
Table 4: Production and NFA Procurement in Rice Paddy Markets (thousand MT) 21
Table 5: Philippine Rice Subsidy Cost/Benefit Calculations 22
Table 6: Tariff Equivalent Rate of the Rice QR, 1980 to 2012 30
v
List of Figures
Figure 1: Annual Rice Stocks-to-Use Ratio and Prices, 1990 to 2014 8
Figure 2: Monthly prices of regularly milled rice (RMR) and rates of price change, 1990 to 2014 8
Figure 3: Rice stocks and monthly price volatility, 1990 to 2015 10
Figure 4: Decennial average monthly rice stocks normalised by annual average monthly stocks,
1980 to 2015 11
Figure 5: Average monthly rice stocks and rice paddy production, 1980 to 2015 12
Figure 6: Average shares of monthly rice stocks of households, commercial and public sectors,
1980 -2015 (%) 14
Figure 7: Average shares of household and public monthly stocks (%) with the price of RMR
(PhP/kg) 15
Figure 8: Average shares of private commercial and public monthly stocks (%) with the price of
RMR (PhP/kg) 16
Figure 9: NFA Rice Price Discount, 1980 to 2013 18
Figure 10: NFA Farm Price Premia and Procurement Levels, 1980-2013 20

vi
List of Abbreviations and Acronyms
Food and Agriculture Organisation (FAO) Metric tonne (MT) National Food Authority (NFA) National Grains Authority (NGA) Quantitative Restriction (QR) Regularly Milled Rice (RMR) Rice and Corn Administration (RCA) Rice and Corn Board (RICOB) Stocks-to-Use Ratio (STU)
1
Introduction
This paper looks at the role played by the government of the Philippines in attaining national food
security. Food security is defined as the situation where “all people, at all times, have physical, social
and economic access to sufficient, safe and nutritious food that meets their dietary needs and food
preferences for an active and healthy life” (FAO, 1996). It may be useful to dissect this definition into
its three dimensions to better understand the evolution of public policies and programmes for food
security in the country.
Following the near-global food shortages in the 1970s, the world’s policymakers focused their
attention on ensuring adequate domestic food supplies to attain food security (Maxell and Slater,
2003). The food availability dimension would have governments working on increasing productivity
in food production. Sen’s work (1981) on poverty and famines shifted policymakers’ understanding of
food security from availability to economic access, particularly of the poor, to food supplies (FAO,
1983). It is a population’s deprivation of the means to access food markets, which make it food
insecure.
The World Bank (1986) has reported that food price fluctuations explain significantly transitory food
insecurity. But alongside that is the recognition that changing levels of foreign exchange earnings,
local food production, and household incomes are important determinants of food access. Even those
that ordinarily find food affordable become food insecure in times of sharp and unexpected food price
spikes.
A renewed effort to avoid extreme food prices swings surfaced once again in the aftermath of the
food crises in 2007 and 2008.1 Keeping food prices stable and affordable has become the paramount
task to secure economic access to food since the 1980s. In the 1990s, safety and quality of food made
up the third dimension of the Food and Agriculture Organisation’s (FAO) definition.
The uncertain and weak access to food of the world’s poor has remained the paramount concern of
policymakers. In its Food Insecurity Report 2001, the FAO (2002) emphasised the intertwined
problems of poverty and food insecurity. People are vulnerable to food insecurity because their
economic status has reduced their entitlements to adequate, safe, and nutritious food. Improved
economic status enables households to better cope with transitory food price fluctuations. With low
income levels, households face difficulty adjusting their respective budgets to cope with unexpected
food price increases. For those in the lowest income levels, access to food may altogether be
economically barred.
The paper argues that the policy configuration since the 1970s in the Philippines has served the goal
of food security ineffectually and, ironically, at a high cost to Philippine consumers and the economy.
The discussion focuses on the country’s staple food: rice. Public intervention for food security revolves
around two public sector anchors: the National Food Authority (NFA) and the rice self-sufficiency
programme.
1 For example, see Timmer (2009) Headey (2011) and G20 (2011) on extreme food price volatility.
2
In the following section, the paper discusses the NFA’s mandate to ensure food security by
enumerating the tasks, functions, powers, and privileges assigned to the NFA under its charter.
The third section takes up the NFA’s performance with respect to attaining food security, and the cost
to Philippine society of its programmes. Like the NFA, the rice self-sufficiency programme has endured
successive governments, with each trying to make the programme their top performance indicator –
eliminating the need to import rice. Like the NFA’s programmes, it has become a black hole of public
funds.
The fourth section describes the programme and its cost. The last section sums up the paper’s
observations and advances a few policy reform suggestions.
Policies Enabling Rice Reserves
The policies mandating the National Food Authority (NFA) for the creation, maintenance and use of
rice reserves to attain food security in the Philippines are spelled out in its charter.2 Rice is the main
staple food of over 100 million Filipinos, and the most important agricultural crop in the Philippines.
About 4.4 million hectares of rice are harvested each year, with yields averaging about 3.2 metric
tonnes (MT) per hectare. Because of its importance, rice is the most regulated agricultural crop in the
country. Regulation and market interventions date back to as far back as the 1960s. The NFA is heavily
involved both in building rice reserves and injecting stocks into the domestic market to assure
sufficient and stable supply at low prices.
2.1 Early years
Public intervention in the Philippine’s food grain markets dates as far back as the early 1960s, when
two public agencies were in operation: the Rice and Corn Administration (RCA), the rice industry
regulator, and the Rice and Corn Board (RICOB), a government-owned and operated grains trading
company that competed with private rice traders.
In 1972, through Presidential Decree No 4 (PD 4)3, the government created the National Grains
Authority (NGA) that combined the regulatory and trading functions of the RCA and RICOB. The NGA
is the predecessor of the National Food Authority (NFA). Except for what food it regulates and its
participation in local marketing, the two are essentially the same. The NFA (and previously the NGA)
has both regulatory and proprietary functions.4
2 This is Presidential Decree No. 4 or the Charter of the National Food Authority. Former President Ferdinand Marcos issued
this law in 1972.
3 During these years, the country was under martial law. Then President Ferdinand Marcos had legislative powers, and issued Presidential Decrees, which had the force of a law of Congress. This ended in the early 1980s.
4 Besides rice, corn had also been regulated by the NGA or NFA. Corn is food grain for about a tenth of the population, most of whom reside in the south. Progressively, the traditional corn consumers became rice consumers and food security policies increasingly became rice-centric. The discussion in this paper focuses on rice.
3
The government at that time had been selling rice to consumers at lower than market prices. RICOB
imported and distributed rice while the RCA decided how much rice to import, i.e. it already had a
“sell low” policy for rice. When the NGA started operating, rice farm yields were low and the
Philippines was a rice-deficit country. Rice queues were part of normal life for the population.
Accordingly, there was no push for the government to procure rice from farmers to support farm
prices. But the green revolution, which was in full swing in the 1970s, provided the impetus of the
programme. It raised rice yields about threefold, and reduced farm market prices.
In response, the NGA stopped rice imports, but that was not enough to keep farm incomes high. The
problem prompted the NGA to go into procurement of rice paddy to support farm prices and keep
rice farm incomes high. The NGA was seen as the farmers’ saviour from the private traders who would
have bought rice paddy at the lower market prices. This became the “buy high” policy.
The NGA has been known, even now with its successor the NFA, to be an agency that loses money
because of its “buy high, sell low” rice policy. Relief for farmers resulted in the government subsidising
rice consumers. Farm price supports addressed the political problem of keeping farmers happy and
keeping the private sector traders away from them.5
Aside from the farm price supports, the NGA also regulated rice and corn trade. The NGA was given
the power to be the country’s only importer of these staples. It decided when, from where and how
much rice or corn the Philippines need to import. To control the local and international rice and corn
trade, the NGA was also given the power to license grain trading businesses, including rice mills.
From the 1970s to the early 1980s, the NGA was largely farmer centric. The agency’s mandate,
functions, and powers were designed to support the government’s rice self-sufficiency policy. The
agency sustained a grain productivity programme by procuring grains at higher than market prices and
assuring grain producers a stable and reasonable return, despite a tripling of rice yields in those years.
In addition to price support, the NGA was responsible to develop the post-harvest systems for grains,
building and operating a network of storage and post-harvest facilities throughout the country. The
agency regulated rice imports, intent on protecting the rice farmers.6
These policies implied high consumer rice prices, and motivated the government to let the NGA “sell
low” to the population. The NGA has three mandates: (a) to stabilise year-round rice prices, (b) to
make rice affordable for the country’s population, and (c) to ensure that rice paddy prices provide rice
farmers a reasonable income.
The NGA provided a general subsidy on rice consumption by injecting rice through its accredited rice
retailers. When Filipinos buy NGA rice, it is at the low market price. But at the same time, the release
5 Due to the lack of market infrastructure in rural areas, the rice paddy market at the farmgate is oligopolistic. Particularly
when you combine the fact that the best time to buy rice is during harvest when farm prices are seasonally low, the imperfect competition keeps farm prices down, which farmers associate with private traders.
6 Rice exports are also regulated to ensure that local rice is first made available to Filipinos. In general, one may describe the rice trade policy as one resorting to importation or exportation if the country sees the need for it, and the NGA is tasked to determine that need.

4
of rice into the market has stabilised prices. In times of high prices, it increases its injection of rice into
the market.
The “buy high, sell low” policy brought financial loss to the NGA. In its first few years of operation the
NGA had a simpler programme, which only required it to store rice and distribute it at subsidised
prices when market prices increased. With a more expanded mandate of supporting farm gate prices,
the agency had to incur a larger loss.
The global wheat crisis in 1975 gave the agency the opportunity to compensate for its losses. The bad
wheat crop in major wheat exporting countries in 1975 sharply increased wheat prices in the world
market, thus preventing the local flour millers from maintaining the government-imposed price ceiling
on wheat flour. That paved the way for the NGA’s importation of wheat grain at the request of the
flour millers. Flour millers could pass the added cost of wheat grain to the price of bread. If the NGA
imported it without any customs duty and sold the grain to flour millers sans the duty but with a profit,
then the price of bread would not go up as much. It was a mutually beneficial arrangement: the NGA’s
sale of wheat grain to the flour millers at a fixed price enabled the flour millers to continue operations,
while at the same time, halting the rise in the price of bread and other wheat flour based food
products. This scheme also prevented undue demand for rice, which the NGA was also importing from
a thin world market. The NGA found an adequate source of income in wheat trading to pay for its
losing commercial operation in rice.
In the second half of the 1970s, the NGA was regarded as a success in food security governance. It
embodied the government’s improved capability to manage food insecurity. The country started to
export rice. Although this outcome was due to the Department of Agriculture’s rice productivity
programme, the NGA was seen as its indispensable partner, particularly because of the latter’s farm
price support and post-harvest and marketing assistance programmes to farmers.
The agency demonstrated that it could manage price crises involving rice and corn and their respective
substitutes. The warehouses and mills were strategically located across the country. The NGA was the
largest strategic grains trader in the country. Local food shortages, particularly those caused by natural
hazards, were swiftly and adequately relieved with grain stocks coming out of the agency’s
warehouses. Lastly, the agency’s programmes did not require a major budgetary outlay because the
NGA had an important source of income with its grain import monopoly, particularly in wheat.
2.2 From National Grains Authority to National Food Authority
The success of the NGA governance model encouraged the government to further expand the
agency’s mandate. In 1981, the government issued PD 1770, giving the agency an additional mandate
to ensure affordable prices of non-grain household necessities, particularly for the poor.7 This directive
changed, along with the agency’s name, which became: the National Food Authority (NFA).
The NFA launched the Kadiwa programme, operating mobile and stationary retail stores in depressed
communities, particularly those in major cities. These stores carried food items that the NFA
7 In a way, the agency already had such a programme, although by that time it was not recognised as such.

5
considered “basic” – rice, sugar, cooking oil, coffee, milk, and noodles – and sold these items at
subsidised prices.
In the first half of the 1980s, the country reeled from the second oil price shock, mounting debt service
payments, and a worsening fiscal deficit. In 1984, the peso depreciated substantively, triggering a
sharp contraction of the economy. The depreciation of the peso decreased the NFA’s income even as
its clients demanded more of its services because of the crisis. These events set the stage for the 1985
NFA reforms.
The flour millers, increasingly dissatisfied with the NFA’s monopoly control over wheat imports,
advocated taking back their legal right to import wheat. Because of the economic crisis, the
government was open to ideas that could get the country out of economic depression.8 In 1985, in
need of foreign exchange to manage its foreign debt, the government agreed with the Asian
Development Bank to end both the Kadiwa programme and the NFA’s wheat import monopoly.
Political support for the programme weakened as the Marcos government became increasingly
isolated politically. In 1986, the government was overthrown following a peaceful people power
revolution in Manila.
2.3 The National Food Authority Since 1985
Changes to the NFA’s charter in 1985 brought its regulatory and commercial operations back to rice
and corn, as in the 1970s. While the company’s financial position partly recovered with the end of its
Kadiwa programme, the reforms took away its wheat import monopoly, a major source of income. To
make up for that, the national government increased its recurring subsidy to the agency, but the
amount was inadequate. The NFA had to borrow from commercial banks, which it paid for with its
income from importing rice.
In the 1980s and early 1990s, world rice prices were lower than both domestic prices and the margin
the agency used to pay for the operational losses in rice and corn domestic commercial operations.
However, during periods of high world rice prices or when the peso depreciated, the agency increased
its borrowing from commercial banks, and situations such as these triggered the accumulation of the
agency’s outstanding debt. Its corporate bonds are fully guaranteed by the national government.
In 1998, through a government executive order, the Kadiwa stores were re-introduced, reversing the
reforms in 1985. Unlike their the original design where it was only the NFA that distributed the
subsidised basic household necessities, private entrepreneurs operated the Kadiwa stores, then
renamed as ERAP9 stores. The private businesses bought from the NFA the basic household necessities
that they distributed to the poor. There was a third type of ERAP store called the ERAP-Palengke ng
Bayan and this was typically located within the premises of a public market. In 1998, the NFA operated
8 The economy contracted by about 4-5% in 1984, on top of the political crisis which eventually toppled the government of
President Marcos in 1986.
9 ERAP is the nickname of then President Joseph Estrada. He won by a landslide in the Presidential Elections in 1998 with the campaign slogan of ERAP Para sa Mahirap (i.e. ERAP for the poor).
6
more than 1,500 ERAP stores nationwide. When President Arroyo came to power in 2002, the Kadiwa
programme continued.10
Besides the return of the Kadiwa programme, an important change after 1998 was the shift to sourcing
rice reserves from rice imports primarily instead of from local procurement. Several factors may have
pushed the agency to this. In 1995, a local shortage in rice sparked rice prices to go up. This mistake
was due to the reluctance of the government to import rice. The government then pledged it would
no longer commit such mistakes. Starting in the late 1990s and through the early 2000s, the NFA had
to increasingly distribute imported rather than local rice. Second, the NFA claimed there was no longer
a need to support farm prices since market prices of rice paddy assured farmers reasonable income.
Third, the shift was also good for the NFA because it reduced losses in local procurement. Fourth, a
growing vested interest in rice imports from the private sector developed.
The NFA legally assigns rice imports to the private sector.11 The agency allows a few private sector
imports of fancy varieties of rice for the expatriate population in the country (about 5% of rice
consumption). In 2003, then President Arroyo ordered the NFA to let rice farmers import rice, adding
an important layer of private sector in the rice import business. However, there were no immediate
takers from the farmers, who of course are not in the import business. Unlike the hotels, restaurants,
and farmer cooperatives, which are legally given the right to import rice by the NFA, some individuals
or firms import rice in the name of the NFA, although their rice import operations are not under any
existing programme of the agency. They appear to personally benefit from the sales commissions and
waived import duty privileges of the NFA.
The 2008 rice crisis resulted in the NFA importing more than what the country needed at a time when
world rice prices spiked. The Arroyo administration imported about 2.4 million MT of rice, and part of
that stock remained in the NFA’s warehouses in 2010, eventually becoming inedible. It was during the
2008 rice crisis that the NFA’s financial losses ballooned.
The government of President Benigno Aquino moved away from its predecessor’s rice policies in three
areas. First, it increasingly sourced its rice reserves from local farmers, and not from imports. The
Aquino government energised the country’s rice self-sufficiency programme, progressively decreasing
rice imports and increasing local rice procurement for reserves. President Aquino promoted this
accomplishment in his State of the Nation address in 2011.
Second, it increased private sector participation in rice imports to bring down the cost to the
government. The NFA delegated half of the country’s 1.3 million MT rice imports in 2011 to the private
sector. However, the increased partnership between the NFA and the private sector sparked public
scrutiny of abuses by some private sector rice importers. It was during these years that rice smuggling
became rampant, such that Congress conducted public hearings about the problem.
10 President Estrada was impeached in 2000. Before his conviction, a peaceful people power style uprising supported by the
military and other institutions of government, including the Supreme Court, replaced his government with that of his then Vice President, President Gloria Arroyo.
11 The NFA maintains its legal monopoly in the rice import business. However, it has the power to delegate its imports to the private sector.
7
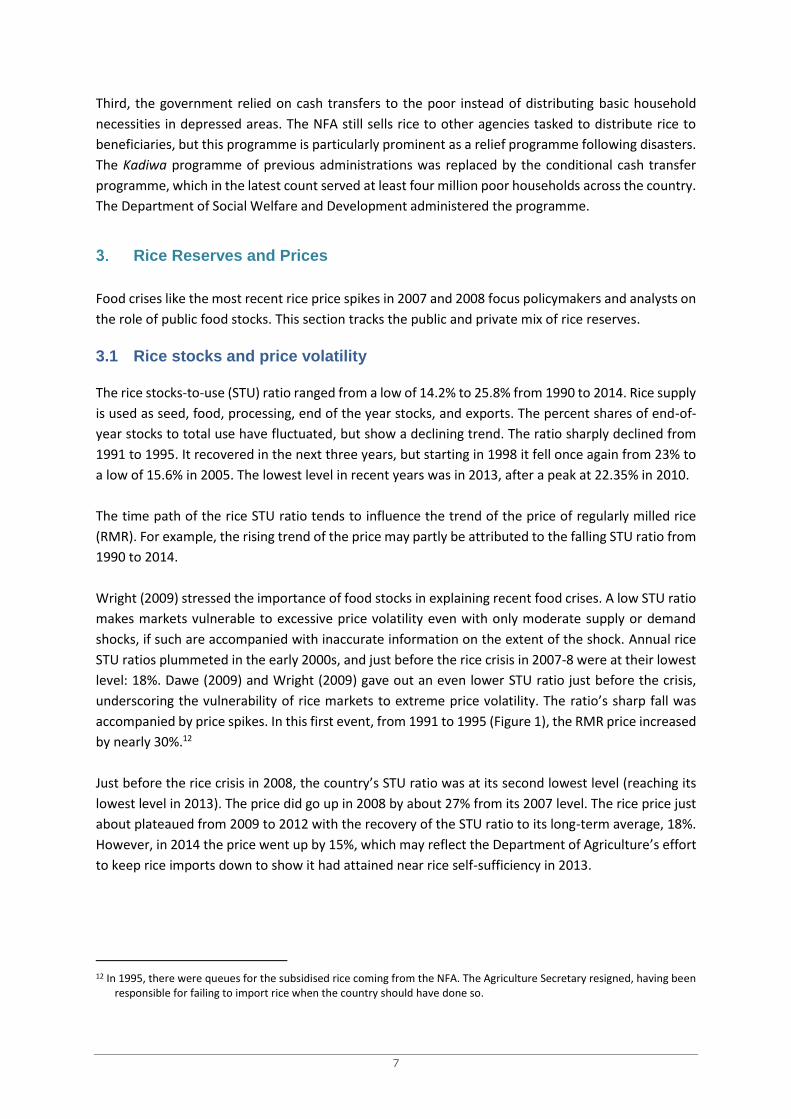
Third, the government relied on cash transfers to the poor instead of distributing basic household
necessities in depressed areas. The NFA still sells rice to other agencies tasked to distribute rice to
beneficiaries, but this programme is particularly prominent as a relief programme following disasters.
The Kadiwa programme of previous administrations was replaced by the conditional cash transfer
programme, which in the latest count served at least four million poor households across the country.
The Department of Social Welfare and Development administered the programme.
Rice Reserves and Prices
Food crises like the most recent rice price spikes in 2007 and 2008 focus policymakers and analysts on
the role of public food stocks. This section tracks the public and private mix of rice reserves.
3.1 Rice stocks and price volatility
The rice stocks-to-use (STU) ratio ranged from a low of 14.2% to 25.8% from 1990 to 2014. Rice supply
is used as seed, food, processing, end of the year stocks, and exports. The percent shares of end-of-
year stocks to total use have fluctuated, but show a declining trend. The ratio sharply declined from
1991 to 1995. It recovered in the next three years, but starting in 1998 it fell once again from 23% to
a low of 15.6% in 2005. The lowest level in recent years was in 2013, after a peak at 22.35% in 2010.
The time path of the rice STU ratio tends to influence the trend of the price of regularly milled rice
(RMR). For example, the rising trend of the price may partly be attributed to the falling STU ratio from
1990 to 2014.
Wright (2009) stressed the importance of food stocks in explaining recent food crises. A low STU ratio
makes markets vulnerable to excessive price volatility even with only moderate supply or demand
shocks, if such are accompanied with inaccurate information on the extent of the shock. Annual rice
STU ratios plummeted in the early 2000s, and just before the rice crisis in 2007-8 were at their lowest
level: 18%. Dawe (2009) and Wright (2009) gave out an even lower STU ratio just before the crisis,
underscoring the vulnerability of rice markets to extreme price volatility. The ratio’s sharp fall was
accompanied by price spikes. In this first event, from 1991 to 1995 (Figure 1), the RMR price increased
by nearly 30%.12
Just before the rice crisis in 2008, the country’s STU ratio was at its second lowest level (reaching its
lowest level in 2013). The price did go up in 2008 by about 27% from its 2007 level. The rice price just
about plateaued from 2009 to 2012 with the recovery of the STU ratio to its long-term average, 18%.
However, in 2014 the price went up by 15%, which may reflect the Department of Agriculture’s effort
to keep rice imports down to show it had attained near rice self-sufficiency in 2013.
12 In 1995, there were queues for the subsidised rice coming from the NFA. The Agriculture Secretary resigned, having been
responsible for failing to import rice when the country should have done so.

8
Figure 1: Annual Rice Stocks-to-Use Ratio and Prices, 1990 to 2014
Price fluctuations influence the desire to store rice. In Figure 2, monthly rice prices from 1991 to 2014,
while steadily rising, fluctuated through the years. Price volatility need not always be bad for the
industry. As in negotiable financial assets, volatility is expected and needed to encourage rice storage
by commercial rice traders. In periods of lower rice prices, traders save in anticipation of higher prices
and by so doing the added inventory help smooth rice use.
However, if the fluctuations are unexpectedly large, their influence on storage becomes more
pronounced. In the case of price spikes, there is significantly large storage in anticipation of higher
profits. But these are the times when government regulators charge traders with excessive
profiteering at the expense of the public interest.
Figure 2: Monthly prices of regularly milled rice (RMR) and rates of price change, 1990 to 2014
-0.15
-0.10
-0.05
0.00
0.05
0.10
0.15
0.20
0
5
10
15
20
25
30
35
40
45
90
J
90
D
91
N
92
O
93
S
94
A
95
J
96
J
97
M
98
A
99
M
00
F
01
J
01
D
02
N
03
O
04
S
05
A
06
J
07
J
08
M
09
A
10
M
11
F
12
J
12
D
13
N
14
O
15
S
PhP/kg
Source of data: Philippine Statistics Authority
Rice Monthly Wholesale Price of Regularly Milled Rice(PhP/kg) Rate of Change of Monthly Rice Prices
0
5
10
15
20
25
30
35
40
0
5
10
15
20
25
30
19
90
19
91
19
92
19
93
19
94
19
95
19
96
19
97
19
98
19
99
20
00
20
01
20
02
20
03
20
04
20
05
20
06
20
07
20
08
20
09
20
10
20
11
20
12
20
13
20
14
PhP/kg.%
Stocks to Use Ratio (%) Price Reg. Milled Rice (PhP/kg.)
Source of data: Philippine Statistics Authority

9
Households may expect and tolerate a degree of price fluctuation (± 5%). They do not significantly
change household spending patterns, nor is the public sector compelled to scale up its rice subsidy for
the poor. These are part of normal price fluctuations, and more likely the demand for rice storage by
traders is not going to be scaled up or down.
In Figure 2, twenty-one (21) observations registered monthly price fluctuations that were at least 5%
in absolute value sense. About a tenth of these or two observations had fluctuations that were at least
15%: one in 1995 and the other in 2008 when global rice market prices sharply increased. In both
instances, the Philippines heavily imported rice at a significant loss to avoid rice queues, although in
1995 the importation was after rice queues had emerged in major cities.
Table 1: Distribution of fluctuations of monthly rice prices, 1990 to 2014
% Change of Monthly RMR Prices Number of observations % share Cumulative % share
From -20 to less than -10 2 0.64 0.64
From -10 to less than-8 1 0.32 0.96
From -8 to less than-6 4 1.28 2.24
From -6 to less than-4 6 1.92 4.15
From -4 to less than-2 24 7.67 11.82
From -2 to less than 0 80 25.56 37.38
From 0 to less than 2 141 45.05 82.43
From 2 to less than 4 32 10.22 92.65
From 4 to less than 6 15 4.79 97.44
From 6 to less than 8 4 1.28 98.72
From 8 to less than 10 1 0.32 99.04
From 10 to less than 20 3 0.96 100.00
Total 313 100
Source of basic data: Philippine Statistics Authority
How do rice stocks change before or after episodes of extreme rice price volatility? To recall, annual
STU ratios were falling just before the 1995 price spike, and were lowest just before the 2008 global
rice crisis. Figure 3 validates the same pattern that was observed in Figure 1, but this time using
monthly rice stocks and monthly rice price volatility. It is apparent from Figures 1 and 3 that the STU
ratio is an important predictor of extreme rice price volatility. At the very least, low STU levels make
the rice market highly vulnerable to extreme price volatility.
Stock levels rose after both of these extreme rice price fluctuations, although the recovery of rice
stocks in 2008 was stronger compared to that of 1995. In that year, the Philippines, through the NFA,
imported more than what the country needed. Indeed, Slayton (2009) took this action of the
Philippines as one of three factors fuelling the 2008 global rice price crisis.13 The Philippines added to
the growing price crisis by issuing in the regional market unprecedentedly large rice tenders. In that
year, the Philippines imported about 2.4 million MT, most of which came from Vietnam.
13 The other two were the rice export restrictions by India and Vietnam.

10
Figure 3: Rice stocks and monthly price volatility, 1990 to 2015
This observation may be important in guiding policymakers on the correction needed to restore stock
levels to their normal level. In the Philippines, there were more stocks than needed, which ended up
wasted. Two years after they were imported the stocks were no longer fit for human consumption.
It was a big waste of rice and money. The importation cost the NFA billions of pesos in additional
corporate debt.
3.2 Intra-year rice reserves
Monthly rice stocks in the Philippines follow a seasonal intra-year variation, which is linked to the
schedule of the two rice harvests each year. The larger harvest occurs in the last quarter of the
calendar year and the smaller one is in the second quarter of the year. The lean quarter in terms of
rice is in the third quarter. Figure 4 charts the average over a decade of monthly rice stocks normalised
by the average monthly rice stocks of the year. This is done in the four decades of the rice stocks data,
i.e. 1980s, 1990s, 2000s, and 2010-2015, and for the entire period from 1980 to 2015.
The charts by decade very closely resemble each other, suggesting a highly regular seasonal pattern.
They show that in the last quarter of the year the country builds up its rice stocks, reaching the peak
monthly stock level in December of about 1.2 of the average monthly stock of the year. In the first
quarter of the following calendar year, the country draws down its rice stocks, reaching the bottom in
March of about 0.88 of the average monthly rice stocks of the following year. The minor harvest in
the second quarter provides the opportunity to increase stock levels to about 1.1 of the average. But
the larger drawdown is in the third quarter, when no rice is harvested in the country throughout the
quarter.
0
1,000
2,000
3,000
4,000
5,000rice stocks (in '000 MT)
-0.15
-0.10
-0.05
0.00
0.05
0.10
0.15
0.20
90
J
91
J
92
J
93
J
94
J
95
J
96
J
97
J
98
J
99
J
00
J
01
J
02
J
03
J
04
J
05
J
06
J
07
J
08
J
09
J
10
J
11
J
12
J
13
J
14
J
15
J
Price volatility
Source of basic data: Philippine Statistics Authority

11
Private stockholdings respond to the seasonal nature of rice production. Traders accumulate rice
stocks at harvest time in anticipation of higher prices during the lean months of the year, or in the
case of rice surplus countries, private traders do the same in anticipation of higher export prices.
Private rice stocks tend to moderate the depressing effect on producer prices at harvest time and to
smooth out price surges in times where there is inadequate rice supply.
There is a continuing need for public rice stocks. It is likely that private traders play an important role
only in smoothing intra-year price fluctuations, as costs and risks can be high for addressing multi-year
price volatility, which publicly held rice stocks can address.
Public storage may also be needed to address intra-year volatility. Private traders tend to get the
blame from rice consumers for rice price spikes. Under pressure, the government may consider
penalising those found holding rice stocks for hoarding when prices increase sharply, which introduces
a disincentive to private storage and results in a sub-optimal amount of storage activity.
3.3 Multi-year rice reserves
The importance of public stocks in ensuring against the risk of a multi-year drought, resulting in
significant reduction of local production, or the unlikely event of shrinking rice trade, is recognised.
However, based on the level of rice stocks held, these events had been very unlikely in the Philippines
in the past 35 years. Average monthly rice stocks from 1980 to 2015 grew moderately, reflecting that
of production. Figure 4 indicates that there is no discontinuity in the pattern, which would indicate a
significant scaling up of stockholding to prepare the country for such catastrophes as a famine or
significant reduction in the country’s access to rice trade.
Figure 4: Decennial average monthly rice stocks normalised by annual average monthly stocks, 1980
to 2015
Figure 5 shows that the observed average monthly rice stocks fluctuated around their trend. In some
years they declined, e.g. the first half of the 1990s and in the 2000s preceding the 2008 global rice
crisis. In other years, the correction (i.e. the declines) were followed by the recovery of rice stocks.
0.6
0.7
0.8
0.9
1
1.1
1.2
1.3
Jan
uar
y
Feb
ruar
y
Mar
ch
Ap
ril
May
Jun
e
July
Au
gust
Sep
tem
ber
Oct
ob
er
No
vem
ber
Dec
emb
er
1980s 1990s 2000s 2010-2015
Source of basic data: Philippine Statistics Authority

12
The correction in the aftermath of the 2008 rice crisis appeared to be more than needed, and the
correction of that correction is evident in Figure 5. The chart goes back to the trend, again suggesting
that the public stocks in the Philippines are more designed for intra-year smoothing of rice
consumption.
Figure 5: Average monthly rice stocks and rice paddy production, 1980 to 2015
3.4 Public-private sector mix of rice reserves
Households held nearly half of the country's average monthly rice stocks from 1980 to 2015 (Table 2).
The public sector comes next with a share of 28.47%, and last is the private commercial sector, at
22.79%. But changes may be observed in this composition through the years. In the 1980s, households
held 54.07% of the total decennial average share of mean monthly stocks. The share came down to
40.50% from 2010 to 2015, which may reflect the drawdown of rice stocks in the first half of the 1990s,
and in the 2000s just before the 2008 rice crisis. This was noted in the discussion of Figures 1 and 3
above.
Table 2: Composition of average monthly rice stocks (%) Household Commercial Public
1980-1989 54.07 17.61 28.33
1990-1999 47.71 27.72 24.57
2000-2009 49.39 21.46 29.14
2010-2015 40.50 25.39 34.10
1980-2015 48.74 22.79 28.47
Source of basic data: Philippine Statistics Authority
Table 2 also shows that the NFA likewise lowered its share in total stocks in the first two decades from
28.33% in 1980s to 24.57% in the 1990s. However, the share of NFA-held stocks had recovered in the
2000s compared to the 1990s. This may be attributed to the significantly larger rice imports by the
0
2,500
5,000
7,500
10,000
12,500
15,000
17,500
20,000
0
500
1,000
1,500
2,000
2,500
3,000
3,500
ProductionStocks
Average monthly rice stocks (in '000 MT)
Palay production (1987 to 2015, '000 MT)
Source of basic data: Philippine Statistics Authority
13
NFA in 2008 and 2009 because of the global rice crisis in those years. This data demonstrates that the
NFA led the recovery in the country's rice stocks in the 2000s.
The 1990s pose an interesting contrast to the 2000s. Instead of the public sector, private commercial
stocks led the recovery of rice stocks (following their decline in the first half the 1990s). Their share in
total stocks rose from 17.61% in the 1980s to 27.72% in the 1990s, displacing both household and NFA
rice stocks.
From 2010 to 2015, the shares of the three appear to converge. Public sector and private commercial
rice stocks further increased, at the expense of the share of household stocks. The decline of
household stocks may indicate households’ rising confidence that they would be able to source their
rice requirement from markets. Households’ transaction costs in buying rice from markets may also
have reduced, and so there is less need for households to hold as much stocks as in the 1980s.
On the other hand, commercial stocks likewise may be more responsive to institutional rice markets,
e.g. restaurants, and especially the so-called fast food chains. Commercial suppliers may need to hold
larger rice stocks to ensure delivery. On the supply side, commercial stocks may reflect increased
private sector participation in importing rice. Since the 2000s, the NFA has delegated about half of the
country's import requirements to farmer cooperatives. This delegation increases the private sector’s
capacity to hold stocks.
Monthly rice stocks of the three stock-holding entities validate the apparent narrowing of the gaps
between the stocks held by households, private traders, and the public sector. The average share of
monthly stocks of households has declined, apparently displaced by both the rising shares of
commercial and publicly-held stocks (Figure 6).
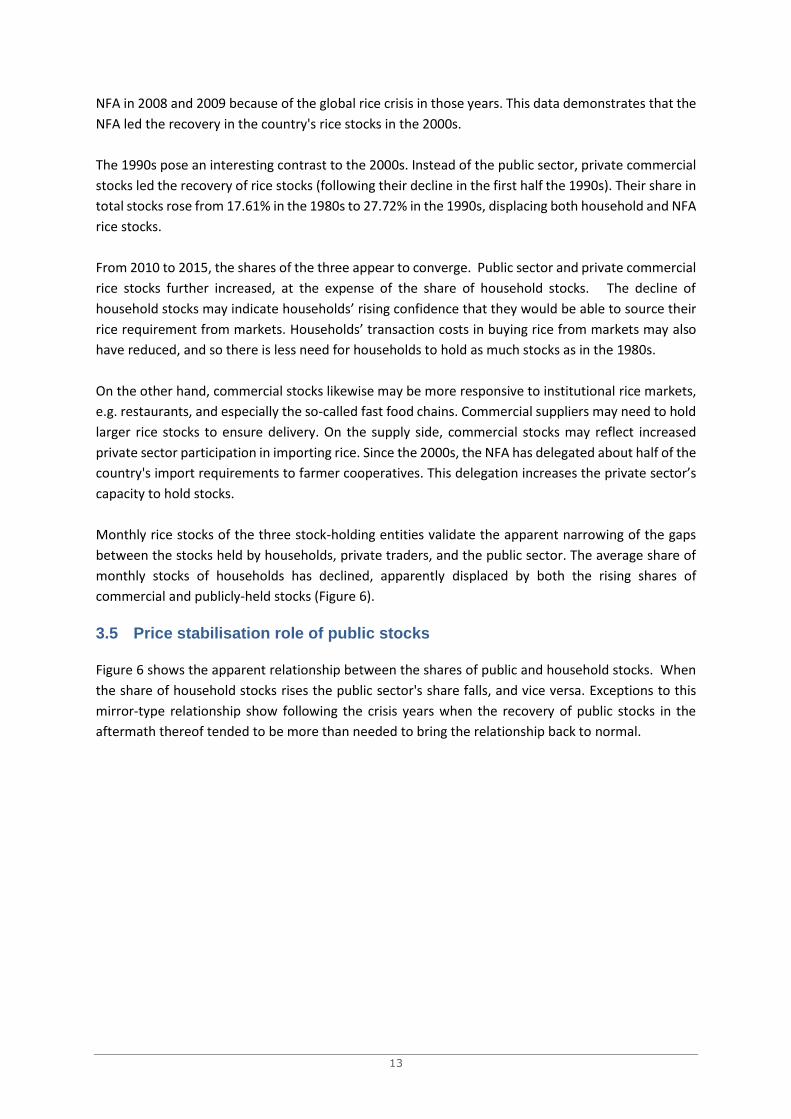
3.5 Price stabilisation role of public stocks
Figure 6 shows the apparent relationship between the shares of public and household stocks. When
the share of household stocks rises the public sector's share falls, and vice versa. Exceptions to this
mirror-type relationship show following the crisis years when the recovery of public stocks in the
aftermath thereof tended to be more than needed to bring the relationship back to normal.

14
Figure 6: Average shares of monthly rice stocks of households, commercial and public sectors, 1980
-2015 (%)
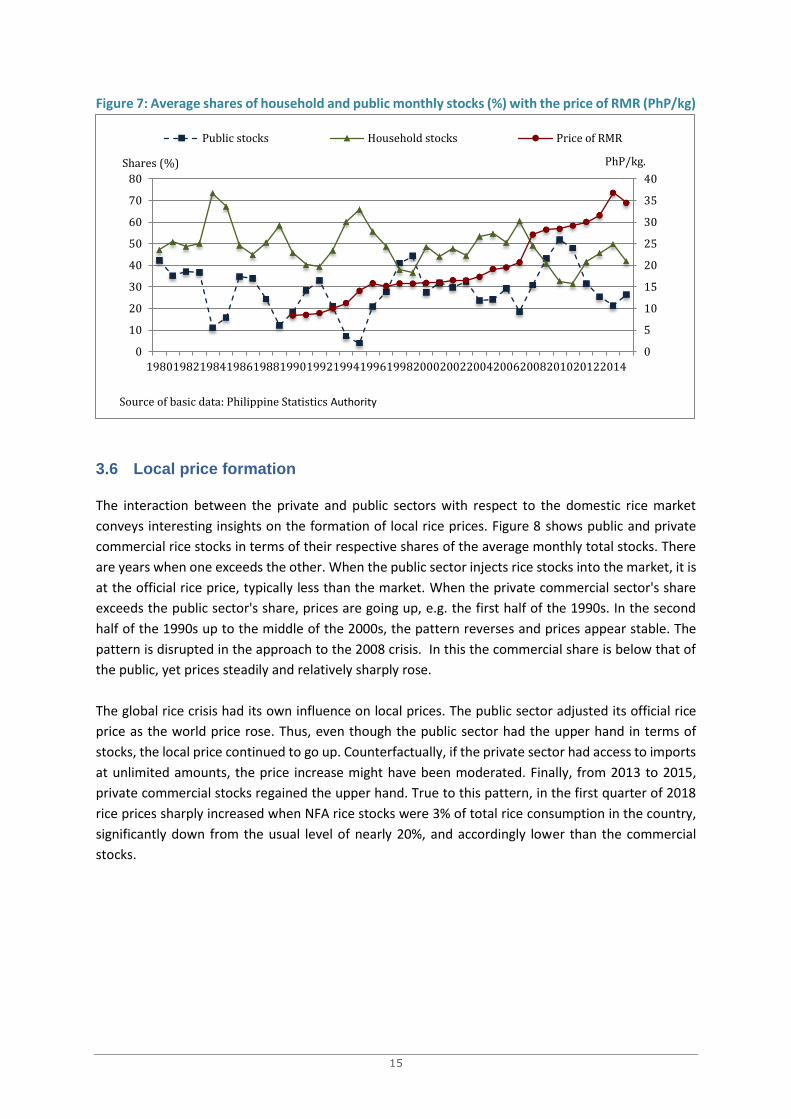
The study observes that it is the public sector's share that behaved the way it did to attain the
government’s mandate of stabilising rice prices, and the household’s share accommodated the
former. In Figure 7, the price of regularly milled rice (RMR) is plotted on the secondary axis. When
prices rise as in the first half of the 1990s, the public sector releases its stocks into the market, reducing
its share of total stocks. From 2006 to 2008, when prices rose once again, the same unloading of stocks
may be observed except this time, publicly-held stocks were apparently inadequate to moderate the
2008 price spikes. This is expected as the 2008 crisis had a global market origin unlike the 1995 crisis,
which was purely a national policy mistake. The public sector's stocks recovered, and the correction
appeared to be more than needed following the 2008 crisis. The correction to the excessive stock
recovery unfolded, and the public sector’s share fell once more even as prices continued to rise in
2012 onwards. But this time, it is like the 1995 rice crisis – a domestic policy mistake, which was the
government’s attempt to attain rice self-sufficiency by reducing rice imports.
0
10
20
30
40
50
60
70
80
Public stocks Household stocks Commercial stocks
Source of basic data: Philippine Statistics Authority
Shares (%)
15
Figure 7: Average shares of household and public monthly stocks (%) with the price of RMR (PhP/kg)
3.6 Local price formation
The interaction between the private and public sectors with respect to the domestic rice market
conveys interesting insights on the formation of local rice prices. Figure 8 shows public and private
commercial rice stocks in terms of their respective shares of the average monthly total stocks. There
are years when one exceeds the other. When the public sector injects rice stocks into the market, it is
at the official rice price, typically less than the market. When the private commercial sector's share
exceeds the public sector's share, prices are going up, e.g. the first half of the 1990s. In the second
half of the 1990s up to the middle of the 2000s, the pattern reverses and prices appear stable. The
pattern is disrupted in the approach to the 2008 crisis. In this the commercial share is below that of
the public, yet prices steadily and relatively sharply rose.
The global rice crisis had its own influence on local prices. The public sector adjusted its official rice
price as the world price rose. Thus, even though the public sector had the upper hand in terms of
stocks, the local price continued to go up. Counterfactually, if the private sector had access to imports
at unlimited amounts, the price increase might have been moderated. Finally, from 2013 to 2015,
private commercial stocks regained the upper hand. True to this pattern, in the first quarter of 2018
rice prices sharply increased when NFA rice stocks were 3% of total rice consumption in the country,
significantly down from the usual level of nearly 20%, and accordingly lower than the commercial
stocks.
0
5
10
15
20
25
30
35
40
0
10
20
30
40
50
60
70
80
198019821984198619881990199219941996199820002002200420062008201020122014
Public stocks Household stocks Price of RMR
Source of basic data: Philippine Statistics Authority
Shares (%) PhP/kg.

16
Figure 8: Average shares of private commercial and public monthly stocks (%) with the price of RMR
(PhP/kg)
National rice reserves serve two purposes. One is to smooth intra-year rice use in a country with very
pronounced seasonal rice output and vulnerable to typhoons and heavy flooding that temporarily
disrupt access of the affected population to rice markets. Rice reserves must hold at least a 90-day
supply during the lean third quarter of any year, with a third of it14 in the hands of the NFA. The share
of public stocks is important in a market where rice imports is restricted. In 1995, the NFA held less
rice reserves than necessary, causing local rice prices to spike and rice queues in the major urban
centres. Additionally, the NFA likewise is required to keep stocks amounting to 15 days at any other
point in time for local disasters.
The other role that is less attended to by the government is the use of rice reserves for multi-year
fluctuations in rice production. Nothing in this section suggests that the government maintains multi-
year rice reserves for prolonged droughts and other social or political problems that reduce access to
rice markets.
The strategic action of multi-year rice reserves may be reasonable considering both these reasons.
One is the high certainty of the timing of the monsoon rains year after year. When the rains are back,
the country’s farmers can plant rice once again. The most likely worst-case scenario the country may
face is a multi-year drought, requiring provisioning for multi-year rice price fluctuations, but this has
yet to happen. The worst situation the country has faced to date is the El Nino dry weather spell in
2015.15 But even during El Nino months, the dry spell leaves the country with solutions. It can import
from Southeast Asia, effectively making mainland ASEAN the country’s reserves for multi-year price
fluctuations. In addition, it is likely that there would still be some rice production as El Nino tends not
to cover the entire country.
14 I.e. a 30-day supply, with the remaining 60-day supply held by both the commercial and household stocks.
15 The last time the Philippines went through a dry spell was in 1997.
0
5
10
15
20
25
30
35
40
0
10
20
30
40
50
60
198019821984198619881990199219941996199820002002200420062008201020122014
Public stocks Commercial stocks Price of RMR
Source of basic data: Philippine Statistics Authority
Shares (%) PhP/kg.

17
On the access to Southeast Asian rice markets, it would help to develop and sustain cooperative
undertakings in this area with neighbours. Several proposals for multi-country rice reserves surfaced
in the aftermath of 2008 rice crisis. One is an international coordinated grain reserves system (Lin
2008). Timmer (2010) suggested building up rice stocks in Asia at four levels: (i) private stocks, (ii)
public stocks in small importing countries, (iii) public stocks in large importing and producing countries,
and (iv) international stocks. The ASEAN states revitalised their largely inactive regional food reserves
cooperation, which dates to 1979 and is mostly in rice, by agreeing with the governments of Japan,
the Republic of Korea, and the People’s Republic of China to establish the ASEAN Plus Three
Emergency Rice Reserves.
NFA’s Effectiveness in Stabilising and Subsidising Rice Supply and Use
The NFA is responsible for managing the country’s public rice stocks. In giving this role to NFA, its
charter assigned it multiple functions including (a) providing farm price supports to rice farmers; (b)
stabilising consumer rice prices; and (c) delivering subsidised rice to targeted beneficiaries.16 It has a
rice import monopoly and sovereign guarantee on all its commercial debt. It regulates rice mills and
logistics companies providing services to the rice industry.17 Conflict of interest situations arise from
these tasks.
4.1 Stabilising rice prices
The NFA carries out its price stabilisation function as follows. Its council sets the target price of rice
or its release price. Among several factors to consider in setting the price are the trend in world
market prices, the impact on the farmgate prices of rice paddy, and the rate of inflation. The release
price is not a ceiling price. The agency’s objective is to keep market rice prices fluctuating moderately
around it. The agency injects rice stocks into the market, particularly during the lean months from July
to September. If the NFA injects substantial rice stocks into the market, then market price is likely to
be closer to the NFA’s release price. The NFA injects its rice through its accredited rice retailers, who
in turn sell rice to consumers.
The NFA maintains buffer stocks dispersed in strategic locations across the country to stabilise rice
prices. The stocks are meant to stabilise supplies in the market, especially during the rice-lean months
and in abnormal situations such as disasters and other emergencies. The NFA aims to respond within
48 hours with the rice requirements and restore within 2 weeks the supply and price of the staple to
its levels immediately prior to the disaster or emergency.
Data from 2000 to 2009 show that NFA held less than its required 30-day stock at the beginning of
July in all but two years. It also held less than its required 15-day stock at the beginning of January in
four years (2005-2008) within the reference period. The deficiency in stock relative to mandated
holdings may be explained by the fact that with improvements in transport systems, the NFA has been
16 The NFA has other functions not necessarily related to managing rice stocks, such as promoting the development of the
rice marketing system or reducing post-harvest rice losses.
17 The NFA has similar functions in the case of corn, but this is not taken up in this study as corn used as food had long been displaced in importance by corn used as feeds. Unlike rice, corn imports can be done by the private sector.
18
counting stocks already contracted for import as compliance with the required holdings. From 2004
to 2007 the NFA was essentially relying on imports for stocks as it had not been buying from, as its
paddy buying price made it uncompetitive in the domestic market.
In terms of shares of total stock, records indicate that NFA generally held an average of 25% at the
beginning of the year from 2000-2010, with the rest in commercial and household rice holdings. The
NFA held an average 36% and at least 19% of total stocks at the start of the lean season in the same
period. Starting in July 2008, the NFA held much higher shares of total stock, reaching as much as 60%
in July 2010.
The NFA releases rice to its market outlets to keep consumer prices affordable. Records show that
NFA distributed some 10% to 17% of rice food requirements from 2000 to 2009. The NFA’s release
price is set lower than the prevailing wholesale rice price. Outlets sell NFA rice to consumers at a price
set by NFA, which is on average 13% lower than average prices for regularly milled rice (RMR) at the
wholesale level. The discount has reached as much as 32%.
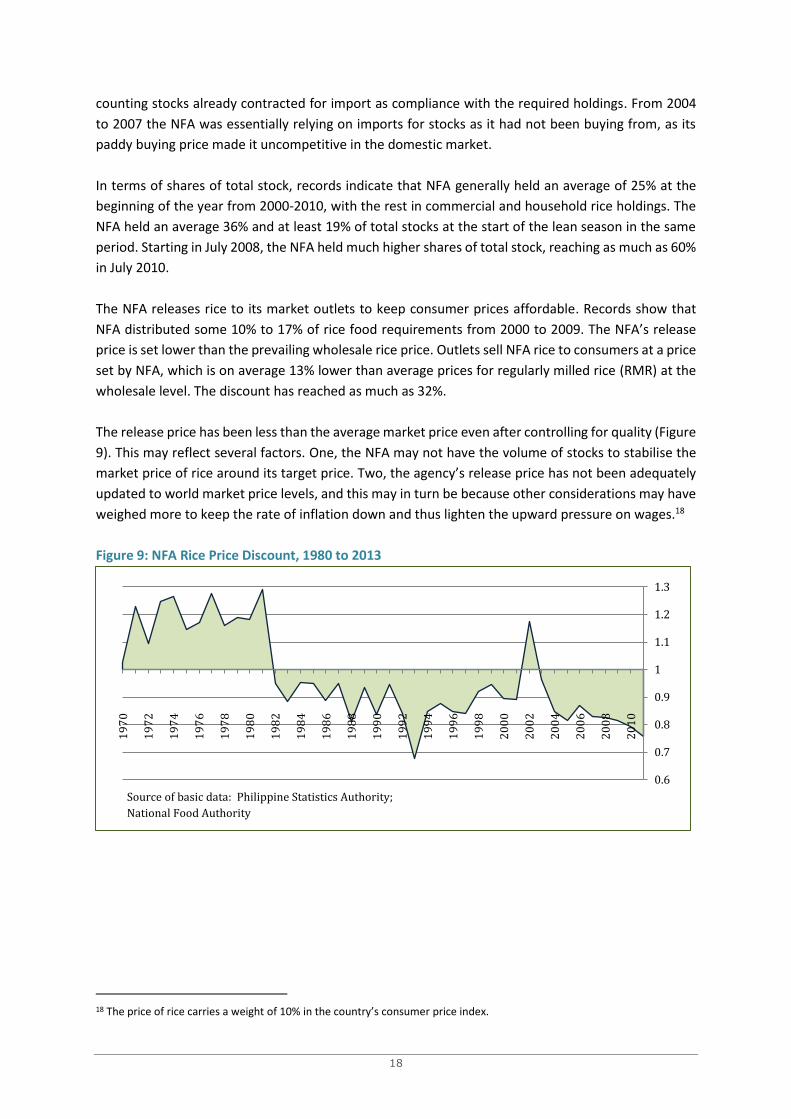
The release price has been less than the average market price even after controlling for quality (Figure
9). This may reflect several factors. One, the NFA may not have the volume of stocks to stabilise the
market price of rice around its target price. Two, the agency’s release price has not been adequately
updated to world market price levels, and this may in turn be because other considerations may have
weighed more to keep the rate of inflation down and thus lighten the upward pressure on wages.18
Figure 9: NFA Rice Price Discount, 1980 to 2013
18 The price of rice carries a weight of 10% in the country’s consumer price index.
0.6
0.7
0.8
0.9
1
1.1
1.2
1.3
19
70
19
72
19
74
19
76
19
78
19
80
19
82
19
84
19
86
19
88
19
90
19
92
19
94
19
96
19
98
20
00
20
02
20
04
20
06
20
08
20
10
Source of basic data: Philippine Statistics Authority; National Food Authority

19
Table 3: NFA Intervention in the Rice Market (thousand MT)
Rice Consumption* Rice Injection NFA's Share
1990 6,425 670 10
1991 5,477 158 3
1992 5,661 521 9
1993 6,533 485 7
1994 6,324 112 2
1995 7,027 257 4
1996 7,654 733 10
1997 7,482 623 8
1998 7,269 1,627 22
1999 7,854 1,372 17
2000 8,050 1,169 15
2001 8,512 813 10
2002 9,201 1,239 13
2003 8,798 1,120 13
2004 9,682 1,342 14
2005 10,515 1,666 16
2006 10,824 1,615 15
2007 11,534 1,883 16
2008 12,431 2,027 16
2009 11,336 1,808 16
2010 11,842 -
Source: National Food Authority
*60% of rice paddy production plus imports
4.2 Farm price support
The NFA buys rice paddy from rice farmers at a price set to allow farmers adequate returns and enough
incentive to continue farming rice. NFA procurement aims to give the farmers an option of last resort
and influence private traders’ buying prices. The farm price is set at approximately half that of the
NFA's selling or release price of rice. The NFA has been able to buy only up to 5% of paddy production
on an annual basis in the last 10 years, while its support price has been within 0.98% to 1.25% of
average farmgate prices. Through its local rice procurement, the NFA sources the rice it would need
to inject into the domestic market to stabilise prices, make rice available to households in areas hit by
disasters, or distribute rice to poor households. This and the purpose of supporting farm prices are
the twin objectives of local rice paddy procurement.
The NFA’s capacity to support farm prices depends on the size of its local rice procurement. Table 4
shows the NFA procurement levels as a percent of production. The procurement level ranges from a
low of 0.1% of local production to as high as 6.1% in 1991. In Figure 10, the line illustrates the size of
this procurement, which varies through the years. In earlier years, say up to the first half of the 1990s,
the NFA farm price premium is significant, but unfortunately this indicates that procurement levels

20
are not big enough as to pull the market price close to the support price. Convergence of the
procurement and farm price would indicate better prices for farmers. Either, market prices are rising
due to rice supply scarcity or the procurement level of the NFA is substantial as to pull farm market
prices towards the official price. But in most observations the premia are large, and there were a few
instances when the market price was even higher than the NFA’s support price. In the former, the
procurement level is inadequate, and in the latter, the NFA had not adjusted the official price.
Figure 10: NFA Farm Price Premia and Procurement Levels, 1980-2013
With low procurement, the NFA had less capacity to pull the market price close to its support price.
In the middle of the 1990s, rice prices spiked. In Figure 10, farm market prices of rice paddy exceeded
the NFA price in 1994-8 and 2004-7. If the NFA procurement price falls below market prices, farmers
would not tend to sell to the NFA, and thus the latter has no stocks to inject into the market to stabilise
rice prices in the lean months. It could import rice, but it did not do so in 1995. Low rice paddy
procurement and the fact that the NFA imported late in 1995 combined to produce the spike of rice
prices in that year.
0
100
200
300
400
500
600
700
800
0.6
0.7
0.8
0.9
1
1.1
1.2
1.3
1.4
19
80
19
81
19
82
19
83
19
84
19
85
19
86
19
87
19
88
19
89
19
90
19
91
19
92
19
93
19
94
19
95
19
96
19
97
19
98
19
99
20
00
20
01
20
02
20
03
20
04
20
05
20
06
20
07
20
08
20
09
20
10
20
11
20
12
20
13
NFA Farm Price Premium
NFA domestic palay procurement
Source of basic data: Philippine Statistics Authority; National Food Authority
'000 MT

21
Table 4: Production and NFA Procurement in Rice Paddy Markets (thousand MT)
Rice Paddy Procurement
Production Rice Paddy % of rice paddy production
1990 9,673 572 5.9
1991 9,129 555 6.1
1992 9,434 420 4.4
1993 10,538 155 1.5
1994 10,541 61 0.6
1995 11,284 8 0.1
1996 11,269 124 1.1
1997 11,269 101 0.9
1998 8,555 62 0.7
1999 11,787 561 4.8
2000 12,389 663 5.4
2001 12,955 474 3.7
2002 13,271 300 2.3
2003 13,500 296 2.2
2004 14,497 208 1.4
2005 14,603 76 0.5
2006 15,327 74 0.5
2007 16,240 33 0.2
2008 16,814 683 4.1
2009 16,265 463 2.8
2010 15,771 487 3.1
Source: National Food Authority
In the 2000s preceding the 2008 rice price crisis, the farm market price once again exceeded the NFA
procurement price, albeit by only a smaller amount compared to 1995. The NFA increased its
procurement price after the crisis after adjusting its release price to conform to the higher world price.
The adjustment attracted many farmers to sell to the NFA, such that the procurement of NFA
increased to 5% of production. Also in this period, the procurement levels of the NFA were low.
Sourcing its rice stocks from local procurement is more costly compared to just importing rice.
Accordingly, the bulk stocks in the 2000s was imported. This changed from 2009 onwards, which is
expected to increase the operations costs of the NFA. The NFA increased its procurement price and
attracted many farmers to sell to it.
That the NFA has not consistently maintained its local procurement levels is not necessarily working
against food security. Giving rice farmer higher incomes with farm price supports ties many farmers
to rice farming when their incomes could be higher by diversifying into other agricultural crops. The
country can import about 10 to 15% of its rice from neighbouring Vietnam or Thailand. In fact, not
importing at all for its buffer stocks under the “self-sufficiency programme” is costlier (Clarete, 2015).
Local rice procurement may actually be poverty worsening, since the poorest of the poor farmers may
have tied their harvest to creditor-traders, and selling to the NFA may no longer an option. The subsidy
may only go to the larger rice farmers, some of whom are also rice traders.

22
4.3 Leakages
Who gets the NFA subsidy? The mandate of the rice retailers is to sell the NFA rice to the public at the
NFA’s release price. Is the total volume of the NFA for price stabilisation purposes released by the
retailers at the NFA’s price? If there were leakages, then that subsidy has accrued to the rice retailers.
And this could also be the reason why the release price falls below the average market price: the
retailers have diverted rice stocks intended for the price stabilisation function.
The NFA’s rice distribution has been criticised for being costly and ineffective in protecting the poor,
and prone to diversion and corruption. Studies show that NFA outlets appear limited in the poorer
regions, restricting access of the poor. Rice prices in poorer provinces have risen faster, indicating
NFA’s inability to temper the market in these areas. Proportionately more poor households consume
NFA rice, but non-poor households buy more NFA rice.
Jah and Mehta (2008) provided interesting insights into the operations of the NFA rice subsidy
programme:
1. Only about 16% of the population had accessed the programme, and they attributed this
performance to high participation costs.
2. Only about 25% of the poor have accessed the NFA rice subsidies, while nearly half of those
who were able to purchase NFA at its official prices are non-poor. The programme leakage is
higher in urban than in rural areas.
3. For every US dollar that NFA provides as rice consumption subsidy, it spent US$2.21, assuming
there was no leakage of programme benefits in 2008 (see Table 5).
Table 5: Philippine Rice Subsidy Cost/Benefit Calculations
Measure Unit 2006 2007 2008
Effective NFA programme cost billion pesos 16.4 18.6 68.6
Maintenance and other operating expenses billion pesos 6.4 1.6 4.2
Less: Net Profit (loss) from sales billion pesos -10 -17 -64.4
Consumer price subsidy = retail price of rice – NFA rice
retail price
pesos/kg 5.6 6.5 12.4
Imputed volume of NFA sales million MT 1.6 1.9 2.5
Total consumer subsidy billion pesos 8.7 12.4 31
Cost-benefit ratio = NFA cost/consumer subsidy 1.89 1.5 2.21
Cost-benefit ratio, assuming 50% leakage 3.77 3.01 4.42
Note: The gross sales and cost of sales not only cover rice but are a close approximation as the bulk of NFA
sales relates to rice.
Source: Jah, S. and Mehta, D. (2008)
While Jah and Mehta cushioned this finding as consistent with what is observed in other countries
(citing UN-ESCAP, 2000), the concern is that programmes such as that by the NFA has been very costly
for the Philippines. Jah and Mehta estimated that the operational cost of the NFA rice subsidy
programme (i.e. price stabilisation and targeted rice distribution programmes) is 2.5% of the Philippine
GDP.

23
Using survey data, the World Bank in its review of the “Filipino Report Card on Pro-Poor Services”
reached similar results (World Bank, 2001). Only 15% of the respondents reported they had bought
NFA rice. The rice bought tended to be of low quality. Proportionally, more poor people bought this
rice compared to upper income classes. However, their absolute number was almost the same as the
non-poor who also reported they purchased NFA rice.
Concluding Observations and Suggestions
Among the dimensions of food security is providing economic access to basic food items. In the
Philippines, the staple food is rice. This paper looks at decades of performance of the National Food
Authority, the government’s arm in managing rice stocks to attain food security. The NFA stabilises
rice prices, distributes rice to the poor at discounted prices, provides price support to rice farmers,
and ensures the country has adequate rice stocks to meet the rice requirement of the population in
normal as well as extreme situations as may be caused by natural hazards such as typhoons, drought,
or earthquakes.
The NFA has all the powers to serve its functions well. It has rice import monopoly. It can recommend
to the President the volume of rice imports needed to ensure food security, and normally what the
NFA recommends the President approves. It is the agency tasked in the first place to read the rice
market situation here and abroad and come up with solutions before the population is subject to food
insecurity. It coordinates with the Department of Agriculture. The Secretary of Agriculture is the
Chairman of the NFA Council. The Department is in charge of local rice production, and has the
resources to increase rice production in step with the rice needs of the population.
The NFA is also given the privilege of borrowing commercially with a national government guarantee
to pay for its operational expenses and the subsidy it gives to poor rice consumers and to rice farmers.
Its financial books had been in the red for several decades already. Its corporate debt that surely it
will no longer be able to pay on its own reached approximately PhP 180 billion. The level of debt had
Department of Finance Secretaries worried, leading to questions as to whether there is a better way
to attain food security that is more cost effective.
This paper went through some of the key indicators to look at the effectiveness of the NFA’s food
security strategy as contemplated by the government half a century ago. Except for a few bumps, rice
prices in the Philippines have been stable. About 95% of the fluctuations in monthly rice prices fall
within ± 5%. There were a few months that did not meet what may be normal, tolerable fluctuations
of the rice price, i.e. those that do not necessarily impair economic access to rice markets, especially
for the poor. One instance was due to human error: the NFA misread the supply and use situation of
the country in 1995. It did not procure nor did it import. Thus, its buffer stocks were not sufficient to
keep rice prices affordable. Rice queues formed, and the Secretary of Agriculture and Chairman of the
NFA was asked to resign.
In 2008, the world market pulled up rice prices everywhere, including those in the Philippines. It came
at a time when buffer stocks were primarily sourced from rice imports, which became very expensive
each week. The Philippines panicked and disturbed the world market even further with its huge

24
tenders for rice imports. It bid for delivery in four months its normal rice imports in one year. Slayton
(2009) stated that this action of the Philippines fuelled the 2008 global rice crisis (Slayton, 2009). It
was human error. In terms of access to rice, Filipinos did not lose out. In that year, rice prices could
have been worse for rice consumers were it not for the timely rice imports of the Philippines.
However, the government imported more than it needed to stabilise rice prices. The NFA’s debt
jumped by billions of pesos as it imported about two million MT of rice at a time when global rice
prices reached their peak. The NFA’s corporate debt hit PhP 179 billion. If Filipinos were not deprived
of rice in 2008, future generations of Filipinos will be deprived of taxpayers’ money to pay for the
corporate debt of the NFA. This mistake raises the perennial question whether the Philippines’ food
security programme is cost effective.
Farm price supports for rice farmers have not been a major part of the buffer stocks that the NFA uses
to stabilise rice. Subsidising rice farmers but not other farmers encourages resource owners and
farmers to stay in rice. But rice farming is one of the lowest net income earners in agriculture. If most
farm households are into rice farming, the government is keeping them below the poverty line.
This is the dilemma. If the government wants to increase rice farmers’ income it has to make good its
farm price supports by increasing its procurement level as a percent of production. But this is a
logistical mess. A recent example of the difficulties of this approach is the paddy pledging programme
of the previous Thai government. Thailand lost half of its export earnings because of that mistake. In
the Philippines case, it needs the stocks to support about 30 days or a third of the rice requirement
during the lean third quarter of the year, and a stand by 15 days of rice requirement each period at
any time of the year for disasters. That amount will not require a large amount of procurement. The
idea of combining procurement and poverty eradication for rice farmers is simply a misguided
development policy peddled by those who stand to gain most if the NFA increased its farm price
support premium backed by more financial resources.
In addition, the targeted rice subsidy for the poor is full of leaks. Studies by the World Bank and Asian
Development Bank indicate most of the subsidies do not go to the poor. Not only that, to deliver a
peso of subsidy to the poor entails a cost of about two to four pesos. It would be much more cost
effective if the subsidy was not delivered in the form of rice but in money deposited to the bank
account of rice farmers such as the government’s current programme on conditional cash transfers.
25
5.1 Rice price band
One idea suggested by this paper is a rice price band. While commodity price stabilisation schemes
elsewhere are normally supported with publicly held buffer stocks that are locally procured, the
proposed scheme uses rice
imports. Accordingly, it has the
potential to make the rice price
stabilisation programme in the
Philippines more cost-effective.
Rice prices fluctuate over time,
responding to changes in
fundamentals mostly affecting
the supply of rice. Normally,
these price fluctuations do not
create economic and political
problems. But to ensure that,
the Philippine government
maintains rice buffer stocks to
keep price fluctuations within
an acceptable range. Since the
1970s, the NFA has maintained
warehouses at strategic places,
bought rice during the main
harvest, and released the rice
stocks during the lean third
quarter of the year.
In stabilising rice prices, one needs to consider both intra-year and inter-year variations. The former
refers to seasonal variations, while the latter captures abnormal shocks to the rice economy, including
occurrences of drought, other natural hazards affecting rice production, and policy shocks, that have
multi-year repercussions. Intra-year variations tend to be predictable, while inter year variations
generally are not (Islam and Thomas, 1993).19
One measure of intra-year price instability is the percentage deviation of monthly wholesale prices
from their 3-month moving average. The other type of price instability is inter-year variability of
monthly wholesale prices from their levels a year ago. The latter tends to display more randomness
and is larger compared to the intra-year variability. It is important to note that despite the El Nino
weather phenomenon in 1997 and 1998, annual wholesale prices of rice either declined or increased
moderately, reflecting the role of imported rice stocks in offsetting local supply shortages.
19 However, we note the increasing availability of early warning systems that utilise increasingly sophisticated forecasting of
hazards like drought, flooding, etc that can provide the basis for forecast-based early action. See, for example, FAO: Early Warning Early Action.
Box 1: Government policy on rice tariffs
The government has pursued a self-sufficiency policy in rice, allowing
only the National Food Authority (NFA) to import rice as a last resort.
Under this regime, rice prices tend to fluctuate more, compared to if
rice imports by private traders at fixed and reasonable customs duties
were allowed.
However, pressed to act on rising inflation attributable to higher rice
prices in 2018 because of the NFA’s failure to import rice on time, the
Philippine Congress enacted the rice tariffication law. It removes the
NFA’s monopoly on rice imports, and replaces it with a tiered tariff:
maximum of 35% on imports coming from ASEAN; 40% on imports
covered by a quota on rice imports from other members of the WTO;
and 180% for rice imports outside this quota. The quota is 350,000 MT.
The move also implements the country’s rice tariff commitment to the
WTO. The country lost its rice waiver on 30 June 2017, and therefore
must abide by its obligation under the WTO’s Agreement on
Agriculture to tariff the quantitative import restrictions on rice to tariff
rate.
President Duterte signed the bill in February 2019. Thus, the drafting
of the implementing rules and regulations of the law may become the
next policy battle ground of both sides of the country’s import rice
policy.

26
A price band for rice is a range of wholesale prices of rice that the population is deemed to tolerate,
i.e. prices in this range do not require any substantive reallocation of household budgets. Accordingly,
there are no major spillovers of rice price changes to the rest of the economy. Rice price fluctuations
are socially tolerated if these do not lead to sustained and widespread dissatisfaction with such price
movements from a group or groups of stakeholders. The discontent is readily observable in the media.
It is possible that a government official will be forced to resign because of the social tensions arising
from changes in rice prices.
Formally, the price band of wholesale prices of rice, 𝑝𝑅 , is set such that actual market prices of rice
are in this set. That is, 𝑝𝑇(1−∝) ≤ 𝑝𝑅 ≤ 𝑝𝑇(1+∝). ∝ is the largest tolerated proportionate deviation
in absolute value terms of wholesale prices from the target price of rice, 𝑝𝑇. The target price is pegged
to the world price of rice, 𝑝𝑇 = 𝑒𝑝𝑊(1 + 𝜏). This linkage is to take advantage of the relatively higher
stability of world rice prices. The exchange rate, 𝑒, may introduce instability, a matter that may be
dealt with by making the statutory tariff, 𝜏 , variable.
Changes in the target price may exceed expectations by the millions of households in the country. The
issue at hand is inter-period variability. Even if we confine fluctuations of rice prices within the price
band, changes in the level of the target price and thus the price band of prices may pose a major
problem. An appropriate width of the price band is one that addresses the intra-period variability.
That is, we confine the range of deviations of actual prices from some norm, which is the target price
in this case, to one that the population is prepared to tolerate.
To cope with the problem of inter-period variability, statutory tariff protection may be adjusted to
compensate for autonomous changes in world prices, the exchange rate, or the cost of items that have
something to do with bringing the imported stock into the country and keeping inter-period variability
within a tolerable range. Trade protection for farmers is reduced when either world prices or the
exchange rate goes up in order to keep the inter-period changes of target prices within the accepted
range of no more than 10% in absolute value terms.
How consistent would this be with the WTO? Variable levy is not allowed under the WTO, but the
nature of the changes given the ceiling binding commitments of developing countries like the
Philippines is legally acceptable. Under this, a developing WTO member country may reduce its duty
on rice imports any time it wants. What it is not allowed is to raise its tariff above its tariff binding in
rice.
5.2 Tariffying the Rice Quantitative Restriction
The government, upon the recommendation of an inter-agency technical working group (TWG) made
up of the National Food Authority (NFA), the Department of Agriculture, and the Bureau of Agricultural
Statistics determines the size of the annual rice quota. The quantity differs upon such variables as the
expected local production, beginning inventories, target ending stocks, consumption, and other uses
of rice. The amount varies year after year.
If the TWG underestimates the import quota required to meet use requirements, then the rice prices
would sharply rise to levels that may no longer be affordable to lower income households. This

27
happened in 1995, when the TWG over-estimated the local output of rice, and recommended that the
country did not need to import rice at all. Eventually, the government decided to import, but that
decision was incapable of preventing the rice crisis of that year. Since many of the poor, particularly
those nearer the NFA warehouses, could no longer afford to purchase their usual rice requirements,
a queue on cheaper NFA rice developed, which embarrassed the government.
The TWG could likewise err on the other side, and recommend a relatively large import quota. This
happened in 2008. Faced with a global rice price crisis in the first four months of that year (see Figure
2), the TWG decided on an unusually large quota. The country imported in that year 2.4 million MT of
rice, at a time when there was hardly an imbalance in the demand and supply of local rice. The result
was that rice stocks swelled, some of which were reported to have rotted in the NFA warehouses in
two years. The TWG’s concern at that time was to make sure local rice prices would not shoot up in
tandem with world market rice prices. It accomplished that objective, but at a very high cost. Based
on its financial statements, the NFA that year had a net operating loss of PhP 36.7 billion, up from PhP
11 billion in 2006 and PhP 5 billion in 2007.
A flaw of the current policy regime of quantitative restriction (QR) to rice imports is that it is the
government that makes the decision for the entire country. The likelihood is high that an erroneous
assessment of the rice production or stocks, or of the trend in world rice prices, by the government
drags the local rice market to larger inefficiencies, compared to a situation when those who can import
rice are many. While private importers do make mistakes in their businesses, the chance that they
will collectively make mistakes simultaneously is relatively low. More importantly, the adverse effect
of their mistakes is spread out and may tend to be offset by the positive effect of the accurate
decisions of other private traders.
Additionally, conferring the NFA the monopoly to import the country’s rice requirements exposes the
country to the risk of having to pay so much for a mistake. As mentioned above, the NFA imported an
unprecedented and unnecessarily large volume of rice in just a period of four months in 2008, which
sharply increased world rice prices, and thus pushed up the cost of imported rice. Not only did the
Philippines purchased a large volume of rice, it did so when world prices were very high.
Before the 2000s, the Philippines was like Indonesia today. Following its Food Law in October 2012,
Indonesia imports rice as a last resort.20 Indonesia’s local rice procurement ratio has been higher,
compared to its sales of imported rice in the local rice market. The Philippines before the 2000s had
been cautious about its decisions on the quantity of rice it needed to import. Rice importation would
appear in public to be an admission that the government had failed in its programme of increasing
local rice production. This view, not just of those in government but even the public, moulded the rice
crisis in 1995. Officials hung onto the idea that they had adequate local production and there was no
need to import rice at all. Thus, when the government realised it made a mistake of overestimating
local production, its decision to correct that by importing rice was too late. The country already had a
rice crisis.
20 An unofficial translation of this law may be read at http://usdaindonesia.org/wp-content/uploads/2012/11/DPR-FOOD-
REGULATION-final.pdf. Food imports are taken up in Article 26, Part V of the law.
28
Because of this decision, and partly because of the 1997 El Niño dry spell, the government shifted to
relying on rice imports to secure an adequate supply of rice in the country at any time. Since that time,
and particularly during the 9-year regime of the Arroyo government, rice imports dominated the NFA’s
rice procurement. But this trend of rising import share can be attributed to the way the government
determines how much to import.
The TWG determines the size of the import quota using the ‘disappearance method’ of estimating
local consumption. The approach proceeds from the supply utilisation equation as follows. In any
given year, the available supply of rice for consumption comes from local production (Q), imports (M),
and beginning rice stocks (𝑆𝑏). On the demand side, rice is used for seeds (Sd), waste and animal use
(W), exports (X), if any, processed into rice-based products (Pr), stored (𝑆𝑒), and consumed (C) as food.
The NFA has information on all these variables, and computes C as the residual. It has fixed target
storage in a given year, which is about a third of the country’s consumption of rice during the rice lean
third quarter of the year, plus provisions for any emergencies due to disasters. Particularly, 𝐶 = 𝑆𝑒 +
𝑊 + 𝑋 + 𝑃𝑟 + 𝑆𝑒 − 𝑄 − 𝑀 − 𝑆𝑏.
The problem with this approach is that it sustains a process of increasing rice imports. In any given
year, per capita consumption using the disappearance method is 𝐶/𝑃𝑜𝑝, the denominator being the
population. When the NFA using its QR powers determines how much to import in the following year,
it now uses the following equation: 𝑀 = 𝑃𝑜𝑝 ∗𝐶
𝑃𝑜𝑝+ 𝑆𝑑 + 𝑊 + 𝑋 + 𝑃𝑟 + 𝑆𝑒 − 𝑄 − 𝑆𝑏.
The mechanism has a built-in capacity of carrying forward an error on the amount of imports. Let
there be an exogenous increase in M in any given year for whatever reason. The spike of M results in
a corresponding increase in C, which in turn requires a higher M in the following year, then a higher
C, and on and on. This feature may help explain why in the 2000s, the country tended to import rice
at an increasing amount each year.
Annex 5 of the WTO Agreement on Agriculture prescribes how contracting parties ought to compute
the tariff equivalent rate of the rice QR. The tariff equivalent rate is the percentage difference
between the local wholesale price of rice from its cost of insurance and freight (CIF) price at the
border. Quality adjustment may be made if the imported rice differs in quality from what is locally
grown. The estimation uses average data of these quantities in the base period from 1986 to 1988.
Foreign currency price may be converted to local currency using the average exchange rate of local to
foreign currency. The calculation is done at the most disaggregated harmonised system level of the
commodity. The country imports milled rice with 15% broken, which is classified as HS 10064000 in
the harmonised system nomenclature.
Table 6 shows the estimated annual tariff equivalent rates of the rice QR using the above formula from
1980 to 2012. The rates range from -32.94% to 92%. The tariff rate equivalent rates are mostly positive
except in the early 1980s when the country was exporting rice. The highest rate of 92% in 1996 may
be explained by a miscalculation of the import requirement in 1995. The Department of Agriculture
overestimated the local harvest of rice in 1995, which highlights one pitfall of retaining the QR and
giving this function to a central procuring body in government. The effect of the mistake may have
carried into 1996.

29
In the last column of Table 6 is a three-year moving average of the tariff equivalent rate of the rice QR.
The three-year average is selected following WTO guidelines. Thus, in the baseline period from 1986
to 1988, the average tariff equivalent rate is 35.82%.
The baseline period is not representative of Philippine conditions at the time this exercise of
estimating the tariff equivalent rate of the QR took place. A few years before this period, the
Philippines has succeeded to gain net exports in rice. The country was then recovering from a major
political shake up and economic crisis. Two alternative periods may be considered and these are (a)
the period just before the end of the original special treatment (2002 to 2004) and (b) the period just
before the close of the extended special treatment, 2010 to 2012.
Table 6 shows the moving averages of the tariff equivalent rate from the 1960s to 2012. The moving
average of the latter two periods, with the respective average rates of 47.73% and 47.4%, may fit
better the situation of the country as one of the world’s largest rice importers. Under paragraph 6 of
the Attachment to Annex 5 of the WTO Agreement on Agriculture, a contracting party may offer an
alternative tariff rate, where the tariff equivalent rate computed using the guidelines may be
inappropriate.
The Philippines is very likely to source its rice imports from within ASEAN. As a contracting party to
the ASEAN Trade in Goods Agreement, which provides for preferential tariff rates on goods, the
Philippines imposes the preferential tariff rate on rice from ASEAN at 35%.
A two-tier tariff structure may be considered whereby the most favoured nation rate, which applies
to rice imports coming from non-ASEAN countries, is set at a higher rate, say 50%. Rice coming from
ASEAN carries the lower preferential tariff rate, which reflects the preferential nature of the ASEAN
Trade in Goods Agreement. But there is a more important reason for keeping this rate low. That is, to
reduce the incentive to smuggle rice into the country. In recent years, undocumented rice imports
have been reported in the media, some of which had been confiscated by customs or coast guard
authorities. The more informed in the rice trading business place this volume of smuggled imports at
500,000 MT.
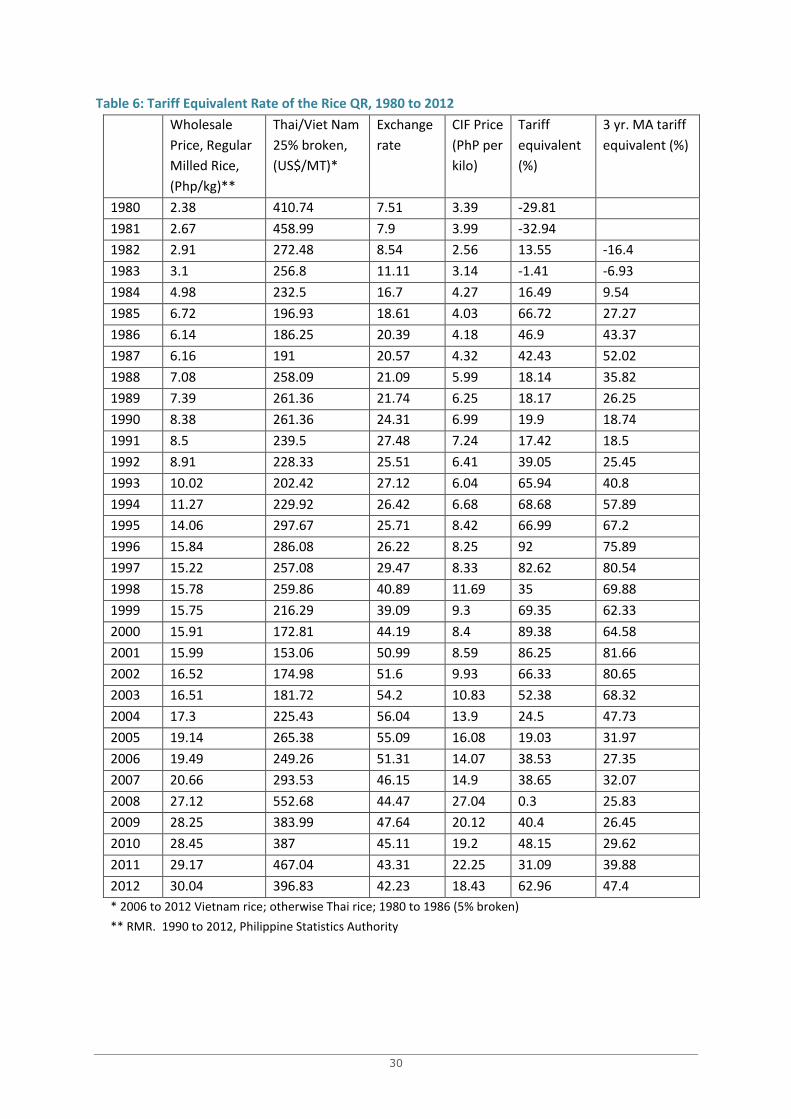
30
Table 6: Tariff Equivalent Rate of the Rice QR, 1980 to 2012
Wholesale
Price, Regular
Milled Rice,
(Php/kg)**
Thai/Viet Nam
25% broken,
(US$/MT)*
Exchange
rate
CIF Price
(PhP per
kilo)
Tariff
equivalent
(%)
3 yr. MA tariff
equivalent (%)
1980 2.38 410.74 7.51 3.39 -29.81
1981 2.67 458.99 7.9 3.99 -32.94
1982 2.91 272.48 8.54 2.56 13.55 -16.4
1983 3.1 256.8 11.11 3.14 -1.41 -6.93
1984 4.98 232.5 16.7 4.27 16.49 9.54
1985 6.72 196.93 18.61 4.03 66.72 27.27
1986 6.14 186.25 20.39 4.18 46.9 43.37
1987 6.16 191 20.57 4.32 42.43 52.02
1988 7.08 258.09 21.09 5.99 18.14 35.82
1989 7.39 261.36 21.74 6.25 18.17 26.25
1990 8.38 261.36 24.31 6.99 19.9 18.74
1991 8.5 239.5 27.48 7.24 17.42 18.5
1992 8.91 228.33 25.51 6.41 39.05 25.45
1993 10.02 202.42 27.12 6.04 65.94 40.8
1994 11.27 229.92 26.42 6.68 68.68 57.89
1995 14.06 297.67 25.71 8.42 66.99 67.2
1996 15.84 286.08 26.22 8.25 92 75.89
1997 15.22 257.08 29.47 8.33 82.62 80.54
1998 15.78 259.86 40.89 11.69 35 69.88
1999 15.75 216.29 39.09 9.3 69.35 62.33
2000 15.91 172.81 44.19 8.4 89.38 64.58
2001 15.99 153.06 50.99 8.59 86.25 81.66
2002 16.52 174.98 51.6 9.93 66.33 80.65
2003 16.51 181.72 54.2 10.83 52.38 68.32
2004 17.3 225.43 56.04 13.9 24.5 47.73
2005 19.14 265.38 55.09 16.08 19.03 31.97
2006 19.49 249.26 51.31 14.07 38.53 27.35
2007 20.66 293.53 46.15 14.9 38.65 32.07
2008 27.12 552.68 44.47 27.04 0.3 25.83
2009 28.25 383.99 47.64 20.12 40.4 26.45
2010 28.45 387 45.11 19.2 48.15 29.62
2011 29.17 467.04 43.31 22.25 31.09 39.88
2012 30.04 396.83 42.23 18.43 62.96 47.4
* 2006 to 2012 Vietnam rice; otherwise Thai rice; 1980 to 1986 (5% broken)
** RMR. 1990 to 2012, Philippine Statistics Authority

31
References
Arkadie, B., et al., 1991. "Study on Foodcrop Policies, The Philippines,” Report to the Asian Development Bank and the
Department of Agriculture.
Clarete, R. 2015. “Philipine Rice Self-Sufficiency Program: Pitfalls and Remedies, Ch. 19. in Balisacan, A., Chakravorty,
U, Ravago, M. (eds.) (2015). Sustainable Economic Development – Resources, Environment and Institutions.
Elsevier
Clarete, R, R. Fabre, C. Balbosa, and E. Castro, 1992, “Securing Food Security: Performance Assessment and Future
Directions of the NFA.” Report submitted to USAID and the Department of Agriculture (ASAP).
Clarete, R., et al., 1998, “Grains Sector Development Program” Report to the Asian Development Bank and the
Department of Agriculture (TA 2717-PHI).
Clarete, R. et. al., 2000. Strategic Reorganization of the National Food Authority for the Next Millennium. Report to
the National Food Authority and USAID.
Dawe, D. and P. Timmer, 1991, Rice Price Stabilization: Contrasting Experiences in the Philippines and Indonesia.
Agricultural Policy Project II Research Report No. 339. Cambridge, Mass., U.S.A.: Harvard Institute for
International Development, Harvard University.
GMA News, “Aquino: Rice rotted in NFA warehouses”, July 26, 2010. In
http://www.gmanetwork.com/news/story/197016/economy/aquino-rice-rotted-in-nfa-warehouse.
Accessed March 30, 2013.
Islam, N. and S. Thomas, 1996, Foodgrain Price Stabilization in Developing Countries: Issues and Experiences in Asia.
Food Policy Review, 3, Washington, D.C.: International Food Policy Research Institute.
Bouis, Howarth, 1991, "Food Demand Elasticities by Income Group by Urban and Rural Populations for the
Philippines." Washington, D.C.: International Food Policy Research Institute.
Jha Shikha and Aashish Mehta. 2008. Effectiveness of Public Spending: The Case of Rice Subsidies in the Philippines.
ADB Economics Working Paper Series No. 138. ADB. Metro Manila
Kanbur, S.M.R., 1984, “How to Analyze Commodity Price Stabilization: A review Article”. Oxford Economic Papers
36(3):336-453.
Pinckney, T.C., 1988, Storage, trade and price policy under production instability: Maize in Kenya. Research Report 71.
Washington, D.C: International Food Policy Research Institute.
Roumasset, James A. (2000, April). Black‐Hole Security. University of Hawaii at Manoa, Department of Economics.
Roumasset, James A. (1999) “Market Friendly Food Security: Alternatives for Restructuring NFA.” Unpublished report
commissioned by the USAID-supported AGILE project for the NFA.
Slayton, T. (2009). "Rice Crisis Forensics: How Asian Governments Carelessly Set the World Rice Market on Fire".
Working Paper Number 163. Washington, DC: Center for Global Development.
Timmer, CP. (2008). “Causes of High Food Prices”. In: Asian Development Bank, Asian Development Outlook 2008
Update. Manila, Philippines: ADB. pp. 73 – 93.
Umali, D. “The Structure and Price Performance of the Philippine Rice Marketing System.” Standford University, Ph.D.
Dissertation, 1990.
World Bank. 2001. Philippines: Filipino Report Card on Pro-Poor Services. Report No. 22181-PH, Washington, DC.