Annual Report State-owned companies 2014 - Government.se
134
Annual report state-owned companies This annual report can be ordered via: www.regeringen.se Article number: N2015.35 www.regeringen.se Annual Report State-owned companies 2014 Contents 3 Financial overview 4 Foreword 6 Events in brief 11 Active ownership 14 Company case – Swedavia 18 Company case – Svevia 20 Nominations to company boards 25 Targets and follow-up 26 Financial targets 28 Facts – The important role of the cost of capital 32 Sustainable business 35 Company case – Bilprovningen 37 Company case – Infranord 38 Public policy targets 40 Company case – SEK 42 Remuneration and other terms of employment 44 State-owned company portfolio 47 Valuation of the company portfolio 48 Publicly traded holdings 49 How the state’s finances are affected by company divestments and dividends 50 Companies 51 Akademiska Hus 52 Almi Företagspartner 53 APL (Apotek Produktion & Laboratorier) 54 Apoteket 55 Apoteksgruppen 56 Arlandabanan Infrastructure 57 Bilprovningen 58 Bostadsgaranti 59 Dom Shvetsii 60 Dramaten 61 ESS (European Spallation Source) 62 Fouriertransform 63 Green Cargo 64 Göta kanalbolag 65 Infranord 66 Inlandsinnovation 67 Jernhusen 68 Lernia 69 LKAB 70 Metria 71 Miljömärkning Sverige 72 Operan 73 Orio 74 PostNord 75 RISE 76 Samhall 77 SAS 78 SBAB 79 SEK 80 SJ 81 SOS Alarm 82 Specialfastigheter 83 SSC (Svenska rymdaktiebolaget) 84 Statens Bostadsomvandling 85 Sveaskog 86 Svedab 87 Svenska Skeppshypotek 88 Svenska Spel 89 Svevia 90 Swedavia 91 Swedesurvey 92 Swedfund 93 Systembolaget 94 TeliaSonera 95 Teracom Boxer Group 96 Vasallen 97 Vattenfall 98 VisitSweden 99 Voksenåsen 100 Other companies and operations 101 Liquidated companies and companies under liquidation 102 State ownership in modern times 106 Accounting principles 107 Definitions and abbreviations 108 State-owned companies in figures 110 List of Government Bills 112 Changes in executive management and boards 114 Board members elected by the Annual General Meeting 121 Companies’ reporting dates 122 The State’s Ownership Policy 2015 126 Guidelines for external reporting 128 Guidelines for terms of employment for senior executives 129 Management responsibility for state-owned companies 131 Addresses 2014
-
Upload
khangminh22 -
Category
Documents
-
view
3 -
download
0
Transcript of Annual Report State-owned companies 2014 - Government.se

Annual report state-owned companiesThis annual report can be ordered via:
www.regeringen.se
Article number: N2015.35
www.regeringen.se
An
nu
al R
ep
ort S
tate
-ow
ned
com
pan
ies 2
01
4
Contents
3 Financial overview
4 Foreword
6 Events in brief
11 Active ownership
14 Company case – Swedavia
18 Company case – Svevia
20 Nominations to company boards
25 Targets and follow-up
26 Financial targets
28 Facts – The important role of the cost
of capital
32 Sustainable business
35 Company case – Bilprovningen
37 Company case – Infranord
38 Public policy targets
40 Company case – SEK
42 Remuneration and other
terms of employment
44 State-owned company portfolio
47 Valuation of the company portfolio
48 Publicly traded holdings
49 How the state’s finances are affected by
company divestments and dividends
50 Companies
51 Akademiska Hus
52 Almi Företagspartner
53 APL (Apotek Produktion & Laboratorier)
54 Apoteket
55 Apoteksgruppen
56 Arlandabanan Infrastructure
57 Bilprovningen
58 Bostadsgaranti
59 Dom Shvetsii
60 Dramaten
61 ESS (European Spallation Source)
62 Fouriertransform
63 Green Cargo
64 Göta kanalbolag
65 Infranord
66 Inlandsinnovation
67 Jernhusen
68 Lernia
69 LKAB
70 Metria
71 Miljömärkning Sverige
72 Operan
73 Orio
74 PostNord
75 RISE
76 Samhall
77 SAS
78 SBAB
79 SEK
80 SJ
81 SOS Alarm
82 Specialfastigheter
83 SSC (Svenska rymdaktiebolaget)
84 Statens Bostadsomvandling
85 Sveaskog
86 Svedab
87 Svenska Skeppshypotek
88 Svenska Spel
89 Svevia
90 Swedavia
91 Swedesurvey
92 Swedfund
93 Systembolaget
94 TeliaSonera
95 Teracom Boxer Group
96 Vasallen
97 Vattenfall
98 VisitSweden
99 Voksenåsen
100 Other companies and operations
101 Liquidated companies and companies
under liquidation
102 State ownership in modern times
106 Accounting principles
107 Definitions and abbreviations
108 State-owned companies in figures
110 List of Government Bills
112 Changes in executive management
and boards
114 Board members elected by the Annual
General Meeting
121 Companies’ reporting dates
122 The State’s Ownership Policy 2015
126 Guidelines for external reporting
128 Guidelines for terms of employment
for senior executives
129 Management responsibility
for state-owned companies
131 Addresses
2014

OAO Dom Shvetsii
Miljömärkning Sverige
OAO Dom Shvetsii
Miljömärkning Sverige
The Government has been commissioned by the Riksdag to acti-
vely manage the state’s assets. The Government Offices and the
various ministries assist the Government in its work and manage
49 companies: 41 wholly owned and 8 partly owned.
Corporate governance is exercised primarily through the board
nomination process at Annual General Meetings, in accordance
with the State’s Ownership Policy, including its guidelines, and by
means of efficient capital structure. The companies are followed
up and assessed through analyses and different types of reports
from the companies. Targets beyond the generation of financial
value are also assessed.
Within the Ministry of Enterprise and Innovation, there is a
specialised investment management organisation that is divided
into two divisions. These are responsible for the development and
coordin ation of corporate governance at the Government Offices
and for the active ownership of 41 of the companies. The responsi-
bility for the remaining, of the total 49 companies, lies with other
ministries.
The state-owned companies act as good examples in having a high proportion of women on their boards and now also chairing the boards. Including
chairpersons, 49 per cent of the board members in companies wholly-owned by the state are women. Among the publicly traded companies, the
proportion of women board members is 29 per cent according to SIS Ägarservice. The Government’s target is for there to be at least 40 per cent of each
gender on each board. In the state-owned companies, no fewer than 46 per cent of chairpersons are women, compared with 41 per cent last year and
23 per cent in 2006. Among the publicly traded companies, the proportion of women chairpersons is only 5 per cent according to SIS Ägarservice.
In total, slightly more than 163,000 people are employed
by the state-owned companies, including the associated
companies. The companies that are wholly owned by the
state have about 125,000 employees.
The companies that are wholly or partly owned by the state
have a total of 343 board members, including chairpersons.
There are 283 board members in the companies wholly
owned by the state.
Gender balance
Number of employeesNumber of board membersHow the state-owned companies are governed
Chairman of the BoardBoard members
46%
163,000343
49%
The Riksdag
The Government
The Government Offices
Division for State-owned
Enterprises
Division for Corporate
Governance and Analysis
Ministry of Enterprise
and Innovation
Division for Innovation
and State-owned
Companies
Other ministries
responsible for
companies
ORGANISATION
The Annual Report has been produced by the Ministry of Enterprise and Innovation in cooperation with Grayling.
Photo: cover Mats Engfors/Lernia, Cecilia Larsson/imagebank.sweden.se, Niclas Albinsson/Göta kanalbolag,
Mattias Forsberg/Sveaskog, Specialfastigheter, SAS p. 5 Kristian Pohl/Government Offices, p. 7 (watering can) Mostphotos,
p. 8 (Rosetta) ESA, p. 41 (containers) Mostphotos, p. 102 (lunar landing) Nasa, p. 104 (mobile phone) iStockphoto,
p. 105 (car) Mostphotos.
Other photos were provided by the companies included in the Annual Report, unless stated otherwise adjacent to the photo.
Repro and print: EO Grafiska 2015.
VALUATION OF PORTFOLIO OF STATE-OWNED COMPANIES1)
SEK billion
1) Value as per 31 December.2) Decreased ownership in Nordea Bank.
0
150
300
450
600
750
2011 2013 201420122) 2)
The state-owned companies represent considerable value. The combined
value of the state-owned company portfolio – which is owned jointly by
the people of Sweden – is calculated at SEK 460 billion. Read more on
pages 44–47.
BASIC MATERIALS/ENERGY: Ersättningsmark, LKAB, Orio, Sveaskog, Vatten-
fall TELECOM: TeliaSonera SERVICE: APL, Bilprovningen, Lernia, Metria,
Miljömärkning Sverige, Samhall, SOS Alarm, Svenska Spel, Swedesurvey
REAL ESTATE: Akademiska Hus, Jernhusen, Specialfastigheter, Statens
bostadsomvandling, Svedab, Vasallen FINANCIALS: Almi Företagspartner,
Bostadsgaranti, Fouriertransform, Inlandsinnovation, RISE, SBAB, SEK,
Svenska Skeppshypotek, Swedfund CONSUMER GOODS: Apoteket, Apoteks-
gruppen, Systembolaget INFRASTRUCTURE: Arlandabanan, Göta kanalbolag,
Infranord, SSC, Svevia, Swedavia, Teracom Boxer Group TRANSPORT: Green
Cargo, PostNord, SAS, SJ OTHERS: Dramaten, ESS, Operan, VisitSweden
Estimated value
460 billion
BREAKDOWN BY SECTOR
Basic materials/Energy 32 %
Telecommunication 18 %
Infrastructure 3 %
Financials 10 %
Service 17 %
Consumer goods 5 %
Real estate 12 %
Transport 3 %

1ANNUAL REPORT STATE-OWNED COMPANIES 2014 1ANNUAL REPORT STATE-OWNED COMPANIES 2014
In 2014, net turnover for the wholly state-owned companies and their subsidiaries decreased by 2.2 per cent to SEK 350 billion. Including
associated companies, net turnover in 2014 was SEK 397 billion, which also represented a decrease of 2.2 per cent.
Net turnover
SEK 350 SEK 397billion billion
Wholly-owned companies and subsidiaries
Dividend
Including associated companies
The state-owned companies make a significant contribution to the
state treasury. For the 2014 fiscal year, the state’s dividends increased
by 1.9 per cent to SEK 18.1 billion. Read more on pages 44-46.
Dividends and profit
SEK 18.1 billion
Profit
SEK 16.5 billion
Combined net profit for 2014 was SEK 16.5 billion, an
increase of almost 15.9 per cent.
NET PROFIT FOR JAN–DEC 2014 (SEK MILLION), COMPANIES WITH THE GREATEST IMPACT
ON EARNINGS
–15,000 –10,000 –5,000 0 5,000 10,000 15,000 20,000
Vattenfall
Akademiska Hus
Svenska Spel
Sveaskog
TeliaSonera
Specialfastigheter
SEK
Other
TOTAL
–8,284
5,817
5,215
4,763
1,691
1,390
1,260
4,671
16,523

2 ANNUAL REPORT STATE-OWNED COMPANIES 2014
The state is a significant company owner in
Sweden. The state-owned company port folio
includes 49 wholly and partly owned com-
panies, of which two are listed. The state bears
a substantial responsibility to be an active and
professional owner. For the government,
the overall objective is for the companies to
generate value and, where relevant, to
ensure that public policy assignments are
executed well.

3ANNUAL REPORT STATE-OWNED COMPANIES 2014
Financial overviewSTATE-OWNED COMPANIES, TOTAL
SEK billion 2014 2013 Change, %
Net turnover 350.1 357.8 –2.2
Net turnover, including associated companies 396.5 405.4 –2.2
Profit before changes in value 23.0 24.9 –7.5
Changes in value 5.0 2.1 136.1
Operating profit (EBIT) 28.1 27.0 3.8
Profit before tax 20.6 17.3 19.4
Net profit 16.5 14.3 15.9
Gross investments 47.5 52.8 –10.0
Cash flow from operating activities (excluding SEK and SBAB) 65.2 65.0 0.3
Total equity 363.8 358.7 1.4
Total assets 1,539.4 1,489.0 3.4
Number of employees, excluding associated companies (thousands) 125.11) 128.61) –2.7
Number of employees, including associated companies (thousands) 163.32) 168.92) –3.4
Dividend 18.1 17.7 1.9
Estimated value 460 500 –8.0
Return on equity (%) 4.8 4.0
Equity/assets ratio (%) 23.6 24.1
1) Of whom women accounted for 34 (34) per cent and men for 66 (66) per cent.
2) Of whom women accounted for 36 (36) per cent and men for 64 (64) per cent.
NET TURNOVER
SEK billion
RETURN ON EQUITY
%
PROFIT BEFORE TAX
SEK billion
NUMBER OF EMPLOYEES
Thousands
GROSS INVESTMENTS
SEK billion
MARKET VALUE
SEK billion
2012 2013 20140
100
200
300
400
500
2012 2013 20140
5
10
15
20
25
2012 2013 20140
20
40
60
80
100
2012 2013 20140
30
60
90
120
150
2012 2013 20140
20
40
60
80
100
2012 2013 20140
200
400
600
800

4 ANNUAL REPORT STATE-OWNED COMPANIES 2014
FOREWORD
Although turnover decreased in 2014, the profitability of the state-owned companies improved
The state-owned companies are owned collectively by the Swedish
people and are therefore an important asset for the entire country.
Governing the state-owned companies is a task that imposes considerable responsibility, that must be performed in an active and professional manner with value creation as an overarching objective. This means that the companies must act efficiently, profitably and long term, and should be given opportunities for development. Most of the companies operate in competitive markets. Accordingly, it is particularly important that they be subject to market requirements to ensure that competition is conducted on equal terms between publicly and privately owned companies.
Being responsible for ownership issues, I consider ensuring the public’s confidence in the state-owned companies to be one of my most important tasks. Key words in the management of the state-owned companies are openness, active ownership, profes-sionalism and good order. Ultimately, the companies are owned by the Swedish people which demands transparancy and profes-sional accounting. In addition to accounting legislation and
In 2014, the profitability in the state-owned companies strengthened. Improved profits for Akademiska Hus,
SBAB and Swedavia strengthened overall profit by more than SEK 3 billion. Vattenfall’s earnings continue to be
burdened by impairments. Falling iron ore prices and increased expenses for community transformation, primarily
in Kiruna, burdened LKAB’s earnings heavily.
generally accepted accounting principles, the state-owned com-panies are required to present annual, quarterly and year-end reports according to the same rules as listed companies. The annual report and the communication to the Riksdag (Swedish parliament) are important instruments in monitoring the devel-opment of the companies.
I am convinced that sustainability is one of the greatest chal-lenges facing trade and industry in the years to come – but also that the transition to a sustainable society offers an amazing number of business opportunities. Proactive sustainability work secures strong long-term growth in the state-owned companies. Accordingly, I have made it clear to the boards of state-owned companies that sustainable business practices are an issue of business strategy and will be central to this government’s corpo-rate governance of the companies.
In recent years, the world economy has undergone very con-siderable change and has increasingly focused on development in the emerging markets. The Swedish economy is one of the world’s most export-dependent and Swedish companies com-pete in a global market. Both state-owned and privately-owned companies need to evolve continuously to maintain their posi-tion and strengthen their competitiveness, particularly in inno-vation and digitalisation.
One of the main tasks of the management organisation is to set and monitor targets for state-owned companies. Most of the companies have financial targets that are regularly reviewed. Companies with public policy assignments have “public policy targets” to assess how well their public policy assignments are being fulfilled. As from 2015 a sustainability analysis is linked to the financial targets and public policy targets. This analysis serves to highlight relevant risks and opportunities in the area of sustainable business practices with regard to climate change, gender equality, human rights and labour rights, for example. The financial targets, public policy targets and monitoring of the strategic sustainability targets are important tools in our
“I am convinced that sustainabil-
ity is one of the greatest chal-
lenges facing trade and industry
– but also that the transition to a
sustainable society offers an
amazing number of business
opportunities.

5ANNUAL REPORT STATE-OWNED COMPANIES 2014
FOREWORD
“Key words for the governance of
state-owned companies are:
transparency, active ownership,
professionalism and good order.
corporate governance to be able to clearly communicate our expectations as an owner.
Turnover in the state-owned company portfolio declined by 2 per cent in 2014, while the companies’ combined profit rose from SEK 14 billion to SEK 16 billion. The improvement in profit is primarily a consequence of a lower non-recurring impairment in Vattenfall’s continental European operations being recognised than in 2013. The underlying operating profit in the companies remains stable with the exception of LKAB’s earnings, which are strongly affected by sharply declining iron ore prices. The value of the state-owned company portfolio, calculated at the end of 2014, decreased from SEK 500 billion to SEK 460 billion, com-pared within the preceding year. The change is a consequence of decreased value in primarily Vattenfall and LKAB.
My ambition is for the state to be an active owner and, through professional portfolio governance, be clear in its owner-ship role, both in relation to the companies and to society in gen-eral.
I take a positive view of the development of our companies and look forward to supporting the state-owned companies con-tinue to generate long-term value and to contribute to the devel-opment of our society.
Stockholm, June 2015
Mikael DambergMINISTER FOR ENTERPRISE AND INNOVATION, MINISTER RESPONSIBLE FOR THE STATE-OWNED COMPANIES

6 ANNUAL REPORT STATE-OWNED COMPANIES 2014
EVENTS IN BRIEF
Events in brief
LKAB and Kiruna agree on
infrastructure compensationIn May 2014, LKAB and the municipality of
Kiruna signed an agreement regulating com-
pensation for infrastructure including streets,
roads, and water and sewerage mains – in-
vestments in schools, emergency services,
libraries and other community buildings that
are necessary when moving the town centre as
the mine expands. The compensation will
amount to SEK 3.74 billion.
Praise for state-owned com-
panies’ sustainability reports During the year, LKAB’s sustainability report
for 2013 was named as Sweden’s best by
FAR the professional organisation for auditors
in Sweden. Among other things, the report
was praised for presenting the company’s
sustainability work as a natural part of the
business strategy with each strategic area
including dimensions of sustainability. This
year, FAR also presented a second place
award, which went to SEK. Forest products
group SCA received the third place award.
Swedfund and ball bearing manufacturer
SKF received honourable mentions. For
more than a decade, the FAR has presented
annual awards for exemplary non-financial
reporting.
Svenska Spel strengthens its
collaboration with Swedish soccer
Svenska Spel continues to sponsor Swed-
ish soccer. In March 2014, a comprehen-
sive agreement was signed regarding prin-
cipal sponsorship. The collaboration is
valued at slightly more than SEK 928 mil-
lion and extends six years into the future.
This includes a major venture in Swedish
elite ladies’ soccer and talent development.
Increased provisions at
Vattenfall due to lower market
interest ratesAfter an extended period of falling market in-
terest rates, Vattenfall has decided to lower
the discount rate in its calculation of pension
provisions, both in Sweden and Germany, as
well as for other provisions in Germany, pri-
marily for future expenses for the decommis-
sioning of nuclear power. This has resulted
in the provisions on the balance sheet in-
creasing by SEK 8.7 billion and the adjusted
net debt increasing by SEK 9.3 billion.
TeliaSonera buys Tele2 in
Norway TeliaSonera is acquiring Tele2’s mobile
operations in Norway. The operations are
valued at SEK 5.1 billion. The transaction
will increase TeliaSonera’s market share in
mobile telephony in Norway from about 23
to 40 per cent, while the number of mobile
subscriptions will rise from 1.6 million to
2.7 million. TeliaSonera has also pledged to
reach 98 per cent of Norway’s population
with 4G coverage by 2016.
Campaign to prevent purchasing of alcohol for minors
In June, Systembolaget’s campaign to prevent purchasing of alcohol for
minors was visible.The campaign included “Tonårsparlören” (Teenager
phrasebook), a website and book on how to talk about alcohol with minors.
The book was distributed to parents of teenagers during the spring by
Systembolaget’s subsidiary IQ-initiativet.
Bostadsgaranti to be
phased out
In May 2014, an Extraordinary
General Meeting of AB Bostads-
garanti resolved to divest the sub-
sidiary Försäkringsaktiebolaget
Bostadsgaranti. The divestment is
part of the ongoing phase-out of
Bostadsgaranti as a whole. The
company’s remaining operations are
expected to be wound up by 2018.

7ANNUAL REPORT STATE-OWNED COMPANIES 2014
EVENTS IN BRIEF
SSC acquired ground station
in CanadaIn January 2014, SSC, the Swedish Space Corpora-
tion, acquired the outstanding shares in PrioraNet
Canada Ltd., in which SSC was already a part own-
er. The company operates the Inuvik ground station
located in northern Canada. The station in Inuvik
represents a step in the strategic strengthening of
SSC’s global network of earth stations.
Metria initiated collaboration on
national elevation modelIn the spring of 2014 Metria initiated a partnership
where it will, with its customer Lantmäteriet
(Swedish National Land Survey) and subcontrac-
tors, complete a comprehensive national elevation
model for Sweden. Eighty per cent of the country’s
surface has already been mapped via laser scan-
ning – now, the remaining 20 per cent, the moun-
tainous regions, will be completed. The National
Elevation Model (project “NH”) was in progress in
2014 and is continuing in 2015.
Workshops on sustainabilityIn 2014, the state-owned companies management organisation conducted three work-
shops on different themes relating to sustainability: diversity, GRI G4 (the latest sustain-
ability reportingguidelines) and ecosystem services (the services natural ecosystems
provide to man). The purpose of the small-group workshop format was to enable more
in-depth know ledge transfer on specific themes. Some 25 people from state-owned
companies participated in each meeting. In 2015, workshops are planned on the UN
Guiding Principles on Business and Human Rights.
Almi lends SEK 1.2 billion to
innovative companies Almi is launching a new Growth Loan for in-
novative businesses. Over a two year period,
Almi will lend SEK 1.2 billion to innovative
companies throughout Sweden. The Growth
Loan is made possible by a guarantee agree-
ment between the European Investment Fund
and Almi.With the new Growth Loan, more
companies with growth potential will have the
opportunity to finance continued development
and growth.
Akademiska Hus’ Aula Medica
named Building of the Year
In March, Aula Medica, which Akad-
emiska Hus built at the Karolinska
Institute’s Solna Campus, was named
Building of the Year 2014 by building
sector magazine Byggindustrin. The
building has been environmentally
certified in accordance with Green
Building, the EU’s system for energy
efficient buildings. Aula Medica is also
certified according to the Sweden Green
Building Council’s Silver standard.
SAS issued preference shares and
terminated the state’s loan
commitmentWhen, in 2012, SAS presented a new business plan
to strengthen the company’s competitiveness, the
Swedish state, together with the Norwegian and
Danish states and a number of private players, is-
sued a loan commitment, known as an RCF, to SAS
for a total SEK 3.5 billion, which was later renegoti-
ated to SEK 2.0 billion. The aim was to secure the
company’s access to liquidity. Since then, SAS’s fi-
nancial position has improved and, in February
2014, the company strengthened its financial posi-
tion by issuing preference shares corresponding to
SEK 3.5 billion to investors and the general public.
Having raised this capital, SAS terminated the loan
commitment.

8 ANNUAL REPORT STATE-OWNED COMPANIES 2014
EVENTS IN BRIEF
New investments by Fouriertransform During 2014, Fouriertransform invested a total of SEK 201.7 million in five new compa-
nies: ÅAC Microtec AB in Uppsala, Pelly AB in Hillerstorp, Osstell AB in Gothenburg,
APR Automation AB in Arvika and SMP Parts AB in Ilsbo, as well as SEK 196.6 million
in existing portfolio companies. In February 2015, ÅF AB (publ) acquired all shares in
Fouriertransform’s portfolio company LeanNova Engineering in Trollhättan. Fourier-
transform also divested 51 per cent of the shares in Vicura AB to AVL List Gmbh.
History written as Rosetta
spacecraft lands on cometIn November, the European Space Agency’s (ESA)
Rosetta spacecraft, which has been chasing a
comet through space for ten years, succeeded
landing the probe Philae on the comet’s surface.
This is the first time in history a landing of this
kind has been carried out and it has been de-
scribed as one of the most complex space mis-
sions ever. The objective is to learn more about
the origins of the solar system. SSC, the Swedish
Space Corporation, has participated in the project
through LSE Space and Aurora.
Sveaskog land impacted by the forest fire in Västmanland
The huge forest fire that broke out in the province of Västmanland in
August affected some 1,500 hectares of Sveaskog’s land holdings.
Sveaskog had a large number of people in place who helped both with
firefighting and the mopping up process. Sveaskog is now planning to
turn its fire-ravaged forest land in the area into an ecopark. The
ecopark will entail a conservation measure safeguarding the survival of
species favoured by and dependent on fire throughout central Sweden.
Following an agreement with SAS,
Swedavia has taken over handling
services at five regional airports from
SAS Ground Handling (SGH). On 1
November, Swedavia assumed re-
sponsibility at Kiruna Airport, Luleå
Airport, Umeå Airport, Åre Östersund
Airport and Ronneby Airport.
Savings programme at PostNordIn the autumn, PostNord initiated a savings pro-
gramme aimed at generating approximately SEK
500 million in annual savings. The programme re-
duces the number of employees by approximately
800 in administration and other support functions,
mostly in Denmark. The negotiations with the unions
were completed in December 2014 in Denmark and
in January 2015 in Sweden.
Miljöstyrningsrådet in liquidation Aktiebolaget Svenska Miljöstyrningsrådet entered
liquidation during 2014. This occurred as a result
of the Government’s decision regarding a unified
procurement support service, meaning that the
procurement support tasks previously conducted
by Miljöstyrningsrådet were transferred to the state
and have been reassigned to the Swedish Compe-
tition Authority since 1 July 2014.
Swedavia takes over
handling at regional
airports

9ANNUAL REPORT STATE-OWNED COMPANIES 2014
EVENTS IN BRIEF
Infranord in European partner- ship on railway development
Infranord, as well as the Swedish
Transport Administration and Vossloh, is
part of the compre hensive development
project Shift2rail. 26 European countries
will be participating over a period of seven
years. The project addresses energy,
transport management, infrastructure, IT
and rolling stock. The aim is to find ways
to more rapidly develop railways
throughout Europe. Increased operational
reliability, greater capacity and lower
lifecycle costs are on the agenda.
More young people visited Dramaten In addition to the productions that primarily target
children and young people at Unga Dramaten, a
relatively large and young audience also attends
theatre performances on the other stages. In 2014,
the number of tickets with child and youth dis-
counts totalled 55,290, which is an increase by
more than 20 per cent compared with 2013. Unga
Dramaten has moved back to the Dramaten
Theatre to continue developing its operations there.
Safe pharmaceuticals at
Apoteksgruppen’s pharmacies.One of Apoteksgruppen’s strategic sustainability objectives is to
increase the use of EES (electronic expert support) in connect-
ion with the dispensing of prescriptions in Apoteksgruppen’s
pharmacies and this is now taking place to an increasing ex-
tent. The aim is to detect incorrect dosages and inappropriate
combinations of pharmaceuticals for individual customers.
Each year, incorrect usage of pharmaceuticals causes consider-
able suffering for individuals and major costs for healthcare.
SBAB has Sweden’s most
satisfied mortgage customersSBAB wins first place, with a good margin
ahead of the major banks, in Swedish Qual-
ity Index’s annual customer satisfaction sur-
vey in residential mortgages. SBAB gained
the highest scores in most of the question
categories in the survey, including value for
money, service, satisfaction, image and
expectations.
Continued efficiency enhancement at SJWithin the framework of the improvement programme that is to reduce SJ’s
costs by SEK 1 billion in administration and sales, a total of 400 employees
were served notice of termination in January 2014. Eighteen of SJ’s travel agen-
cies, including the one in Copenhagen, were phased out during the first quarter.
At the same time, SJ announced that it would be closing its service centre in
Tranås, affecting a total of 95 permanent employees. In the second quarter, SJ’s
service centre operations were concentrated at the Ånge facility.
Changes in the state-owned companies management
organisation following the 2014 electionsThe September parliamentary elections and new Government entailed certain changes in
the state-owned companies’s management organisation. The management of 41 of the
49 companies wholly or partly owned by the Swedish state is now assigned to the Ministry
of Enterprise and Innovation. As of 2015, the organisation has also been responsible for
managing the European company EUROFIMA and the Industrifonden and Norrlands-
fonden foundations. Eight companies are managed by the Ministries of Finance, Culture,
Health and Social Affairs, and the Ministry for Foreign Affairs.
LKAB issues bonds for SEK 2 billionIn December 2014, LKAB suc-
cessfully issued bonds for a total
of SEK 2 billion as part of its new-
ly established MTN programme.
The programme encompasses a
loan framework of SEK 7 billion
and permits bonds to be issued
in the Swedish market. The bond
loans have a maturity of five years
and are divided into two tranches, one with a fixed interest rate and one
with a variable rate. The bonds will be listed on the NASDAQ Stockholm ex-
change. The purpose of establishing an MTN programme is to further in-
crease LKAB’s financial flexibility and its presence in the capital market.
10 ANNUAL REPORT STATE-OWNED COMPANIES 2014
HOW STATE-OWNED COMPANIES ARE MANAGED
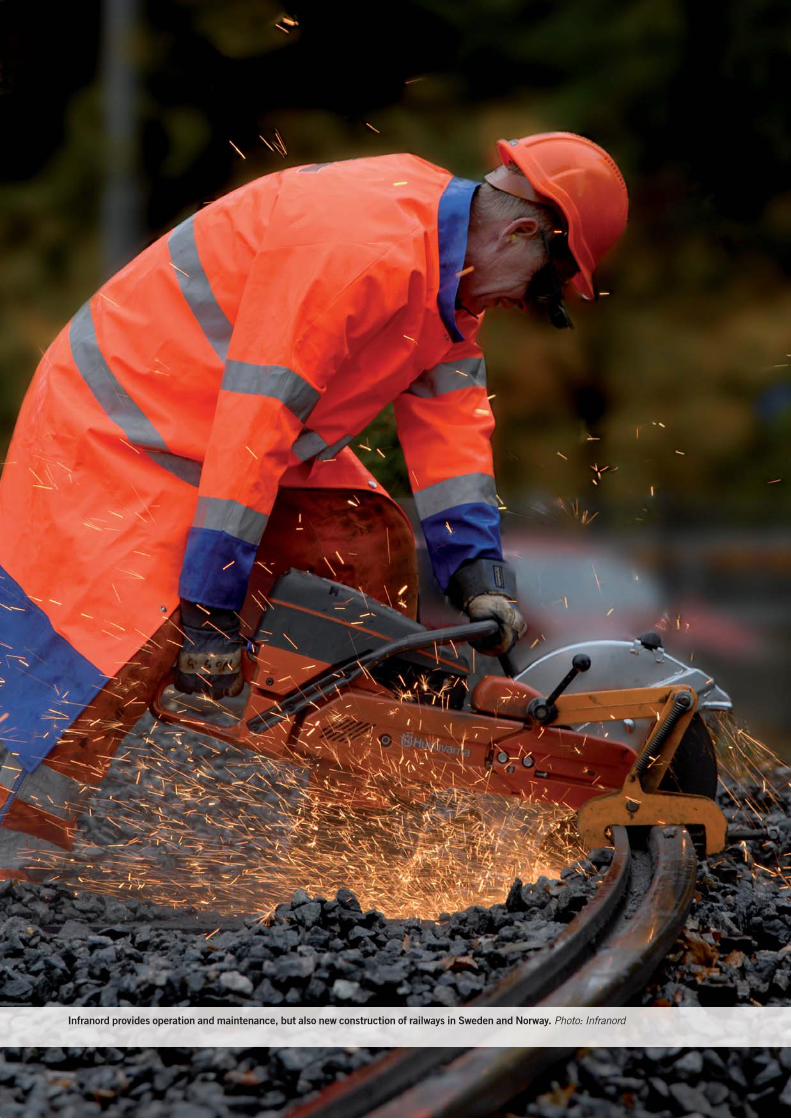
Infranord provides operation and maintenance, but also new construction of railways in Sweden and Norway. Photo: Infranord

11ANNUAL REPORT STATE-OWNED COMPANIES 2014
HOW STATE-OWNED COMPANIES ARE GOVERNED
ACTIVE OWNERSHIP
Active ownership
The state-owned company portfolio, consisting of 49 wholly and partly owned companies, is valued at SEK 460
billion and employs about 163,000 people. Combined, the companies comprise a significant share of the Swedish
business sector. It is the state’s ambition to be an active and responsible owner. Within the Ministry of Enterprise
and Innovation, there is an organisation specialised in generating value in the companies. Organisationally, this is
separated from the market-regulating agencies in other parts of the Government Offices. It is responsible for the
development and management of most state-owned companies. Management is conducted in accordance with
state’s corporate governance documents, which have been compiled in the State’s Ownership Policy.
THE GOVERNMENT’S MANDATE AND PRINCIPLES
The Government is mandated to actively manage the state’s assets. The Government Offices with the ten ministries assist the Government in its work and execute this management. The Gov-ernment Offices currently manage 49 companies1) in accordance with the State’s Ownership Policy, of which 41 are wholly owned and 8 are partly owned. In addition, an European company and two operating foundations are also governed according to the same principles. As per December 2014, the estimated combined value of the company portfolio was approximately SEK 460 bil-lion. Combined, the state-owned companies and their subsidiar-ies employ about 125,000 people, and if associated companies2) are included, the companies employ 163,000 people. Among the
state-owned companies, there are numerous strong brands. In many cases, the companies play an important role in Swedish society, with many having begun as state enterprises, business operations within a public authority or as state monopolies. To operate efficiently and to improve the conditions for competi-tion neutrality in markets that are also targeted by new, private players, these operations have subsequently been corporatized. The majority of state-owned companies now operate in fully competitive markets where the overarching objective of state-ownership for the companies’ operations is to generate value over the long term.
As mandated by the Riksdag, the Government is required to actively manage the state’s holdings in companies in order to
1) Since the 2013 Annual Report, the number of companies has decreased from 50 with the state phasing out the operations of the company Svenska Miljöstyrningsrådet. The
49 companies include Svenska skeppshypotekskassan, which, however, is not a limited company but a special form of association under public law. The operating foundations
Industrifonden and Norrlandsfonden and the European company EUROFIMA are not included in the aggregated figures for employees or sales.
2) The associated companies are those in which the state owns 20–50 per cent, and include Bostadsgaranti, Dom Shvetsii, SAS, SOS Alarm, TeliaSonera and VisitSweden.
The Riksdag
The Government
The Government Offices
The Ministry of Enter-prise and Innovation
Departement for Innovation and State-
owned Companies
Division for State-owned Enterprises
Division for Corporate Governance and Analysis
Other ministries
responsible for
companies
MANAGEMENT ORGANISATION

12 ANNUAL REPORT STATE-OWNED COMPANIES 2014
HOW STATE-OWNED COMPANIES ARE GOVERNED
ACTIVE OWNERSHIP
ensure the best possible long-term value development and – where applicable – to ensure that public policy assignments are performed well. The focus of many of the companies’ operations and public policy assignments means that the state is expected to continue being a major company owner. The Government takes the view that the companies should be managed actively and professionally, with long-term value creation as an overarch-ing goal, and, where relevant, ensuring that specifically adopted public policy targets are performed well. This means that the companies must act efficiently, profitably and long term, and should be afforded capacity for development. State-owned com-panies should act as role models in the area of sustainable busi-ness and should otherwise behave in a manner that instils public confidence. This is the overall focus of the Government Offices’ ongoing management and corporate governance.
MANAGEMENT ORGANISATION
The Minister for Enterprise and Innovation is responsible for a unified overarching ownership policy with regard to the state-owned companies, and is the minister responsible for most of the companies. Accordingly, the Ministry of Enterprise and Innovation has an organisation specialised in corporate govern-ance and investment management1), which is organisationally separate from the Government Offices’ market-regulating oper-ations and which focuses on generating value in the companies. This organisation, which operates within the Departement for Innovation and State-owned Companies, is responsible for the development and governance of 41 of a total of 49 state-owned companies that are managed by the Government Offices, and is divided into two divisions working in close cooperation. The Division for State-owned Enterprises employs investment direc-tors who work on the company boards, coordinate ongoing con-tacts with the companies and lead the organisation’s ongoing work with the holdings. The division also includes a function responsible for communications and investor relations, includ-ing financial information and stakeholder dialogue. The Divi-sion for Corporate Governance and Analysis is responsible for company analysis, sustainable business, business law, board recruitment and overarching corporate governance documents, such as the State’s Ownership Policy, as well as work on and monitoring of financial targets and public policy targets.
For a small number of state-owned companies, responsibility for administration lies with other parts of the Government Offices: the Ministry of Finance, the Ministry of Culture, the Ministry of Health and Social Affairs, the Ministry of Education and Research and the Ministry for Foreign Affairs. The Govern-ment’s principles for active ownership and corporate governance also encompass these companies.
MANAGEMENT COSTS
In 2014, the management organisation costs amounted to SEK 48.3 (56.2) million, corresponding to 0.01 per cent of the assets under management. Of this, SEK 12.5 (20.2) million was for ser-vices procured externally, including fees for financial, economic and legal advice, and for the preparation of the Annual Report and the Government Offices’ interim reports for state-owned companies. The costs for the management organisation consist primarily of salaries but also of other current expenses, such as travel and office supplies. Costs for investment management within other ministries are not included, as they mainly consist of salaries that are also attributable to other tasks within each ministry.
INVESTMENT TEAMS FOR EACH STATE-OWNED COMPANY
Work to develop and manage the individual holdings are mainly conducted based on investment teams for company holdings in the management organisation. For each state-owned company, there is a investment team of comprising expertise from the two aforementioned divisions. The investment teams for each state-owned company holding deal with all ongoing matters of owner-ship involving the managed state-owned companies. The work of the investment teams for state-owned company holdings is coor-dinated and led by an investment director. The investment teams for state-owned company holdings also include investment man-agers, legal counsels, recruiters, communicators and specialists in sustainable business, each of whom can head individual projects within the framework of the investment teams for state-owned company holdings. This composition helps ensure that the groups
INVVESTMENT TEAMS FOR EACH STATE-OWNED
COMPANY HOLDINGS
Communications
Board recruiters
Legal counsels
Sustainable business
Investment managers
S
INVESTMENT DIRECTOR
The investment teams for each state-owned company holdings deal with all ongoing
matters of ownership involving the managed companies.
1) On 1 January, the organisation was transferred from the Ministry of Finance to the
Ministry of Enterprise and Innovation.

13ANNUAL REPORT STATE-OWNED COMPANIES 2014
HOW STATE-OWNED COMPANIES ARE GOVERNED
ACTIVE OWNERSHIP
have good insight into the business environments of the compa-nies and their markets, as well as an understanding of the chal-lenges and risks facing the companies, allowing the management organisation to set requirements and to develop the companies.
The investment teams analyse each state-owned companies’ operations, markets, competitors, and sustainable business prac-tices, helping ensure the value creation in the state’s holdings through active ownership. Various aspects of ownership are addressed, such as the forward looking strategy and changes in the market, board changes, dividend levels and target fulfilment (read
more about the investment teams for company holdings on p.14). POLITICAL LEADERSHIP
In addition to the Minister for Enterprise and Innovation, certain other ministers are also responsible for companies. The relevant ministers and their political advisers hold regular progress meet-ings with the chairmen and executive management teams of the state-owned companies, so-called ownership meetings, with the purpose of reviewing the companies’ operations and perfor-mance in relation to financial targets, public policy targets and sustainability work. Owner meetings are prepared by the rele-vant investment teams. When companies face particularly criti-cal decisions, their boards coordinate their views with the politi-cal leadership in a process of “ownership coordination”.
THE STATE’S MODEL OF CORPORATE GOVERNANCE
The state’s corporate governance document, the ownership policy (the State’s Ownership Policy and guidelines for state-owned companies), specifies the framework for investment manage-ment and clarifies the relationship between the owner, board and management. In the ownership policy, the Government details its management mandate and its positions on key princi-
RESPONSIBLE MINISTRIES
Ministry of Enterprise
and Innovation
Akademiska Hus
Almi Företagspartner
Apoteket
Apoteksgruppen
Arlandabanan Infastructure
Bilprovningen
Bostadsgaranti
EUROFIMA
Fouriertransform
Green Cargo
Göta kanalbolag
Industrifonden
Infranord
Inlandsinnovation
Jernhusen
Lernia
LKAB
Metria
Norrlandsfonden
Orio
PostNord
RISE
Samhall
SAS
SBAB
SEK (Svensk Exportkredit)
SJ
SOS Alarm
Specialfastigheter
SSC (Svenska rymdaktiebolaget)
Statens Bostadsomvandling
Sveaskog
Svedab
Svenska Skeppshypotek
Svenska Spel
Svevia
Swedavia
Swedesurvey
Swedfund
TeliaSonera
Teracom Boxer Group
Vasallen
Vattenfall
VisitSweden
Ministry of Finance
Miljömärkning Sverige
Ministry of Culture
Kungliga Dramatiska Teatern
Kungliga Operan
Voksenåsen
Ministry of Health
and Social Affairs
APL (Apotek Produktion &
Laboratorier)
Systembolaget
Ministry of Education and
Research
ESS (European Spallation
Source)
Ministry for Foreign Affairs
Dom Shvetsii
FRAMEWORK FOR STATE-OWNED COMPANIES
Legal framework
Operations and assignments
Highest decision-making body
State-owned companies
Companies Act
The State’s Ownership Policy
Operations section in
the Articles of Association
Owner instruction1)
Annual General Meeting
Publicly traded companies
Companies Act,
Listing agreement
Operations section in
the Articles of Association
Annual General Meeting
Public authority
Administrative Procedure Act
Government Agencies Ordinance
Ordinance with instructions
Appropriation
Government resolution on
specific assignment
General Director of
agency/board or committee
1) Occurs primarily where companies have public policy assignments, see ownership policy, page 122.
The comparison with a public authority serves to illustrate the considerable difference between companies and authorities in terms of their governance.

14 ANNUAL REPORT STATE-OWNED COMPANIES 2014
HOW STATE-OWNED COMPANIES ARE GOVERNED
ACTIVE OWNERSHIP
Several crucial issues have affected the state’s
ownership of Swedavia. Central to its corporate
governance has been a well-functioning and active
investment team.
Within the management organisation, there is a investment team for
each individual holding that analyses and manages all of the issues
affecting the state in its role as owner. In the Swedavia investment
team, the activity level has been particularly high over the past two
years. Among other things, the group has worked with impact
assessments regarding Arlanda Airport’s environmental permit and
Bromma’s contested air traffic, analyses of pricing regulations and
new financial targets, and public policy targets. In parallel with
these issues, which are of vital company importance, the investment
team also addresses recurring issues such as following up on perfor-
mance in relation to targets, analysing Swedavia’s sustainability
targets and efficiency, and evaluating the Board’s work and compo-
sition.
“As owners, we must understand the company’s challenges and
pay attention to issues affecting the company both in the short and
very long term. Since its incorporation five years ago, Swedavia has
undergone a significant transformation. At the same time, to meet
new passenger flows at key Swedish airports, the company needs a
planning and investment horizon of 30 years,” explains Jenny Lahrin,
investment director at the Ministry of Enterprise and Innovation.
The investment team, which is coordinated by the investment
director, also includes a investment manager, a legal counsel, a
sustainability expert and a board recruiter. As a member of the
board of Swedavia, Jenny Lahrin also contributes to deepening the
group’s knowledge and understanding of various issues within the
company.
“Our work in the Swedavia’s investment team has always been
well-oiled because my colleagues have always realised the need to
take the initiative and have pursued many issues themselves. With
their expertise, the other members of the group have both compli-
mented and challenged the image I have conveyed of the company,
adding additional perspectives. Overall, this dynamic within the
group has enhanced the end product in all of our projects – thus not
only improving the conditions for corporate governance, but also
increasing our preparedness for dealing with difficult standpoints
relating to Swedavia,” says Jenny Lahrin.
Group meetings are held at strategic times over the financial year.
Parts of the group also meet with the company and other players
within the framework of certain analysis projects. Examples of this
include reviewing financial targets and specifically adopted public
policy targets to designing Swedavia’s public policy assignment.
Both are projects pursued by the investment manager and resulting
in resolutions at the 2014 Annual General Meeting.
This high activity level is expected to continue. In addition to
monitoring the company’s performance, the group has, for example,
initiated an efficiency analysis to better comprehend the company’s
journey from an state enterprise to a company.
The group also prepares the political leadership’s meetings with
the chairman and the CEO, and participates in these meetings. Over
the year, the team visited Bromma and Arlanda Airports, Swedavia’s
communications department and Commercial Services to better
understand the business and price regulation process.
“We both improve and simplify our corporate governance when
we have a good basic knowledge of the company’s major issues. For
example, our legal counsel has had detailed knowledge of the com-
pany’s on-going legal processes, enabling us as owners to assess
early the possible consequences,” says Jenny Lahrin.
The team’s work represents our ambition to reflect on past chal-
lenges, plan for the future and share current information, which
contributes to more efficient management of the company.
During 2014, the Swedavia group consisted of Jenny Lahrin, investment director, Per Lundqvist, investment manager, Christina Detter, board
recruiter, Christine Leandersson, legal counsel and Jens Schlyter, sustainable business. Photo: Jörgen Ulvsgård
Active investment teams for company holdings – a strength in connection with difficult ownership issues
SWEDAVIA

15ANNUAL REPORT STATE-OWNED COMPANIES 2014
HOW STATE-OWNED COMPANIES ARE GOVERNED
ACTIVE OWNERSHIP
ples regarding corporate governance and investment manage-ment. In terms of company law, the state-owned companies are controlled in the same way as private limited liability compa-nies, with the Companies Act as their general framework and with the Annual General Meeting as the company’s highest gov-erning body.
The ownership policy is fully applied in companies in which the state is the majority shareholder. In companies where the state is a joint owner, the management organisation engages in a dialogue with the other owners to ensure that the State’s Own-ership Policy is applied. The management organisation’s legal counsels are responsible for the investment management com-plying with the ownership policy. They also play a central role as the investment teams for company holdings’ internal advisors on business law in various projects (read the complete ownership policy on p.122).
Board nominations form an important part of the corporate governance of the state-owned companies. The management organisation includes recruitment specialists who are responsi-ble, within the investment teams for company holdings, for the process of assessing the existing boards, performing needs analy-ses based on the companies’ operations and challenges, and for the process of recruiting chairmen and board members (read
more about board nominations on p.20).
The role of investment director encompasses responsibility for project management in the management of a number of compa-nies in which the investment director is normally also a board member. The investment directors’ board work provides vital expertise to the boards, and contributes to the knowledge of the investment teams for company holdings’ on the companies. The investment management of the publicly traded companies is also based on investment teams for company holdings. In these companies, the state is represented in the nomination commit-tees but not the board.
The requirement for transparency in the state-owned compa-nies is intended to maintain confidence in the companies among the public and in trade and industry. State-owned companies are subject to the same external financial reporting requirements as publicly traded companies (read more about the companies on p.50 and the complete guidelines for external reporting on p.126). Confidence-building communications represent an important aspect of the investment teams for company hold-ings’ work, and are supported by specific expertise in communi-cations. This annual report provides a summary account of the management of state-owned companies. In its annual commu-nication to the Riksdag, the Government provides an account of the past year’s management of state-owned companies. Addi-
ACTIVE OWNERSHIP
Investment
teams for each
individual
holding
Targets and
follow-up
Work on the
company boards
Nomination
of boards
ACTIVE
OWNERSHIP
ACTIVE OWNER-
SHIP WITHIN THE
FRAMEWORK
OF THE STATE’S
OWNERSHIP
POLICY
Transparency
requirements
Owner meetings,
on-going dialogue

16 ANNUAL REPORT STATE-OWNED COMPANIES 2014
HOW STATE-OWNED COMPANIES ARE GOVERNED
ACTIVE OWNERSHIP
tionally, two interim reports on the financial performance of the state-owned companies are published annually.
Monitoring of different targets plays a central role in the dia-logue between the companies and the state in its capacity as owner. The regular ownership meetings where the management organisation and the political leadership meet the chairmen of the Board and executive management, monitor the companies’ performance in relation to established targets. Targets enable the performance of the companies to be measured and, where targets are not met, the owner may request a plan from the companies for the implementation of measures. The targets may be strictly commercial or based on public policy assignments, or may be long-term strategic sustainability targets.
– Financial targets are not set as unilateral demands but through a dialogue between the owners and the company, to enhance the quality of the targets and ensure that they are real-istic. The overall purpose of the targets is to optimise the devel-opment of value in the state-owned companies and for opera-tions to be conducted efficiently. The setting and monitoring of financial targets forms an important part of the work of the investment teams for company holdings. Work is conducted in accordance with an established process and builds on an analysis of the company’s challenges, market and operations led by the investment manager. The Government Offices consider contin-uously how the targets can be revised since a company’s internal and external conditions change as the external environment changes. To encourage an exchange of experiences between the state-owned companies on, for example, financial targets and reporting, the management organisation has initiated a network of CFOs, which met on a few occasions in 2014 (read more about the work with financial targets on p.26).
– Sustainable business is a prerequisite for the companies’ long-term survival. The sustainability targets set by the company boards should be few in number, strategic and measurable. Since 2014, target fulfilment has been monitored by the owner. To
increase transparency, the state-owned companies are obliged to report their activities in accordance with the Global Reporting Initiative, GRI. In the investment teams for company holdings, specialists in the area of sustainable business work together with the other members of the investment teams on, for example, the monitoring of the companies’ sustainability targets and work on sustainable business. In 2014, the process for evaluating the com-panies’ work with sustainable business continued to be developed and integrated into both the development of new financial targets and the overall evaluation of the companies (read more about work
on sustainable business on p.32).Certain state-owned companies are tasked by the Riksdag
with specifically adopted public policy assignments, which are formulated in their Articles of Association and that may be stated in more detail in an owner instruction. The public policy assignments in the state-owned company portfolio have been mapped out. To assess how well the companies perform their assigned public policy assignments, a process has been developed to identify and monitor the public policy targets linked to the public policy assignments (read more about the work with public
policy targets on p. 38). CHANGES IN THE COMPANY PORTFOLIO
While the state did not divest any companies in 2014, it did initi-ate the phasing out of the operations of Apotekens Service, Ersättningsmark i Sverige and Svenska Miljöstyrningsrådet. The liquidation of Apotekens Service was completed in 2014 and the liquidation of Ersättningsmark i Sverige during 2015. Further-more, in 2014, the Government was authorised by the Riksdag to divest assets and liabilities in ESS AB to a consortium for Euro-pean research infrastructures and to liquidate the company. The Government also currently has the Riksdag’s authorisation to decrease or liquidate the holdings in Bilprovningen, Bostads-garanti, Lernia, Orio (formerly Saab Automobile Parts), SAS, and Svensk Exportkredit (SEK).
MANDATE TO CHANGE STATE OWNERSHIP
Company
Current
shareholding, %
Mandate to
change shareholding to, % Decision
Bilprovningen 100 0 Bill 2009/10:54, Report 2009/10:NU10, Riksdag Communication. 2009/10:162
Bostadsgaranti 50 0 Bill 2012/13:1, Report. 2012/13:NU1, Riksdag communication. 2012/13:103
Lernia 100 0 Bill 2012/13:1, Report. 2012/13:NU1, Riksdag communication. 2012/13:103
Orio 100 0 Bill 2012/13:99, Report. 2012/13:FiU21, Riksdag communication.2012/13:287
SAS 21.4 0 Bill 2009/10:121, Report. 2009/10:FiU35, Riksdag communication. 2009/10:220
SEK 100 34 Bill 1995/96:141, Report. 1995/96:NU26, Riksdag communication.
1995/96:302,
Bill 2002/03:142, Report 2002/03:NU14, Riksdag communication.
2002/03:244

17ANNUAL REPORT STATE-OWNED COMPANIES 2014
HOW STATE-OWNED COMPANIES ARE GOVERNED
Apoteksgruppen focuses on health, particularly through the Hälsokällan concept, which was expanded with several new products
over the year. Photo: Apoteksgruppen

18 ANNUAL REPORT STATE-OWNED COMPANIES 2014
HOW STATE-OWNED COMPANIES ARE GOVERNED
COMPANY CASE
Three years of extensive restructuring has resulted in
construction and installation company Svevia pro-
gressing from considerable losses into profitability
while significantly reducing the level of risk.
In 2009, two production units within the former Swedish Road Adminis-
tration that exercised no official authority were incorporated as compa-
nies. The consulting operations within the Swedish Road Administration
and the Swedish Rail Administration were combined to form Vectura
Consulting AB and the road construction, surfacing, equipment and
property operations in Vägverket Produktion within the former Swedish
Road Administration became Svevia AB.
Operating as an independent company represented a major realign-
ment and, despite adjustment measures within Svevia, the company did
not manage to bring its underlying profitability under control during the
initial years following incorporation. Svevia’s leadership changed in
October 2011 with the appointment of the company’s current CEO,
Torbjörn Torell, who has an extensive background as the CEO of several
different types of construction companies.
One of the CEO’s first measures was to conduct a thorough analysis of
Svevia’s existing business projects and work processes. This work
resulted in major impairments, mainly in road construction projects, the
profitability of which was found to be lower than previously estimated.
At the same time, a multi-year action programme was launched and the
company was reorganised. The action programme targeted more efficient
control of projects and strengthened leadership, but also developing the
company’s business focus and reducing costs. In some cases, profitabil-
ity is generated through economies of scale, such as in the maintenance
of the country’s road network where Svevia has a 30 per cent market
share and where the reorganisation contributed to specialisation and
better coordination between different road areas. In other cases, the
measures have resulted in improved risk management, with Svevia
developing methods to identify the projects and assignments on which
the company should bid.
The 2013 Annual General Meeting elected a new chairman: Olof
Ehrlén, who has extensive experience of the industry, most recently as
In the operation and maintenance of roads, Svevia is the market leader in Sweden with a market share of slightly less than 30 per cent the country’s
road network. Photo: Patrick Trägårdh/Svevia
Svevia’s CEO Torbjörn Torell and chairman Olof Ehrlén. Photo: Svevia
Svevia – transition from public authority into a company

19ANNUAL REPORT STATE-OWNED COMPANIES 2014
HOW STATE-OWNED COMPANIES ARE GOVERNED
COMPANY CASE
SVEVIA
President and CEO of NCC. This further reinforced the on-going develop-
ment process within the company.
“Svevia has now completed the transition from being part of a public
authority to being a competitive company in civil construction and road
maintenance. Svevia now has a platform on which to generate growth in
profitability and volumes,” says Olof Ehrlén, Chairman of Svevia. “It is
important to recall that it is not only Svevia’s focus on profitability that
has changed in recent years, but also the company’s culture, which has
helped reduce the general level of risk in the company. Significant
portions of Svevia’s management team and other key competencies have
gradually been replaced to create a strong, profitability-focused execu-
tive management team, and increased system support has brought
improved precision in profitability and risk assessment.”
Several measures have also been implemented within the company to
promote sound ethical behaviour and to minimise the risk of corruption.
An example of this are Svevia’s measures to increase adherence to
centrally signed contracts, with the objective of 100 per cent adherence
to agreements in selected agreement areas by 2016.
The transition has resulted in turnover decreasing by more than half a
billion kronor since 2011. In return, Svevia has shown dramatic improve-
ment in profitability. In 2014, for the first time, Svevia achieved its
target of a 13 per cent return on equity, as established by the owner in
2010. The return was 17 per cent. Due to the recent years’ changes in
Svevia a review of the owner’s financial targets is planned during 2015.
In new construction and rebuilding of roads, Svevia is the fourth-largest player in the market. Photo: Patrick Trägårdh/Svevia

20 ANNUAL REPORT STATE-OWNED COMPANIES 2014
HOW STATE-OWNED COMPANIES ARE GOVERNED
NOMINATIONS TO COMPANY BOARDS
Board work and responsibilities
Under the Swedish Companies Act, the Board of Directors is
responsible for the organisation and administration of a
company’s affairs. This includes the Board determining the
company’s overarching strategy and making more important
strategic decisions.
The Board also appoints the CEO and issues instructions
for the CEO’s management of the company. The Board
determines who represents the company (authorised signa-
tories) and calls shareholders to Annual General Meetings.
Each year, the Board establishes the main focus of its
work for the coming fiscal year. The rules of procedure regu-
late matters including the number of board meetings, the
matters to be addressed at these meetings, the division of
work within the Board, the specific tasks of the Chairman of
the Board and how the work of any committees is to be con-
ducted. The Board shall also examine the CEO’s reporting
instructions each year.
The Board’s responsibilities include ensuring that taxes and
fees are paid on time, and that annual reports are prepared
and submitted to the Companies Registration Office. The
Board bears considerable responsibility and members may be
liable both to the company and to third parties, and can in cer-
tain cases be held personally liable for the company’s liabili-
ties.
Company boards
The Board of Directors bears the overall responsibility
for the management of a limited liability company.
Consequently, board nominations form an important
part of the corporate governance of the state-owned
companies. To ensure that the company boards pos-
sess the requisite skills, the management organisation
has a structured process for board nominations.
BOARD RESPONSIBILITIES
Under the Companies Act, the Board of Directors is responsible for the organisation and management of the company’s affairs. Among other things, this means that the Board determines the company’s overall strategy, makes important strategic decisions, appoints the CEO and issues instructions for his/her manage-ment of the company. These substantial powers impose rigorous demands on a well-functioning Board, suited to the company’s specific operations and challenges, as well as to the state’s ambi-tions as an owner.
COMPOSITION OF THE BOARDS
Each board nomination is based on the expertise required for the specific board. The composition shall ensure that the Board is able to manage the company’s business with integrity and effi-ciency, and that the Board embodies industry-specific skills and other expertise relevant to the company. In addition to relevant skills, Board members in state-owned companies shall also have a high degree of integrity and the capacity to act in the best interests of the company. Sustainability and ethics are impor-tant issues for the state as an owner and boards must be able to work strategically in the area of sustainable business.
An efficient board cannot be too large, the number of mem-bers should normally be six to eight people. The Government intends to have only regular members and no deputies.
Board composition should be such that diversity and breadth of experience are achieved. Diversity and breadth may relate to age, ethnicity and gender, but also professional experience, aca-demic background and profession. Bringing in a new board member with a different background than the other members shall serve to ensure relevant breadth in the combined expertise in the boardroom and to enhance the dynamic of the board. However, this should not be fullfilled at the cost of making the board too large. To achieve gender balance, the state-owned companies target having at least 40 per cent of board members of either gender.
BOARD NOMINATION PROCESS
The management organisation includes recruitment specialists who work exclusively with assessment, recruitment and coordi-nating board nominations for the state-owned companies. To capitalise on the expertise of both women and men, as well as individuals with different backgrounds and experience, the selection of members involves a broad recruitment base. A uni-form and structured approach throughout the nomination pro-cess safeguards quality.
An investment team, consisting of representatives from the investment team for company holdings, begins the board nomi-nation process by analysing current expertise requirements given the company’s business, current situation and future challenges, as well as its present board composition and board evaluations. Recruitment needs are determined, requirement profiles pro-duced and the recruitment process begins. Nomination proposals are approved through a decision by the minister responsible for the company. The Annual General Meeting determines the ulti-mate election of board members.

21ANNUAL REPORT STATE-OWNED COMPANIES 2014
HOW STATE-OWNED COMPANIES ARE GOVERNED
NOMINATIONS TO COMPANY BOARDS
In 2014, each board in the state-owned company portfolio had an average of 7.0 board members, unchanged compared with the previous year. The size of the boards varies from three to ten members. There are a total of some 340 board members in the state-owned companies. Each year, about 50–70 new board members are elected.
In the listed companies SAS and TeliaSonera, in which the state is one of the largest shareholders, the nomination commit-tees include a representative from the management organisa-tion.
CHAIRMAN OF THE BOARD – A SPECIAL ROLE
The chairman holds a special status on the board. He or she is responsible for the work of the board being well organised and efficient. Other special duties include aligning the views of the board with those of the owner when the company faces particu-larly important decisions. The chairman maintains contact with the CEO between board meetings and is responsible for the ongoing dialogue with the owner.
BOARD PERFORMANCE IS ASSESSED
Board performance is assessed annually and the chairman is responsible for ensuring that the evaluation is conducted. In companies wholly or partly owned by the state, the chairman reports the assessment results to the relevant ministry. In the listed companies, the nomination committee is informed.
As part of the corporate governance and board nomination processes, the Government Offices also conduct their own ongo-ing assessments of the boards of the state-owned companies.
Each year, the owner appoints auditors to independently review the administration by the board and the CEO, as well as the company’s annual report and accounts.
BOARD FEES
Board members are compensated for their effort and for the responsibility that the board assignment entails. Board fees are set by the Annual General Meeting. As a rule, officials of the Government Offices who are board members in state-owned companies are not paid board or committee fees by those com-panies. Situations are to be avoided whereby board members or their deputies are engaged as consultants to the company and thereby receive consultancy fees in addition to their board fees.
MORE WOMEN BOARD MEMBERS THAN IN PUBLICLY TRADED
COMPANIES
As of 1 May 2015, 46 per cent of board members elected by the Annual General Meetings were women and 54 per cent were men in the state-owned companies. In the companies that are wholly-owned by the state, the proportion of women was 49 per cent, compared with 291) per cent in listed companies. Of the total 49 state-owned companies, 30 met the gender balance tar-get, i.e. the proportion of either sex was at least 40 per cent. In 19 companies (15 in the previous year), the target was not achieved. In 14 of these companies, men were over-represented, i.e. more than 60 per cent of board members were men and less than 40 per cent were women. In five of these companies, women were over-represented. See the diagram “Number of gender-balanced boards” below.
The proportion of women chairmen in the state-owned com-pany portfolio (wholly and partly owned companies) has risen from 33 per cent in 2010 to 45 per cent in 2015, compared to 51) per cent among publicly traded companies. Among the compa-nies wholly owned by the state, the proportion of women chair-men is 46 per cent.
BOARD NOMINATION PROCESS
Preparation by
the Government Offices
Decision by the Government Offices1)
(nomination decision, appointment,
instructions, power
of attorney)
Annual General
Meeting
ANNUAL
GENERAL
MEETING 2015
Owner’s assessment
Search process
Board assessment
Competence analysis
1) According to SIS Ägarservice.
0–19 W
81–100 M
20–39 W
61–80 M
40–60 W
40–60 M
61–80 W
20–39 M
81–100 W
0–19 M
0
5
10
15
20
25
30
35
40
NUMBER OF GENDER-BALANCED BOARDS
Number of boards1 2012 2013 2014 2015 W = Women, % M = Men, %
The diagram shows the number of companies and the gender distribution of the
boards. In 30 of the 49 companies, the gender balance is 40–60 per cent women or
men respectively.
1) Based on the number of board appointments by the Annual General Meeting.
1) Decision by Minister as authorised by the Government.
22 ANNUAL REPORT STATE-OWNED COMPANIES 2014
HOW STATE-OWNED COMPANIES ARE GOVERNED
NOMINATIONS TO COMPANY BOARDS
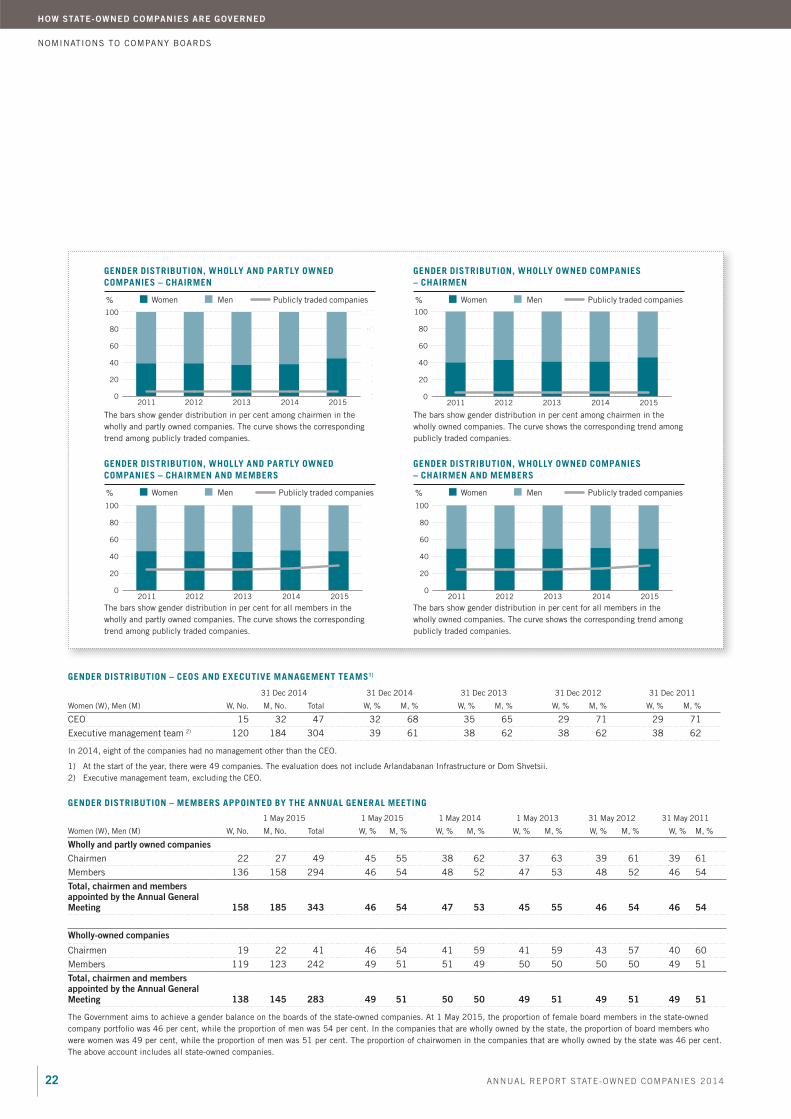
GENDER DISTRIBUTION – CEOS AND EXECUTIVE MANAGEMENT TEAMS1)
31 Dec 2014 31 Dec 2014 31 Dec 2013 31 Dec 2012 31 Dec 2011
Women (W), Men (M) W, No. M, No. Total W, % M, % W, % M, % W, % M, % W, % M, %
CEO 15 32 47 32 68 35 65 29 71 29 71
Executive management team 2) 120 184 304 39 61 38 62 38 62 38 62
In 2014, eight of the companies had no management other than the CEO.
1) At the start of the year, there were 49 companies. The evaluation does not include Arlandabanan Infrastructure or Dom Shvetsii.
2) Executive management team, excluding the CEO.
GENDER DISTRIBUTION – MEMBERS APPOINTED BY THE ANNUAL GENERAL MEETING
1 May 2015 1 May 2015 1 May 2014 1 May 2013 31 May 2012 31 May 2011
Women (W), Men (M) W, No. M, No. Total W, % M, % W, % M, % W, % M, % W, % M, % W, % M, %
Wholly and partly owned companies
Chairmen 22 27 49 45 55 38 62 37 63 39 61 39 61
Members 136 158 294 46 54 48 52 47 53 48 52 46 54
Total, chairmen and members appointed by the Annual General Meeting 158 185 343 46 54 47 53 45 55 46 54 46 54
Wholly-owned companies
Chairmen 19 22 41 46 54 41 59 41 59 43 57 40 60
Members 119 123 242 49 51 51 49 50 50 50 50 49 51
Total, chairmen and members appointed by the Annual General Meeting 138 145 283 49 51 50 50 49 51 49 51 49 51
The Government aims to achieve a gender balance on the boards of the state-owned companies. At 1 May 2015, the proportion of female board members in the state-owned
company portfolio was 46 per cent, while the proportion of men was 54 per cent. In the companies that are wholly owned by the state, the proportion of board members who
were women was 49 per cent, while the proportion of men was 51 per cent. The proportion of chairwomen in the companies that are wholly owned by the state was 46 per cent.
The above account includes all state-owned companies.
The bars show gender distribution in per cent among chairmen in the
wholly and partly owned companies. The curve shows the corresponding
trend among publicly traded companies.
The bars show gender distribution in per cent among chairmen in the
wholly owned companies. The curve shows the corresponding trend among
publicly traded companies.
The bars show gender distribution in per cent for all members in the
wholly and partly owned companies. The curve shows the corresponding
trend among publicly traded companies.
The bars show gender distribution in per cent for all members in the
wholly owned companies. The curve shows the corresponding trend among
publicly traded companies.
GENDER DISTRIBUTION, WHOLLY AND PARTLY OWNED
COMPANIES – CHAIRMEN
GENDER DISTRIBUTION, WHOLLY OWNED COMPANIES
– CHAIRMEN
GENDER DISTRIBUTION, WHOLLY AND PARTLY OWNED
COMPANIES – CHAIRMEN AND MEMBERS
GENDER DISTRIBUTION, WHOLLY OWNED COMPANIES
– CHAIRMEN AND MEMBERS
Women Women
Women Women
Men Men
Men Men
Publicly traded companies Publicly traded companies
Publicly traded companies Publicly traded companies
% %
% %
2011 2012 2013 2014 20150
20
40
60
80
100
0
20
40
60
80
100
2011 2012 2013 2014 20150
20
40
60
80
100
2011 2012 2013 2014 20150
20
40
60
80
100
2011 2012 2013 2014 20150
20
40
60
80
100
23ANNUAL REPORT STATE-OWNED COMPANIES 2014
HOW STATE-OWNED COMPANIES ARE GOVERNED
NOMINATIONS TO COMPANY BOARDS
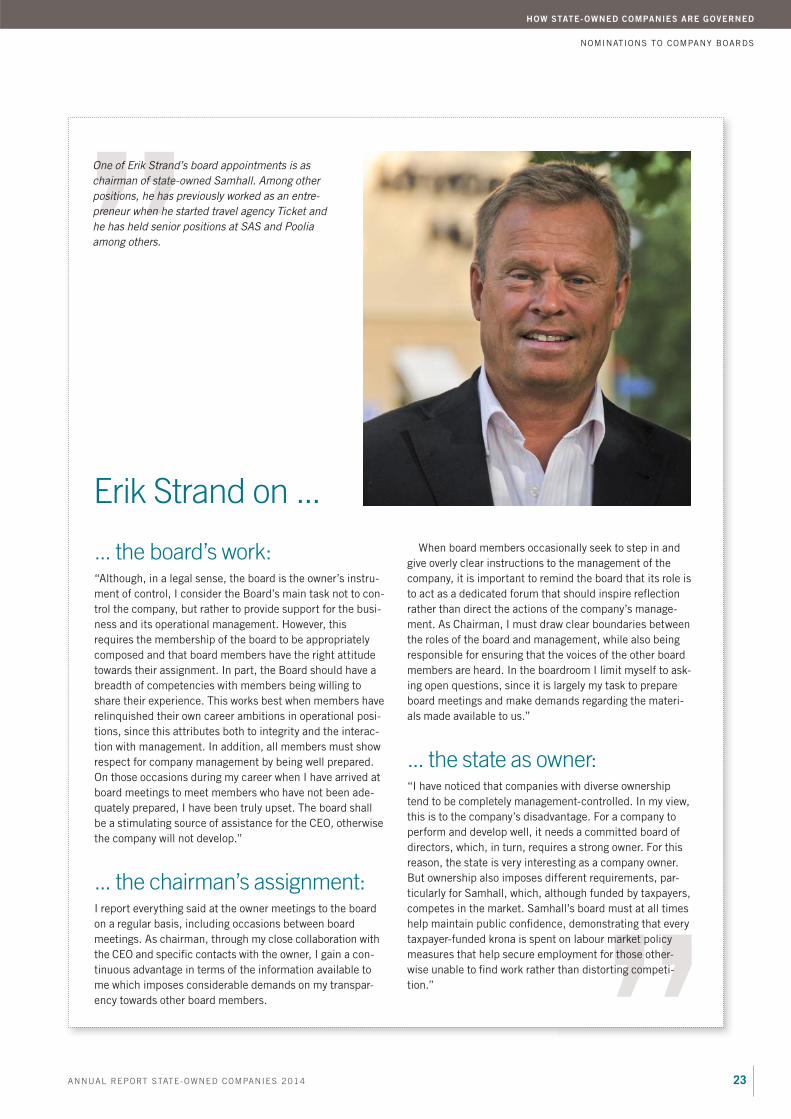
”
”
... the board’s work: “Although, in a legal sense, the board is the owner’s instru-
ment of control, I consider the Board’s main task not to con-
trol the company, but rather to provide support for the busi-
ness and its operational management. However, this
requires the membership of the board to be appropriately
composed and that board members have the right attitude
towards their assignment. In part, the Board should have a
breadth of competencies with members being willing to
share their experience. This works best when members have
relinquished their own career ambitions in operational posi-
tions, since this attributes both to integrity and the interac-
tion with management. In addition, all members must show
respect for company management by being well prepared.
On those occasions during my career when I have arrived at
board meetings to meet members who have not been ade-
quately prepared, I have been truly upset. The board shall
be a stimulating source of assistance for the CEO, otherwise
the company will not develop.”
... the chairman’s assignment:I report everything said at the owner meetings to the board
on a regular basis, including occasions between board
meetings. As chairman, through my close collaboration with
the CEO and specific contacts with the owner, I gain a con-
tinuous advantage in terms of the information available to
me which imposes considerable demands on my transpar-
ency towards other board members.
One of Erik Strand’s board appointments is as
chairman of state-owned Samhall. Among other
positions, he has previously worked as an entre-
preneur when he started travel agency Ticket and
he has held senior positions at SAS and Poolia
among others.
Erik Strand on ...
When board members occasionally seek to step in and
give overly clear instructions to the management of the
company, it is important to remind the board that its role is
to act as a dedicated forum that should inspire reflection
rather than direct the actions of the company’s manage-
ment. As Chairman, I must draw clear boundaries between
the roles of the board and management, while also being
responsible for ensuring that the voices of the other board
members are heard. In the boardroom I limit myself to ask-
ing open questions, since it is largely my task to prepare
board meetings and make demands regarding the materi-
als made available to us.”
... the state as owner: “I have noticed that companies with diverse ownership
tend to be completely management-controlled. In my view,
this is to the company’s disadvantage. For a company to
perform and develop well, it needs a committed board of
directors, which, in turn, requires a strong owner. For this
reason, the state is very interesting as a company owner.
But ownership also imposes different requirements, par-
ticularly for Samhall, which, although funded by taxpayers,
competes in the market. Samhall’s board must at all times
help maintain public confidence, demonstrating that every
taxpayer-funded krona is spent on labour market policy
measures that help secure employment for those other-
wise unable to find work rather than distorting competi-
tion.”

24 ANNUAL REPORT STATE-OWNED COMPANIES 2014
HOW STATE-OWNED COMPANIES ARE GOVERNED
One of SSC’s assignments is technological development. MEMS (Micro Electro Mechanical Systems) is a technology that makes it possible to conduct
completely new missions in space. In turn, this gives us greater knowledge about other planets and increases our understanding of our own planet. Photo: SSC

25ANNUAL REPORT STATE-OWNED COMPANIES 2014
HOW STATE-OWNED COMPANIES ARE GOVERNED
Targets and follow-up
Establishing and monitoring clear targets is an important tool for corporate governance. Targets allow compa-
nies’ performance to be measured and the necessary actions to be taken. Consequently, monitoring targets rep-
resents an increasingly central aspect of the dialogue between the companies and the state as the owner. The
overarching purpose of the targets is for the companies’ operations to be conducted efficiently and with a long-
term perspective, which leads to the sustainable development of value and, where appropriate, that public policy
assignments are performed well.
TARGETS AND FOLLOW-UP
TARGETSFINANCIAL TARGETS
STRATEGIC SUSTAINABILITY TARGETS
PUBLIC POLICY TARGETS
Most of the of the state-owned companies are assessed based
on some form of financial targets. These may, for example,
involve the operations’ profitability or the company’s capital
structure. The purpose of the financial targets is to ensure
value creation in the company portfolio through efficiency in
the operations of the state-owned companies while financial
risks are kept at a reasonable level. The ambition is that, by
2015 at the latest, all companies administered by the Ministry
of Enterprise and Innovation shall undergo review and receive
revised financial targets relevant to their circumstances.
Effective from 2014, the boards of all of the State-owned com-
panies are tasked with elevating sustainability issues to a stra-
tegic level and with formulating a small number of overarching
sustainability objectives for their operations. The aim is thus to
integrate sustainable business into the company’s business
strategy.
Several of the state-owned companies have public policy
assignments decided by the Riksdag. Assessing how well a
public policy assignment is performed is facilitated by clearly
defined objectives. Within the framework for its administration
of the companies, the Government Offices monitors how well
the public policy assignments are performed. Where relevant,
this should be accomplished through one or more public policy
targets being adopted by the Annual General Meeting. There is
no contradiction between public policy assignments and finan-
cial efficiency. The state’s objective is that the assignment is
performed well and as efficiently as possible – consequently, it
is meaningful to combine public policy targets with financial
targets in companies with public policy assignments. Accord-
ingly, the Government Offices have developed a process for
setting public policy targets.
For most of the state-owned companies, the owner has estab-
lished more than one type of target. Various aspects are
weighed in for the goals to be as clear and balanced as
possible. In the event that targets conflict, the company and
the state (as owner) are able to discuss priorities or the time-
frame for target fulfilment.
Concrete targets contribute to clearer owner meetings. When
the chairmen and executive management teams of the compa-
nies meet the owner at the regular progress meetings, the fol-
low-up of results in relation to various targets is a central part of
the agenda. Another advantage with targets is that the compa-
ny’s and the owner’s considerable effort and analysis in prepar-
ing them help increase the understanding of the company’s
challenges, while the owner’s intentions are also clarified for
the company.
(Read about the different targets for the relevant companies
on p. 51–99.)

26 ANNUAL REPORT STATE-OWNED COMPANIES 2014
HOW STATE-OWNED COMPANIES ARE GOVERNED
FINANCIAL TARGETS
Establishing and monitoring clear targets is an impor-
tant tool in the governance of state-owned companies.
Realistic and ambitious targets that can be monitored
are set in a process in which the owners, the board
and company management are actively involved. Tar-
gets, outcomes and the companies’ efforts to reach
the targets are key components in owner meetings.
FINANCIAL TARGETS IN STATE-OWNED COMPANIES
In most cases, state-owned companies operate under market conditions in competitive markets. In these cases, generating value is the overall objective of corporate governance. With operations being subject to the same conditions and require-ments as other actors, competitiveness, value development and capital efficiency are strengthened while the risk that competi-tion is distorted decreases. This also generates the necessary pressure for change that is a prerequisite for improved efficiency and long-term competitiveness. The process of setting and mon-itoring financial targets contributes to this.
The methodology behind the financial targets focuses on value generation and was developed more than three years ago. Since then, a methodology has also been developed for setting public policy targets, focusing on the implementation of the public policy targets and public policy assignments at hand, and for sustainability analysis. In the projects currently being imple-mented, public policy targets, financial targets and sustainabil-ity analyses are being developed in an integrated manner. The sustainability analysis forms an important part of the funda-mental analysis of the company’s risks and opportunities on which the financial targets are based. By simultaneously
developing public policy targets and financial targets, public pol-icy assignments can be balanced with the generation of financial value. A clearly structured target process also lays the founda-tion for the owners and the company maintaining an active dia-logue on targets and outcomes. When targets are drawn up in dialogue with the companies, rather than as unilaterally formu-lated requirements, more nuanced and expedient governance is achieved, while improving the quality of the targets and ensur-ing that they are realistic. The purpose, method and process for setting financial targets are described in brief below.
PURPOSE OF FINANCIAL TARGETS
Financial targets normally address capital structure, profitability and dividends, and serve mainly to:
sustainable dividends, as well as
COST OF CAPITAL IS THE STARTING POINT
The method applied in setting financial targets is based on a multi-stage analysis. The cost of capital represents an investor’s alternative cost for a certain investment and therefore deter-mines whether the investor will receive reasonable compensa-tion for the risk that the investment entails. It affects all three principal areas covered by the financial targets and is therefore a key starting point in the analysis and formulation of the finan-cial targets. The cost of capital affects a company’s optimal capi-tal structure. The capital structure is the distribution between equity and borrowed capital that minimises the company’s cost of capital. Since the cost of capital represents an investor’s
METHOD FOR SETTING FINANCIAL TARGETS
Capital structure
Profitability target Consistency
assessmentProposalCost of
equity
Dividend policy

27ANNUAL REPORT STATE-OWNED COMPANIES 2014
HOW STATE-OWNED COMPANIES ARE GOVERNED
FINANCIAL TARGETS
expected return, over time, it also sets a floor for a company’s profitability targets. In turn, that floor affects the amount of investments that the company finds attractive. For an invest-ment to be attractive, the expected return over time should cor-respond to the cost of capital. All else being equal, a higher cost of capital decreases the amount of attractive investments and thus a company’s need to retain capital in its operations. (Read more about cost of capital on p. 28.)
EFFICIENT CAPITAL STRUCTURE
The purpose of the capital structure target is primarily to keep the company’s financial risk at a reasonable level, while, at the same time, the company is efficiently capitalised. To find an appropriate capital structure, the theoretically optimal capital structure for minimising the company’s cost of capital is first calculated. This calculation is supplemented with relevant sec-tor comparisons and a more detailed analysis of the company’s operating risk. The analysis of the company’s operating risk is particularly important because an appropriate capital structure should both be financially resilient and keep the company effi-ciently capitalised. Consequently, it is not an objective in itself that a company should have more equity than necessary. The capital structure target is generally expressed in terms of net debt/equity ratio, most often as an interval.
AN AMBITIOUS PROFITABILITY TARGET
The purpose of the profitability target is to foster efficient per-formance of the company’s operations. This applies from both an operational and financial perspective. The profitability target should also provide reasonable compensation for the risk-taking that ownership of the company entails. For this reason, the cost of capital forms the floor for the profitability target. It should also be viewed as a target to be achieved over the long term and not as a demand that must be met at every point in time. The profitability target should therefore express an ambitious but, at the same time, achievable target scenario for the company. Con-sequently the profitability target builds primarily on detailed analyses of the company’s business plan and sector comparisons. In most companies, a return target is applied (for example, return on equity or operating capital). This is because such a tar-get generates an incentive for a company to work with profita-bility enhancements as well as capital efficiency. For other com-panies, whose operations do not tie up large amounts of capital and for whom capital efficiency is consequently less important, margin targets, for example, may be more appropriate. Apoteket, Bilprovningen and Svenska Spel, for example, apply operating margin targets, while LKAB has a cost target.
ADAPTED DIVIDEND POLICY
Among other purposes, the dividend policy shall ensure that the owner receives predictable and long-term sustainable dividends. However, the owner may also profit from an increase in value by allowing the company to retain and reinvest capital in the opera-tions rather than by distributing it as dividends. The more attractive investments a company has (that is, investments whose expected returns equal or exceed the cost of capital), the more capital the company should be able to retain for invest-ments.
For this reason, the dividend policy is based primarily on a thorough analysis and assessment of the company’s investment plan and growth opportunities. If a company has an attractive investment opportunity that does not live up to the owner’s profitability target, there may still be reasons for the company to make the investment. As long as the expected return on the investment equals or exceeds the cost of capital, the owner will receive reasonable compensation for its risk-taking in the com-pany. However, where there are several different investment opportunities, it is important that the company prioritises the investments offering the best expected return in relation to the risk. The dividend policy is usually expressed as a percentage of net profit for the year, generally as an interval.
MONITORING AND EVALUATION
The financial targets are forward-looking and long-term. Due to economic fluctuations, for example, it is therefore natural that the targets are exceeded in certain years, but not achieved in others. The owner monitors the company’s development and tar-get fulfilment at regular progress meetings with the company’s Chairman and management. Both the company’s internal work to achieve the targets and the external factors affecting the com-pany’s conditions are discussed at these meetings. Target fulfil-ment is assessed in relation to current market conditions and the budget and business plan.
REVISION OF FINANCIAL TARGETS
A company’s internal and external conditions change as the world around us changes. Accordingly, the financial targets are reviewed after a while. Significant changes in the company’s strategy or market conditions, as well as major acquisitions or divestments may motivate rise to a revision of the targets. Major and lasting changes in macroeconomic conditions, such as the risk-free interest rate and the market risk premium can also give cause to revise the targets. A revision of the targets is a struc-tured process, involving both the owner and the company. Since the financial targets are determined by both the owner and the company, targets and outcomes are communicated externally by both. The owner details them in this publication. The compa-nies communicate the targets in their annual reports.

28 ANNUAL REPORT STATE-OWNED COMPANIES 2014
HOW STATE-OWNED COMPANIES ARE GOVERNED
FINANCIAL TARGETS
WHY IS THIS IMPORTANT?
The cost of equity is a key measure in corporate governance. It represents an investor’s expected return on an alternative investment with the same risk and duration. In other words, the cost of equity is an investor’s opportunity cost for ownership of a company. Consequently, it determines whether the investor receives reasonable compensation for the risk-taking that the ownership of a company entails.
In principle, reasonable compensation means that over time a company generates a return on equity in line with the expected return, i.e. the cost of equity. If the return on equity over time exceeds the expected return, the investor receives additional compensation in relation to the risk-taking that ownership of a company entails. Conversely, when the return on equity over time falls short of the expected return, the investor is not fully compensated for the risk-taking that ownership of a company entails.
COST OF EQUITY
The management organisation applies the Capital Asset Pricing Model (CAPM) to estimate the cost of equity. According to CAPM, the cost of equity (re) is determined by three factors: the risk-free interest rate (rf), the stock market’s risk premium (rm – rf), and beta (ß), which is a measure of the company’s sys-tematic risk, i.e. the risk attributable to market fluctuations that a well-diversified investor cannot avoid through diversification. The cost of equity is determined by the equation:
re = rf + ß (rm − rf)
According to CAPM, higher systematic risk leads to higher cost of equity. In other words, investors expect compensation in terms of higher expected returns in exchange for increased systematic risk.
The lowest expected return, and therefore the absolute floor for the cost of equity, is the risk-free return in the same currency as the company’s shares. In most cases, this is equivalent to the interest on government bonds.
The stock market’s risk premium is intended to capture the compensation that an investor expects above the risk-free inter-est rate to maintain the so-called market portfolio – a portfolio that is often modelled using a broad stock market index.
Beta is a measure of the covariance between the value of the company’s shares and the market portfolio and is intended to
FACTS
capture the company’s systematic risk. The company’s system-atic risk consists of both operating risk and financial risk. Com-panies in cyclical sectors, whose income varies considerably over the business cycle have higher operating risk and are likely to be more sensitive to systematic risk and therefore have a higher beta than companies in less sensitive sectors. At the same time, higher leverage leads to higher fixed costs in terms of interest payments which, all else being equal, increases the financial risk and hence the systematic risk and beta. This, in turn, leads to a higher cost of equity.
For publicly traded companies, beta is estimated by assuming a linear regression with the return on the company’s share as the dependent variable and the return on the market portfolio as the explanatory variable. The regression coefficient for the market portfolio variable is usually represented by the beta symbol (ß), hence the name.
For unlisted companies, beta is usually estimated using a com-parison group of publicly traded companies. Here, it is impor-tant that the operations of the companies in the comparison group correspond as closely as possible to the operations of the company being analysed.
For companies with different areas of operations, it may be helpful to assume different betas for the different areas of oper-ations. Thus each area of operations has its own comparison group that corresponds as closely as possible to the operations concerned. The resulting beta assumptions for the different areas of operations are then weighted together as a beta for the whole company.
WEIGHTED COST OF CAPITAL
Companies normally fund themselves through a combination of equity and borrowed capital. Consequently, a company’s weighted average cost of capital, WACC, is the average weighted cost of equity (re) And borrowed capital (rd), where the weights consist of the proportion of equity (ωe) and borrowed capital (ωd) respectively. The weighted cost of capital is determined by the equation:
rωacc = ωe ∙ re + ωd ∙ rd (1 – τ)
where τ consists of the company’s tax rate. Just as with the cost of equity, the cost of borrowed capital also increases with increased operating and financial risk.

29ANNUAL REPORT STATE-OWNED COMPANIES 2014
HOW STATE-OWNED COMPANIES ARE GOVERNED
FINANCIAL TARGETS
5
10
A company’s weighted cost of capital depends primarily on the systematic risk in the company’s operations. Characteristic of operations with low systematic risk is that demand for their products and services is independent of the business cycle, as well as a strong financial position. Healthcare and FMCG com-panies, for example, are considered to have low systematic risk,
LKAB has relatively high weighted cost of capital, since the systematic
risk in its operations is considered high. The foremost reason for the
higher systematic risk is that demand for iron ore varies considerably
across the business cycle, with large fluctuations in both price and
volume and thus also in income and profit. Vattenfall encompasses both
activities with a relatively high level of risk; primarily electricity genera-
tion, which is exposed to volatile electricity and raw material prices; as
well as operations with a lower level of risk, such as subsidised genera-
tion of wind power and price-regulated electricity distribution.
while mining and technology companies are considered to have high systematic risk. The state-owned companies con-duct operations in diverse sectors and their weighted cost of capital varies accordingly. The graph below presents the weighted cost of capital for a selection among the largest state-owned companies.
Akademiska Hus and Sveaskog are deemed to have relatively low
systematic risk. The reason is that these operations have long-term
business models that are less sensitive to economic fluctuations.
Akademiska Hus enters relatively long-term leases with stable public
sector customers, which decreases the systematic risk. In the case of
Sveaskog, the company can offset temporary decreases in price and
demand by leaving the forest to grow. All else being equal, the company
thus achieves higher growth in value at the expense of direct return.
WEIGHTED COST OF CAPITAL FOR SOME STATE-OWNED COMPANIES
rωacc (%)

30 ANNUAL REPORT STATE-OWNED COMPANIES 2014
HOW STATE-OWNED COMPANIES ARE GOVERNED
Innventia’s pilot plant for the large scale production of nano-cellulose is the first and only of its kind in the world that is open to external
users. Innventia is one of the four research groups included in the RISE group. Photo: Innventia

31ANNUAL REPORT STATE-OWNED COMPANIES 2014
HOW STATE-OWNED COMPANIES ARE GOVERNED
FINANCIAL TARGETS – TARGETS AND OUTCOMES IN 2014
PROFITABILITY CAPITAL STRUCTURE DIVIDEND
Return on equity (unless otherwise stated) Equity/assets ratio (unless otherwise stated) Share of profit for the year
% Target Outcome 2014 Target Outcome 2014 Target Outcome 2014
Akademiska Hus 6.51) 7.3 30–40 48 40–60 50
APL 8 4.3 40–50 42 50 0
Apoteket 32) 1.8 0.4–0.83) 0.03 40–604) 60
Apoteksgruppen 4 1.8 80 84 40 0
Bilprovningen 85) 8.4 30–40 44 80 95
Bostadsgaranti rf+36) 76.0 33 105
Green Cargo 107) neg 0.6-0.98) –0.6 50 0
Infranord 16 3.6 >33 24 50–75 0
Jernhusen 12 9.8 35–45 41 33 32
Lernia 59) 4.2 35–50 54 30–50 258
LKAB 12 0.9 0–0.210) 0 30–50 40
Metria 811) 2.8
PostNord 10.512) 2.7 0.1–0.513) 0.6 40–60 0
Samhall 7 5.0 >30 47 0 0
SAS 814) 0.4 >35 17 30–40 0
SJ 715) 10.1 0.5–1.016) 0.1 30–50 50
SOS Alarm 8 19.5 >30 26 517) 0
Specialfastigheter 8 11.9 25–35 41 50 215
SSC 6 6.2 0.3–0.5 0.1 30 30
Sveaskog 4.518) 5.0 0.3–0.619) 0.44 65–90 90
Svenska Spel >2220) 22.2 100 100
Svevia 13 17.4 >30 30 50–75 63
Swedavia 721) 10.3 1–1.522) 1.4 30–50 0
Swedesurvey >023) 24.0 >30 31
Swedfund rf24) neg
Systembolaget rf+725) 14.4 20–30 31 80–100 100
TeliaSonera >50 83
Teracom Boxer Group 17 17.1 >30 45 40–60 60
Vasallen rf+426) 10.2 >50 89 30–50 322
Vattenfall 927) neg 0.5–0.928) 0.61 40–60 0
FINANCIAL TARGETS
1) The return on operating capital, excluding changes in value, should be at least 6.5 per cent.
2) Operating margin
3) Debt/equity ratio, equity adjusted for pensions
4) Of net profit adjusted for net financial items from pensions and associated tax
5) Operating margin
6) Return on equity, five-year government bond rate plus 5 percentage points.
7) Return on operating capital
8) Net debt/equity ratio
9) Operating margin
10) Debt/equity ratio
11) Operating margin
12) Return on operating capital
13) Net debt/equity ratio
14) Operating margin
PROFITABILITY CAPITAL STRUCTURE DIVIDEND
Return on equity Core Tier I capital ratio Share of profit for the year
% Target Outcome 2014 Target Outcome 2014 Target Outcome 2014
SBAB 10 12.1 18–20 36.8 40 40
SEK 8.0 8.1 1629) 16.9 30 30
15) Return on operating capital
16) Net debt/equity ratio
17) Share of equity
18) Dividend yield
19) Net debt/equity ratio
20) Operating margin
21) Return on operating capital
22) Net debt/equity ratio
23) Operating margin
24) Average return on equity before tax, rf=average government bond yield with one-month maturity
25) Return on equity, rf=10-year government bond rate
26) Return on equity of risk-free interest plus 4 percentage points.
27) Return on capital employed
28) Debt/equity ratio
29) Target 16 per cent, but at least 12 per cent

32 ANNUAL REPORT STATE-OWNED COMPANIES 2014
HOW STATE-OWNED COMPANIES ARE GOVERNED
SUSTAINABLE BUSINESS
The purpose of the Government’s work on sustainable
business is for the state-owned companies to act in
such a way that they enjoy the trust of the public, while
safeguarding long-term growth in value. Ultimately, the
boards of the companies are responsible for the work
on sustainable business and are to set strategic sus-
tainability targets and strategies for achieving those
targets.
LONG-TERM VALUE CREATION
Sustainable business is of great importance to the state’s govern-ance. The Government is one of Sweden’s largest company own-ers and seeks, by means of sustainable business, to ensure secure long-term sustainable growth in value in its corporate holdings. The companies are administered by the State and are ultimately owned by the Swedish people and it is therefore natural that, as an owner, the state strives to be at the forefront in this area.
State-owned companies are to meet ambitious requirements and act in a manner that means they enjoy the confidence of the public. Customers, employees and other stakeholders expect these companies to act responsibly and contribute to more sus-tainable societal development.
Sustainable business entails operations being adapted to new expectations and external demands, just as they must respond to new business challenges such as competition, technological development and changed patterns of behaviour. When compa-nies fall short in dealing with sustainability challenges, this either gives rise to business risks that can have far-reaching con-
sequences for the company’s capacity to survive, or to a business opportunity being lost.
Companies that apply a strategic approach to sustainable busi-ness do so based on their business and/or public policy assign-ment and deal with relevant sustainability challenges. Conse-quently, the point of departure is that proactive and integrated sustainability work contributes positively to the company’s development.
SUSTAINABLE BUSINESS IN CORPORATE GOVERNANCE
The Government has a high level of ambition regarding sustain-able business. Sustainable business, controlled by means of established tools, forms an important and integral part of the state’s governance. The aim of corporate governance is for the state-owned companies to act as role models in the areas of the environment, human rights, working conditions, anti-corrup-tion, business ethics, and equality and diversity.
The companies act as role models by:
example, that boards set strategic targets for sustainability work and strategies for achieving these,
issuing sustainability reports and conducting an open and constructive dialogue with key stakeholders,
and industry, non-profit organisations and other stakeholders to improve efficiency and achieve even better results, and
-tal consideration, human rights, working conditions, anti-cor-ruption and business ethics.
SUSTAINABLE BUSINESS
Diversity
Equality
Business ethics
Anti- corruption
Working conditions
Human rights
Environment
Business model
Long-term
sustainable
business model
33ANNUAL REPORT STATE-OWNED COMPANIES 2014
HOW STATE-OWNED COMPANIES ARE GOVERNED
SUSTAINABLE BUSINESS
In connection with a raised level of ambition, the management organisation has invited board members and CEOs to partici-pate in a dialogue on the owner’s expectations regarding sustain-able business and continuously communicates these expecta-tions.
These expectations are stated in the State’s Ownership Policy (read more in the State’s Ownership Policy on p.122).
SUSTAINABLE BUSINESS – AN IMPORTANT PART OF THE
STRATEGY
On the government’s behalf, the boards of state-owned compa-nies have set targets and strategies for the strategically impor-tant areas of sustainable business. It is the board of a company that has the best understanding of which areas of sustainability within which it is most relevant to establish strategic sustaina-bility targets. Accordingly, it is the responsibility of the compa-nies, and not their annual general meetings, to determine these targets and strategies. The Government has defined a number of quality requirements for the targets – they should be:
-ity challenges,
TRANSPARENCY OF CONDUCT
State-owned companies should behave transparently towards their stakeholders. A transparent approach creates confidence, clarifies risks and opportunities, and gives stakeholders insight into the companies’ on-going efforts. This makes it possible to monitor gradual improvements and better understand the com-panies’ challenges and priorities. A dialogue with relevant stake-holders allows the companies to act as role models. The compa-nies gain a greater awareness of the issues around which they should communicate, which represents an important component in better understanding their external environment and thereby identify the areas that are important for the company to address – including both risks and opportunities.
In the Government’s guidelines for external reporting, the companies are required to publish, simultaneously with their annual accounts, an independently certified and quality assured sustainability report in accordance with the Global Reporting Initiative (GRI). By using the GRI as the starting point, opportu-nities are provided for comparisons over time and between com-panies in different sectors, both nationally and internationally. The state-owned companies continuously develop their reporting and for 2014, a number of state-owned companies have reported in accordance with the new GRI G4 reporting standard.
COOPERATIONS
Each year, all board members and CEOs of state-owned compa-nies are invited to a board seminar. The 2014 seminar was devoted to impact of shale gas on the European energy market and the creation of jobs for young people – both areas currently of great relevance to sustainable business.
Sweden has been an active participant in the development of the
OECD Guidelines on Corporate Governance of State-Owned Enter-
prises. The guidelines, which are non-binding, were drafted in 2005
and provide well-used support in the development of the governance
of state-owned companies in various countries. The Swedish Govern-
ment’s principles of corporate governance largely comply with these
guidelines. The guidelines can be found at www.oecd.org/datao-
ecd/46/51/ 34803211.pdf. During 2015, a review of the guidelines
is in progress, in which Sweden is actively involved. Further details
of the OECD’s work on corporate governance can be found at
http://www.oecd.org/daf/ca/.
Sweden maintains an ongoing dialogue with state ownership and gov-
ernance organisations in other countries to develop its own govern-
ance and to disseminate information about the Swedish ownership
and governance model, which is well in line with best practice in the
OECD area.
Sweden’s work arouses curiosity abroad
In 2014, the management organisation hosted delegations from vari-
ous countries with the aim of increasing their understanding of the
work on sustainable business in the Swedish state-owned compa-
nies. For some years, Sweden has had a statement of intent on CSR
with Chile and China, and in 2014 delegations from both countries
visited Sweden, partly to meet state-owned companies, and partly to
meet the management organisation to increase their knowledge of
how sustainable business is integrated into the corporate governance
model. The delegations consisted of representatives from the corre-
sponding management organisations.
INTERNATIONAL COOPERATION

34 ANNUAL REPORT STATE-OWNED COMPANIES 2014
HOW STATE-OWNED COMPANIES ARE GOVERNED
SUSTAINABLE BUSINESS
Furthermore, the state has established a network for sustaina-ble business to initiate and encourage exchanges of experience and network building between companies in which the Govern-ment is an owner. This provides the companies the opportunity for inspiration and to share their experience with the purpose of strengthening and enhancing the efficiency of efforts in sus-tainable business throughout the state-owned company port-folio. Depending on the theme, speakers are invited from the state-owned company portfolio as well as from the private sec-tor, special interest organisations and other expert organisa-tions. In 2014, the network met and discussed country risk, prin-ciples of children’s rights, the new GRI G4 guideline on sustainability reporting and current sustainability trends. In January 2014, network delegates also participated at an SNS event with Georg Kell, head of the UN Global Compact. The network is run and coordinated by the management organisa-tion, based on the company’s needs and wishes.
In 2014, the management organisation also conducted three workshops on the themes of diversity, ecosystem services and GRI G4. The purpose was to facilitate a more in-depth transfer of knowledge on specific themes in smaller groups.
INTERNATIONAL GUIDELINES
The state-owned companies shall observe international guide-lines regarding environmental consideration, human rights, working conditions, anti-corruption and business ethics: the ten principles in the UN’s Global Compact, the UN’s guiding princi-ples on business and human rights, and the OECD’s guidelines for multinational enterprises. This is particularly important for companies in particularly exposed sectors, or with operations in countries that are deficient in their observance of international guidelines.
POLICY AND GUIDELINES
The guidelines for the state-owned companies’ sustainability report-
ing, harmonise with many of the international standards and thus
form part of an international aspiration towards more sustainable
progress.
Some key international standards
The OECD’s Guidelines for Multinational Enterprises was an early
initiative (1976) to guide companies operating in an international
environment to observe international frameworks for sustainability
and responsible business in all areas of their operations. The guide-
lines are 44 governments’ joint recommendations to multinational
companies. They clarify the expectations on the companies from
the governments that have adopted them and the guidelines act as
a reference point for companies and other stakeholders. The OECD
countries and other signatory countries have undertaken to advance
the guidelines by establishing national contact points. In Sweden,
the Government, by way of the Ministry for Foreign Affairs, chairs
the national contact point, which serves to promote compliance
with the OECD guidelines for multinational companies. Among
other areas, the guidelines address human rights, the environment,
competition, anti-corruption, taxation and product liability.
Global Compact is a global UN initiative based on ten principles of
human rights, labour law, the environment and anti-corruption that
have been formulated based on the UN’s core conventions. Compa-
nies signing up to the Global Compact work to integrate the princi-
ples in their own operations. Since its inception in 2000, the
number of members, most of which are companies, has increased
steadily. Several state-owned companies have joined the Global
Compact. For a complete list, visit the Global Compact website:
www.unglobalcompact.org
The UN Guiding Principles on Business and Human Rights The
principle “Protect, respect and remedy” have been developed to
elucidate governments’ and companies’ respective responsibilities
in relation to the protection and promotion of human rights. Com-
panies have a responsibility to respect these rights in their busi-
ness and to ensure that they do not contribute to human rights
violations.
Global Reporting Initiative (GRI) consists of guidelines for the
reporting of sustainability work in a social, environmental and eco-
nomic perspective. In this way, it is a support and tool for compa-
nies and organisations to report their work on the basis of, for
example, the Global Compact and the OECD’s guidelines. GRI
serves to increase possibilities for monitoring and assessing com-
panies’ sustainability work and to increase comparability.

35ANNUAL REPORT STATE-OWNED COMPANIES 2014
HOW STATE-OWNED COMPANIES ARE GOVERNED
Collaboration and exchange of experience with
other companies and organisations is an impor-
tant part in the continuous development of their
efforts. To afford state-owned companies better
opportunities to develop their efforts, the state
has established a network and conducted work-
shops at which the companies meet to share
their experiences and knowledge in the area of
sustainable business.
In 2014, several workshops were organised on a range of current
themes, such as the GRI’s G4 reporting, ecosystem services and
a well-attended workshop on ecosystem services and diversity.
In the same year, the management organisation conducted a
review of the state-owned companies with a sustainability target
encompassing diversity. The review indicated that the companies
have different strengths in the area diversity. To increase the
usefulness of the companies’ efforts, a well-attended workshop
was conducted on the theme of diversity, at which the compa-
nies were encouraged to inspire and challenge one another.
Bilprovningen was one of the companies that played an active
role at the workshop. The company was early to identify diversity as
a strategically important issue in being an attractive employer with
high level of skill and customer satisfaction. Accordingly, consider-
able focus has been placed on increasing the number of female
employees and employees with a foreign background. “It’s about us
as a company reflecting the diversity of our customers but also
benefiting from the tremendous potential that exists if we can make
use of the skills found among those with a foreign background.
Greater diversity increases our skills, our creativity and our customer
satisfaction,” says Bilprovningen’s CEO, Benny Örnerfors.
During the workshop on diversity, Bilprovningen shared its suc-
cess factors and, among other things, related its experiences of
successful activities to recruit women and people with foreign
backgrounds and the importance of cooperating with other actors.
Bilprovningen often participates in the network activities arranged
for the state-owned companies and finds great value in meeting
other companies and actors. “For me personally, the meetings have
provided a valuable network. But hearing from others has also
provided inspiration for new solutions and new partnerships,” says
Benny Örnerfors. “The fact that the state has such high ambitions
for sustainable business also makes me very proud of the work we
do. The efforts of the state-owned companies sends ripples beyond
the public sphere,” Benny Örnerfors concludes.
Collaboration for increased diversity BILPROVNINGEN

36 ANNUAL REPORT STATE-OWNED COMPANIES 2014
HOW STATE-OWNED COMPANIES ARE GOVERNED
SUSTAINABLE BUSINESS
MONITORING OF THE COMPANIES WORK ON SUSTAINABLE
BUSINESS
In 2014, the owner initiated efforts to monitor the sustainability targets set by the companies’ boards. In the dialogue with the owner, the strategic sustainability targets and their monitoring have formed an important part of the ongoing review process. The companies have presented their targets and explained how the objectives are to be achieved and measured. In certain cases, concrete results have also been presented. The targets are long term and in 2014 the focus of the dialogue with the companies was on the design of the targets and their relevance to the com-panies’ business operations and sustainability challenges.
To monitor and analyse the companies’ work with sustainable business, a sustainability analysis has been developed by the management organisation within the Ministry of Enterprise and Innovation. The analysis serves to increase the awareness of the companies’ sustainability challenges within the investment
teams for company holdings. The analysis is based on broad business intelligence that takes into account global trends, risks and opportunities linked to the value chain in which the com-pany operates. The investment team identifies relevant areas for analysis, and then analyses how the company is working to deal with selected areas through its governance processes. The results of the analysis are used in the active ownership process, that is, in the dialogue with the owner, the board nomination process, the process of setting financial targets and the process of setting public policy targets. The analysis provides a foundation for a shared and predictable starting point in the dialogue between the owner and the company and provides the conditions for the long-term and consistent governance of the companies. The first analyses were performed during 2014. In 2015, the analysis will, to an even greater extent, form an integral part of the process for developing financial targets. This makes the process more effi-cient and reduces the risk of conflicting objectives.
SUSTAINABILITY ANALYSIS PROCESS
COMPARISON
Comparison with
“Best practise”
in the area
CORPORATE ANALYSISCOUNTRY AND SECTOR ANALYSIS
Identification
of relevant:
Sector-related
key issues:
Country-related
key issues:
Analysis of the
com pany’s
management of:
governance
communications
CONCLUSION
The result is used
in corporate
governance:
MIN
ISTR
Y O
F E
NTE
R-
PR
ISE
AN
D IN
NO
VATIO
N
CO
MPA
NY/
BO
AR
D
GLOBAL TRENDS
THE WORK OF THE COMPANY AND THE BOARD ON SUSTAINABLE BUSINESS IS A SEPARATE PROCESS

37ANNUAL REPORT STATE-OWNED COMPANIES 2014
HOW STATE-OWNED COMPANIES ARE GOVERNED
The boards of state-owned companies are tasked
with setting strategic sustainability targets.
Among other things, the targets shall be long-
term, measurable and relevant to the operations.
Most of the targets were set by the boards at the
end of 2013 and 2014 was a year during which
the companies implemented the targets in their
operations and integrated them into both busi-
ness plans and activities. Infranord’s makes no
distinction between strategic targets and sustain-
ability targets.
“This is a process that cannot be rushed. Strategic areas must
be identified, the appropriate key performance indicators defined
and measurements must be made to determine the starting point
– after that, the company can set long-term targets. Solid
groundwork is essential to integrate these issues in the work of
the board, management and the entire operations,” says Eva
Färnstrand, Chairman of the Board of Infranord since 2012. The
company was formed five years ago and works with operation and
maintenance, as well as rebuilding and new construction of
railways in Sweden and Norway. The process of developing
sustainability targets went hand in hand with the company’s strategy
process, which resulted in the board making no distinction between
the company’s strategic targets and its sustainability targets.
Instead, the board views the prioritised areas as important for the
company’s long-term sustainable development.
In 2013, Infranord adopted four overarching areas of focus with
long-term targets: zero workplace accidents, zero negative devia-
tions from planned financial performance, zero ethical irregularities
and zero environmental incidents. The strategic sustainability tar-
gets have been supplemented with more detailed annual targets for
2014 and 2015 and, based on measurements from these years, a
three-year target is to be set. At the 2014 strategy meeting, we
discussed whether we had identified the correct environmental
areas and assessed the action plan. On the board of Infranord, we
are now monitoring the targets,” says Eva Färnstrand. “In the longer
term, we can add further indicators, but right now, the most impor-
tant thing is to work with the areas we have prioritised.”
Eva Färnstrand says: “The management organisation has provided
us with valuable support in the process of developing the sustain-
ability targets, through support processes, quality requirements and
seminars for the Chairman and CEO. The targets are also reviewed
in the dialogue with the owner and the CEO meets with the State
Secretary and Minister responsible. I am proud that the owner
tasked us with setting sustainability targets. This shows that the
state seeks to be at the forefront and that sustainable business is
important.”
Sustainable targets are integrated into operations INFRANORD

38 ANNUAL REPORT STATE-OWNED COMPANIES 2014
HOW STATE-OWNED COMPANIES ARE GOVERNED
Common to the companies with specifically adopted
public policy assignments is that traditional financial
assessment does not provide an accurate or complete
picture of the value these companies generate. Public
policy targets are used to assess how well the public
policy assignments are performed.
Certain state-owned companies have public policy assignments specifically adopted by the Riksdag and these can differ in char-acter. For example, companies may operate in markets where so-called externalities arise that are not covered by pricing. A typical example is an infrastructure company that owns bridges or airports and whose activities, besides the direct value to the owner, also provide positive effects for society as a whole. This occurs because improved transport opportunities foster flexibil-ity in the labour and housing markets, which in turn benefits the national economy. Swedavia, which operates most of Swe-den’s major airports, is an example of an infrastructure company with a specifically adopted public policy assignment. Further examples of companies with specifically adopted public policy assignments are Samhall, whose public policy assignment entails the company providing meaningful and stimulating jobs for people with reduced functionality, and RISE, which is to help develop the industrial research institutes, to thereby strengthen the competitiveness of Swedish trade and industry.
PUBLIC POLICY TARGETS
The management organisation has developed a uniform met hodology and process for setting and monitoring targets for specifically adopted public policy assignments, known as public policy targets, for the companies managed by the Ministry of Enterprise and Innovation.
The purpose of setting public policy targets for the companies is to:
assignments determined by the Riksdag,
performance of the specifically adopted public policy assign-ments,
stakeholders, and to
take the public policy targets into account.
WHAT IS A SPECIFICALLY ADOPTED PUBLIC POLICY
ASSIGNMENT?
When the Riksdag commissions a company to conduct
operations serving to generate effects other than a
financial return for the owner, this constitutes a specific
public policy assignment.
PUBLIC POLICY TARGETS
PUBLIC POLICY TARGETS
Assignment
fulfilment
Follow-up
and dialogue
Elucidate
costsPUBLIC POLICY
TARGETS
Basis
for financial
targets
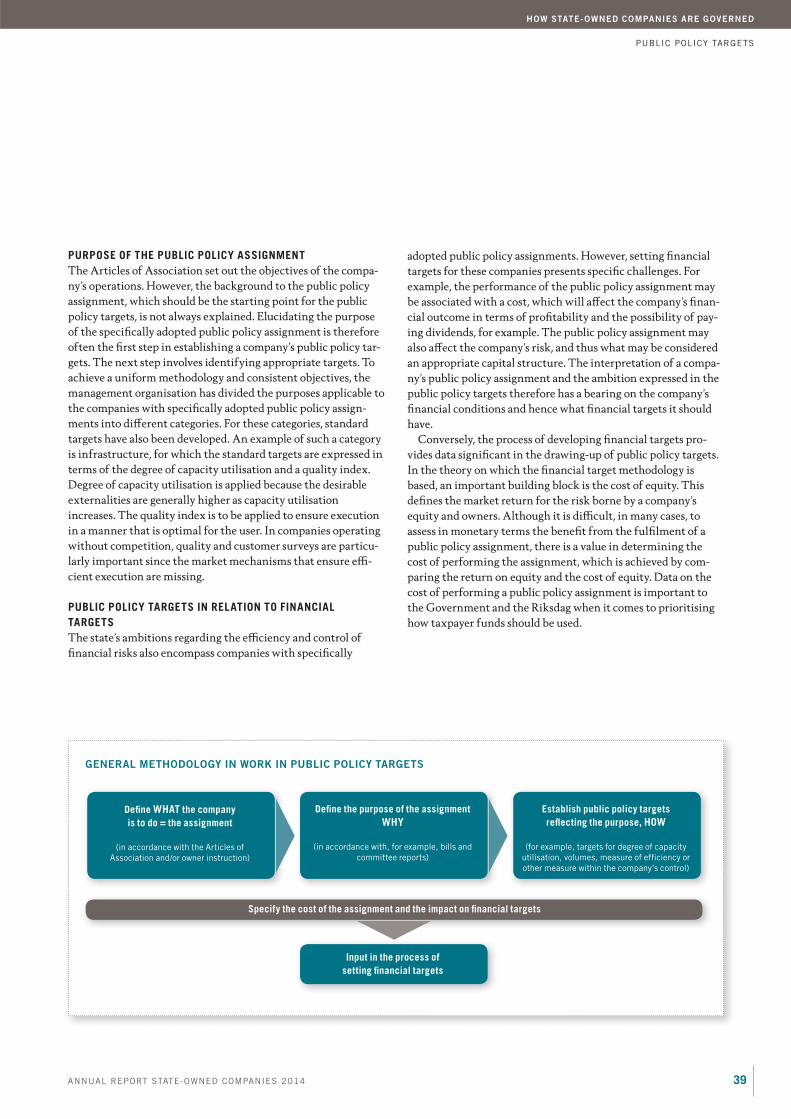
39ANNUAL REPORT STATE-OWNED COMPANIES 2014
HOW STATE-OWNED COMPANIES ARE GOVERNED
PUBLIC POLICY TARGETS
PURPOSE OF THE PUBLIC POLICY ASSIGNMENT
The Articles of Association set out the objectives of the compa-ny’s operations. However, the background to the public policy assignment, which should be the starting point for the public policy targets, is not always explained. Elucidating the purpose of the specifically adopted public policy assignment is therefore often the first step in establishing a company’s public policy tar-gets. The next step involves identifying appropriate targets. To achieve a uniform methodology and consistent objectives, the management organisation has divided the purposes applicable to the companies with specifically adopted public policy assign-ments into different categories. For these categories, standard targets have also been developed. An example of such a category is infrastructure, for which the standard targets are expressed in terms of the degree of capacity utilisation and a quality index. Degree of capacity utilisation is applied because the desirable externalities are generally higher as capacity utilisation increases. The quality index is to be applied to ensure execution in a manner that is optimal for the user. In companies operating without competition, quality and customer surveys are particu-larly important since the market mechanisms that ensure effi-cient execution are missing.
PUBLIC POLICY TARGETS IN RELATION TO FINANCIAL
TARGETS
The state’s ambitions regarding the efficiency and control of financial risks also encompass companies with specifically
adopted public policy assignments. However, setting financial targets for these companies presents specific challenges. For example, the performance of the public policy assignment may be associated with a cost, which will affect the company’s finan-cial outcome in terms of profitability and the possibility of pay-ing dividends, for example. The public policy assignment may also affect the company’s risk, and thus what may be considered an appropriate capital structure. The interpretation of a compa-ny’s public policy assignment and the ambition expressed in the public policy targets therefore has a bearing on the company’s financial conditions and hence what financial targets it should have.
Conversely, the process of developing financial targets pro-vides data significant in the drawing-up of public policy targets. In the theory on which the financial target methodology is based, an important building block is the cost of equity. This defines the market return for the risk borne by a company’s equity and owners. Although it is difficult, in many cases, to assess in monetary terms the benefit from the fulfilment of a public policy assignment, there is a value in determining the cost of performing the assignment, which is achieved by com-paring the return on equity and the cost of equity. Data on the cost of performing a public policy assignment is important to the Government and the Riksdag when it comes to prioritising how taxpayer funds should be used.
GENERAL METHODOLOGY IN WORK IN PUBLIC POLICY TARGETS
Define WHAT the company
is to do = the assignment
(in accordance with the Articles of
Association and/or owner instruction)
Define the purpose of the assignment
WHY
(in accordance with, for example, bills and
committee reports)
Input in the process of
setting financial targets
Specify the cost of the assignment and the impact on financial targets
Establish public policy targets
reflecting the purpose, HOW
(for example, targets for degree of capacity
utilisation, volumes, measure of efficiency or
other measure within the company’s control)

40 ANNUAL REPORT STATE-OWNED COMPANIES 2014
HOW STATE-OWNED COMPANIES ARE GOVERNED
COMPANY CASE
At SEK’s Annual General Meeting in April 2015, reso-
lutions were made regarding new financial targets,
public policy targets and a new owner instruction. This
was the result of a major, three-part project carried out
in 2014 at the owner’s initiative. When it became
necessary to review the company’s financial targets, a
comprehensive initiative was taken addressing targets,
owner instruction and sustainability analysis – all in an
integrated process.
It was necessary to review SEK’s financial targets due to amended
requirements in the regulations on capital and liquidity. In connection
with this, it was also decided to perform a review of the company’s
owner instruction, develop public policy targets and carry out a sustain-
ability analysis of SEK’s operations.
The sustainability analysis and public policy targets are relatively new
tools in the management of the state-owned companies. The sustainabil-
ity analysis serves to increase the knowledge of the management organi-
sation in relevant areas of sustainability thereby integrating sustainable
business into corporate governance – in owner dialogues, board nomina-
tions processes and in the process of setting financial targets. Public
policy targets are developed for companies with public policy assign-
ments specifically adopted by the Riksdag. The purpose of the public
policy targets is to enable measurement and monitoring of how well the
companies are fulfilling their public policy assignments. Since the
results of the sustainability analysis and the level of ambition for finan-
cial goals and public policy targets can affect one another, it is impor-
tant that these be developed in parallel in an integrated process.
In the SEK project, efforts were conducted in three parallel work
flows to achieve integrated and well balanced targets. Together with the
company’s heads of Finance and IT, the investment director and invest-
ment manager responsible for SEK within the management organisation
initiated the process to develop both financial targets and public policy
targets. The company’s CEO and those responsible for risk, lending and
borrowing participated in the process, which encompassed analyses of
the market, regulatory framework and business plan. At the same time,
together with the individual responsible for sustainability issues at the
company, a second investmemnt manager and a sustainability expert
from the management organisation initiated the process of performing a
sustainability analysis.
The sustainability analysis, which includes a mapping of both oppor-
tunities and risks, defined the most significant risks for SEK as those
related to the projects or companies that SEK finances. This risk map-
ping then served as input for both the financial targets and public policy
targets. An example of a clear influence between sustainability and the
assignment is that the projects financed by SEK can give rise to both
positive and negative sustainability impacts while being able to promote
the Swedish export sector, which is SEK’s assignment. The project was
able to conclude that SEK already works with sustainability and credit
risks in an integrated manner in its credit process. However, the project
recommended that, when approving loans, the board should, more
clearly and in a structured manner, include the positive effects associ-
ated with both the assignment and aspects of sustainability.
There are clear links between the assignment and financial targets.
An important issue that needed to be elucidated, and that is related
directly to the company’s capital structure, involved SEK’s assignment.
It concerned what the company’s role should be during periods of finan-
cial crises, for example, when the market cannot adequately provide the
Swedish export sector with financing.
The various sub-projects resulted partly in updated financial targets,
partly in new public policy targets in the form of a customer survey and
stakeholder dialogue, and partly in a sustainability analysis. With all this
in place, a review was also made of the company’s owner instruction,
based on the discussions held during the project. The result was a
clearer, easier-to-use owner instruction that makes it easier for the
company to develop its operations in line with changes in the market
and customer needs. The new financial targets and public policy targets
are detailed in the company overview section on p. 79.
SEK – holistic approach to review and new targets
EXAMPLES FROM THE SUSTAINABILITY ANALYSIS
As an example of the results of the sustainability analysis, the
project’s comments and recommendations to the board regarding
sustainability are presented here.
Comment
SEK has established a process for mitigating risks with regard to
anti-corruption, the environment, human rights and working condi-
tions by means of a high level of risk awareness and compliance
with international standards.
Recommendations
1. Proactive work (risk analysis, due diligence and monitoring) in
anti-corruption should be strengthened.
2. In transactions where a high level of risk is deemed to exist, it is
recommended that the board take both positive and negative
effects into account in a structured manner.
3. Continue to implement relevant international guidelines – the
Equator Principles being the most relevant – as a complement
to the “OECD Common Approaches”.
4. Clarify the objectives for SEK’s work to contribute to sustainable
development.

41ANNUAL REPORT STATE-OWNED COMPANIES 2014
HOW STATE-OWNED COMPANIES ARE GOVERNED
COMPANY CASE
AB Svensk Exportkredit (SEK) promotes the Swedish export sector by offering financing solutions.
AB SVENSK EXPORTKREDIT
MANAGEMENT’S VIEW
Catrin Fransson, CEO
“The process has
resulted in the organisa-
tion being better able to
understand the reason-
ing of the owner. There
are fewer areas of uncertainty regarding our
assignment and the targets facilitate the
assessment of our work. The sustainability
analysis has indicated additional issues on
which we need to work. The new financial
targets and the review of our business and
external environment have really motivated
our on-going process to create a more flat
customer-oriented organisation.”
Johan Henningsson,
Sustainability Manager
“With the sustainability
analysis, we have had
the opportunity to
deepen our discussion
with the management organisation regard-
ing our key sustainability issues. This has
been both important and rewarding for us.
We now have a common understanding of
how we currently manage sustainability
effects in connection with our lending,
what the challenges facing us in the future
look like and what improvements we can
continue to work with.”
Susanna Rystedt,
CFO and IT Manager
“Our collaboration with
the management organi-
sation regarding the
development of new
financial targets and public policy targets
has been very good. A clear and positive
process is in place that has resulted in a
favourable dialogue on the targets associ-
ated with SEK’s assignment and the condi-
tions in the market. The result is clear and
challenging targets that are completely in
line with our business plan.”

42 ANNUAL REPORT STATE-OWNED COMPANIES 2014
HOW STATE-OWNED COMPANIES ARE GOVERNED
REMUNERATION AND OTHER TERMS OF EMPLOYMENT
Since remuneration to senior executives in trade and
industry is a significant issue of confidence, the state-
owned companies should pay managers carefully con-
sidered salaries and pensions.
A MATTER OF CONFIDENCE
Today, the demand for sound remuneration systems has become one of the most important issues of corporate governance, both in Sweden and abroad. Remunerations are criticised for not being transparent, being approved in the wrong way, being too high, and causing a sense of injustice within companies and in society.
Reasonable and well-considered remunerations for senior executives play an important role in the corporate governance of the state-owned companies. The behaviour of the state-owned companies and their representatives is subject to demanding external expectations, and it is important for the state to be a clear, professional and responsible owner.
GUIDELINES FOR TERMS OF EMPLOYMENT
On 20 April 2009, the Government adopted guidelines on terms of employment for senior executives in state-owned companies (see the guidelines in full on p. 128). In these guidelines, the pos-sibility of paying variable salaries to senior executives was removed. In companies where the state is directly or indirectly one of several owners, the Government should, in dialogue with the other owners, act in favour of its guidelines being applied as far as possible. The boards of the state-owned companies are responsible for the Government’s guidelines on terms of employment for senior executives being applied.
According to the remuneration principles in the guidelines, total remuneration to senior executives should be reasonable and carefully considered. It should also be competitive, have a set ceiling and be appropriate, while fostering sound ethics and a
good corporate culture. Remuneration should not be wage-lead-ing in relation to comparable companies, but should be pervaded by moderation. The guidelines further state that this should also serve as standard for total remunerations to other employees.
PERFORMANCE REVIEW
The Government Offices continuously monitor remuneration levels in the companies with state ownership. The Government Offices have commissioned a consulting company to examine compliance with the Government’s guidelines on terms of employment for senior executives. This survey was based on the companies’ own data on terms of employment and remunera-tion of senior executives. The study examines how the compa-nies adhere to the guidelines and compares compensation levels in the companies with market data from private companies that provide relevant benchmarks in terms of size and sector. For each company, five to ten peer companies have been identified, with a total of more than 350 peer companies being included in the survey.
The starting point for the survey has been whether or not total remuneration to the CEO and other senior executives has been “competitive but not wage-leading”, as expressed in the Government’s guidelines. Total remuneration refers to all fixed and variable remuneration and benefits paid to the employee, including pension premiums.
PROPORTION OF CEOS WITH DEFINED BENEFIT PENSION
PLANS REMAINS UNCHANGED
The proportion of CEOs with defined-benefit pension plans remains unchanged. In 2014, slightly less than a quarter (22.2 per cent) of all CEOs, and four out of ten (40.9 per cent) other senior executives had defined-benefit pension plans. For senior execu-tives, this is based mainly on applicable collective agreements and does not therefore conflict with the guidelines. Other cases involve old agreements that have yet to be renegotiated.
CERTAIN POSITIVE TREND IN COMPLIANCE
The 2014 follow-up on the “Guidelines for terms of employment for
senior executives reveals that:
– No CEO of a state-owned company receives variable
remuneration,
– The number of people entitled to retire before the age of 62 is
unchanged,
– The proportion of CEOs with defined-benefit pension plans is
largely unchanged, and
– The number of companies and individuals with variable
remuneration in the group other senior executives has declined.

43ANNUAL REPORT STATE-OWNED COMPANIES 2014
HOW STATE-OWNED COMPANIES ARE GOVERNED
REMUNERATION AND OTHER TERMS OF EMPLOYMENT
Market: For each state-owned company, 5–10 comparison companies have been identified (in total more than 350 companies) which comprise the “Market”.
Size: All of the companies were weighted and divided by size according to number of employees (25 per cent), turnover (25 per cent), total assets (25 per cent) and a qualitative
factor (25 per cent).
Total remuneration includes all fixed and variable remuneration and benefits to the employee including pension plans.
TOTAL REMUNERATION TO SENIOR EXECUTIVES
TOTAL REMUNERATION TO CEOS
0.10 0.2 0.7 0.80.3 0.4 0.5 0.6
SEKm
Size
14
12
10
8
6
4
2
0
SEKm
35
30
25
20
15
10
5
00.10 0.2 0.3 0.4 0.5 0.6 0.7 0.8
Size
In 2014, pension benefits accounted for approximately 27.5 per cent of total average remuneration in the state-owned compa-nies, which is in line with the private market.
According to the Government guidelines, on termination by the company, the period of notice shall not to exceed six months and severance pay shall not be paid for more than 18 months. Consequently, the combined period of notice and severance pay shall not exceed 24 months. With the exception of one individ-ual (out of a total of 382 persons in the compiled data), all senior executives have a combined period of notice and severance pay of 24 months or less.
According to the Government guidelines, retirement age in the companies shall not be lower than 62 and should be at least 65. One CEO and four senior executives have a retirement age of less than 62.
upper quartile for comparison companies
median for comparison companies
lower quartile for comparison companies
upper quartile for state-owned companies of a certain size
median for state-owned companies of a certain size
lower quartile for state-owned companies of a certain size
CEO SALARIES BELOW MARKET TREND
Over the period 2009–2014, total remuneration to CEOs in state-owned companies increased on an average 3.7 per cent annually, which is below the market increase of 4.6 per cent annually. The trend in total remuneration to CEOs in the com-panies was below the market average for these years. For most of the CEOs, their remuneration is close to the median for the mar-ket, and between the upper and lower quartiles. In one of the companies, total remuneration to the CEO is above the market’s upper quartile. Fifteen CEOs have total remuneration exceeding SEK 5 million, which is below the market average and the upper quartile. See figure below.

44 ANNUAL REPORT STATE-OWNED COMPANIES 2014
HOW STATE-OWNED COMPANIES ARE GOVERNED
STATE-OWNED COMPANY PORTFOLIOSTATE-OWNED COMPANY PORTFOLIO
In 2014, the combined profits of the state-owned
companies rose by 16 per cent, mainly due to lower
impairments in Vattenfall, but also due to rising mar-
ket values in Akademiska Hus’ property portfolio.
Lower electricity prices and sharply falling iron ore
prices held profits back.
TURNOVER
The state-owned companies’ turnover in 2014 fell by 2 per cent compared with the previous year and amounted to SEK 350.1 (357.4) billion. Total turnover, including the state’s holdings in associated companies,1) decreased by 2 per cent in 2014. Vatten-fall accounts for 47 (48) per cent of turnover in the state-owned company portfolio and 42 (42) per cent when the associated com-panies are included. Lower prices and volumes contributed to the company’s sales falling by SEK 6.3 billion in 2014 compared with the preceding year. Compared with 2013, LKAB’s turnover decreased by 14 per cent or SEK 3.3 billion due to lower iron ore prices. Turnover in SBAB and Systembolaget both increased by SEK 0.7 billion.
PROFIT
Profit after tax amounted to SEK 16.4 (14.2) billion in 2014. Vattenfall’s loss after tax for 2014 was SEK 8.3 billion, represent-ing an improvement in earnings of SEK 5.6 billion compared with 2013. In Akademiska Hus, profit increased by SEK 2.6 bil-lion as a consequence of positive, unrealised changes in property
values. In SBAB and Swedavia, profit rose by SEK 0.4 billion for each company. In LKAB, profit fell by SEK 5.7 billion to SEK 0.3 billion, the state’s participation in TeliaSonera’s profit decreased by SEK 0.5 billion to SEK 5.8 billion. Svenska Spel’s profit decreased by SEK 0.5 billion. The state’s share in the profits of SAS fell by SEK 0.4 billion.
CASH FLOW
Cash flow from operating activities, excluding the financial sector companies (SBAB and SEK), amounted to SEK 65.3 (65.0) billion. Vattenfall’s cash flow strengthened by SEK 2.3 billion to SEK 40.1 billion. Vattenfall’s cash flow represents slightly more than 60 per cent of the entire portfolio’s cash flow.
INVESTMENT
Compared to 2013, gross investments in 2014 decreased by 10 per cent, from SEK 52.8 billion to SEK 47.5 billion. Total investment was dominated by Vattenfall’s investments of nearly SEK 29 bil-lion, representing an increase of 5 per cent compared with 2013. LKAB’s investments of SEK 5.5 billion were 11 per cent higher than in 2013 and Akademiska Hus’ investments rose to SEK 3.0 billion. Investments by PostNord, Swedavia, Svevia and Svenska Spel declined sharply over the year to SEK 1.8 billion, SEK 0.9 billion, SEK 0.5 billion and SEK 0.5 billion respectively.
PROPOSED DIVIDENDS
For the 2014 fiscal year, dividends from the state-owned compa-nies are expected to amount to SEK 18.1 (17.7) billion. Dividends are slightly higher than in the preceding year.
1) Includes the associated companies on the basis of the state’s share of equity.
TURNOVER
First six months Second six months SEKm
NET PROFIT 1)
First six months Second six monthsSEKm
h 1 h 2 h 1 h 2 h 1 h 2 h 1 h 20
50,000
100,000
150,000
200,000
250,000
2011 2012 2013 2014
h 1 h 2 h 1 h 2 h 1 h 2 h 1 h 2–5,000
0
5,000
10,000
15,000
20,000
25,000
30,000
2011 2012 2013 2014

45ANNUAL REPORT STATE-OWNED COMPANIES 2014
HOW STATE-OWNED COMPANIES ARE GOVERNED
STATE-OWNED COMPANY PORTFOLIOSTATE-OWNED COMPANY PORTFOLIO
GROSS INVESTMENTS1)
2014SEKm
2013SEKm
Change, SEKm
Change%
Total 47,486 52,766 –5,280 –10.0
Vattenfall 29,032 27,761 1,271 4.6
TeliaSonera2) 17,899 17,793 106 0.6
LKAB 5,491 6,141 –650 –10.6
Akademiska Hus 3,007 2,758 249 9.0
PostNord 1,846 2,591 –745 –28.8
Jernhusen 1,199 1,294 –96 –7.4
Systembolaget 1,050 1,234 –184 –14.9
Swedavia 924 2,413 –1,489 –61.7
SJ 828 527 301 57.2
Svevia 544 1,426 –882 –61.9
Svenska Spel 466 3,163 –2,697 –85.3
Fouriertransform 398 408 –9 –2.3
Specialfastigheter 374 497 –123 –24.7
Teracom Boxer Group 284 348 –64 –18.4
RISE Research Institutes of Sweden 227 306 –79 –25.8
Almi Företagspartner 221 222 –1 –0.3
Svedab 216 239 –23 –9.6
Inlandsinnovation 166 275 –109 –39.6
Vasallen 165 56 109 194.6
Green Cargo 163 343 –180 –52.5
SSC (Svenska rymdaktiebolaget) 158 71 88 124.4
Infranord 146 88 58 65.9
Sveaskog 133 212 –79 –37.3
ESS (European Spallation Source) 129 6 123 2,201.8
Other 318 388 –70 –180
1) The table includes the companies whose gross investments exceeded SEK 100
million in 2014.
2) Since TeliaSonera is an associated company, its investments are shown only for
information purposes and are not included in the total.
DIRECT STATE FUNDING
Among the state-owned companies, there are some that receive direct funding from the state to perform particular assignments or operations. Dramaten and Operan, for example, receive funding as national stages for spoken theatre and opera/ballet respectively. Of this funding, 72 per cent goes to Samhall, which receives an appropriation to perform its core labour market policy assignment to provide rewarding jobs for people with disabilities, and 6 per cent to RISE to invest in structural and skill development. In 2014, state-owned companies received SEK 6.1 billion in appropriations.
DIVESTMENTS
In 2013, the Government sold the state’s shareholdings in Nordea Bank and Vectura Consulting, generating revenues of SEK 42.0 billion. No shares were sold in 2014.
DISTRIBUTION OF TURNOVER JAN–DEC 2014 1)
INCLUDING ASSOCIATED COMPANIES
Vattenfall 41.8 %
PostNord 10.1 %
SJ 2.3 %
LKAB 5.2 %
TeliaSonera 9.5 %
Apoteket 4.7 %
Systembolaget 6.7 %
Other 19.7 %
NET PROFIT FOR JAN–DEC 2014 (SEK MILLION), 1)
COMPANIES WITH THE GREATEST IMPACT ON EARNINGS
–15,000 –10,000 –5,000 0 5,000 10,000 15,000 20,000
Vattenfall
Akademiska Hus
Svenska Spel
Sveaskog
TeliaSonera
Specialfastigheter
SEK
Other
TOTAL
–8,284
5,817
5,215
4,763
1,691
1,390
1,260
4,671
16,523
APPROPRIATION/TURNOVER FOR 2014
SEKm
Approp-
riation
2014
Net turnover
2014
Percentage of
financing
through
appropriation, %
Almi Företagspartner 260 1,074 24
Dramaten 227 289 79
Göta kanalbolag 25 73 34
Operan 447 523 86
PostNord 24 40,582 0
RISE Research Institutes of Sweden 361 1,993 18
Samhall 4,405 7,452 59
SOS Alarm 214 953 22
Swedfund3) 34 161 21
Teracom Boxer Group 3 3,849 0
VisitSweden 125 245 51
Voksenåsen 10 70 14
Total 6,135 57,264 11
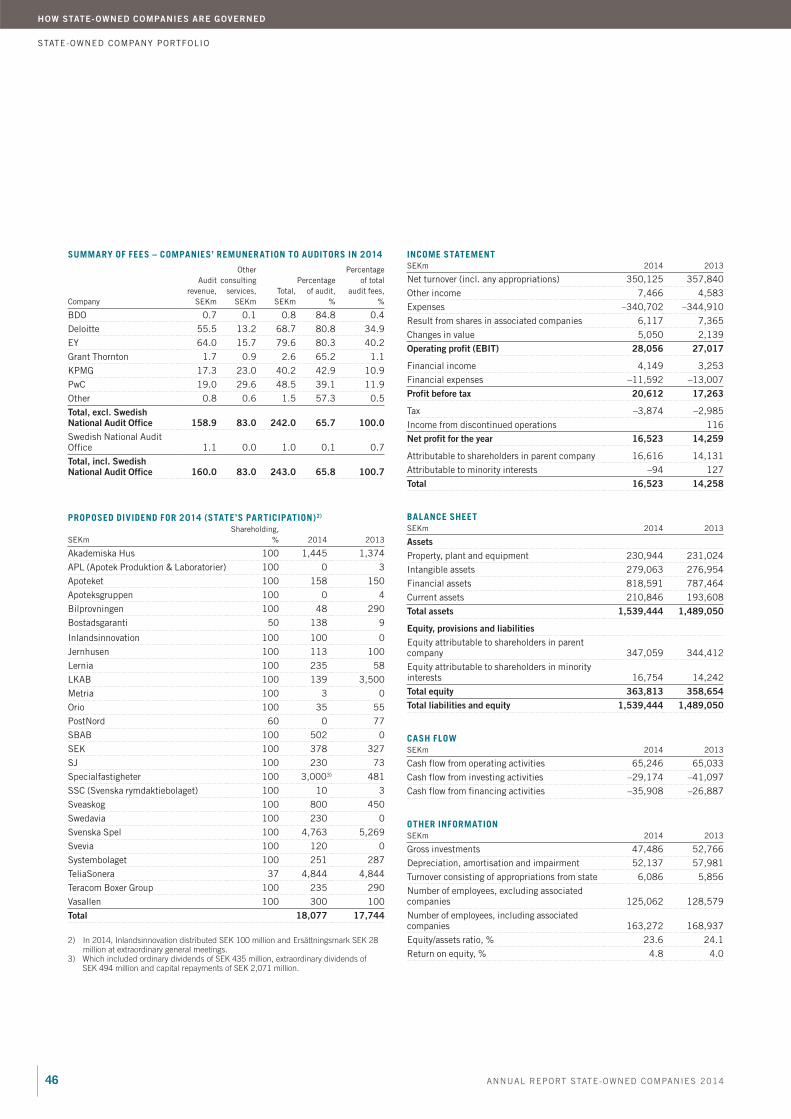
46 ANNUAL REPORT STATE-OWNED COMPANIES 2014
HOW STATE-OWNED COMPANIES ARE GOVERNED
STATE-OWNED COMPANY PORTFOLIO
INCOME STATEMENTSEKm 2014 2013
Net turnover (incl. any appropriations) 350,125 357,840
Other income 7,466 4,583
Expenses –340,702 –344,910
Result from shares in associated companies 6,117 7,365
Changes in value 5,050 2,139
Operating profit (EBIT) 28,056 27,017
Financial income 4,149 3,253
Financial expenses –11,592 –13,007
Profit before tax 20,612 17,263
Tax –3,874 –2,985
Income from discontinued operations 116
Net profit for the year 16,523 14,259
Attributable to shareholders in parent company 16,616 14,131
Attributable to minority interests –94 127
Total 16,523 14,258
BALANCE SHEETSEKm 2014 2013
Assets
Property, plant and equipment 230,944 231,024
Intangible assets 279,063 276,954
Financial assets 818,591 787,464
Current assets 210,846 193,608
Total assets 1,539,444 1,489,050
Equity, provisions and liabilities
Equity attributable to shareholders in parent company 347,059 344,412
Equity attributable to shareholders in minority interests 16,754 14,242
Total equity 363,813 358,654
Total liabilities and equity 1,539,444 1,489,050
CASH FLOWSEKm 2014 2013
Cash flow from operating activities 65,246 65,033
Cash flow from investing activities –29,174 –41,097
Cash flow from financing activities –35,908 –26,887
OTHER INFORMATIONSEKm 2014 2013
Gross investments 47,486 52,766
Depreciation, amortisation and impairment 52,137 57,981
Turnover consisting of appropriations from state 6,086 5,856
Number of employees, excluding associated companies 125,062 128,579
Number of employees, including associated companies 163,272 168,937
Equity/assets ratio, % 23.6 24.1
Return on equity, % 4.8 4.0
PROPOSED DIVIDEND FOR 2014 (STATE’S PARTICIPATION)2)
SEKm
Shareholding,
% 2014 2013
Akademiska Hus 100 1,445 1,374
APL (Apotek Produktion & Laboratorier) 100 0 3
Apoteket 100 158 150
Apoteksgruppen 100 0 4
Bilprovningen 100 48 290
Bostadsgaranti 50 138 9
Inlandsinnovation 100 100 0
Jernhusen 100 113 100
Lernia 100 235 58
LKAB 100 139 3,500
Metria 100 3 0
Orio 100 35 55
PostNord 60 0 77
SBAB 100 502 0
SEK 100 378 327
SJ 100 230 73
Specialfastigheter 100 3,0003) 481
SSC (Svenska rymdaktiebolaget) 100 10 3
Sveaskog 100 800 450
Swedavia 100 230 0
Svenska Spel 100 4,763 5,269
Svevia 100 120 0
Systembolaget 100 251 287
TeliaSonera 37 4,844 4,844
Teracom Boxer Group 100 235 290
Vasallen 100 300 100
Total 18,077 17,744
SUMMARY OF FEES – COMPANIES’ REMUNERATION TO AUDITORS IN 2014
Company
Audit
revenue,
SEKm
Other
consulting
services,
SEKm
Total,
SEKm
Percentage
of audit,
%
Percentage
of total
audit fees,
%
BDO 0.7 0.1 0.8 84.8 0.4
Deloitte 55.5 13.2 68.7 80.8 34.9
EY 64.0 15.7 79.6 80.3 40.2
Grant Thornton 1.7 0.9 2.6 65.2 1.1
KPMG 17.3 23.0 40.2 42.9 10.9
PwC 19.0 29.6 48.5 39.1 11.9
Other 0.8 0.6 1.5 57.3 0.5
Total, excl. Swedish National Audit Office 158.9 83.0 242.0 65.7 100.0
Swedish National Audit Office 1.1 0.0 1.0 0.1 0.7
Total, incl. Swedish National Audit Office 160.0 83.0 243.0 65.8 100.7

47ANNUAL REPORT STATE-OWNED COMPANIES 2014
HOW STATE-OWNED COMPANIES ARE GOVERNED
VALUATION OF THE COMPANY PORTFOLIO
The value of the state-owned company portfolio is
assessed annually. At the end of 2014, the value was
estimated at SEK 460 billion.
ANNUAL VALUATION
The value of the state-owned companies is assessed annually and the estimated value of the state’s holdings is published in con-nection with this Annual Report. The value pertains to the end of 2014.
VALUATION METHODS
Companies corresponding to about 95 per cent of the total port-folio value are assessed based on cash flow assessments and sup-plementary relative valuations. Property companies are valued at net worth and publicly traded companies at their listed market value. Other companies in the state-owned portfolio are valued at the book value of equity.
APPROACH
The companies are valued based on their being owned by the state. The value with the state as the owner may differ signifi-cantly from the value that could be realised in a sale to private owners or through an IPO. One reason is that state-owned com-panies sometimes have specifically adopted public policy assign-ments or instructions that limit their operations.
VALUE DEVELOPMENT IN 2014
At the end of 2014, the estimated value of the state’s publicly traded and unlisted company holdings amounted to SEK 460 billion, a decrease of approximately SEK 40 billion, or 8 per cent, compared with the same time a year earlier. Dividends paid to the state over the year amounted to SEK 17.9 billion, correspond-ing to a dividend yield of 3.6 per cent. Adjusted for shareholder contributions, the total return was a negative 4.7 per cent. By comparison, the Stockholm Stock Exchange rose by 11 per cent over the same period, had a dividend yield of 4 per cent and a total return of 15 per cent. The continued negative trend in the value of the state-owned company portfolio is primarily attrib-utable to the trend in the basic industry/energy sector. Falling prices for energy and iron ore have brought pressure on the prof-itability of both Vattenfall and LKAB. The negative trend in the basic industry/energy segment has also had a negative impact on dividends. Vattenfall paid no dividends in 2014, while LKAB dis-tributed SEK 3 billion. The companies from which the state received the largest dividends in 2014 were Svenska Spel at SEK 5.3 billion and TeliaSonera at SEK 4.8 billion. The best perform-ing sectors in the state portfolio are finance and property. The growth in the finance sector depends is largely attributable to SBAB, which is pursuing a new strategy focusing on residential
mortgages and cost efficiency. In the property sector, the increase is largely attributable to new construction in Akade-miska Hus. The value of the two listed holdings, TeliaSonera and SAS, fell by 6 per cent and 16 per cent respectively.
VALUE DEVELOPMENT 2011–2014
Since 2011, the value of the state-owned company portfolio has decreased from SEK 580 billion to SEK 460 billion. The decrease of SEK 120 billion is explained partly by the divestments made during the period. The net transaction proceeds made over the period amounted to SEK 65 billion, of which the divestment of the holdings in Nordea in 2011 and 2013 formed the greater part. Adjusted for divestments, the value of the portfolio declined by SEK 55 billion over the period, or 9 per cent. In comparison, the Stockholm Stock Exchange rose by 51 per cent over the same period. The weaker performance by the state-owned portfolio compared with the Stockholm Stock Exchange is primarily attributable to the value of the basic industry/energy sector, which includes Vattenfall and LKAB, having declined 50 per cent in value over the period – from SEK 294 billion to SEK 146 billion. As a percentage of the overall portfolio, the value of this sector declined from 51 per cent to 32 per cent, despite divest-ments in other sectors. Over the period, the total value for the other sectors rose by an average 10 per cent. Over the same period, the Stockholm Stock Exchange rose by an average 15 per cent annually. Even when adjusted for the basic industry/energy sector, the composition of the state-owned company portfolio and the Stockholm Stock Exchange differ appreciably – mean-ing that comparisons of performance between the two are not entirely meaningful.
2014201320122011
Reinvested dividends
Accumulated transactions
Portfolio value
Index OMXSB GI
Index OMXSB PI
1,200
1,000
800
600
400
200
0
VALUE DEVELOPMENT ADJUSTED FOR DIVIDENDS
AND TRANSACTIONS

48 ANNUAL REPORT STATE-OWNED COMPANIES 2014
HOW STATE-OWNED COMPANIES ARE GOVERNED
PUBLICLY TRADED HOLDINGS
The market value of the state’s holding in TeliaSonera
and SAS amounted to SEK 82.4 billion at the close of
2014. Consequently, the state’s holdings in publicly
traded companies represent slightly less than 18 per
cent of the value of the overall portfolio of state-owned
companies, which was valued at SEK 460 billion at the
end of 2014.
VALUE DEVELOPMENT
The share price trend in the publicly traded holdings was negative in 2014. Over the year, the value of the publicly traded holdings fell by 6 per cent or slightly more than SEK 5 billion. Over the same period, the OMX Stockholm Benchmark rose by 11 per cent.
DIVESTMENT MANDATES FOR PUBLICLY TRADED COMPANIES
No shares were sold in 2014. The Government currently has the Riksdag’s authorisation to divest the holding in SAS.
SAS – SHARE PRICE TREND
TELIASONERA – SHARE PRICE TREND
MARKET VALUE OF THE STATE’S PUBLICLY TRADED SHAREHOLDINGS, SEKM
31 Dec 2014 31 Dec 2013 25 Feb 2015
CompanyState’s holding, No.
of sharesParticipation in company
Holding in % of state’s total company
portfolio (value SEK 460
billion)Market value,
SEKmMarket value,
SEKm
Share price change
compared with 31 Dec 2013
Market value, SEKm
Share price change
compared with 31 Dec 2014
TeliaSonera 1,614,513,748 37.3% 17.7% 81,371 86,457 –6% 84,358 4%
SAS 70,500,000 21.4% 0.2% 1,072 1,163 –8% 1,283 20%
Total 17.9% 82,443 87,620 –6% 85,641 4%
TOTAL RETURN ON THE STATE’S PUBLICLY TRADED SHAREHOLDINGS,
JAN 2012–FEB 2015
The above graph shows the total return (share price and reinvested dividend) for the state’s publicly traded portfolio since 30 December 2011.
0
50
100
150
200
250
300
350Telia Sonera SASOMX Stockholm Benchmark GI
30 Dec 2011 30 Dec 2012 30 Dec 2013 25 Feb 2015
0
50
100
150
200
250
300
350SASOMX Stockholm Benchmark GI
30 Dec 2011 30 Dec 2012 30 Dec 2013 25 Feb 2015
0
50
100
150
200
250
300
350Telia SoneraOMX Stockholm Benchmark GI
30 Dec 2011 30 Dec 2012 30 Dec 2013 25 Feb 2015

49ANNUAL REPORT STATE-OWNED COMPANIES 2014
HOW STATE-OWNED COMPANIES ARE GOVERNED
HOW THE STATE’S FINANCES ARE AFFECTED BY COMPANY DIVESTMENTS AND DIVIDENDS
Between 2007 and 2014, the state divested compa-
nies for a value of SEK 160 billion. Over the same
period, state-owned companies paid dividends of SEK
203 billion.
The divestment proceeds, which derive primarily from the divestments of Vin & Sprit and Vasakronan, as well shares in Nordea Bank and TeliaSonera, have been used to amortise central government debt. These amortisations have helped reduce the state’s interest expenditure. Divestments of companies also lead to a reduction in possible future dividends, and the sale value nor-mally takes this into account.
The annual dividends from the state-owned companies entail a reduction in central government borrowing needs and thus fall-ing interest expenditure. The state’s savings (or net lending, i.e. net investments of funds in the form of financial assets net placed liabilities), increase when the companies distribute funds, as long as the dividend corresponds to profits generated over the year.
When the companies’ dividends exceed their profits for the year, thereby decreasing their equity, net lending is unaffected because the dividend is matched by an equal reduction in equity, i.e. financial liability. Consequently, it is not possible to strengthen net lending (savings) through additional dividends exceeding profit for the year from state-owned companies. Nor do divestments affect net lending.
DIVESTMENTS IN THE STATE-OWNED COMPANY PORTFOLIO SINCE 2007
SEK billion Year Income, SEKbn
Participation in
company
TeliaSonera 2007 18.0 8%
OMX 2008 2.1 6.6%
Vin & Sprit 2008 57.7 100%
Vasakronan 2008 24.6 100%
Nordea Bank 2011 19.0 6.3%
Arbetslivsresurs 2011 0.1 100%
Vectura 2013 0.9 100%
Nordea Bank 2013 19.5 6.4%
Nordea Bank 2013 21.6 7%
Total 160.3
TOTAL DIVIDENDS FROM STATE-OWNED COMPANIES
Year SEK billion
2007 31.3
2008 23.2
2009 20.8
2010 37.6
2011 27.8
2012 26.7
2013 17.7
2014 18.1
Total 203.2
HOW THE STATE’S FINANCES ARE AFFECTED BY DIVESTMENT PROCEEDS AND DIVIDENDS
Proceeds from
divestments of companies
Dividends equivalent to
operating profit for the year
in the companies
Dividends exceeding
operating profit for the year
in the companies
Central government debt Decreases Decreases Decreases
Central government
borrowing requirement
and interest expenditure
Decreases Decreases Decreases
Net lending Not affected Increases Not affected

50 ANNUAL REPORT STATE-OWNED COMPANIES 2014
COMPANIES
BOARD AND AUDITORS ELECTED FOR 2015/2016
51 Akademiska Hus
52 Almi Företagspartner
53 APL (Apotek Produktion & Laboratorier)
54 Apoteket
55 Apoteksgruppen
56 Arlandabanan Infrastructure
57 Bilprovningen
58 Bostadsgaranti
59 Dom Shvetsii
60 Dramaten
61 ESS
62 Fouriertransform
63 Green Cargo
64 Göta kanalbolag
65 Infranord
66 Inlandsinnovation
67 Jernhusen
68 Lernia
69 LKAB
70 Metria
71 Miljömärkning Sverige
72 Operan
73 Orio
74 PostNord
75 RISE
76 Samhall
77 SAS
78 SBAB
79 SEK
80 SJ
81 SOS Alarm
82 Specialfastigheter
83 SSC (Svenska rymdaktiebolaget)
84 Statens Bostadsomvandling
85 Sveaskog
86 Svedab
87 Svenska Skeppshypotek
88 Svenska Spel
89 Svevia
90 Swedavia
91 Swedesurvey
92 Swedfund
93 Systembolaget
94 TeliaSonera
95 Teracom Boxer Group
96 Vasallen
97 Vattenfall
98 VisitSweden
99 Voksenåsen
Companies
Among other things, VisitSweden is responsi-
ble for the Sweden brand and Sweden’s image.
Photo: Fredrika Berghult/NobelMediaAB/
imagebank.seden.se

51ANNUAL REPORT STATE-OWNED COMPANIES 2014
COMPANIES
BOARD AND AUDITORS ELECTED FOR 2015/2016
Akademiska Hus Aktiebolag was
formed in 1993 in connection with the
reorganisation of the National Board of
Public Buildings. The company’s mis-
sion was clarified in the Budget Bill for
2014. The company shall own, develop
and manage properties for universities
and colleges, with its main focus being
on educational and research opera-
tions. These operations are to be con-
ducted on a commercial basis and gen-
erate a return in line with the market
by setting rent levels that take the op-
erations’ risks into account.
OPERATIONS
Akademiska Hus is one of Sweden’s largest
represent the company’s largest customer group. The company’s operations consists of owning, managing, planning, building and developing properties. The company plays an important role for universities and colleges and it shall help increase customer benefit and facilitate the development of educational and research activi-ties on campuses, thereby contributing to the objective of strengthening Sweden as a nation of learning. Student housing also represents an important part of the long-term development of the campuses, where Akademiska Hus helps create conditions for external actors to build housing, but where the company can also build and own properties itself. An important corner-stone for the operations is that they be pursued sustainably, commercially and on market terms. This serves to ensure that resources are used efficiently, that competition in the property market is not distorted, and that the substantial property holdings are managed in a long-term sustainable manner. In addition, opportunities are provided, regardless of the economic situa-tion, to invest considerable amounts in new projects for seats of learning around Sweden. Akademiska Hus’ operations are characterised by long-term contracts with stable customers, providing a favourable risk profile. The company has operations across the country and its head-quarters are located in Gothenburg.
2014
-ties being brought into use.
to approximately SEK 3.5 billion.-
tions of SEK 3 billion during the year.
Akademiska Hus’ rental income rose, mainly as a result of new facilities being brought into use. The operating surplus improved somewhat over
the year, primarily due to lower operating and maintenance costs. A major cost item is energy, where the company’s efforts to enhance effi-ciency have contributed to lower costs in recent years. Major positive unrealised changes in property values helped greatly increase profit after tax compared with 2013. Gross investments in new building and renovations further increased in 2014 and, at the end of the year, the total project portfolio amounted to slightly more than SEK 20 billion.
PERFORMANCE REVIEW
The return on operating capital was 7.3 (7.2) per cent, which exceeded the target. The equity/assets ratio increased to 48.0 (46.8) per cent, greatly exceeding the target range. An ordinary dividend of SEK 1,445 (1,374) million was proposed for 2014, which is in line with policy. The owner will need to adjust the capital struc-ture in accordance with target equity/assets ratio.
After the owner determined a clarified assign-ment for Akademiska Hus in 2013, revised financial targets were set by the 2014 Annual General Meeting. Work with the different parts of the assignment and the targets is followed up in consultation with the owner. During 2014, the company intensified its customer-focused efforts, including the development of strategy, communications, efficiency enhancements and cooperation initiatives. In cooperation with other parties, a large number of projects to create new student housing were also implemented during the year.
The amount of energy purchased fell by 3.9 per cent in 2014, which is fully in line with the long-term target. The customer satisfaction index was 66 per cent, which was lower than the target of 70 per cent. Over the year, 14 sustainability initiatives were carried out, which exceeded the target of ten. Target levels for eliminating the CO
2 footprint are being developed.
Chair: Eva-Britt Gustafsson CEO: Kerstin
Lindberg Göransson
Chair: Eva-Britt Gustafsson Board: Britta Burreau, Olof
Ehrlén, Ingela Lindh, Leif Ljungqvist, Pia Sandvik,
Gunnar Svedberg, Ingemar Ziegler Employee reps:
Tomas Jennlinger, Anders Larsson Auditor: Björn Flink,
KPMG
Remuneration to the Chairman of the Board is SEK
270 (250). Remuneration to board members elected
by the Annual General Meeting is SEK 135 (125). No
remuneration is payable to members who are employed
by the Swedish Government Offices.
State ownership 100%
Employees Management group Board
74
26
50 5058 42
RETURN ON OPERATING CAPITAL, %
2012 2013
Target
Outcome
20140
2
4
6
8
10
GENDER DISTRIBUTION, % Men Women STATE OWNERSHIP, %
TARGETSFINANCIAL TARGETS
STRATEGIC SUSTAINABILITY TARGETS
2
PUBLIC POLICY TARGETS
INCOME STATEMENT, SEKm 2014 2013
Net turnover 5,681 5,588
Changes in value 3,529 232
Operating profit/loss 7,200 3,665
Profit before tax 6,261 3,275
Net profit/loss 5,215 2,568
– of which attributable to minority
interests 0 0
BALANCE SHEET, SEKm 2014 2013
Total assets 69,719 63,342
Fixed assets 63,399 59,254
Equity 33,432 29,614
– of which, minority interests 0 0
Net debt 17,796 18,235
Operating capital 51,228 47,849
KEY RATIOS 2014 2013
Surplus ratio, % 65 63
Operating margin (incl. change in value), % 126.7 65.6
Return on equity after standard tax
(average), % 16.5 8.9
Return on operating capital (average), % 7.3 7.2
Net debt/equity ratio, multiple 0.5 0,6
Equity/assets ratio, % 48,0 46,8
Gross investments, SEKm 3,007 2,758
Appropriation, SEKm 0 0
Dividend, SEKm 1,445 1,374
Average no. of employees 408 407
Reported in compliance with GRI guidelines Yes
Externally assured GRI report Yes
Reports in compliance with IFRS Yes

52 ANNUAL REPORT STATE-OWNED COMPANIES 2014
COMPANIES
BOARD AND AUDITORS ELECTED FOR 2015/2016
ALMI FÖRETAGSPARTNER AB www.almi.se
Almi Företagspartner AB was formed in
1994 following a resolution by the
Riksdag according to which the county-
specific development funds were reor-
ganised from foundations into limited
companies in a group under a parent
company wholly owned by the state.
Almi’s assignment is to contribute to
growth and innovation, through advisory
services, loans and equity capital to
develop competitive small and medium-
sized companies, both nationally and
globally.
OPERATIONS
Almi’s activities include advisory services, loans and equity capital for companies in early development or entering a new phase. Almi’s operations are to complement the private market with regard to companies’ needs for financing and advice and should engage where suitable private options exist.
Within the Almi group, counselling and lend-ing are conducted in 16 regional subsidiaries, owned 51 per cent by the parent company and 49 per cent by regional actors (county councils, regions, municipal cooperation bodies and others). Advice is provided both by Almi’s own advisers and by externally procured consultants, as well as by the part-owned IFS Rådgivning AB, which focuses on people with a foreign back-ground. Where possible, lending is conducted in collaboration with other lenders, such as banks, at an interest rate above average bank interest rates. Almi’s total loan fund amounts to just over SEK 5 billion and lending operations are to be conducted such that the capital is kept nomi-nally intact.
Investments in equity capital are made through the Almi Invest organization in which 40 investment managers spread over eight regions invest equity capital in both seed capital (pro-jects in the very early stages of development) and partly in companies in the early growth stage. Almi Invest always co-invests alongside private investors. Almi Invest’s fund capital of about SEK 1 billion partly comprises the 2009 Struc-
structural funds and 50 per cent of financing equally distributed between the parent company and the regional owners. There are also funds from the former Innovationsbron with which Almi merged in 2012/13.
2014
value, but decreased 2 per cent in number.
in 194 companies.
Almi’s revenues in 2014 consisted of a grant from the state of SEK 260 (260) million, operating grants from the minority shareholders in the regional subsidiaries, compensation for assignments performed for companies, county councils, municipalities and others, as well as revenues from loan operations and asset man-agement. Operating income decreased by 2.4 per cent, primarily due to lower project revenues and somewhat lower interest income.
The value of newly granted loans in Almi increased to SEK 2,354 (2,200) million, dis-tributed between 3,857 (3,921) loans. Over the year, loan losses in relation to lending volumes decreased to 3.8 (5.6) per cent. After loan losses, the return on loaned funds amounted to 3.9 (1.7) per cent. Among Almi’s priority target groups, the number of loans to women has increased by 2 per cent compared with last year, representing 32 (30) per cent of the total number of loans granted in 2014. The number of loans to entrepreneurs with a foreign back-ground fell by 6 per cent and accounted for 28 (29) per cent of the total number of loans granted. Almi’s advisory offering was utilised by 17,003 (18,271) unique customers.
Within Almi Invest, new and follow-on invest-ments were made in 194 portfolio companies, corresponding to SEK 211 million during 2014. At the end of the year, Almi had hold-ings in 375 (357) portfolio companies, and participations in 10 (11) mutual fund compa-nies.
PERFORMANCE REVIEW
The owner has yet to set any financial goals or public policy targets for Almi. Operations are monitored based on a number of reporting requirements specified in an owner instruction.
Chair: Birgitta BöhlinCEO: Göran Lundwall
Chair: Birgitta Böhlin Board: Anders Byström, Katarina
Green, Nicolas Hassbjer, Åke Hedén, Agneta Mårdsjö,
Anna Söderblom (Katarina Green was elected at the
2015 Annual General Meeting when Inga Thoresson-
Hallgren left the board) Employee reps: Maria Ines
Ribeiro de San Juan, Christina Wahlman Deputy
employee reps: Per-Arne Norbäck Auditor: Jonas
Ståhlberg, Deloitte
Remuneration to the Chairman of the Board is SEK
180,000 (150,000). Remuneration to board members
elected by the Annual General Meeting is SEK 90,000
(80,000). No remuneration is payable to members
who are employed by the Swedish Government Offices
50 50 43 5733
67
Employees Management group Board
2012 20142008 201020092007 2011 2013
0500
1,0001,5002,0002,5003,0003,500
NEW LENDING, SEKmGENDER DISTRIBUTION, % Men Women STATE OWNERSHIP, %
TARGETSFINANCIAL TARGETS
STRATEGIC SUSTAINABILITY TARGETS
PUBLIC POLICY TARGETS
INCOME STATEMENT, SEKm 2014 2013
Net turnover 1,074 1,100
Operating profit/loss 35 –27
Profit before tax 120 75
Net profit/loss 120 75
– of which attributable to minority
interests 1 1
BALANCE SHEET, SEKm 2014 2013
Total assets 7,804 7,733
Fixed assets 4,867 4,857
Equity 6,939 6,820
– of which, minority interests 183 182
Net debt –2,869 –2,787
Operating capital 4,070 4,033
KEY RATIOS 2014 2013
Operating margin, % 3.2 neg
Return on equity (average), % 1.7 1.1
Return on operating capital (average), % 0.9 neg
Net debt/equity ratio, multiple –0.4 –0.4
Equity/assets ratio, % 88.9 88.2
Gross investments, SEKm 221 222
Appropriation, SEKm 260 260
Dividend, SEKm 0 0
Average no. of employees 436 454
Reported in compliance with GRI
guidelines Yes
Externally assured GRI report Yes
Reports in compliance with IFRS No
State ownership 100%

53ANNUAL REPORT STATE-OWNED COMPANIES 2014
COMPANIES
BOARD AND AUDITORS ELECTED FOR 2015/2016
GENDER DISTRIBUTION, % Men Women STATE OWNERSHIP, %
Apotek Produktion & Laboratorier AB’s
(APL) principal assignment is to produce
and supply extempore pharmaceuticals
and stock preparations, that is, pharma-
ceuticals tailored for an individual pa-
tient, clinic, animal or herd, or that are
only produced in small series. The com-
pany was previously a subsidiary of
Apoteket AB, but has been directly
owned by state since 30 June 2010.
OPERATIONS
Today, APL supplies extempore pharmaceuti-cals to all pharmacy companies operating in the outpatient care market, as well as to inpa-tient care providers, on equal and non-discrimi-natory terms. Following changes in the law, which came into effect on 1 June 2010, the extempore market is exposed to competition.
particular responsibility to produce and deliver extempore pharmaceuticals and stock prepara-tions on demand from outpatient pharmacies.
APL is required to develop and supply, in close cooperation with specialists and prescrib-ers (e.g. physicians, dentists and veterinarians), authorities and other stakeholders, a medically appropriate and quality-assured range of extem-pore pharmaceuticals and stock preparations. The company shall also safeguard the availabil-ity of easily accessible information, user-friendly payment procedures and efficient supplies of its pharmaceuticals. APL is also responsible for the administration of product numbers and cataloguing of the stock prepara-tions produced and that are sold extempore pharmacies.
APL also offers development and production services for the Life Science sector.
2014
-tion services for the county councils.
-ments in IT-related operational support gener-ated increased costs.
PERFORMANCE REVIEW
The equity/assets ratio for 2014 was 41.9 per cent. The return on equity was 4.3 per cent. With the implementation of the company’s strategy in mind and its investment needs, the company is not distributing any dividends for the 2014 financial year. Equity amounted to SEK 213.8 million, which was SEK 6.3 million higher than at the start of the year. This change corresponds to net profit for the year less the dividends paid during the year.
Chair: Johan Assarsson CEO: Eva Sjökvist Saers
Chair: Johan Assarsson Board: Malin Forkman, Britt
General Meeting when Gunilla Högbom and Wenche
Rolfsen left the board) Employee reps: Johan
Hammargren, Susann Danielsson-Lindberg Deputy
employee reps: Astrid Holdt, Maria Åhman
Auditor: Åsa Lundvall, EY
Remuneration to the Chairman of the Board is SEK
250,000 (250,000). Remuneration to board members
elected by the Annual General Meeting is SEK
130,000 (130,000).
Employees Management group Board
27
7360 4060 40
TARGETSFINANCIAL TARGETS
STRATEGIC SUSTAINABILITY TARGETS (selection)
Read all of the sustainability targets in the company’s annual report.
PUBLIC POLICY TARGETS
INCOME STATEMENT, SEKm 2014 2013
Net turnover 1,183 1,174
Operating profit/loss 15 28
Profit before tax 12 23
Net profit/loss 9 19
– of which attributable to minority
interests 0 0
BALANCE SHEET, SEKm 2014 2013
Total assets 511 524
Fixed assets 228 234
Equity 214 208
– of which, minority interests 0 0
Net debt 161 154
Operating capital 375 362
KEY RATIOS 2014 2013
Operating margin, % 1.3 2.4
Return on equity (average), % 4.4 9.8
Return on operating capital (average), % 4.1 7.8
Net debt/equity ratio, multiple 0.8 0.7
Equity/assets ratio, % 41.9 39.6
Gross investments, SEKm 18 18
Appropriation, SEKm 0 0
Dividend, SEKm 0 3
Average no. of employees 512 537
Reported in compliance with GRI
guidelines Yes
Externally assured GRI report Yes
Reports in compliance with IFRS No
State ownership 100%

54 ANNUAL REPORT STATE-OWNED COMPANIES 2014
COMPANIES
BOARD AND AUDITORS ELECTED FOR 2015/2016Apoteket AB was founded as
Apoteksbolaget AB in 1970 when the
pharmacy market was nationalised. In
2009, Apoteket’s monopoly in the
pharmacy market came to an end.
Approximately two-thirds of the com-
pany’s network of shops was sold in the
spring of 2010. Today the company
operates in a fully competitive market.
Apoteket remains a central state-owned
player in the pharmacy market, and
shall be operated in such a way that a
satisfactory supply of pharmaceuticals
in Sweden is facilitated.
OPERATIONS
Apoteket offers products and services in the areas of pharmaceuticals and health. In the outpatient market, the company provides prescription and non-prescription pharmaceuti-cals, merchandise, health services and informa-tion to private individuals through about 370 pharmacies nationwide.
The company also has a well-developed remote trade business which consists of Inter-net sales and remote sales via the company’s pharmacy agents. Increased access to pharma-ceuticals and advice represent an important component in the company’s strategy. Apoteket’s other major customer area offers supply and pharmacy services, including phar-maceutical supply, briefings on pharmaceuti-cals and other advisory services to county councils, municipalities and private healthcare companies. The company also conducts dis-pensing operations, which are an important part in increasing patient safety and accessibil-ity. The owner’s ambition is for Apoteket to remain an efficient, competitive and long-term profitable player in the pharmacy market. Here, sustainability work is an important and inte-grated part of the company’s profiling and commercial operations. The company continu-ously further develops its sustainable customer offering to strengthen its position as the lead-ing pharmacy player, both towards consumers and on the contractual side of its operations.
Apoteket is also assigned with maintaining the existing pharmacy agents to the extent necessary to maintain a satisfactory supply of medicines in the locality where the agent operates.
2014
scale contracts in the healthcare market.
margin.
offering.
Apoteket’s sales of pharmaceuticals and other health products in the consumer market increased in 2014. Nonetheless, this increase could not fully offset lower turnover in the healthcare market. In the second half of 2014, however, sales rose compared with the preced-ing year. Operating profit fell slightly compared with the previous year, with an increased share of more expensive pharmaceuticals with a lower margin and reduced parallel imports contribut-ing to this. Net turnover decreased by 2 per cent as a consequence of less extensive and fewer agreements in the healthcare market. Operating expenses were brought down through various cost-saving measures.
PERFORMANCE REVIEW
Apoteket’s operating margin amounted to 1.8 (1.9) per cent in 2014, with the focus remain-ing on reaching 3 per cent. The consolidated, pension-adjusted debt/equity ratio for 2014 was a multiple of 0.03 (0.2), and was thus lower than the targeted debt/equity ratio of a multiple of 0.4–0.8. The dividend amounted to SEK 158 million, which constituted 60 per cent of adjusted profit, in line with policy.
With regard to the sustainability targets, at the end of 2014, 94 per cent of the company’s suppliers (non-prescription) had signed the Code of Conduct, putting the target of 100 per cent within reach. Employee motivation rose from 67 per cent to 72 per cent and the target has now been set at 80 per cent. Furthermore, 80 per cent of Apoteket’s customers are to return left-over pharmaceuticals, with the company estimating the current level at about 75 per cent. Apoteket has adhered fully with the points detailed in the owner instruction includ-ing with regard to the pharmacy agents.
www.apoteket.se APOTEKET AB
Chair: Christian W JanssonCEO: Ann Carlsson
Chair: Christian W Jansson Board: Maria Curman, Gert
Karnberger, Leif Ljungqvist, Kristina Schauman, Sussi
Kvart (Sussi Kvart was elected at the 2015 Annual
General Meeting when Elisabet Wenzlaff left the board)
Employee reps: Gunilla Larsson, Carin Sällström-
Nilsson Deputy employee reps: Marie Redeborn, Lena
Rhodin Auditor: Åsa Lundvall, EY
Remuneration to the Chairman of the Board is SEK
300,000 (300,000). Remuneration to board members
elected by the Annual General Meeting is SEK
150,000 (150,000). No remuneration is payable to
members who are employed by the Swedish Govern-
ment Offices.
GENDER DISTRIBUTION, % Men Women STATE OWNERSHIP, %
14
8650 5057 43
Employees Management group Board
TARGETSFINANCIAL TARGETS
STRATEGIC SUSTAINABILITY TARGETS
Read more about the sustainability targets in the company’s annual report.
PUBLIC POLICY TARGETS
INCOME STATEMENT, SEKm 2014 2013
Net turnover 18,567 18,847
Operating profit/loss 343 355
Profit before tax 481 436
Net profit/loss 371 364
– of which attributable to minority
interests 0 0
BALANCE SHEET, SEKm 2014 2013
Total assets 8,028 7,866
Fixed assets 4,201 4,223
Equity 4,686 4,389
– of which, minority interests 0 0
Net debt –3,647 –3,350
Operating capital 1,039 1,039
KEY RATIOS 2014 2013
Operating margin, % 1.8 1.9
Return on equity (average), % 8.2 9.8
Return on operating capital (average), % 33.0 23.0
Net debt/equity ratio, multiple –0.8 –0.8
Equity/assets ratio, % 58.4 55.8
Gross investments, SEKm 70 135
Appropriation, SEKm 0 0
Dividend, SEKm 158 150
Average no. of employees 3,474 3,899
Reported in compliance with GRI
guidelines Yes
Externally assured GRI report Yes
Reports in compliance with IFRS Yes
OPERATING MARGIN, %
2012 2013
Target
Outcome
20140
1
2
3
4
State ownership 100%

55ANNUAL REPORT STATE-OWNED COMPANIES 2014
COMPANIES
BOARD AND AUDITORS ELECTED FOR 2015/2016
GENDER DISTRIBUTION, % Men Women STATE OWNERSHIP, %
Chair: Birgitta Böhlin CEO: Eva-Britt Gustafsson
Chair: Birgitta Böhlin Board: Peder Larsson, Annema
Paus, Richard Reinius, Gunilla Rittgård, Satish Sen
(Gunilla Rittgård and Richard Reinius were elected at
the 2015 Annual General Meeting when Gunvor
Engström and Lars Erik Fredriksson left the board)
Auditor: Lena Möllerström Nording, Grant Thornton
Remuneration to the Chairman of the Board is SEK
250,000 (250,000). Remuneration to board members
elected by the Annual General Meeting is SEK 130,000
(130,000). No remuneration is payable to members who
are employed by the Swedish Government Offices.
The company, which is wholly owned
by the Swedish state was founded in
2009 and is tasked with implementing
the restructuring of the pharmacy mar-
ket and giving small-scale entrepre-
neurs the opportunity to operate phar-
macies. Today, Apoteksgruppen is a
voluntary pharmacy chain consisting of
165 pharmacies, operated by some
180 self-employed individuals under a
shared brand.
OPERATIONS
Apoteksgruppen generates economies of scale for affiliated pharmacies through cooperation. The service organisation offers pharmacy owners support in operating their pharmacies. The pharmacy owners, gain access to a shared product range, Apoteksgruppen’s proprietary brands, purchasing, finance and HR systems, quality, sales and start-up support, shared marketing and IT systems. The pharmacy market consists largely of five players, with Apoteksgruppen being the fourth-largest with a market share of approximately 10 per cent.
2014
in creasing volumes.
customer satisfaction.
During the year, the group showed strong growth in operating income. Due to changes in accounting principles, the figures for the year include sales from proprietary pharmacies. Operating profit deteriorated, mainly due to costs for the development of a digital platform
having burdened earnings. For pharmacies affiliated with Apoteksgruppen, total sales for 2014 amounted to SEK 3,429 (3,358) million, an increase of 2.1 per cent, which was mainly due to the market growing by 4.9 per cent in 2014. Operating profit amounted to SEK 208 (202) million. The improvement in profits is mainly explained by the positive trend in mer-chandise sales.
PERFORMANCE REVIEW
The equity/assets ratio for 2014 exceeded the target of approximately 80 per cent. Profitabil-ity was 0.9 (1.8) per cent, which fell short of the target. The dividend amounted to SEK 0.0 (3.5) million.
Progress towards the strategic sustainability targets during the year was favourable. Apoteks-gruppen is the chain that uses the EEA system most.
31
6950 5040
60
Employees Management group Board
NUMBER OF PHARMACIES AFFILIATED TO
APOTEKSGRUPPEN
2012 2013 20140
40
80
120
160
200
TARGETSFINANCIAL TARGETS
STRATEGIC SUSTAINABILITY TARGETS
PUBLIC POLICY TARGETS
INCOME STATEMENT, SEKm 2014 2013
Net turnover 254 181
Operating profit/loss –8 –7
Financial income 10 15
Profit before tax –3 7
Net profit/loss 0 0
– of which attributable to minority
interests 0 0
BALANCE SHEET, SEKm 2014 2013
Total assets 474 495
Fixed assets 116 179
Equity 396 412
– of which, minority interests 0 0
Net debt 0 –25
Operating capital 396 387
KEY RATIOS 2014 2013
Operating margin, % neg neg
Return on equity (average), % neg 1.8
Return on operating capital (average), % neg neg
Net debt/equity ratio, multiple 0.0 –0.1
Equity/assets ratio, % 83.6 83.2
Gross investments, SEKm 11 9
Appropriation, SEKm 0 0
Dividend, SEKm 0 4
Average no. of employees 59 80
Reported in compliance with GRI
guidelines Yes
Externally assured GRI report Yes
Reports in compliance with IFRS Yes
State ownership 100%

56 ANNUAL REPORT STATE-OWNED COMPANIES 2014
COMPANIES
BOARD AND AUDITORS ELECTED FOR 2015/2016
www.arlandabanan.se Reg. no. 556481-2385
To connect the Swedish rail system
with Arlanda Airport, the Riksdag
approved in 1994 an infrastructure
project jointly financed by the Govern -
ment and private business – the
Arlandabanan rail line. Arlandabanan
Infrastructure AB was formed under
the auspices of the Government to
implement the project and manage
the facility.
OPERATIONS
Arlandabanan Infrastructure owns and adminis-ters the Arlandabanan rail line, granting use of the line and certain rights for the operation of high-speed shuttle trains (Arlanda Express) between Arlanda Airport and Stockholm Cen-tral. Arlandabanan Infrastructure controls the operation of the facility, as well as the opera-tion of the rail services. The company shall also promote integrated and efficient traffic on the line and work together with Swedavia to create an attractive rail and air traffic solution at Arlanda airport.
Arlandabanan Infrastructure administrates the contracts associated with the Arlandabanan line and is responsible for ensuring that the Government’s rights and obligations in accord-ance with the contracts are observed. A-Train AB holds the concession for the line and is Arlandabanan Infrastructure’s contractual counterparty. A-Train operates the Arlanda Express service, manages the infrastructure and is responsible for all of the obligations this entails. The contracts grant A-Train the right to use Arlandabanan Infrastructure’s traffic rights on the state-owned rail network as well as the right to use Arlandabanan and its stations.
entails an obligation to grant use of the line and the station at Arlanda Airport to other railway companies.
Arlandabanan Infrastructure shall promote increased rail travel to and from Arlanda Air-port. Rail travel is to be developed by integrat-ing new catchment areas well with other rail services. The objective is to double rail travel by 2015 compared with 2010. To date, the increase is 25 per cent.
Through the Swedish National Debt Office, the state has issued an interest and amortisa-tion-free loan to A-Train. According to the terms, the state is instead entitled to royalties from A-Train AB. These royalties may be lower or higher than the state’s costs for the loan. Arlandabanan Infrastructure’s objective is to endeavour that the loan will be repaid within the contract period.
Chair: Jan Olson CEO:
Chair: Jan Olson Board: Lars Erik Fredriksson, Kerstin
Hessius, Irene Svenonius (Lars Erik Fredriksson was
elected at the 2015 Annual General Meeting when
Hans Brändström left the board) Auditor: Mikael
Sjölander, EY
Remuneration to the Chairman of the Board is SEK
110,000 (110,000). Remuneration to board members
elected by the Annual General Meeting is SEK 66,000
(66,000). No remuneration is payable to members
who are employed by the Swedish Government Offices.
2014
Express rose by 8 per cent.
companies rose by 7 per cent.
Arlandabanan Infrastructure’s operations are financed through revenues from traffic rights, land rent from A-Train, special control and supervision fees from A-Train and commission fees from Trafikverket (Swedish Transport Administration). Each year, the operations report a break-even result.
Traffic at Arlanda Airport, as well as travel to and from the airport, increased. Travel by SL’s commuter rail service to Arlanda Airport increased by 14 per cent. Arlanda Express’ market share rose from 14.2 per cent to 14.5 per cent.
PERFORMANCE REVIEW
Due to the company’s financing, its financial outcome will always be break-even.
In the process of setting long-term sustain-ability targets, these have been broken down into long-term and quantifiable targets.
GENDER DISTRIBUTION, % Men Women STATE OWNERSHIP, % NUMBER OF PASSENGERS TO ARLANDA AIRPORT, million
2011 2012 2013 20140
1
2
3
4
5
6Number of pass-engers travellingvia Arlandawith other railcompanies
Number ofArlanda Expresspassengers
50 50
Board
TARGETSFINANCIAL TARGETS
STRATEGIC SUSTAINABILITY TARGETS
PUBLIC POLICY TARGETS
INCOME STATEMENT, SEKm 2014 2013
Net turnover 68 67
Operating profit/loss 0 0
Profit before tax 0 0
Net profit/loss 0 0
– of which attributable to minority
interests 0 0
BALANCE SHEET, SEKm 2014 2013
Total assets 1,455 1,511
Fixed assets 1,437 1,494
Equity 10 10
– of which, minority interests 0 0
Net debt –10 –8
Operating capital 0 2
KEY RATIOS 2014 2013
Operating margin, % 0.0 0.0
Return on equity (average), % 0.0 0.0
Return on operating capital (average), % 0.0 0.0
Net debt/equity ratio, multiple –1.0 –0.8
Equity/assets ratio, % 0.7 0.7
Gross investments, SEKm 0 0
Appropriation, SEKm 0 0
Dividend, SEKm 0 0
Average no. of employees 1 1
Reported in compliance with GRI
guidelines Yes
Externally assured GRI report Yes
Reports in compliance with IFRS No
State ownership 100%

57ANNUAL REPORT STATE-OWNED COMPANIES 2014
COMPANIES
BOARD AND AUDITORS ELECTED FOR 2015/2016
AKTIEBOLAGET SVENSK BILPROVNING www.bilprovningen.se
Chair: Karin Strömberg CEO: Benny Örnerfors
Chair: Karin Strömberg Board: Gunnar Malm, Anna
Nilsson Ehle, Hans Krondahl, Kristina Patek, Hélène
Westholm (Hélène Westholm was elected at an Extra-
ordinary General Meeting in November 2014 when Leif
Ljungqvist left the board, Kristina Patek was elected at
the 2015 Annual General Meeting when Cecilia Daun
Wennborg left the board) Employee reps: Bengt
Lindblom, Joakim Rönnlund Deputy employee reps:
Göran Lund, Jonas Nilsson Auditor: Jonas Ståhlberg,
Deloitte
Remuneration to the Chairman of the Board is SEK
160,000 (130,000). Remuneration to board members
elected by the Annual General Meeting is SEK 85,000
(80,000). No remuneration is payable to members
who are employed by the Swedish Government Offices.
Aktiebolaget Svensk Bilprovning,
Bilprovningen (Swedish Motor-Vehicle
Inspection Company) was founded in
1963, commissioned by the Riksdag
and the Government. The vehicle in-
spection market was deregulated in
2010 and in 2012 the process began
of dividing Bilprovningen into three
clusters of station networks, two of
which were later sold. Since March
2013, Bilprovningen has been fully
owned by the state.
OPERATIONS
Bilprovningen conducts commercial operations in a fully deregulated market. With 94 stations and approximately 650 employees, even follow-ing the completion of the divestments, Bilprov-ningen remains a leading actor in motor vehi-cles inspection and the only player in the market with a nationwide network of stations. By providing advice and inspecting vehicles, Bilprovningen shall meet customers’ service requirements regarding their vehicles’ traffic safety, environmental impact and running costs. Bilprovningen shall be located close to customers and offer its services in a manner that suits the customer. In 2014, Bilprovningen opened new vehicle inspection stations in Kallhäll, Enköping and Värmdö outside Stock-holm. In its market, Bilprovningen is the player with the best availability in terms of opening hours and also offers a drop-in service. In 2014, Bilprovningen carried out more than two million inspections, of which 88 per cent consisted of mandatory inspection and registra-
-tives and national laws and regulations. The company has a strong brand that is to be maintained through a high-quality customer service and a responsible approach that is sustainable in the long term.
2014
amounted to SEK 60 (24) million.
was 33 per cent.
Bilprovningen’s turnover fell to SEK 719 (785) million, although that included cluster 2 (now Besikta Bilprovning i Sverige AB) for slightly more than three months in 2013. Operating profit rose to SEK 60 (24) million, which is partly the result of a price increase imple-mented by the company in the autumn of 2014. Competition in the vehicle inspection market increased during the year and, com-bined, the three players originating from Bil-provningen: Bilprovningen, Opus and Besikta,
held 86 per cent of the market in December 2014. In addition to these actors, there are seven others, who accounted for 14 per cent of the market. The largest of these smaller players is Carspect, with about 8 per cent. At the end of 2014, there were a total 384 inspection stations, which is double the number prior to deregulation, when there were 192 stations. In 2014, the market gained 27 new stations; an increase of 24 per cent on the previous year.
At the 2014 Annual General Meeting, new financial targets and a new dividend policy were adopted for Bilprovningen. PERFORMANCE REVIEW
For the 2014 financial year, the company’s operating margin amounted to 8.4 per cent (3.1) and the equity/assets ratio was 44 (64) per cent. The reason for the reduction in the equity ratio is that, at the 2014 Annual General Meeting, the company approved a special dividend that, combined with the ordinary dividend, amounted to SEK 290 million. The dividend for the 2014 financial year amounts to SEK 48 million, equivalent to 95 per cent of net profit for the year in the parent company.
The company works continuously to achieve its target for the number of additional supple-mentary inspections. In 2014, the proportion of female inspection technicians amounted 10 per cent and inspection technicians with a foreign background accounted for 14 per cent. Between 2006 and 2012, Bilprovningen almost halved its climate impact and it reduced its energy consumption by about 15 per cent.
2012
Target
Outcome
201420130
25
50
75
100
EQUITY/ASSETS RATIO, %GENDER DISTRIBUTION, % Men Women STATE OWNERSHIP, %
88
12
33
6767
33
Employees Management group Board
TARGETSFINANCIAL TARGETS
STRATEGIC SUSTAINABILITY TARGETS
PUBLIC POLICY TARGETS
INCOME STATEMENT, SEKm 2014 2013
Net turnover 719 785
Operating profit/loss 60 24
Profit before tax 63 40
Net profit/loss 63 31
– of which attributable to minority
interests 0 0
BALANCE SHEET, SEKm 2014 2013
Total assets 330 583
Fixed assets 53 60
Equity 145 372
– of which, minority interests 0 0
Net debt 0 0
Operating capital 145 372
KEY RATIOS 2014 2013
Operating margin, % 8.4 3.1
Return on equity (average), % 24.3 4.6
Return on operating capital (average), % n/a n/a
Net debt/equity ratio, multiple 1.5 1.2
Equity/assets ratio, % 43.8 63.7
Gross investments, SEKm 19 11
Appropriation, SEKm 0 0
Dividend, SEKm 48 290
Average no. of employees 646 731
Reported in compliance with GRI
guidelines Yes
Externally assured GRI report Yes
Reports in compliance with IFRS Yes
State ownership 100%

58 ANNUAL REPORT STATE-OWNED COMPANIES 2014
COMPANIES
BOARD AND AUDITORS ELECTED FOR 2015/2016
www.bostadsgaranti .se AKTIEBOLAGET BOSTADSGARANTI
Aktiebolaget Bostadsgaranti was formed
in 1962 and since then has worked with
consumer protection in residential con-
struction. Bostadsgaranti is owned
equally by the state and the Swedish
Construction Federation. As a step in
the owner’s liquidation of the company,
in November 2014, Bostadsgaranti
completed the divestment of the shares
in the subsidiary Försäkringsaktiebolaget
Bostadsgaranti (FABO).
OPERATIONS
In December 2012, the Riksdag authorised the Government to divest the state’s shares in Bostadsgaranti and in 2014 the Government was authorised, as an alternative, to liquidate the company.
The divestment of the shares in the wholly owned subsidiary FABO in 2014 was part of the liquidation of Bostadsgaranti as a whole. The buyer, Columbia Insurance Company, is a wholly
investment company Berkshire Hathaway. Following the divestment, the remaining opera-tions in Bostadsgaranti consisted of the ongoing liquidation of the deposit and advance guaran-tees. New sales ceased in 2012 and remaining commitments are expected to have been com-pleted by 2018 at the latest.
2014
-bolaget Bostadsgaranti.
-tion of previously pledged securities.
Historically, the parent company’s operations have consisted of issuing guarantees in accord-ance with the Tenant Owner Act. This issuance of guarantees ceased in April 2012 and is now being phased out. In 2013, training and con-sultancy operations in connection with the production of tenant-owner properties ceased.
Consolidated net sales decreased by 90 per cent over the year. The substantial increase in profit before tax is mainly explained by capital gains from the divestment of the subsidiary FABO and dissolution of a part of the com-pany’s fund to cover warranty damage resulting from the settlement of previously pledged securities. At the end of the year, the market value of the company’s investments was SEK 275 (982) million. The decline corresponds to the investment assets associated with the disposal of FABO.
PERFORMANCE REVIEW
The return on equity for 2014 amounted to 76 per cent, thus exceeding the target. The divi-dend amounted to SEK 275 million, half of which accrues to the state as an owner, which is in line with policy.
Chair: Hans Wibom CEO: Kåre Eriksson
Chair: Hans Wibom Board: Bo Antoni, Pether
Fredholm, Richard Reinius (Maurice Forslund left the
board at the 2015 Annual General Meeting) Auditor:
Gunilla Wernelind, KPMG
Remuneration to the Chairman of the Board is SEK
76,000 (76,000). Remuneration to board members
elected by the Annual General Meeting is SEK 38,000
(38,000). No remuneration is payable to members
who are employed by the Swedish Government Offices.
State ownership 50%
Sveriges Byggindustrier 50%
Target
Outcome
2012 2013 20140
20
40
60
80
RETURN ON EQUITY, %GENDER DISTRIBUTION, % Men Women STATE OWNERSHIP, %
100100100
Employees Board
TARGETSFINANCIAL TARGETS
STRATEGIC SUSTAINABILITY TARGETS
PUBLIC POLICY TARGETS
INCOME STATEMENT, SEKm 2014 2013
Net turnover 1 7
Operating profit/loss –12 –4
Profit before tax 220 68
Net profit/loss 263 51
– of which attributable to minority
interests 0 0
BALANCE SHEET, SEKm 2014 2013
Total assets 399 1,419
Fixed assets 0 1
Equity 337 356
– of which, minority interests 0 0
Net debt –399 –718
Operating capital –62 –362
KEY RATIOS 2014 2013
Operating margin, % neg neg
Return on equity (average), % 76.0 15.1
Return on operating capital (average), % 5.6 1.3
Net debt/equity ratio, multiple –1.2 –2.0
Equity/assets ratio, % 84.4 25.1
Gross investments, SEKm 0 0
Appropriation, SEKm 0 0
Dividend, SEKm 275 18
Average no. of employees 1 12
Reported in compliance with GRI
guidelines No
Externally assured GRI report No
Reports in compliance with IFRS No

59ANNUAL REPORT STATE-OWNED COMPANIES 2014
COMPANIES
BOARD AND AUDITORS ELECTED FOR 2015/2016The Riksdag resolved in the autumn of
1994 that the Swedish Government
and City of St. Petersburg, Russia
would form a limited company, A/O
Dom Shvetsii, (“House of Sweden”).
The company administers a “House of
Sweden” in St. Petersburg, housing
official, cultural and commercial func-
tions. The Ministry for Foreign Affairs
leases premises in the building for the
Swedish Consulate General of Sweden.
A large proportion of the remaining
premises are leased to operations with
Swedish connections and to Swedish
and foreign companies.
OPERATIONS
The intention was that establishing a House of Sweden in central St. Petersburg would be seen as a step in the development of relations between Russia and Sweden, where Sweden has a particular interest in developing relations with St. Petersburg and northwest Russia. Giving Swedish authorities and the Swedish business sector a natural base for their opera-tions in St. Petersburg was considered a prior-ity. The project was to be implemented on commercial terms and with the long-term objective of being independently financially viable. The company was formed through a tripartite agreement between the Swedish Government, the City of Saint Petersburg and Skanska. Skanska divested its 49-per cent holding in Dom Shvetsii to CA Fastigheter in the autumn of 2008.
Dom Shvetsii is a Russian limited company owned 49 per cent by Ladoga Holding AB (a subsidiary of CA Fastigheter), 36 per cent by the Swedish State, and 15 per cent by the City of St. Petersburg. Dom Shvetsii retains the right of disposal of the Sweden House complex and the land for 49 years. The property com-plex includes a lettable area of about 4,500
Reg. no. P 4401.16.4
Chair: Jan Borekull A management company
attends to the respons-
ibilities of CEO
Chair: Jan Borekull Board: Johan Damne, Lars
Grundberg, Vladislav Vilorgovich Kozelskij, Lena
Wedén (Lena Wedén was elected at the 2015 Annual
General Meeting when Leif Appelblom left the board)
Auditor: Dimitry Mikhaylov, Dimitry Mikhaylov
Consulting Bureau
(0). Remuneration to board member elected by the
remuneration is payable to members who are employed
by the Swedish Government Offices.
A/O Dom Shvetsii
square metres. The largest tenant is the Minis-try for Foreign Affairs, which leases premises for the offices and residence of the Consulate General of Sweden and apartments for emissar-ies. Other major tenants are the Stockholm School of Economics, the Royal Bank of Scot-land and the Nordic Council of Ministers.
2014
supply of office space in the city. The eco-nomic trend in Russia may also contribute to a declining property market.
PERFORMANCE REVIEW
Dom Shvetsii’s operations are entirely depend-ent on the level of demand for premises in St. Petersburg. Today, the House of Sweden has an occupancy rate of 91 per cent.
State ownership 36%
CA Fastigheter 49%
City of St. Petersburg 15%
2012 2013 20140
2
4
6
8
10
VACANCY RATE, %GENDER DISTRIBUTION, % Men Women STATE OWNERSHIP, %
80
20
Board
INCOME STATEMENT, SEKm 2014 2013
Net turnover 13 18
Operating profit/loss 11 14
Profit before tax 10 12
Net profit/loss 8 10
– of which attributable to minority
interests 0 0
BALANCE SHEET, SEKm 2014 2013
Total assets 25 27
Fixed assets 10 15
Equity 13 –3
– of which, minority interests 0 0
Net debt 9 15
KEY RATIOS 2014 2013
Operating margin, % 88.9 75.2
Return on equity (average), % 157.4 neg
Equity/assets ratio, % 50.8 –13.6
Gross investments, SEKm 0 0
Appropriation, SEKm 0 0
Dividend, SEKm 0 0
Average no. of employees 0 0
Reported in compliance with GRI
guidelines No
Externally assured GRI report No
Reports in compliance with IFRS No

60 ANNUAL REPORT STATE-OWNED COMPANIES 2014
COMPANIES
BOARD AND AUDITORS ELECTED FOR 2015/2016Kungliga Dramatiska Teatern (the Royal
Dramatic Theatre) has been Sweden’s
national stage for spoken theatre since
the days of King Gustav III. The theatre
has had varying degrees of state influ-
ence since its inception and, in 1975,
it became a state-owned limited com-
pany. As national stage, the objective is
for Kungliga Dramatiska Teatern to be
the leading institution in its field.
OPERATIONS
Kungliga Dramatiska Teatern (also known in Swedish as simply Dramaten) is to be Sweden’s leading drama institution and, as a national stage, it shall maintain the highest standards in terms of development, renewal, artistic quality and craftsmanship in its studios and work-shops. Dramaten is to operate in an interna-tional theatrical and cultural context, initiating partnerships and promoting intercultural exchange. Dramaten shall nurture and promote the Swedish language and Sweden’s national heritage in theatre.
It shall offer a varied repertoire including Swedish and international classics and modern works, as well as including drama for children and young people. The theatre shall also sup-port innovative Swedish performing arts by commissioning and staging contemporary Swedish drama, while also provide space for innovative performing artists.
Dramaten is to reach the widest and largest audience possible, targeting adults as well as children and young people. At the same time, Dramaten shall be of interest for a nationwide audience in Sweden. Dramaten shall strive to reach new audience groups and to enhance its accessibility in different ways.
2014
equity position.-
mances increased compared with the pre-ceding year.
Reg. no. 556190-4201 www.dramaten.se
The state appropriation for 2014 amounted to SEK 227 million. Profit for the year was SEK 4.5 million and shareholder’s equity continued to strengthen, amounting to SEK 36 million for 2014.
PERFORMANCE REVIEW
The repertoire is varied and includes both contemporary drama and classics of both Swed-ish and international origin. Dramaten presented eight classic and 21 modern pieces, with 20 of these pieces being new productions. The number of performances
-aten’s performing arts venture targeting chil-dren and young people – increased tangibly in 2014. Combined, Dramaten gave 919 perfor-mances that were seen by 270,286 people. In order to reach audiences across the country, guest performances were given and a number of productions were made available digitally and in collaboration with Sveriges Radio AB and Sveriges Television AB, among others.
Chair: Daniel Sachs VD: Eirik Stubø (appointed
in January 2015 when
Marie-Louise Ekman
left the board)
Chair: Daniel Sachs Board: Pontus Braunerhjelm,
Carina Brorman, Sara Danius, Gunvor Kronman, Qaisar
Mahmood, Tasso Stafilidis (Pontus Braunerhjelm and
Tasso Stafilidis were elected at the 2015 Annual Gen-
eral Meeting when Chris Marschall and Eric Sjöström
left the board) Employee reps: Rebecka Hemse, Kjäll
Åkerblom Deputy employee reps: Jan-Eric Piper, Dick
Sandin Auditor: Kerstin Sundberg, Deloitte
Remuneration to the Chairman of the Board is SEK
60,000 (60,000). Remuneration to board members
elected by the Annual General Meeting is SEK 30,000
(30,000).
2011 2012 2013 20140
25
50
75
100
ATTENDANCE RATE, %GENDER DISTRIBUTION, % Men Women STATE OWNERSHIP, %
51 4957
4360
40
Employees Management group Board
TARGETSFINANCIAL TARGETS
STRATEGIC SUSTAINABILITY TARGETS
PUBLIC POLICY TARGETS
INCOME STATEMENT, SEKm 2014 2013
Net turnover 277 263
Operating profit/loss 3 2
Profit before tax 5 3
Net profit/loss 5 3
– of which attributable to minority
interests 0 0
BALANCE SHEET, SEKm 2014 2013
Total assets 101 90
Fixed assets 10 9
Equity 36 31
– of which, minority interests 0 0
Net debt –75 –63
Operating capital –38 –32
KEY RATIOS 2014 2013
Operating margin, % 0.9 0.7
Return on equity (average), % 14.8 10.4
Return on operating capital (average), % neg neg
Net debt/equity ratio, multiple –2.1 –2.0
Equity/assets ratio, % 36.0 35.0
Gross investments, SEKm 4 4
Appropriation, SEKm 227 222
Dividend, SEKm 0 0
Average no. of employees 317 310
Reported in compliance with GRI
guidelines Yes
Externally assured GRI report Yes
Reports in compliance with IFRS No
State ownership 100%

61ANNUAL REPORT STATE-OWNED COMPANIES 2014
COMPANIES
BOARD AND AUDITORS ELECTED FOR 2015/2016
GENDER DISTRIBUTION, % Men Women
The European Spallation Source ESS
AB (ESS) was formed in 2010 and is
tasked with planning, designing,
building, owning and operating the
European Spallation Source in Lund.
ESS is jointly owned by Swedish and
Danish states. The Swedish state owns
74 per cent and the Danish state owns
26 per cent of the shares.
OPERATIONS
During 2014, ESS commenced construction of the European Spallation Source in Lund. When complete it will be the world’s premier facility for materials research, using neutrons to study materials at the atomic and molecular level. This enables studies of the structure of a protein, for example and its function in condi-tions similar to those in which the molecule acts in its original environment. The company cooperates with the 17 partner countries currently participating in the project.
2014
-ants as a result of the start of construction.
million from the Swedish state.
In the fifth year of its existence, the organiza-tion continued to build out and construction commenced as planned in 2014. Construction officially commenced with a ceremony on 2 September with the Swedish and Danish research ministers breaking the ground. The construction phase has entailed increased costs for personnel and consultants. This has also been matched by an increase in the share-holder contribution of SEK 793.6 million.
Chair: Sven Landelius CEO: James H. Yeck
Chair: Sven Landelius Board: Katarina Bjelke, Lars
Börjesson, Per Eriksson, Kim Graugaard, Lena Gustafsson,
Hans Müller Pedersen, Bo Smith (Kim Graugaard was
elected at an Extraordinary General Meeting in October
when Lars Goldschmidt left the board) Employee rep:
Michael Palade Auditor: Kent Lindén, KPMG
Remuneration to the Chairman of the Board is SEK
175,000 (140,000). Remuneration to board members
elected by the Annual General Meeting is SEK 70,000
(70,000). No remuneration is payable to members
who are employed by the Swedish Government Offices
or the Danish ministry.
The intention is for the operations of ESS AB to be turned into an so called Eric consortium during 2015. In December 2014, the Riksdag authorised the government (Bill 2014/15:1,
-tion 2014/15:90), to transfer the company’s assets and liabilities to a European research infrastructure consortium of this kind and to liquidate the company.
www.europeanspallat ionsource.se Reg. no. 556792-4096
Share owned bythe Swedish state 74%
The Danish state 26%
STATE OWNERSHIP, %
75
25
Board
66
3440
Employees
83100
Management group
TARGETSFINANCIAL TARGETS
STRATEGIC SUSTAINABILITY TARGETS
PUBLIC POLICY TARGETS
INCOME STATEMENT, SEKm 2014 2013
Net turnover 0 0
Operating profit/loss –780 –534
Profit before tax –780 –533
Net profit/loss –780 –533
– of which attributable to minority
interests 0 0
BALANCE SHEET, SEKm 2014 2013
Total assets 538 212
Fixed assets 136 9
Equity 314 51
– of which, minority interests 0 0
Net debt 0 0
Operating capital 314 51
KEY RATIOS 2014 2013
Operating margin, % 0.0 0.0
Return on equity (average), % neg neg
Return on operating capital (average), % neg neg
Net debt/equity ratio, multiple 0.0 0.0
Equity/assets ratio, % 58.4 23.8
Gross investments, SEKm 129 6
Appropriation, SEKm 0 0
Dividend, SEKm 0 0
Average no. of employees 246 166
Reported in compliance with GRI
guidelines Yes
Externally assured GRI report Yes
Reports in compliance with IFRS No

62 ANNUAL REPORT STATE-OWNED COMPANIES 2014
COMPANIES
BOARD AND AUDITORS ELECTED FOR 2015/2016Fouriertransform Aktiebolag is a state-
owned venture capital company. The
company was established in December
2008 with equity of approximately SEK
3 billion1). Originally, the company’s
assignment was to contribute invest-
ment to strengthen the Swedish auto-
motive cluster’s international competi-
tiveness. In August 2013, the
company’s business mandate was ex-
tended to include other areas in the
manufacturing industry and related
service industries. The assignment is
performed by providing various forms
of capital on a commercial basis.
OPERATIONS
Fouriertransform invests in operations deemed able to contribute to the Swedish automotive industry, other Swedish industry and related services maintaining their prominent position, particularly in the areas of the environment and safety.
The company’s assignment also includes being an active owner in all part-owned compa-nies, bringing competence to each project by contributing highly qualified board representa-tives, some of whom are employees of Fourier-transform and some of whom are people in the company’s network.
Since its inception in 2009, Fouriertrans-form has invested a total of approximately SEK 1.4 billion in 25 companies. The portfolio companies have a turnover of about SEK 2.5 billion and 1,600 employees.
The company commenced operations in 2009, and investments are made on a long-term basis. Profits are primarily affected by the revaluation of holdings in portfolio companies, net financial items and costs for the manage-ment organisation. The company has 12 employees and offices in Stockholm and Goth-enburg. The company is to be a long-term industrial partner that invests on a commercial basis.
2014
new companies.
companies.
Engineering in Trollhättan.
Over the year, a total of SEK 202 million was invested in five new companies – ÅAC Microtec
Gothenburg, APR Automation in Arvika and SMP Parts in Ilsbo – as well as SEK 197 million in existing portfolio companies.
Reg. no. 556771-5700 www.fouriertransform.se
The company’s costs are primarily attribut-able to personnel costs, and project and con-sulting costs. Effective from the fourth quarter of 2013, Fouriertransform has begun to apply the international accounting standards (IFRS) and all amounts pertain to the investment company, meaning that investments in portfolio companies and short-term investments are valued at their estimated fair value on the closing date.
PERFORMANCE REVIEW
Since its inception, Fouriertransform has invested a total of about SEK 1.4 billion, which compared with the estimated fair value of the existing portfolio and returns from the portfolio companies, corresponds to an increase in value on invested capital of about 2 per cent.
The company’s sustainability work is fully integrated, with sustainability, growth and profitability targets being compatible and coordinated. In 2014, a review was carried out to ensure that the sustainability goals estab-lished in 2013 have been integrated into the portfolio companies’ strategy and support day-to-day business operations. For Fourier-transform, the sustainability targets have been incorporated into the company’s investment process, from investment proposal to exit, in accordance with the approved action plan.
1) The background to the formation of the company
is stated in Government bill “The State’s Responsibility
for Companies with Research and Development Activi-
ties and Other Activities in the Automotive Industry,
etc.” (Bill. 2008/09:95)
Chair: Sigrun Hjelmquist CEO: Per Nordberg
Chair: Sigrun Hjelmquist Board:
Berg, Hasse Johansson, Richard Reinius, Charlotte
Rydin (Richard Reinius was elected at the 2015
Annual General Meeting when Hanna Lagercrantz and
Christina Åkerman left the board) Auditor: Birgitta
Lööf, Deloitte
Remuneration to the Chairman of the Board is SEK
300,000 (300,000). Remuneration to board members
elected by the Annual General Meeting is SEK
150,000 (150,000). No remuneration is payable to
members who are employed by the Swedish Govern-
ment Offices.
GENDER DISTRIBUTION, % Men Women STATE OWNERSHIP, % INVESTMENT PORTFOLIO/NUMBER OF INVESTMENTS
2012 2013 20140
300
600
900
1,200
1,500Carryingamount,investmentportfolio
Number ofinvestments
(13)
(17)
(22)
( )83
17
Employees
67
33
Board
TARGETSFINANCIAL TARGETS
STRATEGIC SUSTAINABILITY TARGETS
PUBLIC POLICY TARGETS
INCOME STATEMENT, SEKm 2014 2013
Net turnover 6 24
Changes in value –112 77
Operating profit/loss –172 42
Profit before tax –80 151
Net profit/loss –91 131
– of which attributable to minority
interests 0 0
BALANCE SHEET, SEKm 2014 2013
Total assets 3,223 3,353
Fixed assets 1,362 1,085
Equity 3,192 3,283
– of which, minority interests 0 0
Net debt –1,851 –2,253
Operating capital 1,342 1,030
KEY RATIOS 2014 2013
Operating margin, % neg 173.7
Return on equity (average), % neg 4.1
Return on operating capital (average), % neg 5.1
Net debt/equity ratio, multiple –0.6 –0.7
Equity/assets ratio, % 99.0 97.9
Gross investments, SEKm 398 408
Appropriation, SEKm 0 0
Dividend, SEKm 0 0
Average no. of employees 12 11
Reported in compliance with GRI
guidelines Yes
Externally assured GRI report Yes
Reports in compliance with IFRS Yes
State ownership 100%

63ANNUAL REPORT STATE-OWNED COMPANIES 2014
COMPANIES
BOARD AND AUDITORS ELECTED FOR 2015/2016Green Cargo AB, which is wholly owned
by the Swedish state, was formed in
2001 in connection with the incorpora-
tion of the Swedish State Railways
state enterprise. At that time, Green
Cargo took over all of the state enter-
prise’s rail freight traffic. Green Cargo’s
business concept is to provide efficient
and sustainable rail logistics for the
Swedish business sector.
OPERATIONS
Green Cargo is Sweden’s largest rail freight operator. The company offers transports both within its network and by means of unit trains. The rail freight market comprises a small number of players. Competition with maritime and road freight companies is very strong.
The company’s largest customers are in the steel, mining, chemical, automotive, engineer-ing, paper and forestry, and trade sectors. The established rail companies are facing increased competition from private players, increasing the requirements on cost-efficient, high-quality freight services. Customers demand efficient international logistics solutions. The rail sector has been slow to adapt to a borderless and integrated Europe has thus found it difficult to compete with other modes of transport for international flows.
Green Cargo’s strategy is to focus on efficient and sustainable rail logistics for the Swedish business sector and to increase quality while conducting operations profitably.
2014
competition and fluctuating volumes.
profits.
The year 2014 was characterised by continued weak economic conditions, intense competition and fluctuating volumes, while the principal focus internally was on achieving sustainable profitability. Profits are headed in the right direction, although much remains to be done. Green Cargo’s operating loss for the full year was SEK 121 (368) million or SEK 80 (178) million excluding non-recurring costs. The improved earnings are attributable largely to the ongoing efficiency enhancement pro-gramme.
The efficiency programme aims to improve network efficiency and to create new approaches and synergies through co-location. The co-location of the operations is largely expected to be completed in the third quarter
of 2015 and the first stage of a new production model was implemented in December 2014. The objective of the programme is for Green Cargo to achieve stable profitability over busi-ness cycles and to boost its operating profit by approximately SEK 400 million in 2016 com-pared with 2013. The changes currently being implemented by Green Cargo represent the most sweeping ones made since the incorpora-tion of the company in 2001.
The company is affected by the uncertain external economic climate. With a strong base in Swedish industry, economic fluctuations have a direct impact on the business.
Volumes increased by 2 per cent compared with the corresponding period last year. This increase occurred mainly in the steel industry.
Safety and punctuality characterise Green Cargo’s daily work. The outcome of the traffic safety index for the year was 94.6 (94.7). The start of the year was characterised by good preparations for the winter within the opera-tions and relatively few shunting accidents. Punctuality of delivery to customers within the promised hour was 95 per cent (95).
PERFORMANCE REVIEW
Green Cargo did not achieve its financial targets in 2014 – these are to be reached by 2016 at the latest. The company paid no dividend for 2014. The strategic sustainability targets have been set for 2020, except with regard to idling of diesel locomotives (2015).
Chair: Lennart Pihl CEO: Jan Kilström
Chair: Lennart Pihl Board: Margareta Alestig Johnson,
Ann-Christine Hvittfeldt, Daniel Kristiansson, Ingvar
Nilsson, Lotta Stalin, Tryggve Sthen (Ingvar Nilsson
was elected at the 2015 Annual General Meeting)
Employee reps: Stefan Bieder, Peter Lundmark Deputy
employee reps: Anders Gustavsson, Jerker Liljeberg
Auditor: Hans Åkervall, KPMG
Remuneration to the Chairman of the Board is SEK
300,000 (300,000). Remuneration to board members
elected by the Annual General Meeting is SEK
150,000 (150,000). No remuneration is payable to
members who are employed by the Swedish Govern-
ment Offices.
2012 2013
negnegneg
Target2016
20140
3
6
9
12
15
RETURN ON EQUITY, %GENDER DISTRIBUTION, % Men Women STATE OWNERSHIP, %
86
14
5743
83
17
Employees Management group Board
TARGETSFINANCIAL TARGETS
STRATEGIC SUSTAINABILITY TARGETS
PUBLIC POLICY TARGETS
INCOME STATEMENT, SEKm 2014 2013
Net turnover 4,154 4,149
Operating profit/loss –121 –368
Profit before tax –171 –394
Net profit/loss –188 –382
– of which attributable to minority
interests 0 0
BALANCE SHEET, SEKm 2014 2013
Total assets 4,192 4,214
Fixed assets 2,969 3,143
Equity 1,096 1,333
– of which, minority interests 0 0
Net debt –711 –540
Operating capital 385 793
KEY RATIOS 2014 2013
Operating margin, % neg neg
Return on equity (average), % neg neg
Return on operating capital (average), % neg neg
Net debt/equity ratio, multiple –0.6 –0.4
Equity/assets ratio, % 26.1 31.6
Gross investments, SEKm 163 343
Appropriation, SEKm 0 0
Dividend, SEKm 0 0
Average no. of employees 2,002 2,125
Reported in compliance with GRI
guidelines Yes
Externally assured GRI report Yes
Reports in compliance with IFRS Yes
State ownership 100%

64 ANNUAL REPORT STATE-OWNED COMPANIES 2014
COMPANIES
BOARD AND AUDITORS ELECTED FOR 2015/2016The first company to administer the
canal was established by a charter is-
sued by King Karl XIII in 1810, and in
1978 AB Göta kanalbolag was regis-
tered when the state assumed control
of assets formerly administered by oth-
er stakeholders. Two resolutions by the
Riksdag, from 1992 and 1994, guide
the owner’s view of Göta kanalbolag’s
commission. The Riksdag determined
that upgrading and operating Göta ka-
nal to preserve its value as a structure
of cultural historical importance and as
a tourist attraction was the concern of
the state.
OPERATIONS
Göta kanal was built between 1810 and 1832. The canal is one of the largest engineering projects ever carried out in Sweden, and has been named as the “Structure of the Millen-nium”. Today, Göta kanalbolag’s assignment is to operate the canal in a manner that preserves its value as a structure of cultural historical importance and as a tourist attraction. Today, Göta kanal is one of the principal engines within the Swedish hospitality industry. The company engages in canal and property operations. The canal operation includes the running of the canal facility, which is 90 km long, with 58 locks and 47 bridges. The canal is mainly navigated by leisure and passenger boats. The company also conducts extensive maintenance and upgrading of the canal and properties to preserve and improve their condition. The property business includes the management of forests, land and properties associated histori-cally and practically to the canal. Most of the properties are leased out as homes or as com-mercial premises. Tourism along the canal is developed in close cooperation with municipali-ties and the business sector. The canal opera-tions generate new conditions for business operations along the canal.
2014
-tions.
-ated with the canal, as well as for visitors to the canal area.
canal but increased caravan tourism.
The increased income from the property opera-tions is a consequence of their market orienta-tion, which generates increased income that can be reinvested in the canal facility and buildings. In recent years, caravan tourism
along the canal has increased significantly and this was also the case in 2014. The year saw the starting shot for the far-reaching, long-term project “Göta kanal – the next 200 years”, which is directly linked to the company’s conservation assignment. The purpose of the project is to document the existing facility, secure its operation under current conditions and to gradually improve the facility through a controlled and optimised renovation pro-gramme. The objective is for the canal to function reliably, providing a canal system through Sweden adapted to current require-ments in terms of safety and functionality.
PERFORMANCE REVIEW
In 2014, Göta kanalbolag reported for the first time the results of the strategic sustainability targets adopted in 2013. All of the targets were met: the customer satisfaction index was 4.7, all water samples were rated “serviceable” with the exception of two of the fifteen samples, which were rated “serviceable with reserva-tions” and the country’s longest tree-lined avenue was replanted with 105 trees. With regard to the responsible employer target, a pilot project was conducted with the Public Employment Service in Motala to design the target. Three young people underwent practical work experience. The board resolved to remove one of the previously established sustainability targets when, during the year, it did not prove possible to secure relevant and verifiable data. The target concerned the number overnight stays in accommodation facilities in the canal area. These facilities are not operated by Göta kanalbolag, but by independent entrepreneurs.
Chair: Elisabeth Nilsson CEO: Anders Donlau
Chair: Elisabeth Nilsson Board: Gunilla Asker, Göran
Carlberg, Anna Ernestam, Bengt-Olov Gunnarson, Jenny
Anna Ernestam and Bengt-Olov Gunnarson were elected
at the 2015 Annual General Meeting when Christer
Berggren and Renée Mohlkert left the board) Employee
rep: Karin Nybrolin Deputy employee rep: Peter Gredin
Auditor: Clas Tegidius, EY
Remuneration to the Chairman of the Board is SEK
60,000 (60,000). Remuneration to board members
elected by the Annual General Meeting is SEK 41,000
(41,000). No remuneration is payable to members
who are employed by the Swedish Government Offices.
2012 2013 20140
2,000
4,000
6,000
8,000
10,000 Passengervessels
Leisure craft
INCOME FROM BOAT TRAFFIC GÖTA KANAL, SEK 000s (excl. VAT)GENDER DISTRIBUTION, % Men Women STATE OWNERSHIP, %
57
4350 50
60
Employees Board
TARGETSFINANCIAL TARGETS
STRATEGIC SUSTAINABILITY TARGETS (summary)
Read the targets in full in the company’s annual report.
PUBLIC POLICY TARGETS
INCOME STATEMENT, SEKm 2014 2013
Net turnover 73 71
Operating profit/loss 0 0
Profit before tax 0 0
Net profit/loss 0 0
– of which attributable to minority
interests 0 0
BALANCE SHEET, SEKm 2014 2013
Total assets 63 57
Fixed assets 54 46
Equity 42 42
– of which, minority interests 0 0
Net debt –5 –5
Operating capital 37 37
KEY RATIOS 2014 2013
Operating margin, % 0 neg
Return on adjusted equity (average), % 0.0 0.1
Return on operating capital (average), % 0 neg
Net debt/equity ratio, multiple –0.1 –0.1
Equity/assets ratio, % 67.1 73.4
Gross investments, SEKm 11 5
Appropriation, SEKm 25 25
Dividend, SEKm 0 0
Average no. of employees 40 39
Reported in compliance with GRI
guidelines Yes
Externally assured GRI report Yes
Reports in compliance with IFRS No
State ownership 100%

65ANNUAL REPORT STATE-OWNED COMPANIES 2014
COMPANIES
BOARD AND AUDITORS ELECTED FOR 2015/2016
GENDER DISTRIBUTION, % Men Women
Since the early 2000s, the Swedish
railway market has gradually been de-
regulated and it is now one the most
competitive in Europe. In November
2009, the Riksdag resolved, in accord-
ance with a government proposal, to
incorporate Banverket Production, a
unit of the former Swedish Rail
Administration. On 1 January 2010
Infranord AB was formed.
OPERATIONS
Infranord provides operation and maintenance, as well as new construction of railways in Sweden and Norway. Sweden is the company’s base with more than 2,000 employees and the largest personnel group consisting of engineers with expertise in rail, electrical, signalling and telecom technology. The company has also been established in Norway since 2010. Effective from January 2015, in addition to the staff functions, operations in Sweden are conducted in two regions, North and South, as well as in the Equipment, Surveying and Components units. In the long term, the outlook for the Nordic rail market remains favourable. There is a general political consensus on continued expansion and modernisation of the railways to enable the transition of transports from road to rail.
2014
due to implemented efficiency improve-ments.
competitiveness.
Infranord shows significant improvement in profitability for the 2014 full year, achieving an operating profit of SEK 32 million, compared with a loss of SEK 190 million the year before. The main reason is the efficiency measures that have been implemented, resulting in lower administrative costs and better resource utilisa-tion. Order intake developed positively in 2014 and was slightly more than SEK 900 million higher than in the preceding year. The com-pany’s competitiveness strengthened over the year, causing the success rate in bidding processes to increase 50 per cent compared with 2013.
Despite the positive trend over the year, the company feels that further streamlining is required for Infranord to be a sustainably successful player for the long term in the Swed-ish rail market. In December, a decision was therefore taken to perform complementary reorganisation and the company served
redundancy notices for about 150 positions. The change affects all parts of the organisation and most of the staff cutbacks affect adminis-trative functions.
Infranord remains a leader in the operation and maintenance of the Swedish railways and secured several new basic operation and main-tenance contracts in Sweden in 2014. In Norway, the company is expanding organically and shows good growth. Among other things, Infranord secured an assignment for track and overhead electricity supply work for the new double track and station at Holmestrand for an order value of SEK 173 million.
Several major future initiatives for the rail-ways in Sweden have been presented and this is expected to generate increased market volumes from the autumn of 2015 at the earliest.
PERFORMANCE REVIEW
Sharply improved profits were reported for 2014, meaning that during that year, the company took significant steps towards achiev-ing its long-term goals. The company will make continued efforts to strengthen its competitive-ness. A dividend may only be paid if the target equity/assets ratio is achieved and conse-quently none was paid.
Infranord’s sustainability target regarding safety work shows that the company needs to continue its efforts to strengthen its safety culture. The number of environmental acci-dents decreased over the year and the company no cases of discrimination in relation to the ethics target.
Chair: Eva Färnstrand CEO: Lars Öhman
Chair: Eva Färnstrand Board: Johan Hallberg, Magnus
Jonasson, Agneta Kores, Johan Skoglund, Gunilla
Spongh, Per Westerberg (Magnus Jonasson and Per
Westerberg were elected at the 2015 Annual General
Meeting when Sven Landelius and Ingemar Ziegler left
the board) Employee reps: Håkan Englund, Jörgen
Lundström Deputy employee reps: Anders Högström,
Dennis Lövgren Auditor: Peter Ekberg, Deloitte
Remuneration to the Chairman of the Board is SEK
380,000 (380,000). Remuneration to board members
elected by the Annual General Meeting is SEK
190,000 (190,000). No remuneration is payable to
members who are employed by the Swedish Govern-
ment Offices.
STATE OWNERSHIP, %
2012 2013 20140
10
20
30
40Target
Outcome
EQUITY/ASSETS RATIO, %
Employees Management group Board
91
9
57 43
67
33
TARGETSFINANCIAL TARGETS
STRATEGIC SUSTAINABILITY TARGETS
For further information on the sustainability targets, see the company’s annual report.
PUBLIC POLICY TARGETS
INCOME STATEMENT, SEKm 2014 2013
Net turnover 3,956 3,787
Operating profit/loss 32 –190
Profit before tax 27 –197
Net profit/loss 17 –162
– of which attributable to minority
interests 0 0
BALANCE SHEET, SEKm 2014 2013
Total assets 2,013 1,805
Fixed assets 778 678
Equity 479 472
– of which, minority interests 0 0
Net debt 150 174
Operating capital 629 646
KEY RATIOS 2014 2013
Operating margin, % 0.8 neg
Return on equity (average), % 3.6 neg
Return on operating capital (average), % 5.0 neg
Net debt/equity ratio, multiple 0.3 0,4
Equity/assets ratio, % 23.8 26.1
Gross investments, SEKm 146 88
Appropriation, SEKm 0 0
Dividend, SEKm 0 0
Average no. of employees 2,184 2,581
Reported in compliance with GRI
guidelines Yes
Externally assured GRI report Yes
Reports in compliance with IFRS Yes
State ownership 100%
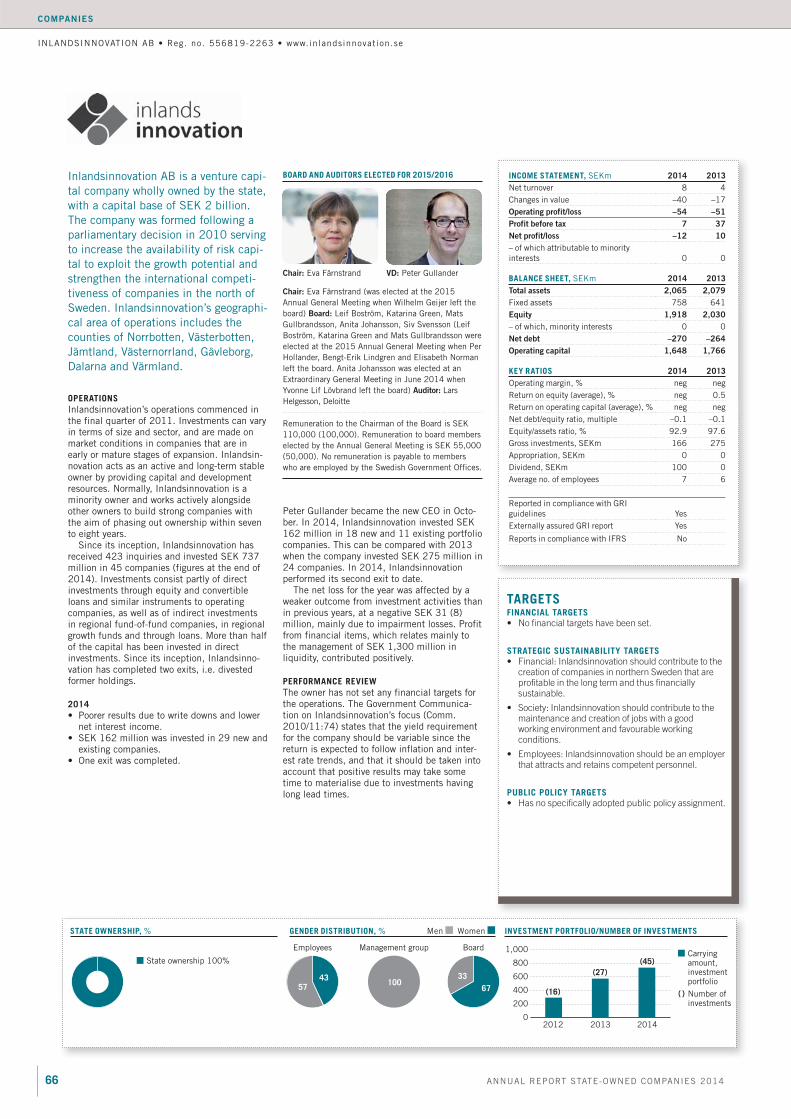
66 ANNUAL REPORT STATE-OWNED COMPANIES 2014
COMPANIES
BOARD AND AUDITORS ELECTED FOR 2015/2016
GENDER DISTRIBUTION, % Men Women
Inlandsinnovation AB is a venture capi-
tal company wholly owned by the state,
with a capital base of SEK 2 billion.
The company was formed following a
parliamentary decision in 2010 serving
to increase the availability of risk capi-
tal to exploit the growth potential and
strengthen the international competi-
tiveness of companies in the north of
Sweden. Inlandsinnovation’s geographi-
cal area of operations includes the
counties of Norrbotten, Västerbotten,
Jämtland, Västernorrland, Gävleborg,
Dalarna and Värmland.
OPERATIONS
Inlandsinnovation’s operations commenced in the final quarter of 2011. Investments can vary in terms of size and sector, and are made on market conditions in companies that are in early or mature stages of expansion. Inlandsin-novation acts as an active and long-term stable owner by providing capital and development resources. Normally, Inlandsinnovation is a minority owner and works actively alongside other owners to build strong companies with the aim of phasing out ownership within seven to eight years.
Since its inception, Inlandsinnovation has received 423 inquiries and invested SEK 737 million in 45 companies (figures at the end of 2014). Investments consist partly of direct investments through equity and convertible loans and similar instruments to operating companies, as well as of indirect investments in regional fund-of-fund companies, in regional growth funds and through loans. More than half of the capital has been invested in direct investments. Since its inception, Inlandsinno-vation has completed two exits, i.e. divested former holdings.
2014
net interest income.
existing companies.
Peter Gullander became the new CEO in Octo-ber. In 2014, Inlandsinnovation invested SEK 162 million in 18 new and 11 existing portfolio companies. This can be compared with 2013 when the company invested SEK 275 million in 24 companies. In 2014, Inlandsinnovation performed its second exit to date.
The net loss for the year was affected by a weaker outcome from investment activities than in previous years, at a negative SEK 31 (8) million, mainly due to impairment losses. Profit from financial items, which relates mainly to the management of SEK 1,300 million in liquidity, contributed positively.
PERFORMANCE REVIEW
The owner has not set any financial targets for the operations. The Government Communica-tion on Inlandsinnovation’s focus (Comm. 2010/11:74) states that the yield requirement for the company should be variable since the return is expected to follow inflation and inter-est rate trends, and that it should be taken into account that positive results may take some time to materialise due to investments having long lead times.
Chair: Eva Färnstrand VD: Peter Gullander
Chair: Eva Färnstrand (was elected at the 2015
Annual General Meeting when Wilhelm Geijer left the
board) Board: Leif Boström, Katarina Green, Mats
Gullbrandsson, Anita Johansson, Siv Svensson (Leif
Boström, Katarina Green and Mats Gullbrandsson were
elected at the 2015 Annual General Meeting when Per
Hollander, Bengt-Erik Lindgren and Elisabeth Norman
left the board. Anita Johansson was elected at an
Extraordinary General Meeting in June 2014 when
Yvonne Lif Lövbrand left the board) Auditor: Lars
Helgesson, Deloitte
Remuneration to the Chairman of the Board is SEK
110,000 (100,000). Remuneration to board members
elected by the Annual General Meeting is SEK 55,000
(50,000). No remuneration is payable to members
who are employed by the Swedish Government Offices.
INLANDSINNOVATION AB www.inlandsinnovation.se
STATE OWNERSHIP, %
BoardEmployees Management group
33
675743
100
TARGETSFINANCIAL TARGETS
STRATEGIC SUSTAINABILITY TARGETS
PUBLIC POLICY TARGETS
INCOME STATEMENT, SEKm 2014 2013
Net turnover 8 4
Changes in value –40 –17
Operating profit/loss –54 –51
Profit before tax 7 37
Net profit/loss –12 10
– of which attributable to minority
interests 0 0
BALANCE SHEET, SEKm 2014 2013
Total assets 2,065 2,079
Fixed assets 758 641
Equity 1,918 2,030
– of which, minority interests 0 0
Net debt –270 –264
Operating capital 1,648 1,766
KEY RATIOS 2014 2013
Operating margin, % neg neg
Return on equity (average), % neg 0.5
Return on operating capital (average), % neg neg
Net debt/equity ratio, multiple –0.1 –0.1
Equity/assets ratio, % 92.9 97.6
Gross investments, SEKm 166 275
Appropriation, SEKm 0 0
Dividend, SEKm 100 0
Average no. of employees 7 6
Reported in compliance with GRI
guidelines Yes
Externally assured GRI report Yes
Reports in compliance with IFRS No
INVESTMENT PORTFOLIO/NUMBER OF INVESTMENTS
2012 2013 20140
200
400
600
800
1,000Carryingamount,investmentportfolio
Number ofinvestments
(16)
(27)
(45)
( )
State ownership 100%

67ANNUAL REPORT STATE-OWNED COMPANIES 2014
COMPANIES
BOARD AND AUDITORS ELECTED FOR 2015/2016
www.jernhusen.se
Jernhusen AB was formed in 2001 in
connection with the incorporation of
the Swedish State Railways state enter-
prise. Jernhusen owns, develops and
manages stations, railyards, mainte-
nance depots and freight and container
terminals along the Swedish railways.
The objective is for Jernhusen to be a
strong, value-generating player meeting
travellers’, traffic operators’ and other
users’ property needs at stations and
engineering facilities on competitively
neutral terms.
OPERATIONS
Jernhusen is a property company in the trans-port sector and owns station facilities, mainte-nance depots and freight terminals in growing communities and at key transport nodes. Existing and new station facilities, maintenance depots and freight terminals are developed. The company also develops and provides other service offerings in connection with these properties. During land development, the company also owns other properties in these areas. Properties are sold either with develop-ment rights or once investments have been completed, in both cases taking risk and return requirements into account. Jernhusen’s opera-tions are organised into four business areas: Stations, City Projects, Depots and Freight Terminals. Jernhusen has several categories of tenants. At stations and in station areas, they are mainly shops and restaurants, but also other types of businesses and organisations. Tenants in maintenance depots are essentially maintenance contractors, but also train opera-tors. At the freight and container terminals, terminal operators and forwarding agents lease warehouses and logistics facilities adjacent to their terminals.
2014
is primarily attributable to changes in the property portfolio.
unrealised value changes in the property portfolio, but negatively by value changes in the derivative portfolio.
year’s record level.
The slight increase in income is primarily attributable to changes in the property portfolio with the Boxholm depot and the Stockholm Årsta container terminal having been added, as well as price adjustments on infrastructure management. Increased rent levels and income from the services provided within Jernhusen’s premises, as well as advertising and events, contributed positively to the increase in income. Operating expenses also increased slightly, driven by expensed maintenance costs and increased costs for property administration. Due to divestments having been made, Jern-husen had a net tax asset for the year.
PERFORMANCE REVIEW
The average return on equity over the past five years is 9.8 (8.5) per cent, which is below the target. The equity/asset ratio is strong and remains within the target range, while the interest coverage ratio exceeds the target. The dividend for the year was SEK 113 million, which is in line with policy.
The number of visitors to the stations increased by 3 per cent and, during the year, six properties passed the requirements corre-sponding the Sweden Green Building Council’s Bronze level.
Chair: Kjell Hasslert CEO: Kerstin Gillsbro
Chair: Kjell Hasslert Board: Kristina Ekengren, Jakob
Grinbaum, Anders Kupsu, Kerstin Lindberg Göransson,
Ingegerd Simonsson, Christel Wiman Employee rep:
Thomas Franzon Auditor: Magnus Fredmer, EY
Remuneration to the Chairman of the Board is SEK
225,000 (225,000). Remuneration to board members
elected by the Annual General Meeting is SEK
120,000 (120,000). No remuneration is payable to
members who are employed by the Swedish Govern-
ment Offices.
2012 2013
Target
Outcome
20140
5
10
15
20
RETURN ON EQUITY, %STATE OWNERSHIP, %
Employees Management group Board
53 47 435750 50
TARGETSFINANCIAL TARGETS
STRATEGIC SUSTAINABILITY TARGETS
PUBLIC POLICY TARGETS
INCOME STATEMENT, SEKm 2014 2013
Net turnover 748 682
Changes in value 17 400
Operating profit/loss 500 797
Profit before tax 355 650
Net profit/loss 389 513
– of which attributable to minority
interests 1 –1
BALANCE SHEET, SEKm 2014 2013
Total assets 12,776 11,920
Fixed assets 12,417 11,659
Equity 5,262 4,973
– of which, minority interests 8 7
Net debt 6,302 5,638
Operating capital 11,564 10,611
KEY RATIOS 2014 2013
Surplus ratio, % 45 42
Operating margin, % 66.9 116.9
Return on equity (average), % 7.6 10.8
Return on operating capital (average), % 4.5 8.0
Net debt/equity ratio, multiple 1.2 1.1
Equity/assets ratio, % 41.2 41.7
Gross investments, SEKm 1,199 1,294
Appropriation, SEKm 0 0
Dividend, SEKm 113 100
Average no. of employees 222 237
Reported in compliance with GRI
guidelines Yes
Externally assured GRI report Yes
Reports in compliance with IFRS Yes
GENDER DISTRIBUTION, % Men Women
State ownership 100%

68 ANNUAL REPORT STATE-OWNED COMPANIES 2014
COMPANIES
BOARD AND AUDITORS ELECTED FOR 2015/2016
the state’s shares in Lernia.
OPERATIONS
2014
PERFORMANCE REVIEW
Chair: CEO:
Chair: Board:
Employee reps:
Auditor:
State ownership 100%
2012 2013
Target
Outcome
20140
2
4
6
8
10
neg
OPERATING MARGIN, %GENDER DISTRIBUTION, %STATE OWNERSHIP, %
Employees Management group Board
63
37
5743
60
40
TARGETSFINANCIAL TARGETS
Targets in 2014. New financial targets were adopted by the 2015 Annual General Meeting.
STRATEGIC SUSTAINABILITY TARGETS
PUBLIC POLICY TARGET
INCOME STATEMENT, 2014 2013
Operating profit/loss 111 185
Profit before tax 112 188
Net profit/loss 85 146
interests
BALANCE SHEET, 2014 2013
Total assets 1,011 1,070
Equity 542 525
Net debt –334 –148
Operating capital 208 377
KEY RATIOS 2014 2013
Yes
Yes
Yes

69ANNUAL REPORT STATE-OWNED COMPANIES 2014
COMPANIES
BOARD AND AUDITORS ELECTED FOR 2015/2016
OPERATIONS
2014
PERFORMANCE REVIEW
Chair: CEO:
Chair: Board:
Employee
reps:
Deputy employee reps:
Auditor:
2012 2013
Target
Outcome
20140
10
20
30
40
RETURN ON EQUITY, %GENDER DISTRIBUTION, %STATE OWNERSHIP, %
Employees Management group Board
80
20
6238
70
30
TARGETSFINANCIAL TARGETS
STRATEGIC SUSTAINABILITY TARGETS
Read all 12 sustainability targets in the company’s annual report.
PUBLIC POLICY TARGET
INCOME STATEMENT, 2014 2013
Operating profit/loss 570 7,639
Profit before tax 594 7,768
Net profit/loss 347 6,032
interests
BALANCE SHEET, 2014 2013
Total assets 63,133 57,822
Equity 37,754 41,472
Net debt –16 –7,315
Operating capital 37,738 34,157
KEY RATIOS 2014 2013
Yes
Yes
Yes
State ownership 100%

70 ANNUAL REPORT STATE-OWNED COMPANIES 2014
COMPANIES
BOARD AND AUDITORS ELECTED FOR 2015/2016
GENDER DISTRIBUTION, %
OPERATIONS
2014
Raka Spåret! (The Direct Line)
PERFORMANCE REVIEW
Chair: CEO:
Chair:
Board:
Employee reps:
Deputy employee
reps:
Auditor:
STATE OWNERSHIP, %
Employees Management group Board
66
34 29
715644
TARGETSFINANCIAL TARGETS
Targets in 2014. Additional financial targets were adopted by the 2015 Annual General Meeting.
STRATEGIC SUSTAINABILITY TARGETS
PUBLIC POLICY TARGET
INCOME STATEMENT, 2014 2013
Operating profit/loss 12 –28
Profit before tax 12 –27
Net profit/loss 10 –20
interests
BALANCE SHEET, 2014 2013
Total assets 198 202
Equity 96 86
Net debt –19 –7
Operating capital 77 79
KEY RATIOS 2014 2013
Yes
Yes
2012 2013
Target
Outcome
20140
2
4
6
8
10
neg
OPERATING MARGIN, %
State ownership 100%
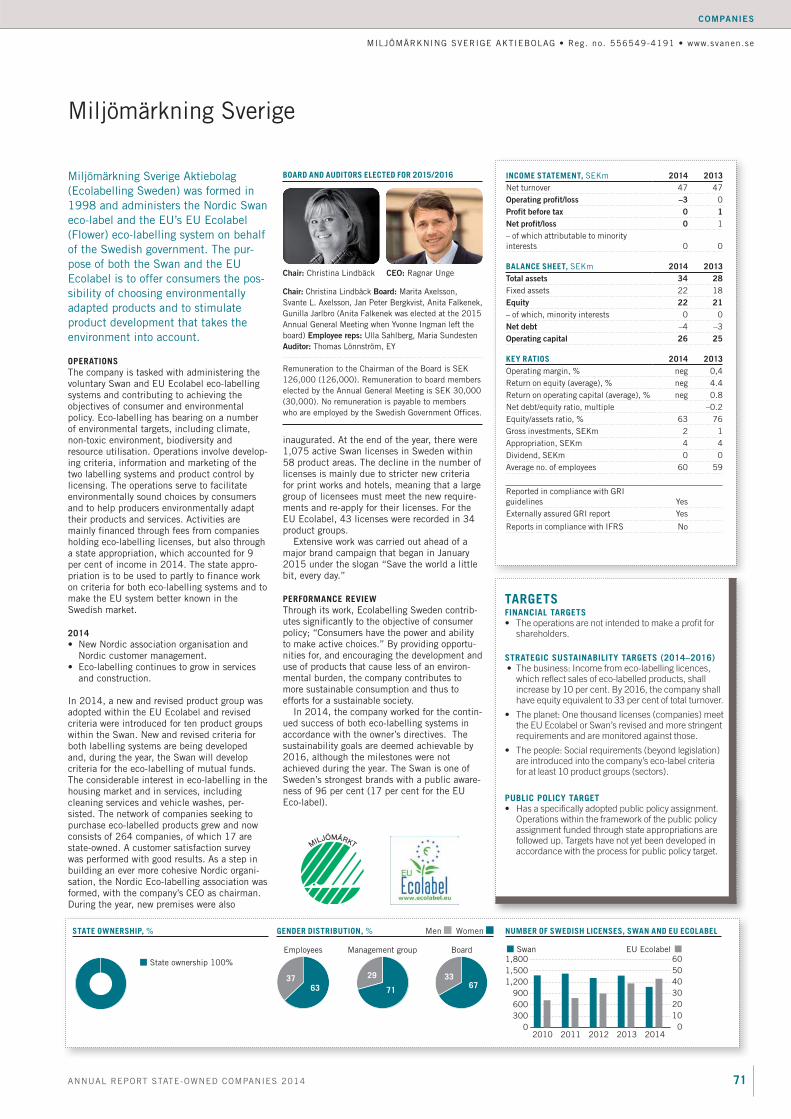
71ANNUAL REPORT STATE-OWNED COMPANIES 2014
COMPANIES
INCOME STATEMENT, 2014 2013
Operating profit/loss –3
Profit before tax 0 1
Net profit/loss 0
interests
BALANCE SHEET, 2014 2013
Total assets 34 28
Equity 22 21
Net debt
Operating capital 26 25
KEY RATIOS 2014 2013
Yes
Yes
BOARD AND AUDITORS ELECTED FOR 2015/2016
OPERATIONS
2014
PERFORMANCE REVIEW
Chair: CEO:
Chair: Board:
Employee reps:
Auditor:
201220112010 2013
Swan
2014
EU Ecolabel
0
300
600
900
1,200
1,500
1,800 60
50
40
30
20
10
0
NUMBER OF SWEDISH LICENSES, SWAN AND EU ECOLABELGENDER DISTRIBUTION, %STATE OWNERSHIP, %
Employees Management group Board
3763
3367
71
29
TARGETSFINANCIAL TARGETS
STRATEGIC SUSTAINABILITY TARGETS (2014–2016)
PUBLIC POLICY TARGET
State ownership 100%

72 ANNUAL REPORT STATE-OWNED COMPANIES 2014
COMPANIES
OPERATIONS
2014
PERFORMANCE REVIEW
Chair: Kristina Rennerstedt
Chair: Board:
Employee reps:
Deputy
employee reps:
Jensen Auditor:
2011 2012 2013
Opera
Balett
20140
25
50
75
100
ATTENDANCE RATE, %GENDER DISTRIBUTION, %STATE OWNERSHIP, %
INCOME STATEMENT, 2014 2013
Operating profit/loss 0 4
Profit before tax 1 6
Net profit/loss 1 6
interests
BALANCE SHEET, 2014 2013
Total assets 229 203
Equity 33 33
Net debt –41 –113
Operating capital –8 –80
KEY RATIOS 2014 2013
Yes
Yes
BOARD AND AUDITORS ELECTED FOR 2015/2016
Employees Management group Board
52 48 4357
30
70
TARGETSFINANCIAL TARGETS
STRATEGIC SUSTAINABILITY TARGETS
Read the targets in full in the company’s annual report.
PUBLIC POLICY TARGET
State ownership 100%
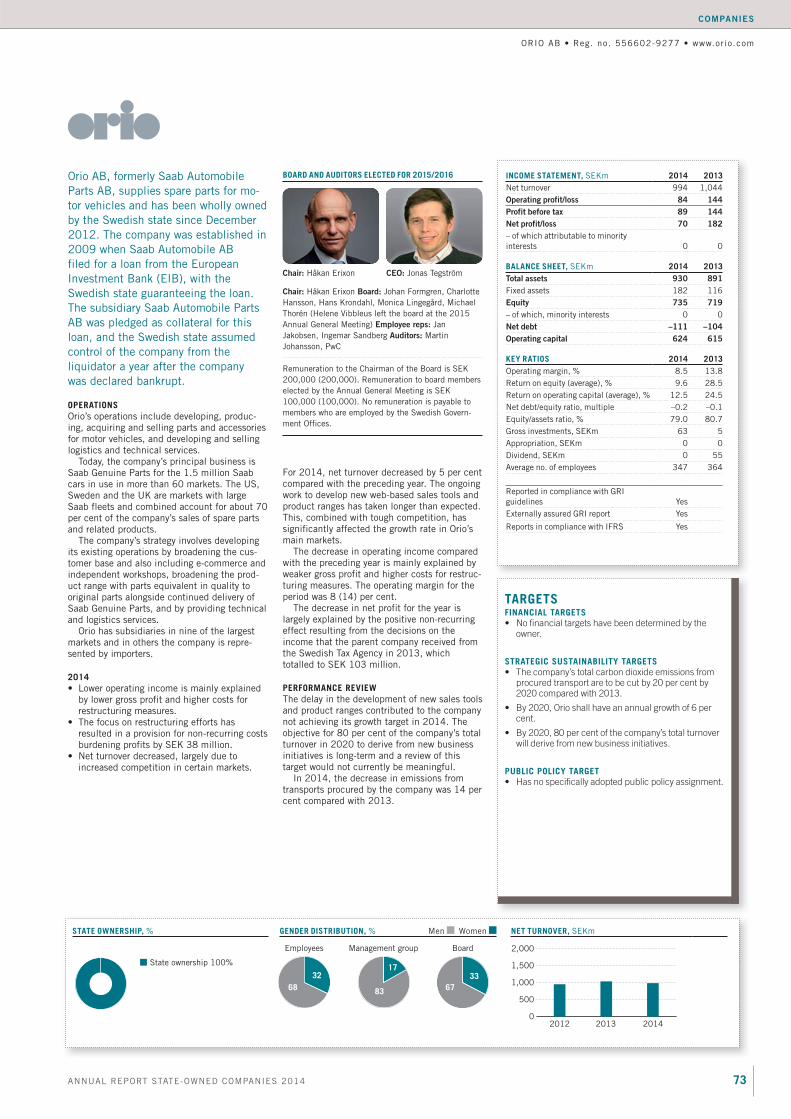
73ANNUAL REPORT STATE-OWNED COMPANIES 2014
COMPANIES
INCOME STATEMENT, 2014 2013
Operating profit/loss 84 144
Profit before tax 89 144
Net profit/loss 70 182
interests
BALANCE SHEET, 2014 2013
Total assets 930 891
Equity 735 719
Net debt –111 –104
Operating capital 624 615
KEY RATIOS 2014 2013
Yes
Yes
Yes
BOARD AND AUDITORS ELECTED FOR 2015/2016
OPERATIONS
2014
PERFORMANCE REVIEW
Chair: CEO:
Chair: Board:
Employee reps: Jan
Auditors:
GENDER DISTRIBUTION, %STATE OWNERSHIP, %
Employees Management group Board
68
32
67
33
83
17
2012 2013 20140
500
1,000
1,500
2,000
NET TURNOVER,
TARGETSFINANCIAL TARGETS
STRATEGIC SUSTAINABILITY TARGETS
PUBLIC POLICY TARGET
State ownership 100%
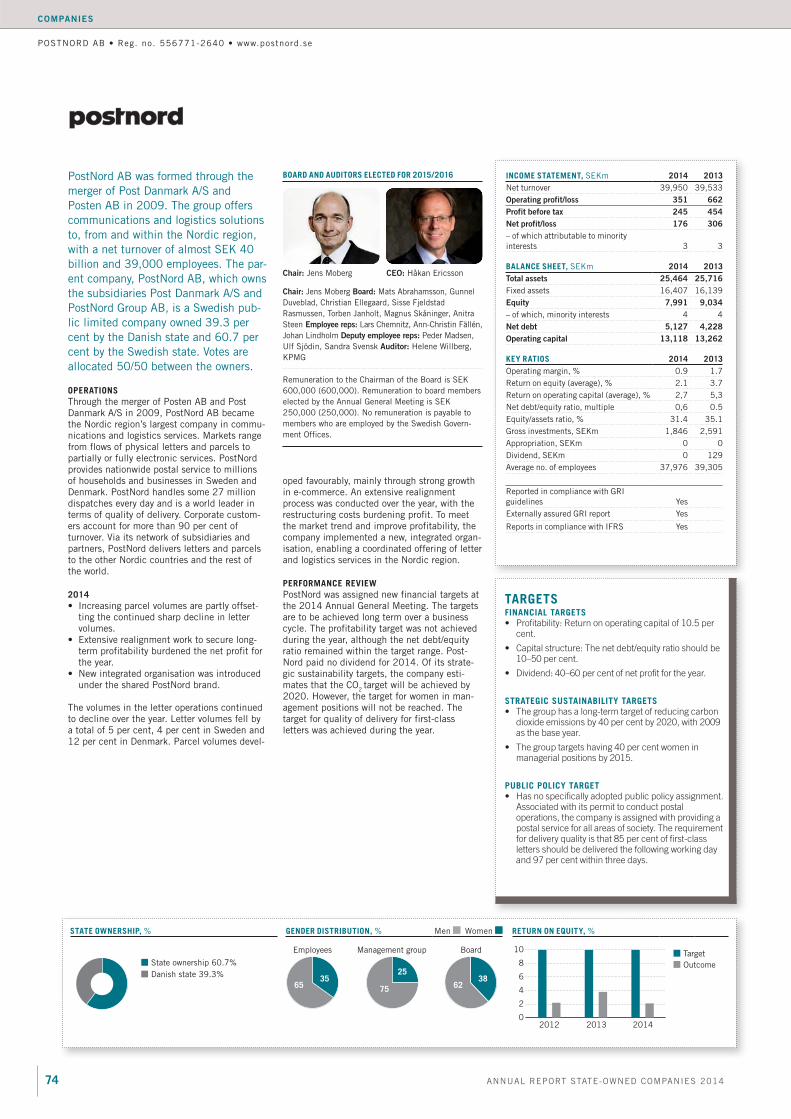
74 ANNUAL REPORT STATE-OWNED COMPANIES 2014
COMPANIES
INCOME STATEMENT, 2014 2013
Operating profit/loss 351 662
Profit before tax 245 454
Net profit/loss 176 306
interests
BALANCE SHEET, 2014 2013
Total assets 25,464 25,716
Equity 7,991 9,034
Net debt 5,127 4,228
Operating capital 13,118 13,262
KEY RATIOS 2014 2013
Yes
Yes
Yes
BOARD AND AUDITORS ELECTED FOR 2015/2016
OPERATIONS
2014
PERFORMANCE REVIEW
Chair: CEO:
Chair: Board:
Employee reps:
Deputy employee reps:
Auditor:
State ownership 60.7%
Danish state 39.3%
2013 201420120
2
4
6
8
10Target
Outcome
RETURN ON EQUITY, %GENDER DISTRIBUTION, %STATE OWNERSHIP, %
Employees Management group Board
6535
6238
75
25
TARGETSFINANCIAL TARGETS
STRATEGIC SUSTAINABILITY TARGETS
PUBLIC POLICY TARGET

75ANNUAL REPORT STATE-OWNED COMPANIES 2014
COMPANIES
INCOME STATEMENT, 2014 2013
Operating profit/loss 51 32
Profit before tax 58 41
Net profit/loss 48 30
interests
BALANCE SHEET, 2014 2013
Total assets 2,046 1,807
Equity 927 875
Net debt 252 155
Operating capital 1,179 1,030
KEY RATIOS 2014 2013
Yes
Yes
Yes
BOARD AND AUDITORS ELECTED FOR 2015/2016
OPERATIONS
2014
ies.
Chair: CEO:
Chair: Board:
Auditor:
GENDER DISTRIBUTION, %STATE OWNERSHIP, %
Business sector 55%
Competence and structural
development funds 18%
Research grants obtained
in competition 27%
RISE GROUP’S TURNOVER IN 2014, %
Employees
67
33
Board
6238
TARGETSFINANCIAL TARGETS
STRATEGIC SUSTAINABILITY TARGETS
PUBLIC POLICY TARGET
State ownership 100%

76 ANNUAL REPORT STATE-OWNED COMPANIES 2014
COMPANIES
INCOME STATEMENT, 2014 2013
Operating profit/loss 0 –40
Profit before tax 92 21
Net profit/loss 81 15
interests
BALANCE SHEET, 2014 2013
Total assets 3,522 3,360
Equity 1,656 1,575
Net debt –2,743 –2,524
Operating capital –1,087 –949
KEY RATIOS 2014 2013
Yes
Yes
BOARD AND AUDITORS ELECTED FOR 2015/2016
OPERATIONS
2014
PERFORMANCE REVIEW
Chair: CEO:
Chair: Board:
Employee reps: Hans
Deputy
employee reps:
Auditor:
2011 2012
Target
Outcome
201420130
200
400
600
800
1,000
1,200
NUMBER OF TRANSITIONSGENDER DISTRIBUTION, %STATE OWNERSHIP, %
Employees Management group Board
56 4457
43
67
33
TARGETSFINANCIAL TARGETS
STRATEGIC SUSTAINABILITY TARGETS
Read more about the sustainability targets in the
company’s annual report.
PUBLIC POLICY TARGET
State ownership 100%

77ANNUAL REPORT STATE-OWNED COMPANIES 2014
COMPANIES
INCOME STATEMENT, 20141) 20131)
Operating profit/loss 153 2,596
Profit before tax –918 1,648
Net profit/loss –719 1,358
interests
BALANCE SHEET, 20141) 20131)
Total assets 29,325 26,813
Equity 4,907 3,226
Net debt –2,676 1,139
Operating capital 2,231 4,365
KEY RATIOS 20141) 20131)
Yes
Yes
Yes
BOARD AND AUDITORS ELECTED FOR 2015/2016
PERFORMANCE REVIEW
Chair: CEO:
Chair: Board:
Employee reps:
Deputy employee reps:
Auditors:
State ownership 21.4%
The Danish state 14.3%
The Norwegian state 14.3%
The Knut and Alice Wallenberg
Foundation 7.6%
Other owners 42.4%
Employees Management group Board
6040
75
25
87
13
SHARE PRICE TREND JANUARY 2012–FEBRUARY 2015GENDER DISTRIBUTION, %STATE OWNERSHIP, %
OPERATIONS
2013/2014 1)
0
50
100
150
200
250
300
350SASOMX Stockholm Benchmark GI
11-12-30 12-12-30 13-12-30 15-02-25
TARGETSFINANCIAL TARGETS
STRATEGIC SUSTAINABILITY TARGETS
PUBLIC POLICY TARGET
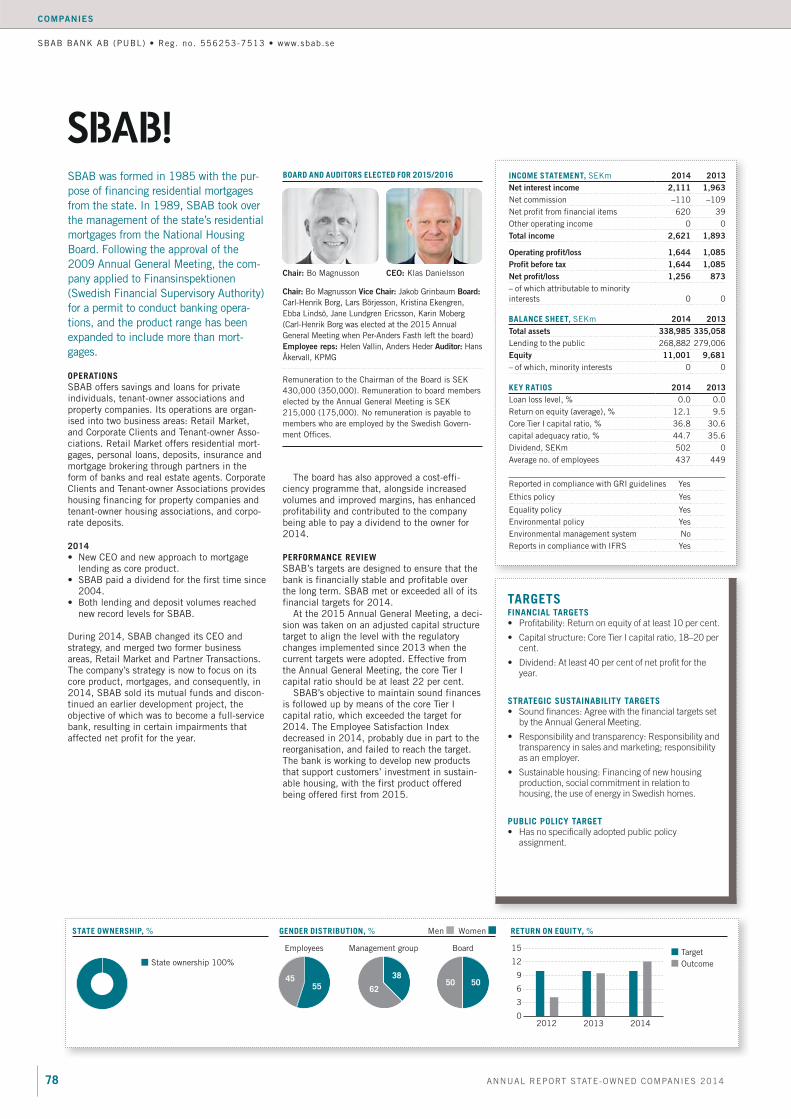
78 ANNUAL REPORT STATE-OWNED COMPANIES 2014
COMPANIES
INCOME STATEMENT, 2014 2013
Net interest income 2,111 1,963
Total income 2,621 1,893
Operating profit/loss 1,644 1,085
Profit before tax 1,644 1,085
Net profit/loss 1,256 873
interests
BALANCE SHEET, 2014 2013
Total assets 338,985 335,058
Equity 11,001 9,681
KEY RATIOS 2014 2013
Yes
Yes
Yes
Yes
BOARD AND AUDITORS ELECTED FOR 2015/2016
OPERATIONS
2014
PERFORMANCE REVIEW
Chair: CEO:
Chair: Vice Chair: Board:
Employee reps: Auditor: Hans
Target
Outcome
20120
3
6
9
12
15
2013 2014
RETURN ON EQUITY, %GENDER DISTRIBUTION, %STATE OWNERSHIP, %
Employees Management group Board
4555
50 5062
38
TARGETSFINANCIAL TARGETS
STRATEGIC SUSTAINABILITY TARGETS
PUBLIC POLICY TARGET
State ownership 100%

79ANNUAL REPORT STATE-OWNED COMPANIES 2014
COMPANIES
BOARD AND AUDITORS ELECTED FOR 2015/2016
GENDER DISTRIBUTION, %
OPERATIONS
2014
PERFORMANCE REVIEW
Chair: CEO:
Chair: Board:
Auditor:
STATE OWNERSHIP, %
Employees Management group Board
5446
50 5043
57
2012 2013
Target
Outcome
20140
2
4
6
8
10
RETURN ON EQUITY, %
TARGETSFINANCIAL TARGETS
Targets in 2014. New targets were adopted by the
2015 Annual General Meeting.
STRATEGIC SUSTAINABILITY TARGETS
PUBLIC POLICY TARGET
INCOME STATEMENT, 2014 2013
Net interest income 1,578 1,555
Total income 2,078 1,958
Operating profit/loss 1,629 1,408
Profit before tax 1,629 1,408
Net profit/loss 1,260 1,090
interests
BALANCE SHEET, 2014 2013
Total assets 325,166 306,554
Equity 16,157 14,990
KEY RATIOS 2014 2013
Yes
Yes
Yes
State ownership 100%
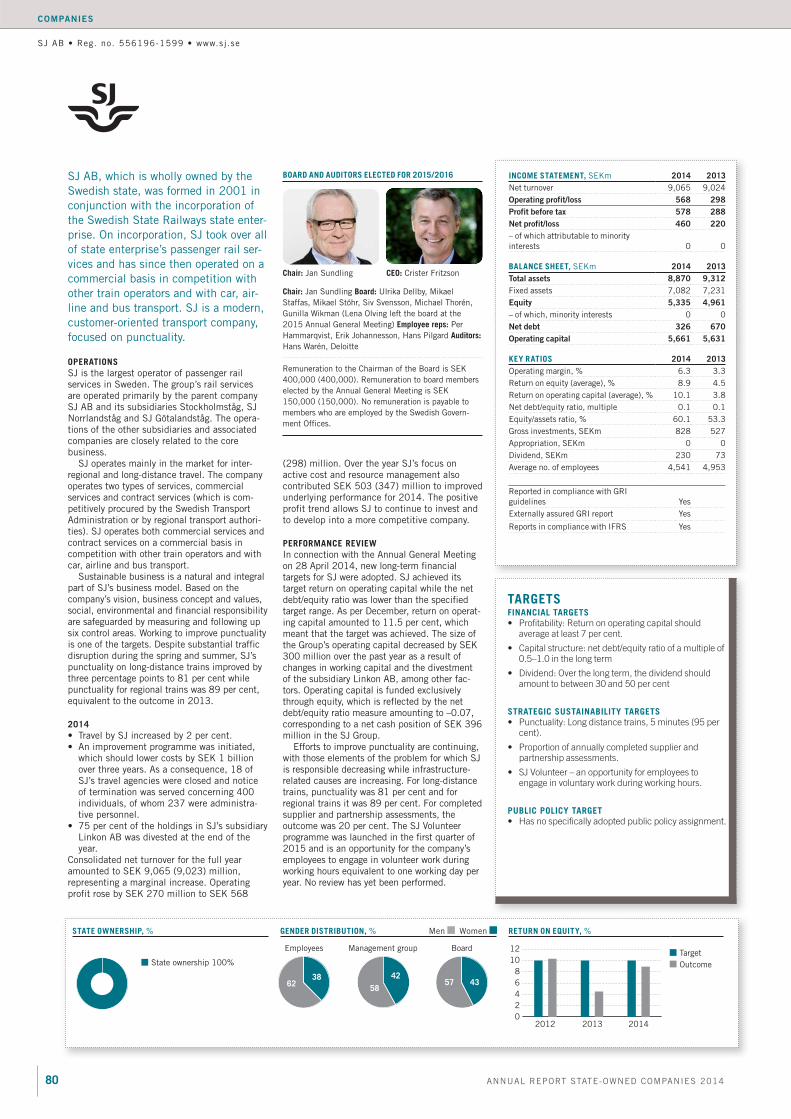
80 ANNUAL REPORT STATE-OWNED COMPANIES 2014
COMPANIES
BOARD AND AUDITORS ELECTED FOR 2015/2016
Chair: CEO:
Chair: Board:
Employee reps:
Auditors:
OPERATIONS
2014
PERFORMANCE REVIEW
GENDER DISTRIBUTION, %
2012 2013
Target
Outcome
20140
2
4
6
8
10
12
RETURN ON EQUITY, %
Employees Management group Board
6238
57 4358
42
STATE OWNERSHIP, %
TARGETSFINANCIAL TARGETS
STRATEGIC SUSTAINABILITY TARGETS
PUBLIC POLICY TARGET
INCOME STATEMENT, 2014 2013
Operating profit/loss 568 298
Profit before tax 578 288
Net profit/loss 460 220
interests
BALANCE SHEET, 2014 2013
Total assets 8,870 9,312
Equity 5,335 4,961
Net debt 326 670
Operating capital 5,661 5,631
KEY RATIOS 2014 2013
Yes
Yes
Yes
State ownership 100%

81ANNUAL REPORT STATE-OWNED COMPANIES 2014
COMPANIES
BOARD AND AUDITORS ELECTED FOR 2015/2016
OPERATIONS
2014
PERFORMANCE REVIEW
Chair: CEO:
Chair:
Board:
Employee reps: Deputy
employee reps:
Auditor:
State ownership 50%
The Swedish Association
of Local Authorities and
Regions (SALAR) 50%
2012 2013
Target
Outcome
negneg
20140
5
10
15
20
RETURN ON EQUITY, %GENDER DISTRIBUTION, %STATE OWNERSHIP, %
Employees Management group Board
42
5844
5644
56
TARGETSFINANCIAL TARGETS
STRATEGIC SUSTAINABILITY TARGETS
PUBLIC POLICY TARGET
INCOME STATEMENT, 2014 2013
Operating profit/loss 30 11
Profit before tax 33 13
Net profit/loss 29 9
interests
BALANCE SHEET, 2014 2013
Total assets 618 570
Equity 162 133
Net debt –128 –82
Operating capital 34 51
KEY RATIOS 2014 2013
Yes
Yes
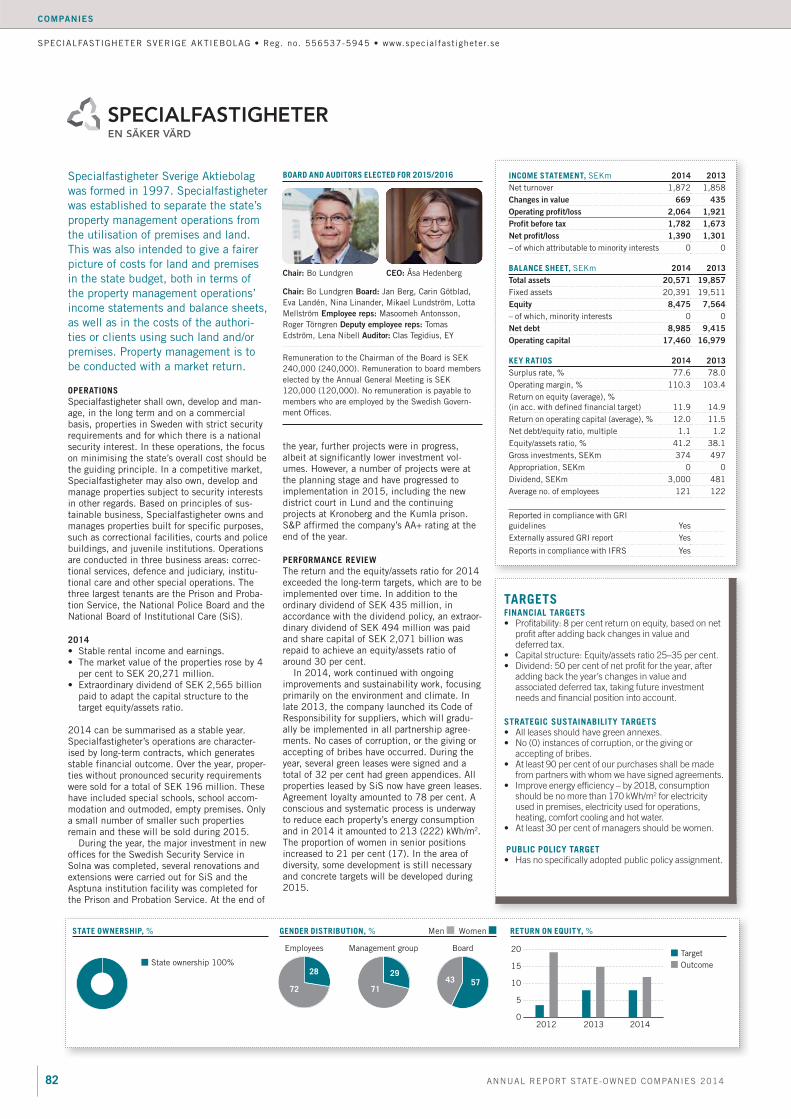
82 ANNUAL REPORT STATE-OWNED COMPANIES 2014
COMPANIES
BOARD AND AUDITORS ELECTED FOR 2015/2016
OPERATIONS
2014
PERFORMANCE REVIEW
.
Chair: CEO:
Chair: Board:
Employee reps:
Deputy employee reps:
Auditor:
2012 2013
Target
Outcome
20140
5
10
15
20
RETURN ON EQUITY, %GENDER DISTRIBUTION, %STATE OWNERSHIP, %
Employees Management group Board
72
2843 57
71
29
TARGETSFINANCIAL TARGETS
STRATEGIC SUSTAINABILITY TARGETS
PUBLIC POLICY TARGET
INCOME STATEMENT, 2014 2013
Changes in value 669 435
Operating profit/loss 2,064 1,921
Profit before tax 1,782 1,673
Net profit/loss 1,390 1,301
BALANCE SHEET, 2014 2013
Total assets 20,571 19,857
Equity 8,475 7,564
Net debt 8,985 9,415
Operating capital 17,460 16,979
KEY RATIOS 2014 2013
Yes
Yes
Yes
State ownership 100%

83ANNUAL REPORT STATE-OWNED COMPANIES 2014
COMPANIES
BOARD AND AUDITORS ELECTED FOR 2015/2016
OPERATIONS
Science Services
Satellite Management Services (SaMS)
Engineering Services
Technology
2014
PERFORMANCE REVIEW
Chair: Hans Karlander
Chair: Board:
Employee reps:
Deputy employee reps:
Auditor:
2012 2013
Target
Outcome
20140
2
4
6
8
RETURN ON OPERATING CAPITAL, %GENDER DISTRIBUTION, %STATE OWNERSHIP, %
Employees Management group Board
77
23
67
33
78
22
TARGETSFINANCIAL TARGETS
STRATEGIC SUSTAINABILITY TARGETS
PUBLIC POLICY TARGET
INCOME STATEMENT, 2014 2013
Operating profit/loss 31 30
Profit before tax 41 22
Net profit/loss 34 11
interests
BALANCE SHEET, 2014 2013
Total assets 1,005 898
Equity 503 446
Net debt 72 –37
Operating capital 575 410
KEY RATIOS 2014 2013
Yes
Yes
Yes
State ownership 100%

84 ANNUAL REPORT STATE-OWNED COMPANIES 2014
BOARD AND AUDITORS ELECTED FOR 2015/2016
COMPANIES
Single-family dwelling 40%
Muncipality 40%
Other than muncipality 20%
MOVING CHAINS – accommodation prior to transition into sheltered housing, %
STATENS BOSTADSOMVANDLING AB SBO
the housing market in communities
liquidates properties taken over from
municipalities or municipal housing
remodelling of existing housing hold
OPERATIONS
tions focus on assisting the restructuring
achieved in the local housing market, the
2014
This creates positive home moving chains in
PERFORMANCE REVIEW
Chair: CEO: Ann Eriksson
Chair:
Board:
Auditor: Lars Magnusson,
Deloitte
State ownership 100%
GENDER DISTRIBUTION, % Men STATE OWNERSHIP, %
Employees Board
67
33
6040
TARGETSFINANCIAL TARGETS
STRATEGIC SUSTAINABILITY TARGETS (A SELECTION)
Read the targets in full in the company’s annual report.
PUBLIC POLICY TARGETS
INCOME STATEMENT, SEKm 2014 2013
Net turnover
Operating profit/loss –16 –17
Profit before tax –5 –5
Net profit/loss –9 –7
interests
BALANCE SHEET, SEKm 2014 2013
Total assets 541 551
Fixed assets
Equity 509 534
Net debt –313 –334
Operating capital 196 200
KEY RATIOS 2014 2013
Operating margin, % neg neg
neg neg
neg neg
Gross investments, SEKm
Appropriation, SEKm
Dividend, SEKm
guidelines Yes
Yes
No

85ANNUAL REPORT STATE-OWNED COMPANIES 2014
BOARD AND AUDITORS ELECTED FOR 2015/2016
COMPANIES
State ownership 100%
Sveaskog AB has its origins in the incor
OPERATIONS
per cent of its productive forest land for nature
forest land to individuals to facilitate purchas
the aim of Sveaskog’s land sales programme is
2014
PERFORMANCE REVIEW
still high level on the leadership index and
Chair: CEO:
Chair: Board:
Deputy employee reps
Eriksson Auditor:
2012
Target
Outcome
201420130
1
2
3
4
5
RETURN ON EQUITY, %GENDER DISTRIBUTION, % Men STATE OWNERSHIP, %
Employees Management group Board
80
20
435760
40
TARGETSFINANCIAL TARGETS
STRATEGIC SUSTAINABILITY TARGETS
Read the targets in full in the company’s annual report.
PUBLIC POLICY TARGETS
INCOME STATEMENT, SEKm 2014 2013
Net turnover
Changes in value 1,032 1,046
Operating profit/loss 2,418 2,214
Profit before tax 2,157 1,941
Net profit/loss 1,691 1,475
interests
BALANCE SHEET, SEKm 2014 2013
Total assets 37,203 35,828
Fixed assets
Equity 18,463 17,396
Net debt 9,552 9,689
Operating capital 28,015 27,085
KEY RATIOS 2014 2013
Operating margin, %
Gross investments, SEKm
Appropriation, SEKm
Dividend, SEKm
guidelines Yes
Yes
Yes

86 ANNUAL REPORT STATE-OWNED COMPANIES 2014
BOARD AND AUDITORS ELECTED FOR 2015/2016
COMPANIES
OPERATIONS
The Öresund Bridge helps strengthen the
the management of assets in the form of roads
tions and maintenance, customer service, and
ensure that the operation and maintenance of
2014
Income and operating profit rose compared
ticipation in the consortium according to the
PERFORMANCE REVIEW
Chair: Lena Erixon CEO: Ulf Lundin
Chair: Lena Erixon Board: Lars Erik Fredriksson,
Auditor:
2012 2013 20140
4
8
12
16
20Lorries
Cars
ROAD VEHICLES, ÖRESUND BRIDGE, PER DAY, thousandsGENDER DISTRIBUTION, % Men STATE OWNERSHIP, %
Employees
67
3310050 50
Board
TARGETSFINANCIAL TARGETS
STRATEGIC SUSTAINABILITY TARGETS
PUBLIC POLICY TARGETS
INCOME STATEMENT, SEKm 2014 2013
Net turnover
Operating profit/loss 452 346
Profit before tax 393 282
Net profit/loss 306 220
interests
BALANCE SHEET, SEKm 2014 2013
Total assets 5,509 5,211
Fixed assets
Equity 131 –349
Net debt 2,972 3,085
Operating capital 3,103 2,736
KEY RATIOS 2014 2013
Operating margin, %
nm nm
Gross investments, SEKm
Appropriation, SEKm
Dividend, SEKm
guidelines Yes
Yes
No
State ownership 100%

87ANNUAL REPORT STATE-OWNED COMPANIES 2014
BOARD AND AUDITORS ELECTED FOR 2015/2016
COMPANIES
shipping companies and to assist in the
OPERATIONS
also administers the Board for Shipping Sup
tions and securities companies, Svenska
2014
reversals of provisions for credit losses and
According to the Basel III regulations, Sven
PERFORMANCE REVIEW
maritime cluster and climate compensates the CO emissions its operations generate through
Chair: Michael Zell CEO:
Chair: Michael Zell Vice Chair: Board:
Deputies:
Zetterdahl Auditors:
Deloitte
2011 2012 2013 20140
2,000
4,000
6,000
8,000
LENDING TO SHIPPING COMPANIES, SEKmGENDER DISTRIBUTION, % Men STATE OWNERSHIP, %
Employees Board
50 5071
29
TARGETSFINANCIAL TARGETS
STRATEGIC SUSTAINABILITY TARGETS
PUBLIC POLICY TARGETS
INCOME STATEMENT, SEKm 2014 2013
Net turnover
Operating profit/loss 73 87
Profit before tax 73 87
Net profit/loss 73 87
interests
BALANCE SHEET, SEKm 2014 2013
Total assets 6,605 6,234
Fixed assets
Equity 1,816 1,743
Net debt –1,806 –1,723
Operating capital 10 20
KEY RATIOS 2014 2013
Operating margin, %
Gross investments, SEKm
Appropriation, SEKm
Dividend, SEKm
8 8
guidelines Yes
Yes
No
State ownership 100%
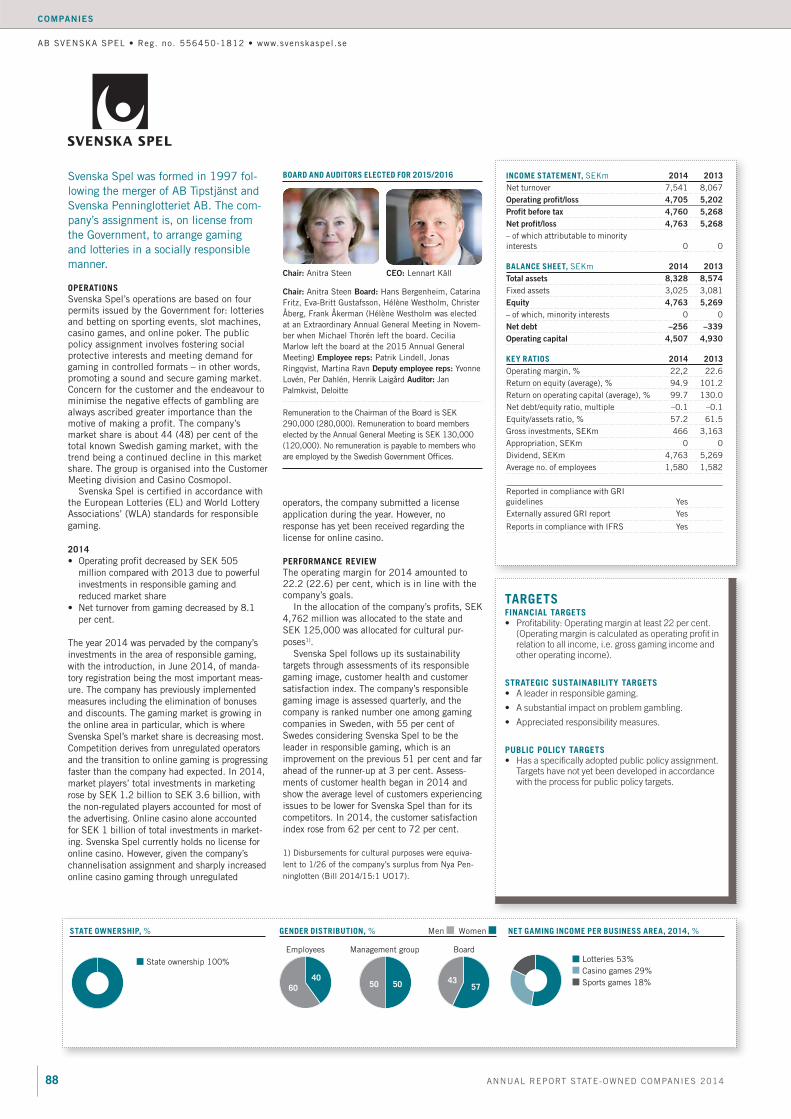
88 ANNUAL REPORT STATE-OWNED COMPANIES 2014
BOARD AND AUDITORS ELECTED FOR 2015/2016
COMPANIES
the Government, to arrange gaming
OPERATIONS
protective interests and meeting demand for
Concern for the customer and the endeavour to
2014
reduced market share
Competition derives from unregulated operators
and the transition to online gaming is progressing
online casino gaming through unregulated
PERFORMANCE REVIEW
poses
gaming image, customer health and customer
Chair: Anitra Steen CEO: Lennart Käll
Chair: Anitra Steen Board: Hans Bergenheim, Catarina
Employee reps:
Deputy employee reps: Yvonne
Auditor:
NET GAMING INCOME PER BUSINESS AREA, 2014, %GENDER DISTRIBUTION, % Men STATE OWNERSHIP, %
Lotteries 53%
Casino games 29%
Sports games 18%
Employees Management group Board
60
40 435750 50
TARGETSFINANCIAL TARGETS
STRATEGIC SUSTAINABILITY TARGETS
PUBLIC POLICY TARGETS
INCOME STATEMENT, SEKm 2014 2013
Net turnover
Operating profit/loss 4,705 5,202
Profit before tax 4,760 5,268
Net profit/loss 4,763 5,268
interests
BALANCE SHEET, SEKm 2014 2013
Total assets 8,328 8,574
Fixed assets
Equity 4,763 5,269
Net debt –256 –339
Operating capital 4,507 4,930
KEY RATIOS 2014 2013
Operating margin, %
Gross investments, SEKm
Appropriation, SEKm
Dividend, SEKm
guidelines Yes
Yes
Yes
State ownership 100%

89ANNUAL REPORT STATE-OWNED COMPANIES 2014
BOARD AND AUDITORS ELECTED FOR 2015/2016
COMPANIES
production unit, and has since then
OPERATIONS
In the operation and maintenance of roads,
port Administration is Svevia’s largest customer
2014
ment in the area of civil engineering and sav
PERFORMANCE REVIEW
CO emissions so that the measurement outcome
Chair: CEO:
Chair: Board:
Employee rep: Christer
Deputy employee rep:
Auditor:
Target
Outcome
2012 2013 20140
5
10
15
20
neg
RETURN ON EQUITY, %GENDER DISTRIBUTION, % Men STATE OWNERSHIP, %
Employees Management group Board
88
12
62
38
77
23
TARGETSFINANCIAL TARGETS
STRATEGIC SUSTAINABILITY TARGETS
PUBLIC POLICY TARGETS
INCOME STATEMENT, SEKm 2014 2013
Net turnover
Operating profit/loss 202 35
Profit before tax 240 75
Net profit/loss 188 57
interests
BALANCE SHEET, SEKm 2014 2013
Total assets 3,922 3,860
Fixed assets
Equity 1,176 985
Net debt –1,367 –1,260
Operating capital –191 –275
KEY RATIOS 2014 2013
Operating margin, %
neg neg
Gross investments, SEKm
Appropriation, SEKm
Dividend, SEKm
guidelines Yes
Yes
Yes
State ownership 100%

90 ANNUAL REPORT STATE-OWNED COMPANIES 2014
BOARD AND AUDITORS ELECTED FOR 2015/2016
COMPANIES
GENDER DISTRIBUTION, % Men
Chair: CEO:
Chair: Board: Karin Apelman, Adine
Employee rep: Deputy
employee rep:
Auditor: Magnus Fagerstedt, EY
terms in the development of the
operations are divided into an airport
OPERATIONS
2014
of Appeal regarding an environmental permit
shares in Arlanda Schiphol Development Com
control of handling services at five regional
airport, and thus gained a controlling influence
announced, entailing the commencement of a
PERFORMANCE REVIEW
entailed the Board proposing that the Annual
STATE OWNERSHIP, %
2012 2013 20140
3
6
9
12Target
Outcome
RETURN ON OPERATING CAPITAL,%
Employees Management group Board
65
35 33
675743
TARGETSFINANCIAL TARGETS
STRATEGIC SUSTAINABILITY TARGETS
PUBLIC POLICY TARGETS
INCOME STATEMENT, SEKm 2014 2013
Net turnover
Operating profit/loss 1,405 954
Profit before tax 1,162 686
Net profit/loss 926 501
interests
BALANCE SHEET, SEKm 2014 2013
Total assets 15,265 16,133
Fixed assets
Equity 5,571 4,915
Net debt 7,603 9,221
Operating capital 13,174 14,136
KEY RATIOS 2014 2013
Operating margin, %
Gross investments, SEKm
Appropriation, SEKm
Dividend, SEKm
guidelines Yes
Yes
Yes
State ownership 100%

91ANNUAL REPORT STATE-OWNED COMPANIES 2014
BOARD AND AUDITORS ELECTED FOR 2015/2016
COMPANIES
pertise and experience in land adminis
tration and geographic information in
the international market, in close col
OPERATIONS
organisations in developing countries and most
mental political and legal conditions, the
ling, land administration, records, valuation
from the customer or through international
2014
the fourth quarter, resulted in income and
PERFORMANCE REVIEW
Chair: CEO: Fredrik Zetterquist
Chair: Board:
Lagerqvist Nilsson Auditor:
2012 201420130
5
10
15
20
TURNOVER, SEKmGENDER DISTRIBUTION, % Men STATE OWNERSHIP, %
Employees Board
4060 67
33
TARGETSFINANCIAL TARGETS
STRATEGIC SUSTAINABILITY TARGETS
PUBLIC POLICY TARGETS
INCOME STATEMENT, SEKm 2014 2013
Net turnover 8
Operating profit/loss 1 –8
Profit before tax 2 –8
Net profit/loss 2 –8
interests
BALANCE SHEET, SEKm 2014 2013
Total assets 22 24
Fixed assets
Equity 7 6
Net debt –18 –18
Operating capital –11 –13
KEY RATIOS 2014 2013
Operating margin, % neg
neg
neg
Gross investments, SEKm
Appropriation, SEKm
Dividend, SEKm
guidelines Yes
Yes
No
State ownership 100%
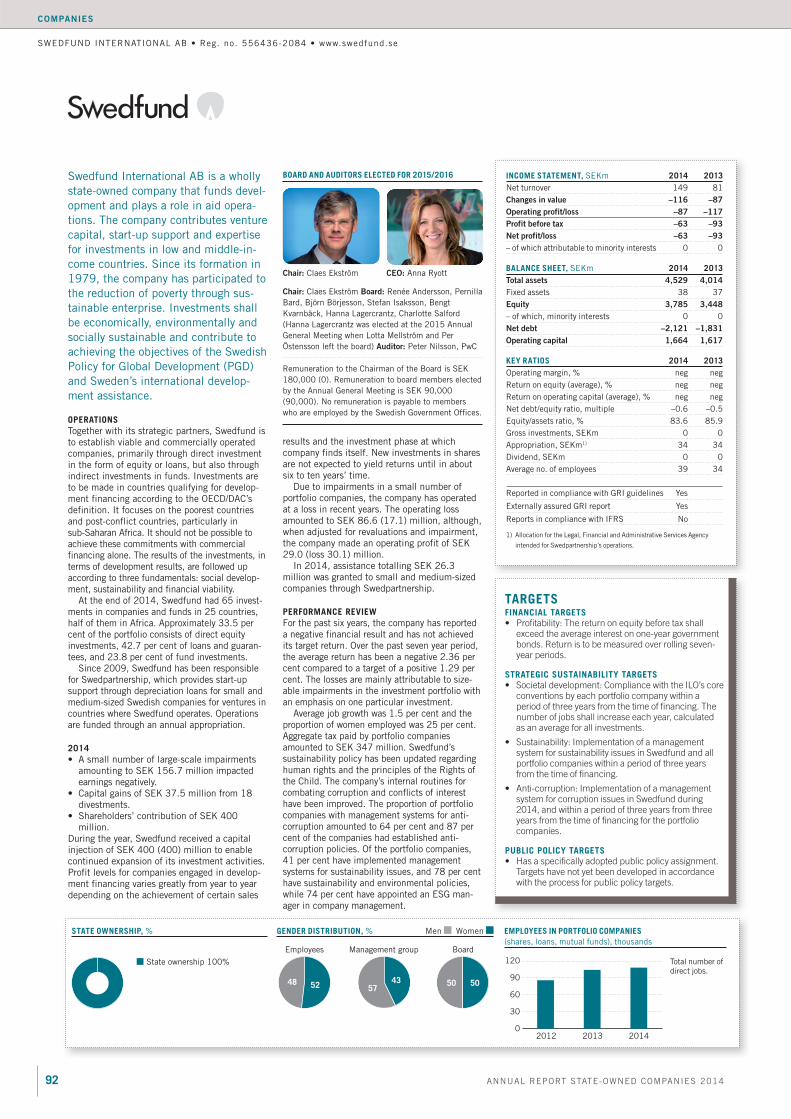
92 ANNUAL REPORT STATE-OWNED COMPANIES 2014
BOARD AND AUDITORS ELECTED FOR 2015/2016
COMPANIES
OPERATIONS
support through depreciation loans for small and
2014
depending on the achievement of certain sales
PERFORMANCE REVIEW
a negative financial result and has not achieved
Chair: CEO:
Chair: Board:
Auditor:
20132012 20140
30
60
90
120
EMPLOYEES IN PORTFOLIO COMPANIES GENDER DISTRIBUTION, % Men STATE OWNERSHIP, %
Employees Management group Board
48 52 50 5057
43
TARGETSFINANCIAL TARGETS
STRATEGIC SUSTAINABILITY TARGETS
PUBLIC POLICY TARGETS
INCOME STATEMENT, SEKm 2014 2013
Net turnover
Changes in value –116 –87
Operating profit/loss –87 –117
Profit before tax –63 –93
Net profit/loss –63 –93
BALANCE SHEET, SEKm 2014 2013
Total assets 4,529 4,014
Fixed assets
Equity 3,785 3,448
Net debt –2,121 –1,831
Operating capital 1,664 1,617
KEY RATIOS 2014 2013
Operating margin, % neg neg
neg neg
neg neg
Gross investments, SEKm
Appropriation, SEKm
Dividend, SEKm
Yes
No
State ownership 100%

93ANNUAL REPORT STATE-OWNED COMPANIES 2014
BOARD AND AUDITORS ELECTED FOR 2015/2016
COMPANIES
SYSTEMBOLAGET AKTIEBOLAG
cal purpose of restricting access to al
OPERATIONS
controlling shop openings and opening hours
2014
retail sales of alcohol through shops is
product mix resulting in a higher average price
PERFORMANCE REVIEW
Chair: Kenneth Bengtsson CEO: Magdalena Gerger
Chair: Kenneth Bengtsson Board: Thord Andersson,
Employee rep: Deputy employee
reps: Auditors:
Lundvall, EY
Target
Outcome
2012 2013 20140
20
40
60
80
100
AGE VERIFICATION CHECKS MADE IN SHOPS, %GENDER DISTRIBUTION, % Men STATE OWNERSHIP, %
Employees Management group Board
37
63 564443
57
TARGETSFINANCIAL TARGETS
Targets in 2014. New targets were adopted by the 2015 Annual General Meeting.
STRATEGIC SUSTAINABILITY TARGETS
PUBLIC POLICY TARGETS
INCOME STATEMENT, SEKm 2014 2013
Net turnover
Operating profit/loss 370 168
Profit before tax 426 375
Net profit/loss 251 287
interests
BALANCE SHEET, SEKm 2014 2013
Total assets 5,756 5,463
Fixed assets
Equity 1,574 1,609
Net debt –3,768 –3,355
Operating capital –2,194 –1,746
KEY RATIOS 2014 2013
Operating margin, %
neg neg
Gross investments, SEKm
Appropriation, SEKm
Dividend, SEKm
guidelines Yes
Yes
Yes
State ownership 100%

94 ANNUAL REPORT STATE-OWNED COMPANIES 2014
BOARD AND AUDITORS ELECTED FOR 2015/2016
COMPANIES
AKTIEBOLAG
OPERATIONS
TeliaSonera is the leading telecommunications
on the stock exchanges in Stockholm and
2014
enues, TeliaSonera reported an EBITDA margin
investments to enhance competitiveness and
and US authorities regarding transactions in
PERFORMANCE REVIEW
Chair: Marie Ehrling CEO:
Chair: Marie Ehrling Board:
Kallasvuo, Mikko Kosonen, Nina Linander, Martin
Employee rep:
Auditors:
Deloitte
State ownership 37.3%
Finnish state 3.2%
Capital Group 3.2%
AMF 1.8%
BNY Mellon Investment Fund 1.4%
Other owners 53.1%
PRICE TREND JANUARY 2012–FEBRUARY 2015GENDER DISTRIBUTION, % Men STATE OWNERSHIP, %
Employees Management group Board
5743
62
38
64
36
0
50
100
150
200
250
300
350Telia SoneraOMX Stockholm Benchmark GI
11-12-30 12-12-30 13-12-30 15-02-25
TARGETSFINANCIAL TARGETS
STRATEGIC SUSTAINABILITY TARGETS
PUBLIC POLICY TARGETS
INCOME STATEMENT, SEKm 2014 2013
Net turnover
Operating profit/loss 22,680 24,462
Profit before tax 20,107 21,368
Net profit/loss 15,599 16,767
interests
BALANCE SHEET, SEKm 2014 2013
Total assets 272,066 252,828
Fixed assets
Equity 116,364 112,934
Net debt 76,160 74,931
Operating capital 192,524 187,865
KEY RATIOS 2014 2013
Operating margin, %
Gross investments, SEKm
Appropriation, SEKm
Dividend, SEKm
guidelines Yes
Yes
Yes

95ANNUAL REPORT STATE-OWNED COMPANIES 2014
BOARD AND AUDITORS ELECTED FOR 2015/2016
COMPANIES
Teracom Boxer Group AB is one of the
Nordic region’s leading radio and televi
television, television and radio transmis
sions, connecting services, placement of
OPERATIONS
Teracom Boxer Group’s four market companies
telecom companies for placement of equipment
sion companies, Boxer Sverige, and Boxer
2014
imposing demands on those operating in the
ment, reorganisation and phasing out of
an agreement for the operation and mainte
shift in customers’ media consumption and
demands for greater freedom of choice are
ues to transform its product offering to meet
PERFORMANCE REVIEW
the group’s capital structure and expected profit
Code of Conduct has resulted in suppliers
Chair: CEO:
Chair: Board:
Employee reps:
Ossfeldt Deputy employee reps:
Auditor:
2012
Target
Outcome
201420130
5
10
15
20
25
30
RETURN ON EQUITY, %GENDER DISTRIBUTION, % Men STATE OWNERSHIP, %
Employees Management group Board
76
24
50 506040
TARGETSFINANCIAL TARGETS
STRATEGIC SUSTAINABILITY TARGETS
For further information on the sustainability targets, see the company’s annual report.
PUBLIC POLICY TARGETS
INCOME STATEMENT, SEKm 2014 2013
Net turnover
Operating profit/loss 542 638
Profit before tax 513 607
Net profit/loss 393 586
interests
BALANCE SHEET, SEKm 2014 2013
Total assets 5,169 5,060
Fixed assets
Equity 2,329 2,259
Net debt 560 943
Operating capital 2,889 3,202
KEY RATIOS 2014 2013
Operating margin, %
Gross investments, SEKm
Appropriation, SEKm
Dividend, SEKm
guidelines Yes
Yes
Yes
State ownership 100%

96 ANNUAL REPORT STATE-OWNED COMPANIES 2014
BOARD AND AUDITORS ELECTED FOR 2015/2016
COMPANIES
VASALLEN AB
PERFORMANCE REVIEW
Chair: Charlotte Axelsson CEO:
Chair: Charlotte Axelsson Board: Agneta Kores, Daniel
Employee rep: Mats Sundqvist Auditor: Ingemar
2012 2013
Target
Outcome
20140
2
4
6
8
10
12
RETURN ON ADJUSTED EQUITY, %GENDER DISTRIBUTION, % Men STATE OWNERSHIP, %
Employees Board
6733 40 60
develop and improve closed regiments
properties to increase Vasallen’s attrac
tiveness on the market in preparation
OPERATIONS
acquisitions of properties other than former
2014
TARGETSFINANCIAL TARGETS
STRATEGIC SUSTAINABILITY TARGETS
PUBLIC POLICY TARGETS
INCOME STATEMENT, SEKm 2014 2013
Net turnover
Changes in value 70 54
Operating profit/loss 75 64
Profit before tax 76 65
Net profit/loss 93 53
interests
BALANCE SHEET, SEKm 2014 2013
Total assets 1,021 999
Fixed assets
Equity 907 914
Net debt –336 –122
Operating capital 571 792
KEY RATIOS 2014 2013
Operating margin, %
Gross investments, SEKm
Appropriation, SEKm
Dividend, SEKm
guidelines Yes
Yes
Yes
State ownership 100%
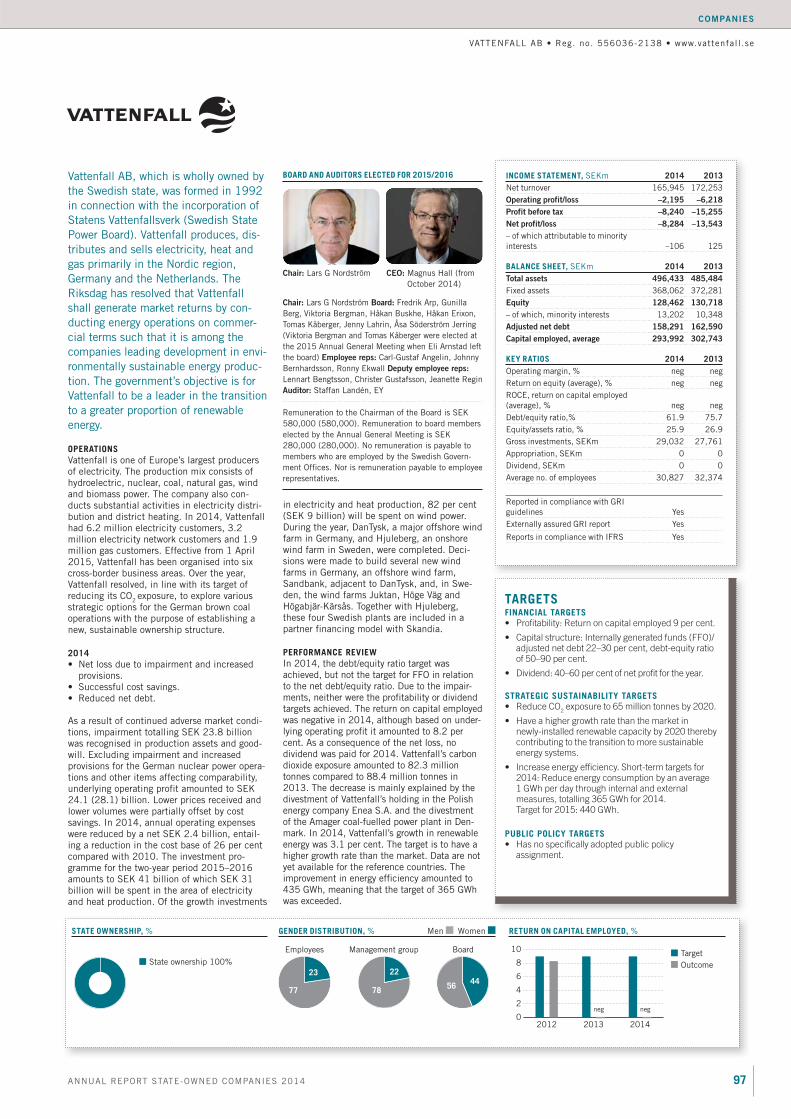
97ANNUAL REPORT STATE-OWNED COMPANIES 2014
BOARD AND AUDITORS ELECTED FOR 2015/2016
COMPANIES
VATTENFALL AB
cial terms such that it is among the
companies leading development in envi
OPERATIONS
Vattenfall is one of Europe’s largest producers
reducing its CO exposure, to explore various
2014
As a result of continued adverse market condi
PERFORMANCE REVIEW
Chair: CEO:
Chair: Board: Fredrik Arp, Gunilla
Employee reps:
Deputy employee reps:
Auditor:
2012
Target
Outcome
201420130
2
4
6
8
10
negneg
RETURN ON CAPITAL EMPLOYED, % GENDER DISTRIBUTION, % Men STATE OWNERSHIP, %
Employees Management group Board
77
23
5644
78
22
TARGETSFINANCIAL TARGETS
STRATEGIC SUSTAINABILITY TARGETS
PUBLIC POLICY TARGETS
INCOME STATEMENT, SEKm 2014 2013
Net turnover
Operating profit/loss –2,195 –6,218
Profit before tax –8,240 –15,255
Net profit/loss –8,284 –13,543
interests
BALANCE SHEET, SEKm 2014 2013
Total assets 496,433 485,484
Fixed assets
Equity 128,462 130,718
Adjusted net debt 158,291 162,590
Capital employed, average 293,992 302,743
KEY RATIOS 2014 2013
Operating margin, % neg neg
neg neg
neg neg
Gross investments, SEKm
Appropriation, SEKm
Dividend, SEKm
guidelines Yes
Yes
Yes
State ownership 100%

98 ANNUAL REPORT STATE-OWNED COMPANIES 2014
BOARD AND AUDITORS ELECTED FOR 2015/2016
COMPANIES
OPERATIONS
travellers are reached and attracted to visit
core operations and the overall marketing of
The state issues annual guidelines for the
tourist destination and maintaining a tourist
2014
achieving continued strong commitment from
PERFORMANCE REVIEW
emis
Chair: CEO:
Chair: Board:
Eslander, Kristina Ekengren, Mats Forslund, Magnus
Deputies:
Auditor:
State ownership 50%
Svensk Turism AB 50%
2012 2013 20140
3
6
9
12
15
NUMBER OF GUEST NIGHTS, millionGENDER DISTRIBUTION, % Men STATE OWNERSHIP, %
Employees Management group Board
30
70 60
4044 56
TARGETSFINANCIAL TARGETS
STRATEGIC SUSTAINABILITY TARGETS
PUBLIC POLICY TARGETS
INCOME STATEMENT, SEKm 2014 2013
Net turnover
Operating profit/loss 1 1
Profit before tax 1 0
Net profit/loss 1 0
interests
BALANCE SHEET, SEKm 2014 2013
Total assets 83 67
Fixed assets
Equity 26 25
Net debt –28 0
Operating capital –2 25
KEY RATIOS 2014 2013
Operating margin, %
Gross investments, SEKm
Appropriation, SEKm
Dividend, SEKm
guidelines Yes
Yes
No

99ANNUAL REPORT STATE-OWNED COMPANIES 2014
BOARD AND AUDITORS ELECTED FOR 2015/2016
COMPANIES
2012 2013 20140
3
6
9
12
15
NUMBER OF ROOMS SOLD, thousands
Chair: Eva Eriksson CEO: Karl Einar Ellingsen
Chair: Eva Eriksson Board:
Auditor: Through its programme operations,
OPERATIONS
Through various forms of outreach activities,
guage and cultural courses for students of
2014
PERFORMANCE REVIEW
GENDER DISTRIBUTION, % Men STATE OWNERSHIP, %
Employees Management group Board
55 45 445657
43
TARGETSFINANCIAL TARGETS
STRATEGIC SUSTAINABILITY TARGETS
PUBLIC POLICY TARGETS
INCOME STATEMENT, SEKm 2014 2013
Net turnover
Operating profit/loss –2 1
Profit before tax –2 1
Net profit/loss 0 0
interests
BALANCE SHEET, SEKm 2014 2013
Total assets 18 20
Fixed assets
Equity 8 10
Net debt 2 4
Operating capital 10 13
KEY RATIOS 2014 2013
Operating margin, % neg
neg
Gross investments, SEKm
Appropriation, SEKm
Dividend, SEKm
guidelines Yes
Yes
No
State ownership 100%

100 ANNUAL REPORT STATE-OWNED COMPANIES 2014
LIQUIDATED COMPANIES AND OTHER COMPANIES AND OPERATIONS
Other companies and operations
EUROFIMA EUROPEAN COMPANY FOR THE FINANCING OF
RAILROAD ROLLING STOCK
CHE-107.738.053
EUROFIMA was formed in 1956 as the result of an international treaty between a number of European states. The operations involve the financing of railroad rollingstock for the company’s own shareholders. Originally, the organisation was intended to exist for 50 years, but in 1984 this was extended by an additional 50 years until 2056. The largest shareholders are Deutsche Bahn (22 per cent), SNCF (22 per cent) and Ferrovie dello Stato Italiane S.p.A. (13 per cent). The company has 26 shareholders and Swe-den owns 2 per cent of the shares.
THE NORRLANDSFONDEN FOUNDATION
897000-3003
The Norrlandsfonden Foundation was established in 1961. Fund capital is contributed by LKAB and the state. The purpose of the Norrlandsfonden Foundation is to promote the development of small and medium-sized enterprises in the counties of Gävle-borg, Västernorrland, Jämtland, Västerbotten and Norrbotten by participating in their financing. Over the long term, the foundation’s capital base shall remain nominally intact. The Norrlandsfonden Foundation offers loans, convertible deben-tures and various types of guarantees to enterprises in northern Sweden. Particular attention shall be paid Norrbotten County and the inland municipalities. In addition, Norrlandsfonden is part-owner in a number of companies with venture capital and incubator operations, such as Partnerinvest Övre Norrland, Norr Sådd and Arctic Business Incubator. The foundation’s capital base amounts to just over SEK 1 billion. Norrlandsfonden has 15 employees. At the end of 2014, Norrlandsfonden had a total com-mitment of SEK 891 million to a total of 405 customers. In 2014, 66 new customers were added.
THE INDUSTRIFONDEN FOUNDATION
802009-0083
The Industrifonden Foundation was established by the state in 1979. The purpose of the Industrifonden Foundation is to pro-mote industrial growth and renewal in Sweden by financing small and medium enterprises on commercial terms. The foun-dation’s capital base shall be kept intact in real terms. All sur-pluses are used for new investments. Industrifonden invests risk capital in companies with a Swedish connection. The Founda-tion is an active minority investor seeking a holding of at least 15 and at most 50 per cent, and partnering with entrepreneurs and other investors. The investment horizon is generally five to ten years. Industrifonden’s successful investments include Mycronic, Qliktech and Arcam. Industrifonden has some 30 employees. On 30 June 2014, the capital base was approximately SEK 3.8 billion, of which just under half was invested in some 90 companies. Over the 2013/14 financial year SEK 488 million was invested, including SEK 184 million in 12 new companies and SEK 304 million in follow-on investments in 39 existing portfo-lio companies. During 2014, Anders Slettengren was appointed as the new CEO.
Since 1 January 2015, the management organisation for the state-owned companies has taken over the
management of the state’s holdings in the European company EUROFIMA and for the Industrifonden and
Norrlandsfonden foundations.

101ANNUAL REPORT STATE-OWNED COMPANIES 2014
Liquidated companies
Companies under liquidation
APOTEKENS SERVICE AKTIEBOLAG
556763-4748
Apotekens Service Aktiebolag was formed in 2008 with the prin-cipal task of assuming responsibility for the infrastructure that all pharmacies need access to in the form of registers and data-bases. Since 26 March 2010, the company was owned directly by the state. In 2013, the Government submitted a bill proposing a new authority for health and care infrastructure (Bill 2012/13:128) to the Riksdag. In this bill, the Government made the assessment that a new agency should be formed and that the state should retain the authority to perform the tasks that previously com-prised the operations of Apotekens Service Aktiebolag. The pro-posal entailed Apotekens Service Aktiebolag being liquidated. The Riksdag approved the Government’s proposal (Report 2012/13: SoU26, Riksdag communication 2012/13:279). The eHealth Agency commenced its operations on 1 January 2014. An Extraordinary General Meeting in Apotekens Service Aktie-bolag on 13 December 2013 resolved to enter the company into voluntary liquidation. Apotekens Service Aktiebolag was placed under the administration of an liquidator tasked with imple-menting the liquidation. The liquidation was concluded on 23 December 2014.
AKTIEBOLAGET SVENSKA MILJÖSTYRNINGSRÅDET
556514-0794
Miljöstyrningsrådet (the Swedish Environmental Management Council – SEMCo) was founded in 1995 to act as the Swedish principal and registration authority for the EU’s Eco-Manage-ment and Audit Scheme (EMAS). The operations have subse-quently been developed to also include the administration and development of the international Environmental Product Decla-ration system (EPD®), as well as systems for sustainable public procurement and other professional procurement (SEMCo’s pro-curement criteria). In June 2014, the Riksdag authorised the
ERSÄTTNINGSMARK I SVERIGE AB
556820-8499
On 23 June 2010, the Riksdag resolved, in accordance with the Government’s proposal, that Sveaskog should transfer 100,000 hectares of productive forest land from Sveaskog to the state, to subsequently be used as substitute land in connection with state appropriations of other properties (Bill 2009/10:169, Report 2009/10:NU22, Riksdag communication 2009/10:384). This transfer was to take place through the distribution of properties or of shares in a subsidiary owned by Sveaskog AB. In April 2011, the Annual General Meeting in Sveaskog AB resolved to approve the Board’s proposal for the distribution of shares in the com-pany Ersättningsmark i Sverige AB. The company owned 100,000 hectares of productive forest land at a book value of SEK 59 mil-lion and received a shareholders contribution of SEK 100 million from Sveaskog AB. The distribution was executed on 29 April 2011. The Swedish Environmental Protection Agency was respon-sible for exchanging the productive forest land for forest land worthy of conservation. During 2012, Ersättningsmark i Sverige AB transferred the 100,000 hectares to the state (the Swedish Environmental Protection Agency) which took possession of the properties on 31 December 2012. The company had thereby ful-filled its assignment. The Riksdag authorised the Government to liquidate Ersättningsmark i Sverige AB by means authorised (Bill 2013/14:1, Report. 2013/14:NU1, Riksdag communication 2013/14:103). On 10 April 2014 the Annual General Meeting resolved to enter the company into voluntary liquidation. From 9 May 2014, Ersättningsmark i Sverige AB was placed under the administration of an liquidator tasked with implementing the liquidation. The liquidation was concluded on 10 March 2015.
Government to transfer parts of the company’s operations to the state and to liquidate Miljöstyrningsrådet at the appropriate juncture (Bill 2013/14:99, Rep. 2013/14:FiU:21, Riksd. comm. 2013/14:316). At a general meeting of Miljöstyrningsrådet on 11 September 2014 a decision was made to liquidate the company. Since 1 October 2014, Miljöstyrningsrådet has been under the administration of an liquidator with the task of implementing the liquidation.
LIQUIDATED COMPANIES AND OTHER COMPANIES AND OPERATIONS

1969 The Ministry of Industry is formed and the management of most state-owned companies is transferred to that ministry.
1970 The Statsföretag organi-sation is formed to coordinate the major limited liability com-panies in the mining, steel, for-estry and petrochemical sectors, among others. Apoteksbolaget is established.
1974 PK-banken is formed through the merger of Postbanken and Sveriges Kreditbank.
1977 Svenska Varv is formed in conjunction with the state taking over Salén-Invest’s shares in Götaverken. The group also includes Arendal, Cityvarvet, Finnboda Varf, Karlskronavarvet, Uddeval-lavarvet and Öresundsvarvet. A comprehensive restructuring pro-cess commences.
1978 SSAB, Scandinavia’s leading steel producer is formed in the reorganisation of Sweden’s three largest producers of commercial steel. The state and Statsföretag own 75 per cent of SSAB and Gränges 25 per cent.
1979 Kockums is incorporated into Svenska Varv.
1980 Combined, SSAB and Statsföretag account for 20 per cent of the country’s industrial investments.
1981 The state transfers its half share in ASEA-ATOM to ASEA. The JAS industrial group is formed, with the gov-ernment being a shareholder through Förenade Fabriks-verken (FFV).
1982 SvenskaVarv is reconstructed. Closures of the major ship-yards continue.
1984 Nokia acquires 70 per cent of satellite and television manu-facturer Luxor, which had been taken over by the state five years previously.
1985 Statsföretag changes name to Procordia. Procordia is restructured through divestments and acquisitions of companies.
1986 The state-owned Sveriges Petroleum (SP) merges with the Swedish oil consumers’ association (OK) to form OK Petroleum, with the Finnish state-owned company Neste as part owner. The first partial privatisation of SSAB is implemented through the acquisition of Gränges’ shareholding and the sale of one-third of the shares in SSAB to a small number of institutions.
1987 Procordia is listed on the stock exchange in conjunction with a new share issue. The state takes over Grängesbergs Gruvor from SSAB.
1988 Statens Järnvägar (SJ), a state enterprise, is demerged. Banver-ket, the Swedish National Rail Administration, is made responsible for the railway network and SJ for train services.
1989 Procordia, Pharmacia and Volvo’s food company Provendor merge to form the new Procordia group with Volvo and the Swedish state as the largest owners, each with 42.5 per cent of the votes. SSAB shares are listed on the A List of the Stockholm Stock Exchange.
1990 PK-banken acquires Nordbanken. The holding company Fortia is formed.
1991 The Riksdag resolves to wholly or partially privatise 35 com-panies and to liquidate Fortia. Celsius Industrier, formerly Sven-ska Varv reorganises as a defence group when merged with Telub and FFV, becoming a limited liability company, and acquires Bofors.
102 ANNUAL REPORT STATE-OWNED COMPANIES 2014
STATE OWNERSHIP IN MODERN TIMES
State ownership in modern times
Since 1969, the management of the state-owned companies has mainly been centralized within the Govern-
ment Offices. The reasons for companies being set up or being under state ownership have changed over time.
The review below briefly summarises the most important corporate events among the companies owned by the
Swedish state.
1969
1980
1988

1992 Domänverket becomes Domän AB. Statens Vattenfallsverk becomes Vattenfall AB, in conjunction with which the Swedish electricity grid and foreign connections are separated to form a new public enterprise, Svenska Kraftnät. A public offering is made of the state’s shareholding in SSAB in the form of a rights issue combined with a government bond. Statens Bostadsfinan-sieringsaktiebolag (SBAB) is fully exposed to competition. SAS acquires 50 per cent of Linjeflyg to form a fully integrated domes-tic airline. Gota Bank is declared bankrupt and is acquired by the state. Securum is set up to deal with the problem loans incurred by Nordbanken as a consequence of the financial crisis.
1993 The National Board of Public Buildings ceases to exist and government agencies and public enterprises are per-mitted to operate freely in the property market. Vasakronan takes over the state’s commer-cial properties. Volvo and the Swedish Government agree to work to divide Procordia into two parts. The state becomes the majority shareholder in
Pharmacia AB, focusing on pharmaceuticals, and Volvo becomes the majority shareholder in AB Procordia, which operates in sectors including food and tobacco. The Government sells 75 per cent of the state’s shares in the defence group Celsius but retains the majority of the voting rights and the shares are listed on the A List of the Stockholm Stock Exchange. Assi AB and Domän AB are merged into AssiDomän AB, which bids for NCB. Securum con-tributes SEK 10 billion to save Nordbanken. Televerket (the National Telecommunications Administration) is reorganised as Telia AB. The AMU group is incorporated.
1994 A-Banan projekt AB is formed to build the Arlandabanan rail line. This is the first infrastructure project in Sweden to be co-financed by the state and the business sector. Posten (Swedish postal service) becomes a limited liability company. The state
divests its remaining shareholdings in SSAB, OKP and parts of AssiDomän AB and Pharmacia.
1995 V&S Vin&Sprit’s monopoly ends. Pharmacia and US phar-maceuticals company UpJohn merge.
1996 The state injects SEK 600 million into AmuGruppen (later Lernia) to save the company from bankruptcy.
1997 SBL Vaccins is sold to Active in Malmö. Svenska Pen-ninglotteriet and Tipstjänst AB merge and change name to Svenska Spel AB. Merita and Nordbanken announce their intention to merge and form MeritaNordbanken.
1998 The unit for state ownership is formed at the Ministry ofEnterprise, Energy and Communications and assigned administra-tion responsibility for a majority of the state-owned companies.
1999 The remaining shareholding in Pharmacia & UpJohn is sold. Sveaskog AB is formed through the transfer of forest assets from AssiDomän. The state sells its shares in SAQ Kontroll (incorporated in 1995 from the Swedish Plant Inspectorate in con-nection with the abolition of the inspection monopoly) and Värdepapperscentralen (Swedish Securities Register).
2000 Remaining shareholding in Celsius (25 per cent) is sold to defence group Saab. Telia is listed on the stock exchange. Vattenfall becomes one of Northern Europe’s largest energy companies through the acquisition of the German energy companies VEAG and
LAUBAG for SEK 14 billion. Nordea Bank merges with UniDan-mark of Denmark and Kreditkassen of Norway, becoming a
103ANNUAL REPORT STATE-OWNED COMPANIES 2014
1992
1993
1997
2000
STATE OWNERSHIP IN MODERN TIMES

Nordic bank. The state’s ownership in the bank decreases to 18.2 per cent. The Swedish State Railways state enterprise is divided into six different limited liability companies. The new SJ AB is responsi-ble for passenger traffic. The other companies are EuroMaint, Green Cargo, Jernhusen TraffiCare and Unigrid.
2001 Sveaskog acquires AssiDomän AB. Airline group SAS, which was previously owned by three separate national parent companies, gains a single newly-formed parent company, SAS AB, in which the former shareholders are given newly issued shares. The Swedish state subsequently owns 21.4 per cent of SAS.
2002 Telia and the Finnish company Sonera merge to form TeliaSonera, becoming the lead-ing telecommunications opera-tor in the Nordic region. The state subsequently owns 46 per cent of TeliaSonera.
2003 The state’s shares in Svenska Skogsplantor are transferred to Sveaskog (also a wholly state-owned company). The state acquires ABB’s holding of 35 per cent of Svensk Exportkredit (Swedish Export Credit Corporation, SEK) and becomes the sole owner of SEK following the acquisition.
2005 The state injects SEK 600 million into Green Cargo. The Swedish Code for Corporate Governance (the Code), which is intended to contribute to improved governance of Swed-ish limited liability companies, starts to be applied by the Stockholm Stock Exchange and also forms part of the State’s
Ownership Policy. Innovationsbron is formed with the task of investing in growth companies. The Riksdag is expanding SBAB’s mission to include accepting deposits from the general public.
2006 The Government sells its last share in SAKAB AB, a left-over from 1992 when the principal responsibility for the handling of hazardous waste was transferred to a private player.
2007 The state decreases its holding in TeliaSonera, selling shares for SEK 18 billion. The Swedish state subsequently owns 37.3 per cent of TeliaSonera. The Riksdag resolves to grant the Govern-ment a mandate to divest some of the state-owned companies.
2008 The state sells its holding in OMX to Borse Dubai, in Vin&Sprit to French Pernod Ricard and in Vasakronan to AP Fastigheter. These divestments provide income equivalent to SEK 81 billion. New capital is injected into to SEK and Almi and, in connection with this, the shares in Venantius are
transferred to SEK. Fouriertransform is formed to invest in research and development in the automotive cluster. In Novem-ber, through the Swedish National Debt Office, the state assumes ownership of Carnegie Investment Bank and Max Matthiessen. The takeover is conducted in accordance with the Act on Sup-port for Banks in Crisis to foster the stability of the financial sec-tor. The shares are divested in 2009.
2009 Svevia and Vectura Con-sulting are formed from activi-ties previously included in the National Rail Administration and the National Road Admin-istration. The state participates in new share issues in Nordea Bank and SAS. The merger of Posten and Post Danmark is completed with a new com-pany, PostNord, being formed. The pharmacy monopoly is dis-continued and the companies Apoteksgruppen, APL and
Apotekens Service are spun off from Apoteket.
104 ANNUAL REPORT STATE-OWNED COMPANIES 2014
STATE OWNERSHIP IN MODERN TIMES
2010
2005
2008
2009
2010 Divestments of 465 pharmacies are completed as a stage in the deregulation of the pharmacy market. In addition, 150 phar-macies are transferred to Apoteksgruppen. Infranord AB is formed from the operations of Banverket Produktion (Swedish Rail Administration’s Production unit). The newly formed com-pany Swedavia AB takes over airport operations for ten nation-ally strategic airports from the Swedish Civil Aviation Adminis-tration. The state participates in a new share issue in SAS. ESS AB is formed with the purpose of planning and building the Euro-pean Spallation Source in Lund and a data processing centre in Copenhagen. Inlandsinnovation AB is formed with the purpose of conducting financing operations to promote innovation and entrepreneurship in inland northern Sweden.
2002

105ANNUAL REPORT STATE-OWNED COMPANIES 2014
STATE OWNERSHIP IN MODERN TIMES
2011 The administration of the state-owned companies is trans-ferred from the Ministry of Enterprise to the Ministry of Finance. The state sells 255 million shares in Nordea Bank for SEK 19 billion, reducing its ownership from 19.9 per cent to 13.5 per cent. Sveaskog distributes the shares in Ersättningsmark i Sverige AB to the state. The company owns 100,000 hectares of productive forest land that will be used as replacement land for high conservation value forests. Metria, which sells analyses, ser-vices and products based on geographical information is spun off from Lantmäteriet (National Land Survey of Sweden). Arbetslivsresurs AR AB (formed in 2005 from Samhall resurs and AMS Arbetslivstjänster) is sold for SEK 145 million.
shares on two occasions during the year for a total of SEK 41 bil-lion. The state sells Vectura Consulting to engineering consul-tancy Sweco for slightly less than SEK 1 billion.
2014 Having improved its profitability and strengthened its financial position through a preferential rights issue on the capi-tal market, SAS cancels the loan commitments provided through a credit facility from the state and others. Apotekens Service is de-corporatised following the transfer of responsibili-ties and functions to the new eHealth Agency that was formed on 1 January 2014. Ersättningsmark i Sverige and Svenska Miljöstyrningsrådet are placed under liquidation. In May 2014, an Extraordinary General Meeting of Bostadsgaranti resolved to divest the subsidiary Försäkringsaktiebolaget Bostadsgaranti. The divestment represents part of the liquidation of Bostadsgar-anti as a whole. The Riksdag authorised the Government to divest assets and liabilities in ESS to a consortium for European research infrastructures and to liquidate the company.
2012 SAS tackles major profitability problems and, to safeguard the company’s liquidity, the Swedish state and the other major owners and a number of banks join to provide a credit facility of SEK 3.5 billion. Bilprovningen completes its partial divestment of the station network by splitting the company into two parts. The minority shareholders take over the network of stations that had been for sale, while the majority shareholder, the state, retains the remainder of Bilprovningen, becoming the 100-per cent owner of that company.
2013 Almi and Innovations-bron merge with the purpose of creating a joint organisa-tion for financing in the early stages of company formation. The management of Saab Automobile Parts (later Orio),
the parts manufacturer that the Swedish National Debt Office took as collateral for a loan to car manufacturer Saab, is trans-ferred to the Ministry of Finance. The state liquidates its entire remaining shareholding in Nordea Bank (13.4 per cent) by selling
2015 The management of the state-owned companies is trans-ferred from the Ministry of Finance to the Ministry of Enter-prise and Innovation and is assigned management responsibility for a further eight companies and two foundations.The liquida-tion of Ersättningsmark is concluded.
2011
2014
2013

ACCOUNTING PRINCIPLES
Accounting principles
Companies included in the consolidated financial statements are those
limited companies in which the state’s shareholding is managed by the
Government Offices plus the organisation Svenska
Skeppshypotekskassan. The consolidated financial statements are a
summary of the financial information issued by the companies
themselves. The consolidated financial statements do not include limited
companies managed by authorities other than the Government Offices or
by state foundations. Companies in which the state has an ownership
share of less than 20 per cent or are in the process of being liquidated are
also not included in the consolidated financial statements. Subsidiaries
are companies in which the state holds a stake equal to 50 per cent or
more. Associated companies, that is, those in which the state holds less
than 50 per cent, but more than 20 per cent, have been included
according to percentage of participation in earnings.
As indicated, the consolidated financial statements are based on the
financial information produced and reported by each company. These
consolidated financial statements cannot be compared with ordinary
consolidated financial statements. This is because the state-owned
companies do not constitute a group and do not therefore produce
consolidated statements in compliance with a formal regulatory
framework. Accordingly, the compilation is intended, to provide, in the
best possible way a coherent and clear picture of the administration of the
state-owned companies in financial terms. To facilitate this without
applying consolidation methods according to current regulatory
framework, a description is provided below of the basis for the summary.
Reporting to the Government Offices from state-owned companies is
based on the established form of presentation applicable in the business
community. However, the income statement, balance sheet and cash flow
statement have been condensed.
Certain adjustments, for which the Swedish Government Offices are
responsible, have been made in the data reported for the consolidated
financial statements (see below). The business descriptions presenting
the various companies are primarily based on the companies’ own
information. Due to varying calculation methods, the key ratios reported
in the consolidated financial statements may differ from the key ratios
presented by the companies themselves (see definitions below).
The following is applicable to the consolidated financial statements.
apply, to some extent, differing regulatory frameworks when preparing
their financial statements. Reporting to the Government Offices is
based on a condensed presentation format with features of both IFRS
and Swedish accounting principles, with the companies having reported
in accordance with the principles adopted in their own case. To
facilitate the consolidation in practical terms, a number of companies,
including financial companies reporting in accordance with the Annual
Accounts for Credit Institutions and Securities Act (1995:1559), adjust
their reporting to the Government Office’s reporting format. During
2014, some companies transitioned to applying BFNAR 2012:1 Annual
and consolidated accounts (K3).
of state-owned companies, financial statements should be prepared on
the basis of the requirements imposed on publicly traded companies. As
of 2005, publicly traded companies in the EU are required to prepare
their consolidated financial statements in accordance with IFRS as
adopted by the EU.
equity method. This means that profit or loss after tax in an associated
company corresponding to the share owned by the state has been
included in the consolidated income statement on one line in operating
profit or loss. Similarly, the owner’s share of the associated company’s
equity has been included in the consolidated balance sheet.
the income statement and balance sheet. This adjustment entails that
the minority owner’s share of the subsidiary’s profit or loss is shown as a
deduction in connection with net profit or loss from shares in the
associated companies. The minority owner’s share of the subsidiary’s
equity is recognised as a separate item in shareholders’ equity in the
consolidated balance sheet.
been eliminated. This is not consistent with customary consolidation
methods for group-internal transactions. The reason for this, as
explained initially, is that the companies do not constitute a corporate
group. Accordingly, the basis required to enable such elimination is not
available to the reporting companies either.
The main reason for this is that the working capital of the financial
companies is of a different character compared with most other
companies.
Please refer to the annual report issued by the respective company for
more information about the accounting principles applied in a particular
company.
106 ANNUAL REPORT STATE-OWNED COMPANIES 2014

107ANNUAL REPORT STATE-OWNED COMPANIES 2014
Definitions and abbreviations
Average number of employees – Recalculated
as full-time equivalent employees.
Gross investments – Sum total of the
company’s investments in property, plant and
equipment, intangible assets and financial
fixed as-sets.
Funds From Operations (FFO) – Internally
injected funds
Adjusted equity – Equity plus any surplus
value in, for example, properties and
subsidiaries.
Net debt – Interest-bearing liabilities
less interest-bearing assets.
Net debt/equity ratio – Interest-bearing net
liability in relation to equity. In certain cases,
the calculation is performed on the basis of
adjusted equity, in which case this is
specified.
Operating capital – Interest-bearing net
liabilities plus equity.
Return on equity (average) – Net profit/loss
attributable to shareholders in the parent
company as a proportion of average equity
attributable to shareholders in the parent
company. In certain cases, the calculation is
performed on the basis of adjusted equity, in
which case this is specified.
Return on operating capital (average) –
Operating profit/ loss in relation to average
operating capital.
Return on capital employed (average) –
Operating profit loss plus financial income in
relation to average capital employed.
Operating margin – Operating profit/loss in
relation to net turnover.
Debt/equity ratio – Interest-bearing liabilities
in relation to equity.
Equity/assets ratio – Equity including minority
share in relation to total assets. In certain
cases, the calculation is performed on the
basis of adjusted equity, in which case this is
specified.
Capital employed – Interest-bearing liabilities
plus equity.
Dividend -Dividend data refer to dividends
approved by the subsequent Annual General
Meeting.
INDUSTRY-SPECIFIC KEY RATIOS
Financial companies
Capital adequacy ratio – Capital base as a
proportion of risk-weighted amount.
Core Tier 1 capital ratio – Tier 1 capital in
relation to risk-weighted amount.
Core Tier 1 capital – Equity less certain
deductible items, such as goodwill.
Property companies
Surplus ratio – Net operating income in
relation to rental income.
ABBREVIATIONS
EMAS – EU Eco Management and audit
scheme.
EPD – Environmental Product Declarations.
GRI – Global Reporting Initiative, international
guidelines for sustainability reporting.
IFRS – International Financial Reporting
Standards.
(XX) – Figures in parentheses after another
figure refer to the preceding year.
DEFINITIONS AND ABBREVIATIONS

108 ANNUAL REPORT STATE-OWNED COMPANIES 2014
State-owned companies in figures
STATE-OWNED COMPANIES IN FIGURES
SUMMARY TABLE FOR STATE-OWNED COMPANIES
Income1),
SEKm
Operating profit,
SEKm
Net profit/loss,
SEKm
Return on
equity, %
Dividend,
SEKm
Number of
employees
Wholly owned, 100% ownership 2014 2013 2014 2013 2014 2013 2014 2013 2014 2013 2014 2013
Akademiska Hus 5,681 5,588 7,200 3,665 5,215 2,568 16.5 8.7 1,445 1,374 408 407
Almi Företagspartner 1,074 1,100 35 –27 120 75 1.7 1.1 - - 436 454
APL (Apotek Produktion & Laboratorier)
1,183 1,174 15 28 9 19 4.4 9.3 - 3 512 537
Apoteket 18,668 18,972 343 355 371 364 8.2 8.3 158 150 3,474 3,899
Apoteksgruppen 254 181 –8 –7 –3 7 neg 1.8 - 4 59 80
Arlandabanan Infrastructure 68 67 - - - - 0.0 0.0 - - 1 1
Bilprovningen 720 787 61 24 63 31 24.3 8.4 48 290 646 731
Dramaten 289 274 3 2 5 3 14.8 9.9 - - 317 310
Fouriertransform 6 24 –172 42 –91 131 neg 4.0 - - 12 11
Green Cargo 4,167 4,161 –121 –368 –188 –382 neg neg - - 2,002 2,125
Göta kanalbolag 73 71 0 0 - 0 0.0 0.2 - - 40 39
Infranord 3,986 3,811 32 –190 17 –162 3.6 neg - - 2,184 2,581
Inlandsinnovation 8 4 –54 –51 –12 10 neg 0.5 100 - 7 6
Jernhusen 1,181 1,104 500 797 389 513 7.6 10.3 113 100 222 237
Lernia 2,657 2,659 111 185 85 146 15.9 27.8 235 58 4,163 3,828
LKAB 20,926 24,092 570 7,639 347 6,032 0.9 14.5 139 3,500 4,539 4,427
Metria 420 436 12 –28 10 –20 10.5 neg 3 - 259 301
Miljömärkning Sverige 47 47 –3 0 0 1 neg 4.4 0 0 60 59
Operan 523 507 - 4 1 6 3.0 18.2 - - 528 536
Orio 994 1,044 84 144 70 182 9.6 25.3 35 55 347 364
RISE Research Institutes of Sweden
1,993 1,819 51 32 48 30 5,3 4.5 - - 1,673 1,586
Samhall 7,452 7,316 - –40 81 15 5.0 1.0 - - 17,908 17,401
SBAB 2,621 1,893 1,644 1,085 1,256 873 12.1 9.0 502 - 437 449
SEK 2,078 1,958 1,629 1,408 1,260 1,090 8.1 7.4 378 327 243 243
SJ 9,207 9,160 568 298 460 220 8.9 4.4 230 73 4,541 4,953
Specialfastigheter 1,872 1,858 2,064 1,921 1,390 1,301 11.9 14.9 3,000 481 121 122
SSC (Svenska rymdaktiebolaget) 872 876 31 30 34 11 7.1 2.4 10 3 533 577
Statens Bostadsomvandling 27 18 –16 –17 –9 –7 neg neg - - 3 5
Sveaskog 6,287 6,096 2,418 2,214 1,691 1,475 9.4 8.5 800 450 877 899
Svedab 6 5 452 346 306 220 nm nm - - 3 4
Svenska Skeppshypotek 148 148 73 87 73 87 4.1 5.0 - - 8 8
Svenska Spel 7,603 8,117 4,705 5,202 4,763 5,268 94.9 100.0 4,763 5,269 1,580 1,582
Svevia 6,933 7,180 202 35 188 57 17.4 5.8 120 - 1,918 2,113
Swedavia 5,885 5,233 1,405 954 926 501 17.7 10.0 230 - 2,460 2,380
Swedesurvey 13 9 2 –8 2 –7 28.8 neg - - 5 6
Swedfund International 149 81 –87 –117 –63 –93 neg neg - - 39 34
Systembolaget 26,437 25,723 370 168 251 287 14.4 18.0 251 287 3,347 3,280
Teracom Boxer Group 3,849 3,875 542 638 393 586 17.1 25.9 235 290 741 710
Vasallen 63 79 75 64 93 53 10.2 5.8 300 100 18 17
Vattenfall 170,542 174,986 –2,195 –6,218 –8,284 –13,543 neg neg - - 30,181 31,817
Voksenåsen 70 58 –2 1 - - 0.0 0.0 - - 49 48
1) Note that income relates to net income + other income.

109ANNUAL REPORT STATE-OWNED COMPANIES 2014
STATE-OWNED COMPANIES IN FIGURES
SUMMARY TABLE FOR STATE-OWNED COMPANIES
Income,
SEKm
Operating profit,
SEKm
Net profit/loss,
SEKm
Return on
equity, %
Dividend,
SEKm
Number of
employees
Partly owned companies (ownership in %) 2014 2013 2014 2013 2014 2013 2014 2013 2014 2013 2014 2013
Bostadsgaranti (50) 6 8 –12 –4 263 51 76.0 14.4 275 18 1 12
ESS (European Spallation Source) (73)
11 7 –780 -534 –780 –533 neg neg - - 246 166
PostNord (60) 40,582 39,766 351 662 176 306 2.1 3.3 - 129 37,976 39,305
SAS (21) 38,006 42,182 153 2,596 –719 1,358 neg 18.9 - - 12,329 14,127
SOS Alarm (50) 953 870 30 11 29 9 19.5 6.4 - - 848 819
TeliaSonera (37) 101,793 103,098 22,680 24,462 15,599 16,767 13.6 13.3 13,000 13,000 24,951 25,321
VisitSweden (50) 245 254 1 1 1 0 2.8 0.4 - - 81 79
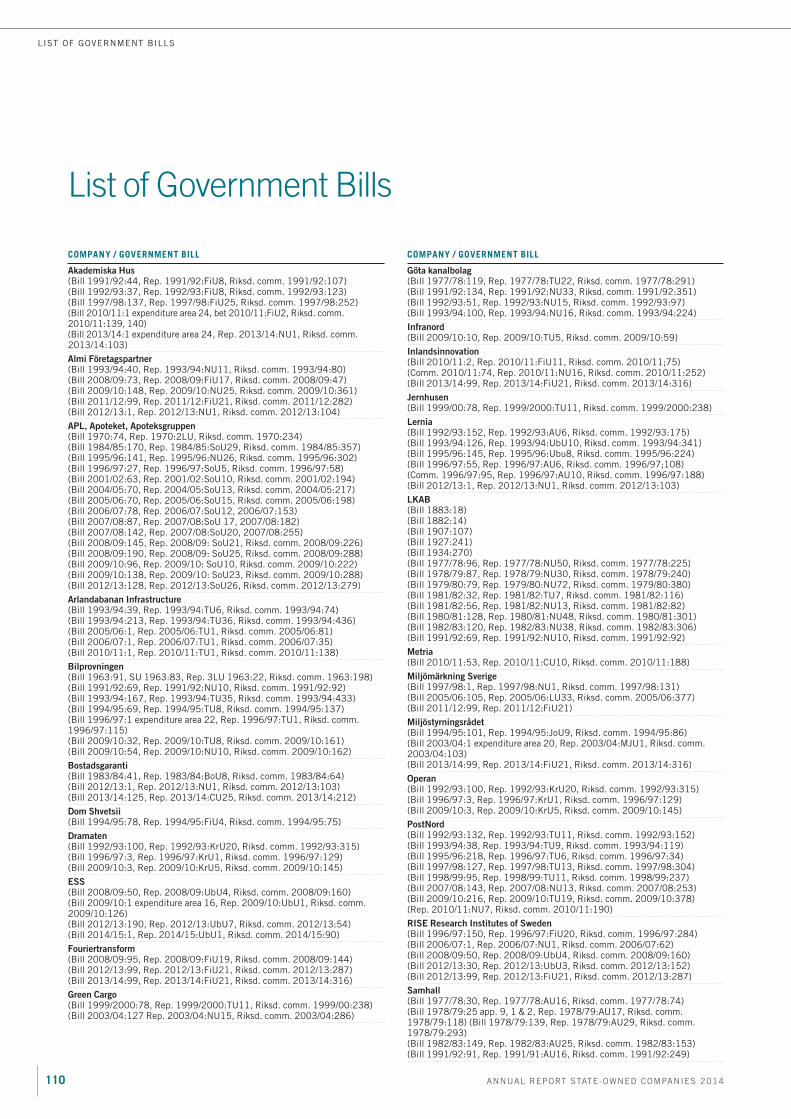
110 ANNUAL REPORT STATE-OWNED COMPANIES 2014
LIST OF GOVERNMENT BILLS
List of Government Bills
COMPANY / GOVERNMENT BILL
Akademiska Hus (Bill 1991/92:44, Rep. 1991/92:FiU8, Riksd. comm. 1991/92:107) (Bill 1992/93:37, Rep. 1992/93:FiU8, Riksd. comm. 1992/93:123) (Bill 1997/98:137, Rep. 1997/98:FiU25, Riksd. comm. 1997/98:252)(Bill 2010/11:1 expenditure area 24, bet 2010/11:FiU2, Riksd. comm. 2010/11:139, 140)(Bill 2013/14:1 expenditure area 24, Rep. 2013/14:NU1, Riksd. comm. 2013/14:103)
Almi Företagspartner(Bill 1993/94:40, Rep. 1993/94:NU11, Riksd. comm. 1993/94:80)(Bill 2008/09:73, Rep. 2008/09:FiU17, Riksd. comm. 2008/09:47)(Bill 2009/10:148, Rep. 2009/10:NU25, Riksd. comm. 2009/10:361) (Bill 2011/12:99, Rep. 2011/12:FiU21, Riksd. comm. 2011/12:282) (Bill 2012/13:1, Rep. 2012/13:NU1, Riksd. comm. 2012/13:104)
APL, Apoteket, Apoteksgruppen(Bill 1970:74, Rep. 1970:2LU, Riksd. comm. 1970:234) (Bill 1984/85:170, Rep. 1984/85:SoU29, Riksd. comm. 1984/85:357) (Bill 1995/96:141, Rep. 1995/96:NU26, Riksd. comm. 1995/96:302)(Bill 1996/97:27, Rep. 1996/97:SoU5, Riksd. comm. 1996/97:58) (Bill 2001/02:63, Rep. 2001/02:SoU10, Riksd. comm. 2001/02:194) (Bill 2004/05:70, Rep. 2004/05:SoU13, Riksd. comm. 2004/05:217) (Bill 2005/06:70, Rep. 2005/06:SoU15, Riksd. comm. 2005/06:198)(Bill 2006/07:78, Rep. 2006/07:SoU12, 2006/07:153)(Bill 2007/08:87, Rep. 2007/08:SoU 17, 2007/08:182) (Bill 2007/08:142, Rep. 2007/08:SoU20, 2007/08:255)(Bill 2008/09:145, Rep. 2008/09: SoU21, Riksd. comm. 2008/09:226)(Bill 2008/09:190, Rep. 2008/09: SoU25, Riksd. comm. 2008/09:288)(Bill 2009/10:96, Rep. 2009/10: SoU10, Riksd. comm. 2009/10:222)(Bill 2009/10:138, Rep. 2009/10: SoU23, Riksd. comm. 2009/10:288)(Bill 2012/13:128, Rep. 2012/13:SoU26, Riksd. comm. 2012/13:279)
Arlandabanan Infrastructure (Bill 1993/94:39, Rep. 1993/94:TU6, Riksd. comm. 1993/94:74) (Bill 1993/94:213, Rep. 1993/94:TU36, Riksd. comm. 1993/94:436) (Bill 2005/06:1, Rep. 2005/06:TU1, Riksd. comm. 2005/06:81) (Bill 2006/07:1, Rep. 2006/07:TU1, Riksd. comm. 2006/07:35) (Bill 2010/11:1, Rep. 2010/11:TU1, Riksd. comm. 2010/11:138)
Bilprovningen (Bill 1963:91, SU 1963:83, Rep. 3LU 1963:22, Riksd. comm. 1963:198) (Bill 1991/92:69, Rep. 1991/92:NU10, Riksd. comm. 1991/92:92)(Bill 1993/94:167, Rep. 1993/94:TU35, Riksd. comm. 1993/94:433)(Bill 1994/95:69, Rep. 1994/95:TU8, Riksd. comm. 1994/95:137) (Bill 1996/97:1 expenditure area 22, Rep. 1996/97:TU1, Riksd. comm. 1996/97:115)(Bill 2009/10:32, Rep. 2009/10:TU8, Riksd. comm. 2009/10:161)(Bill 2009/10:54, Rep. 2009/10:NU10, Riksd. comm. 2009/10:162)
Bostadsgaranti (Bill 1983/84:41, Rep. 1983/84:BoU8, Riksd. comm. 1983/84:64)(Bill 2012/13:1, Rep. 2012/13:NU1, Riksd. comm. 2012/13:103)(Bill 2013/14:125, Rep. 2013/14:CU25, Riksd. comm. 2013/14:212)
Dom Shvetsii (Bill 1994/95:78, Rep. 1994/95:FiU4, Riksd. comm. 1994/95:75)
Dramaten(Bill 1992/93:100, Rep. 1992/93:KrU20, Riksd. comm. 1992/93:315) (Bill 1996/97:3, Rep. 1996/97:KrU1, Riksd. comm. 1996/97:129)(Bill 2009/10:3, Rep. 2009/10:KrU5, Riksd. comm. 2009/10:145)
ESS(Bill 2008/09:50, Rep. 2008/09:UbU4, Riksd. comm. 2008/09:160)(Bill 2009/10:1 expenditure area 16, Rep. 2009/10:UbU1, Riksd. comm. 2009/10:126)(Bill 2012/13:190, Rep. 2012/13:UbU7, Riksd. comm. 2012/13:54)(Bill 2014/15:1, Rep. 2014/15:UbU1, Riksd. comm. 2014/15:90)
Fouriertransform(Bill 2008/09:95, Rep. 2008/09:FiU19, Riksd. comm. 2008/09:144)(Bill 2012/13:99, Rep. 2012/13:FiU21, Riksd. comm. 2012/13:287)(Bill 2013/14:99, Rep. 2013/14:FiU21, Riksd. comm. 2013/14:316)
Green Cargo (Bill 1999/2000:78, Rep. 1999/2000:TU11, Riksd. comm. 1999/00:238) (Bill 2003/04:127 Rep. 2003/04:NU15, Riksd. comm. 2003/04:286)
COMPANY / GOVERNMENT BILL
Göta kanalbolag (Bill 1977/78:119, Rep. 1977/78:TU22, Riksd. comm. 1977/78:291)(Bill 1991/92:134, Rep. 1991/92:NU33, Riksd. comm. 1991/92:351)(Bill 1992/93:51, Rep. 1992/93:NU15, Riksd. comm. 1992/93:97) (Bill 1993/94:100, Rep. 1993/94:NU16, Riksd. comm. 1993/94:224)
Infranord (Bill 2009/10:10, Rep. 2009/10:TU5, Riksd. comm. 2009/10:59)
Inlandsinnovation (Bill 2010/11:2, Rep. 2010/11:FiU11, Riksd. comm. 2010/11;75) (Comm. 2010/11:74, Rep. 2010/11:NU16, Riksd. comm. 2010/11:252)(Bill 2013/14:99, Rep. 2013/14:FiU21, Riksd. comm. 2013/14:316)
Jernhusen (Bill 1999/00:78, Rep. 1999/2000:TU11, Riksd. comm. 1999/2000:238)
Lernia(Bill 1992/93:152, Rep. 1992/93:AU6, Riksd. comm. 1992/93:175) (Bill 1993/94:126, Rep. 1993/94:UbU10, Riksd. comm. 1993/94:341) (Bill 1995/96:145, Rep. 1995/96:Ubu8, Riksd. comm. 1995/96:224) (Bill 1996/97:55, Rep. 1996/97:AU6, Riksd. comm. 1996/97;108) (Comm. 1996/97:95, Rep. 1996/97:AU10, Riksd. comm. 1996/97:188)(Bill 2012/13:1, Rep. 2012/13:NU1, Riksd. comm. 2012/13:103)
LKAB(Bill 1883:18)(Bill 1882:14)(Bill 1907:107)(Bill 1927:241)(Bill 1934:270)(Bill 1977/78:96, Rep. 1977/78:NU50, Riksd. comm. 1977/78:225)(Bill 1978/79:87, Rep. 1978/79:NU30, Riksd. comm. 1978/79:240)(Bill 1979/80:79, Rep. 1979/80:NU72, Riksd. comm. 1979/80:380)(Bill 1981/82:32, Rep. 1981/82:TU7, Riksd. comm. 1981/82:116)(Bill 1981/82:56, Rep. 1981/82:NU13, Riksd. comm. 1981/82:82)(Bill 1980/81:128, Rep. 1980/81:NU48, Riksd. comm. 1980/81:301)(Bill 1982/83:120, Rep. 1982/83:NU38, Riksd. comm. 1982/83:306)(Bill 1991/92:69, Rep. 1991/92:NU10, Riksd. comm. 1991/92:92)
Metria (Bill 2010/11:53, Rep. 2010/11:CU10, Riksd. comm. 2010/11:188)
Miljömärkning Sverige (Bill 1997/98:1, Rep. 1997/98:NU1, Riksd. comm. 1997/98:131)(Bill 2005/06:105, Rep. 2005/06:LU33, Riksd. comm. 2005/06:377)(Bill 2011/12:99, Rep. 2011/12:FiU21)
Miljöstyrningsrådet (Bill 1994/95:101, Rep. 1994/95:JoU9, Riksd. comm. 1994/95:86) (Bill 2003/04:1 expenditure area 20, Rep. 2003/04:MJU1, Riksd. comm. 2003/04:103)(Bill 2013/14:99, Rep. 2013/14:FiU21, Riksd. comm. 2013/14:316)
Operan(Bill 1992/93:100, Rep. 1992/93:KrU20, Riksd. comm. 1992/93:315) (Bill 1996/97:3, Rep. 1996/97:KrU1, Riksd. comm. 1996/97:129)(Bill 2009/10:3, Rep. 2009/10:KrU5, Riksd. comm. 2009/10:145)
PostNord (Bill 1992/93:132, Rep. 1992/93:TU11, Riksd. comm. 1992/93:152)(Bill 1993/94:38, Rep. 1993/94:TU9, Riksd. comm. 1993/94:119)(Bill 1995/96:218, Rep. 1996/97:TU6, Riksd. comm. 1996/97:34)(Bill 1997/98:127, Rep. 1997/98:TU13, Riksd. comm. 1997/98:304)(Bill 1998/99:95, Rep. 1998/99:TU11, Riksd. comm. 1998/99:237)(Bill 2007/08:143, Rep. 2007/08:NU13, Riksd. comm. 2007/08:253)(Bill 2009/10:216, Rep. 2009/10:TU19, Riksd. comm. 2009/10:378)(Rep. 2010/11:NU7, Riksd. comm. 2010/11:190)
RISE Research Institutes of Sweden(Bill 1996/97:150, Rep. 1996/97:FiU20, Riksd. comm. 1996/97:284) (Bill 2006/07:1, Rep. 2006/07:NU1, Riksd. comm. 2006/07:62)(Bill 2008/09:50, Rep. 2008/09:UbU4, Riksd. comm. 2008/09:160)(Bill 2012/13:30, Rep. 2012/13:UbU3, Riksd. comm. 2012/13:152)(Bill 2012/13:99, Rep. 2012/13:FiU21, Riksd. comm. 2012/13:287)
Samhall (Bill 1977/78:30, Rep. 1977/78:AU16, Riksd. comm. 1977/78:74) (Bill 1978/79:25 app. 9, 1 & 2, Rep. 1978/79:AU17, Riksd. comm. 1978/79:118) (Bill 1978/79:139, Rep. 1978/79:AU29, Riksd. comm. 1978/79:293) (Bill 1982/83:149, Rep. 1982/83:AU25, Riksd. comm. 1982/83:153) (Bill 1991/92:91, Rep. 1991/91:AU16, Riksd. comm. 1991/92:249)
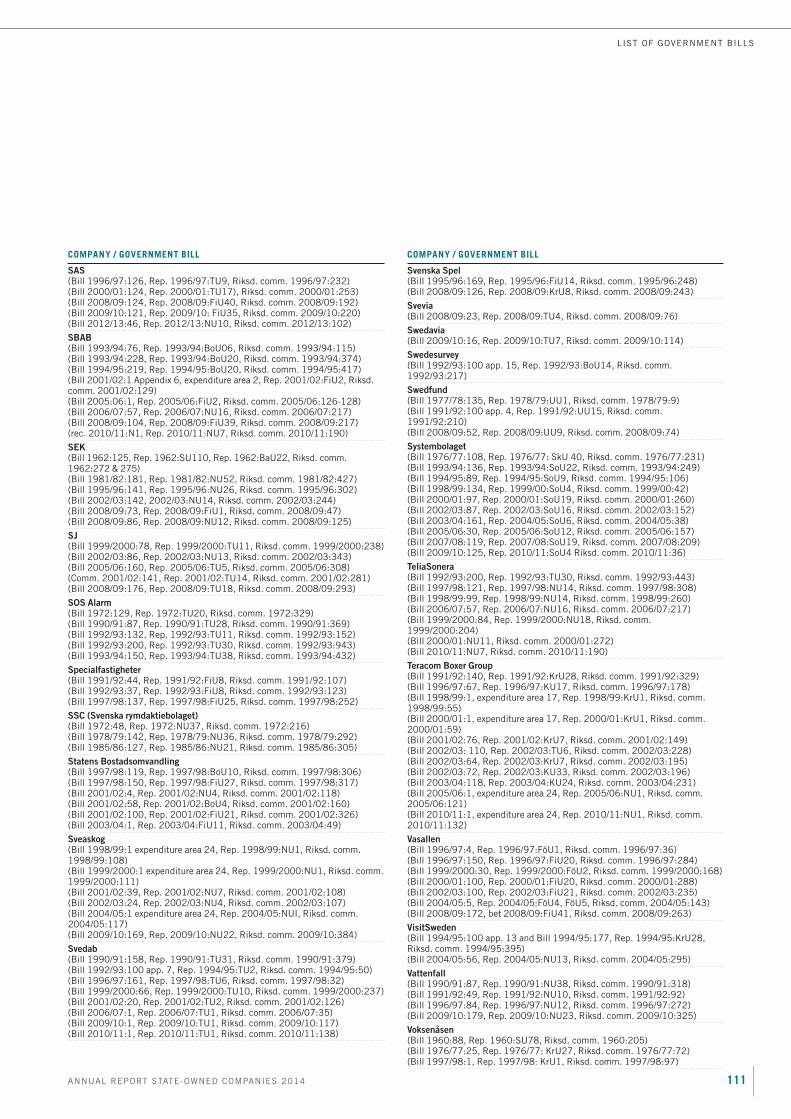
111ANNUAL REPORT STATE-OWNED COMPANIES 2014
LIST OF GOVERNMENT BILLS
COMPANY / GOVERNMENT BILL
SAS (Bill 1996/97:126, Rep. 1996/97:TU9, Riksd. comm. 1996/97:232) (Bill 2000/01:124, Rep. 2000/01:TU17), Riksd. comm. 2000/01:253)(Bill 2008/09:124, Rep. 2008/09:FiU40, Riksd. comm. 2008/09:192)(Bill 2009/10:121, Rep. 2009/10: FiU35, Riksd. comm. 2009/10:220)(Bill 2012/13:46, Rep. 2012/13:NU10, Riksd. comm. 2012/13:102)
SBAB (Bill 1993/94:76, Rep. 1993/94:BoU06, Riksd. comm. 1993/94:115) (Bill 1993/94:228, Rep. 1993/94:BoU20, Riksd. comm. 1993/94:374) (Bill 1994/95:219, Rep. 1994/95:BoU20, Riksd. comm. 1994/95:417) (Bill 2001/02:1 Appendix 6, expenditure area 2, Rep. 2001/02:FiU2, Riksd. comm. 2001/02:129) (Bill 2005:06:1, Rep. 2005/06:FiU2, Riksd. comm. 2005/06:126-128) (Bill 2006/07:57, Rep. 2006/07:NU16, Riksd. comm. 2006/07:217)(Bill 2008/09:104, Rep. 2008/09:FiU39, Riksd. comm. 2008/09:217)(rec. 2010/11:N1, Rep. 2010/11:NU7, Riksd. comm. 2010/11:190)
SEK(Bill 1962:125, Rep. 1962:SU110, Rep. 1962:BaU22, Riksd. comm. 1962:272 & 275)(Bill 1981/82:181, Rep. 1981/82:NU52, Riksd. comm. 1981/82:427)(Bill 1995/96:141, Rep. 1995/96:NU26, Riksd. comm. 1995/96:302) (Bill 2002/03:142, 2002/03:NU14, Riksd. comm. 2002/03:244)(Bill 2008/09:73, Rep. 2008/09:FiU1, Riksd. comm. 2008/09:47)(Bill 2008/09:86, Rep. 2008/09:NU12, Riksd. comm. 2008/09:125)
SJ (Bill 1999/2000:78, Rep. 1999/2000:TU11, Riksd. comm. 1999/2000:238) (Bill 2002/03:86, Rep. 2002/03:NU13, Riksd. comm. 2002/03:343) (Bill 2005/06:160, Rep. 2005/06:TU5, Riksd. comm. 2005/06:308)(Comm. 2001/02:141, Rep. 2001/02:TU14, Riksd. comm. 2001/02:281)(Bill 2008/09:176, Rep. 2008/09:TU18, Riksd. comm. 2008/09:293)
SOS Alarm (Bill 1972:129, Rep. 1972:TU20, Riksd. comm. 1972:329) (Bill 1990/91:87, Rep. 1990/91:TU28, Riksd. comm. 1990/91:369) (Bill 1992/93:132, Rep. 1992/93:TU11, Riksd. comm. 1992/93:152) (Bill 1992/93:200, Rep. 1992/93:TU30, Riksd. comm. 1992/93:943) (Bill 1993/94:150, Rep. 1993/94:TU38, Riksd. comm. 1993/94:432)
Specialfastigheter (Bill 1991/92:44, Rep. 1991/92:FiU8, Riksd. comm. 1991/92:107) (Bill 1992/93:37, Rep. 1992/93:FiU8, Riksd. comm. 1992/93:123) (Bill 1997/98:137, Rep. 1997/98:FiU25, Riksd. comm. 1997/98:252)
SSC (Svenska rymdaktiebolaget)(Bill 1972:48, Rep. 1972:NU37, Riksd. comm. 1972:216) (Bill 1978/79:142, Rep. 1978/79:NU36, Riksd. comm. 1978/79:292) (Bill 1985/86:127, Rep. 1985/86:NU21, Riksd. comm. 1985/86:305)
Statens Bostadsomvandling(Bill 1997/98:119, Rep. 1997/98:BoU10, Riksd. comm. 1997/98:306) (Bill 1997/98:150, Rep. 1997/98:FiU27, Riksd. comm. 1997/98:317) (Bill 2001/02:4, Rep. 2001/02:NU4, Riksd. comm. 2001/02:118) (Bill 2001/02:58, Rep. 2001/02:BoU4, Riksd. comm. 2001/02:160) (Bill 2001/02:100, Rep. 2001/02:FiU21, Riksd. comm. 2001/02:326) (Bill 2003/04:1, Rep. 2003/04:FiU11, Riksd. comm. 2003/04:49)
Sveaskog(Bill 1998/99:1 expenditure area 24, Rep. 1998/99:NU1, Riksd. comm. 1998/99:108) (Bill 1999/2000:1 expenditure area 24, Rep. 1999/2000:NU1, Riksd. comm. 1999/2000:111) (Bill 2001/02:39, Rep. 2001/02:NU7, Riksd. comm. 2001/02:108) (Bill 2002/03:24, Rep. 2002/03:NU4, Riksd. comm. 2002/03:107) (Bill 2004/05:1 expenditure area 24, Rep. 2004/05:NUI, Riksd. comm. 2004/05:117)(Bill 2009/10:169, Rep. 2009/10:NU22, Riksd. comm. 2009/10:384)
Svedab(Bill 1990/91:158, Rep. 1990/91:TU31, Riksd. comm. 1990/91:379) (Bill 1992/93:100 app. 7, Rep. 1994/95:TU2, Riksd. comm. 1994/95:50) (Bill 1996/97:161, Rep. 1997/98:TU6, Riksd. comm. 1997/98:32)(Bill 1999/2000:66, Rep. 1999/2000:TU10, Riksd. comm. 1999/2000:237) (Bill 2001/02:20, Rep. 2001/02:TU2, Riksd. comm. 2001/02:126) (Bill 2006/07:1, Rep. 2006/07:TU1, Riksd. comm. 2006/07:35) (Bill 2009/10:1, Rep. 2009/10:TU1, Riksd. comm. 2009/10:117) (Bill 2010/11:1, Rep. 2010/11:TU1, Riksd. comm. 2010/11:138)
COMPANY / GOVERNMENT BILL
Svenska Spel (Bill 1995/96:169, Rep. 1995/96:FiU14, Riksd. comm. 1995/96:248)(Bill 2008/09:126, Rep. 2008/09:KrU8, Riksd. comm. 2008/09:243)
Svevia (Bill 2008/09:23, Rep. 2008/09:TU4, Riksd. comm. 2008/09:76)
Swedavia (Bill 2009/10:16, Rep. 2009/10:TU7, Riksd. comm. 2009/10:114)
Swedesurvey (Bill 1992/93:100 app. 15, Rep. 1992/93:BoU14, Riksd. comm. 1992/93:217)
Swedfund (Bill 1977/78:135, Rep. 1978/79:UU1, Riksd. comm. 1978/79:9)(Bill 1991/92:100 app. 4, Rep. 1991/92:UU15, Riksd. comm. 1991/92:210) (Bill 2008/09:52, Rep. 2008/09:UU9, Riksd. comm. 2008/09:74)
Systembolaget (Bill 1976/77:108, Rep. 1976/77: SkU 40, Riksd. comm. 1976/77:231) (Bill 1993/94:136, Rep. 1993/94:SoU22, Riksd. comm. 1993/94:249) (Bill 1994/95:89, Rep. 1994/95:SoU9, Riksd. comm. 1994/95:106) (Bill 1998/99:134, Rep. 1999/00:SoU4, Riksd. comm. 1999/00:42) (Bill 2000/01:97, Rep. 2000/01:SoU19, Riksd. comm. 2000/01:260) (Bill 2002/03:87, Rep. 2002/03:SoU16, Riksd. comm. 2002/03:152) (Bill 2003/04:161, Rep. 2004/05:SoU6, Riksd. comm. 2004/05:38) (Bill 2005/06:30, Rep. 2005/06:SoU12, Riksd. comm. 2005/06:157)(Bill 2007/08:119, Rep. 2007/08:SoU19, Riksd. comm. 2007/08:209)(Bill 2009/10:125, Rep. 2010/11:SoU4 Riksd. comm. 2010/11:36)
TeliaSonera (Bill 1992/93:200, Rep. 1992/93:TU30, Riksd. comm. 1992/93:443) (Bill 1997/98:121, Rep. 1997/98:NU14, Riksd. comm. 1997/98:308) (Bill 1998/99:99, Rep. 1998/99:NU14, Riksd. comm. 1998/99:260) (Bill 2006/07:57, Rep. 2006/07:NU16, Riksd. comm. 2006/07:217) (Bill 1999/2000:84, Rep. 1999/2000:NU18, Riksd. comm. 1999/2000:204) (Bill 2000/01:NU11, Riksd. comm. 2000/01:272) (Bill 2010/11:NU7, Riksd. comm. 2010/11:190)
Teracom Boxer Group(Bill 1991/92:140, Rep. 1991/92:KrU28, Riksd. comm. 1991/92:329) (Bill 1996/97:67, Rep. 1996/97:KU17, Riksd. comm. 1996/97:178) (Bill 1998/99:1, expenditure area 17, Rep. 1998/99:KrU1, Riksd. comm. 1998/99:55) (Bill 2000/01:1, expenditure area 17, Rep. 2000/01:KrU1, Riksd. comm. 2000/01:59) (Bill 2001/02:76, Rep. 2001/02:KrU7, Riksd. comm. 2001/02:149) (Bill 2002/03: 110, Rep. 2002/03:TU6, Riksd. comm. 2002/03:228) (Bill 2002/03:64, Rep. 2002/03:KrU7, Riksd. comm. 2002/03:195) (Bill 2002/03:72, Rep. 2002/03:KU33, Riksd. comm. 2002/03:196) (Bill 2003/04:118, Rep. 2003/04:KU24, Riksd. comm. 2003/04:231) (Bill 2005/06:1, expenditure area 24, Rep. 2005/06:NU1, Riksd. comm. 2005/06:121) (Bill 2010/11:1, expenditure area 24, Rep. 2010/11:NU1, Riksd. comm. 2010/11:132)
Vasallen (Bill 1996/97:4, Rep. 1996/97:FöU1, Riksd. comm. 1996/97:36) (Bill 1996/97:150, Rep. 1996/97:FiU20, Riksd. comm. 1996/97:284) (Bill 1999/2000:30, Rep. 1999/2000:FöU2, Riksd. comm. 1999/2000:168) (Bill 2000/01:100, Rep. 2000/01:FiU20, Riksd. comm. 2000/01:288) (Bill 2002/03:100, Rep. 2002/03:FiU21, Riksd. comm. 2002/03:235) (Bill 2004/05:5, Rep. 2004/05:FöU4, FöU5, Riksd. comm. 2004/05:143)(Bill 2008/09:172, bet 2008/09:FiU41, Riksd. comm. 2008/09:263)
VisitSweden (Bill 1994/95:100 app. 13 and Bill 1994/95:177, Rep. 1994/95:KrU28, Riksd. comm. 1994/95:395) (Bill 2004/05:56, Rep. 2004/05:NU13, Riksd. comm. 2004/05:295)
Vattenfall (Bill 1990/91:87, Rep. 1990/91:NU38, Riksd. comm. 1990/91:318) (Bill 1991/92:49, Rep. 1991/92:NU10, Riksd. comm. 1991/92:92) (Bill 1996/97:84, Rep. 1996/97:NU12, Riksd. comm. 1996/97:272) (Bill 2009/10:179, Rep. 2009/10:NU23, Riksd. comm. 2009/10:325)
Voksenåsen (Bill 1960:88, Rep. 1960:SU78, Riksd. comm. 1960:205) (Bill 1976/77:25, Rep. 1976/77: KrU27, Riksd. comm. 1976/77:72) (Bill 1997/98:1, Rep. 1997/98: KrU1, Riksd. comm. 1997/98:97)

CHIEF EXECUTIVE OFFICERS
Company Taking up appointment Leaving
Apotekens Service Stefan Jakas (Jan 2014)
Dramaten Eirik Stubö (Jan 2015) Marie-Louise Ekman (Jan 2015)
Inlandsinnovation Peter Gullander (Oct 2014) Håkan Berg, acting (Oct 2014)
LKAB Jan Moström (Aug 2015) Lars-Eric Aaro (Aug 2015)
Metria Urban Lindskog (Oct 2014 acting, Mar 2015 permanent)
Karin Annerwall Parö (Oct 2014)
Orio Jonas Tegström (Jun 2014) Lennart Ståhl (Jun 2014)
RISE Research Institutes of Sweden Olof Sandén (May 2014) Cecilia Driving (May 2014)
SBAB Klas Danielsson (Aug 2014) Per-Anders Fasth, Acting (Aug 2014)
SBAB Per-Anders Fasth, Acting (Jan 2014) Carl-Viggo Östlund (Jan 2014)
SEK Catrin Fransson (Apr 2014) Peter Yngwe (Apr 2014)
Specialfastigheter Åsa Hedenberg (Apr 2014) Håkan Steinbüchel (Apr 2014)
Vattenfall Magnus Hall (Oct 2014) Øystein Løseth (Oct 2014)
CHAIRMAN OF THE BOARD
Company Taking up appointment1) Leaving1)
Metria Eva Gidlöf Christina Rogestam
Inlandsinnovation Eva Färnstrand Wilhelm Geijer
SOS Alarm Eva Fernvall Johnny Magnusson
Statens Bostadsomvandling Christel Wiman Rolf Åbjörnsson
Sveaskog Helene Biström (Jun 2015) Göran Persson (Jun 2015)
BOARD MEMBERS
Company Taking up appointment1) Leaving1)
Almi Företagspartner Katarina Green Inga Thoresson-Hallgren
APL (Apotek Produktion & Laboratorier) Ulf Tossman Gunilla Högbom
APL (Apotek Produktion & Laboratorier) Malin Forkman Wenche Rolfsen
Apoteket Sussi Kvart Elisabeth Wenzlaff
Apoteksgruppen Gunilla Rittgård Gunvor Engström
Apoteksgruppen Richard Reinius Lars Erik Fredriksson
Arlandabanan Infrastructure Lars Erik Fredriksson Hans Brändström
Bilprovningen Hélène Westholm (Nov 2014) Leif Ljungqvist (Nov 2014)
Bilprovningen Kristina Patek Cecilia Daun-Wennborg
Bostadsgaranti Maurice Forslund
Dom Shvetsii Lena Wedén Leif Appelblom
Dramaten Pontus Braunerhjelm Chris Marschall
Dramaten Tasso Stafilidis Eric Sjöström
ESS (European Spallation Source) Kim Graugaard (Oct 2014) Lars Goldschmidt (Oct 2014)
Fouriertransform Richard Reinius Hanna Lagercrantz
Fouriertransform Christina Åkerman
Green Cargo Ingvar Nilsson
Göta kanalbolag Anna Ernestam Renée Mohlkert
Göta kanalbolag Göran Carlberg Christer Berggren
112 ANNUAL REPORT STATE-OWNED COMPANIES 2014
CHANGES IN EXECUTIVE MANAGEMENT TEAMS AND BOARDS
Changes in executive management since 1 January 2014
Changes in Boardsfollowing the Annual General Meeting in the spring of 2015
1) The appointment/resignation occurred in connection with the Annual General Meeting in the spring of 2015 unless otherwise indicated.

113ANNUAL REPORT STATE-OWNED COMPANIES 2014
CHANGES IN EXECUTIVE MANAGEMENT TEAMS AND BOARDS
BOARD MEMBERS
Company Taking up appointment1) Leaving1)
Göta kanalbolag Bengt-Olov Gunnarson
Infranord Magnus Jonasson Ingemar Ziegler
Infranord Per Westerberg Sven Landelius
Inlandsinnovation Anita Johansson (Jun 2014) Yvonne Lif Lövbrand (Jun 2014)
Inlandsinnovation Mats Gullbrandsson Bengt-Erik Lindgren
Inlandsinnovation Leif Boström Elisabeth Norman
Inlandsinnovation Katarina Green Per Hollander
Lernia Peter Lundahl Sven-Runo Bergqvist
Lernia Johan Hallberg Kristina Ekengren
LKAB Eva Hamilton Maud Olofsson
LKAB Leif Darner
Metria Urban Lindskog (Oct 2014)
Miljömärkning Sverige Anita Falkenek Yvonne Ingman
Operan Baker Karim Lennart Låftman
Operan Örjan Wikforss Dag Hallberg
Operan Leif Jakobsson
Orio Helene Vibbleus
RISE Research Institutes of Sweden Fredrik Winberg Thomas Johannesson
RISE Research Institutes of Sweden Sven Wird
RISE Research Institutes of Sweden Hasse Johansson
Samhall Leif Ljungqvist (Nov 2014) Magnus Skåninger (Nov 2014)
Samhall Angelica Frithiof Gunnel Tolfes
Samhall Hans Kilsved
SBAB Per-Anders Fasth (Sep 2014)
SBAB Carl-Henrik Borg Per-Anders Fasth
SEK Teppo Tauriainen (Oct 2014) Eva Walder (Oct 2014)
SEK Susanne Lithander (Jan 2015)
SJ Lena Olving
SOS Alarm Johnny Magnusson Tommy Bernevång Forsberg
SOS Alarm Alf Jönsson Bo Andersson
SOS Alarm Johan Hallberg Lars Erik Fredriksson
SSC (Svenska rymdaktiebolaget) Anne Gynnerstedt
Statens Bostadsomvandling Håkan Steinbüchel Cathrine Holgersson
Statens Bostadsomvandling Leif Ljungqvist Sophie Ahlstrand
Sveaskog Mats Ringesten
Svedab Lars Erik Fredriksson Hans Brändström
Svenska Spel Hélène Westholm (Nov 2014) Michael Thorén (Nov 2014)
Svenska Spel Cecilia Marlow
Svevia Michael Thorén Richard Reinius
Swedavia Lottie Knutson Hans Jeppsson
Swedavia Lotta Mellström Jenny Lahrin
Swedfund International Hanna Lagercrantz Lotta Mellström
Swedfund International Per Östensson
Teracom Boxer Group Kristina Ekengren Johan Hallberg
Teracom Boxer Group Martin Tiveus Urban Lindskog
Teracom Boxer Group Håkan Dahlström
Vattenfall Tomas Kåberger Eli Arnstad
Vattenfall Viktoria Bergman
VisitSweden Kristina Ekengren Inga Thoresson-Hallgren
1) The appointment/resignation occurred in connection with the Annual General Meeting in the spring of 2015 unless otherwise indicated.

114 ANNUAL REPORT STATE-OWNED COMPANIES 2014
BOARD MEMBERS ELECTED BY THE ANNUAL GENERAL MEETING
Board members elected by the Annual General Meeting
SURNAME FIRST NAME BORN TITLE BOARD OF DIRECTORS
Abrahamsson Mats 1960 Professor of Logistics, Linköping University PostNord (2009–)
Abrahamsson Tomas 1952 Deputy Chairman, Union of Service and Communication Employees SEKO
Svenska Skeppshypotek (2002–)
Ahlstrand Sophie 1977 Deputy director Ministry of Health and Social Affairs Statens Bostadsomvandling (2012–2015)
Alestig Johnson Margareta 1961 CFO Second AP Fund Green Cargo (2010–)
Almberg Jeanette 1964 Global Head Operation SEB Teracom Boxer Group (2013–)
Anderson Bo 1951 Senior Advisor SOS Alarm (2006–2015)
Andersson Renée 1947 Ethics and Environment Manager, Indiska Magasinet AB Swedfund International (2012–)
Andersson Thord 1961 Unit Manager, Örebro Regional Development Council Systembolaget (2011–)
Andreasson Jan 1958 Consulate General, Royal Norwegian Consulate General Voksenåsen (2010–)
Antoni Bo 1948 CEO, Swedish Construction Federation Bostadsgaranti (2008–)
Apelman Karin 1961 Director-General, Swedish Export Credit Board Swedavia (2010–)
Appelblom Leif 1949 Senior Advisor, Ministry for Foreign Affairs Dom Shvetsii (2011–2015)
Ardström Cecilia 1965 Director of Finance, Head of Asset Management, Länsförsäkringar AB
SEK (2011–)
Arnstad Eli 1962 CEO, SpareBank 1 SMN Vattenfall (2008–2015)
Arp Fredrik 1953 Various board assignments Vattenfall (2014-)
Asker Gunilla 1963 CEO, Svenska Dagbladet Göta kanalbolag (2013–)
Assarsson Johan 1962 Regional Director, Västra Götaland APL (Apotek Produktion & Laboratorier) (2012–) Chair.
Axelsson Charlotte 1948 Various board assignments Vasallen (2010–) Chair.
Axelsson Marita 1962 Deputy director, Ministry of Finance Miljömärkning Sverige (2012–)
Axelsson Svante L. 1947 CEO, SA Trading AB Miljömärkning Sverige (2007–)
Axelsson Lindgren Katarina 1964 Various board assignments Metria (2013–)
Backemar Lars 1950 Consultant, Backemar Consulting AB Swedavia (2010–)
Baig Azka 1972 Journalist NRK Voksenåsen (2011–)
Bard Pernilla 1967 Head of Operations, Social Initiative Swedfund International (2012–)
Belfrage Jan 1944 Various board assignments SEK (2010–)
Bengtsson Börje 1947 Various board assignments Metria (2014-)/Svevia (2013–)
Bengtsson Jan 1954 CEO, Almi Invest Fouriertransform (2014–)
Bengtsson Kenneth 1961 Various board assignments Systembolaget (2014–) Chair.
Berg Gunilla 1960 CFO PostNord Vattenfall (2012–)
Berg Jan 1953 Self-employed consultant Specialfastigheter (2009–)
Berg Ulf 1951 Various board assignments Fouriertransform (2014–)
Bergenheim Hans 1960 CEO, Lateus AB Svenska Spel (2010–)
Bergenheim Åsa 1954 Vice-Chancellor, Karlstad University Voksenåsen (2013–)
Berggren Christer 1944 Former Deputy Director, Ministry of Finance Göta kanalbolag (2011–2015)
Bergkvist Jan Peter 1957 Sustainability Advisor Miljömärkning Sverige (2013–)
Bergman Viktoria 1965 Various board assignments Vattenfall (2015–)
Bergqvist Sven-Runo 1943 CEO, Stiftelsen Statshälsan Lernia (2002–2015)
Bergstedt Sten Viveca 1959 Various board assignments and author Systembolaget (2014–)
Bernevång Forsberg Tommy 1959 Local Government Advisor, Christian Democrat Party SOS Alarm (2007–2015)
Biström Helene 1962 Various board assignments Sveaskog (2014–)
Biörck Hans 1951 Various board assignments LKAB (2012–)
Bjelke Katarina 1965 Member of the Board of Trustees, Uppsala University ESS (European Spallation Source) (2010–)
Borekull Jan 1950 CA Fastigheter AB Dom Shvetsii (2008–) Chair.
Borg Carl-Henrik 1952 Proprietary business operations, investor and board member
SBAB (2015–)
Boström Leif 1959 CEO, LKAB MInerals Inlandsinnovation (2015–)
Braunerhjelm Pontus 1953 Research leader, Professor Dramaten (2015–)
Brorman Carina 1958 Various board assignments Dramaten (2008–)
Brunell Fredrik 1959 SVP Head of Corporate Finance AB Volvo SSC (Svenska rymdaktiebolaget) (2012–)
Brändström Hans 1958 Director, Ministry of Enterprise and Innovation Arlandabanan Infrastructure (2007–2015)/Svedab (2007–2015)
Burreau Britta 1964 CEO, Nordea Liv & Pension Akademiska Hus (2014–)
Burton Katarina 1962 Consultant, Burton Consulting Metria (2014–)
Buskhe Håkan 1963 CEO, Saab AB Vattenfall (2012–)
Byström Anders 1958 Regional Director, Regional Development County, County of Jämtland
Almi Företagspartner (2013–)

115ANNUAL REPORT STATE-OWNED COMPANIES 2014
BOARD MEMBERS ELECTED BY THE ANNUAL GENERAL MEETING
SURNAME FIRST NAME BORN TITLE BOARD OF DIRECTORS
Böhlin Birgitta 1948 Various board assignments Almi Företagspartner (2013–) Chair./Apoteksgruppen (2008–) Chair./Lernia (2011–) Chair.
Börjesson Björn 1951 Self-employed consultant Swedfund International (2012–)
Börjesson Lars 1957 Professor of Condensed Matter Physics ESS (European Spallation Source) (2010–)
Börjesson Lars 1964 CEO, Stena Technoworld SBAB (2014–)
Caneman Monica 1954 Various board assignments SAS (2010–)
Carlberg Göran 1964 Head of Construction Project Unit, City of Stockholm Göta kanalbolag (2015–)
Carlsén Bertil 1960 CFO Anticimex Samhall (2010–)
Celsing Anna-Karin 1962 Consultant, AKC AB Operan (2012–)
Christiansen Mikael 1945 Director Operan (2009–)
Clason Peter 1963 CEO, American Express Norden VisitSweden (2007–)
Curman Maria 1950 Various board assignments Apoteket (2012–)/Teracom Boxer Group (2007–)
Dahlström Håkan 1962 Executive Vice President Public, Healthcare & Welfare Tieto
Teracom Boxer Group (2015–)
Damne Johan 1963 CA Fastigheter AB Dom Shvetsii (2008–)
Danius Sara 1962 Professor of Comparative Literature, University of Stockholm
Dramaten (2014–)
Darner Leif 1952 Various board assignments LKAB (2015–)
Daun-Wennborg Cecilia 1963 Consultant, various board assignments Bilprovningen (2013–2015)
Dellby Ulrika 1966 Founder, Fagerberg & Dellby SJ (2014–)
Dilling Carsten 1962 President and CEO, TDC SAS (2014–)
Duveblad Gunnel 1955 Various board assignments PostNord (2009–)
Ehrlén Olof 1949 Former President and CEO, NCC Akademiska Hus (2011–)/Svevia (2013–) Chair.
Ehrling Marie 1955 Various board assignments TeliaSonera (2013–) Chair.
Ekengren Kristina 1969 Deputy director, Ministry of Enterprise and Innovation Jernhusen (2012–)/Lernia (2010–2015)/SBAB (2013–)/Teracom Boxer Group (2015–)/VisitSweden (2015–)
Ekström Claes 1958 Partner Altor Equity Partners Swedfund International (2008–2012)/ Swedfund International (2012–) Chair.
Elgh Anna 1963 CEO, Svenska Retursystem Swedavia (2010–)
Ellegaard Christian 1969 Managing Director, Berendsen PostNord (2013–)
Engström Gunvor 1950 Various board assignments Apoteksgruppen (2008–2015)
Eriksson Eva 1947 Various board assignments Voksenåsen (2008–) Chair.
Eriksson Per 1949 Vice-Chancellor, Lund University ESS (European Spallation Source) (2010–)
Erixon Håkan 1961 Various board assignments Orio (2013–) Chair./Vattenfall (2011–)
Erixon Lena 1960 Director-General, FMV Svedab (2013–) Chair.
Ernestam Anna 1962 CFO Swedish Red Cross Göta kanalbolag (2015–)
Eslander Anders 1956 Various board assignments VisitSweden (2013–)
Fagerström Pia 1966 Desk officer, Ministry of Health and Social Affairs Systembolaget (2014–)
Falkenek Anita 1964 Sustainability Manager, Åhléns AB Miljömärkning Sverige (2015–)
Fasth Per-Anders 1960 Various board assignments SBAB (2014-2015)
Fasth Gillstedt Helen 1962 Various board assignments Samhall (2012–)
Fernvall Eva 1953 Chief Communications Officer, Apoteket SOS Alarm (2015–) Chair.
Fjeldsted Rasmussen Sisse 1967 CFO, Scandinavian Tobacco Group PostNord (2013–)
Forkman Malin 1965 Communications Development Manager, Systembolaget APL (Apotek Produktion & Laboratorier) (2015–)
Formgren Johan 1962 Former Senior Vice President HR, Saab Automobile Orio (2013–)
Forslund Mats 1957 CEO, Jämtland Härjedalen Turism VisitSweden (2013–)
Forslund Maurice 1982 Desk officer, Ministry of Enterprise and Innovation Bostadsgaranti (2013–2015)
Fredholm Pether 1957 CEO, John Svensson Byggnadsfirma Bostadsgaranti (2010–)
Fredriksson Lars Erik 1964 Desk officer, Ministry of Enterprise and Innovation Apoteksgruppen (2012–2015)/Arlandabanan Infrastructure (2015–)/SOS Alarm (2012–2015)/Svedab (2015–)
Friman Maija-Liisa 1953 Various board assignments LKAB (2008–)
Frithiof Angelica 1961 Self-employed Samhall (2015–)
Fritz Catarina 1963 CFO, Keolis Sverige Svenska Spel (2011–)
Fritzon Crister 1961 SJ Systembolaget (2012–)
Fürth Thomas 1947 Head of Research, Kairos Future Voksenåsen (2012–)
Färnstrand Eva 1951 Various board assignments Infranord (2012–) Chair./Inlandsinnovation (2015–) Chair./Sveaskog (2008–)
Gauffin Elisabeth 1959 Deputy Chairman, Federation of Swedish Farmers (LRF) VisitSweden (2013–) Chair.
Geijer Wilhelm 1947 Various board assignments Inlandsinnovation (2011–2015, of which, Chair. 2014–2015)
Gideon Pia 1955 Partner, Gaia Leadership Metria (2014-)/Svevia (2008–)
Gidlöf Eva 1957 Various board assignments Metria (2015–) Chair.
Grate-Axén Adine 1961 Various board assignments Swedavia (2010–)
Graugaard Kim 1961 Various board assignments ESS (European Spallation Source) (2014–)
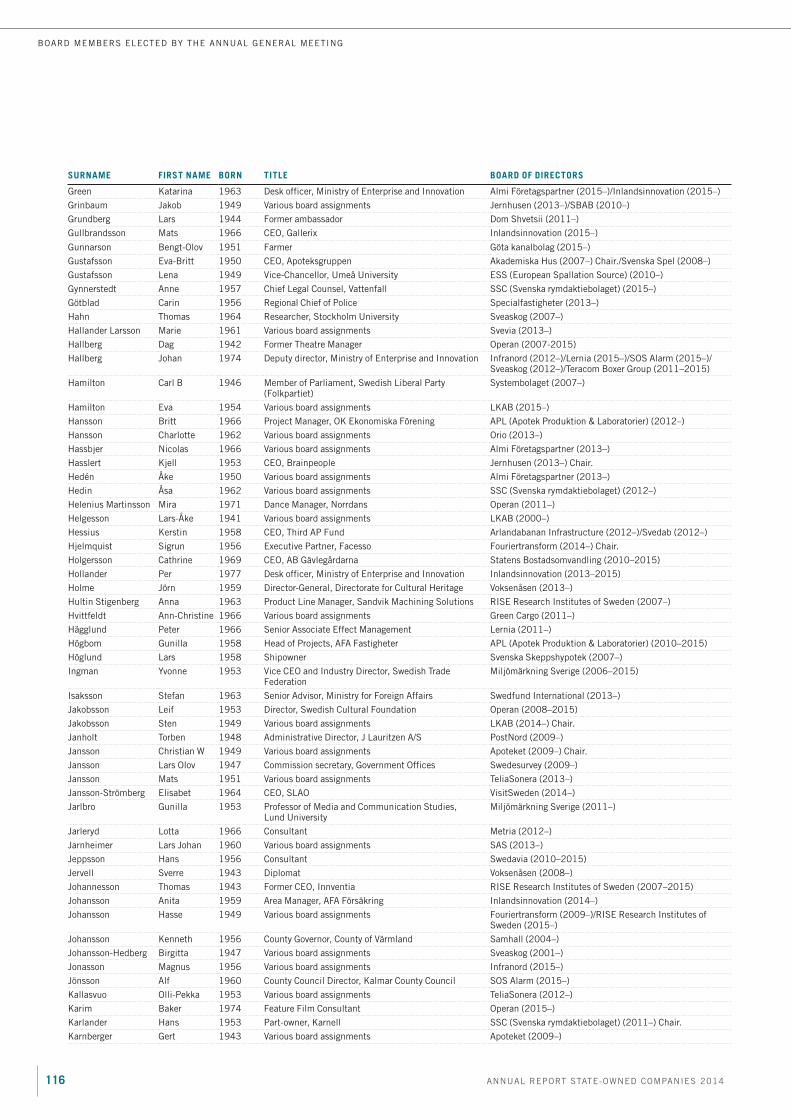
116 ANNUAL REPORT STATE-OWNED COMPANIES 2014
BOARD MEMBERS ELECTED BY THE ANNUAL GENERAL MEETING
SURNAME FIRST NAME BORN TITLE BOARD OF DIRECTORS
Green Katarina 1963 Desk officer, Ministry of Enterprise and Innovation Almi Företagspartner (2015–)/Inlandsinnovation (2015–)
Grinbaum Jakob 1949 Various board assignments Jernhusen (2013–)/SBAB (2010–)
Grundberg Lars 1944 Former ambassador Dom Shvetsii (2011–)
Gullbrandsson Mats 1966 CEO, Gallerix Inlandsinnovation (2015–)
Gunnarson Bengt-Olov 1951 Farmer Göta kanalbolag (2015–)
Gustafsson Eva-Britt 1950 CEO, Apoteksgruppen Akademiska Hus (2007–) Chair./Svenska Spel (2008–)
Gustafsson Lena 1949 Vice-Chancellor, Umeå University ESS (European Spallation Source) (2010–)
Gynnerstedt Anne 1957 Chief Legal Counsel, Vattenfall SSC (Svenska rymdaktiebolaget) (2015–)
Götblad Carin 1956 Regional Chief of Police Specialfastigheter (2013–)
Hahn Thomas 1964 Researcher, Stockholm University Sveaskog (2007–)
Hallander Larsson Marie 1961 Various board assignments Svevia (2013–)
Hallberg Dag 1942 Former Theatre Manager Operan (2007-2015)
Hallberg Johan 1974 Deputy director, Ministry of Enterprise and Innovation Infranord (2012–)/Lernia (2015–)/SOS Alarm (2015–)/ Sveaskog (2012–)/Teracom Boxer Group (2011–2015)
Hamilton Carl B 1946 Member of Parliament, Swedish Liberal Party (Folkpartiet)
Systembolaget (2007–)
Hamilton Eva 1954 Various board assignments LKAB (2015–)
Hansson Britt 1966 Project Manager, OK Ekonomiska Förening APL (Apotek Produktion & Laboratorier) (2012–)
Hansson Charlotte 1962 Various board assignments Orio (2013–)
Hassbjer Nicolas 1966 Various board assignments Almi Företagspartner (2013–)
Hasslert Kjell 1953 CEO, Brainpeople Jernhusen (2013–) Chair.
Hedén Åke 1950 Various board assignments Almi Företagspartner (2013–)
Hedin Åsa 1962 Various board assignments SSC (Svenska rymdaktiebolaget) (2012–)
Helenius Martinsson Mira 1971 Dance Manager, Norrdans Operan (2011–)
Helgesson Lars-Åke 1941 Various board assignments LKAB (2000–)
Hessius Kerstin 1958 CEO, Third AP Fund Arlandabanan Infrastructure (2012–)/Svedab (2012–)
Hjelmquist Sigrun 1956 Executive Partner, Facesso Fouriertransform (2014–) Chair.
Holgersson Cathrine 1969 CEO, AB Gävlegårdarna Statens Bostadsomvandling (2010–2015)
Hollander Per 1977 Desk officer, Ministry of Enterprise and Innovation Inlandsinnovation (2013–2015)
Holme Jörn 1959 Director-General, Directorate for Cultural Heritage Voksenåsen (2013–)
Hultin Stigenberg Anna 1963 Product Line Manager, Sandvik Machining Solutions RISE Research Institutes of Sweden (2007–)
Hvittfeldt Ann-Christine 1966 Various board assignments Green Cargo (2011–)
Hägglund Peter 1966 Senior Associate Effect Management Lernia (2011–)
Högbom Gunilla 1958 Head of Projects, AFA Fastigheter APL (Apotek Produktion & Laboratorier) (2010–2015)
Höglund Lars 1958 Shipowner Svenska Skeppshypotek (2007–)
Ingman Yvonne 1953 Vice CEO and Industry Director, Swedish Trade Federation
Miljömärkning Sverige (2006–2015)
Isaksson Stefan 1963 Senior Advisor, Ministry for Foreign Affairs Swedfund International (2013–)
Jakobsson Leif 1953 Director, Swedish Cultural Foundation Operan (2008–2015)
Jakobsson Sten 1949 Various board assignments LKAB (2014–) Chair.
Janholt Torben 1948 Administrative Director, J Lauritzen A/S PostNord (2009–)
Jansson Christian W 1949 Various board assignments Apoteket (2009–) Chair.
Jansson Lars Olov 1947 Commission secretary, Government Offices Swedesurvey (2009–)
Jansson Mats 1951 Various board assignments TeliaSonera (2013–)
Jansson-Strömberg Elisabet 1964 CEO, SLAO VisitSweden (2014–)
Jarlbro Gunilla 1953 Professor of Media and Communication Studies, Lund University
Miljömärkning Sverige (2011–)
Jarleryd Lotta 1966 Consultant Metria (2012–)
Jarnheimer Lars Johan 1960 Various board assignments SAS (2013–)
Jeppsson Hans 1956 Consultant Swedavia (2010–2015)
Jervell Sverre 1943 Diplomat Voksenåsen (2008–)
Johannesson Thomas 1943 Former CEO, Innventia RISE Research Institutes of Sweden (2007–2015)
Johansson Anita 1959 Area Manager, AFA Försäkring Inlandsinnovation (2014–)
Johansson Hasse 1949 Various board assignments Fouriertransform (2009–)/RISE Research Institutes of Sweden (2015–)
Johansson Kenneth 1956 County Governor, County of Värmland Samhall (2004–)
Johansson-Hedberg Birgitta 1947 Various board assignments Sveaskog (2001–)
Jonasson Magnus 1956 Various board assignments Infranord (2015–)
Jönsson Alf 1960 County Council Director, Kalmar County Council SOS Alarm (2015–)
Kallasvuo Olli-Pekka 1953 Various board assignments TeliaSonera (2012–)
Karim Baker 1974 Feature Film Consultant Operan (2015–)
Karlander Hans 1953 Part-owner, Karnell SSC (Svenska rymdaktiebolaget) (2011–) Chair.
Karnberger Gert 1943 Various board assignments Apoteket (2009–)

117ANNUAL REPORT STATE-OWNED COMPANIES 2014
BOARD MEMBERS ELECTED BY THE ANNUAL GENERAL MEETING
SURNAME FIRST NAME BORN TITLE BOARD OF DIRECTORS
Khorsand Maria 1957 CEO, SP Sveriges Tekniska Forskningsinstitut SOS Alarm (2009–)
Kihlbom Elizabeth 1954 Consultant Svenska Skeppshypotek (2011–)
Kilsved Hans 1955 Consultant Samhall (2012–2015)
Kjellson Bengt 1956 Director General, Lantmäteriet Swedesurvey (2013–) Chair.
Klingspor Anna 1959 Advisor Lernia (2009–)
Knutson Lottie 1964 Various board assignments Swedavia (2015–)
Kores Agneta 1960 CEO, Familjebostäder Göteborg InfraNord (2009–)/Vasallen (2009–)
Kosonen Mikko 1957 CEO, Sitra TeliaSonera (2013–)
Kozelsky Vladislav Vilorgovich
1976 Unit Manager, City of St Petersburg property committee
Dom Shvetsii (2012–)
Kristiansson Daniel 1974 Desk officer, Ministry of Enterprise and Innovation Green Cargo (2014–)/Vasallen (2012–)
Krondahl Hans 1955 Various board assignments Bilprovningen (2014–)/Orio (2013–)
Kronman Gunvor 1963 CEO, Hanaholmen Dramaten (2009–)
Kupsu Anders 1962 CEO, Diligentia Jernhusen (2013–)
Kvarnbäck Bengt 1945 Industrial Advisor, Altor Equity Partners Swedfund International (2012–)
Kvart Sussi 1956 Senior Advisor/ professional board member Apoteket (2015–)
Kåberger Tomas 1961 Professor, Chalmers University of Technology Vattenfall (2015–)
Källsson Anders 1944 Shipowner Svenska Skeppshypotek (2007–)
Lagercrantz Hanna 1970 Deputy director, Ministry of Enterprise and Innovation Fouriertransform (2013–2015)/LKAB (2010–)/SSC (Svenska rymdaktiebolaget) (2008–)/Swedfund International (2015–)
Lagerqvist Nilsson Monica 1967 Deputy director, Ministry of the Environment Swedesurvey (2004–)
Lahrin Jenny 1971 Deputy director, Ministry of Enterprise and Innovation Göta kanalbolag (2013–)/Swedavia (2012–2015)/Vattenfall (2013–)
Landelius Sven 1946 Various board assignments ESS (European Spallation Source) (2010–) Chair./Infranord (2009–2015)
Landén Eva 1965 CEO, Corem Property Group AB Specialfastigheter (2014–)
Larsson Peder 1957 CEO, Hemtex Apoteksgruppen (2008–)
Larsson Ulf 1955 CEO, Junibacken Göta kanalbolag (2011–)
Leifman Håkan 1963 Director, Swedish Council for Information on Alcohol and Other Drugs (CAN)
Systembolaget (2014–)
Leijonborg Lars 1949 Former Minister and party leader, Swedish Liberal Party (Folkpartiet)
SSC (Svenska rymdaktiebolaget) (2010–)
Lekvall Lotta 1965 CEO, Nätverkstan i Göteborg Operan (2013–)
Lennerwald Ingrid 1948 Member, Executive Committee, Region Skåne SOS Alarm (2007–)
Linander Nina 1959 Self-employed, various board assignments Specialfastigheter (2006–)/TeliaSonera (2013–)
Lindberg Göransson Kerstin 1956 CEO, Akademiska Hus Jernhusen (2014–)
Lindbäck Christina 1963 Sustainability Manager, NCC Miljömärkning Sverige (2010–) Chair.
Linder-Aronson Lars 1953 Various board assignments SEK (2011–) Chair.
Lindgren Bengt-Erik 1950 Various board assignments Inlandsinnovation (2012–2015)
Lindh Ingela 1959 CEO, Stockholmshem Akademiska Hus (2014–)
Lindskog Urban 1965 CEO, Metria Metria (2014–2014)/Teracom Boxer Group (2007–2015)
Lindsö Ebba 1955 Various board assignments SBAB (2012–)
Lingegård Monica 1962 CEO, Samhall AB Orio (2013–)
Lithander Susanne 1961 CFO, BillerudKorsnäs SEK (2015–)
Ljungqvist Leif 1971 Deputy director, Ministry of Enterprise and Innovation Akademiska Hus (2012–)/Apoteket (2012–)/Samhall (2014–)/Statens Bostadsomvandling (2015–)
Lorentzon Martin 1969 Founder, Tradedoubler, Spotify TeliaSonera (2013–)
Lundahl Peter 1966 Self-employed consultant, various board assignments Lernia (2015–)
Lundgren Bo 1947 Self-employed, various board assignments Specialfastigheter (2013–) Chair.
Lundgren Ericsson Jane 1966 Lending Manager, SEK SBAB (2013–)
Lundström Mikael 1961 CEO, NAI Svefa AB Göta kanalbolag (2011–)/Specialfastigheter (2013–)
Låftman Lennart 1945 Director Operan (2006-2015)
Magnus Birger 1955 Former Vice CEO, Schibsted SAS (2013–)
Magnusson Bo 1962 Various board assignments SBAB (2013–) Chair.
Magnusson Johnny 1952 County Director for the opposition, Västra Götaland SOS Alarm (2015–)/ SOS Alarm (2007–2015) Chair.
Mahmood Qaisar 1973 Cultural Heritage Manager, Swedish National Heritage Board
Dramaten (2013–)
Malm Gunnar 1950 Former Director-General, Swedish Transport Administration
Bilprovningen (2013–)
Marlow Cecilia 1960 Various board assignments Svenska Spel (2012–2015)
Marschall Chris 1952 Head of Protocol, Region Skåne Dramaten (2012–2015)
Mattsson Christina 1947 Director, Stiftelsen Nordiska Museet Voksenåsen (2009–)
Mejdell Dag 1957 CEO, Posten Norge AS SAS (2008–)

118 ANNUAL REPORT STATE-OWNED COMPANIES 2014
BOARD MEMBERS ELECTED BY THE ANNUAL GENERAL MEETING
SURNAME FIRST NAME BORN TITLE BOARD OF DIRECTORS
Mellström Lotta 1970 Deputy director, Ministry of Enterprise and Innovation SEK (2011–)/Specialfastigheter (2013–)/Swedavia (2015–)/Swedfund International (2014–2015)
Moberg Jens 1962 Various board assignments PostNord (2013–) Chair.
Moberg Karin 1963 Various board assignments SBAB (2009–)
Mohlkert Renée 1960 Various board assignments Göta kanalbolag (2006–2015)
Mydland Lars 1954 Various board assignments Swedavia (2014–)
Müller Pedersen Hans 1958 Director General, Danish Ministry of Science, Innovation and Higher Education
ESS (European Spallation Source) (2012–)
Mårdsjö Agneta 1959 Regional Business Coordinator, Västra Götaland Region Almi Företagspartner (2013–)
Nilsson Elisabeth 1953 County Governor, County of Östergötland Göta kanalbolag (2011–) Chair.
Nilsson Ingvar 1949 Various board assignments Green Cargo (2015–)
Nilsson Jan-Eric 1957 Director Svenska Skeppshypotek (2012–)
Nilsson Magnus 1961 Chairman of the Board, Svensk Turism AB VisitSweden (2009–)
Nilsson Maria 1957 CEO, 2Secure AB Samhall (2009–)/SOS Alarm (2013–)
Nilsson Ulla 1947 CEO, Swedish Chamber of Commerce, London SEK (2011–)
Nilsson-Ehle Anna 1951 Director, SAFER Vehicle and Traffic Safety Centre Bilprovningen (2007–)
Nordmark-Nilsson Anna-Stina 1956 Various board assignments Sveaskog (2006–)
Nordström Lars G 1943 Various board assignments Vattenfall (2011–) Chair.
Norman Elisabeth 1961 Entrepreneur Inlandsinnovation (2011–2015)
Olofsson Maud 1955 Various board assignments LKAB (2012–2015)
Olson Jan 1950 Various board assignments Arlandabanan Infrastructure (2014–) Ordf./Svedab (2013–)
Olving Lena 1956 CEO, Micronic Mydata SJ (2011–2015)
Orback Pettersson Kia 1959 Partner, Konceptverkstan AB Teracom Boxer Group (2013–) Chair.
Patek Kristina 1969 Industrial Advisor Bilprovningen (2015–)
Paus Annema 1955 Consultant, Wangensten Consulting AB Apoteksgruppen (2014–)
Pehrsson Biljana 1970 CEO, Kungsleden Vasallen (2006–)
Persson Göran 1949 Former Prime Minister Sveaskog (2008–) Chair.
Pettersson Lars 1954 Various board assignments LKAB (2013–)
Pihl Lennart 1950 Various board assignments Green Cargo (2012–) Chair.
Reinius Richard 1967 Senior Advisor, Ministry of Enterprise and Innovation Apoteksgruppen (2015–)/Bostadsgaranti (2013–)/Fouriertransform (2015–)/RISE Research Institutes of Sweden (2013–)/Svevia (2013–2015)
Rennerstedt Kristina 1952 Cultural Attaché, Washington DC Operan (2009–) Chair.
Ringesten Mats 1950 Partner, Neuman & Nydahl Sveaskog (2009-2015)
Rittgård Gunilla 1960 CEO, STS Student Travel Schools AB Apoteksgruppen (2015–)
Rogestam Christina 1943 Commissioner Metria (2011–2015) Chair.
Rolfsen Wenche 1952 Various board assignments APL (Apotek Produktion & Laboratorier) (2010–2015)/
Roxendal Jan 1953 Various board assignments SEK (2007–)
Rydin Charlotte 1968 Chief of Staff, Swedish National Debt Office Fouriertransform (2014–)
Rystedt Fredrik 1963 CFO, SCA Teracom Boxer Group (2013–)
Sachs Daniel 1970 CEO, Proventus Dramaten (2009–) Chair.
Saethre-McGuirk Ellen Marie 1975 Head of Research, University of Nordland Voksenåsen (2011–)
Sahlin Mona 1957 Various assignments Systembolaget (2012–)
Salford Charlotte 1970 CEO, GrowthCap Ltd Swedfund International (2014–)
Salmén Ola 1954 Various board assignments Lernia (2013–)/Svevia (2008–)
Sandström Per Arne 1947 Various board assignments TeliaSonera (2010–)
Sandvik Pia 1964 CEO, Länsförsäkringar Jämtland Akademiska Hus (2011–)/RISE Research Institutes of Sweden (2013–) Chair.
Saxton Brita 1954 Director General, Transport Analysis Statens Bostadsomvandling (2011–)
Schauman Kristina 1965 Various board assignments Apoteket (2009–)
Schur Fritz H. 1951 Chairman, Fritz Schur Group SAS (2008–) Chair.
Sen Satish 1957 Consultant, Kaleidoscope Apoteksgruppen (2014–)
Simonsson Ingegerd 1960 Deputy CEO, NCC Construction Sweden Jernhusen (2012–)
Sjöberg Patric 1964 CEO, Stockholmsmässan VisitSweden (2010–)
Sjöström Eric 1966 Various board assignments Dramaten (2013–2015)
Skoglund Johan 1962 CEO, JM Infranord (2012–)
Skogö Ingemar 1949 Former County Governor, County of Västmanland Swedavia (2010–) Chair.
Skåninger Magnus 1971 Head of Division for State-owned Enterprises PostNord (2014–)
Smith Bo 1947 Chief Negotiator, Danish Ministry of Education ESS (European Spallation Source) (2013–)
Spongh Gunilla 1966 International Business Director, Mekonomen Infranord (2009–)
Staffas Mikael 1965 CFO, Boliden SJ (2013–)
Stafilidis Tasso 1971 Director of Operations, Göteborgs Kulturkalas Dramaten (2015–)
Stalin Lotta 1954 Various board assignments Green Cargo (2012–)
Steen Anitra 1949 Various board assignments PostNord (2013–)/Svenska Spel (2011–) Chair.
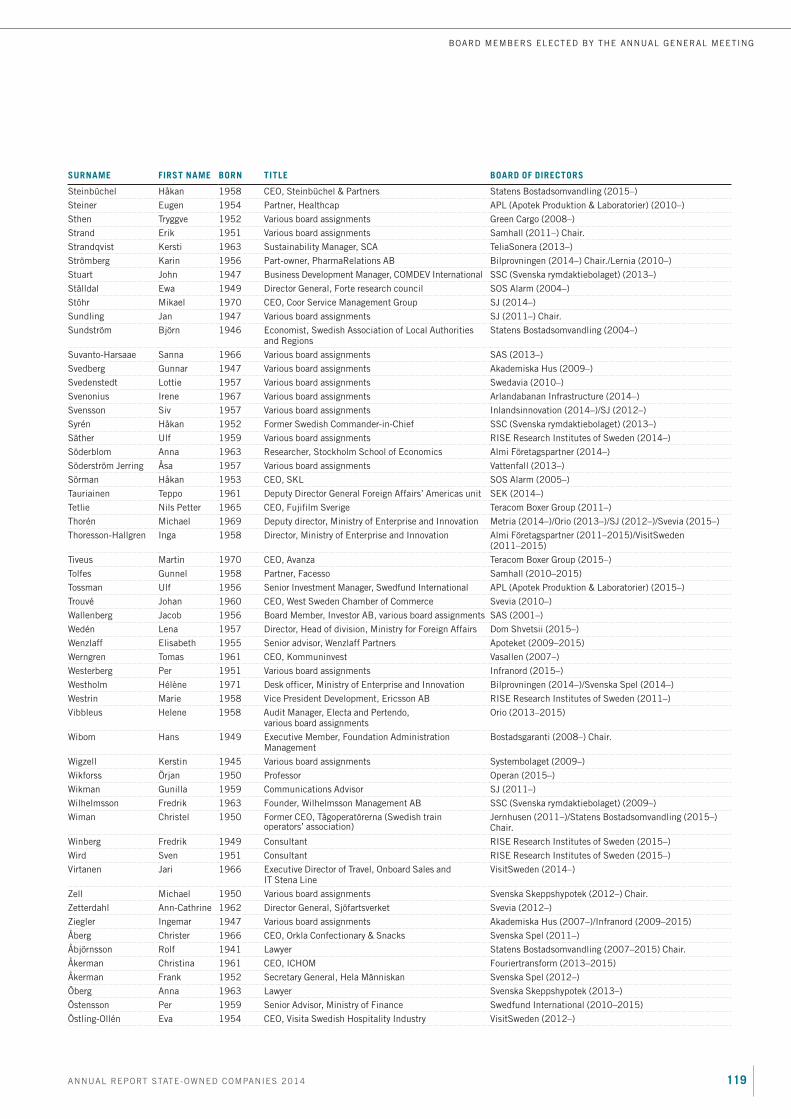
119ANNUAL REPORT STATE-OWNED COMPANIES 2014
BOARD MEMBERS ELECTED BY THE ANNUAL GENERAL MEETING
SURNAME FIRST NAME BORN TITLE BOARD OF DIRECTORS
Steinbüchel Håkan 1958 CEO, Steinbüchel & Partners Statens Bostadsomvandling (2015–)
Steiner Eugen 1954 Partner, Healthcap APL (Apotek Produktion & Laboratorier) (2010–)
Sthen Tryggve 1952 Various board assignments Green Cargo (2008–)
Strand Erik 1951 Various board assignments Samhall (2011–) Chair.
Strandqvist Kersti 1963 Sustainability Manager, SCA TeliaSonera (2013–)
Strömberg Karin 1956 Part-owner, PharmaRelations AB Bilprovningen (2014–) Chair./Lernia (2010–)
Stuart John 1947 Business Development Manager, COMDEV International SSC (Svenska rymdaktiebolaget) (2013–)
Ställdal Ewa 1949 Director General, Forte research council SOS Alarm (2004–)
Stöhr Mikael 1970 CEO, Coor Service Management Group SJ (2014–)
Sundling Jan 1947 Various board assignments SJ (2011–) Chair.
Sundström Björn 1946 Economist, Swedish Association of Local Authorities and Regions
Statens Bostadsomvandling (2004–)
Suvanto-Harsaae Sanna 1966 Various board assignments SAS (2013–)
Svedberg Gunnar 1947 Various board assignments Akademiska Hus (2009–)
Svedenstedt Lottie 1957 Various board assignments Swedavia (2010–)
Svenonius Irene 1967 Various board assignments Arlandabanan Infrastructure (2014–)
Svensson Siv 1957 Various board assignments Inlandsinnovation (2014–)/SJ (2012–)
Syrén Håkan 1952 Former Swedish Commander-in-Chief SSC (Svenska rymdaktiebolaget) (2013–)
Säther Ulf 1959 Various board assignments RISE Research Institutes of Sweden (2014–)
Söderblom Anna 1963 Researcher, Stockholm School of Economics Almi Företagspartner (2014–)
Söderström Jerring Åsa 1957 Various board assignments Vattenfall (2013–)
Sörman Håkan 1953 CEO, SKL SOS Alarm (2005–)
Tauriainen Teppo 1961 Deputy Director General Foreign Affairs’ Americas unit SEK (2014–)
Tetlie Nils Petter 1965 CEO, Fujifilm Sverige Teracom Boxer Group (2011–)
Thorén Michael 1969 Deputy director, Ministry of Enterprise and Innovation Metria (2014–)/Orio (2013–)/SJ (2012–)/Svevia (2015–)
Thoresson-Hallgren Inga 1958 Director, Ministry of Enterprise and Innovation Almi Företagspartner (2011–2015)/VisitSweden (2011–2015)
Tiveus Martin 1970 CEO, Avanza Teracom Boxer Group (2015–)
Tolfes Gunnel 1958 Partner, Facesso Samhall (2010–2015)
Tossman Ulf 1956 Senior Investment Manager, Swedfund International APL (Apotek Produktion & Laboratorier) (2015–)
Trouvé Johan 1960 CEO, West Sweden Chamber of Commerce Svevia (2010–)
Wallenberg Jacob 1956 Board Member, Investor AB, various board assignments SAS (2001–)
Wedén Lena 1957 Director, Head of division, Ministry for Foreign Affairs Dom Shvetsii (2015–)
Wenzlaff Elisabeth 1955 Senior advisor, Wenzlaff Partners Apoteket (2009–2015)
Werngren Tomas 1961 CEO, Kommuninvest Vasallen (2007–)
Westerberg Per 1951 Various board assignments Infranord (2015–)
Westholm Hélène 1971 Desk officer, Ministry of Enterprise and Innovation Bilprovningen (2014–)/Svenska Spel (2014–)
Westrin Marie 1958 Vice President Development, Ericsson AB RISE Research Institutes of Sweden (2011–)
Vibbleus Helene 1958 Audit Manager, Electa and Pertendo, various board assignments
Orio (2013–2015)
Wibom Hans 1949 Executive Member, Foundation Administration Management
Bostadsgaranti (2008–) Chair.
Wigzell Kerstin 1945 Various board assignments Systembolaget (2009–)
Wikforss Örjan 1950 Professor Operan (2015–)
Wikman Gunilla 1959 Communications Advisor SJ (2011–)
Wilhelmsson Fredrik 1963 Founder, Wilhelmsson Management AB SSC (Svenska rymdaktiebolaget) (2009–)
Wiman Christel 1950 Former CEO, Tågoperatörerna (Swedish train operators’ association)
Jernhusen (2011–)/Statens Bostadsomvandling (2015–) Chair.
Winberg Fredrik 1949 Consultant RISE Research Institutes of Sweden (2015–)
Wird Sven 1951 Consultant RISE Research Institutes of Sweden (2015–)
Virtanen Jari 1966 Executive Director of Travel, Onboard Sales and IT Stena Line
VisitSweden (2014–)
Zell Michael 1950 Various board assignments Svenska Skeppshypotek (2012–) Chair.
Zetterdahl Ann-Cathrine 1962 Director General, Sjöfartsverket Svevia (2012–)
Ziegler Ingemar 1947 Various board assignments Akademiska Hus (2007–)/Infranord (2009–2015)
Åberg Christer 1966 CEO, Orkla Confectionary & Snacks Svenska Spel (2011–)
Åbjörnsson Rolf 1941 Lawyer Statens Bostadsomvandling (2007–2015) Chair.
Åkerman Christina 1961 CEO, ICHOM Fouriertransform (2013–2015)
Åkerman Frank 1952 Secretary General, Hela Människan Svenska Spel (2012–)
Öberg Anna 1963 Lawyer Svenska Skeppshypotek (2013–)
Östensson Per 1959 Senior Advisor, Ministry of Finance Swedfund International (2010–2015)
Östling-Ollén Eva 1954 CEO, Visita Swedish Hospitality Industry VisitSweden (2012–)

120 ANNUAL REPORT STATE-OWNED COMPANIES 2014
Puccini’s Madame Butterfly directed by Kirsten Harms was one of two opera premieres presented at Kungliga Operan in 2014.
Photo: Operan

121ANNUAL REPORT STATE-OWNED COMPANIES 2014
COMPANIES’ REPORTING DATES IN 2015
Companies’ reporting dates
COMPANY
ANNUAL GENERAL
MEETING
INTERIM REPORT
JAN–MAR
INTERIM REPORT
JAN–JUN
INTERIM REPORT
JAN–SEP
YEAR-END REPORT
JAN–DEC
Akademiska Hus 28 Apr 2015 28 Apr 2015 15 Jul 2015 28 Oct 2015
Almi Företagspartner 23 Apr 2015 2 Sep 2015 9 Nov 2015 20 Apr 2016
APL (Apotek Produktion & Laboratorier) 23 Apr 2015 15 Aug 2015 15 Feb 2016
Apoteket 14 Apr 2015 24 Apr 2015 17 Jul 2015 23 Oct 2015
Apoteksgruppen 29 Apr 2015 29 Apr 2015 14 Aug 2015 30 Oct 2015
Arlandabanan Infrastructure 28 Apr 2015 13 Aug 2015
Bilprovningen 29 Apr 2015 29 Apr 2015 15 Aug 2015 30 Oct 2015 15 Feb 2016
Bostadsgaranti 27 Feb 2015
Dramaten 22 Apr 2015 15 Sep 2015 1 Apr 2016
ESS (European Spallation Source) 28 Apr 2015 30 Apr 2015 15 Aug 2015 31 Oct 2015 15 Feb 2016
Fouriertransform 22 Apr 2015 23 Apr 2015 17 Jul 2015 29 Oct 2015 16 Feb 2016
Green Cargo 28 May 2015 29 Apr 2015 12 Aug 2015 28 Oct 2015 10 Oct 2015
Göta kanalbolag 20 Apr 2014
Infranord 27 Apr 2015 27 Apr 2015 30 Jul 2015 22 Oct 2015 15 Feb 2016
Inlandsinnovation 28 Apr 2015 28 Apr 2015 17 Jul 2015 23 Oct 2015 15 Feb 2016
Jernhusen 27 Apr 2015 28 Apr 2015 14 Jul 2015 22 Oct 2015 3 Feb 2016
Lernia 28 Apr 2015 28 Apr 2015 17 Jul 2015 23 Oct 2015 11 Feb 2016
LKAB 28 Apr 2015 28 Apr 2015 14 Aug 2015 23 Oct 2015 15 Feb 2016
Metria 27 Apr 2015 28 Apr 2015 24 Jul 2015 30 Oct 2015
Miljömärkning Sverige 27 Apr 2015
Operan 24 Apr 2015 15 Sep 2015 1 Apr 2016
Orio 28 Apr 2015 30 Apr 2015 14 Aug 2015 28 Oct 2015 11 Feb 2016
PostNord 23 Apr 2015 30 Apr 2015 13 Aug 2015 28 Oct 2015 10 Feb 2016
RISE Research Institutes of Sweden 23 Apr 2015 30 Apr 2015 15 Aug 2015 30 Oct 2015 15 Feb 2016
Samhall 23 Apr 2015 23 Apr 2015 14 Aug 2015 23 Oct 2015 29 Feb 2016
SAS 19 Feb 2015 5 Mar 2015 18 Jun 2015 8 Sep 2015 16 Dec 2015
SBAB 22 Apr 2015 23 Apr 2015 17 Jul 2015 22 Oct 2015 5 Feb 2016
SEK 28 Apr 2015 28 Apr 2015 17 Jul 2015 22 Oct 2015 4 Feb 2016
SJ 29 Apr 2015 29 Apr 2015 12 Aug 2015 23 Oct 2015
SOS Alarm 27 Apr 2015 30 Apr 2015 14 Aug 2015 29 Oct 2015 15 Feb 2016
Specialfastigheter 22 Apr 2015 23 Apr 2015 10 Jul 2015 23 Oct 2015
SSC (Svenska rymdaktiebolaget) 24 Apr 2015 30 Apr 2015 14 Aug 2015 30 Oct 2015 15 Feb 2016
Statens Bostadsomvandling 21 Apr 2014 30 Apr 2015 14 Aug 2015 29 Oct 2015 15 Feb 2016
Sveaskog 23 Apr 2015 23 Apr 2015 16 Jul 2015 21 Oct 2015
Svedab 28 Apr 2015 30 Apr 2015 14 Aug 2015 30 Oct 2015
Swedavia 29 Apr 2015 30 Apr 2015 14 Aug 2015 30 Oct 2015 15 Feb 2016
Swedesurvey 24 Apr 2015 15 Feb 2016
Swedfund International 27 Apr 2015 31 Mar 2015 15 Aug 2015 30 Oct 2015 15 Feb 2015
Svenska Spel 22 Apr 2015 22 Apr 2015 20 Jul 2015 22 Oct 2015 31 Jan 2016
Svevia 29 Apr 2015 29 Apr 2015 14 Aug 2015 26 Oct 2015
Systembolaget 23 Apr 2015 27 Apr 2015 14 Aug 2015 27 Oct 2015 15 Feb 2016
TeliaSonera 8 Apr 2015 21 Apr 2015 17 Jul 2015 20 Oct 2015
Teracom Boxer Group 28 Apr 2015 28 Apr 2015 15 Aug 2015
Vasallen 28 Apr 2015 29 Apr 2015 27 Aug 2015 29 Oct 2015 12 Feb 2016
Vattenfall 27 Apr 2015 28 Apr 2015 21 Jul 2015 27 Oct 2015 5 Feb 2015
VisitSweden 21 Apr 2015 31 Aug 2015
Voksenåsen 8 May 2015 20 Apr 2015 20 Aug 2015 20 Oct 2015 1 Mar 2016

122 ANNUAL REPORT STATE-OWNED COMPANIES 2014
THE STATE’S OWNERSHIP POLICY 2015
State-owned companies are ultimately owned by the people of Sweden. On assignment from the Riksdag, the Government is re-
quired to actively manage the state’s holdings in companies in order to ensure the best possible value performance and – where
applicable – to ensure that specifically adopted public policy assignments are performed favourably. The Government considers it
to be of the utmost importance that state-owned companies are proactively and professionally managed with value generation as
an overriding objective. This implies that state-owned companies should act as long-term approach, be efficient and profitable,
while being given the capacity to develop. State-owned companies should serve as role models in the area of sustainable business
and, in other respects, conduct themselves in a manner that generates public confidence. The state-ownership policy constitutes
a key document in clarifying the manner in which the Government considers that this should occur.
In its ownership policy, the Government presents its mandates and objectives, applicable frameworks and position on key fun-
damental issues relating to the governance of the state-owned companies. The state-ownership policy includes the Government’s
guidelines for external reporting and guidelines for terms of employment for senior executives. The state-ownership policy also
requires that the Swedish Code of Corporate Governance be applied.
The state-ownership policy is applied in majority-owned state-owned companies. In respect of other companies in which the
state is a part owner, the state engages in a dialogue with the other owners in an effort to ensure that the ownership policy is ap-
plied. Correspondingly, companies administered by public authorities other than the Government Offices shall apply the state’s
ownership policy.
The State’s Ownership Policy 2015
1. FRAMEWORK FOR STATE OWNERSHIP1.1 The Government’s management mandateThe Government is required to actively manage the state’s assets in the form of shares in state-owned companies in such a manner as to max-imise the long-term value generation and, where appropriate, to ensure that specifically adopted public policy assignments are performed effi-ciently. According to Chapter 9, Section 8, of the Instrument of Government (IG), state assets are at the disposal of and to be managed by the Government, subject to certain exceptions. According to Chapter 9, Section 9 of IG, the Riksdag decides on the principles for managing and disposing over state assets. The provisions on acquisition and transfer of property, including shares and participation rights in companies, are contained in the Budget Act (2011:203). According to Chapter 8, Section 3, of the Budget Act, the Government may not acquire shares or participation rights or in any other way increase the state’s share of the voting power or ownership in a company without a mandate from the Riks-dag. Nor may the Government provide capital to a company without a mandate from the Riksdag. According to Chapter 8, Section 4, second paragraph of the Budget Act, the Government may not, by sale or other means, reduce the state’s share of ownership in companies in which the state holds half or more than half of the votes for all shares without first obtaining a mandate from the Riksdag. In addition to these provisions, a mandate from the Riksdag is required for important changes in the object of the operations of companies. This constitutes the framework for the Government’s mandate for the management of state-owned companies. A Riksdag decision is not required for the payment of dividends, for example, since these form part of the ongoing administration. By virtue of Chapter 7, Section 5 of IG, the prime minister may assign to a minis-ter other than the particular head of ministry responsibility for issues concerning corporate ownership of state-owned companies requiring a unified ownership policy.
1.2 Legislation Subject to the exceptions stated below, state-owned companies are governed by the same laws as those applying to privately owned companies: including the Companies Act, the Annual Accounts Act, the Competition Act, the Book-keeping Act and insider-related legislation. There are no special provisions for state-owned compa-
nies, except that the National Audit Office is entitled to appoint auditors for the companies over which the state has a determining influence and in companies whose operations are subject to statutory regulation. The articles of association stipulate the object of a particular company’s operations, which is to be based on the mandate decided by the Riksdag.
Similar to privately owned companies that operate in a particular sector, the state-owned companies may also be subject to sector-specific legislation, such as the Postal Services Act (2010:1045) and the Electronic Communica-tions Act (2003:389). The work within the Government Offices is divided so that the respon-sibility for such regulations is assigned to units other than the Ministry of Enterprise and Innova-tion’s units– Division for State-owned Enterprises and Division for Corporate Governance and Analysis.
1.3 EU regulations on state subsidiesThe EU’s regulations concerning state subsidies apply to all subsidies granted by the state to both state-owned companies and privately owned companies. The purpose of the rules is to ensure that no member state can distort competition through subsidies that strengthen the competi-tiveness of domestic industry at the expense of companies in another member state. According to the EU’s regulations, the MEIP (Market Econ-omy Investor Principle) or MEO (Market Economy Operator) applies, among other things, to capital infusions in state-owned companies. The MEIP is usually met if capital infusions are provided subject to conditions and terms that would have been accepted by a private investor.
1.4 Reporting of public fundsCompanies that achieve a certain level of annual net sales and that receive public funds or other public benefits are subject to special rules concerning the reporting of financial links. The rules are contained In the Transparency Direc-tive1) and have been incorporated into the Swed-ish legislation in the Insight into Certain Finan-cial Links and related matters Act (2005:590). The rules have been set up to facilitate the EU Commission’s application of the competition
rules of the TFEU on cross-subsidisation, among other things. The funds contributed and the manner in which they are used are to be subject to open reporting. The operations of monopoly companies and other companies with similar special status are also subject to a requirement for separate reporting in cases where such com-panies also conduct operations that are exposed to competition.
1.5 Conflict resolution in competition- limiting public sales operationsState-owned companies in which the state has a direct or indirect controlling interest are subject to a regulation in the Competition Act (2008:579). In response to an action initiated by the Swedish Competition Authority, the Stock-holm City Court may prohibit any such company from applying a particular procedure in a com-mercial or financial operation if it distorts the conditions required for effective competition or development of such competition. The same applies to companies owned by county councils and municipalities. However, this regulation extends beyond the legislation that applies to other companies under the Competition Act.
1.6 Public access to information and confidentialitySince state-owned companies are managed by the Government Offices, which is a state agency, a document that is stored and considered, according to special rules, as received or pre-pared by the Government Offices, may be a public document. Under certain circumstances, the information in a public document may be regarded as confidential. The information may remain confidential to protect the financial interests of the public or of an individual. Some information may comprise sensitive business secrets and could therefore be damaging to the company should it be disclosed. This means that anyone wishing to view a document may request access to information; however, under the Public Access to Information and Secrecy Act (2009:400), the Government Offices must assess the potential damage before releasing any information. The information can usually be released if this is possible without causing damage to the state or the companies to which the information relates.
1) Commission Directive 80/723/EEC of 25 June 1980
on the transparency of financial relations between
Member States and public undertakings as well
as certain undertakings, as amended by Directive
2000/52/EC.

123ANNUAL REPORT STATE-OWNED COMPANIES 2014
1.7 International cooperation and guidelinesSweden has been an active participant in the development of the OECD Guidelines on Corpo-rate Governance of State-Owned Enterprises. The guidelines, which are non-binding, were drafted in 2005 and provide effective support for devel-oping the governance of the state-owned compa-nies in various countries. The Swedish Govern-ment’s principles of corporate governance largely comply with these guidelines. The guidelines can be found at www.oecd.org.
2. CORPORATE GOVERNANCE AND THE RELATIONSHIP BETWEEN OWNER, BOARD AND MANAGEMENT
2.1 The application of the Swedish Code of Corporate Governance (the Code)The Code is to be applied in the state-owned companies in which the state has a controlling interest. In the other companies, the state engages in a dialogue with the other owners to promote the application of the Code. The overall purpose of the Code is to contribute to improved governance of Swedish limited companies and it addresses the decision-making system through which the shareholders directly or indirectly control the company. Its rules focus on the organisation and operational processes of the particular company and the interplay between these areas. The Code should always be applied in accordance with the principle of “comply or explain”. On certain issues, the Government has found reason to justify deviations from the Code, in accordance with the Code’s principle of “com-ply or explain”. The Government’s justification of these deviations is presented below.
2.2 Annual General MeetingThe annual general meeting is the company’s highest decision-making body and the forum in which the shareholders formally exercise their influence.
In addition to the provisions of the Companies Act and the Code, the following principles apply to the general meetings of state-owned compa-nies. Members of the Riksdag are entitled to attend the annual general meetings of companies in which the state owns at least 50 per cent of the shares, provided that the company or an operating subsidiary has more than 50 em ployees. It is the responsibility of the board to ensure that the official notice of the time and location of the annual general meeting is sent to the central office of the Riksdag in conjunction with the issuance to shareholders of the official notice to attend the meeting. Members of the Riksdag who wish to attend the annual general meeting must pre-register their intent with the board and this pre-registration should be received by the board not later than one week prior to the annual general meeting.
The general public should be invited to attend the annual general meeting of state-owned companies. Advance notice of attendance must be received at least one week prior to the meet-ing. State-owned companies should organise some form of arrangement in conjunction with their annual general meetings enabling the public to put questions to the companies’ man-agement.
The annual general meeting of state-owned companies must take place before 30 April and any dividend is to be distributed no later than two weeks after the particular annual general meeting.
2.2.1 Appointment of auditors The auditors’ assignment of independently examining the administration of the boards of
directors and CEOs, as well as company annual accounts and accounting records is a core con-cern of the state as owner. The responsibility for appointing auditors is always that of the owner and auditors are elected at the annual general meeting. As of 2011, auditors are appointed for a term of year. However, this does not apply to the National Audit Office’s auditors, whose assignment is mandated by the Auditing of State Activities etc. Act (2002:1022). The National Audit Office is entitled to appoint one or more auditors in companies over which the state has a controlling influence. The Government Offices’ officials monitor the process for the procurement of auditing services, which is conducted by the company, from procurement criteria to selection and evaluation. Should the reappointment of the auditors be considered, the auditors’ work is always evaluated by the owner.
2.3 Articles of associationThe owner establishes the object of the com-pany’s operations and certain stated frameworks through the articles of association. In state-owned companies, the objectives of the opera-tions are based on the assignment resolved by the Riksdag. The Government Offices provide a template for the articles of association of state-owned companies. This template is based on rules contained in the Swedish Companies Act for listed companies, the Code and the state ownership policy.
2.4 Owner instructionsIn state-owned companies, owner instructions are essentially only applied when the company has specifically adopted public policy assign-ments, receives government subsidies, is in the process of restructuring or re-regulation, or in the event of deregulations or other material changes. The content of owner instructions should be relevant, specific and clear and be formally adopted by decisions at the annual general meeting. Where an assignment is conveyed through owner instructions, these shall clearly stated how the assignment is financed, reported and monitored.
2.5 Public policy targets for companies with specifically adopted public policy assignmentsCertain state-owned companies have specifically adopted public policy assignments. When the Riksdag commissions a company to conduct operations serving to generate effects other than a financial return for the owner, this constitutes a specifically adopted public policy assignment. In certain cases, operations within the framework of a specifically adopted public policy assignment are financed partly through appropriations in the state budget. To assess and monitor how the specifically adopted public policy missions are performed, public policy targets are set where relevant. The purpose of setting public policy targets for the companies is to
policy assignment are performed well,-
cally adopted public policy assignments,
and other stakeholders, and to
targets.
The points of departure on which the public
policy targets are determined include the
purpose of the company’s operations, that is,
what the desirable effects of the Company’s
operations are. Since a company’s opportunities to perform a
specifically adopted public policy assignment and to generate returns are mutually dependent, public policy targets and financial targets are normally prepared as an integrated project. With an integrated project, the level of ambition regarding the public policy targets can be weighed against the cost in terms of the effects on risk and return implied by a certain level in the public policy targets.
Public policy targets are determined by the General Meeting through an owner instruction to the company. Follow-ups are performed by means of a dialogue between representatives of the owner and the chairman of the board, whereby the outcome in relation to the public policy targets and the board of directors’ view of these are discussed, as are any measures planned for achieving the objectives. Follow-up is coordinated with the monitoring of the financial targets.
2.6 Financial targets in state-owned companiesThe owner’s purpose in setting financial targets is to
and management working towards long-term, ambitious and realistic goals,
of equity,-
able level,
sustainable and predictable dividends that take the company’s future capital requirements and financial position into account, and
evaluate profitability, efficiency and risk level.
The financial targets are defined primarily according to the following categories:
capital, return on equity or operating margin)
or equity/assets ratio)
An important basis for establishing the financial targets is the owner’s cost of equity as this figure ultimately determines whether the state, in its capacity as owner, receives reasonable compen-sation at market level for the risk-taking involved in company ownership. The cost of equity serves as a floor for the profitability target, since a return that is systematically below the cost of capital entails the destruction of value for the state as owner. The cost of equity also affects the optimal capital structure since it depends on the relationship between the cost of equity and borrowed capital at different levels of debt. The cost of equity also indirectly affects the dividend, since this cost is a key component in assess-ments of a company’s future investments. In turn, these investments and their contribution to value creation are of vital importance to deter-mining the proportion of the generated profits that should be reinvested and thus for the size of the dividend that can be distributed.
Other key data used in determining targets include analyses of risks and opportunities within the seven areas of sustainable business defined in paragraph 3.1, analyses of the market in which the company operates, comparisons with other companies and analyses of the company’s business plan and history. Finally, stress tests are conducted to assess the targets’ sensitivity in terms of various external and internal factors.
The financial targets are approved by the annual general meeting and are to be docu-mented directly in the minutes. The financial
THE STATE’S OWNERSHIP POLICY 2015
124 ANNUAL REPORT STATE-OWNED COMPANIES 2014
THE STATE’S OWNERSHIP POLICY 2015
targets adopted apply until new/changed targets are adopted at an annual general meeting. Monitoring is performed by means of a dialogue between representatives of the owner and the chairman of the board, whereby the outcome in relation to the financial targets and the board of directors’ view of this are discussed, as are possible actions that may be planned to achieve the targets in a forward-looking perspective. Should external conditions, such as the interest-rate scenario and profitability at a sector level, change significantly and in a lasting manner, the need to revise the targets may be discussed.
2.7 Guidelines2.7.1 External reporting Key words for the governance of state-owned companies are: transparency, active ownership and good order and organisation. State-owned companies are ultimately owned by the Swedish people collectively, which calls for transparent and professional communication of information. In addition to accounting legislation and generally accepted accounting principles, each state-owned company must present – as applic-able – an annual report, interim reports and a year-end report, in accordance with the rules that apply to public listed companies.
The Government adopted the current guide-lines for the external reporting of state-owned companies on 29 November 2007. This report-ing is to provide a comprehensive description of the state-owned companies’ operations as well as basic data for ongoing monitoring and evaluation of the companies’ operations and established goals. The guidelines include information disclo-sure relating to sustainability information; see section 3 below. The Government has highly ambitious targets in respect of external reporting.
These guidelines impose clear requirements on reporting and accounting of the company’s work on sustainable business. The Government views the requirement for sustainability reporting as a tool for good transparency. In accordance with the guidelines, state-owned companies are subject to extended reporting requirements regarding sustainability and must, among other things, apply the GRI’s international guidelines in the publication of their sustainability reports.
2.7.2 Remuneration of senior executivesThe current Government guidelines on terms of employment for senior executives in state-owned companies were adopted on 20 April 2009. Reasonable remuneration is important for main-taining confidence in the business sector as a whole and, from the viewpoint of the Govern-ment, it constitutes a key component of corpo-rate governance. The boards are responsible for determining remuneration for the CEO. It is important that the boards deal with issues con-cerning remuneration of senior executives in a deliberate, responsible and transparent manner and that the boards assure themselves that the total remuneration is reasonable and well-consid-ered. It should also be competitive, capped and appropriate, while contributing to high ethical standards and a good corporate culture. Remu-neration paid should not be wage-leading in relation to comparable companies but be charac-terised by moderation. The remuneration princi-ples in the guidelines are also to serve as guid-ance for other employees.
2.8 About the Board of Directors2.8.1 Responsibilities of the Board of DirectorsThe board is responsible for ensuring that the companies in which the state has a participating interest are managed in an exemplary manner within the framework provided by legislation, the
company’s articles of association, any additional owner instructions and the state-ownership policy. Work aimed at ensuring public confidence in the operations includes establishing relevant policy documents for the operations, such as a code of conduct with such aims as assuring the economi-cal use of all resources in the business and that the special status often enjoyed by state-owned companies is not abused, as well as annual assessments of applicable policy documents and associated follow-up and compliance processes.
2.8.2 Board nomination processThe Government’s aim is for the boards to con-tain a high level of expertise that is well matched to the operations, situation and future challenges of their particular companies. Board members are expected to be persons of high integrity that match the demands for good judgment that may be expected of representatives of the state.
For state-owned companies that are not pub-licly listed, the following principles replace the Code rules pertaining to the preparation of decisions and the nomination of board members and auditors.
These companies are required to apply unified and common principles designed to ensure the achievement of a structured board nomination process. The purpose is to ensure the efficient provision of expertise to the companies’ boards. In publicly listed companies in which the state has a significant participating interest, the Government appoints one member of each nomination committee. The nomination commit-tee is primarily a preparatory body serving the annual general meeting in nomination issues.
The board nominating process is coordinated by the Ministry of Enterprise and Innovation at the Government Offices. For each company, the required expertise is analysed on the basis of the company’s operations, situation and future challenges, and of the board’s composition and the implemented evaluation of the board. Any recruitment requirement is then determined, and the recruitment process initiated.
2.8.3 Board compositionThe starting point for any nomination of a board member must be the requirement of expertise relevant to the board. It is important that the board’s composition be such that the board always possesses the industry knowledge or other expertise directly relevant to the company, even when the company is undergoing development and its business environment is changing. Since sustainable business is an important issue for the state as owner, it is essential that the board has the capacity to work strategically in this area. To be considered for a board position, the candi-date must possess a high level of expertise relevant to current business operations, business development, industry affiliation, financial issues or other appropriate areas. Additional require-ments include outstanding integrity and an ability to see to the company’s best interests. Every board member must be able to indepen-dently assess the company’s operations.
To ensure that the boards of directors are efficient, the number of board members should be between six and eight people. The Govern-ment’s intention is to have only regular members on the boards of directors and no deputies. When necessary, a vice chairman may be elected by the annual general meeting. The composition of every board must also be such that balance is achieved in respect of background, area of expertise, experience and gender. Aspects of diversity, including ethnic and cultural back-ground, are also to be considered in the compo-sition of the boards. The Government is endeav-
ouring to achieve an even gender distribution, with the aim that the proportion of both women and men be at least 40 per cent.
The selection of members is made from a broad recruitment base with a view to making use of the expertise of women and men, as well as individuals with different backgrounds and experiences. Discrimination based on gender, cross-gender identity or expression, ethnic affilia-tion, religion or other belief, disability, sexual preference or age is not permissible. When the process has been completed, nominations are made public pursuant to the Code. Throughout the nomination process, quality is assured by a cohesive and systematic approach.
2.8.4 Board members’ independenceAs regards the independence of board members, it is a fundamental requirement, according to 2.8.3 above, that a board member possess a high level of integrity. A member is not permitted to be so dependent on the company or its man-agement that such independence may be ques-tioned. One deviation from the Code in terms of the independence of board members is that board members’ independence in relation to the state as a major shareholder and in relation to the company and its management need not be reported. The Code is mainly aimed at compa-nies with diverse ownership. In this regard, the requirements of the Code are mainly intended to protect minority shareholders. For wholly state-owned companies and partially state-owned companies with few shareholders, there is there-fore no reason to report this form of independ-ence. In publicly listed companies in which the state has a participating interest, elected board members’ independence in relation to the state shareholder as well as the company is reported.
2.8.5 Chairman of the boardThe chairman of the board is elected by the annual general meeting. The special role of the chairman of the board is dealt with in the Code and the Companies Act.
The special tasks that the chairman of the board has to perform when working on the board are stipulated in the formal work procedures of the board. One such special task is coordination responsibility. Whenever the company is faced with particularly important decisions, the board of directors shall, through its chairman, coordi-nate in writing its view with that of the repre-sentatives of the owner. It is incumbent upon the board to decide the cases in which such align-ment via the chairman is required ahead of a particular board decision.
2.8.6 Board procedures It is the responsibility of every board to assess the need to appoint special committees. Should a committee be appointed, its activities are to be guided by the principles of the Code. Other aspects of the board procedures are also to be guided by guided by the principles of the Code. In state-owned companies, the right to sign for the company should, however, be exercised exclusively by two or more persons jointly, of whom at least one person is to be a board mem-ber or the CEO.
2.8.7 CEOOne of the principal tasks of the board is to appoint, evaluate and, when necessary, dismiss the CEO. According to the Code, the CEO may be a member of the board but may not be its chair-man. Because the Government regards it as important that the roles of the board and the CEO be distinguished, the CEO must not be a member of the Board.

125ANNUAL REPORT STATE-OWNED COMPANIES 2014
2.8.8 Evaluation of the boardsBoard performance must be evaluated annually. According to the Code, it is the task of the chairman of the board to ensure that the evalu-ation is carried out and that the nomination committee is informed of the results of the evaluation.
In wholly state-owned companies, it is the Government Offices that is to be informed of the results of the evaluation. The Government Offices’ involvement in the board nomination process also includes a separate and ongoing evaluation of the boards of all state-owned companies.
2.8.9 Board feesBoard members are compensated for their effort and for the responsibility that the board assign-ment entails. Fees paid to the board chairman, any vice chairman and other members are to be resolved by the annual general meeting. Fees to board members who participate in specially appointed committees within the board of direc-tors are also to be resolved by the annual general meeting. For fees to the paid for service on a committee, the work involved must be of a significant extent. Fees paid for committee work may be adjusted in periods of high work load for a limited period. As a rule, employees of the Government Offices who are board members in state-owned companies are not paid board or committee fees by those companies. In excep-tional cases, however, a fee may be paid to an employee of the Government Offices following a decision by the annual general meeting.
If the fee for work on the board or a committee is invoiced by a member within the framework of business activity conducted as part of a sole proprietorship with a corporate (F) tax card or through the member’s own limited company, it should be stated in conjunction with the general meeting considering fees that statutory employ-er’s social security contributions are to be paid to the board member’s sole proprietorship or limited company in addition to the approved fee. Any agreement with a board member’s sole pro-prietorship with a corporate (F) tax card or limited company regarding invoicing of board or committee fees shall be cost-neutral for the company paying those fees.
Situations are to be avoided whereby board members or their deputies are engaged as con-sultants to the company and thereby receive consultancy fees in addition to their board fees. If this nevertheless occurs, the assignment must be determined by the board in every individual case, be clearly discernible from ordinary work on the board, apply for a limited time and be governed by an agreement between the company and the board member. Principles for consul-tancy fees are to be subject to the annual general meeting’s approval of the board’s proposed guidelines for remuneration of senior executives.
In preparation for the annual general meet-ing’s decision on board fees, an analysis is to be made whereby the level of fees is compared with the fees paid by other comparable companies. The fees must be competitive, but not market-leading. There is nothing to prevent the general meeting from approving remuneration to employee representatives. However, the principle among state-owned companies is that such compensation is not paid.
3 SUSTAINABLE BUSINESS3.1 Purpose and definitionTo promote long-term sustainable value growth in state-owned companies, sustainable business is integrated into corporate governance. State-
owned companies should act as role models within the area of sustainable business and should otherwise behave in a manner that instils public confidence.
The Government’s work on sustainable busi-ness is based on the Brundtland Commission’s original definition of sustainable development from 1987: Sustainable development is develop-ment which meets the needs of current genera-tions without compromising the ability of future generations to meet their own needs. Sustain-able business includes the areas of environment, human rights, working conditions, anti-corruption and business ethics as well as gender equality and diversity. Companies’ acceptance of respon-sibility in the field of sustainable business contributes to their competitiveness. The integra-tion of sustainability issues into operations is thus a self-evident component of a long-term business strategy and development. The compa-nies’ work on sustainable business is monitored integrated with other owner issues or by means of dialogue between representatives of the owner and the company.
3.2 Act as role models 3.2.1 IntroductionThe state-owned companies shall act as role models with regard to sustainable business, meaning, in particular, that they shall
their business strategies and establishing strategic sustainability targets;
risks and opportunities and pursue an active dialogue with the company’s stakeholders in society;
organisations,
area.
The points above are elaborated further under 3.2.2–3.2.5.
The Government considers work on the envi-ronment and climate to be important and acts to ensure that the generation target and environ-mental quality targets approved by the Riksdag are achieved. State-owned companies are to act as role models within the area of environment, meaning, among other things that the companies should strive to reduce their environmental and climate impact through sustainable and non-toxic use of resources.
The overarching objective of the Government’s work to foster diversity is to generate value for Swedish society by deriving benefit from compe-tence and experience from all of society. No discrimination may occur based on gender, cross-gender identity or expression, ethnic affiliation, religion or other belief, disability, sexual prefer-ence or age in relation to employees, business partners, customers and suppliers, or others with whom the companies come into contact. State-owned companies shall take aspects of diversity into account in their operations and personnel policies.
State-owned companies should be role models in gender equality work. The Government regards it as an ongoing and urgent priority to derive benefit from the expertise and experience of both women and men. This applies in particular to companies managerial appointments. The Gov-ernment places considerable importance on increasing the percentage of women in executive management positions. Just as the state in its capacity as owner promotes even gender repre-sentation on its boards of directors, it is essential that state-owned companies steer development
towards more balanced gender representation at senior management positions. State-owned companies shall, even in other regards, work actively on issues of equality throughout their operations.
One way of acting as a role model within the areas of anti-corruption and business ethics is to comply with the Code regarding gifts, rewards and other benefits in business established by the Swedish Anti-Corruption Institute.
3.2.2 Working strategicallyBased on the sectors and markets within which they operate, it is important that companies identify and manage risks and business opportu-nities in the area of sustainable business. State-owned companies should have a well-considered and broadly accepted policy and strategy, as well as established strategic targets in the area of sustainable business. The targets should be few in number, comprehensive and relevant to the company’s business operations and sustainability challenges and, where applicable, relevant to the company’s specifically adopted public policy assignment. The targets should also be long term, challenging and monitorable, while being distinct and easy to communicate. It is the responsibility of the board to establish targets and strategies for the company’s work on sustain-able business. 3.2.3 Transparent behaviourBy maintaining an open and constructive dia-logue with its major stakeholders the state-owned companies act transparently with regard to risks and opportunities in the area of sustainable business and how the companies are working to handle them. Furthermore, state-owned compa-nies are to communicate their work on sustain-able business both externally and internally. In the Government’s guidelines for external report-ing, adopted in 2007, clear requirements are set out for reporting and accounting for the compa-nies’ work on sustainable business.
3.2.4 CooperationTo promote exchange of knowledge and effi-ciency in work in the area of sustainable busi-ness, state-owned companies are expected to work actively in the area, both in their own opera-tions and in cooperation with business partners, customers, suppliers and other stakeholders. 3.2.5 Compliance with international guidelinesThe state-owned companies shall work to foster compliance with international guidelines regard-ing environmental consideration, human rights, working conditions, anti-corruption and business ethics. The Government has identified the follow-ing international principles and policies that are essential for the state-owned companies to follow; the ten principles in the UN’s Global Compact, the UN Guiding Principles for Busi-ness and Human Rights, and the OECD Guide-lines for Multinational Enterprises. These princi-ples and guidelines are based on international conventions and agreements and have been formulated in collaboration between states, companies, labour organisations and other stakeholders with the purpose of providing the business sector guidance in the handling of risks and business opportunities in the area of sustain-able business.
Appendix 1 Guidelines for external reporting
Appendix 2 Guidelines for terms of employment for senior executives
THE STATE’S OWNERSHIP POLICY 2015

126 ANNUAL REPORT STATE-OWNED COMPANIES 2014
GUIDELINES FOR EXTERNAL REPORTING
The Government adopted the following guidelines for external reporting by state-owned companies on 29 November 2007. These
replace the previous guidelines adopted in 2002. The guidelines have been supplemented with expanded and clearer information
requirements regarding sustainability. The state-owned companies are subject to the same laws as privately owned companies,
inter alia, the Companies Act, the Bookkeeping Act and the Annual Accounts Act. These guidelines complement the current
accounting legislation and generally accepted accounting principles. The companies must present their reports in accordance
with these guidelines as of the fiscal year that began on 1 January 2008.
Guidelines for external reporting
INTRODUCTIONThe state is a significant company owner in
Sweden. The companies represent considerable
values and are ultimately owned by the Swedish
people collectively, which calls for transparent
and professional communication of information.
COMMUNICATION OF INFORMATION Key words for the Government’s administration of
the companies are: transparency, active owner-
ship and good order and organisation. The over-
arching governance objective is that these com-
panies should create value and, where applicable,
comply with the societal interests. The external
reporting of the state-owned companies, which
includes the annual report, interim reports, the
corporate governance report, the statement on
internal control and the sustainability report, are
to be as transparent as the reporting of listed
companies. This reporting is to provide a compre-
hensive description of the state-owned compa-
nies’ operations as well as basic data for ongoing
monitoring and evaluation of the companies’
operations and established goals. The Govern-
ment will assess compliance with the guidelines
for external reporting for state-owned companies,
which will be reported in the Government’s
annual report on state-owned companies to the
Riksdag. A responsible and professional owner
should, among other tasks, assume responsibility
for issues relating to sustainable development,
such as ethical issues, the environment, human
rights, gender equality and diversity. All compa-
nies bear this responsibility, but the state-owned
companies must set an example and be at the
leading edge of this work. The Government is
reinforcing its ambitious stance in this field and,
through these guidelines, is imposing clearer
demands for reporting and accounting. According
to the state-ownership policy, the boards of the
state-owned companies are responsible for mat-
ters relating to ethical issues, the environment,
human rights, gender equality and diversity. That
the companies have a well-considered strategy for
these sustainability issues is an integral part of
the Government’s ownership policy. This work is
to be communicated both internally and exter-
nally. Sustainability reports are a tool for driving
sustainable development activities forward by
working systematically with clear reporting and
monitoring. The boards of the state-owned com-
panies are responsible for ensuring that compa-
nies presenting sustainability reports in accord-
ance with Global Reporting Initiative (GRI) guide-
lines which, together with other financial reports,
form an integrated basis for assessment and
monitoring. The GRI guidelines are international
regulatory guidelines for sustainability reports.
APPLICATION OF THE GUIDELINES State-owned companies are required to apply
these guidelines. In those cases where the state
is one of a number of joint owners, the Govern-
ment intends, in consultation with the company
and the other owners, to endeavour for these
Risks and risk management, opportunities and
threats, sensitivity analysis that describes the
main financial risks of the company.
non-financial risks and uncertainty factors of
importance for understanding the company’s
result, position and future prospects.
Investments, acquisitions and important events
that have taken place during the fiscal year and
after its end.
The operations of the company in research and
development.
The work of the board and its composition
during the year.
Remuneration of senior executives and descrip-
tion of the incentive programme.
In addition, the annual report is to include a
report on or information about:
The financial targets and non-financial objec-
tives, the dividend policy adopted, operational
objectives and compliance with targets and
objectives.
The company’s ethical principles, code of
conduct and gender equality policy.
The company’s work on matters relating to
sustainability, including work on gender equal-
ity, diversity and ethics.
The Government’s commission to the company,
objectives related to the commission and
measurement of fulfilment of these objectives
through, for example, customer surveys. These
commissions may be formulated in different
ways for different companies, inter alia, in
government bills, Riksdag communications,
committee reports, Swedish Government
Official Reports (SOUs) and articles of associa-
tion.
The company’s work to comply with the govern-
ment guidelines and the policies that affect all
state-owned companies, such as the ownership
policy, these guidelines and the guidelines for
terms of employment for senior executives.
Sustainability Report A sustainability report in accordance with the GRI
guidelines is to be published on the respective
company’s website in conjunction with publica-
tion of the company’s annual report. The sustain-
ability report may either be a separate report or
an integrated part of the annual report document.
A sustainability report in accordance with the GRI
guidelines includes:
A report and brief analysis of the sustainability
issues regarded as important for the company,
plus the associated reasons.
Transparent reporting of the risks and opportu-
nities in respect of sustainability issues, par-
ticularly such non-financial risks and opportu-
nities required in order to understand the
company’s development, results and position.
Transparent reporting of implemented stake-
holder analyses and stakeholder dialogues in
order to identify and take a position in relation 1) Name changed to NASDAQ OMX Stockholm Aktiebolag.
guidelines to also be applied in the jointly owned
companies.
These guidelines are based on the principle of
“comply or explain,” which means that a com-
pany can deviate from the guidelines if a clear
explanation and justification of this departure is
provided. This design enables the guidelines to
be applicable and relevant to all companies,
regardless of size or industry, without having to
abandon the main purpose of the accounting and
reporting. The board is required to describe in the
annual report how the guidelines have been
applied during the past fiscal year and to com-
ment on any deviations.
RESPONSIBILITIES The boards of the state-owned companies are
responsible for ensuring that the companies’
accounting and reporting comply with these
adopted guidelines. The companies are to start
reporting in accordance with the guidelines as
soon as possible and not later than the fiscal year
that began on 1 January 2008. In addition to
current accounting legislation and generally
accepted accounting principles, in appropriate
parts, the boards of the state-owned companies
are responsible for ensuring that the companies
present the annual report, interim reports and
year-end reports in accordance with the rules of
OMX Nordic Exchange Stockholm AB1) in the
listing agreement. This also means that the
companies are required to present a corporate
governance report and a statement on internal
control in accordance with the Swedish Code for
Corporate Governance.
The companies are also to comply with the
requirements in the Insight into Certain Financial
Links and Related Matters Act (2005:590).
Furthermore, the boards are responsible for
ensuring that the companies present a sustain-
ability report in accordance with the GRI guide-
lines. The regulatory framework to which the
companies are subject is changed and updated
continuously. The state-owned companies are
expected to monitor developments and changes
in legislation, standards and recommendations as
these occur. The board must monitor develop-
ments and decide without delay on relevant
measures resulting from these changes.
PRINCIPLES FOR EXTERNAL REPORTING AND RESPONSIBILITY FOR REPORTING
Annual Report In the annual report, the state-owned companies
must, in accordance with to the Annual Accounts
Act (1995:1554), inter alia, provide a fair picture
of the development of the company’s business
activities, position and result in accordance with
laws and usual practice. This includes, for
example:
Business concept, strategy, business activities,
market, customers and competitors and organi-
sation.
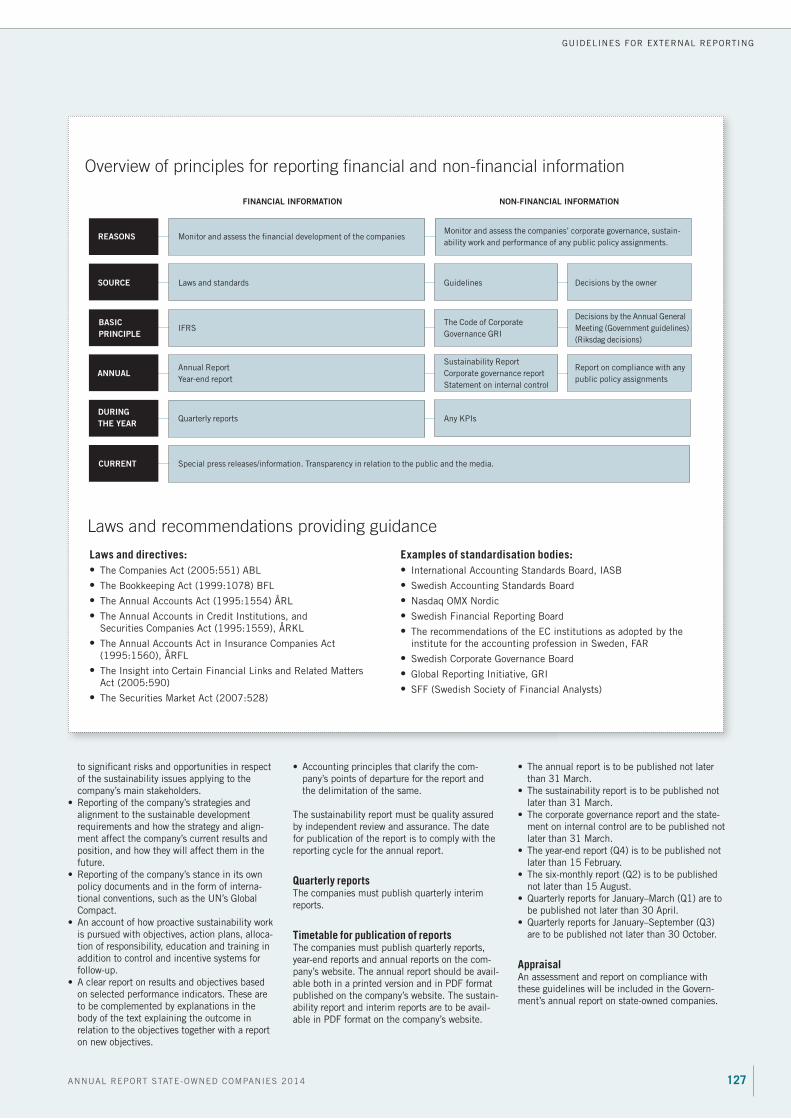
127ANNUAL REPORT STATE-OWNED COMPANIES 2014
GUIDELINES FOR EXTERNAL REPORTING
The annual report is to be published not later
than 31 March.
The sustainability report is to be published not
later than 31 March.
The corporate governance report and the state-
ment on internal control are to be published not
later than 31 March.
The year-end report (Q4) is to be published not
later than 15 February.
The six-monthly report (Q2) is to be published
not later than 15 August.
Quarterly reports for January–March (Q1) are to
be published not later than 30 April.
Quarterly reports for January–September (Q3)
are to be published not later than 30 October.
Appraisal An assessment and report on compliance with
these guidelines will be included in the Govern-
ment’s annual report on state-owned companies.
to significant risks and opportunities in respect
of the sustainability issues applying to the
company’s main stakeholders.
Reporting of the company’s strategies and
alignment to the sustainable development
requirements and how the strategy and align-
ment affect the company’s current results and
position, and how they will affect them in the
future.
Reporting of the company’s stance in its own
policy documents and in the form of interna-
tional conventions, such as the UN’s Global
Compact.
An account of how proactive sustainability work
is pursued with objectives, action plans, alloca-
tion of responsibility, education and training in
addition to control and incentive systems for
follow-up.
A clear report on results and objectives based
on selected performance indicators. These are
to be complemented by explanations in the
body of the text explaining the outcome in
relation to the objectives together with a report
on new objectives.
Accounting principles that clarify the com-
pany’s points of departure for the report and
the delimitation of the same.
The sustainability report must be quality assured
by independent review and assurance. The date
for publication of the report is to comply with the
reporting cycle for the annual report.
Quarterly reports The companies must publish quarterly interim
reports.
Timetable for publication of reports The companies must publish quarterly reports,
year-end reports and annual reports on the com-
pany’s website. The annual report should be avail-
able both in a printed version and in PDF format
published on the company’s website. The sustain-
ability report and interim reports are to be avail-
able in PDF format on the company’s website.
Overview of principles for reporting financial and non-financial information
NON-FINANCIAL INFORMATION FINANCIAL INFORMATION
Laws and directives:
The Companies Act (2005:551) ABL
The Bookkeeping Act (1999:1078) BFL
The Annual Accounts Act (1995:1554) ÅRL
The Annual Accounts in Credit Institutions, and
Securities Companies Act (1995:1559), ÅRKL
The Annual Accounts Act in Insurance Companies Act
(1995:1560), ÅRFL
The Insight into Certain Financial Links and Related Matters
Act (2005:590)
The Securities Market Act (2007:528)
Examples of standardisation bodies:
International Accounting Standards Board, IASB
Swedish Accounting Standards Board
Nasdaq OMX Nordic
Swedish Financial Reporting Board
The recommendations of the EC institutions as adopted by the
institute for the accounting profession in Sweden, FAR
Swedish Corporate Governance Board
Global Reporting Initiative, GRI
SFF (Swedish Society of Financial Analysts)
Laws and recommendations providing guidance
Monitor and assess the financial development of the companies
Laws and standards
IFRS
Annual Report
Year-end report
Quarterly reports
Guidelines
The Code of Corporate
Governance GRI
Sustainability Report
Corporate governance report
Statement on internal control
Monitor and assess the companies’ corporate governance, sustain-
ability work and performance of any public policy assignments.
Decisions by the owner
Decisions by the Annual General
Meeting (Government guidelines)
(Riksdag decisions)
Report on compliance with any
public policy assignments
Any KPIs
Special press releases/information. Transparency in relation to the public and the media.
REASONS
SOURCE
BASIC
PRINCIPLE
ANNUAL
DURING
THE YEAR
CURRENT

128 ANNUAL REPORT STATE-OWNED COMPANIES 2014
GUIDELINES FOR TERMS OF EMPLOYMENT FOR SENIOR EXECUTIVES
Guidelines for terms of employment for senior executives
On 20 April 2009, the Government adopted the following guidelines for terms of employment for senior executives in state-owned
companies.
INTRODUCTIONThe state is a significant company owner in
Sweden. The state bears a substantial responsi-
bility to be an active and professional owner. The
Government manages the state-owned companies
and its overarching objective is that these compa-
nies should create value and, where applicable,
comply with the special societal interests. Rea-
sonable and well-considered remuneration of
senior executives is a key part of achieving this
objective. Reasonable remuneration is also
important for confidence in the business sector
as a whole.
The Government’s governance of the state-
owned companies is to be both transparent and
clear. Accordingly, the external reporting of the
state-owned companies is to be at least as trans-
parent as that of listed companies in this regard.
This also applies to the remuneration of senior
executives.
It is important that boards deal with issues
relating to remuneration of senior executives in a
deliberate, responsible and transparent way and
that the boards ensure that the total remunera-
tion is reasonable, characterised by moderation
and contributes to high ethical standards and a
sound corporate culture.
The Government will monitor and evaluate
compliance with these guidelines. The appraisal
is intended to examine how companies have
applied the guidelines and fulfilled the remunera-
tion principles in the guidelines. This evaluation
will be reported in the Government’s annual
submission to the Riksdag with the report on
state-owned companies.
AREA OF APPLICATION These guidelines replace the Government’s
previous Guidelines for Terms of Employment for
Senior Executives in State-owned Companies (3
July 2008). The board is responsible for renego-
tiation of existing contracts with senior executives
with variable salaries so that they accord with
these guidelines. Other existing contracts with
senior executives that conflict with these guide-
lines should be renegotiated.
The guidelines are a component of the state-
ownership policy1) and apply to companies in
which the state has a controlling influence
through its ownership in a manner corresponding
to the provisions made in Chapter 1, Section 11,
of the Companies Act (2005:551). Furthermore,
these companies must apply the guidelines in
their subsidiaries. In other companies in which
the state is a joint owner, either directly or
through a company, the Government or the
company, respectively, should endeavour for the
guidelines to be applied to the greatest possible
extent in dialogue with the owners.
THE BOARD’S AREA OF RESPONSIBILITY In the same way as in listed companies, the
boards of the state-owned companies are required
to propose guidelines for remuneration of senior
executives for decision by the annual general
meeting and thus apply the pertinent rules con-
tained in Chapter 8, Sections 51–54 of the
Companies Act (2005:551). The guidelines
proposed by the Board are to be compatible with
the Government’s guidelines and state, among
other aspects,
complies with these guidelines, and
the cost for the company before any decision
on individual remuneration is reached.
The remuneration of the chief executive officer is
the responsibility of the board as a whole. The
board is to also ensure that the remuneration of
the chief executive officer and other senior
executives is within the guidelines decided upon
by the annual general meeting.
The board is to confirm that the chief executive
officer ensures that the company’s remuneration
to other employees is based on the remuneration
principles below.
The board is required to report on the special
reasons for deviating from the Government’s
guidelines in any particular case.
REMUNERATION PRINCIPLES The total remuneration payable to senior execu-
tives should be reasonable and well considered. It
should also be competitive, capped and appropri-
ate, while contributing to high ethical standards
and a good corporate culture. The remuneration
paid is not to be wage-leading in relation to
comparable companies but be characterised by
moderation. It is also to provide guidance for the
total amount of remuneration payable to other
employees.
Variable salary is not to be paid to senior
executives. Taking the other principles of these
guidelines into consideration, it is permissible to
pay a variable salary to other employees.
Defined-contribution pension benefits are to be
paid, unless they comply with an applicable
group pension scheme. The defined contribution
should not exceed 30 per cent of the fixed salary.
Accordingly, should the company have agreed
upon a defined-benefit pension benefit, it is to
comply with the applicable group pension
scheme. Any extensions of the group pension
scheme to salary exceeding the income levels
covered by the scheme must be defined-contribu-
tion based. The company’s pension cost is to be
capitalised during the active period of the
employee. No post-retirement pension premiums
for additional pension costs are to be paid by the
company. The retirement age is not to be less
than 62 and should be at least 65.
Should notice to terminate employment be
served by the company, the period of notice is not
to exceed six months. In the event of employ-
ment-termination notice being issued by the
company, severance pay not exceeding 18
monthly salaries may be paid. Severance pay is to
be paid monthly and consist only of the fixed
monthly salary without any supplement for ben-
efits. In the event of new employment or income
from business activity, remuneration from the
company is to be reduced by an amount equiva-
lent to the new income during the period when
salary and severance pay are paid. No severance
pay is to be paid in the event of notice to termi-
1) Included in the Report on State-owned Companies (the
Government’s annual report to the Riksdag with a report
on state-owned companies).
nate employment being served by the employee.
Severance pay is never to be paid after the age of
65.
REPORTING The state-owned companies are to report remu-
neration of senior executives in the same way as
listed companies. Accordingly, the state-owned
companies are required to comply with the
specific rules for reporting remuneration of senior
executives that apply for listed companies and
public limited companies. The rules for this
procedure are stipulated in the Companies Act
(2005:551) and in the Annual Accounts Act
(1995:1554). Furthermore, remuneration of each
individual senior executive is to be reported
separately, in terms of information about fixed
salary, benefits and severance pay.
At the annual general meeting, the board is to
report on whether the adopted guidelines have
been complied with, giving reasons for any devia-
tion. Furthermore, the company’s auditor, ahead
of every annual general meeting, is required to
submit a written signed statement to the board
stating whether the auditor considers that the
guidelines applicable since the previous annual
general meeting have been complied with or not.
In addition, the chairman of the board is to
also provide an oral account at the annual general
meeting of the remuneration of the senior execu-
tives and how this relates to the guidelines
adopted by the annual general meeting.
DEFINITIONS senior executive refers to the
chief executive officer and other indi-viduals in the executive management of the company. This group corresponds to the persons covered by Chapter 8, sec-tion 51, of the Companies Act (2005:551). It includes, inter alia, persons who belong to executive man-agement groups or similar bodies and managers who report directly to the chief executive officer.
Remuneration refers to all remuneration and benefits payable to the employee, such as salary, benefits and severance pay. Remuneration from companies in the same group is also to be included.
Benefits refers to all forms of remunera-tion for work provided in a non-cash form, such as pensions and car, housing and other taxable benefits.
Variable salary refers, inter alia, to incen-tive programmes, bonuses, payments from profit-sharing foundations, commis-sion salary and similar payments.
Defined contribution pension (premium-defined pension) refers to the pension premium being set at a particular per-centage of the current fixed salary.
Defined-benefit pension refers to the amount of pension being determined as a particular percentage of a defined fixed salary.
Subsidiary refers to the legal entitles referred to in Chapter 1, Section 11, of the Companies Act (2005:551).
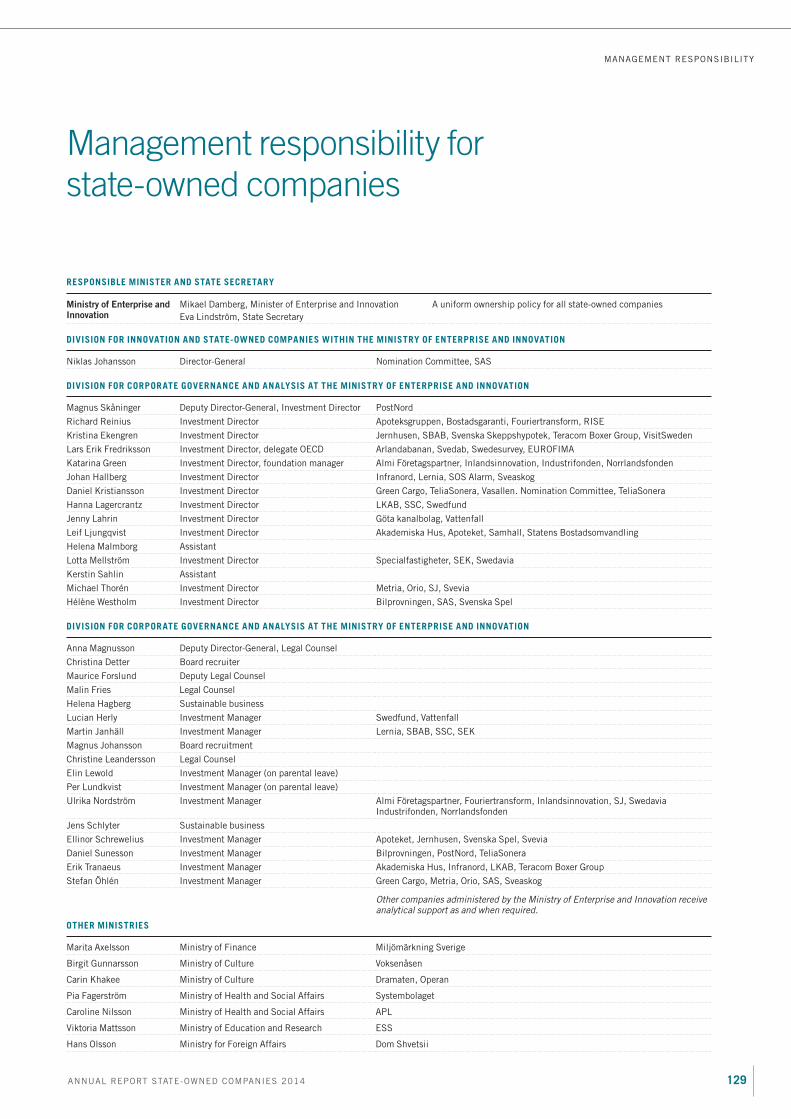
129ANNUAL REPORT STATE-OWNED COMPANIES 2014
MANAGEMENT RESPONSIBILITY
DIVISION FOR INNOVATION AND STATE-OWNED COMPANIES WITHIN THE MINISTRY OF ENTERPRISE AND INNOVATION
Niklas Johansson Director-General Nomination Committee, SAS
DIVISION FOR CORPORATE GOVERNANCE AND ANALYSIS AT THE MINISTRY OF ENTERPRISE AND INNOVATION
Magnus Skåninger Deputy Director-General, Investment Director PostNord
Richard Reinius Investment Director Apoteksgruppen, Bostadsgaranti, Fouriertransform, RISE
Kristina Ekengren Investment Director Jernhusen, SBAB, Svenska Skeppshypotek, Teracom Boxer Group, VisitSweden
Lars Erik Fredriksson Investment Director, delegate OECD Arlandabanan, Svedab, Swedesurvey, EUROFIMA
Katarina Green Investment Director, foundation manager Almi Företagspartner, Inlandsinnovation, Industrifonden, Norrlandsfonden
Johan Hallberg Investment Director Infranord, Lernia, SOS Alarm, Sveaskog
Daniel Kristiansson Investment Director Green Cargo, TeliaSonera, Vasallen. Nomination Committee, TeliaSonera
Hanna Lagercrantz Investment Director LKAB, SSC, Swedfund
Jenny Lahrin Investment Director Göta kanalbolag, Vattenfall
Leif Ljungqvist Investment Director Akademiska Hus, Apoteket, Samhall, Statens Bostadsomvandling
Helena Malmborg Assistant
Lotta Mellström Investment Director Specialfastigheter, SEK, Swedavia
Kerstin Sahlin Assistant
Michael Thorén Investment Director Metria, Orio, SJ, Svevia
Hélène Westholm Investment Director Bilprovningen, SAS, Svenska Spel
DIVISION FOR CORPORATE GOVERNANCE AND ANALYSIS AT THE MINISTRY OF ENTERPRISE AND INNOVATION
Anna Magnusson Deputy Director-General, Legal Counsel
Christina Detter Board recruiter
Maurice Forslund Deputy Legal Counsel
Malin Fries Legal Counsel
Helena Hagberg Sustainable business
Lucian Herly Investment Manager Swedfund, Vattenfall
Martin Janhäll Investment Manager Lernia, SBAB, SSC, SEK
Magnus Johansson Board recruitment
Christine Leandersson Legal Counsel
Elin Lewold Investment Manager (on parental leave)
Per Lundkvist Investment Manager (on parental leave)
Ulrika Nordström Investment Manager Almi Företagspartner, Fouriertransform, Inlandsinnovation, SJ, Swedavia Industrifonden, Norrlandsfonden
Jens Schlyter Sustainable business
Ellinor Schrewelius Investment Manager Apoteket, Jernhusen, Svenska Spel, Svevia
Daniel Sunesson Investment Manager Bilprovningen, PostNord, TeliaSonera
Erik Tranaeus Investment Manager Akademiska Hus, Infranord, LKAB, Teracom Boxer Group
Stefan Öhlén Investment Manager Green Cargo, Metria, Orio, SAS, Sveaskog
Management responsibility for state-owned companies
OTHER MINISTRIES
Marita Axelsson Ministry of Finance Miljömärkning Sverige
Birgit Gunnarsson Ministry of Culture Voksenåsen
Carin Khakee Ministry of Culture Dramaten, Operan
Pia Fagerström Ministry of Health and Social Affairs Systembolaget
Caroline Nilsson Ministry of Health and Social Affairs APL
Viktoria Mattsson Ministry of Education and Research ESS
Hans Olsson Ministry for Foreign Affairs Dom Shvetsii
Other companies administered by the Ministry of Enterprise and Innovation receive analytical support as and when required.
RESPONSIBLE MINISTER AND STATE SECRETARY
Ministry of Enterprise and Innovation
Mikael Damberg, Minister of Enterprise and Innovation
Eva Lindström, State Secretary
A uniform ownership policy for all state-owned companies

130 ANNUAL REPORT STATE-OWNED COMPANIES 2014
ESS is responsible for planning, designing, building, owning and operating the European Spallation Source in Lund. Construction
commenced in 2014 and is now in full swing. Photo: ESS

131ANNUAL REPORT STATE-OWNED COMPANIES 2014
Addresses
Akademiska Hus
Box 483
SE-401 27 Gothenburg
Telephone: +46 (0)31-63 24 00
www.akademiskahus.se
Almi Företagspartner
Box 70394
SE-107 24 Stockholm
Telephone: +46 (0)771-55 85 00
www.almi.se
APL,
Apotek Produktion & Laboratorier
Box 5071
SE-141 05 Kungens Kurva
Telephone: +46 (0)10-447 96 00
www.apl.se
Apoteket
Box 3001
SE-169 03 Solna
Telephone: +46 (0)10-447 50 00
www.apoteket.se
Apoteksgruppen
Box 7264
SE-103 89 Stockholm
Telephone: +46 (0)8-563 022 00
www.apoteksgruppen.se
Arlandabanan Infrastructure
Box 70378
SE-107 24 Stockholm
Telephone: +46 (0)8-22 40 10
www.arlandabanan.se
Bilprovningen
Box 7020
SE-164 07 Kista
Telephone: +46 (0)771-600600
www.bilprovningen.se
Bostadsgaranti
Box 26029
SE-100 41 Stockholm
Telephone: +46 (0)8-545 047 00
www.bostadsgaranti.se
Dom Shvetsii
Ul. Malaya Konyushennaya 1-3,
block A
191186 S:t Petersburg, Russia
Dramaten
Box 5037
SE-102 41 Stockholm
Telephone: +46 (0)8-665 61 00
www.dramaten.se
ESS, European Spallation Source
Box 176
SE-221 00 Lund
Telephone: +46 (0)46-888 30 00
www.europeanspallationsource.se
EUROFIMA
Rittergasse 20
P.O. Box 1764
CH-4001 Basel
Switzerland
Telephone: +41 61 287 33 40
www.eurofima.org
Fouriertransform
Sveavägen 17, 10th floor
SE-111 57 Stockholm
Telephone: +46 (0)8-410 40 600
www.fouriertransform.se
Green Cargo
Box 39
SE-171 11 Solna
Telephone: +46 (0)10-455 40 00
www.greencargo.com
Göta kanalbolag
Box 3
SE-591 21 Motala
Telephone: +46 (0)141-20 20 50
www.gotakanal.se
Industrifonden
Box 1163
SE-111 91 Stockholm
Telephone: +46 (0)8-587 919 00
www.industrifonden.se
Infranord
Box 1803
SE-171 21 Solna
Telephone: +46 (0)10-121 10 00
www.infranord.se
Inlandsinnovation
Akademigatan 2
SE-831 40 Östersund
Telephone: +46 (0)771-150180
www.inlandsinnovation.se
Jernhusen
Box 520
SE-101 30 Stockholm
Telephone: +46 (0)8-410 626 00
www.jernhusen.se
Lernia
Box 1181
SE-111 91 Stockholm
Telephone: +46 (0)771-650 650
www.lernia.se
LKAB
Box 952
SE-971 28 Luleå
Telephone: +46 (0)771-760 000
www.lkab.com
Metria
SE-801 83 Gävle
Telephone: +46 (0)10-121 80 00
www.metria.se
Miljömärkning Sverige
Box 38114
SE-100 64 Stockholm
Telephone: +46 (0)8-55 55 24 00
www.svanen.se
Norrlandsfonden
Box 56
SE-971 03 Luleå
Telephone: +46 (0)920-24 42 50
www.norrlandsfonden.se
Operan
Box 16094
SE-103 22 Stockholm
Telephone: +46 (0)8-791 43 00
www.operan.se
Orio
SE-611 81 Nyköping
Telephone: +46 (0)155-24 40 00
www.orio.com
PostNord
SE-105 00 Stockholm
Telephone: +46 (0)10-436 00 00
www.postnord.se
RISE
Box 3072
SE-103 61 Stockholm
Telephone: +46 (0)8-566 482 50
www.ri.se
Samhall
Box 27705
SE-115 91 Stockholm
Telephone: +46 (0)8-553 411 00
www.samhall.se
SAS
SE-195 87 Stockholm
Telephone: +46 (0)8-797 00 00
www.sasgroup.net
SBAB
Box 27308
SE-102 54 Stockholm
Telephone: +46 (0)771-45 30 00
www.sbab.se
SEK
Box 194
SE-101 23 Stockholm
Telephone: +46 (0)8-613 83 00
www.sek.se
SJ
SE-105 50 Stockholm
Telephone: +46 (0)10-751 60 00
www.sj.se
ADDRESSES

132 ANNUAL REPORT STATE-OWNED COMPANIES 2014
ADDRESSES
Svevia
Box 4018
SE-171 04 Solna
Telephone: +46 (0)8-404 10 00
www.svevia.se
Swedavia
SE-190 45 Stockholm-Arlanda
Telephone: +46 (0)10-109 00 00
www.swedavia.se
Swedesurvey
SE-801 82 Gävle
Telephone: +46 (0)26-63 33 00
www.swedesurvey.se
Swedfund International
Box 3286
SE-103 65 Stockholm
Telephone: +46 (0)8-725 94 00
www.swedfund.se
Systembolaget
SE-103 84 Stockholm
Telephone: +46 (0)8-503 300 00
www.systembolaget.se
TeliaSonera
SE-106 63 Stockholm
Telephone: +46 (0)8-504 550 00
www.teliasonera.com
Teracom Group
Box 30150
SE-104 25 Stockholm
Telephone: +46 (0)8-555 420 00
www.teracom.se
Vasallen
Box 244
SE-701 44 Örebro
Telephone: +46 (0)19-764 86 00
www.vasallen.se
Vattenfall
SE-169 92 Stockholm
Telephone: +46 (0)8-739 50 00
www.vattenfall.se
VisitSweden
Box 3030
SE-103 61 Stockholm
Telephone: +46 (0)8-789 10 00
www.visitsweden.com
Voksenåsen
Ullveien 4
NO-0791 Oslo, Norway
Telephone: +47-22 81 15 00
www.voksenaasen.no
SOS Alarm
Box 19546
SE-104 32 Stockholm
Telephone: +46 (0)8-407 30 00
www.sosalarm.se
Specialfastigheter
Box 632
SE-581 07 Linköping
Telephone: +46 (0)10-788 62 00
www.specialfastigheter.se
SSC (Svenska rymdaktiebolaget)
Box 4207
SE-171 04 Solna
Telephone: +46 (0)8-627 62 00
www.sscspace.com
Statens Bostadsomvandling, Sbo
Stubbengatan 2
SE-703 44 Örebro
Telephone: +46 (0)60-16 21 20
www.sbo.se
Sveaskog
Torsgatan 4
SE-105 22 Stockholm
Telephone: +46 (0)771-787 000
www.sveaskog.se
Svedab
Box 4044
SE-203 11 Malmö
Telephone: +46 (0)40-660 98 80
www.svedab.se
Svenska Skeppshypotek
Box 11010
SE-404 21 Gothenburg
Telephone: +46 (0)31-63 12 50
www.svenskaskeppshypotek.se
Svenska Spel
SE-621 80 Visby
Telephone: +46 (0)10-120 00 00
www.svenskaspel.se