MARINE ECOLOGY PROGRESS SERIES Mar Ecol Prog Ser INTRODUCTION
12
MARINE ECOLOGY PROGRESS SERIES Mar Ecol Prog Ser Vol. 432: 161–172, 2011 doi: 10.3354/meps09160 Published June 27 INTRODUCTION Disease is often cited as an important element in conservation biology, and models describing the limi- tations that disease can exert on host populations have been formally described since the 1970s (Anderson & May 1978). Disease can disrupt ecosystem processes such as trophic relationships when a keystone species is affected (Mumby et al. 2006, Johnson et al. 2009), or it can threaten small or isolated populations with extinction (e.g. Clifford et al. 2006). Conversely, infor- mation about environmental and ecological conditions surrounding disease occurrences can provide critical information about factors that influence disease pro- gression, such as pathogen reservoirs (Haydon et al. 2002). Nonetheless, disease surveillance is uncommon in population or ecosystem monitoring. In the Pacific Northwest, 17 federal conservation units of Pacific salmon have been designated as threatened or endan- gered (Good et al. 2007), stimulating a range of recov- © Inter-Research 2011 · www.int-res.com *Email: [email protected] Nearshore ecosystem predictors of a bacterial infection in juvenile Chinook salmon Linda D. Rhodes 1, *, Casimir A. Rice 1 , Correigh M. Greene 1 , David J. Teel 2 , Shelly L. Nance 1, 3 , Paul Moran 1 , Colleen A. Durkin 1, 4 , Surafel B. Gezhegne 1, 5 1 NOAA Fisheries, Northwest Fisheries Science Center, 2725 Montlake Boulevard East, Seattle, Washington 98112, USA 2 NOAA Fisheries, Northwest Fisheries Science Center, Manchester Research Laboratory, 7305 East Beach Drive, Port Orchard, Washington 98366, USA 3 Present address: Aquatic and Fisheries Sciences, Box 355020, University of Washington, Seattle, Washington 98195, USA 4 Present address: School of Oceanography, Box 357940, University of Washington, Seattle, Washington 98195, USA 5 Present addresss: Internal Medicine Residency Program, Loma Linda University Medical Center, 11234 Anderson Street, Loma Linda, California 92354, USA ABSTRACT: Disease epidemiology requires information about ecological and environmental condi- tions to identify factors that can influence disease progression. Bacterial kidney disease (BKD) is an endemic disease among Pacific Northwest salmonids that causes significant morbidity and mortality in artificially propagated stocks, but risk factors for infection among free-living salmon are unknown. We evaluated infection by the causative agent of BKD, Renibacterium salmoninarum, in 1752 fish across 52 sampling sites monthly from May to November 2003 as a component of a broader study of neritic habitat use in Puget Sound by juvenile Chinook salmon Oncorhynchus tshawytscha. Infection intensity was ≤10 cells per slide for 77% of the fish. Correlations between the density of Chinook salmon with infection prevalence and with infection intensity were observed across multiple spatial scales. Capture location was a stronger predictor of infection than fish origin (based on coded wire tags) or genetic stock. Influential risk factors by logistic regression were temperature, densities of marked and unmarked Chinook salmon, and density of river lamprey Lampetra ayresis. Renibac- terium salmoninarum were found in gut contents and kidney of river lamprey, suggesting this species may be a transmission vector. The low infection intensity, lack of an effect of fish origin, effect of capture bay, and strong associations with Chinook salmon density are consistent with horizontal transmission of R. salmoninarum during the juvenile neritic phase, posing a potential for infectious interaction between sympatric hatchery and wild fish. KEY WORDS: Chinook salmon · Bacterial infection · Risk factor · Horizontal transmission Resale or republication not permitted without written consent of the publisher
-
Upload
nwfsc-noaa -
Category
Documents
-
view
2 -
download
0
Transcript of MARINE ECOLOGY PROGRESS SERIES Mar Ecol Prog Ser INTRODUCTION

MARINE ECOLOGY PROGRESS SERIESMar Ecol Prog Ser
Vol. 432: 161–172, 2011doi: 10.3354/meps09160
Published June 27
INTRODUCTION
Disease is often cited as an important element inconservation biology, and models describing the limi-tations that disease can exert on host populations havebeen formally described since the 1970s (Anderson &May 1978). Disease can disrupt ecosystem processessuch as trophic relationships when a keystone speciesis affected (Mumby et al. 2006, Johnson et al. 2009), orit can threaten small or isolated populations with
extinction (e.g. Clifford et al. 2006). Conversely, infor-mation about environmental and ecological conditionssurrounding disease occurrences can provide criticalinformation about factors that influence disease pro-gression, such as pathogen reservoirs (Haydon et al.2002). Nonetheless, disease surveillance is uncommonin population or ecosystem monitoring. In the PacificNorthwest, 17 federal conservation units of Pacificsalmon have been designated as threatened or endan-gered (Good et al. 2007), stimulating a range of recov-
© Inter-Research 2011 · www.int-res.com*Email: [email protected]
Nearshore ecosystem predictors of a bacterial infection in juvenile Chinook salmon
Linda D. Rhodes1,*, Casimir A. Rice1, Correigh M. Greene1, David J. Teel2, Shelly L. Nance1, 3, Paul Moran1, Colleen A. Durkin1, 4, Surafel B. Gezhegne1, 5
1NOAA Fisheries, Northwest Fisheries Science Center, 2725 Montlake Boulevard East, Seattle, Washington 98112, USA2NOAA Fisheries, Northwest Fisheries Science Center, Manchester Research Laboratory, 7305 East Beach Drive,
Port Orchard, Washington 98366, USA
3Present address: Aquatic and Fisheries Sciences, Box 355020, University of Washington, Seattle, Washington 98195, USA4Present address: School of Oceanography, Box 357940, University of Washington, Seattle, Washington 98195, USA
5Present addresss: Internal Medicine Residency Program, Loma Linda University Medical Center, 11234 Anderson Street, Loma Linda, California 92354, USA
ABSTRACT: Disease epidemiology requires information about ecological and environmental condi-tions to identify factors that can influence disease progression. Bacterial kidney disease (BKD) is anendemic disease among Pacific Northwest salmonids that causes significant morbidity and mortalityin artificially propagated stocks, but risk factors for infection among free-living salmon are unknown.We evaluated infection by the causative agent of BKD, Renibacterium salmoninarum, in 1752 fishacross 52 sampling sites monthly from May to November 2003 as a component of a broader study ofneritic habitat use in Puget Sound by juvenile Chinook salmon Oncorhynchus tshawytscha. Infectionintensity was ≤10 cells per slide for 77% of the fish. Correlations between the density of Chinooksalmon with infection prevalence and with infection intensity were observed across multiple spatialscales. Capture location was a stronger predictor of infection than fish origin (based on coded wiretags) or genetic stock. Influential risk factors by logistic regression were temperature, densities ofmarked and unmarked Chinook salmon, and density of river lamprey Lampetra ayresis. Renibac-terium salmoninarum were found in gut contents and kidney of river lamprey, suggesting this speciesmay be a transmission vector. The low infection intensity, lack of an effect of fish origin, effect of capture bay, and strong associations with Chinook salmon density are consistent with horizontaltransmission of R. salmoninarum during the juvenile neritic phase, posing a potential for infectiousinteraction between sympatric hatchery and wild fish.
KEY WORDS: Chinook salmon · Bacterial infection · Risk factor · Horizontal transmission
Resale or republication not permitted without written consent of the publisher
Mar Ecol Prog Ser 432: 161–172, 2011
ery strategies including captive rearing efforts torebuild a particular stock (Pollard & Flagg 2004). Inaddition, an extensive hatchery system for Pacificsalmon was developed over the last 100 years, annu-ally releasing more than 100 million salmon and steel-head juveniles into Puget Sound and coastal Washing-ton rivers (Mobrand et al. 2005). In the course ofartificial propagation, diseases that are poorly docu-mented in feral populations can emerge as serious epi-zootics or debilitating chronic pathologies (Daszak etal. 2000, Montali et al. 2001). In addition to the impactof diseases on propagated populations, the potentialfor transmission of infectious agents between captivelyreared and wild (or natural origin) fish is a broad con-cern for fish culture and conservation (McVicar et al.2006).
One of the most common and debilitating diseasesamong propagated Pacific Northwest salmon is bacte-rial kidney disease (BKD), which is caused by theGram-positive bacterium Renibacterium salmonina -rum. Infection by R. salmoninarum can cause acutemorbidity and mortality, or it can result in chronicallyinfected, asymptomatic carriers. Transmission canoccur vertically by intra-ovum transfer (Evelyn et al.1986a,b) and horizontally through a presumptive oral-fecal route (Balfry et al. 1996) or through breaks in theskin (Elliott & Pascho 2001). Efforts to control andreduce infection in hatcheries rely on antibiotic injec-tions of broodstock and culling eggs from femaleswith elevated levels of bacterial proteins in kidney tissue. Monitoring juvenile salmon during the fresh-water phase has provided evidence that R. salmoni-narum infection is endemic in Pacific Northwestwatersheds (Sanders et al. 1992, Pascho et al. 1993,VanderKooi & Maule 1999, Arkoosh et al. 2004). Lessis known about the infection status in seawater (Mey-ers et al. 1999, Bruno 2004, Rhodes et al. 2006), espe-cially during the early marine phase, a transitionperiod between freshwater and ocean residence thatis considered to be the most critical period in deter-mining survival to adulthood (Pearcy 1992). The pre-sent study addressed 2 objectives. First, we wished todetermine the prevalence and intensity of infectionamong juvenile Chinook salmon during the first fewmonths in seawater. Second, we wanted to identifybiotic and abiotic risk factors for infection amongrecently emigrated fish. These objectives were chosento address the lack of information about the distribu-tion of infection and its potential impact on endan-gered stocks of Chinook salmon. This effort was acomponent of a larger monitoring study to assessnearshore marine habitat use in Puget Sound by juve-nile Chinook salmon (Rice et al. 2011), which allowsthe infection results to be examined within a broaderecological context.
MATERIALS AND METHODS
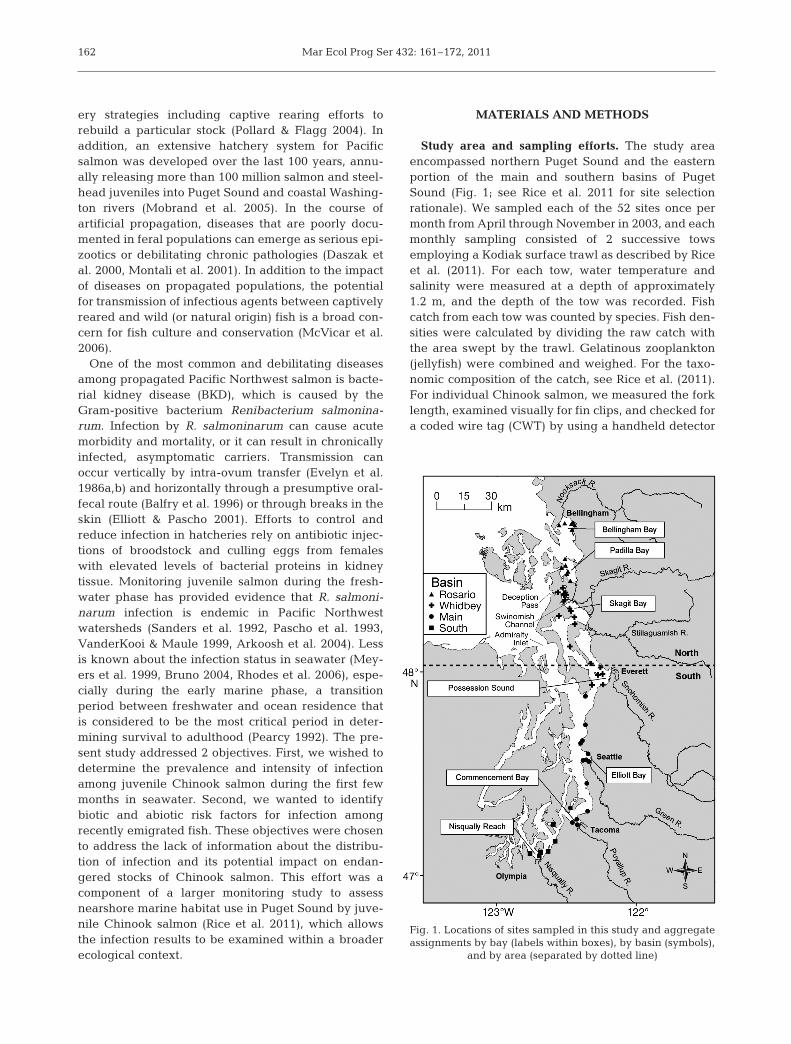
Study area and sampling efforts. The study areaencompassed northern Puget Sound and the easternportion of the main and southern basins of PugetSound (Fig. 1; see Rice et al. 2011 for site selectionrationale). We sampled each of the 52 sites once permonth from April through November in 2003, and eachmonthly sampling consisted of 2 successive towsemploying a Kodiak surface trawl as described by Riceet al. (2011). For each tow, water temperature andsalinity were measured at a depth of approximately1.2 m, and the depth of the tow was recorded. Fishcatch from each tow was counted by species. Fish den-sities were calculated by dividing the raw catch withthe area swept by the trawl. Gelatinous zooplankton(jellyfish) were combined and weighed. For the taxo-nomic composition of the catch, see Rice et al. (2011).For individual Chinook salmon, we measured the forklength, examined visually for fin clips, and checked fora coded wire tag (CWT) by using a handheld detector
162
Fig. 1. Locations of sites sampled in this study and aggregateassignments by bay (labels within boxes), by basin (symbols),
and by area (separated by dotted line)

Rhodes et al.: Predictors of Chinook salmon bacterial infection
(Northwest Marine Technologies). A total of 1752 Chi-nook salmon for infection analysis were collected in668 tows over the sampling period. Collection effortsyielded only 1 fish in April and 5 fish in November, anddata from these fish were excluded from any temporalanalyses. Adult river lamprey Lampetra ayresis werealso captured by the surface trawl, and their parasiticlifestyle suggests that they are potential transmissionvectors for pathogens. A total of 33 river lamprey wascollected for examination for the presence of Renibac-terium salmoninarum.
Tissue collection and determination of infection.Salmon necropsies were conducted at the time of col-lection, and excised kidney tissue was stored on iceuntil slide preparation. River lamprey were stored at–20°C until necropsy. Slides of kidney tissue and gutcontents were prepared by the quantitative fluorescentantibody technique (qFAT) (Cvitanich 1994). The slidewas stained with fluorescein isothiocyanate-conju-gated polyclonal goat anti-Renibacterium salmoni-narum antibody (Kirkegaard and Perry), and a total of400 fields per slide were examined at 1000× magnifi -cation (objective numerical aperture 1.30) on a ZeissAxiophot epifluorescence microscope. When accuratecounts could not be performed before significantquenching of the fluorescent signal, minimum esti-mates of 12 000 cells were applied.
Chinook salmon origins. Chinook salmon originswere examined using hatchery marks, CWTs, andgenetic data. Any fish with detectable hatchery mark-ings or tags was identified as ‘marked’ (a surrogate forhatchery fish). Snouts from marked fish with CWTswere removed and stored in 70% ethanol for sub -sequent decoding. Origins of fish with CWTs weredetermined from the Regional Mark Information Sys-tem (Regional Mark Processing Center; www.rmpc.org/). For each CWT fish, the natal bay (i.e. firstmarine bay encountered in seaward migration) wasassigned as the source bay. Fish lacking detectablehatchery markings or tags were identified as ‘un -marked’. Although the majority of unmarked fishwere likely to be from natural spawn origin, an un -known proportion of hatchery fish were included dueto incomplete marking of hatchery fish (Rice et al.2011). Origins of unmarked fish were estimated usinggenetic assignment techniques (Manel et al. 2005).Fin tissues were stored in non-denatured ethanol forsubsequent DNA isolation using Wizard genomicDNA extraction kits (Promega). Isolated genomicDNA was used in polymerase chain reactions (PCRs)to amplify 13 microsatellite loci that have been stan-dardized among all major West Coast salmon geneticslaboratories (Seeb et al. 2007). PCR products wereseparated electrophoretically on an Applied Biosys-tems (ABI) 3100 genetic analyzer. ABI GeneScan and
Genotyper software were used to estimate allele sizesand assign genotypes. The origins of individual fishwere estimated by using a regional baseline of popu-lation data compiled from the Genetic Analysis ofPacific Salmonids (GAPS) database for Chinook sal -mon (Seeb et al. 2007, Rice et al. 2011) and theONCOR software program (Kalinowski et al. 2007).ONCOR uses the likelihood model of Rannala &Mountain (1997) to calculate the relative probabilitythat each baseline population produced a given indi-vidual’s genotype. Probabilities were summed amonggenetically similar populations to assign fish to oneof fifteen genetic stock groups in southern BritishColumbia and northwestern Washington (Rice et al.2011). Genetic stock groups previously identified inPuget Sound included South Sound Spring (adultreturn time), South Sound/Hood Canal Fall, WhidbeyBasin, and Nooksack River.
Data analysis. Infection data for each fish includedtotal number of bacterial cells per slide (infectionintensity) and infection status (presence or absence ofbacteria). For Chinook salmon infection intensity wasnormalized for fish size by the following formula:ln[(1 + B) / L3], where B is the total number of bacter-ial cells per slide and L is the fork length. For someanalyses, geographic designations were assigned tobroader aggregate designations to examine largerscale effects or to obtain adequate sample sizes. The52 individual sampling sites were assigned to thirteenwatersheds, 8 bays (including a category for ‘non-sys-tem’ sites located outside of defined bays), 4 basins, or2 sampling areas (Fig. 1). Because Chinook salmon inthe North area were collected 2 wk earlier than thosecollected in the South area, fork length was examinedseparately by region. Statistical analyses includedanalysis of variance for fork length and for infectionintensity; Spearman’s rank correlation for infectionprevalence and infection intensity; and the G-statisticand logistic regression modeling for infection preva-lence. The critical p-value was set at 0.10, unless indi-cated otherwise. The data set used for logistic regres-sion contained a case record for each Chinook salmonexamined. Each record included intrinsic target spe-cies factors (length, hatchery marking), physical con-ditions for the tow (water temperature and salinity atthe tow site, depth of tow), and biological communityfactors for the tow (presence and density or mass ofspecies collected). Regression models were evaluatedby Akaike’s Information Criterion (AIC; Akaike 1973,Burnham & Anderson 2002), and differences in AICscores were calculated against the lowest score todetermine the most informative models. The dataused for correlations were aggregated by month andby basin, bay, or watershed. Aggregations comprising5 or fewer fish were ex clu ded from the correlations.
163

Mar Ecol Prog Ser 432: 161–172, 2011
RESULTS
Infection prevalence
Prevalence of infection varied significantly bymonth, with the lowest proportion in May and thehighest in June (Fig. 2; G = 58.1, df = 11, p ≤ 0.0001).Monthly prevalence of infection was positively corre-lated with average Chinook salmon density across all3 geographic scales (Spearman’s rank correlation, p ≤0.002; Fig. 3). Furthermore, significant positive corre-lations between the monthly prevalence of infectionand average Chinook salmon density were found forboth marked and unmarked fish for all 3 geographicscales (Table 1). The prevalence of infection betweenunmarked and marked fish (31.2 and 32.7%, respec-tively) was not different for each of the monthly sam-plings or for the entire survey (Fig. 2; Pearson χ2, p >0.517, N = 1751).
Prevalence of infection differed widely among thecapture locations. Among the 13 watersheds, preva-lence varied significantly from the overall prevalenceof 31.8% (G = 290.9, df = 12, p < 0.0001), with thenorthernmost and southernmost watersheds exhibitingthe highest values (data not shown). Prevalence by bayalso varied significantly (G = 384.7, df = 7, p < 0.0001)with high prevalence in the northernmost (Belling-ham Bay), southernmost (Nisqually Reach), and a cen-trally located bay (Elliott/ Shilshole Bay; Fig. 4). Con-versely, Skagit Bay exhibited the lowest prevalence.Infection prevalence was significantly different among
all 4 basins (G = 185.3, df = 3, p < 0.0001; data notshown).
Among the logistic regression models for each geo-graphic scale (basin, bay, watershed), the model bybay was most informative (ΔAIC probability weight =0.941), and the likelihood of infection for fish capturedin any bay was significantly higher than for fish cap-tured in Skagit Bay (Table 2; p < 0.10). Fish captured inBellingham Bay and Nisqually Reach had the highestodds of infection, while fish from Elliott/Shilshole Bayand Commencement Bays had intermediate odds ofinfection. Although fish captured in Possession Soundhad the lowest odds of infection, the odds of infectionwere still significantly greater than for fish captured inSkagit Bay (Table 2).
Prevalence of infection did not appear to be associ-ated with genetic origin or hatchery origin. Amongunmarked fish, DNA microsatellite analysis of 417 fishresulted in assigning 297 fish to genetic stock groupswith high confidence (probability ≥ 0.800). Althoughinfection prevalence among genetic stock groups wasnot uniform (G, df = 4, p = 0.048), none were differentfrom the overall prevalence. Four Puget Sound geneticstock groups (South Sound/Hood Canal Fall, SouthSound Spring, Whidbey Basin, and Nooksack) and acombined group from the Fraser and Thompson Riversin British Columbia had ≥4 fish per capture bay. Whenthese fish were examined by capture bay, prevalencewas more similar among genetic stock groups within acapture bay than for a genetic stock group across thecapture bays (Fig. 5). For example, the Whidbey Basinand South Sound/Hood Canal Fall stocks each ex -hibited low prevalence when captured in SkagitBay (8.6 and 12.5%, respectively). However, both ofthese stocks displayed elevated prevalence when cap-tured in Bellingham Bay (38.9 and 75.0%) or theNisqually (50.0 and 57.1%). Among the 270 codedwire tagged (CWT) fish, the prevalence by source bayranged from 11.8% (Padilla Bay) to 53.5% (BellinghamBay), with an overall prevalence of 31.1%. Whenexamined by capture bay, fish from different sourcebays that were collected within the same capture bayexhibited similar prevalence (Fig. 6). For example, fishoriginating from Skagit or Bellingham Bay displayedlow infection prevalence when captured in Skagit Bay(10.5 and 14.3%, respectively) but high prevalencewhen captured in Bellingham Bay (59.1 and 83.3%,respectively).
Logistic regression identified significant risk factorsexclusive of capture location. Four models containingphysical, biological, and temporal factors were com-pared and the best overall model included 7 parame-ters (Table 3). For 6 of those parameters, the odds ratiowas >1, indicating that the odds of infection increasedas the parameter value increased. Only one parameter,
164
Fig. 2. Oncorhynchus tshawytscha. Infection prevalance(±95% CI) in marked and unmarked salmon across samplingmonths, with overall infection prevalence (±95% CI) indi-cated by the horizontal line and hatched area. Values differ-ent from the overall prevalence of 0.318 are indicated byasterisks (G-tests; *p < 0.05, ***p < 0.0001). Sample sizes (n)for each month: May, n = 117; June, n = 528; July, n = 468;
August, n = 339; September, n = 190; October, n = 104

Rhodes et al.: Predictors of Chinook salmon bacterial infection
density of unmarked Chinook salmon, had an oddsratio <1, indicating that the odds of infection decreasedas that density increased. The p-values of the coeffi-cients for these parameters were small, suggesting theeffects were consistent among the sampled fish. How-ever, the odds ratios were close to 1 indicating that themagnitude of the parameter effect was small.
This best overall regression model was examined bybasin and by bay, and the significant odds ratios (p ≤0.10) calculated (Table 4, Model 4). Water temperature
and lamprey density were most fre-quently observed as significant positivefactors (i.e. odds ratio >1) in several geo-graphic areas, whereas forage fish den-sity was a significant positive factor pri-marily in southern locations. Marked andunmarked Chinook salmon density ef-fects varied depending upon the locationand frequently had opposing values. Forexample, marked Chinook salmon den-sity was a significant positive factor andun marked Chinook salmon density was asignificant negative factor (i.e. odds ratio<1) in southern locations (Table 4). Jelly-fish mass was a positive factor only in theRosario basin, and non-Chinook salmondensity was not a significant factor at thebasin or bay levels (Table 4).
Logistic regression linked the densityof river lamprey with increased odds ofinfection, implicating this species as avector for horizontal transmission ofRenibacterium salmoninarum. If this ispossible, the bacterium should be pre-sent in tissues of river lamprey. Weemployed qFAT to examine gut contentsand kidney tissues from adult river lam-prey collected in surface trawls fromsites within Skagit Bay and PossessionSound. Bacteria were found in kidneysof 57.6% of the fish and in gut contentsfrom 78.8% of fish (n = 33). The bacterialcounts averaged 5.4 cells per slide forkidney (range 0 to 26) and 4.1 cells perslide for gut contents (range 0 to 15).
As expected, fork length varied by themonth of collection (2-way ANOVA;North region: F = 111.49, df = 7, p <0.0001; South region: F = 92.02, df = 5,p < 0.0001). In the North region, forklength was not affected by infection sta-tus (F = 0.33, df = 1, p = 0.563). However,in the South area, length was affected byinfection status (F = 7.03, df = 1, p =0.008), and there was an interaction
between infection status and month (F = 4.13, df = 5,p = 0.001) that was due primarily to the large size dif-ference in fish collected in September (Fig. 7).
Infection intensity
Temporal and geographic variations in infectionintensity were significant. Fish collected in May exhib-ited higher infection intensity than all other months
165
Fig. 3. Oncorhynchus tshawytscha. Comparison of monthly infection prevalenceand average Chinook salmon density (no. per hectare) at 3 different geographicscales: (A) basin, (B) bay, and (C) watershed. Shaded plot: infection prevalence;line plot: Chinook salmon density. Geographic areas are ordered from north(left) to south (right). Numbers on the x-axis represent the month (5 = May, 6 =June, 7 = July, 8 = August, 9 = September, 10 = October). Spearman’s correlationcoefficient (Spearman’s r) and associated p-value are included with each graph

Mar Ecol Prog Ser 432: 161–172, 2011
(ANOVA, F = 27.30, df = 5, p < 0.0001; Scheffe post-hoccomparisons, p ≤ 0.005). Correlations between infec-tion intensity and sampling month for both marked andunmarked fish were negative (Spearman’s rank corre-
166
Table 1. Oncorhynchus tshawytscha. Spearman’s rank corre-lation (rS) and associated p-values for correlations betweenmonthly infection prevalence and Chinook salmon densityacross 3 geographic scales. (The catch parameter, density ofmarked and unmarked Chinook salmon, was measured as
mean no. of fish ha–1)
Scale N Catch parameter rS p
Basin 25 Marked 0.40 0.047Unmarked 0.61 0.001
Bay 46 Marked 0.30 0.046Unmarked 0.55 <0.001
Watershed 70 Marked 0.41 <0.001Unmarked 0.45 <0.001
Fig. 4. Oncorhynchus tshawytscha. Infection prevalence(±95% CI) by capture bay; overall infection prevalence(±95% CI) indicated by horizontal line and hatched area. Values differing significantly from overall prevalence of 0.318are indicated by asterisks (G-test, df = 7; *p < 0.01, **p <0.001, ***p < 0.0001). Locations on x-axis are ordered fromnorth (left) to south (right); non-system includes salmon not
captured in a distinct geographic area
Table 2. Oncorhynchus tshawytscha. Odds ratios, p-values forthe regression coefficient and the number of salmon by cap-ture bay from the best logistic regression model of infection.Odds ratios are interpreted relative to salmon captured in
Skagit Bay (n = 560)
Capture bay Odds ratio p No. of fish
Bellingham Bay 12.015 <0.001 247Padilla Bay 2.210 <0.001 247Possession Sound 1.629 0.070 115Elliott/Shilshole Bay 5.498 <0.001 214Commencement Bay 3.347 <0.001 159Nisqually Reach 8.140 <0.001 168Non-system 1.878 0.112 42
Fig. 6. Oncorhynchus tshawytscha. Infection prevalenceamong coded wire tagged salmon by source bay and capturebay. Results shown only for groups with 4 or more samples per
data point
Fig. 5. Oncorhynchus tshawytscha. Infection prevalenceamong unmarked salmon by genetic stock group and capturebay. Results shown only for groups with 4 or more samples per
stock group per capture bay

Rhodes et al.: Predictors of Chinook salmon bacterial infection
lation = –0.943, p ≤ 0.005). Geographic differences insize-normalized infection intensity were best observedat the capture bay level (ANOVA, F = 10.21, df = 7, p <0.0001), with higher intensities for fish collected inBellingham and Nisqually Bays, lower intensities forfish collected in Padilla and Skagit Bays, and interme-diate for other locations (Fig. 8) However, none of theinfected fish exhibited clinical evidence of BKD, suchas kidney granulomas or ascites. For 77% of theinfected fish, bacterial cell counts were ≤10 cells. For5.6% of infected fish (31 of 557), bacterial cell countswere ≥100 cells and 4 of these 31 had >1000 cells.
Consistent positive correlations were observed be -tween infection intensity and Chinook salmon catchparameters (Table 5). Across all 3 geographic scales(basin, bay, watershed), the infection intensity waspositively correlated with total Chinook salmon den-sity, with the density of marked Chinook salmon, andwith the percentage of marked Chinook salmon in thetow. The correlation coefficient for the marked Chi-nook salmon density was consistently the highest forall comparisons. In contrast, there were no significantcorrelations with the density of unmarked Chinooksalmon (Table 5). Furthermore, infection intensity wasnot different between all marked and all unmarkedfish (t-test, 2-tailed test, p = 0.8422).
DISCUSSION
Disease surveillance is not typically included in eco-logical field assessments because many diseases areepi sodic and opportunities to detect pa tho gens can berelatively transient. Habitat overlap between infectedpa tho gen reservoirs and susceptible populations of en-dangered species can exacerbate the risk of extinctionwithout observing or understanding the hazard. Multi-disciplinary monitoring can provide beneficial insightsinto en vironmental factors that are associated with thepresence of pathogens, and in some instances, diseaseprofiling can be used as an indicator for environmentalstatus (Myers et al. 2008, Stentiford et al. 2009).
The current study examined both biotic and abioticfactors associated with a bacterial infection in recentlyemigrant juvenile Chinook salmon. Among these fac-tors, Chinook salmon density emerged as important forinfection. Chinook salmon density correlated withinfection prevalence (Fig. 3) and intensity of infection(Table 5) across spatial and temporal scales, suggest-ing that the association is not a population-specific or alocal effect. The association of Chinook salmon densitywith infection is consistent with a horizontal transmis-sion scenario among juvenile fish. Sympatry betweeninfected and susceptible fish provides the opportunityfor pathogen transmission, and increased host densityelevates the probability of transmission. For bacterialkidney disease, infected fish shed bacteria in water(Austin & Rayment 1985, McKibben & Pascho 1999),and cohabitation of infected and naïve fish is an effec-tive method of experimental challenge (Murray et al.1992, Alcorn et al. 2005).
The release of hatchery Chinook salmon is likely tohave an impact on infection for several reasons. First,infection intensity correlated with the percentage ofmarked Chinook salmon and the marked Chinooksalmon density, but not unmarked Chinook salmondensity (Table 5). Second, marked Chinook salmon
167
Table 3. Oncorhynchus tshawytscha. Comparison of bestlogistic regression models of infection showing Akaike’s Infor-mation Criterion (AIC) values, differences in AIC values (Δi),AIC weights, odds ratios, and p-values of the coefficient forparameters of water temperature (Temp), salinity, depth, den-sity of marked Chinook salmon (DensCSmark), density ofunmarked Chinook salmon (DensCSno mark), density of salmonother than Chinook salmon (Dens NonCS), jellyfish biomass(Jellyfish), density of river lamprey (DensLamp), density of forage fish (DensForage), and sampling month (Month). Only
parameters with p ≤ 0.10 were included in the model
Model AIC Δi AIC Parameter Odds pweight ratio
1 2119.812 5.3 0.042 Temp 1.224 <0.001Salinity 0.992 0.471Depth 1.005 0.538DensCSmark 1.003 0.004DensCSno mark 0.992 0.003Dens NonCS 1.000 0.001Jellyfish 1.006 0.014DensLamp 1.008 0.084DensForage 1.000 0.074Month 1.010 0.843
2 2117.8514 3.3 0.113 Temp 1.224 <0.001Salinity 0.992 0.488Depth 1.005 0.542DensCSmark 1.003 0.002DensCSno mark 0.992 0.002Dens NonCS 1.000 <0.001Jellyfish 1.006 0.014DensLamp 1.008 0.085DensForage 1.000 0.067
3 2116.2212 1.7 0.255 Temp 1.227 <0.001Salinity 0.994 0.567DensCSmark 1.003 0.002DensCSno mark 0.992 0.002Dens NonCS 1.000 <0.001Jellyfish 1.007 0.006DensLamp 1.008 0.090DensForage 1.000 0.076
4 2114.5458 0.0 0.590 Temp 1.233 <0.001DensCSmark 1.003 0.002DensCSno mark 0.992 0.002Dens NonCS 1.000 <0.001Jellyfish 1.007 0.002DensLamp 1.008 0.057DensForage 1.000 0.076

Mar Ecol Prog Ser 432: 161–172, 2011
density emerged as a positive risk factor for infectionwhile unmarked Chinook salmon density was a nega-tive risk factor (Table 3). Third, Rice et al. (2011) haveshown that total Chinook salmon densities in this studyare primarily attributable to the release of hatcheryfish. The temporal pattern of infection prevalence weobserved (Fig. 2) corresponds to the timing of releaseof hatchery Chinook salmon in Puget Sound (Rice et al.2011). If pulses of hatchery Chinook salmon areresponsible for transient increases in density, our datasuggest these releases may increase opportunities forpathogen transmission.
Prevalence of infection varied greatlyamong the capture bays, and capturebay had the greatest effect on infection.The lowest prevalence was observedamong fish collected in Skagit Bay(Fig. 4), which receives the largestnumber and greatest proportion of wildjuvenile Chinook salmon of all the baysthat we examined (Rice et al. 2011).The odds of infection among fish col-lected in Bellingham Bay, Elliott/ Shils-hole Bay, Commencement Bay, andNisqually Reach was 3 to 12 timeshigher than that for fish collected inSkagit Bay (Table 2). Three of thesebays are predominantly urban andindustrial in character, while the SkagitBay receives inputs primarily fromrural and agricultural areas. However,there are no major urban or industrialactivities adjacent to Nis qually Reach
(overall infection prevalence = 54.2%), demonstratingthat there is no clear relationship between infectionprevalence and upland development and use. Theeffect of the capture location may reside in factors thatwere not measured in our study, such as a pathogenreservoir in a non-Chinook salmon host.
One possible source of infection variation could befish from a particular hatchery origin or genetic stock.We examined fish origins using 3 different approaches(hatchery mark, hatchery origin, genetic stock). Onecaveat about hatchery markings is that some PugetSound hatcheries mark otoliths, but do not clip fins oruse coded wire tags. Therefore, some fish classified asunmarked may actually be hatchery fish, so our com-parisons are likely between known hatchery fish andfish that are a mixture of hatchery and naturally pro-duced individuals. We did not observe a significant dif-ference in infection prevalence between marked andunmarked fish (Fig. 2). This observation suggestshomogeneity of infection between the 2 groups and isconsistent with pathogen transmission during earlymarine emigration. Coded wire tags in some markedindividuals provided a subset of hatchery samples withknown freshwater release locations, and we did notobserve an obvious ‘hotspot’ hatchery source of infec-tion in our data (Fig. 6).
We used genetic data to estimate the genetic stock oforigin of a subset of unmarked fish. While differentialsusceptibilities to BKD have been observed amongpopulations of salmon (McGeer et al. 1991, Beacham &Evelyn 1992), significant BKD resistance associatedwith locus zygosity (overdominance) has been limitedto the major histocompatibility class IIB locus (Turneret al. 2007), and specific genetic components under -
168
Table 4. Oncorhynchus tshawytscha. Odds ratios for significant parameters (p ≤0.10) from logistic regressions by basin or by bay. Non-Chinook salmon densitywas included in the analysis but was not a significant parameter for any basin orbay. –: parameter was not significant; *: not evaluated because no lamprey
were captured
Temp Chinook density Lamprey Jellyfish Forage Marked Unmarked density mass fish
density
BasinsRosario 1.2587 0.9335 1.0228 1.0293 1.0158 –Whidbey – – – – – –Main – – 1.0164 – – –South 1.5778 1.0103 0.9727 * – 1.0047
BaysBellingham 1.3107 – – 1.0256 – –Padilla – 0.9508 1.0342 – – –Skagit – – – 1.0105 – –Possession – – – – – –Elliott/Shilshole – – – 1.9749 – –Commencement 1.5053 0.9802 1.0530 * – 1.0480Nisqually 1.1578 1.0103 0.9727 * 1.0047 –
Fig. 7. Oncorhynchus tshawytscha. Median fork length (horizontal line) and 25th & 75th percentile range for un -infected (white boxes) and infected (gray boxes) salmon, geographic area (N, North area; S, South area), and month;error bars indicate 5th & 95th percentiles (see Fig. 1 for
map showing areas)

Rhodes et al.: Predictors of Chinook salmon bacterial infection
lying resistance to BKD in Chinook salmon have notbeen identified (Beacham & Evelyn 1992, Johnson etal. 2003, Hard et al. 2006). As expected, the geneticdata did not provide as fine a geographic resolution forfreshwater origin as the CWT data. For example, in thegenetic analysis we grouped fall run populations fromthroughout southern Puget Sound and Hood Canalbecause they are genetically very similar, which likelyreflects extensive transfers of hatchery stocks in thearea (Myers et al. 1998). Nonetheless, we did not findevidence that genetic stock was an important influenceon infection, and our data indicate that the capturelocation was much more strongly associated withinfection than was genetic stock (Fig. 5).
Although a geographic risk factor mayintegrate features that are characteristicfor that location, physical factors for eachtow site were included in the regressionanalysis to determine their significance.Temperature emerged as a positive fac-tor for prevalence, while salinity anddepth of tow were not important (Tables3 & 4). Temperature can modulate bothpathogen and host physiology, and the invitro optimal growth temperature rangefor Renibacterium salmoninarum is 15to 18°C. Fish experimentally infectedwith R. sal mo ninarum succumbed morerapidly at temperatures between 15 and20.5°C (Sanders et al. 1978), a rangeoverlapping approximately half of ourtemperature observations. Immune re -sponses in poikilothermic fish tend toincrease with temperature, but they arenot simply linear (Le Morvan et al. 1998,Watts et al. 2001, Pettersen et al. 2005),while certain innate immune responsesin salmon, such as serum lysozyme andserum complement activities, are not af -fected by water temperature (Alcorn etal. 2002). The temperature relationshipdetected in this study is consistent withobservations of disease exacerbation athigher temperatures (reviewed in Richter& Kolmes 2005), and suggests that sce-narios of increasing water temperaturescould result in greater infection preva-lence.
The emergence of river lamprey den -sity as a positive risk factor was unantic-ipated, and the majority of adult riverlamprey we examined had Renibac-terium sal mo ninarum in both the gutcontents and kidney tissue. R. salmoni-narum has been isolated from sea lam-
prey Petromyzon marinus from the Great Lakes (Eissaet al. 2006) where epizootics of BKD have occurredamong Chinook salmon (Holey et al. 1998), and wehave ob served R. sal moninarum in kidney tissue fromadult Pacific lamprey Lampetra tridentata (Gairdner)from the Columbia River (L. Rhodes unpubl. obs.).During the marine adult phase, river lamprey para-sitize schooling fish such as salmon and herring byfeeding on epidermis, muscle, and blood (Beamish1980, Beamish & Youson 1987). The presence of bac-teria in lamprey kidney tissue indicates that these fishcan become infected, in contrast to attempts to exper-imentally infect Pacific lamprey (Bell & Traxler 1986).The majority of lamprey catches occurred primarily in
169
Fig. 8. Oncorhynchus tshawytscha.Size- normalized infection intensitiesfor in fected salmon (n = 557) by
capture bay

Mar Ecol Prog Ser 432: 161–172, 2011
the North part of the study area, with 70% of the lam-prey captured in Skagit Bay, which had the lowestprevalence of infection. Thus, the presence of lam-preys alone is insufficient for high infection preva-lence, and supports the possibility that lamprey serveas vectors, rather than reservoirs, of R. salmoninarumfor juvenile salmon.
Several factors that were significant in the overalllogistic regression failed to exhibit widespread signifi-cance at the basin or bay level. The density of foragefish and jellyfish mass were significant factors in only1 or 2 geographic locations, and the density of non-Chinook salmon was not significant in any basin or bay(Table 4). These factors may have very weak effects,and indeed the odds ratios for some of them were veryclose to one. Alternatively, they may be surrogates forcommunity features that were not captured by the towdata, e.g. altered community structures (Lynam et al.2006).
Downstream migration and smoltification couldexert a selective pressure against more heavily in fec -ted or clinically ill fish. Juvenile salmon with BKDexhibit reduced survival when exposed to stressorssimulating migration (Sanders et al. 1992, Moles 1997)and while transitioning through smoltification (Mesa etal. 1999). Clinically affected fish are also more suscep-tible to predation (Mesa et al. 1998). Juvenile Chinooksalmon with moderate to severe infection of Renibac-terium salmoninarum have persistently lowered hema-tocrit, lowered plasma glucose, and elevated plasmalactate (Mesa et al. 2000). The altered parameters areindicative of reduced capacity for sustained move-
ment, and these fish are likely to beenergetically disadvantaged. Becausethe intensity of infection was low for themajority of fish we examined, it is pos-sible that the heavily infected fish didnot successfully emigrate to marinewaters.
The individual metric of fork lengthwas the same between uninfected andinfected fish for each month ofthe study, an observation that is con-sistent with susceptibility to infectionthrough out the juvenile life stage. Theinverse relationship between infectionintensity and fork length may be aresult of dilution by growth of the host,especially for a slowly repli cating bac-terial species such as Renibacteriumsal monina rum. Furthermore, immuneresponses in sal monids such as serumIgM levels rise during the post- smoltification period (Melingen et al.1995a,b), possibly resulting in better
infection control in larger fish.This study underscores the value of using a multidis-
ciplinary approach for disease studies and for includ-ing disease assessments in ecological studies. Incorpo-ration of both environmental and catch data withbiological information for each fish allowed identifica-tion of risk factors associated with an increased odds ofinfection. The effect of Chinook salmon density at mul-tiple spatial scales, effect of capture bay, the negligibleeffect of genetic stock and hatchery origin, and the lowinfection intensity among most of the affected fish arefeatures consistent with horizontal transmission ofReni bacterium salmoninarum occurring during theneritic period and with recently acquired infections. Arole for adult river lamprey (as vectors or reservoirs) inpathogen transmission was implicated, and the sourceof infection could be juvenile Chinook salmon, othersalmonids, marine fish (Kent et al. 1998), or even inver-tebrates serving as passive reservoirs of R. salmoni-narum (Starliper & Morrison 2000). If horizontal trans-mission among juvenile Chinook salmon occurs duringthe first few months after emigration into seawater,there is potential for pathogen interaction betweensympatric wild and hatchery stocks. Ideally, pre-release hatchery fish would be managed for the lowestachievable level of infection, including routine moni-toring for pathogens before release. Including healthstatus criteria in the hatchery release decision wouldprovide long-term benefits such as improved survivalto adulthood for both the fish belonging to the man-aged stock and for the wild stocks they encounter dur-ing their lifetime.
170
Table 5. Oncorhynchus tshawytscha. Spearman’s rank correlation (rS) betweenmonthly size-normalized infection intensity and monthly Chinook salmon catchinformation for marked Chinook salmon density (DensCSmark), unmarked Chi-nook salmon density (DensCSno mark), total Chinook salmon density (DensCStotal),and percentage of Chinook salmon that are marked (PctCSmark) across 3 geo-graphic scales. *p < 0.05; Chinook density was measured as mean no. of fish ha–1
Scale N Catch Mean intensity Median intensityparameter rS rS
Basin 25 DensCSmark 0.745* 0.668*DensCSno mark 0.335 0.318DensCStotal 0.666* 0.644*PctCSmark 0.603* 0.554*
Bay 46 DensCSmark 0.623* 0.605*DensCSno mark 0.328 0.301DensCStotal 0.564* 0.544*PctCSmark 0.360* 0.362*
Watershed 70 DensCSmark 0.578* 0.507*DensCSno mark 0.116 0.088DensCStotal 0.362* 0.302*PctCSmark 0.497* 0.417*

Rhodes et al.: Predictors of Chinook salmon bacterial infection
Acknowledgements. We thank the Environmental Conserva-tion Division (Northwest Fisheries Science Center, NOAAFisheries, Seattle) for research vessel and field staff support.F. Sommers was instrumental in ensuring appropriate samplecollection. D. Kuligowski collected the genetic data used inthe study. E. Smith analyzed the river lamprey samples. Fund-ing support was from Northwest Fisheries Science Center’sInternal Grants Program, Seattle City Light, and the US ArmyCorps of Engineers.
LITERATURE CITED
Akaike H (1973) Information theory and an extension of themaximum likelihood principle. In: Petrov BN, Csaki F(eds) Proceedings of the Second International Sympo-sium on Information Theory. Akademiai Kiado, Budapest,p 267–281
Alcorn SW, Murray AL, Pascho RJ (2002) Effects of rearingtemperature on immune functions in sockeye salmon(Onco rhynchus nerka). Fish Shellfish Immunol 12:303–334
Alcorn S, Murray AL, Pascho RJ, Varney J (2005) A cohabita-tion challenge to compare the efficacies of vaccines forbacterial kidney disease (BKD) in chinook salmon Onco -rhynchus tshawytscha. Dis Aquat Org 63:151–160
Anderson RM, May RM (1978) Regulation and stability ofhost-parasite population interactions. I. Regulatory pro-cesses. J Anim Ecol 47:219–247
Arkoosh MR, Clemons E, Kagley AN, Stafford C and others(2004) Survey of pathogens in juvenile salmon Onco rhyn -chus spp. migrating through Pacific Northwest estuaries.J Aquat Anim Health 16:186–196
Austin B, Rayment JN (1985) Epizootiology of Renibacteriumsalmoninarum, the causal agent of bacterial kidney dis-ease in salmonid fish. J Fish Dis 8:505–509
Balfry SK, Albright LJ, Evelyn TPT (1996) Horizontal transferof Renibacterium salmoninarum among farmed salmonidsvia the fecal-oral route. Dis Aquat Org 25:63–69
Beacham TD, Evelyn TPT (1992) Population and genetic variation in resistance of Chinook salmon to vibriosis,furunculosis, and bacterial kidney disease. J Aquat AnimHealth 4:153–167
Beamish RJ (1980) Adult biology of the river lamprey (Lampe-tra ayresi) and the Pacific lamprey (Lampetra tridentata)from the Pacific coast of Canada. Can J Fish Aquat Sci 37:1906–1923
Beamish RJ, Youson JH (1987) Life history and abundance ofyoung adult Lampetra ayresi in the Fraser River and theirpossible impact on salmon and herring stocks in the Straitof Georgia. Can J Fish Aquat Sci 44:525–537
Bell GR, Traxler GS (1986) Resistance of the Pacific lamprey,Lampetra tridentata (Gairdner), to challenge by Renibac-terium salmoninarum, the causative agent of kidney dis-ease in salmonids. J Fish Dis 9:277–279
Bruno DW (2004) Prevalence and diagnosis of bacterial kid-ney disease (BKD) in Scotland between 1990 and 2002. DisAquat Org 59:125–130
Burnham KP, Anderson DR (2002) Model selection and multimodel inference: a practical information-theoreticapproach. Springer-Verlag, New York, NY
Clifford DL, Mazet JAK, Dubovi EJ, Garcelon DK, Coonan TJ,Conrad PA, Munson L (2006) Pathogen exposure inendangered island fox (Urocyon littoralis) populations:implications for conservation management. Biol Conserv131:230–243
Cvitanich JD (1994) Improvements in the direct fluorescent
antibody technique for the detection, identification, andquantification of Renibacterium salmoninarum in sal mo -nid kidney smears. J Aquat Anim Health 6:1–12
Daszak P, Cunningham AA, Hyatt AD (2000) Emerging infec-tious diseases of wildlife — threats to biodiversity andhuman health. Science 287:443–449
Eissa AE, Elsayed EE, McDonald R, Faisal M (2006) Firstrecord of Renibacterium salmoninarum in the sea lamprey(Petromyzon marinus). J Wildl Dis 42:556–560
Elliott DG, Pascho RJ (2001) Evidence that coded-wire- tagging procedures can enhance transmission of Renibac-terium salmoninarum in Chinook salmon. J Aquat AnimHealth 13:181–193
Evelyn TPT, Ketcheson JE, Prosperi-Porta L (1986a) Use of erythromycin as a means of preventing vertical transmissionof Renibacterium salmoninarum. Dis Aquat Org 2:7–11
Evelyn TPT, Prosperi-Porta L, Ketcheson JE (1986b) Experi-mental intra-ovum infection of salmonid eggs with Reni-bacterium salmoninarum and vertical transmission of thepathogen with such eggs despite their treatment with erythromycin. Dis Aquat Org 1:197–202
Good TP, Beechie TJ, McElhany P, McClure MM, Ruck-elshaus MH (2007) Recovery planning for EndangeredSpecies Act-listed Pacific salmon: using science to informgoals and strategies. Fisheries 32:426–440
Hard JJ, Elliott DG, Pascho RJ, Chase DM, Park LK, WintonJR, Campton DE (2006) Genetic effects of ELISA-basedsegregation for control of bacterial kidney disease in Chi-nook salmon (Oncorhynchus tshawytscha). Can J FishAquat Sci 63:2793–2808
Haydon DT, Cleaveland S, Taylor LH, Laurenson MK (2002)Identifying reservoirs of infection: a conceptual and prac-tical challenge. Emerg Infect Dis 8:1468–1473
Holey ME, Elliott RF, Marcquenski SV, Hnath JG, Smith KD(1998) Chinook salmon epizootics in Lake Michigan: Pos-sible contributing factors and management implications.J Aquat Anim Health 10:202–210
Johnson RM, Bryden CA, Heath DD (2003) Utility of geneti-cally based health indicators for selection purposes in cap-tive-reared Chinook salmon, Oncorhynchus tshawytscha,Walbaum. Aquacult Res 34:1029–1036
Johnson PTJ, Ives AR, Lathrop RC, Carpenter SR (2009) Long-term disease dynamics in lakes: causes and consequencesof chytrid infections in Daphnia populations. Ecology90:132–144
Kalinowski ST, Manlove KR, Taper ML (2007) ONCOR: acomputer program for genetic stock identification. Depart -ment of Ecology, Montana State University, Bozeman, MT
Kent ML, Traxler GS, Kieser D, Richard J and others (1998)Survey of salmonid pathogens in ocean-caught fishesin British Columbia, Canada. J Aquat Anim Health 10:211–219
Le Morvan C, Troutaud D, Deschaux P (1998) Differentialeffects of temperature on specific and nonspecific immunedefences in fish. J Exp Biol 201:165–168
Lynam CP, Gibbons MJ, Axelsen BE, Sparks CA, Coetzee J,Heywood BG, Brierley AS (2006) Jellyfish overtake fish ina heavily fished ecosystem. Curr Biol 16:R492–R493
Manel S, Gaggiotti OE, Waples RS (2005) Assignment meth-ods: matching biological questions with appropriate tech-niques. Trends Ecol Evol 20:136–142
McGeer JC, Baranyi L, Iwama GK (1991) Physiologicalresponses to challenge tests in six stocks of coho salmon(Oncorhynchus kisutch). Can J Fish Aquat Sci 48:1761–1771
McKibben CL, Pascho RJ (1999) Shedding of Renibacteriumsalmoninarum by infected Chinook salmon Oncorhynchus
171

Mar Ecol Prog Ser 432: 161–172, 2011
tschawytscha. Dis Aquat Org 38:75–79McVicar AH, Olivier G, Traxler GS, Jones S, Kieser D, Mac -
Kinnon AM (2006) Cultured and wild fish disease inter -actions in the Canadian marine environment. In: A scien-tific review of the potential environmental effects ofaquaculture in aquatic ecosystems, Vol 4. Can Tech RepFish Aquat Sci 2450
Melingen GO, Nilsen F, Wergeland HI (1995a) The serumantibody levels in Atlantic salmon (Salmo salar L.) aftervaccination with Vibrio salmonicida at different times dur-ing the smolting and early post-smolt period. Fish Shell-fish Immunol 5:223–235
Melingen GO, Stefansson SO, Berg A, Wergeland HI (1995b)Changes in serum protein and IgM concentration duringsmolting and early post-smolt period in vaccinated andunvaccinated Atlantic salmon (Salmo salar L.). Fish Shell-fish Immunol 5:211–221
Mesa MG, Poe TP, Maule AG, Schreck CB (1998) Vulnerabil-ity to predation and physiological stress responses in juve-nile chinook salmon (Oncorhynchus tshawytscha) experi-mentally infected with Renibacterium salmoninarum. CanJ Fish Aquat Sci 55:1599–1606
Mesa MG, Maule AG, Poe TP, Schreck CB (1999) Influence ofbacterial kidney disease on smoltification in salmonids: Isit a case of double jeopardy? Aquaculture 174:25–41
Mesa MG, Maule AG, Schreck CB (2000) Interaction of infec-tion with Renibacterium salmoninarum and physical stressin juvenile chinook salmon: physiological responses, dis-ease progression, and mortality. Trans Am Fish Soc 129:158–173
Meyers TR, Thrower F, Short S, Lipson K, Joyce J, FarringtonC, Doherty S (1999) Different prevalences of Renibac-terium salmoninarum detected by ELISA in Alaskan chi-nook salmon Oncorhynchus tshawytscha spawned fromfreshwater and seawater. Dis Aquat Org 35:101–105
Mobrand LE, Barr J, Blankenship L, Campton DE and others(2005) Hatchery reform in Washington state: principlesand emerging issues. Fisheries 30:11–23
Moles A (1997) Effect of bacterial kidney disease on saltwateradaptation of coho salmon smolts. J Aquat Anim Health9:230–233
Montali RJ, Mikota SK, Cheng LI (2001) Mycobacteriumtuberculosis in zoo and wildlife species. Rev Sci Tech 20:291–303
Mumby PJ, Hedley JD, Zychaluk K, Harborne AR, BlackwellPG (2006) Revisiting the catastrophic die-off of the urchinDiadema antillarum on Caribbean coral reefs: fresh in -sights on resilience from a simulation model. Ecol Model196:131–148
Murray CB, Evelyn TPT, Beacham TD, Barner LW, KetchesonJE, Prosperi-Porta L (1992) Experimental induction of bac-terial kidney disease in chinook salmon by immersion andcohabitation challenges. Dis Aquat Org 12:91–96
Myers JM, Kope RG, Bryant GJ, Teel DJ and others (1998)Status review of Chinook salmon from Washington, Idaho,Oregon, and California. NOAA Technical MemorandumNMFS-NWFSC-35, US Department of Commerce, Wash-ingtion, DC
Myers MS, Anulacion BF, French BL, Reichert WL and others
(2008) Improved flatfish health following remediation of aPAH-contaminated site in Eagle Harbor, Washington.Aquat Toxicol 88:277–288
Pascho RJ, Elliott DG, Achord S (1993) Monitoring of the in-river migration of smolts from two groups of spring chi-nook salmon, Oncorhynchus tshawytscha (Walbaum),with different profiles of Renibacterium salmoninaruminfection. Aquacult Fish Manage 24:163–169
Pearcy WG (1992) Ocean ecology of North Pacific salmonids.University of Washington Press, Seattle, WA
Pettersen EF, Bjorlow I, Hagland TJ, Wergeland HI (2005)Effect of seawater temperature on leucocyte populationsin Atlantic salmon post-smolts. Vet Immunol Immuno -pathol 106:65–76
Pollard HA II, Flagg TA (2004) Guidelines for use of captivebroodstocks in recovery efforts for Pacific salmon. Am FishSoc Symp 44:333-345
Rannala B, Mountain JL (1997) Detecting immigration byusing multilocus genotypes. Proc Nathl Acad Sci USA 94:9197–9201
Rhodes LD, Durkin C, Nance SL, Rice CA (2006) Prevalenceand analysis of Renibacterium salmoninarum infectionamong juvenile Chinook salmon Oncorhynchus tsha wy -tscha in North Puget Sound. Dis Aquat Org 71:179–190
Rice CA, Greene CM, Moran P, Teel DJ and others (2011)Abundance, stock origin, and length of marked and un -marked juvenile Chinook salmon in the surface waters ofgreater Puget Sound. Trans Am Fish Soc 140:170–189
Richter A, Kolmes SA (2005) Maximum temperature limits forChinook, coho, and chum salmon, and steelhead trout inthe Pacific Northwest. Rev Fish Sci 13:23–49
Sanders JE, Pilcher KS, Fryer JL (1978) Relation of water tem-perature to bacterial kidney disease in coho salmon(Oncorhynchus kisutch), sockeye salmon (O. nerka), andsteelhead trout (Salmo gairdneri ). J Fish Res Board Can35:8–11
Sanders JE, Long JJ, Arakawa CK, Bartholomew JL, RohovecJS (1992) Prevalence of Renibacterium salmoninarumamong downstream-migrating salmonids in the ColumbiaRiver. J Aquat Anim Health 4:72–75
Seeb LW, Antonovich A, Banks MA, Beacham TD and others(2007) Development of a standardized DNA database forChinook salmon. Fisheries 32:540–552
Starliper CE, Morrison P (2000) Bacterial pathogen contagionstudies among freshwater bivalves and salmonid fishes.J Shellfish Res 19:251–258
Stentiford GD, Bignell JP, Lyons BP, Feist SW (2009) Site- specific disease profiles in fish and their use in environ-mental monitoring. Mar Ecol Prog Ser 381:1–15
Turner SM, Faisal M, DeWoody JA (2007) Zygosity at themajor histocompatibility class IIB locus predicts suscepti-bility to Renibacterium salmoninarum in Atlantic salmon(Salmo salar L.). Anim Genet 38:517–519
VanderKooi SP, Maule AG (1999) Prevalence of Renibac-terium salmoninarum in juvenile spring Chinook salmonat Columbia and Snake river hatcheries, 1993–1996.J Aquat Anim Health 11:162–169
Watts M, Munday BL, Burke CM (2001) Immune responses ofteleost fish. Aust Vet J 79:570–574
172
Editorial responsibility: Hans Heinrich Janssen, Oldendorf/Luhe, Germany
Submitted: January 17, 2011; Accepted: April 7, 2011Proofs received from author(s): June 3, 2011