Marina Cardenas, JorgeMunoz and Mukesh Chawla (1996):Resource Mobilization in Bolivia's Health...
61
Resource Mobilization for the Health Sector in Resource Mobilization for the Health Sector in Bolivia Bolivia Marina Cárdenas Robles Marina Cárdenas Robles Jorge A. Muñoz Jorge A. Muñoz UDAPSO Bolivia and Mukesh Chawla Mukesh Chawla Harvard School of Public Health July 1996 July 1996
Transcript of Marina Cardenas, JorgeMunoz and Mukesh Chawla (1996):Resource Mobilization in Bolivia's Health...

Resource Mobilization for the Health Sector inResource Mobilization for the Health Sector inBoliviaBolivia
Marina Cárdenas RoblesMarina Cárdenas Robles
Jorge A. MuñozJorge A. MuñozUDAPSOBolivia
and
Mukesh ChawlaMukesh ChawlaHarvard School of Public Health
July 1996July 1996

Data for Decision Making Project i
Table of ContentsTable of Contents
Executive SummaryExecutive Summary .......................................................................................................................................................................................... 11
1. Introduction1. Introduction .................................................................................................................................................................................................... 66
2. Overview2. Overview ............................................................................................................................................................................................................ 88
3. The Health Status of Bolivia's Population3. The Health Status of Bolivia's Population ................................................................................................................ 1111
4. The Health Sector4. The Health Sector ................................................................................................................................................................................ 1414Background .................................................................................................. 14
5. Health Care Spending in Bolivia5. Health Care Spending in Bolivia .......................................................................................................................................... 2020
6. Financing Health Services in Bolivia6. Financing Health Services in Bolivia ................................................................................................................................ 2323
7. Central Government and Municipal Tax Revenues7. Central Government and Municipal Tax Revenues ........................................................................................ 2525
8. Social Insurance and Public Health Funds8. Social Insurance and Public Health Funds ................................................................................................................ 3131
9. Private Health Insurance and Pre-Paid Medicine Programs9. Private Health Insurance and Pre-Paid Medicine Programs .................................................................. 3535
10. User Charges10. User Charges .......................................................................................................................................................................................... 3737
11. International Cooperation11. International Cooperation ........................................................................................................................................................ 3939
12. Case Studies12. Case Studies .......................................................................................................................................................................................... 4040PROSALUD .................................................................................................. 40National Mother-Child Insurance Program ...................................................... 42
13. Conclusions13. Conclusions .............................................................................................................................................................................................. 4646
14. Bibliography14. Bibliography ............................................................................................................................................................................................ 4949Supreme Decrees ......................................................................................... 52
Appendix 1Appendix 1 ............................................................................................................................................................................................................ 5353
Appendix 2Appendix 2 ............................................................................................................................................................................................................ 5454

ii Marina Cárdenas Robles, Jorge A. Muñoz and Mukesh Chawla
AcknowledgementsAcknowledgements
This study was supported by the United States Agency for International Devel-opment (USAID) Washington through the AFR/SD/Health and Human Resourcesfor Africa (HHRAA) Project, under the Health Care Financing and Private SectorDevelopment portfolio, whose senior technical advisor is Abraham Bekele.
We would like to thank the following individuals for their collaboration:
Lic. Guillermo AponteNational Secretariat of Health (SNS)
Dr. Rosario GarciaNational Secretariat of Health (SNS)
Dr. Rolando AguirreCommunity and Child Health Project (CCH)
Lic. Hugo LoayzaInitiatives Project/USAID
Dr. Ramiro ZuletaInformation Systems Department, SNS
Lic. Gonzalo CallisayaBudget Department, SNS
Dr. Stephan PeláezMedicentro - Servisalud
Dr. Fernando LavadenzIntegrated Health Services Project (PROISS)
Dr. Virginia ParedesNational Head of the Leshmaniasis Program
Lic. Alberto LeytónPublic Investment & International Financing Under-Secretariat (SIPFE)
Dr. Christian DarrásPan-American Health Organization (PAHO/WHO)

Data for Decision Making Project iii
Dr. Carlos CuellarPROSALUD
Dr. Jennifer LeachWorld Bank
Hope Sukin and Abraham Bekele of the HHRAA project at the Africa Bureaureviewed and gave technical input to the report.
We would also like to acknowledge the Profesional Medical School of Bolivia,and give our special thanks to Roberto Avila Cárcamo (Economist at the Univer-sidad Mayor de San Andrés), for his invaluable help in data processing andstatistical analysis.

iv Marina Cárdenas Robles, Jorge A. Muñoz and Mukesh Chawla
List of AcronymsList of Acronyms
ABOSMEPABOSMEP Bolivian Association of Pre-paid MedicineBolivian Association of Pre-paid Medicine
APSAPS Primary Health Care.Primary Health Care.
BIDBID Inter-American Development Bank.Inter-American Development Bank.
CELADECELADE Latin American Center of Demography.Latin American Center of Demography.
CFSCFS Railroad Workers Health Fund.Railroad Workers Health Fund.
CISSCISS Inter-American Conference of Social SecurityInter-American Conference of Social Security
CNPVCNPV National Census of Population and Housing.National Census of Population and Housing.
CNSCNS National Health Fund.National Health Fund.
CPSCPS Oil Workers Health Fund.Oil Workers Health Fund.
CSBECSBE State Banking Workers Health Fund.State Banking Workers Health Fund.
CSBPCSBP Private Banking Workers Health Fund.Private Banking Workers Health Fund.
CSCAMCSCAM National Road Service Health Fund.National Road Service Health Fund.
CSCORDERSCSCORDERS Regional Development Corporations Health Fund.Regional Development Corporations Health Fund.
DGADGA General Customs Directorate.General Customs Directorate.
DGIIDGII General Internal Revenue Directorate.General Internal Revenue Directorate.
DIDESDIDES Departmental Health Directorate.Departmental Health Directorate.
DILOSDILOS Local Health Boards.Local Health Boards.
DNVCERDNVCER National Directorate of Alert Watch and Control of Diseases andNational Directorate of Alert Watch and Control of Diseases andRisks.Risks.
DSDS Supreme Decree.Supreme Decree.
EDASEDAS Acute Diarrheal Diseases.Acute Diarrheal Diseases.
EIHEIH Living Standards Measurement Survey (LSMS).Living Standards Measurement Survey (LSMS).
ENDSAENDSA Demographic and Health National Survey.Demographic and Health National Survey.
EPFEPF Household Budget Survey.Household Budget Survey.
FISFIS Social Investment Fund.Social Investment Fund.
GACGAC Consolidated Customs Tariff.Consolidated Customs Tariff.
IBIVAIBIVA Real State and Automobiles Tax.Real State and Automobiles Tax.
IBSSIBSS Bolivian Institute of Social Research.Bolivian Institute of Social Research.
ICEICE Specific Consumption Tax.Specific Consumption Tax.
IEHDIEHD Hydrocarbons and Derivatives Tax.Hydrocarbons and Derivatives Tax.
ILDISILDIS Latin American Institute of Social Research.Latin American Institute of Social Research.

Data for Decision Making Project v
IMTIMT Municipal Transactions Tax.Municipal Transactions Tax.
INASESINASES National Institute of Health Funds.National Institute of Health Funds.
INEINE National Statistics Institutes.National Statistics Institutes.
IRASIRAS Acute Respiratory Diseases.Acute Respiratory Diseases.
ITIT Transactions Tax.Transactions Tax.
IUEIUE Corporate Profits Tax.Corporate Profits Tax.
IVAIVA Value-Added Tax (VAT).Value-Added Tax (VAT).
IVEIVE Foreign Travel Tax.Foreign Travel Tax.
LDALDA Administrative Decentralization Law.Administrative Decentralization Law.
LPPLPP Popular Participation Law.Popular Participation Law.
MDHMDH Ministry of Human Development.Ministry of Human Development.
MPSSPMPSSP Ministry of Social Welfare and Public Health.Ministry of Social Welfare and Public Health.
NBINBI Unsatisfied Basic Needs.Unsatisfied Basic Needs.
OMSOMS World Health Organization (WHO).World Health Organization (WHO).
ONG’SONG’S Non-government Organizations (NGO).Non-government Organizations (NGO).
OPSOPS Pan-American Health Organization (PAHO).Pan-American Health Organization (PAHO).
PAEPAE Strategic Actions Program.Strategic Actions Program.
PIAASPIAAS Integrated Plan of Health Sector Activities.Integrated Plan of Health Sector Activities.
PIBPIB Gross Domestic Product (GDP).Gross Domestic Product (GDP).
PNCPNC National Chagas Program.National Chagas Program.
PNLPNL National Leshmaniasis Program.National Leshmaniasis Program.
PNMPNM National Malaria Program.National Malaria Program.
PNTPNT National Tuberculosis Program.National Tuberculosis Program.
PNUDPNUD United Nations Development Program (UNDP).United Nations Development Program (UNDP).
PPAPPA Purchasing Power Parity (PPP).Purchasing Power Parity (PPP).
PROISSPROISS Integrated Health Services Project.Integrated Health Services Project.
PSFPSF Integrated Program of Basic Health Services and SectorIntegrated Program of Basic Health Services and SectorInstitutional Institutional Strengthening.Strengthening.
RC-IVARC-IVA Complementary VAT Tax.Complementary VAT Tax.
SBSPSBSP Bolivian Society of Public Health.Bolivian Society of Public Health.
SDDHSDDH Departmental Secretariat of Human Development.Departmental Secretariat of Human Development.
SISFINSISFIN International Financing Information System.International Financing Information System.
SISINSISIN National System of Public Investment.National System of Public Investment.
SNISSNIS National System of Health Sector Information.National System of Health Sector Information.
SNSSNS National Health Secretariat.National Health Secretariat.
SPSSPS Public Health System.Public Health System.
SSSS Social Security (= Health Funds plus Pension Funds).Social Security (= Health Funds plus Pension Funds).

vi Marina Cárdenas Robles, Jorge A. Muñoz and Mukesh Chawla
SIPFESIPFE Public Investment and International Financing Under-Public Investment and International Financing Under-Secretariat.Secretariat.
TGBTGB Free Transaction of Goods.Free Transaction of Goods.
TGNTGN National Treasury.National Treasury.
UDAPEUDAPE Economic Policy Analysis Unit.Economic Policy Analysis Unit.
UDAPSOUDAPSO Social Policy Analysis Unit.Social Policy Analysis Unit.
UNICEFUNICEF United Nations Children Fund.United Nations Children Fund.
UPPUPP Population Policy Unit.Population Policy Unit.

Data for Decision Making Project 1
Executive SummaryExecutive Summary
As part of its overall strategy of conducting policy-relevant research into mattersthat are likely to be of importance to government policy-makers and USAID missionsin Africa, the Africa Bureau in USAID under its Health and Human ResourcesAnalysis for Africa project commissioned the Data for Decision Making project(DDM) at Harvard University to conduct five case studies on resource mobilizationfor the health sector. Three of these case studies were carried out in sub-SaharanAfrica, and two outside of Africa. One of the countries selected for this outside ofAfrica is Bolivia, and the present report describes Bolivia’s experience with resourcemobilization.
Located near the center of South America, Bolivia (area 1.1 million square km) hasa population of approximately 7.0 million, of which 58% live in urban areas (table1). Over 75% of Bolivians have indigenous roots, and are primarily Quechua andAymara, though other ethnic groups can also be found in the Bolivian Amazon.Close to one third of the population is functionally illiterate (20% never attendedschool), and is concentrated in rural areas and among women. Approximately halfof urban households and over 90% of rural ones have unsatisfied basic needs suchas access to drinking water, sewage, and basic education and health services. Theinfant mortality rate is high by Latin American standards (75 per 1000 live births).Diarrhea and acute respiratory diseases continue to be the main sources of infantmortality, accounting for 32% and 19% of all deaths, respectively. The maternalmortality rate is also high by South American standards, at 390 per 100,000 livebirths.
Bolivia experienced an economic crisis in the beginning of the 1980’s, with inflationaveraging 46% monthly. In August 1985, Bolivia began a drastic structuraladjustment program that stabilized the economy, reduced the role of the State indirectly productive activities, and controlled its public finances. Inflation hasremained steady between 8.5% and 14.5% over the last six years, and in the lastthree years the public sector deficit has not exceeded 3.2%. In the second phase ofreforms in 1993 the “Popular Participation and Administrative DecentralizationReform” was introduced, which transferred resources and primary responsibility,with respect to planning and implementation of public investment projects, from thecentral government to the prefectures and municipalities. This includes the publichealth care system previously administered centrally by the National HealthSecretariat (SNS). As part of the structural adjustment program, Bolivia will begin a“Health Sector Reform” within the next few years, for which preliminary designstudies and planning have already started.

2 Marina Cárdenas Robles, Jorge A. Muñoz and Mukesh Chawla
The main sources of health care financing in Bolivia are (i) central government taxrevenues, channeled through the National Treasury, and municipal revenues,including funds received from the central government, referred to as “co-participationfunds,”; (ii) public health insurance funds; (iii) private health insurance and pre-paidmedicine schemes; (v) user charges; and (vi) international cooperation funds.
Total tax collections of the central government have shown a steady increase overtime, from Bs. 1166 million in 1989 to Bs. 2,435 million (approximately US$530million) in 1994 (all figures in 1990 Bs.). Internal revenue has contributed to mostof this growth, more than doubling over the five year period, while tariff revenue hasregistered only a modest 10% growth.
Public spending on health has increased from Bs. 226.10 million in 1989 to Bs.346.31 in 1994 (all figures in 1990 Bs.), which represents a fall from 19.4% oftotal tax collection in 1989 to 14% in 1994. In 1995, the SNS spent about Bs.477 million (US$99 million) at an average of Bs. 68 (approx. US$14) per personon recurrent costs related to health care. A bulk of this expenditure (around 85%) ison staff salaries (both medical and administrative), with the remaining going toother recurrent costs.
Central tax revenues support a vast network of public sector health institutions,which are administratively under the control of the National Health Secretariat.However, since the implementation of the Popular Participation Law, all SNSinstitutions have been transferred to Municipal Governments. According to theNational System of Health Information, the number of registered institutions in thepublic health sector grew from 1,304 in 1990 to 1,788 in 1994, with a total of7,203 beds, so that in 1994 there was one public sector health care provider forevery 2,758 persons, or one bed for every 685 persons. SNS uses its tax funds toemploy 2,011 doctors, i.e., 2.9 doctors for every 10,000 people.
In terms of utilization of SNS facilities, the 1992 national census indicates that30% of the ill population seeks treatment from SNS facilities. SNS facilities havebeen particularly successful in immunization programs and mother and infant care.However, there remain a number of concerns regarding the equitable use of SNSfacilities, since only 10% of those who sought treatment from SNS facilitiesbelonged to the lowest per-capita spending quintile.
Another major source of financing for health care services in Bolivia is the system ofpublic health funds (insurance) known as “Cajas de Salud”. There are 7 healthfunds and 10 integrated insurance plans, and jointly they have 236 facilities with3,123 beds. All public agencies are required by law to contribute to some publichealth fund, while private sector organizations have the option of affiliatingthemselves to a health fund, or contributing to pre-paid medicine schemes on behalfof their employees. Contribution rates to health funds are fixed at 10% of grosssalaries. The system of public health funds receives no transfers from the National

Data for Decision Making Project 3
or Municipal Governments. In 1995, the public health funds system had a budget ofapproximately US$108 million, which represented an expenditure of US$67.8 foreach potential beneficiary.
There is very limited use of private health insurance in Bolivia. Only a handful ofcompanies offer health insurance policies, and these require very high annualpremia. Pre-paid medicine programs are gradually becoming very popular. Theseprograms charge an annual entry fee which gives the client the right to a givenpackage of limited services. The average annual premium for these centers isUS$215 per person. The most common packages are gynecological, pregnancy,dentistry, and geriatric services. These are low-risk health services, characterized byfairly predictable demand, for both the user and the provider.
Private physician offices and pre-paid medicine provide medical care primarily to theupper middle class, and are found almost exclusively in urban areas. According torepeated rounds of LSMS surveys, households with the highest disposable incomesuse private health care providers in urban areas. Around 70% of all private sectorusers belong to the wealthiest 40% of the population, while only 15% belong to thepoorest 40%. A disproportionately large 43% of all users belong to the fifth quintile,while less than 5% belong to the poorest 20% of the population.
There is little information available regarding out-of-pocket household expenditureson health care. According to the Survey of Household Budgets (EPF) carried out inLa Paz, Cochabamba, Santa Cruz and El Alto in 1990, households spend anaverage of Bs.45 per month (approx. US$14) on health care, which is less than4% of total household expenditures (Urquiola 1994). This proportion varies from2.4% in the poorest quintile (quintile 1) to 4.9% in the richest quintile (quintile 5).Differences across quintiles is more pronounced in absolute terms; average monthlyper capita spending in the first quintile is US$ 3.11, while in the fifth quintile it isUS$38.3. On average, 40% of these expenditures are for drugs and the remaining60% is for services (figure 6). These shares are similar to those in other LatinAmerican countries (OPS/OMS, 1994). On the assumption that households insmaller cities and rural areas have lower expenditure patterns than the averagehousehold in the four main cities, total household expenditure on health in Boliviacan be estimated to be of the order of magnitude of between Bs. 375 million(US$117 million).
International cooperation funds also play an important role in the financing of thehealth sector, especially in terms of fixed investments, and several large projectshave been funded by support from these funds. These projects have had a significantimpact on construction of new health centers, and have generally improved thequality of health care in these centers. International cooperation funds havecontributed US$27.7 million per year at an average over the last six years.

4 Marina Cárdenas Robles, Jorge A. Muñoz and Mukesh Chawla
Bolivia has an interesting private sector experience in financing primary health care.PROSALUD is a private, non-profit association that was born as a result of anUSAID project in August 1985. PROSALUD offers: (i) health care services to thecommunity; (ii) social marketing of health products; (iii) training services; (iv)applied research; and (v) technical assistance. At present, it has 28 health centersthat serve a population of 300,000 people. Of the total operating costs,approximately 75% are covered by PROSALUD funds generated by user fees. Theremainder 25% of operating costs are paid for from the income generated frommarketing of health care products (such as contraceptives, eye-wear, etc.). Trainingactivities and applied research generate minor additional resources. PROSALUDappears to be a sustainable model for the provision of comprehensive and ongoingprimary health services through decentralized, multi-purpose and permanentfacilities.
Bolivia has recently started a National Mother-Childhood Insurance program forwomen of child-bearing age and children under five. This insurance covers maternitycare and complications resulting from pregnancy and childbirth. It also coverschildren under five in the case of diuretic illnesses and acute respiratory infections.The program is partly financed by funds from the Treasury, and partly by the co-participation funds that municipalities receive from the Treasury. Loans anddonations from the international donor community cover infrastructure, equipment,training, follow-up and evaluation costs. The estimated total cost of the insuranceprogram is US$14.1 million annually.
There are several important lessons from this study. First, given the new financingstructure of public services, combined with the strict fiscal discipline in place since1985, an increase in Central Government expenditures in the health sector is veryunlikely. The Government is taking important steps to increase tax revenues,through better collection mechanisms and enforcement, but this increase is morelikely to reduce the fiscal deficit rather than increase expenditures. Second, thanksto Popular Participation, Municipal Governments now have primary responsibility forthe delivery of health services which, combined with greater social pressure at thelocal level, will most likely result in an increase in tax revenues at the municipallevel. However, given the historical neglect in all public services in mostmunicipalities, only part of this increase in revenue will go to health care. Third,there is a significant proportion of users of public health care facilities in urbanareas (SNS and health funds) who belong to the highest income quintiles and couldpotentially pay higher user fees for the services they receive. At the same time,many high income patients who are eligible to use facilities belonging to publichealth funds actually choose private providers instead.
Our findings suggest that equity and efficiency issues in Bolivia’s public health caresystem can be better addressed by more careful rationing of service deliveryaccording to income. There is also some potential for increasing the contributingbase to public health funds (medium and large size private firms, as well as micro-

Data for Decision Making Project 5
enterprises and the informal sector) which, combined with more careful rationing ofusers, would increase significantly the access to health care by the poor, especiallyin urban areas. At the same time, the government should evaluate different ways ofmaking facilities belonging to health care funds more accessible to the rural poor.Also, it is recommended that the current financing structure (which separates staffcosts from investment and other recurrent costs) be evaluated carefully in terms ofthe efficiency and sustainability of health care delivery. The strict fiscal constraintsof the Central Government will limit the amount of staff costs that can be borne bythe state, and the Municipalities will have to find alternative sources of finance forcovering staff costs, such as increased user fees at their local health care facilities.
The Bolivian experience provides many important lessons for other countriesconsidering decentralization in their health sectors. Decentralization certainlyprovides a more effective incentive structure for public health care facilities, andencourages more careful attention to finances, quality control, and definingpriorities, though there is always the danger that national health priorities could beneglected. Decentralization also encourages local decision-makers to seekalternative sources of funds for health care. This may include higher user fees,specific taxes, or other mandatory locally-administered contributions. The Bolivianexperience also highlights the importance of carefully defining the financingresponsibilities of central and local governments, since a purely technical separationof budget items by financing source may result in a sub-optimal mix of the variousfactors required for health care delivery.

6 Marina Cárdenas Robles, Jorge A. Muñoz and Mukesh Chawla
1. Introduction1. Introduction
As part of its overall strategy of conducting policy-relevant research into mattersthat are likely to be of importance to government policy-makers and USAID missionsin Africa, the Africa Bureau in USAID under its Health and Human ResourcesAnalysis for Africa project commissioned the Data for Decision Making project(DDM) at Harvard University to conduct five case studies on resource mobilizationfor the health sector. Resource mobilization includes a range of strategies for raisingfunds, such as enhancing government revenues, user charges, insurance, andcommunity financing. Briefly, this project has three main objectives: (a) to reviewexisting experiences with resource mobilization strategies in developing countriesand the documented experience to date; (b) to analyze the impact of these strategiesin a number of different countries in terms of their effect on equity, quality, revenuegeneration, sustainability and feasibility; and (c) to generate a set of guidelineswhich will assist African decision-makers and USAID missions in the formulation ofpolicies to mobilize resources. Three of these case studies were carried out in sub-Saharan Africa, and two outside of Africa. One of the countries selected for thisoutside of Africa is Bolivia, and the present report describes Bolivia’s experiencewith resource mobilization.
The primary goal of the present study is (i) to present an overview of health carefinancing, production and delivery in Bolivia; (ii) analyze flow of funds, withparticular emphasis on the contribution of taxes, insurance, user fees, donorassistance etc. to financing healthcare, over the last 5-10 years; (iii) analyzecontribution of different financing methods, like general taxes, special taxes, socialinsurance, private insurance, user fees, donor assistance, and (iv) discuss specificcase studies, on communal funds and PROSALUD.
Bolivia started sweeping stabilization and structural adjustments in 1985, followingit up with a second phase in 1993. The adjustment program included an EducationReform, a Capitalization Program, and a revolutionary Popular Participation andAdministrative Decentralization Reform. The health sector is due to undergo reformsof its own in the next couple of years, though some general transformations inadministrative and financing mechanisms are evident even now.
This study describes the various mechanisms of health care financing, and isorganized as follows. A general overview of Bolivia, its geography, population, andeconomy is presented in chapter 2. The health status of Bolivia is discussed inchapter 3, and the health sector is described in chapter 4. Health care spending is

Data for Decision Making Project 7
analyzed in chapter 5, and a national health accounts matrix is presented inchapter 6. Different methods of revenue mobilization for the health sector arediscussed in chapters 7 to 11. Two interesting initiatives, one private and onepublic, on financing the delivery of primary health care are described and analyzedin chapter 12, and the study ends with concluding remarks in chapter 13.

8 Marina Cárdenas Robles, Jorge A. Muñoz and Mukesh Chawla
2. Overview2. Overview
Located near the center of South America, Bolivia (area 1.1 million square km) hasa population of approximately 7.0 million, of which 58% live in urban areas (table1). Over 75% of Bolivians have indigenous roots, and are primarily Quechua andAymara, though other ethnic groups can also be found in the Bolivian Amazon. Yet,much of the “criollo” population (that is, of mixed indigenous and Europeandescent) no longer speaks any indigenous language. According to the 1992 census,only 12.5% of the population was monolingual in an indigenous language, 42.4%were bilingual (Quechua-Spanish or Aymara-Spanish), 41.9% only spoke Spanish,while the remaining 3.2% spoke more than two languages. Close to one third of the
Table 1
Bolivia: Basic Indicators
Territory 1.1 million km.²
Population (1996, est.) 7.0 million
Population Density 6.9 Inhabitants/km.²
Percentage Urban (1992) 42 %
GDP per capita (1994) US$ 770
GDP per capita (1993) (Using PPP Method) US$ 2,510
Exports (1995) US$ 1,187 million
External Debt / GDP (1995) 76 %
External Debt/ Exports (1995) 381.4 %
Rate of Functional Illiteracy (1991-94)
Rural Men 58 %
Rural Women 70 %
Urban Men 20 %
Urban Women 27 %
Percentage of Households with Unsatisfied BasicNeeds (1992)
69.8 %
Urban 51.1 %
Rural 94.0 %
Source: UDAPSO, UDAPE, INE, World Bank, UNDP.

Data for Decision Making Project 9
population is functionally illiterate (20% never attended school), and isconcentrated in rural areas and among women.
Geographically, Bolivia can be divided into three different regions: the Altiplano, theinter-Andean valleys (some arid, some humid), and the eastern lowlands. Theseclimactic regions cover 20%, 20% and 60% of Bolivia’s territory, respectively. Thelarge majority of the population is concentrated in the highland regions of thecountry: 42% in the Altiplano and 26% in the semi-arid valleys. The populationdensity in the lowlands is less than 2.9 persons per sq. km.
Politically and administratively, Bolivia is divided into nine departments and 311municipalities. The departments are administrated by department prefectures whoare part of the executive branch, while the municipalities, which have both urbanand rural jurisdictions, are autonomous governments elected directly by the people.
With a per capita income of US$770 in 1994, Bolivia ranks alongside suchcountries as Lesotho and Indonesia (World Bank 1996). In terms of purchasingpower parity, however, Bolivia ranks alongside Guatemala and Honduras in LatinAmerica or Swaziland and Namibia in Africa, with a per capita income equivalent ofUS$2,510 (UNDP 1996). There are no reliable statistics on income distribution inBolivia; there is a general impression in Bolivia that there is great inequality withregard to wealth, income and opportunities for social mobility between high incomegroups (basically urban) and the poor (overwhelmingly rural and peri-urban).According to the Poverty Map, which uses data from the 1992 Census, the basichuman needs of 51% of urban households and 94% of rural ones are not met, andalmost half of the families living in urban areas and almost all of those living inrural areas do not have access to drinking water, sewage, and basic education andhealth services.
Historically, the mining sector has been the major source of Bolivia’s economicgrowth, with most of its income being derived from exports of high value-per-weightnatural resources. Silver was the predominant export till the 1970’s, and has sincebeen replaced by natural gas and some agricultural products. The total value ofBolivia’s exports in 1995 was US$1,187 million, of which 43% came fromminerals, 13% from hydrocarbons, and 44% from non-traditional goods, such assoybeans, coffee, beef, forestry products, and others.
Bolivia experienced the worst socio-economic crisis in its history in the beginning ofthe 1980’s. Between August 1984 and August 1985, inflation reached a monthlyaverage of 46% and an annual compounded rate of 24,000%, the world highesthyperinflation since World War II and the seventh ever in history. In August 1985,Bolivia began a drastic structural adjustment program that stabilized the economy,reduced the role of the State in directly productive activities, and controlled itspublic finances. Inflation has remained steady between 8.5% and 14.5% over thelast six years, and in the last three years the public sector deficit has not exceeded3.2%.
10 Marina Cárdenas Robles, Jorge A. Muñoz and Mukesh Chawla
A second phase of reforms was initiated in 1993, and included such reforminterventions as the “Education Reform”, “Capitalization Reform”, and “PopularParticipation and Administrative Decentralization Reform”. The Education Reformseeks to reassign public expenditure to basic education, improve primary andsecondary education, increase the access to education to rural women, improveteachers’ performance, and begin the process of basic education in the mothertongue of students. The Capitalization Program transfers the management and 50%of the equity of public enterprises to a “strategic” partner (through an internationalpublic competitive bidding process), in exchange for an equivalent investment in thecapitalized enterprise, while the remaining 50% of the equity is distributed amongall Bolivian adults. The Popular Participation and Administrative Decentralizationlaws transfer resources and primary responsibility, with respect to planning andimplementation of public investment projects, from the central government to the 9Prefectures and 311 Municipalities. As part of the structural adjustment program,Bolivia will begin a “Health Sector Reform” in the coming years. Preliminary designstudies and planning for this change have already started.

Data for Decision Making Project 11
3. The Health Status of Bolivia's3. The Health Status of Bolivia'sPopulationPopulation
Bolivia’s health profile is characterized by the coexistence of traditional and modernpathologies. Among the former is a high incidence of acute infections (respiratoryand intestinal), parasites and nutritional deficiencies. Among the modernpathologies is a gradual increase in the number of accidents and degenerativediseases.
Bolivia faces serious problems linked to the high incidence of endemic diseases.Vector-transmitted diseases, among them malaria, chagas and leishmaniasis, arefound in some 75% of Bolivia’s territory. In fact, 40% of the Bolivian populationlives in areas well-suited for the transmission of malaria. In 1995, the incidence ofparasitic infection in the malarial region (3.1 million inhabitants) was 1.5%(DNVCER-PNM 1995), which represents a total of 46,911 cases nationally(Appendix 1).
It is estimated that 55% of the Bolivian population is at risk of chagas infection.The mortality rate for those infected with chagas is 4% (after 15 years of beinginfected), and accounts for around 13% of the deaths among 15 to 74 year-old menand of 29% of the deaths among 25 to 44 year-old men (National Chagas Program,PNC, 1991). Many of the non-fatal chagas cases are usually accompanied bychronically incapacitating cardiac and digestive complications.
Leishmaniasis is an infectious disease caused by a parasite of the same name, withan incidence rate in Bolivia of 26.3 cases for each 100,000 inhabitants. Some1,500 new cases are discovered each year (National Leishmaniasis Program, PNL,1996).
Tuberculosis continues to be a problem in Bolivia, with 10,000 infections each year(Appendix 1). The incidence rate for tuberculosis in Bolivia for 1995 was 129 casesfor each 100,000 inhabitants (National Tuberculosis Program, PNT), accounting forsome 5,038 deaths (Cardenas et al. 1995).
Close to one third of Bolivian children under three years of age suffer from chronicmalnutrition. In 1994, the infant mortality rate was 75 for each 1,000 live births,which represents a significant improvement since 1976, when the infant mortalityrate was 169. The mortality rate for children under five also improved to 116 per1,000 live births in 1989-94 from 150 in 1984-89 to 1989-94 (table 2). These

12 Marina Cárdenas Robles, Jorge A. Muñoz and Mukesh Chawla
statistics, however, do not show the great disparities between different regions ofthe country. For example, the mortality rate among rural children was 162/1,000 inthe 1984-89 period, while the urban rate was 104. In the inter-Andean valleys, therate was 158, in comparison to 142 in the Altiplano and 84 in the lowlands.
Additionally, there is a strong correlation between the mother’s educational leveland the probability of childhood mortality. During the 1984-89 period, childhoodmortality was 187/1,000 when the mother lacked education, 158/1,000 when shehad basic education and 97/1,000 when she had intermediate level education(National Demographic and Health Survey, ENDSA, 1994). In all cases, however,the national average is much higher than the childhood mortality rates of othercountries in the Andean region, such as 76/1,000 in Peru, 57/1,000 in Ecuador,37/1,000 in Colombia and 28/1,000 in Venezuela (UNICEF/CELADE 1993).
The main causes of childhood mortality in Bolivia are diarrhea and acute respiratoryinfections. It is estimated that 35.7% of deaths of children under five are a resultof acute diarrheal illnesses and 20.4% of acute respiratory infections (Aponte1996).
The maternal mortality rate in Bolivia (390 for 100,000 live births in the period1984-89) is very high in comparison with other Latin American countries (for 1980-
Table 2
Bolivia: Selected Health Indicators, 1989-1994
Indicator 1989 1994
Infant Mortality Rate (per 1000 live births)* 99/a 75/b
Urban 78/a 60/b
Rural 121/a 92/b
Prevalence of Acute Respiratory Infections 25 19
Percentage of Children Under 5 with Moderate Malnutrition 13.3 15.7
Percentage of Children with Complete Immunization 13.3 36.6
Global Fertility Rate 5.6/a 4.8/b
Rate of Maternal Mortality (x 100 thousand live births) 416/a 390/b
Percentage of Prenatal Care by Medical Personnel 44 49.5
Percentage of Women Using Modern Contraception Methods 12.2 17.8
Urban 17.9 25.3
Rural 5.2 6.9
Source: ENDSA 1994
(*) a/ 1984-89

Data for Decision Making Project 13
91, maternal mortality in Columbia was 200 for 100,000 live births, 170 inEcuador and 59 in Venezuela). As with other indicators, the maternal mortality ratealso hides regional differences. In rural areas, maternal mortality reaches 524 for100,000 live births, as opposed to 274 for urban areas. The regional differencesare even more pronounced between the lowlands (110) and the Altiplano (602)(ENDSA 1994). Every year, about 1,000 women die in Bolivia as a result ofpregnancy, delivery and post-partum related complications, leaving approximately3,000 orphaned children (Strategic Actions Program, PAE, 1996).
Modern health problems are associated with accidents and other traumas whichconstitute the main causes of hospitalization, resulting in strong budgetarypressures on the health system and requiring investments in complex and expensivetechnical equipment.

14 Marina Cárdenas Robles, Jorge A. Muñoz and Mukesh Chawla
4. The Health Sector4. The Health Sector
BackgroundBackground
The first public initiatives in the health sector in Bolivia occurred in 1909, when thegovernment created the National Directorates and Departmental Authorities ofHealth. With the Revolution of 1952, which nationalized mines and brought aboutagrarian reform and universal suffrage, a National Health Service (SNS) and asanitary code were created. In 1960, the SNS was made operational with thecentralization of planning norms and the decentralization of executive actions. Thebasic functions of health services and community participation were integrated intothe National Directorate for Health.
In the 1960s the idea of integrating the social security system into the SNS waspromoted without much success. There were several other proposals, such as thecreation of a National Council for Health, enactment of a sanitary code, and thecreation of decentralized health zones and districts, some of which were accepted.Following these proposals, a Medical Supply Center, the Statute for MedicalFunctionaries, a Committee for Hospital Planning, and a National Inoculation Bankwere created. Nevertheless, the development of a regionalized SNS is relativelyrecent in Bolivia, and the basic health needs of the majority of Bolivians continuesto be unmet (Dabdoub 1994).
The Strategy for Economic and Social Development of 1989 proposed thedecentralization of health services with the objective of correcting the administrativedeficiencies of the system. Nevertheless, the lack of coordination between centralplanning and regional operations, combined with the Ministry’s absolute power tohire, fire and fix staff salaries throughout the entire system, were the chief obstaclesto consolidating a truly decentralized model (Dabdoub 1994).
The new government that was elected in 1993 created the Ministry for HumanDevelopment (MDH). The National Health Secretariat (SNS), previously known asthe Ministry of Social Welfare and Public Health (MPSSP), is a part of the MDH.The MDH, as the regulating entity, dictated new norms to adjust the health systemto the mandates of the Popular Participation and Administrative Decentralizationreforms. The Popular Participation Law (LPP) of April 20th, 1994, established that20% of the national tax revenues be distributed among the country’s 311municipalities. Likewise, the power to levy taxes on urban and rural properties,

Data for Decision Making Project 15
automobiles, boats, and airplanes was also transferred to the municipalities, andrural communities and urban neighborhood councils were given a supervisory rolethrough “Vigilance Committees” of the Municipal Government.
The Administrative Decentralization Law (LDA), promulgated on July 28th, 1995,transfers and delegates the jurisdiction of “technical/administrative and non-exclusive” functions from the national executive branch to the department executivebranch. This decentralization seeks to improve the quality and efficiency of publicly-provided services at the local level.
Through the redistribution of public funds, the transfer of responsibilities anddecision-making authority, and the increased social control over public finances atthe local level, these two laws (LPP and LDD) are transforming in a radical way thepolitical and administrative structure of the country. Not surprisingly, these twolaws have had important repercussions in the health sector.
The National Health Secretariat (SNS) was divided into 12 regional HealthSecretariats before the implementation of the Popular Participation andAdministrative Decentralization Laws. With the LPP and LDA, the Ministry forHuman Development (which oversees the SNS) was decentralized into nineDepartmental Secretariats of Human Development (SDDH), each of which has aDepartmental Health Directorate (DDS) (Figure 1). The main functions of the DDSare to implement health policy, design national strategies and programs and specialprojects in the Department, administer the health service network within theirgeographic jurisdiction, set user charges and fees based on SNS technical criteria,develop the Departmental health plan, and support the investment needs ofMunicipal Governments. DDS consists of an Epidemiological Vigilance Unit and aPlanning and Programs Unit, responsible for organizing and administering theDepartmental health service networks and implementing national programs (SNS1996). National priorities (table 3) set by the Ministry for Human Development areadministered through the SNS.
At the municipal level, there exist Local Health Directorates (DILOS) which, alongwith DDS, are co-responsible for implementing national health programs. DILOSconsist of representatives from the Municipal Government, the Vigilance Committee,and the Departmental Prefecture.
Production of health services depends on the physical and human resources used bythe public and private sector providers, as well as those resources used by thepublic and private sector insurance mechanisms (Figure 2).
Overall, Bolivia has 2,128 health care facilities with 12,581 beds nation-wide, i.e.,

16 Marina Cárdenas Robles, Jorge A. Muñoz and Mukesh Chawla
Table 3
The national priorities with regard to health, as defined by the Ministry for HumanDevelopment, through the National Secretariat for Health
1. Infant-Mother Care, with the aim of reducing the morbidity and mortality rates ofwomen and children.
2. Nutrition, with the aim of reducing the caloric and nutrient deficiencies of iodine andmicro-nutrients.
3. Control of vector-transmitted diseases, with an emphasis on Malaria and Chagas.
4. Control of transmissible chronic illnesses, with the aim of reducing tuberculosis andintestinal parasitosis.
5. Prevention and control of cholera, sexually-transmitted diseases, and AIDS.
6. Mental health, with the aim of preventing alcoholism and drug-addiction.
7. Primary care, with an emphasis on prevention and education.
Local priorities are set by those responsible for health posts, the Municipal Government,neighborhood councils, peasant communities and indigenous groups, taking into accountthe incidence, prevalence, magnitude and risk factors associated with morbidity andmortality.

Data for Decision Making Project 17
Figure 1Figure 1
Institutional Organization of the Health Sector - 1996Institutional Organization of the Health Sector - 1996
LOCAL H EALTHDIRECTORATE
VIGI LANCEUNIT
VIGI LANCECOMMITEES
MUNI CIPALGOVERNME NT
DEPARTMENTALHEALTH
DIRECTORATE
NON-P ROFITGROUPS
RELIGIOUSGROUPS
PREF ECTURE
PLANNING ANDPROGRAMMING
UNIT
NATIONAL LEVEL
DEPARTMENTAL LEVEL
LOCAL LEVEL
Special Projects of theSocial Investment Fund
SO U RC E : U D A PSO , B A SED ON D .S. 24237
Minis try f or HumanDevelopment
NATIONALHEALTH
SECRETARIAT
DEPARTMENTA LSECRETARIAT FOR
HU MA N DEVELOPMENT

18 Marina Cárdenas Robles, Jorge A. Muñoz and Mukesh Chawla
one health care facility for every 3,401 inhabitants, or one bed per every 575inhabitants (table 4). There are 23,086 people employed in Bolivia’s health sector,of which 52% work in the public sector (SNS), 38% in the public health fundssystem and only 10% in the private sector (table 5). (These figures do not take intoaccount the fact that a large number of medical personnel actually work in both thepublic and private sectors). Regional imbalances are quite significant, in that of the4,433 medical doctors practicing in Bolivia, 1,704 are in La Paz, 976 in SantaCruz, 813 in Cochabamba, and only 850 in the remainder of the country.
Figure 2Figure 2
Health Subsectors - 1996Health Subsectors - 1996
General
Production ofHealth Care
Services
Public
Subsector
Hospital
Support
Hospital
Health
Centers
Social
Security
Health
University S.S
BanksClinics And
Specialization
Private
Centers
Consultation:Formal/
Traditional
NGO's
Centers ForPrepaid
Health Care
PrivateSubsector Private
HealthInsurance
Private HealthInsurance
Companies
NationalSuperintendencyFor Insurance
And Re-Insurance

Data for Decision Making Project 19
Table 4
Total Number of Health Care Facilities, 1994
1994
National Health Secretariat
Institutions 1,788
Beds 7,203
Health Funds
Institutions 236
Beds 3,123
Private Sector
Institutions 104
Beds 2,255
Total Institutions 2,128
Total Beds 12,581
Source: SNS and INASES
Table 5
Total Staff in the Health Sector
SNS Health Funds Private Total
Doctors 1,976 1,631 3,607
Nurses 1,003 891 1,894
Other Prof. 2,212 767 2,979
Infirm Asst. 3,134 1,606 4,740
Admin. andServ.
3,596 3,880 7,476
Total 11,921 8,775 2,390 23,086
Source: UDAPSO, based on SNS and INASES

20 Marina Cárdenas Robles, Jorge A. Muñoz and Mukesh Chawla
5. Health Care Spending in Bolivia
Public spending on health in Bolivia fell continuously between 1980 and 1986,from Bs. 354.29 million in 1980 to Bs. 53.87 million in 1986 (in real 1990prices), registering a fall of around 85%. As a percentage of GDP, health spendingreached an all-time low of 0.4% in 1986, down from 2.32% in 1980. With theeconomy stabilizing in 1987 and registering a positive growth rate (2.6%) for thefirst time in seven years, public spending on health also increased to Bs. 225.49million (1.7% of GDP). Public health spending increased during the period 1990 to1995, and today stands at Bs. 401.28, or around 2.16% of the country’s GDP(figure 3).
As a percentage of total public spending, the health sector accounts forapproximately 8% of all spending, which compares unfavorably with the 20%
allocation that goes to the education sector. With the exception of the crisis years(1981 to 1986) health spending has been more or less around 10% of allgovernment spending (figure 4).
TAX & C U S TO M S FEE C O LLEC TIO N S(MILLIO N S O F 1990 Bs.)
0 .0 0
5 0 0 . 0 0
1,0 0 0 . 0 0
1,50 0 .0 0
2 ,0 0 0 .0 0
2 , 5 0 0 . 0 0
19 8 9 19 9 0 19 9 1 19 9 2 19 9 3 19 9 4
Y e a r s T A X R E V E N U E
C U S T O M SS o u r c e : U D A P S O B a s e d o n N IS
FigureFigure
33

Data for Decision Making Project 21
According to the 1992 National Census, 67% of all individuals reporting an illnesssought treatment in a formal setting, while 12% sought traditional treatment; 30%of all individuals indicated that they visited an SNS facility, 14% went to publichealth fund facilities, while 23% relied on a private facility. The percentage ofpeople seeking traditional medicine was particularly high among the rural population(25%), while the public health funds, with approximately one-and-a-half millionbeneficiaries, served approximately 21% of the urban population, but only 4% of
the population in rural areas (table 6).
According to the National Demographic and Health Survey (ENDSA, 1994), 49% ofinfants received pre-natal care in 1994 and only 43% of the births were delivered
Table 6
Utilization of Health Services (% of ill population)
SNS Health Funds Private TraditionalMedicine
Other Do Not SeekTreatment
Total 30 14 23 12 10 11
Urban 26 21 31 2 10 10
Rural 35 4 13 25 10 13
Source: UDAPSO, based on the 1992 National Census
MPSSP: Ministry of Social Welfare and Public Health
Quintile of percapita consumption
1er 2do 3er 4 t o 5 t o 0
0 .5
1
1 .5
2
2 .5
3
3 .5
4
4 .5
5
(%)
1er 2do 3er 4 t o 5 t o
Quint i l de Gasto Percápi ta
GASTOS EN SALUD COMO PORCENTAJE DEL TOTAL
(La Paz, Cochabamba, Santa Cruz y El Alto)
Prod . Farmaceút icos Servicios S a l u d
Figure 4Figure 4

22 Marina Cárdenas Robles, Jorge A. Muñoz and Mukesh Chawla
with the assistance of medical personnel. Of a total of 434,546 pre-natal visitsrecorded by the National Health Information System (SNIS), 63% were provided bythe public sector (SNS), 16.8% through the public health funds system, and 20.2%in the private sector. Likewise, of 71,051 reported deliveries, 71.2% were in thepublic sector, 9.6% in public health funds facilities, and 19.2% in the private sector(SNS 1995).

Data for Decision Making Project 23
6. Financing Health Services in Bolivia6. Financing Health Services in Bolivia
There are six sources of financing health care services: (i) central government taxrevenues, channeled through the National Treasury; (ii) municipal revenues,including funds received from the central government, referred to as “co-participationfunds,” as well as municipal taxes; (iii) public health insurance funds; (iv) privatehealth insurance and pre-paid medicine schemes; (v) user charges; and (vi)international cooperation funds. We will discuss each of these in detail in thefollowing chapters.
These funds finance government facilities, health funds facilities, non-governmentorganizations and private physicians. Preliminary estimates indicate that Boliviaspent Bs. 1564 million (4.9% of its GDP) on financing health care. The publicsector consumed 73% of all expenditure, of which the SNS facilities accounted forabout 40% of all expenditure, and health funds facilities 33%. Private physiciansreceived 15.9% of all expenditure on health care, while the pharmacies accountedfor 8%. Out-of-pocket expenditure contributed 26% to total expenditure, whilesocial insurance and government taxes accounted for about 36% each. The privateinsurance market contributed only 1.5%, most of which came through pre-paidmedicine plans. A national health accounts matrix is presented in table 7.

24 Marina Cárdenas Robles, Jorge A. Muñoz and Mukesh Chawla
Table 7
National Health Accounts Matrix (Bs. millions), 1995
Sources of Funds
CentralGovt.
MunicipalGovts.
SocialInsurance
PrivateInsurance
Households Internat'lCooperation
Total
SNS Facilities 477 39 25 81 622(39.8%)
Health FundsFacilities
515 515(32.9%)
TotalPublic Sector
1,137(72.7%)
NGOs 54 54
TotalNGO
54(3.5%)
Pharmacies 150 150(9.6%)
PrivatePhysicians
23 200 223(14.3%)
Total PrivateSector
373(23.8%)
Total 477(30.5%)
39(2.5%)
515(32.9%)
23(1.5%)
375(23.9%)
135(8.7%)
1,564(100%)
% of GDP 1.5% 0.1% 1.6% 0.1% 1.2% 0.4% 4.9%
Source: UDAPSO estimates

Data for Decision Making Project 25
7. Central Government and Municipal Tax7. Central Government and Municipal TaxRevenuesRevenues
Revenue from taxes has been the traditional means of financing the health sector,and will probably continue to play an important role in health financing. The mainsources of central government revenue are the taxes collected by the GeneralInternal Revenues Directorate (DGII) and the General Customs Tariffs Directorate(DGA).
DGII collects the following taxes:
a. IVA (value-added tax)
It is levied on economic activities that involve sales, rent of goods and real estate,general services, imports, and financial leasing. This tax is paid by individual andcorporations. It is set at 13% over the net sale price of the goods or of the servicesprovided.
b. Complementary IVA:
Levied on salaries, bonuses, per-diems, overtime pay to employees, as well as otherpayments to individuals and inheritances, all formal sector employees pay this taxthrough payroll deductions. The rate is 13% of total income. The tax is also leviedon individuals who commonly receive income through rentals; interest payments;anticreticos (swaps of real estate usufruct rights in exchange of an interest-freeloan); honoraria paid to locally-hired individuals by diplomatic missions, andinternational organizations and foreign governments.
c. Transaction Taxes
Levied on gross income obtained through the exercise of any profit-generating ornon-profit activities, such as sales, rentals, interest earnings, transfer of goods andrights, this tax is paid by individuals and corporations. The tax rate is 3% of thetotal value of the transaction.
d. Specific Consumption Tax
This is levied on sales in the domestic market and imports of consumer goods,such as cigarettes, tobacco, motor vehicles, refreshments, beer, and other alcoholicbeverages.

26 Marina Cárdenas Robles, Jorge A. Muñoz and Mukesh Chawla
e. Gratuitous Transfer of Goods
Levied on inheritances, transfers of real estate and vehicles, capital gains, andcopyrights, it is paid by individuals and corporations who are beneficiaries of thetransfer.
f. Foreign Travel Departure Tax
Levied on those traveling abroad by air; it is paid by all residents leaving thecountry. The amount is Bs.100 for travel to neighboring countries and Bs.150 forthe rest of the world.
g. Tax on Hydrocarbons and Derivatives
Levied on domestic sales of hydrocarbons and their derivatives, it is paid byindividuals and corporations who trade in these products. The value of the tax isBs.1.35/liter for premium gasoline, Bs. 0.40/liter for diesel, and Bs.0.56/liter foroils.
h. Corporate Profit Tax
This tax is levied on companies, free-lance and trade professionals and foreignbeneficiaries, and is paid by individuals, corporations, publicly- and privately-heldcompanies, mining and hydrocarbon companies, electrical power companies, free-lance professionals, notaries public, registered professionals, commissionedworkers, and sales and real estate agents. The rate is 25% of net profits or incomefor most categories.
The DGA collects the consolidated customs tax, which is levied on all imports andis based on cost-insurance-freight value.
Municipal revenues are derived mainly from three sources:
(i) Transfers from the Central Government (known as “co-participation taxrevenues” equal to US$22 per inhabitant in 1995;
(ii) Municipal taxes; and,
(iii) Transfers from the various investment funds for specific projects (SocialInvestment Fund, FIS, for the case of health sector infrastructure) whichrequire matching funds from the municipality.
In 1994, Municipal Governments received Bs. 600 million (approximately US$135million) from Central Government transfers. Municipal tax revenues were US$70.7million, while social investment funds transferred to municipalities wereapproximately US$58 million. The implementation of the PPL also permits themobilization of resources from the larger cities to the rest of the country (table 8).Before the law, departmental funds per person varied from Bs. 58 in Pando to Bs.115 in La Paz. With the implementation of the PPL, co-participation funds per

Data for Decision Making Project 27
capita have become equal throughout the country.
With the enactment of the Popular Participation Law of April 1994, municipalgovernments have become responsible for investments and the administration ofhealth sector infrastructure. Over time, these reforms are expected to result in higherbudgetary support from Municipal Governments, who have complete autonomy indetermining budgetary allocations to the various sectors like health, education,urban infrastructure, irrigation, roads, etc. In the absence of well-recorded data,however, accurate figures of actual allocations to the health sector are not available.Available data indicates that in 1995, Municipal Governments assigned asignificant portion of their resources towards urban infrastructure and housing (Bs.576.66 million or 48.6% of total expenditures), while health received only Bs.38.85 million (3.3% of the total expenditure). This figure is expected to rise overtime.
Total tax collections of the central government have shown a steady increase overtime, from Bs. 1166 million in 1989 to Bs. 2,435 million (approximately US$530million) in 1994 (all figures in 1990 Bs.). Internal revenue has contributed to mostof this growth, more than doubling over the five year period, while tariff revenue hasregistered only a modest 10% growth (table 9, figure 5). These tax revenues, alongwith transfers from public enterprises, are channeled through the National Treasuryto different public sector agencies, including the Ministry for Human Development,under which is the SNS.
Table 8
Co-participation Resources - 1994
Department Population Municipalities Co-participationFunds (Bs.)/1
Co-participationFunds Per
Capita
Co-participationFunds (Bs.)/2
Difference
La Paz 1,900,786 75 218,624,933 115 177,424,514 (41,200,419)
Santa Cruz 1,364,389 47 138,897,345 102 127,355,765 (11,541,580)
Chuquisaca 453,756 28 31,957,867 70 42,354,814 10,396,947
Cochabamba 1,110,205 44 103,892,678 94 103,629,542 (263,136)
Tarija 291,407 11 22,194,354 76 27,200,719 5,006,365
Oruro 340,114 31 26,564,973 78 31,747,162 5,182,189
Potosí 645,889 38 37,853,445 59 60,289,029 22,435,584
Beni 276,174 17 17,122,323 62 25,778,829 8,656,506
Pando 38,072 14 2,226,200 58 3,553,744 1,327,544
Total 6,420,792 311 599,334,118 93 599,334,118
Source: Secretariat of the Interior. Subsecretary of Budgets.
1/ Before PPL2/ After PPL (Current)

28 Marina Cárdenas Robles, Jorge A. Muñoz and Mukesh Chawla
Public spending on health has increased from Bs. 226.10 million in 1989 to Bs.346.31 in 1994 (all figures in 1990 Bs.), which represents a fall from 19.4% oftotal tax collection in 1989 to 14% in 1994. In 1995, the SNS spent about Bs.477 million (US$99 million) at an average of Bs. 68 (approx. US$14) per personon recurrent costs related to health care. A bulk of this expenditure (around 85%) ison staff salaries (both medical and administrative), with the remaining going toother recurrent costs.
Central tax revenues support a vast network of public sector health institutions,which are under the administrative control of the National Health Secretariat.According to the National System of Health Information (table 10), the number ofregistered institutions in the public health sector grew from 1,304 in 1990 to 1,788in 1994, with a total of 7,203 beds, so that in 1994 there was one public sectorhealth care provider for every 2,758 persons, or one bed for every 685 persons.1
These numbers do not include the institutions nor population covered by the SocialSecurity system (that is, the public health funds, called “Cajas” in Bolivia) whichare described in the following section.
1/ Since the implementation of the Popular Participation Law, all SNS institutions (with the exception of eightNational Research and Normalization Institutes) have been transferred to Municipal Governments. However, thenational government is still directly responsible for the staff of the public health care system.
TAX & CUSTO MS FEE COLLEC TIONS(MILLIONS OF 1990 Bs.)
0 . 0 0
5 0 0 . 0 0
1,0 0 0 .0 0
1 ,500 .00
2 , 0 0 0 . 0 0
2 , 5 0 0 . 0 0
19 8 9 19 9 0 19 9 1 19 9 2 19 9 3 19 9 4
Y e a r s TAX REVENUE
C U S T O M SS o u r c e : U D A P S O B a s e d o n N I S
Figure 5Figure 5
Table 9
Collection of Internal Revenue and Tariffs, 1989-1994
1989 1990 1991 1992 1993 1994
Internal Revenue 918 1,073 1,224 1,528 1,817 2,160
Tariff Revenue 248 221 173 218 233 275
Source: INE

Data for Decision Making Project 29
With respect to human resources, SNS has a staff of 12,056 in 1995: 2,011doctors, 1,020 nurses, 703 other professionals, 3,177 infirmary assistants, 1,359technical staff and other assistants, and 3,786 administrative staff (table 11). Ineffect, therefore, tax funds provide for 2.9 doctors for every 10,000 people.
In terms of utilization of SNS facilities, the 1992 national census indicates that30% of the ill population seeks treatment from SNS facilities. SNS facilities aremore popular in rural areas, where 35% of the ill seek treatment from SNSfacilities, as compared to 26% in urban Bolivia. While there is no data on specificdiseases or programs covered by SNS facilities, there is documented evidence thatshows a significant increase in the number of visits to SNS facilities, from 1.68million in 1991 to 3.5 million in 1995. The number of people who sought treatmentfrom SNS facilities went up from 1.27 million in 1991 to 2.69 million in 1995.Tax money thus funds health services that are utilized by over 38% of thepopulation.
SNS facilities have been particularly successful in immunization programs andmother and infant care. Complete immunization of children (including polio, DPT-3,measles and BCG) went up from 16% in 1980 to 82% of children of immunizationage, and most of these services are provided by the tax-funded SNS facilities. With
Table 10
Facilities Belonging to the National Health Secretariat,1993-94
1993 1994
Regional Hospitals
No. Institutions 30 29
No. Beds 4,032 3,997
District Hospitals
No. Institutions 57 58
No. Beds 1,493 1,528
Area Health Centers
No. Institutions 423 430
No. Beds 1,678 1,678
Periph. Health Centers
No. Institutions 1,271 1,271
Total Institutions 1,781 1,788
Total Beds 7,203 7,203
Sources: UDAPSO, based on SNS, 1993-94

30 Marina Cárdenas Robles, Jorge A. Muñoz and Mukesh Chawla
reference to pre-natal care, of a total of 434,546 visits recorded by SNIS in 1994,63% were provided by SNS facilities. Likewise, of 71,051 reported deliveries in1994, 71.2% took place in SNS facilities.
SNS facilities have been making concerted efforts to improve and monitor quality.In one such endeavor, the Project for Complete Health Services (PROISS) hasdeveloped a system of quality control that has been implemented in La Paz,Cochabamba, Santa Cruz and El Alto. There are currently 18 Health Districtscurrently applying the system. Evaluations of quality control are conducted in theHealth Centers through a survey that evaluates infrastructure, data and information,admission, cleanliness and maintenance, equipment, healing consultations, popularparticipation, essential medicines and inputs, technical and administrativeprocedures, outreach and prevention, odontology, and prenatal care.
However, there remain a number of concerns regarding the equitable use of SNSfacilities. According to the information collected by the National Institute ofStatistics, only 10% of those who sought treatment from SNS facilities belonged tothe lowest per-capita spending quintile. Over 50% of those who used SNS facilitiesbelonged to the third and fourth quintiles, while over 75% of those who used SNSfacilities belonged to the richest 60%. More than 25% of all users of these facilitiesbelonged to the highest income quintile.
Table 11
Human Resources of SNS, 1991 - 95
1991 1992 1993 1994 1995
Doctors 1,580 1,948 2,008 1,976 2,011
Nurses 870 999 1,002 1,003 1,020
Other Professionals 792 858 669 692 703
Infirmary Assistants 1,606 3,107 3,136 3,134 3,177
Technical Staff 0 574 1,204 1,520 1,359
Admin. and Services 3,910 4,348 3,901 3,596 3,786
Total 8,758 11,834 11,920 11,921 12,056
Source: UDAPSO, based on SNS / SNIS, 1991-95

Data for Decision Making Project 31
8. Social Insurance and Public Health8. Social Insurance and Public HealthFundsFunds
The second major source of financing for health care services is the system of publichealth funds, known in Bolivia as “Cajas de Salud”. The genesis of these funds canbe traced back to the pension fund that was set up at the beginning of the century.With this, the Government started a social security system that initially coverededucation workers (in 1905), but was extended to military personnel (in 1906), andworkers in the Judiciary Branch (in 1911). The Work-Related Accidents andIllnesses Law was promulgated in 1924, and the Mandatory Social Security Lawwas passed in 1954. The Social Security Code was passed in 1956 and formed thebasis of the Bolivian social security system. The Bolivian Institute for SocialSecurity (IBSS) was created in 1973 and made responsible for supervising thesocial security system. Short-term social security, covering health and alliedmatters, was entrusted to the system of health funds in 1987, while long-termsocial security, related to retirement issues, was placed under the responsibility ofthe system of pension funds. In 1994, IBSS was replaced by the National Institutefor Health Funds (INASES), under the jurisdiction of the Ministry of HumanDevelopment.
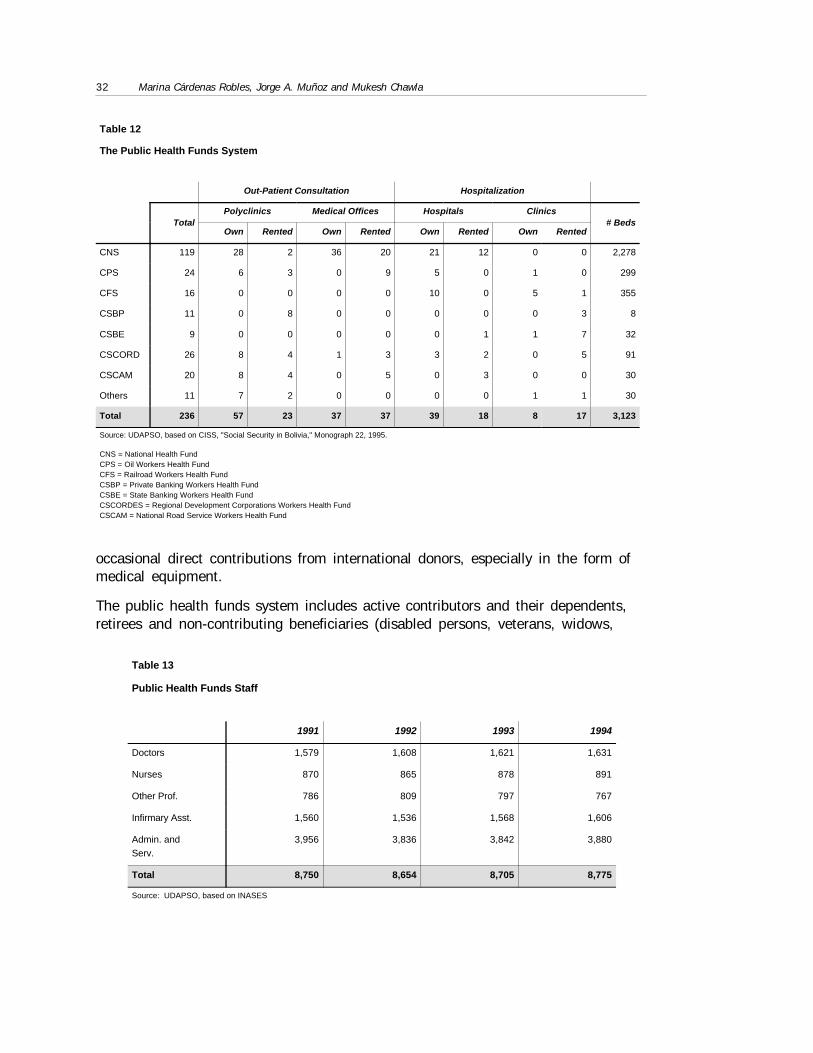
At present, the public health funds system is composed of seven health funds(“cajas”) and ten integrated insurance programs, the latter being supplementaryfunds for particular institutional arrangements, such as the public universities (table12). Larger than the SNS system, the public health funds system consists of 236centers, of which 141 are owned and 95 are rented. Jointly, they have a total of3,123 beds, most of which are concentrated in the country’s larger cities. The totalstaff strength is 7,848, of which 1,445 are doctors, 809 nurses, 444 otherprofessional, 1,453 infirmary assistants, 334 technical staff and other assistants,and 3,363 administrative personnel (table 13).
Health funds receive most of their contributions from public and private employers.The law requires all public agencies to contribute to some public health fund, whileprivate sector organizations have the option of either affiliating themselves to ahealth fund, or contributing to pre-paid medicine schemes on behalf of theiremployees. Contribution rates to health funds are fixed by statute at 10% of grosssalaries, and it is not customary for companies to offer additional coverage aboveand beyond what is required by law. The system of public health funds receives notransfers from the National or Municipal Governments. It has, however, received
32 Marina Cárdenas Robles, Jorge A. Muñoz and Mukesh Chawla
occasional direct contributions from international donors, especially in the form ofmedical equipment.
The public health funds system includes active contributors and their dependents,retirees and non-contributing beneficiaries (disabled persons, veterans, widows,
Table 13
Public Health Funds Staff
1991 1992 1993 1994
Doctors 1,579 1,608 1,621 1,631
Nurses 870 865 878 891
Other Prof. 786 809 797 767
Infirmary Asst. 1,560 1,536 1,568 1,606
Admin. andServ.
3,956 3,836 3,842 3,880
Total 8,750 8,654 8,705 8,775
Source: UDAPSO, based on INASES
Table 12
The Public Health Funds System
Out-Patient Consultation Hospitalization
TotalPolyclinics Medical Offices Hospitals Clinics
# BedsOwn Rented Own Rented Own Rented Own Rented
CNS 119 28 2 36 20 21 12 0 0 2,278
CPS 24 6 3 0 9 5 0 1 0 299
CFS 16 0 0 0 0 10 0 5 1 355
CSBP 11 0 8 0 0 0 0 0 3 8
CSBE 9 0 0 0 0 0 1 1 7 32
CSCORD 26 8 4 1 3 3 2 0 5 91
CSCAM 20 8 4 0 5 0 3 0 0 30
Others 11 7 2 0 0 0 0 1 1 30
Total 236 57 23 37 37 39 18 8 17 3,123
Source: UDAPSO, based on CISS, "Social Security in Bolivia," Monograph 22, 1995.
CNS = National Health FundCPS = Oil Workers Health FundCFS = Railroad Workers Health FundCSBP = Private Banking Workers Health FundCSBE = State Banking Workers Health FundCSCORDES = Regional Development Corporations Workers Health FundCSCAM = National Road Service Workers Health Fund

Data for Decision Making Project 33
former high-level public officials) and their dependents. In 1994, there were346,127 active contributors and a total of 1,575,913 persons insured by thesystem. In 1995, approximately 1.6 million people (close to 22% of the country’spopulation) had some affiliation to some public health fund. The total budget of thepublic health funds was Bs. 514.8 million (approx. US$108 million), equivalent toan expenditure of US$67.8 for each potential beneficiary, or US$310 per activecontributor (INASES 1996).
The largest health fund is the National Health Fund (Caja Nacional de Salud, CNS),which has 199 health care facilities with 2,278 beds and accounts forapproximately 85% of the beneficiaries of the system. In 1995 CNS had a budgetof Bs.364 million (approximately US$76.6 million). The next largest health fund isthe Oil Workers Health Fund, which had a budget of Bs.96.5 million in 1995.
The public health funds system offers rehabilitative and curative services, and areprimarily located in urban areas. The facilities of the public health funds coverapproximately 21% of the urban population, but only 4% of the rural population.For the country as a whole, public health funds cover approximately 14% of theentire population (table 14).
Although much of the urban formal sector labor force participates in the publichealth fund system (the total number of beneficiaries is equal to 40% of the urbanpopulation), many upper-middle and high income households do not utilize itsservices. There are many significant non-market rationing mechanisms (coupons forvisits and long queues) that limit access, and many potential beneficiaries use theservices of private sector providers, either private medical offices or pre-paidmedicine programs. It is commonly observed that high income health fund membersuse private sector providers for routine consultations (e.g. pediatric andgynecological visits), but rely on the health fund system for more expensivetreatments. Private sector providers are also often preferred for specialized care(e.g., ophthalmologic care, surgery) if they are perceived to be of better quality andreliability. The main clients of the public health insurance system are thus the lowerand middle-income urban formal sector, and public bureaucracy.
In terms of utilization of public health funds facilities by income quintiles, 56% ofall public health fund facility users belonged to the wealthiest 40% of thepopulation, while only 23% belonged to the poorest 40%. A disproportionately large35% of all users belonged to the fourth quintile.

34 Marina Cárdenas Robles, Jorge A. Muñoz and Mukesh Chawla
Table 14
Members of the Public Health Funds
Cont. Benef. Retirees Benef. Non-ContMember
Dep. Total
1980 323,842 902,292 62,119 52,435 43,536 27,983 1,412,20
1981 334,916 944,021 67,387 59,489 45,357 27,230 1,478,40
1982 353,861 999,182 70,079 62,616 40,269 25,592 1,551,59
1983 367,608 1,117,89 72,716 63,942 43,222 23,926 1,689,30
1984 340,603 952,123 74,552 63,215 41,373 22,798 1,494,66
1985 342,534 942,703 76,817 60,167 41,365 22,143 1,485,72
1986 318,552 881,071 82,223 73,431 40,402 21,000 1,416,67
1987 267,653 740,064 85,281 92,803 39,918 19,874 1,245,59
1988 281,344 775,366 93,245 94,930 39,246 18,730 1,302,86
1989 294,475 815,429 99,165 99,960 36,841 16,724 1,362,59
1990 317,691 868,745 105,601 105,886 35,978 15,456 1,449,35
1991 330,519 902,106 112,913 114,476 34,607 14,286 1,508,90
1992 330,593 897,435 120,362 120,500 34,426 13,492 1,516,80
1993 335,546 905,974 115,234 127,910 32,562 12,212 1,529,43
1994 346,127 935,609 118,228 134,352 30,624 10,973 1,575,91
Source: UDAPSO, based on INASES, 1995

Data for Decision Making Project 35
9. Private Health Insurance and Pre-Paid9. Private Health Insurance and Pre-PaidMedicine ProgramsMedicine Programs
Use of private health insurance in Bolivia is very limited, and only a handful ofcompanies offer private health insurance policies. On the other hand, pre-paidmedical care (which is often regarded in Bolivia as health insurance) is graduallybecoming more prevalent in the country. Strictly speaking, the prepaid plans are notan insurance; rather, they are a system of prepaying for medical services.Beneficiaries do not buy policies with the objective of protecting themselves againstunforeseen expenses; instead, they primarily buy the right to reduced rates forservices that they almost invariably utilize or expect to eventually utilize. As far asthe centers are concerned, their main objective is to secure a certain number ofrepeat customers who know they will need medical services. Anyone can join thissystem provided they do not exhibit severe health conditions.
The pre-paid medicine programs charge an annual entry fee that gives the client theright to a given package of limited services. The average annual premium forABOSMEP affiliates is US$215 per person per year. The amount of the premiumdepends on the user’s age, medical history, and desired “package” of services, andusually carries a copayment for each visit. The per-visit fee can be adjusted in thecourse of the year depending on the frequency of visits and the evolution of theclient’s clinical history. Pre-paid medicine systems are not subsidized, and thusmust recover all costs through annual premiums, service charges and drug charges.Most service-packages include preventive care and simple curative care, includingchild-delivery, gynecological, dentistry, and geriatric services and other serviceswhich are low-risk health services characterized by fairly predictable demand.
This system of prepaid medicine began ten years ago with the creation of URME, aprivate provider, on the model of Argentina’s prepaid medical plans. This was soonfollowed by the Medicentro, and gradually many more centers emerged. AnAssociation for Prepaid Medicine in Bolivia (ABOSMEP) was formed in 1993, andcurrently there are seven members and approximately 22,000 affiliated persons inthis association. Almost all pre-paid medicine system centers were started as grouppractices by doctors, who make an initial investment in infrastructure and medicalequipment. These centers do not specialize in complicated or high-risk treatments,since these require greater investments in infrastructure and equipment and tend toattract higher risk populations; instead, these centers provide high quality simplecurative and preventive care.

36 Marina Cárdenas Robles, Jorge A. Muñoz and Mukesh Chawla
Private physician offices and pre-paid medicine provide medical care primarily to theupper middle class, and are found almost exclusively in urban areas. According torepeated rounds of LSMS surveys, households with the highest disposable incomesuse private health care providers in urban areas. Around 70% of all private sectorusers belong to the wealthiest 40% of the population, while only 15% belong to thepoorest 40%. A disproportionately large 43% of all users belong to the fifth quintile,while less than 5% belong to the poorest 20% of the population.

Data for Decision Making Project 37
10. User Charges10. User Charges
There is little information available regarding out-of-pocket household expenditureson health care. According to the Survey of Household Budgets (EPF) carried out inLa Paz, Cochabamba, Santa Cruz and El Alto in 1990, households spend anaverage of Bs.45 per month (approx. US$14) on health care, which is less than4% of total household expenditures (Urquiola 1994). This proportion varies from2.4% in the poorest quintile (quintile 1) to 4.9% in the richest quintile (quintile 5).Differences across quintiles is more pronounced in absolute terms; average monthlyper capita spending in the first quintile is US$ 3.11, while in the fifth quintile it isUS$38.3. On average, 40% of these expenditures are for drugs and the remaining60% is for services. These shares are similar to those in other Latin Americancountries (OPS/OMS, 1994). On the assumption that households in smaller citiesand rural areas have lower expenditure patterns than the average household in thefour main cities, total household expenditure on health in Bolivia can be estimatedto be on the order of magnitude of between Bs. 375 million (US$117 million).
The private health care sector consists of private providers, pre-paid medicineinstitutions, and non-profit organizations. Despite the fact that all private healthcare providers are required to be registered and supervised by the SNS, there are noreliable data on the number of private doctors’ offices, clinics, laboratories orpharmacies. Available data (according to the National Hospital Directory of SNS)indicates that in 1994 there were approximately 104 private health care and NGOfacilities in Bolivia, with a total of 2,255 beds, though the accuracy of this figure isdifficult to determine.
Table 15 presents some user fees from health care facilities, public and private, inLa Paz and Santa Cruz. There is substantial variation among public sector (SNS)facilities, health funds, and private sector providers. Among public sector facilities,the user fee for an out-patient consultation varies from Bs. 3 to 5 (US$0.70 to1.00), while in the private sector, the range is larger and has more variation(between Bs. 15 and 100 per visit). There is no explicit national policy with regardto user fees charged at SNS facilities, and the range of Bs. 3 to 5 per visit wasgenerally arbitrarily determined. The contribution of user fees to the overall SNSoperating budget is very low.
According to estimates based on the Fifth Complete Household Survey, the demandfor health services is relatively inelastic with respect to price, though there aredifferences between the elasticities for children (relatively elastic) and adults
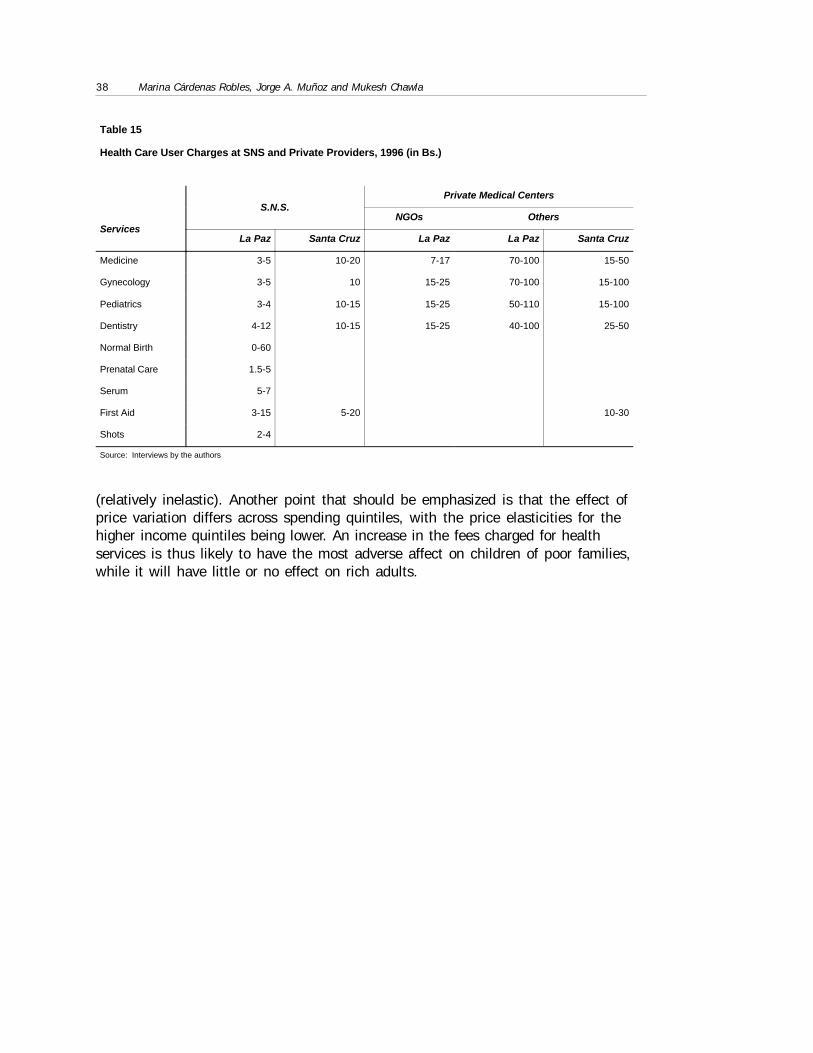
38 Marina Cárdenas Robles, Jorge A. Muñoz and Mukesh Chawla
(relatively inelastic). Another point that should be emphasized is that the effect ofprice variation differs across spending quintiles, with the price elasticities for thehigher income quintiles being lower. An increase in the fees charged for healthservices is thus likely to have the most adverse affect on children of poor families,while it will have little or no effect on rich adults.
Table 15
Health Care User Charges at SNS and Private Providers, 1996 (in Bs.)
S.N.S.Private Medical Centers
ServicesNGOs Others
La Paz Santa Cruz La Paz La Paz Santa Cruz
Medicine 3-5 10-20 7-17 70-100 15-50
Gynecology 3-5 10 15-25 70-100 15-100
Pediatrics 3-4 10-15 15-25 50-110 15-100
Dentistry 4-12 10-15 15-25 40-100 25-50
Normal Birth 0-60
Prenatal Care 1.5-5
Serum 5-7
First Aid 3-15 5-20 10-30
Shots 2-4
Source: Interviews by the authors

Data for Decision Making Project 39
11. International Cooperation11. International Cooperation
International cooperation funds come from two sources: public source (bilateral ormultilateral) and private or non-government. Bolivia has received bilateralassistance on health issues from numerous countries, and has participated inseveral interventions with the support of several multilateral agencies, includingUNICEF, the World Bank and the Inter-American Development Bank (IADB).
Total international cooperation funds committed to the health care sector wereUS$312 million for the period 1989-1995. The average amount invested averagedUS$27.7 per annum during the period (table 16).
Most of the funds from international cooperation are channeled through non-government organizations (NGOs). The exact number of NGOs working on healthissues is not known with certainty, as many of them are unregistered. TheDirectorate for NGO Coordination (Ministry of Finance) has 501 registered nationaland international NGOs. It is estimated that these NGOs channeled about US$200million in cooperation funds in 1993. Approximately 190 of these NGOs work inhealth care, of which the largest is the Catholic Church which has 357 healthprojects in the country (Conferencia Episcopal Boliviana 1994).
Table 16
Public Sector (SNS) and Health Funds
International Cooperation Financing Program, 1989-95 (in thousands of US$)
FundingOrganization
TotalForeignContrib.
Cum.Exec.1989
Exec.1990
Exec.1991
Exec.1992
Exec.1993
Exec.1994
Exec.1995
TotalExec.
Balanceof
Disburs.
OPEP 7,970 4,160 552 257 0 2,206 349 391 7,916 54
IADB 33,900 0 0 0 942 743 5,651 5,617 12,953 20,947
CAF 7,000 0 0 0 0 0 0 2,379 2,379 4,621
IDA 132,083 0 1,083 4,729 6,551 15,498 17,598 14,192 59,651 72,432
JICA 4,890 4,890 0 0 0 0 0 0 4,890 0
USAID 102,663 22,246 5,975 8,510 12,903 16,063 9,869 10,065 85,631 17,032
KFW 3,529 0 122 153 833 1,236 555 390 3,289 240
ESP 10,350 0 0 0 5,004 5,167 180 0 10,350 0
HOL 8,953 0 1,382 1,595 556 963 976 619 6,091 2,862
ASDI 1,000 0 0 0 0 0 0 1,000 1,000 0
General Total 312,338 31,296 9,114 15,244 26,789 41,876 35,178 34,653 194,150 118,188
Source: UDAPSO, based on SIPFE

40 Marina Cárdenas Robles, Jorge A. Muñoz and Mukesh Chawla
12. Case Studies12. Case Studies
PROSALUDPROSALUD
The PROSALUD Project was initiated in 1983 with a team of 6 individuals and thesupport of USAID/Bolivia. PROSALUD, as a civil, private, and non-profitassociation that was born as a result of the project, was created in August 1985.This experience began as a result of three important factors: (i) the gradualdeterioration of the health conditions of a significant part of the population due tothe severe economic crisis in the early 1980’s; (ii) the emergence of a transparentand deregulated market economy that came about with the structural adjustment ofAugust 1985; and (iii) as an efficient alternative to the traditional public system ofprimary health care.
PROSALUD is a sustainable model for the provision of comprehensive and ongoingprimary health services through decentralized, multi-purpose and permanentfacilities, following as a guiding strategy Primary Health Care (APS). PROSALUDpursues its activities within the framework of National Health Policies, and throughagreements with the SNS, the Departmental Health Directorates and municipalities.Currently, PROSALUD has 28 health centers: 13 in Santa Cruz, 6 in La Paz, 7 in ElAlto, 1 in Tarija and 1 in Riberalta; serving a population of some 300,000 persons.In addition, there is a Referral Clinic and a Center for Infant Development in SantaCruz. PROSALUD employs a total of 445 persons throughout the country.
PROSALUD offers: (i) health care services to the community; (ii) social marketing ofhealth products; (iii) training services; (iv) applied research; and (v) technicalassistance. With respect to providing health care services to the community,PROSALUD focuses on medical consultations, childbirth, short-term hospitalization,family planning, dental care, laboratory analysis and immunizations. Withinchildbirth services, PROSALUD offers gynecological consultations, pre-natal care,post-natal control and child development, and other services.
Community health care services are complemented by a marketing program forhealth care products, with the objective of increasing the access to and utilization ofthese products, through pharmacies and non-traditional sources. For this reason,PROSALUD has a factory for orthopedic products and an optical shop in La Paz.

Data for Decision Making Project 41
PROSALUD also offers training services in health care administration that includetechnical and managerial training for maternal-infant care programs, family planningprograms, and quality control of services. As part of an ongoing improvementprocess, PROSALUD conducts market research, as well as operations andepidemiological research. Finally, PROSALUD also offers technical assistanceservices to other organizations, in Bolivia and abroad.
The PROSALUD project originally received funding from USAID (Funds of PL-480,Title III) that served as seed funds for the initiation of the association. Once theproject was successful, there was a positive evaluation in 1989 that permitted theexpansion of coverage and the opening of new centers that also relied on thesupport of USAID. Initial costs of a new center are borne by external funds (USAID,buildings and equipment) and the municipality (granting an unused lot or a buildingin need of repair). Of the total operating costs, approximately 75% are covered byPROSALUD funds generated by user fees. The remainder 25% of operating costs arepaid for from the income generated from marketing of health care products (e.g.contraceptives, glasses). Training activities and applied research generate minoradditional resources.
In 1988-89, PROSALUD conducted detailed studies on the demand for health careservices in areas of interest for future investments. These studies demonstratedthree important aspects about demand for health care: (i) lower income groups inSanta Cruz and El Alto have similar behavior with respect to health care spending,which contradicts the popular assertion that cultural factors determine behavior inthe market for health care services; (ii) the poorer the household, the more sensitiveit is to the quality of health care; and (iii) in lower income groups the demand forhealth care services has very low price and income elasticities (Rosenthal et al1988; Huff-Rouselle and Overholt 1990).
A socio-economic study of the local population usually precedes the opening of anew center in a neighborhood or rural community. These studies are funded in partby USAID and by PROSALUD’S own resources (basically staff time). The studiesare based on a complete census of the populations, using socio-economic andmarketing questionnaires. Information is sought on health, income, employment,socio-economic preferences, willingness to pay for services, etc. The results ofthese studies are the primary input for determining the fee schedule that will prevailin the area. Expected revenues are calculated based on this possible fee schedule.These in turn determine the costs that the center can sustain and the personnel thatit requires. Once the center is open, PROSALUD maintains statistical data on itsclients, where they come from, etc., and conducts periodic customer satisfactionsurveys.
The LPP has simplified negotiations between PROSALUD and MunicipalGovernments to get a plot of land or an unused building. Municipalities have theautonomy and the incentives to negotiate with an agency such as PROSALUD that

42 Marina Cárdenas Robles, Jorge A. Muñoz and Mukesh Chawla
provides primary health care services. This way the municipality does not have toincur large direct costs in building its own facilities, nor does it have to dependexclusively on a national public health care system.
Each PROSALUD center has autonomy, under certain basic rules, to fix user feesthat are most adequate to their region. For example, the city of La Paz hasPROSALUD centers in the southern neighborhoods (that are high-income areas)where a general consultation costs between Bs.15 and 17 (approx. US$3 - 3.30)and for a pediatric visit, Bs. 20 and 25. The same visits in El Alto (a low incomearea and 45 minutes away from the center), cost between Bs.7 and 10, and Bs. 15and 20, respectively. In other words, within the two extremes of the same city, a20-50% difference in user fees may exist, without a corresponding variation in thequality of services provided.
The personnel structure of the 28 PROSALUD centers is quite standard. In eachcenter, there are usually the equivalent of 3 full-time doctors: one full time generalmanager/physician, a half-time gynecologist, a half-time pediatrician and a full-timedentist. In general, the director has a guaranteed salary equivalent to pay for 8hours of work per day. This salary tends to be greater than what he or she couldearn as an employee of the SNS, but it is less than the salaries available at thehealth funds and much less than those earned in the private sector. Nevertheless,the doctors of PROSALUD have the option to work extra hours (emergency care orSaturday mornings, for example), using the infrastructure of PROSALUD centers,receiving in exchange 80% of the fees charged during these extra hours.
Approximately one half of PROSALUD’s 96 doctors work under a “joint venture”program. The doctors receive 50% of the fees charged to users and PROSALUDreceives the other 50%. The doctors thus have appropriate incentives to conducttheir own marketing campaigns to attract clients to PROSALUD and take maximumadvantage of PROSALUD’s infrastructure. Dentists are required to bring their ownequipment, but are allowed to retain 80% of fees charged for dental services.PROSALUD thus saves on equipment maintenance costs, and the dentist utilizes thePROSALUD market to establish a clientele base. PROSALUD has the addedadvantage of being able to provide highly demanded but relatively expensive serviceswithout incurring the investment and maintenance costs. The joint venture systemthus works well for both the physician and the facility.
National Mother-Child Insurance ProgramNational Mother-Child Insurance Program
This is an insurance system recently started by the present government for women offertile age and children under five years of age. It covers maternity care andcomplications resulting from pregnancy and childbirth, and covers children underfive in the case of diarrheal illnesses and acute respiratory infections, whichconstitute the two primary causes of childhood mortality in Bolivia. The package ofservices provided by this insurance program covers:

Data for Decision Making Project 43
• Four pre-natal visits
• Normal childbirth and Cesarean Sections
• Care for complications resulting from pregnancy and childbirth
• One post-partum visit
• Newborn care
• Diarrheal illness care
• Care for pneumonia
The National Mother-Child Insurance program is part of the Strategic ActionsProgram (PAE) of the Ministry for Human Development (table 17). The goal of thisinsurance plan is to reduce infant mortality rate by 25% and maternal mortality rateby 20% in the next two years. The insurance also propose to increase coverage andaccess to health care services, and to create conditions so that economicconsiderations do not constitute a barrier to professional care in these criticalareas. The target population for each type of service is shown in table 18.
PAE is a national initiative that seeks to facilitate the implementation of socialpolicies through a concerted and efficient assignation of resources to reach short-term human development objectives. Health is one of the principal areas of public
Table 17
Strategic Actions Program (PAE)
PAE is a national initiative that seeks to facilitate the implementation of social policiesthrough a concerted and efficient assignation of resources to reach short-term humandevelopment objectives. Heath is one of the principal areas of public intervention. PAEactivities in the health sector focus on improving the health status of women andchildren, the provision of micro-nutrients, and the implementation of school breakfasts.
Within the health and nutrition program, there are three specific intervention areas:infant health, maternal health, and nutrition. In infant health, the priorities forintervention are (i) treatment and prevention of acute diuretic illnesses; (ii) treatmentand prevention of acute respiratory infections; (iii) immunization programs; promotionof breast feeding; and (iv) treatments for the removal of parasites. The goal is toreduce by 25% the mortality rate of children under five, from 116 to 87 per 1000 livebirths.
In women's health, the priorities are (i) care before, during and post-partum (nocomplications); (ii) training in reproductive health; and (iii) administering of tetanusshots. The goal is to reduce maternal mortality by 20%, from 390 to 312 per 100,000live births, saving an average of 200 lives each year.
The priorities in nutrition are to promote the consumption of iodized salt, administervitamin A and ferrous sulfate to women and children, and implement the program ofschool breakfasts. The goal is to improve the nutrition of women and children throughthe provision of micronutrients.

44 Marina Cárdenas Robles, Jorge A. Muñoz and Mukesh Chawla
intervention. PAE activities in the health sector focus on improving the health statusof women and children, the provision of micro-nutrients, and the implementation ofschool breakfasts.
Within the health and nutrition program, there are three specific intervention areas:infant health, maternal health, and nutrition. In infant health, the priorities forintervention are (i) treatment and prevention of acute diarrheal illnesses; (ii)treatment and prevention of acute respiratory infections; (iii) immunizationprograms; (iv) promotion of breast feeding; and (v) treatments for the removal ofparasites. The goal is to reduce by 25% the mortality rate of children under five,
from 116 to 87 per 1000 live births.
In women’s health, the priorities are (i) care before, during and post-partum (nocomplications); (ii) training in reproductive health; and (iii) administering of tetanusshots. The goal is to reduce maternal mortality by 20%, from 390 to 312 per100,000 live births, saving an average of 200 lives each year.
Table 18
Target Population for the Mother-Child Health Program
Service Target Population
Prenatal Care 724,112
Post-Partum Visit 168,356
Vaginal Birth and Newborn Care 150,253
C-Section and Newborn Care 18,103
Premature Birth Warning 3,621
Hemorrhage 3,621
Puerperal Hemorrhage 5,431
Severe Eclamsia/Preeclamsia 3,621
Moderate Preeclamsia 9,051
Puerperal Infection/Sepsis 9,051
Ambulatory Diarrhea 925,402
Hospital Diarrhea 49,335
Ambulatory Pneumonia 86,371
Newborn with Severe Asfixia 37,016
Newborn Pathological Ictericia 3,367
Pneumonia/Sepsis in Newborn 16,836
Total 10,101
Source: UDAPSO from NHS
Data for Decision Making Project 45
The priorities in nutrition are to promote the consumption of iodized salt, administervitamin A and ferrous sulfate to women and children, and implement the program ofschool breakfasts. The goal is to improve the nutrition of women and childrenthrough the provision of micronutrients.
The estimated total cost of the insurance program is US$14.1 million annually(SNS 1996). This includes fixed costs, training, personnel, and drugs and suppliesnecessary for the treatment of the pathologies and conditions covered by theinsurance plan. With the goal of providing care to 70% of pregnant women and80% of children with acute respiratory infections and acute diarrheal illnesses, theTreasury contributes with 33% of the total funds needed in salaries for medicalpersonnel and paramedics. Twenty-two percent of recurrent expenditures arefinanced with a loan from the World Bank, through the Integrated Health ServicesProject (PROISS) in La Paz, El Alto, Santa Cruz and Cochabamba; and with a loanfrom BID through the Integrated Program of Basic Health Services and SectorStrengthening (PSF), in the rest of the country. Public health funds contribute 7% ofcosts in maternal-infant care; and the municipalities cover 30% of the costs withco-participation funds (municipalities are free to buy into the program, by signing anagreement with SNS; so far, over 90% of municipalities have signed agreementswith SNS). The balance is covered by UNICEF, UNFPA and OPS/OMS (Aponte1996).

46 Marina Cárdenas Robles, Jorge A. Muñoz and Mukesh Chawla
13. Conclusions13. Conclusions
Bolivia is going through a phase of widespread reforms that have affected thefinancing and delivery of public services. Health care has been no exception, thoughmost of the reforms specifically targeting the health sector are scheduled to happenonly over the next few years. In any case, Bolivia’s health sector has undergonemany important changes as a result of the Popular Participation and AdministrativeDecentralization reforms.
One of the most significant changes is that the Municipal Governments are now theowners of public health facilities (previously under SNS management) and areresponsible for their administration and maintenance. The Central Governmentremains responsible for covering the costs of medical personnel and administrativestaff. This has encouraged local grassroots organizations and neighborhood councilsin urban areas and peasant and indigenous people’s communities in rural areas toget involved in defining municipal investment priorities, particularly with regard tosocial services. The decentralization process is likely to redefine availability, accessand quality of health care for most low-income users of government health facilities.At the same time, the decentralization process will require much closer coordinationbetween Central and Municipal Governments, since funding for health care deliveryis a joint responsibility of both.
The main funding source for the public health system has always been transfersfrom the Treasury, i.e., from general taxes. With the reforms, some of this revenue isnow transferred to Municipal Governments that enjoy autonomy over decisions offund allocation. The municipal governments have much closer grassroots contactsand are thus likely to, under greater popular pressure, improve availability andquality. The Popular Participation process may encourage some “over-capitalization”of health care facilities, since Municipal Governments under popular pressures mayinvest in them more than the Central Government did in the past. The centralgovernment, however, will have strong reasons to monitor and control this trend,since the Central Government continues to be responsible for salaries and other staffexpenses.
With regard to the public health funds (insurance) system, the only source offinancing (except for occasional international donation of equipment) is employercontributions equivalent to 10% of gross salaries. This contribution is mandatoryfor all public organizations and many private firms also contribute, and the potentialbeneficiary population is large (40% of urban population). However, significant

Data for Decision Making Project 47
numbers of middle to high income groups who are eligible beneficiaries do not usethe services. This has a somewhat progressive effect in that this system provideshealth care to low income urban dwellers that is effectively subsidized by the higherincome groups.
Private sector providers almost exclusively serve middle to high-income urbanhouseholds. Pre-paid medicine programs have emerged as a way of providing privatemedical care to a greater number of people at lower costs (but higher than thepublic sector). These programs offer “packages” of health care services for illnessesor conditions that are fairly predictable for both the consumer and the provider.PROSALUD is an interesting private sector alternative of high quality health care forlow-income urban groups who are willing to pay for quality care.
International cooperation funds play an important role in the financing of the healthsector, especially in terms of fixed investments, and several large projects have beenfunded with support from these funds. These projects have had a significant impacton construction of new health centers, and have generally improved the quality ofhealth care in these centers.
There are several important lessons from this study. First, given the new financingstructure of public services, combined with the strict fiscal discipline in place since1985, an increase in Central Government expenditures in the health sector is veryunlikely. The Government is taking important steps to increase tax revenues throughbetter collection mechanisms and enforcement, but this increase is more likely toreduce the fiscal deficit rather than increase expenditures. Second, thanks toPopular Participation, Municipal Governments now have primary responsibility forthe delivery of health services which, combined with greater social pressure at thelocal level, will most likely result in an increase in tax revenues at the municipallevel. However, given the historical neglect in all public services in mostmunicipalities, only part of this increase in revenue will go to health care. Third,there is a significant proportion of users of public health care facilities in urbanareas (SNS and health funds) who belong to the highest income quintiles and couldpotentially pay higher user fees for the services they receive. At the same time,many high income patients who are eligible to use facilities belonging to publichealth funds actually choose private providers instead.
Our findings suggest that equity and efficiency issues in Bolivia’s public health caresystem can be better addressed by more careful rationing of service deliveryaccording to income. There is also some potential for increasing the contributingbase to public health funds (medium and large size private firms, as well as micro-enterprises and the informal sector) which, combined with more careful rationing ofusers, would increase significantly the access to health care by the poor, especiallyin urban areas. At the same time, the government should evaluate different ways ofmaking facilities belonging to health care funds more accessible to the rural poor.Also, it is recommended that the current financing structure (which separates staff

48 Marina Cárdenas Robles, Jorge A. Muñoz and Mukesh Chawla
costs from investment and other recurrent costs) be evaluated carefully in terms ofthe efficiency and sustainability of health care delivery. The strict fiscal constraintsof the Central Government will limit the amount of staff costs that can be borne bythe state, and the Municipalities will have to find alternative sources of finance forcovering staff costs, such as increased user fees at their local health care facilities.
The Bolivian experience provides many important lessons for other countriesconsidering decentralization in their health sectors. Decentralization certainlyprovides a more effective incentive structure for public health care facilities, andencourages more careful attention to finances, quality control, and definingpriorities, though there is always the danger that national health priorities could beneglected. Decentralization also encourages local decision-makers to seekalternative sources of funds for health care. This may include higher user fees,specific taxes, or other mandatory contributions administered locally. The Bolivianexperience also highlights the importance of carefully defining the financingresponsibilities of central and local governments, since a purely technical separationof budget items by financing source may result in a sub-optimal mix of the variousfactors required for health care delivery.
Data for Decision Making Project 49
14. Bibliography14. Bibliography
Aponte G. “National Mother-Child Health Insurance.” Ministry for HumanDevelopment. La Paz, Bolivia 1996.
National Health Bank. “Annual Statistics 1994.” National Statistics Department.La Paz, Bolivia 1994.
National Security Bank. “Annual Statistics 1993.” National Statistics Department.La Paz, Bolivia 1993.
Cárdenas, M. “The Evolution of Spending and Public Investment in Health for thePeriod 1980-1992,” en OPS/OMS, MCTH, ILDIS. Poverty and Health in Bolivia.1994.
Cárdenas, M., J.M. Madden y S. Contreras. “Analysis of Cost-Effectiveness Analisisof Ten Health Intervention Program in Bolivia.” Working Paper No. 39. UDAPSO.1995.
Cárdenas, M. y Masako I. A Study on the Demand for Health Services in the UrbanZones of Bolivia. UDAPSO, Working Paper 26/94. La Paz, Noviembre 1994.
Cárdenas, M. y Darrás C. “National Spending on and Financing of Health Servicesin Bolivia.” Series:Macroeconomy, Health and Development. No.17. World HealthOrganization. Geneva, Switzerland. 1996.
Chavez J. “Optimization of Insurance Services Production through an Improvementof the System for Service Provision of the Private Insurance Companies.” U.C.B. LaPaz - Bolivia 1995.
Medical College of Bolivia. “Basis for the Creation of Health SERVICIO UNICO.” LaPaz, September 22-24, 1987.
Executive Committee of the Bolivian University. “Statistics for Universities 1990 -1994.” La Paz - Bolivia 1995.
Bolivian Episcopal Conference. National Directory of Health Works of the CatholicChurch in Bolivia. Bolivia, 1994.
Inter-American Conference on Social Security. “Social Security in Bolivia.”Monograph Series Nº 22. Mexico, D.F. 1995.

50 Marina Cárdenas Robles, Jorge A. Muñoz and Mukesh Chawla
Dabdoub, C. “Decentralizing Health: Background and Perspectives.” ILDIS. 1994.
Dumoulin J. Kaddar M. Velasquez G. “Guide for Economic Analysis of theCIRCUITO DEL MEDICAMENTO.” WHO. 1995.
Fortun, W.J. “Basis for the Creation of a Unified Health Service.” Colegio Médicode Bolivia. Septiembre. 1987.
Millenium Foundation. “Interpretations of the World Development Summit”. UNDP.La Paz, Bolivia 1995.
Millenium Foundation. “Decentralization and the Health Sector Changes in Bolivia.”Millenium Studies No.3. 1995.
Huff-Rousselle, M. “PROSALUD, Social Marketing and Financing Primary HealthCare.” Economic Development Institute, The World Bank. OGN Publications 1990.
INE, UNICEF, UNFPA, OPS/WHO. “National Demographic and Health Survey1994.” La Paz, Bolivia. July 1994.
LAC-HNS. “The Operating Costs of Primary Health Care in a Sample of Institutionsof the Ministry for Public Health in Bolvia 1990 - 1991.” Washington DC, UnitedStates, December 1991.
Lamy, Ph. "Introduction to Pharmaceutical Marketing in Bolivia." Bolivian PublicHealth, Year XXXIII, No.53. La Paz, November 1994.
Medicentro. "The New Private Alternative in Health Care Services." La Paz, Bolivia.
Ministry for Human Development. “Comparative Analysis of Health Conditions inthe Urban Districts of the P.S.F. 1992 - 1993”. Series of Technical PublicationsPSF Nº 4. La Paz, Bolivia 1995.
Ministry of Human Development. “Study of the Fee Schedules for Health CareServices." Series of Technical Publications PSF Nº 7. La Paz, Bolivia 1995.
Ministry of Human Development. “Health Statistics 1994.” Statistics Yearbook Nº8. Regional Sub-system of Information and Statistics. La Paz, Bolivia 1994.
Ministry of Human Development. "Poverty Map- A Guide For Social Action."UDAPSO, INE, UPP, UDAPE. La Paz, Diciembre 1993.
Ministry of Human Development. “Directory of Hospitals in Bolivia.” NationalHealth Secretariat. La Paz, Bolivia 1994.
Ministry of Human Development. “Program of Strategic Actions (PSA).”Government Policy for Human Development. 1996.
Minister of Finance. “National Directory of NGOS in Bolivia 1996.” Subsecretariatof Public Invesment and External Financing. La Paz, Bolivia. 1996.

Data for Decision Making Project 51
Ministry of Human Development. “Consultative Group Meeting”. Washington D.C.Diciembre 1993.
Morales, J.A. “Macroeconomic Adjustment and its Impact on the Health Sector inBolivia”. Macroeconomics, Health and Development Series No.10. WHO, Geneva,October 1993.
Morales A., R. “Human Development Indices for Bolivia.” CIESS-Econométrica. LaPaz. 1992.
MPSSP. “Bolivia: The State of Health and its Tendencies.” La Paz. 1989.
MPSSP. “National Health Policy. Groundwork and Achievements 1989-1993.” LaPaz.
Pommier R. “Guide to Health Professionals 1996-1997.” Santa Cruz, Bolivia1996.
Presidency of the Republic of Bolivia. “Public Health Care System, Descentralizedand Participatory.” S.D. 24237.
United Nations Development Program. Report on Development Funding sobre laCooperación para el Desarrollo. Bolivia. 1994-1996.
National Program Against Chagas. MPSSP. “Towards Integrated and SystematicAction to Achieve Development in Health.” 1991.
PROSALUD. “Institutional Presentation.” Santa Cruz, May 1994.
Proyecto APS. Distrito III of the City of El Alto. December 13, 1995.
PSF/SNS. “Access to Health Services and the Attitudes of People Twards theProcess of Health and Illness.” Technical Publications Series: PSF No.6. La Paz,1994.
Rosenthal, G. et.al. “Toward Self-financing of Primary Health Services: A MarketStudy of PROSALUD in Santa Cruz, Bolivia”. NY, August 1988.
National Secretariat of Health (NHS). Health Sector Reform in Bolivia. 1996.
National Health Secretariat. Proposal for a Medical Rotating Fund. IADB, PSF. LaPaz, Bolivia 1996.
National Health Secreatriat (NHS). SNIS. Health Statistics 1991-1995.
Suarez R. “National Spending and Financing of the Health Sector in Latin Americaand the Caribbean.” Technical Report Series Nº 30. WHO/PHO. Washington D.C.,United States. March 1994.
Tejada D. “Crisis of Paradigms in the Reform Process in the Health Sector.” Series:Dialogues on Health. Ildis, Iniciativa. La Paz, Bolivia 1995.

52 Marina Cárdenas Robles, Jorge A. Muñoz and Mukesh Chawla
The World Bank. “Bolivia, Integrated Health Development Project”. Staff AppraisalReport. 20 Diciembre 1989.
UDAPSO,NHS,PHO. Seminar on Health Financing. Washington. 1995.
UDAPE. Information Dossier on Bolivian Statistics. 1994-1995.
Urquiola, M. “Economic Access of to Health Services,” in PHO/WHO, MCTH, LISR:“Poverty and Health in Bolivia.” Bolivia, 1994.
Walsh J. y Anderson D. “Workshop Proceedings. Cost and Cost-effectiveness ofHealth Services.” Harvard University. La Paz, Bolivia 9-11 de Mayo de 1995.
Supreme DecreesSupreme Decrees
S.D. 23813, July 1, 1994: Regulations for Economic and Patrimonial Aspects ofthe PPL.
S.D. 23858, September 9, 1994: On Civil Society and the Popular ParticipationProcess.
It is estimated that in Bolivia there are 12,000 rural organizations and 8,000neighborhood juntas.
S.D. 23818, July 8, 1994: The Demarcation Commission is created to LEVANTARLOS MAPAS PROVISIONALES DE LAS DIFERENTES SECCIONES MUNICIPALES YUBICAR SUS POBLACIONES.
S.D. 24182, December 12, 1995: Establishes the percentage which themunicipalities should assign towards human development, with an end to accedethe departmetal resources and the development funds. The assignments are certifiedby the sectoral secretariats.

Data for Decision Making Project 53
Appendix 1Appendix 1
Bolivia: No. of Cases of Malaria and Tuberculosis 1982-95
Tuberculosis Malaria
1982 4,777 6,699
1983 5,178 14,441
1984 4,131 16,338
1985 7,679 16,017
1986 6,837 20,993
1987 8,960 24,891
1988 10,664 22,257
1989 12,563 25,367
1990 11,166 19,680
1991 11,223 19,031
1992 9,520 24,486
1993 8,614 27,475
1994 9,392 34,835
1995 9,551 46,911
Source: UDAPSO, based on S.N.S

54 Marina Cárdenas Robles, Jorge A. Muñoz and Mukesh Chawla
Health Care Packages of the National Mother ChildInsurance Program
Packages Value (Bs.)
Normal Pre-natal (includes four visits) 5
Vaginal Birth 35
C-Section 220
Post-partum Care 2
Third Trimester Hemorrhage 110
Puerperal Hemorrhage 25
Eclampsia and Severe Pre-eclampsia 100
Pre-eclampsia 55
Puerperal Infection/Sepsis 210
Risk of Pre-mature Birth 250
Pathological Ictericia in Newborns 15
Newborn with Congenital Disorder (?) 35
Hospital Care for Pneumonia/Sepsis 85
Hospital Care for Pneumonia (Critical) 100
Hospital Care for Diarrhea 25
Ambulatory Care for Diarrhea 2
Blood Group Test 2
Hemogram 2
Partial Urine Exam 2
VDRL or RPR 2
Glycemia 2
X-Rays for Children’s Thorax 10
Source: UDAPSO based on NHS
Appendix 2Appendix 2