
MANAGING INVESTMENT PORTFOLIOS WORKBOOK A DYNAMIC PROCESS Third Edition
242
MANAGING INVESTMENT PORTFOLIOS WORKBOOK A DYNAMIC PROCESS Third Edition John L. Maginn, CFA Donald L. Tuttle, CFA Dennis W. McLeavey, CFA Jerald E. Pinto, CFA John Wiley & Sons, Inc.
Transcript of MANAGING INVESTMENT PORTFOLIOS WORKBOOK A DYNAMIC PROCESS Third Edition
MANAGINGINVESTMENTPORTFOLIOSWORKBOOK
A DYNAMIC PROCESS
Third Edition
John L. Maginn, CFA
Donald L. Tuttle, CFA
Dennis W. McLeavey, CFA
Jerald E. Pinto, CFA
John Wiley & Sons, Inc.


MANAGINGINVESTMENTPORTFOLIOSWORKBOOK
A DYNAMIC PROCESS

The CFA Institute is the premier association for investment professionals around the world,with over 85,000 members in 129 countries. Since 1963 the organization has developedand administered the renowned Chartered Financial Analyst® Program. With a rich historyof leading the investment profession, CFA Institute has set the highest standards in ethics,education, and professional excellence within the global investment community, and is theforemost authority on investment profession conduct and practice.
Each book in the CFA Institute Investment Series is geared toward industry practitionersalong with graduate-level finance students and covers the most important topics in theindustry. The authors of these cutting-edge books are themselves industry professionals andacademics and bring their wealth of knowledge and expertise to this series.

MANAGINGINVESTMENTPORTFOLIOSWORKBOOK
A DYNAMIC PROCESS
Third Edition
John L. Maginn, CFA
Donald L. Tuttle, CFA
Dennis W. McLeavey, CFA
Jerald E. Pinto, CFA
John Wiley & Sons, Inc.

Copyright c⃝ 2007 by CFA Institute. All rights reserved.
Published by John Wiley & Sons, Inc., Hoboken, New Jersey.Published simultaneously in Canada.
No part of this publication may be reproduced, stored in a retrieval system, or transmitted in any form or by anymeans, electronic, mechanical, photocopying, recording, scanning, or otherwise, except as permitted under Section107 or 108 of the 1976 United States Copyright Act, without either the prior written permission of the Publisher, orauthorization through payment of the appropriate per-copy fee to the Copyright Clearance Center, Inc., 222Rosewood Drive, Danvers, MA 01923, (978) 750-8400, fax (978) 646-8600, or on the Web at www.copyright.com.Requests to the Publisher for permission should be addressed to the Permissions Department, John Wiley & Sons,Inc., 111 River Street, Hoboken, NJ 07030, (201) 748-6011, fax (201) 748-6008, or online athttp://www.wiley.com/go/permissions.
Limit of Liability/Disclaimer of Warranty: While the publisher and authors have used their best efforts in preparingthis book, they make no representations or warranties with respect to the accuracy or completeness of the contents ofthis book and specifically disclaim any implied warranties of merchantability or fitness for a particular purpose. Nowarranty may be created or extended by sales representatives or written sales materials. The advice and strategiescontained herein may not be suitable for your situation. You should consult with a professional where appropriate.Neither the publisher nor authors shall be liable for any loss of profit or any other commercial damages, includingbut not limited to special, incidental, consequential, or other damages.
For general information on our other products and services or for technical support, please contact our CustomerCare Department within the United States at (800) 762-2974, outside the United States at (317) 572-3993 or fax(317) 572-4002.
Wiley also publishes its books in a variety of electronic formats. Some content that appears in print may not beavailable in electronic formats. For more information about Wiley products, visit our Web site at www.wiley.com.
ISBN 978-0-470-10493-4
Printed in the United States of America.
10 9 8 7 6 5 4 3 2 1

CONTENTS
PART ILearning Outcomes, Summary Overview, and Problems
CHAPTER 1The Portfolio Management Process and the Investment Policy
Statement 3
Learning Outcomes 4Summary Overview 4Problems 6
CHAPTER 2Managing Individual Investor Portfolios 12
Learning Outcomes 12Summary Overview 13Problems 15
CHAPTER 3Managing Institutional Investor Portfolios 25
Learning Outcomes 25Summary Overview 26Problems 28
CHAPTER 4Capital Market Expectations 35
Learning Outcomes 35Summary Overview 36Problems 38
CHAPTER 5Asset Allocation 47
Learning Outcomes 47Summary Overview 48Problems 50
v

vi Contents
CHAPTER 6Fixed-Income Portfolio Management 60
Learning Outcomes 60Summary Overview 61Problems 64
CHAPTER 7Equity Portfolio Management 69
Learning Outcomes 69Summary Overview 70Problems 72
CHAPTER 8Alternative Investments Portfolio Management 76
Learning Outcomes 77Summary Overview 78Problems 79
CHAPTER 9Risk Management 86
Learning Outcomes 86Summary Overview 87Problems 89
CHAPTER 10Execution of Portfolio Decisions 95
Learning Outcomes 95Summary Overview 96Problems 97
CHAPTER 11Monitoring and Rebalancing 102
Learning Outcomes 102Summary Overview 103Problems 104
CHAPTER 12Evaluating Portfolio Performance 112
Learning Outcomes 112Summary Overview 113Problems 116

Contents vii
CHAPTER 13Global Investment Performance Standards 121
Learning Outcomes 121
Summary Overview 122
Problems 125
PART IISolutions
CHAPTER 1The Portfolio Management Process and the Investment Policy
Statement 135
Solutions 135
CHAPTER 2Managing Individual Investor Portfolios 140
Solutions 140
CHAPTER 3Managing Institutional Investor Portfolios 152
Solutions 152
CHAPTER 4Capital Market Expectations 160
Solutions 160
CHAPTER 5Asset Allocation 170
Solutions 170
CHAPTER 6Fixed-Income Portfolio Management 177
Solutions 177
CHAPTER 7Equity Portfolio Management 183
Solutions 183

viii Contents
CHAPTER 8Alternative Investments Portfolio Management 186
Solutions 186
CHAPTER 9Risk Management 194
Solutions 194
CHAPTER 10Execution of Portfolio Decisions 199
Solutions 199
CHAPTER 11Monitoring and Rebalancing 205
Solutions 205
CHAPTER 12Evaluating Portfolio Performance 210
Solutions 210
CHAPTER 13Global Investment Performance Standards 218
Solutions 218
About the CFA Program 231

PART ILEARNING OUTCOMES,SUMMARY OVERVIEW,
AND PROBLEMS

CHAPTER 1THE PORTFOLIO
MANAGEMENT PROCESSAND THE INVESTMENT
POLICY STATEMENT
John L. Maginn, CFAMaginn Associates, Inc.
Omaha, Nebraska
Donald L. Tuttle, CFACFA Institute
Charlottesville, Virginia
Dennis W. McLeavey, CFACFA Institute
Charlottesville, Virginia
Jerald E. Pinto, CFACFA Institute
Charlottesville, Virginia
3

4 Learning Outcomes, Summary Overview, and Problems
LEARNING OUTCOMES
After completing this chapter, you will be able to do the following:
• Justify the importance of the portfolio perspective.• Formulate the steps of the portfolio management process and the components of those
steps.• Compare and contrast the types of investment objectives.• Contrast the types of investment constraints.• Justify the central role of the investment policy statement in the portfolio management
process.• Review the elements of an investment policy statement and distinguish among the compo-
nents within (1) the risk objective, (2) the return objective, and (3) the time horizon con-straint.
• Compare and contrast passive, active, and semiactive approaches to investing.• Discuss the role of capital market expectations in the portfolio management process.• Discuss the role of strategic asset allocation in the portfolio management process.• Discuss the roles of portfolio selection/composition and portfolio implementation in the
portfolio management process.• Contrast the elements of performance evaluation.• Explain the purpose of monitoring and rebalancing.• Formulate the elements of portfolio management as an ongoing process.• Formulate and justify a risk objective for an investor.• Formulate and justify a return objective for an investor.• Determine the liquidity requirement of an investor and evaluate the effects of a liquidity
requirement on portfolio choice.• Contrast the types of time horizons, determine the time horizon for an investor, and
evaluate the effects of the investor’s time horizon on portfolio choice.• Determine the tax concerns, legal and regulatory factors, and unique circumstances for an
investor and evaluate their effects on portfolio choice.• Justify ethical conduct as a requirement for managing investment portfolios.
SUMMARY OVERVIEW
In Chapter 1, we have presented the portfolio management process and the elements of theinvestment policy statement.
• According to the portfolio perspective, individual investments should be judged in thecontext of how much risk they add to a portfolio rather than on how risky they are on astand-alone basis.
• The three steps in the portfolio management process are the planning step (objectivesand constraint determination, investment policy statement creation, capital market expec-tation formation, and strategic asset allocation creation); the execution step (portfolioselection/composition and portfolio implementation); and the feedback step (performanceevaluation and portfolio monitoring and rebalancing).

Chapter 1 The Portfolio Management Process and the Investment Policy Statement 5
• Investment objectives are specific and measurable desired performance outcomes, andconstraints are limitations on the ability to make use of particular investments. The twotypes of objectives are risk and return. The two types of constraints are internal (posed bythe characteristics of the investor) and external (imposed by outside agencies).
• An investment policy statement (IPS) is a written planning document that governs allinvestment decisions for the client. This document integrates a client’s needs, preferences,and circumstances into a statement of that client’s objectives and constraints.
• A policy or strategic asset allocation establishes exposures to IPS-permissible asset classes in amanner designed to satisfy the client’s long-run objectives and constraints. The plan reflectsthe interaction of objectives and constraints with long-run capital market expectations.
• In a passive investment strategy approach, portfolio composition does not react to changesin expectations; an example is indexing, which involves a fixed portfolio designed toreplicate the returns on an index. An active approach involves holding a portfolio differentfrom a benchmark or comparison portfolio for the purpose of producing positive excessrisk-adjusted returns. A semiactive approach refers to an indexing approach with controlleduse of weights different from the benchmark.
• The portfolio selection/composition decision concerns portfolio construction and often usesportfolio optimization to combine assets efficiently to achieve return and risk objectives.The portfolio implementation decision concerns the trading desk function of implementingportfolio decisions and involves explicit and implicit transaction costs.
• The elements of performance evaluation are performance measurement, attribution, andappraisal. Performance measurement is the calculation of portfolio rates of return. Per-formance attribution is the analysis of those rates of return to determine the factorsthat explain how the return was achieved. Performance appraisal assesses how well theportfolio manager performed on a risk-adjusted basis, whether absolute or relative to abenchmark.
• Portfolio monitoring and rebalancing use feedback to manage ongoing exposures to availableinvestment opportunities in order to continually satisfy the client’s current objectives andconstraints.
• Portfolio management is an ongoing process in which the investment objectives andconstraints are identified and specified, investment policies and strategies are developed,the portfolio composition is decided in detail, portfolio decisions are initiated by portfoliomanagers and implemented by traders, portfolio performance is evaluated, investor andmarket conditions are monitored, and any necessary rebalancing is implemented.
• The steps to determine a risk objective include: (1) specify a risk measure (or measures) suchas standard deviation, (2) determine the investor’s willingness to take risk, (3) determinethe investor’s ability to take risk, (4) synthesize the investor’s willingness and ability intothe investor’s risk tolerance, and (5) specify an objective using the measure(s) in the firststep above.
• The steps to determine a return objective include: (1) specify a return measure such astotal nominal return, (2) determine the investor’s stated return desire, (3) determine theinvestor’s required rate of return, and (4) specify an objective in terms of the return measurein the first step above.
• A liquidity requirement is a need for cash in excess of the contribution rate or the savingsrate at a specified point in time. This need may be either anticipated or unanticipated.
• A time horizon is the time period associated with an investment objective. Investmentobjectives and associated time horizons may be short term, long term, or a combination

6 Learning Outcomes, Summary Overview, and Problems
of these two. A multistage horizon is a combination of shorter-term and longer-termhorizons. A time horizon can be considered a constraint because shorter time horizonsgenerally indicate lower risk tolerance and hence constrain portfolio choice, making it moreconservative.
• A tax concern is any issue arising from a tax structure that reduces the amount of the totalreturn that can be used for current needs or reinvested for future growth. Tax concernsconstrain portfolio choice. If differences exist between the tax rates applying to investmentincome and capital gains, tax considerations will influence the choice of investment.
• Legal and regulatory factors are external considerations that may constrain investmentdecision making. For example, a government agency may limit the use of certain assetclasses in retirement portfolios.
Unique circumstances are internal factors (other than a liquidity requirement, timehorizon, or tax concerns) that may constrain portfolio choices. For example, an investorseeking to avoid investments in tobacco companies will place an internal constraint onportfolio choice.
PROBLEMS
1. A. An individual expects to save ¤50,000 during the coming year from income from non-portfolio sources, such as salary. She will need ¤95,000 within the year to make a downpayment for a house purchase. What is her liquidity requirement for the coming year?
B. Endowments are funds that are typically owned by nonprofit institutions involved ineducational, medical, cultural, and other charitable activities. Classified as institutionalinvestors, endowments are almost always established with the intent of lasting intoperpetuity.
The Wilson-Fowler Endowment was established in the United States to providefinancial support to Wilson-Fowler College. An endowment’s spending rate definesthe fraction of endowment assets distributed to the supported institution. The Wilson-Fowler Endowment has established a spending rate of 4 percent a year; the endowmentfollows the simple rule of spending, in a given year, an amount equal to 4% × (Marketvalue of the endowment at the end of the prior year). This amount is committed tothe budgetary support of the college for the coming year. At the end of the prior year,the market value of the Wilson-Fowler Endowment’s assets stood at $75 million. Inaddition, the Wilson-Fowler Endowment has committed to contribute $1 millionin the coming year to the construction of a new student dormitory. Planners at theendowment expect the endowment to receive contributions or gifts (from alumni andother sources) of $400,000 over the coming year. What is the anticipated liquidityrequirement of the Wilson-Fowler Endowment for the coming year?
2. The Executive Director of the Judd University Endowment estimates that the capitalmarkets will provide a 9 percent expected return for an endowment portfolio takingabove-average risk, and a 7 percent expected return for an endowment portfolio takingaverage risk. The Judd Endowment provides tuition scholarships for Judd Universitystudents. The spending rate has been 4 percent, and the expected tuition inflation rateis 3 percent. Recently, university officials have pressured the endowment to increase thespending rate to 6 percent. The endowment has an average to below-average ability toaccept risk and only an average willingness to take risk, but a university official claims

Chapter 1 The Portfolio Management Process and the Investment Policy Statement 7
that the risk tolerance should be raised because higher returns are needed. Discuss anappropriate return objective and risk tolerance for the Judd Endowment.
3. Stux (1994) describes a country allocation strategy across five major equity markets: theUnited States, the United Kingdom, Germany, France, and Japan. In this strategy, ameasure of relative attractiveness among the five equity markets is used as a factor indetermining the weights of the five equity markets in the overall portfolio. The investmentin each country, however, whatever the country’s weight, is an indexed investment inthe equity market of that country. The weights of the five equity markets in the overallportfolio generally are expected to differ from benchmark weights (the weights of thecountries in an appropriate benchmark for the international equity market), within limits.
A. Characterize the two components (portfolio weights and within-country investments)of the country allocation strategy using the text’s framework for classifying investmentstrategies.
B. Characterize the country allocation strategy overall.
4. Characterize each of the investment objectives given below as one of the following: anabsolute risk objective, a relative risk objective, an absolute return objective, or a relativereturn objective.
A. Achieve a rate of return of 8 percent a year.B. Limit the standard deviation of portfolio returns to 20 percent a year or less.C. Achieve returns in the top quartile of the portfolio’s peer universe (the set of portfolios
with similar investment objectives and characteristics).D. Maintain a 10 percent or smaller probability that the portfolio’s return falls below the
threshold level of 5 percent per annum over a one-year time horizon.E. Achieve a tracking risk of no more than 4 percent per annum with respect to the
portfolio’s benchmark.
Questions 5 through 10 relate to James Stephenson. Select and justify the bestanswer.
James Stephenson, age 55 and single, is a surgeon who has accumulated a substantialinvestment portfolio without a clear long-term strategy in mind. Two of his patients whowork in financial markets comment as follows:
• James Hrdina: ‘‘My investment firm, based on its experience with investors, hasstandard investment policy statements in five categories. You would be better served toadopt one of these standard policy statements instead of spending time developing apolicy based on your individual circumstances.’’
• Charles Gionta: ‘‘Developing a long-term policy can be unwise given the fluctuationsof the market. You want your investment adviser to react continuously to changingconditions and not be limited by a set policy.’’
Stephenson hires a financial adviser, Caroline Coppa. At their initial meeting, Coppacompiles the following notes:
Stephenson currently has a $2.0 million portfolio that has a large concentration insmall-capitalization U.S. equities. Over the past five years, the portfolio has averaged20 percent annual total return on investment. Stephenson hopes that, over the longterm, his portfolio will continue to earn 20 percent annually. When asked about his

8 Learning Outcomes, Summary Overview, and Problems
risk tolerance, he described it as ‘‘average.’’ He was surprised when informed that U.S.small-cap portfolios have experienced extremely high volatility.
He does not expect to retire before age 70. His current income is more than sufficientto meet his expenses. Upon retirement, he plans to sell his surgical practice and use theproceeds to purchase an annuity to cover his postretirement cash flow needs.
Both his income and realized capital gains are taxed at a 30 percent rate. No pertinentlegal or regulatory issues apply. He has no pension or retirement plan but does havesufficient health insurance for postretirement needs.
5. The comments about investment policy statements made by Stephenson’s patients arebest characterized as
Hrdina Gionta
A. Correct CorrectB. Correct IncorrectC. Incorrect CorrectD. Incorrect Incorrect
6. In formulating the return objective for Stephenson’s investment policy statement, themost appropriate determining factor for Coppa to focus on is
A. Return desiresB. Ability to take riskC. Return requirementD. Stephenson’s returns over past five years
7. Stephenson’s willingness and ability to accept risk can be best characterized as
Willingness to Accept Risk Ability to Accept Risk
A. Below average Below averageB. Below average Above averageC. Above average Below averageD. Above average Above average
8. Stephenson’s tax and liquidity constraints can be best characterized as
Tax Constraint Liquidity Constraint
A. Significant SignificantB. Significant InsignificantC. Insignificant SignificantD. Insignificant Insignificant
9. Stephenson’s time horizon is best characterized as
A. Short-term and single-stageB. Short-term and multistage

Chapter 1 The Portfolio Management Process and the Investment Policy Statement 9
C. Long-term and single-stageD. Long-term and multistage
10. Stephenson’s return objective and risk tolerance are most appropriately described as
Return Objective Risk Tolerance
A. Below average Below averageB. Below average Above averageC. Above average Below averageD. Above average Above average
11. James Stephenson Investment Profile
Case FactsType of investor Individual; surgeon, 55 years of age, in
good healthAsset base $2 millionStated return desire or investment goal 10 percentage points above the average
annual return on U.S.small-capitalization stocks
Annual spending needs $150,000Annual income from nonportfolio
sources (before tax)$350,000 from surgical practice
Other return factors Inflation is 3%Risk considerations Owns large concentration in U.S.
small-capitalization stocksSpecific liquidity requirements $70,000 charitable donation in 10
monthsTime specifications Retirement at age 70Tax concerns Income and capital gains taxed at 30
percent
Questions1. Underline the word at right that best describes the client’s:
A. Willingness to accept risk Below average Above averageB. Ability to accept risk Below average Above averageC. Risk tolerance Below average Above averageD. Liquidity requirement Significant Not significantE. Time horizon Single stage MultistageF. Overall time horizon Short to intermediate term Long termG. Tax concerns Significant Not significant
2. Discuss appropriate client objectives:A. RiskB. Return

10 Learning Outcomes, Summary Overview, and Problems
12. Foothill College Endowment Fund
Case FactsType of investor Institutional; endowmentPurpose Provide annual scholarships currently totaling $39.5 millionAsset base $1 billionStated return desire 6 percent, calculated as spending rate of 4 percent plus
previously expected college tuition inflation of 2 percentOther return factors Revised expectation of college tuition inflation is 3 percentTax concerns Tax exempt
Questions1. Underline the word at right that best describes the client’s:
A. Risk tolerance Below average Above averageB. Liquidity requirement Significant Not significantC. Time horizon Single stage MultistageD. Overall time horizon Short to intermediate term Long termE. Tax concerns Significant Not significant
2. Discuss appropriate client objectives:A. RiskB. Return
13. Vincenzo Donadoni Investment Profile (adapted from 1998 CFA Level III exam)
Case FactsType of investor Individual; 56 year old male in good
healthAsset base 13.0 million Swiss francs (CHF)Stated return desire or investment
goalLeave a trust fund of CHF 15.0 million
for three childrenAnnual spending needs CHF 250,000 rising with inflationAnnual income from other sources
(after tax)CHF 125,000 consulting income for
next two years onlyAbility to generate additional income NoWillingness to accept risk Impulsive, opinionated, successful with
large bets as a businessman, believessuccess depends on taking initiative
Specific liquidity requirements CHF 1.5 million immediately torenovate house
CHF 2.0 million in taxes due in ninemonths
Time specifications Long term except for liquidity concernsLegal and regulatory factors NoneUnique circumstances None

Chapter 1 The Portfolio Management Process and the Investment Policy Statement 11
Questions1. Underline the word at right that best describes the client’s:
A. Willingness to accept risk Below average Above averageB. Ability to accept risk Below average Above averageC. Risk tolerance Below average Above averageD. Liquidity requirement Significant Not significantE. Time horizon Single stage MultistageF. Overall time horizon Short to intermediate term Long term
2. Discuss appropriate client objectives:A. RiskB. Return
CHAPTER 2MANAGING INDIVIDUALINVESTOR PORTFOLIOS
James W. Bronson, CFANorthern Trust Bank
Newport Beach, California
Matthew H. Scanlan, CFABarclays Global InvestorsSan Francisco, California
Jan R. Squires, CFACFA InstituteHong Kong
LEARNING OUTCOMES
After completing this chapter, you will be able to do the following:
• Review situational profiling for individual investors and discuss source of wealth, measureof wealth, and stage of life as approaches to situational profiling.
• Prepare an elementary situational profile for an individual investor.• Discuss the role of psychological profiling in understanding individual investor behavior.• Formulate the basic principles of the behavioral finance investment framework.• Discuss the influence of investor psychology on risk tolerance and investment choices.• Discuss the use of a personality-typing questionnaire for identifying an investor’s personality
type.• Formulate the relationship of risk attitudes and decision-making styles with individual
investor personality types.• Discuss the potential benefits for both clients and investment advisers of having a formal
investment policy statement.• Review the process involved in creating an investment policy statement for a client.
12

Chapter 2 Managing Individual Investor Portfolios 13
• Discuss each of the major objectives that an individual investor’s investment policystatement includes.
• Distinguish between an individual investor’s ability to take risk and willingness to take risk.• Discuss how to set risk and return objectives for individual investor portfolios.• Discuss each of the major constraints that an individual investor’s investment policy
statement includes.• Formulate and justify an investment policy statement for an individual investor.• Demonstrate the use of a process of elimination to arrive at an appropriate strategic asset
allocation for an individual investor.• Determine the strategic asset allocation that is most appropriate given an individual
investor’s investment objectives and constraints.• Compare and contrast traditional deterministic versus Monte Carlo approaches in the
context of retirement planning.• Discuss the advantages of the Monte Carlo approach to retirement planning.
SUMMARY OVERVIEW
Chapter 2 has presented an overview of portfolio management for individual investors,including the information-gathering process, situational and psychological profiling of clients,formulation of an investment policy statement, strategic asset allocation, and the use of MonteCarlo simulation in personal retirement planning.
• Situational profiling seeks to anticipate individual investors’ concerns and risk tolerance byspecifying the investor’s source of wealth, measure or adequacy of wealth in relationship toneeds, and stage of life.
• Psychological profiling addresses human behavioral patterns and personality characteristicsand their effect on investment choices. It is particularly important in assessing risk tolerance.
• Underlying behavioral patterns often play an important role in setting individual risktolerance and return objectives.
• Based on their responses to a questionnaire, individual investors may be classified intodescriptive personality types, such as cautious, methodical, spontaneous, or individualist.
• Using the results of situational and psychological profiling, and the financial informationgathered in the interviewing process, an adviser can formulate an investment policystatement (IPS).
• A carefully formulated IPS serves as the keystone to the relationship between investorand investment adviser. The process of creating an IPS mirrors the process of portfoliomanagement. The policy statement reconciles investment goals with the realities of risktolerance and investment constraints, resulting in operational guidelines for portfolioconstruction and a mutually agreed-upon basis for portfolio monitoring and review. Bynecessity, the investor and adviser must discuss the construction of an IPS in a linearfashion. In practice, the process is dynamic, similar to solving simultaneously for multiplevariables.
• The return objective for an investment portfolio must ultimately be made consistent withthe investor’s risk tolerance and the portfolio’s ability to generate returns. The traditionaldivision of return requirements between ‘‘income’’ and ‘‘growth’’ objectives may seemintuitive, but these terms blur the distinction between return goals and risk tolerance. The‘‘total return’’ approach seeks to identify a portfolio return that will meet the investor’sobjectives without exceeding the portfolio’s risk tolerance or violating its investmentconstraints.

14 Learning Outcomes, Summary Overview, and Problems
• Risk tolerance reflects both an investor’s ability and willingness to accept risk. Ability toaccept risk is a probabilistic assessment of the investment portfolio’s ability to withstandnegative investment outcomes and still meet the investor’s objectives. Willingness to acceptrisk is a more subjective assessment of the investor’s propensity for risk taking. Becausemany individuals are unfamiliar with the quantitative terminology of risk tolerance, theinvestment adviser may use psychological or situational profiling to anticipate clientattitudes toward risk.
• Investment constraints include the following:
1. Liquidity. Liquidity needs may be categorized as ongoing expenses, emergency reserves,and negative liquidity events. Liquidity is the ease and price certainty with whichassets can be converted into cash. Because assets with stable prices and low transactioncosts are generally low-risk investments, an increasing need for liquidity will constrainthe investment portfolio’s ability to accept risk. Significant illiquid holdings and theirassociated risks should be documented. For many investors, the home or residencerepresents a large percentage of total net worth and is relatively illiquid. Although theprimary residence may be viewed as offsetting long-term needs for care and housing, itshould be discussed as a source of investment risk and as a source of funding for futurecash flow needs. The investor and adviser should together thoroughly review the risksassociated with any concentration of net worth. Large ‘‘positive’’ liquidity events shouldalso be documented, even though they will not act as a constraint.
2. Time horizon. The investor’s time horizon also constrains his ability to accept risk;shorter investment horizons allow less time to make up portfolio losses. The timehorizon constraint may be categorized as short term, intermediate term, or long termand as single stage or multistage. With sufficient assets and multigenerational estateplanning, even older investors may retain a long-term investment perspective.
3. Taxes. The basic principles of tax deferral, avoidance, and reduction underlie alltax-driven portfolio strategies, but individual solutions are highly country specific andclient specific. Taxes relevant to portfolio management generally fall into four majorcategories: income, gains, wealth transfer, and property.
4. Legal and regulatory environment. The investment portfolio’s legal and regulatoryenvironment is ultimately country and client specific. A basic knowledge of English andAmerican trust law is often valuable, however, as the terminology is widely recognizedand the framework widely applied.
5. Unique circumstances. The IPS should capture all unique investment considerationsaffecting the portfolio. Unique circumstances might include guidelines for socialinvesting, trading restrictions, and privacy concerns.
• As a general rule, only certain asset allocations will be consistent with the client’s returnobjectives, risk tolerance, and investment constraints. The adviser can use a process ofelimination to arrive at an appropriate long-term strategic allocation.
• For individual investors, investment decisions, including asset allocation, are made on anafter-tax basis. This is a key distinction in contrast to tax-exempt institutions.
• Monte Carlo simulation has certain advantages over deterministic approaches: It moreaccurately portrays risk–return trade-offs, can illustrate the trade-offs between the attain-ment of short-term and long-term goals, provides more realistic modeling of taxes, and isbetter suited to assessing multiperiod effects.

Chapter 2 Managing Individual Investor Portfolios 15
PROBLEMS
Problems 1 through 8 relate to the Inger family: father (Peter), mother (Hilda), son(Hans), and daughter (Christa) and her child (Jurgen). Peter is the founder andmajority owner of IngerMarine.
Christa estimates that her revised annual living expenses, including a new studio andapartment, will average ¤132,500 (excluding Jurgen’s educational costs). If necessary,she could combine her apartment and studio to reduce spending by ¤32,500. Shedoes not want her financial security to be dependent on further gifting from herparents and is pleased that, after the sale of IngerMarine, she will be able to meether new living expenses with proceeds from art sales (¤50,000) and the expected totalreturn of the proposed investment portfolio (¤82,500). Because of the uncertainty ofart sales, Christa plans to establish an emergency reserve equal to one year’s livingexpenses. Her after-tax proceeds from the sale of IngerMarine are expected to be¤1, 200, 000 × (1 − 0.15) = ¤1, 020, 000. She also holds ¤75,000 in balanced mutualfunds and ¤25,000 in a money market fund. Christa intends to reevaluate her policystatement and asset allocation guidelines every three years.
1. Discuss Christa’s liquidity requirements.2. Determine Christa’s return requirement and evaluate whether her portfolio can be
expected to satisfy that requirement if inflation averages 3 percent annually and shereduces her annual living expenses to ¤100,000 by combining her apartment and studio.
3. Explain why an analysis of Christa’s investment policy statement might become necessarybefore the next three-year review.
Hans’s increasingly irresponsible lifestyle has become a burden to his parents. Hanswas recently arrested for reckless driving—he crashed his car into a restaurant, causingconsiderable damage and injuring a patron. As a result of Hans’s behavior, Peter hasplaced him on probationary leave of absence from IngerMarine but will allow him toretain his annual salary of ¤100,000. The restaurant patron is suing Hans for ¤700,000 indamages, and the restaurant owner estimates that it will take ¤500,000 to repair damagesto his building. Hans’s insurance will cover costs to a maximum of only ¤200,000.
4. Assess the impact of these events on Hans’s liquidity and his personal financial statement.What course of action should he pursue?
5. Assess Hans’s probable future ability to assume risk, based on information about hisbackground and current living situation.
Peter and Hilda are considering an investment of ¤1,000,000 in one of the followinginvestment funds:
InvestmentProjectedIncome
Projected PriceAppreciation
ProjectedTurnover
High-growth stock fund 2.0% 12% 75%Equity value fund 2.5% 10% 25%Municipal bond fund 5.0% (tax free) 2% 15%
6. Evaluate each investment fund based only on its after-tax return. Note: Capital gainstax = Price appreciation ×15% × Turnover rate
16 Learning Outcomes, Summary Overview, and Problems
IngerMarine has experienced a catastrophic event from which it cannot recover.Damage claims resulting from a design flaw are expected to leave IngerMarine bankruptand its stock worthless. Peter’s pension is also lost.
7. Assess the probable impact on Peter’s and Hilda’s return requirement.8. Assess the probable impact on Peter’s and Hilda’s portfolio constraints.9. Adapted from the 2001 CFA Level III examination:
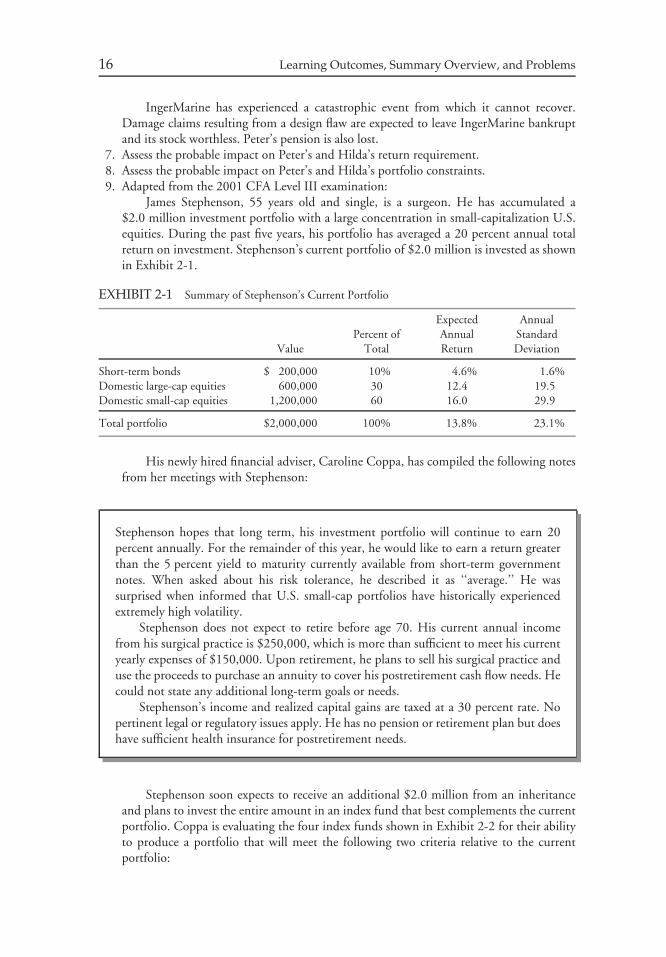
James Stephenson, 55 years old and single, is a surgeon. He has accumulated a$2.0 million investment portfolio with a large concentration in small-capitalization U.S.equities. During the past five years, his portfolio has averaged a 20 percent annual totalreturn on investment. Stephenson’s current portfolio of $2.0 million is invested as shownin Exhibit 2-1.
EXHIBIT 2-1 Summary of Stephenson’s Current Portfolio
ValuePercent of
Total
ExpectedAnnualReturn
AnnualStandardDeviation
Short-term bonds $ 200,000 10% 4.6% 1.6%Domestic large-cap equities 600,000 30 12.4 19.5Domestic small-cap equities 1,200,000 60 16.0 29.9
Total portfolio $2,000,000 100% 13.8% 23.1%
His newly hired financial adviser, Caroline Coppa, has compiled the following notesfrom her meetings with Stephenson:
Stephenson hopes that long term, his investment portfolio will continue to earn 20percent annually. For the remainder of this year, he would like to earn a return greaterthan the 5 percent yield to maturity currently available from short-term governmentnotes. When asked about his risk tolerance, he described it as ‘‘average.’’ He wassurprised when informed that U.S. small-cap portfolios have historically experiencedextremely high volatility.
Stephenson does not expect to retire before age 70. His current annual incomefrom his surgical practice is $250,000, which is more than sufficient to meet his currentyearly expenses of $150,000. Upon retirement, he plans to sell his surgical practice anduse the proceeds to purchase an annuity to cover his postretirement cash flow needs. Hecould not state any additional long-term goals or needs.
Stephenson’s income and realized capital gains are taxed at a 30 percent rate. Nopertinent legal or regulatory issues apply. He has no pension or retirement plan but doeshave sufficient health insurance for postretirement needs.
Stephenson soon expects to receive an additional $2.0 million from an inheritanceand plans to invest the entire amount in an index fund that best complements the currentportfolio. Coppa is evaluating the four index funds shown in Exhibit 2-2 for their abilityto produce a portfolio that will meet the following two criteria relative to the currentportfolio:
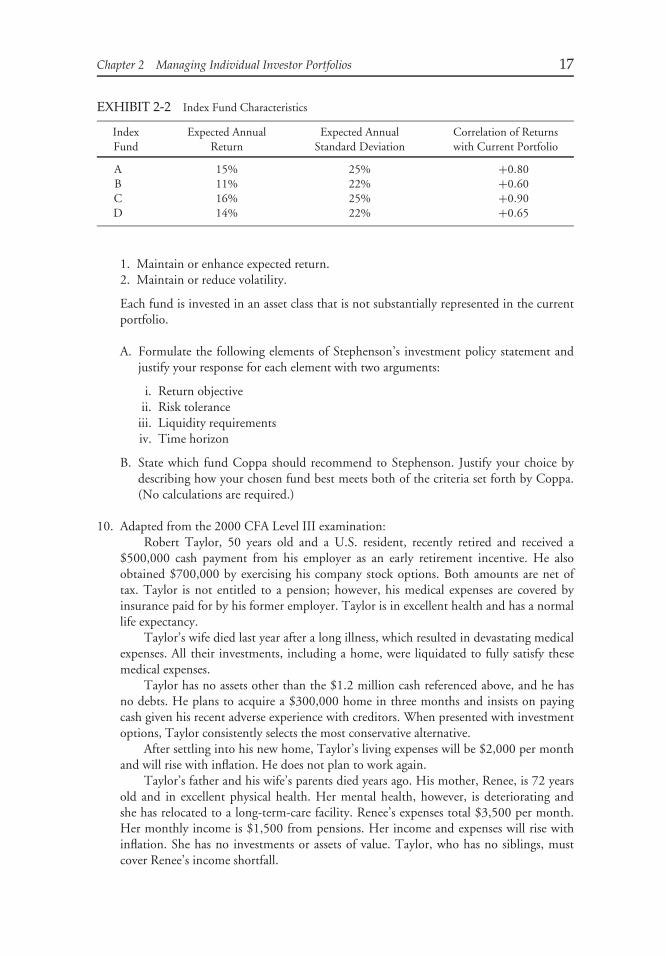
Chapter 2 Managing Individual Investor Portfolios 17
EXHIBIT 2-2 Index Fund Characteristics
IndexFund
Expected AnnualReturn
Expected AnnualStandard Deviation
Correlation of Returnswith Current Portfolio
A 15% 25% +0.80B 11% 22% +0.60C 16% 25% +0.90D 14% 22% +0.65
1. Maintain or enhance expected return.2. Maintain or reduce volatility.
Each fund is invested in an asset class that is not substantially represented in the currentportfolio.
A. Formulate the following elements of Stephenson’s investment policy statement andjustify your response for each element with two arguments:
i. Return objectiveii. Risk tolerance
iii. Liquidity requirementsiv. Time horizon
B. State which fund Coppa should recommend to Stephenson. Justify your choice bydescribing how your chosen fund best meets both of the criteria set forth by Coppa.(No calculations are required.)
10. Adapted from the 2000 CFA Level III examination:Robert Taylor, 50 years old and a U.S. resident, recently retired and received a
$500,000 cash payment from his employer as an early retirement incentive. He alsoobtained $700,000 by exercising his company stock options. Both amounts are net oftax. Taylor is not entitled to a pension; however, his medical expenses are covered byinsurance paid for by his former employer. Taylor is in excellent health and has a normallife expectancy.
Taylor’s wife died last year after a long illness, which resulted in devastating medicalexpenses. All their investments, including a home, were liquidated to fully satisfy thesemedical expenses.
Taylor has no assets other than the $1.2 million cash referenced above, and he hasno debts. He plans to acquire a $300,000 home in three months and insists on payingcash given his recent adverse experience with creditors. When presented with investmentoptions, Taylor consistently selects the most conservative alternative.
After settling into his new home, Taylor’s living expenses will be $2,000 per monthand will rise with inflation. He does not plan to work again.
Taylor’s father and his wife’s parents died years ago. His mother, Renee, is 72 yearsold and in excellent physical health. Her mental health, however, is deteriorating andshe has relocated to a long-term-care facility. Renee’s expenses total $3,500 per month.Her monthly income is $1,500 from pensions. Her income and expenses will rise withinflation. She has no investments or assets of value. Taylor, who has no siblings, mustcover Renee’s income shortfall.
18 Learning Outcomes, Summary Overview, and Problems
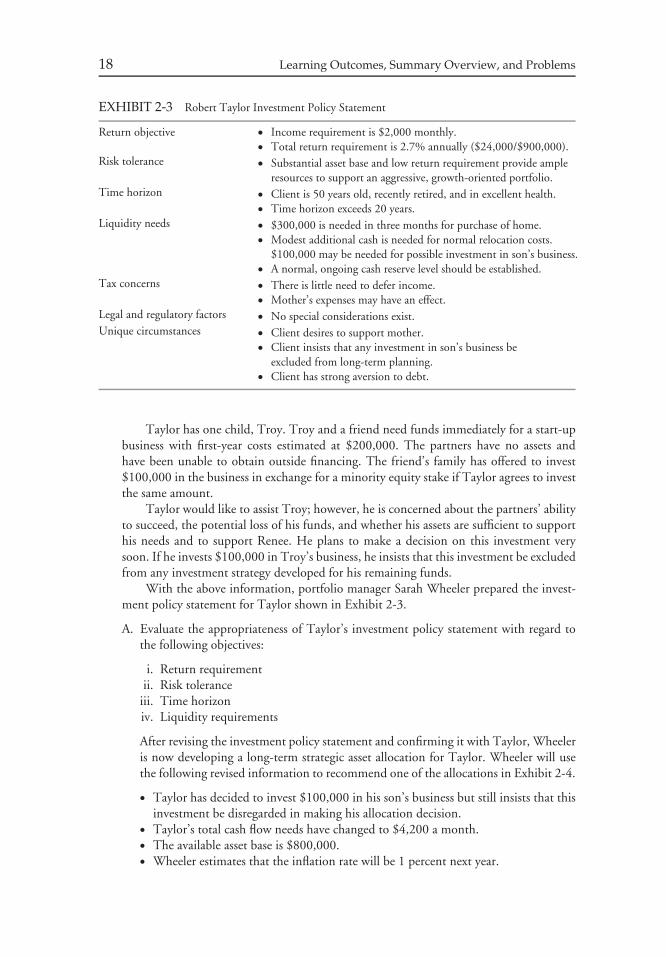
EXHIBIT 2-3 Robert Taylor Investment Policy Statement
Return objective • Income requirement is $2,000 monthly.• Total return requirement is 2.7% annually ($24,000/$900,000).
Risk tolerance • Substantial asset base and low return requirement provide ampleresources to support an aggressive, growth-oriented portfolio.
Time horizon • Client is 50 years old, recently retired, and in excellent health.• Time horizon exceeds 20 years.
Liquidity needs • $300,000 is needed in three months for purchase of home.• Modest additional cash is needed for normal relocation costs.
$100,000 may be needed for possible investment in son’s business.• A normal, ongoing cash reserve level should be established.
Tax concerns • There is little need to defer income.• Mother’s expenses may have an effect.
Legal and regulatory factors • No special considerations exist.Unique circumstances • Client desires to support mother.
• Client insists that any investment in son’s business beexcluded from long-term planning.
• Client has strong aversion to debt.
Taylor has one child, Troy. Troy and a friend need funds immediately for a start-upbusiness with first-year costs estimated at $200,000. The partners have no assets andhave been unable to obtain outside financing. The friend’s family has offered to invest$100,000 in the business in exchange for a minority equity stake if Taylor agrees to investthe same amount.
Taylor would like to assist Troy; however, he is concerned about the partners’ abilityto succeed, the potential loss of his funds, and whether his assets are sufficient to supporthis needs and to support Renee. He plans to make a decision on this investment verysoon. If he invests $100,000 in Troy’s business, he insists that this investment be excludedfrom any investment strategy developed for his remaining funds.
With the above information, portfolio manager Sarah Wheeler prepared the invest-ment policy statement for Taylor shown in Exhibit 2-3.
A. Evaluate the appropriateness of Taylor’s investment policy statement with regard tothe following objectives:
i. Return requirementii. Risk tolerance
iii. Time horizoniv. Liquidity requirements
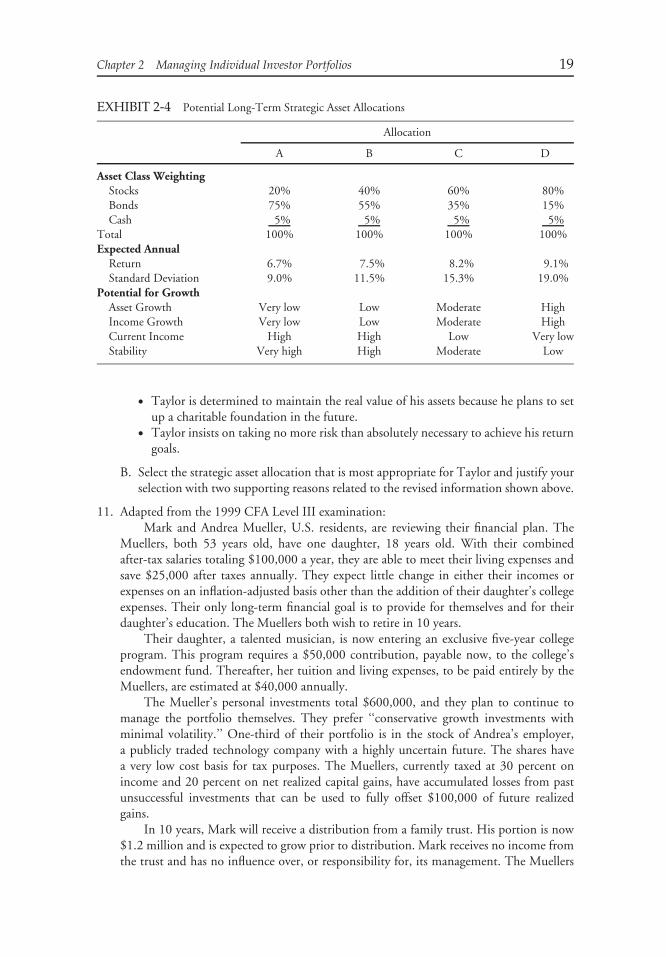
After revising the investment policy statement and confirming it with Taylor, Wheeleris now developing a long-term strategic asset allocation for Taylor. Wheeler will usethe following revised information to recommend one of the allocations in Exhibit 2-4.
• Taylor has decided to invest $100,000 in his son’s business but still insists that thisinvestment be disregarded in making his allocation decision.
• Taylor’s total cash flow needs have changed to $4,200 a month.• The available asset base is $800,000.• Wheeler estimates that the inflation rate will be 1 percent next year.
Chapter 2 Managing Individual Investor Portfolios 19
EXHIBIT 2-4 Potential Long-Term Strategic Asset Allocations
Allocation
A B C D
Asset Class WeightingStocks 20% 40% 60% 80%Bonds 75% 55% 35% 15%Cash 5% 5% 5% 5%
Total 100% 100% 100% 100%Expected Annual
Return 6.7% 7.5% 8.2% 9.1%Standard Deviation 9.0% 11.5% 15.3% 19.0%
Potential for GrowthAsset Growth Very low Low Moderate HighIncome Growth Very low Low Moderate HighCurrent Income High High Low Very lowStability Very high High Moderate Low
• Taylor is determined to maintain the real value of his assets because he plans to setup a charitable foundation in the future.
• Taylor insists on taking no more risk than absolutely necessary to achieve his returngoals.
B. Select the strategic asset allocation that is most appropriate for Taylor and justify yourselection with two supporting reasons related to the revised information shown above.
11. Adapted from the 1999 CFA Level III examination:Mark and Andrea Mueller, U.S. residents, are reviewing their financial plan. The
Muellers, both 53 years old, have one daughter, 18 years old. With their combinedafter-tax salaries totaling $100,000 a year, they are able to meet their living expenses andsave $25,000 after taxes annually. They expect little change in either their incomes orexpenses on an inflation-adjusted basis other than the addition of their daughter’s collegeexpenses. Their only long-term financial goal is to provide for themselves and for theirdaughter’s education. The Muellers both wish to retire in 10 years.
Their daughter, a talented musician, is now entering an exclusive five-year collegeprogram. This program requires a $50,000 contribution, payable now, to the college’sendowment fund. Thereafter, her tuition and living expenses, to be paid entirely by theMuellers, are estimated at $40,000 annually.
The Mueller’s personal investments total $600,000, and they plan to continue tomanage the portfolio themselves. They prefer ‘‘conservative growth investments withminimal volatility.’’ One-third of their portfolio is in the stock of Andrea’s employer,a publicly traded technology company with a highly uncertain future. The shares havea very low cost basis for tax purposes. The Muellers, currently taxed at 30 percent onincome and 20 percent on net realized capital gains, have accumulated losses from pastunsuccessful investments that can be used to fully offset $100,000 of future realizedgains.
In 10 years, Mark will receive a distribution from a family trust. His portion is now$1.2 million and is expected to grow prior to distribution. Mark receives no income fromthe trust and has no influence over, or responsibility for, its management. The Muellers

20 Learning Outcomes, Summary Overview, and Problems
know that these funds will change their financial situation materially but have excludedthe trust from their current financial planning.
A. Construct the objectives and constraints portion of an investment policy statementfor the Muellers, addressing each of the following:
i. Return objectiveii. Risk tolerance
iii. Time horizoniv. Liquidity requirementsv. Tax concerns
vi. Unique circumstances
Ten years have passed. The Muellers, now both aged 63, will retire this year. Thedistribution from Mark’s family trust will occur within the next two weeks. The Muellers’current circumstances are summarized below:
Personal Circumstances and Assets
• Pension income will total $100,000 a year and will not increase with inflation.• Annual expenses will total $180,000 initially and will increase with inflation.• Inflation is expected to be 2 percent annually.• Their personal investments now total $1 million (excluding trust distribution).• The Muellers will rely on this $1 million portfolio to support their lifestyle and do not
wish to reduce their level of spending.• The Muellers have health problems and neither is expected to live more than 10 years.
All health care expenses will be covered by employer-paid insurance.• The Muellers’ daughter is now financially independent, and the Muellers’ sole invest-
ment objective is to meet their spending needs.• The Muellers are not concerned with growing or maintaining principal. The income
deficit may be met with both investment income and by invading principal.
Trust Distribution Assets
• The trust distribution totals $2 million and will occur within the next two weeks. Notax liability is created by the distribution.
• The Muellers will maintain separate accounts for their personal assets and the trustdistribution.
• They do not plan to withdraw income or principal.• Tax liabilities produced by these assets will be paid from this portfolio.• The Muellers plan to donate these assets to an arts society when the surviving spouse
dies. They have made a minimum pledge of $2.6 million toward construction of a newbuilding.
• An after-tax annual return of 5.4 percent is required over five years to meet theminimum pledge.
• The Muellers are concerned only that a minimum gift of $2.6 million is available. TheMuellers assume that at least one of them will live at least five years and that neitherwill live more than 10 years.
Alternative portfolios for the Muellers’ consideration appear in Exhibit 2-5.

Chapter 2 Managing Individual Investor Portfolios 21
EXHIBIT 2-5
Portfolio
Asset Allocation A B C D
Domestic large-cap stocks 14% 30% 40% 30%Domestic small-cap stocks 3 5 10 25Foreign stocks 3 5 10 25Intermediate-term fixed income 70 60 30 20Cash equivalents 10 0 10 0Total 100% 100% 100% 100%Expected annual returna 4.2% 5.8% 7.5% 8.5%Annual standard deviation 6.0% 8.0% 13.0% 18.0%
aNominal after-tax returns.
B. Select and justify with three reasons the most appropriate of the four portfoliosfrom Exhibit 2-5 as an asset allocation for the Muellers’ $1 million in personalassets.
C. Select and justify with three reasons the most appropriate of the four portfolios fromExhibit 2-5 as an asset allocation for the Muellers’ $2 million in trust distributionassets.
12. Adapted from the 1997 CFA Level III examination:John Mesa, CFA, is a portfolio manager in the Trust Department of BigBanc. Mesa
has been asked to review the investment portfolios of Robert and Mary Smith, a retiredcouple and potential clients. Previously, the Smiths had been working with anotherfinancial adviser, WealthMax Financial Consultants (WFC). To assist Mesa, the Smithshave provided the following background information:
Family. We live alone. Our only daughter and granddaughter are financially secureand independent.
Health. We are both 65 years of age and in good health. Our medical costs arecovered by insurance.
Housing. Our house needs major renovation. The work will be completed withinthe next six months, at an estimated cost of $200,000.
Expenses. Our annual after-tax living costs are expected to be $150,000 for this yearand are rising with inflation, which is expected to continue at 3 percent annually.
Income. In addition to income from the Gift Fund and the Family Portfolio (bothdescribed below), we receive a fixed annual pension payment of $65,000 (aftertaxes), which continues for both of our lifetimes.
Financial Goals. Our primary objective is to maintain our financial security andsupport our current lifestyle. A secondary objective is to leave $1 million to ourgrandchild and $1 million to our local college. We recently completed the $1million gift to the college by creating a ‘‘Gift Fund.’’ Preserving the remainingassets for our granddaughter is important to us.
Taxes. Our investment income, including bond interest and stock dividends, is taxedat 30 percent. Our investment returns from price appreciation (capital gains)are taxed at 15 percent, at the time of sale. We have no other tax considerations.

22 Learning Outcomes, Summary Overview, and Problems
General Comments. We needed someone like WFC to develop a comprehensiveplan for us to follow. We can follow such a plan once it is prepared for us.We invest only in companies with which we are familiar. We will not sell asecurity for less than we paid for it. Given our need for income, we invest onlyin dividend-paying stocks.
Investments. We benefit from two investment accounts:
• The Gift Fund ($1 million) represents our gift to the college. During ourlifetimes, we will receive fixed annual payments of $40,000 (tax free) from theGift Fund. Except for the annual payments to us, the Gift Fund is managedsolely for the benefit of the college—we may not make any other withdrawalsof either income or principal. Upon our deaths, all assets remaining in theGift Fund will be transferred into the college’s endowment.
• The Family Portfolio ($1.2 million) represents the remainder of our lifetimesavings. The portfolio is invested entirely in very safe securities, consistentwith the investment policy statement prepared for us by WFC as shown inExhibit 2-6:
EXHIBIT 2-6 WFC Investment Policy Statement for SmithFamily Portfolio
The Smith Family Portfolio’s primary focus is the production of current income, withlong-term capital appreciation a secondary consideration. The need for a dependableincome stream precludes investment vehicles with even modest likelihood of losses.Liquidity needs reinforce the need to emphasize minimum-risk investments. Extensiveuse of short-term investment-grade investments is entirely justified by the expectationthat a low-inflation environment will exist indefinitely into the future. For these reasons,investments will emphasize U.S. Treasury bills and notes, intermediate-term investment-grade corporate debt, and select ‘‘blue chip’’ stocks with assured dividend distributionsand minimal price fluctuations.
To assist in a discussion of investment policy, Mesa presents four model portfoliosused by BigBanc; Exhibit 2-7 applies the bank’s long-term forecasts for asset class returnsto each portfolio.
A. Prepare and justify an alternative investment policy statement for the Smiths’ FamilyPortfolio.
B. Describe how your IPS addresses three specific deficiencies in the WFC investmentpolicy statement.
C. Recommend a portfolio from Exhibit 2-7 for the Family Portfolio. Justify yourrecommendation with specific reference to:
i. Three portfolio characteristics in Exhibit 2-7 other than expected return or yield.ii. The Smiths’ return objectives. Show your calculations.

Chapter 2 Managing Individual Investor Portfolios 23
EXHIBIT 2-7 BigBanc Model Portfolios
Asset Class Total Return Yield Portfolios
A B C D
U.S. large-cap stocks 13.0% 3.0% 0% 35% 45% 0%U.S. small-cap stocks 15.0 1.0 0 5 15 0Non-U.S. stocks 14.0 1.5 0 10 15 10U.S. corporate bonds (AA) 6.5 6.5 80 20 0 30U.S. Treasury notes 6.0 6.0 0 10 5 20Non-U.S. government
bonds6.5 6.5 0 5 5 0
Municipal bonds (AA)a 4.0 4.0 0 10 0 10Venture capital 20.0 0.0 0 0 10 25U.S. Treasury bills 4.0 4.0 20 5 5 5Total 100% 100% 100% 100%After-tax expected return 4.2% 7.5% 13.0% 6.4%Sharpe ratio 0.35 0.50 0.45 0.45After-tax yield 4.2% 2.9% 1.9% 3.3%Expected inflation: 3.0%
aTax-exempt.
13. Adapted from the 2004 CFA Level III examination:Louise and Christopher Maclin live in London, United Kingdom, and currently rent
an apartment in the metropolitan area. Christopher Maclin, aged 40, is a supervisor atBarnett Co. and earns an annual salary of £80,000 before taxes. Louise Maclin, aged38, stays home to care for their newborn twins. She recently inherited £900,000 (afterwealth-transfer taxes) in cash from her father’s estate. In addition, the Maclins haveaccumulated the following assets (current market value):
• £5,000 in cash• £160,000 in stocks and bonds• £220,000 in Barnett common stock
The value of their holdings in Barnett stock has appreciated substantially as a resultof the company’s growth in sales and profits during the past 10 years. Christopher Maclinis confident that the company and its stock will continue to perform well.
The Maclins need £30,000 for a down payment on the purchase of a house andplan to make a £20,000 non-tax-deductible donation to a local charity in memory ofLouise Maclin’s father. The Maclins’ annual living expenses are £74,000. After-tax salaryincreases will offset any future increases in their living expenses.
During discussions with their financial adviser, Grant Webb, the Maclins expressconcern about achieving their educational goals for their children and their own retirementgoals. The Maclins tell Webb:
• They want to have sufficient funds to retire in 18 years when their children begin theirfour years of university education.
• They have been unhappy with the portfolio volatility they have experienced in recentyears. They state that they do not want to experience a loss in portfolio value greaterthan 12 percent in any one year.

24 Learning Outcomes, Summary Overview, and Problems
• They do not want to invest in alcohol and tobacco stocks.• They will not have any additional children.
After their discussions, Webb calculates that in 18 years the Maclins will need £2 millionto meet their educational and retirement goals. Webb suggests that their portfolio bestructured to limit shortfall risk (defined as expected total return minus two standarddeviations) to no lower than a negative 12 percent return in any one year. Maclin’s salaryand all capital gains and investment income are taxed at 40 percent and no tax-shelteringstrategies are available. Webb’s next step is to formulate an investment policy statementfor the Maclins.
A. i. Formulate the risk objective of an investment policy statement for the Maclins.ii. Formulate the return objective of an investment policy statement for the Maclins.
Calculate the pre-tax rate of return that is required to achieve this objective. Showyour calculations.
B. Formulate the constraints portion of an investment policy statement for the Maclins,addressing each of the following:
i. Time horizonii. Liquidity requirementsiii. Tax concernsiv. Unique circumstances
Note: Your response to Part B should not address legal and regulatory factors.
CHAPTER 3MANAGING
INSTITUTIONAL INVESTORPORTFOLIOS
R. Charles Tschampion, CFACFA Institute
New York, New York
Laurence B. SiegelThe Ford FoundationNew York, New York
Dean J. TakahashiYale University
New Haven, Connecticut
John L. Maginn, CFAMaginn Associates, Inc.
Omaha, Nebraska
LEARNING OUTCOMES
After completing this chapter, you will be able to do the following:
• Contrast a defined-benefit plan to a defined-contribution plan from the perspectives ofboth the employee and employer.
• Discuss investment objectives and constraints for defined-benefit plans.• Evaluate pension fund risk tolerance when risk is considered from the perspective of the
(1) plan surplus, (2) sponsor financial status and profitability, (3) sponsor and pension fundcommon risk exposures, (4) plan features, and (5) workforce characteristics.
25

26 Learning Outcomes, Summary Overview, and Problems
• Formulate an investment policy statement for a defined-benefit plan.• Evaluate the risk management considerations in investing pension plan assets.• Formulate an investment policy statement for a defined-contribution plan.• Discuss hybrid pension plans (e.g., cash balance plans) and employee stock ownership
plans.• Distinguish among the types of foundations with respect to their description, purpose,
source of funds, and annual spending requirements.• Discuss investment objectives and constraints for foundations, endowments, insurance
companies, and banks.• Formulate an investment policy statement for a foundation, an endowment, an insurance
company, and a bank.• Contrast investment companies, commodity pools, and hedge funds to other types of
institutional investors.• Evaluate the factors that affect the investment policies of pension funds, foundations,
endowments, life and non–life insurance companies, and banks.• Differentiate among the return objectives, risk tolerances, liquidity requirements, time
horizons, tax considerations, legal and regulatory environment, and unique circumstancesof pension funds, foundations, endowments, insurance companies, and banks.
• Compare and contrast the asset/liability management needs of pension funds, foundations,endowments, insurance companies, and banks.
• Compare and contrast the investment objectives and constraints of institutional investorsgiven relevant data such as descriptions of their financial circumstances and attitudes towardrisk.
SUMMARY OVERVIEW
Chapter 3 has described the investment contexts in which institutional investors operate.Our chief focus has been the development of an investment policy statement for defined-benefit pension plans, defined-contribution pension plans, endowments, foundations, lifeinsurance companies, non–life insurance companies, and banks. We have discussed the specificconsiderations that enter into the development of appropriate return and risk objectives. Wethen addressed liquidity requirements, time horizon, tax concerns, legal and regulatory factors,and unique circumstances.
• The two major types of pension plan are defined benefit (DB) plans and defined contribution(DC) plans. A defined-benefit plan specifies the plan sponsor’s obligations in terms ofthe benefit to plan participants. In contrast, a defined-contribution plan specifies thesponsor’s obligations in terms of contributions to the pension fund rather than benefits toparticipants.
• DB pension assets fund the payment of pension benefits (liabilities). The investmentperformance of a DB plan should be judged relative to its adequacy in funding liabilitieseven if it is also judged on an absolute basis. The funded status of a DB plan is therelationship of the plan assets to the present value of plan liabilities, and is usually measuredwith respect to the projected benefit obligation (PBO) definition of plan liabilities.
• In setting a risk objective, DB plan sponsors need to consider plan funded status, sponsorfinancial status and profitability, sponsor and pension fund common risk exposures, planfeatures (such as provision for lump-sum distributions), and workforce characteristics.

Chapter 3 Managing Institutional Investor Portfolios 27
• A DB pension plan’s broad return objective is to achieve returns that adequately fund itspension liabilities on an inflation-adjusted basis. An appropriate return requirement for afully funded plan is the discount rate applied to pension liabilities. The pension fund’sstated return desire may be higher and may reflect considerations relating to reducingpension contributions or increasing pension income.
• For DB plans, liquidity requirements relate to the number of retired lives, the size ofcontributions in relation to disbursements, and plan features. Factors affecting the timehorizon length include whether the plan is a going concern, the age of the workforce, andthe proportion of retired lives.
• Defined-contribution plans fall into two types: those in which the plan sponsor setsinvestment policy, and those in which the plan participants individually set policy. Theinvestment process for the sponsor-directed plans is a simpler version of the process for DBplans.
• For participant-directed DC plans, the principal issues are offering participants sufficientinvestment choices and avoiding inadequate diversification because of holdings of thesponsor company’s stock.
• Hybrid pension plans combine features of DB and DC plans. A cash balance plan is a hybridplan in which the promised benefit is shown as a balance in a participant-individualizedstatement. Another important type of hybrid plan is the employee stock ownership plan(ESOP), a type of DC plan entirely or primarily invested in the employer’s stock.
• Foundations are grant-making institutions. Private foundations are typically subject to apayout requirement that specifies a minimum level of spending. Endowments are generallynot subject to a legal spending requirement. Endowments typically provide vital support ofongoing operations and programs of institutions such as universities, hospitals, museums,and religious organizations.
• The return objective for most foundations (and endowments) can be stated as the sum ofthe annual spending rate, the cost of generating returns (managing assets), and the expectedinflation rate. A multiplicative formulation of the components is more precise than anadditive one in specifying the return level that should allow the foundation or endowmentto preserve the inflation-adjusted value of assets over many periods.
• A foundation’s investment policy can often be more risk tolerant than the investment policyof DB plans because foundation assets need not be managed with respect to a stream oflegal liabilities, in general. Endowment risk tolerance often depends on the importance ofthe endowment to the supported institution’s operating budget as reflected in the spendingrate, and the use of a smoothing rule for spending, which dampens the portfolio’s sensitivityto short-run volatility.
• A foundation or endowment’s liquidity requirements come from both anticipated andunanticipated cash needs in excess of contributions received. Anticipated needs are capturedin the periodic distributions prescribed by a foundation’s or endowment’s spending rate.Generally, time horizons are long. A variety of legal and regulatory issues can affect afoundation or endowment’s investment activities.
• Insurance companies play a role in absorbing personal and business risks. Insurers arebroadly divided into life insurers and non–life insurers (casualty insurers); the two groupshave distinct investment concerns.
• Historically, return requirements for life insurers have been tied to the interest rates usedby actuaries to determine policyholder reserves or accumulation rates for the funds beingheld by a company for future disbursement. Actual return objectives have been less clearlydefined but may relate to an interest rate spread concerning liabilities.
28 Learning Outcomes, Summary Overview, and Problems
• Insurers have moved toward segmenting their portfolios in relation to associated liabilitiesand setting return objectives by major line of business. The result is that a singlecompany’s investment policy may incorporate multiple return objectives. Furthermore,many companies have established separate investment policies and strategies for eachsegment of their portfolios.
• Because of public policy concerns related to payment of insurance benefits, insurer portfoliosare viewed as quasi–trust funds from a public policy perspective. As a result, conservativefiduciary principles limit the risk tolerance of both life and non–life insurers.
• As one consequence of the need for managing risk with respect to their contractualliabilities, insurers use a variety of asset/liability management techniques.
• Life insurance companies have valuation concerns (related to prescribed valuation reserves),reinvestment risk, credit risk, and cash flow volatility.
• The liquidity concerns associated with disintermediation of cash value policies, asset/liabilitymismatch, and asset marketability risk have increased insurers’ traditionally relativelyminimal liquidity requirements.
• Life insurers have been viewed as the classic long-term investor. As a result of portfoliosegmentation, life insurers may establish relatively shorter time horizons for some portfoliosegments (e.g., group annuities).
• As a regulated industry, life insurers face many regulatory and legal constraints includingthose relating to eligible investments, the prudent investor rule, and valuation methods.
• In contrast to life insurers, non–life insurers typically have shorter-term liabilities. Theunderwriting (profitability) cycle may require non–life insurers to liquidate investments tosupplement cash flow shortfalls. For both of these reasons, non–life insurers have muchshorter investment time horizons than do life insurers.
• Return requirements reflect competitive pricing policy, profitability concerns, and therequirement for a growing surplus to support the writing of new business.
• A bank’s portfolio investments are a residual use of funds after loan demand has been met.The portfolio’s overall objectives are to manage the interest rate risk of the balance sheet,manage liquidity, produce income, and manage credit risk. The bank’s return objective isto earn a positive spread over the cost of funds. Banks typically have below-average risktolerance, and liquidity is a key concern. Bank investment is subject to a range of legal andregulatory factors.
• Investment companies such as mutual funds as well as commodity pools and hedge fundsare institutional investors that function as investment intermediaries. In contrast to othertypes of institutional investors, one cannot generalize about the investment objectives andconstraints of these types of investors.
• Among institutional investors, asset/liability management (ALM) considerations are par-ticularly important for DB pension funds, insurance companies, and banks.
PROBLEMS
1. Worden Technology, Inc.:Based in London, Worden Technology, Inc. is an established company with opera-
tions in North America, Japan, and several European countries. The firm has £16 billionin total assets and offers its employees a defined-benefit pension plan.
Worden’s pension plan currently has assets of £8.88 billion and liabilities of £9.85billion. The plan’s goals include achieving a minimum expected return of 8.4 percent
Chapter 3 Managing Institutional Investor Portfolios 29
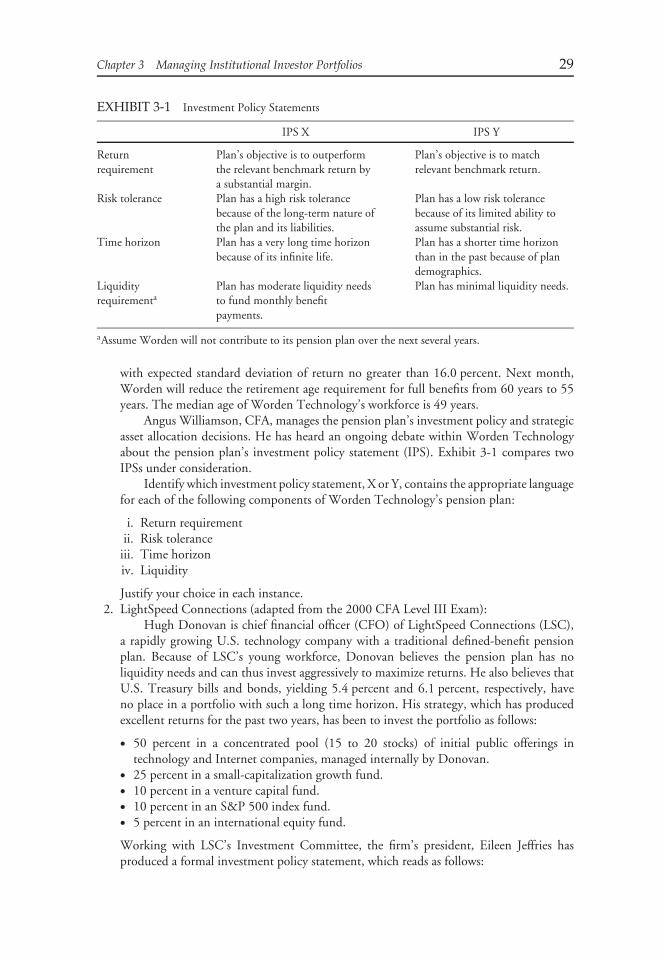
EXHIBIT 3-1 Investment Policy Statements
IPS X IPS Y
Returnrequirement
Plan’s objective is to outperformthe relevant benchmark return bya substantial margin.
Plan’s objective is to matchrelevant benchmark return.
Risk tolerance Plan has a high risk tolerancebecause of the long-term nature ofthe plan and its liabilities.
Plan has a low risk tolerancebecause of its limited ability toassume substantial risk.
Time horizon Plan has a very long time horizonbecause of its infinite life.
Plan has a shorter time horizonthan in the past because of plandemographics.
Liquidityrequirementa
Plan has moderate liquidity needsto fund monthly benefitpayments.
Plan has minimal liquidity needs.
aAssume Worden will not contribute to its pension plan over the next several years.
with expected standard deviation of return no greater than 16.0 percent. Next month,Worden will reduce the retirement age requirement for full benefits from 60 years to 55years. The median age of Worden Technology’s workforce is 49 years.
Angus Williamson, CFA, manages the pension plan’s investment policy and strategicasset allocation decisions. He has heard an ongoing debate within Worden Technologyabout the pension plan’s investment policy statement (IPS). Exhibit 3-1 compares twoIPSs under consideration.
Identify which investment policy statement, X or Y, contains the appropriate languagefor each of the following components of Worden Technology’s pension plan:
i. Return requirementii. Risk tolerance
iii. Time horizoniv. Liquidity
Justify your choice in each instance.2. LightSpeed Connections (adapted from the 2000 CFA Level III Exam):
Hugh Donovan is chief financial officer (CFO) of LightSpeed Connections (LSC),a rapidly growing U.S. technology company with a traditional defined-benefit pensionplan. Because of LSC’s young workforce, Donovan believes the pension plan has noliquidity needs and can thus invest aggressively to maximize returns. He also believes thatU.S. Treasury bills and bonds, yielding 5.4 percent and 6.1 percent, respectively, haveno place in a portfolio with such a long time horizon. His strategy, which has producedexcellent returns for the past two years, has been to invest the portfolio as follows:
• 50 percent in a concentrated pool (15 to 20 stocks) of initial public offerings intechnology and Internet companies, managed internally by Donovan.
• 25 percent in a small-capitalization growth fund.• 10 percent in a venture capital fund.• 10 percent in an S&P 500 index fund.• 5 percent in an international equity fund.
Working with LSC’s Investment Committee, the firm’s president, Eileen Jeffries hasproduced a formal investment policy statement, which reads as follows:
30 Learning Outcomes, Summary Overview, and Problems
‘‘The LSC Pension Plan’s return objective should focus on real total returns that willfund its long-term obligations on an inflation-adjusted basis. The ‘‘time-to-maturity’’ ofthe corporate workforce is a key element for any defined pension plan; given our youngworkforce, LSC’s Plan has a long investment horizon and more time available for wealthcompounding to occur. Therefore, the Plan can pursue an aggressive investment strategyand focus on the higher return potential of capital growth. Under present U.S. tax laws,pension portfolio income and capital gains are not taxed. The portfolio should focusprimarily on investments in businesses directly related to our main business to leverageour knowledge base.’’
A. Evaluate Donovan’s investment strategy with respect to its effect on each of thefollowing:
i. LSC’s pension plan beneficiaries.ii. Managing pension assets in relation to LSC’s corporate strength.
B. Evaluate LSC’s investment policy statement in the context of the following:
i. Return requirementii. Risk tolerance
iii. Time horizoniv. Liquidity
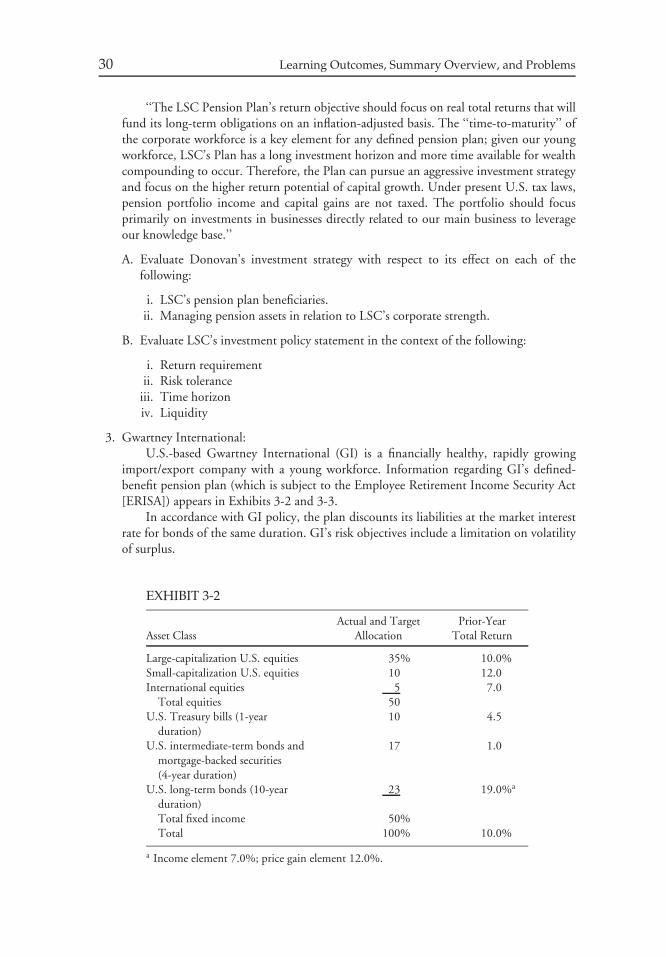
3. Gwartney International:U.S.-based Gwartney International (GI) is a financially healthy, rapidly growing
import/export company with a young workforce. Information regarding GI’s defined-benefit pension plan (which is subject to the Employee Retirement Income Security Act[ERISA]) appears in Exhibits 3-2 and 3-3.
In accordance with GI policy, the plan discounts its liabilities at the market interestrate for bonds of the same duration. GI’s risk objectives include a limitation on volatilityof surplus.
EXHIBIT 3-2
Actual and Target Prior-YearAsset Class Allocation Total Return
Large-capitalization U.S. equities 35% 10.0%Small-capitalization U.S. equities 10 12.0International equities 5 7.0
Total equities 50U.S. Treasury bills (1-year
duration)10 4.5
U.S. intermediate-term bonds andmortgage-backed securities(4-year duration)
17 1.0
U.S. long-term bonds (10-yearduration)
23 19.0%a
Total fixed income 50%Total 100% 10.0%
a Income element 7.0%; price gain element 12.0%.

Chapter 3 Managing Institutional Investor Portfolios 31
EXHIBIT 3-3
Present value of plan liabilities $298 millionMarket value of plan assets $300 millionSurplus $2 millionDuration of liabilities 10 yearsActuarial return assumption 7.0%GI board’s long-term total return objective 9.0%
Giselle Engle, the newly appointed CFO, must explain to the board of directors whythe surplus declined in a year when the actual investment return was 100 basis pointsmore than the long-term objective stated by the board.
A. Explain how the plan surplus could decline in a given year despite an actual return inexcess of the long-term return objective.
B. Explain the importance of an appropriate investment time horizon when settinginvestment policy for GI’s corporate pension plan.
C. Discuss the risk tolerance of GI’s corporate pension plan.
4. Food Processors Inc. (adapted from the 1994 CFA Level III exam):Food Processors Inc. (FPI) is a mature U.S. company with declining earnings and a
weak balance sheet. Its defined-benefit pension plan (which is subject to ERISA) has totalassets of $750 million. The plan is underfunded by $200 million by U.S. standards—acause for concern by shareholders, management, and the board of directors.
The average age of plan participants is 45 years. FPI’s annual contribution to theplan and the earnings on its assets are sufficient to meet pension payments to presentretirees. The pension portfolio’s holdings are equally divided between large-capitalizationU.S. equities and high-quality, long-maturity U.S. corporate bonds. For the purpose ofdetermining FPI’s contribution to the pension plan, the assumed long-term rate of returnon plan assets is 9 percent per year; the discount rate applied to determine the presentvalue of plan liabilities, all of which are U.S. based, is 8 percent. As FPI’s Treasurer, youare responsible for oversight of the plan’s investments and managers and for liaison withthe board’s Pension Investment Committee.
At the committee’s last meeting, its chair observed that both U.S. stocks and U.S.bonds had recorded total returns in excess of 12 percent per year over the past decade. Hethen made a pointed comment: ‘‘Given this experience, we seem to be overly conservativein using only a 9 percent future return assumption. Why don’t we raise the rate to 10percent? This would be consistent with the recent record, would help our earnings, andshould make the stockholders feel a lot better.’’
You have been directed to examine the situation and prepare a recommendation fornext week’s committee meeting. Your assistant has provided you with the backgroundinformation shown in Exhibit 3-4.
Assume that consensus forecast total returns for bonds are at least approximatelyequal to the bonds’ yields.
A. Explain what is meant when a pension plan is said to be ‘‘underfunded’’ and use FPIto illustrate.
B. Discuss the risk–return dilemma that FPI faces.C. Explain a rationale for reducing the discount rate from its current level of 8 percent.

32 Learning Outcomes, Summary Overview, and Problems
EXHIBIT 3-4 Capital Markets Data
AnnualizedMonthly ConsensusStandard Forecast
Total Return Total Return Deviation Total ReturnAsset Class 1929–1993 1984–1993 1984–1993 1994–2000
U.S. Treasury bills 3.7% 6.4% 2.2% 3.5%Intermediate-term Treasury
bonds5.3 11.4 5.6 5.0
Long-term Treasury bonds 5.0 14.4 11.7 6.0U.S. corporate bonds (AAA
rated)5.6 14.0 8.9 6.5
U.S. common stocks (S&P500)
9.5 14.9 18.0 8.5
U.S. inflation rate (annualrate)
3.2% 5.5% N/A 3.3%
D. Explain how the underfunded condition of FPI’s plan would be affected if the discountrate were reduced to 7 percent from the current 8 percent.
5. Medical Research Foundation (adapted from the 1993 CFA Level III exam):The Medical Research Foundation (MRF), based in the United States, was established
to provide grants in perpetuity. MRF has just received word that the foundation willreceive a $45 million cash gift three months from now. The gift will greatly increase thesize of the foundation’s endowment from its current $10 million. The foundation’s grant-making (spending) policy has been to pay out virtually all of its annual net investmentincome. Because its investment approach has been conservative, the endowment portfolionow consists almost entirely of fixed-income assets. The finance committee understandsthat these actions are causing the real value of foundation assets and the real value offuture grants to decline because of inflation effects. Until now, the finance committeebelieved it had no alternative to these actions, given the large immediate cash needs ofthe research programs being funded and the small size of the foundation’s capital base.The foundation’s annual grants must at least equal 5 percent of its assets’ market valueto maintain MRF’s U.S. tax-exempt status, a requirement that is expected to continueindefinitely. The foundation anticipates no additional gifts or fundraising activity for theforeseeable future.
Given the change in circumstances that the cash gift will make, the finance committeewishes to develop new grant-making and investment policies. Annual spending must atleast meet the 5 percent of market value requirement, but the committee is unsure howmuch higher spending can or should be. The committee wants to pay out as much aspossible because of the critical nature of the research being funded; however, it understandsthat preserving the real value of the foundation’s assets is equally important in order topreserve its future grant-making capabilities. You have been asked to assist the committeein developing appropriate policies.
A. Identify and discuss the three key elements that should determine the foundation’sgrant-making (spending) policy.
B. Formulate and justify an investment policy statement for the foundation.

Chapter 3 Managing Institutional Investor Portfolios 33
6. James Children’s Hospital (adapted from the 1998 CFA Level III Exam):The James Children’s Hospital (JCH), based in Washington, D.C., has an operating
budget of $15 million and has been operating at a budget surplus for the last twoyears. JCH has a $20 million endowment (JCHE) whose sole purpose is to providecapital equipment for the hospital. The endowment’s long-term expected total return is8.6 percent, which includes a 3.3 percent income component. JCHE has no minimumpayout requirement and expects no future contributions. Traditionally, the JCHE boardof directors has determined the annual payout based on current needs. Payouts have beenrising steadily—to $1,375,000 two years ago and to $1,400,000 last year.
Michelle Parker, CFO of JCHE, has asked the board’s guidance in establishing along-term spending policy for JCHE. She has received $1.6 million in requests to buyequipment and is concerned about the inflation rate for medical equipment prices, whichis 4 percent, versus 2.5 percent for the U.S. Consumer Price Index.
A. Discuss the implications of the current pressure on JCHE to increase spending.B. Discuss how JCHE’s time horizon affects its risk tolerance.C. Determine a long-term spending policy for JCHE, including a spending rate as a
percentage of assets, and justify the policy.
7. Donner Life Insurance (adapted from the 2000 CFA Level III Exam):Susan Leighton, treasurer for U.S.-based Donner Life Insurance, has just joined the
board of a charitable organization that has a large endowment portfolio. She is researchinghow the investment policy for an endowment differs from that of life insurance companiesand has thus far reached the following conclusions:
1. Both endowments and life insurance companies have aggressive return requirements.2. Endowments are less willing to assume risk than life insurance companies because of
donor concerns about volatility and loss of principal.3. Endowments are less able to assume risk than life insurance companies because of
expectations that endowments should provide stable funding for charitable operations.4. Endowments have lower liquidity requirements than life insurance companies because
endowment spending needs are met through a combination of current income andcapital appreciation.
5. Both endowments and life insurance companies are subject to stringent legal andregulatory oversight.
Evaluate each of Leighton’s statements in terms of accuracy and justify your conclusions.8. Hannibal Insurance Company (adapted from the 1997 CFA Level III Exam):
U.S.-based Hannibal Insurance Company sells life insurance, annuities, and guar-anteed investment contracts (GICs) and other protection- and savings-based products.The company has traditionally managed its investments as a single portfolio, neithersegmenting the assets nor segregating the surplus. The data in Exhibit 3-5 describe theportfolio.
The company attributes the decline in the duration of its liabilities to increases ininterest rates and the passage of time.
Hannibal’s CFO has instructed the portfolio manager as follows: ‘‘The rapidlyincreasing popularity of our two-year fixed-rate GIC product has increased our asset basesubstantially during the last year. Interest rates have been rising and will probably riseanother 100 basis points this year. You should continue to take advantage of this situationby investing in higher-yielding, investment-grade, longer-duration bonds in order to

34 Learning Outcomes, Summary Overview, and Problems
EXHIBIT 3-5 Hannibal Insurance Portfolio Data
Four Years Ago Last Year
Assets (reserves and surplus portfolio) $450 million $500 millionDuration of assets 6.0 years 6.0 yearsLiabilities $390 million $470 millionEstimated duration of liabilities 5.5 years 4.0 years
maximize our spread and maintain a constant duration of the assets. This strategy willensure the delivery of a competitive return to our customers.’’
A. Judge the appropriateness of Hannibal’s investment strategy as stated by the CFO.Prepare two arguments that support your position.
B. Evaluate two factors that would affect liability duration for a life insurance companyother than changes in interest rates and the passage of time. Relate the two factors tothe specific situation at Hannibal. Assume stable mortality rates.
C. Determine the suitability of the segmentation approach to portfolio management atHannibal Insurance Company. Prepare three arguments that support your position.
D. Contrast the return requirement of the surplus portfolio to the return requirement ofpolicyholder reserves, in regard to U.S. life insurance companies in general.
9. Winthrop Bank:Winthrop Bank is a commercial bank with operations in North America. Evaluate the
effect of each of the following scenarios on the bank’s investment objectives, constraints,or risk-taking ability.
A. The target average maturity of loans is increased, with overall risk tolerance unchanged.B. The asset/liability risk management committee (ALCO) decides to increase Winthrop
Bank’s credit standards for loans although Winthrop Bank’s overall risk tolerance isunchanged.
C. Winthrop decides to sell its mortgage loans as soon as they are booked.D. More opportunities exist for expanding net interest margins with low risk in
Winthrop’s loan portfolio than in its securities portfolio.
CHAPTER 4CAPITAL MARKET
EXPECTATIONS
John P. CalverleyAmerican Express Bank
London, England
Alan M. Meder, CFADuff & Phelps Investment Management Co.
Chicago, Illinois
Brian D. Singer, CFAUBS Global Asset Management
London, England
Renato StaubUBS Global Asset Management
Chicago, Illinois
LEARNING OUTCOMES
After completing this chapter, you will be able to do the following:
• Discuss the role of capital market expectations in the portfolio management process.• Review a framework for setting capital market expectations.• Identify and discuss the following as they affect the setting of capital market expectations:
the limitations of economic data, data measurement errors and biases, the limitations ofhistorical estimates, ex post risk as a biased measure of ex ante risk, biases in analysts’
35

36 Learning Outcomes, Summary Overview, and Problems
methods, the failure to account for conditioning information, the misinterpretation ofcorrelations, psychological traps, and model uncertainty.
• Review and demonstrate formal tools for setting capital market expectations, includingstatistical tools (sample estimators, shrinkage estimators, time-series estimators, multifactormodels), discounted cash flow models, the risk premium approach, and financial equilibriummodels.
• Explain the use of survey and panel methods and judgment in setting capital marketexpectations.
• Distinguish between the inventory cycle and the business cycle.• Identify and interpret business cycle phases and their relationship to short- and long-term
capital market returns.• Review the relationship of inflation to the business cycle and characterize the relationship
between inflation/deflation and cash, bonds, equity, and real estate.• Discuss the effects on the business cycle of the following factors: consumer spending,
business investment and spending on inventories, and monetary and fiscal policy.• Demonstrate the use of the Taylor rule to predict central bank behavior.• Review the shape of the yield curve as an economic predictor and the relationship between
the yield curve and fiscal and monetary policy.• Distinguish between business cycles and economic growth trends and demonstrate the
application of business cycle and economic growth trend analysis to the formulation ofcapital market expectations.
• Identify and interpret the components of economic growth trends and explain howgovernmental policies and exogenous shocks can affect economic growth trends.
• Identify and interpret macroeconomic and interest and exchange rate linkages betweeneconomies.
• Review the differences between emerging market and developed economies and explain thecountry risk analysis techniques used to evaluate emerging markets.
• Compare and contrast the major approaches to economic forecasting.• Demonstrate the use of economic information in forecasting returns for cash and equiva-
lents, nominal default-free bonds, defaultable debt, emerging market debt, inflation-indexedbonds, common shares (developed and emerging market), real estate, and currencies.
• Evaluate how economic and competitive factors affect investment markets, sectors, andspecific securities.
• Identify and interpret the major approaches to forecasting exchange rates.• Recommend and justify changes in the component weights of a global investment portfolio
based on trends and expected changes in macroeconomic factors.
SUMMARY OVERVIEW
In Chapter 4, we have discussed how investment professionals address the setting of capitalmarket expectations.
• Capital market expectations are essential inputs to deciding on a strategic asset allocation.The process of capital market expectations setting involves the following steps:
1. Specify the final set of expectations that are needed, including the time horizon to whichthey apply.
Chapter 4 Capital Market Expectations 37
2. Research the historical record.3. Specify the method(s) and/or model(s) that will be used and the information needs for
developing expectations.4. Determine the best sources for information needs.5. Interpret the current investment environment using the selected data and methods,
applying experience and judgment.6. Formulate the set of expectations that are needed, documenting conclusions.7. Monitor actual outcomes and compare to expectations, providing feedback to improve
the expectations-setting process.
• Among the challenges in setting capital market expectations are the limitations of economicdata (including lack of timeliness as well as changing definitions and calculations); datameasurement errors and biases (including transcription errors, survivorship bias, and appraisal[smoothed] data); the limitations of historical estimates (including nonstationarity); ex postrisk as a biased risk measure (historical prices may reflect expectations of a low-probabilitycatastrophe that did not occur); biases in analysts’ methods (including data-mining bias andtime-period bias); the failure to account for conditioning information; the misinterpretation ofcorrelations; and psychological traps (including the anchoring trap, the status quo trap, theconfirming evidence trap, the overconfidence trap, the prudence trap, and the recallabilitytrap); and model uncertainty.
• The tools for formulating capital market expectations include formal tools, survey andpanel methods, and judgment. Formal tools include statistical tools, discounted cash flowmodels, the risk premium approach, and financial market equilibrium models. Analystjudgment includes economic and psychological insight.
• Economic output has cyclical and growth trend components. The cyclical componentsinclude the inventory cycle (measured in terms of fluctuation of inventory) and the businesscycle (representing fluctuations in gross domestic product [GDP] in relation to long-termtrend growth). A typical business cycle has five phases: initial recovery, early upswing, lateupswing, slowdown, and recession. Each of the two cyclical components has implicationsfor variables such as interest rates and corporate profits, which are important for capitalmarket expectations. The economic trend growth component (the long-term growth pathof GDP) is important particularly for setting long-term expectations.
• Consumer spending is typically the most important factor affecting GDP (it often accountsfor 60 to 70 percent of GDP). Retail sales and consumer consumption are closely watchedfor indications of consumer spending.
• Business investment has a smaller weight in GDP than consumer spending but is morevolatile. Data on business investment and spending on inventories reveal recent real businessactivity.
• Fiscal policy and monetary policy are means by which governments attempt to influencethe business cycle.
• Monetary policy makers often target inflation rates and use the central bank’s influenceover interest rates to achieve policy goals. The Taylor rule gives the optimal short-terminterest rate as the neutral rate plus an amount that is positively related to the excess of theGDP and inflation growth rates above their respective trend and target values.
• If monetary and fiscal policies are both tight, the yield curve is typically inverted. Whenmonetary policy is tight but fiscal policy is loose, the yield curve tends to be flat. An invertedyield curve has often preceded a recession.
• In managing cash and equivalents, central bank actions are closely watched.

38 Learning Outcomes, Summary Overview, and Problems
• For investors buying and selling nominal default-free bonds for the short term, developmentsin the business cycle and changes in short-term interest rates must be closely watched.News of stronger economic growth usually makes bond yields rise. For long-term investors,inflation expectations are of great importance. For holders of corporate bonds and otherdefaultable debt, the spread over Treasuries in relation to the business cycle is an importantfactor.
• Investing in emerging-market debt involves special considerations, such as country riskanalysis. Emerging-market governments borrow in a foreign currency and so cannot simplyinflate their way out of a problem in servicing the debt; this limitation increases the risk ofdefault.
• Inflation-indexed bonds are not exposed to the risk of unexpected inflation. Generally,yields on such instruments rise with real economic growth and the level of short-terminterest rates.
• Investors in common shares should analyze economic factors, first, in the way that theyaffect company earnings and, second, in the way that they affect interest rates, bond yields,and liquidity. The trend growth in the aggregate economy largely determines the trendgrowth in aggregate corporate earnings.
• During the economic cycle, the price-to-earnings (P/E) ratio tends to be high and risingwhen earnings are expected to rise but low and falling if the outlook for earnings worsens.P/E ratios are usually lower for an economy stuck on a slower growth path. High inflationoften tends to depress P/E ratios.
• Among the systematic factors affecting real estate returns are growth in consumption, realinterest rates, the term structure of interest rates, and unexpected inflation.
• Among the factors affecting exchange rate movements are purchasing power parity, relativeeconomic strength, capital flows, and savings–investment imbalances.
PROBLEMS
1. An analyst is assembling data for use in her firm’s expectations-setting process. Severalhistorical measures have been collected and used to set expectations on inflation andconsumer consumption trends. Previously, only the most recent 25 years of historicaldata concerning these measures had been collected and analyzed. Now, an executive hassuggested extending the starting point of the data 25 years further back to make theoverall analysis more robust. Discuss why the inclusion of the additional data may presentproblems for the expectations-setting process despite the request’s objective of making theanalysis more robust.
2. Seth Bildownes is an analyst who has prepared forecasts regarding the current capitalmarket environment. He recently gave his presentation to the managing directors of hisfirm. Excerpts of his presentation follow:
‘‘Noting that year-end holiday sales have been weak over the past several years, Ibelieve that current expectations should be likewise muted. In fact, just last week, I hadan occasion to visit Harrods and noticed that the number of shoppers seemed quite low.The last time I saw a retail establishment with so little pedestrian traffic at the beginningof December was in 1990, and that coincided with one of the worst holiday sales periodsin the past 50 years. Thus, there will be no overall year-over-year retail sales growth thisholiday season.’’
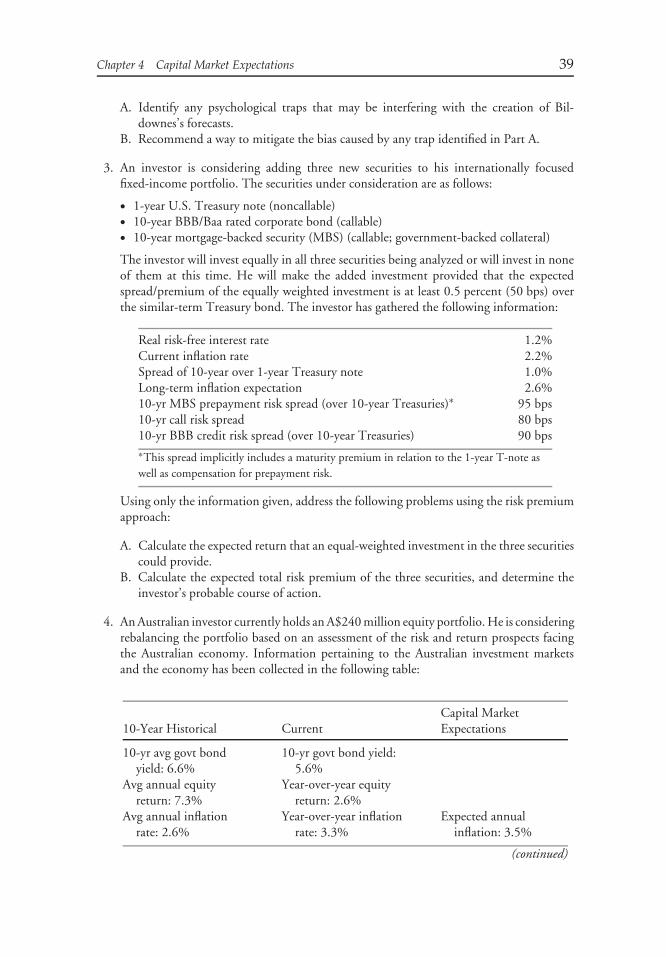
Chapter 4 Capital Market Expectations 39
A. Identify any psychological traps that may be interfering with the creation of Bil-downes’s forecasts.
B. Recommend a way to mitigate the bias caused by any trap identified in Part A.
3. An investor is considering adding three new securities to his internationally focusedfixed-income portfolio. The securities under consideration are as follows:
• 1-year U.S. Treasury note (noncallable)• 10-year BBB/Baa rated corporate bond (callable)• 10-year mortgage-backed security (MBS) (callable; government-backed collateral)
The investor will invest equally in all three securities being analyzed or will invest in noneof them at this time. He will make the added investment provided that the expectedspread/premium of the equally weighted investment is at least 0.5 percent (50 bps) overthe similar-term Treasury bond. The investor has gathered the following information:
Real risk-free interest rate 1.2%Current inflation rate 2.2%Spread of 10-year over 1-year Treasury note 1.0%Long-term inflation expectation 2.6%10-yr MBS prepayment risk spread (over 10-year Treasuries)∗ 95 bps10-yr call risk spread 80 bps10-yr BBB credit risk spread (over 10-year Treasuries) 90 bps∗This spread implicitly includes a maturity premium in relation to the 1-year T-note aswell as compensation for prepayment risk.
Using only the information given, address the following problems using the risk premiumapproach:
A. Calculate the expected return that an equal-weighted investment in the three securitiescould provide.
B. Calculate the expected total risk premium of the three securities, and determine theinvestor’s probable course of action.
4. An Australian investor currently holds an A$240 million equity portfolio. He is consideringrebalancing the portfolio based on an assessment of the risk and return prospects facingthe Australian economy. Information pertaining to the Australian investment marketsand the economy has been collected in the following table:
Capital Market10-Year Historical Current Expectations
10-yr avg govt bondyield: 6.6%
10-yr govt bond yield:5.6%
Avg annual equityreturn: 7.3%
Year-over-year equityreturn: 2.6%
Avg annual inflationrate: 2.6%
Year-over-year inflationrate: 3.3%
Expected annualinflation: 3.5%
(continued)
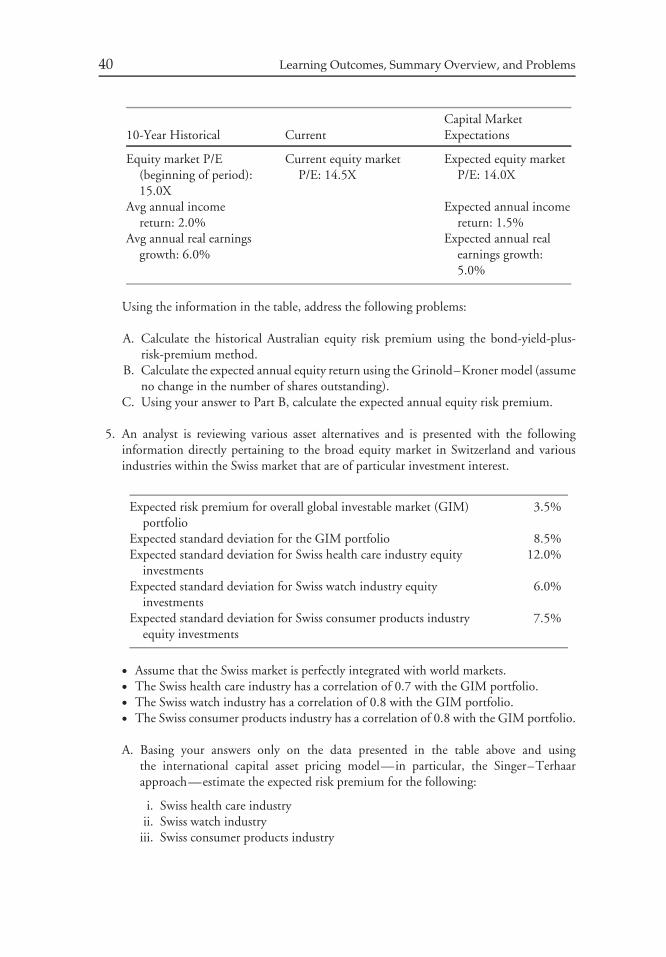
40 Learning Outcomes, Summary Overview, and Problems
Capital Market10-Year Historical Current Expectations
Equity market P/E(beginning of period):15.0X
Current equity marketP/E: 14.5X
Expected equity marketP/E: 14.0X
Avg annual incomereturn: 2.0%
Expected annual incomereturn: 1.5%
Avg annual real earningsgrowth: 6.0%
Expected annual realearnings growth:5.0%
Using the information in the table, address the following problems:
A. Calculate the historical Australian equity risk premium using the bond-yield-plus-risk-premium method.
B. Calculate the expected annual equity return using the Grinold–Kroner model (assumeno change in the number of shares outstanding).
C. Using your answer to Part B, calculate the expected annual equity risk premium.
5. An analyst is reviewing various asset alternatives and is presented with the followinginformation directly pertaining to the broad equity market in Switzerland and variousindustries within the Swiss market that are of particular investment interest.
Expected risk premium for overall global investable market (GIM)portfolio
3.5%
Expected standard deviation for the GIM portfolio 8.5%Expected standard deviation for Swiss health care industry equity
investments12.0%
Expected standard deviation for Swiss watch industry equityinvestments
6.0%
Expected standard deviation for Swiss consumer products industryequity investments
7.5%
• Assume that the Swiss market is perfectly integrated with world markets.• The Swiss health care industry has a correlation of 0.7 with the GIM portfolio.• The Swiss watch industry has a correlation of 0.8 with the GIM portfolio.• The Swiss consumer products industry has a correlation of 0.8 with the GIM portfolio.
A. Basing your answers only on the data presented in the table above and usingthe international capital asset pricing model—in particular, the Singer–Terhaarapproach—estimate the expected risk premium for the following:
i. Swiss health care industryii. Swiss watch industry
iii. Swiss consumer products industry
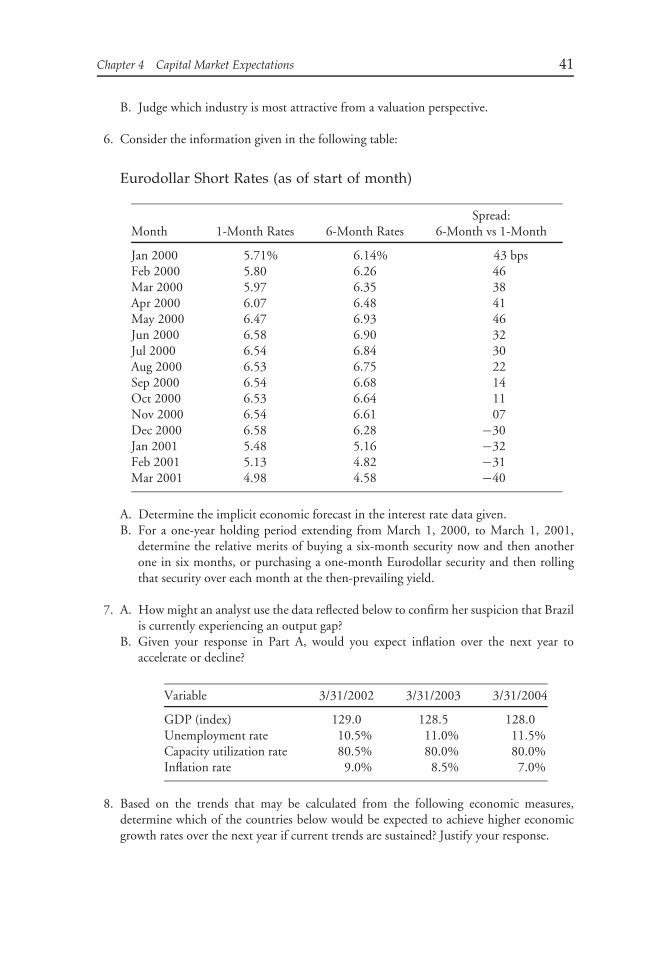
Chapter 4 Capital Market Expectations 41
B. Judge which industry is most attractive from a valuation perspective.
6. Consider the information given in the following table:
Eurodollar Short Rates (as of start of month)
Spread:Month 1-Month Rates 6-Month Rates 6-Month vs 1-Month
Jan 2000 5.71% 6.14% 43 bpsFeb 2000 5.80 6.26 46Mar 2000 5.97 6.35 38Apr 2000 6.07 6.48 41May 2000 6.47 6.93 46Jun 2000 6.58 6.90 32Jul 2000 6.54 6.84 30Aug 2000 6.53 6.75 22Sep 2000 6.54 6.68 14Oct 2000 6.53 6.64 11Nov 2000 6.54 6.61 07Dec 2000 6.58 6.28 −30Jan 2001 5.48 5.16 −32Feb 2001 5.13 4.82 −31Mar 2001 4.98 4.58 −40
A. Determine the implicit economic forecast in the interest rate data given.B. For a one-year holding period extending from March 1, 2000, to March 1, 2001,
determine the relative merits of buying a six-month security now and then anotherone in six months, or purchasing a one-month Eurodollar security and then rollingthat security over each month at the then-prevailing yield.
7. A. How might an analyst use the data reflected below to confirm her suspicion that Brazilis currently experiencing an output gap?
B. Given your response in Part A, would you expect inflation over the next year toaccelerate or decline?
Variable 3/31/2002 3/31/2003 3/31/2004
GDP (index) 129.0 128.5 128.0Unemployment rate 10.5% 11.0% 11.5%Capacity utilization rate 80.5% 80.0% 80.0%Inflation rate 9.0% 8.5% 7.0%
8. Based on the trends that may be calculated from the following economic measures,determine which of the countries below would be expected to achieve higher economicgrowth rates over the next year if current trends are sustained? Justify your response.
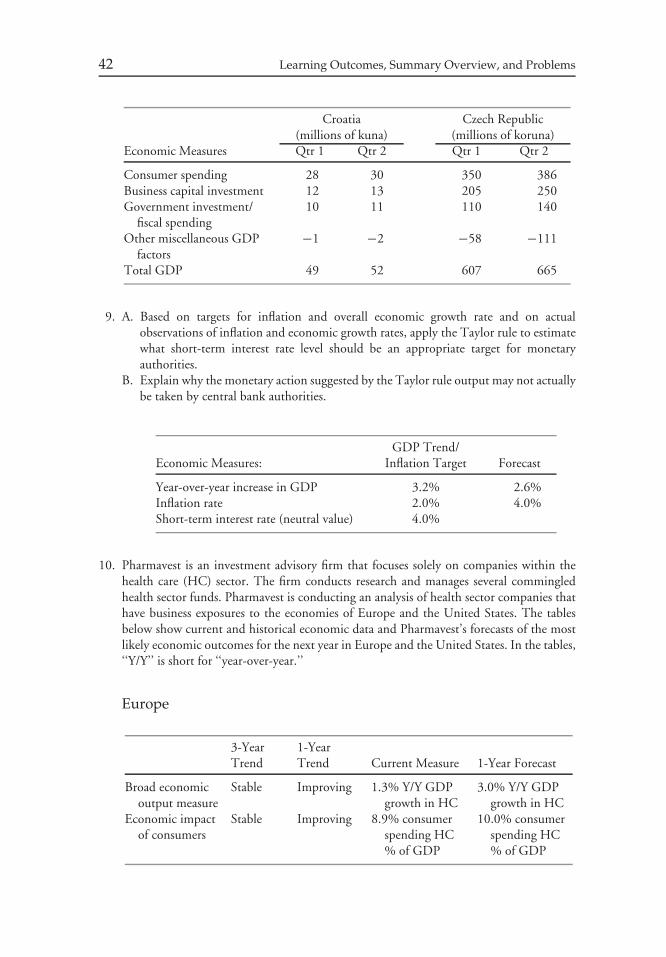
42 Learning Outcomes, Summary Overview, and Problems
Croatia Czech Republic(millions of kuna) (millions of koruna)
Economic Measures Qtr 1 Qtr 2 Qtr 1 Qtr 2
Consumer spending 28 30 350 386Business capital investment 12 13 205 250Government investment/
fiscal spending10 11 110 140
Other miscellaneous GDPfactors
−1 −2 −58 −111
Total GDP 49 52 607 665
9. A. Based on targets for inflation and overall economic growth rate and on actualobservations of inflation and economic growth rates, apply the Taylor rule to estimatewhat short-term interest rate level should be an appropriate target for monetaryauthorities.
B. Explain why the monetary action suggested by the Taylor rule output may not actuallybe taken by central bank authorities.
GDP Trend/Economic Measures: Inflation Target Forecast
Year-over-year increase in GDP 3.2% 2.6%Inflation rate 2.0% 4.0%Short-term interest rate (neutral value) 4.0%
10. Pharmavest is an investment advisory firm that focuses solely on companies within thehealth care (HC) sector. The firm conducts research and manages several commingledhealth sector funds. Pharmavest is conducting an analysis of health sector companies thathave business exposures to the economies of Europe and the United States. The tablesbelow show current and historical economic data and Pharmavest’s forecasts of the mostlikely economic outcomes for the next year in Europe and the United States. In the tables,‘‘Y/Y’’ is short for ‘‘year-over-year.’’
Europe
3-Year 1-YearTrend Trend Current Measure 1-Year Forecast
Broad economicoutput measure
Stable Improving 1.3% Y/Y GDPgrowth in HC
3.0% Y/Y GDPgrowth in HC
Economic impactof consumers
Stable Improving 8.9% consumerspending HC% of GDP
10.0% consumerspending HC% of GDP
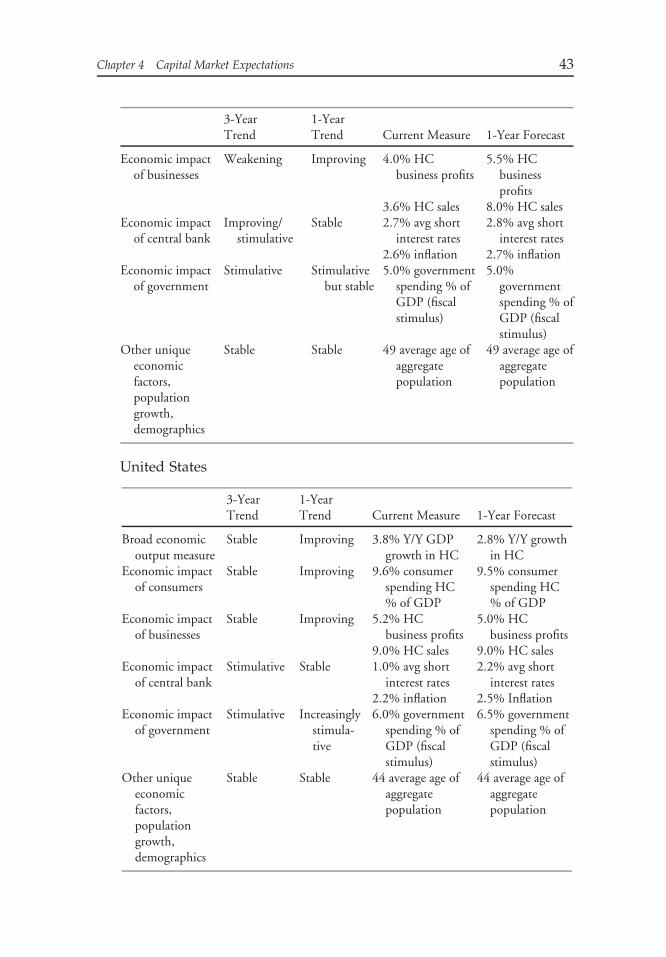
Chapter 4 Capital Market Expectations 43
3-Year 1-YearTrend Trend Current Measure 1-Year Forecast
Economic impactof businesses
Weakening Improving 4.0% HCbusiness profits
5.5% HCbusinessprofits
3.6% HC sales 8.0% HC salesEconomic impact
of central bankImproving/
stimulativeStable 2.7% avg short
interest rates2.8% avg short
interest rates2.6% inflation 2.7% inflation
Economic impactof government
Stimulative Stimulativebut stable
5.0% governmentspending % ofGDP (fiscalstimulus)
5.0%governmentspending % ofGDP (fiscalstimulus)
Other uniqueeconomicfactors,populationgrowth,demographics
Stable Stable 49 average age ofaggregatepopulation
49 average age ofaggregatepopulation
United States
3-Year 1-YearTrend Trend Current Measure 1-Year Forecast
Broad economicoutput measure
Stable Improving 3.8% Y/Y GDPgrowth in HC
2.8% Y/Y growthin HC
Economic impactof consumers
Stable Improving 9.6% consumerspending HC% of GDP
9.5% consumerspending HC% of GDP
Economic impactof businesses
Stable Improving 5.2% HCbusiness profits
5.0% HCbusiness profits
9.0% HC sales 9.0% HC salesEconomic impact
of central bankStimulative Stable 1.0% avg short
interest rates2.2% avg short
interest rates2.2% inflation 2.5% Inflation
Economic impactof government
Stimulative Increasinglystimula-tive
6.0% governmentspending % ofGDP (fiscalstimulus)
6.5% governmentspending % ofGDP (fiscalstimulus)
Other uniqueeconomicfactors,populationgrowth,demographics
Stable Stable 44 average age ofaggregatepopulation
44 average age ofaggregatepopulation
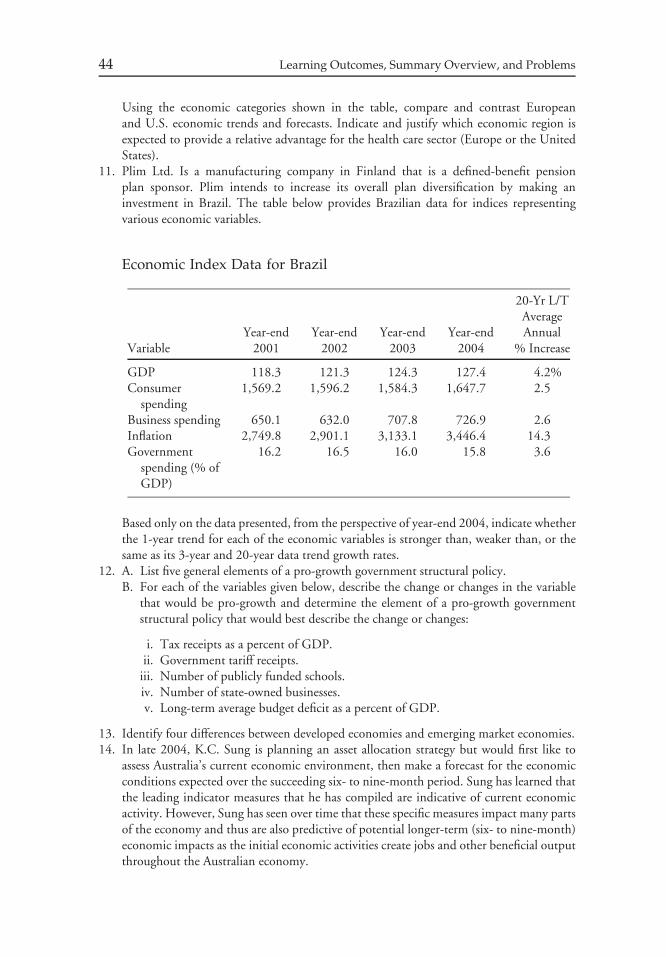
44 Learning Outcomes, Summary Overview, and Problems
Using the economic categories shown in the table, compare and contrast Europeanand U.S. economic trends and forecasts. Indicate and justify which economic region isexpected to provide a relative advantage for the health care sector (Europe or the UnitedStates).
11. Plim Ltd. Is a manufacturing company in Finland that is a defined-benefit pensionplan sponsor. Plim intends to increase its overall plan diversification by making aninvestment in Brazil. The table below provides Brazilian data for indices representingvarious economic variables.
Economic Index Data for Brazil
20-Yr L/TAverage
Year-end Year-end Year-end Year-end AnnualVariable 2001 2002 2003 2004 % Increase
GDP 118.3 121.3 124.3 127.4 4.2%Consumer
spending1,569.2 1,596.2 1,584.3 1,647.7 2.5
Business spending 650.1 632.0 707.8 726.9 2.6Inflation 2,749.8 2,901.1 3,133.1 3,446.4 14.3Government
spending (% ofGDP)
16.2 16.5 16.0 15.8 3.6
Based only on the data presented, from the perspective of year-end 2004, indicate whetherthe 1-year trend for each of the economic variables is stronger than, weaker than, or thesame as its 3-year and 20-year data trend growth rates.
12. A. List five general elements of a pro-growth government structural policy.B. For each of the variables given below, describe the change or changes in the variable
that would be pro-growth and determine the element of a pro-growth governmentstructural policy that would best describe the change or changes:
i. Tax receipts as a percent of GDP.ii. Government tariff receipts.
iii. Number of publicly funded schools.iv. Number of state-owned businesses.v. Long-term average budget deficit as a percent of GDP.
13. Identify four differences between developed economies and emerging market economies.14. In late 2004, K.C. Sung is planning an asset allocation strategy but would first like to
assess Australia’s current economic environment, then make a forecast for the economicconditions expected over the succeeding six- to nine-month period. Sung has learned thatthe leading indicator measures that he has compiled are indicative of current economicactivity. However, Sung has seen over time that these specific measures impact many partsof the economy and thus are also predictive of potential longer-term (six- to nine-month)economic impacts as the initial economic activities create jobs and other beneficial outputthroughout the Australian economy.
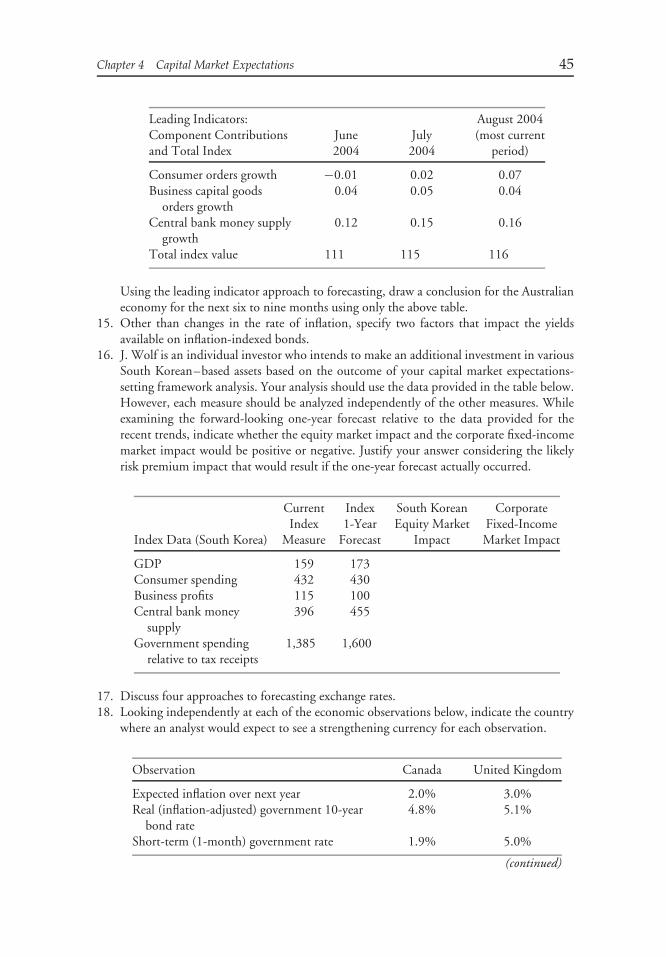
Chapter 4 Capital Market Expectations 45
Leading Indicators: August 2004Component Contributions June July (most currentand Total Index 2004 2004 period)
Consumer orders growth −0.01 0.02 0.07Business capital goods
orders growth0.04 0.05 0.04
Central bank money supplygrowth
0.12 0.15 0.16
Total index value 111 115 116
Using the leading indicator approach to forecasting, draw a conclusion for the Australianeconomy for the next six to nine months using only the above table.
15. Other than changes in the rate of inflation, specify two factors that impact the yieldsavailable on inflation-indexed bonds.
16. J. Wolf is an individual investor who intends to make an additional investment in variousSouth Korean–based assets based on the outcome of your capital market expectations-setting framework analysis. Your analysis should use the data provided in the table below.However, each measure should be analyzed independently of the other measures. Whileexamining the forward-looking one-year forecast relative to the data provided for therecent trends, indicate whether the equity market impact and the corporate fixed-incomemarket impact would be positive or negative. Justify your answer considering the likelyrisk premium impact that would result if the one-year forecast actually occurred.
Current Index South Korean CorporateIndex 1-Year Equity Market Fixed-Income
Index Data (South Korea) Measure Forecast Impact Market Impact
GDP 159 173Consumer spending 432 430Business profits 115 100Central bank money
supply396 455
Government spendingrelative to tax receipts
1,385 1,600
17. Discuss four approaches to forecasting exchange rates.18. Looking independently at each of the economic observations below, indicate the country
where an analyst would expect to see a strengthening currency for each observation.
Observation Canada United Kingdom
Expected inflation over next year 2.0% 3.0%Real (inflation-adjusted) government 10-year
bond rate4.8% 5.1%
Short-term (1-month) government rate 1.9% 5.0%
(continued)

46 Learning Outcomes, Summary Overview, and Problems
Observation Canada United Kingdom
Expected (forward-looking) GDP growth overnext year
2.0% 3.3%
New national laws have been passed thatenable foreign direct investment in realestate/financial companies
Yes No
Government surplus (deficit) 3.0% −1.0%Current account surplus (deficit) 8.0% −1.0%
19. Fap is a small country whose currency is the fip. Ten years ago, the exchange rate withthe Swiss franc (CHF) was 3 fips per 1 CHF, the inflation indices were equal to 100 inboth Switzerland and Fap, and the exchange rate reflected purchasing power parity (PPP).Now, the exchange rate is 2 fips per 1 CHF. The Swiss inflation index level is at 150, andthe Fap inflation index is at 140.
A. What should the current exchange rate be if PPP prevails?B. Are fips over- or undervalued, according to PPP, relative to CHF?
CHAPTER 5ASSET ALLOCATION
William F. SharpeStanford University and Financial Engines, Inc.
Palo Alto, California
Peng Chen, CFAIbbotson Associates
Chicago, Illinois
Jerald E. Pinto, CFACFA Institute
Charlottesville, Virginia
Dennis W. McLeavey, CFACFA Institute
Charlottesville, Virginia
LEARNING OUTCOMES
After completing this chapter, you will be able to do the following:
• Summarize the function of strategic asset allocation in portfolio management.• Discuss the role of strategic asset allocation in relation to exposures to systematic risk.• Compare and contrast strategic and tactical asset allocation.• Appraise the importance of asset allocation for portfolio performance.• Contrast asset-only and asset/liability management (ALM) approaches to asset allocation.• Explain an advantage and a disadvantage of implementing a dynamic versus a static
approach to strategic asset allocation.• Discuss and interpret the specification of return and risk objectives in relation to strategic
asset allocation.
47
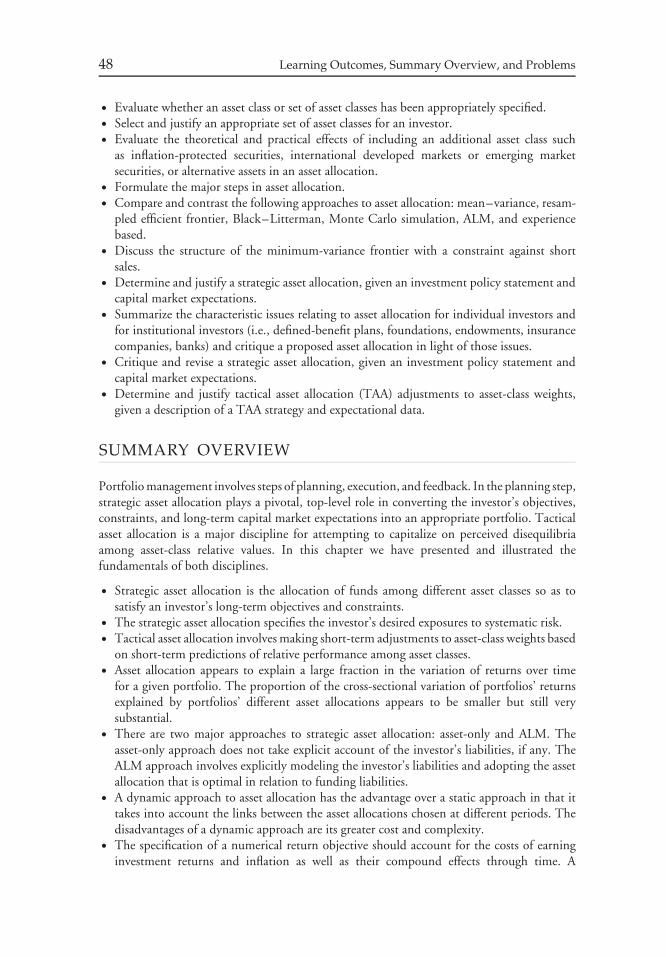
48 Learning Outcomes, Summary Overview, and Problems
• Evaluate whether an asset class or set of asset classes has been appropriately specified.• Select and justify an appropriate set of asset classes for an investor.• Evaluate the theoretical and practical effects of including an additional asset class such
as inflation-protected securities, international developed markets or emerging marketsecurities, or alternative assets in an asset allocation.
• Formulate the major steps in asset allocation.• Compare and contrast the following approaches to asset allocation: mean–variance, resam-
pled efficient frontier, Black–Litterman, Monte Carlo simulation, ALM, and experiencebased.
• Discuss the structure of the minimum-variance frontier with a constraint against shortsales.
• Determine and justify a strategic asset allocation, given an investment policy statement andcapital market expectations.
• Summarize the characteristic issues relating to asset allocation for individual investors andfor institutional investors (i.e., defined-benefit plans, foundations, endowments, insurancecompanies, banks) and critique a proposed asset allocation in light of those issues.
• Critique and revise a strategic asset allocation, given an investment policy statement andcapital market expectations.
• Determine and justify tactical asset allocation (TAA) adjustments to asset-class weights,given a description of a TAA strategy and expectational data.
SUMMARY OVERVIEW
Portfolio management involves steps of planning, execution, and feedback. In the planning step,strategic asset allocation plays a pivotal, top-level role in converting the investor’s objectives,constraints, and long-term capital market expectations into an appropriate portfolio. Tacticalasset allocation is a major discipline for attempting to capitalize on perceived disequilibriaamong asset-class relative values. In this chapter we have presented and illustrated thefundamentals of both disciplines.
• Strategic asset allocation is the allocation of funds among different asset classes so as tosatisfy an investor’s long-term objectives and constraints.
• The strategic asset allocation specifies the investor’s desired exposures to systematic risk.• Tactical asset allocation involves making short-term adjustments to asset-class weights based
on short-term predictions of relative performance among asset classes.• Asset allocation appears to explain a large fraction in the variation of returns over time
for a given portfolio. The proportion of the cross-sectional variation of portfolios’ returnsexplained by portfolios’ different asset allocations appears to be smaller but still verysubstantial.
• There are two major approaches to strategic asset allocation: asset-only and ALM. Theasset-only approach does not take explicit account of the investor’s liabilities, if any. TheALM approach involves explicitly modeling the investor’s liabilities and adopting the assetallocation that is optimal in relation to funding liabilities.
• A dynamic approach to asset allocation has the advantage over a static approach in that ittakes into account the links between the asset allocations chosen at different periods. Thedisadvantages of a dynamic approach are its greater cost and complexity.
• The specification of a numerical return objective should account for the costs of earninginvestment returns and inflation as well as their compound effects through time. A

Chapter 5 Asset Allocation 49
multiplicative return objective takes compounding into account and is the most precise; anadditive objective does not and thus will underestimate the return needed, despite providinga quick approximation. For instance, if the spending rate is 5 percent, the inflation rate3 percent, and the costs of earning investment returns 0.30 percent, the multiplicativeobjective is (1.05)(1.03)(1.003) − 1 = 0.0847, or 8.47 percent; the corresponding additiveobjective is 0.05 + 0.03 + 0.003 = 0.083, or 8.3 percent.
• The asset classes chosen for strategic asset allocation should satisfy the following five criteria:(1) Assets within an asset class should be relatively homogeneous, (2) asset classes should bemutually exclusive, (3) asset classes should be diversifying, (4) the asset classes as a groupshould make up a preponderance of world investable wealth, and (5) the asset class shouldhave the capacity to absorb a significant fraction of the investor’s portfolio without seriouslyaffecting the portfolio’s liquidity.
• After the preliminaries of specifying and listing investment policy statement (IPS)-permissible asset classes, asset allocation involves a series of steps on the capital markets sideand the investor side. On the capital markets side, the steps are to (1) observe capital marketconditions; (2) formulate a prediction procedure; and (3) obtain expected returns, risks,and correlations from the prediction procedure based on capital market conditions. On theinvestor side, the steps are to (1) observe the investor’s assets, liabilities, net worth, and riskattitudes; (2) formulate the investor’s risk tolerance function; and (3) obtain the investor’srisk tolerance. The optimization approach (optimizer) is specified and the investor’s assetmix is determined using the optimizer, using the investor’s capital market expectations andrisk tolerance as inputs. Finally, returns are observed, which provides feedback for the nextasset allocation review.
• The mean–variance approach to asset allocation involves selecting the efficient portfoliothat best satisfies the investor’s risk and return objectives and constraints.
• Simulation and mean–variance analysis are used to develop the resampled efficient frontier.Because the procedure takes account of estimation error, the resampled efficient port-folios on the frontier may be more diversified and stable over time than conventionalmean–variance efficient portfolios. The resampled efficient frontier is used as if it were aconventional efficient frontier to select the portfolio that best satisfies the investor’s needs.
• The Black–Litterman approach with a constraint against short sales reverse-engineers theexpected returns implicit in a diversified market portfolio; it combines those expectedreturns with the investor’s own views (if any) in a systematic way that takes into accountthe investor’s confidence in his or her views.
• Monte Carlo simulation is used to evaluate a proposed asset allocation’s multiperiodperformance. Important real-life complications such as cash inflows and outflows, taxes,and transaction costs can be modeled in a Monte Carlo simulation.
• The ALM approach to strategic asset allocation focuses on optimizing with respect tonet worth or surplus (the value of assets minus the present value of liabilities). In itsmean–variance implementation, ALM involves selecting a portfolio from the surplus effi-cient frontier; Monte Carlo simulation is helpful in evaluating the range of outcomes of asurplus efficient portfolio in funding liabilities over the investor’s time horizon.
• Experience-based approaches include the ideas that a 60/40 stock/bond allocation isappropriate for the average investor; that the allocation to bonds should increase with theinvestor’s risk aversion; that the allocation to stocks should increase with the investor’s timehorizon; and that younger investors should allocate more to stocks than older investors.
• In a mean–variance approach to asset allocation, a non-negativity constraint on asset-classweights is specified. A small number of portfolios called corner portfolios completely

50 Learning Outcomes, Summary Overview, and Problems
describe the resulting efficient frontier. We can find the weights of any portfolio on theminimum-variance frontier (and efficient frontier) using the two corner portfolios thatbracket it in terms of expected return. This result allows us to easily identify the compositionof any efficient portfolio.
• Strategic asset allocation for individual investors should consider both their financial capitaland their human capital (the present value of their expected future labor income). Humancapital as a share of total capital tends to decline as an individual approaches retirement.Consequently, if an investor’s human capital is risk free or low risk and uncorrelated withhis financial capital, his optimal allocation to stocks tends to decline as he approachesretirement, all else equal. To the extent the investor’s human capital is positively correlatedwith stocks, the investor’s allocation to stocks will be less than otherwise. Individualinvestors have a focus on after-tax returns.
• Defined-benefit (DB) pension plans, life insurance companies, non–life insurance com-panies, and banks face high penalties for not meeting liabilities. Insurance companies andbanks take an ALM approach to investing; DB pension plans frequently do also, or at leasttake ALM considerations into account. By contrast, foundations and endowments tend totake an asset-only approach to investing. Of the investors listed, life and non–life insurancecompanies and banks are taxable and have a focus on after-tax returns.
PROBLEMS
1. Paula Williams is chair of the Investment Committee of the Robinson FurnitureManufacturing (RFM) defined-benefit pension plan. The committee has established thestrategic asset allocation given in Exhibit 5-1. The RFM pension liability can be modeledapproximately as a short position in a long-term bond. The expected return on a long-termbond is 4.5 percent.
A. Contrast the appropriateness of using indexed investments versus a single security torepresent domestic and international equities in the RFM policy portfolio, given theeconomic role of strategic asset allocation.
EXHIBIT 5-1 RFM Policy Portfolio
Asset Class Target Allocation Permissible Range
1 Domestic equities 40% 30–50%2 International equities 10 5–153 Domestic long-term bonds 25 20–304 Inflation-protected bonds 25 20–30
EXHIBIT 5-2 Policy Portfolio: Statistics
Measure
Expected return 8%Standard deviation of return 12%Sharpe ratio 0.40Probability portfolio return is below 4.5% over one year 0.10

Chapter 5 Asset Allocation 51
B. Discuss the effects of the following implementation choices on the measured impor-tance of RFM’s policy portfolio:
i. Rebalancing to the policy mix.ii. Investing actively within an asset class or indexing to asset.
iii. Adopting a policy portfolio that is much different from those of peers.
An institutional analyst makes a presentation to the Investment Committee showingpromising past results from an investment program based on the following two variables,measured quarterly:
X = (Earnings yield − Real short-term bond yield) − Past average difference
Y = Change in OECD(Organization for Economic Cooperation and Development)
leading indicators
The analyst proposes that the weightings of domestic and international equities beadjusted quarterly within a band of ±10 percentage points of their target portfolio weightsbased on the values of X and Y .
C. Identify the type of investment program being suggested and critique the proposal.
The Investment Committee of RFM hears a second analyst presentation. This analystrecommends that the committee adopt a dynamic ALM approach to choosing its strategicasset allocation.
D. Justify the analyst’s recommendation, explain the differences between a static anda dynamic ALM approach to asset allocation, and explain an advantage and adisadvantage of the dynamic approach.
E. Identify the risk-minimizing strategic asset allocation from an ALM perspective.
Use the data in Exhibit 5-3 to address Problems 2, 3, and 4.
EXHIBIT 5-3 Forecasts
Investor’s Forecasts
Asset Allocation Expected Return Standard Deviation of Return
A 11.5% 18%B 8 14C 6 10
2. On the scale discussed in the text, Robert Langland’s risk aversion (RA) is 5. Recommendan asset allocation for him.
3. The Garrett Foundation would like to choose an asset allocation that minimizes theprobability of returns below its annual spending rate of 3.5 percent. Recommend an assetallocation for the foundation.
4. William Ernst needs to spend 5 percent from his portfolio annually. He anticipates thatinflation will be 2.4 percent annually. Ernst incurs expenses of 60 basis points a year ininvesting his portfolio. Which asset allocations satisfy Ernst’s return requirement?
5. Critique the following specifications of asset classes:
A. U.S. equities, world equities, U.S. bonds.B. Canadian equities, Canadian bonds, alternative assets.
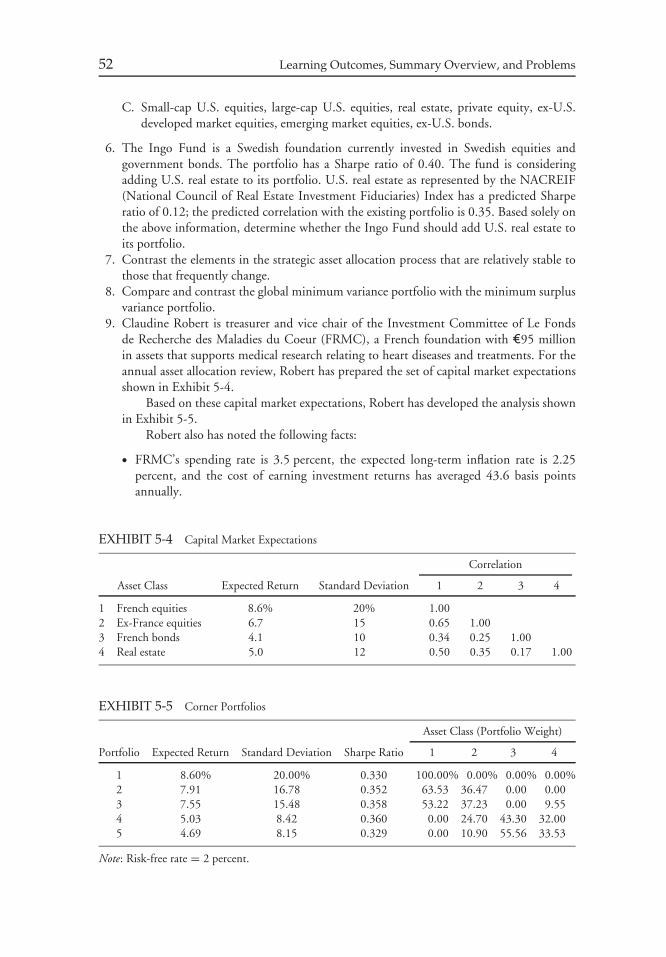
52 Learning Outcomes, Summary Overview, and Problems
C. Small-cap U.S. equities, large-cap U.S. equities, real estate, private equity, ex-U.S.developed market equities, emerging market equities, ex-U.S. bonds.
6. The Ingo Fund is a Swedish foundation currently invested in Swedish equities andgovernment bonds. The portfolio has a Sharpe ratio of 0.40. The fund is consideringadding U.S. real estate to its portfolio. U.S. real estate as represented by the NACREIF(National Council of Real Estate Investment Fiduciaries) Index has a predicted Sharperatio of 0.12; the predicted correlation with the existing portfolio is 0.35. Based solely onthe above information, determine whether the Ingo Fund should add U.S. real estate toits portfolio.
7. Contrast the elements in the strategic asset allocation process that are relatively stable tothose that frequently change.
8. Compare and contrast the global minimum variance portfolio with the minimum surplusvariance portfolio.
9. Claudine Robert is treasurer and vice chair of the Investment Committee of Le Fondsde Recherche des Maladies du Coeur (FRMC), a French foundation with ¤95 millionin assets that supports medical research relating to heart diseases and treatments. For theannual asset allocation review, Robert has prepared the set of capital market expectationsshown in Exhibit 5-4.
Based on these capital market expectations, Robert has developed the analysis shownin Exhibit 5-5.
Robert also has noted the following facts:
• FRMC’s spending rate is 3.5 percent, the expected long-term inflation rate is 2.25percent, and the cost of earning investment returns has averaged 43.6 basis pointsannually.
EXHIBIT 5-4 Capital Market Expectations
Correlation
Asset Class Expected Return Standard Deviation 1 2 3 4
1 French equities 8.6% 20% 1.002 Ex-France equities 6.7 15 0.65 1.003 French bonds 4.1 10 0.34 0.25 1.004 Real estate 5.0 12 0.50 0.35 0.17 1.00
EXHIBIT 5-5 Corner Portfolios
Asset Class (Portfolio Weight)
Portfolio Expected Return Standard Deviation Sharpe Ratio 1 2 3 4
1 8.60% 20.00% 0.330 100.00% 0.00% 0.00% 0.00%2 7.91 16.78 0.352 63.53 36.47 0.00 0.003 7.55 15.48 0.358 53.22 37.23 0.00 9.554 5.03 8.42 0.360 0.00 24.70 43.30 32.005 4.69 8.15 0.329 0.00 10.90 55.56 33.53
Note: Risk-free rate = 2 percent.

Chapter 5 Asset Allocation 53
• FRMC has a multiplicative return requirement based on the spending rate, the expectedinflation rate, and the cost of earning investment returns.
A. Describe how corner portfolios arise and explain how to use them in strategic assetallocation.
B. Compute FRMC’s return requirement (in percent, to two decimal places) and contrastit to an additive return requirement based on the same inputs.
C. Recommend the strategic asset allocation that Robert should present for approval atthe asset allocation review.
Use Exhibit 5-6 and Exhibit 5-7 to solve Problems 10 and 11.
• In Exhibit 5-6, plots are based on applying portfolio weights to true return parameters(mean returns, variances of returns, and correlations).
• In Exhibit 5-7, each of the three series of points (e.g., 1, 2, 3, 4, 5 is a series) representsone simulated efficient frontier from one simulation trial.
10. A. In Exhibit 5-6, if Frontier B is a mean–variance efficient frontier in which the efficientportfolios’ portfolio weights reflect perfect knowledge of the true return parameters,discuss whether Frontier A could be
i. the conventional mean–variance efficient frontierii. the resampled efficient frontier
B. Identify and explain the set of inputs to which mean–variance optimization is mostsensitive.
11. A. Identify the scatter of points in Exhibit 5-7.B. Describe how to compute a resampled efficient frontier from the scatter of points
shown in Exhibit 5-7.
Frontier A
Frontier B
20
15
10
5
Expected Return(%)
Standard Deviation of Return (%)
5 10 252015
EXHIBIT 5-6 Efficient Frontiers
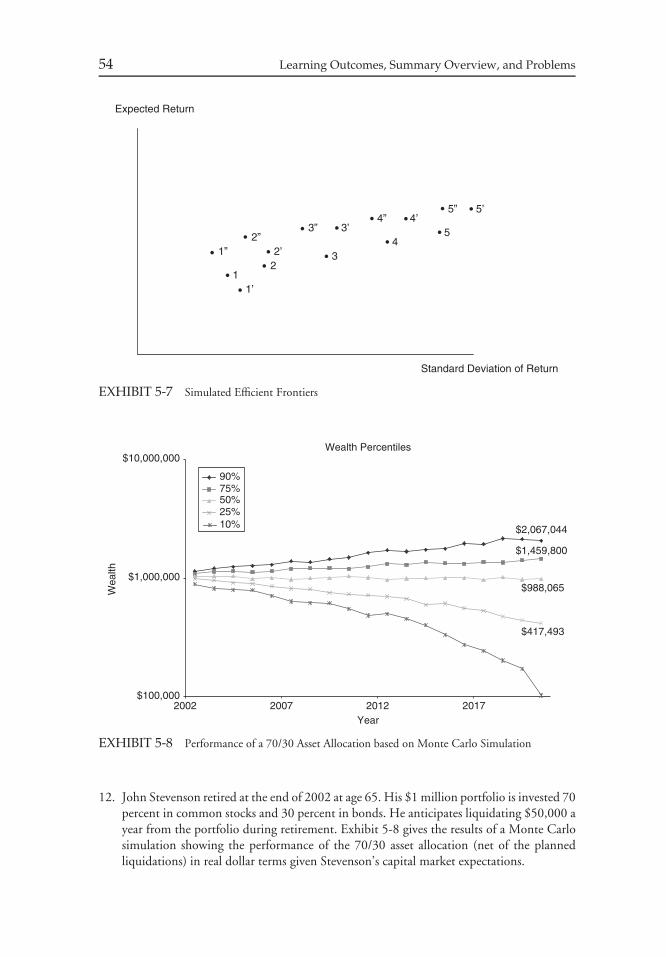
54 Learning Outcomes, Summary Overview, and Problems
Standard Deviation of Return
Expected Return
1’
1”
1
2” 2’
2
3’
3
3”4’
4
4”5”
5
5’
EXHIBIT 5-7 Simulated Efficient Frontiers
Wealth Percentiles
$2,067,044
$1,459,800
$988,065
$417,493
$100,000
$1,000,000
$10,000,000
2002 2007 2012 2017Year
Wea
lth
90%75%50%25%10%
EXHIBIT 5-8 Performance of a 70/30 Asset Allocation based on Monte Carlo Simulation
12. John Stevenson retired at the end of 2002 at age 65. His $1 million portfolio is invested 70percent in common stocks and 30 percent in bonds. He anticipates liquidating $50,000 ayear from the portfolio during retirement. Exhibit 5-8 gives the results of a Monte Carlosimulation showing the performance of the 70/30 asset allocation (net of the plannedliquidations) in real dollar terms given Stevenson’s capital market expectations.

Chapter 5 Asset Allocation 55
Stevenson wants his portfolio value (in real dollars) to be at least $630,000 when heturns 75 in 2012. He requires a 90 percent probability of meeting this goal. Determinewhether Stevenson’s current asset allocation promises to satisfy that requirement.
13. The Inner Life Insurance Company (ILIC) is considering the asset allocation shown inExhibit 5-9 below. ILIC has risk aversion (RA) of 5 using the scale presented in the text.
A. Recommend an asset allocation for ILIC.B. Recommend a statistical method that ILIC should use to obtain information about
a proposed asset allocation’s performance over time, given its forecasts concerningliabilities and its capital market expectations.
14. For the following types of investors, appraise the importance of using the specified assetclass for strategic asset allocation.
A. Long-term bonds for a life insurer and for a young investor.B. Common stock for a bank and for a young investor.C. Domestic tax-exempt bonds for an endowment and for a mid-career professional.D. Private equity for a major foundation and for a young investor.
15. Exhibit 5-10 shows William Smith’s financial and human capital in constant dollars termsat 30, 50, and 65 years of age.
Smith’s target asset allocation for total wealth is 60/40 stocks/bonds. Assume that hishuman capital is approximately risk free and uncorrelated with stock returns. DetermineSmith’s optimal asset allocation for stocks and bonds in his financial portfolio at thefollowing ages:
A. 30B. 50C. 65D. Discuss whether your conclusions in Parts A, B, and C are consistent with experience-
based approaches to asset allocation.
EXHIBIT 5-9 Investor’s Forecasts
Asset Allocation Expected Surplus Return Standard Deviation of Surplus Return
A 6.5% 14%B 4 10C 0 2
EXHIBIT 5-10 Financial and Human Capital
Age Financial Capital Human Capital
30 $ 100,000 $2,100,00050 900,000 1,300,00065 2,000,000 200,000

56 Learning Outcomes, Summary Overview, and Problems
EXHIBIT 5-11 Expected Return for Asset Classes
Asset Class Long-Term Short-Term
Global Equities A BU.S. equities 8% 14%Ex-U.S. equities 10 10Global Fixed Income C DU.S. bonds 6% 8%Ex-U.S. bonds 5 4
16. Wendy Willet is chief investment officer of the Allright University Endowment (AUE)based in the United States. The strategic asset allocation of AUE is as follows, wherepercentages refer to proportions of the total portfolio:
Global equities 60%U.S. Equities 30%Ex-U.S. equities 30%
Global fixed income 40%U.S. bonds 30%Ex-U.S. bonds 10%
Exhibit 5-11 gives Willet’s expectations.AUE runs a top-down global tactical asset allocation program that looks first at
the overall allocation between global equities and global fixed income, then at the assetallocation within global equities and global fixed income. Assume that the asset classes’risk characteristics are constant.
A. Calculate the long-term and short-term expectations for global equities (A and B,respectively) and global fixed income (C and D, respectively).
B. Determine and justify the changes in portfolio weights (in relation to the policyportfolio target weights) that would result from a global tactical asset allocationprogram.
17. (Adapted from the 2000 CFA Level III Exam)Hugh Donovan is chief financial officer (CFO) of LightSpeed Connections (LSC), a
rapidly growing U.S technology company with a traditional defined-benefit pension plan.Because of LSC’s young workforce, Donovan believes the pension plan has no liquidityneeds and can thus invest aggressively to maximize pension assets. He also believes thatTreasury bills and bonds, yielding 5.4 percent and 6.1 percent, respectively, have no placein a portfolio with such a long time horizon. His strategy, which has produced excellentreturns for the past two years, is to invest the portfolio as follows:
• 50 percent in a concentrated pool (15 to 20 stocks) of initial public offerings (IPOs) intechnology and Internet companies, managed internally by Donovan.
• 25 percent in a small-cap growth fund.• 10 percent in a venture capital fund.• 10 percent in an S&P 500 index fund.• 5 percent in an international equity fund.
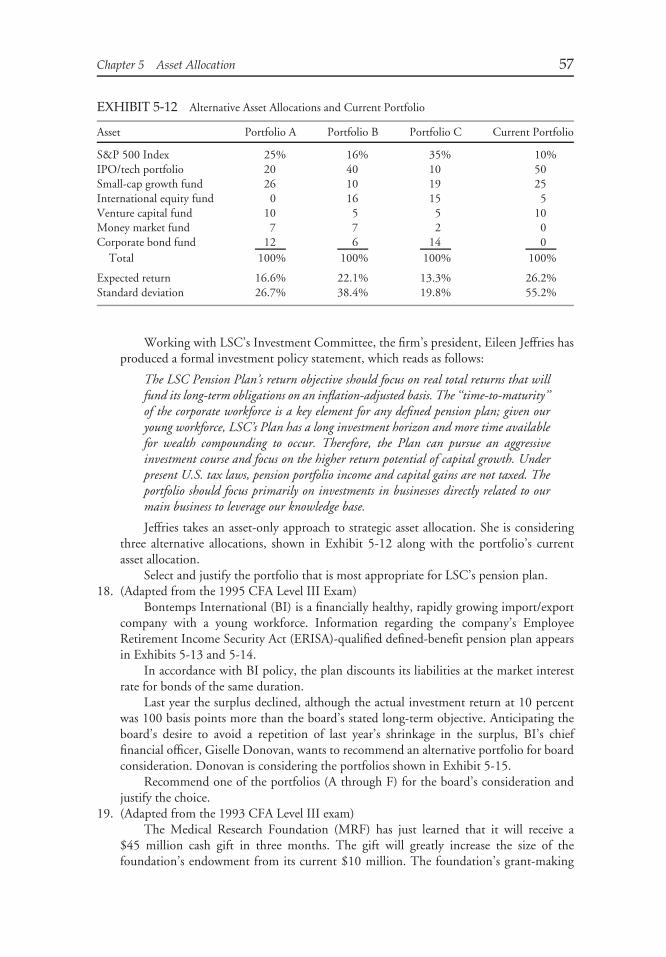
Chapter 5 Asset Allocation 57
EXHIBIT 5-12 Alternative Asset Allocations and Current Portfolio
Asset Portfolio A Portfolio B Portfolio C Current Portfolio
S&P 500 Index 25% 16% 35% 10%IPO/tech portfolio 20 40 10 50Small-cap growth fund 26 10 19 25International equity fund 0 16 15 5Venture capital fund 10 5 5 10Money market fund 7 7 2 0Corporate bond fund 12 6 14 0
Total 100% 100% 100% 100%
Expected return 16.6% 22.1% 13.3% 26.2%Standard deviation 26.7% 38.4% 19.8% 55.2%
Working with LSC’s Investment Committee, the firm’s president, Eileen Jeffries hasproduced a formal investment policy statement, which reads as follows:
The LSC Pension Plan’s return objective should focus on real total returns that willfund its long-term obligations on an inflation-adjusted basis. The ‘‘time-to-maturity’’of the corporate workforce is a key element for any defined pension plan; given ouryoung workforce, LSC’s Plan has a long investment horizon and more time availablefor wealth compounding to occur. Therefore, the Plan can pursue an aggressiveinvestment course and focus on the higher return potential of capital growth. Underpresent U.S. tax laws, pension portfolio income and capital gains are not taxed. Theportfolio should focus primarily on investments in businesses directly related to ourmain business to leverage our knowledge base.
Jeffries takes an asset-only approach to strategic asset allocation. She is consideringthree alternative allocations, shown in Exhibit 5-12 along with the portfolio’s currentasset allocation.
Select and justify the portfolio that is most appropriate for LSC’s pension plan.18. (Adapted from the 1995 CFA Level III Exam)
Bontemps International (BI) is a financially healthy, rapidly growing import/exportcompany with a young workforce. Information regarding the company’s EmployeeRetirement Income Security Act (ERISA)-qualified defined-benefit pension plan appearsin Exhibits 5-13 and 5-14.
In accordance with BI policy, the plan discounts its liabilities at the market interestrate for bonds of the same duration.
Last year the surplus declined, although the actual investment return at 10 percentwas 100 basis points more than the board’s stated long-term objective. Anticipating theboard’s desire to avoid a repetition of last year’s shrinkage in the surplus, BI’s chieffinancial officer, Giselle Donovan, wants to recommend an alternative portfolio for boardconsideration. Donovan is considering the portfolios shown in Exhibit 5-15.
Recommend one of the portfolios (A through F) for the board’s consideration andjustify the choice.
19. (Adapted from the 1993 CFA Level III exam)The Medical Research Foundation (MRF) has just learned that it will receive a
$45 million cash gift in three months. The gift will greatly increase the size of thefoundation’s endowment from its current $10 million. The foundation’s grant-making

58 Learning Outcomes, Summary Overview, and Problems
EXHIBIT 5-13 Bontemps International Defined Benefit Pension Plan Portfolio Summary
Asset Class Percent Allocation Prior-Year Total Return
Large-cap U.S. equities 35% 10.0%Small-cap U.S. equities 10 12.0International equities 5 7.0
Total equities 50U.S. Treasury bills (1-year duration) 10 4.5U.S. intermediate bonds and mortgage-backed
securities (4-year duration)39 1.0
U.S. long-term bonds (10-year duration) 1 19.0%a
Total fixed income 50%Total 100% 10.0%
aIncome element 7.0%; gain element 12.0%.
EXHIBIT 5-14 Bontemps International Defined BenefitPension Plan: Key Details
Present value of plan liabilities $298 millionMarket value of plan assets $300 millionSurplus $2 millionDuration of liabilities 10 yearsActuarial return assumption 7.0%BI board’s long-term total return objective 9.0%
EXHIBIT 5-15 Portfolio Alternatives
Portfolio
A B C D E F Current Portfolio
Domestic large-cap equities 0% 25% 30% 0% 30% 30% 35%Domestic small-cap
equities0 15 20 0 5 20 10
International equities 0 20 20 0 20 20 5
Subtotal equity 0% 60% 70% 0% 55% 70% 50%
Treasury bills (1-yearduration)
100 20 5 0 0 0 10
Intermediate bonds (4-yearduration)
0 20 20 0 0 0 39
Long bonds (10-yearduration)
0 0 5 100 45 30 1
Subtotal fixed income 100% 40% 30% 100% 45% 30% 50%
Total 100% 100% 100% 100% 100% 100% 100%
Expected annual return 5.5% 9.4% 10.0% 7.1% 9.3% 10.2% 9.0%
Return volatility 0.0 10.3 13.0 0.0 10.3 14.0 10.0Surplus volatility 11.0 7.0 11.0 0.0 5.5 7.5 8.0

Chapter 5 Asset Allocation 59
EXHIBIT 5-16 Capital Markets Annualized Return Data
Asset 1926–1992 Average 1993–2000 Consensus Forecast
U.S. Treasury bills 3.7% 4.2%Intermediate-term U.S. T-bonds 5.2 5.8Long-term U.S. T-bonds 4.8 7.7U.S. corporate bonds (AAA) 5.5 8.7Non-U.S. bonds (AAA) N/A 8.4U.S. common stocks (large cap) 10.3 9.0U.S. common stocks (small cap) 12.2 12.0Non-U.S. common stocks (all) N/A 10.1Venture capital N/A 15.5Real estate N/A 8.5
U.S. inflation 3.1% 3.5%
(spending) policy has been to pay out virtually all of its annual net investment income.Because MRF’s investment approach has been conservative, the endowment portfolionow consists almost entirely of fixed-income assets. The finance committee understandsthat these actions are causing the real value of foundation assets and the real value of futuregrants to decline because of inflation effects. Until now, the finance committee has believedit had no alternative to these actions, given the large immediate cash needs of the researchprograms being funded and the size of the foundation’s capital base. The foundation’sannual grants must at least equal 5 percent of its assets’ market value to maintain its U.S.tax-exempt status, a requirement that is expected to continue indefinitely. No additionalgifts or fundraising activity are expected for the foreseeable future.
Given the change in circumstances that the cash gift will make, the finance committeewishes to develop new grant-making and investment policies. Annual spending must atleast meet the 5 percent of market value requirement, but the committee is unsure howmuch higher spending can or should be. The committee wants to pay out as much aspossible because of the critical nature of the research being funded; however, it understandsthat preserving the real value of the foundation’s assets is equally important in order topreserve its future grant-making capabilities. You have been asked to assist the committeein developing appropriate policies. Exhibit 5-16 summarizes the capital markets data.
Recommend and justify a long-term asset allocation.

CHAPTER 6FIXED-INCOME PORTFOLIO
MANAGEMENT
H. Gifford FongGifford Fong Associates
Lafayette, California
Larry D. Guin, CFAMurray State University
Murray, Kentucky
LEARNING OUTCOMES
After completing this chapter, you will be able to do the following:
• Compare and contrast, with respect to investment objectives, the use of liabilities as abenchmark with the use of a bond index as a benchmark.
• Discuss the range of benchmark index–oriented bond investment strategies and compareand contrast pure bond indexing, enhanced indexing, and active investing with respect tothe objectives, techniques, and advantages and disadvantages of each.
• Discuss criteria for selecting a benchmark bond index, and justify the selection of abenchmark index given a description of the investor’s risk aversion, income needs, andliabilities.
• Review and justify the means (e.g., matching duration and key rate durations) by whichan enhanced indexer may seek to align the risk exposures of the portfolio with those of thebenchmark bond index.
• Contrast and illustrate total return and scenario analysis.• Evaluate the effects of leverage on the rate of return on an investor’s equity and discuss the
use of repurchase agreements (repos) to finance bond purchases and the factors that affectthe repo rate.
• Design a bond immunization strategy that will ensure funding of a predetermined liabilityand evaluate the strategy under various interest rate scenarios.
• Demonstrate the process of rebalancing a portfolio to reestablish the dollar duration of theportfolio to a desired level.
60

Chapter 6 Fixed-Income Portfolio Management 61
• Justify the importance of spread duration.• Evaluate the extensions to classical immunization theory.• Critique the risks associated with managing a portfolio against a liability structure (cap risk,
contingent claim risk, and interest rate risk).• Compare and contrast immunization strategies for a single liability, multiple liabilities, and
general cash flows.• Compare and contrast risk minimization with return maximization in immunized portfo-
lios.• Critique the following measures of portfolio risk: standard deviation, target semivariance,
shortfall risk, and value at risk.• Demonstrate the advantages of using futures instead of cash market instruments to alter
portfolio risk.• Formulate, construct, and evaluate an immunization strategy using interest rate futures.• Discuss the types of credit options written on an underlying asset.• Compare default risk, credit spread risk, and downgrade risk, and demonstrate which
credit derivative instruments address each risk, including how they can be used in portfoliomanagement.
• Evaluate the sources of excess return for an international bond portfolio.• Analyze (1) the change in value of a foreign bond when domestic interest rates change,
given the bond’s duration and the country beta, and (2) the contribution of a foreign bondto a domestic portfolio’s duration, given the duration of the foreign bond and the countrybeta.
• Recommend and justify whether to hedge an international bond investment.• Illustrate how breakeven spread analysis can be used to evaluate the risk in seeking yield
advantages across international bond markets.• Discuss the advantages and risks in investing in emerging market debt.• Discuss the selection of a fixed-income manager.
SUMMARY OVERVIEW
The management of fixed-income portfolios is a highly competitive field requiring skill infinancial and economic analysis, market knowledge, and control of costs. Among the pointsthat have been made are the following:
• Because a benchmark is the standard with which the portfolio’s performance will becompared, it should always reflect the portfolio’s objective. If a portfolio has liabilitiesthat must be met, that need is the paramount objective and thus is the most appropriatebenchmark. If a portfolio has no liabilities, the most relevant standard is a bond marketindex that very closely matches the portfolio’s characteristics.
• Bond indexing is attractive because indexed portfolios have lower fees than actively managedportfolios and broadly based bond index portfolios provide excellent diversification.
• In selecting a benchmark index, the manager should choose an index with comparablemarket value risk, comparable income risk (comparable assured income stream), andminimal liability framework risk (minimal mismatch between the durations of assets andliabilities).
• For an indexed portfolio, the manager must carefully try to match the portfolio’s character-istics to the benchmark’s risk profile. The primary risk factors to match are the portfolio’s

62 Learning Outcomes, Summary Overview, and Problems
duration, key rate duration and cash flow distribution, sector and quality percentage, sectorduration contribution, quality spread duration contribution, sector/coupon/maturity/cellweights, and issuer exposure.
• The indexing manager has a variety of strategies from which to choose ranging from atotally passive style to a very active style or points in between. The most popular of thesestrategies are pure bond indexing, enhanced indexing by matching primary risk factors,enhanced indexing by minor risk factor mismatches, active management by larger riskfactor mismatches, and full-blown active management.
• Because a perfectly indexed portfolio will still underperform the benchmark by the amountof transactions costs, the manager may use a variety of techniques to enhance the return.These include lowering managerial and transactions costs, issue selection, yield curvepositioning, sector and quality positioning, and call exposure positioning.
• Total return analysis and scenario analysis are methods of evaluating the impact of a tradegiven a change in interest rates and a range of changes in interest rates, respectively.
• The heart of a bond immunization strategy for a single liability is to match the averageduration of the assets with the time horizon of the liability. However, this matchingalone is not sufficient to immunize the portfolio, in general, because of the impact oftwists and nonparallel changes in the yield curve. Care must be taken when designing theimmunization strategy to ensure that the portfolio will remain immunized under a varietyof different scenarios.
• In order to maintain the dollar duration of a portfolio, rebalancing may be necessary.Methods for achieving this include (1) investing new funds (if necessary), (2) changing theweight of a particular security to adjust the dollar duration, and (3) using derivatives. Ifnew funds are invested to rebalance, after an interest rate change, calculate the new dollarduration of the portfolio, calculate the rebalancing ratio, then multiply the new marketvalue of the portfolio by the desired percentage change.
• Spread duration is a measure of how the market value of a risky bond (portfolio) will changewith respect to a parallel 100 bps change in its spread above the comparable benchmarksecurity (portfolio). Spread duration is an important factor influencing a portfolio’s totalreturn because spreads do change frequently.
• Because parallel shifts in the yield curve are rare, classical immunization will not immunizethe portfolio adequately. Extensions to classical immunization provide better results. Theseextensions include modifying the definition of duration (to multifunctional duration),overcoming the limitations of a fixed horizon, analyzing the risk and return trade-off forimmunized portfolios, and integrating immunization strategies with elements of activebond market strategies.
• Three categories that describe the risk of not being able to pay a portfolio’s liabilities areinterest rate risk, contingent claim, and cap risk. A rising interest rate environment (interestrate risk) comprises the largest risk that a portfolio manager will face. When a security has acontingent claim provision, the manager may have lucrative coupon payments halted (as isthe case with mortgage-backed securities) or a leveling off in the market value of a callablesecurity. An asset that makes floating rate payments will typically have caps associated withthe floating rate. The manager is at risk of the level of market rates rising while the assetreturns are capped.
• Multiple liabilities immunization requires the portfolio payment stream to be decomposedso that each liability is separately immunized by one of the component streams, thecomposite duration of the portfolio must equal the composite duration of the liabilities,and the distribution of individual portfolio assets must have a wider range than the

Chapter 6 Fixed-Income Portfolio Management 63
distribution of the liabilities. For general cash flows, the expected cash contributions can beconsidered the payments on hypothetical securities that are part of the initial holdings. Theactual initial investment can then be invested in such a way that the real and hypotheticalholdings taken together represent an immunized portfolio.
• Risk minimization produces an immunized portfolio with a minimum exposure to anyarbitrary interest rate change subject to the duration constraint. This objective may be toorestrictive in certain situations however. If a substantial increase in the expected return canbe accomplished with little effect on immunization risk, the higher-yielding portfolio maybe preferred in spite of its higher risk.
• Standard deviation, target semivariance, shortfall risk, and value at risk have all beenproposed as appropriate measures of risk for a portfolio. However, each has its owndeficiency. For example, standard deviation (or variance) assumes that risk has a normaldistribution (which may not be true). Semivariance often provides little extra information ifreturns are symmetric. Shortfall risk is expressed as a probability, not as a currency amount.Value at risk does not indicate the magnitude of the very worst possible outcomes.
• A repurchase agreement is subject to a variety of credit risks, including:
a. Quality of the collateral . The higher the quality of the securities, the lower the repo ratewill be.
b. Term of the repo. Typically, the longer the maturity, the higher the rate will be.c. Delivery requirement. If physical delivery of the securities is required, the rate will be
lower because of the lower credit risk.d. Availability of collateral . The buyer of the securities may be willing to accept a lower
rate in order to obtain securities that are in short supply.e. Prevailing interest rates in the economy. As interest rates increase, the rates on repo
transactions will generally increase.f. Seasonal factors. A seasonal effect may exist because some institutions’ supply of funds
varies by the season.
• The primary advantages to using futures to alter a portfolio’s duration are increased liquidityand cost effectiveness.
• Futures contracts can be used to shorten or lengthen a portfolio’s duration. The contractsmay also be used to hedge or reduce an existing interest rate exposure. As such, they maybe combined with traditional immunization techniques to improve the results.
• Unlike ordinary bond options that protect against interest rate risk, credit options arestructured to offer protection against credit risk. Binary credit option and binary creditoption based on a credit rating are the two types of credit options written on an underlyingasset. The former pays the option buyer in the event of default; otherwise, nothing ispaid. The latter pays the difference between the strike price and the market price when thespecified credit rating event occurs and pays nothing if the event does not occur.
• Credit options are structured to offer protection against both default risk and credit spreadrisk, credit forwards offer protection again credit spread risk, and credit default swaps helpin managing default risk.
• The sources of excess return for an international bond portfolio include bond market selec-tion, currency selection, duration management/yield curve management, sector selection,credit analysis, and investing in markets outside the benchmark index.
• Emerging market debt (EMD) has matured as an asset class. The spread of EMD overrisk-free rates has narrowed considerably as the quality of sovereign bonds has increased

64 Learning Outcomes, Summary Overview, and Problems
to the point that they now have similar frequencies of default, recovery rates, and ratingstransition probabilities compared with corporate bonds with similar ratings.
• Emerging market debt is still risky, however, and is characterized by high volatility andreturns that exhibit significant negative skewness. Moreover, emerging market countriesfrequently do not offer the degree of transparency, court tested laws, and clear regulationsfound in established markets.
• For a change in domestic interest rates, the change in a foreign bond’s value may befound by multiplying the duration of the foreign bond times the country beta. Becausea portfolio’s duration is a weighted average of the duration of the bonds in the portfolio,the contribution to the portfolio’s duration is equal to the adjusted foreign bond durationmultiplied by its weight in the portfolio.
• Breakeven spread analysis is used to estimate relative values between markets by quantifyingthe amount of spread widening required to reduce a foreign bond’s yield advantage to zero.The breakeven spread can be found by dividing the yield advantage by the bond’s duration.
• When funds are not managed entirely in-house, a search for outside managers must beconducted. The due diligence for selection of managers is satisfied primarily by investigatingthe managers’ investment process, the types of trades the managers are making, and theorganizational strengths.
PROBLEMS
1. The table below shows the active return for six periods for a bond portfolio. Calculate theportfolio’s tracking risk for the six-period time frame.
Period Portfolio Return Benchmark Return Active Return
1 14.10% 13.70% 0.400%2 8.20 8.00 0.2003 7.80 8.00 −0.2004 3.20 3.50 −0.3005 2.60 2.40 0.2006 3.30 3.00 0.300
2. A portfolio manager decided to purchase corporate bonds with a market value of ¤5million. To finance 60 percent of the purchase, the portfolio manager entered into a30-day repurchase agreement with the bond dealer. The 30-day term repo rate was4.6 percent per year. At the end of the 30 days, the bonds purchased by the portfoliomanager have increased in value by 0.5 percent and the portfolio manager decided to sellthe bonds. No coupons were received during the 30-day period.
A. Compute the 30-day rate of return on the equity and borrowed components of theportfolio.
B. Compute the 30-day portfolio rate of return.C. Compute the 30-day portfolio rate of return if the increase in value of the bonds was
0.3 percent instead of 0.5 percent.D. Use your answers to parts B and C above to comment on the effect of the use of
leverage on the portfolio rate of return.
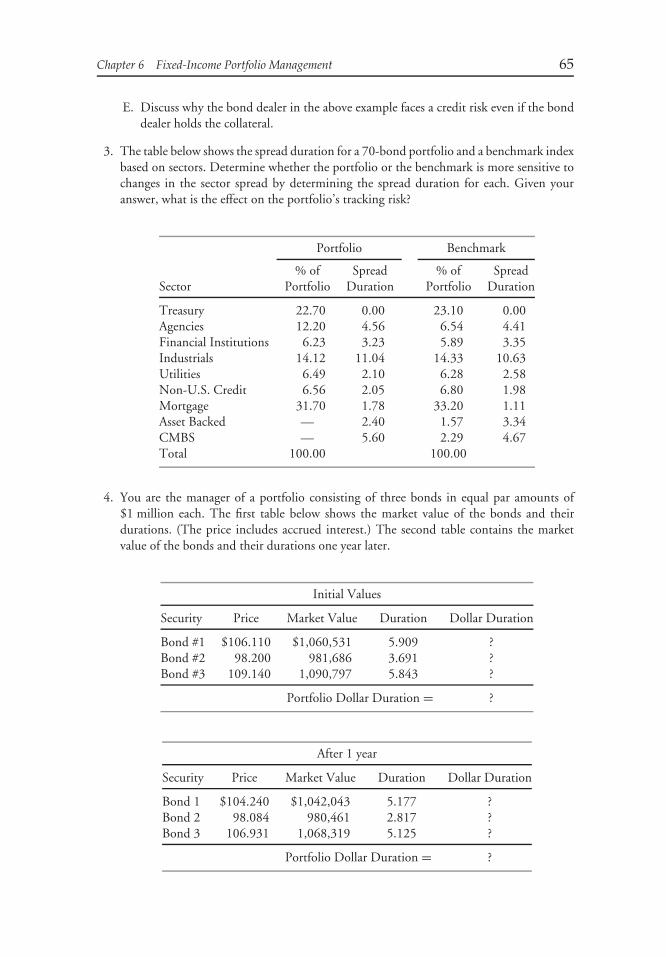
Chapter 6 Fixed-Income Portfolio Management 65
E. Discuss why the bond dealer in the above example faces a credit risk even if the bonddealer holds the collateral.
3. The table below shows the spread duration for a 70-bond portfolio and a benchmark indexbased on sectors. Determine whether the portfolio or the benchmark is more sensitive tochanges in the sector spread by determining the spread duration for each. Given youranswer, what is the effect on the portfolio’s tracking risk?
Portfolio Benchmark
% of Spread % of SpreadSector Portfolio Duration Portfolio Duration
Treasury 22.70 0.00 23.10 0.00Agencies 12.20 4.56 6.54 4.41Financial Institutions 6.23 3.23 5.89 3.35Industrials 14.12 11.04 14.33 10.63Utilities 6.49 2.10 6.28 2.58Non-U.S. Credit 6.56 2.05 6.80 1.98Mortgage 31.70 1.78 33.20 1.11Asset Backed — 2.40 1.57 3.34CMBS — 5.60 2.29 4.67Total 100.00 100.00
4. You are the manager of a portfolio consisting of three bonds in equal par amounts of$1 million each. The first table below shows the market value of the bonds and theirdurations. (The price includes accrued interest.) The second table contains the marketvalue of the bonds and their durations one year later.
Initial Values
Security Price Market Value Duration Dollar Duration
Bond #1 $106.110 $1,060,531 5.909 ?Bond #2 98.200 981,686 3.691 ?Bond #3 109.140 1,090,797 5.843 ?
Portfolio Dollar Duration = ?
After 1 year
Security Price Market Value Duration Dollar Duration
Bond 1 $104.240 $1,042,043 5.177 ?Bond 2 98.084 980,461 2.817 ?Bond 3 106.931 1,068,319 5.125 ?
Portfolio Dollar Duration = ?

66 Learning Outcomes, Summary Overview, and Problems
As manager, you would like to maintain the portfolio’s dollar duration at the initiallevel by rebalancing the portfolio. You choose to rebalance using the existing securityproportions of one-third each. Calculate:
A. The dollar durations of each of the bonds.B. The rebalancing ratio necessary for the rebalancing.C. The cash required for the rebalancing.
5. Your client has asked you to construct a £2 million bond portfolio. Some of the bonds thatyou are considering for this portfolio have embedded options. Your client has specifiedthat he may withdraw £25,000 from the portfolio in six months to fund some expectedexpenses. He would like to be able to make this withdrawal without reducing the initialcapital of £2 million.
A. Would shortfall risk be an appropriate measure of risk while evaluating the portfoliosfor your client?
B. What are some of the shortcomings of the use of shortfall risk?
6. The market value of the bond portfolio of a French investment fund is ¤75 million.The duration of the portfolio is 8.17. Based on the analysis provided by the in-houseeconomists, the portfolio manager believes that the interest rates are likely to have anunexpected decrease over the next month. Based on this belief, the manager has decidedto increase the duration of its entire bond portfolio to 10. The futures contract it woulduse is priced at ¤130,000 and has a duration of 9.35. Assume that the conversion factorfor the futures contract is 1.06.
A. Would the fund need to buy futures contracts or sell?B. Approximately, how many futures contracts would be needed to change the duration
of the bond portfolio?
7. The trustees of a pension fund would like to examine the issue of protecting the bondsin the fund’s portfolio against an increase in interest rates using options and futures.Before discussing this with their external bond fund manager, they decide to ask fourconsultants about their recommendations as to what should be done at this time. It turnsout that each of them has a different recommendation. Consultant A suggests sellingcovered calls, Consultant B suggests doing nothing at all, Consultant C suggests sellinginterest rate futures, and Consultant D suggests buying puts. The reason for their differentrecommendations is that although all consultants understand the pension fund’s objectiveof minimizing risk, they differ with one another in regards to their outlook on futureinterest rates. One of the consultants believes interest rates are headed downward, one hasno opinion, one believes that the interest rates would not change much in either direction,and one believes that the interest rates are headed upward. Based on the consultants’recommendations, could you identify the outlook of each consultant?
8. The current credit spread on bonds issued by Great Foods Inc. is 300 bps. The managerof More Money Funds believes that Great Foods’ credit situation will improve over thenext few months, resulting in a smaller credit spread on its bonds. She decides to enterinto a six-month credit spread forward contract, taking the position that the credit spreadwill decrease. The forward contract has the current spread as the contracted spread, anotional amount of $10 million, and a risk factor of 5.

Chapter 6 Fixed-Income Portfolio Management 67
A. On the settlement date six months later, the credit spread on Great Foods bonds is250 bps. How much is the payoff to More Money Funds?
B. How much would be the payoff to More Money Funds if the credit spread on thesettlement date is 350 bps?
C. How much is the maximum possible gain for More Money Funds?
9. Consider a collateralized debt obligation (CDO) that has a $250 million structure. Thecollateral consists of bonds that mature in seven years, and the coupon rate for these bondsis the seven-year Treasury rate plus 500 bps. The senior tranche comprises 70 percent ofthe structure and has a floating coupon of LIBOR plus 50 bps. There is only one juniortranche that comprises 20 percent of the structure and has a fixed coupon of seven-yearTreasury rate plus 300 bps. Compute the rate of return earned by the equity tranche inthis CDO if the seven-year Treasury rate is 6 percent and the London Interbank OfferedRate (LIBOR) is 7.5 percent. There are no defaults in the underlying collateral pool.Ignore the collateral manager’s fees and any other expenses.
10. Assume that the rates shown in the table below accurately reflect current conditions inthe financial markets.
Dollar/Euro Spot Rate 1.21Dollar/Euro 1-Year Forward Rate 1.181-Year Deposit Rate:Euro 3%U.S. 2%
In the table, the one-year forward dollar–euro exchange rate is mispriced, because itdoesn’t reflect the interest rate differentials between the United States and Europe.
A. Calculate the amount of the current forward exchange discount or premium.B. Calculate the value that the forward rate would need to be in order to keep riskless
arbitrage from occurring.
11. Assume that a U.S. bond investor has invested in Canadian government bonds. Theduration of a 12-year Canadian government bond is 8.40, and the Canadian countrybeta is 0.63. Interest rates in the United States are expected to change by approximately80 bps. How much can the U.S. investor expect the Canadian bond to change in value ifU.S. rates change by 80 bps?
12. Assume that the spread between U.S. and German bonds is 300 bps, providing Germaninvestors who purchase a U.S. bond with an additional yield income of 75 bps per quarter.The duration of the German bond is 8.3. If German interest rates should decline, howmuch of a decline is required to completely wipe out the quarterly yield advantage for theGerman investor?
13. A portfolio manager of a Canadian fund that invests in the yen-denominated Japanesebonds is considering whether or not to hedge the portfolio’s exposure to the Japaneseyen using a forward contract. Assume that the short-term interest rates are 1.6 percent inJapan and 2.7 percent in Canada.
A. Based on the in-house analysis provided by the fund’s currency specialists, theportfolio manager expects the Japanese yen to appreciate against the Canadian dollar

68 Learning Outcomes, Summary Overview, and Problems
by 1.5 percent. Should the portfolio manager hedge the currency risk using a forwardcontract?
B. What would be your answer if the portfolio manager expects the Japanese yen toappreciate against the Canadian dollar by only 0.5 percent?
14. A British fixed-income fund has substantial holdings in U.S. dollar–denominated bonds.The fund’s portfolio manager is considering whether to leave the fund’s exposure to theU.S. dollar unhedged or to hedge it using a U.K. pound–U.S. dollar forward contract.Assume that the short-term interest rates are 4.7 percent in the United Kingdom and4 percent in the United States. The fund manager expects the U.S. dollar to appreciateagainst the pound by 0.4 percent. Assume interest rate parity (IRP) holds. Explain whichalternative has the higher expected return based on the short-term interest rates and themanager’s expectations about exchange rates.
CHAPTER 7EQUITY PORTFOLIO
MANAGEMENT
Gary L. GastineauETF Consultants LLCSummit, New Jersey
Andrew R. Olma, CFABarclays Global InvestorsSan Francisco, California
Robert G. Zielinski, CFAJapan Advisory
Tokyo, Japan
LEARNING OUTCOMES
After completing this reading, you will be able to do the following:• Discuss the role of equities in the overall portfolio.• Discuss the rationales for passive, active, and semiactive (enhanced index) equity investment
approaches and distinguish among those approaches with respect to expected active returnand tracking risk.
• Recommend an equity investment approach based on an investor’s investment policystatement (IPS) and beliefs concerning market efficiency.
• Distinguish among the predominant weighting schemes used in the construction of majorequity share indices, evaluate the biases of each, and explain the composition of majorequity share indices worldwide.
• Compare and contrast alternative methods for establishing a passive exposure to an equitymarket including indexed separate or pooled accounts, index mutual funds, exchange-tradedfunds, equity index futures, and equity total return swaps.
• Compare and contrast the full replication, stratified sampling, and optimization approachesto constructing an indexed portfolio, and recommend an approach given a description ofthe investment vehicle and the index to be tracked.
69

70 Learning Outcomes, Summary Overview, and Problems
• Explain and illustrate equity investment styles, identify and explain the rationales andprimary concerns of value investors and growth investors and the key risks of those styles, anddemonstrate the difficulties in applying style definitions and distinguishing among styles.
• Discuss, compare, and contrast techniques for identifying investment styles and characterizethe style of an investor given a description of the investor’s security selection method,details on security holdings, or the results of a returns-based style analysis.
• Discuss, compare, and contrast the various methodologies used to construct equity styleindices.
• Explain and interpret the equity style box and evaluate the effects of style drift.• Explain the implementation of a socially responsible investing discipline.• Compare and contrast long–short and long-only investment strategies, including their risks
and potential alphas, and explain why pricing inefficiencies may exist on the short side.• Explain the process of equitizing a long–short portfolio.• Compare and contrast the selling disciplines of active investors.• Contrast derivatives-based and stock-based enhanced indexing strategies, and demonstrate
the fundamental law of active management, including its use to justify enhanced indexing.• Explain and interpret a systematic approach to optimizing allocations to a group of
managers.• Compare and contrast the core-satellite and completeness fund approaches to managing a
portfolio of active managers.• Distinguish among the components of total active return (‘‘true’’ active return and ‘‘misfit’’
active return), their associated risk measures (‘‘true’’ active risk and ‘‘misfit’’ risk), andexplain their relevance for evaluating a portfolio of managers.
• Explain alpha and beta separation as an approach to active management and demonstratethe use of portable alpha.
• Review the due diligence process of identifying, selecting, and contracting with equitymanagers, including the qualitative and quantitative factors in developing a universe ofmanager candidates (such as past performance information) and the use of equity managerquestionnaires and fee schedules (ad valorem and performance based).
• Review the process of structuring equity research and security selection, including top-downand bottom-up security selection processes.
SUMMARY OVERVIEW
Equity portfolio management is not only challenging; for many investors, the skill appliedto it can determine their long-term investment success. This chapter has provided a detailedintroduction to the major concepts and tools that professional equity investors use.
• Equities play a growth role in investment portfolios.• The major investment approaches are passive, active, and semiactive. The major passive
approach is indexing, which is based on the rationale that after costs, the return on theaverage actively managed dollar should be less than the return on the average passivelymanaged dollar. Active management is historically the dominant approach to investmentand is based on the rationale that markets offer opportunities to beat a given equitybenchmark. Semiactive or enhanced indexing is a growing discipline based on the rationalethat markets offer opportunities to achieve a positive information ratio with limited riskrelative to a benchmark.
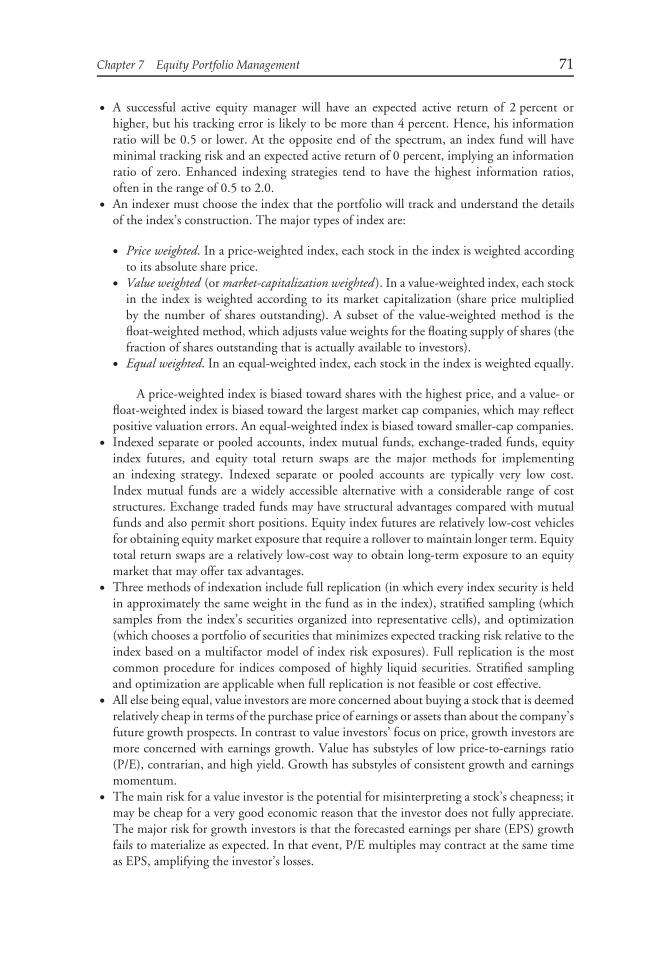
Chapter 7 Equity Portfolio Management 71
• A successful active equity manager will have an expected active return of 2 percent orhigher, but his tracking error is likely to be more than 4 percent. Hence, his informationratio will be 0.5 or lower. At the opposite end of the spectrum, an index fund will haveminimal tracking risk and an expected active return of 0 percent, implying an informationratio of zero. Enhanced indexing strategies tend to have the highest information ratios,often in the range of 0.5 to 2.0.
• An indexer must choose the index that the portfolio will track and understand the detailsof the index’s construction. The major types of index are:
• Price weighted. In a price-weighted index, each stock in the index is weighted accordingto its absolute share price.
• Value weighted (or market-capitalization weighted ). In a value-weighted index, each stockin the index is weighted according to its market capitalization (share price multipliedby the number of shares outstanding). A subset of the value-weighted method is thefloat-weighted method, which adjusts value weights for the floating supply of shares (thefraction of shares outstanding that is actually available to investors).
• Equal weighted. In an equal-weighted index, each stock in the index is weighted equally.
A price-weighted index is biased toward shares with the highest price, and a value- orfloat-weighted index is biased toward the largest market cap companies, which may reflectpositive valuation errors. An equal-weighted index is biased toward smaller-cap companies.
• Indexed separate or pooled accounts, index mutual funds, exchange-traded funds, equityindex futures, and equity total return swaps are the major methods for implementingan indexing strategy. Indexed separate or pooled accounts are typically very low cost.Index mutual funds are a widely accessible alternative with a considerable range of coststructures. Exchange traded funds may have structural advantages compared with mutualfunds and also permit short positions. Equity index futures are relatively low-cost vehiclesfor obtaining equity market exposure that require a rollover to maintain longer term. Equitytotal return swaps are a relatively low-cost way to obtain long-term exposure to an equitymarket that may offer tax advantages.
• Three methods of indexation include full replication (in which every index security is heldin approximately the same weight in the fund as in the index), stratified sampling (whichsamples from the index’s securities organized into representative cells), and optimization(which chooses a portfolio of securities that minimizes expected tracking risk relative to theindex based on a multifactor model of index risk exposures). Full replication is the mostcommon procedure for indices composed of highly liquid securities. Stratified samplingand optimization are applicable when full replication is not feasible or cost effective.
• All else being equal, value investors are more concerned about buying a stock that is deemedrelatively cheap in terms of the purchase price of earnings or assets than about the company’sfuture growth prospects. In contrast to value investors’ focus on price, growth investors aremore concerned with earnings growth. Value has substyles of low price-to-earnings ratio(P/E), contrarian, and high yield. Growth has substyles of consistent growth and earningsmomentum.
• The main risk for a value investor is the potential for misinterpreting a stock’s cheapness; itmay be cheap for a very good economic reason that the investor does not fully appreciate.The major risk for growth investors is that the forecasted earnings per share (EPS) growthfails to materialize as expected. In that event, P/E multiples may contract at the same timeas EPS, amplifying the investor’s losses.

72 Learning Outcomes, Summary Overview, and Problems
• Two major approaches to identifying style are returns-based style analysis, based on portfolioreturns, and holdings-based style analysis based on analysis of security holdings. Returns-based style analysis is quickly executed, cost effective, and requires minimal information.Holdings-based style analysis requires detailed information on security holdings and cangive an up-to-date and detailed picture of a manager’s style. Most current style indices areconstructed using a holdings-based approach.
• The style box is a means of visualizing a manager’s style exposures, which is typically basedon a holdings-based analysis. It may contain as many as nine cells representing a portfolioon value–market-oriented–growth and small–mid–large spectrums.
• Inconsistency in style, or style drift, is of concern to investors because (1) the investormay no longer have exposure to the particular style desired and (2) the manager may beoperating outside her area of expertise.
• A long-only strategy can capture one overall alpha. With a long–short strategy, however,the value added can be equal to two alphas, one from the long position and one fromthe short position. A market-neutral strategy is constructed to have an overall zero beta.Long–short strategies may benefit from pricing inefficiencies on the short side (a greatersupply of overvalued than undervalued securities).
• The Fundamental Law of Active Management states that IR ≈ IC√
Breadth, which impliesthat the information ratio approximately equals what the investor knows about the companymultiplied by the square root of the number of independent active investment decisionsmade each year.
• The framework for optimizing allocations to a group of managers (in this context, equitymanagers within the equity allocation) involves maximizing active return for a given levelof active risk determined by the investor’s aversion to active risk.
• A core-satellite portfolio involves an indexed and/or enhanced indexed core portfolio andactively managed satellite portfolios.
• A completion fund may be used to neutralize unintended bets against the overall equitybenchmark.
• Investment management contracts may involve an ad valorem fee schedule and/or anincentive fee schedule.
• Selecting and monitoring good managers is as complex a process as selecting and managinggood investments.
PROBLEMS
1. Katrina Lowry works for the pension department of National Software. Her supervisorhas asked her to evaluate the different style alternatives for a large-cap mandate and tohighlight their differences.
A. State the three main large-cap styles.B. Describe the basic premise and risks of each style identified in Part A.
2. Juan Varga is concerned about the performance and investment positions of an investmentfirm he hired five years ago. The firm, Galicia Investment Management, has been taskedwith managing an active portfolio with a developed market mandate (MSCI Worldcountries). Galicia is a well-known value manager. Varga performs some returns-basedstyle analysis and finds the following results for the past two years (each quarterly snapshotis the result of a regression using the prior 36 months return data).
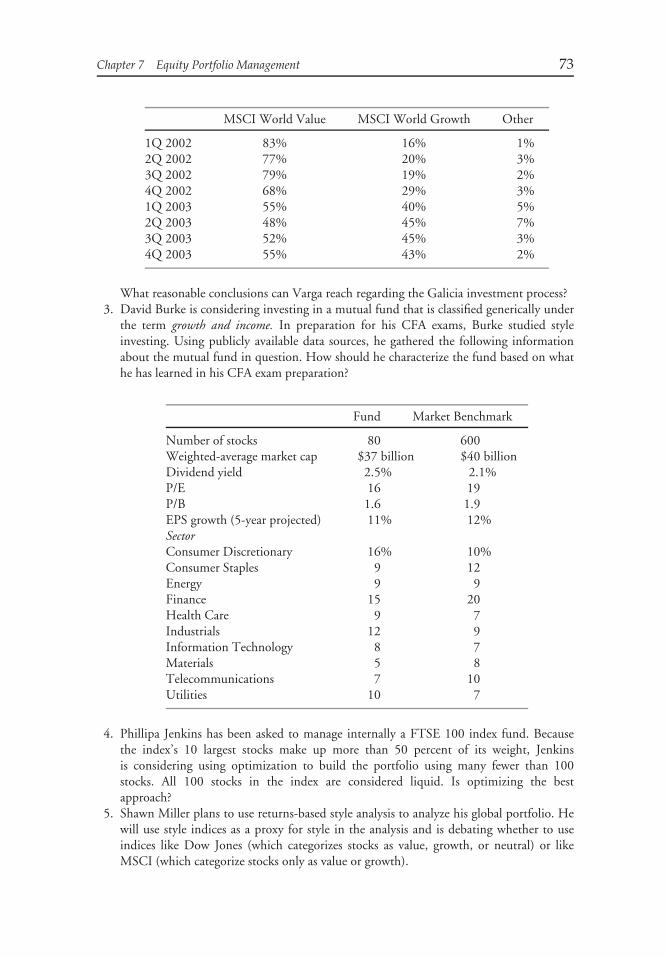
Chapter 7 Equity Portfolio Management 73
MSCI World Value MSCI World Growth Other
1Q 2002 83% 16% 1%2Q 2002 77% 20% 3%3Q 2002 79% 19% 2%4Q 2002 68% 29% 3%1Q 2003 55% 40% 5%2Q 2003 48% 45% 7%3Q 2003 52% 45% 3%4Q 2003 55% 43% 2%
What reasonable conclusions can Varga reach regarding the Galicia investment process?3. David Burke is considering investing in a mutual fund that is classified generically under
the term growth and income. In preparation for his CFA exams, Burke studied styleinvesting. Using publicly available data sources, he gathered the following informationabout the mutual fund in question. How should he characterize the fund based on whathe has learned in his CFA exam preparation?
Fund Market Benchmark
Number of stocks 80 600Weighted-average market cap $37 billion $40 billionDividend yield 2.5% 2.1%P/E 16 19P/B 1.6 1.9EPS growth (5-year projected) 11% 12%SectorConsumer Discretionary 16% 10%Consumer Staples 9 12Energy 9 9Finance 15 20Health Care 9 7Industrials 12 9Information Technology 8 7Materials 5 8Telecommunications 7 10Utilities 10 7
4. Phillipa Jenkins has been asked to manage internally a FTSE 100 index fund. Becausethe index’s 10 largest stocks make up more than 50 percent of its weight, Jenkinsis considering using optimization to build the portfolio using many fewer than 100stocks. All 100 stocks in the index are considered liquid. Is optimizing the bestapproach?
5. Shawn Miller plans to use returns-based style analysis to analyze his global portfolio. Hewill use style indices as a proxy for style in the analysis and is debating whether to useindices like Dow Jones (which categorizes stocks as value, growth, or neutral) or likeMSCI (which categorize stocks only as value or growth).

74 Learning Outcomes, Summary Overview, and Problems
A. What are the benefits and drawbacks of each method?B. Does it matter which type Miller chooses for a returns-based style analysis?
6. Explain the principal benefit of a market-neutral long–short portfolio. What risks areinherent in such a portfolio that a long-only equity portfolio lacks?
7. Simon Hayes is a long–short portfolio manager with Victoria Investment Managementin London. His expertise lies in building market-neutral long–short strategies using U.K.equities. After meeting with his most important client, Hayes learns that the client isplanning to hire an investment firm to manage a Japanese equity portfolio. How canHayes satisfy this mandate using U.K. equities and no Japanese equities?
8. Yoko Suzuki manages an enhanced index portfolio benchmarked to the index for KyushuMotors’ pension fund. The strategy has a target alpha of 1.5 percent annually with anannualized active risk of 2 percent. Her client is quite pleased that the portfolio has metits stated objective for the past five years. Kyushu’s other investment managers have notdone so well against their objectives, however, and the pension fund now suffers from alarge shortfall between its assets and liabilities. To make up this shortfall, Kyushu asks herto double the portfolio’s active risk with the intention of doubling the alpha as well. Howshould Suzuki respond to this suggestion?
9. Mike Smith is a consultant evaluating a market neutral long–short strategy for his client.Based on the holdings data he receives from the client, Smith notices a small but persistentdifference between the alphas generated on the long side and those generated on the shortside. State which of the two alphas is more likely the larger one, and provide three reasonswhy that might be the case.
10. Karen Johnson is responsible for the U.S. equity portion of her company’s pension plan.She is thinking about trying to boost the overall alpha in U.S. equities by using anenhanced index fund to replace her core index fund holding.
A. The U.S. equity portion of the pension plan currently consists of three managers (oneindex, one value, and one growth) and is expected to produce a target annual alpha of2.4 percent with a tracking risk of 2.75 percent. By replacing the index manager withan enhanced indexer the target alpha changes to 2.8 percent with a tracking risk of2.9 percent. Does this change represent an improvement? Why?
B. Johnson also needs to decide whether she prefers a stock-based or a synthetic enhancedindex manager. What are the advantages and disadvantages of each?
11. Stephanie Whitmore is evaluating several alternatives for the U.S. equity portfolio of hercompany’s pension plan, involving the following managers:
Active Risk(with Respect to
Active Return Normal Benchmark) Normal Benchmark
Index 0% 0% Russell 3000Semiactive 1 1.5 Russell 3000Active A (Value) 3 5 Russell 1000 ValueActive B (Growth) 4 6 Russell 1000 GrowthLong–Short 6 6 Cash with Russell
1000 overlay

Chapter 7 Equity Portfolio Management 75
Active A’s misfit risk is 7.13 percent. In all of the questions below, assume that the activereturns are uncorrelated. The overall equity portfolio benchmark is the Russell 3000.
A. Whitmore has taken the information in the table above and used a mean varianceoptimizer to create an implementation efficient frontier. The highest risk point on theefficient frontier is a 100 percent allocation to the long–short manager with a 100percent Russell 1000 overlay. The active risk of this portfolio is 6.1 percent. Why isthe risk greater than 6 percent?
B. Calculate the total active risk for Active A.C. Whitmore’s current equity manager allocation is 30 percent Index and 70 percent
Semiactive. Calculate this portfolio’s current expected active return, active risk, andinformation ratio.
D. After determining the desired level of active risk, Whitmore selected the appropriateportfolio from the efficient frontier. The portfolio allocates 39 percent to the Indexmanager, 34 percent to the Semiactive manager, 7 percent to Active Manager A,8 percent to Active Manager B, and 12 percent to the Long–Short manager. Thisportfolio has an expected active return of 1.59 percent and an expected active riskof 1.10 percent. Does this portfolio represent an improvement over the currentallocation? If so, by how much?
E. Upon further investigation of the long–short manager, Whitmore learns that approx-imately 20 percent of the active return generated comes from equity positions innon-U.S. companies. Is this a concern? Why or why not?
CHAPTER 8ALTERNATIVE
INVESTMENTS PORTFOLIOMANAGEMENT
Jot K. Yau, CFASeattle University
Seattle, Washingtonand
Strategic Options Investment Advisors LtdHong Kong
Thomas SchneeweisAlternative Investment Analytics
Amherst, Massachusetts
Thomas R. Robinson, CFATRRobinson and Associates
Coral Gables, Florida
Lisa R. Weiss, CFABlack Knight Ventures, Inc.
Tampa, Florida
76

Chapter 8 Alternative Investments Portfolio Management 77
LEARNING OUTCOMES
After completing this chapter, you will be able to do the following:
• List and explain the major types of alternative investments.• Characterize the common features of alternative investments and their markets and discuss
how they may be grouped by the role they typically play in a portfolio.• List, explain, and interpret the major due diligence checkpoints in selecting active managers
of alternative investments.• Explain and interpret the special issues that alternative investments raise for investment
advisors of private wealth clients.• Distinguish among the types of investments within alternative investment groups (real
estate, private equity, commodity investments, hedge funds, managed futures, and distressedsecurities).
• Discuss the construction and interpretation of benchmarks, including biases, in alternativeinvestment groups.
• Review the investment characteristics of the major types of investments within alternativeinvestment groups, including risks and liquidity.
• Identify and evaluate, given relevant data, any return enhancement and/or risk-diversifica-tion effects of an alternative investment relative to a comparison portfolio (e.g., one investedin common equity and bonds) and justify any identified benefits in terms of characteristicsand/or market opportunity exploited by the alternative investment.
• Identify and justify any special emphases in due diligence for a given alternative investmentgroup.
• Review the advantages and disadvantages of direct equity investments in real estate.• Identify the major issuers and buyers of venture capital, the stages through which private
companies pass (seed stage through exit), the characteristic sources of financing at eachstage, and the purposes of such financing.
• Compare and contrast venture capital funds and buyout funds.• Discuss the use of convertible preferred stock in direct venture capital investment.• Explain a typical structure of a private equity fund, including the compensation to the
fund’s sponsor (e.g., general partner) and typical timelines.• State and discuss the issues that must be addressed in formulating a strategy for private
equity investment.• Discuss the rationales for indirect versus direct commodity investment.• Calculate and interpret the components of the return to a commodity futures contract and
predict the effects of the term structure of futures prices on the returns earned on a longfutures position.
• Discuss the relationship between commodities and inflation, including distinctions amongtypes of commodities.
• Identify and explain the style classification of a hedge fund, given a description of itsinvestment strategy.
• Explain a typical structure of a hedge fund, including the compensation of the hedge fundmanagers and the rationale for high-water marks and other provisions.
• Explain the rationale and importance of hedge fund incentive fees and the concerns theymay raise for hedge fund investors.
• Explain the advantages and disadvantages of fund-of-funds hedge funds.• Discuss the limitations of using hedge fund indices in analyzing hedge fund performance.

78 Learning Outcomes, Summary Overview, and Problems
• Discuss and illustrate the conventions and special issues involved in hedge fund performanceevaluation and critique the use of the Sharpe ratio in hedge fund performance appraisal.
• Explain the characteristics of derivative markets that affect the investor’s ability to earn arisk premium.
• Demonstrate and explain the major types of distressed securities investing strategies,including the possible reasons for each strategy’s market opportunity.
• Explain event risk, market liquidity risk, market risk, and ‘‘J factor risk’’ as concerns fordistressed securities investors.
SUMMARY OVERVIEW
Alternative investments have become a large portion of the portfolios of both individualand institutional investors. This chapter presented five groups of alternative investments:real estate, private equity, commodities, hedge funds, managed futures, and distressedsecurities.
• Common features of alternative investments include relative illiquidity, which tends tobe associated with a return premium as compensation; diversifying potential relative to aportfolio of stocks and bonds; high due diligence costs; and the difficulty of performanceevaluation.
• Checkpoints in due diligence for alternative investment selection should cover mar-ket opportunity, investment process, organization, people, terms and structure, serviceproviders, documents, and write-up.
• Special concerns for advisers to private wealth clients include tax issues, determiningsuitability, communication with the client, decision risk (the risk of changing strategies atthe point of maximum loss), and concentrated equity positions of the client in a closelyheld company.
• The physical real estate market is characterized by a relative lack of liquidity, large lot size,and high transaction costs.
• Real estate investments can be viewed in terms of direct ownership and indirect ownership.Direct ownership includes investment in residences, business real estate, and agriculturalland. Indirect ownership includes vehicles such as real estate investment trusts (REITs).
• Advantages to real estate investment include tax benefits, the use of leverage, control overproperty, diversification, potential as an inflation hedge, and low volatility of returns.
• Disadvantages to real estate investment include the inability to subdivide real estateinvestments, high information costs, high commissions, maintenance and operating costs,location risk, and political risk related to tax deductions.
• Private equity investments are highly illiquid, and investors must be willing to hold thesesecurities for long periods.
• Private equity investments include start-up companies, middle-market private companies,and private investment in public entities.
• Private equity investors include angel investors, venture capitalists, and larger companies inthe same industry.
• There are two broad approaches to investing in commodities: direct and indirect. Directcommodity investment entails purchase of the physical commodities (e.g., agriculturalproducts, metals, and crude oil). In contrast, indirect investment in commodities involvesthe acquisition of claims on commodities, such as in futures markets.

Chapter 8 Alternative Investments Portfolio Management 79
• Futures contract–based commodity indices have three separate components of return:price, collateral, and roll return.
• Price return derives from changes in commodity futures prices, which comes from thechanges in the underlying spot prices via the cost-of-carry model. In other words, whenthe spot price goes up (down), so does the futures price, giving rise to a positive (negative)return to a long futures position.
• Collateral return is related to the assumption that when an investor invests in the commodityfutures index, the full value of the underlying futures contracts is invested at a risk-freeinterest rate.
• Roll return or roll yield arises from rolling long futures positions forward through timeand may capture a positive return when the term structure of futures prices is downwardsloping.
• The inflation-hedging ability of commodity investing appears to differ according to thecommodity.
• Hedge funds are skill-based investment strategies in various forms, including limitedpartnerships. The funds use different investment strategies and thus are often classifiedaccording to investment style. Within each style category, hedge funds are classifiedaccording to the underlying markets traded or the unique trading style—for example,relative value, event driven, hedged equity, and global macro.
• Within each style classification, there are a number of subgroups. For instance, within thehedge fund relative-value style classification, subgroups include market-neutral long–shortequity, convertible hedging, and fixed-income arbitrage (or bond hedging).
• Hedge funds can provide return and diversification benefits, but the risks are not usuallywell represented by standard deviation.
• Distressed securities are securities of companies that are in financial distress or nearbankruptcy. The securities could be equity, debt, trade, or other claims.
• Distressed securities investment exploits the fact that many investors are unable to holdbelow-investment-grade securities. Furthermore, few analysts cover the distressed market.
• Risks of distressed securities investing include event risk, ‘‘judge’’ factor risk, liquidity risk,market risk, and other risks.
PROBLEMS
1. Compare the relative liquidity characteristics of direct versus indirect investment in realestate. Discuss three factors that affect the liquidity of both forms of investment.
Problems 2 and 3 refer to Exhibit 8-1.
2. A. Summarize the major categories of direct and indirect investment in real estate.B. Using the data in Exhibit 8-1, evaluate the historical relative diversification benefits
of both forms of investment when added to a 50 percent stock/50 percent bondportfolio. Use the National Council of Real Estate Investment Fiduciaries (NCREIF)Index unsmoothed to represent direct investment and the National Association ofReal Estate Investment Trusts (NAREIT) Index to represent indirect investment.
3. The board trustees of Elite Corporation’s US$50 million pension fund are meetingto discuss a presentation they recently received from their pension consultant, whois recommending that they diversify their current 50/50 stock/bond asset allocationto include a 10 percent allocation to real estate. Although the trustees would like to
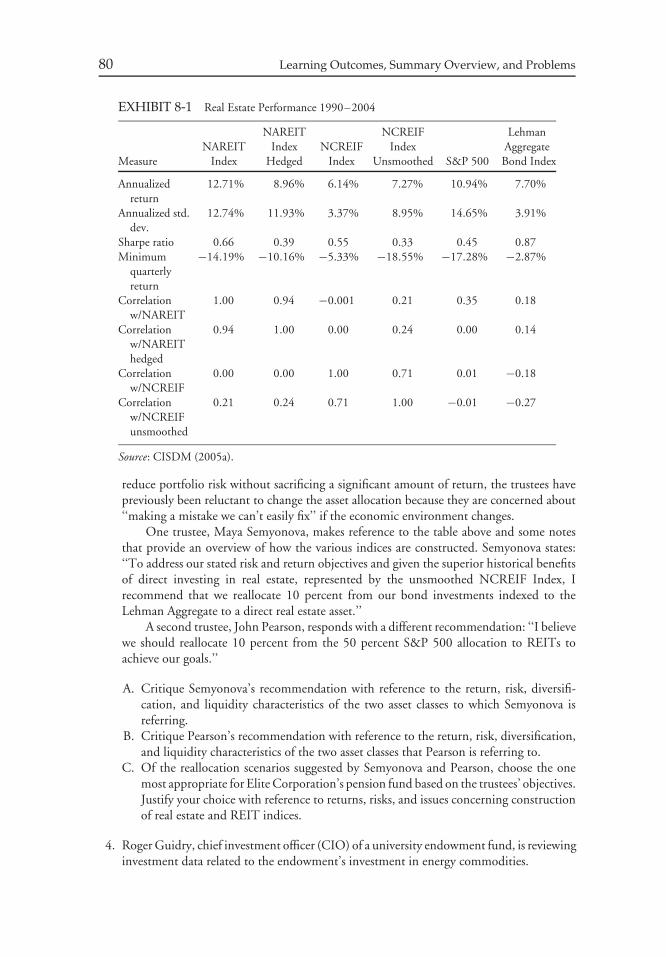
80 Learning Outcomes, Summary Overview, and Problems
EXHIBIT 8-1 Real Estate Performance 1990–2004
NAREIT NCREIF LehmanNAREIT Index NCREIF Index Aggregate
Measure Index Hedged Index Unsmoothed S&P 500 Bond Index
Annualizedreturn
12.71% 8.96% 6.14% 7.27% 10.94% 7.70%
Annualized std.dev.
12.74% 11.93% 3.37% 8.95% 14.65% 3.91%
Sharpe ratio 0.66 0.39 0.55 0.33 0.45 0.87Minimum
quarterlyreturn
−14.19% −10.16% −5.33% −18.55% −17.28% −2.87%
Correlationw/NAREIT
1.00 0.94 −0.001 0.21 0.35 0.18
Correlationw/NAREIThedged
0.94 1.00 0.00 0.24 0.00 0.14
Correlationw/NCREIF
0.00 0.00 1.00 0.71 0.01 −0.18
Correlationw/NCREIFunsmoothed
0.21 0.24 0.71 1.00 −0.01 −0.27
Source: CISDM (2005a).
reduce portfolio risk without sacrificing a significant amount of return, the trustees havepreviously been reluctant to change the asset allocation because they are concerned about‘‘making a mistake we can’t easily fix’’ if the economic environment changes.
One trustee, Maya Semyonova, makes reference to the table above and some notesthat provide an overview of how the various indices are constructed. Semyonova states:‘‘To address our stated risk and return objectives and given the superior historical benefitsof direct investing in real estate, represented by the unsmoothed NCREIF Index, Irecommend that we reallocate 10 percent from our bond investments indexed to theLehman Aggregate to a direct real estate asset.’’
A second trustee, John Pearson, responds with a different recommendation: ‘‘I believewe should reallocate 10 percent from the 50 percent S&P 500 allocation to REITs toachieve our goals.’’
A. Critique Semyonova’s recommendation with reference to the return, risk, diversifi-cation, and liquidity characteristics of the two asset classes to which Semyonova isreferring.
B. Critique Pearson’s recommendation with reference to the return, risk, diversification,and liquidity characteristics of the two asset classes that Pearson is referring to.
C. Of the reallocation scenarios suggested by Semyonova and Pearson, choose the onemost appropriate for Elite Corporation’s pension fund based on the trustees’ objectives.Justify your choice with reference to returns, risks, and issues concerning constructionof real estate and REIT indices.
4. Roger Guidry, chief investment officer (CIO) of a university endowment fund, is reviewinginvestment data related to the endowment’s investment in energy commodities.
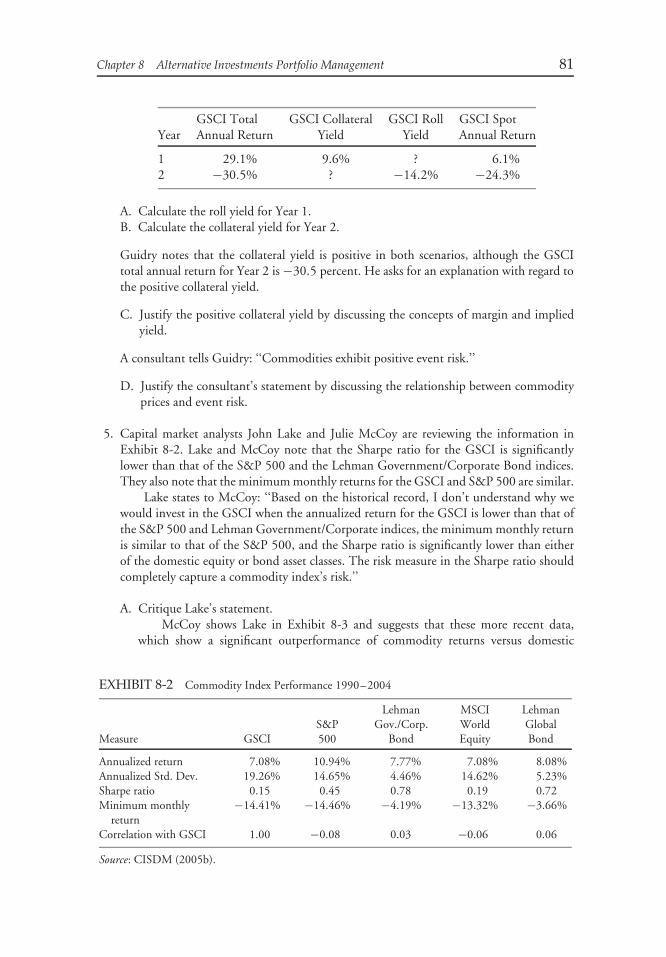
Chapter 8 Alternative Investments Portfolio Management 81
GSCI Total GSCI Collateral GSCI Roll GSCI SpotYear Annual Return Yield Yield Annual Return
1 29.1% 9.6% ? 6.1%2 −30.5% ? −14.2% −24.3%
A. Calculate the roll yield for Year 1.B. Calculate the collateral yield for Year 2.
Guidry notes that the collateral yield is positive in both scenarios, although the GSCItotal annual return for Year 2 is −30.5 percent. He asks for an explanation with regard tothe positive collateral yield.
C. Justify the positive collateral yield by discussing the concepts of margin and impliedyield.
A consultant tells Guidry: ‘‘Commodities exhibit positive event risk.’’
D. Justify the consultant’s statement by discussing the relationship between commodityprices and event risk.
5. Capital market analysts John Lake and Julie McCoy are reviewing the information inExhibit 8-2. Lake and McCoy note that the Sharpe ratio for the GSCI is significantlylower than that of the S&P 500 and the Lehman Government/Corporate Bond indices.They also note that the minimum monthly returns for the GSCI and S&P 500 are similar.
Lake states to McCoy: ‘‘Based on the historical record, I don’t understand why wewould invest in the GSCI when the annualized return for the GSCI is lower than that ofthe S&P 500 and Lehman Government/Corporate indices, the minimum monthly returnis similar to that of the S&P 500, and the Sharpe ratio is significantly lower than eitherof the domestic equity or bond asset classes. The risk measure in the Sharpe ratio shouldcompletely capture a commodity index’s risk.’’
A. Critique Lake’s statement.McCoy shows Lake in Exhibit 8-3 and suggests that these more recent data,
which show a significant outperformance of commodity returns versus domestic
EXHIBIT 8-2 Commodity Index Performance 1990–2004
Lehman MSCI LehmanS&P Gov./Corp. World Global
Measure GSCI 500 Bond Equity Bond
Annualized return 7.08% 10.94% 7.77% 7.08% 8.08%Annualized Std. Dev. 19.26% 14.65% 4.46% 14.62% 5.23%Sharpe ratio 0.15 0.45 0.78 0.19 0.72Minimum monthly
return−14.41% −14.46% −4.19% −13.32% −3.66%
Correlation with GSCI 1.00 −0.08 0.03 −0.06 0.06
Source: CISDM (2005b).
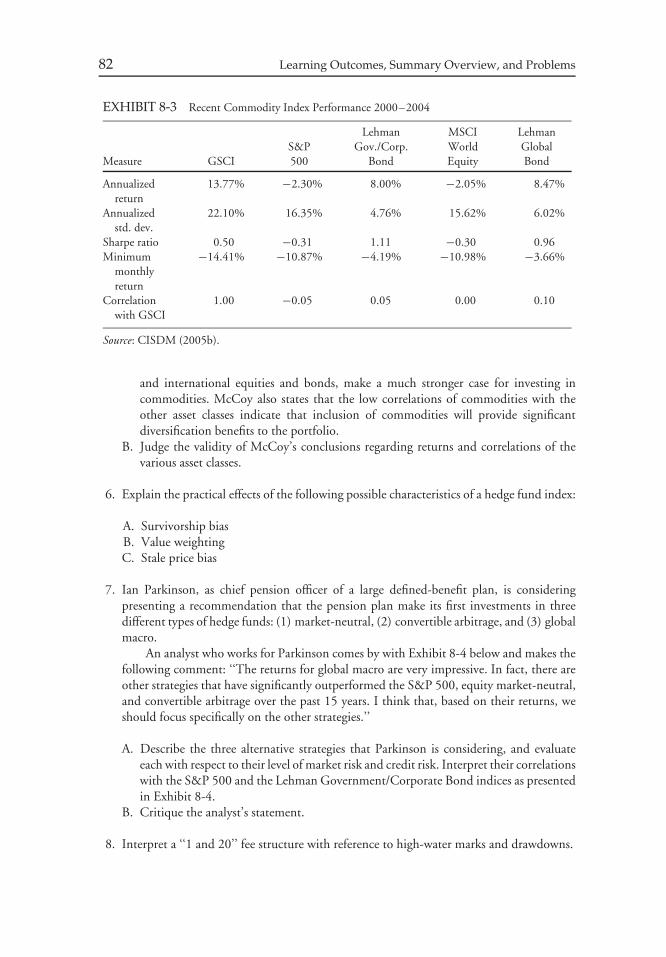
82 Learning Outcomes, Summary Overview, and Problems
EXHIBIT 8-3 Recent Commodity Index Performance 2000–2004
Lehman MSCI LehmanS&P Gov./Corp. World Global
Measure GSCI 500 Bond Equity Bond
Annualizedreturn
13.77% −2.30% 8.00% −2.05% 8.47%
Annualizedstd. dev.
22.10% 16.35% 4.76% 15.62% 6.02%
Sharpe ratio 0.50 −0.31 1.11 −0.30 0.96Minimum
monthlyreturn
−14.41% −10.87% −4.19% −10.98% −3.66%
Correlationwith GSCI
1.00 −0.05 0.05 0.00 0.10
Source: CISDM (2005b).
and international equities and bonds, make a much stronger case for investing incommodities. McCoy also states that the low correlations of commodities with theother asset classes indicate that inclusion of commodities will provide significantdiversification benefits to the portfolio.
B. Judge the validity of McCoy’s conclusions regarding returns and correlations of thevarious asset classes.
6. Explain the practical effects of the following possible characteristics of a hedge fund index:
A. Survivorship biasB. Value weightingC. Stale price bias
7. Ian Parkinson, as chief pension officer of a large defined-benefit plan, is consideringpresenting a recommendation that the pension plan make its first investments in threedifferent types of hedge funds: (1) market-neutral, (2) convertible arbitrage, and (3) globalmacro.
An analyst who works for Parkinson comes by with Exhibit 8-4 below and makes thefollowing comment: ‘‘The returns for global macro are very impressive. In fact, there areother strategies that have significantly outperformed the S&P 500, equity market-neutral,and convertible arbitrage over the past 15 years. I think that, based on their returns, weshould focus specifically on the other strategies.’’
A. Describe the three alternative strategies that Parkinson is considering, and evaluateeach with respect to their level of market risk and credit risk. Interpret their correlationswith the S&P 500 and the Lehman Government/Corporate Bond indices as presentedin Exhibit 8-4.
B. Critique the analyst’s statement.
8. Interpret a ‘‘1 and 20’’ fee structure with reference to high-water marks and drawdowns.

Chapter 8 Alternative Investments Portfolio Management 83
EXHIBIT 8-4 Performance of Hedge Fund Strategies and Traditional Assets 1990–2004
CorrelationAnnual Minimum Correlation with Lehman
Annual Standard Sharpe Monthly with Gov./Corp.Fund or Asset Return Deviation Ratio Return S&P 500 Bond
HFCI 13.46% 5.71% 1.61 6.92% 0.59 0.17Event driven 13.46% 5.59% 1.64 −9.37% 0.59 0.07Equity hedge 15.90% 9.34% 1.24 −9.70% 0.64 0.10Equity
marketneutral
9.24% 2.50% 1.98 −1.07% 0.09 0.24
Merger/riskarbitrage
9.07% 4.86% 0.99 −8.78% 0.48 0.10
Distressed 15.28% 6.07% 1.81 −9.71% 0.42 0.04Fixed-income
arbitrage7.62% 3.61% 0.92 −6.61% 0.06 −0.06
Convertiblearbitrage
10.23% 3.96% 1.50 −3.42% 0.19 0.13
Global macro 16.98% 8.38% 1.51 −5.41% 0.26 0.34Short selling −0.61% 19.39% −0.25 −14.62% −0.76 −0.01S&P 500 10.94% 14.65% 0.45 −14.46% 1.00 0.13Lehman
Gov./Corp.Bond
7.77% 4.46% 0.78 −4.19% 0.13 1.00
MSCI World 7.08% 14.62% 0.19 −13.32% 0.86 0.09Lehman
GlobalBond
8.09% 5.23% 0.73 −3.66% 0.11 0.74
Note: HFCI is the Hedge Fund Composite Index and was constructed by equally weighting theEACM 100, the HFR Fund Weighted Composite Index, and Credit Suisse/Tremont Hedge FundIndex.Source: CISDM (2005c).
9. Susan DiMarco is evaluating a hedge fund that has a high level of portfolio turnover anda short investment record. The hedge fund makes a contractual stipulation with limitedpartners regarding a lock-up period that is quite common in the hedge fund industry.A colleague, Jane Farkas, who has reviewed the fund, makes the following statement toDiMarco: ‘‘Well, if we’re unhappy with performance, we can always fire the hedge fundmanager. If they trade frequently, as indicated by their high portfolio turnover, they musthave high liquidity.’’ Judge the validity of Carr’s statement.
10. Jane Farkas tells Susan DiMarco that she has seen exciting data on the performance ofmarket-neutral, convertible arbitrage, and global macro hedge funds. Farkas states: ‘‘TheSharpe ratios of all of these hedge fund strategies are much higher than for traditionalequities or bonds, which means they have a great risk/return profile. We should definitelyplan a major investment in hedge funds.’’
DiMarco responds: ‘‘There are several reasons that the Sharpe ratio may be mis-leading.’’

84 Learning Outcomes, Summary Overview, and Problems
A. Discuss the situations that could cause an upward bias in the calculation of the Sharperatio.
B. Evaluate the reasons that statistically indicate that the Sharpe ratio is not the mostappropriate measure of risk for hedge funds.
For Problems 11 and 12, please refer to the following table of monthly returnsfor a hedge fund and an index portfolio. For the purpose of computation, the hurdlerate is the U.S. T-bill rate, assumed to be 5 percent per year.
Month Hedge Fund Returns (%) Index Returns (%)
January 3.50 −2.40February 4.00 −4.00March −2.00 −1.60April −2.00 3.00May −1.00 −4.20June 0.90 2.00July −1.00 2.50August 1.70 −2.10September 2.70 −2.00October 3.70 0.50November 0.40 3.10December −3.20 0.20
11. A. Calculate the average rolling returns for the hedge fund if the investor’s investmenthorizon is nine months.
B. Explain how rolling returns can provide additional information about the hedge fund’sperformance.
12. A. Compute the annualized downside deviations for the hedge fund and the index, andcontrast them to the standard deviation. The annualized standard deviations for thehedge fund and the index are, respectively, 8.64 percent and 9.19 percent.
B. Compute the Sortino ratio and, based on this statistic, evaluate the performance ofthe hedge fund against the performance of the index portfolio.
13. Andrew Cassano, CIO of a large charitable organization, is meeting with his senior analyst,Lori Wood, to discuss managed futures. Cassano believes that it would be beneficial toevaluate this alternative investment category before making a final decision with respectto hedge fund investment.
Wood states: ‘‘Although managed futures are sometimes considered a subset of hedgefunds, there are some differences that make them worthy of consideration.’’
A. Determine which absolute-return hedge fund strategy to which managed futures aremostly closely related (i.e., managed futures are often considered a subgroup of thishedge fund strategy).
B. Briefly discuss a primary similarity and a primary difference between managed futuresand many other hedge fund strategies.
C. Contrast the characteristics of two managed futures styles: systematic and discretionary.

Chapter 8 Alternative Investments Portfolio Management 85
14. Cassano asks: ‘‘If managed futures strategies are often momentum based, how do theyachieve excess returns differently from traditional stock or bond investment vehicles?’’Formulate an answer to Cassano’s question.
15. List and discuss the sources of return available to managed futures programs through theuse of derivative trading strategies.
16. Contrast ‘‘fallen angels’’ to high-yield debt.17. Evaluate the role of investors in both the private equity and relative-value strate-
gies—specifically, with respect to investing in distressed securities.18. Formulate a description of the results of a prepackaged bankruptcy with reference to
(a) ‘‘prebankruptcy’’ creditors of the company, (b) ‘‘prebankruptcy’’ shareholders, and(c) vulture investors.
19. Critique the following statement: ‘‘When the economy has been faltering and may begoing into recession, it is typically a good time to invest in distressed securities.’’

CHAPTER 9RISK MANAGEMENT
Don M.Chance, CFALouisiana State University
Baton Rouge, Louisiana
Kenneth GrantCheyne Capital
New York, New York
John Marsland, CFAWMG Advisors LLP
London, England
LEARNING OUTCOMES
After completing this chapter, you will be able to do the following:
• Compare and contrast the main features of the risk management process, risk governance,risk reduction, and an enterprise risk management system.
• Recommend and justify the risk exposures an analyst should report as part of an enterpriserisk management system, given a description of the company’s business.
• Evaluate the strengths and weaknesses of a company’s risk management processes.• Evaluate possible responses to a risk management problem.• Interpret value at risk (VaR) and its role in measuring overall and individual position
market risk.• Compare and contrast the analytical (variance–covariance), historical, and Monte Carlo
methods for estimating VaR and discuss the advantages and disadvantages of each.• Discuss the advantages and limitations of VaR and extension and supplements to it (e.g.,
cash flow at risk, earnings at risk, tail value at risk).• Compare and contrast the various types of stress testing and discuss the advantages and
disadvantages of each.• Evaluate the results of stress tests.
86

Chapter 9 Risk Management 87
• Evaluate a company’s or a portfolio’s exposures to market risk.• Evaluate the credit risk of a position, including forward contract, swap, and option
positions.• Evaluate a company’s or a portfolio’s exposures to nonfinancial risk.• Demonstrate the use of risk budgeting, position limits, and other methods for managing
market risk.• Demonstrate the use of the following methods of managing credit risk: limiting exposure,
marking to market, using collateral, using netting arrangements, setting credit standards,and using credit derivatives.
• Compare and contrast the Sharpe ratio, risk-adjusted return on capital, return overmaximum drawdown, and the Sortino ratio as measures of risk-adjusted performance.
• Demonstrate the use of VaR and stress testing in setting capital requirements.
SUMMARY OVERVIEW
Financial markets reward competence and knowledge in risk management and punishmistakes. Portfolio managers must therefore study and understand the discipline of successfulrisk management. In this chapter, we have introduced basic concepts and techniques of riskmanagement and made the following points:
• Risk management is a process involving the identification of the exposures to risk, theestablishment of appropriate ranges for exposures, the continuous measurement of theseexposures, and the execution of appropriate adjustments to bring the actual level and desiredlevel of risk into alignment. The process involves continuous monitoring of exposures andnew policies, preferences, and information.
• Typically, risks should be minimized wherever and whenever companies lack comparativeadvantages in the associated markets, activities, or lines of business.
• Risk governance refers to the process of setting risk management policies and standards foran organization. Senior management, which is ultimately responsible for all organizationalactivities, must oversee the process.
• Enterprise risk management is a centralized risk management system whose distinguishingfeature is a firmwide or across-enterprise perspective on risk.
• Financial risk refers to all risks derived from events in the external financial markets.Nonfinancial risk refers to all other forms of risk. Financial risk includes market risk (riskrelated to interest rates, exchange rates, stock prices, and commodity prices), credit risk,and liquidity risk. The primary sources of nonfinancial risk are operations risk, model risk,settlement risk, regulatory risk, legal risk, tax risk, and accounting risk.
• Traditional measures of market risk include linear approximations such as beta for stocks,duration for fixed income, and delta for options, as well as second-order estimationtechniques such as convexity and gamma. For products with option-like characteristics,techniques exist to measure the impact of changes in volatility (vega) and the passage oftime (theta). Sensitivity to movements in the correlation among assets is also relevant forcertain types of instruments.
• VaR estimates the minimum loss that a party would expect to experience with a givenprobability over a specified period of time. Using the complementary probability (i.e.,100 percent minus the given probability stated as a percent), VaR can be expressed asa maximum loss at a given confidence level. VaR users must make decisions regardingappropriate time periods, confidence intervals, and specific VaR methodologies.

88 Learning Outcomes, Summary Overview, and Problems
• The analytical or variance–covariance method can be used to determine VaR under theassumption that returns are normally distributed by subtracting a multiple of the standarddeviation from the expected return, where the multiple is determined by the desiredprobability level. The advantage of the method is its simplicity. Its disadvantages are thatreturns are not normally distributed in any reliable sense and that the method does notwork well when portfolios contain options and other derivatives.
• The historical method estimates VaR from data on a portfolio’s performance during ahistorical period. The returns are ranked, and VaR is obtained by determining the returnthat is exceeded in a negative sense 5 percent or 1 percent (depending on the user’s choice)of the time. The historical method has the advantage of being simple and not requiring theassumption of a normal distribution. Its disadvantage is that accurate historical time-seriesinformation is not always easily available, particularly for instruments such as bonds andoptions, which behave differently at different points in their life spans.
• Monte Carlo simulation estimates VaR by generating random returns and determiningthe 5 percent or 1 percent (depending on the user’s choice) worst outcomes. It hasthe advantages that it does not require a normal distribution and can handle complexrelationships among risks. Its disadvantage is that it can be very time consuming and costlyto conduct the large number of simulations required for accuracy. It also requires theestimation of input values, which can be difficult.
• VaR can be difficult to estimate, can give a wide range of values, and can lead to a false senseof security that risk is accurately measured and under control. VaR for individual positionsdo not generally aggregate in a simple way to portfolio VaR. VaR also puts all emphasis onthe negative outcomes, ignoring the positive outcomes. It can be difficult to calculate VaRfor a large complex organization with many exposures. On the other hand, VaR is a simpleand easy-to-understand risk measure that is widely accepted. It is also adaptable to a varietyof uses, such as allocating capital.
• Incremental VaR measures the incremental effect of an asset on the VaR of a portfolio.Cash flow at risk and earnings at risk measure the risk to a company’s cash flow or earningsinstead of market value, as in the case of VaR. Tail value at risk is VaR plus the expectedloss in excess of VaR, when such excess loss occurs. Stress testing is another importantsupplement to VaR.
• Credit risk has two dimensions, the probability of default and the associated recovery rate.• Credit risk in a forward contract is assumed by the party to which the market value is
positive. The market value represents the current value of the claim that one party has onthe other. The actual payoff at expiration could differ, but the market value reflects thecurrent value of that future claim.
• Credit risk in swaps is similar to credit risk in forward contracts. The market value representsthe current value of the claim on the future payments. The party holding the positivemarket value assumes the credit risk at that time. For interest rate and equity swaps, creditrisk is greatest near the middle of the life of the swap. For currency swaps with payment ofnotional principal, credit risk is greatest near the end of the life of the swap.
• Credit risk in options is one-sided. Because the seller is paid immediately and in full, shefaces no credit risk. By contrast, the buyer faces the risk that the seller will not meet herobligations in the event of exercise. The market value of the option is the current value ofthe future claim the buyer has on the seller.
• VaR can be used to measure credit risk. The interpretation is the same as with standardVaR, but a credit-based VaR is more complex because it must interact with VaR basedon market risk. Credit risk arises only when market risk results in gains to trading. Credit
Chapter 9 Risk Management 89
VaR must take into account the complex interaction of market movements, the possibilityof default, and recovery rates. Credit VaR is also difficult to aggregate across markets andcounterparties.
• Risk budgeting is the process of establishing policies to allocate the finite resource of riskcapacity to business units that must assume exposure in order to generate return. Riskbudgeting has also been applied to allocation of funds to investment managers.
• The various methods of controlling credit risk include setting exposure limits for individualcounterparties, exchanging cash values that reflect mark-to-market levels, posting collateral,netting, setting minimum credit, using special-purpose vehicles that have higher creditratings than the companies that own them, and using credit derivatives.
• Among the measures of risk-adjusted performance that have been used in a portfolio contextare the Sharpe ratio, risk-adjusted return on capital, return over maximum drawdown, andthe Sortino ratio. The Sharpe ratio uses standard deviation, measuring total risk as therisk measure. Risk-adjusted return on capital accounts for risk using capital at risk. TheSortino ratio measures risk using downside deviation, which computes volatility using onlyrate-of-return data points below a minimum acceptable return. Return over maximumdrawdown uses maximum drawdown as a risk measure.
• Methods for allocating capital include nominal position limits, VaR-based position limits,maximum loss limits, internal capital requirements, and regulatory capital requirements.
PROBLEMS
1. Discuss the difference between centralized and decentralized risk management systems,including the advantages and disadvantages of each.
2. Stewart Gilchrist follows the automotive industry, including Ford Motor Company.Based on Ford’s 2003 annual report, Gilchrist writes the following summary:
Ford Motor Company has businesses in several countries around the world. Fordfrequently has expenditures and receipts denominated in non-U.S. currencies, includingpurchases and sales of finished vehicles and production parts, subsidiary dividends,investments in non-U.S. operations, etc. Ford uses a variety of commodities in theproduction of motor vehicles, such as nonferrous metals, precious metals, ferrous alloys,energy, and plastics/resins. Ford typically purchases these commodities from outsidesuppliers. To finance its operations, Ford uses a variety of funding sources, such ascommercial paper, term debt, and lines of credit from major commercial banks. Thecompany invests any surplus cash in securities of various types and maturities, the valueof which are subject to fluctuations in interest rates. Ford has a credit division, whichprovides financing to customers wanting to purchase Ford’s vehicles on credit. Overall,Ford faces several risks. To manage some of its risks, Ford invests in fixed-incomeinstruments and derivative contracts. Some of these investments do not rely on a clearinghouse and instead effect settlement through the execution of bilateral agreements.
Based on the above discussion, recommend and justify the risk exposures that shouldbe reported as part of an Enterprise Risk Management System for Ford Motor Company.
3. NatWest Markets (NWM) was the investment banking arm of National WestminsterBank, one of the largest banks in the United Kingdom. On February 28, 1997, NWMrevealed that a substantial loss had been uncovered in its trading books. During the 1990s,NatWest was engaged in trading interest rate options and swaptions on several underlyingcurrencies. This trading required setting appropriate prices of the options by the traders

90 Learning Outcomes, Summary Overview, and Problems
at NatWest. A key parameter in setting the price of an interest rate option is the impliedvolatility of the underlying asset—that is, the interest rate on a currency. In contrastto other option parameters that affect the option prices, such as duration to maturityand exercise price, implied volatility is not directly observable and must be estimated.Many option pricing models imply that the implied volatility should be the same forall options on the same underlying, irrespective of their exercise price or maturity. Inpractice, however, implied volatility is often observed to have a curvilinear relationshipwith the option’s moneyness (i.e., whether the option is out of the money, at the money,or in the money), a relationship sometimes called the volatility smile. Implied volatilitytended to be higher for out-of-the-money options than for at-the-money options on thesame underlying.
NWM prices on certain contracts tended to consistently undercut market prices, asif the out-of-the money options were being quoted at implied volatilities that were toolow. When trading losses mounted in an interest rate option contract, a trader undertooka series of off-market-price transactions between the options portfolio and a swaptionsportfolio to transfer the losses to a type of contract where losses were easier to conceal.A subsequent investigation revealed that the back office did not independently value thetrading positions in question and that lapses in trade reconciliation had occurred.
What type or types of risk were inadequately managed in the above case?4. Sue Ellicott supervises the trading function at an asset management firm. In conducting
an in-house risk management training session for traders, Ellicott elicits the followingstatements from traders:
• Trader 1. ‘‘Liquidity risk is not a major concern for buyers of a security as opposed tosellers.’’
• Trader 2: ‘‘In general, derivatives can be used to substantially reduce the liquidity riskof a security.’’
Ellicott and the traders then discuss two recent cases of a similar risk exposure in anidentical situation that one trader (Trader A) hedged and another trader (Trader B)assumed as a speculation. A participant in the discussion makes the following statementconcerning the contrasting treatment:
• Trader 3: ‘‘Our traders have considerable experience and expertise in analyzing the risk,and this risk is related to our business. Trader B was justified in speculating on the riskwithin the limits of his risk allocation.’’
State and justify whether each trader’s statement is correct or incorrect.5. A large trader on the government bond desk of a major bank loses ¤20 million in a year,
in the process reducing the desk’s overall profit to ¤10 million. Senior management, onlooking into the problem, determines that the trader repeatedly violated his position limitsduring the year. They also determine that the bulk of the loss took place in the last twoweeks of the year, when the trader increased his position dramatically and experienced80 percent of his negative performance. The bank dismisses both the trader and his deskmanager. The bank has an asymmetric incentive compensation contract arrangement withits traders.
A. Discuss the performance netting risk implications of this scenario.B. Are there any reasons why the timing of the loss is particularly significant?C. What mistakes did senior management make? Explain how these errors can be
corrected.

Chapter 9 Risk Management 91
6. Ford Credit is the branch of Ford Motor Company that provides financing to Ford’scustomers. For this purpose, it obtains funding from various sources. As a result of itsinterest rate risk management process, including derivatives, Ford Credit’s debt repricesfaster than its assets. This situation means that when interest rates are rising, the interestrates paid on Ford Credit’s debt will increase more rapidly than the interest rates earnedon assets, thereby initially reducing Ford Credit’s pretax net interest income. The reversewill be true when interest rates decline.
Ford’s annual report provides a quantitative measure of the sensitivity of Ford Credit’spretax net interest income to changes in interest rates. For this purpose, it uses interestrate scenarios that assume a hypothetical, instantaneous increase or decrease in interestrates of 1 percentage point across all maturities. These scenarios are compared with a basecase that assumes that interest rates remain constant at existing levels. The differencesbetween the scenarios and the base case over a 12-month period represent an estimate ofthe sensitivity of Ford Credit’s pretax net interest income. This sensitivity as of year-end2003 and 2002 is as follows:
Pretax net interest Pretax net interestincome impact given income impact givena 1 percentage point a 1 percentage point
instantaneous increase instantaneous decreasein interest rates in interest rates
(in millions) (in millions)
December 31, 2003 ($179) $179December 31, 2002 ($153) $156
Source: Annual Report of Ford Motor Company, 2003.
Describe the strengths and weaknesses of the interest rate risk analysis presented inthe foregoing table.
7. A. An organization’s risk management function has computed that a portfolio held inone business unit has a 1 percent weekly VaR of £4.25 million. Describe what ismeant in terms of a minimum loss.
B. The portfolio of another business unit has a 99 percent weekly VaR of £4.25 million(stated using a confidence limit approach). Describe what is meant in terms of amaximum loss.
8. Each of the following statements about VaR is true except:
A. VaR is the loss that would be exceeded with a given probability over a specific timeperiod.
B. Establishing a VaR involves several decisions, such as the probability and time periodover which the VaR will be measured and the technique to be used.
C. VaR will be larger when it is measured at 5 percent probability than when it ismeasured at 1 percent probability.
D. VaR will be larger when it is measured over a month than when it is measured overa day.
9. Suppose you are given the following sample probability distribution of annual returns ona portfolio with a market value of $10 million.
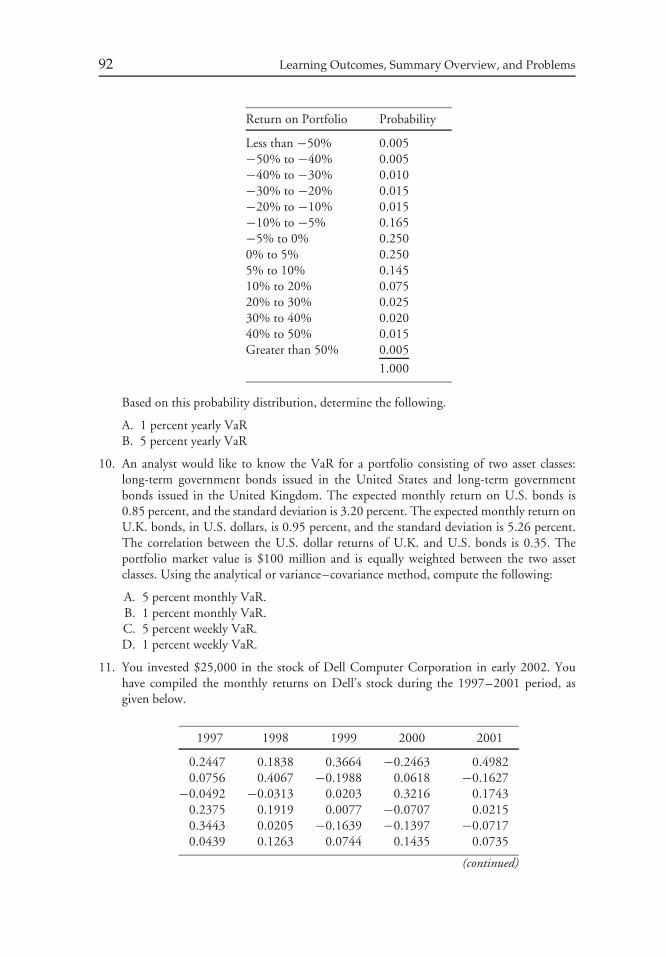
92 Learning Outcomes, Summary Overview, and Problems
Return on Portfolio Probability
Less than −50% 0.005−50% to −40% 0.005−40% to −30% 0.010−30% to −20% 0.015−20% to −10% 0.015−10% to −5% 0.165−5% to 0% 0.2500% to 5% 0.2505% to 10% 0.14510% to 20% 0.07520% to 30% 0.02530% to 40% 0.02040% to 50% 0.015Greater than 50% 0.005
1.000
Based on this probability distribution, determine the following.
A. 1 percent yearly VaRB. 5 percent yearly VaR
10. An analyst would like to know the VaR for a portfolio consisting of two asset classes:long-term government bonds issued in the United States and long-term governmentbonds issued in the United Kingdom. The expected monthly return on U.S. bonds is0.85 percent, and the standard deviation is 3.20 percent. The expected monthly return onU.K. bonds, in U.S. dollars, is 0.95 percent, and the standard deviation is 5.26 percent.The correlation between the U.S. dollar returns of U.K. and U.S. bonds is 0.35. Theportfolio market value is $100 million and is equally weighted between the two assetclasses. Using the analytical or variance–covariance method, compute the following:
A. 5 percent monthly VaR.B. 1 percent monthly VaR.C. 5 percent weekly VaR.D. 1 percent weekly VaR.
11. You invested $25,000 in the stock of Dell Computer Corporation in early 2002. Youhave compiled the monthly returns on Dell’s stock during the 1997–2001 period, asgiven below.
1997 1998 1999 2000 2001
0.2447 0.1838 0.3664 −0.2463 0.49820.0756 0.4067 −0.1988 0.0618 −0.1627
−0.0492 −0.0313 0.0203 0.3216 0.17430.2375 0.1919 0.0077 −0.0707 0.02150.3443 0.0205 −0.1639 −0.1397 −0.07170.0439 0.1263 0.0744 0.1435 0.0735
(continued)
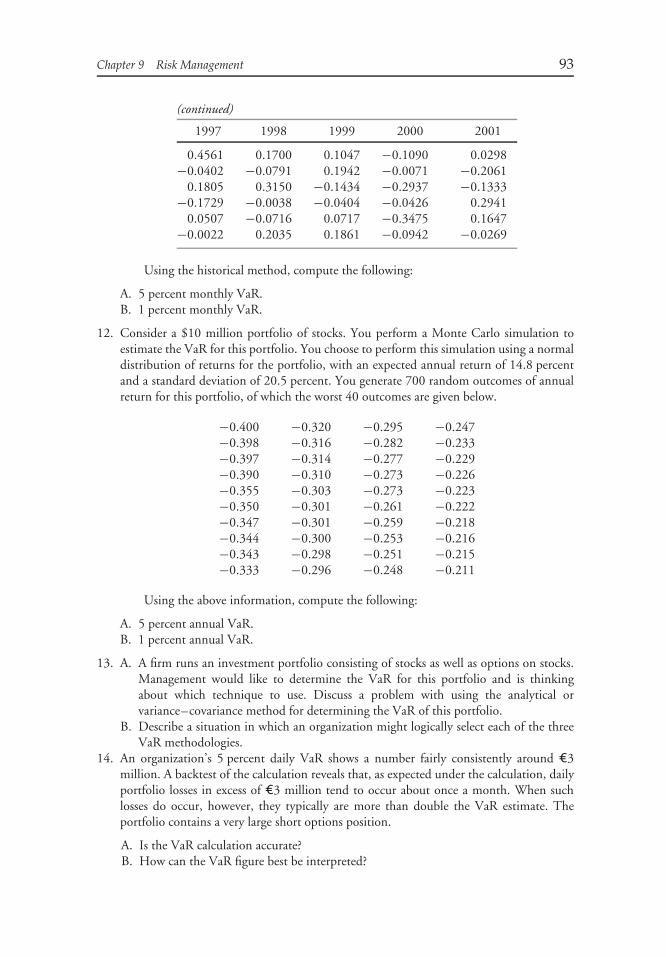
Chapter 9 Risk Management 93
(continued)
1997 1998 1999 2000 2001
0.4561 0.1700 0.1047 −0.1090 0.0298−0.0402 −0.0791 0.1942 −0.0071 −0.2061
0.1805 0.3150 −0.1434 −0.2937 −0.1333−0.1729 −0.0038 −0.0404 −0.0426 0.2941
0.0507 −0.0716 0.0717 −0.3475 0.1647−0.0022 0.2035 0.1861 −0.0942 −0.0269
Using the historical method, compute the following:
A. 5 percent monthly VaR.B. 1 percent monthly VaR.
12. Consider a $10 million portfolio of stocks. You perform a Monte Carlo simulation toestimate the VaR for this portfolio. You choose to perform this simulation using a normaldistribution of returns for the portfolio, with an expected annual return of 14.8 percentand a standard deviation of 20.5 percent. You generate 700 random outcomes of annualreturn for this portfolio, of which the worst 40 outcomes are given below.
−0.400 −0.320 −0.295 −0.247−0.398 −0.316 −0.282 −0.233−0.397 −0.314 −0.277 −0.229−0.390 −0.310 −0.273 −0.226−0.355 −0.303 −0.273 −0.223−0.350 −0.301 −0.261 −0.222−0.347 −0.301 −0.259 −0.218−0.344 −0.300 −0.253 −0.216−0.343 −0.298 −0.251 −0.215−0.333 −0.296 −0.248 −0.211
Using the above information, compute the following:
A. 5 percent annual VaR.B. 1 percent annual VaR.
13. A. A firm runs an investment portfolio consisting of stocks as well as options on stocks.Management would like to determine the VaR for this portfolio and is thinkingabout which technique to use. Discuss a problem with using the analytical orvariance–covariance method for determining the VaR of this portfolio.
B. Describe a situation in which an organization might logically select each of the threeVaR methodologies.
14. An organization’s 5 percent daily VaR shows a number fairly consistently around ¤3million. A backtest of the calculation reveals that, as expected under the calculation, dailyportfolio losses in excess of ¤3 million tend to occur about once a month. When suchlosses do occur, however, they typically are more than double the VaR estimate. Theportfolio contains a very large short options position.
A. Is the VaR calculation accurate?B. How can the VaR figure best be interpreted?

94 Learning Outcomes, Summary Overview, and Problems
C. What additional measures might the organization take to increase the accuracy of itsoverall exposure assessments?
15. Indicate which of the following statements about credit risk is (are) false, and explain why:
A. Because credit losses occur often, it is easy to assess the probability of a credit loss.B. One element of credit risk is the possibility that the counterparty to a contract will
default on an obligation to another (i.e., third) party.C. Like the buyer of a European-style option, the buyer of an American-style option faces
no current credit risk until the expiration of the option.
16. Ricardo Colon, an analyst in the investment management division of a financial servicesfirm, is developing an earnings forecast for a local oil services company. The company’sincome is closely linked to the price of oil. Furthermore, the company derives themajority of its income from sales to the United States. The economy of the company’shome country depends significantly on export oil sales to the United States. As a result,movements in world oil prices in U.S. dollar terms and the U.S. dollar value of the homecountry’s currency are strongly positively correlated. A decline in oil prices would reducethe company’s sales in U.S. dollar terms, all else being equal. On the other hand, theappreciation of the home country’s currency relative to the U.S. dollar would reduce thecompany’s sales in terms of the home currency.
According to Colon’s research, Raul Rodriguez, the company’s chief risk officer, hasmade the following statement:
‘‘The company has rejected hedging the market risk of a decline in oil prices by sellingoil futures and hedging the currency risk of a depreciation of the U.S. dollar relative toour home currency by buying home currency futures in U.S. markets. We have decidedthat a more effective risk management strategy for our company is to not hedge eithermarket risk or currency risk.’’
A. State whether the company’s decision to not hedge market risk was correct. Justifyyour answer with one reason.
B. State whether the company’s decision to not hedge currency risk was correct. Justifyyour answer with one reason.
C. Critique the risk management strategy adopted.
17. Tony Smith believes that the price of a particular underlying, currently selling at $96,will increase substantially in the next six months, so he purchases a European call optionexpiring in six months on this underlying. The call option has an exercise price of $101and sells for $6.
A. How much is the current credit risk, if any?B. How much is the current value of the potential credit risk, if any?C. Which party bears the credit risk(s), Tony Smith or the seller?
18. Following are four methods for calculating risk-adjusted performance: the Sharpe ratio,risk-adjusted return on capital (RAROC), return over maximum drawdown (RoMAD),and the Sortino ratio. Compare and contrast the measure of risk that each method uses.
CHAPTER 10EXECUTION OF PORTFOLIO
DECISIONS
Ananth MadhavanBarclays Global InvestorsSan Francisco, California
Jack L. TreynorTreynor Capital Management, Inc.
Palos Verdes Estates, California
Wayne H. WagnerPlexus Group, Inc.
Los Angeles, California
LEARNING OUTCOMES
After completing this chapter, you will be able to do the following:
• Compare and contrast market and limit orders, including the degree of execution uncer-tainty and price uncertainty associated with each.
• Calculate and interpret the effective spread of a market order and contrast it to the quotedbid–ask spread in measuring the cost of trading.
• Compare, contrast, and state examples of the following market structures: quote-driven(dealer) markets, order-driven markets (including electronic crossing networks, batchauctions, and automated auctions), brokered markets, and hybrid markets.
• Compare and contrast the roles of brokers and dealers.• Explain the criteria of market quality and evaluate the quality of a market given a description
of its characteristics.• Review the components of execution costs, including explicit and implicit costs, and
evaluate trades in terms of those costs.• Calculate, interpret, and explain the importance of implementation shortfall as a measure
of transaction costs.
95

96 Learning Outcomes, Summary Overview, and Problems
• Contrast volume-weighted average price (VWAP) and implementation shortfall as measuresof transaction costs.
• Explain the use of econometric methods in pretrade analysis to estimate implicit transactioncosts.
• Discuss the major types of traders based on the motivation to trade, their time versus pricepreferences, and their preferred order types.
• Evaluate the uses, strengths, and weaknesses of major trading tactics, and recommend atrading tactic given a description of the motivation to trade, the size of the trade, andmarket characteristics.
• Explain the motivation for algorithmic trading and the classification of algorithmictrading strategies, including the objectives of simple logical participation and shortfallimplementation strategies.
• Discuss the choice of an algorithmic trading strategy given a description of the size of theorder, the average daily volume of the security, the current bid–ask spread, and the urgencyof the order.
• Explain the meaning of best execution.• Evaluate a firm’s investment and trading procedures, including processes, disclosures, and
record keeping, with respect to best execution.• Discuss the role of ethics in trading.
SUMMARY OVERVIEW
The portfolio decision is not complete until securities are bought or sold. How well that laststep is accomplished is a key factor affecting investment results. This chapter has made thefollowing points.
• Market microstructure refers to the particular trading protocols that govern how a trader’slatent demands are translated into executed trades. Knowledge of market microstructurehelps investors understand how their trades will be executed and how market frictions maygive rise to discrepancies between price and full-information expectations of value.
• Order-driven markets are those in which prices are established by public limit ordersand include auction markets and electronic crossing networks (where trading occurs atprespecified points in time), as well as automated auctions (where trading takes placecontinuously). Quote-driven markets rely on market makers or dealers to establish pricesat which securities can be bought and sold. Brokered markets are markets in whichtransactions are largely effected by brokers through a search mechanism. Hybrid marketsare those, such as the NYSE, that incorporate features of more than one type of market.
• Execution services secured through a broker include the following: representing the order,finding the buyer, market information for the investor, discretion and secrecy, escrow, andsupport of the market mechanism. A trader’s broker stands in an agency relationship to thetrader, in contrast to dealers. Dealers provide bridge liquidity to buyers and sellers in thatthey take the other side of the trade when no other liquidity is present.
• The effective spread is two times the deviation of the price received or paid from themidpoint of the market at the time an order is entered to the actual execution price. Thebid–ask spread is the difference between the bid and the ask prices. The effective spread is abetter representation of the true cost of trading than the bid–ask spread because it capturesboth price improvement and price impact.

Chapter 10 Execution of Portfolio Decisions 97
• Market quality is judged by the following criteria, which are positives for a market’sliquidity: many buyers and sellers; diversity of opinion, information, and investment needs;a readily accessible location; continuous operation during convenient market hours; areasonable cost of transacting; market integrity, in effect the honesty of market participants;assurity of the contract’s integrity.
• Transaction costs include explicit costs and implicit costs. Explicit costs are the direct costsof trading and include broker commission costs, taxes, stamp duties, and fees. Implicitcosts include indirect costs such as the impact of the trade on the price received.
• Implementation shortfall is an estimate of transaction costs that amounts to subtracting theall-in transaction costs from the market price at the time the decision was made to buy orsell the security.
• Econometric models for costs are useful for obtaining pretrade estimates of the costs ofa trade. These models may use variables such as stock liquidity, risk, trade size relative toavailable liquidity, momentum, and trading style.
• The major types of traders are information-motivated traders (who trade on informationwith limited time value), value-motivated traders (who trade on valuation judgments),liquidity-motivated traders (who trade based on liquidity needs), and passive traders (whotrade for indexed portfolios). Information-motivated and liquidity-motivated traders havevery short trading time horizons and are more sensitive to time than price in execution.By contrast, value-motivated and passive traders have longer trading time horizons and aremore sensitive to price than time in execution.
• The two major order types are market orders (for prompt execution in public markets atthe best price available) and limit orders (specifying a price at which the order becomesexecutable). Market orders are among the order types preferred by information-motivatedand liquidity-motivated traders because of their time preference. Limit orders are amongthe order types preferred by value-motivated and passive traders because they are sensitiveto price.
• Major focuses influencing the choice of trading strategy include the following: liquidityneeded at any cost, need trustworthy agent for possibly hazardous trading situation, costsare not important, advertise to draw liquidity, and low cost whatever the liquidity.
• Algorithmic trading refers to automated electronic trading subject to quantitative rules anduser-specified benchmarks and constraints. Three broad categories of algorithmic tradingstrategies are logical participation strategies (which involve protocols for breaking up anorder for execution over time), opportunistic strategies (which involve passive tradingcombined with the opportunistic seizing of liquidity), and specialized strategies (whichcover a range of strategies that serve special purposes).
PROBLEMS
1. An analyst is estimating various measures of spread for Airnet Systems, Inc. (NYSE: ANS).On page 98 is a sample of quotes in ANS on the New York Stock Exchange on March10, 2004, between 10:49:00 and 10:57:00.
A buyer-initiated trade in ANS was entered at 10:50:06 and was executed at 10:50:07at a price of $4.74. For this trade, answer the following:
A. What is the quoted spread?B. What is the effective spread?C. When would the effective and quoted spreads be equal?
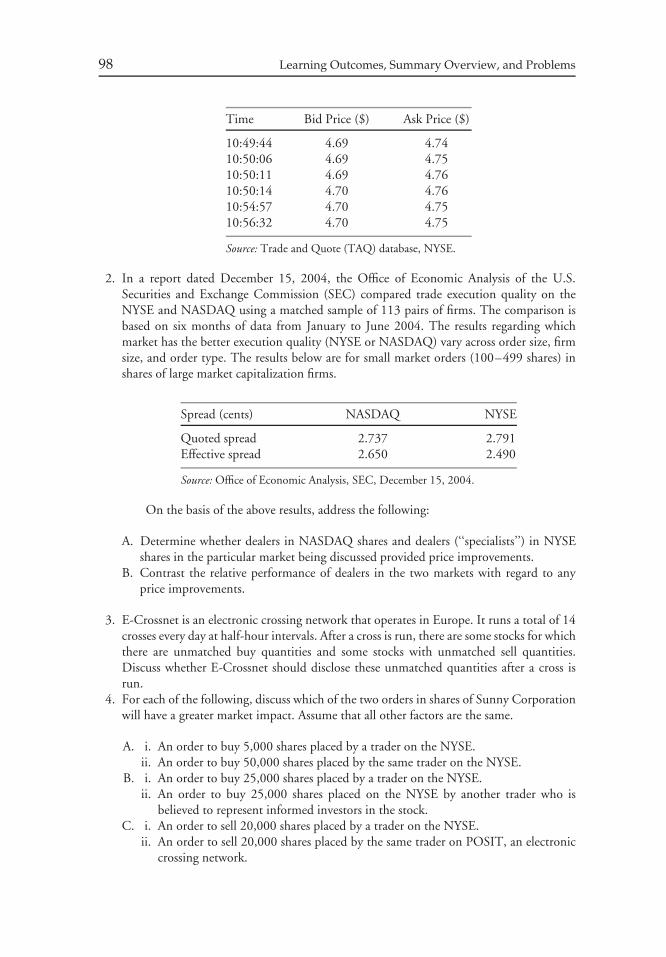
98 Learning Outcomes, Summary Overview, and Problems
Time Bid Price ($) Ask Price ($)
10:49:44 4.69 4.7410:50:06 4.69 4.7510:50:11 4.69 4.7610:50:14 4.70 4.7610:54:57 4.70 4.7510:56:32 4.70 4.75
Source: Trade and Quote (TAQ) database, NYSE.
2. In a report dated December 15, 2004, the Office of Economic Analysis of the U.S.Securities and Exchange Commission (SEC) compared trade execution quality on theNYSE and NASDAQ using a matched sample of 113 pairs of firms. The comparison isbased on six months of data from January to June 2004. The results regarding whichmarket has the better execution quality (NYSE or NASDAQ) vary across order size, firmsize, and order type. The results below are for small market orders (100–499 shares) inshares of large market capitalization firms.
Spread (cents) NASDAQ NYSE
Quoted spread 2.737 2.791Effective spread 2.650 2.490
Source: Office of Economic Analysis, SEC, December 15, 2004.
On the basis of the above results, address the following:
A. Determine whether dealers in NASDAQ shares and dealers (‘‘specialists’’) in NYSEshares in the particular market being discussed provided price improvements.
B. Contrast the relative performance of dealers in the two markets with regard to anyprice improvements.
3. E-Crossnet is an electronic crossing network that operates in Europe. It runs a total of 14crosses every day at half-hour intervals. After a cross is run, there are some stocks for whichthere are unmatched buy quantities and some stocks with unmatched sell quantities.Discuss whether E-Crossnet should disclose these unmatched quantities after a cross isrun.
4. For each of the following, discuss which of the two orders in shares of Sunny Corporationwill have a greater market impact. Assume that all other factors are the same.
A. i. An order to buy 5,000 shares placed by a trader on the NYSE.ii. An order to buy 50,000 shares placed by the same trader on the NYSE.
B. i. An order to buy 25,000 shares placed by a trader on the NYSE.ii. An order to buy 25,000 shares placed on the NYSE by another trader who is
believed to represent informed investors in the stock.C. i. An order to sell 20,000 shares placed by a trader on the NYSE.
ii. An order to sell 20,000 shares placed by the same trader on POSIT, an electroniccrossing network.

Chapter 10 Execution of Portfolio Decisions 99
5. An investment manager placed a limit order to buy 500,000 shares of Alpha Corporationat $21.35 limit at the opening of trading on February 8. The closing market price ofAlpha Corporation on February 7 was also $21.35. The limit order filled 40,000 shares,and the remaining 460,000 shares were never filled. Some good news came out aboutAlpha Corporation on February 8, and its price increased to $23.60 by the end of thatday. However, by the close of trading on February 14, the price had declined to $21.74.The investment manager is analyzing the missed trade opportunity cost using the closingprice on February 8 as the benchmark price.
A. What is the estimate of the missed trade opportunity cost if it is measured at a one-dayinterval after the decision to trade?
B. What is the estimate of the missed trade opportunity cost if it is measured at aone-week interval after the decision to trade?
C. What are some of the problems in estimating the missed trade opportunity cost?
6. A portfolio manager would like to buy 5,000 shares of a very recent initial public offering(IPO) stock. However, he was not able to get any shares at the IPO price of £30. Theportfolio manager would still like to have 5,000 shares, but not at a price above £45 pershare. Should he place a market order or a limit order? What would be the advantage anddisadvantage of each type of order, given his purposes?
7. An asset management firm wants to purchase 500,000 shares of a company. It decides toshop the order to various broker/dealer firms to see which firm can offer the best serviceand lowest cost. Discuss the potential negatives of shopping the order.
8. Able Energy, Inc., is a company listed on NASDAQ (symbol: ABLE). A trader sold 100shares of this company on May 10, 2004 at 15:52:59 at a price of $2.66 per share. All thetrades that occurred in Able Energy on that day are listed below.
Time Trade Price ($) Shares Traded
10:00:39 2.71 20010:00:39 2.72 20010:00:43 2.76 10013:09:07 2.77 10014:13:11 2.70 110015:52:59 2.66 10015:53:01 2.65 100
Source: Trade and Quote (TAQ) database, NYSE.
The trader is analyzing the implicit costs of the trade, focusing on the bid–ask spreadand market impact using specified price benchmarks.
A. What would be the estimated implicit transaction costs using each of the following asthe price benchmark?
i. Opening price.ii. Closing price.
iii. Volume-weighted average price (VWAP).
B. Evaluate the effect on estimated implicit transaction costs of the choice of benchmarkprice.

100 Learning Outcomes, Summary Overview, and Problems
9. A client of a broker evaluates the broker’s performance by measuring transaction costswith a specified price benchmark. The broker has discretion over the timing of his tradesfor the client. Discuss what the broker could do to make his performance look good tothe client (even though the broker’s execution decisions may not be in the best interestsof the client) if the price benchmark used by the client for evaluation is the:
A. Opening price.B. Closing price.C. Volume-weighted average price (VWAP).
10. A trader decided to sell 30,000 shares of a company. At the time of this decision, thequoted price was ¤53.20 to ¤53.30. Because of the large size of the order, the traderdecided to execute the sale in three equal orders of 10,000 shares spread over the courseof the day. When she placed the first order, the quoted price was ¤53.20 to ¤53.30, andshe sold the shares at ¤53.22. The trade had a market impact, and the quoted price hadfallen to ¤53.05 to ¤53.15 when she placed the next order. Those shares were sold at¤53.06. The quoted price had fallen to ¤52.87 to ¤52.98 when she placed the last order.Those shares were sold at ¤52.87. Suppose this was the market closing price of the sharesthat day. Answer the following questions, ignoring commissions.
A. Estimate the total transaction cost of the sale of 30,000 shares if the closing price isused as the price benchmark.
B. What is the implementation shortfall estimate of the total cost of executing the sale?C. Discuss and compare the answers to A and B above. Which of the two approaches is
appropriate for the situation in this problem?
11. Suppose 1,000 shares of Acme Co. stock are ordered to be bought on Monday with abenchmark price of $10.00. On Monday, 600 shares are purchased at $10.02 per share.Commissions and fees are $20. On Tuesday, the benchmark price has fallen to $9.99 pershare. On Tuesday, 100 more shares are purchased at $10.08 per share. Commissions andfees are $12. Shares for Acme close on Tuesday at $10.01 per share. The remaining sharesare not purchased, and the order is canceled on Wednesday just as the market closes at$10.05 per share.
A. Calculate the implementation shortfall for this trade.B. Calculate the components of the implementation shortfall for this trade.
12. Jane Smith manages an equity fund. She has decided to undertake a major portfoliorestructuring by increasing the exposure of the fund to the telecommunications sector.The implementation of her decision would involve investing more than $2 million in thestocks of about 20 telecommunications companies. Contrast the use of a portfolio tradeto the use of purchase orders for these stocks placed individually (stock by stock) in termsof the probable market impact of the two approaches.
13. Famed Investments has a C$25 million portfolio. It follows an active approach toinvestment management and, on average, turns the portfolio over twice a year. That is, itexpects to trade 200 percent of the value of the portfolio over the next year. Every timeFamed Investments buys or sells securities, it incurs execution costs of 75 basis points,on average. It expects an annual return before execution costs of 8 percent. What is theexpected return net of execution costs?
14. Several British stocks trade on both the London Stock Exchange and the New York StockExchange. Due to the time difference between London and New York, these stocks trade

Chapter 10 Execution of Portfolio Decisions 101
for six hours every day in London only, followed by the opening of the NYSE and atwo-hour period when both markets are open before London closes. Werner and Kleidon(1996) found that the volatility of prices in London is much higher during the two-hourperiod when both markets are open than during the preceding six-hour period whenonly London is open. What could be an information-motivated reason for this finding?Assume that U.S. traders do not trade in London.
15. An employee retirement fund manager believes he has special information about aparticular company. Based on this information, he believes the company is currentlyundervalued and decides to purchase 50,000 shares of the company. The manager decidesthat he will not place a large single order for 50,000 shares but will instead place severalmedium-sized orders of 2,500 to 5,000 shares spread over a period of time. Why do youthink the manager chooses to follow this strategy?
16. Consider some stocks that trade in two markets, with a trader being able to trade inthese stocks in either market. Suppose that the two markets are identical in all respectsexcept that bid–ask spreads are lower and depths (the number of shares being offeredat the bid and ask prices) are greater in one of the two markets. State in which marketliquidity-motivated and information-motivated traders would prefer to transact. Justifyyour answer.
17. A trader has been given two trades to execute with the following characteristics. Whattactics do you recommend?
Average DailyTrade Size (shares) Volume (ADV) Price Spread (%) Urgency
A 200,000 6,000,000 10.00 0.03 HighB 150,000 200,000 10.00 0.60 High
18. A trader must rebalance a pension plan’s actively managed $500 million U.S. small-capequity portfolio to an S&P 500 indexed portfolio in order to effect a change in the plan’sstrategic asset allocation. He is told that his primary goal is to minimize explicit costs inthis rebalance. What should his trading strategy be?
CHAPTER 11MONITORING AND
REBALANCING
Robert D. ArnottFirst Quadrant, LP
Research Affiliates, LLCPasadena, California
Terence E. Burns, CFACampion Wealth Management LLC
Vienna, Virginia
Lisa Plaxco, CFAFirst Quadrant, LPPasadena, California
Philip MoorePacific Investment Consultants, LLC
Stevenson Ranch, California
LEARNING OUTCOMES
After completing this chapter, you will be able to do the following:
• Explain and justify fiduciaries’ responsibilities in monitoring.• Contrast the monitoring of investor circumstances, market/economic conditions, and the
portfolio, and interpret the effects on a client’s portfolio of changes in each of those areas.• Evaluate the need to revise an investor’s investment policy statement and strategic asset
allocation given altered investor circumstances (i.e., changes in wealth, time horizon,
102
Chapter 11 Monitoring and Rebalancing 103
liquidity requirements, tax concerns, and legal and regulatory factors) and recommendappropriate revisions.
• Discuss the benefits and costs of rebalancing a portfolio to the investor’s strategic assetallocation.
• Contrast calendar rebalancing to percentage-of-portfolio rebalancing.• Compare and contrast rebalancing an asset class to within the allowed range with rebalancing
the asset class to its target portfolio weight.• Evaluate the effects of the following factors on an asset class’s optimal corridor width,
assuming a percentage-of-portfolio rebalancing approach: transaction costs, risk tolerance,correlation, the asset class’s volatility, and the volatility of the remainder of the portfolio.
• Distinguish among the payoffs in up, down, and nontrending markets of (1) rebalancingto a constant mix of equities and bills, (2) buying and holding equities, and (3) constant-proportion portfolio insurance (CPPI).
• Distinguish between linear, concave, and convex rebalancing strategies.• Judge the appropriateness of constant mix, buy-and-hold, and CPPI rebalancing strategies
given various investor risk tolerances and asset return expectations.
SUMMARY OVERVIEW
Even the most carefully constructed portfolios do not manage themselves. In this chapter wehave discussed two ingredients to ensuring an investment program’s continuing relevancy:monitoring and rebalancing.
• Portfolio managers need to monitor everything that is relevant to positioning a portfolio tosatisfy the client’s objectives and constraints. Three areas that the portfolio manager mustmonitor are changes in investor circumstances and wealth, market and economic changes,and the portfolio itself.
• Fiduciaries have an ethical and legal responsibility for adequate monitoring. Only bysystematic monitoring can the fiduciary secure an informed view of the appropriatenessand suitability of a portfolio for a particular client.
• Rebalancing to an investor’s strategic asset allocation has benefits and costs. If the targetasset class proportions of an investor’s strategic asset allocation represent his optimum, anydivergence from the target proportions represents an expected utility loss to the investor.The benefit in rebalancing equals the reduction in the present value of expected utilitylosses from not tracking the optimum. Rebalancing is a risk-control discipline that helpsensure an appropriate level of portfolio risk.
• The costs of rebalancing include transaction costs and, for taxable investors, tax costs (taxliabilities that are triggered by rebalancing trades).
• Calendar rebalancing involves rebalancing the portfolio to target weights on a periodic basissuch as monthly, quarterly, semiannually, or annually. Calendar rebalancing is the simplestrebalancing discipline; it has the drawback of being unrelated to market performance. Yetit can suffice in ensuring that the actual portfolio does not drift far away from targetfor long periods of time if the rebalancing frequency is adequate given the portfolio’svolatility.
• Percentage-of-portfolio rebalancing involves setting rebalancing thresholds (trigger points)that define a corridor or tolerance band for the value of that asset class such as 50%± 5%. Compared with calendar rebalancing (particularly at lower frequencies such as

104 Learning Outcomes, Summary Overview, and Problems
semiannually or annually), percentage-of-portfolio rebalancing can exercise tighter controlon divergences from target proportions because it is directly related to market performance.
• In rebalancing, two disciplines are rebalancing to target weights and rebalancing to theallowed range. The former exercises tighter discipline on risk exposures, the latter allowsfor more control of costs and for tactical adjustment.
• Factors positively related to optimal corridor width for an asset class include transactioncosts, risk tolerance, and correlation with the rest of the portfolio. The greater these factors,the wider the optimal corridor, in general.
• Factors negatively related to optimal corridor width for an asset class include the assetclass’s volatility and the volatility of the rest of the portfolio. The greater these factors, thenarrower the optimal corridor, in general.
• Three contrasting strategies are buy and hold, constant mix (rebalancing to the strategicasset allocation), and constant proportion (which includes constant-proportion portfolioinsurance).
• A buy-and-hold strategy is a passive strategy of buying an initial asset mix (e.g., 60/40stocks/bills) and doing absolutely nothing subsequently. It is synonymous with a driftingasset mix. A constant-mix strategy involves rebalancing so that the investment in stocks isa constant fraction of portfolio value. A constant-proportion portfolio insurance strategyinvolves making trades so the investment in stocks represents a constant multiple of thecushion of portfolio value above a floor value.
• In strong bull markets, CPPI outperforms a buy-and-and hold strategy, while a buy-and-hold strategy outperforms a constant-mix strategy, in general. In strong bear markets, thesame priority of performance holds. In a market characterized more by reversals than bytrends, a constant-mix strategy tends to do best, followed by buy-and-hold and then CPPIstrategies.
PROBLEMS
1. Evaluate the most likely effects of the following events on the investor’s investmentobjectives, constraints, and financial plan.
A. A childless working married couple in their late 20s adopts an infant for whom theyhope to provide a college education.
B. An individual decides to buy a house in one year. He estimates that he will need$102,000 at that time for the down payment and closing costs on the house. Theportfolio from which those costs will be paid has a current value of $100,000 and noadditions to it are anticipated.
C. A foundation with a ¤150,000,000 portfolio invested 60 percent in equities, 25percent in long-term bonds, and 15 percent in absolute return strategies has approveda grant totaling ¤15,000,000 for the construction of a radio telescope observatory.The foundation anticipates a new contribution from a director in the amount of¤1,000,000 toward the funding of the grant.
2. (Adapted from the 2001 Level III examination)Duane Rogers, as chief investment officer (CIO) for the Summit PLC defined-benefit
pension scheme, has developed an economic forecast for presentation to the plan’s boardof trustees. Rogers projects that U.K. inflation will be substantially higher over the nextthree years than the board’s current forecast.

Chapter 11 Monitoring and Rebalancing 105
Rogers recommends that the board immediately take the following actions based onhis forecast:
A. Revise the pension scheme’s investment policy statement to account for a change inthe U.K. inflation forecast.
B. Reallocate pension assets from domestic (U.K.) to international equities because healso expects inflation in the U.K. to be higher than in other countries.
C. Initiate a program to protect the pension scheme’s financial strength from the effectsof U.K. inflation by indexing benefits paid by the scheme.
State whether each recommended action is correct or incorrect. Justify each of yourresponses with one reason.
The following two interpretative monitoring problems are presented as two-partnarratives: initial client circumstances, which comprise the gist of a client’s investmentpolicy statement (IPS) and the detailed information going into its formulation, followedby the changed client circumstances.
3. (Adapted from the 2002 CFA Level III examination)
Initial Client Circumstances
Claire Wisman, a vice president for Spencer Design, is a 42-year-old widow who lives in theUnited States. She has two children: a daughter, age 21, and a son, age 7. She has a $2.2 millionportfolio; half of the portfolio is invested in Spencer Design, a publicly traded common stock,which has a cost basis of $350,000. Despite a substantial drop in the value of her portfolioover the last two years, her long-term annual total returns have averaged 7 percent before tax.The recent drop in value has caused her great anxiety, and she believes that she can no longertolerate an annual decline greater than 10 percent.
Wisman intends to retire in 20 years, and her goals for the next 20 years, in order ofpriority, are as follows. The present values given are gross of taxes.
• Funding the cost of her daughter’s upcoming final year of college, which has a present valueof $26,000, and her son’s future college costs, which have a present value of $130,000.
• Increasing the portfolio to a level that will fund her retirement living expenses, which sheestimates to be $257,000 for the first year of her retirement.
• Building her ‘‘dream house’’ in five years, the cost of which (including land) has a presentvalue of $535,000.
• Giving, if possible, each of her children $1 million when they reach age 40.
After subtracting the present value (before tax) of her children’s education costs andher homebuilding costs, the present value of her portfolio is $1,509,000. With returns fromincome and gains taxable at 30 percent and with continued annual growth of 7 percentbefore tax (7% × (1 − 0.30) = 4.9% after taxes), the portfolio’s value will be approximately$3,928,000 net of taxes at the end of 20 years.
Wisman’s annual salary is $145,000, her annual living expenses are currently $100,000,and both are expected to increase at an inflation rate of 3 percent annually. Taxes onincome and short-term capital gains (holding period one year or less) are substantially higherthan taxes on long-term capital gains (holding period greater than one year). For planningpurposes, however, Wisman wants to assume that her average tax rate on all income andgains is 30 percent. The inflation and tax rates are expected to remain constant. Currently,

106 Learning Outcomes, Summary Overview, and Problems
Wisman rents a townhouse, has no debt, and adamantly intends to remain debt free. SpencerDesign has no pension plan but provides company-paid medical insurance for executivesfor life and for their children to age 25. After taxes, Wisman’s salary just covers her livingexpenses and thus does not allow her to make further meaningful capital contributions to herportfolio.
Wisman’s current investment policy statement has the following elements:
Return requirement. A total return objective of 7 percent before tax is sufficient to meetClaire Wisman’s educational, housing, and retirement goals. If the portfolio earnsa total return of 7 percent annually, the value at retirement ($3.93 million) shouldbe adequate to meet ongoing spending needs then ($257,000/$ 3, 928, 000 = 6.5%spending rate) and fund all Wisman’s extraordinary needs (college and homebuildingcosts) in the meantime. The million-dollar gifts to her children are unrealistic goalsthat she should be encouraged to modify or drop.
Risk tolerance. Wisman has explicitly stated her limited (below average) willingness totake risk. Wisman appears to have an average ability to take risk. Her portfolio hassome flexibility, because her expected return objective of 7 percent will meet hergoals of funding her children’s education, building her ‘‘dream house,’’ and fundingher retirement. Overall, her risk tolerance is below average.
Time horizon. Her time horizon is multistage. The time horizon could be describedas three-stage (the next 5 preretirement years defined by work/housing costs; thesubsequent 15 preretirement years defined by work/college costs; and beyond 20 yearspostretirement).
Liquidity. Wisman has only a minor liquidity need ($26,000 in present value terms) tocover education expenses for her daughter next year. After that, she has no liquidityneed for the next five years. Only then ($535,000 in present value terms, for homeconstruction) and in Years 11 through 14 ($130,000 in present value terms, for herson’s education) will significant liquidity concerns exist.
Taxes. Taxes are a critical concern because Wisman needs to fund outlays with after-taxdollars.
Unique circumstances. A significant unique circumstance is the large concentration (50percent of her assets) in Spencer Design stock. Another factor is her desire to build anew home in five years yet incur no debt. Also, she would ‘‘like’’ to give each child$1 million, but this goal is unrealistic and should not drive portfolio decisions.
Wisman indicates that Spencer Design has a leading and growing market share. Thecompany has shown steady fundamental growth trends, and Wisman intends to hold herSpencer Design stock, which is expected to return at least 9 percent annually before tax with astandard deviation of returns of 20 percent.
Changed Client Circumstances
Claire Wisman, now 47 years old, has recently married a coworker at Spencer Design. Wismanand her husband are buying their dream house at a total cost of $700,000, and they havedecided to make an immediate down payment of $430,000 and finance the remainder over15 years. Wisman also indicates that her son has contracted a rare disease, requiring majorsurgery; the disease will prevent him from attending college. Although Wisman and her

Chapter 11 Monitoring and Rebalancing 107
husband have medical insurance that will pay her son’s ongoing medical expenses, her son’ssurgery will cost an additional $214,000 immediately. The cost of medical expenditures isexpected to grow at a rate exceeding the general inflation rate for the foreseeable future.Wisman has decided to quit work to care for her son, whose remaining life expectancy is40 years. She also insists on the need to provide care for her son when she and her husbandare no longer capable of doing so. Wisman’s parents died one year ago, and her daughter isnow financially independent. Wisman’s husband intends to retire in 25 years.
Given these circumstances, the investment portfolio held by Wisman and her husbandwill need to provide an amount equal to $1,713,000 (present value) to meet their livingexpenses until his retirement. They also want their portfolio to grow enough to cover theirliving expenses at retirement, which they estimate to be $400,000 annually. They believethey will need a before-tax portfolio growth rate of approximately 8 to 10 percent annuallyto achieve this goal. Based on a retirement spending goal of $400,000, their correspondingeffective postretirement spending rate will be approximately 6 to 7 percent annually beforetax.
Wisman summarizes her new financial information in Exhibit 11-1. She indicates thather portfolio and her husband’s portfolio should be considered as one. She further states thather husband has taken well above-average risk in the past, but he is now willing to leave theinvestment management decisions to her.
A. Indicate how each component of Wisman’s investment policy statement should change asa result of Wisman’s new circumstances. Justify each of your responses with two reasonsbased on Wisman’s new circumstances.
B. Recommend whether the current allocation percentage (given in Exhibit 11-1) for eachof the following assets should be decreased or increased as a result of Wisman’s newcircumstances. Justify each of your responses with one reason based on Wisman’s newcircumstances.
i. Spencer Design common stockii. Money market
iii. Diversified bond fund
EXHIBIT 11-1 New Financial Information
CurrentAllocation
Percentage ofClaire Combined
Wisman Husband Combined Portfolio
Salary $ 0 $150,000 $ 150,000 –AssetsMoney market 61,000 27,000 88,000 2.4%Diversified bond fund 1,129,000 0 1,129,000 30.5%EquitiesLarge-capitalization equities 385,000 0 385,000 10.4%Emerging market equities 0 407,000 407,000 11.0%Spencer Design common stock 1,325,000 122,000 1,447,000 39.1%Undeveloped commercial land 0 244,000 244,000 6.6%Total portfolio $2,900,000 $800,000 $3,700,000 100.0%

108 Learning Outcomes, Summary Overview, and Problems
iv. Large-capitalization equitiesv. Emerging market equities
vi. Undeveloped commercial land
4. (Adapted from the 2003 CFA Level III examination)
Initial CircumstancesBoth parents of 12-year-old Andrew Campbell recently died in an accident. The parentshad been supporting Andrew and his grandmother, Lisa Javier, age 77. The parents’accumulated assets prior to their death were $640,000 in a diversified common stock (bothdomestic and international) portfolio and $360,000 in the common stock of NewmanEnterprises, a publicly traded company founded by Javier’s husband. The parents’ assetswill now be held in a single U.S.-based trust—the Javier–Campbell Trust (the Trust)—tobenefit both Javier and Campbell. In addition to these assets, the Trust received lifeinsurance proceeds of $2 million.
Newman Enterprises will continue to provide medical coverage for Javier until herdeath. Campbell has government-provided health care until he reaches age 22. Campbellwill attend college for four years beginning at age 18. In addition to normal living expenses,initial annual university costs are projected to be $38,000, rising 8 percent annually.
According to the provisions of the Trust document:
• The Trust should provide for Javier’s and Campbell’s annual living expenses, currentlyestimated to total $78,000 per year (after tax). The Trust portfolio should earn areturn sufficient to cover the living expenses of Javier and Campbell, taking taxes intoconsideration and allowing for inflation (expected to be 2 percent annually). Incomeand capital gains are taxed at 30 percent, and this tax treatment is not expected tochange.
• The Trust should limit shortfall risk (defined as expected total return minus two standarddeviations) to no lower than a −10 percent return in any one year.
• Campbell is entitled to receive distributions from the Trust until he reaches age 32. Atthat point, the Trust will continue making distributions for Javier’s living expenses.
• Upon Javier’s death, the Trust’s assets will go to Campbell, provided he is at least32 years old. If Campbell is not yet aged 32 when Javier dies, the Trust will thendistribute income and principal to Campbell until he reaches age 32, at which point theTrust will terminate and the assets will be distributed to Campbell.
• The Newman Enterprises common stock cannot be sold without Javier’s approval foras long as she is alive. Javier has stated her strong desire to retain the Newman stockindefinitely, to fulfill a promise she made to her husband.
• The Trust must hold in cash equivalents an amount equal to nine months of livingexpenses (on a pretax basis) for Javier and Campbell.
• In the unlikely event that Campbell dies before Javier, distributions will continuefor Javier’s benefit until she dies, at which point any remaining Trust assets will bedistributed to several charities.
As a result of poor financial advice, Javier lost all of her inheritance from her husband’sestate. Because her assets are nearly depleted, she wants to minimize any future losses inthe Trust portfolio; in fact, she has expressed serious concerns about the Trust’s ability tomeet Campbell’s and her needs during her lifetime.
The risk tolerance and return requirement elements of the Javier–Campbell Trust’sIPS are as follows:

Chapter 11 Monitoring and Rebalancing 109
Risk ToleranceAbility. The Trust has average ability to assume risk, largely because of its substantial
asset base in relation to its spending needs. Because the portfolio is Javier’sonly source of support, the Trust’s ability to assume risk is lower than it mightotherwise be.
Willingness. The Trust has below-average willingness to assume risk. The Trustdocument requires that the account be invested so that shortfall risk (defined asexpected total return minus two standard deviations) is limited to a −10 percentreturn in any one year. This limitation implies that the Trust will be unwilling totolerate any substantial volatility in portfolio returns.
Overall risk tolerance. The Trust has below-average risk tolerance and will continueto have it for many years, especially while Javier is alive.
Return RequirementThe return requirement reflects two major factors: the need to cover living expenses andthe need to protect the portfolio from the adverse effects of inflation. Specifically, the Trustmust generate a total before-tax return of at least 6.57 percent on an annual basis to meetthese return requirements.
The living expenses, estimated at $78,000 per year, represent a $78,000/$3,000,000 = 2.6% spending rate in real, after-tax terms. However, because the Trustis taxed at 30 percent, it will need to earn a pretax return of (2.6% + 2%)/(1 − 0.30)= 6.57% to meet Javier and Campbell’s living expenses.
Changed Client CircumstancesTen years have now passed, and the Javier–Campbell Trust portfolio returns over theprevious 10 years have failed to meet expectations. Lower returns, coupled with Lisa Javier’sand Andrew Campbell’s living expenses and Campbell’s college costs, have combined toreduce the value of the Trust portfolio to $2 million.
Javier, now 87, recently moved to an assisted-living care facility. With her healthfailing, doctors have determined she will live no longer than three years and will requirefull-time care for the remaining time until her death. Javier’s medical expenses are coveredby insurance, but her care and living expenses now require $84,000 per year (after tax andadjusted for inflation) from the Trust. Inflation is expected to be 3 percent annually overthe next several years. Javier has no other support and depends on the Trust to meet herfinancial needs. She has continued to express her concern that the Trust will not provideenough distributions to cover her expenses during her remaining lifetime. She still wishesto retain the Newman Enterprises common stock, which now constitutes 15 percent ofthe Trust portfolio and has an expected annual yield of 2 percent over the next severalyears. Legal constraints have not changed, and the Trust still requires nine months of livingexpenses (on a pretax basis) to be held in reserve.
Campbell, now 22, is a recent college graduate and has accepted a job with ElkhornConsulting Partners. In the job offer, Elkhorn agreed to pay the cost of Campbell’s MBAdegree. Campbell also has the opportunity to buy a partnership stake in the company bymaking equal annual payments of $600,000 per year for five years. He will begin makingthose payments in 10 years. Campbell’s starting salary is sufficient to cover his livingexpenses.
110 Learning Outcomes, Summary Overview, and Problems
Although Campbell is concerned about providing for Javier, he believes that withthe appropriate asset allocation, the Trust assets should be sufficient to take care of herexpenditures until she dies and to provide the growth he needs to meet his partnershipobligations. Campbell views growth from the Trust to be essential in meeting his long-termgoals. Assuming that Campbell lives longer than Javier, the individual assets in the Trustwill be distributed to Campbell upon termination of the Trust; the Trust portfolio willbecome Campbell’s portfolio.
The trustee believes that circumstances have changed enough to warrant revisingcertain components of the investment policy statements for Campbell and the Trust.
Formulate revised statements about the Javier–Campbell Trust’s willingness to takerisk that reflect the changed circumstances of both Javier and Campbell. Your responseshould include appropriate supporting justification.
5. A foundation holds an equally weighted portfolio of domestic equities, internationalequities, private equity, and inflation-protected bonds.
A. Critique a percentage-of-portfolio discipline that involves establishing a corridor oftarget percentage allocation ± 5 percent for each asset class in the foundation’s portfolio.
B. Evaluate the implications of the following sets of facts on the stated corridor, given anall-else-equal assumption in each case:
i. The Foundation’s risk tolerance has decreased. Corridor for international equities.ii. Transaction costs in international equities are one-half those for private equity.
Corridor for inflation-protected bonds.iii. The correlation of private equity with the rest of the portfolio is lower than the
correlation of domestic equities with the rest of the portfolio. Corridor for privateequity.
iv. The volatility of domestic equities is higher than that of inflation-protected bonds.Corridor for domestic equities.
6. A. Recommend an appropriate rebalancing discipline for an investor who cannot monitorportfolio values on a daily basis yet holds an above-average risk portfolio and low risktolerance.
B. How would the investment results of the recommended rebalancing discipline beaffected if markets were nontrending?
7. (Adapted from the 2002 CFA Level III examination)Marvis University (MU) is a private, multiprogram U.S. university with a $2 billion
endowment fund as of fiscal year-end May 31, 2002. With little government support, MUis heavily dependent on its endowment fund to support ongoing expenditures, especiallybecause the university’s enrollment growth and tuition revenue have not met expectationsin recent years. The endowment fund must make a $126 million annual contribution,which is indexed to inflation, to MU’s general operating budget. The U.S. Consumer PriceIndex is expected to rise 2.5 percent annually, and the U.S. higher education cost indexis anticipated to rise 3 percent annually. The endowment has also budgeted $200 milliondue on January 31, 2003, representing the final payment for construction of a new mainlibrary.
In a recent capital campaign, MU met its fundraising goal only with the help ofone very successful alumna, Valerie Bremner, who donated $400 million of BertocchiOil and Gas common stock at fiscal year-end May 31, 2002. Bertocchi Oil and Gas isa large-capitalization, publicly traded U.S. company. Bremner donated the stock on the

Chapter 11 Monitoring and Rebalancing 111
condition that no more than 25 percent of the initial number of shares may be sold in anyfiscal year. No substantial additional donations are expected in the future.
Given the large contribution to and distributions from the endowment fund, thefund’s investment committee has decided to revise its investment policy statement.
In the revised IPS, the endowment portfolio manager established that MU’s returnrequirement is 10 percent. MU’s average ability to take risk restrains its risk tolerance.
Five years have passed, and the Marvis University endowment fund’s willingness andability to assume risk have increased. The endowment fund’s investment committee asks itsconsultant, James Chan, to discuss and recommend a rebalancing strategy to incorporatethe new risk tolerance. Chan anticipates a bull market in growth assets over the next threeto five years. He also believes that volatility will be below historical averages during thatsame time period. The investment committee directs Chan to incorporate his views intohis recommendation. The committee also does not want the market value of the portfolioto decline more than 15 percent below its current market value.
A. Describe the following three primary rebalancing strategies:
i. Buy and holdii. Constant mix
iii. Constant-proportion portfolio insurance
B. Determine which one of the three rebalancing strategies in Part A Chan shouldrecommend for the Marvis University endowment fund. Justify your response withtwo reasons based on the circumstances described above.
CHAPTER 12EVALUATING PORTFOLIO
PERFORMANCE
Jeffery V. Bailey, CFATarget Corporation
Minneapolis, Minnesota
Thomas M. Richards, CFARichards & Tierney, Inc.
Chicago, Illinois
David E. TierneyRichards & Tierney, Inc.
Chicago, Illinois
LEARNING OUTCOMES
After completing this chapter, you will be able to do the following:
• Justify the importance of performance evaluation.• Characterize and distinguish among the components of portfolio evaluation: performance
measurement, performance attribution, and performance appraisal.• Explain the calculation of return when an account receives an external cash flow (1) at the
beginning of an evaluation period or (2) at the end of an evaluation period.• Compute, compare, and contrast time-weighted and money-weighted rates of return.• Evaluate the effect of external contributions and withdrawals in the calculation of time-
weighted and money-weighted rates of return.• Evaluate potential data quality issues as they relate to calculating rates of return.• Demonstrate the analysis of portfolio returns into components due to the market, to style,
and to active management.
112

Chapter 12 Evaluating Portfolio Performance 113
• Identify and discuss the properties of a valid benchmark.• Discuss the types of benchmarks and each type’s advantages and disadvantages, and critique
the appropriateness of each benchmark type for performance evaluation.• Summarize the steps in constructing a custom security-based benchmark.• Judge the validity of using manager universes as benchmarks.• Evaluate benchmarks by applying tests of quality.• Review hedge fund benchmarks and evaluate the effects of short positions on hedge fund
performance measurement.• Distinguish between macro and micro performance attribution.• List and discuss the inputs that are necessary for a macro performance attribution.• Demonstrate the incremental-return and incremental-value contributions to the ending
value of the fund at the following attribution levels: net contributions, risk-free asset, assetcategory, benchmarks, investment managers, and allocation tactics.
• Demonstrate a performance attribution analysis, given data on the portfolio’s and bench-mark’s sector weights and returns, and evaluate the impacts from pure sector allocation,within-sector selection, and allocation/selection interaction.
• Discuss fundamental factor model micro attribution.• Compare and contrast the strengths and limitations of allocation/selection attribution and
fundamental factor model attribution.• Distinguish between the effect of the interest rate environment and the effect of active
management on fixed-income portfolio returns.• Explain the management factors contributing to a fixed-income portfolio’s total return,
and interpret the results of a fixed-income performance attribution analysis.• Compute, compare, and contrast the following risk-adjusted performance appraisal mea-
sures in their ex post forms: ex post alpha, Treynor measure, Sharpe ratio, and M2.• Distinguish between the information ratio and the Sharpe ratio.• Evaluate the risk-adjusted performance of one or more portfolios.• Demonstrate the use of performance quality control charts in performance appraisal.• Discuss the issues involved in manager continuation policy decisions, including the costs
of hiring and firing investment managers.• Contrast Type I and Type II errors in manager continuation decisions.
SUMMARY OVERVIEW
Performance evaluation is as important as it is challenging. Decisions reached concerningmanager skill can affect the attainment of investment objectives. It therefore benefits investorsand their advisers to be up to date in their knowledge of this field.
• From the fund sponsor’s perspective, performance evaluation serves as a feedback mecha-nism to a fund’s investment policy. It identifies strengths and weaknesses, attributes resultsto key decisions, and focuses attention on poor performance. It provides evidence to fundtrustees on whether the investment program is being conducted effectively. From theinvestment manager’s perspective, performance evaluation permits an investigation of theeffectiveness of various elements of the investment process and the contributions of thoseelements to investment results.
• Performance evaluation is composed of three parts: (1) performance measurement,(2) performance attribution, and (3) performance appraisal.
114 Learning Outcomes, Summary Overview, and Problems
• The rate of return on an asset is typically defined as the investment-related growth in theasset’s value over the evaluation period. When there are intraperiod cash flows, the rate ofreturn can be measured as the growth rate applied to a single dollar invested at the start ofthe period (time-weighted rate of return, or TWR) or to an ‘‘average’’ amount of dollarsinvested over the evaluation period (money-weighted rate of return, or MWR). The MWRis sensitive to the size and timing of cash flows, but the TWR is not. Because investmentmanagers rarely have control over the size or timing of cash flows, the TWR is the mostcommonly used performance measure.
• When the investment manager has control over the size and timing of cash flows into anaccount, the MWR may be an appropriate performance measure.
• When the MWR is calculated over reasonably frequent time periods and those returnsare chain-linked over the entire evaluation period, which could be of any length, anapproximation of the TWR for the period, called the linked internal rate of return (LIRR),is obtained.
• If external funds are added to an account prior to a period of strong performance, theMWR will give a higher rate of return than the TWR. If a large amount is withdrawn priorto a period of strong performance, the MWR will yield a lower rate of return than theTWR. The opposite effect is experienced during periods of weak performance.
• Data quality is important in determining the accuracy of rates of return. Rates of returnfor large-capitalization securities are likely to be more accurate than those for illiquid andinfrequently priced assets.
• A valid benchmark should meet the following criteria: It should be unambiguous, investable,measurable, and appropriate for the manager’s style and area of expertise; reflect currentinvestment opinions; be specified in advance; and exhibit ownership by the investmentmanager.
• The types of benchmarks in common use are: absolute return, manager universes, broadmarket indexes, style indexes, factor model–based, returns-based, and custom security-based. A custom security–based benchmark meets all fundamental and quality-basedbenchmark criteria, making it the most appropriate benchmark to use.
• The median manager or median fund, though intuitively appealing, lacks the followingdesirable benchmark properties: It is not specified in advance, it is not investable, and itcannot serve as a passive investment.
• Steps in creating a custom security-based benchmark are: Identify prominent aspects ofthe manager’s investment process; select securities consistent with that investment process;devise a weighting scheme for the benchmark securities, including a cash position; reviewthe preliminary benchmark and make modifications; and rebalance the benchmark portfolioon a predetermined schedule.
• Good benchmarks should generally display the following characteristics: minimal systematicbias between the account and the benchmark, less tracking error of the account relative tothe benchmark when compared to alternative benchmarks, strong correspondence betweenthe manager’s universe of potential securities and the benchmark, and low turnover.
• When a factor model is used as a benchmark, an analysis of past portfolios gives a sense oftypical exposures (betas) to various systematic sources of return. A ‘‘normal’’ portfolio isone in which the factor sensitivities are set to these ‘‘normal’’ betas.
• Performance attribution compares account and benchmark performance and identifiesand quantifies sources of differential returns. It requires an appropriate framework fordecomposing an account’s returns relative to those of the benchmark.
Chapter 12 Evaluating Portfolio Performance 115
• A manager has two basic avenues for superior performance relative to the benchmark:(1) selecting superior (or avoiding inferior) performing assets and (2) owning the superior(inferior) assets in greater (lesser) proportions than are held in the benchmark.
• Performance attribution conducted at the fund sponsor level is called macro attribution.It has three sets of inputs: (1) policy allocations to asset categories within the fundand to individual managers within asset categories; (2) benchmark portfolio returns; and(3) account returns, valuations, and external cash flows.
• Several decision-making levels can be of interest when evaluating a fund sponsor’s decision-making process. These decision levels include: net contributions, the risk-free asset, assetcategories, investment style, investment managers, and allocation effects.
• Micro attribution is concerned with the investment results of individual portfolios ratherthan the entire fund. Over a given period, the difference between the portfolio returnand the benchmark return is the manager’s value-added return, or active return. Becausesecurity-by-security micro attribution is unwieldy, a more productive method uses a factormodel of returns to assign value-added return to sources of systematic returns.
• The common stock manager’s value-added can be expressed as the difference betweenthe weighted average return on the economic/industry sectors in the portfolio and thebenchmark. This value-added return can be further divided into (1) a pure sector alloca-tion component, (2) a within-sector selection component, and (3) an allocation/selectioninteraction.
• For common stocks, fundamental factors such as company size, industry, and growthcharacteristics seem to have a systematic impact on account performance. These factors canbe combined with economic sector factors to conduct micro attribution.
• Fixed-income portfolio returns may be decomposed to show the contributions from theexternal interest rate environment, on one hand, and the management effect, on the other.
• The widely accepted tenet that investors are risk averse leads to risk-adjusted performanceappraisal methods which compare returns with an account’s corresponding risk. Two typesof risk measures are typically used: the account’s systematic risk (beta) and the account’sstandard deviation of returns.
• There are several measures of the return relative to the risk of a portfolio. The ex post alphameasures the account’s excess return over the risk-free rate relative to the excess returnof the market proxy over the risk-free rate scaled by the account’s beta. The intercept,or alpha, from the estimating regression is a measure of the manager’s skill. The Treynormeasure is similar to the ex post alpha measure and will always give the same assessment ofinvestment skill. It is the account’s average return less the average risk-free rate divided bythe account’s beta. Unlike the ex post alpha and Treynor measures, which compare returnson an account relative to its systematic risk, the Sharpe ratio measures returns relative tothe account’s standard deviation of returns. The Sharpe ratio is an account’s average returnless the average risk-free rate divided by the account’s standard deviation. The M2 measureis equal to the Sharpe measure multiplied by the standard deviation of the market indexand then added to the average risk-free rate.
• The Sharpe ratio can be generalized to directly compare the performance of an account tothat of a specific benchmark. In this general form, the Sharpe ratio is called the informationratio and is defined as the excess return of the account over the benchmark, divided by thestandard deviation of the excess returns.
• Roll’s critique is a major issue when using methods based on the capital asset pricing model(CAPM) to evaluate performance. Slight changes in the market portfolio surrogate canyield significantly different performance appraisal answers.

116 Learning Outcomes, Summary Overview, and Problems
• Quality control charts are an effective way of illustrating performance appraisal data. Insimple terms, a quality control chart plots a portfolio manager’s performance over timeand relative to a benchmark within a statistically derived confidence band. The confidenceband indicates whether the manager’s performance was statistically different from that ofthe benchmark.
• Fund sponsors adopt manager continuation policies (MCPs) to guide their managerevaluations. An MCP seeks to develop consistent procedures designed to retain goodmanagers and remove inferior ones based on both quantitative and qualitative information.
• If we begin with the null hypothesis that all managers under evaluation are zero-value-addedmanagers (have no investment skill) and our goal is to identify and separate positive-value-added managers from those without skill, then two types of error can occur. A Type I errorresults when we keep or hire managers because we believe they are superior when in factthey are not. A Type II error causes us to not reject the null hypothesis when it is incorrect,thus firing or not hiring skillful managers.
PROBLEMS
1. Paul Joubert retired from his firm. He has continued to hold his private retirementinvestments in a portfolio of common stocks and bonds. At the beginning of 2002,when he retired, his account was valued at ¤453,000. By the end of 2002, the value ofhis account was ¤523,500. Joubert made no contributions to or withdrawals from theportfolio during 2002. What rate of return did Joubert earn on his portfolio during 2002?
2. Frederic Smith works for the Swanson Manufacturing Company and participates in thesavings plan at work. He began the month with a balance in his account of £42,000.When he got paid on the last day of the month, the company deposited 10 percent of hisgross salary into his savings plan account (£5,000 gross salary). The ending balance in hisaccount at the end of the month was £42,300.
A. What was the rate of return for the month in Smith’s savings plan?B. What would be the rate of return for the month if Swanson had paid Smith and
deposited 10 percent of his salary on the first rather than the last day of the month,holding all else constant?
3. Mary Nesbitt has an investment account with a local firm, and she makes contributionsto her account as funds become available. Self-employed, Mary receives money from herclients on an irregular basis. She began the month of September with a balance in heraccount of $100,000. She received funds in the amount of $3,000 and made a depositinto her account on September 14. Next, she received a payment of $2,500 on September21 and made another contribution. The value of her account after the first contributionwas $105,000, and the account value was $108,000 after the second contribution. Theaccount was valued at $110,000 at the end of the month. Mary believes that it will bedifficult, if not impossible, to determine an accurate rate of return for her account, sinceher cash flows do not occur on a regular basis.
A. State and justify whether an accurate rate of return can be calculated.B. If an accurate rate of return can be calculated, determine that rate of return.

Chapter 12 Evaluating Portfolio Performance 117
4. An investment manager has time-weighted returns for the first six months of the year asfollows:
January: 1.25%February: 3.47%March: –2.36%April: 1.89%May: –2.67%June: 2.57%
A. Calculate a time-weighted rate of return for the investment manager by chain-linkingthe monthly time-weighted returns.
B. Compare and contrast the time-weighted rate of return with a calculation involvingadding the monthly rates of return.
5. Compare and contrast the time-weighted rate of return with the money-weighted rate ofreturn. In general terms, how is each calculated? Are there certain situations that wouldcause the two methods to have drastic differences in the calculated rates of return?
6. A pension portfolio manager is about to upgrade his performance calculation software.Currently, his performance software will only calculate his performance on a quarterlybasis. For the year 2005, the quarterly performance numbers are as shown below:
Quarter 1: 5.35%Quarter 2: –2.34%Quarter 3: 4.62%Quarter 4: 1.25%
These values were calculated on a money-weighted rate-of-return basis.
A. Explain how you would approximate a time-weighted rate of return for the entire year(2005).
B. Determine the approximate time-weighted rate of return.
7. Swennson, who manages a domestic equities portfolio of Swedish shares, has had fairlyvolatile returns for the last five years. Nevertheless, Swennson claims that his returns overthe long run are good. Another Swedish equity manager, Mattsson, has had less volatilereturns. Their records are as follows:
Year Swennson Mattsson
1 27.5% 5.7%2 –18.9% 4.9%3 14.6% 7.8%4 –32.4% –6.7%5 12.3% 5.3%

118 Learning Outcomes, Summary Overview, and Problems
Assume no interim cash flows.
A. Calculate the annualized rates of return for Swennson and Mattsson.B. State which manager achieved a higher return over the five-year period.
8. A U.S. large-cap value portfolio run by Anderson Investment Management returned18.9 percent during the first three quarters of 2003. During the same time period, theRussell 1000 Value Index had returns of 21.7 percent and the Wilshire 5000 returned25.2 percent.
A. What is the return due to style?B. What is the return due to active management?C. Discuss the implications of your answers to Parts A and B for assessing Anderson’s
performance relative to the benchmark and relative to the market.
9. You have selected a U.S. domestic equity manager for a small-cap mandate. Yourconsultant has suggested that you use the Russell 2000® Index as a benchmark. Youfind the following information on the Russell/Mellon web site (www.russellmellon.com):
Russell 3000® IndexThe Russell 3000 Index offers investors access to the broad U.S. equity universe
representing approximately 98 percent of the U.S. market. The Russell 3000 is constructedto provide a comprehensive, unbiased, and stable barometer of the broad market and iscompletely reconstituted annually to ensure new and growing equities are reflected.
Russell 2000® IndexThe Russell 2000 Index offers investors access to the small-cap segment of the U.S.
equity universe. The Russell 2000 is constructed to provide a comprehensive and unbiasedsmall-cap barometer and is completely reconstituted annually to ensure larger stocks donot distort the performance and characteristics of the true small-cap opportunity set. TheRussell 2000 includes the smallest 2000 securities in the Russell 3000.
As of the latest reconstitution, the average market capitalization was approximately$607.1 million; the median market capitalization was approximately $496 million.The index had a total market-capitalization range of approximately $1.6 billion to$175.8 million.
What analysis could you conduct to verify that the Russell 2000® index is appropriatefor the small-cap manager?
10. The information in Exhibit 12-1 pertains to a New Zealand pension plan sponsor.Based on the information given in the table, address the following:
A. Which asset classes and managers have done relatively well and which have donerelatively poorly as judged by returns alone?
B. Characterize the overall performance of the pension plan sponsor.C. Assuming that relative outperformance or underperformance as indicated in the table
is representative of performance over a substantial time period, would you recommendany changes? If so, what changes would you consider?
11. Briefly discuss the properties that a valid benchmark should have.12. Kim Lee Ltd., an investment management firm in Singapore managing portfolios of
Pacific Rim equities, tells you that its benchmark for performance is to be in the topquartile of its peer group (Singapore managers running portfolios of Pacific Rim equities)over the previous calendar year. Is this a valid benchmark? Why or why not?
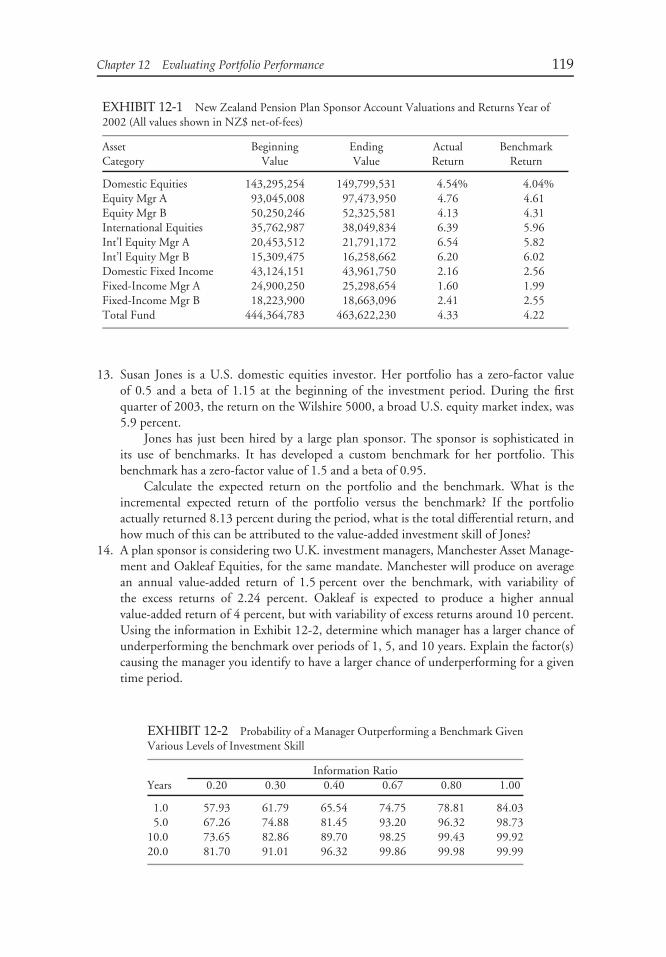
Chapter 12 Evaluating Portfolio Performance 119
EXHIBIT 12-1 New Zealand Pension Plan Sponsor Account Valuations and Returns Year of2002 (All values shown in NZ$ net-of-fees)
Asset Beginning Ending Actual BenchmarkCategory Value Value Return Return
Domestic Equities 143,295,254 149,799,531 4.54% 4.04%Equity Mgr A 93,045,008 97,473,950 4.76 4.61Equity Mgr B 50,250,246 52,325,581 4.13 4.31International Equities 35,762,987 38,049,834 6.39 5.96Int’l Equity Mgr A 20,453,512 21,791,172 6.54 5.82Int’l Equity Mgr B 15,309,475 16,258,662 6.20 6.02Domestic Fixed Income 43,124,151 43,961,750 2.16 2.56Fixed-Income Mgr A 24,900,250 25,298,654 1.60 1.99Fixed-Income Mgr B 18,223,900 18,663,096 2.41 2.55Total Fund 444,364,783 463,622,230 4.33 4.22
13. Susan Jones is a U.S. domestic equities investor. Her portfolio has a zero-factor valueof 0.5 and a beta of 1.15 at the beginning of the investment period. During the firstquarter of 2003, the return on the Wilshire 5000, a broad U.S. equity market index, was5.9 percent.
Jones has just been hired by a large plan sponsor. The sponsor is sophisticated inits use of benchmarks. It has developed a custom benchmark for her portfolio. Thisbenchmark has a zero-factor value of 1.5 and a beta of 0.95.
Calculate the expected return on the portfolio and the benchmark. What is theincremental expected return of the portfolio versus the benchmark? If the portfolioactually returned 8.13 percent during the period, what is the total differential return, andhow much of this can be attributed to the value-added investment skill of Jones?
14. A plan sponsor is considering two U.K. investment managers, Manchester Asset Manage-ment and Oakleaf Equities, for the same mandate. Manchester will produce on averagean annual value-added return of 1.5 percent over the benchmark, with variability ofthe excess returns of 2.24 percent. Oakleaf is expected to produce a higher annualvalue-added return of 4 percent, but with variability of excess returns around 10 percent.Using the information in Exhibit 12-2, determine which manager has a larger chance ofunderperforming the benchmark over periods of 1, 5, and 10 years. Explain the factor(s)causing the manager you identify to have a larger chance of underperforming for a giventime period.
EXHIBIT 12-2 Probability of a Manager Outperforming a Benchmark GivenVarious Levels of Investment Skill
Information RatioYears 0.20 0.30 0.40 0.67 0.80 1.00
1.0 57.93 61.79 65.54 74.75 78.81 84.035.0 67.26 74.88 81.45 93.20 96.32 98.73
10.0 73.65 82.86 89.70 98.25 99.43 99.9220.0 81.70 91.01 96.32 99.86 99.98 99.99

120 Learning Outcomes, Summary Overview, and Problems
15. You are a plan sponsor trying to decide between two equity portfolio managers. As youreview the information you have gathered during your search, you notice that the twomanagers have similar investment styles and similar returns for the equity portion of theirportfolios. However, the first manager, Acorn Asset Management, keeps its cash level verylow, typically around 1 percent of assets. But the second manager, Zebra Investments, hasmuch more cash in the portfolio and usually keeps approximately 10 percent in cash forclients’ accounts.
Contrast Zebra and Acorn in terms of cash level in the accounts relative to overallportfolio performance. Are there time periods when higher or lower cash levels could bebeneficial to an equity portfolio?
16. Briefly explain the challenges inherent in performance measurement and performanceevaluation for a long–short hedge fund. If traditional performance measurement andevaluation are not appropriate in a long–short environment, are there other options thatmay be useful?
17. Compare and contrast macro attribution with micro attribution. What is the differencebetween using a return metric and using a dollar metric? Briefly discuss the inputs andmethodology that could be used with a macro analysis.
CHAPTER 13GLOBAL INVESTMENT
PERFORMANCESTANDARDS
Philip Lawton, CFACFA Institute
Charlottesville, Virginia
W. Bruce Remington, CFAWells Fargo
Lincoln, Nebraska
LEARNING OUTCOMES
After completing this chapter, you will be able to do the following:
• Summarize the reasons for the creation of the Global Investment Performance Standards(GIPS®standards), the standards’ evolution, and their benefits to an investment firm’smanagers and prospective clients.
• Formulate the objectives, key characteristics, and scope of the GIPS standards.• Discuss the fundamentals of compliance with the GIPS standards, including the def-
inition of the firm, the conditions under which an investment management firmcan claim compliance, and the correct wording of the prescribed GIPS compliancestatement.
• Formulate the requirements and recommendations of the GIPS standards with respectto input data, including accounting policies related to asset valuation and performancemeasurement.
• Summarize and justify the requirements of the GIPS standards with respect to return calcu-lations including the treatment of large external cash flows, and calculate a time-weightedtotal return consistent with those standards.
121

122 Learning Outcomes, Summary Overview, and Problems
• Formulate the requirements and recommendations of the GIPS standards with respect tocomposite return calculations, including methods for asset-weighting portfolio returns.
• Demonstrate the meaning of ‘‘discretionary’’ in the context of composite construction andevaluate whether a portfolio is discretionary given a description of the relevant facts.
• Discuss the role of investment strategies or styles in the construction of composites.• Formulate the requirements and recommendations of the GIPS standards with respect to
composite construction, including switching portfolios among composites and the tim-ing of including new portfolios in composites and excluding terminated portfolios fromcomposites.
• Formulate the requirements and recommendations of the GIPS standards for: asset classsegments carved out of multiasset class portfolios; fees; the use of leverage and derivatives;conformity with local laws and regulations that conflict with the GIPS standards; andnoncompliant performance records.
• Formulate the requirements of the GIPS standards with respect to presentation and report-ing, including the required timeframe of compliant performance records, annual returns,composite market values, and benchmarks.
• Discuss the conditions under which the performance record of a past firm or affiliationmust be linked to or used to represent the historical record of a new firm or new affiliation.
• Evaluate the relative merits of high/low, interquartile range, and standard deviation asmeasures of the dispersion of portfolio returns within a composite.
• Discuss the recommendations of the GIPS standards with respect to presentation andreporting.
• Explain the types of investments that are subject to the GIPS standards for real estate andprivate equity.
• Explain the requirements of the GIPS standards with respect to reporting total return,income return, and capital return for real estate assets.
• Summarize the performance presentation requirements and recommendations for privateequity.
• Discuss the purpose and scope of verification.• Formulate the requirements for compliance with the GIPS Advertising Guidelines.• Discuss approaches to after-tax benchmark selection and contrast the preliquidation and
mark-to-liquidation methods for calculating after-tax performance.• Identify the items in a performance report that are not compliant with GIPS standards and
revise the report to bring it into compliance.
SUMMARY OVERVIEW
The Global Investment Performance Standards meet the need for consistent, globally acceptedstandards for investment management firms in calculating and presenting their results toclients and potential clients. This chapter has made the following points:
• The GIPS standards are ethical standards that promote fair representation and full disclosureof an investment firm’s performance history. The GIPS standards were created and fundedby CFA Institute (formerly known as the Association for Investment Management andResearch, or AIMR) with the participation of many experts and local sponsorship fromnumerous industry groups. The Investment Performance Council is the governance bodyresponsible for developing and interpreting the GIPS standards.
Chapter 13 Global Investment Performance Standards 123
• The objectives of the GIPS standards are to obtain worldwide acceptance of a commonstandard for calculating and presenting investment performance; to ensure accurate andconsistent performance data; to promote fair, global competition for all markets; and tofoster the notion of industry self-regulation.
• Only investment management firms can claim compliance with the GIPS standards. Afirm may claim compliance only when it has satisfied all the requirements of the GIPSstandards.
• Portfolio valuations must be based on market values (not cost basis or book values). Accrualaccounting must be used for all assets that accrue interest income, and for periods beginningJanuary 1, 2005, trade-date accounting must be used.
• Under the GIPS provisions for return-calculation methodology, firms must calculate time-weighted total returns. For periods beginning January 1, 2005, if a firm uses approximatedrates of return, it must adjust them for daily weighted cash flows. For periods beginningJanuary 1, 2010, firms must value portfolios on the date of all large external cash flows.
• Large external cash flows can significantly distort the accuracy of estimated returns whenmarkets are volatile. The GIPS standards require firms to document composite-specificpolicies for the treatment of external cash flows and to adhere to those policies consistently.
• Total return calculations must include returns from cash and cash equivalents and must bereduced by actual trading expenses.
• Composite returns must be calculated by asset-weighting the individual portfolio returnsusing beginning-of-period values or a method that reflects both beginning-of-period valuesand external cash flows.
• All actual, fee-paying, discretionary portfolios must be included in at least one composite.Portfolios are discretionary if client-imposed restrictions do not prevent the firm fromimplementing the intended investment strategy.
• Composites must be defined according to their investment objectives or strategies.• Firms must include new portfolios in composites on a timely and consistent basis.
Terminated portfolios must be included in the historical record of the appropriatecomposite up to the last full measurement period they were under management. A firmcannot switch portfolios from one composite to another unless documented changes inclient guidelines make switching appropriate or the composite is redefined.
• When a single asset class (e.g., equities) is carved out of a multiple asset class portfolio(e.g., a balanced account invested in equity and fixed-income securities) and the returns arepresented as part of a single-asset-class composite, cash must be allocated to the carve-outreturns in a timely and consistent manner. Beginning January 1, 2010, carve-out returnsare not permitted to be included in single asset class composite returns unless the carved-outsegment is actually managed separately with its own cash balance.
• The GIPS standards include detailed disclosure requirements related to the firm, per-formance calculations and benchmarks, fees, composites, and composite performancepresentations, among other items. Additional disclosures are recommended.
• The GIPS provisions for presentation and reporting require that at least five years ofGIPS-compliant performance must be shown (or from inception if the firm or compositehas been existence for a shorter period). The GIPS-compliant performance record mustthen be extended each year until 10 years of results are presented.
• The GIPS standards specify required elements of composite performance presentations,including annual composite and benchmark returns for all years presented, the numberof portfolios in the composite (if five or more), the amount of assets in the composite,either the percentage of the firm’s total assets represented by the composite or the

124 Learning Outcomes, Summary Overview, and Problems
amount of total firm assets at the end of each period, and a measure of dispersion ofindividual portfolio returns within the composite. Additional presentation elements arerecommended.
• Acceptable measures of dispersion include but are not limited to high/low, the interquartilerange, and standard deviation.
• Performance track records of a past firm or affiliation must be linked to or used to representthe historical record of a new firm or affiliation if all the following conditions are met:substantially all the investment decision makers are employed by the new firm; the staffand decision-making process remain intact and independent within the new firm; and thenew firm has records that document and support the reported performance. The new firmmust disclose that the performance results from the past firm are linked to the performancerecord of the new firm.
• If a firm uses a custom benchmark, it must describe the benchmark creation and rebalancingprocess. The frequency of rebalancing can affect the reported benchmark return.
• The main GIPS standards also apply to real estate and private equity; however, specificprovisions exist for these two asset classes.
• Real estate investments must be valued at market value at least once every 12 months(for periods beginning January 1, 2008, at least quarterly). Real estate investments mustbe valued at least every 36 months by an external professionally designated, certified orlicensed commercial property valuer or appraiser.
• In addition to total return for real estate, a firm must show the income and capital appreci-ation component returns and disclose the calculation methodology for component returns.The GIPS provisions for real estate also recommend that firms present the since-inceptioninternal rate of return (SI-IRR) for the composite.
• Private equity investments must be valued according to the GIPS Private Equity ValuationPrinciples, which recommend fair value valuations. Firms must calculate the annualizedSI-IRR using either daily or monthly cash flows and the period-end valuation of theremaining holdings.
• Performance presentations for private equity must include the annualized gross-of-fees andnet-of-fees SI-IRR of the composite and of the benchmark, if any, for each year sinceinception. Paid-in capital, invested capital, and cumulative distributions must be presentedfor each period. The investment multiple (the ratio of total value to paid-in capital, orTVPI), the realization multiple (the ration of cumulative distributions to paid-in capital,or DPI), the ratio of paid-in capital to committed capital (PIC), and the ratio of residualvalue to paid-in capital (RVPI) must also be presented for each period.
• Verification is the review of a firm’s performance measurement processes and procedures bya qualified, independent third party. Verification tests whether the firm has complied withall the composite construction requirements on a firmwide basis and whether the firm’sprocesses and procedures are designed to calculate and present performance in compliancewith the GIPS standards. A single verification report is issued for the entire firm; verificationcannot be carried out for an individual composite. Firms that have been verified may chooseto have a further in-depth examination of a specific composite presentation, but they cannotmake any claim to the effect that a composite has been verified.
• The GIPS Advertising Guidelines allow a firm to claim compliance with the GIPS standardsin an advertisement. All advertisements stating a claim of compliance following the GIPSAdvertising Guidelines must use the prescribed wording for the claim. Advertisementsthat state a claim of compliance and show performance results must present additionalinformation taken from a GIPS-compliant performance presentation.
Chapter 13 Global Investment Performance Standards 125
• The GIPS standards do not require firms to present after-tax returns. For a conceptualframework, the former AIMR Performance Presentation Standards included provisionsfor after-tax return calculations. Preliquidation after-tax returns reflect the impact of taxesrealized during the measurement period. Mark-to-liquidation methods calculate the after-tax returns that would be earned if unrealized gains held in the portfolio were immediatelyrealized. After-tax returns should be calculated using the client’s anticipated tax rate orthe highest applicable tax rate. Supplemental information may include returns adjusted tocompensate for the tax impact of nondiscretionary asset sales, information about the benefitsof tax loss harvesting during the measurement period, and various tax efficiency measures.
PROBLEMS
1. Walker, Pierce Corporation is a global financial services company. In addition to itsLondon headquarters, the company has subsidiaries in New York, Frankfurt, and HongKong. Walker, Pierce Corporation has decided not to implement the GIPS standards.However, the head of marketing for its continental European subsidiary, Walker, Pierce& Company of Frankfurt, believes that the division would benefit by implementing theGIPS standards. Is it possible for Walker, Pierce & Company of Frankfurt to becomeGIPS-compliant even if Walker, Pierce Corporation does not implement the GIPSstandards companywide?
2. Larson Dynamic Management claims to comply with the GIPS standards. At the time thefirm first achieved compliance, trade-date accounting was recommended but settlementdate accounting was acceptable. On January 1, 2005, trade-date accounting becamemandatory. Larson Dynamic Management has been unable to reprogram its accountingsystem to produce statements on a trade-date basis. Larson Dynamic Management includesthe following statement with composite performance presentations covering periods thatbegan after January 1, 2005: ‘‘Larson Dynamic Management has prepared and presentedthis report in compliance with the Global Investment Performance Standards (GIPS®),except that settlement date accounting has been used as an acceptable alternative.’’ Is thiscompliance statement allowable?
3. The Dennett Electronics Pension Plan had the following quarterly returns during the lasttwo years:
1Q Year 1: +4.76%2Q Year 1: +12.08%3Q Year 1: –4.88%4Q Year 1: +7.14%1Q Year 2: –13.57%2Q Year 2: +17.65%3Q Year 2: +1.08%4Q Year 2: +0.97%
Calculate the following:
A. Annual performance for Year 1.B. Annual performance for Year 2.

126 Learning Outcomes, Summary Overview, and Problems
C. Cumulative performance for the two-year period.D. Annualized compound performance for the two-year period.
4. Smith & Jones Asset Management has been managing equity, fixed-income, and balancedaccounts since 1986. Senior management has decided that to remain competitive andfairly present performance to prospective clients, the firm must adopt the GIPS standardscompanywide. After compiling performance data, management discovers that prior to1999, the market values of fixed-income securities excluded accrued income. In addition,some accounts used derivative securities for hedging. Is it possible for Smith & Jones toincorporate pre-1999 performance into a GIPS-compliant performance presentation?
5. In March 1997, Smith & Jones Asset Management, a GIPS-compliant firm, introduceda new technical analysis model that management believed would be a powerful toolin tactical asset allocation. After extensive back-testing, Smith & Jones began to usethe model to manage actual ‘‘live’’ portfolios in June 1997, and managers constructed acomposite composed of actual, fee-paying, discretionary portfolios managed in accordancewith the model. In 2000, after three very successful years of managing client funds in thisway, management decided that because the actual performance of live portfolios validatedthe performance of the model, it should present the simulated performance of the modelthrough the back-testing period to prospective clients. Smith & Jones proceeded to linkthe backtested returns to the actual performance of the composite and presents 3-, 5- and10-year performance as a continuous record to prospects. Does this practice comply withthe GIPS standards?
6. Barry, Smith Investment Management specializes in balanced account management formidsize pension plans. On March 12, 2006, a contribution of $2,265,000 is made toDennett Electronics’ Pension Plan, which is included in Barry Smith’s Balanced Tax-Exempt Composite. Barry, Smith invests the contribution on March 12. The pensionplan’s portfolio had a market value of $16,575,000 at the beginning of March. Forthe purpose of calculating portfolio performance, how should Barry, Smith handle theexternal cash flow?
7. Use the following input data on the Dennett portfolio for the month of March 2006 toanswer questions A through C.
Market value 28 February $16,575,000Cash contribution 12 March 2,265,000Market value March 12a 19,550,000Market value March 31 19,250,000aIncludes cash contribution of $2,265,000 received andavailable for investment on 12 March
A. Calculate the approximate time-weighted return for March using the Modified Dietzformula.
B. Calculate the true time-weighted rate of return for March.C. What accounts for the difference between the approximate and the true return?
8. How must the firm treat trading expenses when calculating performance that adheres tothe requirements of the GIPS standards? What is the rationale for the required treatment?
9. A European equity composite contains three portfolios. Use the data given in Exhibit13-1 to answer parts A through C.

Chapter 13 Global Investment Performance Standards 127
EXHIBIT 13-1 European Equity Composite
Portfolio (¤ Millions)
Cash Flow Weighting Factor A B C
Market value as of July 31 74.9 127.6 110.4External cash flowsAugust 8 0.742 –15August 12 0.613 7.5August 19 0.387 –5 15Market value as of August 31 85.3 109.8 128.4
A. Calculate the returns of Portfolio A, Portfolio B, and Portfolio C for the month ofAugust using the Modified Dietz formula. For convenience, the cash flow–weightingfactors are presented above.
B. Calculate the August composite return by asset-weighting the individual portfolioreturns using beginning-of-period values.
C. Calculate the August composite return by asset-weighting the individual portfolioreturns using a method that reflects both beginning-of-period values and external cashflows.
10. Explain how the concept of discretion is used to determine whether or not an accountshould be included in a composite.
11. Midwest National Bank manages a domestic equity portfolio for the Springfield MunicipalEmployees’ Retirement Fund (SMERF), a mature defined-benefit pension plan. TheSMERF portfolio belongs to Midwest’s Institutional Equity composite. The compositedescription states, ‘‘Portfolios included in the Institutional Equity composite are activelymanaged for long-term capital appreciation.’’ SMERF’s investment policy statementincludes the following provisions:
• All security transactions must be approved in advance by the SMERF InvestmentCommittee.
• SMERF anticipates making regular net withdrawals in substantial amounts from theportfolio to meet pension liabilities. SMERF staff will prepare a schedule of withdrawalsat the beginning of each fiscal year. The portfolio manager must manage liquidity so asto disburse funds in accordance with the withdrawal schedule.
In view of these restrictions, discuss whether Midwest National Bank can justifyincluding the SMERF portfolio in the composite.
12. The GIPS standards require that a firm’s composites must be defined according to similarobjectives, strategies, or styles. State the guiding principles for composite definition, andexplain the suggested hierarchy for defining composites.
13. Smith & Jones Asset Management manages numerous balanced accounts in addition toequity and fixed-income accounts. Discuss an approach for defining balanced accountcomposites in accordance with the GIPS standards.
14. When should a new client’s portfolio be added to an existing composite?15. Under what conditions may a portfolio be switched from one composite to another? How
must the historical record of the portfolio be treated?16. What is the minimum number of portfolios that a composite must contain to comply
with the GIPS standards? Must a firm disclose the number of portfolios in a composite?
128 Learning Outcomes, Summary Overview, and Problems
17. The performance of the equity composites presented by Shelbourne Capital Companydeclines after seven members of the equity investment management group leave the smallfirm in April 2006. The head of performance measurement informs senior managementthat the GIPS standards require firms to disclose all significant events that help a prospec-tive client interpret the performance record. The chief investment officer, who headsShelbourne’s Investment Strategy Committee, responds that it is the firm’s investmentdecision process, not the talent of individual employees, that produces returns and thatthe recent underperformance was caused by factors other than employee turnover. ShouldShelbourne Capital Company disclose the departure of the equity managers in its equityperformance presentations?
18. Smith & Jones wants to include the performance and assets of the equity and fixed-incomeportions of its balanced accounts in separate composites. Management recognizes that theGIPS standards require cash to be allocated to carve-out segments. Data on a balancedaccount composite with an 80/20 strategic asset allocation appear below.
Market Value asof June 30
StrategicMix
JulyReturn
Stocks 96,425,706 80% 0.79%Bonds 20,777,934 20% 0.44%Cash 8,514,010 0% 0.21%Total balanced composite assets 125,717,650 100% 0.69%
A. Calculate the return for the month of July of the equity segment, including cashallocated in accordance with the beginning-of-period allocation method.
B. Calculate the July return of the equity segment, including cash allocated in accordancewith the strategic asset allocation method.
19. Claiborne and Jackson, recognizing that its equity performance was poor, terminates someof its investment professionals and hires a new team of equity portfolio managers froma rival firm, Shelbourne Capital Company, in 2006. The new employees of Claiborneand Jackson include two members of the former firm’s five-member Investment StrategyCommittee, and these individuals maintain that they were responsible for ShelbourneCapital’s enviable performance track record in equities. All the former Shelbourne Capitalemployees were compelled in a court of law to return records they had taken whenthey left the firm, including client lists and historical performance data. Claiborne andJackson sees that linking the returns of the Shelbourne Capital composites to its owncomposites would improve its ability to compete for new business, and it does not considersuch treatment misleading because prospective clients will have the benefit of the sameinvestment expertise that produced the historical returns. Can Claiborne and Jackson linkthe composite returns its new employees achieved during their affiliation with anotherfirm to its existing composites?
20. Because Smith & Jones Asset Management’s net-of-fees performance record is superb,management has chosen to present performance (calculated monthly using the ModifiedDietz method) net of investment management fees. The firm’s fees are not bundled. Whatare the GIPS standards’ requirements and recommendations regarding the presentationof net-of-fees returns?
21. Bentwood Institutional Asset Management has been managing equity, fixed-income, andbalanced accounts since 1986. The firm became GIPS-compliant on January 1, 2001, and
Chapter 13 Global Investment Performance Standards 129
prepared composite performance presentations for the 1996–2000 period. Fixed-incomeperformance was poor prior to 2001, when a new team of managers was brought onboard. When Christopher Cooper joins Bentwood as marketing director in June 2006, hesuggests showing performance starting with calendar 2001, the first year that performancestarted to improve. He proposes to show composites with returns for the five calendaryears 2001 through 2005. Does this course of action comply with the GIPS standards?
22. Larson Dynamic Management, a GIPS-compliant firm, has specialized in equity invest-ment management for more than 20 years. Employing a large-cap growth style of equitymanagement, the company has compiled a mediocre track record during the last decadeand has slipped below its benchmark during the last three years. The benchmark is acapital market index that is widely used to gauge investment results in the large-capgrowth style. Several of Larson’s portfolio managers have informed Chief InvestmentOfficer Russ Larson that clients are complaining about performance shortfalls versus thebenchmark and are threatening to leave the firm. In addition, the head of marketing hasreported that the firm’s investment performance record compared with the benchmarkis an impediment to winning new business. Larson believes that performance has beenreasonable, given the risk taken in most of the accounts, and counters that perhaps adifferent benchmark is in order. He instructs the head of performance measurement toconduct research on other commercially available large-cap growth indices, with attentionto how the indices are constructed and how their historical returns compare to those ofLarson Dynamic Management’s existing benchmark. What do the GIPS standards sayabout selecting and changing composite benchmarks?
23. Renner, Williams & Woods specializes in management of equity and balanced individual,personal accounts with an emphasis on income generation. Because most of its clients areelderly and care little about performance as long as they receive a steady, monthly incomestream, Renner, Williams & Woods decides that there is no reason to show a benchmarkwhen presenting composite investment performance. Is this decision permissible underthe GIPS standards?
24. A performance analyst determines that an asset-weighted composite return for one year is2.59 percent and the mean return of the portfolios in the composite is 2.57 percent. Shecalculates the following dispersion measures for the portfolios that were in the compositefor the full year:
High 3.65%Low 1.92%High/low range 1.73%Interquartile range 0.82%Equal-weighted standard deviation 0.55%
Explain what these measures mean and evaluate their relative advantages anddisadvantages.
25. Bronson Growth Property is a real estate development organization that raises funds fromwealthy individuals and rehabilitates blighted commercial buildings for sale. Second-quarter financial information about one of Bronson’s funds, called Rehab XI, appears inExhibit 13-2.
A. Using the data in Exhibit 13-2, calculate the capital return for the second quarter.B. Using the data in Exhibit 13-2, calculate the income return for the second quarter.C. Calculate the total return for the second quarter.

130 Learning Outcomes, Summary Overview, and Problems
EXHIBIT 13-2 Rehab XI Second Quarter
Beginning capital as of March 31 8,000,000Capital contribution May 15 (weight: 0.51) 1,000,000Portfolio market value as of March 31 7,450,000Portfolio market value as of June 30 8,375,000Capital expenditures 1,750,000Sale proceeds 2,250,000Accrued investment income 75,000Nonrecoverable expenses 200,000Interest expense on debt 137,500Property taxes paid 20,000
26. Renner, Williams & Woods decides to have its equity and balanced composites verified.Because the firm has only a handful of fixed-income accounts and does not present fixed-income management results in marketing materials shown to prospects, managementdecides that it would be a waste of time and money to hire a verification firm to verifysuch a small composite. Is it possible for Renner, Williams & Woods to obtain a firmwideverification that covers only the equity and balanced composites?
27. Bristol Capital Management manages an equity portfolio on a tax-aware basis for MartinFlemington, a high-net-worth individual. Flemington’s tax accountant advises Bristol thatFlemington’s expected federal income tax rate is 17.2 percent, his expected state incometax rate is 4.3 percent, and his expected city income tax rate is 2.1 percent. State and cityincome taxes are deductible from the federal income tax liability. Dividend income andshort-term capital gains are taxable at the income tax rates. Flemington’s expected long-term capital gains tax rate is 15.0 percent. Information about the Flemington portfolio inthe month of April is given in Exhibit 13-3.
A. Calculate Flemington’s anticipated combined federal, state, and city income tax rateto one decimal place (XX.X%).
B. Assuming that investment income is included in the ending market value, calculatethe approximate pretax time-weighted return for April.
C. Using the Modified Dietz formula, calculate the after-tax return on a preliquidationbasis.
D. Calculate the preliquidation after-tax return adjusted for the impact of nondiscre-tionary capital gains.
EXHIBIT 13-3 Flemington Portfolio
Market value as of March 31 127,945,000Cost as of March 31 92,120,400Withdrawal on April 17 (8,950,000)Market value as of April 30 123,159,825Cost as of April 30 85,676,400Dividend income in April 533,105Net short-term capital gains realized in April 975,000Net long-term capital gains realized in April 12,545,000

Chapter 13 Global Investment Performance Standards 131
EXHIBIT 13-4 Bristol Capital Management Performance Results: Intermediate GlobalFixed-Income Composite January 1, 2002 through March 31, 2007
Year
Gross-of-Fees Return
(percent)
BenchmarkReturn
(percent)No. of
Portfolios
CompositeDispersion(percent)
Total Assets atEnd of Period
($million)
Percent ofFirm Assets($million)
Total FirmAssets
($million)
2002 12.7 10.7 8 6.6 512 21 $2,4382003 9.5 7.2 12 4.7 780 23 3,3912004 2.1 1.5 22 6.5 1,250 27 4,6292005 14.2 14.1 25 3.0 1,425 32 4,4532006 4.9 6.1 29 1.9 1,712 32 4,8911Q 2007 7.1 5.9 34 4.4 1,994 37 5,389
(Returns for 1Q 2007 are annualized)
Bristol Capital Management has prepared and presented this report in compliancewith the Global Investment Performance Standards (GIPS®), except for the use ofcash-basis accounting for the recognition of interest income.
Notes
1. Bristol Capital Management is an independent investment management firm foundedin November 1995.
2. Performance results are presented before investment management and custodial fees.3. Portfolio valuations are computed quarterly and are denominated in U.S. dollars.4. Bristol Capital Management uses derivative products to enhance portfolio returns.5. All accounts worth more than $1 million that are invested in the Intermediate Global
Fixed Income strategy are included in the composite at the beginning of the first fullquarter under management.
6. The Intermediate Global Fixed Income composite includes several non-fee-payingaccounts.
7. Allied Verification, Ltd. has verified the Bristol Capital Management IntermediateGlobal Fixed Income Composite.
28. (Adapted from the 2002 CFA Level III examination)It is 2007. Bristol Capital Management is the intermediate global fixed-income
manager for the Jarvis University endowment fund. Bristol has prepared the performancereport shown in Exhibit 13-4. James Chan, consultant to Jarvis University, reviews thereport and tells the fund’s investment committee that the report does not meet theminimum requirements of the GIPS standards.
Identify four omissions that prevent the Bristol Capital Management performancereport from being in compliance with GIPS standards. Also identify four items includedin the Bristol Capital Management performance report (other than omissions) that donot comply with GIPS standards.


PART IISOLUTIONS

CHAPTER 1THE PORTFOLIO
MANAGEMENT PROCESSAND THE INVESTMENT
POLICY STATEMENT
SOLUTIONS
1. A. The liquidity requirement for this individual is her need for cash in excess of her savingsduring the coming year. Therefore, her liquidity requirement is ¤95,000 − ¤50,000 =¤45,000.
B. The Wilson-Fowler Endowment’s anticipated liquidity requirement is $600,000,calculated as $1 million (the planned contribution to the construction of the newdormitory) minus $400,000 (the anticipated amount of new contributions to theendowment). Note that the amount of 4% × $75 million = $3 million, as providedfor in the spending rule, is fully committed to budgetary support; thus this amountis not available to help meet the endowment’s planned contribution to the buildingproject.
2. The Judd Endowment’s risk tolerance is limited by its ability and willingness to acceptrisk. Risk tolerance is not a function of a need for higher returns. The return objectiveshould be consistent with risk tolerance, so an appropriate return objective for the JuddEndowment is 7 percent. A spending rate of 6 percent is too high for this endowment;raising the return objective to 9 percent would only compound the problem created by a6 percent spending rate, which is inappropriately high for this endowment.
3. A. The country allocation strategy as described mixes elements of active and passiveinvestment approaches. The portfolio weights are actively determined and differ frombenchmark weights, within limits. However, the investments in individual countriesare passive, indexed investments.
B. Overall, we can classify the country allocation strategy as a semiactive or controlled-active investment approach.
4. A. This is an absolute return objective because it does not reference a comparison to theperformance of another portfolio but rather is stated in terms of a fixed number (an8 percent annual return).
135

136 Solutions
B. This is an absolute risk objective because it does not reference a comparison to theperformance of another portfolio but rather is stated in terms of a fixed number (astandard deviation of return of 20 percent a year).
C. This is a relative return objective because it references a comparison to the performanceof other portfolios.
D. This is an absolute risk objective because it addresses the risk that a portfolio’s returnwill fall below a minimum acceptable level over a stated time horizon.
E. This is a relative risk objective because it references a comparison to the performanceof another portfolio, the benchmark.
5. D is correct. The IPS identifies pertinent investment objectives and constraints for aparticular investor. Clearly identified objectives and constraints ensure that the policystatement is accurate and relevant to the investor’s specific situation and desires. The resultshould be an optimal balance between return and risk for that investor. The IPS providesa long-term plan for an investor and a basis for making disciplined investment decisionsover time. The absence of an investment policy statement reduces decision making to anindividual-event basis and often leads to pursuing short-term opportunities that may notcontribute to, or may even detract from, reaching long-term goals.
6. B is correct. An investor’s ability to take risk puts an upper limit on a reasonable returnobjective.
7. D is correct. Even though Stephenson describes his risk tolerance as ‘‘average,’’ his presentinvestment portfolio and his desire for large returns indicate an above-average willingnessto take risk. His financial situation (large asset base, ample income to cover expenses, lackof need for liquidity, and long time horizon) indicates an above-average ability to acceptrisk.
8. B is correct. Stephenson has adequate income to cover his living expenses and has nomajor outlays for which he needs cash, so his liquidity needs are minimal. He is not atax-exempt investor (both income and capital gains are taxed at 30 percent), so taxesshould play a considerable role in his investment decisions.
9. D is correct. Stephenson’s time horizon is long—he is currently only 55 years old. Thetime horizon consists of two stages: the first stage extends to his retirement in 15 years; thesecond stage may last for 20 years or more and extends from retirement until his death.
10. D is correct.
Risk. Stephenson has an above-average risk tolerance based on both his ability andwillingness to assume above-average risk. His large asset base, long time horizon, ampleincome to cover expenses, and lack of need for liquidity or cash flow indicate an above-average ability to assume risk. His concentration in U.S. small-capitalization stocks andhis desire for high returns indicate substantial willingness to assume risk.Return. Stephenson’s financial circumstances (long time horizon, sizable asset base,ample income, and low liquidity needs) and his risk tolerance warrant an above-averagetotal return objective. His expressed desire for a continued return of 20 percent, however,is unrealistic. Coppa should counsel Stephenson on what level of returns to reasonablyexpect from the financial markets over long periods of time and to define an achievablereturn objective.

Chapter 1 The Portfolio Management Process and the Investment Policy Statement 137
11. James Stephenson
1. Underline the word at right that best describes the client’s:
A. Willingness to accept risk Below average Above averageExplanation in 2A below
B. Ability to accept risk Below average Above averageExplanation in 2A below
C. Risk tolerance Below average Above averageExplanation in 2A below
D. Liquidity requirement Significant Not significant$70,000 can be met byexpected annual saving of$350,000 × (1 − 0.3) −$150,000 = $95,000
E. Time horizon Single stage MultistageStage 1: Pre-retirementStage 2: Retirement
F. Overall time horizon Short to intermediateterm
Long termOverall time horizon couldbe 20 to 30 years or more
G. Tax concerns SignificantTaxed at 30% rate
Not significant
2. Discuss appropriate client objectives:
A. Risk. Stephenson has an above-average risk tolerance based on both his ability andwillingness to assume above-average risk. His large asset base, long time horizon,ample income to cover expenses, and lack of need for liquidity or cash flow indicatean above-average ability to assume risk. His concentration in U.S.small-capitalization stocks and his desire for high returns indicate substantialwillingness to assume risk.
B. Return. Stephenson’s financial circumstances (long time horizon, sizable asset base,ample income, and low liquidity needs) and his risk tolerance warrant anabove-average total return objective. His expressed desire for a return 10 percentagepoints above the average return on U.S. small capitalization stocks, however, isunrealistic. The portfolio manager should counsel Stephenson on what level ofreturns to reasonably expect from the financial markets over long periods of timeand to define an achievable return objective.
12. Foothill College Endowment Fund
1. Underline the word at right that best describes the client’s:
A. Risk tolerance Below average Above averageExplanation in 2A below
B. Liquidity requirement Significant Not significantBudgeted support at 4% × $1billion exceeds scholarshipneeds of $39.5 million

138 Solutions
C. Time horizon Single stage MultistageD. Overall time horizon Short to
intermediateterm
Long termProvide support in perpetuity
E. Tax concerns Significant Not significant Tax exempt
2. Discuss appropriate client objectives:
A. Risk. The endowment fund, with a large asset base and very long time horizon, hasan above-average risk tolerance.
B. Return. An estimate for the endowment’s required annual return is the sum of thespending rate (4 percent) plus the expected annual college tuition inflation rate(3 percent) for a total of 7 percent.The endowment’s objective is to maintain the long-term purchasing power of itsassets while providing a stable flow of funds for scholarships.
13. Vincenzo Donadoni
1. Underline the word at right that best describes the client’s:
A. Willingness to accept risk Below average Above averageExplanation in 2A below
B. Ability to accept risk Below average Above averageExplanation in 2A below
C. Risk tolerance Below average Above averageExplanation in 2A below
D. Liquidity requirement SignificantCHF 1.5 million needednowCHF 2 million due innine months
Not significant
E. Time horizon Single stage MultistageThree stages:First nine monthsNext 20 to 30 yearsLife of trust
F. Overall time horizon Short to intermediateterm
Long termOverall time horizon isapproximately 20 to30 years
2. Discuss appropriate client objectives:
A. Risk. Donadoni has an above-average risk tolerance based on both his willingnessand ability to accept above-average risk. He is a risk taker with a long timehorizon, a relatively low need for income, and a large asset base.

Chapter 1 The Portfolio Management Process and the Investment Policy Statement 139
B. Return. To meet his long-term goal of a leaving a CHF 15.0 million trust fund forhis three children, Donadoni must also achieve growth of his current assets. Inaccordance with his above-average risk tolerance and his goal of leaving the trust,Donadoni should adopt an above-average total real return objective.Donadoni has a minimal need for additional cash flow given his current expenses,income, and asset base: (250,000 − 125,000)/(13 million − 1.5 million) = 1.1%.In nine months, his need will grow due to inflation of his expenses, his reductionin income, and his reduced asset base:(250,000 − 0)/(13 million − 1.5 million − 2 million in taxes) = 2.6 percentreturn. As a long-run average, a 2.6 percent real return should be achievable.

CHAPTER 2MANAGING INDIVIDUALINVESTOR PORTFOLIOS
SOLUTIONS
1. Need for cash:
Ongoing expenses ¤132,500/yearEmergency reserve ¤132,500Anticipated income ¤50,000/year art sales¤82,500/year expected total return on portfolio
(subject to risk)¤1,020,000 after taxes from sale of IngerMarine
The after-tax proceeds from the imminent sale of IngerMarine well exceed heranticipated needs for cash for the coming year (2 × ¤132,500 = ¤265,000). Thus,Christa’s liquidity needs are currently met. Because portfolio returns are risky and heranticipated annual income of ¤132,500 just covers her annual cash needs, however,Christa may face a challenge in the form of liquidity requirements at some point in thefuture.
2. After the sale of IngerMarine, Christa’s portfolio will have a market value of roughly¤1,120,000, taking account of the after-tax proceeds from the sale of IngerMarine(¤1,020,000), her balanced mutual funds (¤75,000), and her money market fund(¤25,000). Her expected portfolio return is ¤82,500, equal to a 7.4 percent rate of return.Her required real return, if she reduces her spending by combining her apartment andstudio, is ¤50,000 (art sales of ¤50,000 less ¤100,000 expenses), or 4.5 percent as a rateof return on her portfolio.
Because the portfolio’s expected return of 7.4 percent translates to a real returnof approximately 4.4 percent (7.4 percent less 3 percent inflation), the portfolio is notexpected to meet the return requirement of 4.5 percent.
3. Portfolio guidelines and investment policy should be reviewed whenever a significantchange occurs in the underlying assumptions of the policy statement. At Christa’s portfolioperformance reviews, the need for an interim reevaluation of the policy statement shouldalways be considered. Possible triggers for a policy statement review might include thefollowing:
• A change in personal circumstances affecting risk–return objectives or portfolioconstraints. Examples could include an increase in expected income from nonportfoliosources, uninsured health problems, or marriage.
140

Chapter 2 Managing Individual Investor Portfolios 141
• A change in market conditions affecting long-term risk–return relationships amongasset classes. Examples could include a shift in outlook for inflation and global politicalchanges.
• New investment markets or vehicles. Examples could include markets made accessiblethrough commingled investment funds and retirement saving accounts.
• A change in tax laws. An example could be elimination of the capital gains tax.• A severe performance shortfall, sufficient to jeopardize the portfolio’s ability to meet
expense needs in excess of income from other sources.
4. Hans’s reckless actions will significantly reduce his portfolio. Hopefully, this incidentwill make him aware of his financial vulnerability and the long-term consequences ofhis actions. The potential costs of the accident have created an immediate need forliquidity. Currently, Hans has a diversified equity portfolio valued at ¤200,000 and cashof ¤100,000. If he has not already done so, he should immediately use the cash to retainan attorney for his upcoming legal challenges. He should also make his financial advisoraware of his situation and instruct him or her to establish a high level of portfolio liquidity.Hans may need to convert a portion of his IngerMarine holdings to cash, if he can, andshould notify his father of this possibility. Alternatively, Hans may be able to obtain a loanusing IngerMarine shares as collateral. If the IngerMarine holdings cannot be monetized,Hans may be able to borrow against the equity in his home.
5. In light of the auto accident, Hans must reassess his investment portfolio. Assuming thatthe legal challenges against him are successful, he stands to lose ¤1,000,000 in savings(after insurance). In addition, his legal fees may be large, resulting in a further decline innet worth. His salary has not been reduced, but depending on the outcome of his legaltroubles, he may face job termination. His investment personality profile classified Hansas a spontaneous risk taker, and his propensity to engage in riskier investing will haveto be reevaluated. Even though Hans is young, his ability to take risk has been severelycurtailed by the recent incident. His net worth may be reduced by as much as half, and hefaces the potential loss of his current income. Hans will now need to consider rebuildinghis life, engaging in lower-risk investing until his contingent liabilities are settled.
6. Peter and Hilda are subject to a flat tax of 25 percent on all income and a capital gains taxof 15 percent. The analysis below presents comparative after-tax returns. Even though theHigh Growth Stock Fund maintains high portfolio turnover, its return is high enoughto provide superior after-tax performance. Of course, a complete investment evaluationshould also address the relative risk of each investment alternative. The High GrowthStock Fund is quite likely to have high portfolio volatility, and this factor must also beconsidered before a final decision is made.
After-Tax Investment Evaluation
High-Growth Equity Value Municipal BondInvestment Vehicle Stock Fund Fund Fund
Investment ¤1,000,000 ¤1,000,000 ¤1,000,000Projected income 20,000 25,000 50,000Projected price appreciation 120,000 100,000 20,000Projected income tax liability (5,000) (6,250) 0Projected capital gains tax liabilitya (13,500) (3,750) (450)Net investment gains ¤ 121,500 ¤ 115,000 ¤ 69,550
aGains tax liability = Price appreciation × 15% × Turnover rate.
142 Solutions
7. Remaining investment portfolio:
Stocks ¤ 750,000Bonds 1,000,000Cash 1,000,000Gold 500,000
¤3,250,000
Additional resources:
Hilda’s trust distribution ¤ 75,000/yearHouse 1,200,000Peter’s RSA 50,000
The goal of replacing Peter’s ¤500,000 salary has become a ‘‘desired’’ portfolioreturn that is clearly not realistic. Peter and Hilda must now reconsider the return thatthey will ‘‘require’’ in order to meet their basic financial goals. The required return mustbe reconcilable with their new investment constraints and ability to assume risk. Beforereaching an achievable return objective, Peter and Hilda will have to address some difficultdecisions regarding their future lifestyle and long-term goals. Possible changes mightinclude the following:
• Postpone retirement.• Attempt to rebuild IngerMarine.• Return to the workforce as consultants or salaried employees.• Sell home.• Curtail gifting programs.• Cancel plans for second home.• Cancel investment in Exteriors magazine.• Liquidate Hilda’s design company.
8. Portfolio Constraints
• Liquidity. The Ingers’ short-term liquidity needs have clearly increased. Becausespending commitments are sometimes difficult to curtail, Peter and Hilda may needto withdraw as much as ¤500,000 in the coming year from their remaining assets, topay for expenses previously covered by Peter’s salary. Fortunately, the Ingers have anemergency reserve of cash and bullion equivalent to approximately three years’ salary.
The Ingers must ultimately reconcile their ongoing liquidity needs, as well astargeted liquidity events, with their remaining net worth. Left unchanged, the increasedliquidity requirements will require an increasing allocation to investments with lowervolatility and lower return. At the same time, withdrawals will begin to outstrip returns,leaving the Ingers’ portfolio in a deteriorating situation.
• Time horizon. Peter and Hilda’s investment time horizon has been shortened, as theincreased need to secure their own financial future has left them less able to approachportfolio risk from a multigenerational perspective. Their joint life expectancy, however,would reasonably warrant a portfolio time horizon that is still long term (20 to 25 yearsor more).

Chapter 2 Managing Individual Investor Portfolios 143
• Taxes. Tax rates remain unchanged for the Ingers, although their tax burden will declinewith the loss of Peter’s income. Their business loss from IngerMarine may be availableto offset future investment gains.
• Regulatory environment. The regulatory environment is unchanged.• Unique circumstances. It would be appropriate to note the bankruptcy of IngerMarine
and any consequences it might have for portfolio management, such as the allocationof portfolio assets to build a new family business.
9. A. i. Return objective. Stephenson’s expressed desire for 20 percent average annualreturn is unrealistic. Coppa should counsel Stephenson on the level of returns hecan reasonably expect from the financial markets over long time periods and todefine an achievable return objective. Nevertheless, Stephenson’s circumstancessupport an above-average return objective that emphasizes capital appreciation.This formulation is justified by the following:
• Because Stephenson has a sizable asset base and ample income to cover hiscurrent spending, focus should be on growing the portfolio.
• Stephenson’s low liquidity needs and long time horizon support a long-termcapital appreciation approach.
• Stephenson is in the consolidation phase of his life cycle and does not rely onthe portfolio to meet living expenses.
Stephenson stated that he wants a return in excess of 5.0 percent for theremainder of the year. This short-term goal needs to be considered to the extentpossible but should not be a significant factor in the IPS, which focuses on theclient’s long-term return objective.
To maintain his lifestyle after retirement, Stephenson needs approximately$234,000 in inflation-adjusted after-tax income annually when he retires in 15years [$150,000 × (1.03)15 = $233,695]. Assuming he can achieve a 7 percentreturn (3% inflation + 4% real return = 7%), Stephenson will have $5,500,000in 15 years [$2,000,000 × (1.07)15 = $5,520,000]. Generating $234,000 from a$5,520,000 asset base requires a 4.2% after-tax return.
ii. Risk tolerance. Stephenson has an above-average risk tolerance.
• Although Stephenson describes his risk tolerance as ‘‘average,’’ his currentinvestment portfolio indicates an apparent above-average willingness to takerisk.
• His financial situation (large current asset base, ample income to cover expenses,lack of need for liquidity or cash flow, and long time horizon) indicates anabove-average ability to assume risk.
iii. Liquidity requirements. Stephenson’s liquidity needs are low.
• Stephenson has no regular cash flow needs from the portfolio because theincome from his medical practice meets all current spending needs.
• No large, one-time cash needs are stated. It would be appropriate, however, tokeep a small cash reserve for emergencies.
iv. Time horizon. Stephenson’s time horizon is long term and consists of two stages:
• Time until retirement, which he expects to be 15 years.• His lifetime following retirement, which could range from 15 to 20 years.
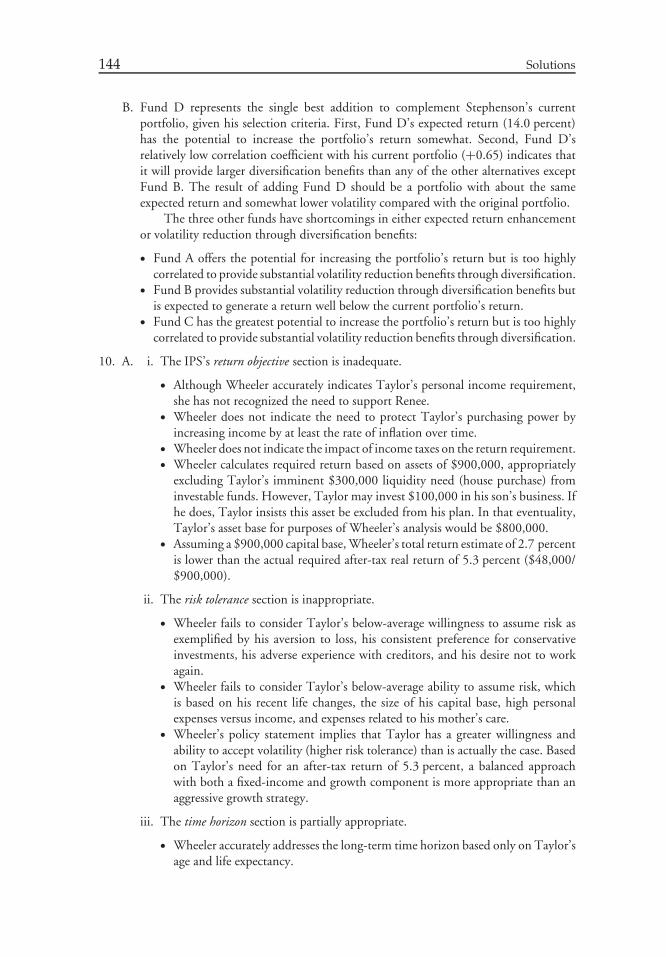
144 Solutions
B. Fund D represents the single best addition to complement Stephenson’s currentportfolio, given his selection criteria. First, Fund D’s expected return (14.0 percent)has the potential to increase the portfolio’s return somewhat. Second, Fund D’srelatively low correlation coefficient with his current portfolio (+0.65) indicates thatit will provide larger diversification benefits than any of the other alternatives exceptFund B. The result of adding Fund D should be a portfolio with about the sameexpected return and somewhat lower volatility compared with the original portfolio.
The three other funds have shortcomings in either expected return enhancementor volatility reduction through diversification benefits:
• Fund A offers the potential for increasing the portfolio’s return but is too highlycorrelated to provide substantial volatility reduction benefits through diversification.
• Fund B provides substantial volatility reduction through diversification benefits butis expected to generate a return well below the current portfolio’s return.
• Fund C has the greatest potential to increase the portfolio’s return but is too highlycorrelated to provide substantial volatility reduction benefits through diversification.
10. A. i. The IPS’s return objective section is inadequate.
• Although Wheeler accurately indicates Taylor’s personal income requirement,she has not recognized the need to support Renee.
• Wheeler does not indicate the need to protect Taylor’s purchasing power byincreasing income by at least the rate of inflation over time.
• Wheeler does not indicate the impact of income taxes on the return requirement.• Wheeler calculates required return based on assets of $900,000, appropriately
excluding Taylor’s imminent $300,000 liquidity need (house purchase) frominvestable funds. However, Taylor may invest $100,000 in his son’s business. Ifhe does, Taylor insists this asset be excluded from his plan. In that eventuality,Taylor’s asset base for purposes of Wheeler’s analysis would be $800,000.
• Assuming a $900,000 capital base, Wheeler’s total return estimate of 2.7 percentis lower than the actual required after-tax real return of 5.3 percent ($48,000/$900,000).
ii. The risk tolerance section is inappropriate.
• Wheeler fails to consider Taylor’s below-average willingness to assume risk asexemplified by his aversion to loss, his consistent preference for conservativeinvestments, his adverse experience with creditors, and his desire not to workagain.
• Wheeler fails to consider Taylor’s below-average ability to assume risk, whichis based on his recent life changes, the size of his capital base, high personalexpenses versus income, and expenses related to his mother’s care.
• Wheeler’s policy statement implies that Taylor has a greater willingness andability to accept volatility (higher risk tolerance) than is actually the case. Basedon Taylor’s need for an after-tax return of 5.3 percent, a balanced approachwith both a fixed-income and growth component is more appropriate than anaggressive growth strategy.
iii. The time horizon section is partially appropriate.
• Wheeler accurately addresses the long-term time horizon based only on Taylor’sage and life expectancy.

Chapter 2 Managing Individual Investor Portfolios 145
• Wheeler fails to consider that Taylor’s investment time horizon is multistage.Stage 1 represents Renee’s life expectancy, during which time Taylor willsupplement her income. Stage 2 begins at Renee’s death, concluding Taylor’sneed to supplement her income, and ends with Taylor’s death.
iv. The liquidity section is partially appropriate.
• Wheeler addresses potential liquidity events.• Wheeler fails to specifically consider ongoing expenses ($2,000/month for
Taylor’s living expenses and $2,000/month to support his mother) relative toexpected portfolio returns.
• The reference to a ‘‘normal, ongoing cash reserve’’ is vague. The reserve’spurpose and size should be specified.
B. Allocation B is most appropriate for Taylor. Taylor’s nominal annual return require-ment is 6.3 percent, based on his cash flow (income) needs ($50,400 annually), tobe generated from a current asset base of $800,000. After adjusting for expectedannual inflation of 1.0 percent, the real return requirement becomes 7.3 percent.To grow to $808,000 ($800,000 × 1.01), the portfolio must generate $58,400($50,400 + $8,000) in the first year ($58,400/$800,000 = 7.3%).
Allocation B meets Taylor’s minimum return requirement. Of the possibleallocations that provide the required minimum real return, Allocation B also has thelowest standard deviation of returns (i.e., the least volatility risk) and by far the bestSharpe ratio. In addition, Allocation B offers a balance of high current income andstability with moderate growth prospects.
Allocation A has the lowest standard deviation and best Sharpe ratio but does notmeet the minimum return requirement when inflation is included in that requirement.Allocation A also has very low growth prospects.
Allocation C meets the minimum return requirement and has moderate growthprospects but has a higher risk level (standard deviation) and a lower Sharpe ratio, aswell as less potential for stability, than Allocation B.
11. A. The Muellers’ investment policy statement should include the following objectivesand constraints.
i. Return objective. The Muellers’ return objective should reflect a total returnapproach that combines capital appreciation and capital preservation. After retire-ment, they will need approximately $75,000 (adjusted for inflation) annually tomaintain their current standard of living. Given the Muellers’ limited needs andasset base, preserving their financial position on an inflation-adjusted basis maybe a sufficient objective. Their long life expectancy and undetermined retirementneeds, however, lead to the likely requirement for some asset growth over time, atleast to counter any effects of inflation.
Although the Muellers wish to exclude the future trust distribution from theircurrent planning, that distribution will substantially increase their capital base anddramatically alter the return objective of their future IPS, primarily by reducingtheir needed return level.
ii. Risk tolerance. The Muellers are in the middle stage of the investor life cycle. Theirincome (relative to expenses), total financial resources, and long time horizongive them the ability to assume at least an average, if not an above-average, levelof investment risk. Their stated preference of ‘‘minimal volatility’’ investments,
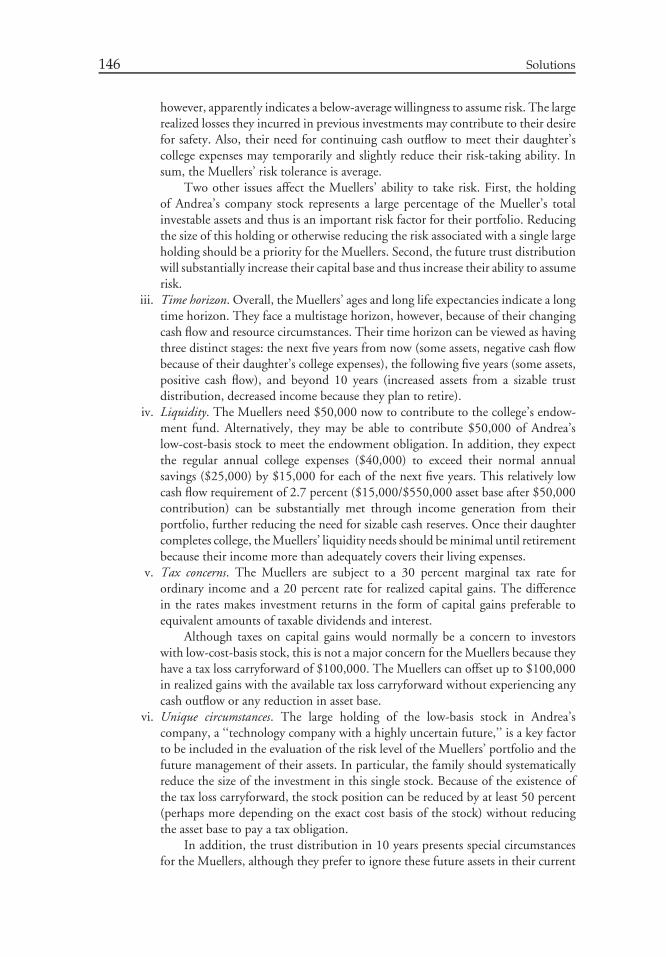
146 Solutions
however, apparently indicates a below-average willingness to assume risk. The largerealized losses they incurred in previous investments may contribute to their desirefor safety. Also, their need for continuing cash outflow to meet their daughter’scollege expenses may temporarily and slightly reduce their risk-taking ability. Insum, the Muellers’ risk tolerance is average.
Two other issues affect the Muellers’ ability to take risk. First, the holdingof Andrea’s company stock represents a large percentage of the Mueller’s totalinvestable assets and thus is an important risk factor for their portfolio. Reducingthe size of this holding or otherwise reducing the risk associated with a single largeholding should be a priority for the Muellers. Second, the future trust distributionwill substantially increase their capital base and thus increase their ability to assumerisk.
iii. Time horizon. Overall, the Muellers’ ages and long life expectancies indicate a longtime horizon. They face a multistage horizon, however, because of their changingcash flow and resource circumstances. Their time horizon can be viewed as havingthree distinct stages: the next five years from now (some assets, negative cash flowbecause of their daughter’s college expenses), the following five years (some assets,positive cash flow), and beyond 10 years (increased assets from a sizable trustdistribution, decreased income because they plan to retire).
iv. Liquidity. The Muellers need $50,000 now to contribute to the college’s endow-ment fund. Alternatively, they may be able to contribute $50,000 of Andrea’slow-cost-basis stock to meet the endowment obligation. In addition, they expectthe regular annual college expenses ($40,000) to exceed their normal annualsavings ($25,000) by $15,000 for each of the next five years. This relatively lowcash flow requirement of 2.7 percent ($15,000/$550,000 asset base after $50,000contribution) can be substantially met through income generation from theirportfolio, further reducing the need for sizable cash reserves. Once their daughtercompletes college, the Muellers’ liquidity needs should be minimal until retirementbecause their income more than adequately covers their living expenses.
v. Tax concerns. The Muellers are subject to a 30 percent marginal tax rate forordinary income and a 20 percent rate for realized capital gains. The differencein the rates makes investment returns in the form of capital gains preferable toequivalent amounts of taxable dividends and interest.
Although taxes on capital gains would normally be a concern to investorswith low-cost-basis stock, this is not a major concern for the Muellers because theyhave a tax loss carryforward of $100,000. The Muellers can offset up to $100,000in realized gains with the available tax loss carryforward without experiencing anycash outflow or any reduction in asset base.
vi. Unique circumstances. The large holding of the low-basis stock in Andrea’scompany, a ‘‘technology company with a highly uncertain future,’’ is a key factorto be included in the evaluation of the risk level of the Muellers’ portfolio and thefuture management of their assets. In particular, the family should systematicallyreduce the size of the investment in this single stock. Because of the existence ofthe tax loss carryforward, the stock position can be reduced by at least 50 percent(perhaps more depending on the exact cost basis of the stock) without reducingthe asset base to pay a tax obligation.
In addition, the trust distribution in 10 years presents special circumstancesfor the Muellers, although they prefer to ignore these future assets in their current

Chapter 2 Managing Individual Investor Portfolios 147
planning. The trust will provide significant assets to help meet their long-termreturn needs and objectives. Any long-term investment policy for the family mustconsider this circumstance, and any recommended investment strategy must beadjusted before the distribution takes place.
B. Personal portfolio. Portfolio A is the most appropriate portfolio for the Muellers.Because their pension income will not cover their annual expenditures, the shortfallwill not likely be met by the return on their investments, so the 10 percent cash reserveis appropriate. As the portfolio is depleted over time, it may be prudent to allocatemore than 10 percent to cash equivalents. The income deficit will be met each year bya combination of investment return and capital invasion.
Now that their daughter is financially independent, the Mueller’s sole objectivefor their personal portfolio is to provide for their own living expenses. Their willingnessand need to accept risk is fairly low. Clearly, there is no need to expose the Muellersto the possibility of a large loss. Also, their health situation has considerably shortenedtheir time horizon. Therefore, a 70 percent allocation to intermediate-term high-gradefixed-income securities is warranted.
The income deficit will rise each year as the Muellers’ expenses rise withinflation, but their pension income remains constant. The conservative 20 percentallocation to equities should provide diversification benefits and some protectionagainst unanticipated inflation over the expected maximum 10-year time horizon.
Portfolio B, the second-best portfolio, has no cash reserves, so it could not meetthe Muellers’ liquidity needs. Also, although it has a higher expected return, PortfolioB’s asset allocation results in a somewhat higher standard deviation of returns thanPortfolio A.
Portfolios C and D offer higher expected returns but at markedly higher levelsof risk and with relatively lower levels of current income. The Muellers’ large incomerequirements and low risk tolerance preclude the use of Portfolios C and D.
C. Trust distribution portfolio. Portfolio B is the most appropriate for the trust assets.Portfolio B’s expected return of 5.8 percent exceeds the required return of 5.4 percent,and the required return will actually decline if the surviving spouse lives longer thanfive years. The portfolio’s time horizon is relatively short, ranging from a minimumof 5 years to a maximum of 10 years. The Muellers’ sole objective for this moneyis to adequately fund the building addition. The portfolio’s growth requirements aremodest, and the Muellers have below-average willingness to accept risk. The portfoliowould be unlikely to achieve its objective if large, even short-term losses were absorbedduring the minimum five-year time horizon. Except for taxes, no principal or incomedisbursements are expected for at least five years; therefore, only a minimal or evenzero cash reserve is required. Accordingly, an allocation of 40 percent to equities toprovide some growth and 60 percent to intermediate-term fixed-income to providestability and capital preservation is appropriate.
There is no second-best portfolio. Portfolio A’s cash level is higher than necessary,and the portfolio’s expected return is insufficient to achieve the $2.6 million valuewithin the minimum value in five years. Portfolio C has a sufficient expected return,but it has a higher cash level than is necessary and, more importantly, a standarddeviation of return that is too high given the Muellers’ below-average risk tolerance.Portfolio D has a sufficient return and an appropriate cash level but a clearly excessiverisk (standard deviation) level. Portfolios C and D share the flaw of having excessive

148 Solutions
equity allocations that fail to recognize the relatively short time horizon and thatgenerate risk levels much higher than necessary or warranted.
12. A. To prepare an appropriate IPS, a manager should address the Smiths’ return objective,risk tolerance, and constraints.
Return objective. To achieve its objectives, the Family Portfolio must provide forafter-tax distributions equal to the difference between the Smiths’ expensesand their fixed income payments. To maintain its real value, the portfoliomust also grow at a rate that offsets inflation’s impact on the Smiths’ totalexpenses, including those currently covered by the fixed pension and GiftFund payments.
A secondary objective is the gifting of $1 million to the Smiths’granddaughter. Because the Family Portfolio will be worth $1 million afterthe renovation of their house, the Smiths need no further capital growth toreach their nominal goal. To maintain its real value, the portfolio must havegrowth at least equal to the rate of inflation.
Risk tolerance. The Smiths are in a relatively late stage of the investor life cycle,and their comments suggest a conservative bias or below-average willingnessto accept risk. In light of their long-term goals and current financial security,however, the Smiths have the ability to accommodate moderate portfoliovolatility.
In the short term, the consequences of an adverse investment outcomeare limited; the Smiths could use principal from the Family Portfolio to coveroccasional performance shortfalls. They are thus able to accommodate somemeasure of short-term volatility in return for greater long-term expectedreturns. In extreme circumstances, the Smiths could modify or forgo theirsecondary objective of leaving $1 million to their granddaughter.
The consequences of an adverse portfolio outcome in the long term,however, could be serious. Depending on the length of their remaining life-times and the growth rate of their expenses, the Smiths could seriously depletethe corpus of the Family Portfolio and jeopardize their financial security.
The Smiths’ comments imply that they have spent a lifetime saving andbuilding a ‘‘safe’’ collection of income-oriented investments. Their desireto preserve market value and the WealthMax Financial Consultants (WFC)policy statement’s emphasis on secure investments suggest that they may fall,at least partially, into the ‘‘cautious’’ category, a group with below-averagerisk tolerance.
Time horizon. The Family Portfolio should have an intermediate to slightlylonger-term investment horizon.
The Smiths’ joint life expectancy, at 65 years of age, is still substantial.Because their objective of financial security is well provided for in the shortterm (see discussion of risk tolerance), the Smiths can afford to focus moreon the long-term aspects of that objective.
To the extent that the Smiths emphasize the objective of leaving $1million to their granddaughter in their planning, a longer-term time horizonwould be warranted.
Liquidity requirements. The Smiths’ current annual living costs ($150,000 aftertaxes) are being met, which allows them to address longer-term growth
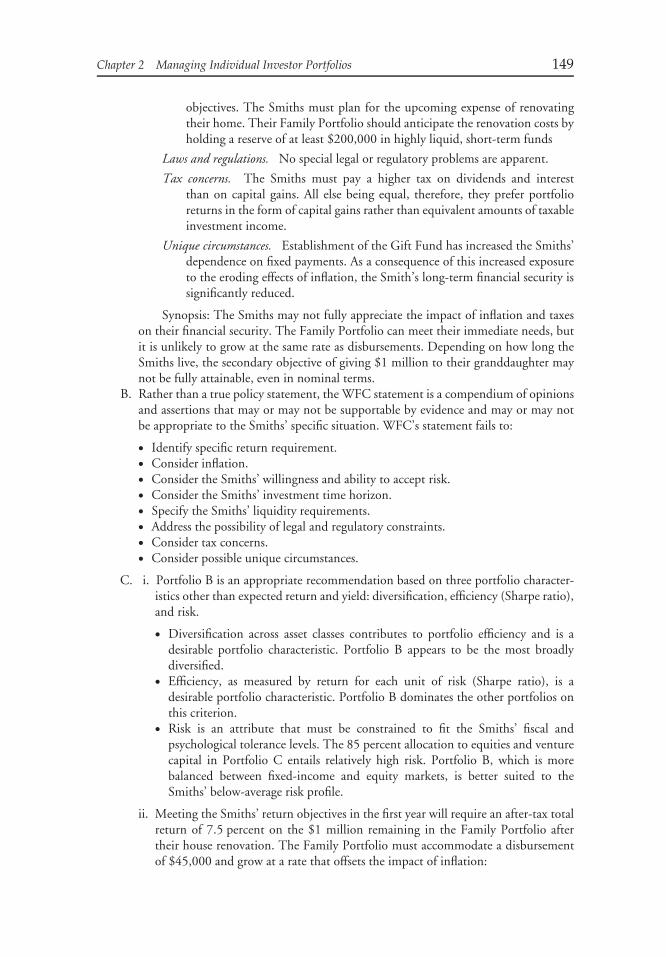
Chapter 2 Managing Individual Investor Portfolios 149
objectives. The Smiths must plan for the upcoming expense of renovatingtheir home. Their Family Portfolio should anticipate the renovation costs byholding a reserve of at least $200,000 in highly liquid, short-term funds
Laws and regulations. No special legal or regulatory problems are apparent.
Tax concerns. The Smiths must pay a higher tax on dividends and interestthan on capital gains. All else being equal, therefore, they prefer portfolioreturns in the form of capital gains rather than equivalent amounts of taxableinvestment income.
Unique circumstances. Establishment of the Gift Fund has increased the Smiths’dependence on fixed payments. As a consequence of this increased exposureto the eroding effects of inflation, the Smith’s long-term financial security issignificantly reduced.
Synopsis: The Smiths may not fully appreciate the impact of inflation and taxeson their financial security. The Family Portfolio can meet their immediate needs, butit is unlikely to grow at the same rate as disbursements. Depending on how long theSmiths live, the secondary objective of giving $1 million to their granddaughter maynot be fully attainable, even in nominal terms.
B. Rather than a true policy statement, the WFC statement is a compendium of opinionsand assertions that may or may not be supportable by evidence and may or may notbe appropriate to the Smiths’ specific situation. WFC’s statement fails to:
• Identify specific return requirement.• Consider inflation.• Consider the Smiths’ willingness and ability to accept risk.• Consider the Smiths’ investment time horizon.• Specify the Smiths’ liquidity requirements.• Address the possibility of legal and regulatory constraints.• Consider tax concerns.• Consider possible unique circumstances.
C. i. Portfolio B is an appropriate recommendation based on three portfolio character-istics other than expected return and yield: diversification, efficiency (Sharpe ratio),and risk.
• Diversification across asset classes contributes to portfolio efficiency and is adesirable portfolio characteristic. Portfolio B appears to be the most broadlydiversified.
• Efficiency, as measured by return for each unit of risk (Sharpe ratio), is adesirable portfolio characteristic. Portfolio B dominates the other portfolios onthis criterion.
• Risk is an attribute that must be constrained to fit the Smiths’ fiscal andpsychological tolerance levels. The 85 percent allocation to equities and venturecapital in Portfolio C entails relatively high risk. Portfolio B, which is morebalanced between fixed-income and equity markets, is better suited to theSmiths’ below-average risk profile.
ii. Meeting the Smiths’ return objectives in the first year will require an after-tax totalreturn of 7.5 percent on the $1 million remaining in the Family Portfolio aftertheir house renovation. The Family Portfolio must accommodate a disbursementof $45,000 and grow at a rate that offsets the impact of inflation:

150 Solutions
Expenses ($150,000)Sources of fundsPension (after tax) 65,000Gift Fund (after tax) 40,000 105,000Family Portfolio disbursement (after tax) 45,000
$150,000Required returnDisbursement ($45,000) 4.50%Inflation 3.00%Total 7.50%
Subsequent distributions from the Family Portfolio will increase at a ratesubstantially higher than inflation (to offset the lack of growth in $105,000 of fixedpension and Gift Fund payments):
Year 1 Year 2 ChangeExpenses (3% growth) $150,000 $154,500 3%Portfolio distribution $ 45,000 $ 49,500 10%
Portfolios B and C both have expected returns that meet the Smiths’ projecteddisbursements in Year 1. Portfolio C’s expected return is closer to that necessaryto meet their objective over a longer time frame. However, Portfolio C’s level ofrisk is too high given the Smiths’ risk tolerance. Although Portfolio C should allowthe Smiths to both fund their lifetime real income needs and leave $1 million totheir grandchild, the risk in Portfolio C may endanger both their income and thebequest.
The Smiths’ adviser should select Portfolio B based on its appropriate risk leveland conformity with the Smiths’ constraints. As a consequence of Portfolio B’sprobable inability to meet the Smiths’ long-term spending needs, however, principalinvasion may be necessary, and the secondary objective of giving $1 million, evenin nominal terms, to their granddaughter may be forfeited.
13. A. i. The Maclins’ overall risk objective must consider both willingness and ability totake risk:
Willingness. The Maclins have a below-average willingness to take risk, basedon their unhappiness with the portfolio volatility they have experiencedin recent years and their desire not to experience a loss in portfolio valuein excess of 12 percent in any one year.
Ability. The Maclins have an average ability to take risk. Although theirfairly large asset base and long time horizon in isolation would suggestan above-average ability to take risk, their living expenses of £74,000are significantly higher than Christopher’s after-tax salary of £80,000(1 − 0.40) = £48,000 causing them to be very dependent on projectedportfolio returns to cover the difference and thereby reducing their abilityto take risk.
Overall. The Maclins’ overall risk tolerance is below average, as their below-average willingness to take risk dominates their average ability to takerisk in determining their overall risk tolerance.

Chapter 2 Managing Individual Investor Portfolios 151
ii. The Maclins’ return objective is to grow the portfolio to meet their educational andretirement needs as well as to provide for ongoing net expenses. The Maclins willrequire annual after-tax cash flows of £26,000 (calculated below) to cover ongoingnet expenses and will need £2 million in 18 years to fund their children’s educationand their retirement. To meet this objective, the Maclins’ pretax required returnis 7.38 percent which is determined below.
The after-tax return required to accumulate £2 million in 18 years beginningwith an investable asset base of £1,235,000 (calculated below) and with annualoutflows of £26,000 is 4.427 percent, which when adjusted for the 40 percent taxrate, results in a 7.38 percent pretax return (4.427%/(1 − 0.40) = 7.38%).
Christopher’s annual salary £80,000Less: taxes (40%) −32,000Living expenses −74,000Net annual cash flow −£26,000Inheritance 900,000Barnett Co. common stock 220,000Stocks and bonds 160,000Cash 5,000Subtotal £1,285,000Less one-time needs:Down payment on house −30,000Charitable donation −20,000Investable asset base £1,235,000
Note: No inflation adjustment is required in the return calculation becauseincreases in living expenses will be offset by increases in Christopher’s salary.
B. The Maclins’ investment policy statement should include the following constraints:
i. Time horizon. The Maclins have a two-stage time horizon, because of theirchanging cash flow and resource needs. The first stage is the next 18 years. Thesecond stage begins with their retirement and the university education years fortheir children.
ii. Liquidity requirements. The Maclins have one-time immediate expenses totaling£50,000 that include the deposit on the house they are purchasing and thecharitable donation in honor of Louise’s father.
iii. Tax concerns. A 40 percent tax rate applies to both ordinary income and capitalgains.
iv. Unique circumstances. The large holding of the Barnett Co. common stockrepresents almost 18 percent of the Maclins’ investable asset base. The concentratedholding in Barnett Co. stock is a key risk factor of the Maclins’ portfolio andachieving better diversification will be a factor in the future management of theMaclins’ assets.
The Maclins’ desire not to invest in alcohol and tobacco stocks is another constrainton investment.

CHAPTER 3MANAGING
INSTITUTIONAL INVESTORPORTFOLIOS
SOLUTIONS
1. Worden Technology, Inc.IPS Y and IPS X offer different components that are appropriate for Worden
Technology’s pension plan:
i. Return requirement. IPS Y has the appropriate return requirement for Worden’s pensionplan. Because the plan is currently underfunded, the manager’s primary objective shouldbe to make it financially stronger. The risk inherent in attempting to maximize totalreturns would be inappropriate.
ii. Risk tolerance. IPS Y has the appropriate risk tolerance for Worden’s plan. Because ofits underfunded status, the plan has a limited risk tolerance; a substantial loss in thefund could further jeopardize payments to beneficiaries.
iii. Time horizon. IPS Y has the appropriate time horizon for Worden’s plan. Althoughgoing-concern pension plans usually have long time horizons, the Worden plan hasa comparatively short time horizon because of the company’s reduced retirement ageand relatively high median age of its workforce.
iv. Liquidity. IPS X has the appropriate liquidity constraint for Worden’s plan. Because ofthe early retirement feature starting next month and the age of the workforce (whichindicates an increasing number of retirees in the near future), the plan needs a moderatelevel of liquidity to fund monthly payments.
2. LightSpeed Connections
A. i. Concentrating LSC’s pension assets as Donovan has done subjects the plan benefi-ciaries to an extraordinarily high level of risk because of the high correlation betweenthe market values of the portfolio and LSC’s business results.
ii. By concentrating the pension assets heavily in technology and Internet companies,Donovan has increased the company’s risk as the pension plan’s sponsor. LightSpeednow faces the prospect of having to provide additional funding to the pension planat a time when the company’s own cash flow and/or earnings position may beweakened. A more prudent approach would be to invest in assets expected to beless highly correlated with the company’s market value, so in the event additional
152

Chapter 3 Managing Institutional Investor Portfolios 153
funding for the pension plan becomes necessary, it will be less likely to occur whenLSC is in a weakened financial position.
B. i. The IPS drafted by Jeffries and the investment committee correctly identifies thatthe return requirement should be total return, with a need for inflation protectionthat is sufficient to fund the plan’s long-term obligations. The IPS is weak in thatit neglects to state a specific return requirement.
ii. The IPS fails to address the pension plan’s risk tolerance, one of the two mainobjectives of a complete investment policy statement. Consequently, the IPS doesnot provide the guidance on risk tolerance that would highlight the potential risk tothe beneficiaries and the company of LSC’s current aggressive investment strategy.
iii. The IPS correctly addresses the time horizon constraint by stating that the assetsare long-term in nature, both because of LSC’s young workforce and the normallong-term nature of pension investing.
iv. The IPS fails to address the liquidity constraint; although liquidity is a minimalconcern in this case, the IPS should nonetheless address that fact.
3. Gwartney International
A. The amount of surplus will decline when the present value of plan liabilities risesfaster than the market value of the assets. According to the information provided, GI’sliabilities have a duration of 10 years, the same as U.S. long-term bonds which returneda total of 19 percent for the previous year (7 percent income, 12 percent from capitalgains associated with a decline in interest rates for the period). The decline in interestrates for long-term bonds translates into a lower discount rate for the plan’s liabilities.The 12 percent gain in bonds implies that the plan’s liabilities would have increased bythe same amount. The combination of a 12 percent gain in liabilities and a 10 percentreturn on assets resulted in a decrease in the pension plan’s surplus.
B. Investment time horizon is a primary determinant of an investor’s risk tolerance. GI hasa young workforce with many years until retirement, indicating a long time horizon.GI should thus adopt a long investment horizon, allowing investment in higher-risk,higher-expected-return asset classes.
C. The plan’s risk tolerance embodies the plan sponsor’s ability and willingness toabsorb the consequences of adverse investment outcomes and/or prolonged subparinvestment performance (i.e., its sensitivity to the possibility of being required toincrease contributions at unpredictable times and intervals). The less risk an investorcan tolerate, the less return will be achieved in the long run.
GI is financially healthy and growing. Given its financial health, the company hasthe ability to increase contributions when necessary. Because of GI’s young workforce,the pension plan has a long time horizon, allowing for investment in riskier assets. Theplan is also currently fully funded, and GI is financially strong. All these considerationspoint to GI having an above-average risk tolerance.
4. Food Processors Inc. (FPI)
A. In the United States, every Employee Retirement Income Security Act (ERISA)-qualified defined-benefit pension plan has a projected benefit obligation, whichrepresents the discounted present value of the retirement benefits that the plan isobligated by law to make, given certain assumptions about future rates of pay andworkforce factors. If the plan assets at fair market value exceed the projected benefitobligation (PBO), the plan is said to be overfunded. Conversely, if the value of the
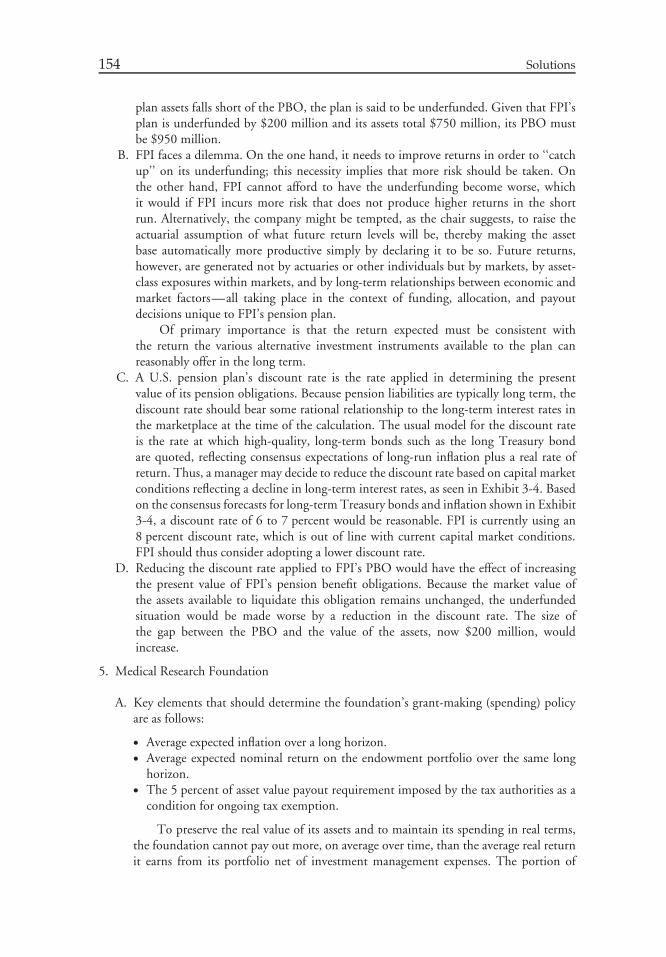
154 Solutions
plan assets falls short of the PBO, the plan is said to be underfunded. Given that FPI’splan is underfunded by $200 million and its assets total $750 million, its PBO mustbe $950 million.
B. FPI faces a dilemma. On the one hand, it needs to improve returns in order to ‘‘catchup’’ on its underfunding; this necessity implies that more risk should be taken. Onthe other hand, FPI cannot afford to have the underfunding become worse, whichit would if FPI incurs more risk that does not produce higher returns in the shortrun. Alternatively, the company might be tempted, as the chair suggests, to raise theactuarial assumption of what future return levels will be, thereby making the assetbase automatically more productive simply by declaring it to be so. Future returns,however, are generated not by actuaries or other individuals but by markets, by asset-class exposures within markets, and by long-term relationships between economic andmarket factors—all taking place in the context of funding, allocation, and payoutdecisions unique to FPI’s pension plan.
Of primary importance is that the return expected must be consistent withthe return the various alternative investment instruments available to the plan canreasonably offer in the long term.
C. A U.S. pension plan’s discount rate is the rate applied in determining the presentvalue of its pension obligations. Because pension liabilities are typically long term, thediscount rate should bear some rational relationship to the long-term interest rates inthe marketplace at the time of the calculation. The usual model for the discount rateis the rate at which high-quality, long-term bonds such as the long Treasury bondare quoted, reflecting consensus expectations of long-run inflation plus a real rate ofreturn. Thus, a manager may decide to reduce the discount rate based on capital marketconditions reflecting a decline in long-term interest rates, as seen in Exhibit 3-4. Basedon the consensus forecasts for long-term Treasury bonds and inflation shown in Exhibit3-4, a discount rate of 6 to 7 percent would be reasonable. FPI is currently using an8 percent discount rate, which is out of line with current capital market conditions.FPI should thus consider adopting a lower discount rate.
D. Reducing the discount rate applied to FPI’s PBO would have the effect of increasingthe present value of FPI’s pension benefit obligations. Because the market value ofthe assets available to liquidate this obligation remains unchanged, the underfundedsituation would be made worse by a reduction in the discount rate. The size ofthe gap between the PBO and the value of the assets, now $200 million, wouldincrease.
5. Medical Research Foundation
A. Key elements that should determine the foundation’s grant-making (spending) policyare as follows:
• Average expected inflation over a long horizon.• Average expected nominal return on the endowment portfolio over the same long
horizon.• The 5 percent of asset value payout requirement imposed by the tax authorities as a
condition for ongoing tax exemption.
To preserve the real value of its assets and to maintain its spending in real terms,the foundation cannot pay out more, on average over time, than the average real returnit earns from its portfolio net of investment management expenses. The portion of

Chapter 3 Managing Institutional Investor Portfolios 155
the total return representing the inflation rate must be retained and reinvested if thefoundation’s principal is to grow with inflation. Because of the minimum 5 percentspending policy mandated by tax considerations, the real return of the portfolio willhave to equal or exceed 5 percent plus the cost of earning investment returns in orderto preserve the foundation’s tax-exempt status and maintain its real value of principaland future payouts.
B. The new IPS should include the following components:
• Return objective. A total return approach is recommended to meet the foundation’sobjective of maintaining real value after grants. The required annual return shall bethe sum of the spending rate plus the expected inflation rate.1
• Risk tolerance. The adoption of a clear-cut spending policy will permit cash flows tobe planned with some precision, adding stability to annual budgeting and reducingthe need for liquidity. Based on its long time horizon, low liquidity needs, and (now)ample assets, the foundation’s risk tolerance is above average.
• Liquidity requirements. Based on asset size and the predictable nature of cash payouts,liquidity needs are low.
• Time horizon. The Foundation, with an unlimited lifespan, has a very long timehorizon.
• Tax considerations. The foundation is tax-exempt under present U.S. law as long asthe annual minimum payout of 5 percent is met.
• Legal and regulatory constraints. The foundation is governed by the Uniform Man-agement of Institutional Funds Act (UMIFA) as well as IRS regulations.
• Unique circumstances. None apply, other than those previously discussed.
6. James Children’s Hospital
A. The current spending request of $1.6 million represents $1.6 million/$20million =0.08 or 8 percent of the value of the endowment. This level of spending is highgiven the endowment’s long-term expected total return of 8.6 percent per year (innominal terms) and expected 4 percent inflation rate for medical equipment prices. Ifsuch spending is permitted, the current beneficiaries of the JCHE (for example, thepatients of JCH) may receive benefits at the expense of future beneficiaries, becausethe endowment is unlikely to be able to maintain its value in inflation-adjustedterms.
B. JCHE has a perpetual time horizon; it can thus tolerate a higher risk level (in terms ofvolatility of returns) than a fund with a shorter time horizon. The higher risk toleranceresults from the longer period available to make up for any market downturns. With ahigher risk tolerance, JCHE can target a higher expected return.
C. JCHE’s long-term spending policy should balance the needs of current and futurebeneficiaries. Its spending policy should balance income needs and the need tobuild the payout stream to preserve purchasing power. JCHE balances these conflictingobjectives only when future beneficiaries receive the same inflation-adjusted distributionthat current beneficiaries receive. With zero real growth, intergenerational neutralityexists. Because market returns are variable, JCHE should use a smoothing mechanismthat will apply the spending rate to a moving average of market value:
1This additive return objective is easy to understand; as discussed in the text, a multiplicative returnobjective would be more precise.
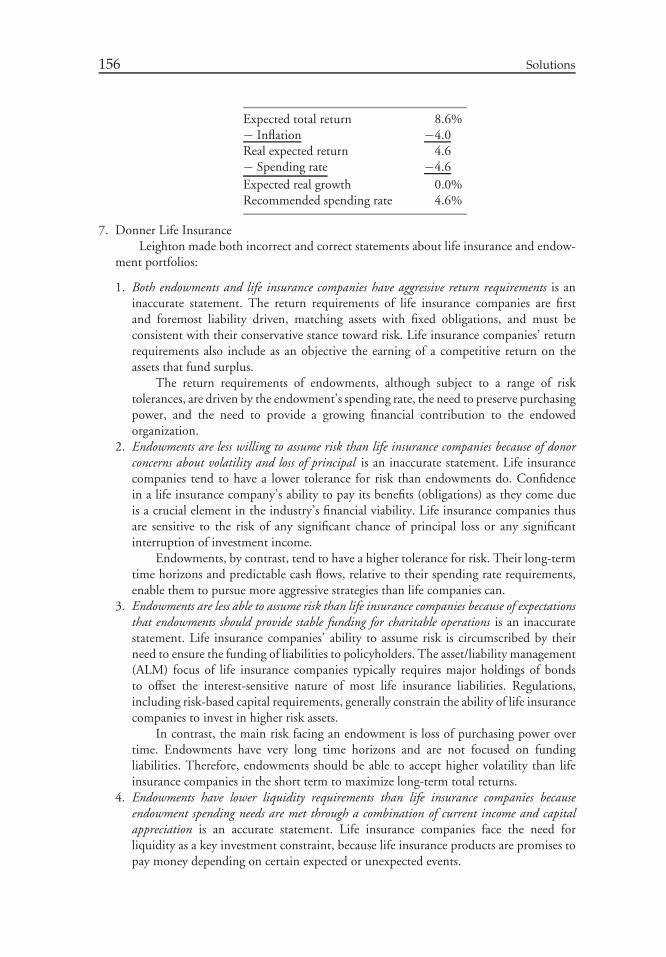
156 Solutions
Expected total return 8.6%− Inflation −4.0Real expected return 4.6− Spending rate −4.6Expected real growth 0.0%Recommended spending rate 4.6%
7. Donner Life InsuranceLeighton made both incorrect and correct statements about life insurance and endow-
ment portfolios:
1. Both endowments and life insurance companies have aggressive return requirements is aninaccurate statement. The return requirements of life insurance companies are firstand foremost liability driven, matching assets with fixed obligations, and must beconsistent with their conservative stance toward risk. Life insurance companies’ returnrequirements also include as an objective the earning of a competitive return on theassets that fund surplus.
The return requirements of endowments, although subject to a range of risktolerances, are driven by the endowment’s spending rate, the need to preserve purchasingpower, and the need to provide a growing financial contribution to the endowedorganization.
2. Endowments are less willing to assume risk than life insurance companies because of donorconcerns about volatility and loss of principal is an inaccurate statement. Life insurancecompanies tend to have a lower tolerance for risk than endowments do. Confidencein a life insurance company’s ability to pay its benefits (obligations) as they come dueis a crucial element in the industry’s financial viability. Life insurance companies thusare sensitive to the risk of any significant chance of principal loss or any significantinterruption of investment income.
Endowments, by contrast, tend to have a higher tolerance for risk. Their long-termtime horizons and predictable cash flows, relative to their spending rate requirements,enable them to pursue more aggressive strategies than life companies can.
3. Endowments are less able to assume risk than life insurance companies because of expectationsthat endowments should provide stable funding for charitable operations is an inaccuratestatement. Life insurance companies’ ability to assume risk is circumscribed by theirneed to ensure the funding of liabilities to policyholders. The asset/liability management(ALM) focus of life insurance companies typically requires major holdings of bondsto offset the interest-sensitive nature of most life insurance liabilities. Regulations,including risk-based capital requirements, generally constrain the ability of life insurancecompanies to invest in higher risk assets.
In contrast, the main risk facing an endowment is loss of purchasing power overtime. Endowments have very long time horizons and are not focused on fundingliabilities. Therefore, endowments should be able to accept higher volatility than lifeinsurance companies in the short term to maximize long-term total returns.
4. Endowments have lower liquidity requirements than life insurance companies becauseendowment spending needs are met through a combination of current income and capitalappreciation is an accurate statement. Life insurance companies face the need forliquidity as a key investment constraint, because life insurance products are promises topay money depending on certain expected or unexpected events.
Chapter 3 Managing Institutional Investor Portfolios 157
Endowments typically have low liquidity needs, except to fund periodic distribu-tions and to cover emergency needs. Distributions are usually foreseeable and can usuallybe met from a combination of investment income and the sale of readily marketablesecurities.
5. Both endowments and life insurance companies are subject to stringent legal and regulatoryoversight is an inaccurate statement. Life insurance companies are subject to relativelyrigorous legal and/or regulatory oversight with respect to their portfolio compositionand investment strategies.
In contrast, endowments are relatively unburdened with legal and/or regulatoryrestraints, at least at the federal level in the United States, although some states do havespecific rules and regulations regarding management of endowment assets.
8. Hannibal Insurance Company
A. The investment strategy of Hannibal Insurance Company is inappropriate, because thecompany is ignoring interest rate risk and the strategy threatens both the surplus andpolicyholder reserves.
Hannibal’s investment strategy has three key negative consequences. First, thecompany faces major interest rate risk, as evidenced by the duration mismatch. Second,a focus on short-duration products will accelerate the mismatch. Finally, the companyhas not generated sufficient reserves and surplus relative to liabilities, given the risks itfaces; thus it is increasing its risk of insolvency.
Given the interest rate sensitivity of many life insurance products, controllinginterest rate risk is one of the most challenging tasks facing portfolio managers inthe insurance industry. Although tolerance for interest rate risk, or level of mismatch,varies from company to company, duration mismatch can become an acute problemin periods of rising interest rates. Meeting the return objective of earning a significantspread is important, but assets and liabilities must be managed in a way that offsets theeffects of changes in interest rates.
Confidence in an insurance company’s ability to meet its obligations is so vital tothe company’s survival that special care must be taken to avoid any significant lossesof principal. Hannibal has taken on a substantial amount of interest rate risk in recentyears. Continuing a spread-maximization strategy in the face of rising interest ratesthreatens the firm’s financial stability.
The mismatch must be corrected. Continuing along the path outlined by the chieffinancial officer (CFO) will magnify the interest rate risk, which the CFO is ignoringbecause of the ‘‘increasing popularity’’ of a short-duration product. As the duration ofthe assets is held steady through the CFO’s urging to invest in higher-yielding, longer-duration bonds, the duration of the liabilities will shrink. The CFO is focusing on aspread-maximization strategy and mistakenly relying on investment-grade securities toprovide policyholder security. The real danger lies in another direction—namely, thepotential forced sale of assets, with sizable losses resulting from interest rate increases,to pay off short-duration liabilities.
The company has a relatively small surplus portfolio. Surplus is an indicator of aninsurance company’s financial health and is vital to expansion of the business. If interestrates continue to rise as expected, the market value of the portfolio assets will decline,which may wipe out the surplus and a portion of policyholder reserves. With thecompany unable to expand or meet its obligations, its viability becomes questionable.
B. Two additional factors that affect liability duration for a life insurance company are(1) the duration of products sold and (2) policy surrenders and/or loans.

158 Solutions
• The duration of products sold is a main driving force influencing the overall durationof liabilities. The extent to which a company directs marketing efforts toward short-or long-duration products will tilt overall duration. In this case, the company isplacing a heavy emphasis on a two-year guaranteed investment contract product.The duration of this product will be much shorter than that of the overall portfolio.Management indicates that this product is popular, with sales increasing in recentyears. This increase, all else being equal, will contribute to a decline in the durationof liabilities.
• Duration of liabilities is also driven by policy surrender and/or loans, either of whichcan be triggered by interest rate changes. Surrender rates triggered by interest ratechanges are more difficult to predict than mortality rates and have become a criticalvariable for many life insurance companies. During periods of rising interest rates,policyholder redemptions accelerate as policyholders seek the most competitive rate.Such behavior would be typical in an environment in which ‘‘interest rates are risingand are expected to rise another 100 basis points.’’ Accelerating surrenders couldalso influence an actuary to reduce the assumed duration of a company’s liabilities.
C. Because of the varied features in life and annuity contracts, most life insurancecompanies segment their portfolios to group liabilities with similar interest-rate-sensitivity characteristics. Portfolios are then constructed by segment in such a waythat the most appropriate securities fund each product segment. This practice alsorecognizes that particular product lines have unique time horizons and return objectivesand should be managed accordingly.
Segmentation would be appropriate at Hannibal because of the problems arisingfrom the popularity of a short-duration product. The portfolio manager could constructa portfolio targeted to the liabilities created by this product. Three arguments for thesegmentation approach could be chosen from the following: Segmentation:
• Aids in managing liabilities of similar characteristics.• Assists in the selection of the most appropriate assets to fund product segments
(liabilities).• Aids in the management and/or measurement of interest rate risk and duration
mismatch by product line.• Provides a framework for meeting return objectives by product line.• Provides for accurate measurement of the profitability of product lines and/or
manager performance.• Provides for the allocation of investment income by line of business.• Provides for the measurement of risk-adjusted returns.• Facilitates accountability and allays regulatory concerns.
D. The focus of the return requirement for policyholder reserves is on earning a competitivereturn on the assets used to fund estimated liabilities. Life insurance companies areconsidered spread managers, in that they manage the difference between the returnearned on investments and the return credited to policyholders. Spread managementcan take various forms, such as a yield approach versus a total-return approach, but theobjective remains the same.
The focus of the return requirement for the surplus is on long-term growth. Anexpanding surplus is an important indicator of financial stability and the base forbuilding the lines of business. When selecting investments for the surplus portfolio,

Chapter 3 Managing Institutional Investor Portfolios 159
managers typically seek assets with the potential for capital appreciation, such ascommon stocks, venture capital, and equity real estate.
9. A. Because the loan portfolio is now subject to greater interest rate risk although overallrisk tolerance has not changed, the target maturity of the securities portfolio must bereduced to offset the loan portfolio’s greater risk.
B. Winthrop Bank should have more leeway to invest in below-investment-quality debtin its bond portfolio as a result.
C. Winthrop’s decision decreases the need for liquidity in its securities portfolio.D. The development suggests taking less risk in its securities portfolio.

CHAPTER 4CAPITAL MARKET
EXPECTATIONS
SOLUTIONS
1. The chief point is that extending the data series further back in time increases the riskof using data representing more than one regime. The analyst also needs to be aware ofadjustments or revisions to the data, which can create inconsistencies in the data andmake interpretation of those data difficult. The analyst must be sure that any adjustmentsto the data were made on a consistent and uniform basis. Furthermore, the analyst needsto be aware that variable definitions and calculation methods may have changed over theoriginal and extended periods.
2. Drawing an inference that current sales expectations might be muted due to the weaksales numbers posted over the past several years is an example of the status quo trap. Anobjective assessment of early sales figures, surveys of shoppers, and collecting data aboutretail order patterns and shipments represent more unbiased bases for a year-end salesforecast.
The confirming evidence trap was evident when Bildownes used the recent observationof the number of customers in a single department store as further support of his forecastfor weak year-end retail sales. To help prevent this bias, an analyst could undertake moreobservations and then honestly and independently assess them with equal rigor beforedrawing a conclusion.
Bildownes also seemed to be strongly influenced by his memory of previous weakyear-end sales periods being associated with low pedestrian traffic during early December1990. In assuming that a correlation witnessed in the past will repeat again without furtheranalysis, Bildownes has fallen into the recallability trap. To counter this forecast-taintingbias, Bildownes should emphasize objective assessments of data, rather than personalmemories, in forecasting.
In drawing the conclusion that ‘‘there will be no overall year-over-year retail salesgrowth this holiday season,’’ Bildownes has fallen into the overconfidence trap. This traprelates to the natural tendency for individuals to be overconfident about the accuracy oftheir forecasts. The easiest way to help prevent this trap from biasing a forecast is to admitthe possibility that the forecast may be inaccurate and to increase the range of possibleoutcomes around the primary target outcome.
160
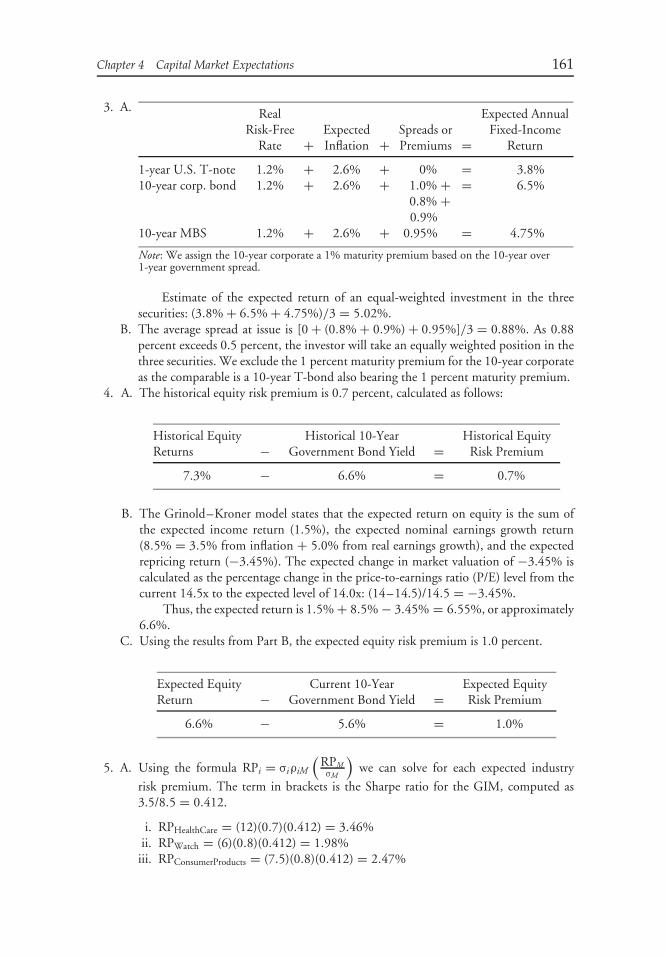
Chapter 4 Capital Market Expectations 161
3. A. RealRisk-Free
Rate +ExpectedInflation +
Spreads orPremiums =
Expected AnnualFixed-Income
Return
1-year U.S. T-note 1.2% + 2.6% + 0% = 3.8%10-year corp. bond 1.2% + 2.6% + 1.0% + = 6.5%
0.8% +0.9%
10-year MBS 1.2% + 2.6% + 0.95% = 4.75%
Note: We assign the 10-year corporate a 1% maturity premium based on the 10-year over1-year government spread.
Estimate of the expected return of an equal-weighted investment in the threesecurities: (3.8% + 6.5% + 4.75%)/3 = 5.02%.
B. The average spread at issue is [0 + (0.8% + 0.9%) + 0.95%]/3 = 0.88%. As 0.88percent exceeds 0.5 percent, the investor will take an equally weighted position in thethree securities. We exclude the 1 percent maturity premium for the 10-year corporateas the comparable is a 10-year T-bond also bearing the 1 percent maturity premium.
4. A. The historical equity risk premium is 0.7 percent, calculated as follows:
Historical EquityReturns −
Historical 10-YearGovernment Bond Yield =
Historical EquityRisk Premium
7.3% − 6.6% = 0.7%
B. The Grinold–Kroner model states that the expected return on equity is the sum ofthe expected income return (1.5%), the expected nominal earnings growth return(8.5% = 3.5% from inflation + 5.0% from real earnings growth), and the expectedrepricing return (−3.45%). The expected change in market valuation of −3.45% iscalculated as the percentage change in the price-to-earnings ratio (P/E) level from thecurrent 14.5x to the expected level of 14.0x: (14–14.5)/14.5 = −3.45%.
Thus, the expected return is 1.5% + 8.5% − 3.45% = 6.55%, or approximately6.6%.
C. Using the results from Part B, the expected equity risk premium is 1.0 percent.
Expected EquityReturn −
Current 10-YearGovernment Bond Yield =
Expected EquityRisk Premium
6.6% − 5.6% = 1.0%
5. A. Using the formula RPi = σiρiM
!RPMσM
"we can solve for each expected industry
risk premium. The term in brackets is the Sharpe ratio for the GIM, computed as3.5/8.5 = 0.412.
i. RPHealthCare = (12)(0.7)(0.412) = 3.46%ii. RPWatch = (6)(0.8)(0.412) = 1.98%
iii. RPConsumerProducts = (7.5)(0.8)(0.412) = 2.47%
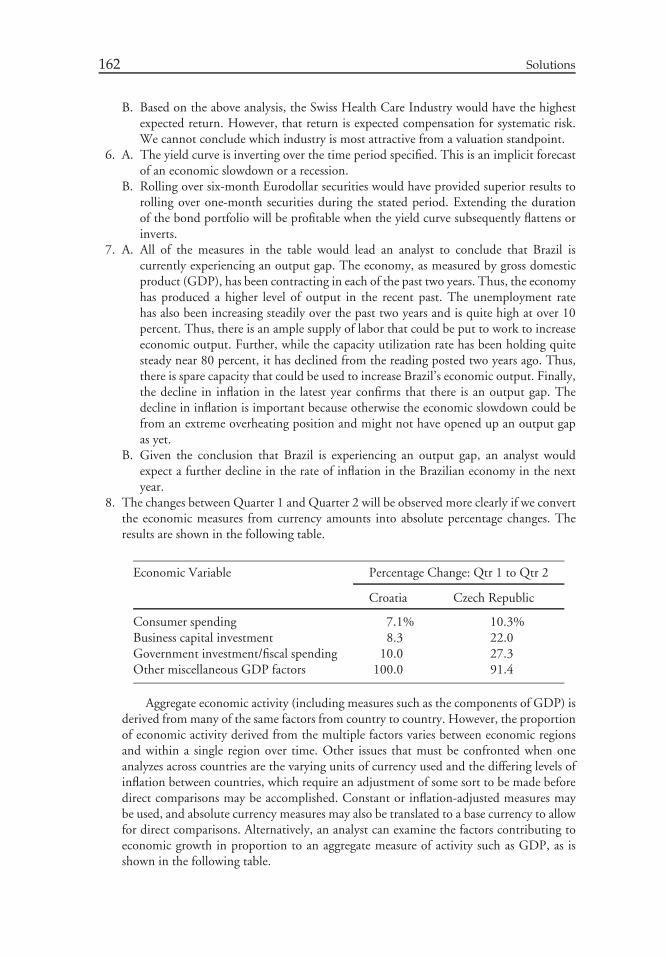
162 Solutions
B. Based on the above analysis, the Swiss Health Care Industry would have the highestexpected return. However, that return is expected compensation for systematic risk.We cannot conclude which industry is most attractive from a valuation standpoint.
6. A. The yield curve is inverting over the time period specified. This is an implicit forecastof an economic slowdown or a recession.
B. Rolling over six-month Eurodollar securities would have provided superior results torolling over one-month securities during the stated period. Extending the durationof the bond portfolio will be profitable when the yield curve subsequently flattens orinverts.
7. A. All of the measures in the table would lead an analyst to conclude that Brazil iscurrently experiencing an output gap. The economy, as measured by gross domesticproduct (GDP), has been contracting in each of the past two years. Thus, the economyhas produced a higher level of output in the recent past. The unemployment ratehas also been increasing steadily over the past two years and is quite high at over 10percent. Thus, there is an ample supply of labor that could be put to work to increaseeconomic output. Further, while the capacity utilization rate has been holding quitesteady near 80 percent, it has declined from the reading posted two years ago. Thus,there is spare capacity that could be used to increase Brazil’s economic output. Finally,the decline in inflation in the latest year confirms that there is an output gap. Thedecline in inflation is important because otherwise the economic slowdown could befrom an extreme overheating position and might not have opened up an output gapas yet.
B. Given the conclusion that Brazil is experiencing an output gap, an analyst wouldexpect a further decline in the rate of inflation in the Brazilian economy in the nextyear.
8. The changes between Quarter 1 and Quarter 2 will be observed more clearly if we convertthe economic measures from currency amounts into absolute percentage changes. Theresults are shown in the following table.
Economic Variable Percentage Change: Qtr 1 to Qtr 2
Croatia Czech Republic
Consumer spending 7.1% 10.3%Business capital investment 8.3 22.0Government investment/fiscal spending 10.0 27.3Other miscellaneous GDP factors 100.0 91.4
Aggregate economic activity (including measures such as the components of GDP) isderived from many of the same factors from country to country. However, the proportionof economic activity derived from the multiple factors varies between economic regionsand within a single region over time. Other issues that must be confronted when oneanalyzes across countries are the varying units of currency used and the differing levels ofinflation between countries, which require an adjustment of some sort to be made beforedirect comparisons may be accomplished. Constant or inflation-adjusted measures maybe used, and absolute currency measures may also be translated to a base currency to allowfor direct comparisons. Alternatively, an analyst can examine the factors contributing toeconomic growth in proportion to an aggregate measure of activity such as GDP, as isshown in the following table.
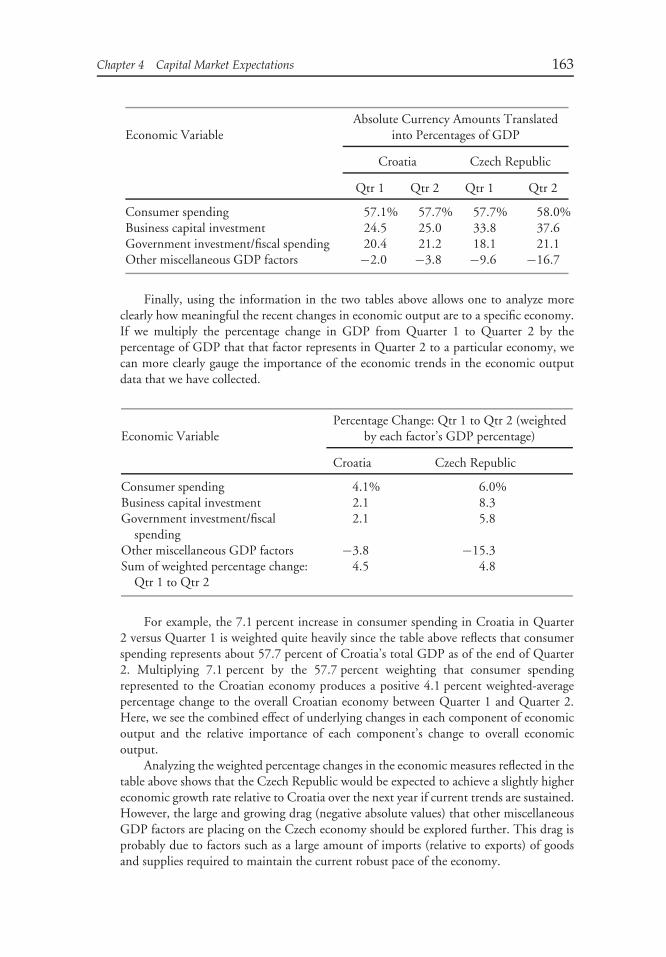
Chapter 4 Capital Market Expectations 163
Economic VariableAbsolute Currency Amounts Translated
into Percentages of GDP
Croatia Czech Republic
Qtr 1 Qtr 2 Qtr 1 Qtr 2
Consumer spending 57.1% 57.7% 57.7% 58.0%Business capital investment 24.5 25.0 33.8 37.6Government investment/fiscal spending 20.4 21.2 18.1 21.1Other miscellaneous GDP factors −2.0 −3.8 −9.6 −16.7
Finally, using the information in the two tables above allows one to analyze moreclearly how meaningful the recent changes in economic output are to a specific economy.If we multiply the percentage change in GDP from Quarter 1 to Quarter 2 by thepercentage of GDP that that factor represents in Quarter 2 to a particular economy, wecan more clearly gauge the importance of the economic trends in the economic outputdata that we have collected.
Economic VariablePercentage Change: Qtr 1 to Qtr 2 (weighted
by each factor’s GDP percentage)
Croatia Czech Republic
Consumer spending 4.1% 6.0%Business capital investment 2.1 8.3Government investment/fiscal
spending2.1 5.8
Other miscellaneous GDP factors −3.8 −15.3Sum of weighted percentage change:
Qtr 1 to Qtr 24.5 4.8
For example, the 7.1 percent increase in consumer spending in Croatia in Quarter2 versus Quarter 1 is weighted quite heavily since the table above reflects that consumerspending represents about 57.7 percent of Croatia’s total GDP as of the end of Quarter2. Multiplying 7.1 percent by the 57.7 percent weighting that consumer spendingrepresented to the Croatian economy produces a positive 4.1 percent weighted-averagepercentage change to the overall Croatian economy between Quarter 1 and Quarter 2.Here, we see the combined effect of underlying changes in each component of economicoutput and the relative importance of each component’s change to overall economicoutput.
Analyzing the weighted percentage changes in the economic measures reflected in thetable above shows that the Czech Republic would be expected to achieve a slightly highereconomic growth rate relative to Croatia over the next year if current trends are sustained.However, the large and growing drag (negative absolute values) that other miscellaneousGDP factors are placing on the Czech economy should be explored further. This drag isprobably due to factors such as a large amount of imports (relative to exports) of goodsand supplies required to maintain the current robust pace of the economy.

164 Solutions
9. A. The Taylor rule can be used to estimate the direction and magnitude of a short-term interest rate adjustment that could be made by central bank authorities. Thecalculation follows:
Roptimal = Rneutral + [0.5 × (GDPgforecast − GDPgtrend) + 0.5 × (Iforecast − Itarget)]
= 4.0% + [0.5 × (2.6% − 3.2%) + 0.5 × (4.0% − 2.0%)]
= 4.70%
B. The Taylor rule is a simple yet useful tool that an analyst can use to determine frommacroeconomic factors when it might be appropriate for central bank authorities topush down short-term interest rates in order to monetarily stimulate an economy thatis functioning below potential (i.e., has an output gap). Conversely, if an economyis operating above its long-term average rate (substantial growth) and there are signsof accelerating inflation or rising inflation expectations, the Taylor rule can signal theneed for central bank authorities to raise the level of short-term interest rates so thateconomic activity and increasing inflation expectations may be mitigated.
However, many other economic factors also affect aggregate output, inflation,and interest rates. Beyond economic factors, political and social factors come intothe decision-making process when central bank authorities are setting interest ratetargets. Central banks also typically take account of fiscal policies, wage behavior, assetprices, and developments in other economies. Periods of deflation would also call formore unorthodox central bank actions due to the fact that the central bank’s abilityto influence the economy is diminished once short-term interest rates approach zeroduring deflationary periods.
10. Comparing the broad economic output measures for Europe and the United States, thedata show that both Europe and the United States have posted similar trends over thepast few years and have had improving trends over the past year. The U.S. economy hasposted higher absolute levels of GDP health care growth, which is expected to moderateover the next year. However, overall output and health care–related output are expectedto continue to increase in Europe over the next year. Advantage: Europe.
Recent consumer trends for Europe and the United States have also been quitecorrelated. However, the United States recently has registered higher absolute measuresof overall consumer health care spending. Whereas this consumer impact is likely to bestable in the United States over the next year, Europe is expected to continue to showincreased growth. Advantage: Europe.
Regarding the economic impact of businesses, the United States posted better resultsthan Europe over the past three years. However, over the past year, improving conditionshave been seen for both regions. Currently, business profits have rebounded more inthe United States. Thus, absolute economic measures look stronger in the United Statesthan in Europe in the near term. However, over the next year, business-related economicimpacts should be stronger in Europe. Advantage: Europe.
Monetary authorities have been stimulative in both Europe and the United Statesover the past several years. However, the stimulation is expected to reverse in the UnitedStates over the next year, with short-term rates rising from 1 percent to 2.2 percent.Short-term rates are expected to rise only slightly over the next year in Europe. Thus,monetary policy will be a more neutral factor for both economies over the next year. TheUnited States is expected to have lower overall interest rates and slightly lower inflation.Advantage: United States.

Chapter 4 Capital Market Expectations 165
Fiscal policies for Europe and for the United States have been stimulative over thepast few years but have been increasingly stimulative in the United States. Over the nextyear, the fiscal stimulation in the United States is expected to widen further in comparisonto Europe. This trend is favorable to the United States as long as inflation is not anunexpected outcome of this fiscal stimulation and government borrowing caused by thefiscal stimulation does not crowd corporate borrowers out of the health care industry.Advantage: United States.
The higher average age of the aggregate general population in Europe relative tothe United States is a positive factor for the health care industry from the perspective ofPharmavest. Advantage: Europe.
With more advantages pointing toward Europe’s economies over the next year,Europe appears to be the economic region that should provide the stronger economicbackdrop for the health care sector over the next year.
Matrix Summarization of Relative Advantages: Europe versus United States
Recent Trends Current Measures 1-Year Forecast
Broad economicmeasures
Similar (inEurope/U.S.)
Similar Advantage:Europe
Impact ofconsumers
Similar Similar Advantage:Europe
Impact ofbusinesses
Advantage: U.S. Similar Advantage:Europe
Impact of centralbank
Similar Similar Advantage: U.S.
Impact ofgovernment
Similar Advantage:Europe
Advantage: U.S.
Other/uniquefactors
Similar Advantage:Europe
Advantage:Europe
11. To address the question, we first convert the data from the table into trend information(1-year, 3-year, and long-term 20-year trend information). The time periods are from theperspective of the end of 2004.
Trend Comparisons 1-Year Trend 3-Year Trend 20-Year Trend
GDP 2.5% 7.7% (2.5% compoundaverage annual growth)
4.2%
Consumer spending 4.0 5.0 (1.6% compoundaverage annual growth)
2.5
Business spending 2.7 11.8 (3.8% compoundaverage annual growth)
2.6
Inflation 10.0 25.3 (7.8% compoundaverage annual growth)
14.3
Govt spending (% ofGDP)
−1.25 −2.5 (−0.8% compoundaverage annual growth)
3.6
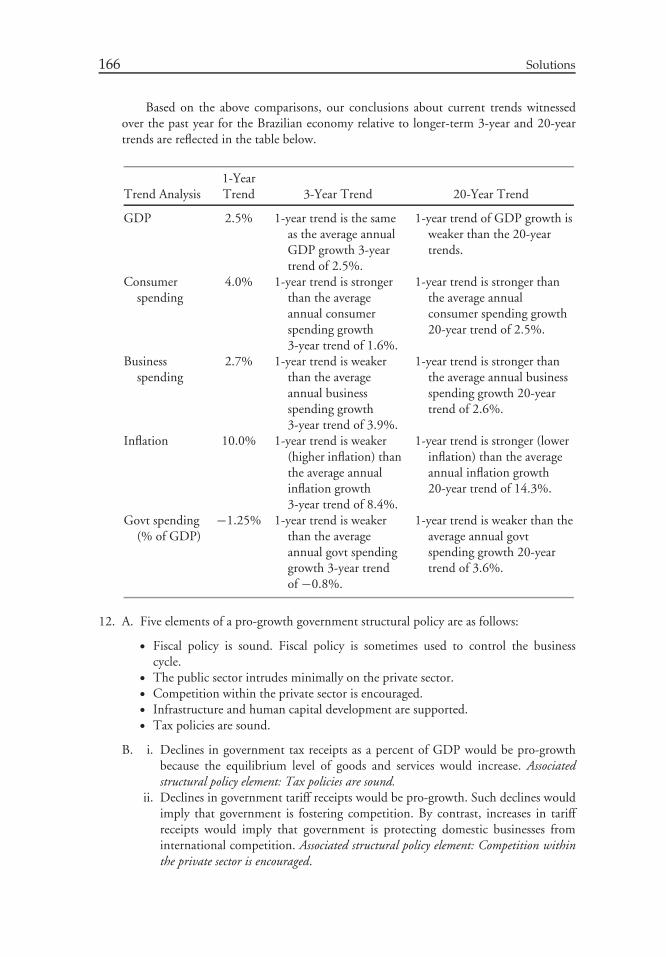
166 Solutions
Based on the above comparisons, our conclusions about current trends witnessedover the past year for the Brazilian economy relative to longer-term 3-year and 20-yeartrends are reflected in the table below.
Trend Analysis1-YearTrend 3-Year Trend 20-Year Trend
GDP 2.5% 1-year trend is the sameas the average annualGDP growth 3-yeartrend of 2.5%.
1-year trend of GDP growth isweaker than the 20-yeartrends.
Consumerspending
4.0% 1-year trend is strongerthan the averageannual consumerspending growth3-year trend of 1.6%.
1-year trend is stronger thanthe average annualconsumer spending growth20-year trend of 2.5%.
Businessspending
2.7% 1-year trend is weakerthan the averageannual businessspending growth3-year trend of 3.9%.
1-year trend is stronger thanthe average annual businessspending growth 20-yeartrend of 2.6%.
Inflation 10.0% 1-year trend is weaker(higher inflation) thanthe average annualinflation growth3-year trend of 8.4%.
1-year trend is stronger (lowerinflation) than the averageannual inflation growth20-year trend of 14.3%.
Govt spending(% of GDP)
−1.25% 1-year trend is weakerthan the averageannual govt spendinggrowth 3-year trendof −0.8%.
1-year trend is weaker than theaverage annual govtspending growth 20-yeartrend of 3.6%.
12. A. Five elements of a pro-growth government structural policy are as follows:
• Fiscal policy is sound. Fiscal policy is sometimes used to control the businesscycle.
• The public sector intrudes minimally on the private sector.• Competition within the private sector is encouraged.• Infrastructure and human capital development are supported.• Tax policies are sound.
B. i. Declines in government tax receipts as a percent of GDP would be pro-growthbecause the equilibrium level of goods and services would increase. Associatedstructural policy element: Tax policies are sound.
ii. Declines in government tariff receipts would be pro-growth. Such declines wouldimply that government is fostering competition. By contrast, increases in tariffreceipts would imply that government is protecting domestic businesses frominternational competition. Associated structural policy element: Competition withinthe private sector is encouraged.
Chapter 4 Capital Market Expectations 167
iii. Increases in the number of publicly funded schools would be pro-growth becausebusinesses stand to gain from a well-educated workforce. Associated structural policyelement: Infrastructure and human capital development are supported.
iv. A negative net change in the number of state-owned businesses (that is, fewersuch businesses) would be pro-growth. Such a change would increase the privatesector’s share of output, which would favor the efficient allocation of scarceresources. Associated structural policy element: The public sector intrudes minimallyon the private sector.
v. A decrease in the long-term average budget deficit as a percent of GDP is pro-growth, because it would be a positive for controlling the current account deficit.Associated structural policy element: Fiscal policy is sound.
13. Four factors usually associated with emerging market economies are as follows:
• Emerging market economies require high rates of investment, which is usually inshort supply within the emerging economy itself. This situation creates a reliance onforeign capital. Areas of needed investment usually include both physical assets (capitalequipment and infrastructure) and human capital (education and skills building).
• Emerging economies typically have volatile political and social situations. Leadersusually acquire and maintain power using force and other less-than-democratic means.The social environment is usually strained by the fact that a large portion of thepopulation possesses few assets, has little formal education, and is unable to generateincome to feed/support family and neighbors.
• To alleviate the first two factors above, organizations such as the IMF and WorldBank provide conduits for external sources of investment and a means to push forstructural reforms—political, social, educational, pro-growth, etc. The ‘‘conditions’’usually prescribed by these institutions are often felt to be draconian.
• Emerging countries typically have economies that are relatively small and undiversified.Those emerging economies that are dependent on oil imports are especially vulnerablein periods of rising energy prices and can become dependent on ongoing capital inflows.
14. The consumer-oriented aspect of the Australian economy (as measured by consumerorders) has been consistently strengthening over the past several months. The consumermeasure had a negative reading in June, a slightly positive reading in July, and an evenstronger August reading. From this information, we can state that the consumer-orientedaspect of the Australian economy appears to be improving.
The business-oriented aspect of the Australian economy (as measured by businesscapital goods orders) has remained quite flat in the period reviewed. From this information,we can state that the business-oriented aspect of the Australian economy currently appearsto be a positive contributor but is not necessarily showing signs of improvement orweakness. Thus, in recent months, the measure has been a stable but positive contributor.
The central bank–oriented aspect of the Australian economy (as measured by centralbank money supply) has also steadily improved over the period being analyzed.
All of the leading indicator components have been positively contributing to theeconomy, and most have been contributing at an increasingly positive rate (all exceptbusiness capital goods orders). These components are a sign of current economic activityand also typically create additional economic activity by their very nature. In addition, thetotal index of leading indicators, which includes all the components, has likewise movedupward steadily over the past few months. Thus, we can conclude from the measures inthe table that the Australian economy should show continued growth over the next six tonine months.
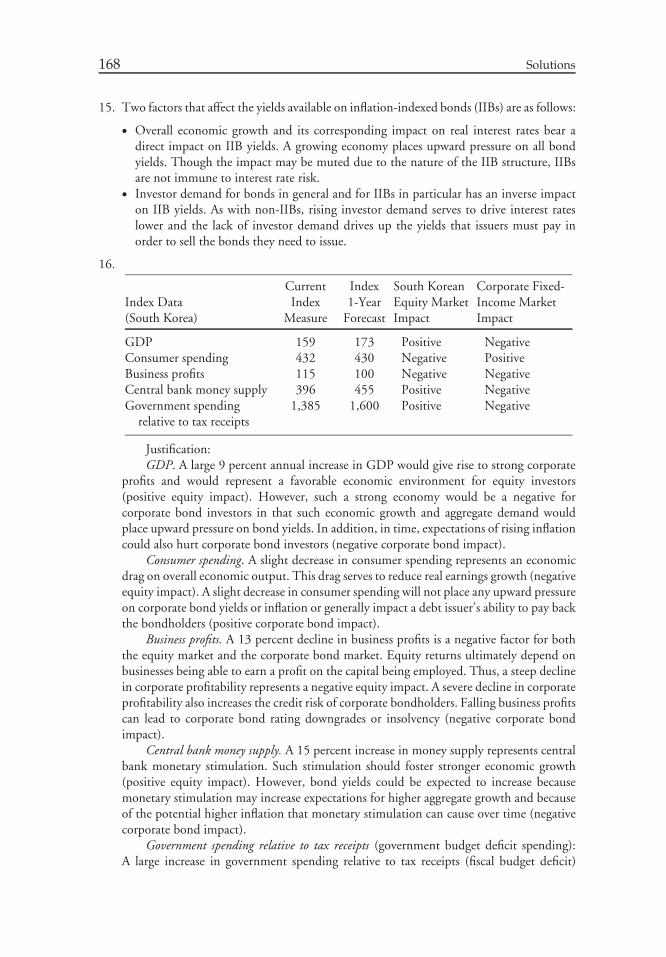
168 Solutions
15. Two factors that affect the yields available on inflation-indexed bonds (IIBs) are as follows:
• Overall economic growth and its corresponding impact on real interest rates bear adirect impact on IIB yields. A growing economy places upward pressure on all bondyields. Though the impact may be muted due to the nature of the IIB structure, IIBsare not immune to interest rate risk.
• Investor demand for bonds in general and for IIBs in particular has an inverse impacton IIB yields. As with non-IIBs, rising investor demand serves to drive interest rateslower and the lack of investor demand drives up the yields that issuers must pay inorder to sell the bonds they need to issue.
16.
Index Data(South Korea)
CurrentIndex
Measure
Index1-Year
Forecast
South KoreanEquity MarketImpact
Corporate Fixed-Income MarketImpact
GDP 159 173 Positive NegativeConsumer spending 432 430 Negative PositiveBusiness profits 115 100 Negative NegativeCentral bank money supply 396 455 Positive NegativeGovernment spending
relative to tax receipts1,385 1,600 Positive Negative
Justification:GDP. A large 9 percent annual increase in GDP would give rise to strong corporate
profits and would represent a favorable economic environment for equity investors(positive equity impact). However, such a strong economy would be a negative forcorporate bond investors in that such economic growth and aggregate demand wouldplace upward pressure on bond yields. In addition, in time, expectations of rising inflationcould also hurt corporate bond investors (negative corporate bond impact).
Consumer spending. A slight decrease in consumer spending represents an economicdrag on overall economic output. This drag serves to reduce real earnings growth (negativeequity impact). A slight decrease in consumer spending will not place any upward pressureon corporate bond yields or inflation or generally impact a debt issuer’s ability to pay backthe bondholders (positive corporate bond impact).
Business profits. A 13 percent decline in business profits is a negative factor for boththe equity market and the corporate bond market. Equity returns ultimately depend onbusinesses being able to earn a profit on the capital being employed. Thus, a steep declinein corporate profitability represents a negative equity impact. A severe decline in corporateprofitability also increases the credit risk of corporate bondholders. Falling business profitscan lead to corporate bond rating downgrades or insolvency (negative corporate bondimpact).
Central bank money supply. A 15 percent increase in money supply represents centralbank monetary stimulation. Such stimulation should foster stronger economic growth(positive equity impact). However, bond yields could be expected to increase becausemonetary stimulation may increase expectations for higher aggregate growth and becauseof the potential higher inflation that monetary stimulation can cause over time (negativecorporate bond impact).
Government spending relative to tax receipts (government budget deficit spending):A large increase in government spending relative to tax receipts (fiscal budget deficit)
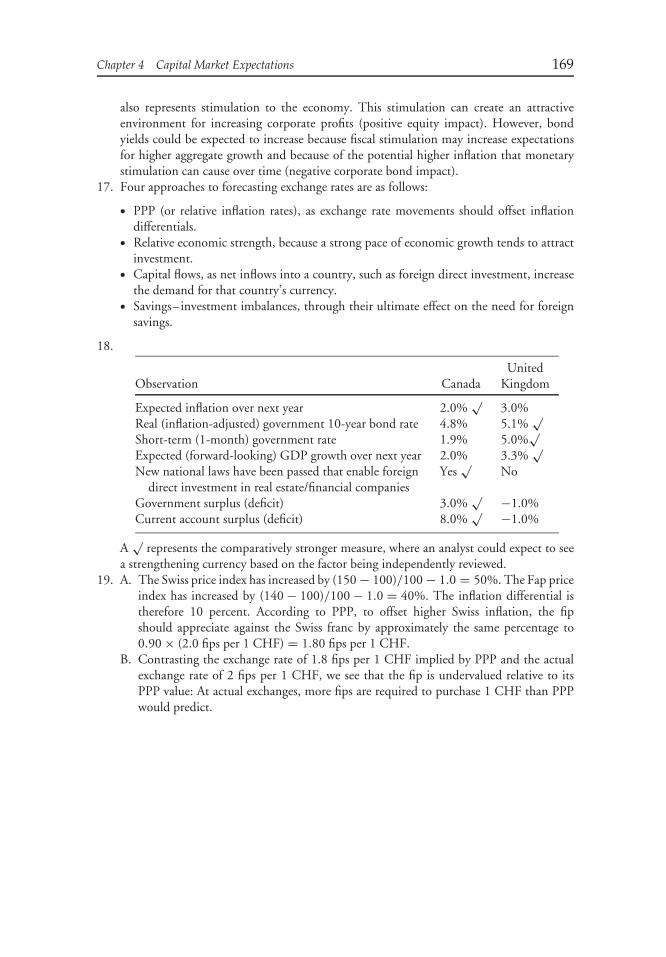
Chapter 4 Capital Market Expectations 169
also represents stimulation to the economy. This stimulation can create an attractiveenvironment for increasing corporate profits (positive equity impact). However, bondyields could be expected to increase because fiscal stimulation may increase expectationsfor higher aggregate growth and because of the potential higher inflation that monetarystimulation can cause over time (negative corporate bond impact).
17. Four approaches to forecasting exchange rates are as follows:
• PPP (or relative inflation rates), as exchange rate movements should offset inflationdifferentials.
• Relative economic strength, because a strong pace of economic growth tends to attractinvestment.
• Capital flows, as net inflows into a country, such as foreign direct investment, increasethe demand for that country’s currency.
• Savings–investment imbalances, through their ultimate effect on the need for foreignsavings.
18.
Observation CanadaUnited
Kingdom
Expected inflation over next year 2.0%√
3.0%Real (inflation-adjusted) government 10-year bond rate 4.8% 5.1%
√
Short-term (1-month) government rate 1.9% 5.0%√
Expected (forward-looking) GDP growth over next year 2.0% 3.3%√
New national laws have been passed that enable foreigndirect investment in real estate/financial companies
Yes√
No
Government surplus (deficit) 3.0%√ −1.0%
Current account surplus (deficit) 8.0%√ −1.0%
A√
represents the comparatively stronger measure, where an analyst could expect to seea strengthening currency based on the factor being independently reviewed.
19. A. The Swiss price index has increased by (150 − 100)/100 − 1.0 = 50%. The Fap priceindex has increased by (140 − 100)/100 − 1.0 = 40%. The inflation differential istherefore 10 percent. According to PPP, to offset higher Swiss inflation, the fipshould appreciate against the Swiss franc by approximately the same percentage to0.90 × (2.0 fips per 1 CHF) = 1.80 fips per 1 CHF.
B. Contrasting the exchange rate of 1.8 fips per 1 CHF implied by PPP and the actualexchange rate of 2 fips per 1 CHF, we see that the fip is undervalued relative to itsPPP value: At actual exchanges, more fips are required to purchase 1 CHF than PPPwould predict.

CHAPTER 5ASSET ALLOCATION
SOLUTIONS
1. A. The economic role of strategic asset allocation is to supply the investor’s desiredexposures to systematic risk. A single company’s shares have substantial idiosyncraticor nonsystematic risk. By contrast, an indexed investment is a highly diversifiedportfolio with negligible nonsystematic risk. Representing an equity asset class withan indexed investment far better fulfills the purposes of strategic asset allocation.
B. i. The more frequently RFM rebalances to its strategic asset allocation, the moreimportant strategic asset allocation will appear in a time-series sense as in Brinson,Hood, and Beebower (1986).
ii. If RFM chooses to index, the measured time-series importance of strategic assetallocation will increase, but it will decrease if RFM actively manages within assetclasses, all else equal. This effect will occur because the percent of total variationexplained by security selection will increase. Active management will also tend todecrease the measured cross-sectional importance of asset allocation.
iii. By itself, choosing a policy portfolio that is distinct from peers’ should not affectasset allocation’s measured importance in a time-series sense. It will tend todifferentiate RFM’s returns from those of its peers, however, and tend to makeasset allocation appear important in a cross-sectional sense.
C. The institutional analyst is proposing a tactical asset allocation program because itinvolves making short-term adjustments to asset-class weights based on short-termexpected relative performance differences between domestic and international equities.A problem with the TAA program is that the band of asset weights within whichthe proposed TAA would operate is too wide in relation to the permissible range forinternational equities determined by the Investment Policy Committee.
D. A major concern of a DB pension plan is funding the pension liability. An ALMapproach more directly and precisely addresses that concern than an asset-onlyapproach to strategic asset allocation. A dynamic ALM approach considers theinterperiod linkages of optimal investment decisions. By contrast, a static approach doesnot account for such linkages. A single-period mean–variance surplus optimizationmodel is an example of a static ALM model. An advantage of a dynamic ALMapproach is that it takes account of interperiod linkages; a disadvantage is that it ismore costly and complex to implement than a static approach.
E. Because the RFM pension liability can be modeled approximately as a short positionin a long-term bond, the risk-minimizing strategic asset allocation is one 100 percentinvested in long-term bonds.
170

Chapter 5 Asset Allocation 171
2. Using Equation 5-1,
Um = E(Rm) − 0.005RAσ2m
= E(Rm) − 0.005(5)σ2m
= E(Rm) − 0.025σ2m
Therefore, for Allocation A, UA = E(RA) − 0.025σ2A = 11.5 − 0.025(18)2 = 11.5 −
8.1 = 3.4 percent; Allocation B, UB = E(RB) − 0.025σ2B = 8 − 0.025(14)2 = 8 − 4.9
= 3.1 percent; and for Allocation C, UC = E(RC ) − 0.025σ2C = 6 − 0.025(10)2 = 6 −
2.5 = 3.5 percent.Asset Allocation C appears best because it affords Lagland the highest risk-adjusted
expected return.3. We can use Roy’s safety-first criterion with a return threshold (RL) of 3.5 percent to
decide which of the three allocations best meets the Garrett Foundation’s objective. Theasset allocation with the highest ratio [E(RP ) − RL]/σP is the one that minimizes theprobability of not meeting the return threshold.
Allocation A: 0.444 = (11.5 − 3.5)/18
Allocation B: 0.321 = (8 − 3.5)/14
Allocation C: 0.250 = (6 − 3.5)/10
Allocation A, with the largest ratio (0.444), is the foundation’s best alternative accordingto Roy’s safety-first criterion.
4. Because (1.05)(1.024)(1.006) − 1 = 0.082 or 8.2 percent, only Asset Allocation A withan expected return of 11.5 percent promises to satisfy Ernst’s return requirement.
5. A. U.S. equities form a major part of world equities, so the specification does not meet thecriterion that asset classes should be mutually exclusive. A possible additional criticismis that the asset classes may be nonhomogeneous. Narrower asset-class specificationsmay help control systematic risk.
B. Alternative assets need to be subdivided further for asset allocation purposes becausethey are not homogeneous as a group. A further possible criticism is that the assetclasses do not make up a preponderance of world wealth because Canadian marketsare only a small fraction of world wealth (the text mentions that Canadian equitymarkets are one-tenth as large as U.S. equity markets).
C. With the addition of U.S. fixed-income asset classes, this asset-class set should meet allthe stated criteria. The specification between small- and large-cap stocks is frequentlyencountered because they are well differentiated; however, the argument could be madethat mid-cap stocks should be added (or the limits of ‘‘small-cap’’ and ‘‘large-cap’’defined to cover ‘‘mid-cap’’) to better cover investable wealth.
6. According to Equation 5-3, the new asset class’s Sharpe ratio must exceed the quantity(Sharpe ratio of existing portfolio) × (Correlation of U.S real estate with the existingportfolio) = 0.40(0.35) = 0.14 for it to be optimal to add the new asset class. Thus, thefoundation should add U.S. real estate if its predicted Sharpe ratio exceeds 0.14. Becausethe fund predicts a Sharpe ratio of 0.12 for U.S. real estate, the foundation should notadd that asset class to the existing portfolio.
7. The relatively constant elements in the asset allocation process are the predictionprocedure, the investor’s risk tolerance function, and the optimizer. Most of the investor’sexpertise goes into formulating these stable elements. The prediction procedure represents

172 Solutions
the investor’s perception of best process for developing capital market expectations. Theinvestor’s risk tolerance function represents a quantification of his risk attitudes. Theoptimizer is the procedure for producing the best asset allocation. By contrast, the otherelements of the process are inputs or outputs that are regularly revised.
8. The global minimum-variance portfolio has the smallest variance among all portfolios onthe minimum-variance frontier. The concept is important in a mean–variance asset-onlyapproach to asset allocation. By contrast, the minimum surplus variance portfolio conceptis important in a mean–variance surplus optimization approach that focuses on surplusor net worth. The minimum surplus variance portfolio has minimum variance of surplusamong all portfolios on the surplus efficient frontier.
9. A. Corner portfolios arise from a mean–variance optimization in which asset-class weightsare constrained to be nonnegative. The global minimum variance portfolio is alwaysincluded as a corner portfolio. Corner portfolios are minimum-variance portfolios inwhich an asset weight changes from zero to positive or from positive to zero alongthe minimum-variance frontier. The usefulness of corner portfolios comes from thefact that, although few in number, they can be used to find the composition of anyminimum-variance portfolio.
B. FRMC’s return requirement is (1.035)(1.0225)(1.00436) − 1.0 = 0.06290 or 6.29percent a year. This result contrasts to an additive return requirement of 3.5% +2.25% + 0.436% = 6.19%, which is lower.
C. The highest Sharpe-ratio-efficient portfolio is close to Corner Portfolio 4. CornerPortfolio 4’s expected return of 5.03 percent, however, does not satisfy FRMC’sreturn objective of 6.29 percent. The efficient portfolio that just satisfies FRMC’sreturn requirement must lie between Corner Portfolio 4 and Corner Portfolio 3,which has an expected return of 7.55 percent. The portfolio thus identified will havethe highest Sharpe ratio among those efficient portfolios satisfying FRMC’s returnrequirement.
From the corner portfolio theorem, it follows that
6.29 = 7.55w + 5.03(1 − w)
We find that the weight on Corner Portfolio 3 is w = 0.500 and the weight on CornerPortfolio 4 is (1 − w) = 0.500. Therefore,
Weight of French equities 0.5(53.22%) + 0.5(0.00%) = 26.61%
Weight of ex-France equities 0.5(37.23%) + 0.5(24.70%) = 30.97%
Weight of French bonds 0.5(0%) + 0.5(43.30%) = 21.65%
Weight of real estate 0.5(9.55%) + 0.5(32.00%) = 20.78%
As an arithmetic check, 26.61% + 30.97% + 21.65% + 20.78% = 100%.10. A. i. No. A conventional mean–variance efficient frontier is calculated using estimates
of return distribution parameters. By assumption, the weights in Frontier B donot reflect estimation error, so the resulting efficient frontier must be superiorto the conventional efficient frontier using estimates (in fact, it must be the bestattainable). A frontier is superior to another frontier if it lies above it.
ii. No. An efficient frontier reflecting the true return parameters must lie above theresampled efficient frontier. Resampled efficiency addresses estimation error byaveraging portfolio weights across different simulations but cannot completelyremove its impact.

Chapter 5 Asset Allocation 173
B. The results of MVO, in particular the composition of efficient portfolios, are mostsensitive to expected return inputs. As discussed in the text, estimation error inexpected returns has been estimated to be roughly 10 times as important as estimationerror in variances and 20 times as important as estimation in covariances.
11. A. The scatter of points in Exhibit 5–7 can be called a statistical equivalence regionbecause these points represent possible efficient portfolios that could result fromsampling based on the same underlying return parameters.
B. For each series of points, the numbering represents a rank order by mean return.The first point in the resampled efficient frontier is found by averaging the portfolioweights of assets in 1, 1′, and 1′′; the second by averaging 2, 2′, and 2′′; and so forthto the highest mean return resampled efficient portfolio (averaging the weights of 5,5′, and 5′′).
12. According to the Monte Carlo simulation the current asset allocation is not expected tosatisfy Stevenson’s requirement. The y-axis in Exhibit 5-8 is a logarithmic scale. Becauselog10(630,000) = 5.8 while log10(100,000) = 5 and log10(1,000,000) = 6, $630,000would be a point eight-tenths of the distance between the $100,000 and $1,000,000hatch marks. Note that relevant line is the 10 percent one, because 90 percent of outcomeslie above it, and that in the year 2012 (10 years from 2002) the 10 percent line clearly isless than that ‘‘eight-tenths’’ point. Thus Stevenson cannot expect that portfolio value (inreal dollars) to be at least $630,000 with a probability of 90 percent at age 75.
13. A. We use Equation 5-4:
U ALMm = E(SRm) − 0.005RAσ2(SRm)
= E(SRm) − 0.005(5)σ2(SRm)
= E(SRm) − 0.025σ2(SRm)
For Allocation A,
U ALMA = E(SRA) − 0.025σ2(SRA) = 6.5 − 0.025(14)2 = 6.5 − 4.90 = 1.60
For Allocation B,
U ALMB = E(SRB) − 0.025σ2(SRB) = 4.0 − 0.025(10)2 = 4.0 − 2.50 = 1.50
For Allocation C,
U ALMC = E(SRC ) − 0.025σ2(SRC ) = 0.0 − 0.025(2)2 = 0.0 − 0.10 = −0.10
ILIC should prefer Asset Allocation A because it has the highest risk-adjusted expectedreturn.
B. ILIC can use Monte Carlo simulation to obtain information concerning an assetallocation over time, as described in the text.
14. A. Long-term bond holdings are important for life insurers because of their asset/liabilitymanagement (ALM) emphasis and the long-term nature of their liabilities. In contrast,individual investors do not have ALM concerns to the same degree, in general. Asdiscussed in the text as well, because of the importance of human capital in relationto financial capital during youth, for many young investors equity investments will

174 Solutions
be very large relative to fixed-income holdings. In conclusion, long-term bonds aregenerally more important in strategic asset allocation for life insurers than for younginvestors.
B. Banks are generally restricted by regulations in their holdings of common stock.Overall, common stock plays a minimal role in banks’ securities portfolio. By contrast,because of human capital considerations mentioned in the solution to Part A, commonstock investments tend to be very important for young investors (with the possibleexception of those investors whose employment income is linked to equity marketreturns).
C. Because endowments are tax exempt, tax-exempt bonds play no role in their strategicasset allocation. In contrast, tax-exempt bonds sometimes play a substantive role forindividual investors in high tax brackets, such as many midcareer professionals.
D. Private equity may play a role in the strategic asset allocation of substantial investors,both institutional and individual. A major foundation is much more likely to have theresources to research and invest in private companies than young investors and to playa role in strategic asset allocation.
15. A. At age 30, the closest Smith can get to his optimal 60/40 asset allocation is toinvest 100 percent of his financial assets in stocks, a 100/0 stock/bond mix. Thenhis effective asset allocation for total wealth is $100,000/$2,200,000 = 4.55% stocksand 95.45% bonds.
B. At age 50, the closest Smith can get to his optimal 60/40 asset allocation is toinvest 100 percent of his financial assets in stocks, 100/0 stock/bond mix. Then hiseffective asset allocation for total wealth is $900,000/$2,200,000 = 40.91% stocksand 59.09% bonds.
C. At age 65, Smith can attain his optimal 60/40 asset allocation by holding 0.60 ×$2,200,000 = $1,320,000 in stocks for an asset allocation of $1,320,000/$2,000,000 = 66% stocks and 34% bonds, considering financial capital only.
D. At ages 30, 50, and 65, Smith’s financial asset allocations were determined to be 100/0,100/0, and 66/34, respectively. The results are consistent with the experience-basedprinciple that for most individual investors, the allocation to stocks should be relativelylarge early in life and smaller later in life.
16. A. U.S. equities, and ex-U.S. equities represent respectively 30%/60% = 0.5 and30%/60% = 0.5 of global equities. Therefore, for global equities,
A = (0.5 × 8%) + (0.5 × 10%) = 9%
B = (0.5 × 14%) + (0.5 × 10%) = 12%
Global equities’ short-term expected return at 12 percent is above the long-termexpectation of 9 percent because U.S. equities are expected in the short-term tooutperform their long-term expected return.
U.S. bonds and ex-U.S. bonds represent respectively 30%/40% = 0.75 and10%/40% = 0.25 of global fixed income. Therefore, for global fixed income,
C = (0.75 × 6%) + (0.25 × 5%) = 5.75%
D = (0.75 × 8%) + (0.25 × 4%) = 7%
Global fixed income’s short-term expected return at 7 percent is above its long-termexpectation of 5.75 percent. However within global fixed income U.S. bonds are

Chapter 5 Asset Allocation 175
expected short-term at 8 percent to outperform their long-term expected return whileex-U.S. bonds are expected short term at 4 percent to underperform their long-termexpected return.
B. The results in Part A suggest three actions:
• In absolute terms, the global equities short-term expected return is 300 basis pointsabove its expected long-term value of 9 percent; in relative terms, that is equivalentto a 12%/9% − 1.0 = 33% higher expected return. For global fixed income, theabsolute and relative expected return differences are 125 basis points and 22 percent,respectively. Because global equities appear more undervalued than global bonds,increase the weight on global equities from 60 percent and decrease the weight onglobal fixed income from 40 percent.
• Within global equities, overweight U.S. equities versus their target weight of 30percent and decrease the weight on ex-U.S. equities from 30 percent. Althoughthe short-term expected return on ex-U.S. equities is the same as the long-termexpectation, U.S. equities are expected to outperform their long-term expectedreturn by 600 basis points in the short term.
• Within the new global fixed-income allocation, overweight U.S. bonds and under-weight ex-U.S. bonds, reflecting their short-term expected performance.
17. Portfolio C is the only appropriate choice. It is well diversified across all asset classeswith minimal initial public offering (IPO)/technology exposure, and only 34 percent ofthe portfolio exposed to the riskier asset classes in total (IPO/tech, small-cap growth,and venture capital). IPO/Tech assets may be highly correlated with the plan sponsor’sunderlying business, thereby exposing both the company and the plan beneficiaries toexcessive risk in the event of a sharp downturn in the company’s business. Portfolio Chas a Sharpe ratio higher than that of the current portfolio; Portfolio C’s Sharpe ratio islower than, but in line with, those of Portfolios A and B. Portfolio C is better diversifiedacross asset classes and substantially less volatile. Finally, Portfolio C has minimal reserves,which is appropriate given the plan’s long time horizon and minimal liquidity needs.
18. To avoid a repetition of last year’s shrinkage in the plan’s surplus, BI’s board mustconsider both surplus management and the level of total return produced. As such,Donovan should recommend that the board consider Portfolio E. Portfolio E minimizessurplus volatility while meeting the board’s expected return objective of 9 percent. Itsabsolute volatility is only slightly more than that of the current portfolio (which offers alower rate of return) and equals that of Portfolio B (which offers a slightly higher expectedreturn but also higher surplus volatility). Adopting Portfolio E would minimize surplusvolatility without significantly increasing absolute risk or sacrificing expected return.
19. The real return from the recommended allocation should meet the minimum requiredreturn identified in the IPS. The allocation philosophy will reflect the Foundation’s returnobjective, above-average risk tolerance, low liquidity requirements, and tax-exempt status.In general the portfolio allocation should include the following:
• An allocation to fixed-income instruments of less than 50 percent, because real returnsof bonds are forecasted to be lower than those of stocks. Bonds will be includedprimarily for diversification and risk reduction. The ongoing cash flow from the bondportfolio should easily provide for all normal working capital needs.
• An allocation to equities greater than 50 percent. A number of factors support a highallocation to equities: historical and expected real returns are high, the horizon is long,risk tolerance is above average, and taxes are not a consideration.

176 Solutions
• Within the equity universe, large-cap, small-cap, international stocks and venturecapital should be considered. Diversifying within the equity universe will contribute torisk reduction, and total return could be enhanced.
• Real estate should be included in the portfolio as an alternative to stocks and bonds. Itwill provide diversification as well as inflation protection in the long term.
An example of an appropriate modestly aggressive allocation is shown below:
7-Year RealForecast of Recommended Return
Asset Class Real Returns Allocation Contribution
Cash (U.S.):T-bills 0.7% 0% −
BondsIntermediate 2.3 5 0.115%Long Treasury 4.2 10 0.420Corporate 5.2 10 0.520International 4.9 10 0.490
StocksLarge cap 5.5 30 1.650Small cap 8.5 10 0.850International 6.6 10 0.660
Venture capital 12.0 5 0.600Real estate 5.0 10 0.500
Total expected real return 100% 5.805%

CHAPTER 6FIXED-INCOME PORTFOLIO
MANAGEMENT
SOLUTIONS
1. The tracking risk is the standard deviation of the active returns. For the data shown inthe problem, the tracking risk is 19.728 bps, as shown below:
Portfolio Benchmark ActivePeriod Return Return Return (AR − Avg. AR)2
1 14.10% 13.70% 0.400% 0.00090%2 8.20 8.00 0.200 0.000103 7.80 8.00 −0.200 0.000904 3.20 3.50 −0.300 0.001605 2.60 2.40 0.200 0.000106 3.30 3.00 0.300 0.00040Average active return per period = 0.100%Sum of the squared deviations = 0.00400%
Tracking risk (std. dev.) = 0.28284%
2. A. Equity = E = 40 percent of ¤5 million = ¤2 million
Borrowed funds = B = 60 percent of ¤5 million = ¤3 million
k = Cost of borrowed funds = 4.6 percent per year
= 4.6/12 or 0.3833 percent per 30 days
rF = Return on funds invested = 0.5 percent
Therefore,
RE = Return on equity = rF = 0.5 percent
RB = Return on borrowed funds = rF − k = 0.5 − 0.3833 = 0.1167 percent
B. RP = Portfolio rate of return = (Profit on borrowed funds + Profit on equity)/Amount of equity = [B × (rF − k) + E × rF ]/E = [¤3 million × (0.5 − 0.3833)+ ¤2 million × 0.5]/¤2 million = 0.6750 percent
177
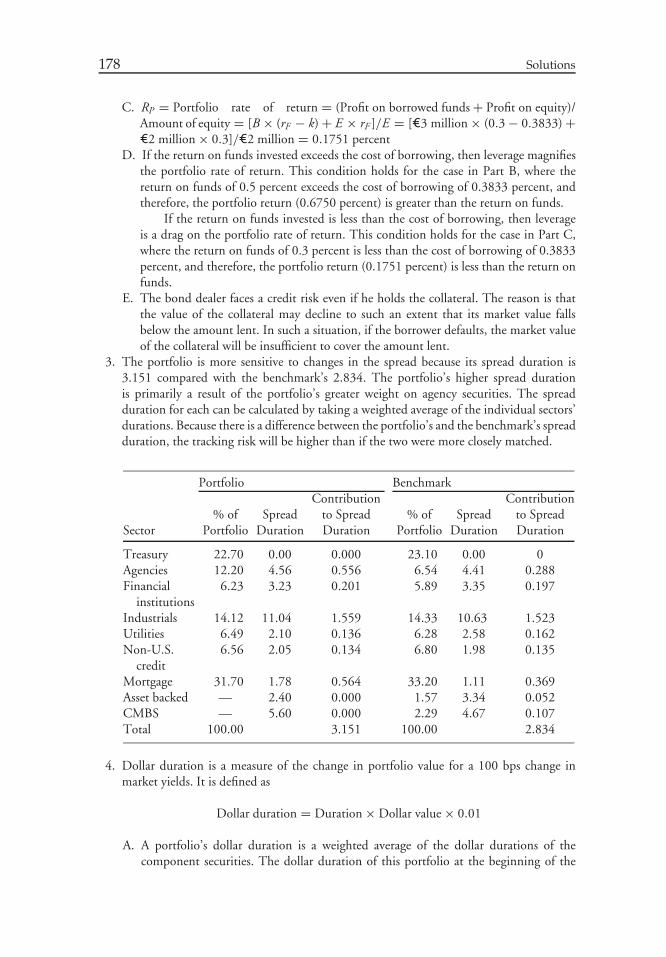
178 Solutions
C. RP = Portfolio rate of return = (Profit on borrowed funds + Profit on equity)/Amount of equity = [B × (rF − k) + E × rF ]/E = [¤3 million × (0.3 − 0.3833) +¤2 million × 0.3]/¤2 million = 0.1751 percent
D. If the return on funds invested exceeds the cost of borrowing, then leverage magnifiesthe portfolio rate of return. This condition holds for the case in Part B, where thereturn on funds of 0.5 percent exceeds the cost of borrowing of 0.3833 percent, andtherefore, the portfolio return (0.6750 percent) is greater than the return on funds.
If the return on funds invested is less than the cost of borrowing, then leverageis a drag on the portfolio rate of return. This condition holds for the case in Part C,where the return on funds of 0.3 percent is less than the cost of borrowing of 0.3833percent, and therefore, the portfolio return (0.1751 percent) is less than the return onfunds.
E. The bond dealer faces a credit risk even if he holds the collateral. The reason is thatthe value of the collateral may decline to such an extent that its market value fallsbelow the amount lent. In such a situation, if the borrower defaults, the market valueof the collateral will be insufficient to cover the amount lent.
3. The portfolio is more sensitive to changes in the spread because its spread duration is3.151 compared with the benchmark’s 2.834. The portfolio’s higher spread durationis primarily a result of the portfolio’s greater weight on agency securities. The spreadduration for each can be calculated by taking a weighted average of the individual sectors’durations. Because there is a difference between the portfolio’s and the benchmark’s spreadduration, the tracking risk will be higher than if the two were more closely matched.
Portfolio BenchmarkContribution Contribution
% of Spread to Spread % of Spread to SpreadSector Portfolio Duration Duration Portfolio Duration Duration
Treasury 22.70 0.00 0.000 23.10 0.00 0Agencies 12.20 4.56 0.556 6.54 4.41 0.288Financial
institutions6.23 3.23 0.201 5.89 3.35 0.197
Industrials 14.12 11.04 1.559 14.33 10.63 1.523Utilities 6.49 2.10 0.136 6.28 2.58 0.162Non-U.S.
credit6.56 2.05 0.134 6.80 1.98 0.135
Mortgage 31.70 1.78 0.564 33.20 1.11 0.369Asset backed — 2.40 0.000 1.57 3.34 0.052CMBS — 5.60 0.000 2.29 4.67 0.107Total 100.00 3.151 100.00 2.834
4. Dollar duration is a measure of the change in portfolio value for a 100 bps change inmarket yields. It is defined as
Dollar duration = Duration × Dollar value × 0.01
A. A portfolio’s dollar duration is a weighted average of the dollar durations of thecomponent securities. The dollar duration of this portfolio at the beginning of the

Chapter 6 Fixed-Income Portfolio Management 179
period is $54,212, which is calculated as
Portfolio Dollar Duration = 0.013
[(1,060,531)(5.909) + (981,686)(3.691)
+ (1,090,797)(5.843)]
= $54,212.
or
Initial Values
Security Price Market Value Duration Dollar Duration
Bond 1 $106.110 $1,060,531 5.909 $62,667Bond 2 98.200 981,686 3.691 36,234Bond 3 109.140 1,090,797 5.843 63, 735
Portfolio Dollar Duration = $54,212
At the end of one year, the portfolio’s dollar duration has changed to $45,439, asshown below.
After 1 Year
Security Price Market Value Duration Dollar Duration
Bond 1 $104.240 $1,042,043 5.177 $53,947Bond 2 98.084 980,461 2.817 27,620Bond 3 106.931 1,068,319 5.125 54, 751
Portfolio Dollar Duration = $45,439
B. The rebalancing ratio is a ratio of the original dollar duration to the new dollarduration:
Rebalancing ratio = $54,212/$45,439 = 1.193
C. The portfolio requires each position to be increased by 19.3 percent. The cash requiredfor this rebalancing is calculated as:
Cash required = 0.193 × ($1,042,043 + 980,461 + 1,068,319) = $596,529
5. A. Because you are considering bonds with embedded options, the returns of portfoliosare unlikely to be normally distributed. Because shortfall risk is not based on normalityassumption, however, it may be used as a risk measure. Furthermore, because theclient has specified a minimum target return (£25,000/£2,000,000 or 1.25 percentover the next six months), shortfall risk could be a useful measure to look at.
B. One of the shortcomings of shortfall risk is that it is not as commonly used asstandard deviation, and there is relatively less familiarity with shortfall risk. Also, itsstatistical properties are not well known. Unlike VAR, it does not take the form of adollar amount. Finally, the shortfall risk gives the probability of the returns from the

180 Solutions
portfolio falling below the specified minimum target return, but it does not provideany information about the extent to which the return may be below the specifiedminimum target.
6. A. Because the fund desires to increase the duration, it would need to buy futures contracts.
B. DT = target duration for the portfolio = 10
DI = initial duration for the portfolio = 8.17
PI = initial market value of the portfolio = ¤75 million
DCTD = the duration of the cheapest-to-deliver bond = 9.35
PCTD = the price of the cheapest-to-deliver bond = ¤130,000
Conversion factor for the cheapest-to-deliver bond = 1.06
Approximate number of contracts
= (DT − DI )PI
DCTDPCTD× Conversion factor for the CTD bond
= (10.0 − 8.17) × 75,000,0009.35 × 130,000
× 1.06 = 119.69.
Thus, the pension fund would need to buy 119 futures contracts to achieve the desiredincrease in duration.
7. Covered call writing is a good strategy if the rates are not going to change much fromtheir present level. The sale of the calls brings in premium income that provides partialprotection in case rates increase. The additional income from writing calls can be usedto offset declining prices. If rates fall, portfolio appreciation is limited because the shortcall position is a liability for the seller, and this liability increases as rates go down.Consequently, there is limited upside potential for the covered call writer. Overall, thisdrawback does not have negative consequences if rates do not change because the addedincome from the sale of calls would be obtained without sacrificing any gains. Thus,Consultant A, who suggested selling covered calls, probably believes that the interest rateswould not change much in either direction.
Doing nothing would be a good strategy for a bondholder if he believes that rates aregoing down. The bondholder could simply gain from the increasing bond prices. Thus,Consultant B, who suggested doing nothing, likely believes that the interest rates wouldgo down.
If one has no clear opinion about the interest rate outlook but would like to avoidrisk, selling interest rate futures would be a good strategy. If interest rates were to decline,the loss in value of bonds would be offset by the gains from futures. Thus, Consultant C,who suggested selling interest rate futures, is likely the one who has no opinion.
Paying the premium for buying the puts would not be a bad idea if a bondholderbelieves that interest rates are going to increase. Thus, Consultant D is likely the one whobelieves that the interest rates are headed upward.
8. The payoff to More Money Funds would be:
Payoff = (0.030 − Credit spread at maturity) × $10,000,000 × 5
A. Payoff = (0.030 − 0.025) × $10,000,000 × 5 = $ 250,000.B. Payoff = (0.030 − 0.035) × $10,000,000 × 5 = −$250,000, or a loss of $250,000.

Chapter 6 Fixed-Income Portfolio Management 181
C. The maximum gain would be in the unlikely event of credit spread at the forwardcontract maturity being zero. So, the best possible payoff is (0.030 − 0.000) ×$10,000,000 × 5 = $1,500,000.
9. First, let us compute the amount in each of the three tranches in the CDO. Thesenior tranche is 70 percent of $250 million = $175 million. The junior tranche is 20percent of $250 million = $50 million. The rest is the equity tranche = $250 million −$175 million − $50 million = $25 million.
Now let us compute the amount that would be received by the equity tranche. Annualinterest generated by the collateral would be 6 + 5 = 11 percent of $250 million =$27.5 million. Annual interest received by the senior tranche would be 7.5 + 0.5 =8 percent of $175 million = $14 million. Annual interest received by the junior tranchewould be 6 + 3 = 9 percent of $50 million = $4.5 million. So, the amount to be receivedby the equity tranche is 27.5 − 14 − 4.5 = $9 million. This amount represents a returnof 9/25 = 0.36 or 36 percent.
10. The mispricing occurs because the forward rate doesn’t conform to the covered interestrate parity theorem.
A. The current discount rate is −2.48 percent [i.e., ($1.18 − $1.21)/$1.21]B. The covered interest rate parity theorem states that the forward foreign exchange rate
for a fixed period must be equal to the interest rate differentials between the twocountries.
Forward rate = spot rate × (1 + domestic interest rate)/(1 + foreign interest rate)
Substituting into the formula:
Forward rate = $1.21(1 + 0.02)/(1 + 0.03)
Forward rate = $1.198
11. The investor can evaluate the change in value of the Canadian bond if U.S. rates changeby 80 bps as follows:
! in value of Canadian bond = Canadian bond’s duration × Canada country beta
× ! in U.S. rates
! in value of Canadian bond = 8.40 × 0.63 × 0.80 percent
! in value of Canadian bond = 4.23 percent
12. Let W denote the spread widening.
Change in price = Duration × Change in yield
Change in price = 8.3 × W
Assuming, the increase in price caused by the spread widening will be 0.75 percent.
0.75% = 8.3 × W

182 Solutions
Solving for the spread widening, W ,
W = 0.0904% = 9.04 bps
Thus, a spread widening of 9.04 bps would wipe out the additional yield gained frominvesting in the U.S. bond. The 0.0904 percent change in rates would wipe out thequarterly yield advantage of 75 bps.
13. The forward premium on the Japanese yen is 2.7 − 1.6 = 1.1%. So, the portfoliomanager should hedge using a forward contract if the anticipated return on yen is lessthan 1.1 percent.
A. Because the anticipated return on yen of 1.5 percent is greater than 1.1 percent, theportfolio manager should not hedge.
B. Because the anticipated return on yen of 0.5 percent is less than 1.1 percent, theportfolio manager should hedge.
14. The interest rate differential between the U.K. pound and the U.S. dollar is 4.7 − 4.0 =0.7%. Because this differential is greater than the 0.4 percent return on the U.S. dollarexpected by the fund manager, the forward hedged position has a higher expected returnthan the unhedged position.

CHAPTER 7EQUITY PORTFOLIO
MANAGEMENT
SOLUTIONS
1. A. The three main large-cap styles are value, growth, and market oriented.B. Value managers seek to buy stocks below their intrinsic value. That said, the stocks
may be cheap for good reason. Also, it may take a long time for stocks to reach theirintrinsic value. Growth managers buy stocks of companies with either steadily growingearnings or companies whose earnings they expect to sharply appreciate. However,they may overpay for these earnings or the expected earnings may not materialize.Managers following the third style, market oriented, may forecast stock returns usinga combination of growth or value considerations but endeavor to build portfolios thatmore closely resemble the market than either value or growth managers. If their feesare relatively high for achieving market-like returns, indexing or enhanced indexingmay be a more cost-effective alternative.
2. The portfolio managed by Galicia is experiencing style drift. The threefold increase inthe weighting of growth stocks suggests that Galicia has decided to shift to more of amarket orientation, although some or all of the drift may have occurred because thestocks in the portfolio have become less value-like during the two-year period. Therelatively low percentages given to ‘‘Other’’ suggest that Galicia’s style exposures explainthe overwhelming majority of the portfolio’s performance.
3. The fund has a modest value orientation. Dividend yield, price-to-earnings ratio (P/E),price-to-book ratio (P/B), and earnings per share (EPS) growth are all slightly lowerthan the market benchmark. The sector weights are a bit more mixed. Some sectors thattypically contain stocks with value characteristics (consumer discretionary and utilities)are overweight, while others (finance and energy) are underweight or equal weight to thebenchmark. Also, traditionally growth-oriented sectors like health care and informationtechnology are modestly overweight—unlikely in a deep value portfolio.
4. A better approach would be full replication. The main justification for using full replicationis that all the components of the FTSE 100 are very liquid, so full replication can beaccomplished readily and inexpensively. Because full replication minimizes tracking risk,it is the preferred method when the index consists of liquid securities. Another point isthat full replication allows for the creation of a self-rebalancing portfolio in the case of avalue-weighted (or float-weighted index): Trading is required only to reinvest dividendsand to reflect changes in index composition. A self-rebalancing portfolio is one in whichthe portfolio moves in line with the index without any need for trading activity. An
183

184 Solutions
optimized portfolio may indeed hold fewer than 100 stocks. Because it does not containevery stock in the index in the proper capitalization weight, however, periodic trading willbe required (even in the absence of index changes and dividend flows) simply to realignthe portfolio’s characteristics with those of the index. Over time, the trading-related costswill drag down performance. In general, optimization should be used only in situationsin which full replication would result in substantial transaction costs.
5. A. The principal benefit of all stocks being categorized as either growth or value (MorganStanley Capital International [MSCI] approach) is that it is collectively exhaustive.That said, many stocks are ‘‘border’’ stocks (i.e., have characteristics that place themnear the value/growth border) that don’t really exhibit significant value or growthcharacteristics but are categorized in one of these styles anyway. The Dow Jonesmethod’s neutral/core category eliminates this problem, but the value and growthindices by definition do not contain all of the stocks in the broad index.
B. Either set of indices can be used for returns-based style analysis. That said, Miller islikely to obtain a higher R2 in a regression of the portfolio returns on the style indexreturns if he uses the more ‘‘granular’’ set of style indices—those by Dow Jones. Forexample, if the portfolio is a deep value portfolio or a strong growth portfolio, theDow Jones indices are more likely to better explain the portfolio’s style than a set ofstyle indices in which every stock is forced into either value or growth. Specifically, thedeep value portfolio will be better represented by the Dow Jones Value Index becausethat index focuses more on deep value stocks. That same portfolio’s returns regressedversus the MSCI Value Index is likely to show a lower R2.
6. The principal benefit of a market-neutral long–short portfolio is absence of a long-onlyconstraint. A long-only constraint penalizes portfolios in two ways. First, it prevents theportfolio manager from fully exploiting a negative forecast on a given stock. Secondly, in along-only portfolio, being unable to fully exploit a negative forecast also limits the abilityof the portfolio manager to maximize positive forecasts. The main risk with long–shortportfolios is the unlimited liability on the short trades. If a stock in which an investor has along position loses all of its value, the most that could happen is that the investor loses hisentire investment. With a short position, however, the investor’s upside is limited (stockgoes to zero) but the liability is unlimited (theoretically, a stock can appreciate infinitely).
7. Hayes can produce such a portfolio through the use of a portable alpha. He submits aproposal to manage a market-neutral long–short portfolio of U.K. stocks. This strategygenerates alpha (α). To produce beta (β), the Japanese equity exposure, Hayes takes along position in a notional value of futures equal to the size of the portfolio.
8. Suzuki tells her client that although she can certainly double the portfolio’s tracking riskto 4 percent, the portfolio’s alpha will increase but not double. The problem is that as aninvestor increases a portfolio’s tracking risk, the long-only constraint increasingly limitsthe portfolio manager from taking full advantage of her investment insights. Remember,IR ≈ IC
√Breadth. If the breadth is constant but the information coefficient (IC) falls
because a smaller portion of the manager’s insight is translated into the portfolio, thenthe information ratio (IR) must also fall.
9. The short-side alpha is likely the larger of the two. Many investors look for cheap stocksin which to take long positions, but comparatively few look for expensive stocks toshort. Shorting is operationally more cumbersome than taking a long position, whichcontributes to the limited use of shorting by most investors. Also, sell recommendationsfrom the analyst community are relatively uncommon. Analysts are more likely to simplynot cover a stock on which they have an unfavorable opinion. Also, analysts working

Chapter 7 Equity Portfolio Management 185
for investment banking firms have a strong incentive not to issue negative reports oncompanies with which the bank may wish to do business.
10. A. The change is in fact positive (assuming that Johnson is willing to accept a slightlyhigher level of tracking risk) because the information ratio improves. Her currentportfolio has an information ratio of 0.87 (2.4%/2.75%). The portfolio with theenhanced indexer has an information ratio of 0.97 (2.8%/2.9%).
B. Stock-based enhanced indexing begins with an index portfolio and then over- orunderweights individual stocks based on the portfolio manager’s return expectationsfor those stocks. The portfolio is built to look like its target benchmark but to add somelevel of outperformance on a fairly consistent basis. The advantage of this approachis greater breadth than the synthetic approach. That said, as with all active strategies,obtaining a satisfactory IC or level of investment insight is the challenge. Syntheticenhanced index strategies involve gaining exposure to the benchmark with futures(or a swap) while generating an alpha, typically using fixed income. This strategy hasthe advantage of being straightforward. It generally has narrower breadth (usually aduration or credit bet) and so requires a high IC to produce the same level of IR as thestock-based approach.
11. A. The total active risk is greater than 6 percent because in the calculation, the long–shortmanager would be benchmarked to the Russell 1000 rather than the manager’s normalbenchmark, which most closely captures the manager’s orientation. We can see this bynoting the positive level of misfit risk. The misfit risk is calculated with the equation!
6.0%2 + (Misfit risk)2 = 6.1%2, which equals 1.1%.B. The total active risk is
√5%2 + 7.13%2 = 8.71%.
C. The expected active return is (0.3 × 0%) + (0.7 × 1%) = 0.7%.
The expected total active risk for the portfolio is!(0.32 × 0%2) + (0.72 × 1.5%2) = 1.05%.
The expected IR is 0.7%/1.05% = 0.67.
D. The efficient combination of managers leads to a portfolio with an IR of1.59%/1.10% = 1.45. Hence, despite the slightly greater active risk exposure, theoverall portfolio IR increases by a factor of 2.17 versus the current mix.
E. In general, the exposures to non-U.S. equities in the long–short portfolio should notconcern Whitmore as long as she believes that the manager has skill in managingnon-U.S. equities. As shown in Part A of this problem, the misfit risk for the strategyis relatively small because the manager overlays the long–short portfolio with Russell1000 futures and thus has a high correlation with the Russell 3000 benchmark. Thelarge majority of the strategy’s total active risk is driven by the manager’s active returnvolatility.
CHAPTER 8ALTERNATIVE
INVESTMENTS PORTFOLIOMANAGEMENT
SOLUTIONS
1. Direct (physical) investments in real estate tend to be much less liquid than investmentsin real estate investment trusts (REITs), which are indirect investments. Reasons for theilliquidity of direct investments include the following:
• The large transaction sizes when buying/selling commercial/industrial buildings andland or residential apartment buildings is in contrast to the flexibility of trading smallamounts in REITs on public exchanges.
• The lack of availability and timeliness of information with respect to direct real estateinvestment results in extensive valuation and due diligence issues, whereas REITs areexchange traded in real time on a daily basis, and information about them is readilyavailable and accessible.
• The high transaction costs of direct investments in terms of broker commissions andthe financing costs of buying physical assets require long-term investment horizons.Exchange-traded REITs have low transaction costs, and reallocation of funds is easy.
2. A. Direct investment in real estate includes individual residences, agricultural land, andcommercial real estate. The category of commercial real estate can be subdivided intoindustrial, office, retail, and apartment complexes. Indirect investment is achieved viaREITs, which can be subdivided into equity, mortgage, and hybrid (a combination offirst two) investment trusts.
Using the unsmoothed National Council of Real Estate Investment Fiduciaries(NCREIF) Index as a benchmark for direct investment in commercial real estateindicates that the long-term (1990–2004) correlation of direct real estate investmentwith the S&P 500 is slightly negative; the correlation of direct real estate investmentwith bonds (the Lehman Aggregate Bond Index) is significantly negative, indicatingthat adding physical real estate to a 50 percent stock/50 percent bond portfolio wouldhave provided very substantial diversification benefits.
The correlations of the National Association of Real Estate Investment Trusts(NAREIT) Index with both the S&P 500 and bonds were both moderately positivefor the period examined. This fact indicates that indirect investment in real estatehad diversification benefits relative to a 50/50 stock bond portfolio, but that the
186
Chapter 8 Alternative Investments Portfolio Management 187
diversification benefits were not as large as those resulting from direct real estateinvestment.
3. A. Semyonova’s recommendation can be critiqued along the following dimensions:
• Return. The long-term returns for bonds and direct investment in real estate(unsmoothed NCREIF) are similar (7.70 percent and 7.27 percent); therefore,reallocating 10 percent of bond investments to direct real estate investment wouldnot sacrifice much return.
• Risk. (a) The standard deviation for the unsmoothed NCREIF Index is more thantwice that for the Lehman Aggregate; therefore, this reallocation does not reducerisk as measured by standard deviation. (b) Downside volatility, as represented inthis table by the minimum quarterly return, is much greater for real estate thanfor bonds. (c) The NCREIF Index is a compilation of many types of real estate,whereas the trustees would have to choose a specific asset, possibly incurring higherrisk than indicated by the NCREIF data.
• Diversification. The correlation between the Lehman Aggregate and the unsmoothedNCREIF Index is significantly negative, which would indicate good potential fordiversification.
• Liquidity. Investment in physical real estate is the least liquid of the asset classesshown in the table. A transaction could probably not be reversed quickly or easily.
B. Pearson’s recommendations can be criticized along the following dimensions:
• Return. The unhedged return of REITs is almost 2 percentage points greater thanthe return of the S&P 500, whereas the hedged return is about 2 percentage pointsless than the S&P. Therefore, taking into account the equity return component ofthe NAREIT Index, this reallocation could represent a slight sacrifice in return.
• Risk. The standard deviation of the NAREIT Index and the hedged NAREITIndex was approximately 2 and 3 percentage points below that of the S&P 500,respectively. Thus, no matter which index we use to represent indirect real estateinvestment, the reallocation would satisfy the objective of risk reduction, based onhistorical experience. Additionally, downside risk (as measured by the minimumquarterly return) was much less for REITs than for the S&P 500, so the reallocationcould reduce downside risk as well.
• Diversification. The correlation between the S&P 500 and the hedged NAREITIndex is zero, indicating that REITs have sources of return that are different fromthose for large-cap equities, which would enhance diversification.
• Liquidity. REITs and S&P 500 equities are exchange traded and, therefore, areboth liquid.
C. The second scenario—that is, reallocation of 10 percent of large-cap equities toREITs—is the best choice to fulfill the trustees’ stated goals for the following reasons:
• Return. Using the long-term data provided in the table, the first scenario (basedon unsmoothed NCREIF data) would have a mean return of 10.94% × 0.5 +7.70% × 0.4 + 7.27% × 0.1 = 9.28%, whereas the second scenario (using hedgedNAREIT) would yield 9.12 percent. If the unhedged NAREIT returns are used inthe calculation, the expected return rises to 9.5 percent. Therefore, a 10 percentinvestment in REITs (even those least correlated with equities—e.g., mortgageREITs) and corresponding 10 percent reduction in S&P 500 stocks would representa return similar to that of the first scenario.
188 Solutions
• Risk. The second scenario is superior in terms of risk reduction because it maintainsa higher allocation to bonds, which show a much lower correlation with unhedgedREITs than does the S&P 500. Additionally, the minimum quarterly return is worst(most negative) for the unsmoothed NCREIF Index and the S&P 500. Therefore,the second scenario would reduce allocation to an asset class with high downsiderisk and reallocate money to REITs, which have a lower downside risk. Finally,REITs are highly liquid and can be easily divested, whereas physical real estatenecessitates a long-term commitment and entails high transaction costs.
Note: Although bonds have a negative correlation with the NCREIF Index (thefirst scenario), which suggests a superior reduction in risk through diversification, thethree points provided here indicate that the reallocation from equities to REITS moreclosely fulfills the stated objectives of the trustees.
• Index construction. The choice of real estate index is pertinent to the assumptionsused in calculating expected results for asset allocation decisions. The use ofthe unsmoothed NCREIF Index can be substantiated because more frequent,market-based (transaction) data are more timely and accurate than the smoothed,annually calculated, appraisal-based data. This method suggests higher expectedreturns—and significantly greater risk.
The use of the hedged NAREIT Index could be justified by the conceptof eliminating double counting (the equity return component in equity REITs).Additionally, the use of mortgage and hybrid REITs would reduce the redundancy ofthe more highly correlated equity REITs. Nevertheless, equity REITs compose about95 percent of the NAREIT Index, so the unhedged data show a significant increase inreturn with less risk, as demonstrated by the high Sharpe ratio of the NAREIT Indexrelative to most other asset classes.
4. A. The roll yield for Year 1 is 29.1% − 9.6% − 6.1% = 13.4%.B. The collateral yield for Year 2 is −30.5% − (−14.2%) − (−24.3%) = 8.0%.C. Collateral yield is earned because of the assumption that when investing in a
commodity futures index, the full value of the underlying futures contract is investedat a risk-free rate as the investor posts 100 percent margin with T-bills. Therefore, theposition is fully collateralized, and for every dollar invested in the commodity futuresindex, the investor receives a dollar of commodity exposure plus interest on a dollarinvested in T-bills. This is the implied yield or collateral return.
D. Changes in commodity futures prices are highly correlated with changes in spot prices.In periods of financial, economic, or political distress, and sometimes after naturaldisasters, short-term commodity prices tend to rise because most such events createshocks with respect to physical commodities that reduce current supply and causeprices to rise. This is called positive event risk.
5. A. Two points can be made that relate to the value of the Goldman Sachs CommodityIndex (GSCI) as a risk diversifier and the interpretation of the Sharpe ratio. First, thenegative correlation of the GSCI with the S&P 500 and the low positive correlationof the GSCI with the Lehman Government/Corporate Bond Index suggest good riskreduction benefits when the GSCI is added to a portfolio of U.S. stocks and bonds.Second, in interpreting the low Sharpe ratio for the GSCI, account must be taken ofthe appropriateness of the Sharpe ratio for measuring commodity returns. The validityof standard deviation as a measure of risk in the denominator of the Sharpe ratio iscompromised when returns are skewed and/or have high kurtosis. Because commodity

Chapter 8 Alternative Investments Portfolio Management 189
returns exhibit skewness, the Sharpe ratio is not necessarily the best representation ofthe risk–return trade-off with respect to this asset class.
B . McCoy is evaluating a short time series. Because investment performance depends onthe time period studied, the high returns generated by commodities in 2000–2004may not be representative of long-term performance. In fact, we know this is the casewhen the data are compared with data for the longer period documented in Problem4. This does not necessarily suggest that investment in commodities is not appropriate.However, it raises a caveat about comparing expectations of future returns for a periodwhen the economic environment may be different from that of the short-term periodthat generated the results in the table given. This information also suggests thatcommodities may provide benefits as a tactical asset class.
The same concerns with respect to the short time frame covered by the table canbe expressed for the correlation data. However, the values are virtually the same for thelonger-term data, which suggests that commodity returns are not correlated with theother asset classes; as a result, inclusion of commodities in the portfolio could provideboth long- and short-term diversification benefits.
6. A. Survivorship bias occurs when returns of managers who have failed or exited themarket are not included in the data analyzed over a specific time frame. Thisresults in overestimation of historical returns in the range of 1.5 to 3.0 percent peryear. The timing of survivorship bias may be concentrated during certain economicperiods, further complicating analysis of persistence of returns over short timeframes.Additionally, age (vintage) effects make it difficult to compare performance of hedgefunds that have track records of different lengths. This is especially important whenresearching hedge funds, which have average track records of two to five years.
B. Indices that are value weighted as opposed to equally weighted may take on the returncharacteristics of the best-performing hedge fund in them over a given period. Theseindices thus reflect the weights of popular bets by hedge fund managers, because theasset values of the various funds change as a result of asset purchases as well as priceappreciation.
C. Lack of security trading leads to stale price bias and can cause measured standarddeviation to be over- or understated, depending on the time period being studied.This could result in measured correlations being lower than expected. This issue isnot a significant concern in the creation of hedge fund indices because monthly dataare used. Furthermore, the underlying holdings in many hedge fund strategies arerelatively liquid; therefore, positions reflect market prices.
7. A. Equity market-neutral strategies identify over- and undervalued stocks while neu-tralizing the fund’s exposure to market risk by combining long and short positionswith similar exposure to related market or sector factors. Therefore, as their namesuggests, they have little or no market risk. They also have low credit risk becausetheir long–short positions result in net low leverage. As expected, there is virtually nocorrelation between funds using this strategy and the S&P 500.
Convertible arbitrage strategies exploit anomalies in the prices of corporateconvertible bonds, warrants, and preferred stock. The convertible arbitrage funds buyor sell these securities and then hedge the risk of changes in price and volatility ofthe underlying securities, changes in interest rates, and changes in the issuers’ creditratings. The many small, individual positions taken, and hedging of these risks, resultin low market exposure. However, this strategy also increases credit risk considerablybecause hedging via derivative instruments creates high leverage exposure. Convertible
190 Solutions
arbitrage strategies have a relatively low correlation with the S&P 500 or the LehmanGovernment/Corporate Bond Index because hedging the risks mitigates underlyingmarket exposure.
Global macro strategies trade on systematic moves in major financial andnonfinancial markets by using futures and options contracts. They may also takepositions in traditional equity and fixed-income markets. Because they tend to makelarge bets on the direction of currencies, commodities, or stock and bond marketsglobally, they have high market exposure. Given their extensive use of leverage viafutures and options, they are also exposed to significant credit (leverage) risk. Becauseof their large positions with regard to anticipated changes in market levels, thecorrelation of global macro with the S&P 500 and Lehman Government/CorporateBond Index tends to be greater than those of the first two strategies discussed here.
B. The usefulness of historical hedge fund data continues to be controversial. Researchhas shown that the volatility of returns is more persistent through time than the levelof returns. Issues such as survivorship and backfill bias have a significant impact onhistorical tests of performance persistence. Additionally, lock-up periods, restrictionson redemptions/withdrawals, and the relatively short track record of many hedge fundscomplicate the extrapolation of past performance to expected (future) performance ofhedge funds.
8. The fee structures charged by hedge fund managers often have two components:management fees and incentive fees. The ‘‘1 and 20’’ refers to a 1 percent per yearmanagement fee based on net asset value plus a 20 percent incentive, or profit-sharing, feethat is earned only if assets exceed a specified value. This value may be the high-water markof the fund—that is, the highest previous NAV. Typically, drawdowns (declines/losses innet asset value) must be recouped before any incentive fees are charged.
9. Farkas’s statement is not valid if the hedge fund has a lock-up period. During this time, theinvestor cannot redeem any part of the investment. Additionally, once the lock-up periodhas expired, redemption rights may be limited to a quarterly or semiannual scheduleand the investor generally must give advance notice, ranging from 30 to 90 days, of anintention to redeem.
10. A. Any of the following reasons could cause an upward bias in the Sharpe ratio:
• Lengthening the measurement interval: This will result in a lower estimate ofvolatility. For example, the annualized standard deviation of daily returns isgenerally higher than of weekly returns, which is, in turn, higher than of monthlyreturns.
• Compounding the monthly returns but calculating the standard deviation from the(not compounded) monthly returns.
• Writing out-of-the-money puts and calls on a portfolio: This strategy can potentiallyincrease the return by collecting the option premium without paying off for severalyears. Strategies that involve taking on default risk, liquidity risk, or other formsof catastrophe risk have the same ability to report an upwardly biased Sharpe ratio.(An example is the Sharpe ratios of market-neutral hedge funds before and after the1998 liquidity crisis.) This is akin to trading negative skewness for a greater Sharperatio by improving the mean or standard deviation of the investment.
• Smoothing of returns: Using certain derivative structures, infrequent marking tomarket of illiquid assets, or using pricing models that understate monthly gains orlosses can reduce reported volatility.

Chapter 8 Alternative Investments Portfolio Management 191
• Eliminating extreme returns: Because such returns increase the reported standarddeviation of a hedge fund, a manager may choose to attempt to eliminate thebest and the worst monthly returns each year to reduce the standard deviation.Operationally, this entails a total-return swap, in which one pays the best and worstreturns for one’s benchmark index each year and the counterparty pays a fixed cashflow and hedges the risk in the open market. If swaps are not available, one can doit directly with options.
B. Because of the option-like payoff characteristics of many hedge fund strategies, theirreturns are not normally distributed, but normality is an assumption inherent in thecomputation of standard deviation in the denominator of the Sharpe ratio. Hedge fundreturns, on average, display some skewness (asymmetry of the return distribution),as well as high kurtosis (relatively frequent extreme returns). These effects are notcaptured by standard deviation, the risk measure used in the Sharpe ratio. Also, Sharperatios are overestimated when investment returns are serially correlated (i.e., returnstrend), which causes a lower estimate of the standard deviation. This occurs withcertain momentum (trend-following) hedge fund strategies and those that may have aproblem with stale pricing or illiquidity (e.g., distressed securities).
11. A. The hedge fund’s average nine-month rolling return:
RR9,1 = (2.7 + 1.7 − 1 + 0.9 − 1 − 2 − 2 + 4 + 3.5)/9 = 0.7556%
RR9,2 = 0.7778%
RR9,3 = 0.3778%
RR9,4 = 0.2444%
Average = (0.7556 + 0.7778 + 0.3778 + 0.2444)/4 = 0.54%
B. Rolling returns can show how consistent the returns are over the investment periodand whether there is any cyclicality in the returns.
12. A. A hurdle rate of 5% per year equates to a monthly hurdle rate of 5%/12 = 0.4167%.The downside deviation for the hedge fund =
!28.78/(12 − 1) ×
√12 = 5.60%.
The downside deviation for the index =!
65.04/(12 − 1) ×√
12 = 8.42%.The downside deviation is lower than the standard deviation because downside
deviation takes into account only the deviations on the downside. The downsidedeviation of the hedge fund is lower than that of the index in this case.
B. Annualized return for the hedge fund = 0.6613% × 12 = 7.9356%.Annualized return for the index = 0.449% × 12 = 5.388%.The Sortino ratio for the hedge fund = (7.94 − 5)/5.6 = 0.53.The Sortino ratio for the index = (5.39 − 5)/8.42 = 0.05.The Sortino ratio of the hedge fund is much higher than that of the index,
indicating that it provides greater return per unit of downside risk.13. A. Managed futures are often considered a subgroup of global macro hedge funds because
both strategies attempt to take advantage of systematic moves in major financial andnonfinancial markets.
B. The primary similarity between managed futures and absolute-return hedge fundstrategies is that they seek positive returns regardless of market direction. Managedfutures strategies invest exclusively in the forward and derivatives markets on aleveraged basis by trading futures and options contracts in the financial, commodity,

192 Solutions
and currency markets. In contrast, other hedge fund strategies invest in underlyingmarkets; some, depending on their strategies, also use derivatives.
14. The theory of market efficiency suggests that news is simultaneously available to allmarket participants and is quickly incorporated into market prices. However, research inbehavioral finance indicates that investors may systematically underreact to information;consequently, security prices may trend, particularly in traditional investment vehicles(stocks and bonds). Actively managed derivative strategies that follow momentum, ortrend-based, models have been shown to be profitable by capturing these trends.
15. Similarly to market-neutral funds, managed futures programs can replicate many strategiesavailable to cash market investors at lower transaction costs and can also trade on strategiesby using derivatives that are unavailable to cash market investors. Research has shownthat when returns are segmented according to whether the stock/bond markets roseor fell, managed futures have negative correlation cash market portfolios when cashmarket portfolios post significant negative returns and are positively correlated when cashportfolios reported significant positive returns. Therefore, managed futures may offerunique asset allocation characteristics in different market environments.
Also, hedging demands of cash market participants may create investment situationswhere hedgers are required to offer derivative investors a risk premium, or positive return,for holding open long or short offsetting positions. Option traders may be able to createpositions that offer this ‘‘risk premium’’ for holding various option contracts when cashmarket participants increase purchases of options to protect themselves in markets withtrending prices or volatility. This return (i.e., the convenience yield) can be earned simplyby buying and holding a derivatives portfolio.
16. The term fallen angels refers to debt securities that were originally deemed investment gradewhen issued by financially healthy companies but have subsequently been downgraded tobelow investment grade. In contrast, companies with high-risk profiles and existing seniordebt issues can seek additional (subordinated) financing via originally issued high-yieldsecurities.
17. The private equity approach of investing is considered an active approach. New investorsin the debt and/or equity of a troubled company (distressed securities) participate oncreditor committees and assist in the recovery or reorganization process to maximizetheir return on investment. Under the relative-value approach, passive investors buy thedistressed securities and either hold them until they appreciate to the desired level or tradethem within a relatively short period of time.
18. The results of a prepackaged bankruptcy have different effects on the various partiesinvolved:
(a) In a prepackaged bankruptcy, the prebankruptcy creditors of the company havealready agreed in advance with the debtor company on a plan or reorganization beforethe debtor company actually files for bankruptcy. This may involve the creditorsmaking concessions in return for equity of the reorganized company.
(b) Prebankruptcy shareholders do not have nearly as much leverage as the creditors. Theprebankruptcy shareholders typically lose their entire stake in the company becausein a prepackaged bankruptcy, a private equity firm (the vulture investor) seeks tobecome a majority owner of a new private company.

Chapter 8 Alternative Investments Portfolio Management 193
(c) The vulture investor is bearing a lot of risk in a transaction like this but may comeout with a substantial profit if things work out well. The vulture investor hopes toend up with a healthy company that can be sold to private or public investors.
19. The statement is correct. When the economy is in a downturn, there are more bankruptcies,thereby increasing the supply of distressed securities at relatively low (or falling) prices.

CHAPTER 9RISK MANAGEMENT
SOLUTIONS
1. Centralized risk control systems bring all risk management activities under the respon-sibility of a single risk control unit. Under decentralized systems, each business unit isresponsible for its own risk control. The advantages of a centralized system are that itbrings risk control closer to the key decision makers in the organization and enables theorganization to better manage its risk budget by recognizing the diversification embeddedacross business units. The decentralized approach has the advantage of placing risk controlin nearer proximity to the source of risk taking. However, it has the disadvantage of notaccounting for portfolio effects across units.
2. The following risk exposures should be reported as part of an Enterprise Risk ManagementSystem for Ford Motor Company:
• Market risks:
• Currency risk, because expenditures and receipts denominated in nondomesticcurrencies create exposure to changes in exchange rates.
• Interest rate risk, because the values of securities that Ford has invested in are subjectto changes in interest rates. Also, Ford has borrowings and loans, which could beaffected by interest rate changes.
• Commodity risk, because Ford has exposure in various commodities and finishedproducts.
• Credit risk, because of financing provided to customers who have purchased Ford’svehicles on credit.
• Liquidity risk, because of the possibility that Ford’s funding sources may be reduced orbecome unavailable and Ford may then have to sell its securities at a short notice witha significant concession in price.
• Settlement risk, because of Ford’s investments in fixed-income instruments and derivativecontracts, some of which effect settlement through the execution of bilateral agreementsand involve the possibility of default by the counterparty.
• Political risk, because Ford has operations in several countries. This exposes it to politicalrisk. For example, the adoption of a restrictive policy by a non-U.S. governmentregarding payment of dividends by a subsidiary in that country to the parent companycould adversely affect Ford.
3. Two types of risk that were inadequately managed were model risk and operational risk.Systematic errors in a major input of the options pricing model, implied volatility, resulted
194

Chapter 9 Risk Management 195
in mispricing options and trading losses. Thus model risk was inadequately managed.Furthermore, the systems and procedures at NatWest failed to prevent or detect and bringto the attention of senior management the trading losses. Thus, operational risk also wasnot well managed.
4. Trader 1’s statement is incorrect. Buyers are concerned about the transaction costs oftrades as much as sellers, so a security’s liquidity is highly relevant to buyers. In certaincases, such as a short position in a stock with limited float, the liquidity risk for thepurchase side of a trade can be considerable.
Trader 2’s statement is incorrect. Derivatives usually do not help in managingliquidity risk because the lack of liquidity in the spot market typically passes right throughto the derivatives market.
Trader 3’s statement is correct. Businesses need to take risks in areas in whichthey have expertise and possibly a comparative advantage in order to earn profits. Riskmanagement can entail taking risk as well as reducing risk.
5. A. Assuming that the desk pays its traders a percentage of the profits on their own tradingbooks, the −¤20 million loss generated by an individual trader implies that the restof the desk made ¤30 million and that the bank will have to pay the other traders anincentive fee on this larger amount, even though it generated only ¤10 million in netrevenues. By contrast, if every trader had made money and the revenues to the deskwere ¤10 million, the incentive payouts to traders would have been much lower andthe net profits to the bank much higher.
B. In the scenario described above, the trader in question appears to have increased hisrisk exposure at year-end. The asymmetric nature of the incentive fee arrangementmay induce risk taking because it is a call option on a percentage of profits and thevalue of a call option increases in the volatility of the underlying. In this sense, theinterests of the bank and the trader diverged to the detriment of the bank.
C. First and foremost, it is clear that senior management was out of touch with the riskdynamics of the desk because it should have known that the trader in question wasover his limits at some points much earlier in the scenario. The fact that managementdiscovered this violation only after the loss occurred reflects poor risk governance.
6. Strengths. The sensitivity analysis reported by Ford is useful in highlighting the possibleadverse effect of a 1 percent decline in interest rates on Ford Credit’s net income. It alsois based on an objective measure of interest rate risk, duration.
Weaknesses. The sensitivity analysis reported in the table assumes that interest ratechanges are instantaneous, small, parallel shifts in the yield curve. From a risk managementperspective, one would have a special interest in the effects of larger interest rate changes,including major discontinuities in interest rates. The inclusion of value at risk would helpfill this gap in the analysis. Furthermore, changes in the yield curve other than parallelshifts should be examined, such as nonparallel shifts (twists) in the yield curve. The textmentions the recommendation of the Derivatives Policy Group to examine both parallelshifts and twists of the yield curve.
7. A. There is a 1 percent chance that the portfolio will lose at least £4.25 million in anygiven week.
B. There is a 99 percent chance that the portfolio will lose no more than £4.25 millionin one week.
8. Statement A, which is the definition of value at risk (VaR), is clearly correct. StatementB is also correct, because it lists the important decisions involved in measuring VaR.Statement D is correct: The longer the time period, the larger the possible losses. Statement

196 Solutions
C, however, is incorrect. The VaR number would be larger for a 1 percent probabilitythan for a 5 percent probability. Accordingly, the correct answer is C.
9. A. The probability is 0.005 that the portfolio will lose at least 50 percent in a year. Theprobability is 0.005 that the portfolio will lose between 40 percent and 50 percentin a year. Cumulating these two probabilities implies that the probability is 0.01 thatthe portfolio will lose at least 40 percent in a year. So, the 1 percent yearly VaR is 40percent of the market value of $10 million, which is $4 million.
B. The probability is 0.005 that the portfolio will lose at least 50 percent in a year,0.005 that it will lose between 40 and 50 percent, 0.010 that it will lose between 30and 40 percent, 0.015 that it will lose between 20 and 30 percent, and 0.015 thatit will lose between 10 and 20 percent. Cumulating these probabilities indicates thatthe probability is 0.05 that the portfolio will lose at least 10 percent in a year. So,the 5 percent yearly VaR is 10 percent of the market value of $10 million, which is$1 million.
10. First, we must calculate the monthly portfolio expected return and standard deviation.Using ‘‘1’’ to indicate the U.S. government bonds and ‘‘2’’ to indicate the U.K. governmentbonds, we have
µP = w1µ1 + w2µ2 = 0.50(0.0085) + 0.50(0.0095) = 0.0090
σ2P = w2
1σ21 + w2
2σ22 + 2 w1 w2σ1σ2ρ
= (0.50)2(0.0320)2 + (0.50)2(0.0526)2 + 2(0.50)(0.50)(0.0320)(0.0526)(0.35)
= 0.001242
σP =√
0.001242 = 0.0352
A. For a 5 percent monthly VaR, we have µP − 1.65σP = 0.0090 − 1.65(0.0352) =−0.0491. Then the VaR would be $100 million(0.0491) = $4.91 million.
B. For a 1 percent monthly VaR, we have µP − 2.33σP = 0.0090 − 2.33(0.0352) =−0.0730. Then the VaR would be $100 million(0.0730) = $7.30 million.
C. There are 12 months or 52 weeks in a year. So, to convert the monthly return of0.0090 to weekly return, we first multiply the monthly return by 12 to convert itto an annual return, and then we divide the annual return by 52 to convert it to aweekly return. So, the expected weekly return is 0.0090(12/52) = 0.0021. Similarly,we adjust the standard deviation to 0.0352(
√12/
√52) = 0.01691. The 5 percent
weekly VaR would then be µP − 1.65σP = 0.0021 − 1.65(0.01691) = −0.0258.Then the VaR in dollars would be $100 million(0.0258) = $2.58 million.
D. The 1 percent weekly VaR would be µP − 2.33σP = 0.0021 − 2.33(0.01691) =−0.0373. Then the VaR would be $100 million(0.0373) = $3.73 million.
11. A. For the five-year period, there are 60 monthly returns. Of the 60 returns, the 5 percentworst are the 3 worst returns. Therefore, based on the historical method, the 5 percentVaR would be the third worst return. From the returns given, the third worst returnis −0.2463. So, the VaR in dollars is 0.2463($25,000) = $6,157.50.
B. Of the 60 returns, the 1 percent worst are the 0.6 worst returns. Therefore, we woulduse the single worst return. From the returns given, the worst return is −0.3475. So,the VaR in dollars is 0.3475($25,000) = $8,687.50.

Chapter 9 Risk Management 197
12. A. Of the 700 outcomes, the worst 5 percent are the 35 worst returns. Therefore, the5 percent VaR would be the 35th worst return. From the data given, the 35th worstreturn is −0.223. So, the 5 percent annual VaR in dollars is 0.223($10 million) =$2,230,000.
B. Of the 700 outcomes, the worst 1 percent are the 7 worst returns. Therefore,the 1 percent VaR would be the seventh worst return. From the data given,the seventh worst return is −0.347. So, the 1 percent annual VaR in dollars is0.347($10 million) = $3,470,000.
13. A. The analytical or variance–covariance method begins with the assumption thatportfolio returns are normally distributed. A normal distribution has an unlimitedupside and an unlimited downside. The assumption of a normal distribution isinappropriate when the portfolio contains options because the return distributionsof options are far from normal. Call options have unlimited upside potential, asin a normal distribution, but the downside return is truncated at a loss of 100percent. Similarly, put options have a limited upside and a large but limited downside.Likewise, covered calls and protective puts have limits in one direction or the other.Therefore, for the portfolio that has options, the assumption of a normal distributionto estimate VaR has a number of problems. In addition, it is very difficult to calculatea covariance between either two options or an option and a security with morelinear characteristics—among other reasons because options have different dynamicsat different points in their life cycle.
B. Portfolios with simple, linear characteristics, particularly those with a limitedbudget for computing resources and analytical personnel, might select the vari-ance/covariance method. For more complex portfolios containing options andtime-sensitive bonds, the historical method might be more appropriate. The MonteCarlo simulation method typically would not be a wise choice unless it weremanaged by an organization with a portfolio of complex derivatives that is will-ing to make and sustain a considerable investment in technology and humancapital.
14. A. The observed outcomes are consistent with the VaR calculation’s prediction on thefrequency of losses exceeding the VaR. Therefore, the VaR calculation is accurate.
B. The VaR results indicate that under ‘‘normal’’ market conditions that would charac-terize 19 out of 20 days, the portfolio ought to lose less than ¤3 million. It providesno other information beyond this.
C. The portfolio certainly lends itself to scenario analysis. In this particular case, giventhe substantial short options position, it might be instructive to create a customizedscenario under which the portfolio was analyzed in the wake of a large increase inoption-implied volatility.
15. The fact that credit losses occur infrequently makes Statement A incorrect. Unlike aEuropean-style option, which cannot be exercised prior to expiration and thus has nocurrent credit risk, an American-style option does have the potential for current creditrisk. Therefore, Statement C is incorrect. Statement B, however, is correct.
16. A. The decision not to hedge this risk was correct. Suppose the company had hedgedthis risk. If the price of oil were to increase, the favorable effect of the increase onincome would be offset by the loss on the oil futures, but the home currency shouldappreciate against the U.S. dollar, leaving the company worse off. If the price of oilwere to decrease, the unfavorable effect on income would be offset by the futuresposition and the home currency should depreciate, leaving the company better off. In

198 Solutions
short, the company would remain exposed to exchange rate risk associated with oilprice movements.
B. The decision not to hedge this risk was correct. The company should remain exposedto market risk associated with exchange rate movements (i.e., currency risk). Hedgingwould remove currency risk but leave the company with market risk associated with oilprice movements. If the home currency declined, the price of oil would likely declinebecause it is positively correlated with the U.S. dollar value of the home currency.That would be a negative for income. On the other hand, appreciation of the homecurrency is likely to be accompanied by an oil price increase, which would be positivefor income.
C. The risk management strategy adopted is logical because it exploits a natural hedge. Adecline in the price of oil (a negative) is likely to be accompanied by a depreciation ofthe home currency relative to the U.S. dollar (a positive), and an increase in the priceof oil (a positive) is likely to be accompanied by appreciation of the home currency(a negative). Hedging both currency and market risk would be an alternative riskmanagement strategy to consider, but in comparison to the strategy adopted, it wouldincur transaction costs.
17. A. Because the option is a European-style option, it cannot be exercised prior toexpiration. Therefore, there is no current credit risk.
B. The current value of the potential credit risk is the current market value of the option,which is $6. Of course, at expiration, the option is likely to be worth a differentamount and could even expire out of the money.
C. Options have unilateral credit risk. The risk is borne by the buyer of the option, TonySmith, because he will look to the seller for the payoff at expiration if the optionexpires in the money.
18. The Sharpe ratio uses standard deviation of portfolio return as the measure of risk.Standard deviation is a measure of total risk. The Sortino ratio measures risk usingdownside deviation, which computes volatility using only rate of return data points belowa minimum acceptable return. In contrast to the Sharpe ratio, its focus is on downsiderisk. Return over maximum drawdown (RoMAD) uses maximum drawdown as a riskmeasure. Maximum drawdown is the difference between a portfolio’s maximum point ofreturn and the lowest point of return over a given time interval.

CHAPTER 10EXECUTION OF PORTFOLIO
DECISIONS
SOLUTIONS
1. A. Quoted spread is the difference between the ask and bid prices in the quote prevailingat the time of the trade is entered. The prevailing quote is the one at 10:50:06,with a bid of $4.69 and an ask of $4.75. So, Quoted spread = Ask − Bid =$4.75 − $4.69 = $0.06.
B. The time-of-trade quotation midpoint = ($4.69 + $4.75)/2 = $4.72.Effective spread = 2 × (Trade price − Time-of-trade quotation midpoint) = 2 ×($4.74 − $4.72) = 2 × $0.02 = $0.04.
C. The effective and quoted spreads would be equal if a purchase took place at the askprice and a sale took place at the bid price.
2. A. The difference between quoted spreads and effective spreads reflects the price improve-ment provided by dealers. If the effective spreads are lower than the quoted spreads,dealers are providing price improvements. Since the effective spreads are lower thanthe quoted spreads on both the New York Stock Exchange (NYSE) and NationalAssociation of Securities Dealers Automated Quoting system (NASDAQ), dealers inboth markets provided price improvements in the period being examined.
B. The difference between the quoted and effective spreads is much greater on the NYSE(0.301 cents) than on NASDAQ (0.087 cents). Therefore, the dealers on the NYSEprovided greater price improvement than those on NASDAQ.
3. E-Crossnet should not disclose unmatched quantities. Crossing networks maintaincomplete confidentiality not only in regard to the size of the orders and the names of theinvestors placing the orders, but also in regard to the unmatched quantities. If E-Crossnetwere to disclose the unmatched quantities, it would provide useful information to otherparties that would affect the supply and demand of these stocks in which clients wantto transact. As a result of the information leakage, transaction costs for its clients wouldlikely rise.
4. A. The second order will have a greater market impact because it is bigger in size.B. The second order will have a greater market impact because the trader placing it
has a reputation of representing informed investors in the stock. Thus, other tradersmay believe that the stock’s intrinsic value differs from the current market price andadjust their quotations accordingly. In contrast to most other situations in which areputation of being smart is beneficial, in stock trading, it is not to one’s advantage.
199

200 Solutions
C. By definition, orders executed on crossing networks, such as POSIT, avoid marketimpact costs because the orders are crossed at the existing market price determinedelsewhere, regardless of size. Therefore, the first order will have greater market impact.Note, however, that a part of a large order may go unfilled on the crossing network.
5. A. Missed trade opportunity cost is the unfilled size times the difference between thesubsequent price and the benchmark price for buys (or times the difference betweenthe benchmark price and the subsequent price for sells). So, using the closing priceon February 8 as the subsequent price, the estimated missed trade opportunity cost is460,000 × ($23.60 − $21.35) = $1,035,000.
B. Using the closing price on February 14 as the subsequent price, the estimated missedtrade opportunity cost is 460,000 × ($21.74 − $21.35) = $179,400.
C. One of the problems in estimating missed trade opportunity cost is that the estimatedepends upon when the cost is measured. As the solutions to Parts A and B of thisproblem indicate, the estimate could vary substantially when a different interval isused to measure the missed trade opportunity cost. Another problem in estimatingthe missed trade opportunity cost is that it does not consider the impact of order sizeon prices. For example, the estimates above assume that if the investment managerhad bought the 500,000 shares on February 8, he would have been able to sell these500,000 shares at $23.60 each on February 8 (or at $21.74 each on February 14).However, an order to sell 500,000 shares on February 8 (or on February 14) wouldhave likely led to a decline in price, and the entire order of 500,000 shares would nothave been sold at $23.60 (or at $21.74). Thus, the missed trade opportunity costsabove are likely to be overestimates.
6. Since the portfolio manager does not want to pay more than £45 per share, he should placea limit order to buy 5,000 shares at no more than £45 per share. An advantage of placingthe limit order is that he avoids the risk of paying too high a price and then sufferingsubstantial losses if the stock price subsequently declines. However, a disadvantage is thathis order may not be filled because the market price may never touch his limit order priceof £45, incurring a missed trade opportunity cost. For example, consider a situation inwhich the stock’s ask price is £47 when the order to buy at £45 limit is placed and thestock trades up to £80. If the portfolio manager had placed a market order, he would havebeen able to purchase the stock at £47 and make a profit by selling the stock at the currentprice of £80. An advantage of a market order is certainty of execution. The disadvantageof a market order is uncertainty concerning the price at which the order will be executed.Because the portfolio manager’s chief focus is on execution price, the limit order wouldbe preferred.
7. One negative of shopping the order is that it could delay the execution of the order, andthe stock price could increase in the meantime. Another important negative of shoppingthe order is that it leaks information to others about the buying intention of the assetmanagement firm. This information leakage could result in an adverse price movement inthe shares that the asset management firm wants to buy because the broker/dealers couldrevise their quotes or trade based on the information gained.
8. A. Estimated implicit costs = Trade size × (Trade price − Benchmark price) for a buy,or Trade size × (Benchmark price − Trade price) for a sale. In this problem, Tradesize = 100 and Trade price = $2.66.
i. Opening price = $2.71
Estimated implicit costs = 100 × ($2.71 − $2.66) = $5

Chapter 10 Execution of Portfolio Decisions 201
ii. Closing price = $2.65
Estimated implicit costs = 100 × ($2.65 − $2.66) = −$1
iii. We need to first calculate the volume-weighted average price (VWAP).
VWAP = Dollar volume/Trade volume
Dollar volume = (200 × $2.71) + (200 × $2.72) + (100 × $2.76) + (100×
$2.77) + (1100 × $2.70) + (100 × $2.66) + (100×
$2.65) = $5, 140
Trade volume = 200 + 200 + 100 + 100 + 1100 + 100 + 100 =
1, 900 shares
So, VWAP = $5,140/1,900 = $2.7053 per share.
Estimated implicit costs = 100 × ($2.7053 − $2.66) = $4.53
B. Using VWAP as a benchmark, implicit costs are $4.53, whereas implicit costs are−$1 if the closing price is used as a benchmark. Estimated implicit costs may be quitesensitive to the choice of benchmark.
9. A. If the order is received late in the day, the broker would act based on how the priceshave changed during the day. If the order is a sell order and prices have increasedsince the opening, the broker would immediately fill the order so that the sale priceis greater than the benchmark price. If prices have fallen during the day, the brokerwould wait until the next day to avoid recording a low-priced sale on a day when themarket opened higher. The broker would do the opposite if the order is a buy order.If prices have increased since the opening, the broker would wait until the next dayto avoid recording a high-priced buy on a day when the market opened lower. If theprices have fallen during the day, the broker would immediately fill the order so thatthe purchase price is lower than the benchmark price.
B. The broker would execute the order just before closing so that the transaction price isthe same as the closing price.
C. The broker would split the order and spread its execution throughout the day so thatthe transaction price is close to the market VWAP.
10. A. For a sale,
Estimated cost = Trade size × (Benchmark price − Trade price).
Using ¤52.87 as the benchmark price, the transaction cost estimate of the firsttrade is 10,000 × (¤52.87 − ¤53.22) = −¤3,500. The transaction cost estimateof the second trade is 10,000 × (¤52.87 − ¤53.06) = −¤1,900. The transactioncost estimate of the third trade is 10,000 × (¤52.87 − ¤52.87) = ¤0. The totaltransaction cost estimate =
−¤3,500 + (−¤1,900) + ¤0 = −¤5,400

202 Solutions
B. The quotation midpoint that prevailed at the time of the decision to trade was¤53.25. This is the benchmark price, and the implementation shortfall estimateof the cost of executing the first order is 10,000 × (¤53.25 − ¤53.22) = ¤300.The implementation shortfall estimate of the cost of executing the second order is10,000 × (¤53.25 − ¤53.06) = ¤1,900. The implementation shortfall estimate ofthe cost of executing the third order is 10,000 × (¤53.25 − ¤52.87) = ¤3,800. So,the implementation shortfall estimate of the total cost of executing the three orders is¤300 + ¤1,900 + ¤3,800 = ¤6,000.
C. The estimated transaction cost using the closing price as the benchmark is negative.This result makes it seem as if the trader had a trading profit. This conclusion is notreasonable because the trader did pay the bid–ask spread and her trades had a marketimpact, making prices less favorable in her subsequent trades. For example, in thefirst trade, the trader sold the shares close to the bid price and the trade resulted in adecline in prices. Overall, the use of closing price as the benchmark is not appropriatein this problem because the benchmark itself is significantly affected by the large sizeof the order.
In contrast, the implementation shortfall estimate uses a benchmark which isdetermined before the order has an impact on prices. The implementation shortfallapproach, which results in a reasonable estimate of ¤6,000 as the total cost of executingthe sale, is the appropriate approach in this problem.
11. A. The paper portfolio traded 1,000 shares on Monday for $10.00 per share. The valueof the portfolio at the close on Wednesday is $10,050. The net value is $50.
The real portfolio contains only 700 shares and was traded over the course of twodays. On Wednesday’s close, it is worth 700 × $10.05 = $7,035.
The cost of the portfolio is $7,052:
Monday : 600 × $10.02 = $6,012 + $20 commissions = $6,032
Tuesday : 100 × $10.08 = $1,008 + $12 commissions = $1,020
The net value of the real portfolio is $7,035 − 7,052 = −$17.Thus, the implementation shortfall is $50 − (−$17) = $67, or 67 bps.
B. Implementation shortfall broken into components is as follows:
• Delay
Monday : 600/1,000 × [($10.00 − $10.00)/$10.00] = 0.00%
Tuesday : 100/1,000 × [($9.99 − $10.00)/$10.00] = −0.01%
• Realized profit and loss
Monday : 600/1,000 × [($10.02 − $10.00)/$10.00] = 0.12%
Tuesday : 100/1,000 × [($10.08 − $9.99)/$9.99] = 0.09%
• Missed trade opportunity cost
300/1,000 × [($10.05 − $10.00)/$10.00] = 0.15%
Commissions are 0.20% + 0.12% = 0.32%.Total implementation shortfall is 0.67 percent, or 67 bps.

Chapter 10 Execution of Portfolio Decisions 203
12. Portfolio trades involve the purchase or sale of a basket of stocks, with the buy or sellorders placed as a coordinated transaction. Jane Smith could ask a broker for a quote forthe entire basket of telecommunications stocks that she wants to purchase. Because thereare multiple stocks in the basket being purchased, it is clear to the counterparty that thepurchase is not motivated by information about a particular stock and the market impactof the trade is likely to be less. As a consequence, the cost of trading the basket of stocksis expected to be lower than the total trading cost of buying each stock individually.
13. The average execution cost for a purchase of securities is 75 basis points, or 0.75 percent,and the average execution cost for a sale of securities is also 0.75 percent. So, the averageexecution for a round-trip trade is 2 × 0.75%, or 1.5%. Since the portfolio is expectedto be turned over twice, expected execution costs are 1.5% × 2 = 3%. Therefore, theexpected return net of execution costs is 8% − 3% = 5%.
14. Just as some traders in London possess information about stocks that traders in New Yorkmay not, some New York-based traders possess information that London-based tradersmay not. When New York-based traders begin to trade with the opening of U.S. markets,their trades reveal new information. The new information is incorporated into prices notonly in New York but also in London during the hours of overlap between the markets.This incorporation of additional information from New York in London results in highervolatility of prices in London after the opening of the U.S. markets.
15. One reason the manager may have chosen not to trade more aggressively is that he doesnot think there are other informed traders who have the same information he has aboutthe company’s stock. That is, he does not expect other traders to trade in the stockbased on information, thus quickly eliminating his informational advantage. By tradingin smaller sizes over a period of time, the manager attempts to reduce the chance thatother traders will infer that the fund manager is trading based on special information. Byspreading his trades over time, the manager is trying to reduce the price impact of tradingby not revealing his full trading intentions.
16. Liquidity-motivated traders transact only to meet liquidity needs and desire low trans-action costs. So, they would prefer the market with the lower bid–ask spreads. Theinformation-motivated traders trade strategically to maximize the profits from theirinformation. Some of their profits are made in trades in which liquidity-motivatedtraders are the counterparty. Since the liquidity-motivated traders trade in the mar-ket with the lower spreads, information-motivated traders will trade with them inthat market. Also, information-motivated traders prefer to place larger orders to profitfrom any superior information they have. Such traders with large orders are particu-larly concerned about the market impact cost in the form of a price change for largetrades. Since the quoted prices are firm for only a fixed depth, larger orders maymove the bid (ask) price downward (upward). In a market with greater depth, themarket impact cost is less. Thus, the market with greater depths would be preferredby information-motivated traders. Overall, between the two alternate trading venues,the one with lower spreads and greater depths would be preferred by both types oftraders.
17. Trade A. In spite of the high urgency level, this trade represents 3 percent ADV. Thistrade is suitable for an implementation shortfall algorithm.Trade B. This trade represents 75 percent ADV and has high spreads. It is not suitable foran algorithmic trade and should be traded using a broker.
18. Although the goal is to minimize explicit transaction costs, the trader needs also toconsider the opportunity cost of not being invested in the S&P 500 portfolio. The trader

204 Solutions
should use an implementation shortfall strategy to control the risk of this rebalance. Inshort, he should minimize explicit costs by waiting for trades to cross in an electroniccrossing network, such as the POSIT trading system, but he should also submit namesnot likely to cross to a broker in order to minimize opportunity costs. Such a strategywould balance the costs of a delay in implementing a strategic asset allocation against theconcern to minimize explicit transaction costs.

CHAPTER 11MONITORING AND
REBALANCING
SOLUTIONS
1. A. Accumulating funds for the child’s education is a new investment goal. Prior to theadoption, the couple’s time horizon was two-stage (preretirement and postretirement).In their late 40s, they will have a period in which they need to pay for the cost ofthe child’s education; this will involve substantial costs for which they must plan. Thecouple’s multistage time horizon now includes the period up to the child’s enteringcollege, the child’s college years, the remaining period to retirement, and retirement.
B. Given the investor’s circumstances, the decision to buy a house in one year’s time makesthe addition of a shortfall risk objective appropriate. He needs to earn at least 2 percentif he is to have sufficient funds to buy the house. An appropriate shortfall risk objectiveis to minimize the probability that the return on the portfolio falls below 2 percentover a one-year horizon. The decision also creates a liquidity requirement. The need for$102,000 in cash at the end of the investment period means that the investor cannottie up his money in a way such that he does not have ready access to it in a year’s time.
C. The approval of the grant has created a liquidity requirement of ¤15 million −¤1 million = ¤14 million.
2. The first action (‘‘Revise the investment policy statement of the pension scheme to takeinto account a change in the forecast for inflation in the United Kingdom’’) is incorrect.The investment policy statement (IPS) depends on the client’s particular circumstances,including risk tolerance, time horizon, liquidity and legal constraints, and unique needs.Therefore, a change in economic forecast would not affect the IPS. The IPS also considersa client’s return requirement. This return requirement may change over the long term ifthe inflation outlook has changed over the long term. A change in the inflation outlookover a short period, such as in this question, would not necessitate a change in the returnportion or any other aspect of the IPS.
The second action (‘‘Reallocate pension assets from domestic (U.K.) to internationalequities because he also expects inflation in the United Kingdom to be higher than in othercountries’’) is correct. A change in economic forecast might necessitate a change in assetallocation and investment strategy. An expectation of increased inflation in the UnitedKingdom might lead to expectations that U.K. equity performance will slow and wouldlikely result in both weaker U.K. equity returns and stronger returns from overseas markets.This would justify an increased allocation to international equities.
205

206 Solutions
The third action (‘‘Initiate a program to protect the financial strength of the pensionscheme from the effects of U.K. inflation by indexing benefits paid by the scheme’’) isincorrect. The implementation of an inflation index adjustment program would protectthe plan participants, not the plan itself, from the effects of higher U.K. inflation. With aninflation index adjustment program, Summit’s costs of funding the defined benefit schemewould actually increase (thereby weakening the plan’s financial position) as U.K. inflationincreases.
3. A. The return requirement should be higher to:
• Fund her additional living expenses.• Meet her new retirement goals.
The following calculations are not required but provide basis for the statement thatthe return must be higher than the previous 7 percent to generate a retirement portfoliothat will support the desired retirement spending level (at a reasonable retirementspending rate). The portfolio must now produce a return of approximately 9 percent,depending on the retirement spending rate assumption made.
Current portfolio (gross) $3,700,000Less surgery 214,000Less house down payment 430,000Less living expenses 1,713,000Current portfolio (net) 1,343,000
After-tax return = Before-tax return(1 − T) = 9.0% (0.7) = 6.3%Years = 25Retirement portfolio $6,185,967 = $1, 343, 000(1.063)25
Retirement spending (after tax) 280,000Retirement spending (before tax) 400,000Spending rate (before tax) 6.47% = $400, 000/$6, 185, 967
Risk tolerance should be higher. Wisman’s risk tolerance should be higher because:
• Her husband’s intention to work for another 25 years gives her the ability to assumemore risk.
• The increase in assets affords her the ability to assume more risk.
Her time horizon is still multistage, but the stages have changed. In the first stage,expected to last 25 years, her husband will be working. The second stage is retirement.
The liquidity requirement should be higher. Wisman has a higher liquidityrequirement because of the cost of the surgery for her son and the down payment forthe house.
B. The allocation to Spencer Design Stock (currently 39.1 percent) should be decreased.Having a large percentage of her portfolio in one risky and potentially illiquid equitysecurity exposes the portfolio to unnecessary and significant security-specific risk.
The allocation to cash (currently 2.4 percent) should be increased. Wisman needs$430,000 for a house down payment, $214,000 for her son’s surgery, and the currentyear’s portion of the $1,713,000 present value of ongoing living expenses.
The allocation to the diversified bond fund (currently 30.5 percent) should beincreased. The couple’s portfolio must support the $1,713,000 present value of ongoing

Chapter 11 Monitoring and Rebalancing 207
living expenses and can sustain only moderate portfolio volatility. The regular incomestream and diversification benefits offered by bonds are consistent with those needs.
The allocation to large-capitalization equities (currently 10.4 percent) should beincreased. Wisman requires growth and inflation protection to meet her current andfuture spending needs. A diversified equity portfolio is likely to meet these requirementsover time without imparting unacceptable volatility to principal values.
The allocation to emerging market equities (currently 11 percent) should bedecreased. Wisman requires high returns but cannot afford to sustain large losses.Having a large percentage of total assets in volatile emerging markets securities is toorisky for Wisman.
The allocation to undeveloped commercial land (currently 6.6 percent) should bedecreased. Wisman needs income and liquidity to meet ongoing portfolio disbursementrequirements. Undeveloped land requires cash payments (taxes, etc.) and is oftenilliquid.
4. The Javier–Campbell Trust’s willingness to take risk is now below average because of itsneed to have a high probability of covering Javier’s living expenses during the remainderof her lifetime, which encompasses a short time horizon. Javier’s below-average willingnessto take risk (coupled with her short time horizon) dominates Campbell’s above-averagewillingness (coupled with his long time horizon). Of course, once Javier is no longer living,the Trust can reflect Campbell’s higher willingness to take risk.
5. A. The suggested approach has several disadvantages:
• A fixed ±5 percent corridor takes no account of differences in transaction costsamong the asset classes. For example, private equity has much higher transactioncosts than inflation-protected bonds and should have a wider corridor, all else equal.
• The corridors do not take account of differences in volatility. Rebalancing is mostlikely to be triggered by the highest volatility asset class.
• The corridors do not take account of asset class correlations.
B. i. The corridor for international equities should be narrower than it was previously.ii. The corridor for inflation-protected bonds should be unaffected. The transaction
costs should have an effect on the relative widths of the corridors for private equityand international equities.
iii. The corridor for private equity should be narrower than that for domestic equities.iv. The corridor for domestic equities should be narrower than that for inflation-
protected bonds.6. A. Calendar rebalancing at a relatively high frequency such as weekly or monthly would
be appropriate. In contrast to percentage-of-portfolio rebalancing, calendar rebalancingdoes not require continuous monitoring of portfolio values. The riskiness of theportfolio suggests frequent rebalancing to control drift.
B. Such markets tend to be characterized by reversal and enhance the investment resultsfrom rebalancing to the strategic asset allocation, according to Perold–Sharpe analysis.
7. A. i. Buy and hold. The buy-and-hold strategy maintains an exposure to equities that islinearly related to the value of equities in general. The strategy involves buying, thenholding, an initial mix (equities/bills). No matter what happens to relative values,no rebalancing is required; hence, this is sometimes termed the do nothing strategy.The investor sets a floor below which he or she does not wish the portfolio’s value tofall. An amount equal to the value of that floor is invested in some nonfluctuatingasset (e.g., Treasury bills or money market funds). The payoff diagram for a

208 Solutions
buy-and-hold strategy is a straight line, so the portfolio’s value rises (falls) as equityvalues rise (fall), with a slope equal to the equity proportion in the initial mix. Thevalue of the portfolio will never fall below the specified floor, and the portfolio hasunlimited upside potential. Increasing equity prices favor a buy-and-hold strategy;the greater the equity proportion in the initial mix, the better (worse) the strategywill perform when equities outperform (underperform) bills.
The strategy is particularly appropriate for an investor whose risk toleranceabove the specified floor varies with wealth but drops to zero at or below that floor.After the initial portfolio transaction, transaction costs are not an issue. The strategyis tax efficient for taxable investors.
ii. Constant mix. The constant-mix strategy maintains an exposure to equities that isa constant percentage of total wealth. Periodic rebalancing to return to the desiredmix requires the purchase (sale) of equities as they decline (rise) in value. Thisstrategy, which generates a concave payoff diagram, offers relatively little downsideprotection and performs relatively poorly in up markets. The strategy performsbest in relatively flat (but oscillating or volatile) markets and capitalizes on marketreversals. The constant-mix strategy performs particularly well in a time periodwhen equity values oscillate greatly but end close to their beginning levels; greatervolatility around the beginning values accentuates the positive performance.
The constant-mix strategy is particularly appropriate for an investor whose risktolerance varies proportionately with wealth; such an investor will hold equities atall levels of wealth. This strategy requires some rule to determine when rebalancingshould take place; typical approaches avoid transaction costs until asset-class weightshave changed by a given percentage. At this point, transaction costs are incurred torebalance. Taxes can be material for taxable investors.
iii. Constant-proportion portfolio insurance. The constant-proportion portfolio insurance(CPPI) strategy maintains an exposure to equities that is a constant multiple greaterthan 1 of a ‘‘cushion’’ specified by the investor. The investor sets a floor belowwhich he does not wish assets to fall, and the value of that floor is invested in somenonfluctuating asset (e.g., Treasury bills or money market funds). Under normalmarket conditions the value of the portfolio will not fall below this specified floor.As equity values rise (fall), the CPPI strategy requires the investor to purchase (sell)additional equities. Thus following this strategy keeps equities at a constant multipleof the cushion (assets–floor) and generates a convex payoff diagram. The CPPIstrategy tends to give good downside protection and performs best in directional,especially up, markets; the strategy does poorly in flat but oscillating markets and isespecially hurt by sharp market reversals.
The strategy is particularly appropriate for an investor who has zero tolerancefor risk below the stated floor but whose risk tolerance increases quickly as equityvalues move above the stated floor. To control transaction costs, this strategyrequires some rule to determine when rebalancing takes place. One approach avoidstransaction costs until the value of the portfolio has changed by a given percentage.At this point, transaction costs are incurred to rebalance. Taxes can be a materialconsideration for taxable investors.
B. The CPPI strategy is the most appropriate rebalancing strategy for the MU endowmentfund, taking into account the major circumstances described: the endowment’s increasedrisk tolerance, the outlook for a bull market in growth assets over the next five years,

Chapter 11 Monitoring and Rebalancing 209
the expectation of lower than normal volatility, and the endowment’s desire to limitdownside risk.
The CPPI strategy is consistent with higher risk tolerance, because the strategycalls for purchasing more equities as equities increase in value; higher risk tolerance isreflected in the resulting increased allocation to equities over time.
• The CPPI strategy will do well in an advancing equities market; because equities arepurchased as their values rise, each marginal purchase has a high payoff.
• The CPPI strategy would do poorly in a higher-volatility environment for equities,because the strategy would sell on weakness but buy on strength, only to experiencereversals; conversely, the strategy does much better in the face of lower volatility.
• The CPPI strategy provides good downside protection, because the strategy sells onweakness and reduces exposure to equities as a given floor is approached.
In summary, given that MU receives little other funding, the endowment fund mustproduce the maximum return for a specified level of risk. Given that the level of acceptablerisk is generally higher, although with a very specific downside floor, the market outlooksuggests that the constant-proportion strategy is the endowment fund’s best rebalancingstrategy.

CHAPTER 12EVALUATING PORTFOLIO
PERFORMANCE
SOLUTIONS
1. In this simplest rate-of-return calculation, the portfolio experiences no external cash flows.In this situation, the account’s rate of return during evaluation period t equals the marketvalue (MV1) at the end of the period less the market value at the beginning of the period(MV0), divided by the beginning market value:
rt = MV1 − MV0
MV0or (¤523,500 − ¤453,000)/¤453,000
= 0.1556 = 15.56%
Joubert earned a 15.56 percent rate of return on his portfolio during the year 2002.2. A. The contribution was received at the end of the evaluation period, and it should be
subtracted from the account’s ending value. The external cash flow had no opportunityto affect the investment-related value of the account, and hence, it should be ignored.
rt = (MV1 − CF) − MV0
MV0or
rt = (42,300 − 500) − 42,00042,000
= −0.48%
Even though Smith actually ended up with a larger amount in his account at the endof the period as compared to the beginning of the period (£42,300 versus £42,000),he actually lost money on his investments. His rate of return was −0.48 percent. Theslight increase in his account balance was due to the contribution at the end of themonth rather than to a positive return.
B. In this case, the contribution was received at the beginning of the evaluation period,and it should be added to the account’s beginning value. This sum is then subtractedfrom the ending value of the account, and the result is divided by the same sum(see formula below). In this case, the external cash flow did have an opportunityto affect the investment-related value of the account and it should be included in
210

Chapter 12 Evaluating Portfolio Performance 211
the calculation.
rt = MV1 − (MV0 + CF)MV0 + CF
rt = 42,300 − (42,000 + 500)(42,000 + 500)
= −0.47%
This rate of return is slightly higher (a smaller negative number) than the −0.48percent return calculated in Part A. The slight increase in investment performancewas due to the contribution made at the beginning of the month. In this case, thenumerator of the formula yields an identical answer to that of Part A (−£200). Butthe denominator is larger (£42,500 vs. £42,000), giving a slightly higher return thanin Part A.
3. A. Yes, an accurate rate of return can be calculated. The appropriate calculation isthe time-weighted rate of return. The time-weighted rate of return (TWR) reflectsthe investment growth in the account as if the account began with one dollar. Itscalculation requires that the account be valued every time an external cash flow occurs.If no cash flows take place, then the calculation of the TWR is simple; the change inthe account’s value is expressed relative to its beginning value. If external cash flows dooccur, then the TWR requires computing a set of subperiod returns. These subperiodreturns must then be linked together to compute the TWR for the entire evaluationperiod.
First, we determine the appropriate subperiods by reviewing the dates of thecontributions to the account. Contributions were made on September 14th and 21st.The appropriate subperiods are as shown:
Subperiod 1 = Days 1 through 14
Subperiod 2 = Days 15 through 21
Subperiod 3 = Days 22 through 30
Next, we calculate the rate of return for each subperiod:
For subperiod 1:
rt,1 = [($105,000 − $3,000) − $100,000]/$100,000
= 0.02 or 2.00%
For subperiod 2:
rt,2 = [($108,000 − $2,500) − $105,000]/$105,000
= 0.0048 or 0.48%
For subperiod 3:
rt,3 = ($110,000 − $108,000)/$108,000
= 0.0185 or 1.85%

212 Solutions
Converting the subperiod returns into decimal form, we use the following expressionto compute the time-weighted rate of return:
rtwr = (1 + rt,1) × (1 + rt,2) × . . . × (1 + rt,n) − 1
In the case of Mary’s portfolio:
rtwr = (1 + 0.02) × (1 + 0.0048) × (1 + 0.0185) − 1
= 0.0439 or 4.39%
4. A. The time-weighted rate of return for the investment manager is:
rtwr = (1 + 0.0125)(1 + 0.0347)(1 + [−0.0236])(1 + 0.0189)
(1 + [−0.0267])(1 + 0.0257) − 1
= 0.0405 or 4.05%
B. Adding the subperiod rates of return gives 0.0125 + 0.0347 + (−0.0236) + 0.0189+ (−0.0267) + 0.0257 = 0.0415 or 4.15 percent.
Characteristically, the additive calculation gives a higher return number (4.15percent) than the time-weighted calculation (4.05 percent). In general, the time-weighted rate of return is a better indicator of long-term performance because it takesaccount of the effects of compounding.
5. The TWR reflects the investment growth of one unit of money initially invested in theaccount. If external cash flows occur, then the account must be valued as of the date ofeach of these cash flows; the calculation of the TWR then requires computing a series ofsubperiod returns for the subperiods defined by the external cash flows. The subperiodreturns are then combined by chain-linking, and 1 is subtracted from the result to arriveat the TWR.
The money-weighted rate of return (MWR) measures the compound growth rate inthe value of all funds invested in the account over the evaluation period. The MWR isalso called internal rate of return (IRR). The MWR is the growth rate that will link theending value of the account to its beginning value plus all external cash flows. The MWRis computed using an iterative procedure.
The MWR represents the average growth rate of all dollars invested in an account,while the TWR represents the growth of a single unit of money invested in the account.Consequently, the MWR is sensitive to the size and timing of external cash flowscontributed to and withdrawn from the account, while the TWR is not affected by thecash flows. Under ‘‘normal’’ conditions, these two return measures will produce similarresults. However, when external cash flows occur that are large relative to the account’svalue (rule of thumb: greater than 10 percent) and the account’s performance fluctuatessignificantly, then the MWR and the TWR can differ substantially.
6. A. The correct methodology for approximating a time-weighted rate of return for theentire year of 2003 is to use a linked internal rate of return (LIRR) approach. Thisapproach takes the money-weighted rate-of-return values and then chain-links thereturns over the entire evaluation period.

Chapter 12 Evaluating Portfolio Performance 213
B. The calculation is:
rLIRR = (1 + 0.0535) × (1 + [−0.0234]) × (1 + 0.0462) × (1 + 0.0125) − 1
= 0.0898 or 8.98%
7. A. For Swennson, the annualized rate of return is:
ra = [(1 + 0.275)(1 − 0.189)(1 + 0.146)(1 − 0.324)(1 + 0.123)]1/5 − 1
= −0.0209 = −2.09%
For Mattsson, the annualized rate of return is:
ra = [(1 + 0.057)(1 + 0.049)(1 + 0.078)(1 − 0.067)(1 + 0.053)]1/5 − 1
= 0.0327 or 3.27%
B. Mattsson’s annualized rate of return of 3.27 percent was higher than Swennson’s at−2.09 percent.
8. In this problem, the Wilshire 5000 represents the market index for U.S. equities, theRussell 1000 Value Index represents the portfolio benchmark, and Anderson’s account isthe portfolio.
A. The return due to style is the difference between the benchmark and the market index,or S = (B − M) = (21.7 percent − 25.2 percent) = −3.5 percent.
B. The return due to active management is the difference between the portfolio and thebenchmark, or A = (P − B) = (18.9% − 21.7%) = −2.8%.
C. The implication of the style calculation is that large-cap value is out of favor: i.e., theRussell 1000 Value Index underperformed the Wilshire 5000 by 3.5 percent. In and ofitself, this should not be a large concern for an investor with a properly diversified port-folio. Certain styles will periodically outperform and underperform the market index.
The implication of the active management calculation is that Anderson is notadding value as compared to the benchmark, since its portfolio underperformed theportfolio benchmark. If Anderson is indeed a large-cap value manager and the Russell1000 Value Index is an appropriate benchmark, then the client may be better offinvesting in the passive alternative. Of course, one period is not enough to make ajudgment such as this. However, sustained underperformance of an active manager ascompared to an appropriate benchmark should be cause for concern.
9. To verify the choice of the benchmark, a potential client could compare the marketcapitalization (median, average, weighted average) of the subject portfolio with therespective benchmark index. This can help identify a good match (or mismatch) based onthe size (market capitalization) of the stocks in the portfolio versus the index. In addition,the historical beta of the portfolio can be calculated relative to the potential benchmark.On average, it should be close to 1.0. If the beta is significantly larger (smaller) than thebenchmark, it would indicate that the portfolio is substantially riskier (less risky) than thebenchmark.

214 Solutions
10. A. Overall, the domestic equities asset class has performed well relative to the benchmark(4.54 percent vs. 4.04 percent). However, only one of the two domestic equitiesmanagers has outperformed his respective benchmark. Equity manager A has outper-formed by 15 basis points, while equity manager B has underperformed by 18 basispoints.
The international equity asset class as a whole has outperformed its benchmark. Inaddition, both international equity managers have also outperformed their respectivebenchmarks.
The fixed-income asset class underperformed its benchmark. Both fixed-incomemanagers have underperformed their respective benchmarks as well.
B. Overall, the total fund has outperformed its benchmark by 11 basis points. Neverthe-less, the fund may be able to improve its relative performance by considering somechanges to the manager lineup.
C. For each manager that underperformed his or her assigned benchmark (equitymanager B and both fixed-income managers), the plan sponsor should first verifythat the benchmarks in place are appropriate for the particular managers’ investmentstyles. If the benchmarks are appropriate, and if performance is not expected toimprove (based on many factors, including quality of people, organizational issues,etc.), then the plan sponsor may consider replacing these managers with other activemanagers following similar investment disciplines, or perhaps replacing them withpassive investment alternatives corresponding to the benchmarks those managers arebeing measured against.
11. In practice, an acceptable benchmark is one that both the investment manager and theplan sponsor agree represents the manager’s investment process. However, in order tofunction effectively in performance evaluation, a benchmark should possess certain basicproperties. It should be:
• Unambiguous. The names of securities and their corresponding weights in the bench-mark should be clearly noted.
• Investable. The benchmark should be available as a passive option.• Measurable. It should be possible to calculate the benchmark’s return on a timely basis,
for various time periods (e.g., monthly, quarterly, annually).• Appropriate. The benchmark should be consistent with the manager’s investment style
or area of expertise.• Reflective of current investment opinions. The manager should have opinions and
investment knowledge of the individual securities within the benchmark.• Specified in advance. The benchmark should be specified prior to the beginning of an
evaluation period and known to both the investment manager and the fund sponsor.• Owned. The investment manager should be aware of and accept accountability for the
constituents and performance of the benchmark.
12. Kim Lee Ltd.’s benchmark is not valid. The chief criticism of this type of benchmark isthat it is not, and cannot be, specified in advance. Furthermore, since no one knows whothe top-quartile managers will be at the beginning of an evaluation period, the benchmarkis not investable; that is, there is no passive option for investment. Kim Lee Ltd. caninform existing and prospective clients where the firm’s past performance has ranked inits peer group, but the universe should not be used ex ante as a performance benchmark.

Chapter 12 Evaluating Portfolio Performance 215
Furthermore, the firm should disclose sufficient information about the composition ofthe peer group for recipients to evaluate the meaningfulness of the firm’s ex post ranking.
13. A one-factor model can be used to predict the return on Jones’ portfolio and thebenchmark. In this case, the returns can be expressed as a linear function of the return onthe entire U.S. equity market (as represented in the problem statement by the Wilshire5000), as shown below:
Rp = ap + βpRI + εp
where Rp is the return on the portfolio and RI is the return on U.S. equities. The term εp isthe residual, or nonsystematic, element of the relationship. Finally, the term βp measuresthe sensitivity of the portfolio to the return on the U.S. equities market.
Calculating the expected return on Jones’s portfolio gives:
RJones = 0.5 + 1.15(5.9) = 7.29%
Calculating the expected return on the custom benchmark gives:
RBenchmark = 1.5 + 0.95(5.9) = 7.11%
The incremental expected return of the portfolio versus the benchmark is 0.18 percent.This can be calculated by computing the difference between the two expected returns. Itcan also be calculated by combining the two formulas as shown below:
RDifference = (0.5 − 1.5) + (1.15 − 0.95)(5.9) = 0.18%
Since the portfolio actually returned 8.13 percent during the period, the total differentialreturn is 1.02 percent (the difference between the actual return of 8.13 percent and theexpected benchmark return of 7.11 percent). However, based on the one-factor model, anoutperformance of 0.18 percent was expected. The difference between the 1.02 percentand the 0.18 percent (or 0.84 percent) can be attributed to the value-added investmentskill of Susan Jones.
14. We begin by calculating the information ratio for each of the two managers. The formulafor the information ratio is:
IRA = RA − RB
σA−B
In our problem statement, the value-added for Manchester (1.5 percent) is the numeratorin this formula, and the variability of excess returns (2.24 percent) is the denominator.Thus, for Manchester we can calculate an information ratio of 0.67.
Similarly, for Oakleaf we can calculate an information ratio of 0.4 (4 percent excessreturns divided by 10 percent variability).
When we review our table, it gives the probability of outperformance. Since thequestion refers to underperformance, we must subtract the values in the table from 1 todetermine the probability of underperformance.

216 Solutions
Manchester Manchester Oakleaf OakleafYear Outperformance Underperformance Outperformance Underperformance
1 74.75% 25.25% 65.54% 34.46%5 93.20 6.80 81.45 18.55
10 98.25 1.75 89.70 10.30
In this case, Oakleaf has a larger chance of underperforming the benchmark at allthree time periods: 1, 5, and 10 years. This is interesting, since Oakleaf has a much largerexpected value-added return (4 percent annually versus 1.5 percent for Manchester).However, the much larger variability of excess returns (10 percent for Oakleaf versus 2.24percent for Manchester) clearly is an important factor in this situation.
15. In general terms, equity will earn higher returns than cash on average over the long term.However, there are periods of declining equity performance when cash may outperformequities.
In the case of Acorn and Zebra, Acorn would be preferable over Zebra, all else butthe cash levels being equal. During most time periods when equities are outperformingcash, it would be better to have less cash and more equities in the portfolio. But duringthe time periods when equities are declining, it may be preferable to have more cash.Unfortunately, it is extremely difficult to forecast ahead of time when these time periodsof declining equity performance will occur.
16. There are performance measurement issues that are created when there are short positionsin a portfolio. The basic equation for the return on an account is:
rt = MV1 − MV0
MV0
In theory, the net assets of a long–short portfolio could be zero. If the value of theportfolio’s long positions is equal to the value of the portfolio’s short positions, then thebeginning market value, MV0, would be zero and the account’s rate of return would beeither positive infinity or negative infinity.
To address this problem, we need to revise our performance measurement methodol-ogy. One approach would be to determine returns by summing the performance impactsof the individual security positions (both long and short). A return could be calculatedfor the period that the individual security positions were maintained. Once an individualsecurity position changed, the return period would end and a new return period wouldstart.
Regarding performance evaluation, if we have information regarding the historicalreturns and holdings of a long–short equity manager’s long and short portfolios, we coulduse either returns-based or security-based benchmark building approaches to constructseparate long and short benchmarks for the manager. These benchmarks could then becombined in appropriate proportions to create an appropriate benchmark for the manager.
Another possible option for performance evaluation is the use of the Sharpe ratioto evaluate hedge fund manager performance. It can be calculated without reference tothe manager’s underlying investment universe. Typically, a hedge fund manager’s Sharperatio is compared to that of a universe of other hedge fund managers whose investmentmandates are similar to those of the manager under evaluation.

Chapter 12 Evaluating Portfolio Performance 217
17. Both macro attribution and micro attribution are different facets of performance attribu-tion. The basic tenet behind performance attribution is that an account’s performance iscompared to a designated benchmark, then the sources of differential returns are identifiedand quantified. The main difference between macro and micro attribution is the definitionof which ‘‘account’s’’ performance we are analyzing. Macro attribution is done at the fundsponsor level; that is, analysis is typically done for a grouping of investment managersor investment accounts. Micro attribution is carried out at the level of the individualinvestment manager.
There are three main inputs to the macro attribution approach:
1. Policy allocations.2. Benchmark portfolio returns.3. Fund returns, valuations, and external cash flows.
Fund sponsors determine policy allocations, or ‘‘normal’’ weightings, for each assetclass and individual manager. These are typically determined after some sort of assetliability analysis and/or determination of the risk tolerance of the governing body of thefund.
Benchmark portfolio returns are an important factor in determining the value addedby the fund. If the benchmarks do not adequately match the managers’ investment styles,the performance attribution will have little value. Fund sponsors may use broad marketindexes as the benchmarks for asset categories (the Wilshire 5000 as the benchmark foroverall U.S. domestic equities, for example) and may use more focused indexes to representmanagers’ investment styles (such as the Russell 2000 Value Index for a small-cap valuemanager).
Fund returns, valuations, and external cash flows are all critical elements for de-termining the relevant performance for the portfolio as a whole and for each individualinvestment manager’s account.
A return metric implies that fund returns are used at the level of the individualmanagement account to allow an analysis of the fund sponsor’s decisions regardingmanager selection. A dollar-metric approach uses account valuation and external cashflow data to calculate rates of return and also to compute the dollar impacts of the fundsponsor’s investment policy decision making.

CHAPTER 13GLOBAL INVESTMENT
PERFORMANCESTANDARDS
SOLUTIONS
1. The Global Investment Performance Standards (GIPS standards) must be applied ona firmwide basis, and the firm must be defined as an investment firm, subsidiary, ordivision held out to clients or potential clients as a distinct business entity (ProvisionsII.0.A.1–2). A distinct business entity is a unit, department, or office that is organizationallyand functionally segregated from other units, divisions, departments, or offices and thatretains discretion over the assets it manages and autonomy over the investment decision-making process (GIPS glossary). If Walker, Pierce & Company of Frankfurt satisfiesthese criteria, it may define itself as a firm and undertake meeting all the requirementsof the GIPS standards in order to claim compliance. The fact that Walker, Pierce &Company of Frankfurt has its own head of marketing suggests that it does hold itselfout as a distinct business entity, and the fact that it is geographically separated from itsparent company headquarters suggests that it may be organizationally and functionallysegregated, but we lack sufficient information to determine if it retains discretion over theassets it manages and autonomy over the investment decision-making process. If Walker,Pierce & Company of Frankfurt does in fact qualify as a firm and achieve compliance, itmust disclose the definition of the firm used to determine total firm assets and firmwidecompliance (Provision II.4.A.1).
2. The standard compliance statement must accompany performance presentations preparedby firms claiming GIPS compliance. The statement cannot claim compliance with theGIPS standards ‘‘except for’’ anything (Provision II.0.A.8). In spite of the prior years’compliance with the then-prevailing Standards, Larson Dynamic Management may nolonger claim compliance if it has failed to meet the January 1, 2005 deadline fortrade-date accounting. The only acceptable compliance statement is: ‘‘[Name of firm] hasprepared and presented this report in compliance with the Global Investment PerformanceStandards (GIPS®).’’ The compliance statement may be used only if the firm compliedwith all requirements of the GIPS standards (Provision II.0.A.7).
3. A and B. To calculate annual performance for Year 1 and Year 2, convert the quarterlyreturns to relative form (1 + r), link them multiplicatively, and subtract 1.
218

Chapter 13 Global Investment Performance Standards 219
For Year 1:
1Q Year 1: 1 + 4.76% = 1.0476
2Q Year 1: 1 + 12.08% = 1.1208
3Q Year 1: 1 + (–4.88%) = 0.9512
4Q Year 1: 1 + 7.14% = 1.0714
rYear1 = (1.0476 × 1.1208 × 0.9512 × 1.0714) − 1 = 0.1966 = 19.66%
For Year 2:
1Q Year 2: 1 + (−13.57%) = 0.8643
2Q Year 2: 1 + 17.65% = 1.1765
3Q Year 2: 1 + 1.08% = 1.0108
4Q Year 2: 1 + 0.97% = 1.0097
rYear2 = (0.8643 × 1.1765 × 1.0108 × 1.0097) − 1 = 0.0378 = 3.78%C. To calculate cumulative performance, convert the quarterly returns for the entire
two-year period to relative form (1 + r), link them multiplicatively, and subtract 1:
rCum = (1.0476 × 1.1208 × 0.9512 × 1.0714 × 0.8643 × 1.1765
× 1.0108 × 1.0097) − 1
= 0.2418 = 24.18%
Alternately, express the annual returns for Year 1 and Year 2 in relative form, multiplythem together, and subtract 1:
rCum = (1.1966 × 1.0378) − 1
= 0.2418 = 24.18%
D. To calculate annualized compound performance, convert the cumulative rate of returnto relative form (1 + rCum) and raise it to the reciprocal of the number of years in theperiod (1/n), and subtract 1. In this problem, there are two years in the period, so thecompound annual rate of return is:
1.2418(1/2) − 1 =√
1.2418 − 1
= 0.1144 = 11.44%
4. The GIPS standards allow the linking of noncompliant performance, provided that nononcompliant performance is shown after January 1, 2000 (Provision II.5.A.2). Firmsmust disclose which periods are not in compliance and the reasons for noncomplianceduring any time period for which the composite is not in compliance (Provision II.4.A.10).In the example given, Smith & Jones may link noncompliant performance prior to January1, 2000 but must disclose that the market value of fixed-income securities did not include

220 Solutions
accrued income for periods prior to 1999. If the use of derivatives in some accountswas material, the nature and extent of such use must be disclosed (Provision II.4.A.5).It might be appropriate to place portfolios that use leverage or derivatives into differentcomposites from those that do not.
5. Smith & Jones may not claim to be GIPS-compliant if model performance is linkedto actual performance. The GIPS standards state that composites must include onlyactual assets under management within the defined firm, and they expressly prohibitlinking simulated or model portfolios with actual performance (Provision II.3.A.8).This requirement does not restrict investment managers from showing model results assupplemental information, but linking model returns to actual returns and showing thecombined history as a continuous record would be misleading and thus is not permitted.If a firm presents model results as supplemental information, it must clearly label them.
6. Barry, Smith must have a documented, composite-specific policy for the treatment ofexternal cash flows and must compute time-weighted total returns that adjust for externalcash flows. For periods beginning January 1, 2005, rate-of-return approximation methodsmust adjust for cash flows on a day-weighted basis (Provision II.2.A.2). Accordingly,Barry, Smith must use a return-calculation methodology that adjusts for daily-weightedexternal cash flows, such as the Modified Dietz method. However, the March 12, 2006,contribution to the Dennett portfolio represents 13.67 percent of the portfolio’s value,and it may be classified as a large external cash flow. Barry, Smith must establish inadvance a policy for determining what is considered a ‘‘large’’ external cash flow for theBalanced Tax-Exempt composite. Large external cash flows may distort approximatedreturns. The GIPS standards recommend that portfolios be valued as of the date of alllarge external cash flows (Provision II.2.B.3), and this treatment will be mandatory forperiods beginning January 1, 2010 (Provision II.2.A.2). If the portfolio is valued as of theend of the day on March 12, then Barry, Smith can compute subperiod returns and linkthem to calculate a true time-weighted rate of return for the month of March. The firmcould also treat the cash flow as a temporary new account. Alternately, if Barry, Smith hasadopted a Significant Cash Flow policy for this composite, the firm could determine thatthis account should be excluded from the composite for the month.
7. A. Approximate return for March using the Modified Dietz formula:
rModDietz = MV1 − MV0 − CFMV0 +
!(CFi × wi)
wi = 31 − 1231
= 0.6129
rModDietz = 19,250,000 − 16,575,000 − 2,265,00016,575,000 + (2,265,000 × 0.6129)
= 0.0228 = 2.28%
B. True time-weighted return for March:
rt = MV1 − MV0
MV0
rt,1 = (19,550,000 − 2,265,000) − 16,575,00016,575,000
= 0.0428 = 4.28%
rt,2 = 19,250,000 − 19,550,00019,550,000
= −0.0153 = −1.53%

Chapter 13 Global Investment Performance Standards 221
rtwr = (1 + rt,1) × (1 + rt,2) × . . . × (1 + rt,n) − 1
rtwr = (1 + 0.0428) × (1 + (−0.0153)) − 1 = 0.0268 = 2.68%
C. The capital markets in which the Dennett portfolio was invested were volatile duringthe month of March. The portfolio had a 4.28 percent return in the first 12 days ofthe month but a −1.53 percent return for the rest of the month. The portfolio hada large external cash inflow during March. In these circumstances, the approximatereturn may be distorted. The approximate return calculated using the Modified Dietzmethod differs by 40 basis points (0.40 percent) from the true time-weighted returncalculated by geometrically linking subperiod returns.
8. Performance must be calculated after actual trading expenses are deducted (ProvisionII.2.A.5). Trading expenses are the costs of buying or selling a security, and they typicallytake the form of brokerage commissions or spreads. Only actual trading expenses areused; estimates are not permitted. The reason for this requirement is that trading expensesmust be incurred in order to implement the investment strategy, and performance shouldreflect those expenses.
9. A. Portfolio returns:
rA = 85.3 − 74.9 − 7.574.9 + (7.5 × 0.613)
= 2.979.5
= 0.0365 = 3.65%
rB = 109.8 − 127.6 − (−15) − (−5)127.6 + (−15 × 0.742) + (−5 × 0.387)
= 2.2114.535
= 0.0192 = 1.92%
rC = 128.4 − 110.4 − 15110.4 + (15 × 0.387)
= 3116.205
= 0.0258 = 2.58%
B. To calculate the composite return based on beginning assets, first determine thepercent of beginning composite assets represented by each portfolio; then determinethe weighted-average return for the month.
Beginning composite assets = 74.9 + 127.6 + 110.4 = 312.9
Portfolio A = 74.9312.9
= 0.239 = 23.9%
Portfolio B = 127.6312.9
= 0.408 = 40.8%
Portfolio C = 110.4312.9
= 0.353 = 35.3%
rComp = (0.0365 × 0.239) + (0.0192 × 0.408) + (0.0258 × 0.353) = 0.0257
= 2.57%
222 Solutions
C. To calculate the composite return based on beginning assets plus cash flows, first usethe denominator of the Modified Dietz formula to determine the percentage of totalbeginning assets plus weighted cash flows represented by each portfolio, and thencalculate the weighted-average return.
Beginning composite assets + Weighted cash flows = [74.9 + (7.5 × 0.613)]
+ [127.6 + (−15 × 0.742) + (−5 × 0.387)] + [110.4 + (15 × 0.387)] = 79.5
+ 114.535 + 116.205 = 310.24
Portfolio A = 79.5310.24
= 0.256 = 25.6%
Portfolio B = 114.535310.24
= 0.369 = 36.9%
Portfolio C = 116.205310.24
= 0.375 = 37.5%
rComp = (0.0365 × 0.256) + (0.0192 × 0.369) + (0.0258 × 0.375) = 0.0261
= 2.61%
10. The GIPS standards require that all of the compliant firm’s actual, fee-paying, discretionaryportfolios must be included in at least one composite. This requirement prevents firmsfrom presenting only the best-performing portfolios to prospective clients. A key term inthe Standards is ‘‘discretionary.’’ As defined in the Guidance Statement on CompositeDefinition, ‘‘Discretion is the ability of the firm to implement its intended strategy.’’Restrictions placed on the manager that impede the investment process to such an extentthat the strategy cannot be implemented may render the portfolio nondiscretionary. Afirm’s composites cannot include nondiscretionary portfolios (Provision II.3.A.1). Thefirm’s documented policies should include a definition of discretion, and the firm shouldreview the client’s investment guidelines periodically to confirm whether a portfolio isdiscretionary.
11. The GIPS standards prohibit including nondiscretionary portfolios in composites. IPSrestrictions do not necessarily render a portfolio nondiscretionary. It is up to the investmentmanagement firm to define discretion and to determine whether it has the discretion toimplement the investment strategy, given the restrictions of the IPS. In this case, however,it appears likely that SMERF’s policy requiring transactions to be approved in advanceby the Investment Committee and the pension plan’s liquidity needs prevent MidwestNational Bank from fully implementing the investment objective of achieving long-termcapital appreciation through active management. If so, Midwest National Bank shouldclassify the SMERF portfolio as nondiscretionary and exclude it from all composites.
12. The guiding principles for firms to consider when defining composites include thefollowing:
• Composites must be defined according to objective or strategy.• Composite definitions should be stated clearly.• Because the GIPS standards promote comparability among firms, composite definitions
ought to take into account how other firms define similar products.

Chapter 13 Global Investment Performance Standards 223
• Firms must consistently apply the criteria so that the composite includes all actual,fee-paying, discretionary portfolios that meet the composite definition.
• Firms cannot include portfolios with different investment strategies or objectives inthe same composite. Firms may need to create multiple composites to ensure that thiscircumstance does not occur.
The following hierarchy is useful for defining composites that represent the firm’sinvestment strategies:
Investment mandate. Portfolios with a similar strategy or product description; forexample, ‘‘Small-Cap Domestic Equity.’’
Asset classes. Composites based on broad asset classes; for example, equity, fixed-income, balanced, and the like.
Style or strategy. Composites defined by the style employed by the manager; forexample, value, growth, passive or sector.
Benchmarks. Composites based on a specific index or custom benchmark againstwhich the portfolio is managed.
Risk/return characteristics. Portfolios grouped together based on shared, distinctiverisk/return characteristics.
Other criteria should also be considered, including the extent and use of derivatives,hedging and/or leverage, tax status, type of client, instruments used, client characteristics,and portfolio types.
13. Balanced or multiasset composites may come in a wide range of equity and fixed-incomeexposure levels. The GIPS standards do not specify how many or what composites a firmshould create. Firms themselves must direct the creation of composites, including howmany to define and what portfolios they contain. Smith & Jones must determine howmany different balanced composites are needed to provide an adequate representationof the firm’s distinct investment strategies. The key to defining multiasset compositesis determining the base or strategic asset mix and the tactical asset ranges for eachcomposite. For example, if Smith & Jones manages four base strategies with 20 percent,40 percent, 60 percent, and 80 percent equity exposure and manages them within atightly constrained allowable range of 2 percent to 3 percent before rebalancing (that is,without tactical asset management), it could create four balanced composites that reflectthose base mixes. If Smith & Jones also manages four base strategies with 20 percent,40 percent, 60 percent, and 80 percent equity exposure with allowances for tactical assetallocation, eight composites could be created—one for each of the four base exposurelevels without tactical management and one for each of the four base exposures withtactical management.
14. Composites must include new portfolios on a consistent and timely basis after the portfoliocomes under management, unless specifically mandated by the client (Provision II.3.A.3).It is up to the firm to establish and document a policy that includes new portfoliosin composites as soon as possible. The firm may define composite-specific policies onthe timing of the inclusion of new portfolios, taking into account the time required toimplement the investment strategy represented by each composite. Once the policy hasbeen defined, it must be applied consistently.
15. As a general rule, a firm should not switch portfolios from one composite to another.Unless documented changes are made to a client’s objectives or investment guidelines,or the composite is redefined, portfolios should remain in the appropriate composite

224 Solutions
throughout their lives (Provision II.3.A.5). In cases of documented changes in the client’sobjectives or guidelines, a portfolio may be moved to a new composite but the historicalrecord must stay with the old composite. This standard is designed to prevent themovement of outperforming portfolios into and underperforming portfolios out of acomposite, thereby improving the composite’s reported performance.
Take, for example, a case in which a middle-aged client’s portfolio was included inan investment management firm’s balanced growth composite and all of the componentportfolios in the balanced growth composite (including the client’s) were invested in a 60percent large-cap value equity/40 percent intermediate-term municipal bond mix for the1996–2003 period. If the client retired in 2004 and instructed the manager to reduceequity exposure and emphasize tax-exempt income, the portfolio could at that point bemoved to another composite reflecting the new objective. The portfolio’s performancefrom 1996 through 2003 must remain in the balanced growth composite, and futureperformance would be included in an appropriate income-oriented composite. Anytime aportfolio is moved from one composite to another, the move must be based on a change inclient objectives, a change in directive from the client, or a redefinition of the composite,and the change and move must be clearly documented.
16. Under the Standards, there is no minimum or maximum number of portfolios that acomposite may include. The Standards require that firms disclose the number of portfoliosin each composite as of the end of each period presented, unless there are five or fewerportfolios.
17. The head of performance measurement is correct in stating that the GIPS standardsrequire the presenting firm to disclose significant events that may assist a prospective clientin interpreting the performance record (Provision II.4.A.19). Such events include, but arenot limited to, the loss of key personnel such as portfolio managers. In this case, the smallfirm lost not one but seven investment decision-makers. Shelbourne Capital Companymust include a disclosure that equity investment professionals left the firm, and it mustindicate when they left.
18. A. Under the beginning-of-period allocation method, cash is allocated to the equitysegment in proportion to stocks as a percentage of invested assets excluding cash.
Allocated CashBeginning = 8,514,010 × 96,425,70696,425,706 + 20,777,934
= 7,004,641
The equity segment return is the weighted-average return of the stock and cashcomponents.
rB ="
0.0079 × 96,425,70696,425,706 + 7,004,641
#
+"
0.0021 × 7,004,64196,425,706 + 7,004,641
#= 0.0075 = 0.75%
B. Under the strategic asset allocation method, the cash position associated with theequity segment is assumed to be total assets multiplied by the percentage differencebetween the strategic and the actual allocation to stocks. The strategic allocation tostocks is 80 percent, and the actual allocation to stocks is 76.7 percent.
Allocated CashStrategic = 125,717,650 × (0.800 − 0.767) = 4,148,682

Chapter 13 Global Investment Performance Standards 225
rS ="
0.0079 × 96,425,70696,425,706 + 4,148,682
#
+"
0.0021 × 4,148,68296,425,706 + 4,148,682
#= 0.0077 = 0.77%
19. A long-standing principle in performance record reporting is that performance belongsto the firm, not to the individual or individuals managing accounts for the firm. TheGIPS standards stipulate that performance track records of a past firm or affiliation mustbe linked to or used to represent the historical record of a new firm or new affiliationif (1) substantially all the investment decision-makers are employed by the new firm(i.e., research department, portfolio managers, and other relevant staff); (2) the staff anddecision-making process remain intact and independent within the new firm; and (3) thenew firm has records that document and support the reported performance (ProvisionII.5.A.4.a). Although a new team of equity managers joined Claiborne and Jackson,there is no evidence that the entire decision-making team, including analysts and traders,also joined Claiborne and Jackson. Indeed, three members of the old firm’s investmentstrategy committee did not join the new firm. It also appears that Claiborne and Jacksonmay lack data documenting and supporting the reported performance. Consequently,Claiborne and Jackson may not use the historical performance record that the new equityportfolio managers claim to have achieved while they were employed at ShelbourneCapital Company.
20. The GIPS standards recommend presenting performance gross of investment manage-ment and administrative fees and before taxes, except nonreclaimable withholding taxes(Provision II.5.B.1.a). Returns must be clearly labeled as gross of fees or net of fees(Provision II.4.A.6). In addition, the firm’s fee schedule must be presented (ProvisionII.4.A.12). When net-of-fees returns are presented, the firm must disclose if any otherfees are deducted in addition to direct trading expenses and investment management fees(Provision II.4.A.16). Philosophically, gross-of-fees returns are more directly comparableto benchmark returns and the returns earned by other firms, compared with net-of-feesreturns, which reflect the actual benefit the client has received from the firm’s managementof portfolio assets. There is no reason for Smith & Jones not to present properly calculatedand labeled net-of-fees returns, but management should additionally consider presentinggross-of-fees returns as recommended by the GIPS standards.
21. The GIPS standards require that at least five years of GIPS-compliant performance bereported (or a record for the period since firm inception if inception is less than fiveyears ago). After presenting five years of performance, the firm must present additionalannual performance up to 10 years (Provisions I.E.12.a–b and II.5.A.1.a). BentwoodInstitutional Asset Management could not drop the years prior to 2001 at the time Coopersuggests it do so. In addition to violating a specific requirement, Cooper’s suggestion wasnot in the spirit of fair representation and full disclosure of performance. Technically, thefirm will be able drop the early years of its composite presentation once it has establisheda 10-year GIPS-compliant record, as long as it continues to show at least the most recent10 years. For instance, it will be able to show just the 10 calendar years 2001–2010after the composite returns for 2010 become available. The GIPS standards are ethicalstandards, however, and it would be most appropriate for Bentwood to show its entireGIPS-compliant performance record.
22. The GIPS standards are ethical standards for fair representation and full disclosure ofinvestment performance. A primary purpose of a benchmark is to allow clients and
226 Solutions
prospective clients to conduct meaningful analysis of a portfolio’s performance over time.The GIPS standards define benchmark as ‘‘an independent rate of return (or hurdle rate)forming an objective test of the effective implementation of an investment strategy’’ (GIPSGlossary). The firm should accordingly select or construct a benchmark appropriate for theinvestment objectives, strategy, or style represented by the composite. The GIPS standardsrecognize that benchmarks evolve and that a new benchmark that better represents theintended investment strategy may become available. Changing benchmarks solely orprimarily to improve the firm’s relative performance, however, is not in keeping with thespirit of the GIPS standards. If a firm decides to change a composite benchmark, it mustdisclose when and why it made the change (Provision II.5.A.6). The GIPS standards donot prohibit a firm from making the change of benchmark retroactive, but normally itis most fitting for the change to become effective prospectively. Firms are encouraged tocontinue to present the old benchmark for prior periods. (GIPS Interpretations, questionand answer dated September 19, 2001.)
23. The GIPS standards require that the total return of a benchmark (or benchmarks)that reflects the investment strategy or mandate represented by the composite must bepresented for each annual period. If no benchmark is presented, the presentation mustexplain why not (Provision II.5.A.6). Benchmarks provide an objective test of a firm’simplementation of an investment strategy in the spirit of fair representation and fulldisclosure of investment results. Stating that most of the firm’s clients are uninterestedin performance relative to a benchmark does not give a compelling reason for failingto provide the independent returns of an appropriate benchmark. Renner, Williams &Woods should attempt to identify a benchmark that reflects the income-oriented strategyof the fixed-income composite.
24. High/low presents the highest and lowest portfolio returns in the composite, and thehigh/low range is the arithmetic difference between the return earned by those best-performing and the worst-performing portfolios in the composite. These values are easyto understand, but the presence of outliers may result in high/low measures that do notrepresent the normal dispersion of portfolio returns within the composite.
The interquartile range is the spread between the return of the portfolio at the 25thpercentile and the return of the portfolio at the 75th percentile of an ordered distributionof returns. It has the advantage of eliminating the impact of outliers, but prospectiveclients may be unfamiliar with this measure.
If returns are normally distributed, approximately two-thirds of the returns will fallwithin one standard deviation of the mean return. In this case, if the returns of theindividual portfolios are normally distributed, approximately two-thirds of the portfolioreturns will lie between 2.02 percent and 3.12 percent. This calculation is somewhatdifficult by hand, especially for a large number of portfolios, but spreadsheet softwaretypically includes a standard deviation routine. Standard deviation is a well-known andgenerally valid measure of dispersion.
25. A. The first step in calculating the capital return is to determine the capital employed.
CE = C0 +$
(CFi × wi)
CE = 8,000,000 + (1,000,000 × 0.51) = 8,510,000
The formula for capital return for a single period (in this case, the second quarter)reduces the change in market value by capital expenditures during the period (EC )

Chapter 13 Global Investment Performance Standards 227
and increases it by the proceeds of property sales (S).
rC = (MV1 − MV0) − EC + SCE
rC = 8,375,000 − 7,450,000 − 1,750,000 + 2,250,0008,510,000
= 0.1675 = 16.75%
B. The income return calculation requires reducing accrued investment income bynonrecoverable expenditures (ENR), interest on debt (INTD), and property taxes (TP ).
rI = INCA − ENR − INTD − TP
CE
rI = 75,000 − 200,000 − 137,500 − 20,0008,510,000
= −0.0332 = −3.32%
C. The total return for the quarter is the sum of the capital return and the income return.
rT = rC + rI
rT = 0.1675 + (−0.0332) = 0.1343 = 13.43%
26. Under the GIPS standards, a single verification report is issued with respect to the wholefirm. Verification cannot be carried out for a single composite, and the term ‘‘verification’’may never be applied to an individual composite (see Provisions III.A.1 and III.C). Aqualified, reputable verification firm will not accept an assignment from Renner, Williams& Woods to conduct verification only with regard to the firm’s equity and balancedaccount composites while excluding the fixed-income composites from the scope of theverification.
27. A. Anticipated income tax rate:
Federal income tax rate + [State income tax rate × (1 − Federal income tax rate)]
+ [City income tax rate × (1 − Federal income tax rate)]
= 0.172 + [0.043 × (1 − 0.172)] + [0.021 × (1 − 0.172)] = 0.225 = 22.5%
B. Pretax return:
rModDietz = 123,159,825 − 127,945,000 − (−8,950,000)
127,945,000 +%−8,950,000 × 30−17
30
&
= 4,164,825124,066,667
= 0.0336 = 3.36%
C. Preliquidation after-tax return:
Treal = (12,545,000 × 0.15) + (975,000 × 0.225) + (533,105 × 0.225)
= 2,221,074
rPLATModDietz = rModDietz − Treal
MV0 −!
(CFi × wi)

228 Solutions
rPLATModDietz = 0.0336 − 2,221,074124,066,667
= 0.0336 − 0.0179 = 0.0157 = 1.57%
D. To add back the hypothetical return effect of nondiscretionary asset sales, one mustfirst calculate the gain ratio (GR), the weighted-average capital gains tax rate, and theadjustment factor (F).
GR = Greal + Gunreal
MV1 + CFNetOut
Greal = 975,000 + 12,545,000 = 13,520,000
Gunreal = 123,159,825 − 85,676,400 = 37,483,425
CFNetOut = 8,950,000 − 533,105 = 8,416,895
GR = 13,520,000 + 37,483,425123,159,825 + 8,416,895
= 0.3876
The weighted-average capital gains tax rate is calculated by weighting the short-term capital gains tax rate in proportion to realized short-term capital gains as apercentage of total realized capital gains, and the long-term capital gains tax rate inproportion to realized long-term capital gains, as a percentage of total realized capitalgains:
Tcgr ="
0.225× 975,000975,000+12,545,000
#+
"0.15× 12,545,000
975,000+12,545,000
#
= 0.1554 = 15.54%
F = CFNetOut × Tcgr × GR
F = 8,416,895 × 0.1554 × 0.3876 = 506,975
Then the after-tax return adjusted for the impact of nondiscretionary capitalgains is
rAdjPLATModDietz = rPLATModDietz + FMV0 +
!(CFi × wi)
= 0.0157 + 506,975124,066,667
= 0.0157 + 0.0041 = 0.0198 = 1.98%
28. The report has a significant number of omissions and errors.Omissions that prevent the Bristol Capital Management performance report from
being GIPS compliant are as follows:
• The availability of a complete list and description of all of Bristol’s composites is notdisclosed as is required (Provision II.4.A.2).

Chapter 13 Global Investment Performance Standards 229
• The availability of additional information regarding policies for calculating and report-ing returns in compliance with the GIPS standards is not disclosed (Provision II.4.A.17).
• Although Bristol does disclose the use of derivatives, the firm has omitted the requireddescription of the extent of use, frequency, and characteristics of the instruments thatmust also be disclosed in sufficient detail to identify the risks (Provision II.4.A.5).
• If the firm has included non-fee-paying accounts in its composite, the percentage ofthe composite represented by these accounts must be disclosed as of the end of eachannual period (Provision II.5.A.7).
• The composite creation date must be disclosed (Provision II.4.A.24).• Because the composite represents a global investment strategy, the presentation must
include information about the treatment of withholding tax on dividends, interestincome, and capital gains (Provision II.4.A.7).
• A description of the composite’s strategy must be disclosed (Provision II.4.A.20).
Items included in the Bristol Capital Management performance report that are notcompliant with GIPS Standards are as follows:
• The GIPS standards state that performance periods of less than one year must not beannualized, as Bristol does for the first quarter of 2007 (Provision II.5.A.3).
• GIPS verification cannot be performed for a single composite as is stated in the notesto the Bristol report. Third-party verification is performed with respect to the entirefirm (Provisions III.A.1 and III.C).
• For periods beginning January 1, 2001, portfolios must be valued at least monthly.Bristol is valuing portfolios quarterly (Provision II.1.A.3).
• A firm must use the compliance statement as specified in the GIPS. There are noprovisions for partial compliance. If a firm does not meet all the GIPS requirements,then it is not in compliance with the GIPS standards. Bristol’s use of the ‘‘except for’’compliance statement violates the Standards (Provisions II.0.A.7–8).
• The firm must disclose which measure of composite dispersion is presented (ProvisionII.4.A.26).
• The GIPS standards state that accrual accounting must be used for fixed-incomesecurities and all other assets that accrue interest income (Provision II.1.A.6). Bristolstates that it uses cash-basis accounting for the recognition of interest income.

ABOUT THECFA PROGRAM
The Chartered Financial Analyst® designation (CFA®) is a globally recognized standardof excellence for measuring the competence and integrity of investment professionals. Toearn the CFA charter, candidates must successfully pass through the CFA Program, a globalgraduate-level self-study program that combines a broad curriculum with professional conductrequirements as preparation for a wide range of investment specialties.
Anchored by a practice-based curriculum, the CFA Program is focused on the knowledgeidentified by professionals as essential to the investment decision-making process. This bodyof knowledge maintains current relevance through a regular, extensive survey of practicingCFA charterholders across the globe. The curriculum covers 10 general topic areas rangingfrom equity and fixed-income analysis to portfolio management to corporate finance, all witha heavy emphasis on the application of ethics in professional practice. Known for its rigor andbreadth, the CFA Program curriculum highlights principles common to every market so thatprofessionals who earn the CFA designation have a thoroughly global investment perspectiveand a profound understanding of the global marketplace.
www.cfainstitute.org
230