MANAGERIAL ECONOMICS - CPA College of global studies
86
SEMESTER NOTES MANAGERIAL ECONOMICS FIRST t semester BCom COOPERATION & FINANCE Prepared by:- NIZAMUDHEEN KK Assistant professor CPA COLLEGE OF GLOBAL STUDIES, PUTHANATHANI
-
Upload
khangminh22 -
Category
Documents
-
view
1 -
download
0
Transcript of MANAGERIAL ECONOMICS - CPA College of global studies

SEMESTER NOTES
MANAGERIAL ECONOMICS
FIRSTt semester BCom COOPERATION & FINANCE
Prepared by:-
NIZAMUDHEEN KK
Assistant professor
CPA COLLEGE OF GLOBAL STUDIES, PUTHANATHANI

BCM1C01 MANAGERIAL ECONOMICS Lecture Hours per week: 5, Credits: 4
Internal: 20, External 80, Examination 2.5 Hours
Objectives:
The objective of the course is to acquaint students with the basic principles of micro and
macroeconomics for developing the understanding of theory of the firm, markets and the macro
environment, which would help them in managerial decision making processes.
Module I Managerial Economics:- – Definition and characteristics – Nature and Scope - Economics Vs
Managerial Economics - Decision making and forward planning – Relationship of managerial
economics with other disciplines - Basic economic tools in management economics – The role of
managerial economist. (10 Hours, 10 marks)
Module II
Theory of consumer behaviour: - Cardinal analysis - Law of diminishing marginal utility – consumer
surplus; Ordinal approach – indifference curve analysis – consumer equilibrium – income
consumption curve and price consumption curve – Hicksian decomposition of price effect in to
substitution effect and income effect – Demand curve for normal, inferior and ` giften goods –
concept of elasticity of demand – measurement of various elasticities – Elasticity of supply. (20
Hours, 20 marks)
Module III Market structure:-
a. Perfect competition: – profit maximization and equilibrium of firm and industry – short run and
long term supply curves – price and output determination.
b. Monopoly: – Price determination under monopoly – equilibrium of firm – comparison between
perfect competition and monopoly – price discrimination.
c. Monopolistic competition: price and output determination – product differentiation – comparison
with perfect competition – excess capacity under monopolistic competition.
d. Oligopoly: indeterminate pricing and output – classical models of oligopoly – price leadership -
collusive oligopoly – kinked demand curve. (20 Hours, 20 marks)
Module IV An overview of Indian economy - Indian economy since 1991 - Basic characteristics of Indian
economy - Factors that led to the opening up of Indian economy - Indian economy under WTO
regime - Issues in Indian economy: Problems of growth, unemployment, poverty, inequality in
income distribution, inflation – The role of parallel economy – The role of Government in a market
economy. (15 Hours, 15 Marks)
Module V Structure and direction of India‘s foreign trade and India‘s trade regulation and promotion -
Exchange rate policy – Intellectual Property Rights - Foreign capital and MNCs in India, Trade
reforms - An overview of Kerala economy - Trade and commerce in Kerala - Industrial development
of the state - the role of small scale industries in Kerala economy. (15 Hours, 15 marks)
Reference Books: 1. R.L. Varshney and K.L. Maheswari, Managerial Economics
2. Ahuja. HL; Business Economics, S. Chand & co.
3. D.N. Dwivedi, Managerial Economics
4. Dr. S. Sankaran, Managerial Economics
5. DM Mithani: Business Economics
6. Seth M L Text Book of Economic Theory

7. K K Dewett: Economic Theory
8. Dutt & Sundaram: Indian Economy
9. Petersen &. "Lewis: Managerial Economics
10. Mote V L peul. S & Gupta G S: Managerial Economics
11. H. Craig Petersen & W. Cris lewis: Managerial Economics
12. Dr. P.N. Reddy and H.R, Appanaiah : Essentials of Business Economics
13. Barry Keating and J. Holton Wilson: Managerial Economics

MODULE -1
INTRODUCTION
The term “economics” has been derived from the ancient Greek Word “Oikonomia”which means
‘household’.
Economics is a social science. It is called ‘social’ because it studies mankind of society.
It deals with aspects of human behavior. It is called science since it studies social problems from
a scientific point of view.
DEFINITIONS OF ECONOMICS (4 definitions)
Classical economists like Adam Smith, Ricardo, Mill Malthus and others; socialist economist
like Karl Marx; neo-classical economists like Alfred Marshall, AC Pigou and Lionel Robbins
and modern economists like JM Keynes,Samuelson and others have made considerable
contribution to the development of Economics. Hence a plethora of definitions are available in
connection with the subject matter of economics.
These are broadly divided into:-
A. Wealth Definition- by Adam smith
B. Welfare Definition – by Alfred Marshall
C. Scarcity Definition and
D. Growth Definition
A. Wealth Definition
Adam Smith defined economics in his book “An Enquiry into the Nature and Cause of Wealth
of Nation”
“Study of the nature and cause of national wealth”.
According to him, economics is the study of wealth- How wealth is produced and distributed.

Adam smith is called as “father of economics” and This definition is popularly called “Wealth
definition”.
B. Welfare Definition
Alfred Marshall defined economics in his book “Principles of Economics”( published in 1890)
According to him:-
“Wealth is simply a means to an end in all activities, the end being human welfare. He adds,
that economics “is on the one side a study of the wealth; and the other and more important
side, a part of the study of man”.
Marshall gave primary importance to man and secondary importance to wealth.
This definition is criticized on the grounds that welfare cannot be measured correctly and it was
ignored the valuable services like teachers, lawyers, singers etc (non-material welfare)
C. Scarcity Definition
Lionel Robbins defined economics in his book “The Nature and Significance of Economic
Science” in 1932.
According to him,
“Economics is the science which studies human behavior as a relationship between ends and
scares means which have alternative uses”.
He gave importance to four fundamental characters of human existence such as;
1. Unlimited wants- In his definition “ends” refers to human wants which are boundless or
unlimited.
2. Scarcity of means (Limited Resources) – the resources (time and money) at the disposal of a
person to satisfy his wants are limited.
3. Alternate uses of Scares means- Economic resources not only scarce but have alternate uses
also. So one has to make choice of uses.
4. The Economic Problem –when wants are unlimited, means are scarce and have alternate uses,
the economic problem arises. Hence we need to arrange wants in the order of urgency.
D. Modern Definition/ Growth definition
Lord J.M Keynes defined economics as the
“study of the administration of scares resources and the determinants of income and
employment”.

Prof. Samuelson recently given a definition based on growth aspects which is known as Growth
definition.
“Economics is the study of how people and society end up choosing, with or without the use of
money to employ scarce productive resources that could have alternative uses to produce
various commodities and distribute them for consumption, now or in the future, among
various persons or groups in society. Economics analyses the costs and the benefits of
improving patterns of resources use”.
MEANING AND DEFINITION OF MANAGERIAL ECONOMICS
Joel Dean in 1951 introduced first Managerial Economics as a subject through his book
“Managerial Economics”
Managerial economics bridges the gap between traditional economic theory and real business
practices in two ways.
Firstly, it provides number of tools and techniques to enable the manager to become more
competent to take decisions in real and practical situation.
Secondly, it serves as an integrating course to show the interaction between various areas in
which the firm operates.
DEFINITION
Spencer and Siegleman defined managerial Economics as
“The integration of economic theory with business practice for the purpose of facilitating
decision making and forward planning of management”
Managerial economics helps the managers to analyze the problems faced by the business unit
and to take vital decisions.
OBJECTIVES AND NEEDS OF MANAGERIAL ECONOMICS
The basic objective of managerial economics is to analyze the economic problems faced by the
business.
Other objectives are :-
1. To integrate economic theory with business practice.
2. To apply economic concepts and principles to solve business problems.
3. To allocate the scares resources in the optimal manner.
4. To make all-round development of a firm.

5. To minimize risk and uncertainty
6. To helps in demand and sales forecasting.
7. To help in profit maximization.
8. To help to achieve the other objectives of the firm like industry leadership, expansion,
Implementation of policies etc.
NEED AND IMPORTANCE OF MANAGERIAL ECONOMICS
In order to solve the problems of decision making, data are to be collected and analyzed in the
light of business objectives. Managerial economics provides help in this area.
The importance of Managerial economics given in the following points:
1. It provides tool and techniques for managerial decision making.
2. It gives answers to the basic problems of business management.
3. It supplies data for analysis and forecasting.
4. It provides tools for demand forecasting and profit planning.
5. It guides the managerial economist.
6. It helps in formulating business policies.
7. It assists the management to know internal and external factors influence the business.
AREAS OF BUSINESS DECISION MAKING
a) Selection of product.
b) Selection of suitable product mix.
c) Selection of method of production.
d) Product line decision.
e) Determination of price and quantity.
f) Decision on promotional strategy.
g) Optimum input combination.
h) Allocation of resources.
i) Replacement decision.

j) Make or buy decision.
k) Shut down decision.
l) Decision on export and import.
m) Location decision.
n) Capital budgeting.
SCOPE OF MANAGERIAL ECONOMICS
The scope of managerial economics refers to its area of study.
Economics is dealing the decisional problems of both business and non-business organizations,
Business economics deals only the problems of business organizations.
Business economics giving solution to the problems of a business unit or profit oriented unit.
Managerial economics giving solution to the problems of non-profit organizations like schools,
hospital etc., also.
The scope covers two areas of decision making
(A) operational or internal issues and
(B) Environmental or external issues.
A) Operational/internal issues
These issues are those which arise within the business organization and are under the control of
the management.
They pertains to simple questions of what to produce, when to produce, how much to produce
and for which category of consumers.
The following aspects may be said to be fall under internal issues;-
1. Demand analysis and Forecasting: - A study of the determinants of demand is necessary for
forecasting future demand of the product.
2. Cost analysis: - The factors causing variation of cost must be found out and allowed for it
management to arrive at cost estimates. This will helps for more effective planning and sound
pricing practices.
3. Pricing Decisions: The pricing is an important area of managerial economics. Theories
regarding price fixation helps the firm to solve the price fixation problems.

4. Profit Analysis: - Profit planning become necessary under the conditions of uncertainty.
5. Capital budgeting: - The manager has to calculate correctly the profitability of investment
and to properly allocate the capital.
Success of the firm depends upon the proper analysis of capital project and selecting the best
one.
6. Production and supply analysis: - Production analysis is proceeds in physical terms while
cost analysis proceeds in monitory term.
Important aspects of supply analysis are; supply schedule, curves and functions, law of supply,
elasticity of supply and factors influencing supply.
B) Environmental or external issues
It refers to the general business environment in which the firm operates.
A study of economic environment should include the types of economic system in the country.
1. The general trend in production, employment, income, prices, savings and investments
2. Trends in the working of financial institutions like banks, financial corporations, insurance
companies etc..
3. Magnitude and trends in foreign trade.
4. Trends in labour and capital market.
5. Government economic policies viz., industrial policy, monitory policies, fiscal policy, price
policy etc…
DIFFERENCE BETWEEN ECONOMICS AND MANAGERIAL ECONOMICS
ECONOMICS MANAGERIAL ECONOMICS
1. Dealing both micro and macro aspects
2. Both positive and normative science.
3. Deals with theoretical aspects
4. Study both the firm and individual.
5. Wide scope
1. Dealing only micro aspects
2. Only a normative science.
3. Deals with practical aspects.
4. Study the problems of firm only.
5. Narrow scope.

FUNCTIONS AND RESPONSIBILITIES OF MANAGERIAL ECONOMIST
A managerial economist can play an important role by assisting the management to solve the
difficult problems of decision making and forward planning.
Following are the important specific functions of managerial economist;
1. Sales forecasting.
2. Market research.
3. Production scheduling
4. Economic analysis of competing industry.
5. Investment appraisal.
6. Security management analysis.
7. Advise on foreign exchange management.
8. Advice on trade.
9. Environmental forecasting.
10. Economic analysis of agriculture Sales forecasting
The responsibilities of managerial economists are the following;
1. To bring reasonable profit to the company.
2. To make accurate forecast.
3. To establish and maintain contact with individual and data sources.
4. To keep the management informed of all the possible economic trends.
5. To prepare speeches for business executives.
6. To participate in public debates
7. To earn full status in the business team.
DECISION MAKING
Decision making is an integral part of modern management.

Decision making is the process of selecting one action from two or more alternative course of
actions.
Resources such as land, labour and capital are limited and can be employed in alternative uses,
so the question of choice is arises.
AREAS OF DECISION MAKING
a) Selection of product.
b) Selection of suitable product mix.
c) Selection of method of production.
d) Product line decision.
e) Determination of price and quantity.
f) Decision on promotional strategy.
g) Optimum input combination.
h) Allocation of resources.
i) Replacement decision.
j) Make or buy decision.
k) Shut down decision.
l) Decision on export and import.
m) Location decision.
n) Capital budgeting.
MODULE – II
CONSUMER BEHAVIOUR
Consumer behaviour is the study of consumer while engaged in the process of consumption.
It tells us how a consumer with his limited resources purchases different varieties of goods and
services in the market.

Theories of Consumer Behaviour The basic objective of a consumer is to get maximum satisfaction from consuming goods and
services. This is possible when he reaches the position of equilibrium.
It is necessary to find out how a consumer allocates his income on various goods so as to get
maximum satisfaction or to reach equilibrium.
Various theories (or approaches) have been developed to explain the behaviour of consumers.
There are three approaches to study the consumer behaviour.
They are:
1. Cardinal utility approach
2. Ordinal utility approach
3. Revealed preference theory of Paul Samuelson.
Cardinal Utility Approach (Cardinal Analysis)
The cardinal utility theory was developed by classical economists (Gossen of Germany, William
Stanley Jevons of England, Leon Walras of France and Karl Menger of Austria).
Neoclassical economists, particularly Alfred Marshal made significant refinements in the
cardinal
utility theory. Hence cardinal utility theory is also known as neo-classical utility theory or
Marshallian utility theory.
The cardinal utility theory states that utility is measurable just as height, weight, length,
temperature etc.
According to cardinal utility theory utility is measurable cardinally or quantitatively.
It means utility can be measured in cardinal numbers like 1, 2, 3 and so on.
Boulding suggested another unit of measurement of utility. This unit of measurement is called
'utils'. Thus utility can be measured in utils. For example, an apple possesses 10 utils and an
orange possesses 5 utils. Here the utility of an apple is twice that of an orange.
Assumptions of Cardinal Utility Theory
The cardinal utility approach is based on the following assumptions:
1. Utility is measurable in numerical terms.
2. Every consumer is rational.
3. Every rational consumer intends to maximize his or her satisfaction from his or her Money
income.
4. The consumer has limited income to spend on the goods and services he or she chooses
consume.
5. Utility gained from the successive units of a commodity goes on diminishing.
In other words, marginal utility of a commodity diminishes as the consumer acquires more
and
more units of a commodity.
6. The marginal utility of money remains constant.
7. The utilities are independent (i.e, the commodities are neither substitutes or complements).

8. Utility derived from various goods and services consumed by a consumer can be added
together to obtain the total utility.
Defects or Limitations of Marshallian Utility Analysis (Cardinal Utility Approach)
The cardinal utility approach has the following limitations or weaknesses:
1. Utility is a subjective and psychological concept. Hence, it cannot be measured
cardinally.
2. The cardinal approach assumes that the utility depends upon that commodity alone (ie.,
utilities are independent). This assumption is not correct. In actual life, utility depends
upon the availability of substitutes and complements.
3. The assumption that the marginal utility of money remains constant is wrong. As the
consumer's money stock increases, the marginal utility of money decreases. So, money
cannot be used as a measuring rod.
4. Money is not a correct and perfect measure of utility. This is because the value of money
often changes.
5. The assumption that man is rational is not correct. No consumers compare the utility and
disutility from each unit of a commodity while buying it. Further, due to ignorance or
advertisement, the consumer may be forced to choose a wrong them.
6. The cardinal approach does not study income effect, substitution effect and price effect.
7. The approach fails to clarify the study of inferior and Giffen goods.
8. The cardinal theory is based on a number of unrealistic assumptions. In other words, the
theory assumes too much but explains too little.
Consumer's Equilibrium in terms of the Utility Analysis
The objective of every consumer is to get maximum utility or satisfaction from spending his or
her limited income. He would like to spend his or her limited income on a commodity or several
commodities in such a way as to get maximum satisfaction (total utility).
When he gets maximum satisfaction, he is said to be in equilibrium. In short, the position of
maximum satisfaction implies consumer's equilibrium.
This can be determined with the help of three fundamental laws-
(1) Law of diminishing marginal utility, (single commodity)
(2) Law of equimarginal utility (two or more commodities), and
(3) Concept of consumer surplus.
In fact, the above three laws fall under cardinal utility approach to the theory of consumer
behaviour. Here we discuss only law of diminishing marginal utility and concept of consumer
surplus.
Law of Diminishing Marginal Utility
This is an important law of utility.

This law explains human behaviour (consumer behaivour) in relation to the consumption of a
commodity.
Law of Diminishing Marginal Utility states that as a consumer consumes more and more of a
commodity, the utility derived by him from every subsequent unit goes on falling
(diminishing).
It is the experience of every consumer that as he goes on consuming a particular commodity;
each successive unit gives him lesser and lesser satisfaction.
In other words, the total utility goes on increasing, but at diminishing rate.
Marshall defined it as "the additional benefit which a person derives from a given increase of his
stock of a thing diminishes with every increase in stock that he already has".
A German economist H.H. Gossen was the first to explain this law.
Hence it is also known as Gossen's first law of consumption.
The law states that from the first unit, an individual gets the greatest satisfaction.
For example,
Let us assume that a man is very hungry. In order to satisfy his hunger, he goes on eating the
mangoes one after another. The first mango gives him the greatest amount of satisfaction or
utility, the second mango gives him slightly less satisfaction, the third mango gives him still less
utility and so on. Ultimately he may reach a stage where he may refuse to eat any more mangoes
because at that stage he might have actually derived disutility. In this way, the utility goes on
diminishing as we consume more and more of a commodity.
The following table shows how the marginal utility goes on diminishing when we consume
increasing number of mangoes.
No. of Mangoes Total Utility Marginal Utility
1 5 5
2 9 4
3
12 3
4
14 2
5
15 1
6
15 0
7 14 -1

The above table shows that, when we eat the first mango, we get the greatest amount of utility (5
units). But the consumption of the second mango yields us only 4 units of marginal utility,
though total utility goes up to 9 units. When we consume the third mango we deserve 12 units of
total utility, but the marginal utility further diminished to 3 units. So, as we go on consuming
more and more mangoes, the total utility derived goes on increasing but the marginal utility goes
on diminishing. From the first mango to fifth mango the total utility increases from 5 to 15 units.
But the marginal utility goes on diminishing from 5 to 1 unit. The six mangos do not yield any
marginal utility. So we do not consume the sixth mango at all. The seventh mango gives us
negative utility (-1). Hence a rational consumer goes on consuming up to fifth mango (marginal
unit) and stops further consumption after this limit.
The law of Diminishing Marginal Utility can be described through the following diagram:
It is clear from the above graph that as the units of mango increase, the total utility increases but
at a decreasing rate. However at 'S' the total utility curve becomes flat indicating zero marginal
utility i.e. zero utility from the 6th unit. It implies that at 'S' the slope is zero indicating saturation
point. From the graph it is clear that total utility is maximum when marginal utility is zero. At the
6th unit the consumer stops further consumption. If he consumes the 7th unit, he will derive
negative utility. Thus at 6th unit of consumption, he enjoys the maximum utility. This is the
consumer's equilibrium.
Relation Between Marginal Utility and Total Utility
The relation between marginal utility and total utility as indicated by the above chart and graph
can be stated as follows:

Marginal Utility Total Utility
1. Declines 1. Increases but at a diminishing rate
2. Reaches zero 2. Reaches maximum
3. Becomes negative 3. Declines from the maximum
Consumer's Surplus
The concept of Consumer Surplus stems from the demand curve. It was originally developed by
the French engineer-economist A.J.Dupuit in 1844. Marshall refined the concept in his book
"Principles of Economics". Marshall developed the concept and gave definite shape to it.
Recently, Prof. Boulding named it as "Buyer's Surplus". Today most economists believe that the
concept of Consumer's Surplus is a product from the fertile brain of Marshall.
There are certain commodities which are highly useful but they are relatively cheap. Newspaper,
salt, match box, post card etc. are some classic examples. For these commodities we are often
prepared to pay a higher price than what we actually pay.
Thus we get extra or surplus satisfaction over and above the price we pay. This is called
Consumer's Surplus. For instance, a post card is priced 50 paise, but we are prepared to pay R.
1.50 for it rather than go without it. Then if we actually pay 50 paise and purchase it we may say
that we get a surplus satisfaction to the extent of Rs.1 (1.50-0.50). So Rs. 1 is termed as
consumer's surplus by Marshall.
According to Marshall, "Consumer's Surplus is the excess of the price which we would be
willing to pay rather than go without the thing over what we actually pay is the economic
measure of this surplus satisfaction".
Prof. Samuelson defines it thus:
"The gap between the total utility of a good and its total market value is called consumer's
surplus".
In short,
Consumer's surplus = What we are prepared to pay - What we actually pay
Or
Total utility - Total amount spent
or
Total utility - (Market price x Quantity purchased)
The concept of consumer's surplus can be explained with an illustration and a diagram. The
following table shows how the consumer gets surplus satisfaction. The market price is Rs. 2 per
orange.
Orange
(Number)
Marginal Utility
(Price willing to pay)
Market Price
(Amt. spent)
Consumer's Surplus

1
2
3
4
5
6
5
4
3
2
2
2
2
2
2
4
3
2
1
0
20 10 10
Consumer's Surplus = Total utility - Total amount spent
= 20 -10 = 10
It is clear that the consumer is willing to pay Rs. 6 for the first orange since he gets utility equal
to Rs.6. But he actually pays Rs.2 for it because the price prevailing in the market is Rs.2.
Therefore, he gets extra satisfaction of (6-2=4) Rs. 4 from the first orange. Similarly we can
calculated the consumer's surplus from the second, third, fourth and fifth oranges. The second
orange brings a consumer surplus of Rs. 3 but it is less than the first one does. This is so because
the marginal utility diminishes. As he buys more and more the marginal utility goes on falling
and hence the consumer's surplus also diminishes.
The consumer is willing to pay in all Rs. 20 for all 5 oranges because he gets total utility of 20
from the five oranges. But since the market price is Rs. 2 per orange, the consumer pays the
same price for all the five oranges. Thus he pays (5x2) Rs.10. Therefore the surplus satisfaction
is equal to Total utility - (Market Price x Qty)=20 - (2x5) = 10.
The above illustration is shown in the following diagram.

MP or OQ shows the market price per orange. It is same for all units (i.e Rs.2). OM is the
quantity purchased when price is equal to marginal utility. The total amount paid is therefore OM
x MP, i.e, OMPQ (total price paid for all five oranges). But total satisfaction derived will be
equal to the total area OMPQ + the shaded area. Therefore the shaded area represents consumer's
surplus (4+3+2+1). For the fifth orange, there is no consumer surplus. This is because the
marginal utility (price willing to pay) is equal to the actual price.
The concept of consumer's surplus is based on the law of DMU. As we go on purchasing more
and more oranges, the marginal utility goes on diminishing. We stop purchasing when the price
we have to pay is equal to the marginal utility. The marginal utility of the earlier oranges will be
more than the price. Therefore the consumer gets more satisfaction than the price that he pays for
them. This is how the consumer's surplus arises.
Assumptions of the Theory of Consumer Surplus
Marshall's concept of consumer surplus is based on the following assumptions:
1. Utility can be measured.
2. The marginal utility of money to consumer remains constant.
3. The commodity has no substitute.
4. The income, taste and fashion of consumer remains constant.
5. The utility of a commodity depends upon the quantity of that commodity alone. For example,
the utility derived from Coca Cola depends only on its quantity. The quantity of Pepsi
does not affect it.
6. This theory is applicable only if the law of DMU is valid.
Ordinal Utility Approach (Ordinal Analysis)

The modern economists have discarded the concept of cardinal utility. Instead they have used the
concept of ordinal utility for analyzing consumer behaviour.
The ordinal utility approach to the theory of consumer behaviour is based on the idea that utility
is not measurable in monetaryterms. It is only comparable by ranking the level of satisfaction.
This means it is always possible for a consumer to say whether a commodity is more or less or
equally useful as compared to another. For example, a consumer may not be able to say that an
ice cream gives 5 utils and chocolate gives 2 utils. But he or she can always say whether
chocolate gives more or less utility that ice cream. This assumption forms the basis of the ordinal
theory of consumer behaviour.
Concept of Ordinality: The numbers 1, 2, 3 etc. are cardinal numbers. The number 2 for
example is twice the number 1, the number 9 is thrice the number 3 and so on. In contrast, the1st,
2nd, 3rd etc. are ordinal numbers. Such numbers are ordered, or ranked. There is no way of
knowing, just from the ranking, what the size relation of numbers is. The 2nd may or may not be
twice as big as the 1st.
Ordinal Utility Approach (Indifference Curve Analysis or Technique)
The modern economists believe that utility is subjective. It is a psychological concept.
Hence it is not possible to measure utility quantitatively. The modern economists developed an
alternative approach to analyse consumer behaviour. This alternative approach is Indifference
curve Theory.
The 'Indifference Curve Technique' or the 'Ordinal Utility Analysis' was first introduced by
English economist Edgeworth in 1881. An Italian economist Pareto refined Edgeworth's concept
in 1906. It was further refined by Russian economist, Slustky in 1915. It was given perfection by
Prof.J.R. Hicks and R.G.D. Allen of the Cambridge University in 1934.
According to Indifference Curve Analysis, utility is not measurable in cardinal numbers.
It is measurable ordinally. This means utility is measured as the level of satisfaction and not the
amount of satisfaction. Consumers can only say whether a good or a combination of goods give
him or her greater, less, or equal satisfaction (cannot say 'how much greater or less). One can
simply rank the goods or combinations of goods in the order of preferences.
For example, there are two goods, say, apple and orange. Once can only say that apple is
preferred to orange but, he or she cannot say by 'how much'. It may also happen that there can be
some combinations of two or more goods that give the same level of satisfaction. This means the
consumer is indifferent (no combination gives greater or less satisfaction i.e., all combinations
give equal satisfaction).
Meaning and Nature of Indifference Curve The basic instrument of Hicks - Allen ordinal analysis of demand is the indifference curve. Every
consumer makes his purchases according to his scale of preferences. He prepares several lists of
goods in order of preference or importance. Each list contains several alternative combinations of
goods which give the same total satisfaction, but the amount of total satisfaction yielded by one
list is different from that yielded by another list.

Let us give ordinal numbers to these lists arranged in the order of preferences as First, Second,
Third and so on. Therefore, the second list yields more satisfaction than the first list. The third
list gives more satisfaction than the second one and so one. Of course the consumer would not be
able to afford to buy all the combinations contained in a single list or all the different lists that he
prepares. This is because his income is limited. But from the lists, he can say which list or which
groups or combinations would yield greater satisfaction or lower satisfaction or the same level of
satisfaction.
If all combinations of two or more goods give the same level of satisfaction, the consumer gives
equal preference to all such combinations. In such a situation, the consumer does not bother
about the selection of a particular combination. This is because he gets the same total utility
whether he chooses one or the other of such combinations. If he chooses one combination, he is
indifferent about the other combinations. This can be shown graphically with the help of a curve.
Such a curve is known as indifference curve.
Thus indifference curve may be defined as a curve which shows number of alternative
combinations of two or more goods which yield the same level of satisfaction to the consumer.
Let us explain the indifference curve analysis with the help of an indifference schedule and
curve.
Indifference Schedule: It is a schedule showing different combinations of two or more commodities which yield the
same level of satisfaction. For example, a consumer buys two commodities, apple and orange.
Let us make two combinations-
Combination A consists of 1 unit of apple and 20 units of orange.
Combination B consists of 2 units of apple and 15 units of orange.
If a consumer is asked to give his preference, it may by any of the three:
1) He prefers combination A to B, or
2) He prefers combination B to A, or
3) Combinations A and B are equally preferable.
In the 3rd case he is indifferent between combinations A and B. This is because both the
combinations are yielding the same level of satisfaction. In the first and second cases, he has
given a clear preference. But in the third case he is indifferent. This means both combinations are
preferable. There may be a series of such combinations giving the same level of satisfaction.
These can be tabulated. Such tabulation or list is known as indifference schedule.
An indifference schedule is given below:
Combination Units of Apple Units of Orange
A 1 20
B 2 15

C 3 11
D 4 8
E 5 6
The above indifference schedule shows five combinations of apples and oranges. Each one of
these combinations yields the same level of satisfaction to the consumer. Therefore, the
consumer can choose any of these alternative combinations.
If the combinations of the indifference schedules are represented on a diagram, we shall get a
line known as indifference curve. This is shown below:
In the above graph, apple is measured on X axis and orange on the Y axis. The various
combinations are plotted in the graph. The plotted points are joined by a line. This line becomes
an indifference curve (IC). The points A, B, C, D and E are called locus points. These points
represent the five combinations which give the same level of satisfaction. The indifference curve
may be rightly called as iso-utility curve.
Assumptions of Indifference Curve Analysis
Indifference curve analysis is based on the following assumptions:
1. The consumer is rational
2. Consumer purchases a group or combination of two goods.
3. Consumer has full knowledge about the market conditions.
4. Utility cannot be measured cardinally but can be expressed ordinally.
5. Marginal utility of money does not remain constant.
6. The preference of consumers is consistent.

1. Consumer's preference and indifference are transitive. It means if a consumer prefers A to
B and B to C, then A is preferable to C. or, if he treats A = B and B =C, he must treat A=C.
2. The consumer can arrange the combinations of goods in a scale of preference. The scale of
preference is a set of alternative combinations of a number of goods from which the consumer
has to choose the best combination.
Marginal Rate of Substitution
The concept of marginal rate of substitution is an important concept under indifference curve
analysis. It is the rate at which consumer substitutes one commodity for the other.
In order to understand this, let us go back to our Indifference Schedule. In this schedule, we can
see that initially the consumer substitutes 1 apple for 5 oranges. His level of satisfaction remains
the same. Thus here, the rate of substitution between apple and orange is 5:1 (or simply 5). This
is the rate of substitution.
Again when the consumer goes to combination C, 4 units of oranges are exchanged for one unit
of apple. Here marginal rate of substitution is 4:1 (or 4). We can find for other levels also as
shown below:
Combination Apple Orange MRS
A 1 20 -
B 2 15 5
C 3 11 4
D 4 8 3
E 5 6 2
Diminishing Marginal Rate of Substitution
It may be noted that the MRS is always diminishing.
It means that as we add one more unit of one commodity, we forego less and less of the other,
the satisfaction remaining the same.
To understand this, let us consider the indifference schedule. Initially the consumer was ready to
give up 5 oranges for one apple. The MRS between orange and apple (MRSao) was 5.
In the next round, he is ready to exchange only 4 oranges for one apple. Thus the MRSao is 4. In
the next round, he is ready to exchange only 4 oranges for one apple. Thus the MRSao is 3. In
the next round he forgoes only 2 oranges for one apple (MRSao=2). Thus we can see that
MRSao is diminishing.
Therefore, he does not want more of apples now and he is not ready to give up more number of
oranges for apple. Third, the goods are not perfect substitutes of each other in the satisfaction of
a particular want. If they are perfect substitutes, the MRS will remain constant.
In short, the MRS is higher in the beginning but goes on diminishing gradually and finally it will
tend to be horizontal
Properties (Characteristics) of Indifference Curve
Indifference curve has the following properties:

1. The indifference curve slopes downwards from left to right. This is because of the
operation of the principle of diminishing marginal rate of substitution.
2. The indifference curve is convex to the point of origin. This is also because of the
operation of the principle of DMRS
3. The indifference curve has a negative slope. This is because when the amount of one
commodity is increased, the amount of the other must be reduced, in order to maintain
the same level of satisfaction. The portions AC and D of the indifference curve have
positive slope.
Consumer's Equilibrium The aim of every consumer is to get maximum satisfaction from the goods to be purchased.
Therefore, he wants to reach the highest possible indifference curve. But there are certain limits.
These limits are relating to his money income and the prices of the goods. The budget line
describes these limits.
Income Effect (or Change in Income) and Income Consumption Curve (ICC) In the difference curve analysis we have made two assumptions.
1) The income of the consumer remains constant.
2) The prices of two goods remain constant. However, in reality, these assumptions do not
hold good.
This means that these assumptions can change in reality. Changes in income and price will
affect the consumer's equilibrium. The effect of change in consumer's income on his total
satisfaction or demand (purchase) of two commodities (prices and other factors remaining
constant) is known as income effect.
In short, the effect of a change in income on quantity demanded or consumer's equilibrium is
called income effect.
Income Consumption Curve and the Nature of the Commodity
The effect of changes in income on the consumption (income effect) of different kinds of
commodities is different. It may be positive or negative or even neutral.
In fact, the nature of a commodity determines whether the effect is positive or negative. When
the ICC slopes upward, the income effect is positive (the ICC has positive slope) to both
commodities. This means that the consumer increases the consumption of both commodities with
the increase in his income.
The income effect is positive (ICC is upward sloping) in case both goods are normal goods are
normal goods.
But sometimes, the income effect may be positive for one commodity and negative for another.
The income effect of a commodity is positive when the consumer purchases more of that
commodity with the increase in income. This is a normal good.

If income effect of a commodity is negative, it will mean that consumer purchases less of that
good as the income increases. Such goods are inferior goods. Examples are maize, jowar, bajra,
low quality clothes etc.
When the income of the consumer increases he likes to spend more on normal goods and less on
inferior goods. That is, he substitutes superior (normal) goods in place of inferior goods. This
may be discussed below.
Negative Income Effect: The Case of Inferior Goods
(a) When Good X is Inferior:
This may be explained with the help of a graph
In the graph, the ICC begins to move towards Y axis on which we measure good Y. This shows
that
after a certain point, the consumer purchases less of good X and purchases more and more of
good Y as the income increases. Here good X is inferior good and good Y is normal or superior
good. In this case income effect is positive for good Y (superior or normal) and income effect is
negative for good X (inferior). Thus, in case of inferior good, the ICC will at first be upward
rising and then backward bending (slopes backward, i.e., slopes upward to the left or bends back
towards Y axis). This is shown in figure.
(b) When Good Y is inferior:
When good X is normal and good Y is inferior, the ICC will slope towards good X. This is
shown in in the graph

In the given graph, ICC slopes downwards to the right and bends towards good X. It shows that
good X is purchased more and good Y is purchased less with the increased income.
Here, income effect is positive (because both income and demand are increased) in the case of
good X and negative in case of good Y.
The slope of the ICC will, however, depend upon the income elasticity for these two goods. If
income elasticity for Y is high and that of X is low, the ICC will be sloping upwards to the left
more nearer the Y axis. If income elasticity for X is high and that of Y is low, the ICC will be
sloping upwards to the right more nearer the X axis.
The slope of the income consumption curve gives an indication of income elasticity. If the curve
is relatively flat, income elasticity is high. If it has an angle of 45o, income elasticity is unity.
If the curve is steep, income elasticity is low. If the curve is vertical line, income elasticity is
zero.
If the curve has negative slope, income elasticity is negative.
It may be noted here that both the commodities cannot be negative at the same time. The reason
for this is that, when one commodity is inferior, the consumer spends the excess of his income on
the consumption of the other commodity. So the consumer will not be able to spend his total
income when both commodities are inferior. In other words, if both the goods are inferior, there
will be decrease in expenditure on the two goods resulting in disequilibrium. Here the consumer
will be below the budget line. He will not be reaching in optimum position of equilibrium. This
is based on the assumption that the consumer spends his entire income on the purchase of two
commodities. It may be noted that the consumer may consume two normal or luxury goods.

Zero Income Effect (Neutral Income Effect) The income effect is zero for those commodities which the consumer purchases in fixed
quantities. Examples are drugs, salt etc. He wouldn't buy more when income increases. Similarly
he wouldn't buy less when the income decreases. This means that he would buy such
commodities in fixed quantities whether the income increases or falls. In the case of such
commodities there is no income effect.
The Price Effect (or Change in Price) and Price Consumption Curve It is possible that the income of the consumer remains the same, but the prices of commodities
may change. When the price of one commodity changes (say X), the equilibrium of the
consumer also changes. The slope of the budget line of the consumer also shifts.
When the price of a good falls the real income of the consumer increases. Then the consumer
would be better off (he becomes 'rich').
Accordingly, he would shift to a higher indifference curve. On the other hand, if the price of a
good rises, the real income of the consumer falls. Then he would be worse off. Accordingly, he
would shift to a lower indifference curve. The effect of a change in price of a good on the
quantity of its purchase is known as price effect (the price of other good and the income of the
consumer remain the same). The price effect is shown in the following
diagram:
In the diagram, commodity X is taken on X axis and commodity Y is taken on Y axis.
Money income of the consumer remains constant. The price line is AB. The consumer reaches at
the equilibrium point E. At that point the price line AB is tangent to indifference curve IC1. In
other words, the equilibrium occurs at a point where the price or budget line touches the highest
possible indifference curve. At this point, he buys OM quantity of X and ON quantity of Y.
Suppose the price of X falls. Now the real income of the consumer increases (the price of
commodity Y and the money income of the consumer remain the same). The consumer shall be
able to buy more quantity of X. Whenever there is change in the price of commodity X, the
budget or price line changes its slope. That is, with every change in the price of commodity X,
the price line shifts. As already stated, the money income of the consumer remains unchanged
and the price of Y also remains unchanged. Hence, the price line shall not be parallel to the old
price line (only a shift in price line but not parallel). It starts from point A.
This indicates that with the money income of the consumer and the price of Y remaining
constant, the consumer shall not be able to buy more quantity of Y. He shall buy more of X only
because the price of X has fallen. Here, when the price of X falls, his real income increases.
hence, his price line shift to AB1. Now the consumer reaches at a new equilibrium point E1. At
this point, he buys OM1 quantity of X and ON1 quantity of Y. Suppose the price of X falls
further. Again, the real income of the consumer increases. The price line again shifts to AB2.
The new point of equilibrium is E2 where the budget line AB2 is tangent to the higher
indifference curve IC3. At this point, the quantity of purchase of X is OM2 and that of Y is ON2.
When we join all successive points of equilibrium, we get a curve. This curve is called price
consumption curve (PCC). It is also called price offer curve. Thus, the curve connecting different

equilibrium points when the price of only one commodity changes and the price of other
commodity and the money income remain the same is known as PCC. It shows how the change
in price of good affects the consumer's purchases or equilibrium. From the graph it is clear that
the consumer will get higher level of satisfaction from higher indifference curve and feel better
off.
PCC may have different shapes and slopes. If price of X falls, the demand for Y may increase,
may decrease or may remain constant. If the demand for Y increases the PCC will be upward
sloping. If the demand for Y decreases, the PCC will be downward sloping. If the demand for Y
remains constant, the PCC is horizontal. These different shapes of PCC may be explained below.
Downward
Sloping PCC
In the given graph (Fg.23) the PCC is a downward sloping curve. In this case, the consumer
purchases larger quantity of X and smaller quantity of Y when the price of X falls. Thus, the
demand for X is elastic. Elasticity is greater than one.
Upward Sloping PCC
In the case of upward sloping PCC, we can see that the quantity purchased of both X and
Y rises due to fall in the price of X. We get upward sloping PCC for commodity X when the
demand for X is less elasticity (less than one) as shown in figure.
Backward Sloping PCC
When the PCC for commodity X is backward sloping (as shown in figure), we can find that the
consumer purchases less and less of X and more and more of Y due to fall in the price of X.
This happens in the case of Giffen goods.
Horizontal PCC
Horizontal PCC for X indicates that when the price of X falls, its quantity purchased increases
proportionately, while quantity purchased of Y remains at the same level. In this case, price
elasticity of demand for X = 1 (unit elasticity)
PCC with Varying Slope
Generally PCC has different slopes at different price ranges. At higher price levels, it usually
slopes downwards. Thereafter, it may have a horizontal shape for some price ranges.
Ultimately it slopes upwards for further falling in price. APCC with different shapes and slopes
is
illustrated figure.
Substitution Effect
Another important factor responsible for the changes in consumption of goods is the substitution
effect. The substitution effect shows the change in the quantity of a good purchased due to a
change in the relative price of a good, while the income of the consume remains constant. When
the price of a good falls, the real income of the consumer increases.
Suppose, a customer has Rs. 100 with him. He buys 4 oranges at the rate of Rs.25. Suppose, the
price of oranges falls to Rs.20. If he buys 4 oranges as before, he can save Rs.20. Or he can buy
5

Oranges falls to Rs.20. If he buys 4 oranges now Ii.e., he can spend more with the amount
saved). Thus, when the price of a commodity falls, the real income of the consumer increases
and vice versa. The increase in real income induces the consumer to buy more of it under the
income effect. But with fall in the price of a good, it becomes relatively cheaper. This induces
the consumer to buy more to substitute it in place of the costlier good. This is called substitution
effect.
Thus, a change in price has both income as well as substitution effects.
Hicksian Decomposition of Price Effect into Income Effect and Substitution Effect (or
Separation of Break up of Substitution and income Effects from the Price Effect)
As price falls, demand for normal goods increases as a result of substitution effect. When price
falls, real income increases. As a result, demand for normal goods increases. This is due to
income effect. Thus, as price falls, demand for normal goods increases as a result of both
substitution effect and income effect. The price effect comprises the income effect and the
substitution effect (or price
effect=income effect +substitution effect).
Demand Curve for Normal, Inferior and Giffen goods
The shape of the demand curve depends on the nature of the goods. Goods may be normal,
inferior or Giffen goods.
Demand Curve for Normal Goods
When price falls, demand for normal good increases and vice versa. It happens so because of
price effect. Thus, change in price and change in demand moves in opposite direction. That is,
demand curve for normal good is negatively slopped. To be more clearly, demand curve for
normal goods slopes downward from left to right. It is shown in the given graph.

Normal good may be luxury or comfort or necessity. If demand is not very sensitive to income,
the product is known as a 'necessity product'. If demand is very sensitive to income, the product
is known as a 'luxury product'. As income increases, the demand curves for luxury good shirts
more to the right than a necessity good.
Demand Curve for Inferior Goods
When price falls, demand for inferior good increases as a result of price effect. However,
it increases only to a lesser extent than that of any normal good. Hence, demand curve will be
steep. In the case of inferior good also there is an inverse relationship between price and demand.
That is, demand curve for inferior good has negative slope. It is shown in the following graph:

Demand Curve for Giffen Goods
When price falls, demand for Giffen goods decreases as a result of price effect. Thus, in the case
of Giffen goods, the law of demand does not held good. Here, the change in price and change in
demand move in the same direction. In other words, the demand curve for Giffen good is
positively slopped. This is shown below:
Now the three demand curves may be shown in one graph as below:
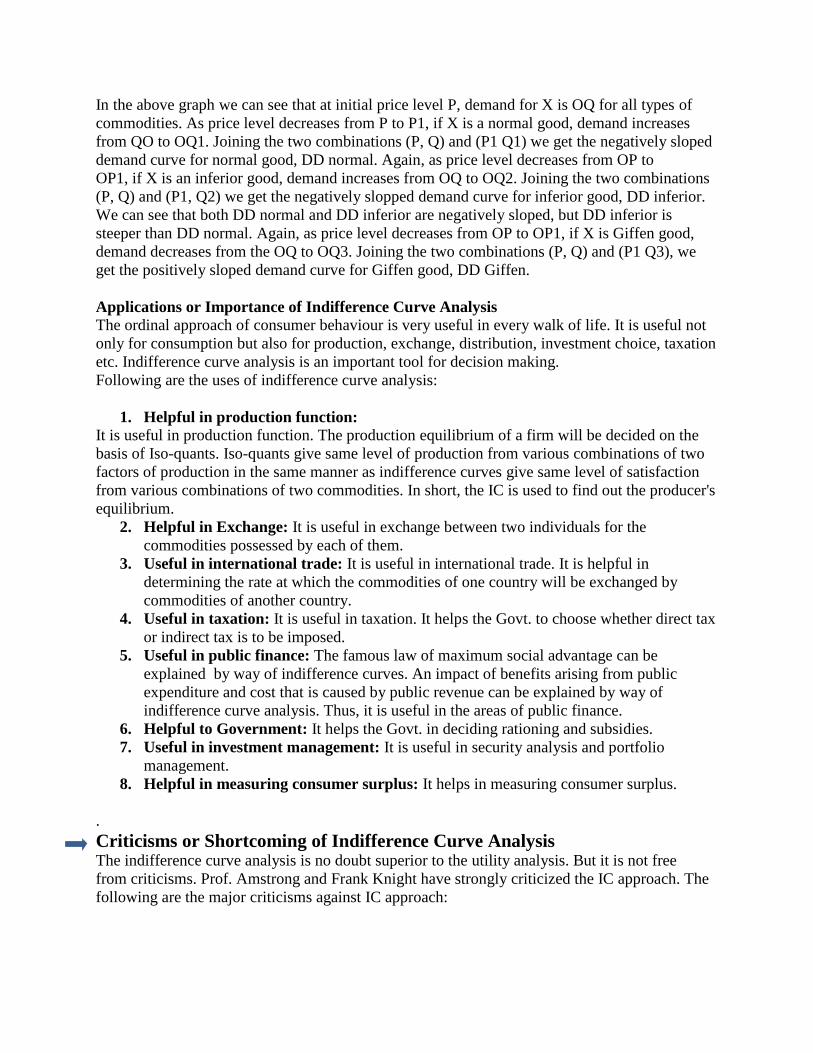
In the above graph we can see that at initial price level P, demand for X is OQ for all types of
commodities. As price level decreases from P to P1, if X is a normal good, demand increases
from QO to OQ1. Joining the two combinations (P, Q) and (P1 Q1) we get the negatively sloped
demand curve for normal good, DD normal. Again, as price level decreases from OP to
OP1, if X is an inferior good, demand increases from OQ to OQ2. Joining the two combinations
(P, Q) and (P1, Q2) we get the negatively slopped demand curve for inferior good, DD inferior.
We can see that both DD normal and DD inferior are negatively sloped, but DD inferior is
steeper than DD normal. Again, as price level decreases from OP to OP1, if X is Giffen good,
demand decreases from the OQ to OQ3. Joining the two combinations (P, Q) and (P1 Q3), we
get the positively sloped demand curve for Giffen good, DD Giffen.
Applications or Importance of Indifference Curve Analysis
The ordinal approach of consumer behaviour is very useful in every walk of life. It is useful not
only for consumption but also for production, exchange, distribution, investment choice, taxation
etc. Indifference curve analysis is an important tool for decision making.
Following are the uses of indifference curve analysis:
1. Helpful in production function:
It is useful in production function. The production equilibrium of a firm will be decided on the
basis of Iso-quants. Iso-quants give same level of production from various combinations of two
factors of production in the same manner as indifference curves give same level of satisfaction
from various combinations of two commodities. In short, the IC is used to find out the producer's
equilibrium.
2. Helpful in Exchange: It is useful in exchange between two individuals for the
commodities possessed by each of them.
3. Useful in international trade: It is useful in international trade. It is helpful in
determining the rate at which the commodities of one country will be exchanged by
commodities of another country.
4. Useful in taxation: It is useful in taxation. It helps the Govt. to choose whether direct tax
or indirect tax is to be imposed.
5. Useful in public finance: The famous law of maximum social advantage can be
explained by way of indifference curves. An impact of benefits arising from public
expenditure and cost that is caused by public revenue can be explained by way of
indifference curve analysis. Thus, it is useful in the areas of public finance.
6. Helpful to Government: It helps the Govt. in deciding rationing and subsidies.
7. Useful in investment management: It is useful in security analysis and portfolio
management.
8. Helpful in measuring consumer surplus: It helps in measuring consumer surplus.
.
Criticisms or Shortcoming of Indifference Curve Analysis The indifference curve analysis is no doubt superior to the utility analysis. But it is not free
from criticisms. Prof. Amstrong and Frank Knight have strongly criticized the IC approach. The
following are the major criticisms against IC approach:

1. Old wine in new bottle: It is pointed out that the IC approach is nothing but old wine in new
bottle. The logic is that of Marshall but terms are different. Hicks used 'preference' in place of
'utility', 'ordinal' and place of 'cardinal' and MRS in place of DMU. Thus it tells nothing new.
2. Deals with only two goods: It deals with only two goods on which the consumer spends his
entire money income. But in real life, such cases are not found. A consumer generally spends his
income not on two goods, but on more than two goods. The IC analysis can be extended to more
than two goods. But in such cases, the indifference map loses all its simplicity and the entire
analysis becomes very complicated. For three goods, we have to draw three dimensional
diagram. It is very difficult to explain in case of three goods.
3. Wrong assumption of rationality: It assumes that a consumer behaves rationally when he is
spending his money on goods. This assumption is not very realistic. There are many consumers
who spend their money in an irrational and thoughtless manner.
4. Inapplicable in case of risk and uncertainty: John von Neuman and Oskar Morgenstern in
their classic work 'The Theory of Games and Economic Behaviour' pointed out that the
IC approach fails to explain consumer behaviour when risk and uncertainty arise. Prof.
Samuelson has called the entire technique as non-operational.
5. Ignores the market behaviour: It is pointed out that the IC approach ignores the market
behaviour. It does not explain much on market changes in the prices of other goods. It deals only
with the prices of two goods.
6. Unrealistic assumption of perfect competition: It is based on unrealistic assumption of
perfect competition and homogeneity of goods. But in real life the consumer is confrontedwith
differentiated products and monopolistic competition.
7. Consumers do not have complete knowledge of all his scale of preferences: The IC
analysis requires highly introspective information from the consumer because he is required to
arrange all combinations according to his preference. It is difficult for human brain to have
complete knowledge of his scale of preference.
In the words of Prof.Robertson, "Indifference jumps from the frying pan of difficulty on
measuring the utility into the fire of unreality of assuming consumer's complete knowledge of all
his scales of preferences".
8. Not amenable to experiments: The IC technique is not very much amenable to experiments
or research. Further, indifference curves are imaginary curves.
9. Micro-economic in character: It deals only with the choice and equilibrium of an individual
consumer. It does not study the group equilibrium or group choice.
10. All commodities are not divisible: It assumes that all commodities are divisible. But there
are some commodities which are not divisible. Commodities like watches, cars, computers etc.,
are indivisible.

MODULE – III
MARKET STRUCTURES AND PRICE OUTPUT DETERMINATION
Market in economic term means a meeting place where buyers and sellers deal directly or
indirectly.
Clark and Clark define market as that “any body of persons who are in intimate business
relations and carry on extensive transactions in any commodity”.
Market structures are different market forms based on the degree of competition prevailing in the
market.
Broadly the market forms are classified into two types:-
1. Perfectly competitive market
2. Imperfectly competitive market
Perfect Competition The term perfect competition is used in wider sense. Perfect competition means all the buyers
and sellers in the market are aware of price of products .The following are the characteristics of
perfectly competitive market:_
1. Large number of buyers and sellers in the market
2. Homogeneous product
3. Free entry or exit
4. All the buyers and sellers in the market have perfect knowledge about the market conditions.
5. Perfect mobility of factor of production
6. Absence of transportation costs.
When the first three assumptions are satisfied there exists pure competition.
Competition becomes perfect only when all the assumptions are satisfied.
In perfect competition, the demand for the output for each producer is perfectly elastic .With the
larger number of firms and homogeneous products, no individual firm is in a position to
influence the price.
Equilibrium Price The demand curve normally slopes downwards showing that more quantity of commodity will
be demanded at a lower price than at higher prices. Similarly supply curve showing an upward
trend where the producers will offer to sell a larger quantity at a higher price
Effect of time on supply

According to Marshall, time has great influence on the determination of price .The following are
the market periods based on time- market period, short period and long period.
1. Very short period (Market period)
2. Short period
3. Long period
Market period or very short period may be only a day or very few days .Change in supply is not
possible where the period is very short and quantity demanded will be the determining factor in
this period Further, supply curve in the market period is remain fixed showing vertical straight
line.
The short period is a period not sufficient to make any changes in the existing fixed plant
capacity. Increase in supply in the short period is possible by increasing the variable factors of
production only. The supply curve slopes upward to right showing that some increase in supply
is possible when the price increases.
Long period is a time long enough to adjust the supply to any changes in demand .The long run
supply curve is less steep then short run supply curve showing increase in quantity supplied
when price changes.
Price determination under perfect competition In perfect competition the market price of a commodity is determined by its demand and supply.
The price of a commodity determines at the point where quantity demanded equates quantity
supplied.
Monopoly Monopoly means `single `selling. In brief, monopoly is a market situation in which there is only
one seller or producer of a product for which no close substitution is available .As there is only
one firm under monopoly, that single firm constitutes the whole industry .The monopolist can fix
price of his product and can pursue an independent price policy .A monopolist can take the
decision about the price of his product .For ex:- electricity , water supply companies etc.
Examples: Microsoft and Windows, DeBeersand diamonds, your local natural gas company.
Features
The following are the important features of monopoly:-
1. One seller and a large number of buyers.
2. No close substitutes for the product.
3. Monopolist is not the price taker and the price maker.
4. Monopolist can control the supply.
5. No entry of new firm to the market.
6. Firm and industry are the same
Causes of Monopoly 1. Legal restrictions
2. Exclusive ownership or control over the raw materials.
3. Economies of large scale production

4. Exclusive knowledge of a production technique.
Price Determination under Monopoly A monopoly firm has complete control over the entire supply .It can sell different quantities at
different prices .It can sell more if it cuts down its price.
Thus the monopoly firm faces a downward sloping demand curve or average revenue (AR)
curve .As the single firm constitutes the industry the demand curve of the monopoly firm and the
industry will be the same. But under perfect competition the firm`s demand curve is a horizontal
straight line ,but the industry’s demand curve slopes down wards. Since average revenue falls
when more units of output are sold marginal revenue will be less than average revenue .MR
curve thus declines at a greater rate than .AR curve and it falls below AR curve .
Though the monopolist has the freedom to fix any price he will prefer a price output combination
that gives him maximum profit.. He goes on producing so long as additional units add more to
revenue than to cost He will stop at that point beyond which additional units of production add
more to cost than to revenue. In other words he will be in equilibrium position at the output level
at which MR equal MC and MC cuts MR from below.
Short Run Monopoly Equilibrium The monopolist will be in short run equilibrium where the output having MR equal MC
Long run Monopoly Equilibrium The monopolist is the single producer and the new firms cannot cuts the industry which enables
the monopolist to continue to earn super profit in the long run. In the figure the long run
equilibrium of the monopolist will be at the out put where the long run marginal cost curve MC
Intersects the marginal revenue curve MR
Difference between perfect competition and Monopoly 1. Under perfect competition there are many sellers but in the case of monopoly , there is
only one seller
2. Individual seller has no control over the market supply in the case of perfect competition.
But in the case of Monopoly individual seller controls the supply
3. Products are identical in the case of perfect competition, but there is only one product in
the case of Monopoly.
4. Under perfect competition, there are free entry and exit of firms .But the Monopolist
blocks the entry.
5. The Monopolist discriminates the price but there is uniform price in perfect competition.
6. Firm and Industry is different in the case of perfect competition, they are same in the case
of Monopoly.
Monopolistic Competition In the present World market, it can be seen that there is no monopoly and there is no real
competition. There is a mix up of the two. This situation is generally known as Monopolistic
competition. According to Prof .E. H Chemberlin of America, Monopolistic Competition means

a market situation In which competition is imperfect. The products of the firms under monopolist
competition, are mainly close substitutes to each other .
Examples of monopolistic competition can be found in every high street.
Monopolistically competitive firms are most common in industries where differentiation is
Possible, such as:
The restaurant business
Hotels and pubs
General specialist retailing
Consumer services, such as hairdressing
Features /Assumptions of Monopolistic Competition. The following are the important features of Monopolistic Competition.
1. There are large numbers of producers or sellers
2. It deals with differentiated products.
3. There are free entry and exit of firms to the markets.
4. The selling cost determines the demand for the products.
5. There is no association of firms
6. There is no price competition.
7. There is lack of knowledge of the market.
Price and Output decisions under Monopolistic Competition
Short run period In short run, each existing firm is a monopolist having a downward sloping demand curve for its
product . In order to maximize its profit the firm will produce that level of output at which
MC=MR if price is more than MR, there will be abnormal profit.
Long –Run Period In the long period, normal profits will disappear .New firms will enter the industry and
consequent expansion of output will decrease the price and only normal profit are made by the
firms. Profit are normal only when Average Cost (AC) equals the Average Revenue (AR).Then
the equilibrium output will be at AC and MC=MR.
Perfect Competition Monopolistic Competition

Difference between Perfect Competition and Monopolistic Competition
Oligopoly Oligopoly is a situation in which there are so few sellers that each of them is conscious of the
results upon the price of the supply. Which he individually places upon the market.
1) Products are identical .
2) It is not a real concept
3) Large Number of buyers and sellers
4) Perfect knowledge of market Condition
5) Selling Cost do not play any role .
6)They are price takers
7) Demand curve is horizontal
8) AR,.MR curves are parallel to x axis
and
price = demand = AR=MR
1) Products are differentiated
2) It is real concept .
3) Buyers and Sellers are not so large
4) Lack of perfect knowledge of market
Condition
5) Selling cost has an important role.
6) They are price markers .
7) Demand curve is downward sloping
8) Price = demand =AR=But MR<AR.

According to J .Stigler `Oligopoly is that situation in which a firm bases its market policy in part
on the expected behavior of a few close revels`. Further, they may produce homogeneous or
differentiated products.
Characteristics
Oligopoly is a distinct market condition. It has the following features:
1. The firms are interring dependent in decision making.
2. Advertising should be effective.
3. Firms should have group behavior.
4. Indeterminateness of demand curve.
5. The number of firms or producers or sellers are very small .
6. Product are identical or close substitutes to each other
7. There is an element of Monopoly
Price Determination under Oligopoly Pricing many be in condition of independent pricing, Pricing under price leadership and pricing
under collusion.
Independent pricing (Kinked Demand Model or Price rigidity Model)
Kinked demand curve was first introduced by Prof Paul M Sweezy to explain price rigidity under
oligopoly. An oligopolist always guesses about his competitors’ reaction. They assume that if
one decides to decrease the price, the others will also reduce the price.
The assumption behind the kinked curve is that each oligopolist will act and react in ways that
keep condition tolerable for all the members of the industry. If one firm reduces the price of the
product, the others will be compelled to reduce the price. But sometimes, if one increases the
price, the other will not increase the price.
The firms in Oligopoly do not increase the prices due to the possibility of losing the customers to
rivals who do not raise their prices.
Firms usually do not change their price in response to small changes in costs. The kinked
demand curve has two segments i.e. (i) the relatively elastic portion of the demand curve
and(ii)the relatively inelastic portion of the demand curve
Pricing under Price Leadership
The price leadership means the leading firm determines the price and others follow it. All the
firms in the industry adjusts, the price fixed by the price leader.The large firm , who fixes the
price , is known as the price maker and the firms, who follow it are known as price –takers. The
price leadership may be four types.
They are:-
1. Dominant price leadership :-
In this situation , there exists many small firms and one large firm and the large firm fixes the
price and the small firms in the market accept that price .
2. Barometric Price Leadership :-

Under this situation one reputed and experienced firm fixes the price and others may follow it.
3. Aggressive Price Leadership :–
Under this market condition, one dominating firm fixes the price and they compel all others in
the industry to follow the price.
4. Effective Price Leadership :-
Under this condition, there are small number of firms in the industry .
Price -Output determination Under Price Leadership
In order to determine the price and output underprice leadership .we have to make two
assumptions. They are:-
1. There are two firms –L and F, in which the cost of production of L is less than that of F and
2. Products are identical
Price Discrimination
A monopolist is in a position to fix the price of his product .He enjoys the control of supply of
the product. A monopolist is able to charge different price for his products to the different
customers. This is known as price discrimination. According to Mrs. John Robinson ‘the act of
selling the same article, produced under single control at different prices to different buyers is
known as price discrimination. This is also known as differential pricing
Types of Price Discrimination
1. Price relatively elastic portion of the demand curve of the first degree –charging different
Price for different persons for the same product.
2. Price discrimination of the second degree –Under this, the buyers are classified into
different divisions .
3. Price discrimination of the third degree –Here , the markets are divided according to
elasticity of demand
Conditions of Price Discrimination
There are three conditions to be satisfied to apply the price discrimination they are:
1. There must be more than one separate market
2. The markets must have different elasticity of demand
3. The market should be such that no buyer of the market may enter the other market and
vice versa
Dumping
When monopolist works in home market as well as foreign market, he is able to discriminate the
price between these two markets . If he has monopoly in home market , and he faces competition
in to foreign market , he will be able to charge higher prices for his products in home market.
This practice is known as `Dumping` or `price dumping `
Monopsony
A monopsony is a market condition in which there is only one buyer, the monopsonist. Like a
monopoly, a monopsony also has imperfect market conditions. The difference between a
monopoly and monopsony is primarily in the difference between the controlling entities. A

single buyer dominates a monopsonized market while an individual seller controls a
monopolized market. Monosonists are common to areas where they supply most or all of the
region's jobs.
PRICING POLICY AND PRACTICES.
Formulating price policies and setting the price are the most important aspects of managerial
decision making. Price in fact, is the source of revenue which the firm seeks to maximize. Again,
it is the most important device a firm can use to expand the market. If the price is set too high, a
seller may price himself out of the market. If it is too low, his income may not cover costs, or at
best, fall short of what it could be. In other words, if the Company prices too much, it will make
fewer sales. If it charges too little, it will sacrifice profits. So the price must be fixed judiciously.
Meaning of price.
Price is the money value of the goods and services. In other words, it is the exchange value of a
product or service in terms of money. To the seller, price is a source of revenue. To the buyer,
price is the sacrifice of purchasing power.
Factors governing prices and pricing decision.
Price is very important to both the buyer and the seller. In this connection, it may be noted that in
economic theory, two parties should be generally emphasized ie. Buyers and sellers. Inpractice,
however, as pointed out by Oxenfeldt, certain other parties are also involved in the pricing
process, i.e. Rival seller, potential rivals, middlemen & government. All these parties also
exercise their influence in price determination.
Factors governing prices may be divided into external factors and internal factors.
Internal Factors:
These are the factors which are within the control of the organization. Various internal factors
are
as follows.
1. Cost: The price must cover the cost of production including materials, labour, overhead,
administrative and selling expenses and a reasonable profit.
2. Objectives: While fixing the price, the firm’s objectives are to be taken into
consideration. Objectives may be maximum sales, targeted rate of return, stability in
prices, increase market share, meeting or preventing competition, projecting image etc.
3. Organizational factors: Internal arrangement of the organization. Organizational
mechanism is to be taken into consideration while deciding the price.
4. Marketing Mix: Other element of marketing mix, product, place, promotion, pace an
politics are influencing factors for pricing. Since these are interconnected, change in one
element will influence the other.
5. Product differentiation: One of the objectives of product differentiation is to charge
higher prices.
6. Product life cycle: At various stages in the Product Life Cycle, various strategic pricing
decisions are to be adopted, eg. In the introduction stage. Usually firm charges lower
price and in growth stage charges maximum price.
7. Characteristics of product: Nature of product, durability, availability of substitute etc.
will also influence the pricing.

External Factors.
These factors are beyond the control of organization. The following are the main external
factors.
1. Demand: If the demand for a product is Inelastic it is better to fix a higher price and if
demand is elastic, lower price may be fixed.
2. Competition: Number of substitutes available in the market and the extent of
competition and the price of competition etc. are to be considered while fixing a firm
price.
3. Distribution channels: Conflicting interest of manufacturers and middleman is one of
the
of the important factor that affect the pricing decision. Manufacturer would desire that
middleman should sell the product at a minimum mark up
4. General economic conditions: During inflation a firm forced to fix a higher price and in
deflation forced to reduce the price
5. Government Policy: While taking pricing decision, a firm has to take into consideration
the taxation policy, trade policies etc. of the Government.
6. Reaction of consumers: If a firm fixes the price of its product unreasonably high, the
consumer may boycott the product.
Pricing Policies.
Price must not be too high or too low. Price setting is a complex problem. The pricing
decision is critical not only in the beginning but it must be reviewed and reformulated
from time to time. Price policies provide the guidelines within which pricing strategy is
formulated and implemented. It represents the general frame work within which pricing
decision are taken. Price policies are those management guidelines that control the day to
day pricing decision as a means of meeting the objectives of the firm such as
maximization of profit, maximization of sales, targeted rate of return, survival, stability
of prices, meeting or preventing competition etc.
Steps in formulating pricing policies:
1. Selecting the target market or market segment on which marketer would concentrate more
2. Studying the consumer behavior and collecting information relating to target market
selected.
3. Studying the prices, promotion strategies etc.of the competitors and their impact on the
market segment.
4. Assigning a role to price in the marketing mix.
5. Collecting the cost of manufacturing the product at different levels of demand.

6. Fixing suitable (strategic) price after determining the price objectives and according to a
selected method of pricing.
Objectives of pricing policy.
Pricing decisions are usually considered a part of the general strategy for achieving a
broadly defined goal. Before determining the price itself, the management should decide
the objectives. While setting the price, the firm may aim at one or more of the following
objectives.
1. Profit maximization: Since the primary motive of business is to earn maximum profit,
pricing always aim at maximization of profit through maximization of sales.
2. Market share: For maximizing market share a firm may lower its price in relation to
the competitors’ product.
Target return in investment: The firm should fix the price for the product in such a way
that it will satisfy expected returns for the investment.
3. Meet or prevent competition: In order to discourage competition a firm may adopt a
low
price policy.
4. Price stabilization: Another objective of pricing is to stabilize the product prices over
aconsiderable period of time.
5. Resource mobilization: Company may fix their prices in such a way that sufficient
resources are made available for the firms expansion, developmental investment etc.
6. Speed up cash collection: Some firms try to set a price which will enable rapid cash
recovery as they may be financially tight or may regard future is too uncertain to justify
patient cash recovery.
7. Survival and growth: An important objective of pricing is survival and achieving the
expected rate of growth. Profit is less important than survival.
8. Prestige and goodwill: Pricing also aims at maintaining the prestige and enhancing
the
goodwill of the firm.
9. Achieving product –quality leadership: Some Companies aim at establishing product
quality leader through premium price.
Methods of pricing.
1. Cost Plus pricing.
2. Target pricing.
3. Going rate pricing.
4. Customary pricing.

5. Follow up pricing.
6. Differential pricing.
7. Marginal cost pricing.
8. Barometric pricing.
1. Cost plus pricing: This is the most common method used for price. Under this method, the
price is fixed to cover all costs and a predetermined percentage of profit.ie, the price iscomputed
by adding a certain percentage to the cost of the product per unit. This method is also known as
margin pricing or average cost pricing or full cost pricing or mark up pricing. The business firm
under oligopoly and monopolistic market are following this pricing policy.
2. Target pricing: this is variant of full cost pricing. Under this method, the cost is added with
the predetermined target rate of return on capital invested. In this case the company estimates
future sales, future cost and calculates a targeted rate of return on capital invested. This is also
called as rate of return pricing.
3. Marginal cost pricing: under the marginal cost pricing, the price is determined on thebasis of
marginal cost or variable cost. In this method, fixed costs are totally excluded.
4. Differential pricing: Under this method, the same product is sold at different prices to
different customers, in different places, and at different periods. This method is called
discriminatory pricing or price discrimination. Examples, Cinema Theater, telephone bills etc
5. Going rate pricing: under this method, prices are maintained at par with the average level Of
prices in the industry. I.e., under this method a firm charges the prices according to what
competitors are charging. Firm accepting the price prevailing in the industry in order to avoid
price war. This method is also called acceptance pricing or parity pricing.
6. Customary pricing: in the case of some commodities the prices get fixed because they have
prevailed over along period of time. Examples, the price of cup of tea or coffee. In short the
prices are fixed by custom. The price will change only when the cost changes significantly. It is
also called conventional pricing.
7. Follow up pricing: this is the most popular price policy. Under this, a firm determines the
price policy according to the price policies of competitors. If the competitors reduce the price of
the product, the firm also reduces the price of its product. If the competitors increase the price,
the firma also follow the same.
8. Barometric pricing: this is the method of leadership pricing. In this type of price leadership,
there is no leader firm. But one firm among the oligopolistic firms announces a price change
first. This is followed by other firms in the industry. The barometric price leader need not be a
dominant firm with the lowest cost or even the largest firm in the industry but they responds to
changes in business environments rapidly. On the basis of a formal or informal tacit agreement,

the firms in the industry accept a firm as price leader who may act firstly upon the environmental
or market changes.
Pricing of a new product. (Methods and strategy)
In pricing a new product, generally two types of strategies are suggested. They are;
1. Skimming price strategy
This is done with a basic idea of gaining a premium from those buyers who always readyto pay a
much higher price than others. Accordingly a product is priced at a very high level due to
incurring large promotional expenses in the early stages. Thus skimming price refers to the high
initial price charged when a new product is introduced in the market. Reasons for charging this
price are;
A. When the demand of new product is relatively inelastic.
B. When there is no close substitutes
C. Elasticity of demand is not known.
D. When the buyers are not able to compare the value and utility.
E. To attract the high income customers.
F. To recover early the R&D and promotional expenses.
G. When the product has distinctive qualities, luxuries etc..
2. Penetration price strategy
This is the practice of charging a low price right from the beginning to stimulate the growth of
the market and to capture large share of it. Since the price is lower, the product quickly
penetrates the market, and consumers with low income are able to purchase it.
Reasons for adopting this policy are:
A. Product has high price elasticity in the initial stage.
B. The product is accepted by large number of customers.
C. Economies of large scale production available to firm.
D. Potential market for the product is large.
E. Cost of production is low.
F. To introduce product into market
G. To discourage new competitors.
H. Most of the prospective consumers are in low income class.
Kinds of pricing (pricing strategies)
Pricing policy means a policy determined for normal conditions of the market. Pricing strategy is
a policy determined to face a specific situation and is of temporary nature. Simply pricing
policies provide guidelines to carry out pricing strategy. Following are the important pricing
strategies.

1. Psychological pricing: Here manufacturers fix their prices of a product in the manner
that
it may create an impression in the mind of consumers that the prices are low. E.g. Prices
of Bata shoe as Rs.99.99. This is also called odd pricing.
2. Mark up pricing. This method of pricing is followed by whole salers and retailers.
When the goods are received, the retailers add a certain percentage of the whole saler’s price.
3. Administered pricing: Here the pricing is done on the basis of managerial decisions
and not on the basis of cost, demand, competition etc.
4. Other pricing strategies: Geographical pricing, base point pricing, zone pricing, dual
pricing, product line pricing etc. are some other pricing strategies.
Role of Cost in Pricing
Most of the wholesale and retail organizations add some percentage of profit or mark up total
cost per unit to arrive at selling price. According to Hall and Hitch, business firmsunder the
conditions of oligopoly and monopolistic competitive market do not determine priceand output
with the help of the principle MC=MR. they determine price and output on the basis of full
average cost of production. Cost of production consists of fixed and variable costs. In the short
run the firm may not cover the fixed cost but it must cover at least variable cost. In long run all
costs must be covered. if the entire cost is not recovered, the firm will incur losses, and the firm
must stop their production. Thus costs provide the basis for pricing. If the cost increase price also
increases. Cost represents a resistance point for lowering of price, i.e., below which pricing
should not be done. Cost also determines the profit margin at various level of output.
Role of Demand factor in pricing
In the case of pricing of a product, demand plays a significant role. In some cases demand
occupies a vital role than cost. The demand is the factor which determines the sales and profit.
We know as per law of demand, demand and price have inverse relationship. To increase the
demand, the firm has to reduce the price. Similarly to decrease the demand the firm has to
increase the price. The elasticity of demand is to be considered in determining the price of the
product. If the demand for the product is elastic, the firm can fix lower price. If the demand is
inelastic, the firm can fix a higher price.
Consumer Psychology and Pricing
While fixing the price of product, the management should give importance to consumer
psychology. Actually demand of the product is based upon the behavior of consumers. Some
consumer may buy a product of high quality even though the products are highly priced.
Consumers think that highly priced products are of high quality. If the price of product is less,
consumer will think that such product is of low quality. If the price is too high, the consumer
may boycott the product and they will go for substitute product of low price. If the price is too
low the consumers think that the goods are of inferior quality. They will not buy it. The
important elements that influence the consumer psychology are; price of the product, after sales
service, advertisement and sales promotion, personal income, fashions. So consumer are many
types, they follow different approaches to firms product. So in case of price determination, the
consumer psychology must given due weightage.

MODULE – 4
AN OVERVIEW OF INDIAN ECONOMY
India is a land of diversity. It is the second largest populous country in the world. It is blessed
with plenty of natural resources. India is a vibrant democratic country, it the largest democracy
of the world. It carries the lamp of democracy in the developing world. It has a long and glorious
history to tell.
India economy since 1991
In the late 1980s and early 1990s Indian economy faced with serious problems such as large
trade deficits, huge foreign debt, sharp decline in the external value of rupee, low economic
efficiency, recession and so on, all the above factors led to fiscal and external imbalances,
inflation, chronic unemployment and such other related consequences.
To correct the imbalances and to solve the basic problems of poverty, unemployment and
inequality, the congress government which has sworn into power in June 1991, decided to
introduce some major economic reforms. These economic reforms are popularly called
structural adjustment programmes(sap) or liberalization or globalization.
By these, the government dreamed a total transformation of Indian economy.
The new economic policy is a package of five strategies: -
privatization, globalisaion,liberalisaiton, market friendly state, and technology.
Gross Domestic product
India's GDP stood at 5, 86, 212 crore in 1991. About 25 years later, it stands at f 1, 35, 76, 086
crore, an increase of 2216 percent. In dollar terms, India's GDP crossed the $2 trillion mark in
2015-16. Currently, the Indian economy is the world's seventh largest economy in terms of
nominal GDP. It is the third largest economy by Purchasing Power Parity.
India is expected to be the second largest economy in the world by 2050, India is now being
considered as the fastest growing major economy in the world, with a growth rate of 7. 6% in
2015-16. India's gross domestic product (GDP) growth rate in 2012-13 was the lowest for a
decade, at just 5. 1%.
Foreign Direct Investment
Before 1991, foreign investment was negligible. The first year of reform saw a total foreign
investment of only $74 million. However, investments have steadily risen since then, except for
occasional falls between 1997 and 2000 and 2008 and 2012-owing to the global economic
slowdown. The year 2008 recorded the highest FDI inflow of 543. 40 billion, the biggest rise in
inflow was between 2005 and 2006-175. 54%. In 2015 India received $63 billion (nearly 4. 19
lakh crore) and replaced China as the top FDI destination.
Foreign Exchange Reserves
It was India's dismal state of fore reserves that forced the Government to bring in economic
reforms in 1991. Now, 25 years later, fore reserves are at a record high. In 1991, it stood at
just55. 8 billion. As of 24 June, 2016 the country's for reserves stood at $360. 8 billion. The
biggest jump in reserves was witnessed between 2007 and 2008 when the total reserves were
increased to $309. 2 billion. India's foreign exchange reserves were US$ 405. 64 billion in the
week up to March 15, 2019, according to data from the RBI.
External Debt
In 1991, the country's external debt stood ats83. 8 billion. The rise has been steady with the
figure in December 2015 hitting $480. 2 billion. Though the f figure looks huge, as a percentage
of GDP the external debt has declined. In 1991-92, external debt as a percentage of GDp stood at

38%. The corresponding figure in 2015 is just about 24%. Between 2007 and 2008, external debt
increased by more than 30% which is the steepest rise in the last 25 years.
Foreign Institutional Investment
In 1992-93, Fll inflow stood at a meagre $4. 2 million. By 1994-95, the figure had risen tc$2. 43
billion. However, there was a net outflow of 5386 million for the first time in 1998-99. The
reason for this may be the political instability and the Kargil War Another major outflow was
recorded in 2008-09-$9. 83 billion-during the global financial crisis. Fll inflow rose to$45. 69
billion in 2014-15 from $8. 87 billion in 2013-14, a 414 percent spike in just one year. In2015-
16, however, there was a net Fll outflow of 2. 53 billion.
Per Capita Income
Per capita income is the average income of every citizen arrived at by dividing the GDP by the
country's population. In 1991 per capita income was'6, 270. It increased to'22, 491 in 2000-01
and it almost doubled to'41, 255 in 2011-12. When calculated at 2011-12 prices, per capita net
national figure increased at 63460 in 2011-12 and to 72889 in 2014-15. In 2016, it was increased
at Rs. 93293. This is a whopping 1388 percent jump.
Purchasing Power Parity
Purchasing power parity (PPP) gives a comprehensive idea on the standard of living and the cost
of living in a particular country. When per capita income of Indians is calculated in terms of
PPP, the standard of living has improved. However, he cost of living has risen too. In 1991, per
capita PPP was Rs. 1173. In 2014, It rose nearly fivefold to Rs. 5701. Nevertheless, when
compared with developed countries, india’s standard of living as well as cost of living is quite
low.
Share of agriculture
The post reform period shows the gradual decline in the agriculture sectors contribution to the
Indian economy. India’s tradition occupation, agriculture, now contributes only about 15% to the
GDP, fallen from 29 percent in 1991. The services sector has taken the lead role in propelling the
economy at the global stage. The IT sector has been the torchbearer of the service sector in india.
Currently, it contributes around 53% to the national economy.
Labour force and employment
The labor force in india currently stands at 49.7% crores. In 1991, it stood at 33.7 crores. More
or less two fifth of population is p[art of the labor force. The most important fact is that the
decline in unemployment rate over the last 25 years is only marginal from 4.3% in 1991 to 3.6%
in 2014. Agriculture sector, which is considered india’s backbone, now employs less than 50%
of the labor force, while industrial and service sector have marginally moved ahead.
Telecommunication
The telecom revolution in india can be called the biggest legacy of the post 1991 economy.
Telephone, especially wireless, subscription has witnessed exponential growth since the dawn of
this century. Telephone connections steadily roe in the initial few years, but could never match
the rapid rise of sim based mobile subscription.
Industrial sector
India is tenth in the world in factory output. Manufacturing sector in addition to mining
,quarrying, electricity and gas together account for 27.6% of the GDP and employ 17% of the
total workforce. Economic reforms introduced after 1991 brought foreign competition. This led
to privatization of certain public sector industries, opening up of sectors hitherto reserved for the
public sector and an expansion in the production of fast moving consumer goods.
Agricultural sector

the actual outputs of oil seeds, sugar cane, cotton and jute for the five years ending 1996 -97
were higher than the targets. But the food grains production for the corresponding period was
199 million tons. This was the highest registered by india till then.
Services
India is fifteenth in services output. India’s IT industry, despite contributing significantly toits
balance of payments, accounts for only about 1% of the total GDP or 1/50th of the total services.
Foreign trade
In 1991 india’s main export were textiles and cut and polished gems, today, its main exports are
computer software, other business services, pharmaceuticals, automobiles and auto components.
Recent Developments With the improvement in the economic scenario, there have been various
investments in various sectors of the economy. The M&A activity in India reached record US$
129.4 billion in 2018 while private equity (PE) and venture capital (VC) investments reached
US$ 20.5 billion. Some of the important recent developments in Indian economy are as follows:
During 2018-19 (up to February 2019), merchandise exports from India have increased 8.85
per cent year-on-year to US$ 298.47 billion, while services exports have grown 8.54 per
cent year-on-year to US$ 185.51 billion.
Nikkei India Manufacturing Purchasing Managers’ Index (PMI) reached a 14-month high in
February 2019 and stood at 54.3.
Net direct tax collection for 2018-19 had crossed Rs 10 trillion (US$ 144.57 billion) by March
16, 2019, while goods and services tax (GST) collection stood at Rs 10.70 trillion (US$ 154.69
billion) as of February 2019.
Proceeds through Initial Public Offers (IPO) in India reached US$ 5.5 billion in 2018 and US$
0.9 billion in Q1 2018-19.
India's Foreign Direct Investment (FDI) equity inflows reached US$ 409.15 billion April 2000
and December 2018, with maximum contribution from services, between Apcomputer software
and hardware, telecommunications, construction, trading and automobiles.
India's Index of Industrial Production (IIP) rose 4.4 per cent year-on-year in 2018 19 (up to
January 2019).
Consumer Price Index (CPI) inflation stood at 2.57 per cent in February 2019.
Net employment generation in the country reached a 17-month high in January 2019.
Basic characteristics of Indian economy
Indian economy is termed as the developing economy of the world. Some features like low per
capita income, higher population below poverty line, poor infrastructure, agriculture based
economy and lower rate of capital formation, tagged it as a developing economy in the world.
1. Low per Capita Income: India’s per capita income is very less as compare to developed
countries. As per the estimates of the Central Statistics Office (CSO), the per capita net national
income of the country at current prices for the year 2015-16 is estimated to attain the level of Rs.
93231/-. The per capita net national income at constant prices (2011-12) for the year 2015-16 is
estimated to attain the level of Rs. 77, 431/-.
2. Agriculture Based Economy: Agriculture and allied sectors provide around 14.2% of Indian
GDP while 53% of total Indian population is based on the agriculture sector.
3. Over population: in every decade Indian population get increased by about 20% . During the
2001-11 population increased by 17.6%. Currently India is adding the total population of
Australia every year. India is the possessor of around 17.5% population of the whole world.
4. Income Disparities: a report released by Credit Suisse revealed that the richest 1% Indians
owned 53% of the country’s wealth, while the share of the top 10% was 76.30%. To put it

differently, in a manner that conveys the political economy of this stunning statistic, 90% of
India owns less than a quarter of the country’s wealth.
5. Lack of Capital Formation: Rate of capital formation is low because of lower level of
income. Gross domestic capital formation was 23.3% in 1993-94 increased upto the level os
38.1% in 2007-08 but declined upto 34.8% in 2012-13.
6. Backwardness of Infrastructural Development: As per an recent study, 25% of Indian
families don’t have reach of electricity and 97 million peoples don’t have reach of safe drinking
water and 840 million people in India don't have sanitation services. India needs 100 million
dollar for infrastructural development upto 2025.
7. Market Imperfections: Indian economy doesn’t have good mobility from one place to other
which hinders the optimum utilization of resources. These market imperfections create the
fluctuations in the price of commodities every year.
8. Economy is Trapped in the Vicious Circle of Poverty: Prof. Ragner Nurkes says that ‘a
country is poor because it is poor’. It means poor countries are trapped in the vicious circle of
poverty.
9. Use of Outdated Technology: It is very clear that Indian production technique is more labour
oriented in nature. So it increases the cost of production of the products made in these countries.
10. Traditional Set Up of Society: Indian societies are trapped in the menace like
casteism,communalist, male dominated society, superstitions, lack of entrepreneurship, and
‘chalta hai attitude’ of the peoples. These all factors hindered the growth of the country as
awhole.
Factors that led to the opening op of Indian economy
1. Balance of payment crisis
As already stated, during late 1980s as early 1990sindia had a severe BOP crisis (when foreign
exchange falls short for payment, ie, total imports exceed total exports, the problem of adverse
BOP will arise). This pushed the country to near bankruptcy. In response to this crisis, the
alternative was to open the economy to the outside world.
2. Rise in fiscal deficit
Due to increase in non development expenditure, fiscal deficit of the got had been increasing.
Fiscal deficit means difference between total expenditure and total receipts minus loans. Due to
rise in fiscal deficit there was rise in public debt and interest. In 1991interest liability became
36.4% of total govt expenditure.
3. Debt trap
To finance the fiscal deficit, government borrowed funds from banks and internation financial
institutions. Due to faulty policies, government was not able to repay the borrowings and started
taking loans again to repay the previous loans.
4. Poor performance of the industrial sector
Before the introduction of economic reforms, the industrial sector suffered due to beaurocratic
controls. The industries had to obtain several licenses and permissions for undertaking any
activity such as setting up a new firm, staring a new product line, expansion of existing business,
foreign investments and so on.
5. Very low foreign exchange resources
In the early 1990s, our foreign exchange reserves had almost dried up. They were, barely enough
to pay for two weeks imports, in 1986-87 foreign exchange reserves were rs. 8151 crores and in
1989-90, it declined to Rs. 6252 crores.
6. (IV) Iraq war

In 1990-91, war in Iraq broke out. This led to rise in petrol prices. This had increased the need
for more foreign currency. The flow of foreign currency from gulf countries stopped. This
further aggravated the problem.
7. Rise in price(inflation)
Prices were continuously rising in india. The inflation rate increased from 6.7% to 16.7%. due to
inflation country’s economic position became worse. Main reason for inflation was raid increase
in money supply.
8. Low per capita income and poverty
When compared to advanced countries per capita income was much low in india during 1980s.
most people were living under severe hardships. They did not get sufficient foodfor eat, shelter
to live, adequate medical care and minimum educational opportunities.
9. Unemployment
At all times one of the crucial problems in india was unemployment. Even now unemployment
continuous to be a crucial problem. By opening up the economy it was expected that the
unemployment rate would come down.
10. Shortage of domestic capital
At all times india faced shortage of capital. Due to shortage of capital the government reduced
the non development expenditure. It was shortage of capital that the government decided to open
the economy and to integrate with the world economy so as to progress towards a free market
economy.
11. Fall of communist countries
After the fall of communist countries, particularly, soviet union, india shifted its economic
outlook from being socialist to being a mixed one. Thus the fall of communist countries forced
the government to open up its economy to the outside world.
Indian Economy under WTO Regime
Consequent upon India's signing of GATT agreement in 1954 and joining of WTO as a founder
member in 1995, a number of issues have arisen. These issues have impact on India's interest.
The government of India has adopted WTO regime in agriculture, trade and industry, intellectual
property and services. Let us examine the study of those issues in the context of Indian economy.
A.WTO and Indian Agriculture
There are four major provisions relating to agriculture in WTO accord.
They are: (a) Reduction in domestic support, (b) Market Access, (c) Trade Related Intellectual
Property Rigths (TRIPs), and (d) Disbanding public distribution system. These may be discussed
in detail below:
1.Reduction in Domestic Support: According to the proposal, the maximum support to agriculture should not exceed 10% of the
value of agricultural produce for India. In India it has been observed that government offers
minimum support price to 20agricultural products. The subsidy provided in each case is less than
10%. Moreover, this 10% norm is not applicable to poor farmers (those farmers having less than
2.5 hectors). In India around 40% of the farmers come under the category of poor farmers. Hence
these provisions may not have significant impact on India's policy of announcing support to the
farmers.
2.Market Access: WTO agreement on agriculture also provides for minimum access to market to the foreign
supplies. The range of this access is 3 to 5% of the domestic consumption or the existing level of
imports.

3.TRIPs:
The agreement on Trade Related Intellectual Property Rights argues that as far as the plant
varieties are concerned (including seeds), they must be protected either by a patent or by an
effective Sui generis system or by combination of both.
4.Disbanding Public Distribution: The WTO accord requires the member countries to procure agricultural products at market price.
However, in India, the Public Distribution is meant to help consumers and not the producers.
Therefore, the question of disbanding Indian on PDS does not arise. Agricultural exports from
India would increase due to reduction in agricultural subsidies and barriers to export of
agricultural products.
B.TRIMs and India. The agreement on Trade Related Investment Measures (TRIMs) under the WTO regime is
another sensitive area in the context of the Indian economy. The very purpose ofTRIMs is to
monitor investment measures which may have the effect of restricting and distortingtrade.
Provisions regarding TRIMs are not different from those which we have already incorporated in
our New Economic Policy (NEP) of 1991. Thus, there is not much problem withregard to
TRIMs. This is so because we are already moving on the path of liberalization.
C. Social Clause and India.
Social Clause stands for protecting labor standards, more specifically prohibition of employment
of children in hazardous industries, providing adequate wages, healthy and hygienic working
conditions etc. The Issue relating to labor was not settled. WTO assigned this task to the
International Labor Organization (ILO) to formulate the labor standards.
D.TRIPs and India.
The TRIPs section of the WTO agreement covers the following types of intellectual property
rights: copyright, trademarks, trade secrets, geographical indications, industrial designs,
integrated circuits, and patents. a.Copyright b.Trade marks and service marks c. Industrial
Designs and patents.
E.WTO and Indian Industry. In the industrial sector, the WTO agreement makes it necessary for India to modify its patent
law. Under the present Indian Patents Act, in certain products like food and pharmaceuticals, the
patent is limited to method or process of manufacturing. This means that a medicine developed
and patented by a firm in a foreign country may be manufactured and marketed by a firm in India
if the manufacturing process used is different from the original one.
F. WTO and services
Service sector like insurance, banking, telecommunication is backward in india as compared to
that of developed countries. Therefore, inclusion of trade in services id detrimental to the interest
of india.
Implication for india as a member of WTO
There are heated discussions and arguments for and against india becoming a member of the
WTO. Arguments for joining WTO (BENEFITS TO INDIA)
1. The GATT secretariat estimated that largest increase in the level of merchandise trade in
goods will be in the areas of clothing, agriculture, forestry and fishery products and

processed food and beverages. India’s competitive advantage lies in these fields. Hence,
it is logical to believe that india will obtain large gains in these areas.
2. Agricultural exports from india will increase due to the reduction in agricultural subsidies
and barriers to export of agricultural products.
3. The multilateral rules and disciplines relating to antidumping, subsidies and
countervailing measures, safeguards and disputes settlement machinery will ensure
greater security of international trade.
4. India has the market access to a number of advanced countries due to the imposition of
the clauses relating to trade without discrimination
5. Without the WTO membership, inida has the advantage of living trade links with all
other member countries without the need for bilateral agreements. The role of WTO is
like that of a telephone exchange in this context.
6. India’s textile and clothing exports would increase due to the dismantling of mult fibre
arrangement in 2005.
7. In line with the WTO obligations, india has adopted the product patent regime for food,
drugs and chemical from Ist January 2005 and embedded software with adequate
safeguards to protect the interest of common man.
Argument against membership
1. The claim that world trade would increase substantially and that india’s exports woul
expand considerably is not acceptable to many. Flow of goods and services across the
globe depends not much on trade restriction but on factors like infrastructure, political
environment, technology, assured supply of exportable goods, and quality consciousness
of producing countries. Removal of trade barriers will not guarantee expansion in world
trade.
2. Introduction of product patent in india will lead to sharp increase in prices of drugs by the
MNCs who have the product patent. The prices of agricultural inputs will also increase.
This will affect the poor people.
3. The free market access and the removal of all restriction on imports would adversely
affect the farming community. Cheap imports of agricultural products would push
farmers out of production.
4. India cannot compete with the developed countries in the international market of
agricultural commodities. This is because the developed countries can supply goods at
much lower prices on account of subsidies.
5. A change in the patent laws of india in accordance with the TRIPs agreement would lead
to brain drain. This would prove costly for india.
6. India and other developing countries have blindly walked into the trap laid by loped
countries.
7. The extension of intellectual property rights to agriculture has negative effects on india.
8. Service sector like insurance, banking, telecommunications, transportation etc, is
backward in india compared to that of developed countries.
Major issues in Indian economy
Being a poor country and one of the fastest growing economies in the world, there are some
unique economic issues in India as explained below:

1. Low per capita income
Usually, developing economies have a low per-capita income. The per capita income in India in
2014 was $1,560. In the same year, the per-capita Gross National Income (GNI) of USA was 35
times that of India and that of China was 5 times higher than India.
2. Unequal distributionof income.
This makes the problem of poverty a critical one and a big obstacle in the economic progress of
the country. Therefore, low per-capita income is one of the primary economic issues in India.
3. Huge dependence of population on agriculture
Another aspect that reflects the backwardness of the Indian economy is the distribution of
occupations in the country. The Indian agriculture sector has managed to live up to the demands
of the fast-increasing population of the country.
According to the World Bank, in 2014, nearly 47 percent of the working population in India was
engaged in agriculture. Unfortunately, it contributed merely 17 percent to the national income
implying a low productivity per person in the sector. The expansion of industries failed to attract
enough manpower either.
4. Heavy population pressure
We have a high-level of birth rates and a falling level of death rates. In order to maintain a
growing population, the administration needs to take care of the basic requirements of food,
clothing, shelter, medicine, schooling, etc. Hence, there is an increased economic burden on the
country.
The existence of chronic unemployment and under-employment
The huge unemployed working population is another aspect which contributes to the economic
issues in India. There is an abundance of labor in our country which makes it difficult to provide
gainful employment to the entire population.
Also, the deficiency of capital has led to the inadequate growth of the secondary and tertiary
occupations. This has further contributed to chronic unemployment and under-employment in
India. With nearly half of the working population engaged in agriculture, the marginal product of
an agricultural laborer has become negligible. The problem of the increasing number of
educated-unemployed has added to the woes of the country too.
Slow improvement in Rate of Capital Formation
India always had a deficiency of capital. However, in recent years, India has experienced a slow
but steady improvement in capital formation. We experienced a population growth of 1.6 percent
during 2000-05 and needed to invest around 6.4 percent to offset the additional burden due to the
increased population. Therefore, India requires a gross capital formation of around 14 percent to
offset depreciation and maintain the same level of living. The only way to improve the standard
of living is to increase the rate of gross capital formation.
Inequality in wealth distribution
According to Oxfam’s ‘An economy for the 99 percent’ report, 2017, the gap between the rich
and the poor in the world is huge. In the world, eight men own the same wealth as the 3.6 billion
people who form the poorest half of humanity.
In India, merely 1 percent of the population has 58 percent of the total Indian wealth. Also, 57
billionaires have the same amount of wealth as the bottom 70 percent of India. Unequal
distribution of wealth is certainly one of the major economic issues in India.

Poor Quality of Human Capital
In the broader sense of the term, capital formation includes the use of any resource that enhances
the capacity of production. Therefore, the knowledge and training of the population is a form of
capital. Hence, the expenditure on education, skill-training, research, and improvement in health
are a part of human capital. To give you a perspective, the United Nations Development Program
(UNDP), ranks countries based on the Human Development Index (HDI). This is based on the
life expectancy, education, and per-capita income. In this index, India ranked 130 out of 188
countries in 2014.
Low level of technology
New technologies are being developed every day. However, they are expensive and require
people with a considerable amount of skill to apply them in production. Any new technology
requires capital and trained and skilled personnel. Therefore, the deficiency of human capital and
the absence of skilled labor are major hurdles in spreading technology in the economy. Another
aspect that adds to the economic issues in India is that poor farmers cannot even buy essential
things like improved seeds, fertilizers, and machines like tractors, investors, etc. Further, most
enterprises in India are micro or small. Hence, they cannot afford modern and more productive
technologies.
Lack of access to basic amenities
In 2011, according to the Census of India, nearly 7 percent of India’s population lives in rural
and slum areas. Also, only 46.6 percent of households in India have access to drinking water
within their premises. Also, only 46.9 percent of households have toilet facilities within the
household premises. This leads to the low efficiency of Indian workers. Also, dedicated and
skilled healthcare personnel are required for the efficient and effective delivery of health
services. However, ensuring that such professionals are available in a country like India is a huge
challenge.
Demographic characteristics
According to the 2011 Census, India had a population density of 382 per square kilometer as
against the world population density of 41 per square kilometer. Further, 29.5 percent was in the
age group of 0-14 years, 62.5 percent in the working age group of 15-59 years, and around 8
percent in the age group of 60 years and above. This proves that the dependency burden of our
population is very high.
Under-utilisation of natural resources
India is rich in natural resources like land, water, minerals, and power resources. However, due
to problems like inaccessible regions, primitive technologies, and a shortage of capital, these
resources are largely under-utilized. This contributes to the economic issues in India.
Lack of infrastructure
The lack of infrastructural facilities is a serious problem affecting the Indian economy. These
include transportation, communication, electricity generation, and distribution, banking and
credit facilities, health and educational institutions, etc. Therefore, the potential of different
regions of the country remains under-utilized.
UNEMPLOYMENT IN INDIA
Unemployment is a common economic malady being faced by most of the less developed
countries in the world. It is found in developed countries also. However, the nature of the
unemployment may differ from country to country.
Every sixth person in the world is a Indian and every third poor person in the world also an

Indian. The statistics speak about the gravity of the problems of unemployment and poverty.
Meaning of unemployment
We can see in the most of the societies that people are available and willing to work, but unable
to find jobs. This is the situation of unemployment. Unemployment refers to a situation when
people are willing and able to work are not gainfully employed in any productive activity. It is a
situation in the labor market where the supply of labor is greater than its demand.
Cause of unemployment in india
The following are the main causes of unemployment:
(i) Caste System:
In India caste system is prevalent. The work is prohibited for specific castes in some areas.
In many cases, the work is not given to the deserving candidates but given to the person
belonging to a particular community. So this gives rise to unemployment.
(ii) Slow Economic Growth:
Indian economy is underdeveloped and role of economic growth is very slow. This slow growth
fails to provide enough unemployment opportunities to the increasing population.
(iii) Increase in Population:
Constant increase in population has been a big problem in India. It is one of the main causes of
unemployment. The rate of unemployment is 11.1% in 10th Plan.
(iv) Agriculture is a Seasonal Occupation:
Agriculture is underdeveloped in India. It provides seasonal employment. Large part of
population is dependent on agriculture. But agriculture being seasonal provides work for a few
months. So this gives rise to unemployment.
(v) Joint Family System:
In big families having big business, many such persons will be available who do not do any work
and depend on the joint income of the family.
Many of them seem to be working but they do not add anything to production. So they encourage
disguised unemployment.
(vi) Fall of Cottage and Small industries:
The industrial development had adverse effect on cottage and small industries. The production of
cottage industries began to fall and many artisans became unemployed.
(vii) Slow Growth of Industrialisation:
The rate of industrial growth is slow. Though emphasis is laid on industrialisation yet the
avenues of employment created by industrialisation are very few.
(viii) Less Savings and Investment:
There is inadequate capital in India. Above all, this capital has been judiciously invested.
Investment depends on savings. Savings are inadequate. Due to shortage of savings and
investment, opportunities of employment have not been created.
(ix) Causes of Under Employment:
Inadequate availability of means of production is the main cause of under employment. People
do not get employment for the whole year due to shortage of electricity, coal and raw materials.
(x) Defective Planning:
Defective planning is the one of the cause of unemployment. There is wide gap between supply
and demand for labor. No Plan had formulated any long term scheme for removal of
unemployment.
(xi) Expansion of Universities:

The number of universities has increased manifold. There are 385 universities. As a result of this
educated unemployment or white collar unemployment has increased.
(xii) Inadequate Irrigation Facilities:
Even after the completion of 9th five plans, 39% of total cultivable area could get irrigation
facilities.
Due to lack of irrigation, large area of land can grow only one crop in a year. Farmers remain
unemployed for most time of the year.
(xiii) Immobility of labour:
Mobility of labour in India is low. Due to attachment to the family, people do not go to far off
areas for jobs. Factors like language, religion, and climate are also responsible for low mobility.
Immobility of labour adds to unemployment.
Remedial measures undertaken by the government to reduce unemployment problem
The following steps have been taken by Govt, to increase employment opportunities:
1. Integrated Rural Development Programme (IRDP):
In 1978-79, government of India introduced IRDP to create full employment opportunities in
rural areas. Under this programme agriculture, animal husbandry, forests, fisheries, small and
cottage industries, construction of roads and canals etc. are to be developed in all the 5111
development blocks.
Moreover, to provide more employment, in the Seventh Plan a sum of Rs. 312 crores was spent
on this programme. It benefited 182 lakh families. In 1995- 96 about 21 lakh families have been
benefited.
2. Drought Prone Area Programme (DPAP):
This programme was launched in 70 such districts of 13 states as were prone to drought. The
programme has proved fruitful particularly in removing seasonal unemployment. In Sixth Plan,
the programme provided 17 crore and 70 lakh man-days of employment.
In the same period, a sum of Rs. 301 crores was made on the programme. In Seventh Plan, Rs.
474 crores has been spent for the programme.
3. Training for Self-Employment:
This programme was launched on 15th August, 1979 by the Government of India. It is called
National Scheme of Training of Rural Youth for Self Employment (TRYSEM). The main
objective of this programme is to reduce unemployment among the youth. During Seventh Plan
about 11.6 lakh youth were imparted training under the programme. During training period,
young men are given financial assistance. On completion of training, they are asked to prepare
project report. Arrangements are made to get them financial assistance from the banks. Every
trained youth is given a financial help varying from Rs. 3,000 to Rs. 5,000 to start his work. In
the Seventh Plan, under this programme, Composite Rural Training and Technical Centres
(CRTTC) were set up to impart training to rural youth. In 1995-96 training was to be provided to
2.8 lakh rural youth under this programme.
4. Jawahar Rozgar Yojana:
The Jawahar Rozgar Yojana was started on 28th April 1989. The objective of this Yojana is to
provide employment to at least one member of each poor rural family for fifty to a hundred days
a year at a work place near his residence. A special feature of the scheme is that 30% of the
employment generated will be reserved for women.
5. Employment in Foreign Countries:
Government also helps people to get employment abroad. Special agencies have been set up to

recruit people to serve in gulf countries like Kuwait, etc.
6. Self-employment to Educated Unemployed Youth:
In 1983, a scheme namely self-employment of educated unemployed was initiated. Under this
scheme, loans up to Rs. 25,000 are given to those educated unemployed who have no other
financial resources. This scheme is enforced by District Industries Centers. Government will give
25 percent as subsidy of the loans given by the banks under this scheme.
7. Nehru Rozgar Yojana (NRY):
This Yojana was started in 1989. There are three schemes under it. (1) Under the first scheme,
subsidy is given to urban poor to set up micro enterprises. In 1995, under this programme, 1.25
lakh families have been benefited. (2) Under the second scheme arrangements have been made
for wage-employment to labors in cities with less than 10 lakh population by providing Indian
Economic Development and Elementary Statistic ‘them basic facilities. In 1995, under this
scheme 93 lakhs man-days of employment have been provided. (3) Under the third scheme,
urban poor in the cities are to be provided employment opportunities in jobs like house repairing
etc.
8. Small and Cottage Industries:
In order to reduce unemployment, government if has made special efforts to develop small and
cottage industries. In 1995-96 about 33 lakh persons were employed in these industries.
9. Development of Organized Sector:
Many people are getting employment in organized public and private sectors. In 1995-96, nearly
340 lakh persons got employment in large industries. In 1961, organized public sector provided
employment to 70 lakh persons; now it provides employment to 1 crore and 92 lakh persons.
Likewise, in 1961 organized private sector provided employment to 50 lakh persons; in 2000 it
provided employment to 89 lakh persons.
10. Employment Exchanges:
Government has set up about 890 employment exchanges offering information on the possible
vocational avenues. These exchanges do not provide employment directly but are of great
assistance in directing the job-seeker to the possible areas of employment.
11. Employment Guarantee Scheme:
This Scheme has been launched in man; states, such as, Maharashtra, West Bengal, Kerala,
Rajasthan etc. Under the scheme unemployed persons are given economic assistance.
12. Employment Assurance Scheme:
The Employment Assurance Scheme (EAS) was launched in 1994 in 1752 backward blocks in
the country. The main objective was to provide 100 days of unskilled manual work to the rural
poor who are seeking employment.
13. Prime Minister’s Integrated Urban Poverty Eradication Program (PMIUPEP):
This programme has been implemented in 1995-96. This programme aims at to provide
employment to the urban poor. It will cover 50 lakh urban poor living in 345 towns. The central
government will incur an expenditure of Rs. 800 crores this programme during a period of Five
years.
14. The Swaran Jayanti Rozgar Yojana:
This plan began on December 1, whereas launching of this yojana, previous programmes meant
for providing employment to urban unemployed like Nehru Rozgar Yojana and Prime Minister
Integrate Urban Poverty Eradication Programme were merged into it. It aims at providing
selfemployment
or wage employment to urban unemployed and under- employ persons. It comprises

of two plans: (i) Urban Self- Employment Programme-(USE and (ii) Urban Wage Employment
Programme -(UWEP). Of the total expenditure on “Yojana, 75 percent will be borne by the
centre and 25 percent by the state governments. In the year 1997-98, a sum of Rs. 125 crore was
spending on this yojana.
15. Jawahar Gram Samridhi Yojana:
Jawahar Rozgar Yojana has been restructured as Jawahar Gram Samridhi Yojana with effect
from April 1999. This Yojana has been formulated to improve the quality of life of the rural poor
by providing the additional gainful employment.
16. Other Programmes:
Govt, of India launched other employment and poverty alleviation programme as under:
(i) Pradhan Mantri Gramodaya Yojana (PMGY)
(ii) Pradhan Mantri Gramodaya Yojana (Gramin Awas)
(iii) Pradhan Mantri Gramodaya Yojana-Rural Drinking water project.
(iv) Pradhan Mantri Gram Sadak Yojana (PMGSY)
(v) Autyodya Anna Yojana.
(vi) Jai Prakash Rozgar Guarantee Yojana (JPRGY).
(vii) Valmiki Ambedkar Awas Yojana (VAMBAY).
Underemployment
Underemployment refers to people who are working in a lower capacity than they are qualified
for, including in a lower-paid job or for fewer hours than they would like to work.
Full employment
Full employment is an economic situation in which all available labor resources are being used
in the most efficient way possible. Full employment embodies the highest amount of skilled and
unskilled labor that can be employed within an economy at any given time.
Poverty in india
Poverty is a great curse on humanity. A poor man, being poor, has not enough to eat. Being
underfed he remains inefficient and incapable. Being inefficient and incapable, he has low
working capacity. Low working capacity means low earning. Low earning means poverty
therefore, a man is poor because he is poor.
Meaning of poverty
Poverty is a social phenomenon. It is a widespread social problem in underdeveloped countries
of the world. Particularly in asia and Africa. Poverty may be defined as a social phenomenon in
which a section of the society is unable to fulfill even the basic necessities of the life. It is the
denial of opportunity to lead long, healthy, creative life and enjoy a decent standard of living,
freedom, dignity and self respect and the respect for others.
Meaning of poverty line
Poverty line is the level of income to meet the minimum living conditions. Poverty line is the
amount of money needed for a person to meet his basic needs. It is defined as the money value of
the goods and services needed to provide basic welfare to an individual.
Type of poverty
There are two aspect of poverty, namely, absolute poverty and relative poverty.
Absolute poverty is when household income is below a certain level, which makes it impossible
for the person or family to meet basic needs of life including food, shelter, safe drinking water,
education, healthcare, etc. In this state of poverty, even if the country is growing economically it
has no effect on people living below the poverty line. Absolute poverty compares households
based on a set income level and this level varies from country to country depending on its overall

economic conditions.
Relative poverty is when households receive 50% less than average household incomes, so they
do have some money but still not enough money to afford anything above the basics. This type
of poverty is, on the other hand, changeable depending on the economic growth of the country.
Causes of poverty in india
(i) Heavy pressure of population:
Population has been rising in India at a rapid speed. This rise is mainly due to fall in death rate
and more birth rate. India’s population was 84.63 crores in 1991 and became 102.87 crores in
2001. This pressure of population proves hindrance in the way of economic development.
(ii) Unemployment and under employment:
Due to continuous rise in population, there is chronic unemployment and under employment in
India. There is educated unemployment and disguised unemployment. Poverty is just the
reflection of unemployment.
(iii) Capital Deficiency:
Capital is needed for setting up industry, transport and other projects. Shortage of capital creates
hurdles in development.
(iv) Under-developed economy:
The Indian economy is under developed due to low rate of growth. It is the main cause of
poverty.
(v) Increase in Price:
The steep rise in prices has affected the poor badly. They have become more poor.
(vi) Net National Income:
The net national income is quite low as compared to size of population. Low per capita income
proves its poverty. The per capita income in 2003-04 was Rs. 20989 which proves India is one of
the poorest nations.
(vii) Rural Economy:
Indian economy is rural economy. Indian agriculture is backward. It has great pressure of
population. Income in agriculture is low and disguised unemployment is more in agriculture.
(viii) Lack of Skilled Labor:
In India, unskilled labor is in abundant supply but skilled labor is less due to insufficient
industrial education and training.
(ix) Deficiency of efficient Entrepreneurs:
For industrial development, able and efficient entrepreneurs are needed. In India, there is
shortage of efficient entrepreneurs. Less industrial development is a major cause of poverty.
(x) Lack of proper Industrialisation:
Industrially, India is a backward state. 3% of total working population is engaged in industry. So
industrial backwardness is major cause of poverty.
(xi) Low rate of growth:
The growth rate of the economy has been 3.7% and growth rate of population has been 1.8%. So
compared to population, per capita growth rate of economy has been very low. It is the main
cause of poverty.
(xii) Outdated Social institutions:
The social structure of our country is full of outdated traditions and customs like caste system,
laws of inheritance and succession. These hamper the growth of economy.
(xiii) Improper use of Natural Resources:
India has large natural resources like iron, coal, manganese, mica etc. It has perennial flowing

rivers that can generate hydro electricity. Man power is abundant. But these sources are not put
in proper use.
(xiv) Lack of Infrastructure:
The means of transport and communication have not been properly developed. The road
transport is inadequate and railway is quite less. Due to lack of proper development of road and
rail transport, agricultural marketing is defective. Industries do not get power supply and raw
materials in time and finished goods are not properly marketed.
INEQUALITY IN INCOME DISTRIBUTION IN INDIA
The most outstanding features of the capitalist economic system is the unequal distribution of
income and wealth. A very small percentage of population will be very rich while masses are
suffering from extreme poverty
Causes of inequalities in income distribution in india
1. Difference in occupation
2. Private ownership of property
3. Policy of the government
4. Chronic unemployment
5. High tax evasion
6. Corruption
7. Privatization.
Inflation in india Inflation is a quantitative measure of the rate at which the average price level of a basket of
selected goods and services in an economy increases over a period of time. It is the constant rise
in the general level of prices where a unit of currency buys less than it did in prior periods. Often
expressed as a percentage, inflation indicates a decrease in the purchasing power of a nation’s
currency.
Types of Inflation
Demand Pull Inflation
Cost-Push Inflation
Open Inflation
Repressed Inflation
Hyper-Inflation
Creeping and Moderate Inflation
True Inflation
Semi-Inflation
Demand Pull Inflation
This is when the aggregate demand in an economy exceeds the aggregate supply. This increase
in the aggregate demand might occur due to an increase in the money supply or income or the
level of public expenditure.
Cost-Push Inflation
Supply can also cause inflationary pressure. If the aggregate demand remains unchanged but the
aggregate supply falls due to exogenous causes, then the price level increases.
Open Inflation
This is the simplest form of inflation where the price level rises continuously and is visible to

people. You can see the annual rate of increase in the price level.
Repressed Inflation
Let’s say that there is excess demand in an economy. Typically, this leads to an increase in price.
However, the Government can take some repressive measures like price control, rationing, etc. to
prevent the excess demand from increasing the prices.
Hyper-Inflation
In hyperinflation, the price level increases at a rapid rate. In fact, you can expect prices to
increase every hour. Usually, this leads to the demonetization of an economy.
Creeping and Moderate Inflation
Creeping – In this case, the price level increases very slowly over an extended period of
time.
Moderate – In this case, the rise in the price level is neither too fast nor too slow – it is
moderate.
True Inflation
This takes place after the full employment of all the factor inputs of an economy. When there is
full employment, the national output becomes perfectly inelastic. Therefore, more money simply
implies higher prices and not more output.
Semi-Inflation
Even before full employment, an economy might face inflationary pressure due to bottlenecks
from certain sectors of the economy.
Causes of inflation Increase in Public Spending
In any modern economy, Government spending is an important element of the total spending. It
is also an important determinant of aggregate demand.
Usually, in lesser developed economies, the Govt. spending increases which invariably creates
inflationary pressure on the economy.
Deficit Financing of Government Spending
There are times when the spending of Government increases beyond what taxation can finance.
Therefore, in order to incur the extra expenditure, the Government resorts to deficit financing.
For example, it prints more money and spends it. This, in turn, adds to inflationary pressure.
Increased Velocity of Circulation
In an economy, the total use of money = the money supply by the Government x the velocity of
circulation of money.
When an economy is going through a booming phase, people tend to spend money at a faster rate
increasing the velocity of circulation of money.
Population Growth
As the population grows, it increases the total demand in the market. Further, excessive demand
creates inflation.
Hoarding
Hoarders are people or entities who stockpile commodities and do not release them to the
market. Therefore, there is an artificially created demand excess in the economy. This also leads
to inflation.
Genuine Shortage
It is possible that at certain times, the factors of production are short in supply. This affects
production. Therefore, supply is less than the demand, leading to an increase in prices and

inflation.
Exports
In an economy, the total production must fulfill the domestic as well as foreign demand. If it fails
to meet these demands, then exports create inflation in the domestic economy.
Trade Unions
Trade union works in favor of the employees. As the prices increase, these unions demand an
increase in wages for workers. This invariably increases the cost of production and leads to a
further increase in prices.
Tax Reduction While taxes are known to increase with time, sometimes, Governments reduce taxes to gain
popularity among people. The people are happy because they have more money in their hands.
However, if the rate of production does not increase with a corresponding rate, then the excess
cash in hand leads to inflation.
The imposition of Indirect Taxes
Taxes are the primary source of revenue for a Government. Sometimes, Governments impose
indirect taxes like excise duty, VAT, etc. on businesses.
As these indirect taxes increase the total cost for the manufacturers and/or sellers, they increase
the price of the product to have a minimal impact on their profits.
Price-rise in the International Markets
Some products require to import commodities or factors of production from the international
markets like the United States. If these markets raise prices of these commodities or factors of
production, then the overall production cost in India increases too. This leads to inflation in the
domestic market.
Non-economic Reasons
There are several non-economic factors which can cause inflation in an economy. For example,
if there is a flood, then crops are destroyed. This reduces the supply of agricultural products
leading to an increase in the prices of the commodities.
Measures to control inflation
The various methods are usually grouped under three heads: monetary measures, fiscal measures
and other measures.
1. Monetary Measures:
Monetary measures aim at reducing money incomes.
(a) Credit Control:
One of the important monetary measures is monetary policy. The central bank of the country
adopts a number of methods to control the quantity and quality of credit. For this purpose, it
raises the bank rates, sells securities in the open market, raises the reserve ratio, and adopts a
number of selective credit control measures, such as raising margin requirements and regulating
consumer credit. Monetary policy may not be effective in controlling inflation, if inflation is due
to cost-push factors. Monetary policy can only be helpful in controlling inflation due to
demandpull
factors.
(b) Demonetisation of Currency:
However, one of the monetary measures is to demonetise currency of higher denominations.
Such a measures is usually adopted when there is abundance of black money in the country.
(c) Issue of New Currency:
The most extreme monetary measure is the issue of new currency in place of the old currency.

Under this system, one new note is exchanged for a number of notes of the old currency. The
value of bank deposits is also fixed accordingly. Such a measure is adopted when there is an
excessive issue of notes and there is hyperinflation in the country. It is a very effective measure.
But it is inequitable for its hurts the small depositors the most.
2. Fiscal Measures:
Monetary policy alone is incapable of controlling inflation. It should, therefore, be supplemented
by fiscal measures. Fiscal measures are highly effective for controlling government expenditure,
personal consumption expenditure, and private and public investment.
The principal fiscal measures are the following:
(a) Reduction in Unnecessary Expenditure:
The government should reduce unnecessary expenditure on non-development activities in order
to curb inflation. This will also put a check on private expenditure which is dependent upon
government demand for goods and services. But it is not easy to cut government expenditure.
Though this measure is always welcome but it becomes difficult to distinguish between essential
and non-essential expenditure. Therefore, this measure should be supplemented by taxation.
(b) Increase in Taxes:
To cut personal consumption expenditure, the rates of personal, corporate and commodity taxes
should be raised and even new taxes should be levied, but the rates of taxes should not be so high
as to discourage saving, investment and production. Rather, the tax system should provide larger
incentives to those who save, invest and produce more.
Further, to bring more revenue into the tax-net, the government should penalise the tax evaders
by imposing heavy fines. Such measures are bound to be effective in controlling inflation. To
increase the supply of goods within the country, the government should reduce import duties and
increase export duties.
(c) Increase in Savings:
Another measure is to increase savings on the part of the people. This will tend to reduce
disposable income with the people, and hence personal consumption expenditure. But due to the
rising cost of living, people are not in a position to save much voluntarily.
Keynes, therefore, advocated compulsory savings or what he called ‘deferred payment’ where
the saver gets his money back after some years. For this purpose, the government should float
public loans carrying high rates of interest, start saving schemes with prize money, or lottery for
long periods, etc. It should also introduce compulsory provident fund, provident fund-
cumpension
schemes, etc. All such measures increase savings and are likely to be effective in
controlling inflation.
(d) Surplus Budgets:
An important measure is to adopt anti-inflationary budgetary policy. For this purpose, the
government should give up deficit financing and instead have surplus budgets. It means
collecting more in revenues and spending less.
(e) Public Debt:
At the same time, it should stop repayment of public debt and postpone it to some future date till
inflationary pressures are controlled within the economy. Instead, the government should borrow
more to reduce money supply with the public.
Like monetary measures, fiscal measures alone cannot help in controlling inflation. They should
be supplemented by monetary, non-monetary and non-fiscal measures.
3. Other Measures:

The other types of measures are those which aim at increasing aggregate supply and reducing
aggregate demand directly.
(a) To Increase Production:
The following measures should be adopted to increase production:
(i) One of the foremost measures to control inflation is to increase the production of essential
consumer goods like food, clothing, kerosene oil, sugar, vegetable oils, etc.
(ii) If there is need, raw materials for such products may be imported on preferential basis to
increase the production of essential commodities,
(iii) Efforts should also be made to increase productivity. For this purpose, industrial peace
should be maintained through agreements with trade unions, binding them not to resort to strikes
for some time,
(iv) The policy of rationalisation of industries should be adopted as a long-term measure.
Rationalisation increases productivity and production of industries through the use of brain,
brawn and bullion,
(v) All possible help in the form of latest technology, raw materials, financial help, subsidies, etc.
should be provided to different consumer goods sectors to increase production.
(b) Rational Wage Policy:
Another important measure is to adopt a rational wage and income policy. Under hyperinflation,
there is a wage-price spiral. To control this, the government should freeze wages, incomes,
profits, dividends, bonus, etc.
But such a drastic measure can only be adopted for a short period as it is likely to antagonise
both workers and industrialists. Therefore, the best course is to link increase in wages to increase
in productivity. This will have a dual effect. It will control wages and at the same time increase
productivity, and hence raise production of goods in the economy.
(c) Price Control:
Price control and rationing is another measure of direct control to check inflation. Price control
means fixing an upper limit for the prices of essential consumer goods. They are the maximum
prices fixed by law and anybody charging more than these prices is punished by law. But it is
difficult to administer price control.
(d) Rationing:
Rationing aims at distributing consumption of scarce goods so as to make them available to a
large number of consumers. It is applied to essential consumer goods such as wheat, rice, sugar,
kerosene oil, etc. It is meant to stabilise the prices of necessaries and assure distributive justice.
But it is very inconvenient for consumers because it leads to queues, artificial shortages,
corruption and black marketing. Keynes did not favor rationing for it “involves a great deal of
waste, both of resources and of employment.”
Disinflation
Disinflation is a decrease in the rate of inflation – a slowdown in the rate of increase of the
general price level of goods and services in a nation's gross domestic product over time. It is the
opposite of reflation.
Role of government in a market economy
1. Provide economy with legal structure
This is the first and most important function a government should provide and without it an
economy may collapse. This function requires the government to ensure property rights, provide
enforcement of contracts, act as a referee and impose penalties for foul play.
2. Protect the environment

Sometime the market system fails to produce efficient products because of side effects, such side
effects are known as externalities. These externalities have impact on the outside parties. If the
impact on outside party is negative, it is called negative externality. If the impact is positive, it is
called positive externality.
3. Protect the private property rights:
Property rights refer to the legal ownership of resources, which include the right to own, use and
sell them. Property rights are essential to the transactions in a market economy.
4. Provide infrastructure
The government should provide an integrated infrastructure. Infrastructure. Infrastructure refers
to those activities that enhance, directly or indirectly, output levels or efficiency in production.
The government should provide essential elements such as transportation, power generation,
communication and banking, educational and health facilities.
5. Stabilize economy and encourage economic growth
The role of the government is to stabilize the economy by reducing unemployment and inflation
and promoting economic growth. Macro economic policies for stabilization and economic
growth includes fiscal policies along with monetary policies.
6. Provide public goods
One of the important functions of a government is to provide public goods. Most goods and
services produced in market economy are private gods and services. Consumers purchase these
goods and consume these goods. Public goods will not be provided by private business in a
market economy. People can consume public goods without paying for them.
7. Redistribute the income
A market economy may produce unacceptably high levels of inequality of income. An important
role of government is to redistributing the income by taxing those people with large incomes and
give it to needy people. Welfare, social security and medicare programmes are examples of
programmes that support the poor, sick and elderly.
8. Main competition
Competition is important in market economies because it leads to lower production costs and
prices. If businesses become monopolies, the benefits of competition are lost.
9. Regulate private sector
The regulation of trade is another key focus area of policy because unrestricted trade can lead to
local markets facing inflation. The working of the CCI (competition Commission of India),
SEBI, IRDA and other such regulatory bodies working in tandem with central and state
government in india ensure that legal and ethical practices are followed and the general public is
given a fair deal.

MODULE 5 FOREIGN TRADE IN INDIA
Foreign trade in important for india because it affects the domestic economy in several ways. It
enhances output, employment and income. Exports provide important market outlets for a
number of industries. Likewise, imports are a source of supply to many other industries. Export
business earns foreign exchange for the country. In short foreign trade contributes to economic
growth of india.
Features of India’s foreign trade
1. More Share of GNP:
India’s foreign trade has great significance for its GNP. In 1980-81, India’s foreign trade
constituted 12% of its G.N.P. In 2001-02 it increased to 23.4% of gross national product.
2. Less Percentage of World Trade:
India’s share in world trade has been sliding down. In 1950-51, India’s share in total import trade
of the world was 1.8% and in total export trade was 2%. In 2001-02, it came down to 0.5% in
import trade and to 0.2% in export trade.
3. Change in Composition of Exports:
After independence, there was change in the composition of India’s export trade. Before,
independence, India used to export agricultural products and raw materials. Now on export side,
various types of finished products have been added to the number of export commodities.
4. Change in the Composition of Imports: In the post independence era, composition of India’s import trade has also undergone a change.
Prior to independence, India used to import finished products comprising of medicines, cloth,
motor vehicles, electrical goods, iron and steel etc. But now, its imports comprises of largely
petrol, machines, chemical fertilizers, oilseeds, raw materials, steel, oil etc.
5. Dependence on Few Ports:
India’s foreign trade is handled mainly by Bombay, Calcutta, Madras ports. Therefore, these
ports remain over busy. During planning period Government of India has developed three more
ports viz; Kandla, Cochin and Vishakhapatnam.
6. Balance of Trade:
Prior to independence, India’s balance of trade was favorable. But soon after independence, it
became unfavorable. In 1995-96, balance of trade was Rs. 42 crore which was favorable. From
1995-96 to onwards, it became unfavorable. Ending 1998-99, deficit of balance of trade was of
Rs. 28580 crore and Rs. 36181 in 2000-01. It is again expected to decline to Rs. 26014 crore in
2001-02.
7. Foreign Trade by Government:
In order to conduct foreign trade smoothly, Government has set up many corporations like State
Trading Corporation (1946), Minerals and Metal Trading Corporation (1963) etc.
8. Oceanic Trade:
Most of India’s foreign trade is by sea routes. India has very little trade relations with
neighboring countries like Nepal, Afghanistan, Burma, Sri Lanka etc. About 68% of India’s
trade is by sea.

9. Export Import Ratio:
Export import ratio refers to the percentage of total bill that can be paid out of export earnings. In
1991-92, export-import ratio was 92%. It means that. 8% of total imports were paid either by
foreign loans or by drawing from foreign exchange resources. In 1999-2000, export-import ratio
has increased to 95.4 per cent.
10. Dependent Trade:
India’s foreign trade depends mostly on foreign shipping companies, insurance companies and
banks. After independence, government has been paying special attention towards these aspects
of foreign trade.
Export Promotion
Export promotion has been defined as “those public policy measures which actually or
potentially enhance exporting activity at the company, industry, or national level”. Although
many forces determine the international flow of goods and services, export promotion is one of
the principal opportunities that governments have to influence the volume and types of goods
and services exported from their areas of jurisdiction.
Need for export promotion in india
1. To correct unfavorable balance of payment.
2. To earn more and more foreign exchange as to reduce foreign debt.
3. To meet out the growing need of foreign exchange for import of machineries and other
equipments.
4. To get international market for new products being produced by innovators and
entrepreneurs.To make economy self sufficient and thereby ensure sustainable economic
development.
Measures for export promotion in india
Some of the export promotion measures are listed below.
1. Duty Free Replenishment Certificate (DFRC): DFRC is issued to a merchant exporter
or manufacturer exporter for the duty free import of inputs such as raw materials,
components, intermediates, consumables, spare parts, including packing materials to be
used for export production. Such license is given subject of the fulfillment of time bound
export obligation.
2. Duty Entitlement Passbook Scheme (DEPB): Under the DEPB scheme, an exporter
may apply for credit as a specified percentage of FOB value of exports, made in freely
convertible currency. The credit shall be available against such export products and at
such rates as may be specified by the Director General of Foreign Trade (DGFT) by way
of public notice issued in this behalf, for import of raw materials, intermediates,
components, parts, packaging materials, etc.
3. Export Promotion Capital Goods Scheme (EPCG): EPCG scheme was introduced by
the EXIM policy of 1992-97 in order to enable manufacturer exporter to import
machinery and other capital goods for export production at concessional or no customs
duties at all. This facility is subject to export obligation, i.e., the exporter is required to
guarantee exports of certain minimum value, which is in multiple of tit1e value of capital
goods imported.
4. Duty Drawback (DBK): The Duty Drawback Scheme is administered by the Directorate

of Drawback, Ministry of Finance. Under this scheme, an exporter is entitled to claim
Customs duty paid on the import of raw materials, components and consumables
Central excise duty paid on indigenous raw materials, components
Consumables utilized in the manufacture of goods meant for export
5. Excise Duty Refund: Excise duty is a tax imposed by the central government on goods
manufactured in India. This duty is collected at source, i.e., before removal of goods from
the factory premises. Export goods are totally exempted from central excise duty.
However, necessary clearance has to be obtained in one of the following ways
Export under rebate
Export under bond
6. Octroi Exemption: Octroi is a duty paid on manufactured goods, when they enter the
municipal limits of a city or a town. However, export goods are exempted from Octroi.
Reasons for the slow growth of exports in india
1. Inadequate infrastructure facilities and incentives
2. Low quality of exportable goods
3. High cost of production of exportable goods
4. Lack of effective promotion.
5. Time and cost related delays in export
6. Use of traditional technology in production
7. High competition from foreign commodities
8. Tariff and trade policy of developed countries.
Exchange rate
An exchange rate is the value of one nation's currency versus the currency of another nation or
economic zone.
Exchange rate systems
Some of the major types of foreign exchange rates are as follows:
1. Fixed Exchange Rate System (or Pegged Exchange Rate System).
2. Flexible Exchange Rate System (or Floating Exchange Rate System).
3. Managed Floating Rate System.
1. Fixed Exchange Rate System:
Fixed exchange rate system refers to a system in which exchange rate for a currency is fixed by
the government.
1. The basic purpose of adopting this system is to ensure stability in foreign trade and capital
movements.
2. To achieve stability, government undertakes to buy foreign currency when the exchange rate
becomes weaker and sell foreign currency when the rate of exchange gets stronger.
3. For this, government has to maintain large reserves of foreign currencies to maintain the
exchange rate at the level fixed by it.
4. Under this system, each country keeps value of its currency fixed in terms of some ‘External
Standard’.
5. This external standard can be gold, silver, other precious metal, another country’s currency or
even some internationally agreed unit of account.
6. When value of domestic currency is tied to the value of another currency, it is known as
‘Pegging’.
7. When value of a currency is fixed in terms of some other currency or in terms of gold, it is

known as ‘Parity value’ of currency.
For, “Merits and demerits of Fixed Exchange Rate System”, refer Power Booster.
2. Flexible Exchange Rate System:
Flexible exchange rate system refers to a system in which exchange rate is determined by forces
of demand and supply of different currencies in the foreign exchange market.
1. The value of currency is allowed to fluctuate freely according to changes in demand and
supply of foreign exchange.
2. There is no official (Government) intervention in the foreign exchange market.
3. Flexible exchange rate is also known as ‘Floating Exchange Rate’.
4. The exchange rate is determined by the market, i.e. through interactions of thousands of banks,
firms and other institutions seeking to buy and sell currency for purposes of making transactions
in foreign exchange.
Exchange rate policy of india
The exchange rate of rupee ha an important role n defining the competitiveness of Indian goods
an services in international markets. The currency regimes used by Indian in the last 72 years
were of different variety.
Par value system (bretton woods system)(1947-1971)
After independence, india followed the par value system. Under this regime, the rupee’s external
par value was fixed with gold and UK pound sterling.
Pegged regime (1971-1991)
India pegged its currency to the US dollar (1971-1991) and to pound for 4 years. The following
the breakdown of Breton woods system, The value of pound collapsed, and india witnessed
misalignment of the rupee. To overcome the pressure of devaluation, india pegged its currency to
a basket of currencies.
Market based exchange rate
The need for adjusting exchange rate became essential due to the external payments crisis of
1991. The government was forced to take loans from the IMF to the extent of 1.8 billion in
January 1991.
Liberalized exchange rate management system
LERMS was introduced in 1992. The LERMS involved partial convertibility of rupee. Under
this system, india followed a dual exchange rate policy, where 40% of the exchange rate were to
be converted at the official exchange rate and the remaining 60% were to be converted at the
market based exchange rate.
Market based exchange rate system
By abolishing the dual exchange rate, it was finally unified in 1993. As a result, the Indian rupee
became managed float.
Objectives of exchange rate management
1. Reduce volatility in exchange rates, ensuring that the market correction of exchange rates is
effected in an orderly and calibrated manner.
2. Help maintain an adequate level of foreign exchange reserves
3. Prevent the emergence of destabilization by speculative activities; and
4. Help eliminate market constraints so as to assist the development of a healthy foreign
exchange market.
Capital account convertibility of the rupee
Capital account convertibility of the rupee is a distant dream because macroeconomic parameters
have to be stable before it is implemented. The low current account deficit should be sustained

and the fiscal deficit needs to be contained.
Intellectual property rights
A right that is had by a person or by a company to have exclusive rights to use its own plans,
ideas, or other intangible assets without the worry of competition, at least for a specific period of
time. These rights can include copyrights, patents, trademarks, and trade secrets. These rights
may be enforced by a court via a lawsuit. The reasoning for intellectual property is to encourage
innovation without the fear that a competitor will steal the idea and / or take the credit for it.
Types of intellectual property right
1. Patents
A patent grants property rights on an invention, allowing the patent holder to exclude others from
making, selling, or using the invention. Inventions allow many businesses to be successful
because they develop new or better processes or products that offer competitive advantage on the
marketplace. You get a patent by filing a patent application with the U.S. Patent and Trademark
Office (USPTO).
2. Trademarks
A trademark is a word, phrase, symbol, or design that distinguishes the source of products
(trademarks) or services (service marks) of one business from its competitors. In order to qualify
for patent protection, the mark must be distinctive. For example, the Nike "swoosh" design
identifies athletic foot ware made by Nike.
3. Trade Secrets
A trade secret is a formula, process, device, or other business information that companies keep
private to give them a business advantage over their competitors.
4. Copyrights
Copyrights protect original works of authorship, such as literary works, music, dramatic works,
pantomimes and choreographic works, sculptural, pictorial, and graphic works, sound
recordings, artistic works, architectural works, and computer software. With copyright
protection, the holder has the exclusive rights to modify, distribute, perform, create, display, and
copy the work.
Nature of Intellectual Property
Intellectual properties have their own peculiar features. These features of intellectual properties
may serve to identify intellectual properties from other types of properties. Thus, we will discuss
them in brief.
1. Territorial
Any intellectual property issued should be resolved by national laws. Why is it an issue? Because
intellectual property rights have one characteristic which other national rights do not have. In
ownership of intellectual property of immovable properties, issues of cross borders are not
probable. But in intellectual properties, it is common. A film made in Hollywood can be seen in
other countries. The market is not only the local one but also international. If a design in China is
imitated by another person in France which law would be applicable?
2. Giving an exclusive right to the owner
It means others, who are not owners, are prohibited from using the right. Most intellectual
property rights cannot be implemented in practice as soon as the owner got exclusive rights.
Most of them need to be tested by some public laws. The creator or author of an intellectual
property enjoys rights inherent in his work to the exclusion of anybody else.
3. Assignable
Since they are rights, they can obviously be assigned (licensed). It is possible to put a dichotomy

between intellectual property rights and the material object in which the work is embodied.
Intellectual property can be bought, sold, or licensed or hired or attached.
4. Independence
Different intellectual property rights subsist in the same kind of object. Most intellectual property
rights are likely to be embodied in objects.
5. Subject to Public Policy
They are vulnerable to the deep embodiment of public policy. Intellectual property attempts to
preserve and find adequate reconciliation between two competing interests. On the one hand, the
intellectual property rights holders require adequate remuneration and on the other hand,
consumers try to consume works without much inconvenience. Is limitation unique for
intellectual property?
6. Divisible (Fragmentation)
Several persons may have legally protected interests evolved from a single original work without
affecting the interest of other right holders on that same item. Because of the nature of
indivisibility, intellectual property is an inexhaustible resource. This nature of intellectual
property derives from intellectual property’s territorial nature. For example, an inventor who
registered his invention in Ethiopia can use the patent himself in Ethiopia and License it in
Germany and assign it in France. Also, copyright is made up of different rights. Those rights
may be divided into different persons: publishers, adaptors, translators, etc
Importance of intellectual property right
Intellectual property rights are accepted all over the world due to some important reasons. They
were essentially recognized for the acceptations of these rights are:-
Provides incentive to the individual for new creations.
Providing due recognition to the creators and inventors.
Ensuring the material reward for intellectual property.
Ensuring the availability of the original products.
For economic growth and advancement in technology sector protection of Intellectual
property protection is important.
They are benefited for the growth of the business in the field of technology.
Intellectual Property Rights in India Intellectual Property Rights are legal rights governing the use of creations of the human mind.
The recognition and protection of these rights is of recent origin. Patents, designs and trademarks
are considered as industrial property. As per International Convention for the protection of
industrial (Paris Convention) the protection of industrial property has as its object patents, utility
models, industrial designs, trademarks, service marks, trade names, indications of source or
appellations or origin and the repression of unfair competition when copyrights, Geographical
indicators, layout Designs and confidential information were included to industrial property, they
all become intellectual property.
With the trade related Aspects of Intellectual Property Rights (TRIPS) Agreement of
World Trade Organisation (WTO), the intellectual property rights attained the authority to
enforce the law internationally. According to TRIPS, the intellectual property rights are:
1) Copyright and Related Rights
a) Rights of artists, painters, musicians sculptors, photographers, and authors for copyright in
their works;
b) Rights of computer programmes whether in source or object code for a copyright in their

programmes and compilation data;
c) Rights of performers producers of phonogram’s and broadcasting organizations in respect of
fixation on their programmes for copyright in their work.
2) Right of traders in their trade marks.
3) Right of manufacturers & producers on geographical indication in relation to such products
and produce.
4) Right of designers for their distinctive design striking to the eye.
5) Patents:
a) Right of the inventor for patent is his invention.
b) Rights of plant breeders and farmers.
c) Rights of biological diversity.
6) Right of computer technologist for their layout design of integrated circuits.
7) Right of businessmen for protection of their undisclosed information on technology and
management.
Foreign capital and MNC in india
Capital is required for speedy economic development of a country. A country can obtain capital
from two sources, namely, internal sources and external sources, capital raised from internal
sources is inadequate for underdeveloped and developing countries. Therefore, they depend upon
external sources of a capital for initiating their process of economic development.
Types of foreign capital or foreign investment
Funds from foreign country could be invested in shares, properties, ownership / management or
collaboration. Based on this, Foreign Investments are classified as below.
Foreign Direct Investment (FDI)
Foreign Portfolio Investment (FPI)
Foreign Institutional Investment (FII)
Details on each of the foreign investment type can be found below :
Foreign Direct Investment (FDI)
FDI is an investment made by a company or individual who us an entity in one country, in the
form of controlling ownership in business interests in another country. FDI could be in the form
of either establishing business operations or by entering into joint ventures by mergers and
acquisitions, building new facilities etc.
Forms of FDI
The various type of Foreign Direct Investment includes:
Horizontal FDI: It is the investment done by a company or organization which practices
all the tasks and activities done at the investing company, back at its own country of
operation. Therefore, basically such investors are from the same industry where
investments are done but operating in two different countries. For e.g., a car manufacture
in Australia invests in a car manufacturing company of India.
Vertical FDI: The industry of the investor and the company where investments are done
are related to each other. This type of FDI is further classified as:
Forward Vertical FDI: In such investments, foreign investments are done in
organizations which can take the products forward towards the customers. For e.g., a car
manufacturing company in Australia invests in a wholesale Car Dealer company in India.
Backward Vertical FDI: IN such investments, foreign investments are done in an
organization which is involved in sourcing of products for the particular industry. For

e.g., the car manufacturer of Australia invests in a tyre manufacturing plant in India.
Conglomerate FDI: Such investments are done to gain control in unrelated business
segments and industries in a foreign land. For e.g., the car manufacturer of Australia
invests in a consumer durable good manufacturer in India. Here the investing company
ideally manages two challenges, first being gaining operational control in a foreign land,
and the second being starting operations in a new industry segment.
Greenfield Entry: In this special type of FDI, the investing company refers to an
investing organization starting assembling from scratch just like Honda did in United
Kingdom
Foreign Takeover: This type of FDI takes the form of a foreign merger, acquisition or
takeover of an existing foreign company.
Foreign Portfolio Investment (FPI)
Foreign Portfolio Investment (FPI) is an investment by foreign entities and non-residents in
Indian securities including shares, government bonds, corporate bonds, convertible securities,
infrastructure securities etc. The intention is to ensure a controlling interest in India at an
investment that is lower than FDI, with flexibility for entry and exit.
Foreign Institutional Investment (FII)
Foreign Portfolio Investment (FPI) is an investment by foreign entities in securities, real
property and other investment assets. Investors include mutual fund companies, hedge fund
companies etc. The intention is not to take controlling interest, but to diversify portfolio ensuring
hedging and to gain high returns with quick entry and exit.
Need for foreign capital or foreign direct investment 1. It provides local economic benefits in multiple locations.
The companies or individuals that participate in FDI can stimulate community economic growth
on the local level for their headquarters or home. Profits are often reinvested into workers or
increasing organizational opportunities, which can create new jobs, which then creates new FDI
opportunities. The investments do the same for the home market of the foreign organization as
well.
2. It makes international trade easier to complete.
Many countries have import tariffs that must be paid for goods and services. Import/Export
businesses can struggle to keep products at affordable prices for customers because of these
taxes. Through FDI, it becomes possible to limit or eliminate these tariffs since a minimum stake
in a foreign organization occurs. That gives the local business more control over the market
while maintaining price competition.
3. Foreign income can increase.
Many foreign markets have employees working at wages that would be considered poverty
wages in the United States. A majority of the world earns less than $4 per hour. Some
international markets offer less than $1 per hour. With FDI, foreign income levels can increase.
Worker wages increase. That creates new resources that can help communities to begin growing.
4. It improves human resources.
Businesses are successful because humans have expertise. In the under-developed and
developing world, human skills are limited to basic labor, agricultural work, and other entrylevel
skills. Foreign direct investment creates educational opportunities so that people can
improve their personal skill base. With better skills, higher wages can be earned. Greater
productivity levels are achieved. The company benefits, as does the individual, and that trickles

down to each community.
5. It allows your money to work harder for you.
To encourage FDI, many governments have placed tax incentives on this type of investment.
That makes more money available to work for a foreign company without disrupting the
investing agency’s budget dramatically. These incentives make it easier to accomplish goals
because the money involved can be directed toward resources instead of government coffers. At
the same time, the gap between cost and revenue is reduced, providing more opportunities to find
profit streams.
6. It provides a foreign company with needed experience.
Investors bring more than money to an FDI relationship. They can also bring their personal
experiences within a specific industry. For the foreign company, such an investment can create
an immediate surge in productivity. Investments can also provide better facilities for the foreign
organization, better equipment assets, and improved vendor access if contact access from the
investor is permitted in the relationship.
7. It creates new opportunities for workers.
Workers who are employed by the investing company can travel overseas and experience new
cultures and ideas. That can make them more productive at home. Foreign workers have better
access to the best practices that have been developed, which helps them to create new
opportunities as well. This process helps both parties grow faster than if they were on their own.
FDI in india(measures taken by the government of india to attract FDI)
1. Granting of automatic permission for foreign equity participation up to 51% in high
technology and high investment priority industries.
2. Allowing foreign equity participation up to 51% in international trading companies. Hotel
industry and tourist industry.
3. Allowing the MNCs to use their trade marks in india with effect from 14th may 1992
4. Allowing 100% foreign equity for setting up of power plants with free repatriation of
profits.
5. Allowing 100% equity contribution by the NRIs and the corporate bodies owned by NRIs
in high priority industries, with automatic approval and capital repatriation benefits.
6. Foreign investors can disinvest at market rates on stock exchanges from September 15,
1992. However, they should repatriate the proceeds of such disinvestment.
7. The holding non banking financial companies can hold foreign equity up to 100%.
8. Foreign investors are allowed to establish 100% operating subsidiaries and should bring
at least 50 million for this purpose.
9. Private sector firms can have FDI up to 49% in automatic route subject to conformity to
reserve bank of india guidelines.
10. 100% FDI is permitted in business to business e commerce, power sector and oil refining.
11. 74% FDI allowed subject to licensing and security norms in internet service providers
with gateways, radio paging and end to end bank width. However, 100% FDI is allowed
in other telecommunication projects.
Multinational corporations A multinational corporation (MNC) has facilities and other assets in at least one country other
than its home country. Such companies have offices and/or factories in different countries and
usually have a centralized head office where they coordinate global management. Very large
multinationals have budgets that exceed those of many small countries. Multinational

corporations are sometimes referred to as transnational, international or stateless corporations.
Factors Responsible for the growth of MNCs
The main factors which have contributed towards the growth of multinational corporations are
given below:
1. Market Expansion : The growth of GDP and per capita income in various countries led to
increasing demand for goods and services. Companies in developed economies explained their
operations overseas to exploit the expanding markets abroad.
Marketing Superiorities: Multinationals enjoy the following marketing superiorities over the
following over the domestic companies:
a) Availability of more reliable and up-to-date information about market conditions.
b) Reputation in the market due to popular brands and image.
c) More effective advertising and sales promotion techniques.
d) Wide distribution network.
e) Quick transportation and warehousing facilities.
2. Financial Superiorities: Multinationals are financially superior to domestic companies in the
following respects:
a) Huge financial resources.
b) More effective and economical utilisation of funds through transfer of excess funds from one
country to another.
c) Easy access to foreign capital markets.
d) Easy mobilisation of high quality resources of different types.
e) Access to international banks and financial institutions.
3. Technological Superiorities: Multinationals have strong R & D departments. They can invent
and innovate new products and processes more easily and frequently. This provides them an
edge over national companies. Developing countries invite multinationals for advanced
technology due to the following reasons:
a) Developing countries do not have the resources to develop advanced technology and the level
of industrialisation is low.
b) They are unable to exploit their rich mineral and other natural resources due to shortage of
funds and low level technology.
c) They do not have adequate foreign exchange reserves to import raw materials, capital
equipment and technology on their own.
d) They face difficulty in marketing their products in highly competitive world markets.
Harmful effect of foreign capital / FDI/MNCs on the Indian economy
1. Increase competition
2. National sovereignty
3. Adverse effect on domestic companies.
4. unfavorable balance of trade
5. No larger employment.
6. Hampers the consumers interest
7. Investment in profitable areas only.
8. Outdated technology
9. Political interference
10. Social and cultural Implications
11. Ignoring the needs of India.
12. Fast depletion of resources.

13. Adverse effect on the traditional industries.
14. Unethical business practices
15. Avoidance of tax.
16. No social obligations.
17. Outflow of fund.
Trade Reforms
The main features of trade sector reforms introduced by the government after 1991 were as
under:
(i) Removal of Quantitative Restrictions on Imports:
Prior to trade reforms, there was much complexity in the import policy on account of the
existence of different categories of importers, diversities in import licenses and varied ways of
making imports. A step was taken in the direction of simplification and liberalisation of imports.
In March 1996, import restrictions were removed off 6161 tariff lines. In 2000-01 and 2001-02,
quantitative restrictions were removed in the case of 714 and 715 tariff lines respectively. This
process continues through regional agreements with SAARC and ASEAN countries.
(ii) Reduction in Import Tariffs:
In connection with the aim of liberalisation of imports, the government attempted to proceed in
accordance with the recommendations of the Chelliah Committee for the rationalisation of tariff
structure in the country. In the 1993-94 Budget, the government of India reduced the peak rates
of import duty from 110 percent to 85 percent. Subsequently, the government continued to scale
down the peak rates of import tariffs in phases. At present, the peak rate of import duty on
nonagricultural
goods is only 10 percent.
(iii) Convertibility of Rupee on Current Account:
An important reform in the direction of liberalisation in the fields of trade and payments was
related to the convertibility of rupee with other currencies. The partial convertibility of rupee was
introduced in 1992-93. The full convertibility of rupee on current account was introduced in
1994-95. Consequently, the exchange rate of rupee no longer remained pegged. It became a
market- determined rate.
The government adopted a more cautious approach in respect of convertibility of rupee on
capital account. It was decided that the convertibility of rupee on capital account would be
introduced in a phased manner. A considerable progress in this regard has already been made.
(iv) Decanalisation:
The government had set up prior to 1991, the organisations like State Trading Corporation and
Metals and Mineral Trading Corporation in the public sector. The imports and exports of several
products used to be canalised through them. 20 of the import items and 16 of the export items out
of them were decanalised by the government in August 1991. The decanalisation process
remained continued in the subsequent years.
(v) Concessions and Exemptions:
In order to liberalise imports and to promote exports, the government extended a number of tax
concessions and exemptions during the 1990’s.
(vi) Promotion of Exports of Services:
In order to promote the export of services, the EXIM Policy 2002-07, announced in March 2003,
included several measures. The advance license system was announced for the tourism sector.
The firms, under this system, were permitted to make duty-free import of consumable goods and
spares upto 5 percent of their average export earnings over the previous three years, provided

they were actual uses of the items to be imported.
(vii) Special Economic Zones (SEZ) Scheme:
In March 2000, the government announced the scheme for the establishment of Special
Economic Zones (SEZ) for the boosting up of exports. Such zones could be set up in public
sector, joint sector or by the State governments. The essential purposes for setting up the SEZ’s
were to ensure hassle-free exports and to increase the competitiveness of Indian exports in the
international markets. In 2004-05
(viii) Setting Up of Agricultural Export Zones:
The EXIM Policy of 2001 put forward the proposal of setting up of Agricultural Export Zones
(AEZ). This scheme was meant for promoting agricultural exports and to organise the export
effort on the basis of specific products and specific geographical areas. The scheme assured to
provide the latest services related to various aspects of agriculture.
(ix) Export-Oriented Units (EOU) Scheme:
This scheme is complementary to SEZ scheme. It offers more extensive and wide options for the
establishment of export-oriented units.
(x) Setting up of Trading Houses:
The trade policy of 1991 permitted the export houses and trading houses to import a wide range
of products. The trade policy of 1992-97 allowed them the duty-free imports. A new category of
trading houses called Super Star Trading Houses was introduced under the 1994-95 trade policy.
Those trading houses were included in this category in case of which value of exports over the
previous three years average of Rs. 925 crore or in case of which the value of exports in the
preceding year amounted to Rs. 1387.5 crore.
The government also permitted the setting up of trading houses with 51 percent foreign equity
for the expansion of exports. According to Foreign Trade Policy 2004-09, the star trading houses
could retain upto 100 percent of their exchange earnings through exports.
(xi) Market Access Initiative Scheme:
In order to promote the sale of products in foreign markets, this scheme was launched in 2001-
02. Under this scheme, in-depth market studies are conducted related to the expansion of export
of specific products in some selected countries. For generating the demand for domestic products
in foreign markets, trade fairs and exhibitions are organised. The publicity campaigns are
undertaken in foreign countries. The efforts are made to upgrade the quality of products in
accordance with the requirements of the foreign buyers.
Key features of the new foreign trade Policy
1.India to be made a significant participant in world trade by 2020
2. Merchandize exports from India (MEIS) to promote specific services for specific Markets
Foreign Trade Policy
3.FTP would reduce export obligations by 25% and give boost to domestic manufacturing
> FTP benefits from both MEIS & SEIS will be extended to units located in SEZs
> FTP 2015-20 introduces two new schemes, namely "Merchandise Exports from India Scheme
(MEIS)" and "Services Exports from India Scheme (SEIS)". The 'Services Exports from India
Scheme' (SEIS) is for increasing exports of notified services. These schemes (MEIS and SEIS)
replace multiple schemes earlier in place, each with different conditions for eligibility and usage.
Incentives (MEIS & SEIS) to be available for SEZs also. e-Commerce of handicrafts,
handlooms, books etc., eligible for benefits of MEIS.
> Agricultural and village industry products to be supported across the globe at rates of 3% and

5% under MEIS. Higher level of support to be provided to processed and packaged agricultural
and food items under MEIS.
> Industrial products to be supported in major markets at rates ranging from 2% to 3%.
> Served From India Scheme (SFIS) will be replaced with Service Export from India Scheme
(SEIS).
> Branding campaigns planned to promote exports in sectors where India has traditional
Strength.
> SEIS shall apply to 'Service Providers located in India' instead of 'Indian Service Providers'.
> Business services, hotel and restaurants to get rewards scrips under SEIS at 3% and other
specified services at 5%.
> Duty credit scrips to be freely transferable and usable for payment of customs duty, excise duty
and service tax.
> Debits against scrips would be eligible for CENVAT credit or drawback also.
> Nomenclature of Export House, Star Export House, Trading House, Premier Trading House
certificate changed to 1,2,3,4,5 Star Export House.
> The criteria for export performance for recognition of status holder have been changed from
Rupees to US dollar earnings
> Manufacturers who are also status holders will be enabled to self-certify their manufactured
goods as originating from India.
> Reduced Export Obligation (EO) (75%) for domestic procurement under EPCG scheme.
> Online procedure to upload digitally signed document by Chartered Accountant/Company
Secretary/Cost Accountant to be developed.
> Inter-ministerial consultations to be held online for issue of various licenses.
> No need to repeatedly submit physical copies of documents available on Exporter Importer
Profile.
> Validity period of SCOMET export authorisation extended from present 12 months to 24
months.
> Export obligation period for export items related to defense, military store, aerospace and
nuclear energy to be 24 months instead of 18 months
> Calicut Airport, Kerala and Arakonam ICDS, Tamil Nadu notified as registered ports for
import and export.
> Vishakhapatnam and Bhimavarm added as Towns of Export Excellence.
> Certificate from independent chartered engineer for redemption of EPCG authorisation no
longer required.
Kerala economy Kerala is blessed with enchanting natural beauty. It has varied flora and fauna. It has many
sunsoaked
beaches, a network of rivers and backwaters, evergreen forest and numerous hill resorts.
An overview of Kerala economy
Kerala is known as God's own country. It has natural beauty. The State stands second due to its
world class infrastructure and well-trained human resources pool. However, Kerala economy is
not well-developed like Maharashtra, Punjab, Tamilnadu etc. Kerala is the 11th largest economy
in India. An overview of kerala economy may be given in the following pages.
1. Gross State Domestic Products (GSDP): When compared to some states, Kerala's GDP is
low. But it is above Indian average. At current prices, Kerala's Gross State Domestic product

!GSDP) was about US$ 106. 52 billion in 2017-18Q. The state's GSDP recorded at a CAGR of
11. 16 per cent between 2011.-12 and 2017-18Q.
2 . Per Capita income
The states Per capita GSDP was US $ 3089 during 2017-18. The per capita GDP in 2017-18 was
Rs: 140107.
3. Agriculture: The economy of Kerala is hugely dependent on its agriculture. The distinction of
the agricultural sector of the economy can be noted from the fact that 96% of India's entire yield
of pepper and 91% of natural rubber is produced in Kerala. Other important crops in the region
are coconut, tea, coffee, cashew, and spices such as cardamom, vanilla, cinnamon, and nutmeg.
Rice is the staple food of the natives and is grown in abundance in the state. Home gardening is a
common activity in Kerala and the citizens contribute significantly to the economy by indulging
in this pleasurable pursuit.
4.Livestock: Livestock and animal husbandry is an equally important facet of Kerala's economy.
It has been suggested as an apt occupation for the rural populace and as the remedy for
unemployed women and the economically weaker classes such as the landless. Almost 58% of
Malayalis households (38 lakhs of the 55 lakh households) are engaged in managing livestock
and such activities such as Feeding, milking, cattle breeding, livestock management, health care
and allied endeavors. The government of Kerala promotes livestock and cattle rearing by
offering lucrative incentives to those engaged in the profession and holds educational programs.
The introduction of new breeds of cattle such as "Sunandini" is also an encouraging factor.
5. Fisheries: Fisheries contribute about 3% to the total economy of the state. The natural
landforms of the state endow Kerala with a huge output of marine and freshwater fish haul each
year. About 10.85 lakh people earn their livelihood from fishing and allied activities such as
drying, processing, packaging, exporting and transporting fisheries. The well being of these
fishermen and workers depends on the proper implementation of the various schemes devised by
the Department of Fisheries. The government of Kerala is enforcing every measure possible in
their interest. The state alone yields 6.75 lakh tonnes of fish every year.
6. Forestry & Wildlife: About 10,336 sq.km of Kerala is densely forested. This constitutes
26.6% of the total geographic land. A huge spectrum of flora and fauna has its home in this
verdant state. Thus forestry and wildlife plays a major role in the state's economy. The revenue
earned from export of herbs and herbal byproducts such as oils, hides of animals such as the
jaguar, fox, elephant etc., tree barks, natural incense, scents, ivory, sandalwood, teakwood,
rosewood etc contribute as a major foreign exchange earner. A number of indigenous industries
have also mushroomed owing to this phenomenon. These include leather product manufacturing
units, fragrance and incense preparing cottage industry, sandal and ivory carving business and
coir product manufacturing units.
7.Industry & infrastructure: A number of industries in Kerala are booming and flourishing.
The textile and electronics industry in Kerala is on an all time high. Coffee, tea, cardamom,
ginger, pepper coconut kernels form the bulk of the exports from the state. Kerala has about 1.8
lakh small scale industries and about 511 medium sized and large scale industries. The roads of
the state too are in excellent metaled condition. The state boasts of having 145,704 km of roads
and 8 national highways. Traffic in the state grows at 11% annually.
8. Minerals & Energy: A high output of hydel power had held Kerala in good stead till recently.
The steady increase in industries and an inability to undertake more hydel energy generating
projects has forced the state to look towards diesel energy and thermal energy import. Kerala is
the second largest diesel-based thermal electricity generator in India. The state's national market

share is over 21%. The state is rich in its mineral ores as well. The finest variety of China Clay in
India is available here. Bauxite, quartz, silica etc are some minerals available freely in the state.
Kerala is blessed with a bounty of mineral wealth.
9. Banking & Finance: Kerala has its share of banking and financial institutions. Besides the
PSUs, a number of leading private banks such as HDFC Bank, ICICI Bank, ABN Amro Bank
etc. have set up a network of retail branches and ATMs for the residents of the state. Besides
traditional products these offer a plethora of financial services especially NRI services owing to
the extent of Malayali Diaspora. Mutual funds, financial lending institutions and other such
services are easily available in the state.
10. Kerala Tourism: Tourism in Kerala is the livelihood of over 7 lakh people and generates
revenue of about 4000 crore rupees (Rs. 40,000 million). Kerala remained till a decade back, a
sheltered, secluded pristine haunt and was popular as a tourist destination only to the country.
This well guarded secret was let out in the mid 90's when the Government of Kerala and the
Department of Tourism actively started promoting the region as a cherished tourist destination.
The influx of global backpackers into the state has been ever increasing and the allied businesses
involved such as hotels and accommodation and transport etc have also flourished.
Kerala Real Estate: The real estate sector of the state's economy is really on an upswing. Increase
in population and increased access to home finances has increased the demand for constructing
houses. While various institutions such as The Kerala State Housing Board, Rural Development
Department, Kerala State Co-operative Housing Federation, Agricultural Bank and Kerala State
Development Corporation are busy implementing the various housing schemes devised by the
Government of Kerala, various mushrooming PSU and other financial institutions are wooing the
people of Kerala with funds and financial aid towards housing and home building.
11. Health Care: The medical profession and the healthcare industry in Kerala is growing in
leaps and bounds. Dentistry, cardiac sciences, oncology, ophthalmology, nursing and
biotechnology are major growth fields. With the growth of medical education, there has been a
spectacular increase in the number of hospitals and diagnostic centers in the state. Medical
tourism to the state is a major revenue earner. Tourists especially from the Gulf and Middle East
where the costs of surgical procedures, post operative care and pharmaceutical drugs are very
high.
12. IT Sector: With the boom in the IT sector of Kerala, the state has become one of the most
promising destinations in the entire continent for software development, e-commerce and
ebusiness
solutions. The rise in the number of professionals employed in this sector has steeply
risen following the active promotion of educational institutions offering courses such as MCA,
Bsc (Comp), Software Engineering etc. This is a direct result of the Government of Kerala's
active IT Mission which aims at creating about 2 lakh vacancies in the sector by 2010.
Features of kerala economy
1. Kerala economy is the eleventh largest economy in india.
2. The growth rate of GDP is 11.4% during the year 2017-18
3. The percapita GDP is estimated at rs . 230526
4. Agricultural sector contribute 13% to GSDP, industrial sector 24% and service sector 63%.
5. Agriculture continues to be dominant source of livelihood in the state.
6. Industrial development is low in india.
7. Kerala economy is largely dependent on trade in services and foreign remittance.
8. Kerala is eleventh as regards unemployment in india.

9. Main agricultural crops are pepper, rubber, coconut, tea, coffee, cashew, tapioca, spices, rice
etc. most of the crops are cash crops.
10. Kerala is the only state where government sells liquor to people.
11. Kerala is one of the most popular tourist destinations in the world.
12. The main source of power is hydro electric power
13. Kerala’s traditional industris include handloom, cashew, coir and handicrafts
14. One of the main items of export is spices.
15. Kerala has large deposits of some rare minerals sucha s monozite, elmenite, thorium etc,
16. Kerala is a deficit state.
17. It has second highest population density in india
18. In terms of infrastructure penetration, kerala is a leading state.
Business opportunities in kerala
At present kerala is lagging behind in respect of business and industries. But there is
tremendous potential in kerala. There are more business opportunities here due to the following
reasons.
1. The kerala advantage
Kerala has an enviable tradition of literacy and social development. It is endowed with
unique natural resources and is supported by the thriving diaspora.
2. High quality human capital and social development
3. Traditional areas of strength
4. Economically successful diaspora
5. Top quality infrastructure
6. Investment climate
Trade and commerce in kerala
Trade and commerce form an important part of kerala economy. In kerala internal trade is
being conducted on large scale. Kerala is a good market for many business houses (both national
and international). The external trade in kerala is mainly operated through cochin port. Major
items of trade are cashew, coir and coir products, tea, coffee, pepper cardamom, ginger, other
spices oil and marine products, machinery chemicals, coal, fertilisers and raw materials. Imports
through cochin port continued to increase in 2016-17 touching 202.48 lakh MT compared to
181.84 lakh MT in 2015-16 showing an increase of 11.36 percent, fertilizers and raw materials,
iron and steel and machinery, newsprint, raw cashew nut, food grains, POL are the main items of
import.
Reason for the growth of trade and commerce in kerala
1. Density of population
2. Cultural factors
3. Development of transport and communication
4. Development of tourism.
5. Development of banking and finance.
Major Industries in Kerala
Kerala is mainly dominated by handloom, handicraft, bamboo, coir, khadi & village, cashew,
tourism etc.
1. Agriculture & Livestock
Kerala is mainly involved into the production of pepper, natural rubber, tea, cashew, spices,
coffee, coconut. All its agriculture production is send across the country. It produces various

types of spices including vanilla, cardamom, nutmeg, cinnamon. Kerala has huge workforce for
all these tasks. The state is also known for its huge varieties of rice.
2. Tourism
Tourism is one of the major industries in Kerala. The state has various tourist places that attract
the tourist from all across the word. Some of the most visited areas are Kovalam, Fort Kochi,
Munnar, Ponmudi, Nelliampathi, , Kozhikode, Alappuzha, Thrissur. The major tourist attractions
are coastal areas, mountains, temples, wildlife sanctuary etc.
3. Oil Refining & Petrochemicals
The city is also having oil refining and petrochemical industry in the city of Kochi. It has one of
the leading state owned refinery in India with the huge production capacity. Its oil refinery is
referred as Kochi Refinery which was formerly named as Cochin Refineries Ltd. Kochi Refinery
is engaged in Refining and marketing of petroleum products.
4. Ship Building
Ship Building is one of the major industries in Kerala. The state has largest ship building facility
in India. Cochin Shipyard was started in the year 1972 as fully owned by Government of India
company. The yard is involved into building and repairing of largest vessels in India. It is also
building Shipyard for Indian Navy .Recently Cochin Shipyard won a major repair orders from
ONGC.
5. Energy
India’s largest floating solar power plant set up on the Banasura Sagar reservoir in Wayanad,
Kerala. The state is contributing hugely in the promotion of solar energy.
6. Chemical Industry
Aluva is one of leading industrial belt in Kerala. The industrial belt is manufacturing of wide
range of chemical products including pesticides, rubber processing chemicals, zinc/ chromium
compounds, rare-earth elements and leather products.
7. Handloom
Handloom is one of the leading sector in Kerala. The industry in mainly concentrated
in Thiruvananthapuram and Kannur districts.
8. Handicrafts
Handicraft is one of the major industries in Kerala. It is also contributing into the generation of
employment into that state. The handicrafts products includes coconut shell carving, bamboo and
reed weaving, bell metal casting, straw picture making, mat weaving, ivory carving
etc. Handicrafts Development Corporation and Artisans Development Corporation are the major
promotional agencies of the industry.
9. Bamboo Industry
Bamboo is mainly used in the State for the manufacture of pulp for making paper, bamboo ply
and in traditional bamboo industry. . The Kerala State Bamboo Corporation has created a new
product Flattened Bamboo Board which is going to hit the market along with bamboo ply.
10. Khadi and Village Industry
The state has Khadi and Village Industries Board. It does various activities through registered
institutions, cooperative societies by the financial assistance from Khadi Commission,
Nationalized Banks and State Government.
11. Cashew Industry
It has Kerala State Cashew Development Corporation which is involved into development of this
Industry. KSCDC exports cashew kernels and cashew shell liquid. The Institutions promoting
industrial activity in the Sate are the following.

Causes for industrial backwardness of kerala
1. Geographical location of the state.
2. Technological backwardness.
3. Lack of large tracts of land.
4. Population density.
5. Higher price for land.
6. Higher cost of labor
7. Public agitations against wrong doings of factory.
8. Procedural formalities
9. Lack of raw materials
10. Ecological problems
11. Corruption
12. Low central investment
13. Other causes.
Measures taken by the government to promote industries in kerala Kerala is traditionally backward in industrial development. So the government has come forward
with policy initiative for greater industrial investment and has laid stress on facilitating more
private industrial investment in the state. Let us examine the measures or initiatives taken by the
government for the rapid industrialisation of kerala.
1. Special economic zones
The special policy of central government provides for setting up of special economic
zones for inviting world class industrial ventures with a competitive edge in the public, private,
joint sector or by state government..
2. Restructuring and revival of public sector undertakings
Several initiatives were taken to restructure and revive PSUs under the industries
department. Comprehensive restructuring packages were successfully implemented in kerala
state electronic development corporations ltd.
3. Strengthening of IT industry
Developments in the IT sector in the state affirms that kerala’s to catch up with other
important centres of information technology development like banglore, hyderabad and chennai
are becoming fruitful.
4. Industrial policy of 2018
With a view to speed up the process of industrialisation in the state, the government has
announced its industrial policy in the year 2018.
5. Directorate of industries and commerce
Directorate of industries and commerce coordinates industrial development activity in
various sectors – micro, small, medium and large throughout the state. This helps the
entrepreneurs to acquire the required inftrastructure. It provides financial incentives and
concessions on industrial investment.
6. Institute for promoting industries
the institutions promoting industrial activity in the state are the following.
a. KFC
B. KSIDC
c. SIDBI
d. KINFRA

e. INKL
f. DIC
g. SIDCO
h. MSME
i. KITCO
j. K-bip
k. CMD
7. Incentives and subsidies
Government of kerala provides various incentives and subsidies to entrepreneurs in the
state, thereby motivating them to undertake ventures in the state.
8. Simplification of procedural formalities
Many people believe that in the kerala there is no investment climate. They feel that there
are labour troubles. They also feel that doing business is not easy because of too much
procedural formalities and delays.
Small Scale Industries
Small scale industries (SSI) are those industries in which manufacturing, providing services,
productions are done on a small scale or micro scale. For example, these are the ideas of Small
scale industries: Napkins, tissues, chocolates, toothpick, water bottles, small toys, papers,
pens. Small scale industries play an important role in social and economic development of India.
These industries do a one-time investment in machinery, plants, and industries which could be on
an ownership basis, hire purchase or lease basis. But it does not exceed Rs. 1 Crore. Let us
discuss in detail about it.
MSME Definitions of Micro, Small & Medium Enterprises In accordance with the provision of
Micro, Small & Medium Enterprises Development (MSMED) Act, 2006 the Micro, Small and
Medium Enterprises (MSME) are classified in two Classes:
1. Manufacturing Enterprises-he enterprises engaged in the manufacture or production of
goods pertaining to any industry specified in the first schedule to the industries (Development
and regulation) Act, 1951) or employing plant and machinery in the process of value addition to
the final product having a distinct name or character or use. The Manufacturing Enterprise are
defined in terms of investment in Plant & Machinery.
2. Service Enterprises:-The enterprises engaged in providing or rendering of services and are
defined in terms of investment in equipment.
Ancillary unit
An ancillary unit is the unit which supplies not less than 50% of its production to the parent unit.
A tiny unit is the business enterprise whose investment in plant and machinery is not more than
Rs. 25 lakh. Investment limit in such unit is one crore.
Export Oriented Units
Export oriented units are units undertaking to export their entire production of goods. EOUs can
be engaged in manufacturing, services, development of software, repair, remaking,
reconditioning, re-engineering including making of gold / silver / platinum jwellery and articles.
Further, units involved in agriculture, agro-processing, aquaculture, animal husbandry,
biotechnology,
floriculture, horticulture, pisciculture, viticulture, poultry, sericulture and granites
can also obtain the status of EOU.

Role of small scale industries (MSMEs) in Kerala Economy
1. Industrialization of rural and backward areas.
2. Large employment opportunities.
3. Balanced Regional development.
4. Mobilization of local resources
5. Promotion of self employment.
6. Promotion of exports.
7. Protection of environment.
8. Contributes to socio economic development of the state.
Problems of MSMEs in Kerala
Major five factors for failure has been identified as
1. Inadequate finance
2 . Inadequate market linkages
3. Obsolete technology
4. Industrial Sickness
5. Problems in Frequent Inspection
6. Tough competition and Inadequate margin
7. Low collection in Account Receivables
1. Inadequate finance
The mind set of banks towards SMEs have somewhat changed in the recent past. With the entry
of private banks, increased competition has led to a rush for lending to prime customers. The
multiple financial options from the capital market have also compelled banks to take more risks
in the case of MSMEs. The increased lending to MSMEs is propelled by the compulsion of the
'market as well as by the rapid expansion of these companies. But there exists a stark disparity
amongst small players and big players within the SMEs sector. Loans to bigger companies are
growing at a faster pace than loans to the SSI sector. By the the proportion of SSI loans to total
loans has remained small at 8.4%.The Small Industries Development Bank of India (SIDBI) was
set up in 1990 under the Act of Indian Parliament as the principal financial institution for
promotion, financing, development of industry in the small sector and coordinating the financial
activities of other institutions engaged in similar activities.
2. Inadequate market linkages
Next to finance, marketing is the big problem area for small entrepreneurs. The survival of small
entrepreneurs very much depends on sound marketing techniques. One of the most important
tools in the hands of small entrepreneurs for promoting their sales is low prices coupled with
credit to buyers, which give rise to number of problems at a later stage. Marketing as a
profession has not yet developed in the SME sector. Professional agencies are not engaged by
small entrepreneurs on account of paucity of funds. The concept of marketing is not known to
the majority of small entrepreneurs. For majority, marketing means advertisement or personal
contacts. There are many ad-hoc initiatives taken by the Government to promote marketing of
products/services of small units but no concrete action plan has been chalked out or targets made
3. Obsolete technology
Modernization, technological and quality up gradation has assumed great significance in the
present day context. With the inflow of latest technology reducing the cost of production and the
increasing competition from within and outside, the small scale sector will have to attach more
importance and pay attention to the areas of technology up gradation and modernization.
However, due to lack of information on the areas of technology up gradation, entrepreneurs who

have plans for technical up gradation are not to go ahead.
4. Industrial Sickness
A host of developmental schemes launched by the Government for solving the problems of small
scale industries have yet to achieve their goals to arrest sickness in SSI sector. The plight of
existing small scale industries is visible in many industrial complexes wherein the industrial
sheds have been converted into allied activities like showrooms, banquet halls, Restaurants, etc.
There seems to be some lacuna in the implementation part of the developmental schemes.
5. Problems in Frequent Inspection
One of the major grievances of the small scale sector is that the frequent inspections by multiple
government agencies are a source of harassment. At present, 55 inspectors of different levels are
visiting the small scale units, which is a cause of major concern to the small scale units. It is
suggested that the government should stream line the inspection procedure. It should also include
repeal of laws and regulations applicable to the sector that has become redundant.
6. Tough competition and Inadequate margin
By virtue of the fact that most of the entities in SME sector are small players in their field, they
may have to encounter tough competition from the bigger players. They face the pressure on
their margins they can’t raise their price but have to absorb the high input cost.
7. Low collection in Account Receivables
As is evidenced in the increasing trend of outstanding receivables in the SSI sectors, there exists
collection risk in the receivable portfolio of SME sectors for the reason that SMEs cannot dictate
terms to their customers. As SME sector business entity is at the receiving end, this may put
strain on the liquidity position of the business entity. However, the track record of SMEs as
borrowers reveals that the default rate is low. Very low rates of bad debts may be the result of
banks restricting their exposure to this sector.