CPA Common Final Examination 2018 Part A
317
CPA Common Final Examination BOARD OF EXAMINERS’ REPORT PART A — The Day 2 and Day 3 Report September 2018 Examination CPA EVALUATIONS
-
Upload
khangminh22 -
Category
Documents
-
view
1 -
download
0
Transcript of CPA Common Final Examination 2018 Part A
CPA Common Final Examination BOARD OF EXAMINERS’ REPORT
PART A — The Day 2 and Day 3 ReportSeptember 2018 Examination
CPA EVALUATIONS

© 2019 Chartered Professional Accountants of Canada All rights reserved. This publication is protected by copyright and written permission is required to reproduce, store in a retrieval system or transmit in any form or by any means (electronic, mechanical, photocopying, recording, or otherwise).
CPA BOARD OF EXAMINERS MEMBERS
Chair: Terry Booth, FCPA, FCA, CF RSM Canada LLP Calgary, Alberta
Vice-Chair: Paul Van Bakel, CPA, CA
Musashi Auto Parts Canada Inc. Waterloo, Ontario
Jonathan Blanchette, M.Sc., CPA, CA
Lune Rouge Entertainment. Montreal, Quebec
Monique Côté, CPA, CA MNP LLP
Calgary, Alberta
Susan Deleau, FCPA, FCA The Great-West Life Assurance Company
Winnipeg, Manitoba
Debbie L. Good MBA, FCPA, FCA University of Prince Edward Island
Charlottetown, Prince Edward Island
Tanya Kirsch, CPA, CA, CFA University of Toronto Mississauga, Ontario
David Legere, CPA, CA, LPA Self-Employed
Brantford, Ontario
Pier-Olivier Migneault, CPA, CA Business Development Bank of Canada
Montreal, Québec
Jonathan Vandal, CPA, CA, Fin Pl. JV Conseil inc.
Montréal, Québec
Joan Davison Atkinson, FCPA, FCA Dalhousie University Halifax, Nova Scotia
Leelah E. Dawson, CPA, CMA
British Columbia Institute of Technology Burnaby, British Columbia
Maxime Dubeau-Marcoux, CPA, CA, MBA-FSI
Sun Life Financial Montreal, Quebec
Gabriela Kegalj, CPA, CA
KPMG LLP Toronto, Ontario
Paul Kroetsch, CPA, CMA, CTP FFC Professional Corporation
Burlington, ON
Colin MacLean, FCPA, FCMA Dalhousie University Halifax, Nova Scotia
David (Jordan) Oakley, CPA, CA Deloitte
Winnipeg, Manitoba
Bill Waterman, CPA, CMA University of Prince Edward Island
Charlottetown, Prince Edward Island

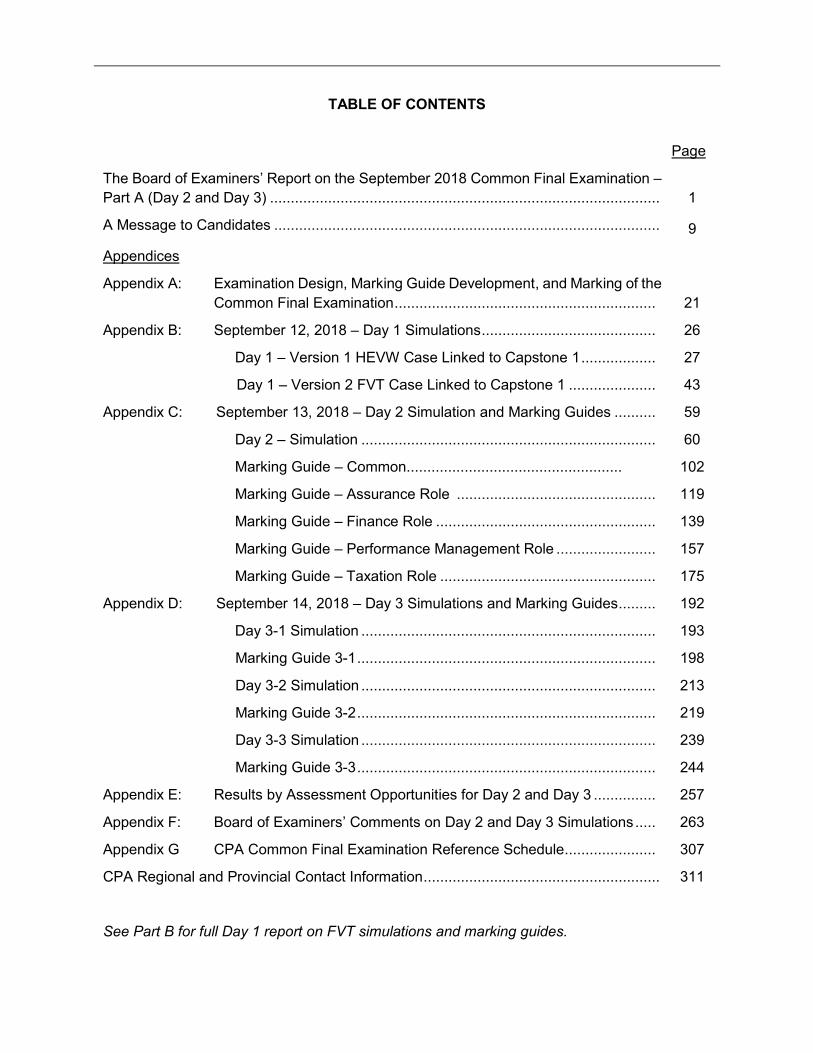
TABLE OF CONTENTS
Page
The Board of Examiners’ Report on the September 2018 Common Final Examination – Part A (Day 2 and Day 3) .............................................................................................. 1
A Message to Candidates ............................................................................................. 9
Appendices
Appendix A: Examination Design, Marking Guide Development, and Marking of the Common Final Examination ............................................................... 21
Appendix B: September 12, 2018 – Day 1 Simulations .......................................... 26
Day 1 – Version 1 HEVW Case Linked to Capstone 1 .................. 27
Day 1 – Version 2 FVT Case Linked to Capstone 1 ..................... 43
Appendix C: September 13, 2018 – Day 2 Simulation and Marking Guides .......... 59
Day 2 – Simulation ....................................................................... 60
Marking Guide – Common.................................................... 102
Marking Guide – Assurance Role ................................................ 119
Marking Guide – Finance Role ..................................................... 139
Marking Guide – Performance Management Role ........................ 157
Marking Guide – Taxation Role .................................................... 175
Appendix D: September 14, 2018 – Day 3 Simulations and Marking Guides ......... 192
Day 3-1 Simulation ....................................................................... 193
Marking Guide 3-1 ........................................................................ 198
Day 3-2 Simulation ....................................................................... 213
Marking Guide 3-2 ........................................................................ 219
Day 3-3 Simulation ....................................................................... 239
Marking Guide 3-3 ........................................................................ 244
Appendix E: Results by Assessment Opportunities for Day 2 and Day 3 ............... 257
Appendix F: Board of Examiners’ Comments on Day 2 and Day 3 Simulations ..... 263
Appendix G CPA Common Final Examination Reference Schedule ...................... 307
CPA Regional and Provincial Contact Information ......................................................... 311
See Part B for full Day 1 report on FVT simulations and marking guides.

THE BOARD OF EXAMINERS’ REPORT ON THE SEPTEMBER 2018 COMMON FINAL EXAMINATION
OBJECTIVES OF THE REPORT The objective of this report is to explain the Common Final Examination (CFE) process and to assist the profession in improving the performance of candidates on the CFE. The report sets out the responsibilities of the Board of Examiners, the methods used for guide setting and marking the CFE, and the results of the marking process. The report also includes recommendations to candidates from the Board of Examiners. The September 2018 CFE Report is presented in two parts: Part A is the Day 2 and Day 3 Report and Part B is the Day 1 report. The appendices provide more detailed information on the design, guide setting, and marking of the CFE, as well as the board’s expectations of candidates on the simulations. Readers are cautioned that the marking guides were developed for the entry-level candidate and that, therefore, all the complexities of a real-life situation may not be fully reflected in the content. The CFE report is not an authoritative source of GAAP. RESPONSIBILITIES OF THE BOARD OF EXAMINERS The Board of Examiners (BOE or the board) comprises a chair, a vice-chair, and sixteen members appointed by the provincial bodies. The board’s responsibilities, as set out in its terms of reference, include the following: - Setting the CFE in accordance with the CPA Competency Map (the Map) and other directions
from the Professional Education Management Committee; - Submitting the CFE and the marking guides to the provincial bodies for review; - Marking the candidates’ responses and recommending to the provincial bodies the pass or fail
standing that should be given to each candidate; and - Reporting annually on the CFE to various CPA committees and the provincial bodies, in such
form and detail and at such time as is satisfactory to them. The chair is responsible for the supervision of the evaluation process. The entire board is actively involved in the preparation of the CFE simulations, the preliminary marking guides, and the setting of the initial passing profile. A CFE subcommittee, made up of six members, participates in the Preliminary Evaluation Centre where the marking guides are tested against candidate responses and finalized. The chair and vice-chair participate in the start-up of the marking centre and provide oversight throughout the marking process. The full board is responsible for determining the passing standard.
The Board of Examiners’ Report on the 2018 Common Final Examination – Part A (Day 2 and Day 3) Page 1
THE CFE Preparation and Structure of the CFE The board staff works in conjunction with authors to ensure that simulations presented to the board achieve the overall intent and design objectives set by the board, while adhering to the competencies and the proficiency levels specified in the Map. The full board provides guidance as to the content and nature of simulations to be included on the examination. It also reviews and refines these simulations to make up the three-paper evaluation set. Nature of the Simulations The CFE comprises a set of simulations that are both essential and effective in evaluating the candidates’ readiness to enter the profession: Day 1 – The first paper is a four-hour examination consisting of a single simulation that is linked to the Capstone 1 group case. There are two versions of the linked cases. Version 1 is linked to the most current Capstone case, and is written by first time writers and by repeat writers who chose to attempt the new case rather than Version 2 of the previous Capstone case. Version 2 is written by repeat writers and candidates who deferred and are writing Version 2 as their first attempt. Day 2 – The second paper is a five-hour case, with four different roles and requirements. Additional information tailored to each role is provided in four separate appendices. Day 3 – The third paper, is a four-hour paper, consisting of three multi-competency area simulations. Assessment Opportunities The board applies competency-based marking procedures that enable it to decide which candidates demonstrate readiness to enter the profession. Assessment Opportunities are designed to answer the question, “What would a competent CPA do in these circumstances?” To attain a pass standing, candidates must address the issues in the simulations that are considered significant. Appendix A contains a comprehensive description of the evaluation process.
The Board of Examiners’ Report on the 2018 Common Final Examination – Part A (Day 2 and Day 3) Page 2
Marking Guides Marking centre leaders and assistant leaders provide valuable input during the testing and setting of the marking guides, before live marking begins. The board chair, the vice-chair, selected board member(s) and senior evaluations staff hold meetings with the leaders and their assistants during both the guide-setting and the marking processes. See Appendix B for the Day 1 simulations that appeared on the 2018 CFE and Appendix C and D for the Day 2 and Day 3 simulations and marking guides. The marking results for Day 2 and Day 3, by Assessment Opportunity, appear in the statistical reports found in Appendix E of this report. See Part B of the CFE Report for details on Day 1, FVT Version 1 and Version 2. Day 1 – The marking guide is designed to assess the candidate on the stages of the CPA Way: 1) situational analysis; 2) analysis of the major issues; 3) conclusions and advice; and 4) communication. Based on these four summative assessments, the candidate’s response is then holistically judged to be either a passing or a failing response. Day 2 and Day 3 – Marking guides are prepared for each simulation. Besides identifying the Assessment Opportunities, each marking guide includes carefully defined levels of performance to assist markers in evaluating a candidate’s competence relative to the expectations set out by the board when developing the passing profile for a competent CPA. Five categories of performance are given for each Assessment Opportunity. The candidate’s performance must be ranked in one of the five categories: • Not Addressed • Nominal Competence • Reaching Competence • Competent • Competent with Distinction
The Board of Examiners’ Report on the 2018 Common Final Examination – Part A (Day 2 and Day 3) Page 3
Setting the Passing Standard The board chair and vice-chair participate in the monitoring of live marking. Near the completion of the marking process, the CFE subcommittee satisfies itself that the markers applied the marking guides as intended by the board. In determining which candidates pass the CFE, a candidate is judged in relation to the board’s pre-established expectations of an entry-level chartered professional accountant. Any changes to the initial profile that were made throughout guide-setting and the marking centre are ratified by the full board. In setting the passing profile, the board considers the following: - The competency area requirements described in the Map - The level of difficulty of each simulation - The level of difficulty of each Assessment Opportunity - The design and application of the marking guides - Comments from leaders and assistant leaders regarding any marking difficulties encountered
or any time constraints noted - Possible ambiguity of wording or of translation - Input on critical decision factors from an independent board of three CPAs who review the fair
pass package The Decision Model The purpose of the CFE is to assess whether candidates possess the competencies required of an entry-level CPA through a written evaluation that is common to all CPAs. Each day of the CFE is unique and is designed specifically to assess different skills: ➢ Day 1 is linked to the Capstone 1 group case work. It assesses the candidates’ ability to
demonstrate professional skills. It is independent from Day 2 and Day 3. ➢ Day 2 is the depth test. It assesses technical depth in one of four unique roles (that reflect the
four CPA elective choices) and provides depth opportunities in the common core competency areas of Financial Reporting and/or Management Accounting. Candidates pre-select one role and respond from that role’s perspective.
➢ Day 3 supplements the depth test in the common core areas of Financial Reporting and/or
Management Accounting. It is also the breadth test for all common core competency areas. Candidates must pass all three days in order to qualify for entry to the profession. Those seeking licensure must obtain depth in Financial Reporting and in the Assurance Role.
The Board of Examiners’ Report on the 2018 Common Final Examination – Part A (Day 2 and Day 3) Page 4
Day 1 Day 1 is assessed independently from Day 2 and Day 3. A pass or fail decision is made based on a holistic assessment of the candidates’ performance in applying the CPA Way to demonstrate essential professional skills. Day 2 and Day 3 The decision model used by the board is presented in Exhibit I. Four key decision points, or levels, are applied in reaching a pass or fail decision, as follows: 1. The response must be sufficient; i.e., the candidate must demonstrate competence in the
Assessment Opportunities presented on Day 2 and Day 3 (Level 1).
2. The response must demonstrate depth in the common core area of Financial Accounting or Management Accounting (Level 2).
3. The response must demonstrate depth in the pre-selected elective role (Level 3).
4. The response must demonstrate breadth across all competency areas of the Map, at a core level, by not having avoided a particular technical competency area (Level 4).
The Board of Examiners’ Report on the 2018 Common Final Examination – Part A (Day 2 and Day 3) Page 5
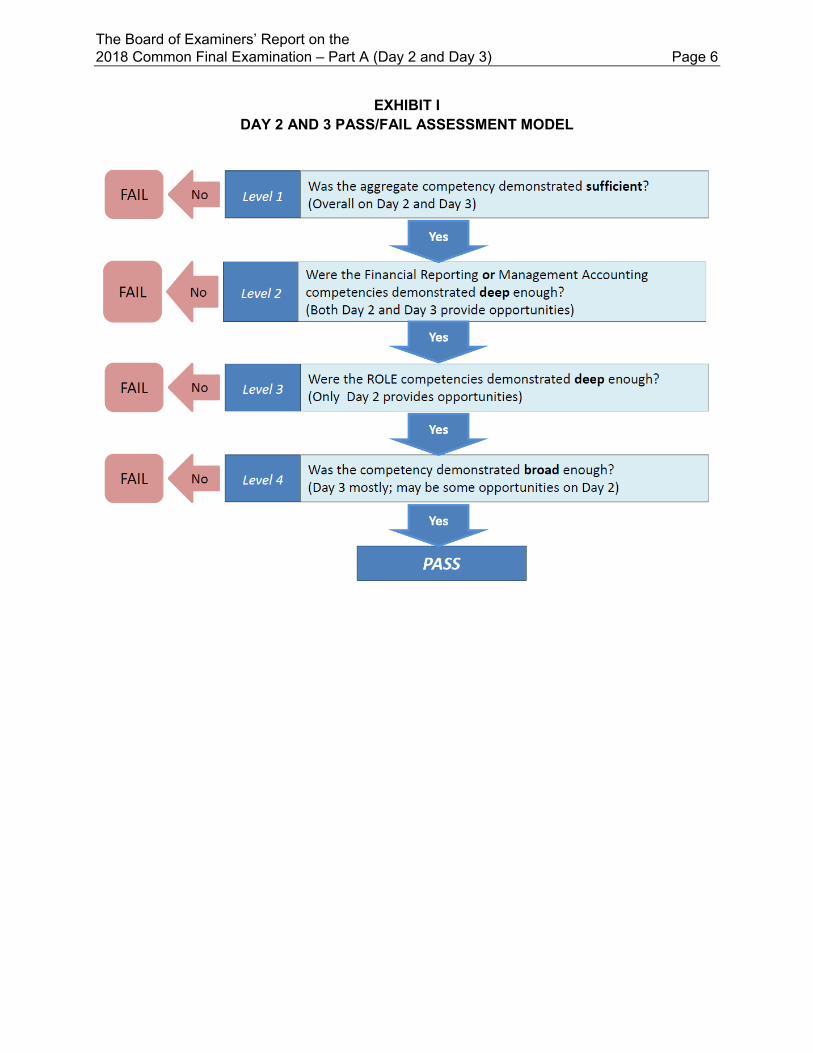
EXHIBIT I DAY 2 AND 3 PASS/FAIL ASSESSMENT MODEL
The Board of Examiners’ Report on the 2018 Common Final Examination – Part A (Day 2 and Day 3) Page 6
Approving the Results The CFE subcommittee reviews and approves the marking results for each simulation. Day 1 is assessed separately from Day 2 and Day 3. Day 1 – The CFE subcommittee discusses the profiles for both the marginally passing and marginally failing candidates to confirm that the board’s pre-established passing profile has been appropriately applied by the markers. Day 2 and Day 3 – As part of the development process, the CFE subcommittee sets preliminary requirements for the three levels (tests of depth and breadth) being assessed on the Day 2 and Day 3 simulations. After the marking is completed, the board reviews and finalizes those requirements. The board establishes the Level 1 (sufficiency) requirement for the combined Day 2 and Day 3 simulations. During the approval process, the board continues to consider whether the results could be affected by any inconsistency in the evaluation or the board’s processes. Reporting In reaching its decision, the board determines which candidates pass on a national basis only, without regard to provincial origin or language. Similarly, the detailed comments are based on analyses of the performance of all candidates. The board reports the following information by candidate number: - Overall pass/fail standing and pass/fail standing for each of Day 1 and of Day 2 and Day 3
combined. - A pass/fail standing for Day 1. A decile ranking is provided for failing candidates. - A pass/fail standing for Level 1, Sufficiency. - A pass/fail standing for Level 2, Depth in Financial Reporting and/or Management Accounting. - A pass/fail standing for Level 3, Depth in Role. - A pass/fail standing for Level 4, Breadth in all technical competency areas.
The Board of Examiners’ Report on the 2018 Common Final Examination – Part A (Day 2 and Day 3) Page 7
Thank You All board members wish to express their warm and sincere appreciation for the outstanding energy, support, and commitment of the small group of Board of Examiners staff members whose dedication and talent contributed in large measure to the achievement of our objectives and the fulfilment of our responsibilities. We also wish to acknowledge the contributions made by the provincial reviewers, markers, authors, translators, and editors. The commitment, energy, and skill demonstrated by all the markers were outstanding, resulting in the sound application of marking procedures and producing an appropriate evaluation of the candidates. Everyone’s commitment to the quality and fairness of the process is appreciated.
Terry Booth, FCPA, FCA, CF Chair Board of Examiners
The Board of Examiners’ Report on the 2018 Common Final Examination – Part A (Day 2 and Day 3) Page 8
A MESSAGE TO CANDIDATES
To attain a pass standing, candidates needed to achieve a “Pass” on Day 1, and on Day 2 and Day 3 combined demonstrate sufficient competence in all areas, plus meet the two depth standards and the breadth standards.
INTRODUCTION
The September 2018 CFE Report presents detailed information on candidates’ performance for all the examination cases, except for HEVW, the Day 1 linked case, Version 1. Commentary on the performance of candidates on Day 1 (HEVW Version 1) is provided in a summary format only in this message to candidates, since detailed commentary on HEVW will only be provided after Version 2 is written in September 2019. The simulations, marking guides, marking results, and Board of Examiners’ comments on the rest of the examination are found in this document (Part A of the CFE Report). Similar information on Day 1 (FVT Version 1 and Version 2) can be found in Part B of the CFE Report.
The intent of this message is to highlight common areas of deficiency and to offer advice from the Board to help candidates understand how to improve their performance on the CFE.
Nature of the CFE
The design of the CFE is such that each day of the examination allows candidates to demonstrate a different skill set. Day 1 allows candidates to demonstrate their high-level professional skills, such as critical analysis, decision-making, and professional judgment, as well as communication. Day 2 allows candidates to demonstrate their technical competence in the common Financial Reporting and Management Accounting competencies and in their chosen role, which ties to one of the four elective areas. Day 2 clearly directs candidates to the work to be done and is not designed to be time constrained, allowing candidates to demonstrate depth. Day 3 allows candidates to demonstrate depth in the common Financial Reporting and Management Accounting competencies and provides multiple opportunities to demonstrate breadth in all the core technical competency areas. Day 3 is less directive and more integrative than Day 2. It is also time constrained, requiring candidates to prioritize their time per issue.
Specific Strengths and Weaknesses
Lack of Support/Generic Discussions
A common theme across all the days was the fact that some candidates presented case facts without elaborating on why they were relevant to the discussion or the position being argued. This was typically done in point form. Also, some candidates made generic comments or drew conclusions on an analysis that failed to integrate the case facts, resulting in a superficial analysis of the issues and unsupported conclusions.
A Message to Candidates Page 9
For example, on Day 2, Performance Management role, many candidates provided a bullet-point list of case facts, under the headings of strengths, weaknesses, opportunities, and threats, without any further explanation. In addition, on the two assessment opportunities (AOs) for which a qualitative analysis was necessary, many candidates listed case facts labelled as pros or cons but did not explain any further. On Day 3, Simulation 1, the Board saw a similar approach taken to the qualitative discussion of the two offers. Some candidates simply listed case facts under either Offer A or Offer B, with no further explanation as to why each factor would be either an advantage or a disadvantage of each option. Similarly, on Day 3, Simulation 3, some candidates merely listed the case facts that identified issues with the current board of directors, without any further explanation as to why these were issues that needed to be addressed. The Board also noted AOs for which candidates provided generic discussions or made unsupported conclusions. On Day 2, Common, AO#3 (business acquisition), many candidates concluded that the purchase of Bright Sun Power’s assets qualified as a business combination, without providing any supporting case facts. On Day 2, Assurance role, AO#8 (inventory procedures), candidates provided only very generic inventory procedures and did not apply the relevant case facts (for example, the fact that it was now after year end or the fact that the inventory was different and at different locations) to their discussions to come up with more specific and relevant procedures. The above tendencies were also noted on Day 1. Candidates must ensure that they answer the questions “Why?” or “So what?” when they make any point using case facts. Simply repeating case facts without any further explanation, even if it is in a logical format, is insufficient. The Board is interested in understanding a candidate’s logic and wants to see evidence of the analysis and professional judgment that has been applied. Candidates are reminded that all competent candidate profiles on the CFE require supported arguments and defensible positions that are case specific.
Time Management
An improvement in time management was noted on the September 2018 CFE. With a few exceptions, described in this section, time was well managed on all three days of the CFE. In the past, the Board had noted that on Day 1, some candidates have spent an inordinate amount of time preparing a full situational analysis, rather than addressing the changes that were relevant based on the case facts presented. While this continued to be the case on Version 2 of FVT, and often resulted in candidates running out of time, the Board was pleased to see an improvement on Version 1 of HEVW. Version 2 of FVT also had a number of candidates who appeared to address the issues in the order in which they appeared in the case. While candidates are free to address the requireds in the order they like, the most significant issue on Version 2 of FVT this year happened to appear last in the case. For those candidates who did not rank the issues, this resulted in not leaving enough time to fully address this issue.
A Message to Candidates Page 10
Although Day 2 is not designed to be time constrained, the Board saw some evidence of time management issues. Several candidates spent too much time addressing the common financial reporting AOs; specifically, the revenue recognition issue, for which some candidates’ responses were ten pages long. While this resulted in strong responses on that one required, it also resulted in some candidates running out of time on other requireds. This was most commonly seen on the Day 2 Finance and Day 2 Performance Management role responses. Candidates are reminded that spending too much time on any one required can hurt performance on another required. Allocating sufficient time to cover all of the requireds, while still ranking the importance of the issues, is essential. Judgment is required in determining how much evidence to provide to demonstrate competence per AO. The Board is looking for sufficient, but not excessive, depth to be demonstrated. Day 2 is specifically designed to allow time for filtering information and planning the response. Candidates are encouraged to use the time provided to ensure sufficient time is allocated to all the requireds. The Board was pleased to see candidates generally following the suggested times for each simulation on Day 3 to ensure they had the opportunity to answer all the requireds. The Board continued to see some evidence of candidates going over the suggested times on Simulation 1 and sometimes Simulation 2, to the detriment of their performance on Simulation 3. Also, some candidates seemed to spend a lot of time preparing a quantitative analysis on Simulation 1, without having a clear purpose in terms of what they were trying to achieve. This resulted in some candidates running out of time on Simulation 3. The Board was pleased to see a decrease in the number of candidates skipping issues on Day 2 and Day 3 (see the percentage of Not Addressed by AO). Candidates appeared to make a concerted effort this year to attempt all of the AOs. When candidates did skip an AO this year, it appeared to be due to time constraints rather than intentionally avoiding the issue. In addition, most candidates who experienced the time management issues noted in this section generally chose to still try and address all of the AOs rather than skipping some AOs all together. This was typically evidenced by rushed or brief responses on the last one or two AOs of those simulations. While there is still room for improvement, the Board was encouraged by the candidates’ efforts to attempt all of the AOs this year. The Board reminds candidates that the CFE has not only depth and breadth tests but also a sufficiency score, which is impacted by skipping issues. Therefore, it is important that candidates continue to attempt all of the requireds, managing their time carefully in doing so.
A Message to Candidates Page 11
Day 1 Points have been excerpted from the September 2017 Board of Examiners’ report on Day 1, Version 1 of FVT. Additional commentary based on candidates’ performance on Version 2 has been added. Comments Specific to Day 1 (FVT Version 1) [excerpted from September 2017 CFE Report]
Most candidates dedicated the first section of their response to a situational analysis. Most used their situational analysis later in their response, making links back to the work they did while analyzing the specific issues. Most also used the information provided in the case (for example, financial ratios and industry benchmark) to perform a general financial assessment of FVT. The most frequently used element of the situational analysis was the focus on new technology (for example, the new mission and trends toward new technology). Some candidates calculated the covenant based on the internally prepared financial statements and recalculated it incorporating their recommendations for financing. Weak candidates simply recapped case facts or went into too much depth in their situational analysis, redoing the entire analysis rather than focusing on the changes, which the case specifically directed them to do. Candidates are reminded that the purpose of the situational analysis is to identify relevant changes in circumstances since the Capstone 1. It is not intended to be a full SWOT, nor is it intended to be a standalone analysis that is rewarded. Only when the information is integrated into the discussion of the specific issues is there value added. There were five issues that candidates were expected to analyze from both a strategic perspective and an operational perspective. Four were investment opportunities that the candidates were specifically asked to analyze, and the fifth was an undirected requirement about the governance and ethical issues facing FVT. Candidates were expected to provide a qualitative and quantitative analysis for each of the four investment opportunities. Candidates were also expected to integrate the case information to recognize at least one of the ethics and governance issues and to recommend appropriate action. Overall, most candidates provided a balanced response, with appropriate depth in the qualitative discussion on every issue, and they showed some numeracy skill in most of the major issues. Strong candidates tended to discuss the issues with the strategic implications at the forefront of their analysis. Weak candidates tended to list qualitative points that were mostly restated case facts, and they also tended to focus on the operational decision factors. Some weak candidates were not able to use the quantitative information in a useful way for FVT. Candidates are reminded that avoiding the numbers is a fatal flaw for the Day 1 case and are strongly advised to perform a balanced quantitative and qualitative analysis. Candidates are also reminded that it is important on Day 1 to discuss the strategic implications, not just identify the operational issues, keeping in mind that often the operational issues are presented in the case to raise broader strategic issues. Candidates are reminded to step back and think about the interrelationships between the issues.
A Message to Candidates Page 12
For example, candidates were expected to realize that FVT had financial constraints, such as the financial covenant and the limit on spending on investment ($2.5 million), that they should have considered when assessing the investment options. Weak candidates did not understand the constraints that FVT was facing. Candidates were not specifically directed to the ethical and governance issues but were given multiple examples in the case of these issues. Many candidates recognized the unethical actions of Zobair and realized that the FLIXREWARDS points should be remitted to the clients in order to maintain FVT’s reputation. However, some did not see the issue at all, which was disconcerting to the Board. Candidates are expected to address ethical issues that could have an impact on the business, even though they are not directed to them. Candidates need to step back and integrate all the case facts to uncover those non-directed issues. Candidates are expected to conclude on each analysis they complete, and their conclusions are expected to be consistent with the analysis they perform. There was no one correct solution to the case. Strong candidates provided thorough conclusions for all the issues they analyzed. Most candidates took into account the constraints provided in the case by either comparing the investment needed for each project with the spending limit or attempting to recalculate the financial covenant based on the projects recommended. Only a few candidates struggled with effective communication. The approach most candidates took was well structured and the language used was clear. However, the presentation of the exhibit in Excel by some candidates was hard to follow. The use of decision matrix and column format in Word (with pro/con listings) is also not an effective communication technique because it is difficult to clearly communicate the thought process in this format.
Comments Specific to Day 1 (FVT Version 2)
Generally, candidates provided an appropriate situational analysis, recognizing some of these issues and integrating them into their analysis. Most candidates recapped the mission and key success factors and framed the situational analysis in a SWOT. Some candidates still spent excessive time on this part of their response, with many spending nearly half of their total response performing a SWOT analysis and providing a detailed discussion of FVT’s performance relative to the industry benchmarks. Many of these candidates discussed each of the nine benchmarks in detail. Some even recalculated the ratios (such as the current ratio) using the numbers from the financial statements, even though the calculated ratios were provided in Appendix II. There were four major issues and one minor governance issue that candidates were expected to analyze from both an operational and a strategic perspective. Candidates were expected to qualitatively and quantitatively analyze each of the major issues, keeping in mind FVT’s current problems (cash flow and debt issues) and its new financial targets.
A Message to Candidates Page 13
The first issue was the potential sale of Cinema LaRoche (CLR). Even though it was presented last in the case, candidates were expected to identify the issue as the most significant one in the case, due to the impact on cash flows and revenue. Many candidates addressed the issues in the order they appeared in the case, so many of these candidates were rushed when it came to their CLR discussion and as a result did not do an adequate analysis. Candidates are reminded to take the time to assess the relative importance of the issues before responding, to ensure that the most important issues are addressed adequately. The second issue was whether to close The Games Place or leave it open and lease the games. Alternatively, although not specifically mentioned, FVT could always maintain status quo. Candidates generally did well on this issue. However, some failed to clearly identify status quo as being a feasible option. The third issue was whether to renovate part of FVT’s Tillsonburg theatre to accommodate live performances. Most candidates determined that the live theatre was more profitable, although some struggled with what was considered a basic quantitative analysis. However, many candidates provided a biased analysis and tended to ignore the fact that FVT did not have the funds to pay for the renovation. Candidates are reminded to consider both sides of the decision before concluding, to ensure that all relevant decision factors are weighed into the conclusion. The fourth issue was the supplier contract (KC or TBG). Most candidates provided a reasonable qualitative comparison of the two suppliers. However, many candidates’ quantitative analysis was merely a restatement of case facts (for example, TBG would reduce cost to 23% of revenue, while KC would reduce it to 25%) that focused on comparing the operational choices. By taking this approach, candidates did not get a sense of the magnitude of the actual dollar savings and how that fit into the strategic discussion and overall decision of how best to resolve the cash issue facing the company. Candidates are encouraged to take the time to step back and consider how the issues presented tie into the bigger picture of the company’s objectives before they conclude on the issue and move on to the next discussion. Some candidates simply restated case facts, with no added value (for example, that FVT had purchased CLR and was experiencing operating problems). Candidates are reminded that stating their final position is important, particularly when there are several pros and cons for each alternative and multiple issues to address. Summing up is necessary to convey which courses of actions should be pursued first and why. In this case, since the issues were highly integrative, an overall conclusion helped demonstrate the candidate’s strategic thinking. Many Version 2 candidates persist in using point form to list the pros and cons related to an issue, with little explanation of their thought process. This can be a poor communication technique because it can lead to responses that are unclear and in many cases challenging to understand, since the point listed can often be interpreted more than one way. Candidates are not discouraged from using point form; however, they need to ensure they go beyond the case facts to clearly explain why the point is relevant.
A Message to Candidates Page 14
Comments Specific to Day 1 (HEVW Version 1)
Most candidates dedicated the first section of their response to a situational analysis. Most used their situational analysis later in their response, making links back to the work they did while analyzing the specific issues. Weak candidates typically recap the case facts or go into too much depth in their situational analysis, redoing the entire analysis rather than focusing on the changes, which this case specifically directed them to do. The Board was pleased to see that there was less evidence of candidates doing that this year on Version 1 of HEVW. There were four major issues that candidates were expected to analyze from both a strategic perspective and an operational perspective. These four major issues related to important decisions HEVW was facing that the candidates were specifically asked to analyze from both a qualitative perspective and a quantitative perspective; however, the case required far more quantitative analysis, and far fewer qualitative points could be provided for each issue. There were also some minor issues that candidates could discuss at an operational level and in less depth. Overall, most candidates provided an appropriate response, considering sufficient qualitative factors for the issues presented, and they showed reasonable numeracy skill in most of the major issues. Strong candidates tended to discuss the issues with the strategic implications first, whereas weak candidates tended to focus on the operational decisions. Some weak candidates listed qualitative points that were mostly restated case facts and were not able to present the quantitative information in a way that was useful to HEVW, although most attempted some of the required calculations. Generally, avoiding the numbers is a fatal flaw for the Day 1 case, and candidates are strongly advised to perform a balanced quantitative and qualitative analysis. However, for HEVW Version 1, it was appropriate to provide more quantitative and less qualitative analysis. Candidates are reminded to judge, on a case-by-case basis, the amount of qualitative and quantitative analysis that is necessary and appropriate in the circumstances by what will provide the most useful information. Candidates are also reminded that it is important on Day 1 to discuss the strategic implications, not just identify the operational issues, keeping in mind that often the operational issues are presented in the case to raise broader strategic issues. Candidates are reminded to step back and think about the interrelationships between the issues. For example, candidates were expected to realize that HEVW was experiencing a short-term cash flow shortage that they should have considered when assessing each of the decisions. It was the key issue in the case.
A Message to Candidates Page 15
Candidates are expected to conclude on each analysis they complete, and their conclusions are expected to be consistent with the analysis they perform. There was no one correct solution to the HEVW case. Most candidates considered the cash flow constraint when evaluating each of the decisions, made a recommendation, understood it was a short-term issue that would resolve itself as capacity was reached, and offered some way to find cash in the short-term that was feasible. Candidates are reminded to provide well-supported conclusions for all issues, in order to justify their position, but also to integrate any broader constraints and objectives into an overall conclusion. Only a few candidates struggled with effective communication. The approach most candidates took was well structured and the language used was clear. However, some candidates’ presentation of the exhibit in Excel was hard to follow due to poor labelling or a lack of formulas.
Additional Day 2 and Day 3 Comments
The following paragraphs elaborate on the strengths noted and draw attention to the common detracting characteristics identified by the Board of Examiners on Day 2 and Day 3.
Technical Knowledge
Most candidates were able to demonstrate the technical knowledge required throughout the CFE. In general, candidates performed well across most of the depth and breadth tests. The following are some examples of the technical weaknesses noted on the Day 2 and Day 3 simulations that contributed to the weaker results on those AOs. Most candidates were able to provide a complete analysis of the basic accounting issues, but they continued to struggle with the more difficult issues. On Day 2, Common, AO#3 (business acquisition), many candidates struggled with applying Handbook guidance, frequently misinterpreting paraphrased sections, including entire sections without identifying the subsection relevant to the scenario, or using guidance from a Handbook section that did not apply to the situation (such as IFRS 10 – Consolidation, IFRS 11 – Joint Ventures, or IAS 32 – Financial Instruments). On Day 2, Common, AO#5 (EPS), many candidates had numerous errors in their EPS calculations. For example, some candidates used incorrect figures, such as gross profit instead of net income in the numerator or retained earnings instead of the number of common shares in the denominator. Dilutive EPS calculations often contained errors such as the inclusion of both the in- and out-of-the-money options in the denominator, instead of recognizing the options were antidilutive and should not be included. Many candidates also incorrectly deducted the interest paid on the convertible bonds from net income, instead of correctly recognizing it should be added to net income.
A Message to Candidates Page 16
On Day 2, Assurance role, AO#11 (summary of misstatements), candidates struggled with completing the summary, with many providing incorrect or one-sided journal entries to correct the misstatements presented. They also struggled with applying the concepts of materiality and pervasiveness to specific case facts, and at times would provide either irrelevant audit report options (such as disclaimer of opinion) or incorrect advice on how a clean opinion could be obtained (such as suggesting that materiality could be changed). On Day 2, Assurance role, AO#13 (interim review of financial statements), most candidates only provided generic discussions of the nature of audits versus reviews, and they struggled with providing any discussions on the specific characteristics of interim reviews. Candidates struggled with this topic and seemed to lack a basic understanding of what an interim review is and how it is different from a year-end review. As a result, they were unable to provide discussions that had value for Jeremy. On Day 2, Performance Management role, AO#10 (transfer pricing), a hard assessment opportunity, candidates struggled to link the transfer pricing options to the evaluation of the plant managers’ performance for compensation purposes. They were only able to provide theoretical discussions and to quantify the impact on the bonuses, which was not really addressing the issue adequately. On Day 2, Finance role, candidates frequently made errors in calculating the cash conversion cycle (AO#12) or avoided the calculation altogether in favour of a discussion that indicated they did not understand the cash conversion cycle. In addition, candidates had difficulty explaining the nature of the solar farm project financing (AO#9), even though its definition was provided in the case itself, and many instead wrote in generic terms. On Day 2, Taxation role, candidates addressed simpler topics, such as the calculation of taxable income, the calculation of CCA, and employee versus contractor considerations, with strong technical analyses that showed they clearly understood the issues being tested. On the more difficult topics, however, many candidate responses contained significant technical errors. For example, when discussing acquisition of control (AO#9), an alarming number of candidates stated that all assets of the corporation were deemed to have been disposed of at fair market value, while the technically correct rule is that assets with accrued losses are deemed to have been disposed of at fair market value, and assets with gains are eligible for an election for a deemed disposition anywhere up to fair market value. Candidates also struggled with the treatment of the windup of a subsidiary corporation after disposition of its assets (AO#10 OWF sales of assets versus shares). Many candidates attempted to apply rules applicable to individuals instead of rules applicable to corporations.
A Message to Candidates Page 17
Candidates struggled the most on Day 3, Simulation 1, AO#5 (boat rental breakeven), where they failed to understand the basic elements of a contribution margin and breakeven calculation. For example, candidates incorrectly included fixed costs in the contribution margin analysis, such as the attendant’s salary, and included capital costs in their breakeven calculation. On Day 3, Simulation 2, AO#2 (packing coordinators), candidates calculated the variance in salary and compared it to the reduction that was expected after eliminating the packing coordinators, without incorporating the changes in volume of skids handled to their analysis. This lack of understanding of basic management accounting concepts left the client with a superficial analysis of the issues that would not allow them to fix the problems.
Candidates also struggled on the Financial Reporting AO on Day 3, Simulation 3, AO#3 (lease). Candidates incorrectly concluded that the purchase option price was a bargain price, although the purchase option price was equal to the fair value of the soundboard at the time the option could be exercised. In addition, whether candidates concluded that there was a bargain purchase option or not, many made mistakes in treating the purchase option in their present value calculation in a way that would be consistent with their interpretation.
Finally, candidates demonstrated a lack of knowledge on Day 3, Simulation 1, AO#4 (tax implications). Candidates struggled with the technical tax knowledge that was required to help the client. For example, some candidates did not understand the difference between the regular tax rate of 13% and the tax rate of 52% that should have been used in this case. They also wrongly applied the lifetime capital gain exemption to the capital gain generated with Offer A, mixing up personal and corporate tax rules.
Candidates are reminded that the CFE requires them to have a strong foundation of technical knowledge in order for them to clearly demonstrate their professional skills, apply their judgment, and thereby demonstrate competence.
Irrelevant Discussions
Similar to the prior year, there were a few incidents of candidates providing irrelevant discussions.
For the first time last year, there was an enabling AO on Day 2. Some Assurance candidates appeared to think that there was an enabling skills AO/undirected required in the case again this year, bringing up the fact that Elite was putting significant pressure on SPS to perform well financially or suggesting that SPS may not be a going concern due to the declining share price and the company’s need for additional financing. These discussions were often very brief and were not relevant in this case. There were no hints in the case to suggest that Elite’s interest in SPS’s financial performance was beyond that of a normal significant investor, or that going concern was an issue for SPS, given the company still had significant net income for the year and obtaining financing is a normal part of business operations for most companies. While candidates are encouraged to always keep the big picture in mind and should consider any non-directed issues, they should ensure that the issues identified are supported by the actual case facts presented.
A Message to Candidates Page 18
Also on Day 2, Assurance role, AO#13 (interim financial statement review), some candidates provided discussions of several special reports (such as Section 5815, Section 8600, and Section 9100 reports) that did not at all address the required in the case. It appeared that candidates applied their own interpretation of the required, instead of taking the time to read and clearly understand the case required. On Day 2, Taxation role, AO#11 (treatment of employees versus contractors), many candidates dwelled on a discussion of whether workers would be employees or contractors. It was clear in the case that the company would do what was necessary to have these workers treated as contractors, so the discussions were not useful. In addition, many candidates described rules for deductions that can be claimed by employees when they were clearly asked to discuss deductions that can be claimed by independent contractors. On Day 3, Simulation 3, AO#4 (carryforward and deadlines), some candidates misinterpreted the question from the client when she asked about the filing and payment requirements and deadlines for GHT/HST. The client had said that she was not sure she had been doing it properly. Some candidates misinterpreted this statement and discussed whether or not KST should register for GST/HST, when Ellen was already dealing with GST/HST. Candidates are reminded to use their judgment in deciding whether a discussion is pertinent to the issues at hand or the role. Candidates should be careful not to assume that the required is identical to something that was asked for in a previous case, which could lead to providing a rote response that is incorrect.
Ignoring/Contradicting Case Facts
As in the prior year, the Board saw several instances of candidates directly contradicting case facts presented to them, even when the facts were presented by authoritative sources in the simulation. For example, on Day 2, Common, some candidates discussed the accounting treatment of the bonds and options, despite the fact that they were specifically told the auditors had already reviewed the accounting for these. Candidates are reminded that, while they should remain skeptical of unreliable sources, they should not be suspicious of all the information presented to them. Candidates are expected to apply their judgment to determine what information can be relied upon and what information should be treated with skepticism. On Day 2, Performance Management role, the case mentioned that if the solar farm did not produce enough electricity to provide Comcap with the contractual number of kilowatt hours, the shortfall could be purchased from the public utility at market prices. Many candidates ignored that case fact when addressing AO#7, which led them to conclude by mistake that the proposed upgrade to the solar farm was mandatory, when, in fact, a calculation had to be performed to determine if the upgrade was a profitable investment.
A Message to Candidates Page 19
A Message to Candidates Page 20
On Day 2, Taxation role, despite there being no CCPCs in the simulation (except for one unrelated entity mentioned only briefly), candidates discussed the implication of loss of CCPC status instead of discussing acquisition of control on AO#9. Perhaps these candidates were using the 2017 exam as a template, since such a situation occurred on that exam.
On Day 3, Simulation 2, AO#2 (packing coordinators), some candidates ignored the timing related to the elimination of the packing coordinators. They based their analysis on the three periods presented, instead of focusing on the period right before the packing coordinators left and the one right after to home in on the impact of their departure.
On Day 3, Simulation 3, AO#1 (ShowTix proposal), many candidates ignored the fact that only one-third of the online sales would be from new patrons. These candidates based their analysis on all revenue that would be generated online, rather than only using the revenue from new patrons. Therefore, they were not able to provide an incremental quantitative analysis (in other words, showing the incremental net income that the project would provide to KST).
Candidates are reminded to take the time to read the simulations and carefully assess what are the relevant case facts.
Qualitative versus Quantitative Analysis
New this year, the Board noted a few AOs where candidates listed factors under their qualitative analysis that were actually quantitative and were elements they had already considered in their quantitative analysis. These candidates seemed to think that they were performing a qualitative analysis, when they were simply describing their quantitative analysis.
For example, on Day 2, Performance Management role, AO#8 (solar farm - qualitative), candidates were required to perform a qualitative analysis of the solar farm. However most of the elements raised by candidates were quantitative in nature, despite them labelling their analysis as “qualitative.” These candidates merely repeated each key component of their quantitative analysis in a narrative form as either a pro or a con, failing to discuss enough of the actual qualitative elements.
There were also a few examples of this on Day 3. On Day 3, Simulation 1, AO#3 (qualitative on Offer A versus Offer B), although most candidates did well in providing qualitative factors to consider, some provided factors that they had already considered in their quantitative analysis. For example, some of these candidates compared the difference in repairs and maintenance or propane costs under each offer, but that had already been accounted for in the quantitative analysis. On Day 3, Simulation 3, AO#1 (ShowTix proposal), some candidates repeated that there was an upfront fee of $20,000 that had to be paid, or that total tickets sales would be higher with ShowTix, when these were already factored into their quantitative analysis.
Appendix A: Examination Design, Marking Guide Development, and Marking of the CFE Page 21
APPENDIX A
EXAMINATION DESIGN, MARKING GUIDE DEVELOPMENT, AND MARKING OF THE COMMON FINAL EXAMINATION
Appendix A: Examination Design, Marking Guide Development, and Marking of the CFE Page 22
CFE Design
Day 1 is one four-hour case that is linked to the Capstone 1 case, which is worked on in groups for eight weeks prior to the CFE. When writing the Day 1 case, candidates are allowed access to their Capstone 1 case but not their group’s answer or any sample response. The Day 1 case is designed to assess the enabling (professional) skills. Candidates are directed to not perform any detailed technical analysis, but rather to target a “board room and senior management” level of discussion, with high-level analytics. There are two versions of the Day 1 case. Candidates preselect the version they will write.
Day 2 is one four-hour case that candidates are given five hours in which to respond. The extra hour gives candidates time to filter and find the information that they need to answer their role requirements from within the common information presented. Day 2 is designed to assess the technical competencies in depth (Level 2 and Level 3). Candidates pre-select a role (Assurance, Finance, Taxation, or Performance Management). All candidates work with the same case — it has a common section and four sets of appendices containing additional information applicable to each of the four unique roles. The required tasks, regardless of the role, are clearly directed unless there is an undirected/enabling issue in the case that the board expects candidates to identify on their own. Day 2 evaluates the competencies listed in the CPA Competency Map mostly in the elective area and in common Financial Reporting and/or Management Accounting areas in depth. The role depth test (Level 2) may also include coverage of other competency areas from the common core.
Day 3 is a four-hour examination containing a mix of small cases (60 to 90 minutes each) that evaluate the common core competencies only. The Day 3 cases provide additional opportunities for depth in Financial Reporting and Management Accounting and all the breadth opportunities for all the technical competency areas. Cases are time constrained, and they are designed to cover different competency areas within each case. A higher level of integration and judgment is required on Day 3 of the CFE than in the core modules, although the technical competencies are tested at the common core level of expectation.
The assessment opportunities on the Day 2 case are given mark values such that each of Day 2 and Day 3 are weighted equally.
The Development of Marking Guides and the Provincial Review Centre
Approximately three months prior to the Common Final Examination booklets being published, provincial reviewers meet to examine the simulations and the preliminary marking guides. The provincial reviewers’ comments are then considered by the board when it finalizes the examination set and again when the senior markers review the marking guides in the context of actual responses.
Appendix A: Examination Design, Marking Guide Development, and Marking of the CFE Page 23
The September 2018 CFE Marking Centre
From the marker applications received, approximately 268 individuals were chosen to participate in the September 2018 CFE marking centre. The criteria for selection included marking experience, motivation, academic achievement, work experience, personal references, and regional representation. The marking was supervised by the CPA Canada Evaluations and International Assessment full-time board staff (6 staff).
The Day 1 HEVW Version 1 linked case was marked by a team of 34 people in Montreal from October 5 to October 27, 2018. The Day 1 FVT Version 2 linked case was marked remotely by a four-member team from September 24 to October 17, 2018.
The Day 2 Common assessment opportunities were marked by a separate team from the role teams for the first time this year. Day 2 Common was marked in Montreal by a team of 42 people from October 5 to 19, 2018. Day 2 Assurance was marked by a team of 59 people in Montreal from October 3 to October 17, 2018. Day 2 Performance Management was marked by a team of 19 people in Montreal from October 5 to October 15, 2018. The other two Day 2 roles (Taxation and Finance) were marked by a total of 16 people, remotely, from September 22 to September 30, 2018, immediately following the preliminary evaluation centre.
Whereas only one Day 3 case was remotely marked for the past two years, all three Day 3 cases were marked remotely from October 7 to October 24, 2018. The Day 3 simulations were marked by a total of 92 people.
Before the marking centre, the members of the CFE subcommittee, staff, leaders, and assistant leaders attended a five-day preliminary evaluation centre (PEC). Participants reviewed the marking guides, applied them to randomly selected candidate responses, and made necessary revisions to the marking guidelines, taking into account the written comments on the marking guides received from provincial reviewers.
At the beginning of the marking centre, the leaders and assistant leaders presented the marking guides to their teams, while staff, the BOE chair, and the vice-chair supervised. The teams undertook a two-phase test-marking procedure prior to actual marking. Phase one consisted of marking guide familiarization, during which markers applied the marking guide to copies of candidates’ responses and collectively reviewed their results. Phase one thus ensured that all markers understood the issues in the marking guide and the basis on which to apply each expectation level. Phase two consisted of an expanded test marking of several responses to establish marker congruence.
After the training and test-marking phases, and only when marker congruence was achieved, live marking commenced. All teams, for all days, had a leader, and anywhere from one to six assistant leaders, and had both French-speaking and English-speaking markers. Each team had one or more markers who marked in both languages.
Appendix A: Examination Design, Marking Guide Development, and Marking of the CFE Page 24
The board strives for the highest possible marking consistency and quality control. Leaders and assistant leaders, therefore, devoted much of their time to cross-marking and other monitoring activities. Markers’ statistics were reviewed to ensure that marking remained consistent throughout the centre. Based on analysis of the statistics, leaders reviewed and, if necessary, re-marked papers to ensure that the assessment opportunities were marked fairly for all candidates. Bilingual markers marked papers in both languages, and their results were compared to ensure that the marking was consistent in both languages.
Borderline Marking (Day 1)
Each candidate’s paper was marked once. All candidates’ responses that were assessed as clear fail, marginal fail, and marginal pass were marked a second time by the team leader, an assistant team leader or a senior marker. Clear pass results were also audited to ensure accuracy of marking.
Double Marking (Day 2)
Each candidate’s Day 2 paper was marked independently by two different markers. If the two initial markings differed on any assessment opportunity, an arbitrator (the leader, the assistant leader, or a senior marker) compared the two initial markings and determined the final result.
As an added measure to ensure that markers were consistently applying the marking guide, a two-day rule exists that results in the second round of marking not beginning until two days have elapsed since the first marking. Adherence to this rule ensures that any movement in the application of the marking guides due to marker interpretations during the first two days of live marking are stabilized before the second marking and arbitration procedures begin.
Borderline Marking (Day 3)
Unlike Day 2, Day 3 was marked using a borderline model. All Day 3 responses were marked once and then the Day 2 and Day 3 results were combined. All failing candidates who passed the Day 2 role test, had their Day 3 response marked a second time by an independent marker, and any differences between the first and second markings were arbitrated by a leader or senior marker.
Subsequent Appeal of Results and Request for Performance Analysis
Failing candidates may apply for an appeal of their examination results and/or a performance analysis for either Day 1, or Day 2 and Day 3, or for all three days.
Appeal Approach
Great care is exercised in the original marking and tabulating of the papers and results. The following appeal procedures are applied to all three papers constituting the Common Final Examination.

Appendix A: Examination Design, Marking Guide Development, and Marking of the CFE Page 25
Under the supervision of the chair of the Board of Examiners, as well as CPA Canada Evaluations and International Assessment staff, the responses are reviewed by the leaders and assistant leaders who did the original marking. The leaders and assistant leaders read the responses and compare them to the marking guides used at the marking centre. In reviewing candidates’ results, two aspects are considered. First, it must be determined that the basis of marking the papers has been consistent with that accorded other candidates who wrote the examination. Second, all responses reviewed are subjected to a careful check to ensure the markers have indicated that consideration has been given to all material submitted by the candidate.
The results are then tabulated and the decision made regarding whether any candidates have been treated unfairly and should be granted a pass on the examination.
The appeal results are then forwarded to the provincial bodies for notification of the candidates.
Appendix B: September 12, 2018 – Day 1 Simulations Page 26
APPENDIX B
SEPTEMBER 12, 2018 – DAY 1 SIMULATIONS
See Part B of CFE report for the marking guides for FVT version 1 and version 2. (The marking guide for the HEVW Version 1 simulation will not be disclosed until version 2 of
the case is written, which will be in September 2019.)
Appendix B: September 12, 2018 – Day 1 Simulations Page 27
COMMON FINAL EXAMINATION SEPTEMBER 12, 2018 – Day 1
Case (HEVW-Version 1) (Suggested time: 240 minutes)
It is September 2020, over two years since Andrew and Jenny expanded their vineyard and decided to build a winery to bottle their wines. Until last week, Andrew continued to be the resident winemaker at County Winery (CW). He helped select and train the new winemaker and left on good terms with Jeremy Stiles, the proprietor of CW. Jeremy agreed to be an advisor to HEVW.
HEVW’s Pinot Noir releases sell out each year, largely because of the awards the wines have won. The HEVW wine club is quite successful and continues to grow as its members get first access to HEVW wines. Andrew and Jenny decided not to enter into a strategic partnership with Niagara College.
This is the first harvest in which Andrew and Jenny will be pressing and bottling their own grapes. The official grand opening of the winery, which includes retail space, and some currently unused space, is scheduled to take place on September 22, 2020, during the Crush Festival, which celebrates the grape harvest season. Jenny oversaw construction of the winery, paving of the parking lot and landscaping. She has worked hard to promote the winery and expects a lot of visitors, both at the grand opening and afterward.
Jenny and Andrew have stayed with their original vision and mission, and recently assembled an advisory board to guide them. The board consists of Andrew (president of HEVW), Jenny (vice-president operations), John Heartwood (creditor, acting as vineyard advisor), Benita Garcia (lead sommelier for Wellington Gastro Pub & Wine Bar, acting as marketing advisor), and Jeremy Stiles (owner of CW, acting as winery advisor). The board’s first meeting will coincide with the grand opening of the winery.
Andrew and Jenny are again asking Bennett & Robertson LLP (BR) for strategic advice. Before HEVW’s advisory board meets, Andrew and Jenny want BR to provide further analysis and advice on the opportunities and challenges they are facing, and to assist them in presenting the issues at the board meeting. All suggestions should be consistent with HEVW’s long-term goals.
Appendix B: September 12, 2018 – Day 1 Simulations Page 28
INDEX TO APPENDICES
Page
I Email from the Heartwoods to Jean Bennett ……….................................................. 29
II Excerpts from Pre-Advisory Board Meeting – Sept. 9, 2020 ……….......................... 31
III Vineyard Update ………............................................................................................. 35
IV Heartbreak Reserve Pinot Noir ………....................................................................... 37
V D’Vine-on-Tap Proposal ……….................................................................................. 38
VI Winery Update ………................................................................................................. 40
VII Financing Options ………........................................................................................... 42
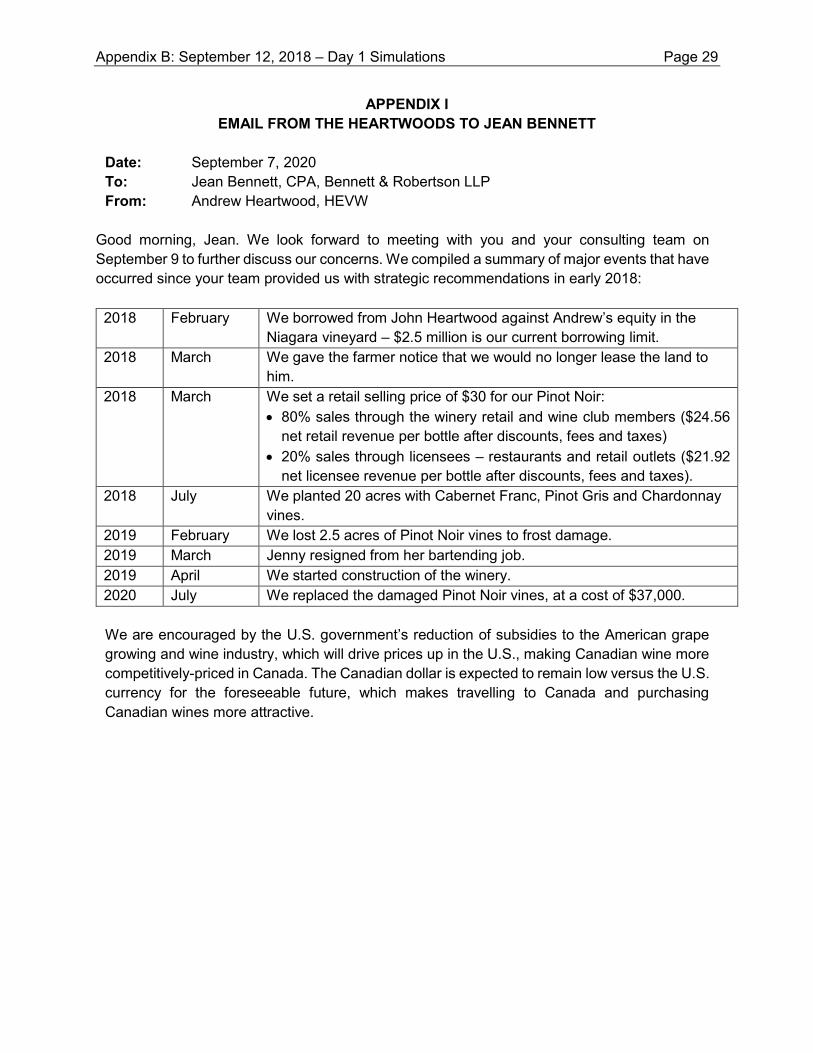
APPENDIX I EMAIL FROM THE HEARTWOODS TO JEAN BENNETT
Date: September 7, 2020 To: Jean Bennett, CPA, Bennett & Robertson LLP From: Andrew Heartwood, HEVW
Good morning, Jean. We look forward to meeting with you and your consulting team on September 9 to further discuss our concerns. We compiled a summary of major events that have occurred since your team provided us with strategic recommendations in early 2018:
2018 February We borrowed from John Heartwood against Andrew’s equity in the Niagara vineyard – $2.5 million is our current borrowing limit.
2018 March We gave the farmer notice that we would no longer lease the land to him.
2018 March We set a retail selling price of $30 for our Pinot Noir: • 80% sales through the winery retail and wine club members ($24.56
net retail revenue per bottle after discounts, fees and taxes) • 20% sales through licensees – restaurants and retail outlets ($21.92
net licensee revenue per bottle after discounts, fees and taxes). 2018 July We planted 20 acres with Cabernet Franc, Pinot Gris and Chardonnay
vines. 2019 February We lost 2.5 acres of Pinot Noir vines to frost damage. 2019 March Jenny resigned from her bartending job. 2019 April We started construction of the winery. 2020 July We replaced the damaged Pinot Noir vines, at a cost of $37,000.
Appendix B: September 12, 2018 – Day 1 Simulations Page 29
We are encouraged by the U.S. government’s reduction of subsidies to the American grape growing and wine industry, which will drive prices up in the U.S., making Canadian wine more competitively-priced in Canada. The Canadian dollar is expected to remain low versus the U.S. currency for the foreseeable future, which makes travelling to Canada and purchasing Canadian wines more attractive.

Appendix B: September 12, 2018 – Day 1 Simulations Page 30
APPENDIX I (continued)EMAIL FROM THE HEARTWOODS TO JEAN BENNETT
Prince Edward County is the fastest growing wine region in the world, with its wines recognized globally. The Pinot Noir continues to increase in popularity among premium wine drinkers, and consumers are willing to pay a significant premium for organic wines. The number of millennials visiting the region is also increasing.
In its recent budget, the Ontario government committed to supporting the Ontario wine industry and announced new grant programs, especially for producers using sustainable farming and innovative packing methods.
The number of local wineries in our area has doubled. There are a number of virtual winemakers looking to bottle their wines, and grape growers looking for wineries to purchase their grapes. Within the next three to five years, 20 to 25 new restaurants or bars are expected to open in the region. All signs point to continued growth.
Appendix B: September 12, 2018 – Day 1 Simulations Page 31
APPENDIX II EXCERPTS FROM PRE-ADVISORY BOARD MEETING – SEPTEMBER 9, 2020
Present: Jean Bennett, Andrew and Jenny Heartwood
Jenny: Jean, we wanted to meet with you before our first advisory board meeting to get your advice on items that we plan to discuss.
Andrew: Now that we have completed planting the vineyard and building our winery, we have some new opportunities that we are exploring. We have done some analysis and would like you to review it and provide your input, including recommendations on how we should proceed.
Jean: Sure. Let’s get started with discussing things that are of concern to you.
Jenny: I am concerned about our cash flow. The forecast that I prepared in January 2019 showed that our net cash for 2020 would be an outflow of $100,000. I haven’t had time to update the forecast but, considering the lost revenue of $155,000 caused by the damaged vines and the replanting costs of $37,000, I estimate that the outflow will be closer to $300,000. We are getting close to our borrowing limit with John.
Andrew: I take some responsibility for our financial problems. Balancing the different demands on my time has been challenging. I didn’t get the damaged Pinot Noir vines replanted until just this past July. The good news is that there should be no more planting for many years.
Jenny: It’s unfortunate that we didn’t have insurance in place on the vines. I thought that Andrew had done that and he thought I had.
Andrew: Insurance isn’t all we need. We have to make a decision on purchasing equipment to protect our vines. I researched two options that we should get the board’s opinion on. I have put together some background information for their consideration (Appendix III).
Jenny: We have both been so busy that Andrew forgot to tell me about the delay in replanting and I didn’t inform him of my overspending on the winery.
I think my winery decisions were right. Thanks to my decor choices, we are featured on the September 2020 cover of Vine and Wine, and that exposure will attract more visitors.
Appendix B: September 12, 2018 – Day 1 Simulations Page 32
APPENDIX II (continued)EXCERPTS FROM PRE-ADVISORY BOARD MEETING – SEPTEMBER 9, 2020
Andrew: I purchased new equipment for the winery whereas I had budgeted for used equipment. The upfront costs were higher, but now our energy costs will be about $35,000 lower per year and carbon dioxide emissions will decrease by over 55,000 kilograms per year. In total, we overspent by about $250,000.
It’s not all bad news. We will soon be bottling our 2019 vintage, which is our best Pinot Noir to date. Over the winter, we will enter it in several national and international wine competitions.
I plan to start producing a special “Heartbreak Reserve Pinot Noir,” aging it an additional 12 months. I prepared an analysis of the impact on revenue (Appendix IV).
Jenny: I am not sure this is a good idea right now. We need to consider how it impacts our immediate cash flow needs. Please let us know if you think we should proceed.
We also need to apply for some government grants. Other local winery owners tell me that grants average 4% of net revenue and that vineyards and wineries pursuing organic and sustainable methods can get grants exceeding 6% until the winery reaches $2.5 million in net revenue. With hindsight, we should have been more proactive about pursuing grants, but I just couldn’t find the time.
We have a proposal from D’Vine-on-Tap (DOT) that I think we should seriously consider. It will provide immediate cash flow. DOT wants to use space in our winery to operate a keg-filling facility. Its marketing representative has provided information on the opportunity, which I have summarized (Appendix V).
The operation can be up and running shortly after we sign the agreement. It could be a great channel for selling our new varietals, which we will be harvesting for the first time this season. Once the vines are at full production in 2022, we may not be able to sell the full production from these varietals through our existing distribution channels.
Andrew: If we rent that space to DOT for five years, our opportunity to be a major player in the Prince Edward County tourism events will be limited, which is one reason we invested so heavily in this beautiful facility. And have you considered other implications of this idea? Wine on tap is relatively new and I am not sure how the market will react to it. It may be perceived as lower-quality wine. Selling our wine on tap may not get it to the right market.
Appendix B: September 12, 2018 – Day 1 Simulations Page 33
APPENDIX II (continued)EXCERPTS FROM PRE-ADVISORY BOARD MEETING – SEPTEMBER 9, 2020
Jenny: Andrew, we have to deal with our short-term cash flow problem. I think this DOT idea is what we need right now. Maybe appealing to a wider market for some of our wines is a good idea.
In addition to the DOT idea, there are other ways to generate cash that we should consider.
Andrew: I agree. Jeremy suggested that a better way to generate cash is to maximize the use of our excess bottling capacity. CW does this by bottling for virtual winemakers in our region and also selling their wines in its store. They also purchase grapes from local vineyards and produce more wine that way. I have prepared information on these opportunities (Appendix VI).
As much as I like the opportunity to fill our bottling capacity, I do not want to harm our own wine sales or negatively impact our brand by producing wines for other vineyards or from purchased grapes. It could also reflect badly on our flagship Pinot Noir if customers drink wine from purchased grapes, thinking it comes from our vineyard. I am not confident that the quality of the wines produced will meet our standard, so I am somewhat reluctant to pursue these options.
Jenny: Can’t we just brand the wines from purchased grapes differently to distinguish them from our wines?
Andrew: I just want to be sure we don’t damage our reputation as an estate winery.
Jenny: That is a risk, but I don’t think it’s insurmountable. In fact, pursuing DOT could free up additional bottling capacity, which could then generate more cash flow through a combination of the virtual winery and purchasing of grapes.
Our long-term goal remains to become a successful small- to mid-size winery. Long term, we should be able to do this with wines from our own vineyard. But in the short-run, we need to consider all options. Since I am no longer working at the bar and Andrew has resigned from his position at CW, we no longer have income from other sources to help out.
Appendix B: September 12, 2018 – Day 1 Simulations Page 34
APPENDIX II (continued)EXCERPTS FROM PRE-ADVISORY BOARD MEETING – SEPTEMBER 9, 2020
Jenny: We don’t get dividends from Andrew’s share of the family vineyard as long as we have the debt to his father. I think we should repay this loan, with debt from a bank or other source, so that we will at least get our dividend income. I have some financing options to present to our advisory board (Appendix VII). These ideas are at an early stage. We are looking for you to identify any potential disadvantages. Do you think any of these are worth investigating further, or do you have other suggestions?
Jean: This discussion has been helpful. We will analyze the decisions you are facing after reviewing the material you provided. We will focus on the strategic implications of the alternatives, as that is what your advisors will be concerned with. I will have CPA, who was part of the original team of advisors, prepare the report.
Appendix B: September 12, 2018 – Day 1 Simulations Page 35
APPENDIX III VINEYARD UPDATE
Prepared by Andrew Heartwood
New vines
The 20 acres planted in July 2018 with VQA-qualified Cabernet Franc, Pinot Gris and Chardonnay vines are growing well and are on track to produce the first harvest in 2020, with an estimated 25% yield. The actual costs for these vines are close to our targeted costs. We continue to use organic farming techniques, which result in lower yields and higher costs but a better wine. The remaining ten acres were to be used for the winery (5 acres) and the potential joint venture with Niagara College (5 acres). We have not yet done anything with the five acres that we had set aside for the college.
Pinot Noir frost damage
The warm air that rises from Lake Ontario mitigates the chance of frost damage to our hillside vineyard, but not during extreme cold. We have experienced extreme cold twice in the past three winters, and avoided frost damage by building bonfires at the bottom of the vineyard hillsides. Sudden cold temperatures in mid-February 2019 resulted in the loss of 25%, or 2.5 acres, of our Pinot Noir vines. The table on the following page shows the impact of the loss, and our annual vineyard and winery production with the replacement vines included, until we reach full production in 2025.
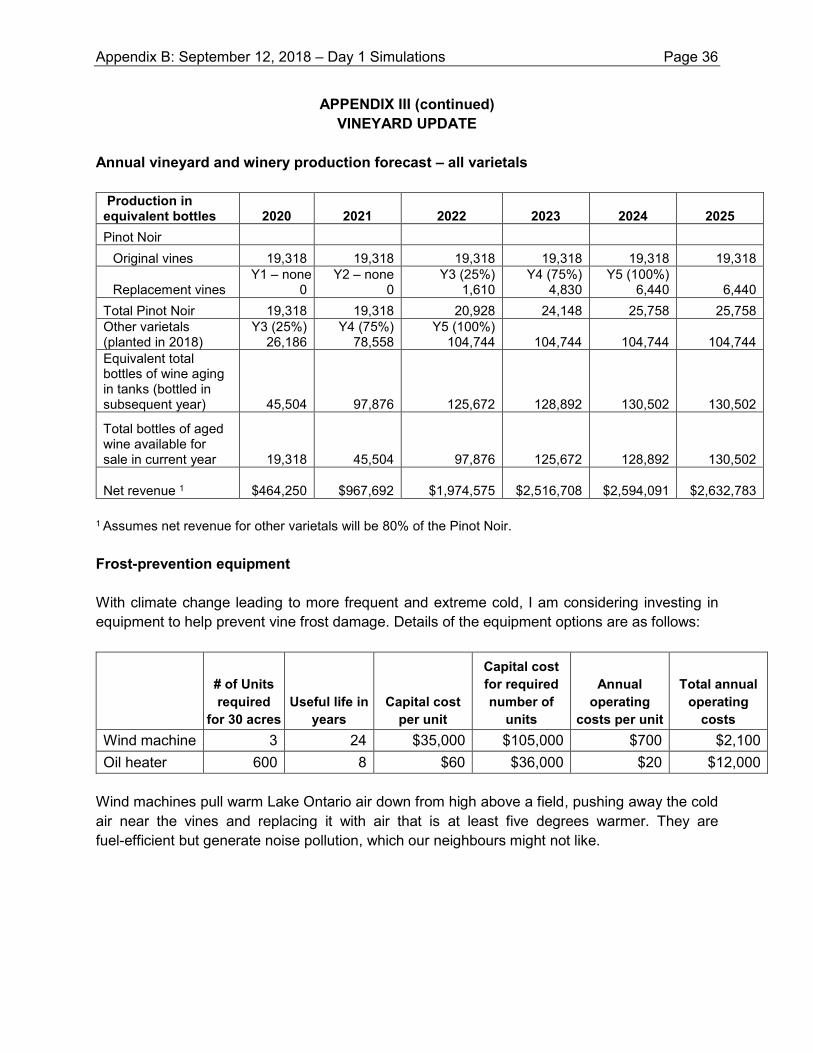
Annual vineyard and winery production forecast – all varietals
Production in equivalent bottles 2020 2021 2022 2023 2024 2025
Pinot Noir Original vines 19,318 19,318 19,318 19,318 19,318 19,318
Replacement vines Y1 – none
0 Y2 – none
0 Y3 (25%)
1,610Y4 (75%)
4,830 Y5 (100%)
6,440
6,440
Total Pinot Noir 19,318 19,318 20,928 24,148 25,758 25,758
Other varietals (planted in 2018)
Y3 (25%) 26,186
Y4 (75%) 78,558
Y5 (100%) 104,744 104,744 104,744 104,744
Equivalent total bottles of wine aging in tanks (bottled in subsequent year) 45,504 97,876 125,672 128,892 130,502 130,502
Total bottles of aged wine available for sale in current year 19,318 45,504 97,876 125,672 128,892 130,502 Net revenue 1 $464,250 $967,692 $1,974,575 $2,516,708 $2,594,091 $2,632,783
1 Assumes net revenue for other varietals will be 80% of the Pinot Noir.
Frost-prevention equipment
With climate change leading to more frequent and extreme cold, I am considering investing in equipment to help prevent vine frost damage. Details of the equipment options are as follows:
# of Units required
for 30 acresUseful life in
years Capital cost
per unit
Capital cost for required number of
units
Annual operating
costs per unit
Total annual operating
costs Wind machine
3 24 $35,000 $105,000 $700 $2,100
Oil heater 600 8 $60 $36,000 $20 $12,000
Appendix B: September 12, 2018 – Day 1 Simulations Page 36
APPENDIX III (continued)VINEYARD UPDATE
Wind machines pull warm Lake Ontario air down from high above a field, pushing away the cold air near the vines and replacing it with air that is at least five degrees warmer. They are fuel-efficient but generate noise pollution, which our neighbours might not like.
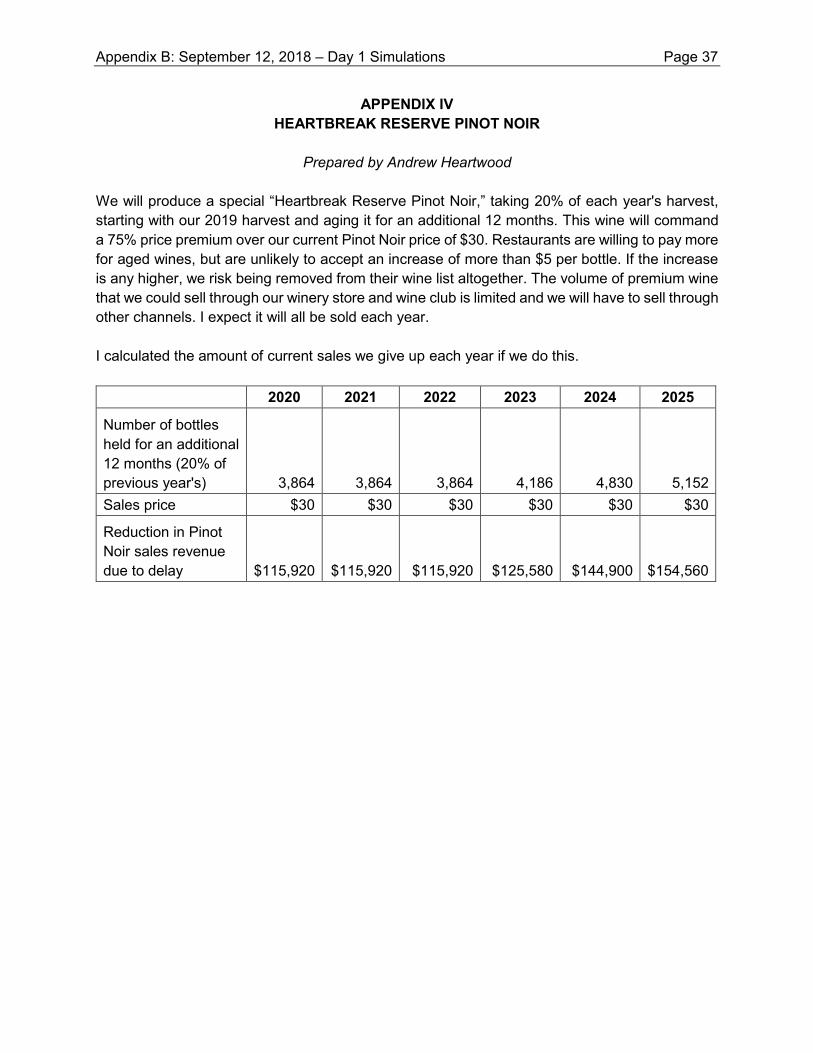
APPENDIX IV HEARTBREAK RESERVE PINOT NOIR
Prepared by Andrew Heartwood
We will produce a special “Heartbreak Reserve Pinot Noir,” taking 20% of each year's harvest, starting with our 2019 harvest and aging it for an additional 12 months. This wine will command a 75% price premium over our current Pinot Noir price of $30. Restaurants are willing to pay more for aged wines, but are unlikely to accept an increase of more than $5 per bottle. If the increase is any higher, we risk being removed from their wine list altogether. The volume of premium wine that we could sell through our winery store and wine club is limited and we will have to sell through other channels. I expect it will all be sold each year.
I calculated the amount of current sales we give up each year if we do this.
2020 2021 2022 2023 2024 2025
Number of bottles held for an additional 12 months (20% of previous year's) 3,864 3,864 3,864 4,186 4,830 5,152 Sales price $30 $30 $30 $30 $30 $30
Reduction in Pinot Noir sales revenue due to delay $115,920 $115,920 $115,920 $125,580 $144,900
Appendix B: September 12, 2018 – Day 1 Simulations Page 37
$154,560
Appendix B: September 12, 2018 – Day 1 Simulations Page 38
APPENDIX V D’VINE-ON-TAP PROPOSAL
Prepared by Jenny Heartwood
D’Vine-on-Tap (DOT) works with wineries to market and distribute a variety of wines to restaurants and bars. DOT currently operates two keg-filling facilities in partnership with local wineries in other regions of southwestern Ontario. Wineries send their wines in bulk to DOT and DOT fills large kegs with the wine. The kegs are owned by DOT and used in the restaurants and bars. The restaurants pay a security deposit to DOT for the kegs and pay the Liquor Control Board of Ontario price for the wine, which DOT submits to the wineries, less a keg-filling fee.
DOT’s proposal to HEVW:
• DOT will contract with local wineries, including HEVW, to keg and sell their wines. • HEVW will provide 2,000 square feet of space in the winery showroom for DOT to use as its
keg-filling facility. • DOT will waive the keg-filling fee for HEVW’s kegs. • DOT will be responsible for all costs associated with setting up the keg-filling facility. • HEVW will make a five-year commitment to DOT with respect to the space and DOT will pay
HEVW $100,000 up front to rent the space for the five years.
The DOT account manager provided me with their estimate of the volume of kegs they expect to sell. DOT has solid evidence to suggest that, if we set up this facility, five new restaurants or bars offering wine on tap will open in the area each year for the next five years. DOT has suggested we could obtain 30% to 40% of the market based on the reputation of our wines. The manager tells me that wine on tap is becoming very popular in the areas where DOT has set up previously, and that having wine on tap results in an overall increase in wine sales.
The stainless-steel kegs have a 30-year lifespan. By eliminating the need for glass, cork, labels and capsules, packaging costs are reduced, which means increased profits.
If we do not pursue this option, we will use the full 2,500 square feet of space to host tourism and other events throughout the year. Longer term, we may consider offering another location for DOT.
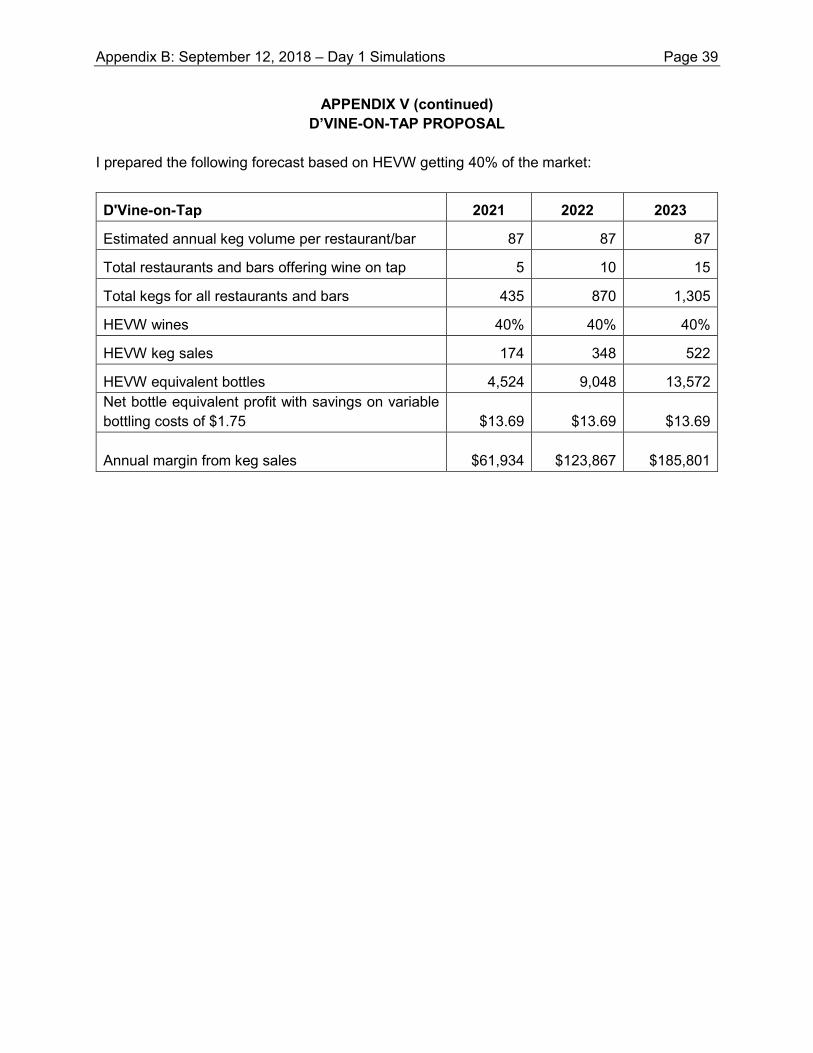
Appendix B: September 12, 2018 – Day 1 Simulations Page 39
APPENDIX V (continued)D’VINE-ON-TAP PROPOSAL
I prepared the following forecast based on HEVW getting 40% of the market:
D'Vine-on-Tap 2021 2022 2023
Estimated annual keg volume per restaurant/bar 87 87 87
Total restaurants and bars offering wine on tap 5 10 15
Total kegs for all restaurants and bars 435 870 1,305
HEVW wines 40% 40% 40%
HEVW keg sales 174 348 522
HEVW equivalent bottles 4,524 9,048 13,572Net bottle equivalent profit with savings on variable bottling costs of $1.75 $13.69 $13.69 $13.69
Annual margin from keg sales $61,934 $123,867 $185,801
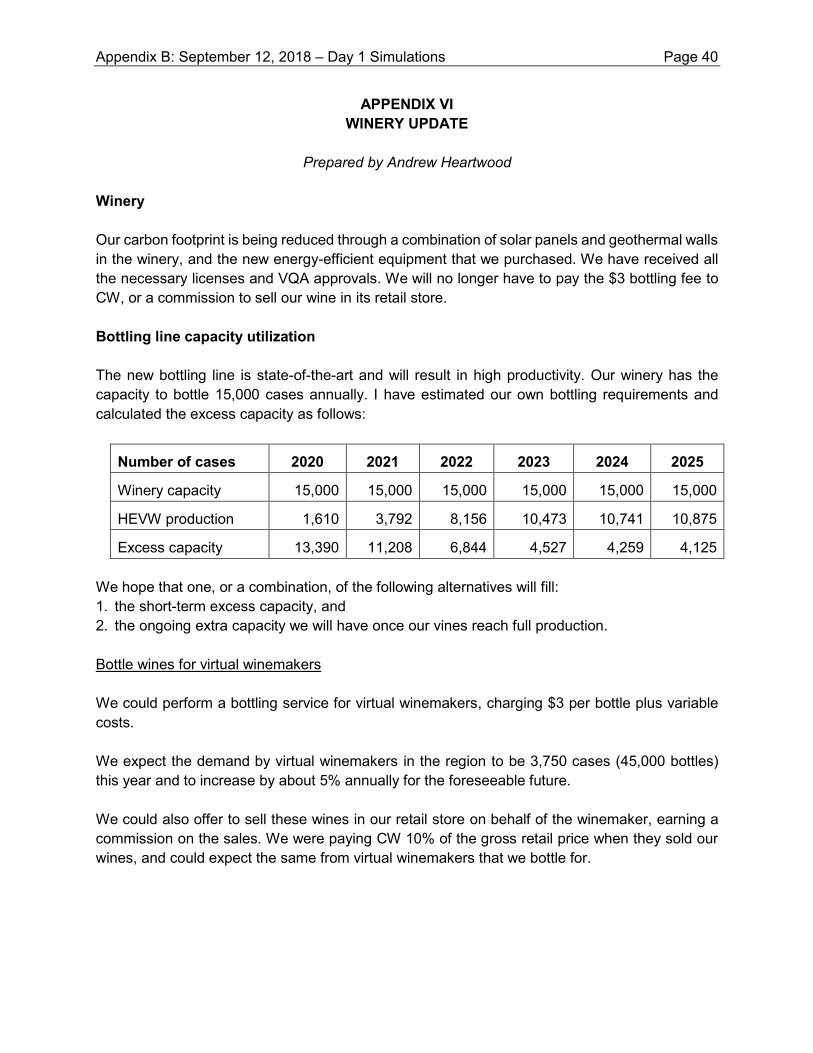
APPENDIX VI WINERY UPDATE
Prepared by Andrew Heartwood
Winery
Our carbon footprint is being reduced through a combination of solar panels and geothermal walls in the winery, and the new energy-efficient equipment that we purchased. We have received all the necessary licenses and VQA approvals. We will no longer have to pay the $3 bottling fee to CW, or a commission to sell our wine in its retail store.
Bottling line capacity utilization
The new bottling line is state-of-the-art and will result in high productivity. Our winery has the capacity to bottle 15,000 cases annually. I have estimated our own bottling requirements and calculated the excess capacity as follows:
Number of cases 2020 2021 2022 2023 2024 2025
Winery capacity 15,000 15,000 15,000 15,000 15,000 15,000
HEVW production 1,610 3,792 8,156 10,473 10,741 10,875
Excess capacity 13,390 11,208 6,844 4,527 4,259 4,125
Appendix B: September 12, 2018 – Day 1 Simulations Page 40
We hope that one, or a combination, of the following alternatives will fill: 1. the short-term excess capacity, and2. the ongoing extra capacity we will have once our vines reach full production.
Bottle wines for virtual winemakers
We could perform a bottling service for virtual winemakers, charging $3 per bottle plus variable costs.
We expect the demand by virtual winemakers in the region to be 3,750 cases (45,000 bottles) this year and to increase by about 5% annually for the foreseeable future.
We could also offer to sell these wines in our retail store on behalf of the winemaker, earning a commission on the sales. We were paying CW 10% of the gross retail price when they sold our wines, and could expect the same from virtual winemakers that we bottle for.
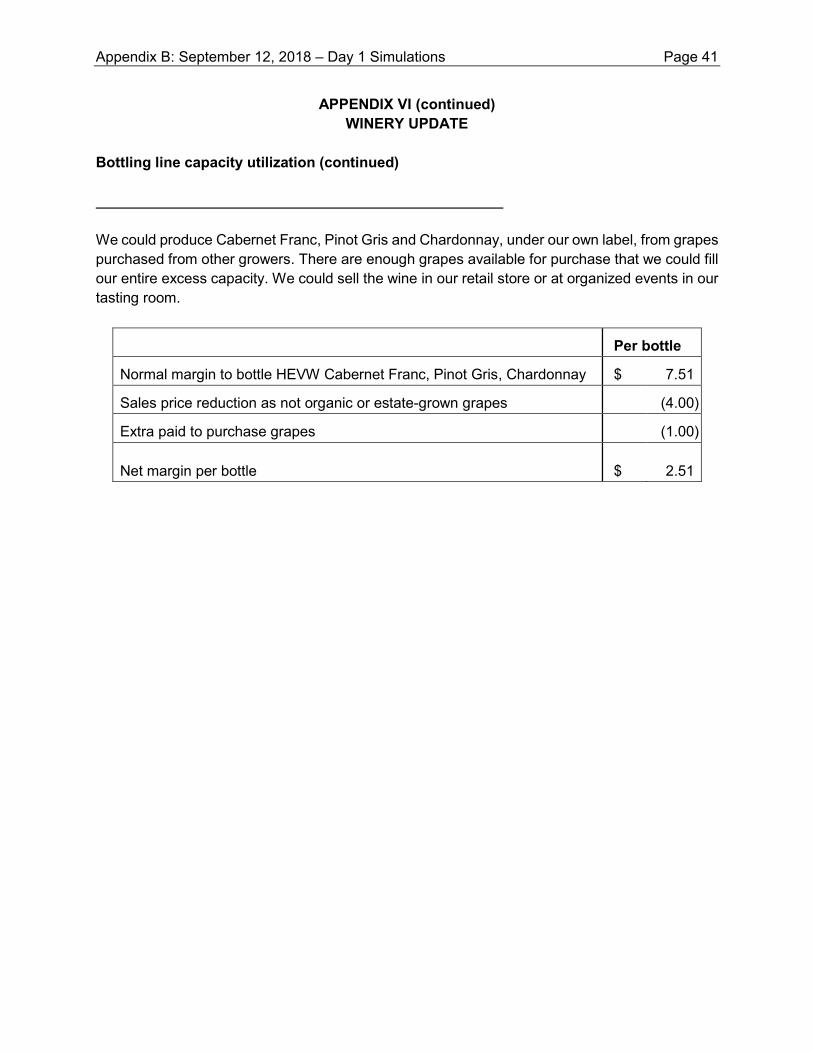
We could produce Cabernet Franc, Pinot Gris and Chardonnay, under our own label, from grapes purchased from other growers. There are enough grapes available for purchase that we could fill our entire excess capacity. We could sell the wine in our retail store or at organized events in our tasting room.
Per bottle
Normal margin to bottle HEVW Cabernet Franc, Pinot Gris, Chardonnay $ 7.51
Sales price reduction as not organic or estate-grown grapes (4.00)
Extra paid to purchase grapes (1.00)
Appendix B: September 12, 2018 – Day 1 Simulations Page 41
APPENDIX VI (continued)WINERY UPDATE
Bottling line capacity utilization (continued)
Net margin per bottle $ 2.51
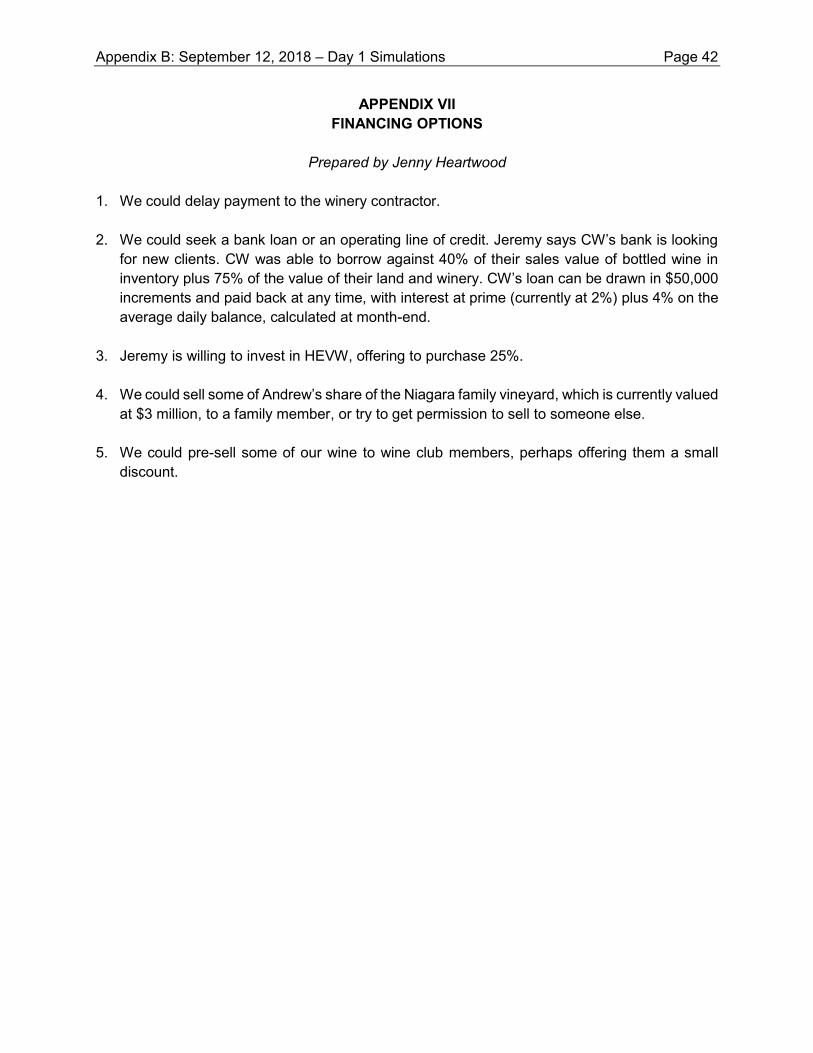
Appendix B: September 12, 2018 – Day 1 Simulations Page 42
APPENDIX VII FINANCING OPTIONS
Prepared by Jenny Heartwood
1. We could delay payment to the winery contractor.
2. We could seek a bank loan or an operating line of credit. Jeremy says CW’s bank is lookingfor new clients. CW was able to borrow against 40% of their sales value of bottled wine ininventory plus 75% of the value of their land and winery. CW’s loan can be drawn in $50,000increments and paid back at any time, with interest at prime (currently at 2%) plus 4% on theaverage daily balance, calculated at month-end.
3. Jeremy is willing to invest in HEVW, offering to purchase 25%.
4. We could sell some of Andrew’s share of the Niagara family vineyard, which is currently valuedat $3 million, to a family member, or try to get permission to sell to someone else.
5. We could pre-sell some of our wine to wine club members, perhaps offering them a smalldiscount.
Appendix B: September 12, 2018 – Day 1 Simulations Page 43
COMMON FINAL EXAMINATION SEPTEMBER 12, 2018 – Day 1
Case (FVT-Version 2) (Suggested time: 240 minutes)
It is May 5, 2020, and Chris Renker, your boss at Renker and Curtis Co. Management Consultants tells you that the original consulting team has another consulting engagement with First View Theatres Inc. (FVT).
Several Canadian manufacturers and producers have ceased operations recently, and in the next twelve months, more closures and layoffs are expected in southwestern Ontario. Interest rates have started to rise and are expected to increase significantly in the short term.
The viewing industry continues to invest in technology. Theatres that lack premium auditoriums have experienced a further decline in attendance. A number of smaller operators have closed, increasing large competitors’ ability to negotiate favourable supplier contracts. To increase attendee numbers and revenues, companies are offering different products and services. One positive note is an increase in demand for independent films that cannot be viewed at home. Many operators are showing this type of film in their theatres, with positive results. Attendees are willing to pay the higher admission fee.
In 2017, FVT purchased Cinema LaRoche (CLR). Since that time, the attendees and revenues at the Quebec theatres have been increasing and represented more than 50% of FVT’s revenues in 2019. However, the profits from Quebec have been declining for two reasons. First, in 2018, the Quebec government increased the minimum wage by 30%, causing wages to increase significantly in 2018 and 2019. Second, FVT’s management has had difficulty integrating the two companies.
After the CLR purchase, FVT successfully introduced the film club concept to Ontario. FVT has been showing independent films to its film club members since January 2018. However, because FVT is a very small player, it is paying higher film licensing fees for all types of films in comparison to the larger, national competitors.
In January 2018, FVT opened The Games Place (TGP) in London, and in November 2019, FVT closed both Sarnia theatre locations. FVT did not proceed with the other major investments that were being considered in 2017.
Appendix B: September 12, 2018 – Day 1 Simulations Page 44
FVT has suffered more than its competitors as declining attendance (7,336,364 in 2019) has resulted in lower purchase volumes, declining revenues per attendee, and higher negotiated prices for film licences and for food and beverages. Profits and operating cash flows have decreased. FVT has maintained its capital assets but no additional funds have been invested in technology. With little cash on hand, FVT has focused on expanding services that require little capital investment. Bonuses were not paid last year after having been reduced in prior years. Focus has shifted from growing revenue per attendee to improving net earnings, with a goal of increasing net earnings by 10% in 2020. The Board of Directors would like the operating income and employee bonus amounts to return to 2016 levels within the next three years. The bank loan is at its maximum and cannot be increased.
The 11,000 outstanding common shares are owned equally by Stephanie, Viktor and Lanny Lightfoot. FVT has not had enough cash and First Lands Limited (FLL) has waived its annual redemption rights on the preferred shares since the last redemption in 2016.
FVT has expanded beyond theatres and wants to differentiate itself but still wants to ensure it provides a premier entertainment experience. The vision was reworded as follows:
“Our vision is to ensure that our guests enjoy a unique, premier, entertainment experience each and every time they visit our locations.”
The mission statement was not changed.
Chris asks you the following: “Please draft a report that will form the basis for my presentation to the FVT board. Take into account what you have previously learned about FVT, and highlight any changes in circumstances that affect the board’s decisions. Assess the major issues facing FVT and discuss any significant factors FVT may not have considered. The board wants coverage of both strategic and operational decisions, but emphasis should be on the strategic elements. Where there is sufficient information, please suggest a course of action. Please identify what, if any, additional information should be obtained.”
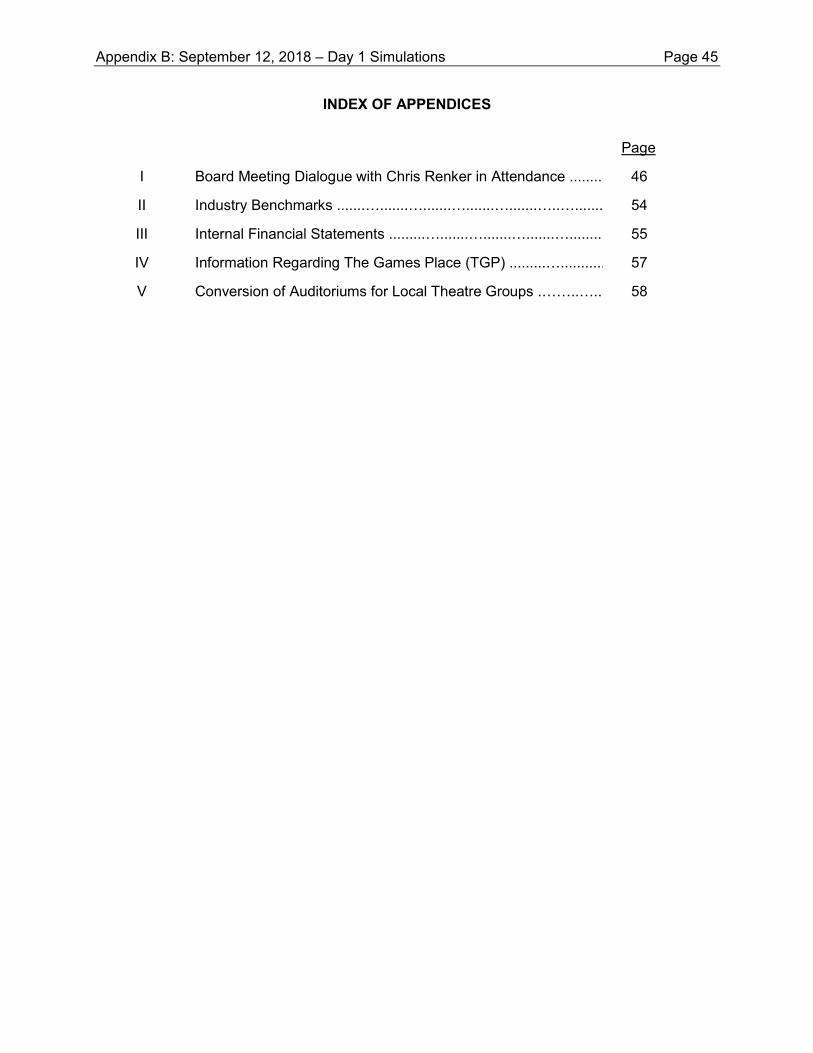
INDEX OF APPENDICES
Page
I Board Meeting Dialogue with Chris Renker in Attendance ......... 46
II Industry Benchmarks .......….......….......….......….......…..…........ 54
III Internal Financial Statements .........….......….......….......…......... 55
IV Information Regarding The Games Place (TGP) .........…........... 57
V Conversion of Auditoriums for Local Theatre Groups .……..…... 58
Appendix B: September 12, 2018 – Day 1 Simulations Page 45
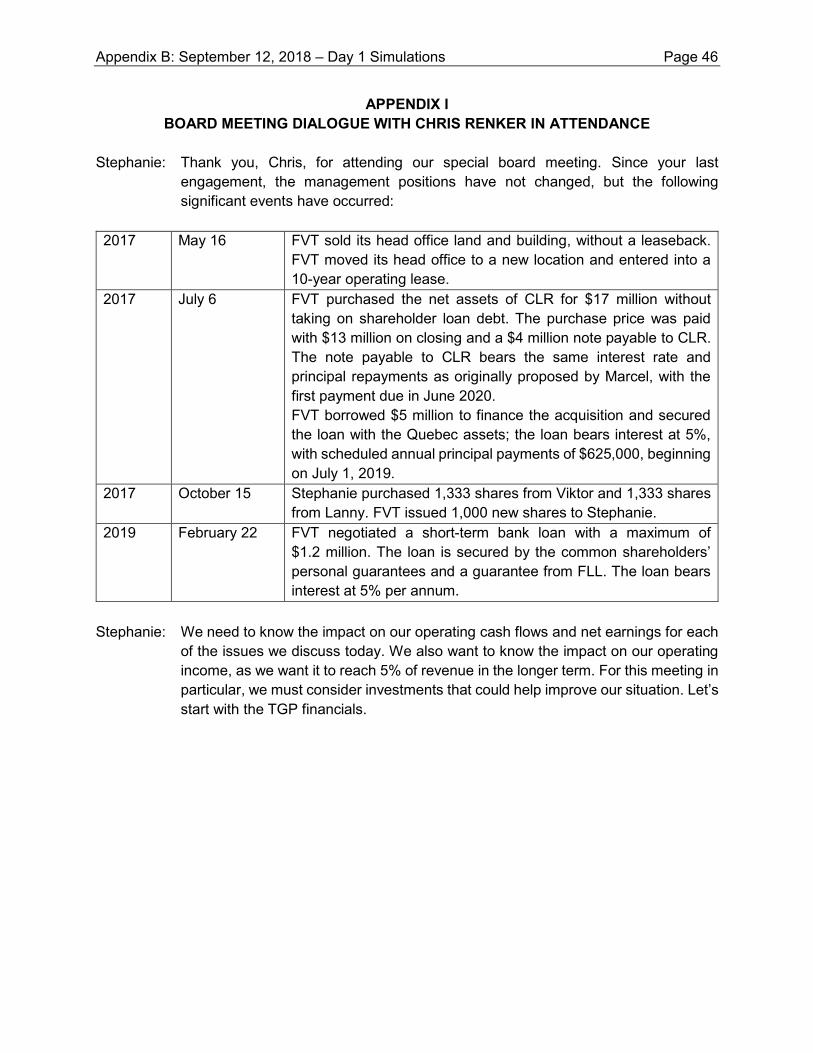
APPENDIX I BOARD MEETING DIALOGUE WITH CHRIS RENKER IN ATTENDANCE
Stephanie: Thank you, Chris, for attending our special board meeting. Since your last
engagement, the management positions have not changed, but the following significant events have occurred:
2017 May 16 FVT sold its head office land and building, without a leaseback.
FVT moved its head office to a new location and entered into a 10-year operating lease.
2017 July 6 FVT purchased the net assets of CLR for $17 million without taking on shareholder loan debt. The purchase price was paid with $13 million on closing and a $4 million note payable to CLR. The note payable to CLR bears the same interest rate and principal repayments as originally proposed by Marcel, with the first payment due in June 2020. FVT borrowed $5 million to finance the acquisition and secured the loan with the Quebec assets; the loan bears interest at 5%, with scheduled annual principal payments of $625,000, beginning on July 1, 2019.
2017 October 15 Stephanie purchased 1,333 shares from Viktor and 1,333 shares from Lanny. FVT issued 1,000 new shares to Stephanie.
2019 February 22 FVT negotiated a short-term bank loan with a maximum of $1.2 million. The loan is secured by the common shareholders’ personal guarantees and a guarantee from FLL. The loan bears interest at 5% per annum.
Stephanie: We need to know the impact on our operating cash flows and net earnings for each
of the issues we discuss today. We also want to know the impact on our operating income, as we want it to reach 5% of revenue in the longer term. For this meeting in particular, we must consider investments that could help improve our situation. Let’s start with the TGP financials.
Appendix B: September 12, 2018 – Day 1 Simulations Page 46
APPENDIX I (continued) BOARD MEETING DIALOGUE WITH CHRIS RENKER IN ATTENDANCE
Lanny: TGP has not been as profitable as anticipated, with a loss in 2019. Based on my staff’s analysis, the poor results relate to the types of games and maintenance costs. Because we purchased the games, we are responsible for all related costs, which are 19% of revenue. We expected each game to last five years, but each game only generates reasonable levels of income in the first six months; after six months, revenues decline dramatically as customers are drawn to the new games. Once the novelty has worn off, they don’t seem to come back.
Viktor: What about leasing the games instead? By letting our games supplier, All Games Inc. (AGI), absorb the risk of the games having shorter useful lives, I believe we can make this work.
Lanny: My staff prepared a preliminary analysis (Appendix IV). They estimated a positive operating income from entering into a lease agreement with AGI. The games lease would require that AGI maintain the games and replace them every six months.
Kent: This whole situation proves that we should stick to what we know – film exhibition. TGP, although unique, is not a premier experience and should be closed and its assets sold as soon as possible!
Stephanie: As I have stated many times, we must move away from the dying film exhibition industry. We need to give this strategy a chance.
Viktor: I agree with Stephanie. I see this as a way to diversify. We should try the leasing option for a few years and see how it goes.
Kent: Based on the last few years’ results, I am not convinced you three know what you are doing. Since opening TGP, has there been a drop in our attendance numbers? Is it taking customers away from our theatres?
Lanny: The decline in our London theatres’ attendance numbers is consistent with declines in our other locations.
Stephanie: AGI is motivated to keep TGP open because this is the first location AGI has supplied in southwestern Ontario, and it wants to expand further in this region. AGI wants us to be successful. I vote to keep TGP open and negotiate for the best terms we can get from AGI.
Appendix B: September 12, 2018 – Day 1 Simulations Page 47
APPENDIX I (continued) BOARD MEETING DIALOGUE WITH CHRIS RENKER IN ATTENDANCE
Lanny: The games lease will be for five years with the option to renew. Closing TGP and
selling the assets would give us desperately-needed cash. I would rather use that cash for other opportunities than waste more time seeing if TGP succeeds. But we signed a long-term lease for the TGP premises, so I suppose we could give this concept another chance.
Viktor: It is too early to close TGP. We just closed Sarnia. Customers may begin to worry
that FVT is in trouble.
Kent: Sheila and I will certainly not be providing another penny to keep TGP open. Viktor: Lanny, why were these problems not brought to our attention earlier? The place has
been open for two years. You should have seen that interest in the games is not lasting as long as we first thought. Are you sure you are on top of this?
Lanny: I was dealing with other matters and wanted to give TGP time to settle, to see if the
problem was just because it was new. My staff is very good and report to me constantly. Even when I am not here, I keep on top of things.
Stephanie: Chris, we’ll need an assessment of whether to accept a new lease arrangement with
AGI and keep TGP open or to close it immediately. Let’s move on. Sheila: A local theatre group asked if we would consider renovating part of our Tillsonburg
theatre to create a stage for live performances. The theatre group has been operating out of a local school but their audiences have grown and they need a larger space.
Kent: They would help finance some of the cost of the renovations, although, as a
non-profit organization, the contribution size will depend on the success of its fundraising. FVT would cover most of the capital costs. We would be offering a permanent location for live theatre, with comfortable seats and great ambience. FVT would rent the location to the theatre group on an as-needed basis for a fixed rate plus a percentage of ticket sale revenues.
Stephanie: Do we know the cost, and how profitable it would be for FVT? Lanny: My staff prepared a preliminary analysis (Appendix V). To provide a stage and
theatre that seats 500, we will have to use two existing Tillsonburg auditoriums. This would leave seven auditoriums available for film exhibition.
Appendix B: September 12, 2018 – Day 1 Simulations Page 48
APPENDIX I (continued) BOARD MEETING DIALOGUE WITH CHRIS RENKER IN ATTENDANCE
Viktor: This sounds more like a charitable donation than a business venture! Can this be
profitable? We will be relying on the theatre group to choose the right plays to draw an audience.
Lanny: My staff estimated rental income, assuming a fixed annual rent of $180,000. The
theatre group plans to produce six plays per year, three more than they can do in their current space. The total estimated rental income and share of revenue from the theatre group would be $188,000. Although the theatre group will pay rent for the full year, they only need the theatre for six months of the year for their rehearsals and performances. The theater group has agreed to let FVT rent the space out to others when not in use by them.
Stephanie: Tillsonburg is one of our more profitable theatre locations. I don’t think this is such a
good idea. How will the community react if we reduce the number of available auditoriums and show times? It could reduce, rather than increase, our earnings.
Kent: Many of the theatre people that I know have asked me to support this endeavour. It
broadens our offering of unique experiences and is a great way to give back to the community. I’m convinced people will still attend the films. The other theatres will simply be fuller than usual.
Sheila: We could also tie this into our film club, perhaps by giving members a discount on
the stage productions. We may be able to attract new clientele. The theatre group thought this might be a great way to promote each other.
Lanny: I think the payback period is more than the five years that we would ordinarily look
for, ignoring the tax benefit for the capital cost allowance. This sounds like a very risky venture. What if the theatre group suddenly shuts down?
Kent: Oh, that will never happen. The group has been around for more than thirty years
and is very well supported by the community. Your payback estimate sounds too conservative. Maybe you should look at it again. Sheila and I are willing to help finance FVT’s share of the costs. Any funds we advance would be interest-free with no fixed repayment terms. In fact, we might even forgive the loan at some future date.
Lanny: The analysis assumes we are renting to other groups wanting stage and auditorium
seating. We have not done any research to validate this amount. Kent: Why not, Lanny? I brought you this idea a month ago, and specifically asked that
you research it.
Appendix B: September 12, 2018 – Day 1 Simulations Page 49
APPENDIX I (continued) BOARD MEETING DIALOGUE WITH CHRIS RENKER IN ATTENDANCE
Lanny: I didn’t have time, and I was waiting for this meeting before going further. I’m
prioritizing my department’s work, which is my prerogative. By the way, this live theatre investment will only add to my staff’s workload.
Stephanie: Never mind. Let’s work with the numbers we have. I would like Chris to provide an
opinion on this potential investment.
Let’s discuss concession costs next. We have been approached by Theatre Buyers Group (TBG), a group of small, regional theatre owners like us. There are already one hundred members in this new buying group, which operates primarily in western Canada and Ontario.
Viktor: As Lanny was unavailable, Stephanie and I met with a TBG representative. There is
an annual membership fee of $25,000 to cover administration costs. Membership allows us to purchase selected concession products at the cost negotiated by TBG, which is about 15% below our current costs. While TBG controls what we buy and from whom, they only use Ontario suppliers. This deal would bring our concession costs down to 23% of concession revenues.
Stephanie: There are other conditions. First, we must commit to a three-year membership and
to a minimum purchase volume for the three years based on the previous year’s sales volumes. Also, their invoices are payable in 10 days and we must be willing to share some financial information, such as concession revenues, with the other members.
Kent: I am not willing to share any financial information with competitors! They will find out
about our business and that our profit levels are dropping. Sheila: Calm down, Kent. We might learn something about our competitors. I think it is more
important to reduce our concession costs than to worry about sharing limited financial information.
Appendix B: September 12, 2018 – Day 1 Simulations Page 50
APPENDIX I (continued) BOARD MEETING DIALOGUE WITH CHRIS RENKER IN ATTENDANCE
Lanny: I talked to KC Corp. (KC), our current supplier, to see what they could do. KC sources
from the U.S. and said that, if we would agree to a fixed U.S. dollar price and assume the risk of the foreign-currency exchange rates, they would give us a 10% discount from our current costs, which would bring our concession costs down to 25% of concession revenues. They want us to commit to a minimum product volume for five years but are willing to negotiate the amount. KC’s payment terms remain at 30 days. The Canadian dollar is supposed to increase in value in the next few years. If exchange rates move in our favour, which I think they will, our savings could be even more than 10%. I like this proposal better than TBG’s because we already know KC.
Viktor: Why haven’t you asked our supplier for this type of contract before? Is it not your responsibility, Lanny, to manage these costs?
Lanny: I cannot do everything around here! Stephanie: Chris, can you please identify the advantages and disadvantages, and inherent risks
in the two agreements? I now want to discuss our investment in Quebec and what we are going to do about it. As you know, profits continue to fall. For 2019, Quebec contributed $4 million to FVT’s EBITDA and $1.2 million to operating income.
Viktor: I propose that we get out of Quebec and sell the net assets. I have found it very
difficult to deal with management. They have ignored all of my suggestions. I get the feeling they don’t want to cooperate with us. I am ready to pull the plug on this investment. I blame Lanny for this mess. He asked to manage this acquisition.
Lanny: Don’t blame me! You know very well that any acquisition takes time to integrate. And
how was I supposed to plan for a legislated increase in minimum wage? I recently changed the manager for the Quebec operations. I have a lot more confidence in this new person. Let’s give them at least another year.
Stephanie: I am not sure we have another year, Lanny. Honestly, I am not sure where we are
going to get $1 million to make the first payment on the note payable to CLR. The bank has indicated that it will renew the long-term loan but will increase the interest rate to 8% and, in addition to the collateral, will require that we maintain a total debt to EBITDA ratio of 4.0 or less. Unless FVT’s earnings increase, we will not be able to meet this new covenant.
Appendix B: September 12, 2018 – Day 1 Simulations Page 51
APPENDIX I (continued) BOARD MEETING DIALOGUE WITH CHRIS RENKER IN ATTENDANCE
Kent: Sheila and I went to Quebec to see for ourselves what was going on, something that
you have not yet done, Lanny. We spoke with Marcel and the local managers, who were very easy to talk to, and they realize that changes need to be made. In fact, they gave me a list of items that seem to have never been acted upon. Lanny, did you ever receive any such list?
Lanny: Yes, I did, and I thought I had told the manager to do whatever needed to be done. Kent: Really? Sheila and I think we can get this all sorted out if, like our competitors, we
increase prices to compensate for the higher wages. We would have Quebec generating significantly higher profits by the end of 2020, and we’d realize some of the expected synergies.
Sheila: I was quite impressed with our Quebec division and think there is a lot of potential.
Kent and I have already made arrangements to move to Quebec for the next four months to be more actively involved until all the issues are resolved.
Stephanie: What? I spoke to Marcel yesterday about the note payable. CLR is prepared to buy
back the net assets at 70% of the price we paid. I don’t think we can wait and I am inclined to accept his offer, since it will resolve all our cash and debt problems.
Lanny: But we would be selling the assets for far less than their current market value. Based
on recent acquisitions, the net assets could be sold for at least their book value of $13 million.
Viktor: I think we should take the offer. We can use the cash from the sale to invest in new
areas rather than wasting it on CLR. Kent: Stephanie, Marcel told me he spoke with you. He also talked to me yesterday and
said that if we wished to keep the theatres in Quebec, he would be willing to change the terms of the note payable so as to defer the due date of the first payment until 2021, as long as we agreed to pay interest at 5% on the note.
Stephanie: Chris, can you please summarize reasons for keeping or selling the theatres in
Quebec?
Thanks to everyone for participating.
Chris: Okay. I have a good idea of what you need and will start work on it immediately.
Appendix B: September 12, 2018 – Day 1 Simulations Page 52

APPENDIX I (continued) BOARD MEETING DIALOGUE WITH CHRIS RENKER IN ATTENDANCE
A few hours later, Stephanie telephones Chris. Stephanie: Chris, this call is concerning Lanny. In March of 2019, he announced that he would
only be working four days a week since he had such reliable staff in the office. The reality is that he is only working, at most, one day a week, yet is still drawing the same salary as Viktor and me. Is that fair?
Appendix B: September 12, 2018 – Day 1 Simulations Page 53
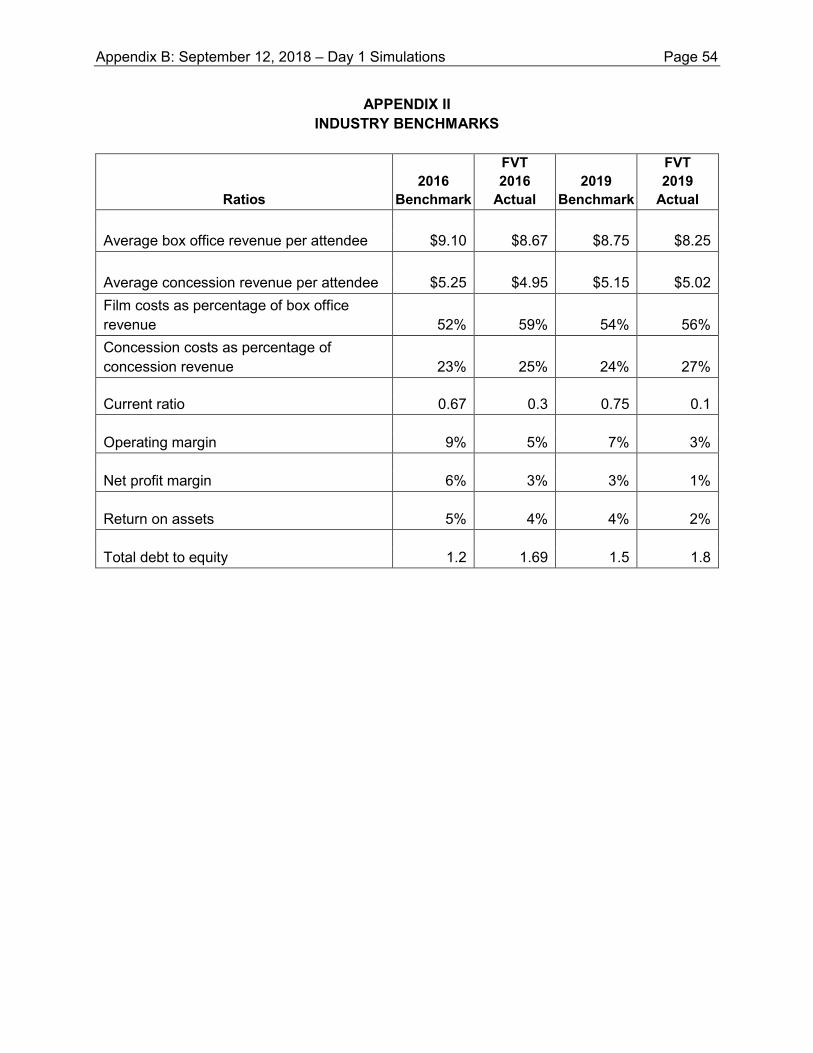
APPENDIX II INDUSTRY BENCHMARKS
Ratios 2016
Benchmark
FVT 2016
Actual 2019
Benchmark
FVT 2019
Actual
Average box office revenue per attendee $9.10 $8.67 $8.75 $8.25
Average concession revenue per attendee $5.25 $4.95 $5.15 $5.02 Film costs as percentage of box office revenue 52% 59% 54% 56% Concession costs as percentage of concession revenue 23% 25% 24% 27%
Current ratio 0.67 0.3 0.75 0.1
Operating margin 9% 5% 7% 3% %5
Net profit margin 6% 3% 3% 1%
Return on assets 5% 4% 4% 2%
Total debt to equity 1.2 1.69 1.5 1.8
Appendix B: September 12, 2018 – Day 1 Simulations Page 54
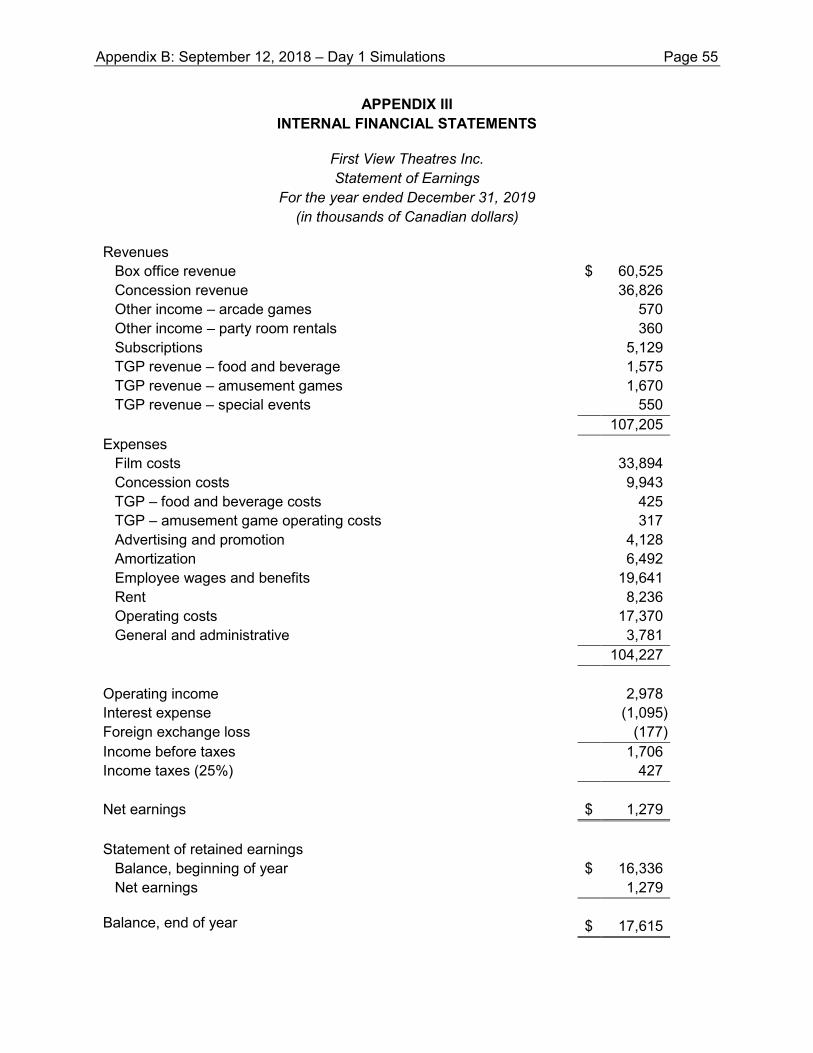
APPENDIX III INTERNAL FINANCIAL STATEMENTS
First View Theatres Inc. Statement of Earnings
For the year ended December 31, 2019 (in thousands of Canadian dollars)
Revenues
Box office revenue $ 60,525 Concession revenue 36,826 Other income – arcade games 570 Other income – party room rentals 360 Subscriptions 5,129 TGP revenue – food and beverage 1,575 TGP revenue – amusement games 1,670 TGP revenue – special events 550
107,205 Expenses
Film costs 33,894 Concession costs 9,943 TGP – food and beverage costs 425 TGP – amusement game operating costs 317 Advertising and promotion 4,128 Amortization 6,492 Employee wages and benefits 19,641 Rent 8,236 Operating costs 17,370 General and administrative 3,781
104,227 Operating income 2,978 Interest expense (1,095) Foreign exchange loss (177) Income before taxes 1,706 Income taxes (25%) 427 Net earnings
$ 1,279
Statement of retained earnings
Balance, beginning of year $ 16,336 Net earnings 1,279
Balance, end of year
$ 17,615
Appendix B: September 12, 2018 – Day 1 Simulations Page 55
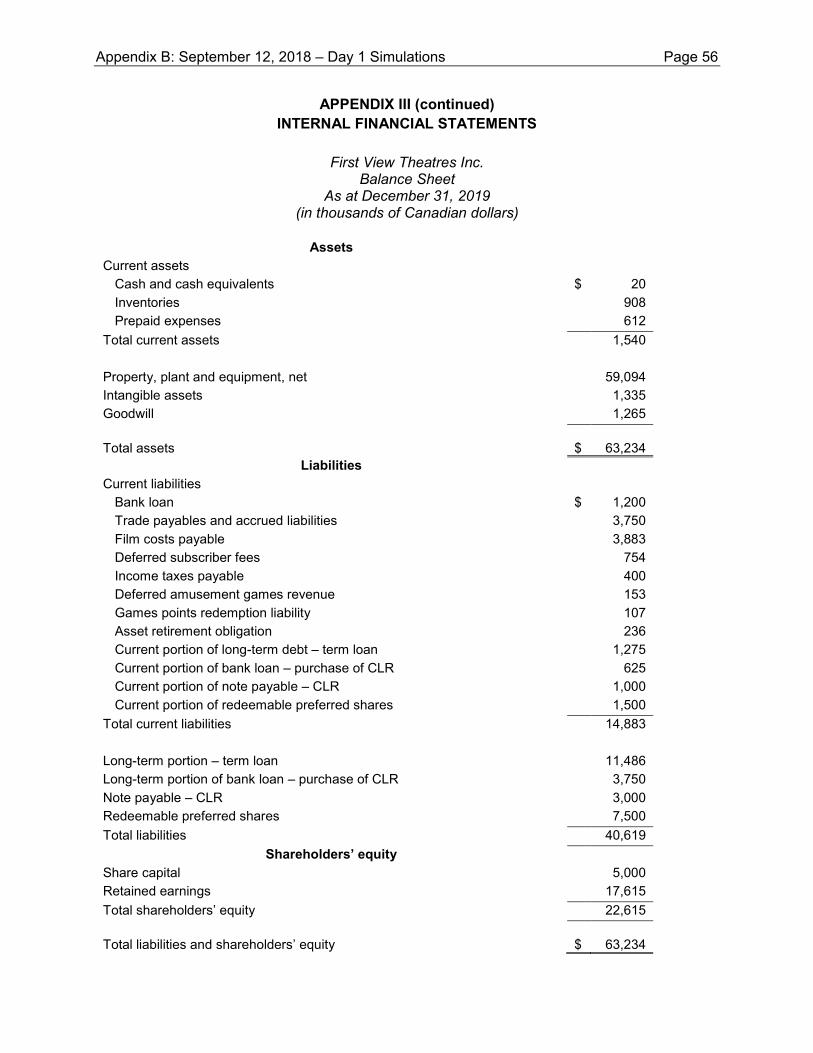
APPENDIX III (continued) INTERNAL FINANCIAL STATEMENTS
First View Theatres Inc.
Balance Sheet As at December 31, 2019
(in thousands of Canadian dollars)
Assets Current assets
Cash and cash equivalents $ 20 Inventories 908 Prepaid expenses 612
Total current assets 1,540 Property, plant and equipment, net 59,094 Intangible assets 1,335 Goodwill 1,265 Total assets
$ 63,234
Liabilities Current liabilities
Bank loan $ 1,200 Trade payables and accrued liabilities 3,750 Film costs payable 3,883 Deferred subscriber fees 754 Income taxes payable 400 Deferred amusement games revenue 153 Games points redemption liability 107 Asset retirement obligation 236 Current portion of long-term debt – term loan 1,275 Current portion of bank loan – purchase of CLR 625 Current portion of note payable – CLR 1,000 Current portion of redeemable preferred shares 1,500
Total current liabilities 14,883 Long-term portion – term loan 11,486 Long-term portion of bank loan – purchase of CLR 3,750 Note payable – CLR 3,000 Redeemable preferred shares 7,500 Total liabilities 40,619
Shareholders’ equity Share capital 5,000 Retained earnings 17,615 Total shareholders’ equity 22,615 Total liabilities and shareholders’ equity
$ 63,234
Appendix B: September 12, 2018 – Day 1 Simulations Page 56
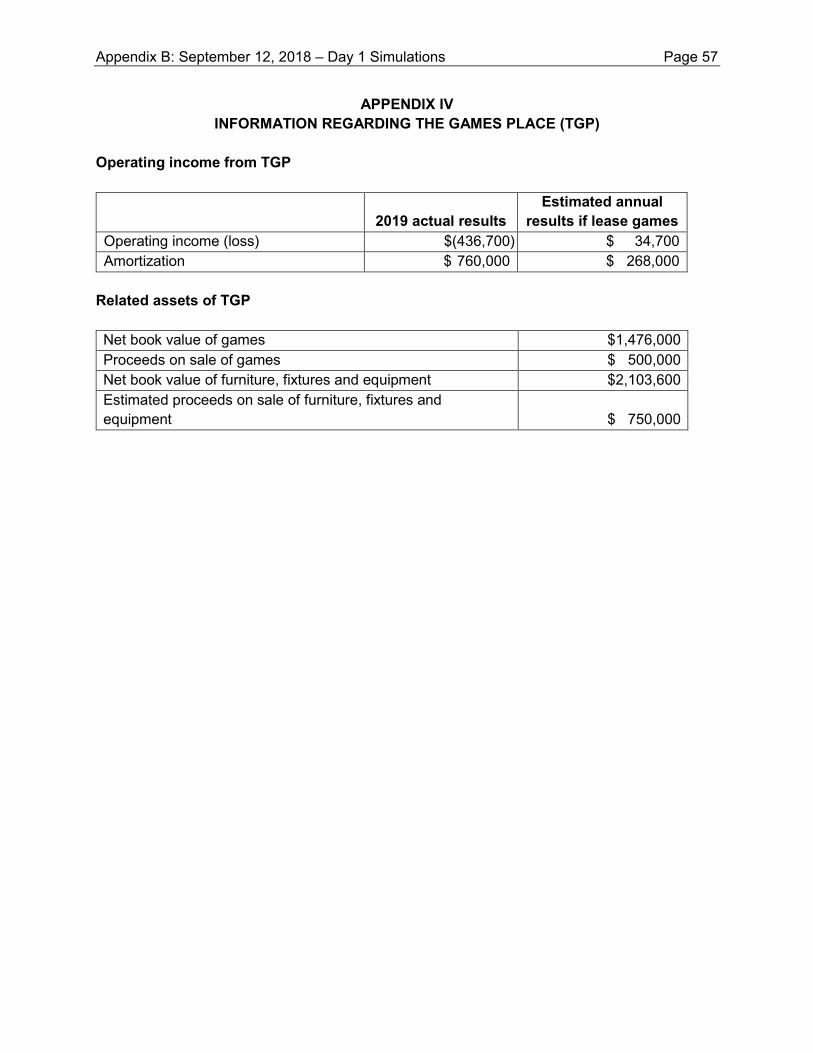
APPENDIX IV INFORMATION REGARDING THE GAMES PLACE (TGP)
Operating income from TGP
2019 actual results Estimated annual
results if lease games Operating income (loss) $(436,700) $ 34,700 Amortization $ 760,000 $ 268,000
Related assets of TGP Net book value of games $1,476,000 Proceeds on sale of games $ 500,000 Net book value of furniture, fixtures and equipment $2,103,600 Estimated proceeds on sale of furniture, fixtures and equipment $ 750,000
Appendix B: September 12, 2018 – Day 1 Simulations Page 57
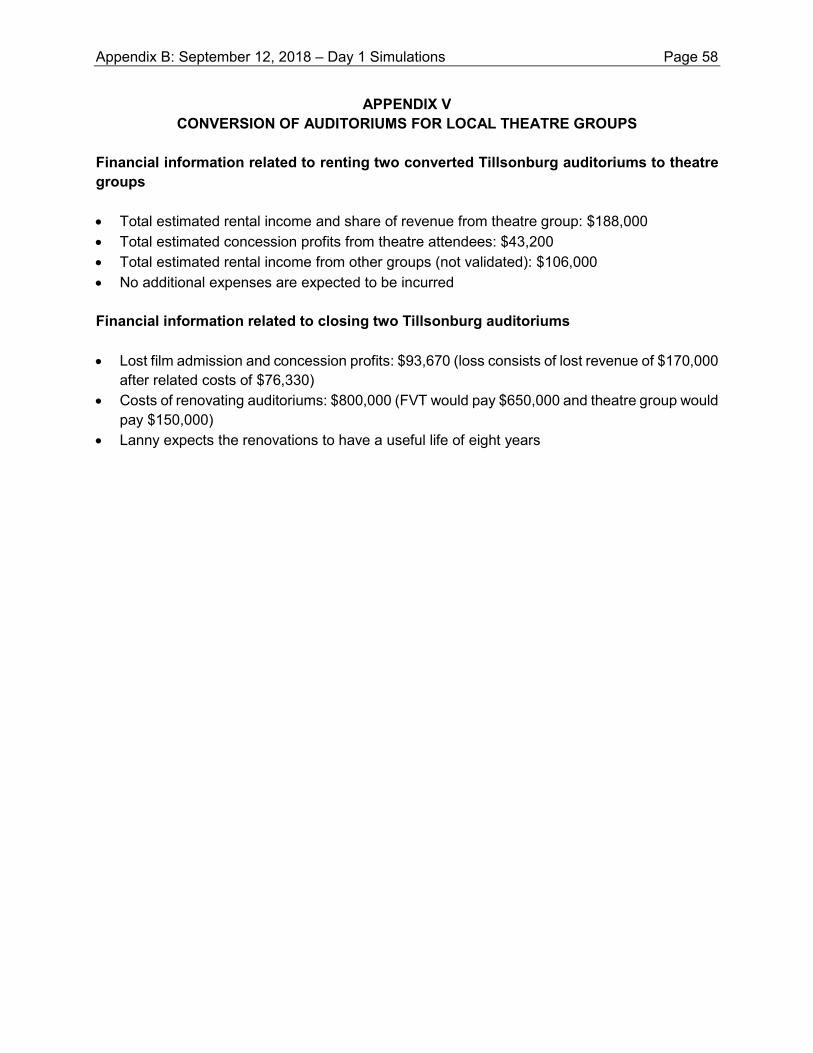
APPENDIX V CONVERSION OF AUDITORIUMS FOR LOCAL THEATRE GROUPS
Financial information related to renting two converted Tillsonburg auditoriums to theatre groups • Total estimated rental income and share of revenue from theatre group: $188,000 • Total estimated concession profits from theatre attendees: $43,200 • Total estimated rental income from other groups (not validated): $106,000 • No additional expenses are expected to be incurred
Financial information related to closing two Tillsonburg auditoriums • Lost film admission and concession profits: $93,670 (loss consists of lost revenue of $170,000
after related costs of $76,330) • Costs of renovating auditoriums: $800,000 (FVT would pay $650,000 and theatre group would
pay $150,000) • Lanny expects the renovations to have a useful life of eight years
Appendix B: September 12, 2018 – Day 1 Simulations Page 58
APPENDIX C
SEPTEMBER 13, 2018 – DAY 2 SIMULATION AND MARKING GUIDES
Appendix C: September 13, 2018 – Day 2 Simulation and Marking Guides Page 59
COMMON FINAL EXAMINATION SEPTEMBER 13, 2018 – Day 2
Case Assume the pre-selected role in which you will be formulating your response. Answer all requireds as specifically directed in your role. Within the requireds for each role, candidates are directed to look at specific additional appendices, which are unique to each role. Use only the information you have been directed to refer to. Information that is shared by all roles is presented in the “Common Information” section. Additional information, customized to each role, is presented in the “Specific Information” section.
INDEX Common Information – to be read by all roles Page Background ................................................................................................................................ 61
Specific Requirements – read only the pages specified for your pre-selected role
Assurance Requirements ......................................................................................................... 62 Finance Requirements ............................................................................................................ 64 Performance Management Requirements ........................................................................... 66 Taxation Requirements ........................................................................................................... 67 Common Information – to be read by all roles
Appendix I – Industry Background ………………………………………………………..... 68 Appendix II – Excerpts from Draft Financial Statements …………………………………. 69 Appendix III – Extracts from Minutes of Meeting to Review Accounting Issues –
February 8, 2018
73 ..………………..…………………………………………. Appendix IV – Bright Project Sales Contracts ……………………………………….……. 75 Appendix V – Warranty Agreement ………………………………………………………… 77 Appendix VI – Purchase of the Net Assets of Bright Sun Power Ltd. ...………………… 78 Appendix VII – Robotic Equipment Purchase .…………………………………...……….. 79 Specific Information – read only the pages specified for your pre-selected role
Appendix VIII – Assurance – Additional Information ……………..…………………..…. 80 Appendix VIII – Finance – Additional Information ………………...……………………... 86 Appendix VIII – Performance Management – Additional Information …………….…… 91 Appendix VIII – Taxation – Additional Information ……………………………………..... 98
Appendix C: September 13, 2018 – Day 2 Simulation and Marking Guides Page 60
BACKGROUND COMMON INFORMATION FOR ALL ROLES
Solar Panel Solutions Inc. (SPS) is a Canadian public company founded in 2001 that manufactures solar panels. SPS sells solar panels to installers and distributors for resale to residential and commercial customers. SPS’s mission is to manufacture and deliver sustainable and efficient energy solutions to its customers.
In August 2017, SPS acquired all the shares of Ontario Wind Farms Inc. (OWF), a startup wind farm that should be operational by January 2019. In October 2017, SPS acquired the net assets of Bright Sun Power Ltd. (Bright), a solar-panel installation company. These acquisitions were made to support SPS’s expansion into value-added services and to diversify. Bright’s services include engineering, design, installation, and multi-year maintenance agreements. As a result, SPS had a new stream of revenue in 2017, consisting of project sales for complete, custom-designed solar-panel installations for commercial and utilities customers. SPS is considering securing additional financing in late 2018 for further expansion plans.
Roger Lindham is the founder, current CEO and chair of SPS and owns 20% of the outstanding common shares. Another 20% is held by Elite Inc. (Elite), which is owned by Jeremy Whitman. The rest of the issued shares are widely held. Elite also holds a convertible bond issued by SPS.
Elite is a holding company that also owns investments in eight other companies involved in alternative sources of energy. Elite invests in underperforming companies and provides them with expertise in order to improve their situation, thereby increasing shareholder value. After five to seven years, Elite sells the investment. At the last annual general meeting in 2017, Elite gained enough proxy votes to secure four of the ten seats on SPS’s Board of Directors, with Jeremy assuming one of the four. Elite promoted the acquisition of OWF and Bright to force SPS to expand. It is now pushing for further operational improvements because the share price, like all solar-panel manufacturers in the industry, has dropped by 40% over the past six months to $25 per share.
Today is February 9, 2018. Jeremy has called a special board meeting to be held in early March to address SPS’s poor 2017 financial results, consider operational and strategic improvements, and approve an action plan. Jeremy has reviewed the draft 2017 financial statements (Appendix II) and voiced his concerns in a meeting with Roger and Thomas Saunders, SPS’s CFO. Extracts from the meeting minutes are in Appendix III.
Additional information, customized to your role, is presented in your role package.
Appendix C: September 13, 2018 – Day 2 Simulation and Marking Guides Page 61
REQUIREMENTS FOR YOUR ROLE (READ ONLY THE ONE SPECIFIED FOR YOUR PRE-SELECTED ROLE)
ASSURANCE REQUIREMENTS
You, CPA, are an employee of CPA LLP, SPS’s external auditors. SPS has been an audit client for the past 10 years. This morning, you met with Andre Leveque, a partner with the firm, to discuss SPS’s 2017 year-end audit. The initial planning was completed in October 2017 and the year-end audit is currently underway, but some additional issues have arisen that will require modifications to the audit plan.
Because Jeremy has some concerns about SPS’s recent financial results and draft 2017 financial statements, Andre asks you to discuss the accounting issues identified by Jeremy and to recommend any required adjustments for the audit file. In addition, as many analysts value the share price using a multiple of diluted EPS, Andre wants you to calculate the basic and diluted EPS for the draft statements, before any accounting adjustments, and he would like you to explain to Roger the impact that the options and convertible bond have on the EPS calculations.
Based on information acquired subsequent to the October audit planning, Andre asks you to update the risk assessment and audit approach. In addition, he would like you to recommend a revised materiality and performance materiality and to improve the documentation surrounding the materiality assessment.
As in previous years, CPA LLP attended some of the inventory counts performed by SPS. The Quebec year-end inventory was assumed to be immaterial this year and therefore SPS’s Quebec inventory count was not attended by CPA LLP. Also, neither SPS nor CPA LLP counted any offsite inventory. Andre asks you to determine what audit procedures can be performed now to ensure the existence and completeness of the inventory on the balance sheet. Andre also wants you to design the appropriate audit procedures for valuation.
CPA LLP hired an expert to determine the fair value of some of Bright’s long-term assets as at October 4, 2017, the date of acquisition. Andre asks you to prepare a memo to file, documenting why using the work of the auditor’s expert is appropriate, as well as what additional procedures would have to be performed in order to use the report received from the expert.
Andre also wants you to recommend audit procedures for the new, specific accounting issues identified by Jeremy.
Although fieldwork is not yet finished, there is already a list of identified misstatements. Andre has reviewed and approved these proposed adjustments and wants you to prepare the summary of identified misstatements to date and to comment on how the aggregate errors, if left uncorrected, would impact the audit opinion. Because any new, proposed adjustments related to the financial reporting issues identified by Jeremy will need to be reviewed and approved, please do not include these in your summary.
Appendix C: September 13, 2018 – Day 2 Simulation and Marking Guides Page 62
REQUIREMENTS FOR YOUR ROLE (continued) (READ ONLY THE ONE SPECIFIED FOR YOUR PRE-SELECTED ROLE)
ASSURANCE REQUIREMENTS (continued)
Given that CPA LLP will be providing SPS with a management letter, Andre would like you to discuss any control weaknesses you identify with the job-costing program acquired from Bright and related processes, along with recommendations to improve them.
Finally, SPS currently does not have its quarterly interim financial statements reviewed. Jeremy is concerned that new, complex transactions may not be recorded properly in the financial statements during the year and the errors may not be detected until the year-end audit. He is considering engaging CPA LLP to perform quarterly reviews. Andre asks you to draft a memo to Jeremy explaining what a review of interim financial statements is, including how it differs from an annual financial statement audit, and any first-time interim review considerations SPS should be made aware of. In addition, if SPS does not elect to have its quarterly financial statements reviewed, he wants you to suggest how the year-end audit plan can be changed to address Jeremy’s concerns.
In addition to the common appendices (I to VII), information provided in Appendix VIII (Assurance) is relevant for your analysis.
Appendix C: September 13, 2018 – Day 2 Simulation and Marking Guides Page 63
REQUIREMENTS FOR YOUR ROLE (READ ONLY THE ONE SPECIFIED FOR YOUR PRE-SELECTED ROLE)
FINANCE REQUIREMENTS
You, CPA, are a financial analyst for Elite and report directly to Jeremy. Recently, Jeremy met with Roger to discuss a number of issues relating to the 2017 year-end.
Because Jeremy has some concerns about SPS’s recent financial results and the draft 2017 financial statements, he asks you to discuss the accounting issues he has identified and recommend any required adjustments. In addition, as many analysts value the share price using a multiple of diluted EPS, Jeremy wants you to calculate the basic and diluted EPS for the draft statements, before any accounting adjustments, and he would like you to explain the impact that the options and convertible bond have on the EPS calculations.
A computer processing company in southern Ontario, Comcap Inc. (Comcap), has recently approached SPS about a solar farm. Comcap requires large amounts of electricity to run its data centre and wants to enter into a purchase agreement to buy all the electricity that a solar farm, built and owned by SPS, will generate. Jeremy wants to know whether you would recommend that SPS make this investment, and he wants your analysis to consider both quantitative and qualitative aspects.
Jeremy also wants to understand the impact of electricity prices and sunlight hours on the net present value of the solar farm project. Therefore, he wants you to determine the minimum amount of revenue required for the project to be financially acceptable for SPS. If the solar farm generates 30,000 kilowatts per hour, and the selling price for the electricity is $0.14 per kilowatt, how many hours of annual sunlight are required to achieve this amount of revenue? In addition, assuming 1,500 hours of annual sunlight, what selling price would generate the minimum amount of revenue?
Jeremy likes the idea of solar farming and is considering building a second solar farm to service more customers (other than Comcap). He has been approached by an investor interested in investing in this solar farm, which would generate electricity using a newly-developed technology. Jeremy has not yet decided to undertake this investment, as relevant information related to the project has not yet been obtained. The solar farm would have an estimated initial cost of $400 million. In the past, Jeremy has used project financing for larger projects (in other words, setting up a second legal entity that is financed separately and managed independently from SPS). He asks you to determine the appropriate cost of capital for this project, to discuss why project financing might be appropriate, and to list both advantages and disadvantages of using project financing, assuming that SPS goes forward with this investment. You are not asked to analyze the decision of whether to proceed with this additional investment.
Last week, SPS received an offer of $20 million from Grain Farmers Co-op (GFC) for the purchase of 100 % of the outstanding shares of Ontario Wind Farms Inc. (OWF). GFC owns and operates other wind farms. Jeremy wants to know the value of OWF to SPS, and whether GFC’s offer should be accepted.
Appendix C: September 13, 2018 – Day 2 Simulation and Marking Guides Page 64
REQUIREMENTS FOR YOUR ROLE (continued) (READ ONLY THE ONE SPECIFIED FOR YOUR PRE-SELECTED ROLE)
FINANCE REQUIREMENTS (continued)
In light of GFC’s interest in the wind farm, Jeremy wonders whether SPS should instead offer GFC a 25% ownership in OWF. OWF would then issue enough new shares from OWF to provide GFC with 25% ownership. The funds received from the issuance of these shares would be used to help finance the remaining construction of the wind farm. Jeremy wants you to calculate the amount that OWF should require in exchange for these shares. He also wants you to list the advantages and disadvantages of the possible share issue and determine whether it would be appropriate for SPS.
Due to increased market competition, SPS's competitors are now offering 60-day credit terms on their solar panels. Jeremy is contemplating doing the same and wants you to calculate the impact on SPS's income before taxes, as well as on its cash cycle, of offering 60-day credit terms. The current policy is to allow a 30-day credit period. He asks you to recommend improvements to SPS’s current working capital management, and to evaluate the option of offering a discount for early payment to its largest customer.
To compensate for the share price decline, a board member suggested that the cash balance at year-end ($8,580,000) be used to either repurchase shares or be paid out as a dividend. Jeremy wants you to analyze both options, and recommend whether SPS should pay dividends, repurchase shares, or do nothing. He also wants you to determine the number of shares that would be repurchased if that particular option is selected, and determine the impact of each of the two options on SPS's earnings per share.
Jeremy also suggests that SPS follow a “residual dividend policy” going forward. A residual dividend policy consists of paying as a dividend any funds left over from the current earnings after having provided for recurring capital expenditures, assuming these are financed using the target capital structure, which for SPS is 30% debt. The residual is available for dividend payouts. He anticipates recurring capital investments of $15 million, starting in 2018. Jeremy wants you to determine the dividend-per-share that would be paid out under this policy, using the 2017 financial statements.
In addition to the common appendices (I to VII), information provided in Appendix VIII (Finance) is relevant for your analysis.
Appendix C: September 13, 2018 – Day 2 Simulation and Marking Guides Page 65
REQUIREMENTS FOR YOUR ROLE (READ ONLY THE ONE SPECIFIED FOR YOUR PRE-SELECTED ROLE)
PERFORMANCE MANAGEMENT REQUIREMENTS
You, CPA, are a financial analyst for Elite and report directly to Jeremy. Recently, Jeremy met with Roger to discuss a number of issues relating to the 2017 year-end.
Because Jeremy has some concerns about SPS’s recent financial results and the draft 2017 financial statements, he asks you to discuss the accounting issues he has identified and recommend any required adjustments. In addition, as many analysts value the share price using a multiple of diluted EPS, Jeremy wants you to calculate the basic and diluted EPS for the draft statements, before any accounting adjustments, and he would like you to explain the impact that the options and convertible bond have on the EPS calculations.
Jeremy asks that you complete a situational analysis for SPS before examining the strategic and operational changes that he is considering. He also wants you to summarize the risks that SPS is currently facing, and suggest ways to mitigate them.
A computer processing company in southern Ontario, Comcap Inc. (Comcap), has recently approached SPS about a solar farm. Comcap requires large amounts of electricity to run its data centre and built its own solar farm to meet most of its electricity needs. Subsequently, Comcap realized that it does not have the expertise to operate the farm and has approached SPS to do so. Jeremy would like you to qualitatively and quantitatively assess whether SPS should enter into this operating agreement.
SPS uses performance indicators to determine bonuses for its two manufacturing plant managers. Both manufacturing managers have complained that many of the indicators are unfair as they measure factors outside of their control. Jeremy asks you to review each performance indicator, discuss whether it is relevant and fair, and recommend improvements and additional, appropriate, performance indicators. The plant managers also complained that the price used to transfer the final product to the sales division significantly decreased their 2017 bonuses. Jeremy would like you to review the transfer pricing data provided and discuss the pros and cons of all the different transfer price options on the manufacturing plant managers’ and sales manager’s bonuses, and recommend a more equitable policy. Finally, Jeremy believes the solar-panel division’s operational costs could be reduced by outsourcing the sales division. Jeremy has gathered some data and wants your analysis of it, taking into account the possibility of a 10% increase or decrease from 2017 solar-panel sales levels. Your recommendation should be supported by a qualitative assessment.
In addition to the common appendices (I to VII), information provided in Appendix VIII (Performance Management) is relevant for your analysis.
Appendix C: September 13, 2018 – Day 2 Simulation and Marking Guides Page 66
REQUIREMENTS FOR YOUR ROLE (READ ONLY THE ONE SPECIFIED FOR YOUR PRE-SELECTED ROLE)
TAXATION REQUIREMENTS
You, CPA, work in the tax group at CPA LLP. Sheila LaRoche, a tax partner with the firm, recently met with Roger to discuss a number of issues relating to the 2017 year-end. Sheila asks you to assist with Roger’s requests.
Because Jeremy has some concerns about SPS’s recent financial results and the draft 2017 financial statements, Roger asks you to discuss the accounting issues Jeremy has identified and recommend any required adjustments. In addition, as many analysts value the share price using a multiple of diluted EPS, Roger wants you to calculate the basic and diluted EPS for the draft statements, before any accounting adjustments, and he would like you to explain the impact that the options and convertible bond have on the EPS calculations.
Sheila asks you to calculate both the taxable income and taxes payable for 2017 based on the revised net earnings. Sheila does not want you to prepare any of the related financial accounting adjustments for deferred taxes or income taxes payable. She does, however, want you to discuss each adjustment that you include in your calculations, and provide a detailed capital cost allowance calculation.
Roger asks you to discuss the implications for Ontario Wind Farms Inc. (OWF) of its acquisition by SPS in 2017. Specifically, he wants to understand the tax implications of this acquisition of control.
Last week, SPS received an offer from Grain Farmers Co-op (GFC) to purchase OWF. Roger wants an analysis of the tax issues arising from the sale, whether for assets or shares, at the amounts offered, and the implications for both OWF and SPS. Specifically, Sheila wants you to determine which option will yield the most after-tax cash for SPS.
Jeremy would like to outsource the sales division by laying off the sales staff and hiring independent contractors. Sheila asks you to discuss the tax differences for SPS between having employees and having independent contractors. For the purpose of recruiting contractors, Roger has asked that CPA LLP also discuss the tax implications from the salesperson’s perspective of being an independent contractor as opposed to an employee. Specifically, he wants to know what independent contractors can deduct from their commission income.
A board member suggested that SPS pay dividends in 2018. Roger already receives annual dividends from Vitality Corp. (VC), a Canadian-controlled private corporation. VC typically earns active business income below the small business limit and is not associated with SPS. Roger wants to understand from a qualitative and quantitative perspective how the tax treatment of dividends paid by SPS will differ from the VC dividends he receives. He receives around $100,000 in dividends from VC in addition to his $200,000 annual salary (which will not be reduced) and expects that SPS would pay him a $100,000 dividend in 2018.
In addition to the common appendices (I to VII), information provided in Appendix VIII (Taxation) is relevant for your analysis.
Appendix C: September 13, 2018 – Day 2 Simulation and Marking Guides Page 67
APPENDIX I – COMMON INDUSTRY BACKGROUND
Manufacture of solar panels
The primary ingredient in the manufacturing of solar panels is polysilicon, which goes into the solar cells that convert sunlight energy into electricity. The production of solar panels is very labour intensive and generates large amounts of hazardous waste, which is disposed of according to strict government regulations.
SPS has a strong R&D team that, in 2017, developed panels with higher production efficiency. The team is currently developing panels from products that produce less hazardous waste.
Industry information
Due to excess supply and decreased demand, the solar-panel industry has suffered in the past few years. Capacity utilization for the industry has fallen from a historical rate of 85% to 75% for 2017.
The selling price of the different-sized panels is based on the number of watts per hour of sunlight. The average selling price per solar panel and the cost of polysilicon have both declined significantly over the past three years and are expected to remain low for the foreseeable future.
The trend in manufacturing solar panels has been for companies to improve their efficiency in producing electricity, thereby lowering the overall cost for customers, and to reduce manufacturing costs to offset the lower selling prices.
Solar panels have become homogenous, with little differentiation between competitors’ products. Due to its low cost per unit, China has become a leader in this global industry. In order to compete, most Canadian manufacturers are offering more value-added services, including design, engineering, installation of solar farms, and creation of their own solar farms from which to sell electricity. In an effort to diversify, some competitors have also expanded into other sources of renewable energy such as wind turbines, investing in wind farms and selling the electricity generated or entering into partnerships to co-own these facilities.
Appendix C: September 13, 2018 – Day 2 Simulation and Marking Guides Page 68
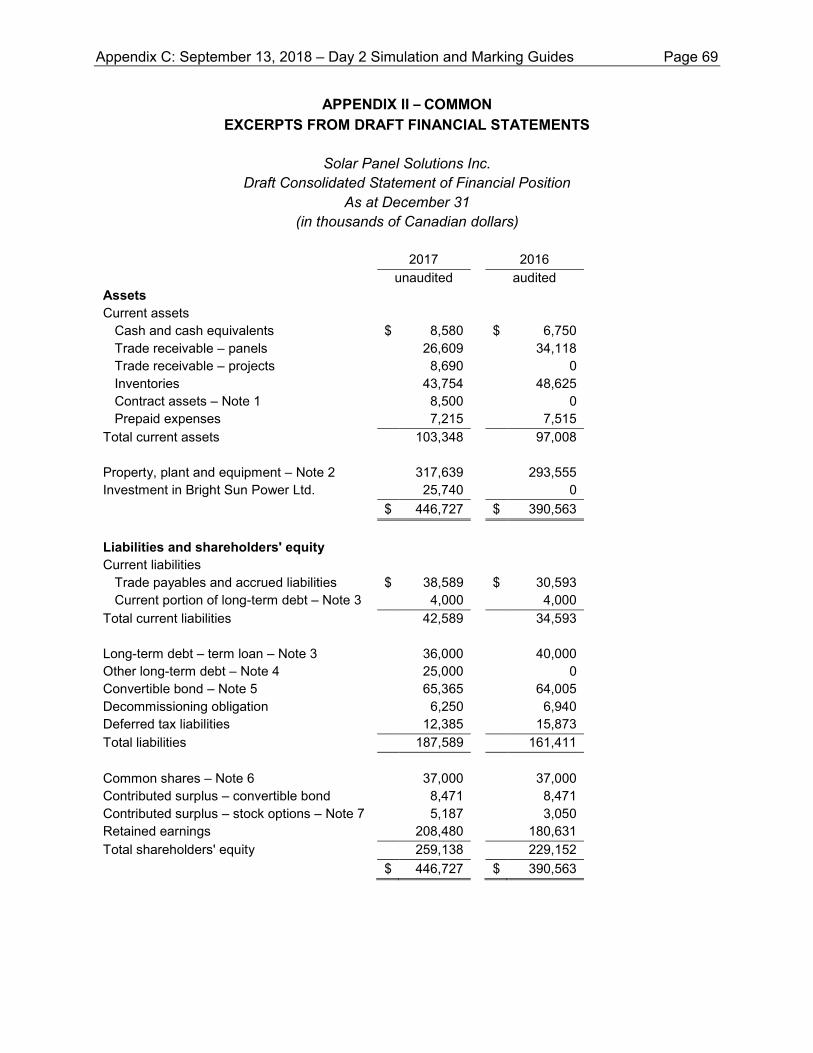
APPENDIX II – COMMON EXCERPTS FROM DRAFT FINANCIAL STATEMENTS
Solar Panel Solutions Inc.
Draft Consolidated Statement of Financial Position As at December 31
(in thousands of Canadian dollars)
2017 unaudited
2016 audited
Assets Current assets
Cash and cash equivalents $ 8,580 $ 6,750 Trade receivable – panels 26,609 34,118 Trade receivable – projects 8,690 0 Inventories 43,754 48,625 Contract assets – Note 1 8,500 0 Prepaid expenses 7,215 7,515
Total current assets 103,348 97,008
Property, plant and equipment – Note 2 317,639 293,555 Investment in Bright Sun Power Ltd. 25,740 0 $ 446,727 $ 390,563
Liabilities and shareholders' equity Current liabilities
Trade payables and accrued liabilities $ 38,589 $ 30,593 Current portion of long-term debt – Note 3 4,000 4,000
Total current liabilities 42,589 34,593
Long-term debt – term loan – Note 3 36,000 40,000 Other long-term debt – Note 4 25,000 0 Convertible bond – Note 5 65,365 64,005 Decommissioning obligation 6,250 6,940 Deferred tax liabilities 12,385 15,873 Total liabilities 187,589 161,411
Common shares – Note 6 37,000 37,000 Contributed surplus – convertible bond 8,471 8,471 Contributed surplus – stock options – Note 7 5,187 3,050 Retained earnings 208,480 180,631 Total shareholders' equity 259,138 229,152 $ 446,727 $ 390,563
Appendix C: September 13, 2018 – Day 2 Simulation and Marking Guides Page 69
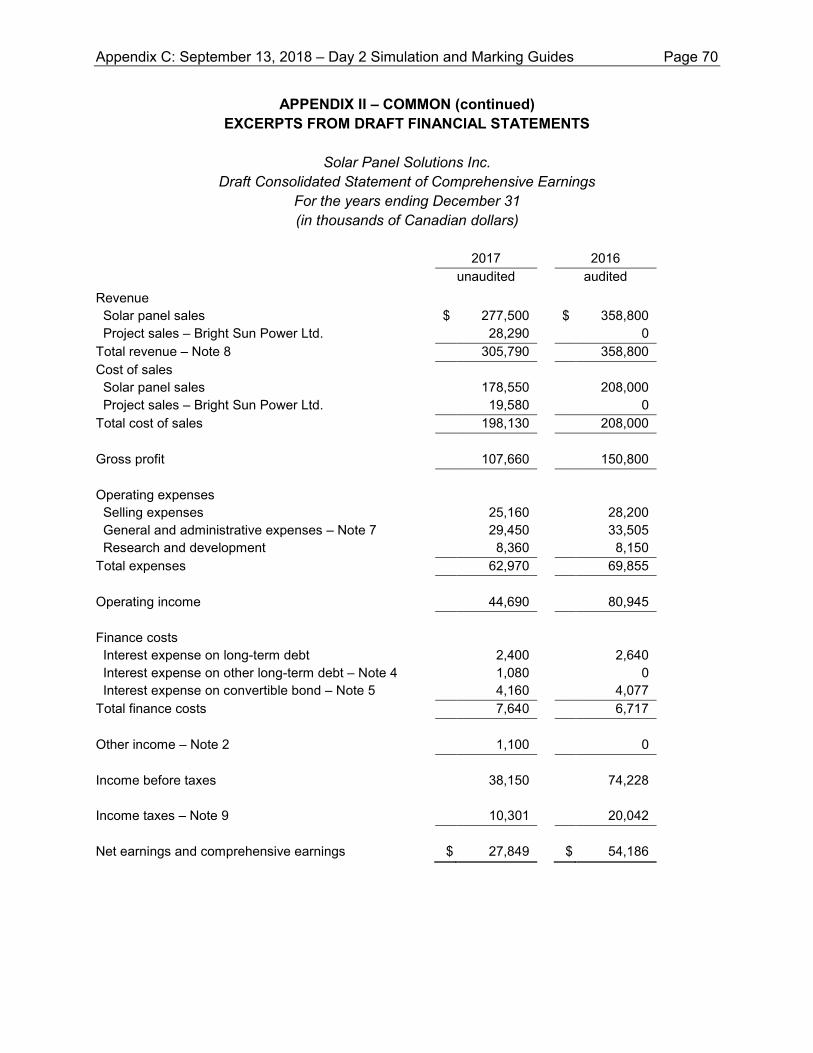
APPENDIX II – COMMON (continued) EXCERPTS FROM DRAFT FINANCIAL STATEMENTS
Solar Panel Solutions Inc.
Draft Consolidated Statement of Comprehensive Earnings For the years ending December 31 (in thousands of Canadian dollars)
2017
unaudited 2016
audited
Revenue Solar panel sales $ 277,500 $ 358,800 Project sales – Bright Sun Power Ltd. 28,290 0 Total revenue – Note 8 305,790 358,800 Cost of sales Solar panel sales 178,550 208,000 Project sales – Bright Sun Power Ltd. 19,580 0 Total cost of sales 198,130 208,000 Gross profit 107,660 150,800 Operating expenses Selling expenses 25,160 28,200 General and administrative expenses – Note 7 29,450 33,505 Research and development 8,360 8,150 Total expenses 62,970 69,855 Operating income 44,690 80,945
Finance costs Interest expense on long-term debt 2,400 2,640 Interest expense on other long-term debt – Note 4 1,080 0 Interest expense on convertible bond – Note 5 4,160 4,077 Total finance costs 7,640 6,717 Other income – Note 2 1,100 0 Income before taxes
38,150 74,228
Income taxes – Note 9 10,301 20,042 Net earnings and comprehensive earnings $ 27,849 $ 54,186
Appendix C: September 13, 2018 – Day 2 Simulation and Marking Guides Page 70
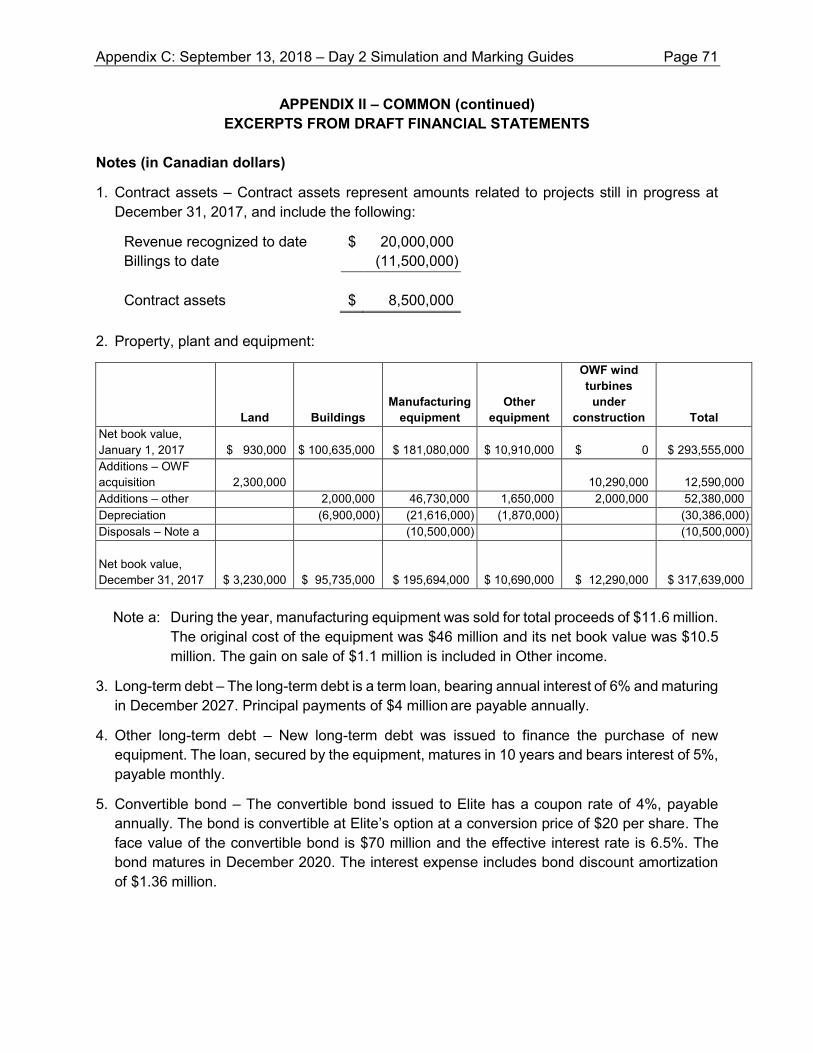
APPENDIX II – COMMON (continued) EXCERPTS FROM DRAFT FINANCIAL STATEMENTS
Notes (in Canadian dollars)
1. Contract assets – Contract assets represent amounts related to projects still in progress at December 31, 2017, and include the following:
Revenue recognized to date $ 20,000,000 Billings to date (11,500,000) Contract assets
$ 8,500,000
2. Property, plant and equipment:
Land Buildings Manufacturing
equipment Other
equipment
OWF wind turbines
under construction Total
Net book value, January 1, 2017 $ 930,000 $ 100,635,000 $ 181,080,000 $ 10,910,000
$ 0 $ 293,555,000
Additions – OWF acquisition 2,300,000
10,290,000 12,590,000
Additions – other 2,000,000 46,730,000 1,650,000 2,000,000 52,380,000 Depreciation (6,900,000) (21,616,000) (1,870,000) (30,386,000) Disposals – Note a (10,500,000) (10,500,000)
Net book value, December 31, 2017 $ 3,230,000 $ 95,735,000 $ 195,694,000 $ 10,690,000
$ 12,290,000 $ 317,639,000
Note a: During the year, manufacturing equipment was sold for total proceeds of $11.6 million. The original cost of the equipment was $46 million and its net book value was $10.5 million. The gain on sale of $1.1 million is included in Other income.
3. Long-term debt – The long-term debt is a term loan, bearing annual interest of 6% and maturing in December 2027. Principal payments of $4 million are payable annually.
4. Other long-term debt – New long-term debt was issued to finance the purchase of new equipment. The loan, secured by the equipment, matures in 10 years and bears interest of 5%, payable monthly.
5. Convertible bond – The convertible bond issued to Elite has a coupon rate of 4%, payable annually. The bond is convertible at Elite’s option at a conversion price of $20 per share. The face value of the convertible bond is $70 million and the effective interest rate is 6.5%. The bond matures in December 2020. The interest expense includes bond discount amortization of $1.36 million.
Appendix C: September 13, 2018 – Day 2 Simulation and Marking Guides Page 71
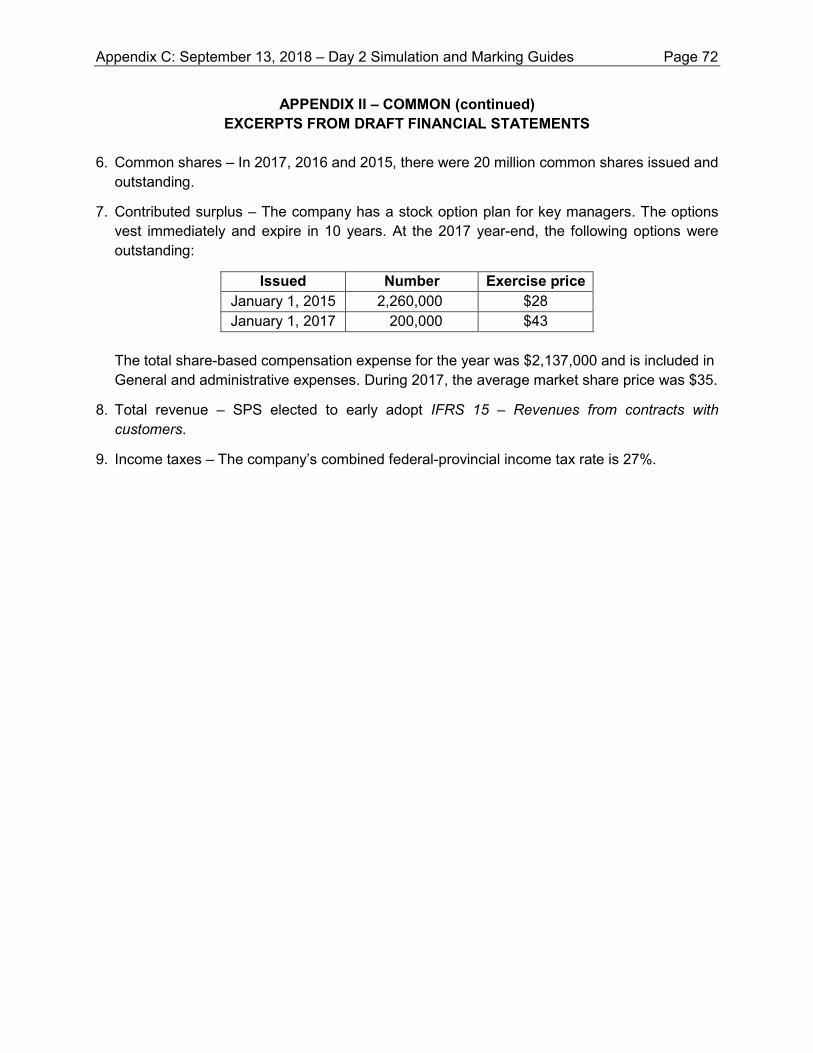
APPENDIX II – COMMON (continued) EXCERPTS FROM DRAFT FINANCIAL STATEMENTS
6. Common shares – In 2017, 2016 and 2015, there were 20 million common shares issued and
outstanding.
7. Contributed surplus – The company has a stock option plan for key managers. The options vest immediately and expire in 10 years. At the 2017 year-end, the following options were outstanding:
Issued Number Exercise price January 1, 2015 2,260,000 $28 January 1, 2017 200,000 $43
The total share-based compensation expense for the year was $2,137,000 and is included in General and administrative expenses. During 2017, the average market share price was $35.
8. Total revenue – SPS elected to early adopt IFRS 15 – Revenues from contracts with customers.
9. Income taxes – The company’s combined federal-provincial income tax rate is 27%.
Appendix C: September 13, 2018 – Day 2 Simulation and Marking Guides Page 72
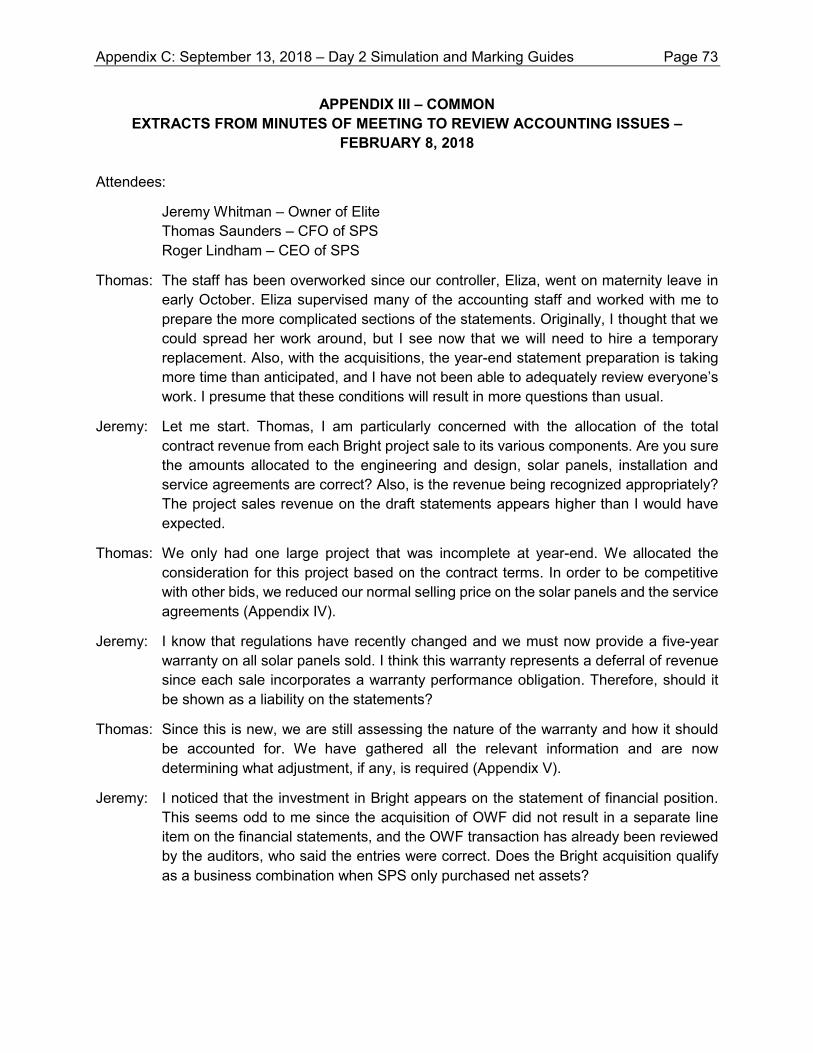
APPENDIX III – COMMON EXTRACTS FROM MINUTES OF MEETING TO REVIEW ACCOUNTING ISSUES –
FEBRUARY 8, 2018 Attendees:
Jeremy Whitman – Owner of Elite Thomas Saunders – CFO of SPS Roger Lindham – CEO of SPS
Thomas: The staff has been overworked since our controller, Eliza, went on maternity leave in early October. Eliza supervised many of the accounting staff and worked with me to prepare the more complicated sections of the statements. Originally, I thought that we could spread her work around, but I see now that we will need to hire a temporary replacement. Also, with the acquisitions, the year-end statement preparation is taking more time than anticipated, and I have not been able to adequately review everyone’s work. I presume that these conditions will result in more questions than usual.
Jeremy: Let me start. Thomas, I am particularly concerned with the allocation of the total contract revenue from each Bright project sale to its various components. Are you sure the amounts allocated to the engineering and design, solar panels, installation and service agreements are correct? Also, is the revenue being recognized appropriately? The project sales revenue on the draft statements appears higher than I would have expected.
Thomas: We only had one large project that was incomplete at year-end. We allocated the consideration for this project based on the contract terms. In order to be competitive with other bids, we reduced our normal selling price on the solar panels and the service agreements (Appendix IV).
Jeremy: I know that regulations have recently changed and we must now provide a five-year warranty on all solar panels sold. I think this warranty represents a deferral of revenue since each sale incorporates a warranty performance obligation. Therefore, should it be shown as a liability on the statements?
Thomas: Since this is new, we are still assessing the nature of the warranty and how it should be accounted for. We have gathered all the relevant information and are now determining what adjustment, if any, is required (Appendix V).
Jeremy: I noticed that the investment in Bright appears on the statement of financial position. This seems odd to me since the acquisition of OWF did not result in a separate line item on the financial statements, and the OWF transaction has already been reviewed by the auditors, who said the entries were correct. Does the Bright acquisition qualify as a business combination when SPS only purchased net assets?
Appendix C: September 13, 2018 – Day 2 Simulation and Marking Guides Page 73
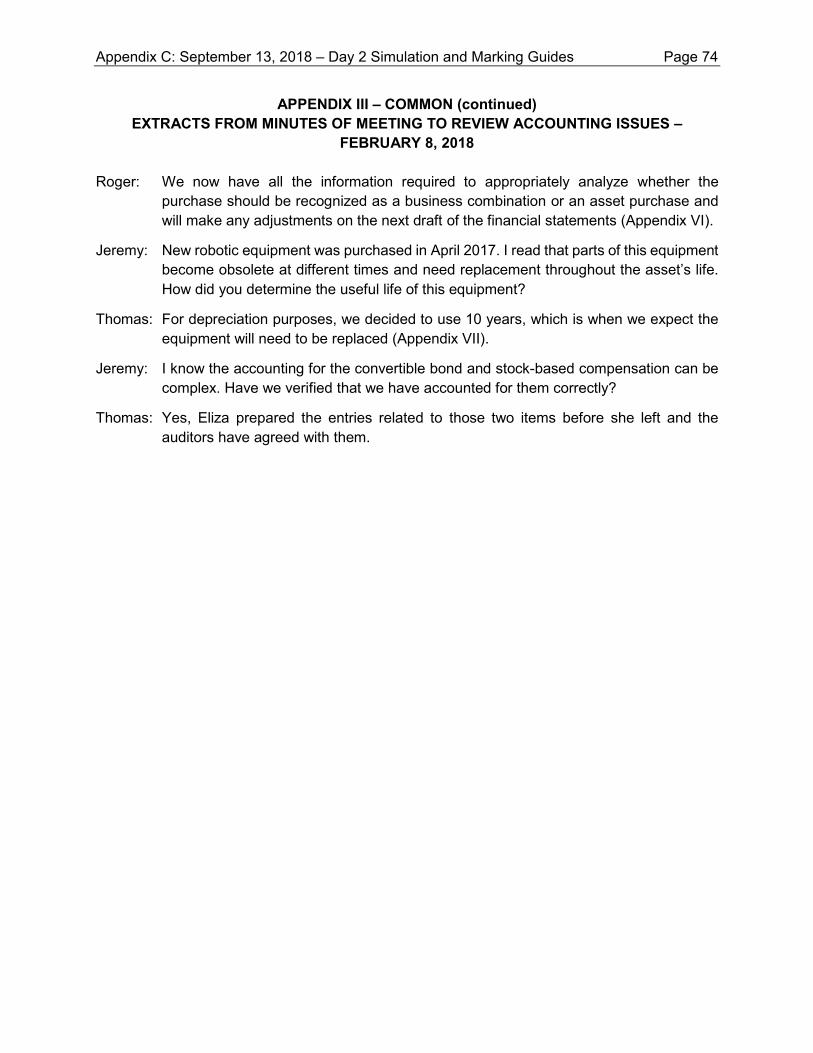
APPENDIX III – COMMON (continued) EXTRACTS FROM MINUTES OF MEETING TO REVIEW ACCOUNTING ISSUES –
FEBRUARY 8, 2018
Roger: We now have all the information required to appropriately analyze whether the purchase should be recognized as a business combination or an asset purchase and will make any adjustments on the next draft of the financial statements (Appendix VI).
Jeremy: New robotic equipment was purchased in April 2017. I read that parts of this equipment become obsolete at different times and need replacement throughout the asset’s life. How did you determine the useful life of this equipment?
Thomas: For depreciation purposes, we decided to use 10 years, which is when we expect the equipment will need to be replaced (Appendix VII).
Jeremy: I know the accounting for the convertible bond and stock-based compensation can be complex. Have we verified that we have accounted for them correctly?
Thomas: Yes, Eliza prepared the entries related to those two items before she left and the auditors have agreed with them.
Appendix C: September 13, 2018 – Day 2 Simulation and Marking Guides Page 74
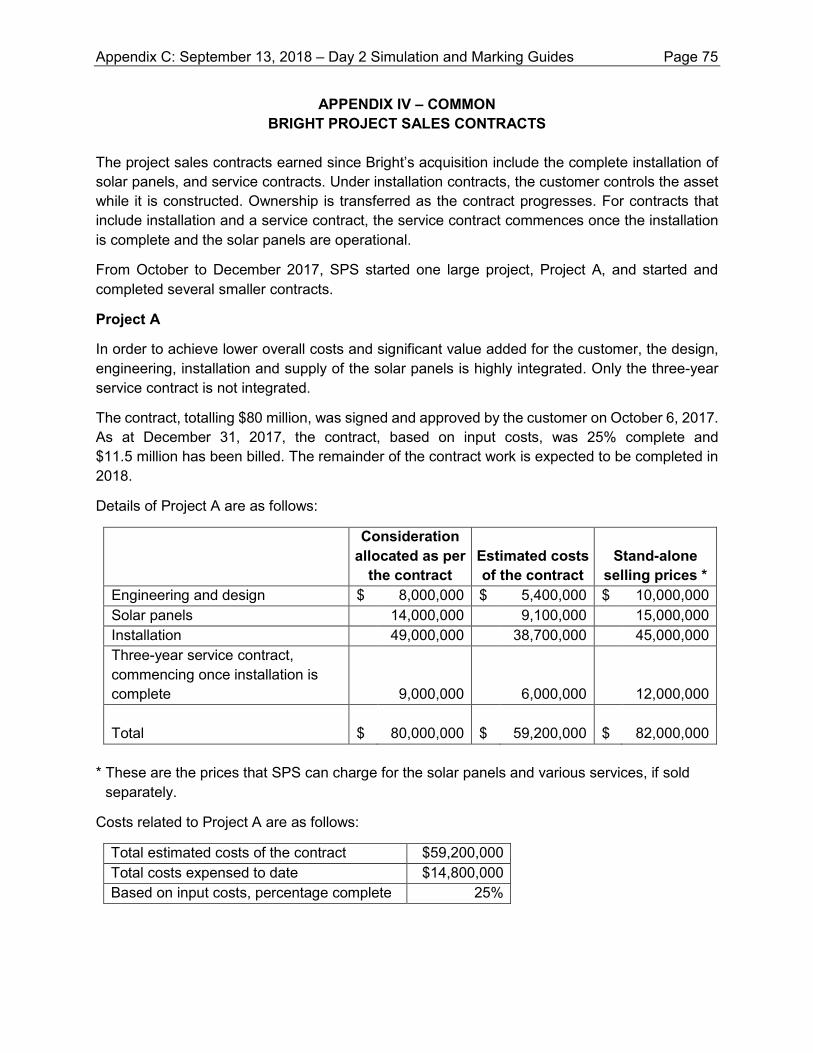
APPENDIX IV – COMMON BRIGHT PROJECT SALES CONTRACTS
The project sales contracts earned since Bright’s acquisition include the complete installation of solar panels, and service contracts. Under installation contracts, the customer controls the asset while it is constructed. Ownership is transferred as the contract progresses. For contracts that include installation and a service contract, the service contract commences once the installation is complete and the solar panels are operational.
From October to December 2017, SPS started one large project, Project A, and started and completed several smaller contracts.
Project A
In order to achieve lower overall costs and significant value added for the customer, the design, engineering, installation and supply of the solar panels is highly integrated. Only the three-year service contract is not integrated.
The contract, totalling $80 million, was signed and approved by the customer on October 6, 2017. As at December 31, 2017, the contract, based on input costs, was 25% complete and $11.5 million has been billed. The remainder of the contract work is expected to be completed in 2018.
Details of Project A are as follows:
Consideration allocated as per
the contract Estimated costs of the contract
Stand-alone
selling prices * Engineering and design $ 8,000,000 $ 5,400,000 $ 10,000,000 Solar panels 14,000,000 9,100,000 15,000,000 Installation 49,000,000 38,700,000 45,000,000 Three-year service contract, commencing once installation is complete 9,000,000 6,000,000
12,000,000 Total
$ 80,000,000
$ 59,200,000
$ 82,000,000
* These are the prices that SPS can charge for the solar panels and various services, if sold
separately.
Costs related to Project A are as follows:
Total estimated costs of the contract $59,200,000 Total costs expensed to date $14,800,000 Based on input costs, percentage complete 25%
Appendix C: September 13, 2018 – Day 2 Simulation and Marking Guides Page 75
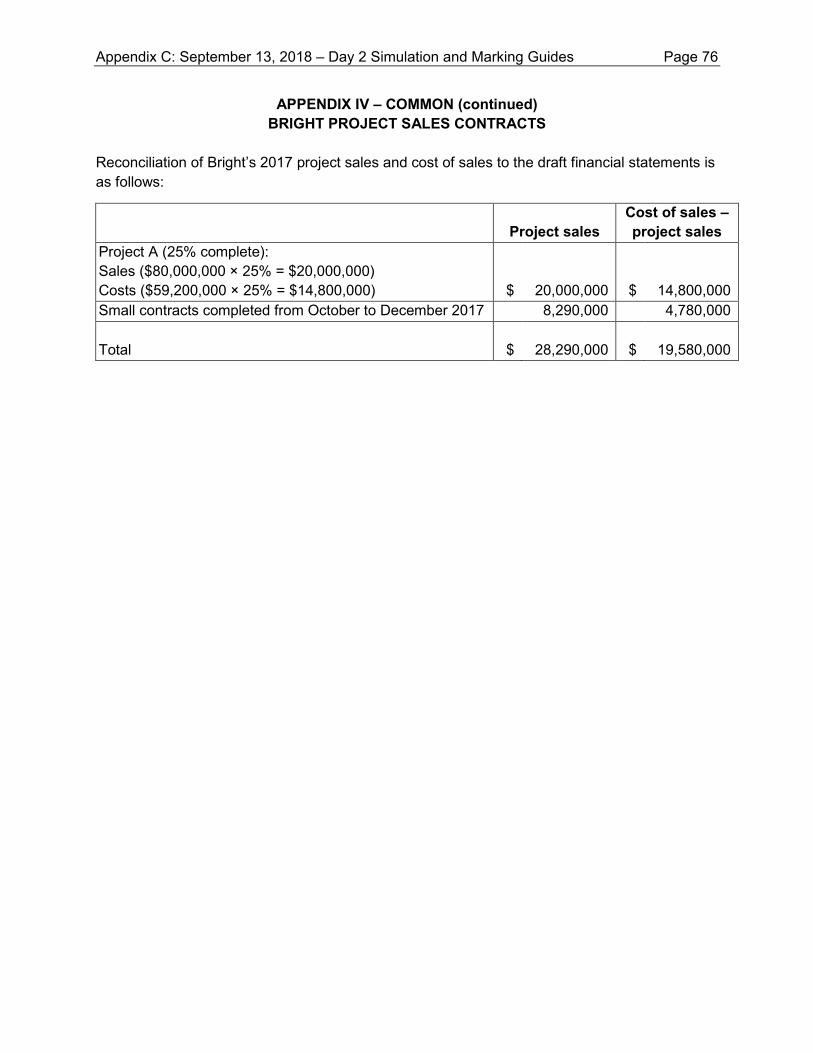
APPENDIX IV – COMMON (continued) BRIGHT PROJECT SALES CONTRACTS
Reconciliation of Bright’s 2017 project sales and cost of sales to the draft financial statements is as follows:
Project sales
Cost of sales – project sales
Project A (25% complete): Sales ($80,000,000 × 25% = $20,000,000) Costs ($59,200,000 × 25% = $14,800,000) $ 20,000,000 $ 14,800,000 Small contracts completed from October to December 2017 8,290,000 4,780,000 Total $ 28,290,000 $ 19,580,000
Appendix C: September 13, 2018 – Day 2 Simulation and Marking Guides Page 76
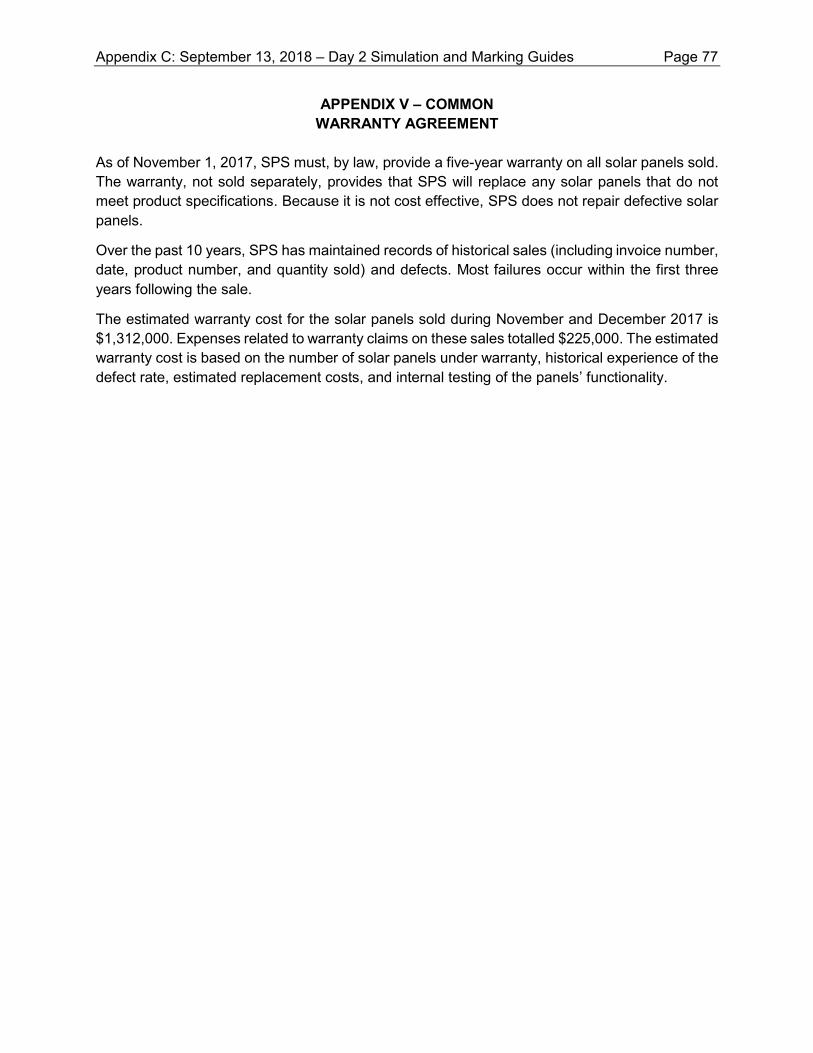
APPENDIX V – COMMON WARRANTY AGREEMENT
As of November 1, 2017, SPS must, by law, provide a five-year warranty on all solar panels sold. The warranty, not sold separately, provides that SPS will replace any solar panels that do not meet product specifications. Because it is not cost effective, SPS does not repair defective solar panels.
Over the past 10 years, SPS has maintained records of historical sales (including invoice number, date, product number, and quantity sold) and defects. Most failures occur within the first three years following the sale.
The estimated warranty cost for the solar panels sold during November and December 2017 is $1,312,000. Expenses related to warranty claims on these sales totalled $225,000. The estimated warranty cost is based on the number of solar panels under warranty, historical experience of the defect rate, estimated replacement costs, and internal testing of the panels’ functionality.
Appendix C: September 13, 2018 – Day 2 Simulation and Marking Guides Page 77
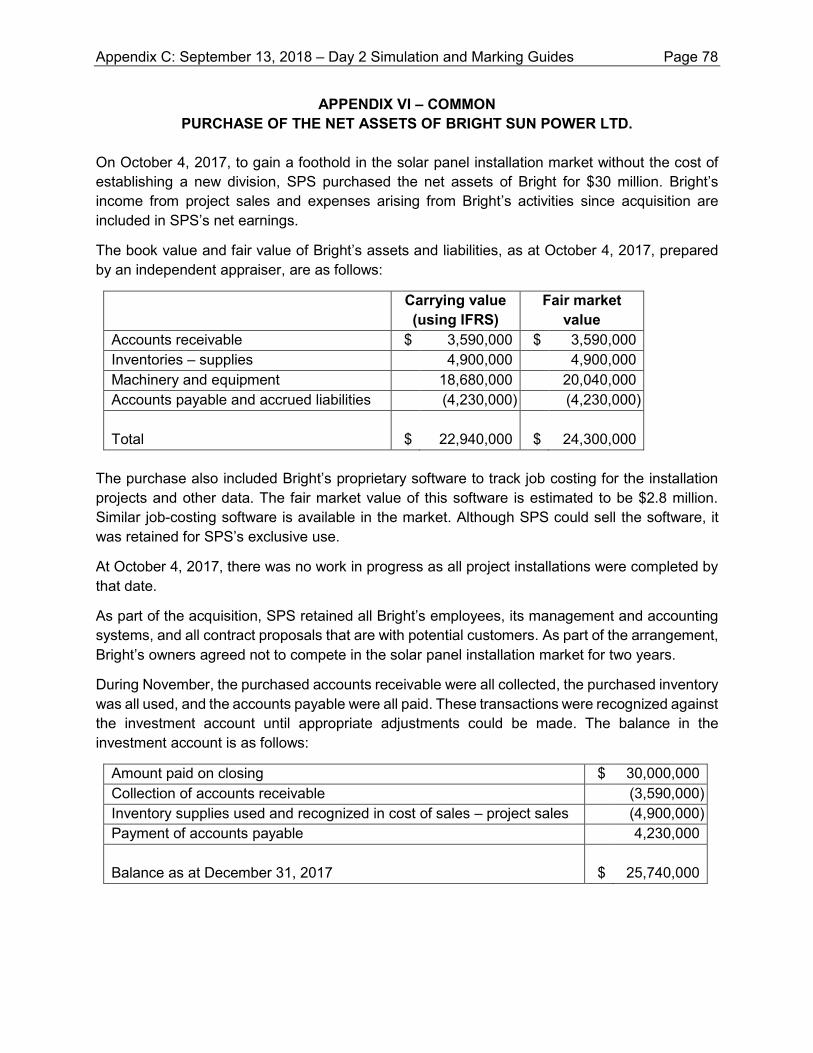
APPENDIX VI – COMMON PURCHASE OF THE NET ASSETS OF BRIGHT SUN POWER LTD.
On October 4, 2017, to gain a foothold in the solar panel installation market without the cost of establishing a new division, SPS purchased the net assets of Bright for $30 million. Bright’s income from project sales and expenses arising from Bright’s activities since acquisition are included in SPS’s net earnings.
The book value and fair value of Bright’s assets and liabilities, as at October 4, 2017, prepared by an independent appraiser, are as follows:
Carrying value (using IFRS)
Fair market value
Accounts receivable $ 3,590,000 $ 3,590,000 Inventories – supplies 4,900,000 4,900,000 Machinery and equipment 18,680,000 20,040,000 Accounts payable and accrued liabilities (4,230,000) (4,230,000) Total $ 22,940,000 $ 24,300,000
The purchase also included Bright’s proprietary software to track job costing for the installation projects and other data. The fair market value of this software is estimated to be $2.8 million. Similar job-costing software is available in the market. Although SPS could sell the software, it was retained for SPS’s exclusive use.
At October 4, 2017, there was no work in progress as all project installations were completed by that date.
As part of the acquisition, SPS retained all Bright’s employees, its management and accounting systems, and all contract proposals that are with potential customers. As part of the arrangement, Bright’s owners agreed not to compete in the solar panel installation market for two years.
During November, the purchased accounts receivable were all collected, the purchased inventory was all used, and the accounts payable were all paid. These transactions were recognized against the investment account until appropriate adjustments could be made. The balance in the investment account is as follows:
Amount paid on closing $ 30,000,000 Collection of accounts receivable (3,590,000) Inventory supplies used and recognized in cost of sales – project sales (4,900,000) Payment of accounts payable 4,230,000 Balance as at December 31, 2017 $ 25,740,000
Appendix C: September 13, 2018 – Day 2 Simulation and Marking Guides Page 78
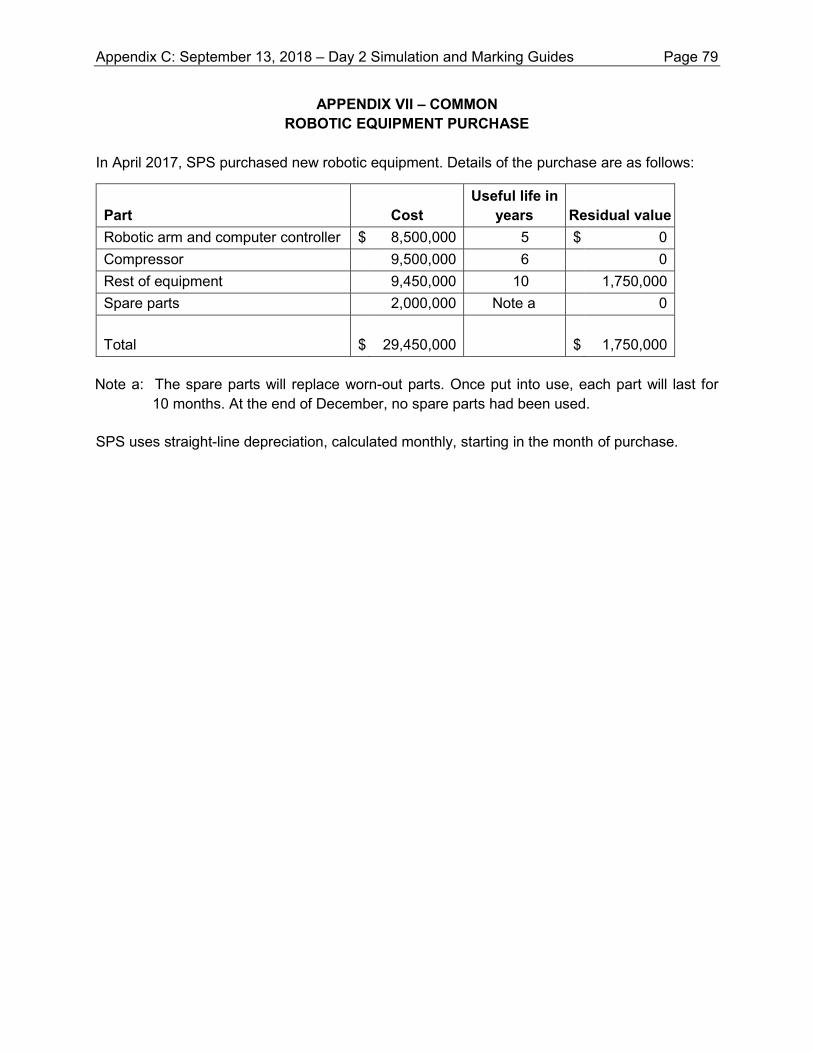
APPENDIX VII – COMMON ROBOTIC EQUIPMENT PURCHASE
In April 2017, SPS purchased new robotic equipment. Details of the purchase are as follows:
Part Cost Useful life in
years Residual value Robotic arm and computer controller $ 8,500,000 5 $ 0 Compressor 9,500,000 6 0 Rest of equipment 9,450,000 10 1,750,000 Spare parts 2,000,000 Note a 0 Total $ 29,450,000 $ 1,750,000
Note a: The spare parts will replace worn-out parts. Once put into use, each part will last for 10 months. At the end of December, no spare parts had been used.
SPS uses straight-line depreciation, calculated monthly, starting in the month of purchase.
Appendix C: September 13, 2018 – Day 2 Simulation and Marking Guides Page 79

ASSURANCE ROLE ADDITIONAL INFORMATION
Appendix C: September 13, 2018 – Day 2 Simulation and Marking Guides Page 80
APPENDIX VIII ASSURANCE – ADDITIONAL INFORMATION
Preliminary audit planning excerpts Date: October 13, 2017 Risk assessment The risk of material misstatement at the financial statement level has been assessed as low: • SPS has a Board of Directors that meets six times per year and an Audit Committee that
meets quarterly. • There were no major changes to accounting policies and to the operating environment. Other
than Eliza’s maternity leave, there were also no changes to accounting staff in 2017. • The only error found in past audits was in 2009, when depreciation was calculated incorrectly,
and SPS has since improved internal controls in this area. • SPS now has a second stream of revenue, in Bright project sales, but the amounts are
expected to be insignificant. Approach The plan is to rely on internal controls and control testing for the significant areas of the financial statements. Materiality Using the internal financial statements available in October, planning materiality is set at $2.5 million, based on 5% of preliminary income before taxes.
Appendix C: September 13, 2018 – Day 2 Simulation and Marking Guides Page 81
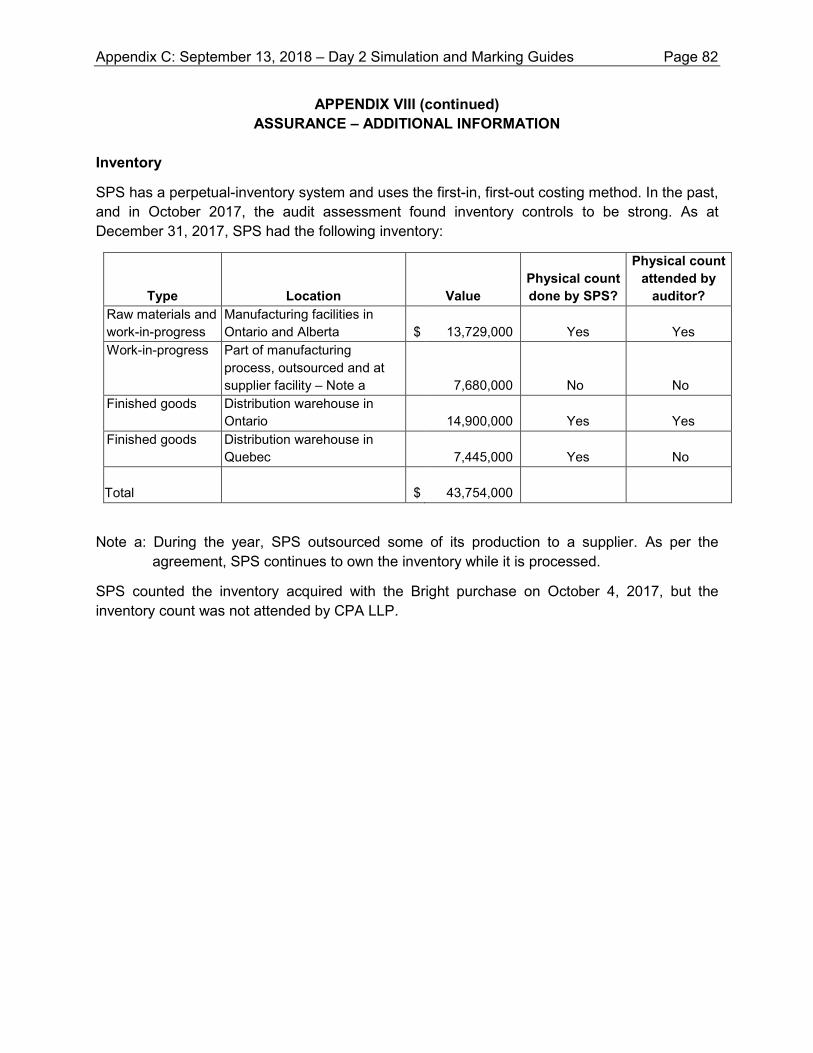
APPENDIX VIII (continued) ASSURANCE – ADDITIONAL INFORMATION
Inventory
SPS has a perpetual-inventory system and uses the first-in, first-out costing method. In the past, and in October 2017, the audit assessment found inventory controls to be strong. As at December 31, 2017, SPS had the following inventory:
Type Location Value Physical count done by SPS?
Physical count attended by
auditor? Raw materials and work-in-progress
Manufacturing facilities in Ontario and Alberta $ 13,729,000 Yes Yes
Work-in-progress Part of manufacturing process, outsourced and at supplier facility – Note a 7,680,000 No No
Finished goods Distribution warehouse in Ontario 14,900,000 Yes Yes
Finished goods Distribution warehouse in Quebec 7,445,000 Yes No
Total $ 43,754,000
Note a: During the year, SPS outsourced some of its production to a supplier. As per the agreement, SPS continues to own the inventory while it is processed.
SPS counted the inventory acquired with the Bright purchase on October 4, 2017, but the inventory count was not attended by CPA LLP.
Appendix C: September 13, 2018 – Day 2 Simulation and Marking Guides Page 82
APPENDIX VIII (continued) ASSURANCE – ADDITIONAL INFORMATION
Work of auditor’s expert
CPA LLP has used the valuator before. Excerpts from the report include the following:
Scope of work
• Machinery and equipment – Physically inspected the machinery and equipment. Identified comparable machinery and equipment and obtained current selling prices. The values were adjusted for the assets’ age and performance, as required.
• Software – Discussed with Bright’s management how the software is used and reviewed the software’s functionality. Although similar job-costing software exists in the market, some functionality is different and I therefore obtained the cost to build this software. Verified input costs with software developers familiar with this type of software.
• All supporting documentation and specific calculations are included in the report.
Qualifications of the valuator
• Ms. Penelope Lomas has over 15 years of experience as a valuator. She is a Qualified Business Valuator and Qualified Asset Appraiser; both qualifications are accredited and require passing of national exams and ongoing professional development. Ms. Lomas has significant experience in the alternative-energy sector.
Disclaimer
• The valuator does not have any stake, directly or indirectly, in the valuation calculations.
Appendix C: September 13, 2018 – Day 2 Simulation and Marking Guides Page 83
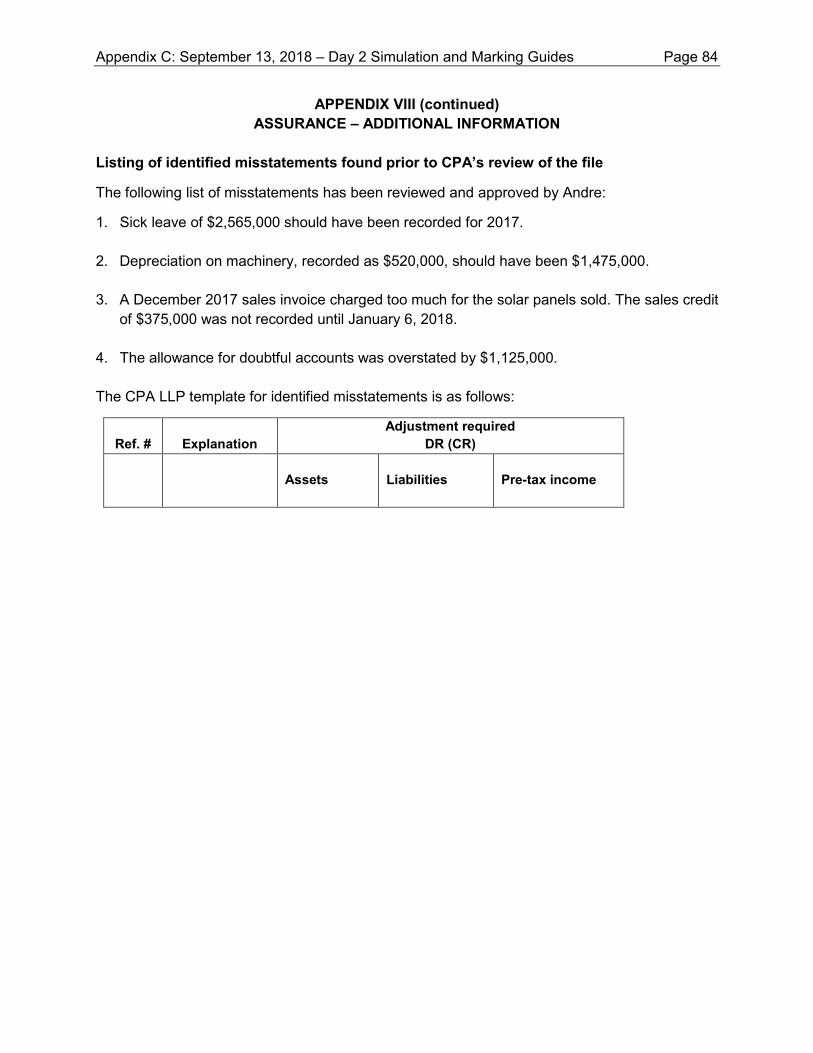
APPENDIX VIII (continued) ASSURANCE – ADDITIONAL INFORMATION
Listing of identified misstatements found prior to CPA’s review of the file
The following list of misstatements has been reviewed and approved by Andre:
1. Sick leave of $2,565,000 should have been recorded for 2017.
2. Depreciation on machinery, recorded as $520,000, should have been $1,475,000.
3. A December 2017 sales invoice charged too much for the solar panels sold. The sales credit of $375,000 was not recorded until January 6, 2018.
4. The allowance for doubtful accounts was overstated by $1,125,000.
The CPA LLP template for identified misstatements is as follows:
Ref. # Explanation Adjustment required
DR (CR)
Assets
Liabilities
Pre-tax income
Appendix C: September 13, 2018 – Day 2 Simulation and Marking Guides Page 84
APPENDIX VIII (continued) ASSURANCE – ADDITIONAL INFORMATION
Bright’s job-costing software
With the acquisition of Bright, SPS acquired its proprietary job-costing software, Cogna, which tracks budgeted costs, actual costs and billings-to-date. There have been many complaints from the project managers using Cogna, who say the software interface is not intuitive and that they keep finding additional functionality of the software that they were unaware of. The IT manager, Josh, does not understand why this is an issue, as he sent the user guide for Cogna to everyone who would be using it weeks before the software was installed.
Josh and his team have been overworked since the Bright acquisition, resolving bugs in the software and integrating Cogna into the existing accounting system. Because Cogna only allows for one super-user account, the entire IT team has been using the same login when they need to update the software coding. Josh is now too busy to review every programmer’s work. Since he has not found any errors in their work to date, he no longer feels that a review is necessary.
Since SPS acquired Cogna, major changes made to the software include the following:
• When a user starts a new project, they must input a project job number (created by the project manager) and the customer name. If the customer had a project with Bright in the past, the details from the previous order are pre-populated into all the fields, including the address, phone number, previous job description and previous budgeted costs.
• Project managers use invoices and timesheets as a basis for inputting actual costs incurred into Cogna, so that they can be compared to budgeted information. The actual costs captured in Cogna are automatically transferred to the accounting system and the appropriate journal entry is created and recorded. No one in the accounting department sees the entries.
• A new functionality ensures that backups are done automatically every night, with the prior backup being overwritten.
Appendix C: September 13, 2018 – Day 2 Simulation and Marking Guides Page 85

FINANCE ROLE ADDITIONAL INFORMATION
Appendix C: September 13, 2018 – Day 2 Simulation and Marking Guides Page 86
APPENDIX VIII FINANCE – ADDITIONAL INFORMATION
Investment in solar farm for Comcap
SPS has determined that a solar farm with the following characteristics will meet Comcap’s electricity needs:
• The initial cost will be $60 million. The equipment qualifies as Class 43.1, which has a prescribed CCA rate of 30%.
• Annual maintenance and cleaning, replacement, insurance and property taxes will cost $1.4 million.
• Because the amount of electricity generated depends on the number of sunlight hours per day, annual revenues could range from $6.4 million to $8.6 million.
• The accounts receivable balance is estimated to be an average of $526,000 for the duration of the project.
• The useful life of the solar farm will be 40 years. Once the contract with Comcap has expired, it is expected that all the electricity produced by the solar farm will be sold to a third party.
• At the end of 40 years, it is expected that the equipment will have a salvage value of $5 million and there will be decommissioning costs of $12 million after tax.
• Management has determined that an 8% rate of return should be required for this project. • A purchase agreement will be signed between Comcap and SPS, outlining the price to be paid
per kilowatt of electricity produced; depending on market rates, this price could fluctuate significantly.
Specifics of the purchase agreement are as follows:
• Comcap will pay SPS monthly, based on kilowatts produced. • The initial agreement is for 10 years, with renegotiation at that time. • In any month in which the electricity generated is below a minimum threshold, SPS will pay a
penalty, according to a prescribed formula. • Either party can terminate this contract with 90 days’ notice.
Appendix C: September 13, 2018 – Day 2 Simulation and Marking Guides Page 87
APPENDIX VIII (continued) FINANCE – ADDITIONAL INFORMATION
Project financing opportunity
The proposed project financing details for the solar farm are as follows:
• A separate legal entity will be established to construct and own the solar farm. • SPS and another financial partner, Public Utility Co. (PUC) will each contribute equity of
$50 million. PUC will buy any electricity generated that is not sold to other customers. PUC has experience in generating and selling electricity.
• A syndicate of lenders, led by Renewable Energy Lenders Group, will advance a loan of $300 million. The loan will bear interest at 4%, provided that contractual arrangements are in place and secured by the solar farm. Proceeds on this loan will be advanced as project expenditures are incurred. Principal repayments will commence once the solar farm is operational.
• The solar farm industry has a beta of 3.0. The current risk-free rate is 2% and the market risk premium is 5%.
• The appropriate tax rate is 27%.
Appendix C: September 13, 2018 – Day 2 Simulation and Marking Guides Page 88
APPENDIX VIII (continued) FINANCE – ADDITIONAL INFORMATION
GFC's offer to buy OWF
Relevant data for valuation of the wind farm assets is as follows:
• Once operational in January 2019, annual revenues and operating expenses are estimated to be as follows:
Revenue Operating costs 2019 $ 15,000,000 $ 4,500,000 2020 19,000,000 4,100,000 2021, 2022, 2023, 2024, 2025 26,000,000 5,200,000 2026 24,000,000 5,100,000 2027 22,000,000 4,900,000 2028 18,000,000 4,700,000
• The required rate of return is 9% and the income tax rate is 27%. • At the end of its useful life, the land will have a salvage value of $4.5 million and
decommissioning costs of $3 million will be required to remove the wind turbines. • The annual accounting depreciation expense and capital cost allowance are each expected to
be $8.5 million. • Completion of the wind farm’s construction will occur in 2018 and will cost an additional
$75 million. • A discounted cash flow approach is used to value this tangible asset.
So far, SPS has paid $4.1 million in additional construction costs for the wind farm.
Appendix C: September 13, 2018 – Day 2 Simulation and Marking Guides Page 89
APPENDIX VIII (continued) FINANCE – ADDITIONAL INFORMATION
Impact of new credit terms and proposed discount
New credit terms
Assuming similar sales in 2017 and 2018, the costs of extending credit to 60 days are as follows:
• Bad debts are expected to increase from 2.7% to 5.2% of sales. • The company would have to finance this cash shortfall by using its line of credit. The interest
rate of this short-term financing is 4%.
At December 31, 2017, the accounts payable related to the solar panels was $26,739,000.
The industry average inventory period is 75 days, and average payable period is 60 days.
The cash cycle used by SPS is calculated as: days in receivables plus days in inventory minus days in payables.
Proposed discount
It is assumed that SPS’s largest customer will take the full 60-day credit period to pay. The proposal is to offer this customer a 3% discount if the receivable is paid within 25 days. Sales to this customer average $7 million a year.
Appendix C: September 13, 2018 – Day 2 Simulation and Marking Guides Page 90

PERFORMANCE MANAGEMENT ROLE ADDITIONAL INFORMATION
Appendix C: September 13, 2018 – Day 2 Simulation and Marking Guides Page 91
APPENDIX VIII PERFORMANCE MANAGEMENT – ADDITIONAL INFORMATION
Additional industry information
Demand for solar panels is driven by customers’ desire to reduce their electricity costs and use more renewable-energy sources. Historically, governments have provided end consumers with financial incentives to invest in renewable-energy sources. These incentives initially drove up demand for solar panels and increased production capacity. Many of those incentives have now been reduced or eliminated, resulting in a large reduction in demand, and thus a significant reduction in selling prices and excess of production capacity.
To help counter this, governments in many regions have mandated that public utilities use a specified proportion of renewably-sourced electricity. Also, to support their sustainability and environmental policies, many corporations are adopting the use of renewable energies.
Widespread adoption of solar-panel energy is currently hindered by the amount of land required for large installations, its unreliability for uninterrupted power requirements and its higher cost when compared to traditional energy sources. As a result, the selling price of solar panels has declined by 25% in the past three years.
Fortunately, the price of polysilicon has dropped by 95% since 2007 and, paired with more efficient operations, manufacturers have seen their total manufacturing costs decline. On average, the industry’s manufacturing costs have declined by 10% since 2016. In 2017, SPS’s panels achieved 23% energy production efficiency; the industry range is 15% to 25%.
Appendix C: September 13, 2018 – Day 2 Simulation and Marking Guides Page 92
APPENDIX VIII (continued) PERFORMANCE MANAGEMENT – ADDITIONAL INFORMATION
Proposed solar farm agreement with Comcap
Comcap requires 46 million kilowatt hours (kWh) annually and would pay $0.10 per kWh, regardless of the market price. SPS could sell any excess electricity generated to the public utility at the market rate; however, if SPS cannot generate sufficient electricity to meet Comcap’s needs, SPS will have to purchase it from the public utility.
Electricity has two price components – the cost to generate the electricity plus the cost to deliver the electricity. Since the solar farm is on Comcap property, there is no delivery cost. However, if electricity is purchased from, or sold to, the public utility, there is a $0.06 per kWh delivery cost. The market price for electricity has ranged from $0.08 to $0.18 per kWh (not including delivery).
It is expected that the market price of electricity will move towards, and possibly exceed, the high end of the range over the next few years. After allowing prices to increase for three years, the current government has promised to then keep the cost of delivering electricity stable.
Currently, Comcap’s solar farm produces 26 million kWh, and SPS estimates operating costs would be $1 million annually.
Comcap was founded two years ago, at which time it built its solar farm. The solar farm still uses the same technology, which is now outdated. SPS could upgrade the solar farm and significantly increase efficiency so it could produce an additional 25 million kWh per year. This one-time upgrade would cost $4.5 million and would be incurred entirely in Year 1. Comcap has proposed a one-year agreement with an option to renew annually.
Appendix C: September 13, 2018 – Day 2 Simulation and Marking Guides Page 93
APPENDIX VIII (continued) PERFORMANCE MANAGEMENT – ADDITIONAL INFORMATION
Performance indicators for the manufacturing division
Performance indicators, in no specific order, for the manufacturing plant managers are as follows:
• Net operating profit for the division by plant, which includes an administrative overhead charge that is allocated to the manufacturing division based on square footage used.
• Total cost of goods sold, as a percentage of sales. • Total annual volume produced, as a percentage of 100% manufacturing capacity. (Normal
downtime for maintenance reduces annual capacity to 90%.) • Overtime paid to employees as a percentage of total wages. • Number of safety incident occurrences. • Return on investment, calculated as net operating profit for the division by plant divided by the
total net book value of the plant assets.
Appendix C: September 13, 2018 – Day 2 Simulation and Marking Guides Page 94
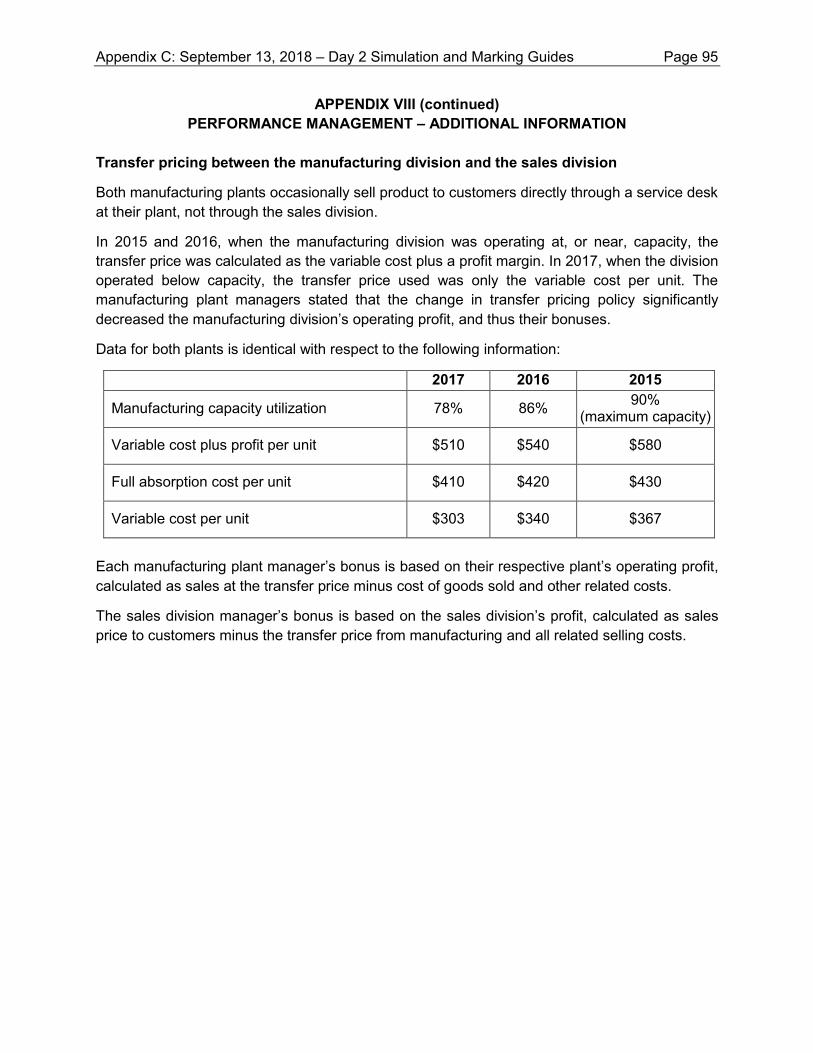
APPENDIX VIII (continued) PERFORMANCE MANAGEMENT – ADDITIONAL INFORMATION
Transfer pricing between the manufacturing division and the sales division
Both manufacturing plants occasionally sell product to customers directly through a service desk at their plant, not through the sales division.
In 2015 and 2016, when the manufacturing division was operating at, or near, capacity, the transfer price was calculated as the variable cost plus a profit margin. In 2017, when the division operated below capacity, the transfer price used was only the variable cost per unit. The manufacturing plant managers stated that the change in transfer pricing policy significantly decreased the manufacturing division’s operating profit, and thus their bonuses.
Data for both plants is identical with respect to the following information:
2017 2016 2015
Manufacturing capacity utilization 78% 86% 90% (maximum capacity)
Variable cost plus profit per unit $510 $540 $580
Full absorption cost per unit $410 $420 $430
Variable cost per unit $303 $340 $367
Each manufacturing plant manager’s bonus is based on their respective plant’s operating profit, calculated as sales at the transfer price minus cost of goods sold and other related costs.
The sales division manager’s bonus is based on the sales division’s profit, calculated as sales price to customers minus the transfer price from manufacturing and all related selling costs.
Appendix C: September 13, 2018 – Day 2 Simulation and Marking Guides Page 95
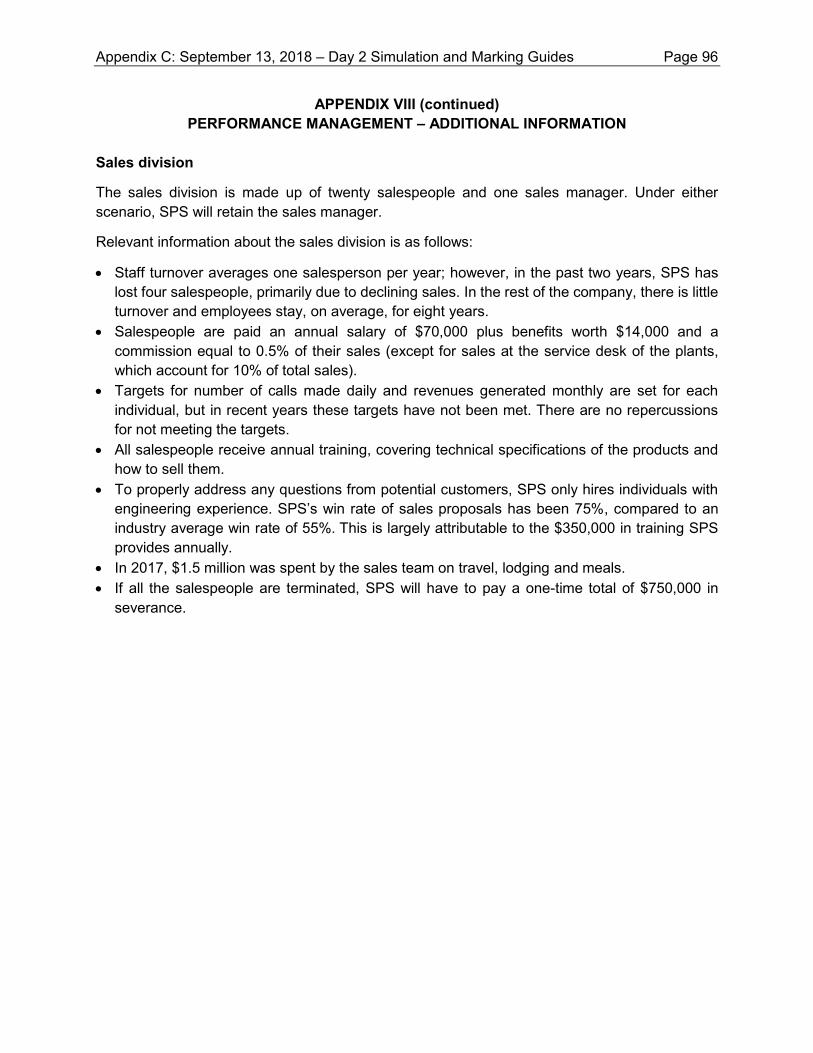
APPENDIX VIII (continued) PERFORMANCE MANAGEMENT – ADDITIONAL INFORMATION
Sales division
The sales division is made up of twenty salespeople and one sales manager. Under either scenario, SPS will retain the sales manager.
Relevant information about the sales division is as follows:
• Staff turnover averages one salesperson per year; however, in the past two years, SPS has lost four salespeople, primarily due to declining sales. In the rest of the company, there is little turnover and employees stay, on average, for eight years.
• Salespeople are paid an annual salary of $70,000 plus benefits worth $14,000 and a commission equal to 0.5% of their sales (except for sales at the service desk of the plants, which account for 10% of total sales).
• Targets for number of calls made daily and revenues generated monthly are set for each individual, but in recent years these targets have not been met. There are no repercussions for not meeting the targets.
• All salespeople receive annual training, covering technical specifications of the products and how to sell them.
• To properly address any questions from potential customers, SPS only hires individuals with engineering experience. SPS’s win rate of sales proposals has been 75%, compared to an industry average win rate of 55%. This is largely attributable to the $350,000 in training SPS provides annually.
• In 2017, $1.5 million was spent by the sales team on travel, lodging and meals. • If all the salespeople are terminated, SPS will have to pay a one-time total of $750,000 in
severance.
Appendix C: September 13, 2018 – Day 2 Simulation and Marking Guides Page 96
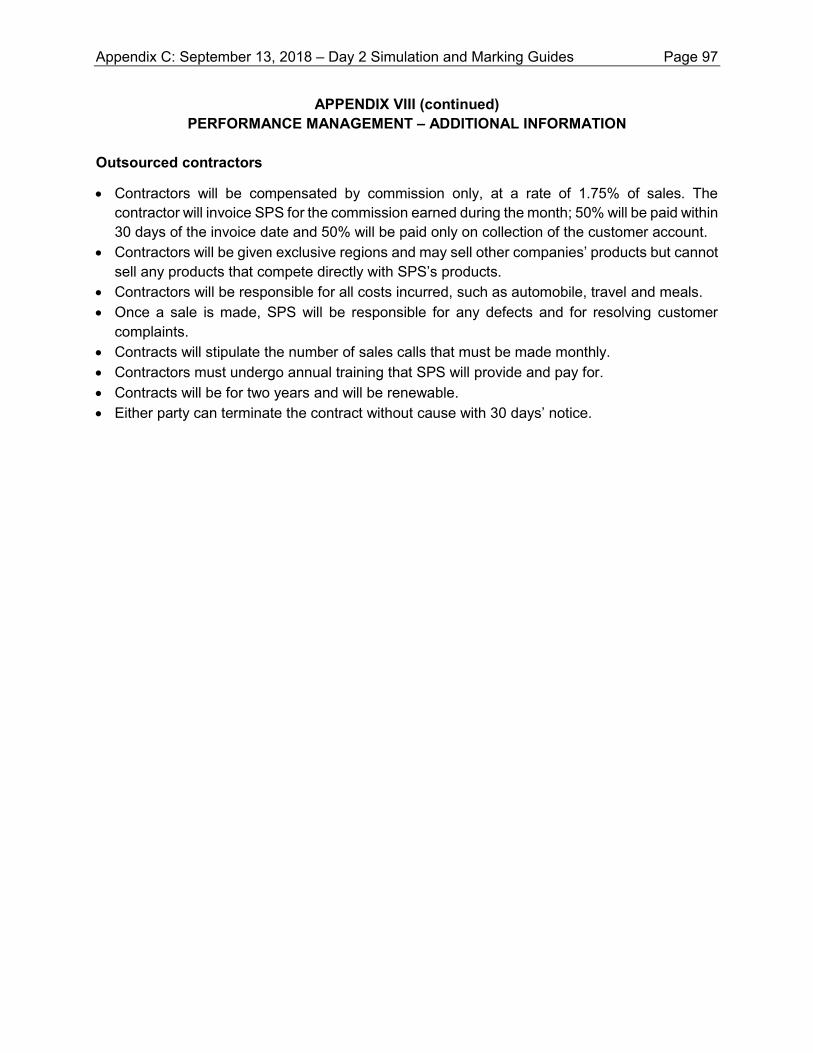
APPENDIX VIII (continued) PERFORMANCE MANAGEMENT – ADDITIONAL INFORMATION
Outsourced contractors
• Contractors will be compensated by commission only, at a rate of 1.75% of sales. The contractor will invoice SPS for the commission earned during the month; 50% will be paid within 30 days of the invoice date and 50% will be paid only on collection of the customer account.
• Contractors will be given exclusive regions and may sell other companies’ products but cannot sell any products that compete directly with SPS’s products.
• Contractors will be responsible for all costs incurred, such as automobile, travel and meals. • Once a sale is made, SPS will be responsible for any defects and for resolving customer
complaints. • Contracts will stipulate the number of sales calls that must be made monthly. • Contractors must undergo annual training that SPS will provide and pay for. • Contracts will be for two years and will be renewable. • Either party can terminate the contract without cause with 30 days’ notice.
Appendix C: September 13, 2018 – Day 2 Simulation and Marking Guides Page 97
TAXATION ROLE ADDITIONAL INFORMATION
Appendix C: September 13, 2018 – Day 2 Simulation and Marking Guides Page 98
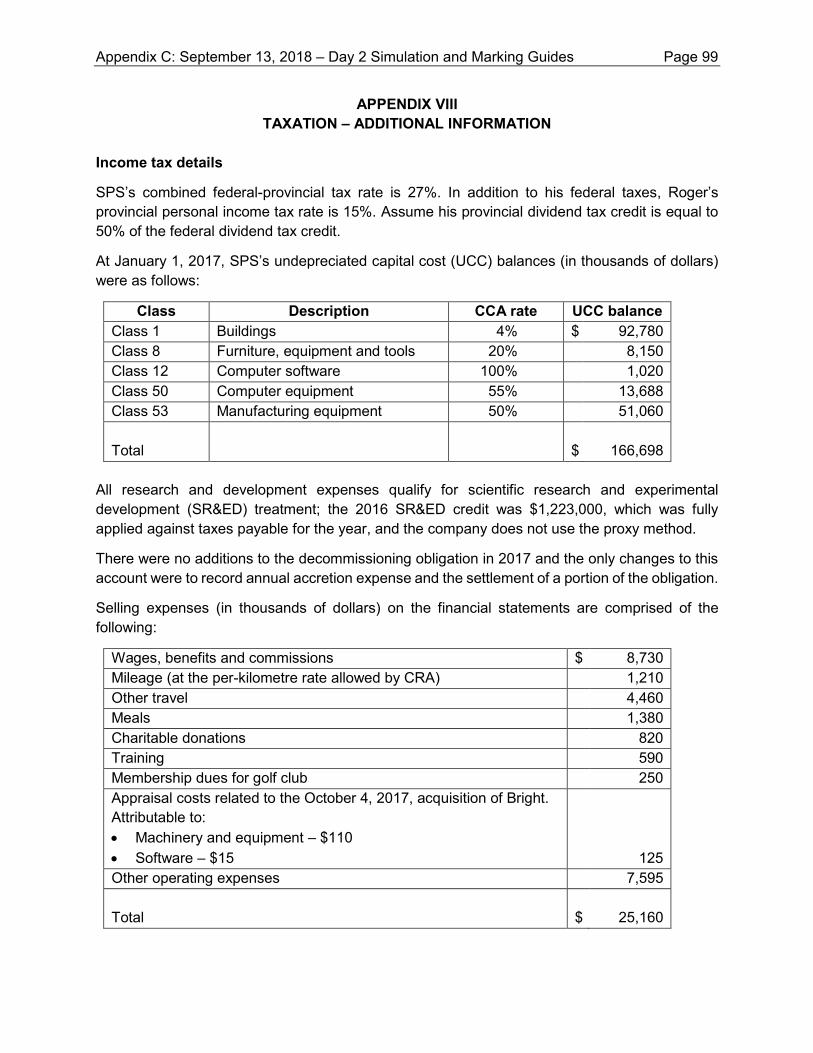
APPENDIX VIII TAXATION – ADDITIONAL INFORMATION
Income tax details
SPS’s combined federal-provincial tax rate is 27%. In addition to his federal taxes, Roger’s provincial personal income tax rate is 15%. Assume his provincial dividend tax credit is equal to 50% of the federal dividend tax credit.
At January 1, 2017, SPS’s undepreciated capital cost (UCC) balances (in thousands of dollars) were as follows:
Class Description CCA rate UCC balance Class 1 Buildings 4% $ 92,780 Class 8 Furniture, equipment and tools 20% 8,150 Class 12 Computer software 100% 1,020 Class 50 Computer equipment 55% 13,688 Class 53 Manufacturing equipment 50% 51,060 Total $ 166,698
All research and development expenses qualify for scientific research and experimental development (SR&ED) treatment; the 2016 SR&ED credit was $1,223,000, which was fully applied against taxes payable for the year, and the company does not use the proxy method.
There were no additions to the decommissioning obligation in 2017 and the only changes to this account were to record annual accretion expense and the settlement of a portion of the obligation.
Selling expenses (in thousands of dollars) on the financial statements are comprised of the following:
Wages, benefits and commissions $ 8,730 Mileage (at the per-kilometre rate allowed by CRA) 1,210 Other travel 4,460 Meals 1,380 Charitable donations 820 Training 590 Membership dues for golf club 250 Appraisal costs related to the October 4, 2017, acquisition of Bright. Attributable to: • Machinery and equipment – $110 • Software – $15 125 Other operating expenses 7,595 Total $ 25,160
Appendix C: September 13, 2018 – Day 2 Simulation and Marking Guides Page 99
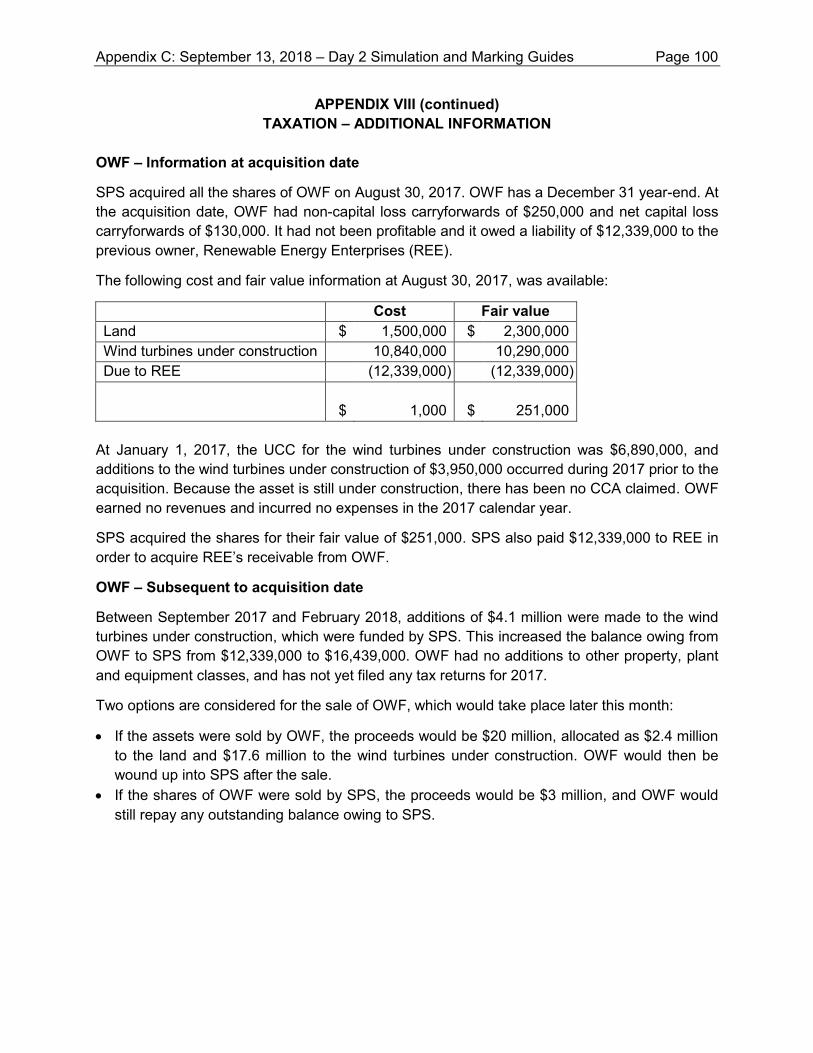
APPENDIX VIII (continued) TAXATION – ADDITIONAL INFORMATION
OWF – Information at acquisition date
SPS acquired all the shares of OWF on August 30, 2017. OWF has a December 31 year-end. At the acquisition date, OWF had non-capital loss carryforwards of $250,000 and net capital loss carryforwards of $130,000. It had not been profitable and it owed a liability of $12,339,000 to the previous owner, Renewable Energy Enterprises (REE).
The following cost and fair value information at August 30, 2017, was available:
Cost Fair value Land $ 1,500,000 $ 2,300,000 Wind turbines under construction 10,840,000 10,290,000 Due to REE (12,339,000) (12,339,000) $ 1,000 $ 251,000
At January 1, 2017, the UCC for the wind turbines under construction was $6,890,000, and additions to the wind turbines under construction of $3,950,000 occurred during 2017 prior to the acquisition. Because the asset is still under construction, there has been no CCA claimed. OWF earned no revenues and incurred no expenses in the 2017 calendar year.
SPS acquired the shares for their fair value of $251,000. SPS also paid $12,339,000 to REE in order to acquire REE’s receivable from OWF.
OWF – Subsequent to acquisition date
Between September 2017 and February 2018, additions of $4.1 million were made to the wind turbines under construction, which were funded by SPS. This increased the balance owing from OWF to SPS from $12,339,000 to $16,439,000. OWF had no additions to other property, plant and equipment classes, and has not yet filed any tax returns for 2017.
Two options are considered for the sale of OWF, which would take place later this month:
• If the assets were sold by OWF, the proceeds would be $20 million, allocated as $2.4 million to the land and $17.6 million to the wind turbines under construction. OWF would then be wound up into SPS after the sale.
• If the shares of OWF were sold by SPS, the proceeds would be $3 million, and OWF would still repay any outstanding balance owing to SPS.
Appendix C: September 13, 2018 – Day 2 Simulation and Marking Guides Page 100
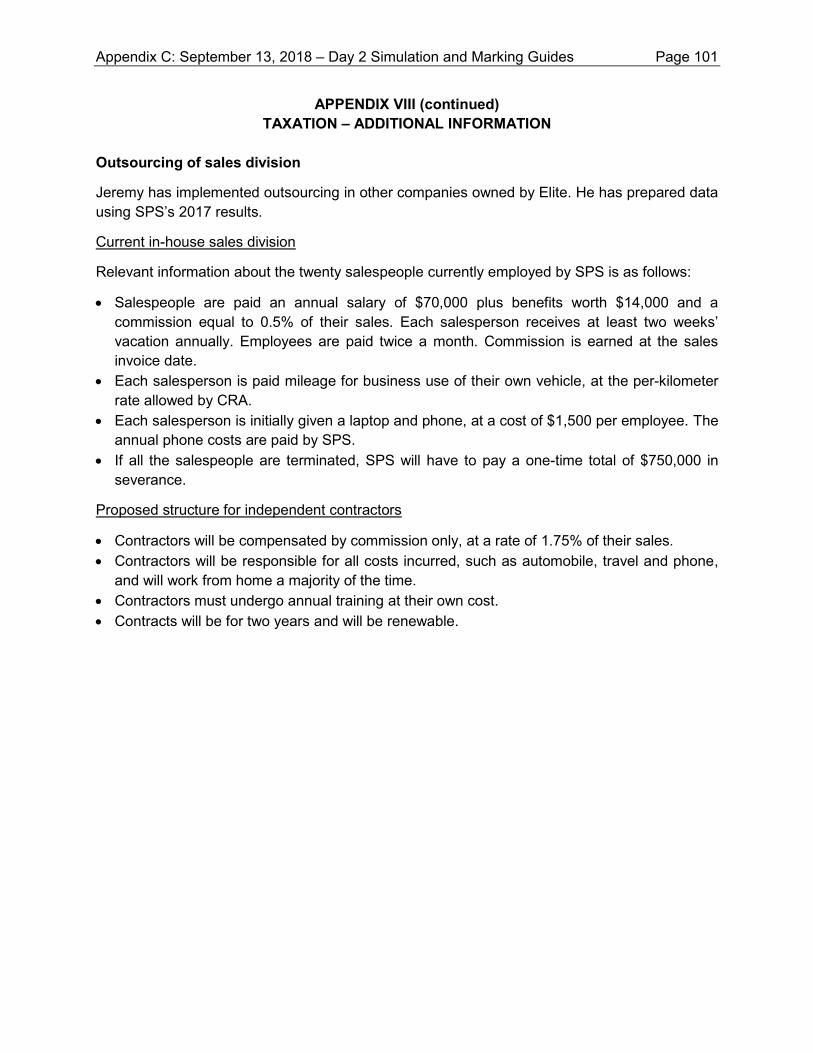
APPENDIX VIII (continued) TAXATION – ADDITIONAL INFORMATION
Outsourcing of sales division
Jeremy has implemented outsourcing in other companies owned by Elite. He has prepared data using SPS’s 2017 results.
Current in-house sales division
Relevant information about the twenty salespeople currently employed by SPS is as follows:
• Salespeople are paid an annual salary of $70,000 plus benefits worth $14,000 and a commission equal to 0.5% of their sales. Each salesperson receives at least two weeks’ vacation annually. Employees are paid twice a month. Commission is earned at the sales invoice date.
• Each salesperson is paid mileage for business use of their own vehicle, at the per-kilometer rate allowed by CRA.
• Each salesperson is initially given a laptop and phone, at a cost of $1,500 per employee. The annual phone costs are paid by SPS.
• If all the salespeople are terminated, SPS will have to pay a one-time total of $750,000 in severance.
Proposed structure for independent contractors
• Contractors will be compensated by commission only, at a rate of 1.75% of their sales. • Contractors will be responsible for all costs incurred, such as automobile, travel and phone,
and will work from home a majority of the time. • Contractors must undergo annual training at their own cost. • Contracts will be for two years and will be renewable.
Appendix C: September 13, 2018 – Day 2 Simulation and Marking Guides Page 101
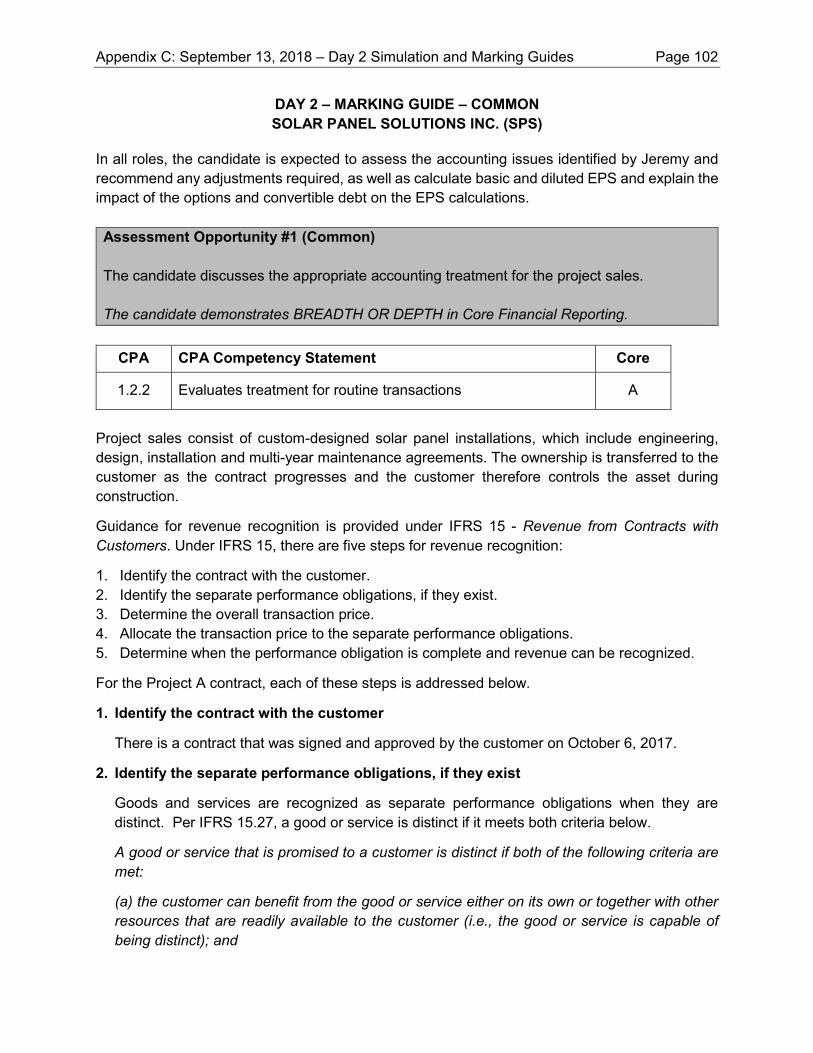
DAY 2 – MARKING GUIDE – COMMON SOLAR PANEL SOLUTIONS INC. (SPS)
In all roles, the candidate is expected to assess the accounting issues identified by Jeremy and recommend any adjustments required, as well as calculate basic and diluted EPS and explain the impact of the options and convertible debt on the EPS calculations. Assessment Opportunity #1 (Common) The candidate discusses the appropriate accounting treatment for the project sales. The candidate demonstrates BREADTH OR DEPTH in Core Financial Reporting.
CPA CPA Competency Statement Core
1.2.2 Evaluates treatment for routine transactions A
Project sales consist of custom-designed solar panel installations, which include engineering, design, installation and multi-year maintenance agreements. The ownership is transferred to the customer as the contract progresses and the customer therefore controls the asset during construction.
Guidance for revenue recognition is provided under IFRS 15 - Revenue from Contracts with Customers. Under IFRS 15, there are five steps for revenue recognition:
1. Identify the contract with the customer. 2. Identify the separate performance obligations, if they exist. 3. Determine the overall transaction price. 4. Allocate the transaction price to the separate performance obligations. 5. Determine when the performance obligation is complete and revenue can be recognized.
For the Project A contract, each of these steps is addressed below.
1. Identify the contract with the customer
There is a contract that was signed and approved by the customer on October 6, 2017.
2. Identify the separate performance obligations, if they exist
Goods and services are recognized as separate performance obligations when they are distinct. Per IFRS 15.27, a good or service is distinct if it meets both criteria below.
A good or service that is promised to a customer is distinct if both of the following criteria are met:
(a) the customer can benefit from the good or service either on its own or together with other resources that are readily available to the customer (i.e., the good or service is capable of being distinct); and
Appendix C: September 13, 2018 – Day 2 Simulation and Marking Guides Page 102
(b) the entity’s promise to transfer the good or service to the customer is separately identifiable from other promises in the contract (i.e., the promise to transfer the good or service is distinct within the context of the contract).
.29 In assessing whether an entity’s promises to transfer goods or services to the customer are separately identifiable in accordance with paragraph 27(b), the objective is to determine whether the nature of the promise, within the context of the contract, is to transfer each of those goods or services individually or, instead, to transfer a combined item or items to which the promised goods or services are inputs. Factors that indicate that two or more promises to transfer goods or services to a customer are not separately identifiable include, but are not limited to, the following:
(a) the entity provides a significant service of integrating the goods or services with other goods or services promised in the contract into a bundle of goods or services that represent the combined output or outputs for which the customer has contracted. In other words, the entity is using the goods or services as inputs to produce or deliver the combined output or outputs specified by the customer. A combined output or outputs might include more than one phase, element or unit.
(b) one or more of the goods or services significantly modifies or customises, or are significantly modified or customised by, one or more of the other goods or services promised in the contract.
(c) the goods or services are highly interdependent or highly interrelated. In other words, each of the goods or services is significantly affected by one or more of the other goods or services in the contract. For example, in some cases, two or more goods or services are significantly affected by each other because the entity would not be able to fulfil its promise by transferring each of the goods or services independently.
With respect to IFRS 15.27(a), this criterion is met since each of these items may be sold on its own, as indicated by the stand-alone selling prices that were provided.
For the criterion outlined in IFRS 15.27(b), we also have to look at IFRS 15.29 to determine whether the good or service is separately identifiable. For IFRS 15.29(a), we are told that all performance obligations under the contract except the three-year maintenance contract are highly integrated. The design and engineering are used to provide the ultimate product, which is the delivery of the installed solar panels. Therefore, it can be argued that the engineering and design, solar panels, and installation are highly integrated. However, these services may also be sold separately, so it can also be argued that they can be separated. For IFRS 15.29(b), it is likely that the engineering and design will affect how the solar panels are installed. Therefore, engineering and design services significantly modify the installation services in the contract. For IFRS 15.29(c), there is no indication that the different components are highly interdependent, due to the ability to offer these services separately.
Based on the analysis above, the engineering and design, solar panels and installation costs are highly integrated and considered one distinct performance obligation. The three-year service agreement is seen as a second distinct performance obligation.
Appendix C: September 13, 2018 – Day 2 Simulation and Marking Guides Page 103
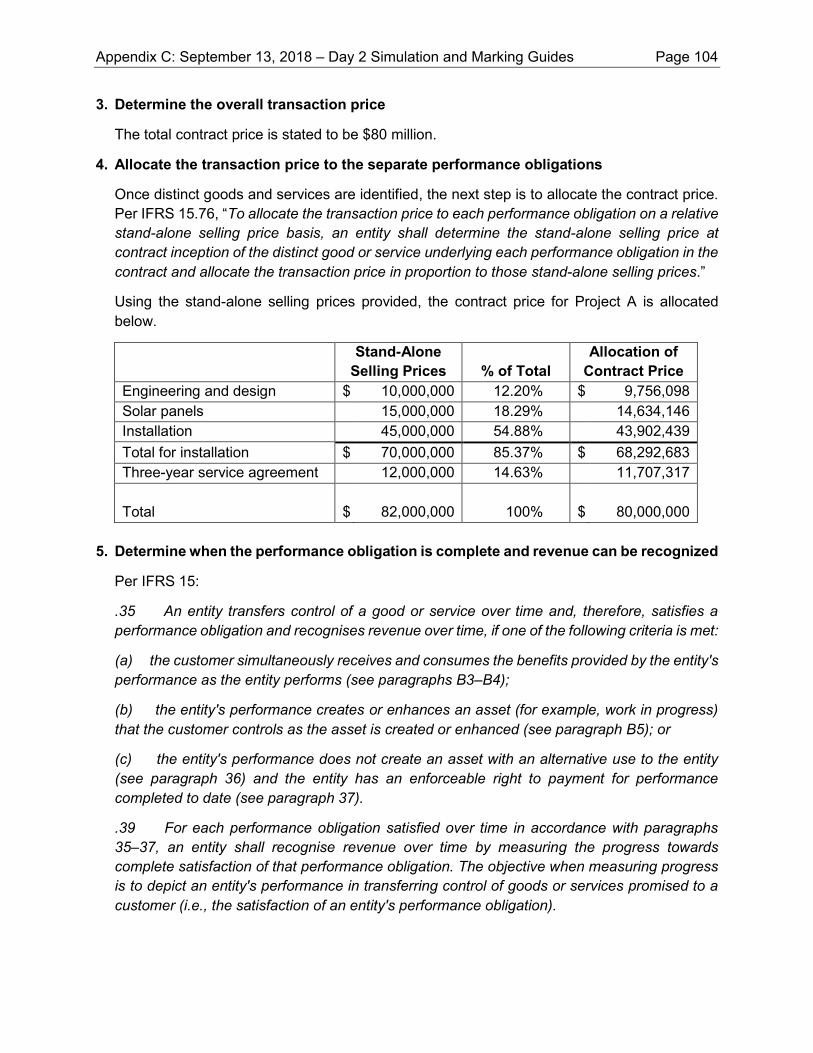
3. Determine the overall transaction price
The total contract price is stated to be $80 million.
4. Allocate the transaction price to the separate performance obligations
Once distinct goods and services are identified, the next step is to allocate the contract price. Per IFRS 15.76, “To allocate the transaction price to each performance obligation on a relative stand-alone selling price basis, an entity shall determine the stand-alone selling price at contract inception of the distinct good or service underlying each performance obligation in the contract and allocate the transaction price in proportion to those stand-alone selling prices.”
Using the stand-alone selling prices provided, the contract price for Project A is allocated below.
Stand-Alone Selling Prices
% of Total
Allocation of Contract Price
Engineering and design $ 10,000,000 12.20% $ 9,756,098 Solar panels 15,000,000 18.29% 14,634,146 Installation 45,000,000 54.88% 43,902,439 Total for installation $ 70,000,000 85.37% $ 68,292,683 Three-year service agreement 12,000,000 14.63% 11,707,317 Total
$ 82,000,000 100%
$ 80,000,000
5. Determine when the performance obligation is complete and revenue can be recognized
Per IFRS 15:
.35 An entity transfers control of a good or service over time and, therefore, satisfies a performance obligation and recognises revenue over time, if one of the following criteria is met:
(a) the customer simultaneously receives and consumes the benefits provided by the entity's performance as the entity performs (see paragraphs B3–B4);
(b) the entity's performance creates or enhances an asset (for example, work in progress) that the customer controls as the asset is created or enhanced (see paragraph B5); or
(c) the entity's performance does not create an asset with an alternative use to the entity (see paragraph 36) and the entity has an enforceable right to payment for performance completed to date (see paragraph 37).
.39 For each performance obligation satisfied over time in accordance with paragraphs 35–37, an entity shall recognise revenue over time by measuring the progress towards complete satisfaction of that performance obligation. The objective when measuring progress is to depict an entity's performance in transferring control of goods or services promised to a customer (i.e., the satisfaction of an entity's performance obligation).
Appendix C: September 13, 2018 – Day 2 Simulation and Marking Guides Page 104
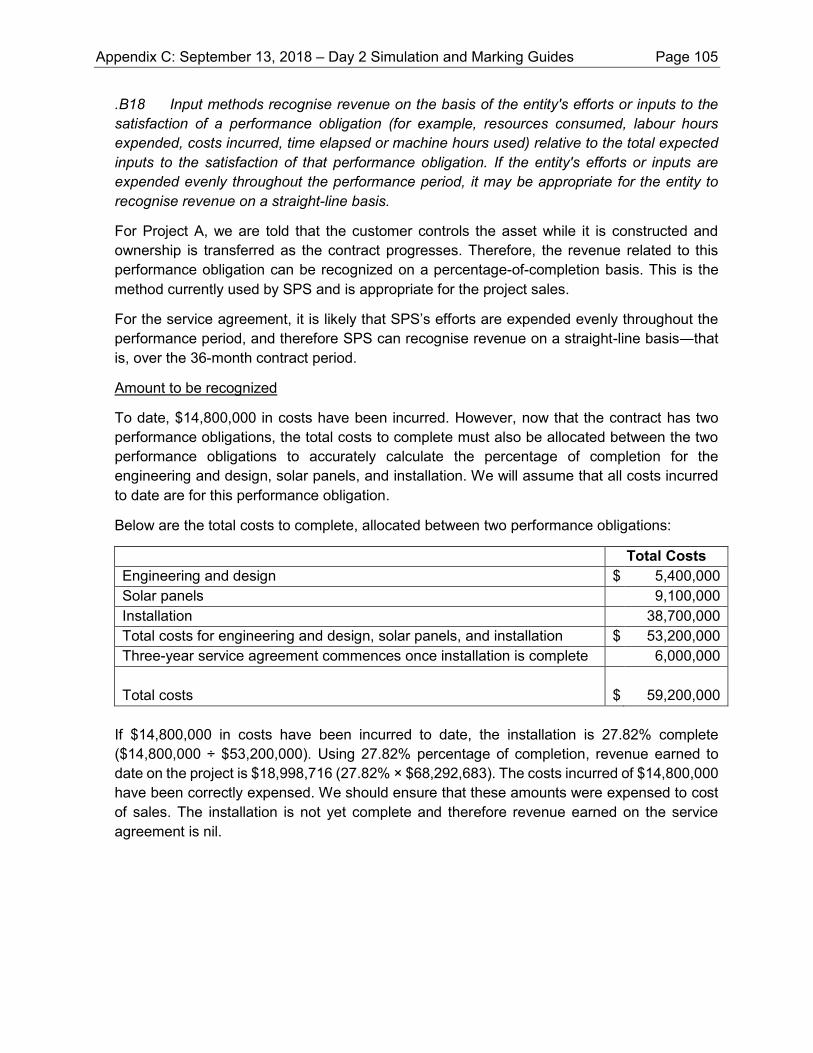
.B18 Input methods recognise revenue on the basis of the entity's efforts or inputs to the satisfaction of a performance obligation (for example, resources consumed, labour hours expended, costs incurred, time elapsed or machine hours used) relative to the total expected inputs to the satisfaction of that performance obligation. If the entity's efforts or inputs are expended evenly throughout the performance period, it may be appropriate for the entity to recognise revenue on a straight-line basis.
For Project A, we are told that the customer controls the asset while it is constructed and ownership is transferred as the contract progresses. Therefore, the revenue related to this performance obligation can be recognized on a percentage-of-completion basis. This is the method currently used by SPS and is appropriate for the project sales.
For the service agreement, it is likely that SPS’s efforts are expended evenly throughout the performance period, and therefore SPS can recognise revenue on a straight-line basis―that is, over the 36-month contract period.
Amount to be recognized
To date, $14,800,000 in costs have been incurred. However, now that the contract has two performance obligations, the total costs to complete must also be allocated between the two performance obligations to accurately calculate the percentage of completion for the engineering and design, solar panels, and installation. We will assume that all costs incurred to date are for this performance obligation.
Below are the total costs to complete, allocated between two performance obligations:
Total Costs Engineering and design $ 5,400,000 Solar panels 9,100,000 Installation 38,700,000 Total costs for engineering and design, solar panels, and installation $ 53,200,000 Three-year service agreement commences once installation is complete 6,000,000 Total costs
$ 59,200,000
If $14,800,000 in costs have been incurred to date, the installation is 27.82% complete ($14,800,000 ÷ $53,200,000). Using 27.82% percentage of completion, revenue earned to date on the project is $18,998,716 (27.82% × $68,292,683). The costs incurred of $14,800,000 have been correctly expensed. We should ensure that these amounts were expensed to cost of sales. The installation is not yet complete and therefore revenue earned on the service agreement is nil.
Appendix C: September 13, 2018 – Day 2 Simulation and Marking Guides Page 105
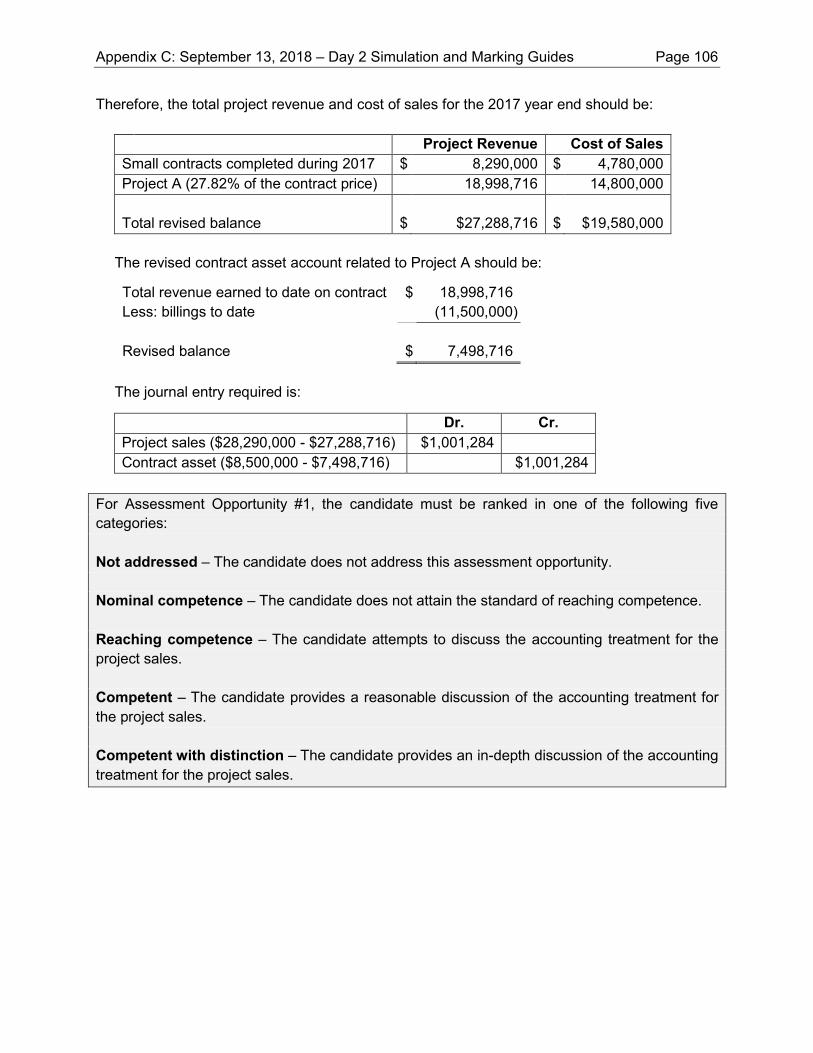
Therefore, the total project revenue and cost of sales for the 2017 year end should be: Project Revenue Cost of Sales Small contracts completed during 2017 $ 8,290,000 $ 4,780,000 Project A (27.82% of the contract price) 18,998,716 14,800,000 Total revised balance
$ $27,288,716
$ $19,580,000
The revised contract asset account related to Project A should be:
Total revenue earned to date on contract $ 18,998,716 Less: billings to date (11,500,000) Revised balance $ 7,498,716
The journal entry required is:
Dr. Cr. Project sales ($28,290,000 - $27,288,716) $1,001,284 Contract asset ($8,500,000 - $7,498,716) $1,001,284
For Assessment Opportunity #1, the candidate must be ranked in one of the following five categories:
Not addressed – The candidate does not address this assessment opportunity. Nominal competence – The candidate does not attain the standard of reaching competence.
Reaching competence – The candidate attempts to discuss the accounting treatment for theproject sales.
Competent – The candidate provides a reasonable discussion of the accounting treatment for the project sales.
Competent with distinction – The candidate provides an in-depth discussion of the accountingtreatment for the project sales.
Appendix C: September 13, 2018 – Day 2 Simulation and Marking Guides Page 106
Assessment Opportunity #2 (Common) The candidate discusses the appropriate accounting treatment for the warranty of the solar panels. The candidate demonstrates BREADTH OR DEPTH in Core Financial Reporting.
CPA CPA Competency Statement Core
1.2.1 Develops or evaluates appropriate accounting policies and procedures A
1.2.2 Evaluates treatment for routine transactions A
There are two issues to address with respect to the warranty:
1. The nature of the warranty agreement and how it should be recognized at the time of sale; and
2. The correct amount of the warranty provision.
1. Nature of the warranty agreement
Under IFRS 15 - Revenue from Contracts with Customers, paragraph B28, there are two types of warranties: “Some warranties provide a customer with assurance that the related product will function as the parties intended because it complies with agreed-upon specifications. Other warranties provide the customer with a service in addition to the assurance that the product complies with agreed-upon specifications.”
In addition:
.B31 In assessing whether a warranty provides a customer with a service in addition to the assurance that the product complies with agreed-upon specifications, an entity shall consider factors such as:
(a) Whether the warranty is required by law—if the entity is required by law to provide a warranty, the existence of that law indicates that the promised warranty is not a performance obligation because such requirements typically exist to protect customers from the risk of purchasing defective products.
(b) The length of the warranty coverage period—the longer the coverage period, the more likely it is that the promised warranty is a performance obligation because it is more likely to provide a service in addition to the assurance that the product complies with agreed-upon specifications.
(c) The nature of the tasks that the entity promises to perform—if it is necessary for an entity to perform specified tasks to provide the assurance that a product complies with agreed-upon specifications (for example, a return shipping service for a defective product), then those tasks likely do not give rise to a performance obligation.
Appendix C: September 13, 2018 – Day 2 Simulation and Marking Guides Page 107
SPS is only obligated to replace defective panels that do not meet product specifications with a new panel. There are no additional services to be provided. In addition, the warranty is required by law and the warranty is not sold separately. As a result, this appears to be an assurance-type warranty, and therefore should be recognized as a provision, as per paragraph B30:
If a customer does not have the option to purchase a warranty separately, an entity shall account for the warranty in accordance with IAS 37 Provisions, Contingent Liabilities and Contingent Assets unless the promised warranty, or a part of the promised warranty, provides the customer with a service in addition to the assurance that the product complies with agreed-upon specifications.
2. Amount of the provision as at December 31, 2017
The next issue is whether the amount of provision has been correctly recognized and measured in the draft 2017 financial statements. Under IAS 37:
.14 A provision shall be recognised when:
(a) an entity has a present obligation (legal or constructive) as a result of a past event;
(b) it is probable that an outflow of resources embodying economic benefits will be required to settle the obligation; and
(c) a reliable estimate can be made of the amount of the obligation.
All the criteria above have been met, as the warranty results from a previous sale (criterion a), past experience has shown that it is probable that claims will be made by customers (criterion b), and based on past experience, an estimate of the warranty costs can be made (criterion c). Therefore, warranties should be recognized at the time they arise, which is at the point of sale.
In addition,
.36 The amount recognised as a provision shall be the best estimate of the expenditure required to settle the present obligation at the end of the reporting period.
.45 Where the effect of the time value of money is material, the amount of a provision shall be the present value of the expenditures expected to be required to settle the obligation.
Therefore, the expected expenditures should be present valued if the effect of time value of money is material. However, for SPS, the timing is very uncertain and most panels fail within the first three years, so discounting has not been used. This would likely be acceptable, given that there is little evidence to support discounting.
Appendix C: September 13, 2018 – Day 2 Simulation and Marking Guides Page 108
The warranty provision should be calculated as follows:
Estimated warranty cost $ 1,312,000 Less: expenses incurred for warranty claims (225,000) Balance as at December 31, 2017 $ 1,087,000
The journal entry required is:
Dr. Cr. Warranty expense (Cost of sales - solar panels) $1,087,000 Warranty provision $1,087,000
For Assessment Opportunity #2, the candidate must be ranked in one of the following five categories: Not addressed – The candidate does not address this assessment opportunity. Nominal competence – The candidate does not attain the standard of reaching competence. Reaching competence – The candidate attempts to discuss the accounting treatment for the warranty of the solar panels. Competent – The candidate provides a reasonable discussion of the accounting treatment for the warranty of the solar panels. Competent with distinction – The candidate provides an in-depth discussion of the accounting treatment for the warranty of the solar panels. Assessment Opportunity #3 (Common) The candidate discusses the appropriate accounting treatment for the purchase of Bright Sun Power Ltd. The candidate demonstrates BREADTH OR DEPTH in Core Financial Reporting.
CPA CPA Competency Statement Core
1.2.1 Develops or evaluates appropriate accounting policies and procedures A
1.2.3 Evaluates treatment for non-routine transactions B
Appendix C: September 13, 2018 – Day 2 Simulation and Marking Guides Page 109
The accounting issues related to the acquisition of Bright Sun Power Ltd. (Bright) include:
1. Whether the acquisition is a business combination; and 2. If so, how the consideration paid is recognized in the financial statements.
IFRS 3 – Business Combinations is the relevant standard by which to address these issues.
1. Does this qualify as a business combination?
.3 An entity shall determine whether a transaction or other event is a business combination by applying the definition in this IFRS, which requires that the assets acquired and liabilities assumed constitute a business. If the assets acquired are not a business, the reporting entity shall account for the transaction or other event as an asset acquisition. Paragraphs B5–B12 provide guidance on identifying a business combination and the definition of a business.
IFRS 3, paragraph 2(b) also states that, when acquiring assets rather than a business:
… the acquirer shall identify and recognise the individual identifiable assets acquired (including those assets that meet the definition of, and recognition criteria for, intangible assets in IAS 38 Intangible Assets) and liabilities assumed. The cost of the group shall be allocated to the individual identifiable assets and liabilities on the basis of their relative fair values at the date of purchase. Such a transaction or event does not give rise to goodwill.
However, if the transaction is a business combination, the assets and liabilities are accounted for differently.
Per IFRS 3, Appendix A, the definition of a business combination is “a transaction or other event in which an acquirer obtains control of one or more businesses”. For a business combination to occur, there must be an acquirer who has gained control and a business that has been purchased:
Has an acquirer gained control?
Per IFRS 3.B5(a), “An acquirer might obtain control of an acquiree in a variety of ways, for example: (a) by transferring cash, cash equivalents or other assets (including net assets that constitute a business)”. SPS paid cash to Bright in order to purchase net assets of Bright. SPS is the acquirer and has control over the assets purchased.
Has a business been purchased?
Per IFRS 3, Appendix A, a business is defined as “an integrated set of activities and assets that is capable of being conducted and managed for the purpose of providing a return in the form of dividends, lower costs or other economic benefits directly to investors or other owners, members or participants”. IFRS 3.B11 also states that “determining whether a particular set of assets and activities is a business should be based on whether the integrated set is capable of being conducted and managed as a business by a market participant”.
Appendix C: September 13, 2018 – Day 2 Simulation and Marking Guides Page 110
In reviewing the purchase, we see that, in addition to the processes and contract proposals currently outstanding, the employees have also been acquired. We also note that, from Bright’s perspective, it has decided to no longer sell these services and products and has contracted to not do so for the next two years. From SPS’s perspective, it acquired these assets to secure a position in the solar panel installation market and appears to be treating this as a separate business division. Given the above analysis, the conclusion is that this acquisition qualifies as a business combination.
2. Allocation of the consideration paid
Per IFRS 3:
.10 As of the acquisition date, the acquirer shall recognise, separately from goodwill, the identifiable assets acquired, the liabilities assumed and any non-controlling interest in the acquiree.
.18 The acquirer shall measure the identifiable assets acquired and the liabilities assumed at their acquisition-date fair values.
.32 The acquirer shall recognise goodwill as of the acquisition date measured as the excess of (a) over (b) below:
(a) the aggregate of:
(i) the consideration transferred measured in accordance with this IFRS, which generally requires acquisition-date fair value (see paragraph 37);
(ii) the amount of any non-controlling interest in the acquiree measured in accordance with this IFRS; and
(iii) in a business combination achieved in stages (see paragraphs 41 and 42), the acquisition-date fair value of the acquirer's previously held equity interest in the acquiree.
(b) the net of the acquisition-date amounts of the identifiable assets acquired and the liabilities assumed measured in accordance with this IFRS.
Because this is a net asset purchase, the tax basis for SPS for the assets and liabilities acquired will be the acquisition price paid at the time of the acquisition; therefore, there will be no related deferred taxes at the date of acquisition.
Two questions arise with respect to separately identifiable assets: the software and the non-compete arrangement. IFRS 3 provides guidance on this:
B31 The acquirer shall recognise, separately from goodwill, the identifiable intangible assets acquired in a business combination. An intangible asset is identifiable if it meets either the separability criterion or the contractual-legal criterion.
Appendix C: September 13, 2018 – Day 2 Simulation and Marking Guides Page 111
B33 The separability criterion means that an acquired intangible asset is capable of being separated or divided from the acquiree and sold, transferred, licensed, rented or exchanged, either individually or together with a related contract, identifiable asset or liability. An intangible asset that the acquirer would be able to sell, license or otherwise exchange for something else of value meets the separability criterion even if the acquirer does not intend to sell, license or otherwise exchange it. An acquired intangible asset meets the separability criterion if there is evidence of exchange transactions for that type of asset or an asset of a similar type, even if those transactions are infrequent and regardless of whether the acquirer is involved in them. For example, customer and subscriber lists are frequently licensed and thus meet the separability criterion. Even if an acquiree believes its customer lists have characteristics different from other customer lists, the fact that customer lists are frequently licensed generally means that the acquired customer list meets the separability criterion. However, a customer list acquired in a business combination would not meet the separability criterion if the terms of confidentiality or other agreements prohibit an entity from selling, leasing or otherwise exchanging information about its customers.
In addition, for an intangible asset to be recognized, it must be identifiable. As per IAS 38.12:
.12 An asset is identifiable if it either:
(a) is separable, i.e., is capable of being separated or divided from the entity and sold, transferred, licensed, rented or exchanged, either individually or together with a related contract, identifiable asset or liability, regardless of whether the entity intends to do so; or
(b) arises from contractual or other legal rights, regardless of whether those rights are transferable or separable from the entity or from other rights and obligations.
In the case of the software, there are similar software products available for sale, and although SPS could sell this software, it has decided to keep it for its own use. Consequently, it meets the criterion for separability and can be recognized separately from goodwill. In addition, it also meets the criterion of being identifiable since it can be sold individually. Accordingly, the software can be recognized as a separate intangible asset.
In the case of the non-compete agreement, to be recognized separately from goodwill, it must be separable and identifiable:
• Separable – The fact that there is a legal contract means it is likely separable. Therefore, the criterion is met.
• Identifiable – The non-compete arrangement does arise from contractual rights that disallow Bright from competing. Therefore, it appears to meet this criterion.
The non-compete agreement should be recognized separately from goodwill. However, the valuation of the agreement must be considered. Non-compete agreements are rarely enforceable in court; in addition, even if enforceable, the terms of the non-compete period is very short (two years), which makes the value of the asset minimal. Therefore, the asset is not material enough to be separately recognized and the value can be included as a part of goodwill.
Appendix C: September 13, 2018 – Day 2 Simulation and Marking Guides Page 112
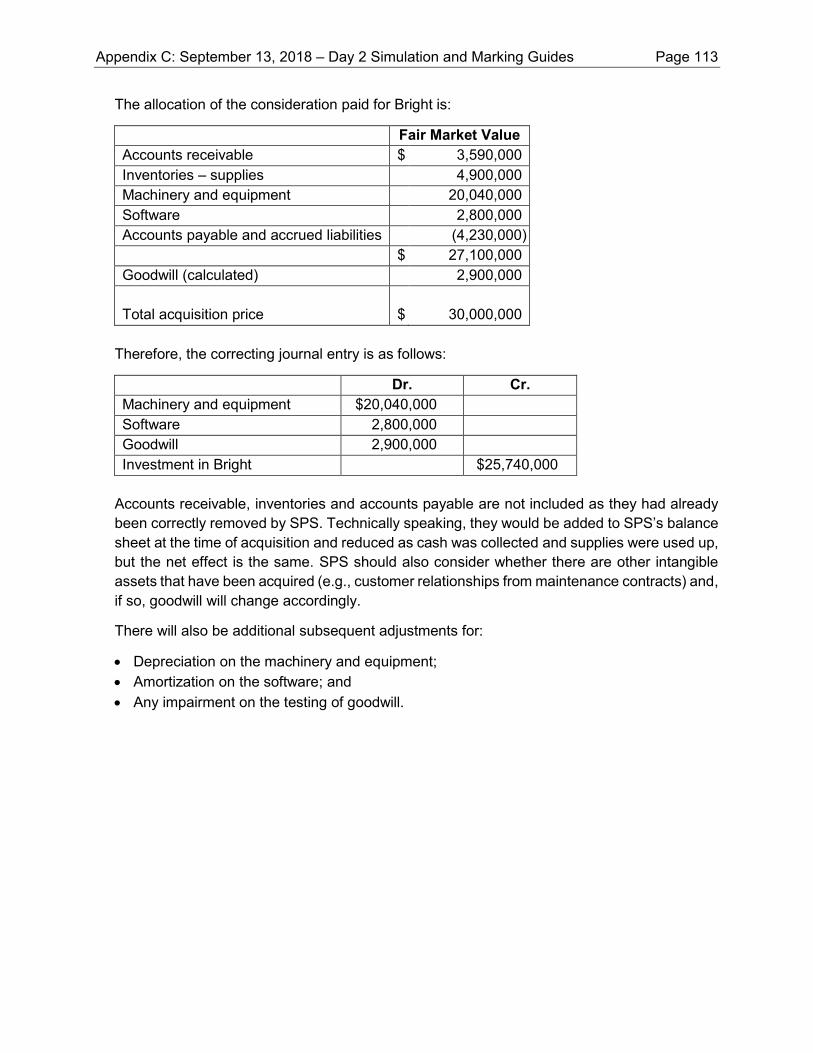
The allocation of the consideration paid for Bright is:
Fair Market Value Accounts receivable $ 3,590,000 Inventories – supplies 4,900,000 Machinery and equipment 20,040,000 Software 2,800,000 Accounts payable and accrued liabilities (4,230,000) $ 27,100,000 Goodwill (calculated) 2,900,000 Total acquisition price
$ 30,000,000
Therefore, the correcting journal entry is as follows:
Dr. Cr. Machinery and equipment $20,040,000 Software 2,800,000 Goodwill 2,900,000 Investment in Bright $25,740,000
Accounts receivable, inventories and accounts payable are not included as they had already been correctly removed by SPS. Technically speaking, they would be added to SPS’s balance sheet at the time of acquisition and reduced as cash was collected and supplies were used up, but the net effect is the same. SPS should also consider whether there are other intangible assets that have been acquired (e.g., customer relationships from maintenance contracts) and, if so, goodwill will change accordingly.
There will also be additional subsequent adjustments for:
• Depreciation on the machinery and equipment; • Amortization on the software; and • Any impairment on the testing of goodwill.
Appendix C: September 13, 2018 – Day 2 Simulation and Marking Guides Page 113
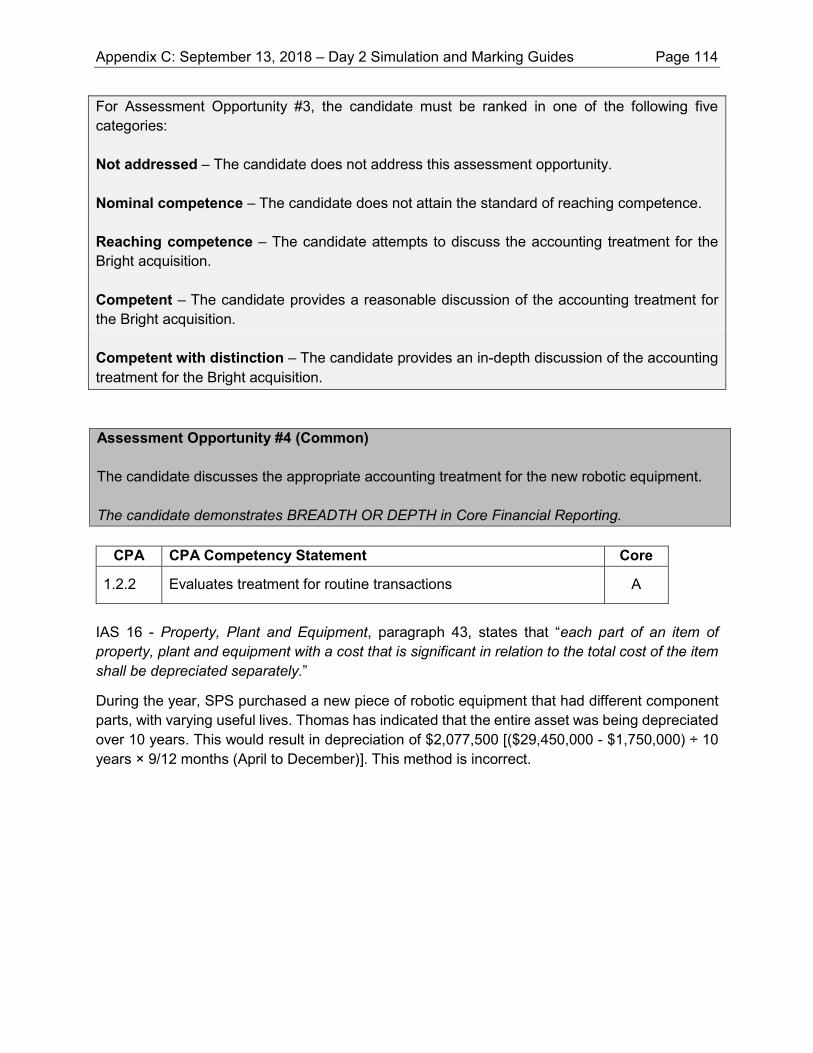
For Assessment Opportunity #3, the candidate must be ranked in one of the following five categories: Not addressed – The candidate does not address this assessment opportunity. Nominal competence – The candidate does not attain the standard of reaching competence.
Reaching competence – The candidate attempts to discuss the accounting treatment for theBright acquisition.
Competent – The candidate provides a reasonable discussion of the accounting treatment forthe Bright acquisition. Competent with distinction – The candidate provides an in-depth discussion of the accounting treatment for the Bright acquisition. Assessment Opportunity #4 (Common) The candidate discusses the appropriate accounting treatment for the new robotic equipment. The candidate demonstrates BREADTH OR DEPTH in Core Financial Reporting.
CPA CPA Competency Statement Core
1.2.2 Evaluates treatment for routine transactions A
IAS 16 - Property, Plant and Equipment, paragraph 43, states that “each part of an item of property, plant and equipment with a cost that is significant in relation to the total cost of the item shall be depreciated separately.”
During the year, SPS purchased a new piece of robotic equipment that had different component parts, with varying useful lives. Thomas has indicated that the entire asset was being depreciated over 10 years. This would result in depreciation of $2,077,500 [($29,450,000 - $1,750,000) ÷ 10 years × 9/12 months (April to December)]. This method is incorrect.
Appendix C: September 13, 2018 – Day 2 Simulation and Marking Guides Page 114
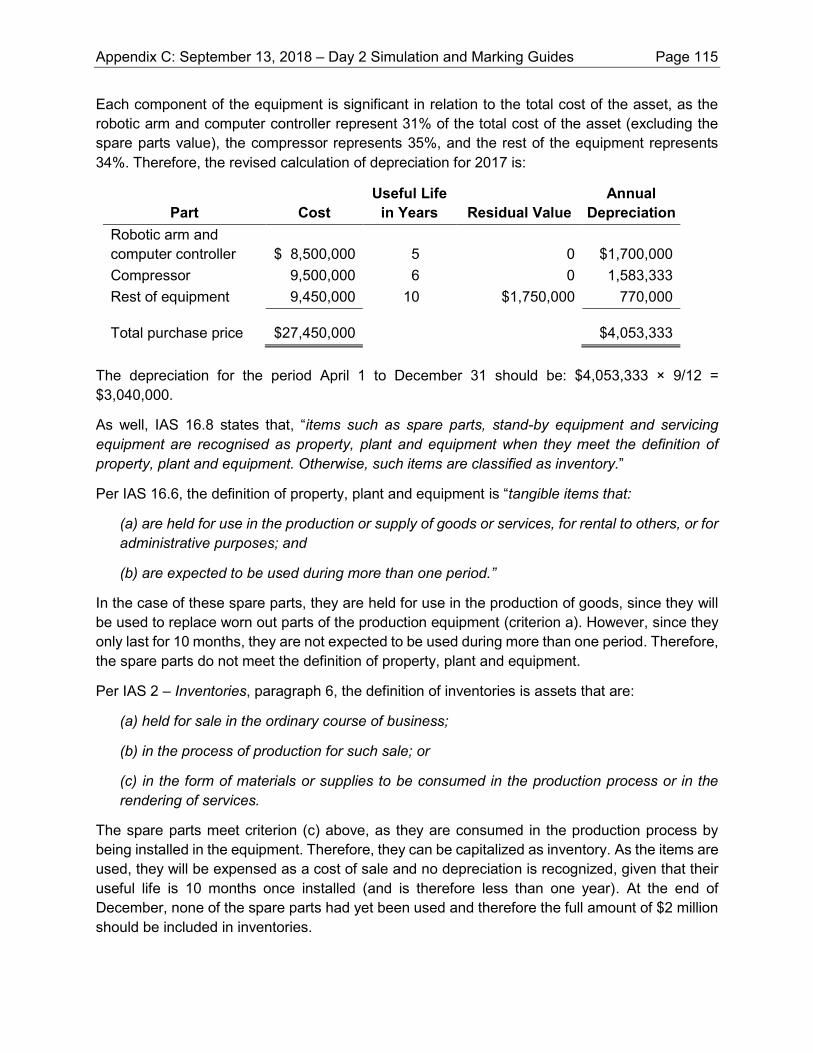
Each component of the equipment is significant in relation to the total cost of the asset, as the robotic arm and computer controller represent 31% of the total cost of the asset (excluding the spare parts value), the compressor represents 35%, and the rest of the equipment represents 34%. Therefore, the revised calculation of depreciation for 2017 is:
Part Cost Useful Life
in Years Residual Value Annual
Depreciation Robotic arm and computer controller $ 8,500,000 5 0 $1,700,000 Compressor 9,500,000 6 0 1,583,333 Rest of equipment 9,450,000 10 $1,750,000 770,000
Total purchase price $27,450,000 $4,053,333 The depreciation for the period April 1 to December 31 should be: $4,053,333 × 9/12 = $3,040,000.
As well, IAS 16.8 states that, “items such as spare parts, stand-by equipment and servicing equipment are recognised as property, plant and equipment when they meet the definition of property, plant and equipment. Otherwise, such items are classified as inventory.”
Per IAS 16.6, the definition of property, plant and equipment is “tangible items that:
(a) are held for use in the production or supply of goods or services, for rental to others, or for administrative purposes; and
(b) are expected to be used during more than one period.”
In the case of these spare parts, they are held for use in the production of goods, since they will be used to replace worn out parts of the production equipment (criterion a). However, since they only last for 10 months, they are not expected to be used during more than one period. Therefore, the spare parts do not meet the definition of property, plant and equipment.
Per IAS 2 – Inventories, paragraph 6, the definition of inventories is assets that are:
(a) held for sale in the ordinary course of business;
(b) in the process of production for such sale; or
(c) in the form of materials or supplies to be consumed in the production process or in the rendering of services.
The spare parts meet criterion (c) above, as they are consumed in the production process by being installed in the equipment. Therefore, they can be capitalized as inventory. As the items are used, they will be expensed as a cost of sale and no depreciation is recognized, given that their useful life is 10 months once installed (and is therefore less than one year). At the end of December, none of the spare parts had yet been used and therefore the full amount of $2 million should be included in inventories.
Appendix C: September 13, 2018 – Day 2 Simulation and Marking Guides Page 115
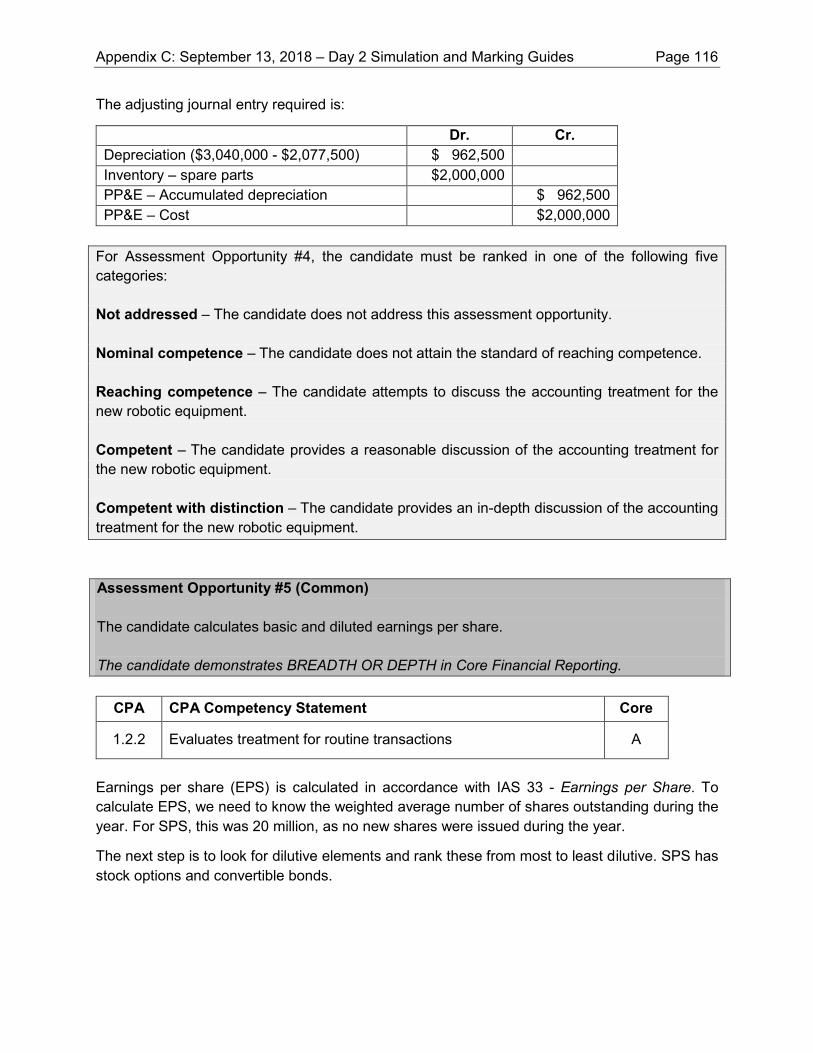
The adjusting journal entry required is:
Dr. Cr. Depreciation ($3,040,000 - $2,077,500) $ 962,500 Inventory – spare parts $2,000,000 PP&E – Accumulated depreciation $ 962,500 PP&E – Cost $2,000,000
For Assessment Opportunity #4, the candidate must be ranked in one of the following five
categories: Not addressed – The candidate does not address this assessment opportunity. Nominal competence – The candidate does not attain the standard of reaching competence. Reaching competence – The candidate attempts to discuss the accounting treatment for the new robotic equipment.
Competent – The candidate provides a reasonable discussion of the accounting treatment forthe new robotic equipment. Competent with distinction – The candidate provides an in-depth discussion of the accounting treatment for the new robotic equipment. Assessment Opportunity #5 (Common) The candidate calculates basic and diluted earnings per share. The candidate demonstrates BREADTH OR DEPTH in Core Financial Reporting.
CPA CPA Competency Statement Core
1.2.2 Evaluates treatment for routine transactions A
Earnings per share (EPS) is calculated in accordance with IAS 33 - Earnings per Share. To calculate EPS, we need to know the weighted average number of shares outstanding during the year. For SPS, this was 20 million, as no new shares were issued during the year.
The next step is to look for dilutive elements and rank these from most to least dilutive. SPS has stock options and convertible bonds.
Appendix C: September 13, 2018 – Day 2 Simulation and Marking Guides Page 116
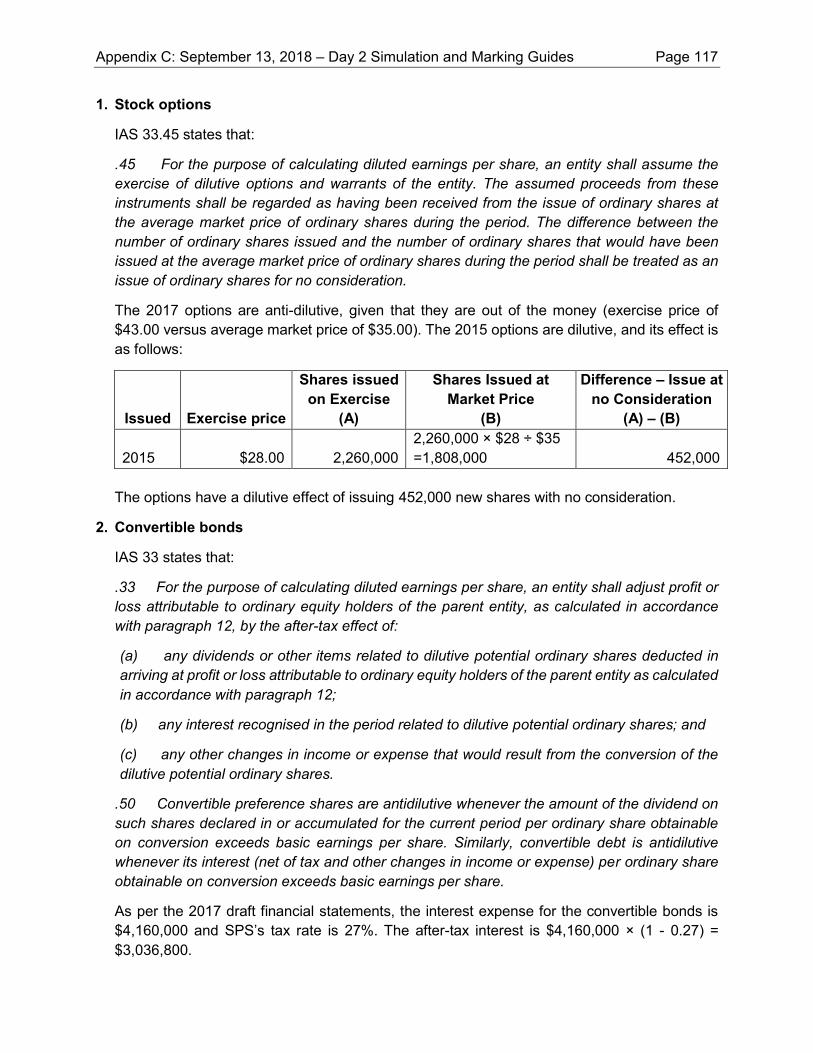
1. Stock options
IAS 33.45 states that:
.45 For the purpose of calculating diluted earnings per share, an entity shall assume the exercise of dilutive options and warrants of the entity. The assumed proceeds from these instruments shall be regarded as having been received from the issue of ordinary shares at the average market price of ordinary shares during the period. The difference between the number of ordinary shares issued and the number of ordinary shares that would have been issued at the average market price of ordinary shares during the period shall be treated as an issue of ordinary shares for no consideration.
The 2017 options are anti-dilutive, given that they are out of the money (exercise price of $43.00 versus average market price of $35.00). The 2015 options are dilutive, and its effect is as follows:
Issued Exercise price
Shares issued on Exercise
(A)
Shares Issued at Market Price
(B)
Difference – Issue at no Consideration
(A) – (B)
2015 $28.00 2,260,000 2,260,000 × $28 ÷ $35 =1,808,000 452,000
The options have a dilutive effect of issuing 452,000 new shares with no consideration.
2. Convertible bonds
IAS 33 states that:
.33 For the purpose of calculating diluted earnings per share, an entity shall adjust profit or loss attributable to ordinary equity holders of the parent entity, as calculated in accordance with paragraph 12, by the after-tax effect of:
(a) any dividends or other items related to dilutive potential ordinary shares deducted in arriving at profit or loss attributable to ordinary equity holders of the parent entity as calculated in accordance with paragraph 12;
(b) any interest recognised in the period related to dilutive potential ordinary shares; and
(c) any other changes in income or expense that would result from the conversion of the dilutive potential ordinary shares.
.50 Convertible preference shares are antidilutive whenever the amount of the dividend on such shares declared in or accumulated for the current period per ordinary share obtainable on conversion exceeds basic earnings per share. Similarly, convertible debt is antidilutive whenever its interest (net of tax and other changes in income or expense) per ordinary share obtainable on conversion exceeds basic earnings per share.
As per the 2017 draft financial statements, the interest expense for the convertible bonds is $4,160,000 and SPS’s tax rate is 27%. The after-tax interest is $4,160,000 × (1 - 0.27) = $3,036,800.
Appendix C: September 13, 2018 – Day 2 Simulation and Marking Guides Page 117
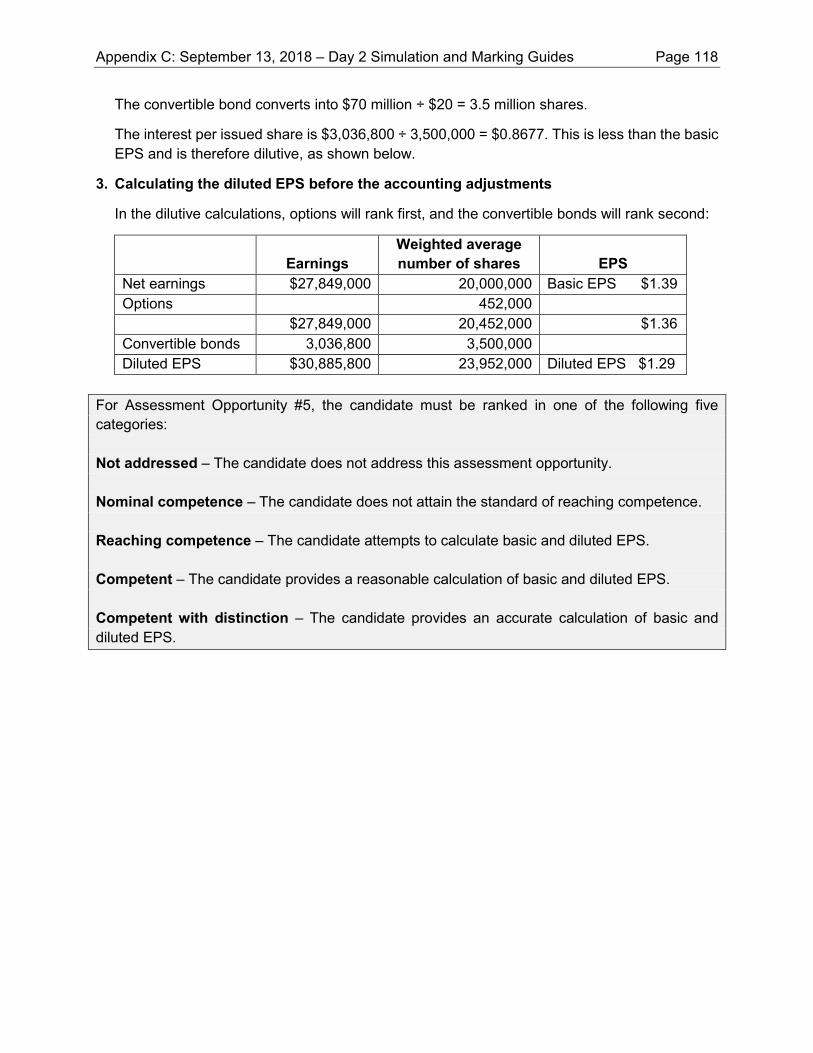
The convertible bond converts into $70 million ÷ $20 = 3.5 million shares.
The interest per issued share is $3,036,800 ÷ 3,500,000 = $0.8677. This is less than the basic EPS and is therefore dilutive, as shown below.
3. Calculating the diluted EPS before the accounting adjustments
In the dilutive calculations, options will rank first, and the convertible bonds will rank second:
Earnings
Weighted average number of shares EPS
Net earnings $27,849,000 20,000,000 Basic EPS $1.39 Options 452,000 $27,849,000 20,452,000 $1.36 Convertible bonds 3,036,800 3,500,000 Diluted EPS $30,885,800 23,952,000 Diluted EPS $1.29
For Assessment Opportunity #5, the candidate must be ranked in one of the following five
categories: Not addressed – The candidate does not address this assessment opportunity. Nominal competence – The candidate does not attain the standard of reaching competence. Reaching competence – The candidate attempts to calculate basic and diluted EPS. Competent – The candidate provides a reasonable calculation of basic and diluted EPS. Competent with distinction – The candidate provides an accurate calculation of basic and diluted EPS.
Appendix C: September 13, 2018 – Day 2 Simulation and Marking Guides Page 118
DAY 2 – MARKING GUIDE – ASSURANCE ROLE SOLAR PANEL SOLUTIONS INC. (SPS)
In the Assurance role, the candidate is expected to reassess the risk and approach of this engagement, improve documentation surrounding materiality and revise materiality, given the accounting errors in the financial statements and other industry factors that have arisen since the preliminary planning in October. The candidate is expected to design specific audit procedures for inventory, as well as for the accounting issues identified. CPA LLP has engaged an expert for the valuation of certain assets acquired from Bright Sun Power Ltd. (Bright), and the candidate is expected to document why the use of the expert is appropriate and provide specific audit procedures to be performed related to the expert’s report. In addition, the candidate is to prepare a summary of identified misstatements found to date and make a preliminary conclusion on the implications for the auditor’s report. Finally, the candidate should prepare a management letter discussing the control weaknesses identified in the Cogna software, and discuss how a review of interim financial statements would differ from a year-end audit.
See Common Marking Guide for solution to Common assessment opportunities #1 to #5. Assessment Opportunity #6 The candidate discusses the changes required to the preliminary risk assessment. The candidate demonstrates DEPTH in the Assurance role.
Risk Assessment
The preliminary audit plan indicated that there were no substantial changes in the operating environment. This is, however, not the case. The following items represent changes in SPS since preliminary planning.
Factors that impact the risk of material misstatement at the financial statement level:
• SPS’s share price has fallen by 40% in the past six months, similar to other solar panel manufacturers in the industry. This increases risk because the share price is valued at a multiple of diluted EPS; management may be inclined to make estimates that will over-state profits to improve the company’s diluted EPS.
• SPS is considering additional financing in late 2018, so the financial statements will be relied upon by prospective shareholders and lenders. Again, this will increase risk, since management may be motivated to make estimates that will over-state profits and the company’s financial performance.
• Because Eliza, the controller, went on maternity leave in October, resulting in the loss of one key staff member in the accounting department, the control environment may be weak. In addition to the added accounting work resulting from the acquisition, the accounting staff is overworked and the CFO has been unable to review everyone’s work adequately. Also, the controller was involved in the more complicated financial statement elements. This has led to some errors being found, increasing risk as the existing controls may no longer be operating effectively in detecting errors in the financial statements.
Appendix C: September 13, 2018 – Day 2 Simulation and Marking Guides Page 119
• There have been new transactions during the year, including significant acquisitions and the provision of a new five-year warranty, which were not considered as part of the risk assessment. This increases risk because the accounting for new transactions can be complex and there may be additional new transactions from the acquisitions that SPS is not aware of.
• There have already been several accounting errors that have been found in the financial statements. Therefore, other errors may exist in the financial statement, increasing risk.
• A new software system from Bright, Cogna, was implemented at SPS during the year. The software will be unfamiliar to staff and introduces new processes for SPS, which increases the risk of error.
• There have been control deficiencies found in the Cogna system that has been implemented. As a result, there is a greater likelihood that there are errors in the financial statements, increasing risk.
• The acquisition of OWF and Bright during the year will result in new processes, as well as the integration of OWF and Bright employees to existing SPS processes. This increases risk as employees may not be familiar with the existing or implemented processes.
Therefore, the risk of material misstatement at the financial statement level should be higher than the initial assessment in October 2017. I recommend that the risk be assessed as high. For Assessment Opportunity #6 (Assurance), the candidate must be ranked in one of the following five categories: Not addressed – The candidate does not address this assessment opportunity. Nominal competence – The candidate does not attain the standard of reaching competence. Reaching competence – The candidate attempts to revise the preliminary risk assessment. Competent – The candidate revises the preliminary risk assessment and concludes on the risk level. Competent with distinction – The candidate thoroughly revises the preliminary risk assessment and concludes on the risk level. Assessment Opportunity #7 The candidate discusses the changes required to the preliminary materiality and planned approach. The candidate demonstrates DEPTH in the Assurance role.
Appendix C: September 13, 2018 – Day 2 Simulation and Marking Guides Page 120
Approach
In October, our notes suggested that we would rely on a combined approach for the initial planning assessment. However, there have been numerous changes in the control environment, including:
• The controller has been on maternity leave, which is causing staff to be overworked and a temporary replacement has not yet been hired. Thomas has not been able to adequately review everyone’s work. This means that controls that involved Eliza are likely not effective for the period she has been away.
• The new Cogna software has had bugs and many control weaknesses associated with it. In addition, Josh has not been able to review the changes that have been made to Cogna. Therefore, there are not likely to be controls that can be relied upon with the new system.
The above increases the company’s control risk. We may want to consider moving toward a more substantive audit approach as a result, at least for the period where the controller has been away and Cogna has been implemented. We may be able to perform a combined approach for the first part of the year.
Materiality
The current documentation of materiality does not discuss the users and their needs, nor the factors supporting the basis and percentage used to calculate materiality.
User of the financial statements
The main users of the financial statements are the lenders, Elite, the Board of Directors, audit committee, management, existing shareholders and prospective shareholders and lenders:
• The lenders (existing and prospective) would be interested in SPS’s ability to repay the loans, and therefore would be interested in net income and perhaps the specific assets that are used as collateral.
• Elite, as the holder of the convertible debt, is concerned about the financial performance of SPS and ultimately the share price, which affects the value of the investment it has in SPS. Since share price is typically valued at a multiple of EPS, Elite will be interested in net income. Net income is also a good indicator of the company’s financial performance.
• The board, audit committee and management will be using the financial statements to assess company performance, which is best represented by net income.
• Existing and prospective shareholders will rely on the financial statements to decide whether to purchase these shares and at what price, and will be most interested in net income.
Based on the above analysis, income before tax is the most appropriate basis to use for materiality. This is also consistent with CAS 320 – Materiality in Planning and Performing an Audit, paragraph A5, which suggests that “profit before tax from continuing operations is often used for profit-oriented entities”. CAS 320.A8 also states that:
Appendix C: September 13, 2018 – Day 2 Simulation and Marking Guides Page 121
Determining a percentage to be applied to a chosen benchmark involves the exercise of professional judgment… For example, the auditor may consider five percent of profit before tax from continuing operations to be appropriate for a profit-oriented entity in a manufacturing industry, while the auditor may consider one percent of total revenue or total expenses to be appropriate for a not-for-profit entity. Higher or lower percentages, however, may be deemed appropriate in the circumstances.
Given that five percent is recommended for profit-oriented entities and there are no other factors to suggest another percentage would be more appropriate, five percent has been applied to the income before taxes and the resulting planning materiality would be $1.9 million ($38,150,000 × 5% = $1,907,500).
We must also calculate the performance materiality for the audit. Per CAS 320.A13, performance materiality is “set to reduce to an appropriately low level the probability that the aggregate of uncorrected and undetected misstatements in the financial statements exceeds materiality for the financial statements as a whole.” Performance materiality is usually in the range of 50% to 75% of materiality. Given that the risk of material misstatement at the financial statement level has been re-assessed as high and there is a higher expectation of misstatements in the current year due to the staff shortage, a performance materiality factor of 60% has been applied. Therefore, performance materiality for SPS is $1,140,000 ($1,900,000 × 60%).
Revision as the Audit Progresses
Materiality needs to be revised as the auditor becomes aware of issues affecting the calculation. Given the adjustments made to the financial statements, the new materiality based on the revised financial statements is:
• (Revised earnings before tax due to accounting adjustments +/- unadjusted summary of differences below) × 5%
= [$38,150,000 (draft income before taxes) - $1,001,284 (revenue) - $1,087,000 (warranty expense) - $962,500 (depreciation) - $2,770,000 (summary of identified misstatements; see later calculation)] × 5%
= $32,329,216 × 5%
= $1,616,461 or $1,600,000 rounded
The new performance materiality is therefore $960,000 ($1,600,000 × 60%).
Impact on the Audit
The preliminary materiality that was utilized during planning in October was $2.5 million. Since the revised materiality is significantly lower than the amount initially set at the planning stage, the audit team must revisit the work that has been completed to date for the substantive testing to ensure that appropriate coverage has been obtained for all testing.
Appendix C: September 13, 2018 – Day 2 Simulation and Marking Guides Page 122
For Assessment Opportunity #7 (Assurance), the candidate must be ranked in one of the following five categories: Not addressed – The candidate does not address this assessment opportunity. Nominal competence – The candidate does not attain the standard of reaching competence. Reaching competence – The candidate attempts to revise the materiality and approach in the preliminary audit plan. Competent – The candidate revises the materiality and approach in the preliminary the audit plan. Competent with distinction – The candidate thoroughly revises the materiality and approach in the preliminary audit plan. Assessment Opportunity #8 The candidate provides audit procedures for the inventory at year end. The candidate demonstrates DEPTH in the Assurance role. Existence and Completeness of Inventory
Based on the information provided, there were two inventory locations where CPA LLP did not attend the inventory count, and inventory balances at these locations were material. To verify the existence and completeness of the inventory at these locations, CPA LLP should obtain a listing of the inventory on hand at these locations as at December 31, 2017, and perform the following procedures:
• For the inventory held by third parties – the supplier facility:
- Obtain evidence to support the existence of the inventory, including written confirmation of what was on hand at December 31, 2017; confirm whether the inventory was physically inspected by the supplier.
- Review the contractual arrangement with the supplier to ensure that the inventory is still owned by SPS.
- Because the amount is significant and CPA LLP has no assessment of the controls at the supplier’s facilities, CPA LLP may consider asking whether the audit team can visit the location now and conduct onsite test counts; alternatively, we could attempt to obtain a CSAE 3416 report on the controls at the supplier’s facilities. If not, we should perform an inventory count at the supplier’s facilities and perform roll-back procedures, which would involve reviewing a sample of shipping and receiving activity since year end to tying to supporting documentation, such as shipping/receiving slips. Review the slips for dates and signatures.
Appendix C: September 13, 2018 – Day 2 Simulation and Marking Guides Page 123
• For the inventory at the Quebec warehouse: - Review documents from SPS’s year-end physical count now and compare them to the
perpetual inventory listing. Review any documents that would show evidence of controls put in place during the count, such as signing of count sheets, etc.
- To determine what was on hand at December 31, 2017, perform an inventory count now and perform rollback procedures by reviewing the shipments and receipts of inventory subsequent to year end, and vouching to supporting documentation.
Inventory from Bright acquisition
The inventory purchased as part of the net assets of Bright was counted on the date of acquisition by SPS, but the count was not attended by CPA LLP. The existence and completeness of this inventory should be verified as at October 4, 2017, as it might affect the purchase price allocation calculation. The total of the purchased inventory is greater than the revised materiality, and therefore should be audited for existence and completeness. Since this inventory relates to Bright, there may not be a perpetual inventory system for this inventory. We must therefore:
• Determine how the company tracks this inventory and check physical count sheets from the date of acquisition, comparing them to the inventory listing that was a part of the purchase agreement. To determine what was on hand at October 4, 2017, we should review activity subsequent to the date of acquisiton, as well as shipments and receipts of inventory, to work backwards.
• Identify personnel responsible for this inventory and ask if they are aware of inventory held in other locations or unrecorded or missing from the October 4, 2017, listing.
• Ensure that the inventory has been properly valued for the purchase price allocation calculation by vouching the fair value to appropriate support, such as current market values of the inventory researched online.
• Review for unrecorded transactions before the date of acquisition by selecting a sample of purchase invoices for inventory purchased several days prior to October 4, 2017, and ensuring that the amounts are recorded in inventory. For testing unrecorded transactions after the date of acquisition, we should select a sample of cost-of-sales entries several days after October 4 and ensure that the amounts were in inventory on October 4, 2017.
Valuation of Finished Goods
During the year, the cost of raw materials has declined, as have the selling prices for solar panels. Therefore, there is a high risk that the finished goods inventory has been over-stated.
The following audit procedures need to be completed.
Valuation – cost:
• Review the figures used to determine SPS’s cost of inventory, to ensure that the inventory cost has been correctly calculated and follows the first-in, first-out costing method. Ensure that the normal cost allocations have been applied for work-in-progress and finished goods.
Appendix C: September 13, 2018 – Day 2 Simulation and Marking Guides Page 124
• Review the appropriateness of the costing method used for the finished goods, including: - Determining whether costs have significantly increased or decreased during the year and
confirming whether it has the expected impact on cost of sales and inventory - Selecting a sample of items for testing and performing the following:
o Agree the material cost calculations to supplier invoices o Compare the labour rates used to the payroll records o Assess the reasonableness of the overhead rates used. Compare the rates used to
actual overhead in the accounting records.
Valuation – net realizable value:
• Inquire about any differences between cost and net realizable value and consider whether a write-down is necessary (e.g., Do particular products have a high risk of obsolescence? Is it a new product to the market? Are costs being recovered on sale?).
• To ensure that the inventory is at the lower of cost and NRV, select a sample of inventory items, and compare inventory cost to current price lists, customer contracts and prices used on sales after December 31, 2017.
For Assessment Opportunity #8 (Assurance), the candidate must be ranked in one of the following five categories: Not addressed – The candidate does not address this assessment opportunity. Nominal competence – The candidate does not attain the standard of reaching competence.
Reaching competence – The candidate provides some procedures to be performed over the inventory balance. Competent – The candidate provides several procedures to be performed over the inventory balance. Competent with distinction – The candidate provides most procedures to be performed over the inventory balance.
Assessment Opportunity #9 The candidate documents why using the work of the auditor’s expert is appropriate, and discusses additional procedures that would have to be performed in order to use the report. The candidate demonstrates DEPTH in the Assurance role.
Appendix C: September 13, 2018 – Day 2 Simulation and Marking Guides Page 125
Valuation Report by Auditor’s Expert
In October 2017, SPS purchased the net assets of Bright. CPA LLP decided to hire an expert to determine the fair value of some of Bright’s long-term assets. The fair values are used to allocate the consideration paid. CAS 620 – Using the work of an auditor’s expert outlines the specific requirements for using the work of an auditor’s expert. These requirements will need to be documented in the working papers.
Determining the need for an expert:
CPA LLP has already decided it will require an expert to obtain sufficient and appropriate audit evidence that the amounts recognized as the long-term assets purchased―Bright’s machinery and equipment, and software―are not materially misstated. We need to document the need for the expert. In this case, due to the nature and significance of the matter and its complexity, using an expert to assist with this is required. The valuations given to the long-term assets are all material and CPA LLP does not have the expertise to assess whether these amounts are reasonable. In addition, the risk of misstatement is high as the valuation of the items in question can be complex and these items in total represent $22,840,000 ($20,040,000 + $2,800,000), which is significantly higher than materiality, as is each asset individually. The allocation also has implications for the goodwill that will be recorded from the Bright acquisition and ongoing amortization and depreciation expenses.
Competence, capabilities and objectivity of the auditor’s expert:
CPA LLP has used this expert in the past, so we are aware of the competence and abilities of the expert. However, because this is a different engagement, the assessment needs to be completed again. The valuator, Penelope Lomas, has professional credentials as a Qualified Business Valuator and as a Qualified Asset Appraiser. Both these professions are accredited, requiring the passing of national exams and ongoing professional development. Ms. Lomas has over 15 years of experience as a valuator and significant experience in the alternative-energy sector. Therefore, Ms. Lomas appears to have the expertise for this engagement. The report stated that she does not have any stake, directly or indirectly, in the valuation calculations. This indicates that there is no interest or relationship that may hinder the expert’s objectivity.
Additional work to be performed on the report:
• Confirm that Ms. Lomas is in good standing with the Qualfiied Business Valuator and Qualified Asset Appraiser organizations.
• Obtain sufficient understanding of the field of expertise, to determine the scope and nature of the expert’s work and to evaluate the adequacy of that work for purposes of the audit.
• Make inquiries of the expert―the expert’s report outlines the scope of what was done and CPA LLP needs to discuss these further with the expert to understand the methodologies used.
• Review the expert’s assumptions, calculations and the supporting documentation that is provided in the report. CPA LLP should examine published data, if available, to corroborate (e.g., the market prices for the machinery and equipment).
Appendix C: September 13, 2018 – Day 2 Simulation and Marking Guides Page 126
• Perform analytical procedures and re-perform the calculations. Specifically, review and re-calculate the adjustments made to current market selling prices for age and performance of the machinery and equipment, and the cost to build the software from scratch.
• Assess the relevance and reasonableness of the expert’s findings by determining whether they are consistent with the values used by SPS. For example, we should compare the values provided by the expert to the values used by SPS to allocate the consideration paid for Bright’s net assets. If there are any major differences, these will have to be discussed with SPS’s management to determine the causes for the differences.
These audit procedures will allow CPA LLP to conclude as to whether the work is adequate and can be relied upon. For Assessment Opportunity #9 (Assurance), the candidate must be ranked in one of the following five categories: Not addressed – The candidate does not address this assessment opportunity. Nominal competence – The candidate does not attain the standard of reaching competence. Reaching competence – The candidate documents some reasons why using the work of the auditor’s expert is appropriate, or discusses some additional procedures to be performed. Competent – The candidate documents some reasons why using the work of the auditor’s expert is appropriate, and discusses some additional procedures to be performed. Competent with distinction – The candidate documents several reasons why using the work of the auditor’s expert is appropriate, and discusses several additional procedures to be performed. Assessment Opportunity #10 The candidate provides relevant audit procedures for the new, specific accounting issues identified by Jeremy. The candidate demonstrates DEPTH in the Assurance role. Bright Project Sales
As a result of the Bright acquisition, there is a new revenue stream. Since Project A is greater than materiality, it will be reviewed and tested. For the smaller contracts, a small sample of two to three will be selected and reviewed. The substantive tests for Project A and the sample of the smaller contracts to ensure occurrence, completeness, accuracy and cut-off are detailed as follows:
• Vouch the selected sample to the supporting contracts and any revisions made to these supporting contracts. Check for the date, contract amount and any unusual terms.
Appendix C: September 13, 2018 – Day 2 Simulation and Marking Guides Page 127

• Ensure that the budget summary of costs for each project is revised for any contract revisions. • Trace a sample of the billings in Cogna to the invoice and agree the amount to the contract.
Ensure that this has been posted to the accounts receivable ledger. • For Project A (in progress at year end), discuss the percentage-of-completion method used
by the project manager, how this is calculated, and whether the percentage is reflective of the stage of the project. Check that the calculation has been completed correctly.
• Also for Project A, audit the estimated costs to complete by discussing with the project manager, in order to understand the budgeting process. Also assess whether budgeted figures are accurate by reviewing prior budgeted information and comparing it to actual costs incurred.
• From Cogna, select a sample of actual material costs for each project under review. Trace the actual costs back to the supplier invoice or to the inventory requisition.
• For labour costs, select a sample of labour costs from the job costing ledger. Trace the labour costs back to supporting documentation, such as timesheets.
Warranty Provision and Related Warranty Expense
Due to a change in legislation, there is a new warranty provision. The steps to ensure occurrence/existence, completeness, and accuracy/valuation, for a sample of warranties, are as follows:
• Trace the sales invoices to the warranty records maintained and agree the invoice number, date, product number, warranty expiry date and quantity of panels sold.
• From the warranty records, select a sample of sales invoices and trace back to the original invoice. Again, agree the invoice number, date, product number, warranty expiry date and quantity of panels sold.
• Select a sample of warranty replacements made during November and December 2017. Trace back to the warranty claim (costs) and agree the product, number of panels replaced and original sales invoice.
• To assess the reasonability of the calculation used to determine the number of warranty claims predicted, examine the supporting documentation for the calculation of the historical rate of defect. Also review the supporting documentation for the cost-per-panel for 2017 used in calculating the warranty provision.
• Select a sample of sales invoices and warranty costs immediately before and after the year end and ensure that they have been correctly included or excluded from the year-end provision calculation.
Purchase of Net Assets of Bright
The acquisition of Bright is a significant event during the year and the existence and valuation of the assets, as well as the completeness of liabilities, need to be verified.
• Accounts receivable and accounts payable: - Although accounts receivable and accounts payable have been fully collected by year
end, the fair value of the accounts receivable and accounts payable at the time of acquisition could affect the amount of goodwill recorded.
Appendix C: September 13, 2018 – Day 2 Simulation and Marking Guides Page 128
- A sample of accounts receivable should be selected and vouched to subsequent cash receipt.
- A search for unrecorded liabilities should be performed by selecting a sample of subsequent payments to suppliers and reviewing the related invoice to ensure that, if it was a liability at the date of acquisition, it was appropriately recorded in accounts payable or accrued liabilities.
• Inventories: - See above for procedures to be performed on Bright’s inventory purchased.
• Machinery and equipment purchased and software: - As discussed earlier, the existence and valuation of the long-term assets at the acquisition
date can be verified by auditing the expert’s report. - In addition, we should inquire of management as to the estimated useful life of the assets,
and recalculate depreciation to ensure that it has been correctly recognized. • Goodwill:
- Goodwill is a new item and therefore CPA LLP will need to recalculate the amount initially recognized, to ensure that it is correct (this is done as part of the entry to record the purchase of net assets from Bright).
- Inquire of management as to whether there are any indicators of impairment. If there are indicators of impairment, ensure that management has performed a goodwill impairment test, obtain the related documents (e.g., future estimated cash flows), and review any assumptions used in the supporting documentation. If an impairment loss has arisen, check the calculation and ensure that it has been recognized and measured correctly.
New Robotic Equipment
Due to the revised depreciation calculation, the valuation of the robotic equipment and accuracy of the related depreciation expense should be reviewed:
• Check the invoice to ensure that the amounts allocated to the components are correct. • Check the calculation of the depreciation for each component by inquiring of management as
to the estimated useful lives of the components, and recalculating the depreciation based on these estimates. Verify the estimated useful lives against an external source, if possible, or at a minimum, corroborate the estimate with other SPS employees who would be knowledgeable about the useful lives of the robotic equipment.
• Check the residual value of the rest of the equipment by comparing it to similar equipment that SPS might have had previously and vouching to what the equipment would have been sold for at the end of its useful life.
• Check the accounting treatment for the spare parts by inquiring of management as to whether the parts will be used for more than one year, and how they are recorded in the general ledger.
Appendix C: September 13, 2018 – Day 2 Simulation and Marking Guides Page 129
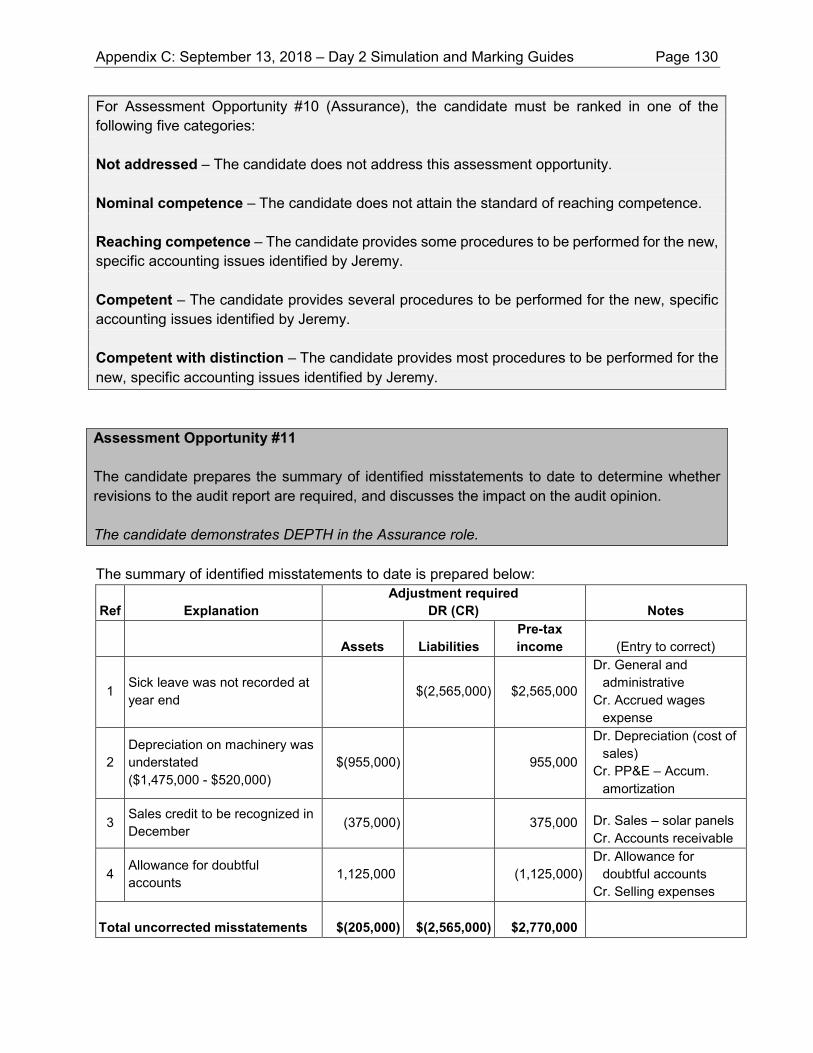
For Assessment Opportunity #10 (Assurance), the candidate must be ranked in one of the following five categories: Not addressed – The candidate does not address this assessment opportunity. Nominal competence – The candidate does not attain the standard of reaching competence. Reaching competence – The candidate provides some procedures to be performed for the new, specific accounting issues identified by Jeremy. Competent – The candidate provides several procedures to be performed for the new, specific accounting issues identified by Jeremy. Competent with distinction – The candidate provides most procedures to be performed for the new, specific accounting issues identified by Jeremy. Assessment Opportunity #11 The candidate prepares the summary of identified misstatements to date to determine whether revisions to the audit report are required, and discusses the impact on the audit opinion. The candidate demonstrates DEPTH in the Assurance role. The summary of identified misstatements to date is prepared below:
Ref Explanation Adjustment required
DR (CR) Notes
Assets Liabilities Pre-tax income (Entry to correct)
1 Sick leave was not recorded at year end
$(2,565,000) $2,565,000
Dr. General and administrative
Cr. Accrued wages expense
2 Depreciation on machinery was understated ($1,475,000 - $520,000)
$(955,000) 955,000
Dr. Depreciation (cost of sales)
Cr. PP&E – Accum. amortization
3 Sales credit to be recognized in December (375,000) 375,000 Dr. Sales – solar panels
Cr. Accounts receivable
4 Allowance for doubtful accounts 1,125,000 (1,125,000)
Dr. Allowance for doubtful accounts
Cr. Selling expenses Total uncorrected misstatements $(205,000) $(2,565,000) $2,770,000
Appendix C: September 13, 2018 – Day 2 Simulation and Marking Guides Page 130
Because there is a single misstatement that, on its own, is above materiality, in addition to the total of uncorrected misstatements being more than materiality, there is an impact on the audit opinion. To determine the type of modification required to the auditor’s report, we have to determine whether the misstatements are pervasive. According to CAS 705 – Modifications to the Opinion in the Independent Auditor’s Report:
.05 Pervasive effects on the financial statements are those that, in the auditor's judgment: (i) Are not confined to specific elements, accounts or items of the financial statements; (ii) If so confined, represent or could represent a substantial proportion of the financial
statements; or (iii) In relation to disclosures, are fundamental to users' understanding of the financial statements.
In addition:
7. The auditor shall express a qualified opinion when: (a) The auditor, having obtained sufficient appropriate audit evidence, concludes that misstatements, individually or in the aggregate, are material, but not pervasive, to the financial statements; or (b) The auditor is unable to obtain sufficient appropriate audit evidence on which to base the opinion, but the auditor concludes that the possible effects on the financial statements of undetected misstatements, if any, could be material but not pervasive.
8. The auditor shall express an adverse opinion when the auditor, having obtained sufficient appropriate audit evidence, concludes that misstatements, individually or in the aggregate, are both material and pervasive to the financial statements. 9. The auditor shall disclaim an opinion when the auditor is unable to obtain sufficient appropriate audit evidence on which to base the opinion, and the auditor concludes that the possible effects on the financial statements of undetected misstatements, if any, could be both material and pervasive.
In this case, there are several errors spanning many lines of the financial statements; it can be argued that these therefore represent a substantial portion of the financial statements. However, other than the sick leave error, which is above materiality on its own, the remaining errors net out to a relatively immaterial impact on total assets and net income ($205,000). Therefore, if the errors are not corrected, a qualified opinion should most likely be issued on SPS’s financial statements. As SPS is a public company and is unlikely to want a qualified or adverse opinion, we should discuss with management the potential impact of not making the proposed adjustments.
Note that, once the financial reporting proposed adjustments are also considered, this conclusion may change, depending on whether these adjustments are made by SPS.
Appendix C: September 13, 2018 – Day 2 Simulation and Marking Guides Page 131
In addition, if CPA LLP cannot be satisfied that the amount of inventory on hand at the year end actually existed and is complete, which is possible, given (a) the large amount of Bright inventory and the period of time that has passed since the acquisition, and (b) the large amount of finished goods inventory in the Quebec warehouse, where the inventory count was not attended by the auditor, CPA LLP should determine how the audit opinion may be affected. In this case, if sufficient audit evidence cannot be obtained for inventory, the amount would be material, but not pervasive (limited to several lines of the financial statements only), and therefore the opinion could be qualified. For Assessment Opportunity #11 (Assurance), the candidate must be ranked in one of the following five categories: Not addressed – The candidate does not address this assessment opportunity. Nominal competence – The candidate does not attain the standard of reaching competence. Reaching competence – The candidate attempts to prepare a summary of identified misstatements and discusses the impact on the audit opinion. Competent – The candidate prepares a reasonable summary of identified misstatements and discusses the impact on the audit opinion. Competent with distinction – The candidate prepares a thorough summary of identified misstatements and discusses the impact on the audit opinion. The candidate considers how not attending certain inventory counts at year end might affect the audit opinion. Assessment Opportunity #12 The candidate discusses the control weaknesses identified with Cogna and related processes, and makes recommendations to improve them. The candidate demonstrates DEPTH in the Assurance role. Lack of Training
Weakness: The IT manager (Josh) only sent out a user guide for Cogna to all users of the software and did not appear to provide any training.
Implication: New users are unlikely to be able to learn a completely new, proprietary software without receiving training from an expert. This can result in users not using the software correctly or not being aware of all the available functions of the software, leading to inefficiencies or errors in usage.
Appendix C: September 13, 2018 – Day 2 Simulation and Marking Guides Page 132
Recommendation: Josh should ensure that users receive formal training for Cogna, either in a classroom setting or individually. SPS should have a formal policy that training be provided for all new software implementations. In addition, the training should be offered on an ongoing basis, for new hires or existing employees who need to start using the software.
Super-User Account
Weakness: Because Cogna only allows for one super-user account, the entire IT team is using the same account when making software coding changes.
Implication: This does not allow for tracking of who has made what changes. As a result, unauthorized changes may be made without ever being able to track who made the change. In addition, it does not allow for a specific programmer’s access to be terminated should the programmer leave the company, which can result in unauthorized access.
Recommendation: SPS should see if Cogna can be re-programmed to allow for more than one super-user account; each programmer should then be given a separate login. If that is not possible, only one person (likely Josh) should have access to the super-user account, and all changes should be made by that person. Before making a change, that person should ensure that there is sufficient documentation surrounding what the change is, and why it should be implemented. To ensure segregation of duties, the approver should not be the same person who actually changes the programming in the software.
Review of Changes
Weakness: As Josh has not found any mistakes in the past and has become too busy, no one is reviewing the changes made to the software by the programmers.
Implication: Even if Josh has not found errors in the past, it does not mean that the programmers cannot make mistakes in the future. Any mistakes made would significantly impact the financial statements, as well as analysis made by project managers, leading to errors in decision making.
Recommendation: All changes in the software should be reviewed by someone before being implemented. Since Josh is currently too busy to do so, he should allocate some of his current work to other programmers to ensure he has time to perform the review. Alternatively, the programmers can review each others’ work.
Appendix C: September 13, 2018 – Day 2 Simulation and Marking Guides Page 133
Project Job Number
Weakness: Project job numbers are created by the project manager instead of by Cogna.
Implication: Since everyone has a different numbering system, it would be difficult to keep the listing of projects organized and prevent the creation of duplicate job numbers. It would also be difficult for the auditor or management to determine the completeness of any project job listing.
Recommendation: Every time a project manager starts a new project in the system, Cogna
should automatically create a new project job number. The numbering should be sequential (or some other logical structure) so that SPS can easily determine whether a project job listing is complete, and for easier organization of files.
Pre-Populated Customer Fields
Weakness: If a customer has been with Bright before, Cogna automatically populates details from a previous order, including the address, phone number, previous job description and previous budgeted costs.
Implication: While pre-populating some of the fields can be useful in order to prevent inputting errors, having fields such as the previous job description and previous budgeted costs pre-populated increases the risk of error, as a project manager may forget to delete or revise these fields, and therefore the information would be incorrect.
Recommendation: Fields that are expected to change from project to project should not be pre-populated. A better form of input controls would be to restrict the fields in some manner, so that, for example, the budgeted costs field would have numeric values only.
Cogna Transfer of Information into Accounting System
Weakness: The actual costs from Cogna, which are entered by project managers, are automatically transferred to the accounting system and the appropriate journal entry created and recorded. No one in the accounting department sees the entries.
Implication: As there is no review of the actual costs, project managers may make errors (intentionally or unintentionally) that would never be caught, creating errors in the financial statements.
Recommendation: The journal entry created should be reviewed by someone in the accounting department before it is recorded in the accounting system. Since the related documentation (e.g., invoices, timesheets) is sent to the department, the review should include matching of the actual costs with the supporting documentation.
Appendix C: September 13, 2018 – Day 2 Simulation and Marking Guides Page 134
Backup of System
Weakness: Backups are performed nightly and the existing backup file is overwritten.
Implication: While it is good practice to have nightly backups, overwriting of the existing file is not necessarily useful, since a backup may be needed from more than one day ago. For example, files that are accidentally deleted or corrupted may not be detected until several days later.
Recommendation: While not every nightly backup needs to be kept forever, there should be certain backups that are retained for the long term. For example, a schedule could be set up so that the most recent seven days are always retained, and a monthly backup is retained and archived for the time period beyond the most recent seven days.
For Assessment Opportunity #12 (Assurance), the candidate must be ranked in one of the following five categories:
Not addressed – The candidate does not address this assessment opportunity. Nominal competence – The candidate does not attain the standard of reaching competence. Reaching competence – The candidate discusses some of the internal control weaknesses. Competent – The candidate discusses several of the internal control weaknesses. Competent with distinction – The candidate discusses most of the internal control weaknesses.
Assessment Opportunity #13 The candidate explains what a review of interim financial statements is, including how it differs from an annual financial statement audit, and any first-time review considerations. The candidate provides alternatives to an interim financial statement review to address Jeremy’s concerns. The candidate demonstrates DEPTH in the Assurance role. Interim Financial Statement Review
Per Section 7060 – Auditor Review of Interim Financial Statements:
A6. The objective of a review of interim financial statements differs significantly from the objective of an audit of financial statements in accordance with generally accepted auditing standards. The objective of an audit is to enable the auditor to express an opinion on whether the financial statements are presented fairly, in all material respects, in accordance with the applicable financial reporting framework. An interim review does not provide a basis for the expression of such an opinion.
Appendix C: September 13, 2018 – Day 2 Simulation and Marking Guides Page 135
A7. An interim review performed by the auditor in accordance with this Section also differs in several essential respects from a review of historical financial statements performed by a practitioner in accordance with CSRE 2400.
(a) The purpose of the auditor's interim review is to assist the entity's audit committee in discharging its responsibilities for the review of the interim statements. The auditor's interim review report is intended solely for the audit committee. This is in contrast to the practitioner's review engagement report under CSRE 2400, which (unless the practitioner chooses otherwise) is normally unrestricted.
(b) Through performing the audit of the entity's annual financial statements, the auditor possesses (or must obtain) an understanding of the entity and its environment, including internal control, which the auditor updates through inquiries made in the course of the interim review. As well, when the auditor is engaged to review the interim financial statements, the frequency of the reviews enables the auditor to update the auditor's understanding of the entity and its environment on a continuing basis. A practitioner who is not the auditor of the entity does not normally have the same breadth and depth of understanding of the entity and its environment, including internal control. That practitioner might often carry out more or different inquiries, and other procedures, in performing a review in accordance with CSRE 2400 than might be required in an interim review under this Section.
(c) Regulatory deadlines for filing interim financial statements often require the auditor to obtain a basis to conclude on the interim financial statements within a much tighter timeframe than is often the case for reviews of historical financial statements under CSRE 2400.
There are several significant differences between an interim financial statement review and a year-end financial statement audit. Specifically for SPS, Jeremy can expect the following differences:
• Nature of procedures – While the procedures performed by the auditors for a year-end audit will include inspection, observation, confirmation, recalculation, re-performance and analytical procedures, the procedures associated with an interim review are typically inquiry, discussion, and analytical procedures. The timeline is typically very short for interim financial statements and therefore precludes management from developing information and documentation to the same extent as a year-end audit. Therefore, the auditor will allow a greater use of estimates for the interim financial statements. SPS can expect much more discussion of the financial statement line items, and fewer requests for supporting documentation from the auditors.
• Time required from SPS staff – Because of the nature of the procedures, SPS staff will spend less time preparing for the interim review (as less documentation is needed), and also less time addressing questions from the auditors while they are onsite, compared to a year-end audit. However, in aggregate throughout the year (when taking into account both interim reviews and the year-end audit), staff will likely end up spending more time than if there was only a year-end audit.
Appendix C: September 13, 2018 – Day 2 Simulation and Marking Guides Page 136
• Cost – As there is less work involved on the part of the auditor, the fees associated with the interim financial statement review will be substantially less than the year-end financial statement audit. In addition, you may find that the year-end audit fees may decrease as a result of the auditors being able to gain an understanding of the company’s significant transactions earlier in the year and leveraging that understanding during the audit.
• Use of auditor’s report – Unlike the year-end audit report, the interim review report is issued to the audit committee only and is not intended for public use. Therefore, SPS’s interim review report cannot be used for any other purpose. (However, in cases where a modified conclusion is required, to avoid being associated with false or misleading information, a written interim review report will be issued by the auditor.)
First time considerations
SPS should be made aware that, during the first several interim reviews, where comparatives for the statement of comprehensive income and statement of cash flows have not been audited or reviewed, a statement to that effect will be made in the auditor’s report (the statement of financial position would have comparatives from the year-end audit, and thus this does not apply for that part of the financial statements). If SPS would like the comparative figures reviewed as well, this would be an additional one-time cost for the company; however, it is unlikely that Jeremy will request this, given that his intention is to detect misstatements throughout the year.
In addition, given that the firm already audits the year-end financial statements, it may be able to leverage some of the work performed at year-end to reduce the costs related to the interim review, given that the firm already has an understanding of SPS and its operating environment.
Alternatives to an Interim Financial Statement Review
To address Jeremy’s concern that new, complex transactions may not be recorded properly and errors may not be detected until the year-end audit, there are several options available. The audit team can perform some planned interim fieldwork in advance of the year-end audit, reviewing significant, new, or complex transactions; alternatively, the audit team can be informed when new, significant transactions (such as the Bright acquisition) occur, and the auditing work on that particular transaction can be done shortly after the event. This has the advantage of likely being able to reduce audit work at year end, which can lessen the load on SPS staff during a very busy time of year, shifting that work to less busy times.
Appendix C: September 13, 2018 – Day 2 Simulation and Marking Guides Page 137
For Assessment Opportunity #13 (Assurance), the candidate must be ranked in one of the following five categories: Not addressed – The candidate does not address this assessment opportunity. Nominal competence – The candidate does not attain the standard of reaching competence. Reaching competence – The candidate attempts a reasonable discussion of an interim financial statement review and its alternatives. Competent – The candidate provides a reasonable discussion of an interim financial statement review and its alternatives. Competent with distinction – The candidate provides a thorough discussion of an interim financial statement review and its alternatives.
Appendix C: September 13, 2018 – Day 2 Simulation and Marking Guides Page 138
DAY 2 – MARKING GUIDE – FINANCE ROLE SOLAR PANEL SOLUTIONS INC. (SPS)
In the Finance role, the candidate is expected to prepare a capital budget for the solar farm investment, using an NPV analysis, and make a recommendation. The candidate is also asked to calculate the cost of capital using project financing and to discuss the advantages and disadvantages of using project financing for this investment.
The candidate is required to review the valuation of a tangible asset, the wind farm, to determine whether an offer should be accepted, and to discuss whether selling off a portion of the ownership in OWF might be more appropriate.
The candidate is also required to evaluate the implications of increasing the credit payment terms for SPS’s customers, and whether SPS should offer its largest customer a discount on early payment.
Finally, the candidate is to determine whether the cash on hand should be used to pay dividends, repurchase shares, or be saved for investment purposes. See Common Marking Guide for solution to Common Assessment Opportunities #1 to #5. Memo
To: Jeremy Whitman From: Finance CPA at Elite Re: Finance analysis Assessment Opportunity #6 The candidate quantitatively evaluates whether building SPS’s own solar farm is a viable investment by completing a capital budget using NPV. The candidate demonstrates DEPTH in the Finance role.
SPS was recently approached by Comcap Inc. (Comcap), who wants to enter into a purchase agreement to buy all the electricity that a solar farm, built and owned by SPS, will generate. You have asked for a recommendation as to whether you should advise SPS to make this investment
For this analysis, a net present value (NPV) is calculated using the 8% cost of capital provided. The related risks will then be discussed.
Appendix C: September 13, 2018 – Day 2 Simulation and Marking Guides Page 139
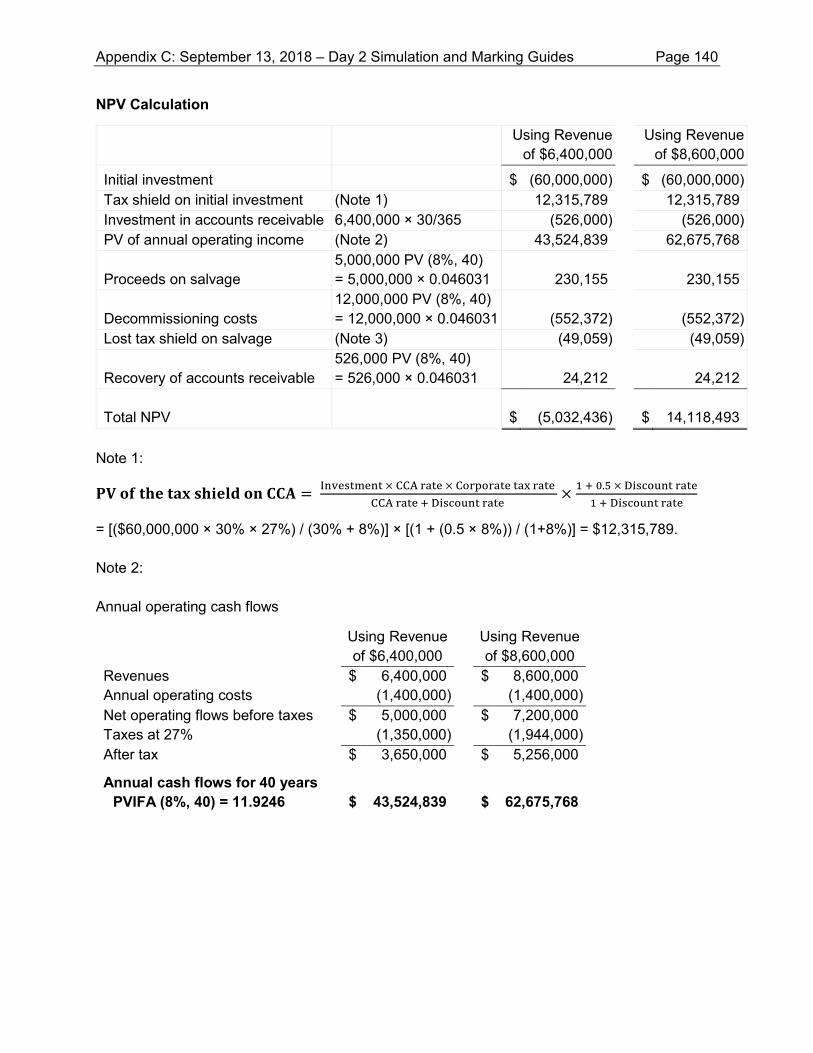
NPV Calculation
Using Revenue of $6,400,000
Using Revenue of $8,600,000
Initial investment $ (60,000,000) $ (60,000,000) Tax shield on initial investment (Note 1) 12,315,789 12,315,789 Investment in accounts receivable 6,400,000 × 30/365 (526,000) (526,000) PV of annual operating income (Note 2) 43,524,839 62,675,768
Proceeds on salvage 5,000,000 PV (8%, 40) = 5,000,000 × 0.046031
230,155
230,155
Decommissioning costs
12,000,000 PV (8%, 40)= 12,000,000 × 0.046031
(552,372)
(552,372)
Lost tax shield on salvage (Note 3) (49,059) (49,059)
Recovery of accounts receivable 526,000 PV (8%, 40) = 526,000 × 0.046031
24,212
24,212
Total NPV
$ (5,032,436)
$ 14,118,493
Note 1:
𝐏𝐕 𝐨𝐟 𝐭𝐡𝐞 𝐭𝐚𝐱 𝐬𝐡𝐢𝐞𝐥𝐝 𝐨𝐧 𝐂𝐂𝐀 = Investment × CCA rate × Corporate tax rate
CCA rate + Discount rate ×
1 + 0.5 × Discount rate
1 + Discount rate
= [($60,000,000 × 30% × 27%) / (30% + 8%)] × [(1 + (0.5 × 8%)) / (1+8%)] = $12,315,789. Note 2: Annual operating cash flows
Using Revenue of $6,400,000
Using Revenue of $8,600,000
Revenues $ 6,400,000 $ 8,600,000 Annual operating costs (1,400,000) (1,400,000) Net operating flows before taxes $ 5,000,000 $ 7,200,000 Taxes at 27% (1,350,000) (1,944,000) After tax $ 3,650,000 $ 5,256,000
Annual cash flows for 40 years PVIFA (8%, 40) = 11.9246
$ 43,524,839
$ 62,675,768
Appendix C: September 13, 2018 – Day 2 Simulation and Marking Guides Page 140
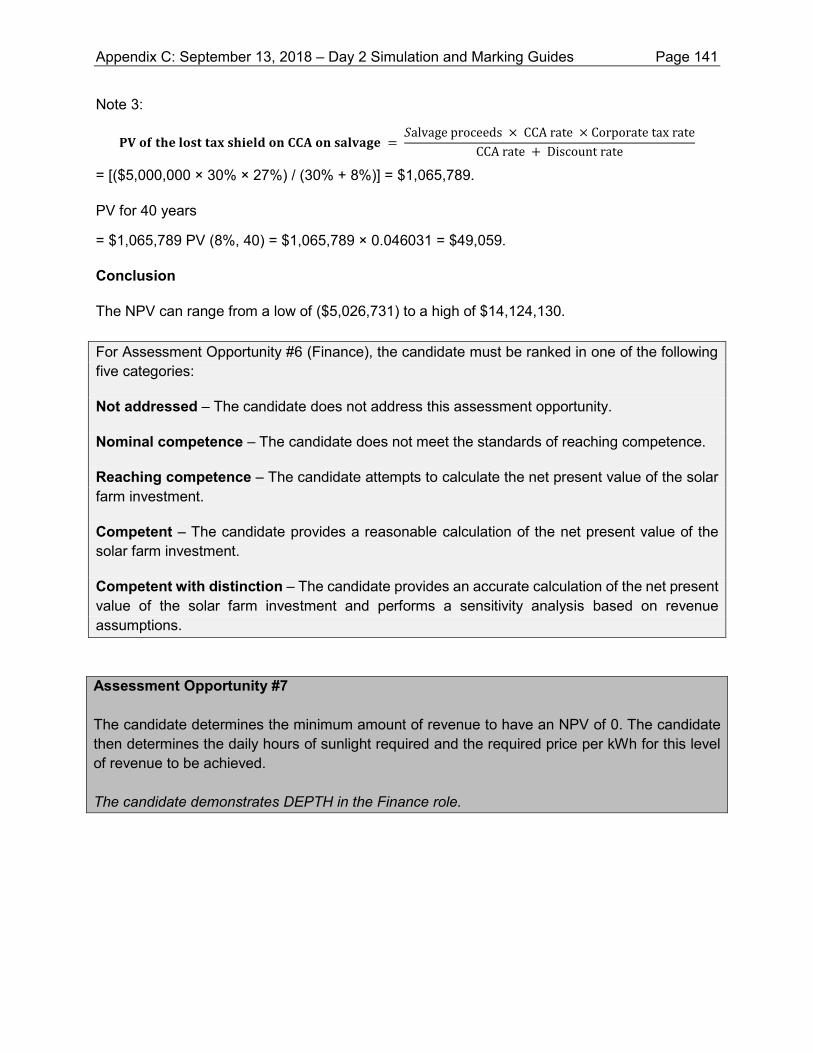
Note 3:
𝐏𝐕 𝐨𝐟 𝐭𝐡𝐞 𝐥𝐨𝐬𝐭 𝐭𝐚𝐱 𝐬𝐡𝐢𝐞𝐥𝐝 𝐨𝐧 𝐂𝐂𝐀 𝐨𝐧 𝐬𝐚𝐥𝐯𝐚𝐠𝐞 = 𝑆alvage proceeds × CCA rate × Corporate tax rate
CCA rate + Discount rate
= [($5,000,000 × 30% × 27%) / (30% + 8%)] = $1,065,789.
PV for 40 years
= $1,065,789 PV (8%, 40) = $1,065,789 × 0.046031 = $49,059.
Conclusion
The NPV can range from a low of ($5,026,731) to a high of $14,124,130. For Assessment Opportunity #6 (Finance), the candidate must be ranked in one of the following five categories:
Not addressed – The candidate does not address this assessment opportunity.
Nominal competence – The candidate does not meet the standards of reaching competence.
Reaching competence – The candidate attempts to calculate the net present value of the solar farm investment.
Competent – The candidate provides a reasonable calculation of the net present value of the solar farm investment.
Competent with distinction – The candidate provides an accurate calculation of the net present value of the solar farm investment and performs a sensitivity analysis based on revenue assumptions.
Assessment Opportunity #7 The candidate determines the minimum amount of revenue to have an NPV of 0. The candidate then determines the daily hours of sunlight required and the required price per kWh for this level of revenue to be achieved. The candidate demonstrates DEPTH in the Finance role.
Appendix C: September 13, 2018 – Day 2 Simulation and Marking Guides Page 141
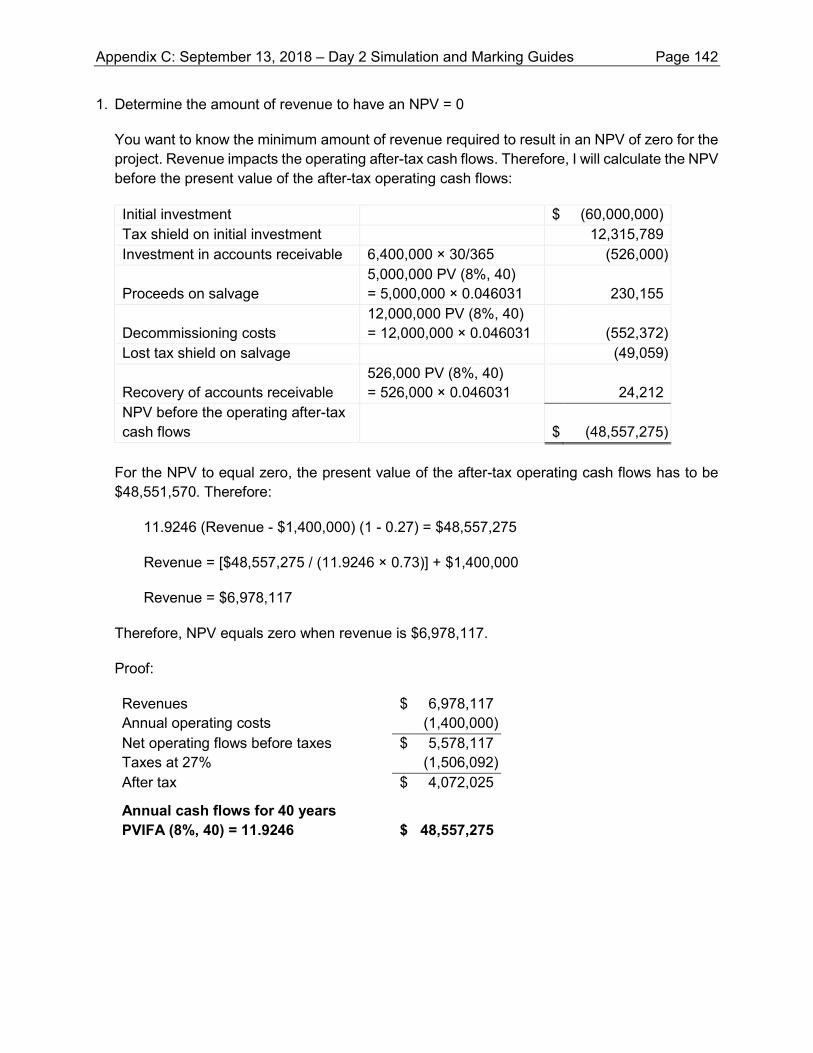
1. Determine the amount of revenue to have an NPV = 0
You want to know the minimum amount of revenue required to result in an NPV of zero for the project. Revenue impacts the operating after-tax cash flows. Therefore, I will calculate the NPV before the present value of the after-tax operating cash flows:
Initial investment $ (60,000,000) Tax shield on initial investment 12,315,789 Investment in accounts receivable 6,400,000 × 30/365 (526,000)
Proceeds on salvage 5,000,000 PV (8%, 40) = 5,000,000 × 0.046031
230,155
Decommissioning costs 12,000,000 PV (8%, 40) = 12,000,000 × 0.046031
(552,372)
Lost tax shield on salvage (49,059)
Recovery of accounts receivable 526,000 PV (8%, 40) = 526,000 × 0.046031
24,212
NPV before the operating after-tax cash flows
$ (48,557,275)
For the NPV to equal zero, the present value of the after-tax operating cash flows has to be $48,551,570. Therefore:
11.9246 (Revenue - $1,400,000) (1 - 0.27) = $48,557,275
Revenue = [$48,557,275 / (11.9246 × 0.73)] + $1,400,000
Revenue = $6,978,117
Therefore, NPV equals zero when revenue is $6,978,117.
Proof:
Revenues $ 6,978,117 Annual operating costs (1,400,000) Net operating flows before taxes $ 5,578,117 Taxes at 27% (1,506,092) After tax $ 4,072,025
Annual cash flows for 40 years PVIFA (8%, 40) = 11.9246
$ 48,557,275
Appendix C: September 13, 2018 – Day 2 Simulation and Marking Guides Page 142
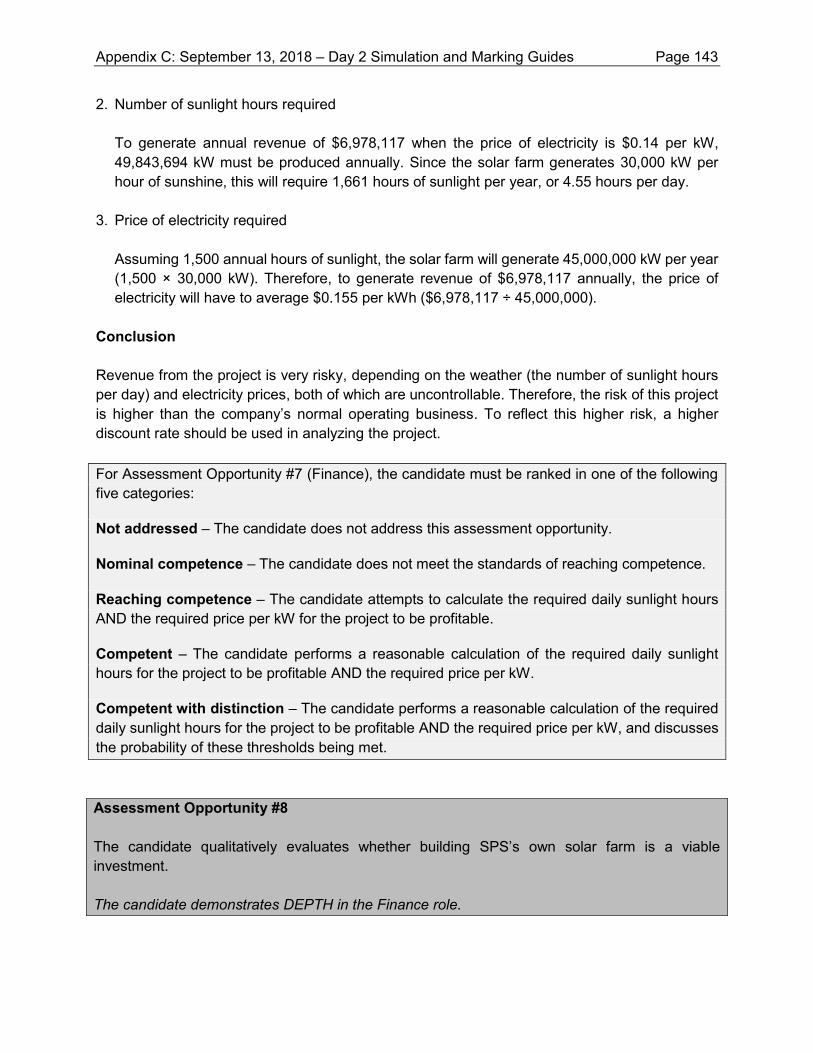
2. Number of sunlight hours required To generate annual revenue of $6,978,117 when the price of electricity is $0.14 per kW, 49,843,694 kW must be produced annually. Since the solar farm generates 30,000 kW per hour of sunshine, this will require 1,661 hours of sunlight per year, or 4.55 hours per day.
3. Price of electricity required
Assuming 1,500 annual hours of sunlight, the solar farm will generate 45,000,000 kW per year (1,500 × 30,000 kW). Therefore, to generate revenue of $6,978,117 annually, the price of electricity will have to average $0.155 per kWh ($6,978,117 ÷ 45,000,000).
Conclusion Revenue from the project is very risky, depending on the weather (the number of sunlight hours per day) and electricity prices, both of which are uncontrollable. Therefore, the risk of this project is higher than the company’s normal operating business. To reflect this higher risk, a higher discount rate should be used in analyzing the project. For Assessment Opportunity #7 (Finance), the candidate must be ranked in one of the following five categories:
Not addressed – The candidate does not address this assessment opportunity.
Nominal competence – The candidate does not meet the standards of reaching competence.
Reaching competence – The candidate attempts to calculate the required daily sunlight hours AND the required price per kW for the project to be profitable.
Competent – The candidate performs a reasonable calculation of the required daily sunlight hours for the project to be profitable AND the required price per kW.
Competent with distinction – The candidate performs a reasonable calculation of the required daily sunlight hours for the project to be profitable AND the required price per kW, and discusses the probability of these thresholds being met. Assessment Opportunity #8 The candidate qualitatively evaluates whether building SPS’s own solar farm is a viable investment. The candidate demonstrates DEPTH in the Finance role.
Appendix C: September 13, 2018 – Day 2 Simulation and Marking Guides Page 143
Qualitative Analysis
The following risks should be considered:
• SPS has never been involved in owning and maintaining a solar farm, or in billing customers based on kilowatts produced.
• SPS has not yet built a solar farm and, further, it is not clear if the wind farm expertise from OWF would translate to a solar farm.
• Electricity produced per day will be dependent on the number of sunlight hours and may therefore be volatile. Because revenue depends on electricity produced, this increases the risk of the project significantly.
• Revenue will also be impacted by the selling price of electricity. • If the electricity generated in a month is below a minimum threshold, SPS will be required to
pay a penalty. • It appears that this is SPS’s first involvement with Comcap. Because all revenue from this
project will come from Comcap, there is a risk that Comcap will be unable to purchase these levels of electricity on an ongoing basis. An analysis of Comcap’s financial situation should be undertaken prior to signing the contract.
• The agreement may be terminated with 90 days’ notice. If Comcap decides to terminate, SPS will need to find another buyer for the electricity. As this is a significant risk, it is strongly recommended that this be renegotiated before accepting the contract.
• As Comcap’s agreement is only for 10 years, there is a risk that the agreement will not be renewed at that time. However, SPS could then sell the electricity generated back to the electrical grid or find another customer.
• Installation costs may be higher than anticipated. However, SPS’s subsidiary, OWF, has expertise in building a wind farm and should therefore be able to provide a reasonable estimate of its costs.
• Operating costs may be higher than expected. Again, SPS’s subsidiary, OWF, has experience in this area and can likely make reasonable assumptions on costs.
• Inflation has not been incorporated into the NPV calculation for the operating costs, or into the price of kilowatts sold.
Conclusion
Because the expected NPV of the project is negative, and considering the magnitude of the risks involved in this project, SPS should not accept this proposal to build and operate a solar farm for Comcap.
Appendix C: September 13, 2018 – Day 2 Simulation and Marking Guides Page 144
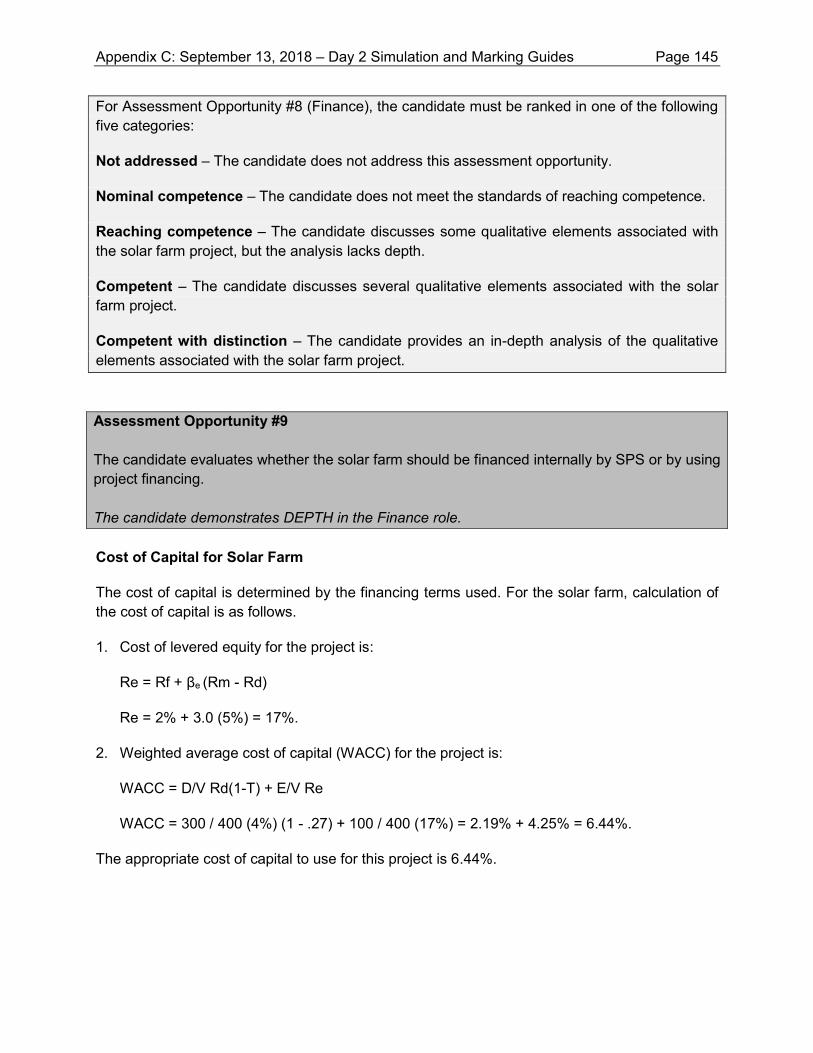
For Assessment Opportunity #8 (Finance), the candidate must be ranked in one of the following five categories:
Not addressed – The candidate does not address this assessment opportunity.
Nominal competence – The candidate does not meet the standards of reaching competence.
Reaching competence – The candidate discusses some qualitative elements associated with the solar farm project, but the analysis lacks depth.
Competent – The candidate discusses several qualitative elements associated with the solar farm project.
Competent with distinction – The candidate provides an in-depth analysis of the qualitative elements associated with the solar farm project. Assessment Opportunity #9 The candidate evaluates whether the solar farm should be financed internally by SPS or by using project financing. The candidate demonstrates DEPTH in the Finance role. Cost of Capital for Solar Farm
The cost of capital is determined by the financing terms used. For the solar farm, calculation of the cost of capital is as follows.
1. Cost of levered equity for the project is:
Re = Rf + βe (Rm - Rd)
Re = 2% + 3.0 (5%) = 17%.
2. Weighted average cost of capital (WACC) for the project is:
WACC = D/V Rd(1-T) + E/V Re
WACC = 300 / 400 (4%) (1 - .27) + 100 / 400 (17%) = 2.19% + 4.25% = 6.44%.
The appropriate cost of capital to use for this project is 6.44%.
Appendix C: September 13, 2018 – Day 2 Simulation and Marking Guides Page 145
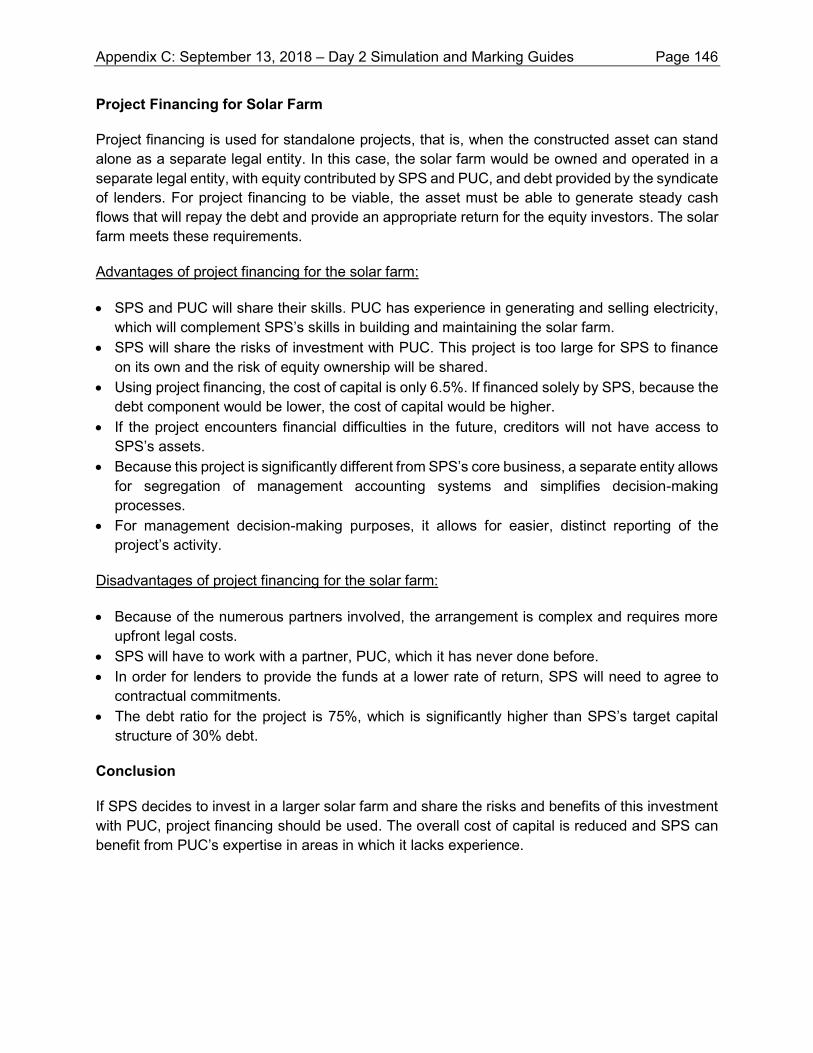
Project Financing for Solar Farm
Project financing is used for standalone projects, that is, when the constructed asset can stand alone as a separate legal entity. In this case, the solar farm would be owned and operated in a separate legal entity, with equity contributed by SPS and PUC, and debt provided by the syndicate of lenders. For project financing to be viable, the asset must be able to generate steady cash flows that will repay the debt and provide an appropriate return for the equity investors. The solar farm meets these requirements.
Advantages of project financing for the solar farm:
• SPS and PUC will share their skills. PUC has experience in generating and selling electricity, which will complement SPS’s skills in building and maintaining the solar farm.
• SPS will share the risks of investment with PUC. This project is too large for SPS to finance on its own and the risk of equity ownership will be shared.
• Using project financing, the cost of capital is only 6.5%. If financed solely by SPS, because the debt component would be lower, the cost of capital would be higher.
• If the project encounters financial difficulties in the future, creditors will not have access to SPS’s assets.
• Because this project is significantly different from SPS’s core business, a separate entity allows for segregation of management accounting systems and simplifies decision-making processes.
• For management decision-making purposes, it allows for easier, distinct reporting of the project’s activity.
Disadvantages of project financing for the solar farm:
• Because of the numerous partners involved, the arrangement is complex and requires more upfront legal costs.
• SPS will have to work with a partner, PUC, which it has never done before. • In order for lenders to provide the funds at a lower rate of return, SPS will need to agree to
contractual commitments. • The debt ratio for the project is 75%, which is significantly higher than SPS’s target capital
structure of 30% debt.
Conclusion
If SPS decides to invest in a larger solar farm and share the risks and benefits of this investment with PUC, project financing should be used. The overall cost of capital is reduced and SPS can benefit from PUC’s expertise in areas in which it lacks experience.
Appendix C: September 13, 2018 – Day 2 Simulation and Marking Guides Page 146
For Assessment Opportunity #9 (Finance), the candidate must be ranked in one of the following five categories:
Not addressed – The candidate does not address this assessment opportunity.
Nominal competence – The candidate does not meet the standards of reaching competence.
Reaching competence – The candidate provides a reasonable calculation of the proposed new entity's WACC OR provides a reasonable analysis of the benefits and drawbacks of the proposed project financing.
Competent – The candidate provides a reasonable calculation of the proposed new entity's WACC AND provides a reasonable analysis of the benefits and drawbacks of the proposed project financing.
Competent with distinction – The candidate provides an accurate calculation of the proposed new entity's WACC AND provides an in-depth analysis of the benefits and drawbacks of the proposed project financing. Assessment Opportunity #10 The candidate determines the value of a tangible asset, the wind farm, assuming that the construction is completed. The candidate demonstrates DEPTH in the Finance role. Last week, SPS received an offer of $20 million from Grain Farmers Co-op (GFC) for the assets of Ontario Wind Farms Inc. (OWF). You want to know the value of OWF to SPS and whether GFC’s offer should be accepted.
Discounted Cash Flow Valuation of OWF
Please see the next page for a calculation of the discounted cash flow.
Appendix C: September 13, 2018 – Day 2 Simulation and Marking Guides Page 147
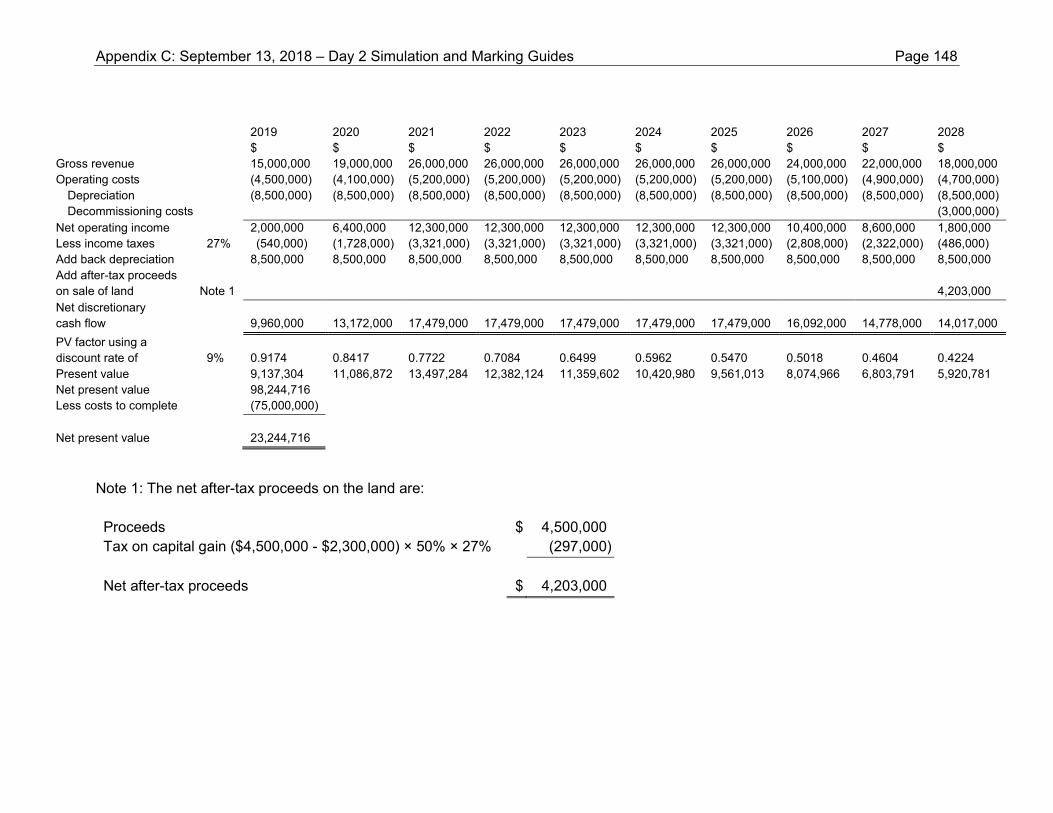
2019 2020 2021 2022 2023 2024 2025 2026 2027 2028
$ $ $ $ $ $ $ $ $ $ Gross revenue 15,000,000 19,000,000 26,000,000 26,000,000 26,000,000 26,000,000 26,000,000 24,000,000 22,000,000 18,000,000 Operating costs (4,500,000) (4,100,000) (5,200,000) (5,200,000) (5,200,000) (5,200,000) (5,200,000) (5,100,000) (4,900,000) (4,700,000)
Depreciation (8,500,000) (8,500,000) (8,500,000) (8,500,000) (8,500,000) (8,500,000) (8,500,000) (8,500,000) (8,500,000) (8,500,000) Decommissioning costs (3,000,000)
Net operating income 2,000,000 6,400,000 12,300,000 12,300,000 12,300,000 12,300,000 12,300,000 10,400,000 8,600,000 1,800,000 Less income taxes 27% (540,000) (1,728,000) (3,321,000) (3,321,000) (3,321,000) (3,321,000) (3,321,000) (2,808,000) (2,322,000) (486,000) Add back depreciation 8,500,000 8,500,000 8,500,000 8,500,000 8,500,000 8,500,000 8,500,000 8,500,000 8,500,000 8,500,000 Add after-tax proceeds on sale of land Note 1 4,203,000 Net discretionary cash flow 9,960,000 13,172,000 17,479,000 17,479,000 17,479,000 17,479,000 17,479,000 16,092,000 14,778,000 14,017,000 PV factor using a discount rate of 9% 0.9174 0.8417 0.7722 0.7084 0.6499 0.5962 0.5470 0.5018 0.4604 0.4224 Present value 9,137,304 11,086,872 13,497,284 12,382,124 11,359,602 10,420,980 9,561,013 8,074,966 6,803,791 5,920,781 Net present value 98,244,716 Less costs to complete (75,000,000) Net present value 23,244,716
Note 1: The net after-tax proceeds on the land are: Proceeds $ 4,500,000 Tax on capital gain ($4,500,000 - $2,300,000) × 50% × 27% (297,000) Net after-tax proceeds $ 4,203,000
Appendix C: September 13, 2018 – Day 2 Simulation and Marking Guides Page 148
The valuation, using a discounted cash flow approach, indicates that the value of the wind farm once the construction is complete at the end of 2018 is $23,244,716. If we present value this back by one more year, the present value today is $21,324,702 ($23,244,716 × 0.9174).
The offer received is $20 million, which is less than what OWF would be worth if SPS completed the project and operated it for its 10-year life. This indicates that the wind farm is currently worth more to SPS if it keeps it and invests the amount required to complete its construction.
Recommendation
SPS should not accept this offer, since it is lower than this tangible asset’s current value to SPS.
For Assessment Opportunity #10 (Finance), the candidate must be ranked in one of the following five categories:
Not addressed – The candidate does not address this assessment opportunity.
Nominal competence – The candidate does not meet the standards of reaching competence.
Reaching competence – The candidate uses the discounted cash flow approach to attempt a calculation of the value of OWF.
Competent – The candidate uses the discounted cash flow approach to perform a reasonable calculation of the value of OWF and compares it to the offer received.
Competent with distinction – The candidate uses the discounted cash flow approach to perform an accurate calculation of the value of OWF, compares it to the offer received and provides a useful recommendation. Assessment Opportunity #11 The candidate evaluates the issuance of enough OWF shares to make GFC a 25% shareholder. The candidate demonstrates DEPTH in the Finance role. Equity Carve-Out
The other alternative being considered is whether OWF should issue enough shares to give GFC a 25% ownership in OWF. The cash would be received by OWF directly, and GFC would own 25% of OWF. SPS, with 75% ownership, would still have control. OWF would remain consolidated for financial statement reporting purposes.
Appendix C: September 13, 2018 – Day 2 Simulation and Marking Guides Page 149
Since the funds would be injected in OWF, they would thereby increase its value. In order for GFC to obtain a 25% stake in OWF, the additional shares to be issued represent one-third of the current outstanding shares. For example, if OWF currently has 90 shares outstanding (all owned by SPS), an additional 30 shares would be issued for GFC to obtain a 25% interest in the company.
We have earlier determined that the current value of OWF is $23,244,716. An amount of $7,748,239 (1/3 of $23,244,716) should be requested for the issuance to GFC of the shares required for a 25% stake in OWF. As GFC would be a minority shareholder, it might request a minority discount, and expect to pay a little less than 25% of the value of the farm.
Implications
• OWF will receive cash inflows, which can help finance the $75 million required to complete the project.
• SPS could share the risks of the investment with GFC. • GFC owns and operates other wind farms and could therefore provide expertise in this area.
Other synergies might also arise from this joint ownership. • SPS will not have complete autonomy and there will be representatives of GFC on the board
of OWF. • As it will own more than 50% of the voting rights, SPS will continue to control the decisions
made in OWF. • GFC will be a minority shareholder in OWF and SPS will therefore have to deal with any issues
that might arise due to this relationship. The objectives of SPS and GFC may not be similar. • On the consolidated statements of SPS, there will be a non-controlling interest, for the 25%
not owned, that will show in the equity section of the balance sheet and will also be an allocation of the net earnings for the year.
• If SPS wants to divest more in the future, GFC might be a ready buyer for these shares.
Conclusion
If SPS still wants to retain ownership and control in the wind farm but would like assistance with the financing of the rest of the construction, it would be appropriate for OWF to issue new shares to GFC for 25% ownership. It would also be appropriate because GFC has experience in operating wind farms that SPS will otherwise need to learn.
Appendix C: September 13, 2018 – Day 2 Simulation and Marking Guides Page 150
For Assessment Opportunity #11 (Finance), the candidate must be ranked in one of the following five categories:
Not addressed – The candidate does not address this assessment opportunity.
Nominal competence – The candidate does not meet the standards of reaching competence.
Reaching competence – The candidate attempts a calculation of the amount received through the equity carve-out OR discusses the benefits and risks of the carve-out.
Competent – The candidate performs a reasonable calculation of the amount received through the equity carve-out AND discusses the benefits and risks of the carve-out.
Competent with distinction – The candidate performs an accurate calculation of the amount received through the equity carve-out AND discusses the benefits and risks of the carve-out in depth. Assessment Opportunity #12 The candidate evaluates the company's cash conversion cycle, and the impact of proposed changes in SPS's credit and discount policies, and provides a recommendation.
The candidate demonstrates DEPTH in Finance role. You asked for an analysis of the impact on the cash cycle and costs if SPS extends its credit payment terms to 60 days for its customers. You also want an assessment of whether to offer the new discount to SPS’s largest customer.
Impact of 60-Day Credit Terms
Note that this is for the solar panel sales; project sales are not part of the analysis.
Current cash cycle
The average collection period for 2017 (note that average balance was not used because sales changed significantly from 2016 to 2017) is:
= (Balance of accounts receivable ÷ Sales) × 365 days
= ($26,609 ÷ $277,500) × 365 days = 35 days.
Appendix C: September 13, 2018 – Day 2 Simulation and Marking Guides Page 151
The inventory period for 2017 is:
= (Balance of inventory ÷ Cost of sales) × 365 days
= ($43,754 ÷ $178,550) × 365 days = 89 days.
This is significantly higher than the industry average of 75 days.
The payables period for 2017 is:
= (Balance of accounts payable ÷ Cost of sales) × 365
= ($26,739 ÷ $178,550) × 365 days = 55 days.
This is lower than the industry average of 60 days.
The current cash cycle is: 35 + 89 - 55 = 69 days.
New cash cycle
If the credit terms are extended from 30 days to 60 days, this increases the cash cycle to:
60 + 89 - 55 = 94 days.
The cash cycle will increase by 25 days.
Cost of extending credit terms
The costs incurred to extend the credit payment period are:
Additional bad debts = (5.2% - 2.7%) × $277,500,000 = $6,937,500.
Additional financing costs if the company has to borrow on short-term credit
= $277,500,000 × (60 - 35) ÷ 365 × 4% = $760,274.
Additional financing costs on the additional bad debts (cost per year) = 4% × $6,937,500 = $277,500.
Total costs = $6,937,500 + $760,274 + $277,500 = $7,975,274.
Recommendation
SPS should try to increase its payment terms on its supplier payables to the industry average of 60 days and reduce its inventory period to the industry average of 75 days. With these changes, the revised cash cycle will be: 75 + 60 - 60 = 75 days. This will result in an increase of only five days in the cash cycle, rather than the 25 days that is anticipated with the extension of the receivables.
Appendix C: September 13, 2018 – Day 2 Simulation and Marking Guides Page 152
Since the bad debts are expected to increase by $6,937,500, SPS should tighten its review of customer accounts. Hiring some additional staff to monitor collection could reduce the bad debt expense, likely by more than the cost of the additional staff.
Discount to Largest Customer
The proposal is to offer SPS’s largest customer a 3% discount if the receivable is paid within 25 days. Sales to this customer average $7 million per year. If this change is implemented, it is assumed that the customer will take the full 60-day credit period to pay.
The after-tax cost of debt is used as the discount rate and equals 4% (1 - 0.27) = 2.92%.
Present value of the current policy
= $7,000,000 ÷ (1 + 0.0292)60/365 = $7,000,000 ÷ 1.00474 = $6,966,977.
Present value of the new policy
= $7,000,000 (1 - 0.03) ÷ (1 + 0.0292)25/365 = $6,790,000 ÷ 1.001973 = $6,776,630.
The discount period is calculated as a percentage of the year until the cash is collected.
Based on the above analysis, the present value of payment in 60 days is higher than offering the discount.
Therefore, the discount offer should not be made.
For Assessment Opportunity #12 (Finance), the candidate must be ranked in one of the following five categories:
Not addressed – The candidate does not address this assessment opportunity.
Nominal competence – The candidate does not meet the standards of reaching competence.
Reaching competence – The candidate attempts a calculation of the cash conversion cycle, costs associated with the changes in the credit policy, or costs associated with the proposed discount to its largest customer, or the candidate recommends improvements to the accounts receivable or cash conversion cycles.
Competent – The candidate performs a reasonable calculation of the cash conversion cycle, costs associated with the changes in the credit policy, or costs associated with the proposed discount to its largest customer, and the candidate recommends improvements to the accounts receivable or cash conversion cycles.
Competent with distinction – The candidate performs a reasonable calculation of the cash conversion cycle, costs associated with the changes in the credit policy, and costs associated with the proposed discount to its largest customer, and the candidate recommends improvements to the accounts receivable or cash conversion cycles.
Appendix C: September 13, 2018 – Day 2 Simulation and Marking Guides Page 153
Assessment Opportunity #13 The candidate evaluates the proposal to issue a dividend or to buy back shares, and the impact of these two alternatives on the company’s EPS. The candidate also assesses SPS’s implementation of the residual dividend policy going forward. The candidate demonstrates DEPTH in the Finance role. Quantitative Analysis
Dividend payout
If the available cash of $8,580,000 is paid as dividends, this will result in a dividend-per-share of $0.429 per share ($8,580,000 ÷ 20,000,000 shares). There is no impact on EPS.
Buy back shares
Given that the current share price is $25 per share, if shares are repurchased, $8,580,000 ÷ $25 = 343,200. The cash can buy back 343,200 shares. This represents only 1.7% (343,200 ÷ 20,000,000) of all the outstanding shares.
Using the revised net earnings, this will increase the basic EPS to $10,924,158 / (20,000,000 - 343,200) = $10,924,158 / 19,656,800 = $0.56, which is a very small increase from $0.55.
Qualitative Analysis
In deciding whether SPS should pay dividends, repurchase shares or keep the cash, the following factors should be considered:
• Legal restrictions – Does the company have any legal restrictions on paying dividends or buying back shares? Are there any covenants or other arrangements that restrict these payments?
• Liquidity – Does SPS have enough cash on hand to meet its current obligations? Based on the draft financial statements, the current ratio is 2.4 ($103,348 / $42,589). However, if all the cash on hand is used to pay a dividend or to repurchase shares, the current ratio will decline to 2.24 [($103,348 - 8,580) / $42,589], which still seems healthy. We would need to obtain industry benchmarks to fully assess this ratio. However, this will leave no cash on hand. The company would then have to borrow to meet its commitments.
• Earnings volatility – The last three years of earnings have been volatile, with significant declines from 2015 to 2017. If the company pays a dividend, there will be an expectation that the dividend will continue, unless this is declared as a special dividend.
• Internal financing – If all the cash is paid out, this leaves nothing on hand for investments. SPS would have to borrow more to make these investments, which will increase financing costs. The company should consider keeping the cash to use for these investments.
Appendix C: September 13, 2018 – Day 2 Simulation and Marking Guides Page 154
• Signalling with dividend payout – Usually a dividend increase (which is the case here, since the company has not paid dividends in the past) is interpreted as a positive signal and the share price increases. However, in this case, when there is turmoil in the industry, shareholders may not agree that cash should be paid out at this time but instead think it should be kept for new strategic investments that increase shareholders’ value. If SPS starts issuing dividends, and then stops, this could send signals of financial difficulties to the market and generate a drop in the stock price.
• Signalling with a share repurchase – A share repurchase is usually completed for any one of the following reasons: - The share price is low, and management believes that it is trading below its intrinsic value.
With the announcement of a share repurchase, it may be interpreted that the share price is low and may increase. However, given recent unfavourable events in the industry, this action may not be interpreted by shareholders positively. With only buying back 1.7% of the shares, this may not be enough to impact the share price.
- To alter the capital structure – This does not appear to be the case for SPS. - To consolidate ownership – This is likely not the case for SPS. The cash available will only
buy back 1.7% of shares. • Potential agency conflicts – Paying the cash out as dividends or repurchasing shares reduces
the amount of cash left that management could possibly allocate to poor investments. With less cash on hand, management is forced to invest its limited funds in good projects that will increase shareholders’ value. With a strong board, and with you pushing the board to take some action, this may not be significant for SPS.
Residual Dividend Policy
Step 1: Determine how much equity must be used to finance current capital projects
To maintain SPS’s debt-to-equity ratio, the capital investments must be financed with 30% debt and 70% equity. For a capital investment of $15 million, $10.5 million ($15,000,000 × 70%) must come from equity.
Step 2: Determine how much residual is left and available to pay as dividends
Using the net earnings from the draft financial statements, the residual left is $17,349,000 ($27,849,000 - $10,500,000). This means that only $8,580,000 could be paid out as dividends this year, which is all the cash on hand.
This would equate to $0.429 per share, as previously calculated.
Appendix C: September 13, 2018 – Day 2 Simulation and Marking Guides Page 155
Recommendation
The recommendation is that SPS not pay out a dividend or repurchase shares. The amount of cash available is better used in the company for new capital investments. Also, with the turmoil in the industry, the company might be better to maintain some cash as a cushion if sales decline further during 2018. If it does not need the cash immediately, it should consider achieving a return on this cash on hand by investing in short-term, low-risk bonds.
For Assessment Opportunity #13 (Finance), the candidate must be ranked in one of the following five categories:
Not addressed – The candidate does not address this assessment opportunity.
Nominal competence – The candidate does not meet the standards of reaching competence.
Reaching competence – The candidate attempts a calculation of the dividend that would be paid out using a residual dividend policy OR discusses the two proposed options to pay out the current cash balance to the shareholders.
Competent – The candidate attempts a calculation of the dividend that would be paid out using a residual dividend policy AND discusses the two proposed options to pay out the current cash balance to the shareholders.
Competent with distinction – The candidate attempts a calculation of the dividend that would be paid out using a residual dividend policy, discusses the two proposed options to pay out the current cash balance to the shareholders, and provides a useful recommendation.
Appendix C: September 13, 2018 – Day 2 Simulation and Marking Guides Page 156
DAY 2 – MARKING GUIDE – PERFORMANCE MANAGEMENT ROLE SOLAR PANEL SOLUTIONS INC. (SPS)
In the Performance Management role, the candidate is expected to assess the financial reporting issues identified by Jeremy and determine EPS. The candidate works for Jeremy and is to evaluate various alternatives in order to improve earnings, EPS, and ultimately, the share price.
The candidate is expected to prepare a SWOT analysis and discuss the operating environment and associated risks in the industry. Various other strategic and operating suggestions have been put forth which must be analyzed in the context of the results of the SWOT analysis.
Specifically, the candidate is to evaluate operating a solar farm for an IT company, Comcap Inc. (Comcap). From an operational perspective, the candidate is to assess a proposal to use independent contractors rather than its current in-house sales agents.
Finally, the candidate is to assess the current performance indicators being used and propose new ones. This then ties into a final discussion of the appropriate transfer pricing to be used between the various divisions. See Common Marking Guide for solution to Common assessment opportunities #1 to #5. Assessment Opportunity #6 The candidate evaluates SPS’s current operating environment using a SWOT analysis, and analyzes operating risks in the industry. The candidate demonstrates DEPTH in the Performance Management role.
Jeremy has requested a SWOT and risks analysis in order to understand the environment that SPS is operating in. Below is a summary of this analysis.
Strengths
• Elite owns 20% of SPS and can influence SPS to make decisions that align with Elite’s goals and mission.
• SPS purchased Bright and became vertically integrated, as it can now sell solar panel installations. Given that the solar panels alone are selling at very low prices, these new, value-added services will help to maintain or increase profits.
• Elite has experience in the energy industry that SPS can leverage, to improve operations and ensure that SPS is competitive.
• SPS has a strong R&D department that has produced high-efficiency panels and is currently working on products that will reduce its output of hazardous waste. This will keep SPS at the forefront of the industry, help maintain its market share, and lower manufacturing costs.
Appendix C: September 13, 2018 – Day 2 Simulation and Marking Guides Page 157
• SPS is currently in a good financial position with: a current ratio of 1.8, which means it has enough to cover short-term needs; gross profit of 39%, which is sufficient to cover its costs and generate a profit; times interest earned of 3.08, which means that SPS generates enough profits to cover its debt obligations.
• SPS’s solar panels have an efficiency rating of 23%, which is on the high side compared to the industry range of 15% to 25%; this gives their product a competitive advantage.
• The cost to produce panels has been declining, which will increase profits and help offset declining selling prices.
• Expansion into the wind-energy market with OWF will give SPS the opportunity to diversify its revenues beyond solar energy.
Weaknesses
• SPS’s share price has declined by 40% in the past six months. • SPS’s financial trends are troubling. While it is still profitable, everything is in decline. Sales
are decreasing and 2017 profits dropped by over 70% from 2016. The gross margin indicates that cost improvements are not keeping up with the price reductions demanded by the market.
• Staff are overworked and there is no controller, which increases the risk of misstatement in the financial statements.
• There is dissatisfaction with current performance measures at the manufacturing division production plants, which may be a disincentive for employees.
• Production managers are unhappy with the transfer price policy, which could impact their efficiency and their relationship with the sales division. They may focus more of their time and effort on selling externally rather than internally.
Opportunities
• The cost of polysilicon has been declining, which results in lower input costs and improved margins, or at least maintained margins, given the declining selling price in the market.
• Many competitors are also diversifying and investing in wind farms to generate another source of revenue not tied to the solar panel market. SPS just purchased a wind farm that is a construction-in-progress. If there is an increase in demand for wind-generated electricity, this will make the project more profitable and sustainable.
• Many governments are mandating that their public utilities produce a certain percentage of energy from renewable sources, which could result in higher demand for solar panels and wind power.
• To support their sustainability and environmental policies, many companies are moving toward the use of renewable energy sources. This again may increase demand for solar panels.
• The Comcap opportunity indicates that there may be more opportunities in the marketplace to operate solar farms on behalf of owners.
Appendix C: September 13, 2018 – Day 2 Simulation and Marking Guides Page 158
Threats
• The production of solar panels produces large amounts of hazardous waste. Disposal of this waste is regulated by the government and, if the government changes those regulations, it may have a negative impact on SPS.
• Solar power is very dependant on weather patterns, making it less attractive than other sources of energy.
• Capacity utilization for the industry has declined from 85% to 75%, indicating that all competitors are looking for methods to increase capacity utilization, or to add other value-added services.
• Prices are forecast to remain low for the foreseeable future. • Solar panels are homogenous, with little differentiation other than in efficiency ratings. There
is increased competition as peers try to gain an advantage in the market with higher efficiency-rated panels.
• This is a global industry, and China, with its low wage rate, is a very low-cost producer and the leader in the field; this has caused selling prices to decline. To remain competitive, SPS must keep improving costs or provide more value.
• Solar panel installations require a large upfront capital investment by customers, which may be a deterrent. In addition, governments have been reducing or eliminating financial incentives that were historically used to offset this capital investment.
• Large-scale installations are hindered by the need for large lots of land and, due to the reliance on sunlight, the unreliability of uninterrupted power. These disadvantages will hinder the demand for solar energy as a viable alternative to electricity.
Risk Analysis and Mitigation
Risk: If supply of polysilicon starts to decline, input costs may increase, which will result in even lower margins due to the low selling prices.
Mitigation: To lock in the price of polysilicon for a period of time, SPS should consider entering into a long-term supplier agreement.
Risk: Due to lower government support and continued oversupply, there is the risk of selling prices declining further as demand decreases. This would have serious negative financial implications for SPS.
Mitigation: To reduce its dependency on one sole source of revenue, SPS should continue moving to other sources of revenue―in particular, the design, engineering and installation of the solar panels. SPS will also need to continue to improve and differentiate their product and improve the efficiency of their operations, to maintain low costs.
Risk: Because of its high capital cost and need for large amounts of land, solar power may continue to cost more than conventional sources of energy.
Appendix C: September 13, 2018 – Day 2 Simulation and Marking Guides Page 159
Mitigation: SPS is developing solar panels that will produce more energy at a lower overall cost, making the total cost per kilowatt cheaper for the customer.
Risk: Regulations for hazardous waste production as part of the manufacturing process may increase or change, impacting its disposal and increasing costs.
Mitigation: SPS needs to continue to research methods to reduce the amount of hazardous waste produced. To stay informed of any impending regulation changes, SPS could also become actively involved with the appropriate government department.
Conclusion
Overall, the internal and external analysis indicates that the solar panel manufacturing and sales industry is facing many risks, which have impacted SPS’s net earnings for 2016 and 2017. In comparison to the industry, SPS seems to be doing well but earnings have declined substantially and the shareholders want this declining trend to stop.
However, there is an opportunity to expand vertically by building and selling solar panel installations. SPS has recently moved into this revenue stream. In addition, many competitors have built their own solar panel farms and now sell electricity directly to customers, which is another strategic opportunity for SPS to consider. Also, SPS purchased a wind farm under construction and therefore has this other strategic opportunity to assess.
Because the solar panel manufacturing industry looks unfavourable for the future, SPS’s immediate concern is to examine alternative sources of revenue and earnings. Specifically, SPS has several possible strategic opportunities to examine in order to increase shareholder value, increase the company’s share price and increase net earnings. It also has a variety of operational improvements that could be made to further increase net earnings and EPS.
For Assessment Opportunity #6 (Performance Management), the candidate must be ranked in one of the following five categories: Not addressed – The candidate does not address this assessment opportunity. Nominal competence – The candidate does not attain the standard of reaching competence. Reaching competence – The candidate attempts to complete a situational analysis. Competent – The candidate provides a reasonable situational analysis, including a risk assessment and mitigation. Competent with distinction – The candidate provides a balanced situational analysis, including a risk assessment and mitigation.
Appendix C: September 13, 2018 – Day 2 Simulation and Marking Guides Page 160
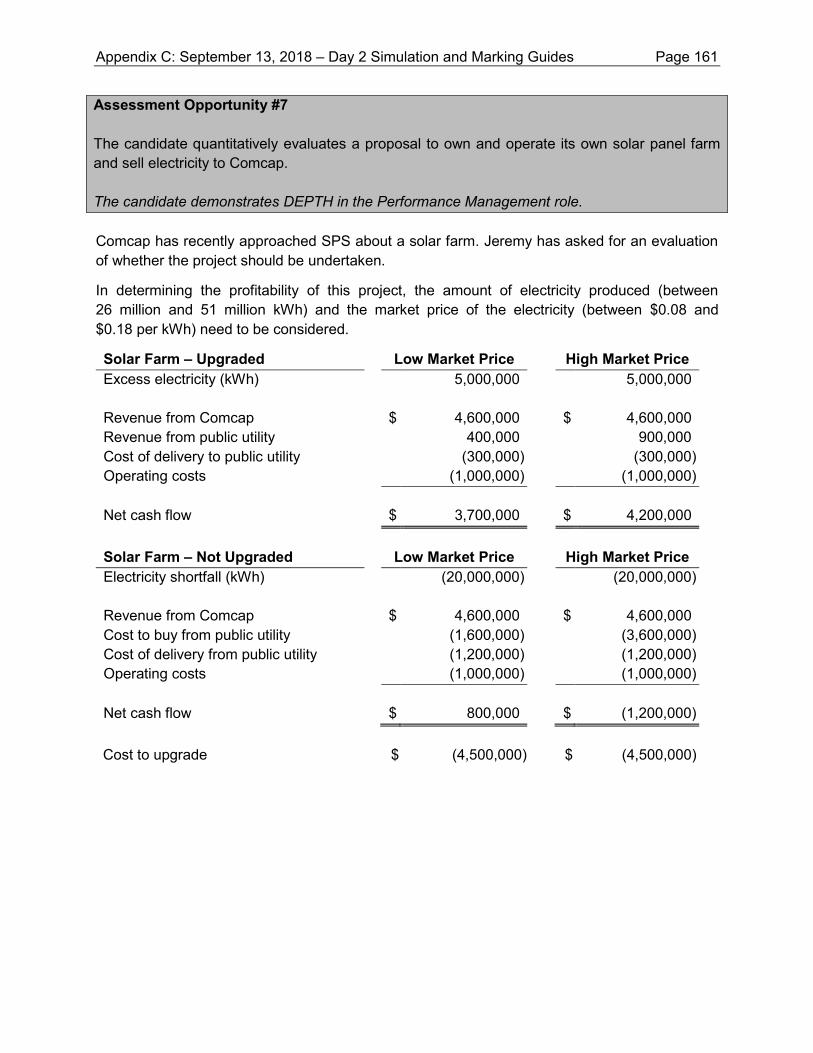
Assessment Opportunity #7 The candidate quantitatively evaluates a proposal to own and operate its own solar panel farm and sell electricity to Comcap. The candidate demonstrates DEPTH in the Performance Management role. Comcap has recently approached SPS about a solar farm. Jeremy has asked for an evaluation of whether the project should be undertaken.
In determining the profitability of this project, the amount of electricity produced (between 26 million and 51 million kWh) and the market price of the electricity (between $0.08 and $0.18 per kWh) need to be considered.
Solar Farm – Upgraded Low Market Price High Market Price Excess electricity (kWh) 5,000,000 5,000,000 Revenue from Comcap $ 4,600,000 $ 4,600,000 Revenue from public utility 400,000 900,000 Cost of delivery to public utility (300,000) (300,000) Operating costs (1,000,000) (1,000,000)
Net cash flow
$ 3,700,000
$ 4,200,000
Solar Farm – Not Upgraded Low Market Price High Market Price Electricity shortfall (kWh) (20,000,000) (20,000,000) Revenue from Comcap $ 4,600,000 $ 4,600,000 Cost to buy from public utility (1,600,000) (3,600,000) Cost of delivery from public utility (1,200,000) (1,200,000) Operating costs (1,000,000) (1,000,000)
Net cash flow
$ 800,000
$ (1,200,000) Cost to upgrade $ (4,500,000) $ (4,500,000)
Appendix C: September 13, 2018 – Day 2 Simulation and Marking Guides Page 161
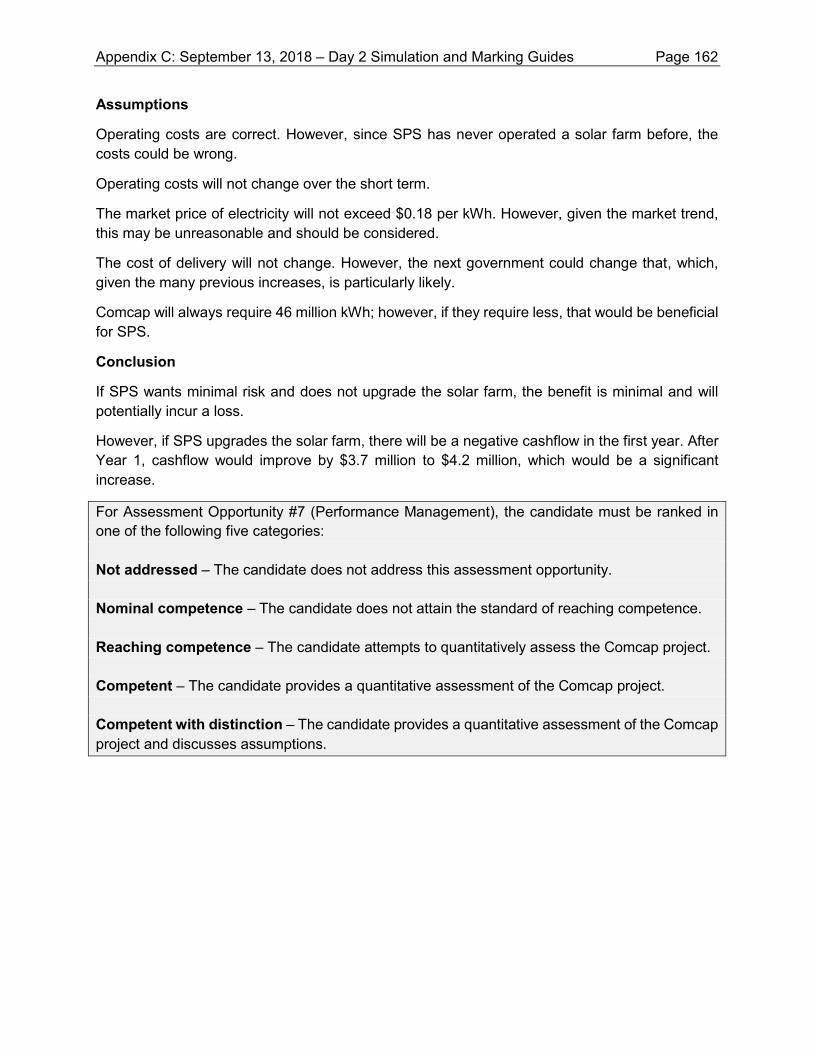
Assumptions
Operating costs are correct. However, since SPS has never operated a solar farm before, the costs could be wrong.
Operating costs will not change over the short term.
The market price of electricity will not exceed $0.18 per kWh. However, given the market trend, this may be unreasonable and should be considered.
The cost of delivery will not change. However, the next government could change that, which, given the many previous increases, is particularly likely.
Comcap will always require 46 million kWh; however, if they require less, that would be beneficial for SPS.
Conclusion
If SPS wants minimal risk and does not upgrade the solar farm, the benefit is minimal and will potentially incur a loss.
However, if SPS upgrades the solar farm, there will be a negative cashflow in the first year. After Year 1, cashflow would improve by $3.7 million to $4.2 million, which would be a significant increase.
For Assessment Opportunity #7 (Performance Management), the candidate must be ranked inone of the following five categories: Not addressed – The candidate does not address this assessment opportunity. Nominal competence – The candidate does not attain the standard of reaching competence. Reaching competence – The candidate attempts to quantitatively assess the Comcap project. Competent – The candidate provides a quantitative assessment of the Comcap project. Competent with distinction – The candidate provides a quantitative assessment of the Comcap project and discusses assumptions.
Appendix C: September 13, 2018 – Day 2 Simulation and Marking Guides Page 162
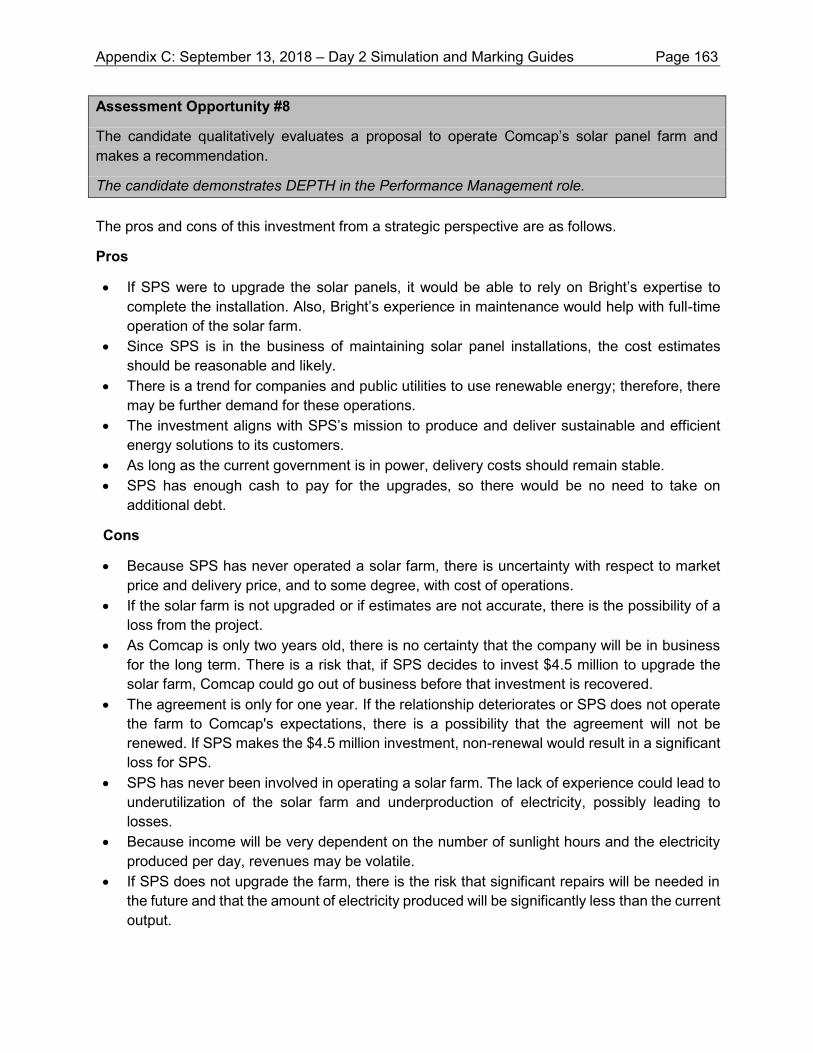
Assessment Opportunity #8
The candidate qualitatively evaluates a proposal to operate Comcap’s solar panel farm and makes a recommendation.
The candidate demonstrates DEPTH in the Performance Management role. The pros and cons of this investment from a strategic perspective are as follows.
Pros
• If SPS were to upgrade the solar panels, it would be able to rely on Bright’s expertise to complete the installation. Also, Bright’s experience in maintenance would help with full-time operation of the solar farm.
• Since SPS is in the business of maintaining solar panel installations, the cost estimates should be reasonable and likely.
• There is a trend for companies and public utilities to use renewable energy; therefore, there may be further demand for these operations.
• The investment aligns with SPS’s mission to produce and deliver sustainable and efficient energy solutions to its customers.
• As long as the current government is in power, delivery costs should remain stable. • SPS has enough cash to pay for the upgrades, so there would be no need to take on
additional debt.
Cons
• Because SPS has never operated a solar farm, there is uncertainty with respect to market price and delivery price, and to some degree, with cost of operations.
• If the solar farm is not upgraded or if estimates are not accurate, there is the possibility of a loss from the project.
• As Comcap is only two years old, there is no certainty that the company will be in business for the long term. There is a risk that, if SPS decides to invest $4.5 million to upgrade the solar farm, Comcap could go out of business before that investment is recovered.
• The agreement is only for one year. If the relationship deteriorates or SPS does not operate the farm to Comcap's expectations, there is a possibility that the agreement will not be renewed. If SPS makes the $4.5 million investment, non-renewal would result in a significant loss for SPS.
• SPS has never been involved in operating a solar farm. The lack of experience could lead to underutilization of the solar farm and underproduction of electricity, possibly leading to losses.
• Because income will be very dependent on the number of sunlight hours and the electricity produced per day, revenues may be volatile.
• If SPS does not upgrade the farm, there is the risk that significant repairs will be needed in the future and that the amount of electricity produced will be significantly less than the current output.
Appendix C: September 13, 2018 – Day 2 Simulation and Marking Guides Page 163
Conclusion
Based on the above analysis, SPS should accept this proposal to operate the solar farm for Comcap and upgrade the equipment. Solar panels are SPS’s area of expertise, which it should leverage.
If the farm is upgraded and the market price is at the high end of the range, there is a significant potential profit for SPS, which would make up for the declining sales and profitability from SPS’s current business line. It should increase shareholder value, resulting in an increase in share price.
However, before taking on this project, SPS needs to investigate the financial stability of Comcap to ensure that the company will be able to pay for the electricity; in order to recover the $4.5 million upgrade, the term of the agreement should be lengthened to at least two years.
If SPS decides not to upgrade the solar farm, it should perform a thorough assessment of the existing equipment to reduce the risk of having significant problems in the near future.
For Assessment Opportunity #8 (Performance Management), the candidate must be ranked in one of the following five categories: Not addressed – The candidate does not address this assessment opportunity. Nominal competence – The candidate does not attain the standard of reaching competence. Reaching competence – The candidate attempts a qualitative assessment of the solar farm project. Competent – The candidate provides a qualitative assessment of the solar farm project, with a recommendation. Competent with distinction – The candidate provides a thorough qualitative assessment of the solar farm project, with a recommendation, and attempts to mitigate the cons. Assessment Opportunity #9 The candidate evaluates current divisional performance indicators and makes recommendations for new ones. The candidate demonstrates DEPTH in the Performance Management role. Jeremy has asked for a review of SPS’s performance indicators, along with recommendations for possible improvements or any additional, appropriate indicators.
Appendix C: September 13, 2018 – Day 2 Simulation and Marking Guides Page 164
SPS’s manufacturing plant managers have complained that the current performance indicators are not fair as many are not within their control.
Current Performance Indicators
Net operating profit for the division
The net profit includes an administrative overhead charge that is allocated to the manufacturing division based on square footage. Since the manufacturing plant is likely to represent a significant portion of the total square footage used by the entire company, this division will have a higher administration charge than is likely appropriate. There should be no allocation of administrative overhead to measurement of the plant managers’ performance. Alternatively, if head office must allocate overhead, a better allocation could be based on number of employees or some other base that properly accounts for the administration time spent solely on production issues.
This measure could be improved by allocating an appropriate administrative overhead charge, and even by using an appropriate transfer price for the sale that is acceptable to the plant managers.
Total cost of goods sold as a percentage of sales
Ideally, this should be as low as possible and improve each year.
While this cost measurement appears to make sense, there are a lot of variables in the measure that the manager has no control over. For example, the selling price of the panels will dictate the percent. The cost of materials is set by the market, and encouraging cost reduction here could lower product quality. As designs continue to evolve and improve, the cost to make the panels could change.
As sales are declining, a better measure would be a cost per unit produced versus a flexible budget. Assuming the manufacturing plant managers would be a part of the budgeting process, the managers should be working towards budget. The managers could also be measured on labour efficiency variance or direct material usage variance.
Total annual volume produced as a percentage of 100% manufacturing capacity
(Normal downtime for maintenance reduces this by 10%.) This measure does not make sense because there is insufficient market demand and producing at 90% capacity would result in significant excess inventory. This would result in a waste of working capital, especially since the inventory could become obsolete quickly.
A better measure could be production compared to budget or to an inventory target.
Overtime paid to employees as a percentage of total wages
This should be as low as possible. As this is something within the plant managers’ control, this is a fair measurement as long as the overtime arises from production-related issues.
Appendix C: September 13, 2018 – Day 2 Simulation and Marking Guides Page 165
If, for example, the sales division has promised an unrealistic delivery schedule that the plant manager then has to incur overtime to meet, the plant manager has no control over this; therefore, this overtime should not be included in the measurement calculation.
Number of safety incident occurrences
This should be as low as possible. This is a valid measurement because the plant manager is responsible for safety. While this does not link to profit or cost, it is an important measure in order to remain in business, and because solar panel production creates hazardous waste.
Return on investment measured by net operating profit for the division divided by the total net book value of the plant assets
If the managers have no control over the assets of the plant, this would not be a fair measure. In addition, the plant managers do not have control over sales, so using operating profit is not fair either.
A better measure could be around the equipment maintenance expense. Alternatively, an output measure by piece of equipment may be more appropriate. For example, if a machine is expected to produce 1,000 units per year, the managers could be measured by their ability to ensure that the machine is capable of that production.
Additional performance indicators
The following additional performance indicators should be added:
Quality assurance – To ensure that quality and efficiency ratings are maintained, quality for the finished product must remain high. A measurement that incents managers to ensure high quality assurance is the percentage of production that meets quality testing levels, with a minimum level required. Another quality measure could be to minimize defective returns or to maintain them at a minimal level.
Waste reduction – Cost of wastage and rework caused by production issues should be measured, with incentives to keep these as low as possible. The volume of hazardous waste reduced in comparison to the previous year would also be a valid measurement.
Process improvement – In this competitive market, management should also be focused on improvements; cost improvements or process improvements could be put in place.
Conclusion
It appears that SPS is using some performance measures that are not controlled by the plant managers. The suggestions above provide a variety of performance indicators that will incent managers to take actions that will improve SPS’s overall corporate profits.
Appendix C: September 13, 2018 – Day 2 Simulation and Marking Guides Page 166
For Assessment Opportunity #9 (Performance Management), the candidate must be ranked in one of the following five categories:
Not addressed – The candidate does not address this assessment opportunity. Nominal competence – The candidate does not attain the standard of reaching competence. Reaching competence – The candidate attempts to critique the current performance measures.
Competent – The candidate critiques the current performance measures and attempts to provide new measures.
Competent with distinction – The candidate critiques the current performance measures and provides new measures.
Assessment Opportunity #10
The candidate evaluates the appropriate transfer price to be used with the manufacturing andsales divisions.
The candidate demonstrates DEPTH in the Performance Management role. Currently, the division managers’ bonuses are dependent on the profits of their division, which is based on a transfer price used. As a result, division managers will likely take actions that will improve their divisional income regardless of the impact on the company’s overall profit. The transfer price should be the price that will incent all managers to make decisions that will improve the company’s overall objectives.
The manufacturing managers are assessed on the division’s operating profit. As a result, the manufacturing division managers are motivated to charge the highest transfer price possible, which is not in the best interest of the sales division. When manufacturing was at capacity in 2015, it made sense to transfer product to the sales division at cost plus, but now that there is excess capacity, that is no longer sensible.
The sales manager is assessed on net profit, determined as sales to customers less transfer price paid for solar panels from manufacturing less all related selling costs. Therefore, the sales manager would want the lowest transfer price.
Each type of transfer price, and its implication, is discussed below.
Appendix C: September 13, 2018 – Day 2 Simulation and Marking Guides Page 167
Market Price
This is the highest transfer price, which would result in the highest net profit for the manufacturing division. However, as the net profit for the sales division would be negative once the selling costs were included in the calculation, this transfer price is not fair to the sales division. Therefore, market price is not an option.
Variable Cost Plus Profit
In 2015 and 2016, the sales department was charged a price that included profit; even though external sales were not substantial, this policy made sense because the plants were operating at or near capacity. This meant that there was a positive net profit on which the manufacturing managers’ bonuses were calculated.
From the sales division’s perspective, the variable cost plus profit would need to be low enough for them to achieve their profit target. With increasing pressure to lower prices, it is likely that the sales division’s profit is getting constricted; therefore, variable cost plus profit likely meant that they missed their target. If that was the case, the sales division would be motivated to seek external sales for solar panels in order to achieve their target.
Therefore, a policy of variable cost plus profit does not make sense for SPS.
Full Absorption Cost
The full absorption transfer price would exactly cover the manufacturing division’s cost of goods sold and all other related costs. This would result in the manufacturing division having a net profit of nil. As a result, the manufacturing managers would not receive any bonuses, which would lead to discouragement. At this price, they would be motivated to focus efforts on selling to outside customers rather than to the sales division.
At the full absorption transfer price, the low input cost will result in a higher net profit for the sales division.
Variable Cost
At the variable cost, which is the lowest of the transfer prices, the manufacturing division will end up at a loss because fixed costs will not be covered. This will result in no bonus for the plant managers, no matter what they do, and will lead to discouragement. Similar to the full absorption transfer price, the manufacturing managers would be motivated to sell externally.
At the variable cost transfer price, the input cost would be the lowest and the sales division would show its highest net profit.
Appendix C: September 13, 2018 – Day 2 Simulation and Marking Guides Page 168
Negotiated Price
Using this policy, the two divisions can negotiate a transfer price that is high enough to result in some profit for both divisions and can still incent them to sell and buy internally versus externally. This would likely be a price above full absorption cost.
Depending on the negotiating skills of the managers, this could work better for one division over the other. Using this policy may improve relationships between the two divisions or could make them worse. This policy would need support and oversight by upper management.
Conclusion
Although the manufacturing division sells externally, the ideal solution would be to reclassify it as a cost centre; it would consequently only be concerned with operational efficiency and arriving at the lowest cost while maintaining quality. As a cost centre, the manufacturing division’s bonuses would not be based on profit but on costs; therefore, they would not be concerned with transfer prices and upper management could use whatever transfer price they choose. This would motivate the manufacturing managers to focus on manufacturing and not on selling.
Ideally, so that all the manufacturing costs are covered, the transfer price should be the full absorption cost. The sales division would then use that cost to determine the selling price.
In addition, SPS could also make the sales division a revenue centre so that it just focuses on driving sales. Upper management can determine selling prices and target margins but the sales division, having no control over the cost of the solar panels, would not need to be concerned with margin or profit.
For Assessment Opportunity #10 (Performance Management), the candidate must be ranked in one of the following five categories:
Not addressed – The candidate does not address this assessment opportunity. Nominal competence – The candidate does not attain the standard of reaching competence. Reaching competence – The candidate attempts to discuss various transfer price policies.
Competent – The candidate discusses various transfer price policies and makes a reasonable recommendation.
Competent with distinction – The candidate discusses various transfer price policies, makes a reasonable recommendation and identifies the responsibility centre change for the manufacturing division.
Appendix C: September 13, 2018 – Day 2 Simulation and Marking Guides Page 169
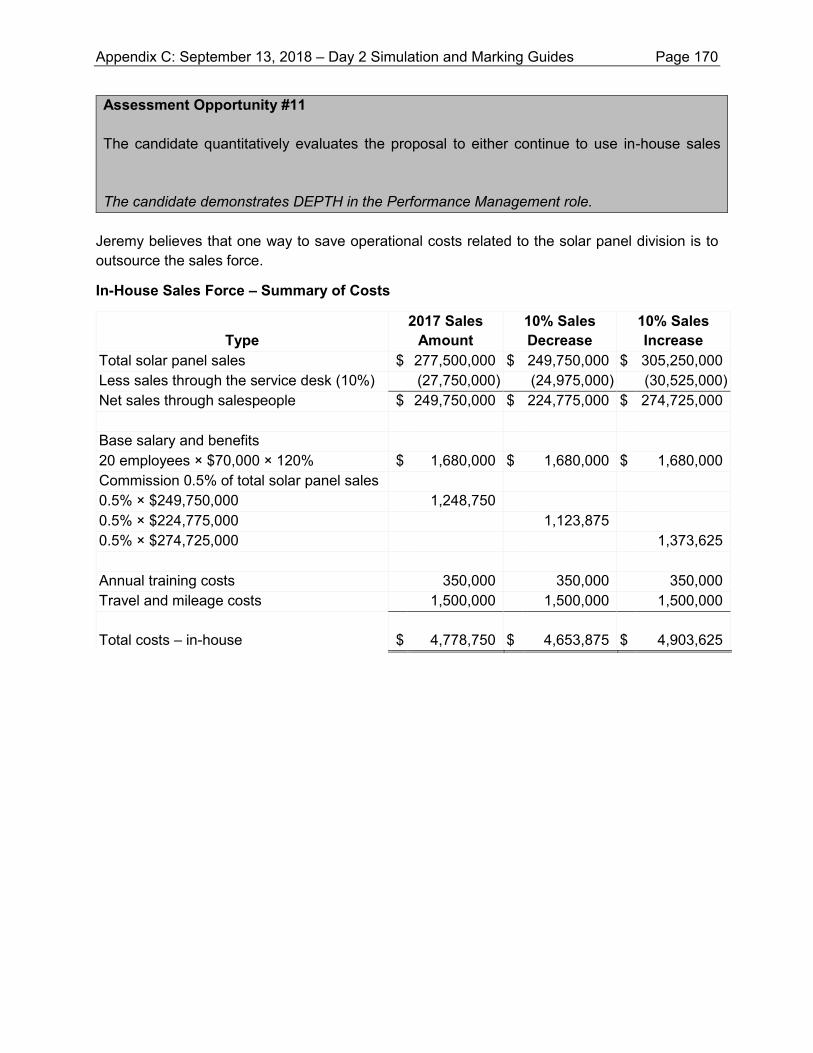
Assessment Opportunity #11 The candidate quantitatively evaluates the proposal to either continue to use in-house sales agents or to use independent contractors. The candidate demonstrates DEPTH in the Performance Management role.
Jeremy believes that one way to save operational costs related to the solar panel division is to outsource the sales force.
In-House Sales Force – Summary of Costs
Type 2017 Sales
Amount 10% Sales Decrease
10% Sales Increase
Total solar panel sales $ 277,500,000 $ 249,750,000 $ 305,250,000 Less sales through the service desk (10%) (27,750,000) (24,975,000) (30,525,000) Net sales through salespeople $ 249,750,000 $ 224,775,000 $ 274,725,000
Base salary and benefits 20 employees × $70,000 × 120% $ 1,680,000 $ 1,680,000 $ 1,680,000 Commission 0.5% of total solar panel sales 0.5% × $249,750,000 1,248,750 0.5% × $224,775,000 1,123,875 0.5% × $274,725,000 1,373,625
Annual training costs 350,000 350,000 350,000 Travel and mileage costs 1,500,000 1,500,000 1,500,000 Total costs – in-house
$ 4,778,750 $ 4,653,875 $ 4,903,625
Appendix C: September 13, 2018 – Day 2 Simulation and Marking Guides Page 170
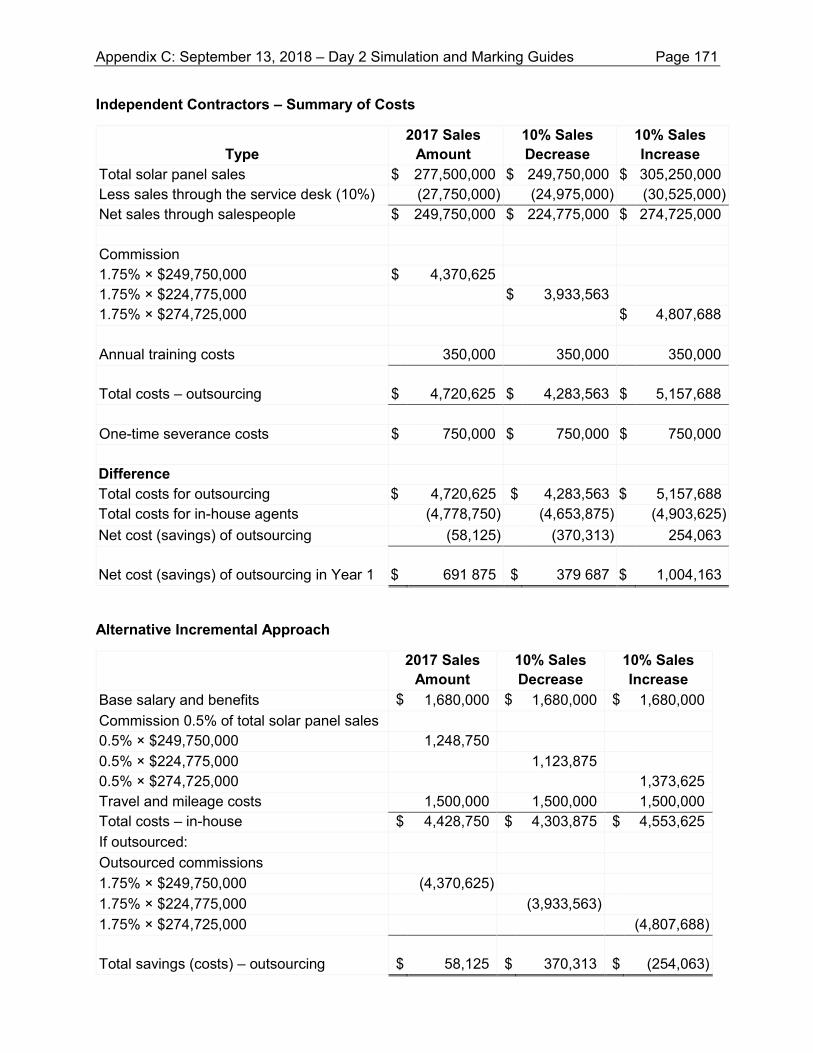
Independent Contractors – Summary of Costs
Type 2017 Sales
Amount 10% Sales Decrease
10% Sales Increase
Total solar panel sales $ 277,500,000 $ 249,750,000 $ 305,250,000 Less sales through the service desk (10%) (27,750,000) (24,975,000) (30,525,000) Net sales through salespeople $ 249,750,000 $ 224,775,000 $ 274,725,000
Commission 1.75% × $249,750,000 $ 4,370,625 1.75% × $224,775,000 $ 3,933,563 1.75% × $274,725,000 $ 4,807,688
Annual training costs 350,000 350,000 350,000 Total costs – outsourcing
$ 4,720,625
$ 4,283,563
$ 5,157,688
One-time severance costs $ 750,000 $ 750,000 $ 750,000 Difference
Total costs for outsourcing $ 4,720,625 $ 4,283,563 $ 5,157,688 Total costs for in-house agents (4,778,750) (4,653,875) (4,903,625) Net cost (savings) of outsourcing (58,125) (370,313) 254,063
Net cost (savings) of outsourcing in Year 1 $ 691 875
$ 379 687
$ 1,004,163
Alternative Incremental Approach
2017 Sales Amount
10% Sales Decrease
10% Sales Increase
Base salary and benefits $ 1,680,000 $ 1,680,000 $ 1,680,000 Commission 0.5% of total solar panel sales 0.5% × $249,750,000 1,248,750 0.5% × $224,775,000 1,123,875 0.5% × $274,725,000 1,373,625 Travel and mileage costs 1,500,000 1,500,000 1,500,000 Total costs – in-house $ 4,428,750 $ 4,303,875 $ 4,553,625 If outsourced: Outsourced commissions 1.75% × $249,750,000 (4,370,625) 1.75% × $224,775,000 (3,933,563) 1.75% × $274,725,000 (4,807,688)
Total savings (costs) – outsourcing $ 58,125
$ 370,313
$ (254,063)
Appendix C: September 13, 2018 – Day 2 Simulation and Marking Guides Page 171
Conclusion
If SPS’s sales force remains in-house and sales increase by 10%, SPS would save $254,063. If sales decrease by 10%, it would cost SPS $370,313 more versus outsourcing.
Due to the one-time $750,000 severance costs in the first year, it would cost SPS between $495,938 and $1,120,313 to outsource, dependant on the sales level.
If SPS expects sales to remain flat, outsourcing is close to its existing cost (lower by $58,125). However, given the trend of decreasing demand, it may make more financial sense to outsource. For Assessment Opportunity #11 (Performance Management), the candidate must be ranked in one of the following five categories: Not addressed – The candidate does not address this assessment opportunity. Nominal competence – The candidate does not attain the standard of reaching competence. Reaching competence – The candidate attempts to complete a quantitative analysis of the outsourcing option.
Competent – The candidate completes a quantitative analysis of the outsourcing option.
Competent with distinction – The candidate completes a quantitative analysis of the outsourcing option and recognizes the cost improvements after the first year.
Assessment Opportunity #12
The candidate qualitatively evaluates whether to continue to use in-house sales agents or to use independent contractors, and makes a recommendation.
The candidate demonstrates DEPTH in the Performance Management role. In addition to the quantitative analysis, there are many qualitative facts to consider.
Pros to Keeping In-House Sales Force • SPS’s currently trained sales staff should be seen as a competitive advantage as they win
about 75% of proposals compared to the industry average of 55%. • SPS only hires people with engineering experience for it sales staff. The outsourcing company
may not have as high a standard as SPS, which may result in lower sales and lower customer satisfaction.
Appendix C: September 13, 2018 – Day 2 Simulation and Marking Guides Page 172
• As it can dictate priorities, rectify problems, ensure consistency with all sales people and address customer concerns immediately, SPS has more control over the work performed. With an outsourced company, that may not be done as efficiently, especially as the outsourced sales people can sell other products.
• The training program appears to have given SPS a competitive advantage over its competitors. Assuming that SPS will be training the contractors, it may be giving up a competitive advantage.
• Now that SPS can sell the value-added services that came with the Bright acquisition, the sales people have more things to sell, and thus have a better chance to meet targets and increase their own income. This should help motivate the sales team and reduce turnover.
• Total costs are more consistent and certain with the lower sales commissions, which makes budgeting more accurate.
• By remaining in-house, SPS would not have to worry about terminated employees who might go to a competitor and take SPS customers with them.
• If outsourcing is not successful and the contract is not renewed, it will be difficult for SPS to hire and train new qualified salespeople quickly.
Cons to Keeping In-House Sales Force • Turnover has been high in the past two years, with four people leaving due to the industry
conditions and low sales. If the poor market conditions continue, there may be few experienced sales people remaining.
• Although targets for calls and revenue per month are stipulated, these have not been met in the past years and there are no consequences for the employee if targets are not met. It appears that SPS does not have much control over the sales people.
• 50% of a contractor’s commission will be paid within 30 days of the date of the invoice and the remaining 50% will be paid only on collection of the customer account. If the customer does not pay, the second payment will not be made. This will defer payments being made to the contractors and, if the customer never pays, only 50% of the commission earned is paid. Therefore, if SPS outsources, it will have a little less risk with accounts receivable.
• Contractors are responsible for travel and meals costs, so the administrative burden of tracking and reimbursing these expenses is eliminated with outsourcing.
Recommendation
The recommendation is that SPS continue with the in-house sales force. Although it is more expensive at the current level of 2017 sales to have in-house sales staff, SPS has more control over the sales process and will not lose two of its competitive advantages, those being a good sales force and excellent training program. With the recent acquisition of Bright, it will be important to be able to closely monitor and understand the sales of the value-added services and see whether the acquisition was favourable. This will be easier and more efficient with in-house sales people who are only focused on SPS.
Appendix C: September 13, 2018 – Day 2 Simulation and Marking Guides Page 173
If sales decrease, outsourcing is financially favourable in the long-term, especially after termination costs have been paid; if sales continue to deteriorate, SPS could revisit the outsourcing option in a few years.
For Assessment Opportunity #12 (Performance Management), the candidate must be ranked in one of the following five categories:
Not addressed – The candidate does not address this assessment opportunity.
Nominal competence – The candidate does not attain the standard of reaching competence. Reaching competence – The candidate attempts to complete a qualitative assessment of the outsourcing option. Competent – The candidate completes a qualitative assessment of the outsourcing option and provides a recommendation. Competent with distinction – The candidate completes a thorough qualitative assessment of the outsourcing option and provides a consistent, convincing recommendation.
Appendix C: September 13, 2018 – Day 2 Simulation and Marking Guides Page 174
DAY 2 – MARKING GUIDE – TAXATION ROLE SOLAR PANEL SOLUTIONS INC. (SPS)
In the Taxation role, the candidate is expected to prepare a calculation of the 2017 taxable income and taxes payable based on the revised financial statements.
The candidate is also expected to discuss acquisition of control of OWF. In addition, SPS has received an offer for the sale of OWF and the candidate is to address tax issues related to the sale of shares or assets of OWF.
A proposal has been made to outsource the solar panel sales force to independent contractors, and the candidate is required to assess the corporate and individual tax consequences of using independent contractors versus employees.
Finally, the tax candidate is to discuss how dividends received from a Canadian-controlled private corporation (CCPC) and SPS are taxed at the personal level, including a discussion of eligible and other-than-eligible dividends and a calculation of the gross-up and tax credits.
See Common Marking Guide for the Common Assessment Opportunities #1 to #5.
Memo To: Sheila LaRoche, Tax Partner From: Tax CPA Re: Tax analysis Assessment Opportunity #6 The candidate recalculates 2017 taxable income and taxes payable. The candidate demonstrates DEPTH in the Taxation role.
Appendix C: September 13, 2018 – Day 2 Simulation and Marking Guides Page 175
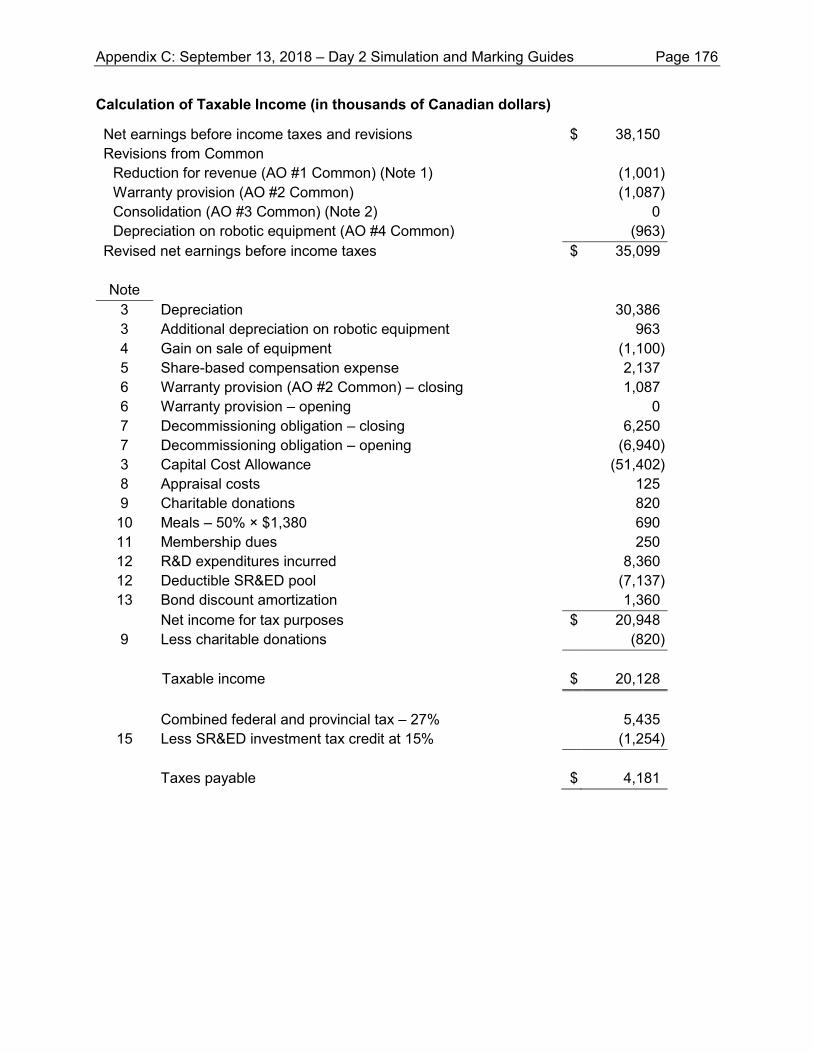
Calculation of Taxable Income (in thousands of Canadian dollars)
Net earnings before income taxes and revisions $ 38,150 Revisions from Common
Reduction for revenue (AO #1 Common) (Note 1) (1,001) Warranty provision (AO #2 Common) (1,087) Consolidation (AO #3 Common) (Note 2) 0 Depreciation on robotic equipment (AO #4 Common) (963)
Revised net earnings before income taxes $ 35,099 Note
3 Depreciation 30,386 3 Additional depreciation on robotic equipment 963 4 Gain on sale of equipment (1,100) 5 Share-based compensation expense 2,137 6 Warranty provision (AO #2 Common) – closing 1,087 6 Warranty provision – opening 0 7 Decommissioning obligation – closing 6,250 7 Decommissioning obligation – opening (6,940) 3 Capital Cost Allowance (51,402) 8 Appraisal costs 125 9 Charitable donations 820 10 Meals – 50% × $1,380 690 11 Membership dues 250 12 R&D expenditures incurred 8,360 12 Deductible SR&ED pool (7,137) 13 Bond discount amortization 1,360 Net income for tax purposes $ 20,948
9 Less charitable donations (820)
Taxable income $ 20,128
Combined federal and provincial tax – 27% 5,435
15 Less SR&ED investment tax credit at 15% (1,254)
Taxes payable
$ 4,181
Appendix C: September 13, 2018 – Day 2 Simulation and Marking Guides Page 176
For Assessment Opportunity #6 (Taxation), the candidate must be ranked in one of the following five categories: Not addressed – The candidate does not address this assessment opportunity. Nominal competence – The candidate does not attain the standard of reaching competence. Reaching competence – The candidate attempts to calculate the taxable income. Competent – The candidate provides a reasonable calculation of the taxable income and tax liability. Competent with distinction – The candidate provides a thorough calculation of the taxable income tax liability. Assessment Opportunity #7 The candidate discusses the adjustments to 2017 taxable income. The candidate demonstrates DEPTH in the Taxation role. Notes: 1. An analysis should also be done to determine if IFRS 15 revenue recognition standards are
consistent with tax laws; however, it is likely that they are, so no adjustment is proposed.
2. Consolidating on acquisition is simply a matter of reallocating assets and liabilities and therefore has no impact on income. The pending adjustments noted will not affect SPS’s taxable income; any adjustments for depreciation, amortization, or impairment will all be reversed for income tax purposes. Consolidation of OWF will need to be “undone” before preparation of SPS’s financial statements, but there has been zero income.
3. The depreciation expense is from Note 2 in Appendix II. Because it is an item on account of capital, depreciation is not deductible. Instead of accounting depreciation, SPS can claim capital cost allowance (CCA) on its assets. CCA is calculated in the schedule below.
4. The gain on sale is not taxable and is instead reconciled through the CCA class. Proceeds were less than cost so there is no capital gain (capital losses on depreciable property are not allowed by the Income Tax Act). The amount is from Note 2(a) in Appendix II.
5. The share-based compensation expense is not a deductible reserve under par. 18(1)(e). The
amount is from Note 7 in Appendix II.
Appendix C: September 13, 2018 – Day 2 Simulation and Marking Guides Page 177
6. The warranty provision is not a deductible reserve under par. 18(1)(e) but the actual warranty
expenses for the year are. Figures for this adjustment are from Common AO #2.
7. The decommissioning obligation is not deductible under par. 18(1)(e) but the actual expenses for the year are. There were no additions to the reserve, so changes represent payments of the obligation or accretion. Therefore, the net amount is adjusted through net income for tax purposes.
8. The appraisal costs (included in selling expenses – Appendix VIII) are capital items and cannot be expensed.
9. Charitable donations (included in selling expenses – Appendix VIII) are not deductible in determining net income for tax purposes but are deductible from taxable income within limits (s. 118.1). The limit is 75% of net income for tax purposes. The amount of these charitable contributions is less than 75% of net income for tax purposes and is therefore fully deductible.
10. Meals (included in selling expenses – Appendix VIII) – Only 50% is allowed as a deduction
under s. 67.1
11. Membership dues for the golf club (included in selling expenses – Appendix VIII) are not deductible under par. 18(1)(l).
12. Research and development expenditures all qualify for SR&ED treatment, according to the
information provided. Accordingly, the full amount of the expenditures should be added back into net income for tax purposes, and SPS would add these all to the SR&ED pool. Netted against this would be the prior year SR&ED credit received of $1,223 (included in income tax details – Appendix VIII). SPS may then deduct as much or as little of the pool as it likes; since there is still substantial income, I recommend deducting the entire balance.
13. Bond discount amortization on the convertible bond of $1,360 is not deductible under par. 20(1)(f).
14. An allowance paid at the mileage rate allowed by CRA (included in selling expenses –
Appendix VIII) is deductible. Based on the information provided, the rate paid by SPS is based on CRA’s prescribed rates and is therefore deductible. No adjustment is required.
15. All the research and development expenses qualify for the SR&ED investment tax credit. Therefore, the amount of this year’s credit is: $8,360 × 15% = $1,254.
Appendix C: September 13, 2018 – Day 2 Simulation and Marking Guides Page 178
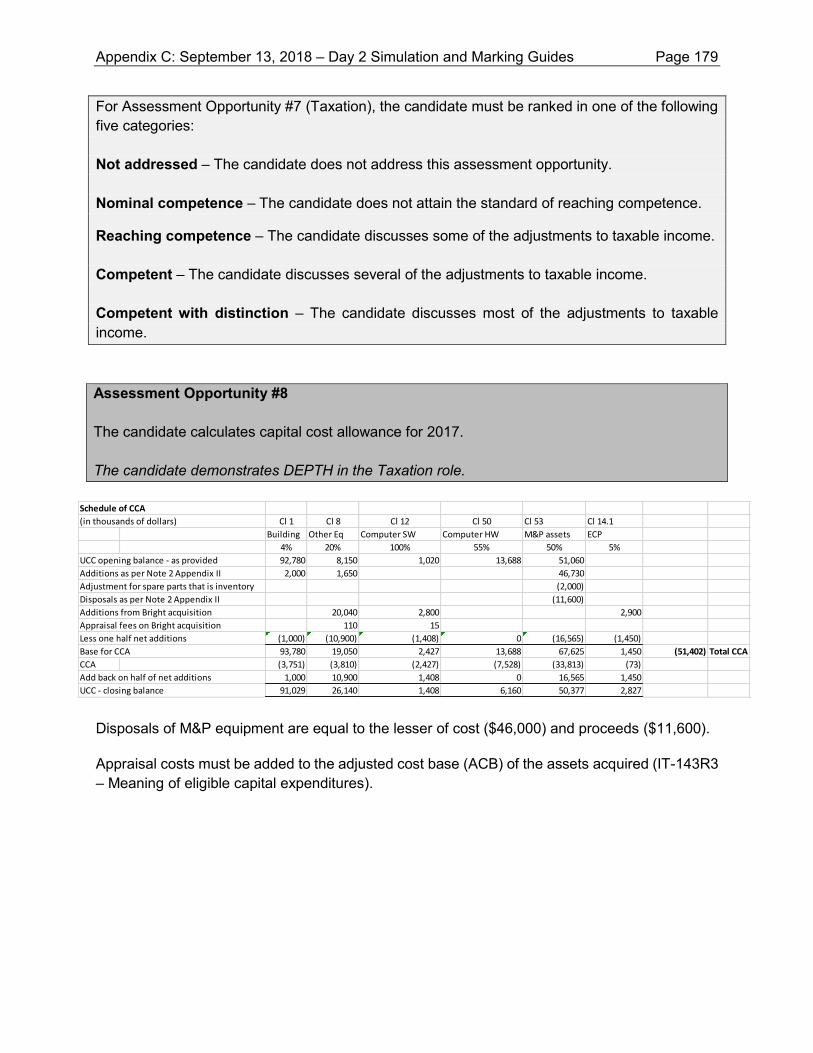
For Assessment Opportunity #7 (Taxation), the candidate must be ranked in one of the following five categories: Not addressed – The candidate does not address this assessment opportunity. Nominal competence – The candidate does not attain the standard of reaching competence.
Reaching competence – The candidate discusses some of the adjustments to taxable income. Competent – The candidate discusses several of the adjustments to taxable income. Competent with distinction – The candidate discusses most of the adjustments to taxable income. Assessment Opportunity #8 The candidate calculates capital cost allowance for 2017. The candidate demonstrates DEPTH in the Taxation role.
Disposals of M&P equipment are equal to the lesser of cost ($46,000) and proceeds ($11,600).
Appraisal costs must be added to the adjusted cost base (ACB) of the assets acquired (IT-143R3 – Meaning of eligible capital expenditures).
Schedule of CCA
(in thousands of dollars) Cl 1 Cl 8 Cl 12 Cl 50 Cl 53 Cl 14.1
Building Other Eq Computer SW Computer HW M&P assets ECP
4% 20% 100% 55% 50% 5%
UCC opening balance - as provided 92,780 8,150 1,020 13,688 51,060
Additions as per Note 2 Appendix II 2,000 1,650 46,730
Adjustment for spare parts that is inventory (2,000)
Disposals as per Note 2 Appendix II (11,600)
Additions from Bright acquisition 20,040 2,800 2,900
Appraisal fees on Bright acquisition 110 15
Less one half net additions (1,000) (10,900) (1,408) 0 (16,565) (1,450)
Base for CCA 93,780 19,050 2,427 13,688 67,625 1,450 (51,402) Total CCA
CCA (3,751) (3,810) (2,427) (7,528) (33,813) (73)
Add back on half of net additions 1,000 10,900 1,408 0 16,565 1,450
UCC - closing balance 91,029 26,140 1,408 6,160 50,377 2,827
Appendix C: September 13, 2018 – Day 2 Simulation and Marking Guides Page 179
For Assessment Opportunity #8 (Taxation), the candidate must be ranked in one of the following five categories: Not addressed – The candidate does not address this assessment opportunity. Nominal competence – The candidate does not attain the standard of reaching competence. Reaching competence – The candidate attempts to calculate the CCA deduction. Competent – The candidate calculates the CCA deduction. Competent with distinction – The candidate prepares a thorough calculation of the CCA deduction. Assessment Opportunity #9 The candidate discusses acquisition of control related to the purchase of OWF. The candidate demonstrates DEPTH in the Taxation role. Acquisition of Control Related to OWF On August 30, 2017, when SPS acquired all the shares of OWF, there was an acquisition of control of OWF. There are several tax rules that are applicable to this OWF acquisition: • Subsection 111(4) requires that OWF have a deemed year end on the day before the
acquisition of control. Therefore, OWF has a deemed year end on August 29, 2017 (the day before SPS acquired control of the shares), and corporate tax returns must be completed and filed.
• The deemed year end will impact CCA calculations; however, as the company has not yet claimed any CCA (and does not seem to intend to), this also has no immediate impact for OWF.
• Since the company has non-capital tax loss carryforwards of $250,000, a deemed year end will reduce the number of years left to use the loss carryforwards. However, with the 20-year loss carryforward period available, this will likely have no impact on OWF. The deemed year end will likely create a loss for tax purposes at August 29, 2017, which will increase this loss carryforward.
Appendix C: September 13, 2018 – Day 2 Simulation and Marking Guides Page 180
• The non-capital loss carryforwards can only be applied against income from the same, or a similar, business. They cannot be used against capital gains if OWF were to subsequently sell its assets. Because SPS carries on a different business, they also cannot be used, for example, by SPS if it were to wind up or amalgamate OWF. However, an argument could be made that wind electricity generation and solar power generation are similar businesses―if SPS were to start selling electricity itself, the profits of this could be offset by these losses.
• OWF also had net capital losses of $130,000. Paragraph 111(4)(a) states that any net capital losses that are present at the deemed year end are lost. Therefore, OWF will have no net capital losses to carry forward from this date onward.
• However, under par. 111(4)(e), OWF has the option to file an election to “bump” the cost basis of any of its assets up to their fair values. Since the cost basis of the land at the date of acquisition was $1.5 million and the fair value was $2.3 million, OWF could elect to increase its cost basis to $1,760,000―the election can be made at any amount between cost and fair value. This would trigger a $260,000 capital gain, and a $130,000 taxable capital gain, which would be completely offset by the net capital losses that are about to expire. This would be beneficial to OWF, and in turn to SPS, because when it ultimately sells the land, it will have a smaller gain to pay tax on.
• However, ss. 111(5.1) requires that any depreciable capital property be written down to its fair value when the fair value is less than its UCC. The UCC for the wind turbines under construction as at January 1, 2017, was $6,890,000. With the additions of $3,950,000 prior to the acquisition, this results in a UCC at August 29, 2017, of $10,840,000, which is greater than its fair market value of $10,290,000. Therefore, this UCC balance must be written down to $10,290,000; the difference of $550,000 is treated as CCA that will be deducted in the deemed taxation year. This will create a higher loss for tax purposes for the deemed year end and further increase the non-capital loss carryforward.
Similarly, if the shares of OWF are later sold, there will be another deemed year end at that date of sale. The same considerations addressed above will be applied on the day prior to the new owner acquiring control of the shares. For Assessment Opportunity #9 (Taxation), the candidate must be ranked in one of the following five categories: Not addressed – The candidate does not address this assessment opportunity. Nominal competence – The candidate does not attain the standard of reaching competence. Reaching competence – The candidate attempts a discussion of the acquisition of control. Competent – The candidate discusses the implications of the acquisition of control. Competent with distinction – The candidate discusses the implications of the acquisition of control and suggests a planning measure to minimize the impact.
Appendix C: September 13, 2018 – Day 2 Simulation and Marking Guides Page 181
Assessment Opportunity #10
The candidate discusses the sale of assets or shares of OWF. The candidate demonstrates DEPTH in the Taxation role.
Sale of Assets
If the assets are sold, as offered by GFC, proceeds of $20 million from the sale will be received by OWF. The proceeds are allocated as $2.4 million to the land and $17.6 million to the wind farm. OWF will pay taxes on this sale of assets, estimated as follows.
Taxable capital gain on sale of land:
No planning With 111(4)(e) bump Proceeds $ 2,400,000 $ 2,400,000 ACB $ 1,500,000 $ 1,760,000 Gain $ 900,000 $ 640,000 Taxable capital gain (50%) $ 450,000 $ 320,000
Proceeds on sale of wind farm: Wind farm UCC Cost UCC (equal to cost), Jan. 1 2017 $ 6,890,000 $ 6,890,000 Additions Jan. 1-Aug. 30 $ 3,950,000 $ 3,950,000 Deemed CCA, at acquisition of control $ (550,000) Additions Aug. 30-today $ 4,100,000 $ 4,100,000 UCC and cost, today $ 14,390,000 $ 14,940,000 Deduct lesser of cost and proceeds ($17.6M) $ (14,940,000) Ending balance after disposition $ (550,000) Becomes recapture Proceeds $ 17,600,000 ACB $ 14,940,000 Gain $ 2,660,000 Taxable capital gain (50%) $ 1,330,000
Appendix C: September 13, 2018 – Day 2 Simulation and Marking Guides Page 182
Total taxable income: Income: No planning With 111(4)(e) bump Land - taxable capital gain $ 450,000 $ 320,000 Wind farm - recapture $ 550,000 $ 550,000 Wind farm - taxable capital gain $ 1,330,000 $ 1,330,000 Non-capital loss carryforward $ (550,000) $ (550,000) Limited to business income Taxable income $ 1,780,000 $ 1,650,000 Tax rate 27% 27% Taxes payable on disposition $ 480,600 $ 445,500 As noted above, due to the acquisition of control, the losses are applicable only to income from the same or similar business. Accordingly, only the recapture may be offset by this.
Based on the numbers above, and assuming the par. 111(4)(e) bump was used, this would leave cash on hand of $19,554,500 ($20,000,000 - $445,500) in OWF.
This cash would then be used to repay SPS $16,439,000 for the intercompany payable, leaving $3,115,500 still on hand.
With this amount, SPS would wind up OWF into SPS. We assume that paid-up capital (PUC) is equal to $1,000, the net cost before the initial acquisition, which will yield a deemed dividend of $3,114,500. As it is an intercorporate dividend, the dividend would be received tax-free.
Since PUC is not equal to ACB, we need to determine a gain or loss on the disposition of the wound-up shares. Proceeds will be equal to the fair value minus the deemed dividend, being $1,000. ACB is equal to the $251,000 paid for the shares. This will yield a $250,000 capital loss, or $125,000 net capital loss. This loss, however, is ground down by the amount of tax-free dividend received under ss. 111(3), leaving no capital loss available.
On the windup of OWF into SPS, any of OWF’s non-capital losses still available (assuming they were not all used for the disposition as above) could be used in SPS, if SPS ever carries on a “similar business” as OWF, as noted above.
Under this scenario, SPS will ultimately have total cash on hand of $19,554,500 ($16,439,000 + $3,115,500).
Appendix C: September 13, 2018 – Day 2 Simulation and Marking Guides Page 183
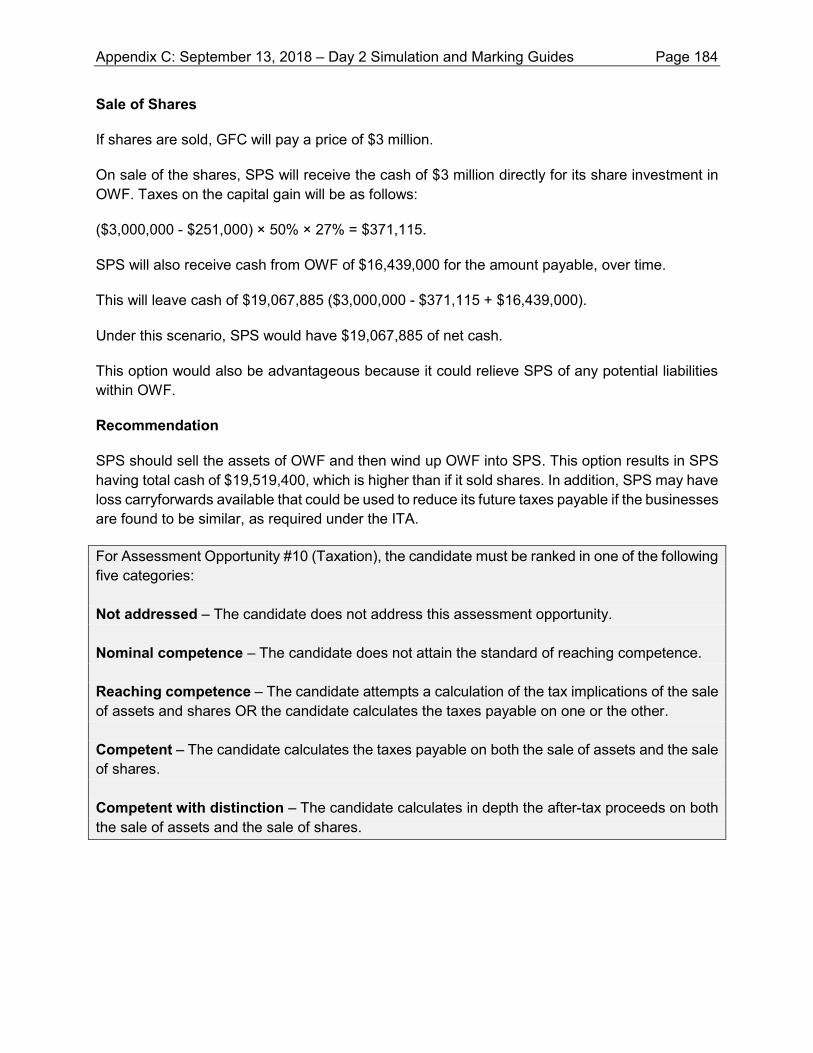
Sale of Shares
If shares are sold, GFC will pay a price of $3 million.
On sale of the shares, SPS will receive the cash of $3 million directly for its share investment in OWF. Taxes on the capital gain will be as follows:
($3,000,000 - $251,000) × 50% × 27% = $371,115.
SPS will also receive cash from OWF of $16,439,000 for the amount payable, over time.
This will leave cash of $19,067,885 ($3,000,000 - $371,115 + $16,439,000).
Under this scenario, SPS would have $19,067,885 of net cash.
This option would also be advantageous because it could relieve SPS of any potential liabilities within OWF.
Recommendation
SPS should sell the assets of OWF and then wind up OWF into SPS. This option results in SPS having total cash of $19,519,400, which is higher than if it sold shares. In addition, SPS may have loss carryforwards available that could be used to reduce its future taxes payable if the businesses are found to be similar, as required under the ITA.
For Assessment Opportunity #10 (Taxation), the candidate must be ranked in one of the following five categories: Not addressed – The candidate does not address this assessment opportunity. Nominal competence – The candidate does not attain the standard of reaching competence. Reaching competence – The candidate attempts a calculation of the tax implications of the sale of assets and shares OR the candidate calculates the taxes payable on one or the other. Competent – The candidate calculates the taxes payable on both the sale of assets and the sale of shares. Competent with distinction – The candidate calculates in depth the after-tax proceeds on both the sale of assets and the sale of shares.
Appendix C: September 13, 2018 – Day 2 Simulation and Marking Guides Page 184
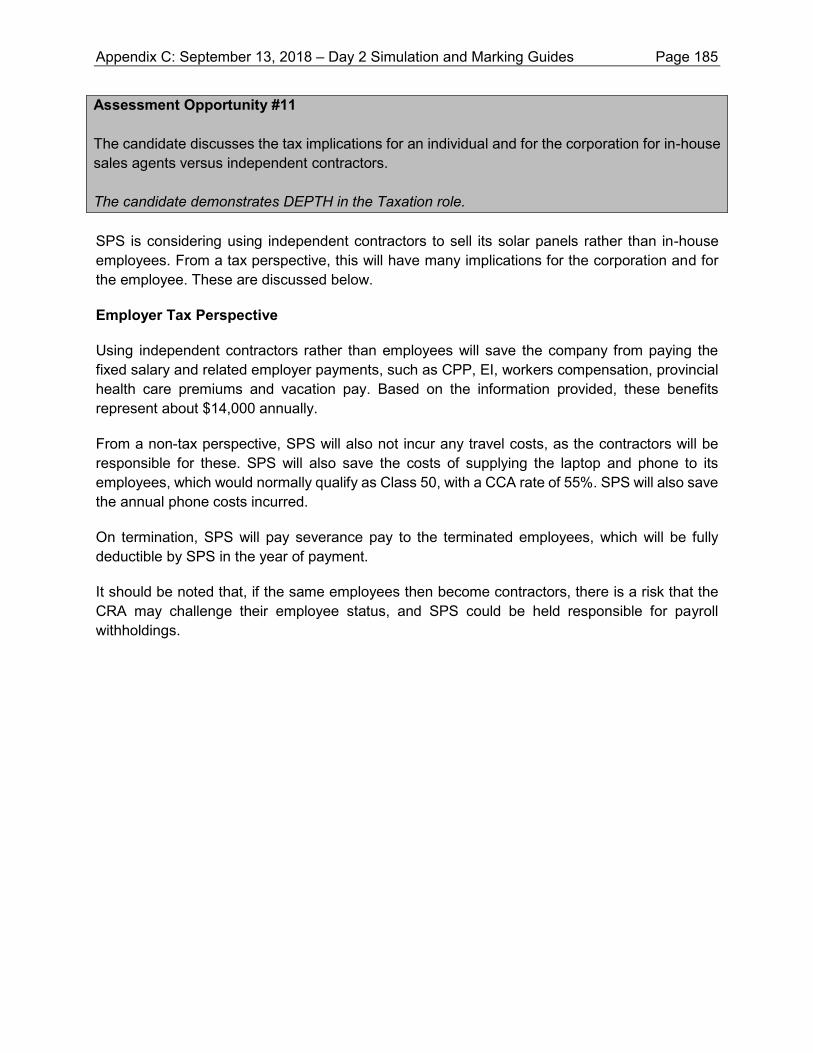
Assessment Opportunity #11 The candidate discusses the tax implications for an individual and for the corporation for in-house sales agents versus independent contractors. The candidate demonstrates DEPTH in the Taxation role. SPS is considering using independent contractors to sell its solar panels rather than in-house employees. From a tax perspective, this will have many implications for the corporation and for the employee. These are discussed below.
Employer Tax Perspective
Using independent contractors rather than employees will save the company from paying the fixed salary and related employer payments, such as CPP, EI, workers compensation, provincial health care premiums and vacation pay. Based on the information provided, these benefits represent about $14,000 annually.
From a non-tax perspective, SPS will also not incur any travel costs, as the contractors will be responsible for these. SPS will also save the costs of supplying the laptop and phone to its employees, which would normally qualify as Class 50, with a CCA rate of 55%. SPS will also save the annual phone costs incurred.
On termination, SPS will pay severance pay to the terminated employees, which will be fully deductible by SPS in the year of payment.
It should be noted that, if the same employees then become contractors, there is a risk that the CRA may challenge their employee status, and SPS could be held responsible for payroll withholdings.
Appendix C: September 13, 2018 – Day 2 Simulation and Marking Guides Page 185
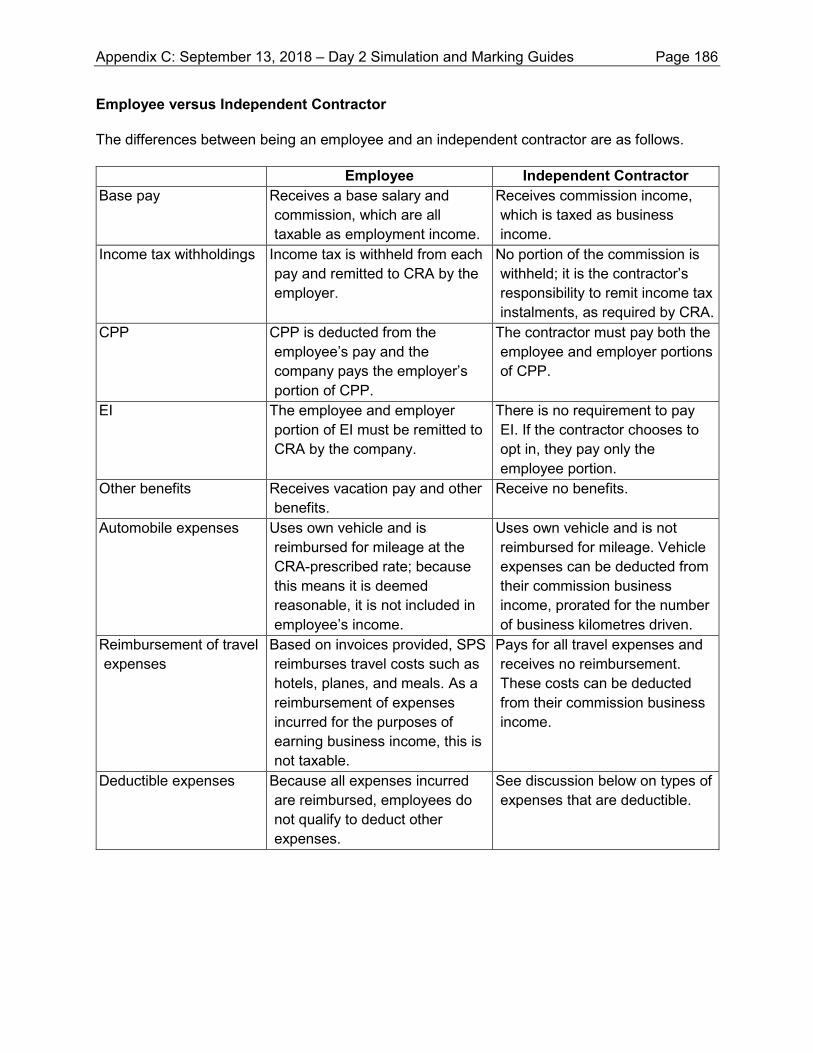
Employee versus Independent Contractor
The differences between being an employee and an independent contractor are as follows.
Employee Independent Contractor Base pay Receives a base salary and
commission, which are all taxable as employment income.
Receives commission income, which is taxed as business income.
Income tax withholdings Income tax is withheld from each pay and remitted to CRA by the employer.
No portion of the commission is withheld; it is the contractor’s responsibility to remit income tax instalments, as required by CRA.
CPP CPP is deducted from the employee’s pay and the company pays the employer’s portion of CPP.
The contractor must pay both the employee and employer portions of CPP.
EI The employee and employer portion of EI must be remitted to CRA by the company.
There is no requirement to pay EI. If the contractor chooses to opt in, they pay only the employee portion.
Other benefits Receives vacation pay and other benefits.
Receive no benefits.
Automobile expenses Uses own vehicle and is reimbursed for mileage at the CRA-prescribed rate; because this means it is deemed reasonable, it is not included in employee’s income.
Uses own vehicle and is not reimbursed for mileage. Vehicle expenses can be deducted from their commission business income, prorated for the number of business kilometres driven.
Reimbursement of travel expenses
Based on invoices provided, SPS reimburses travel costs such as hotels, planes, and meals. As a reimbursement of expenses incurred for the purposes of earning business income, this is not taxable.
Pays for all travel expenses and receives no reimbursement. These costs can be deducted from their commission business income.
Deductible expenses Because all expenses incurred are reimbursed, employees do not qualify to deduct other expenses.
See discussion below on types of expenses that are deductible.
Appendix C: September 13, 2018 – Day 2 Simulation and Marking Guides Page 186
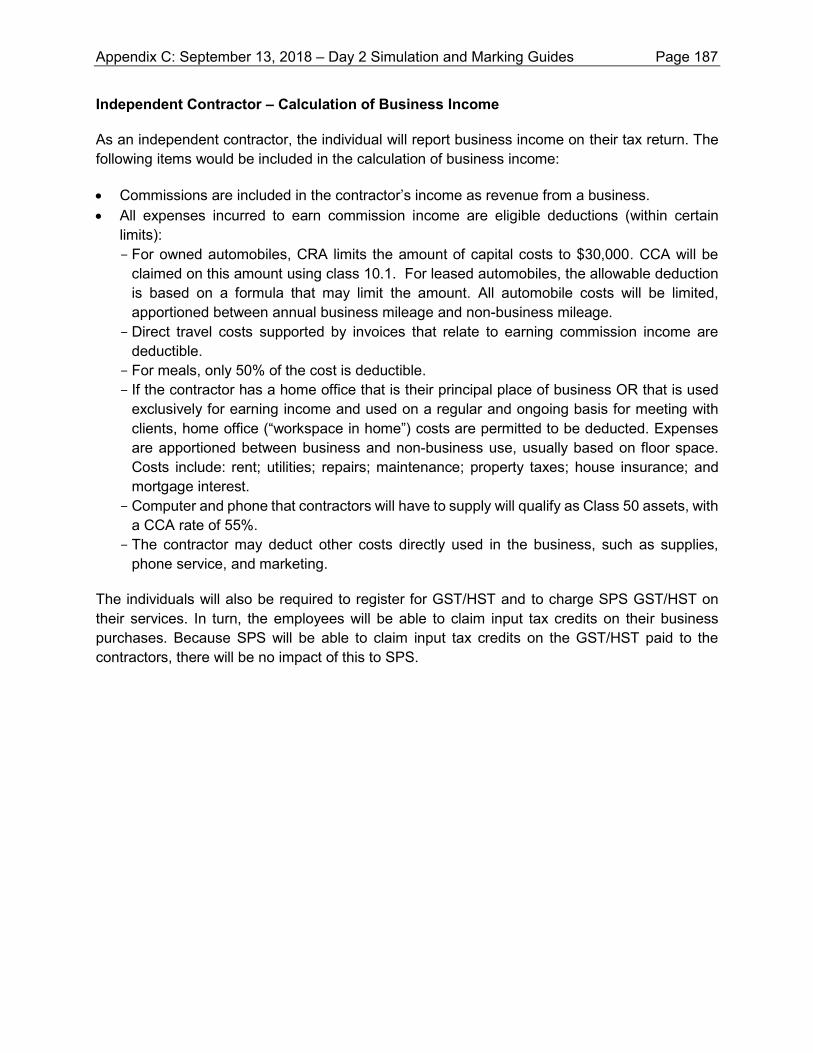
Independent Contractor – Calculation of Business Income
As an independent contractor, the individual will report business income on their tax return. The following items would be included in the calculation of business income:
• Commissions are included in the contractor’s income as revenue from a business. • All expenses incurred to earn commission income are eligible deductions (within certain
limits): - For owned automobiles, CRA limits the amount of capital costs to $30,000. CCA will be
claimed on this amount using class 10.1. For leased automobiles, the allowable deduction is based on a formula that may limit the amount. All automobile costs will be limited, apportioned between annual business mileage and non-business mileage.
- Direct travel costs supported by invoices that relate to earning commission income are deductible.
- For meals, only 50% of the cost is deductible. - If the contractor has a home office that is their principal place of business OR that is used
exclusively for earning income and used on a regular and ongoing basis for meeting with clients, home office (“workspace in home”) costs are permitted to be deducted. Expenses are apportioned between business and non-business use, usually based on floor space. Costs include: rent; utilities; repairs; maintenance; property taxes; house insurance; and mortgage interest.
- Computer and phone that contractors will have to supply will qualify as Class 50 assets, with a CCA rate of 55%.
- The contractor may deduct other costs directly used in the business, such as supplies, phone service, and marketing.
The individuals will also be required to register for GST/HST and to charge SPS GST/HST on their services. In turn, the employees will be able to claim input tax credits on their business purchases. Because SPS will be able to claim input tax credits on the GST/HST paid to the contractors, there will be no impact of this to SPS.
Appendix C: September 13, 2018 – Day 2 Simulation and Marking Guides Page 187
For Assessment Opportunity #11 (Taxation), the candidate must be ranked in one of the following five categories: Not addressed – The candidate does not address this assessment opportunity. Nominal competence – The candidate does not attain the standard of reaching competence. Reaching competence – The candidate discusses the difference between employees and contractors, from either the worker or company perspective. Competent – The candidate discusses the difference between employees and contractors, from both the worker and company perspective. Competent with distinction – The candidate discusses in depth the difference between employees and contractors, from both the worker and company perspective. Assessment Opportunity #12 The candidate discusses the tax implications for shareholders with respect to dividends paid by SPS and compares this to dividends paid by private companies. The candidate demonstrates DEPTH in the Taxation role. Roger would like to understand the tax implications of dividends received from a private company compared to dividends received from SPS, which is a public company. The tax treatment is different from these two sources. Using a dividend amount of $100,000 at the top marginal tax bracket, the taxes payable by Roger are calculated to show the differences.
The Canadian income tax system is designed to try to achieve integration; that is, that total taxes paid on a fixed amount of business income that flows through a corporation and then to the shareholders is as close as possible to the total amount of taxes that would be paid if there was no corporation and the business income flowed directly to the non-incorporated individual. To achieve integration, the tax treatment of dividend income differs according to the rate of tax that has already been paid by the corporation.
Dividends are paid from after-tax income. The income tax treatment for dividend income received by an individual depends on whether the dividend is identified as eligible or other-than-eligible.
For public companies, there is no small business deduction available and these companies pay a higher rate of tax on their business income; in the case of SPS, this is 27%. Dividends paid from this type of income are called eligible dividends.
Appendix C: September 13, 2018 – Day 2 Simulation and Marking Guides Page 188
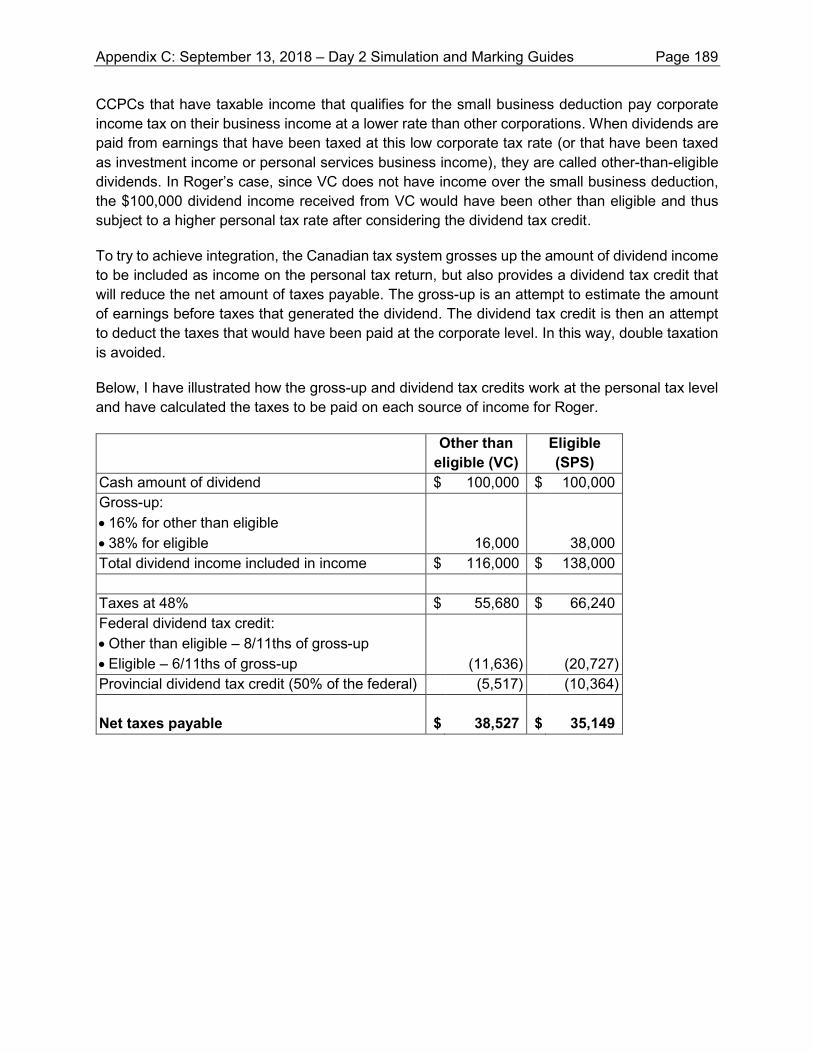
CCPCs that have taxable income that qualifies for the small business deduction pay corporate income tax on their business income at a lower rate than other corporations. When dividends are paid from earnings that have been taxed at this low corporate tax rate (or that have been taxed as investment income or personal services business income), they are called other-than-eligible dividends. In Roger’s case, since VC does not have income over the small business deduction, the $100,000 dividend income received from VC would have been other than eligible and thus subject to a higher personal tax rate after considering the dividend tax credit.
To try to achieve integration, the Canadian tax system grosses up the amount of dividend income to be included as income on the personal tax return, but also provides a dividend tax credit that will reduce the net amount of taxes payable. The gross-up is an attempt to estimate the amount of earnings before taxes that generated the dividend. The dividend tax credit is then an attempt to deduct the taxes that would have been paid at the corporate level. In this way, double taxation is avoided.
Below, I have illustrated how the gross-up and dividend tax credits work at the personal tax level and have calculated the taxes to be paid on each source of income for Roger.
Other than eligible (VC)
Eligible (SPS)
Cash amount of dividend $ 100,000 $ 100,000 Gross-up: • 16% for other than eligible • 38% for eligible
16,000
38,000 Total dividend income included in income $ 116,000 $ 138,000 Taxes at 48% $ 55,680 $ 66,240 Federal dividend tax credit: • Other than eligible – 8/11ths of gross-up • Eligible – 6/11ths of gross-up
(11,636)
(20,727) Provincial dividend tax credit (50% of the federal) (5,517) (10,364) Net taxes payable
$ 38,527
$ 35,149
Appendix C: September 13, 2018 – Day 2 Simulation and Marking Guides Page 189
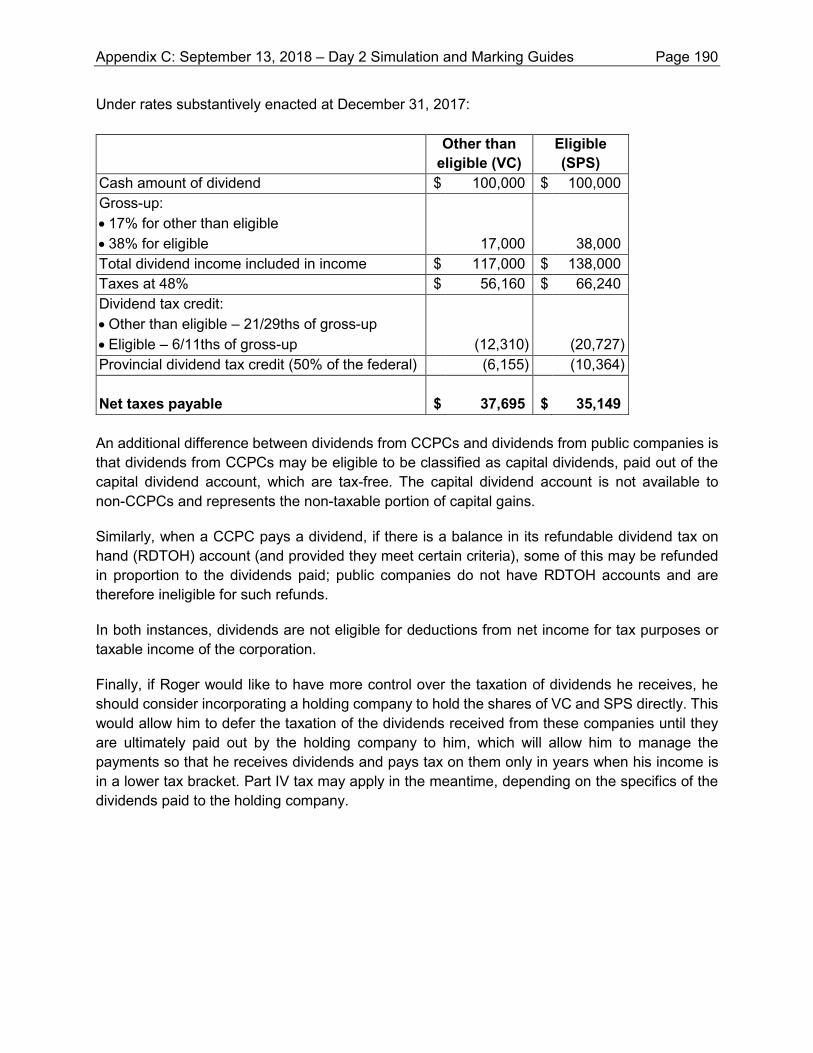
Under rates substantively enacted at December 31, 2017: Other than
eligible (VC) Eligible (SPS)
Cash amount of dividend $ 100,000 $ 100,000 Gross-up: • 17% for other than eligible • 38% for eligible
17,000 38,000 Total dividend income included in income $ 117,000 $ 138,000 Taxes at 48% $ 56,160 $ 66,240 Dividend tax credit: • Other than eligible – 21/29ths of gross-up • Eligible – 6/11ths of gross-up
(12,310) (20,727) Provincial dividend tax credit (50% of the federal) (6,155) (10,364) Net taxes payable
$ 37,695
$ 35,149
An additional difference between dividends from CCPCs and dividends from public companies is that dividends from CCPCs may be eligible to be classified as capital dividends, paid out of the capital dividend account, which are tax-free. The capital dividend account is not available to non-CCPCs and represents the non-taxable portion of capital gains.
Similarly, when a CCPC pays a dividend, if there is a balance in its refundable dividend tax on hand (RDTOH) account (and provided they meet certain criteria), some of this may be refunded in proportion to the dividends paid; public companies do not have RDTOH accounts and are therefore ineligible for such refunds.
In both instances, dividends are not eligible for deductions from net income for tax purposes or taxable income of the corporation.
Finally, if Roger would like to have more control over the taxation of dividends he receives, he should consider incorporating a holding company to hold the shares of VC and SPS directly. This would allow him to defer the taxation of the dividends received from these companies until they are ultimately paid out by the holding company to him, which will allow him to manage the payments so that he receives dividends and pays tax on them only in years when his income is in a lower tax bracket. Part IV tax may apply in the meantime, depending on the specifics of the dividends paid to the holding company.
Appendix C: September 13, 2018 – Day 2 Simulation and Marking Guides Page 190
For Assessment Opportunity #12 (Taxation), the candidate must be ranked in one of the following five categories: Not addressed – The candidate does not address this assessment opportunity. Nominal competence – The candidate does not attain the standard of reaching competence. Reaching competence – The candidate attempts to discuss the difference between dividends from CCPCs and dividends from public companies, or attempts to calculate the difference. Competent – The candidate discusses the difference between dividends from CCPCs and dividends from public companies, and attempts to calculate the difference. Competent with distinction – The candidate discusses in depth the difference between dividends from CCPCs and dividends from public companies, from both the payer and recipient perspective, and provides a reasonable calculation of the difference.
Appendix C: September 13, 2018 – Day 2 Simulation and Marking Guides Page 191
APPENDIX D
SEPTEMBER 14, 2018 – DAY 3 SIMULATIONS, SOLUTIONS AND MARKING GUIDES
Appendix D: September 14, 2018 – Day 3 Simulation and Marking Guides Page 192
COMMON FINAL EXAMINATION SEPTEMBER 14, 2018 – Day 3
Case #1 (Suggested time: 90 minutes) Lake Country Camping Inc. (LCC) was incorporated in 2009 and is wholly-owned by Janie Sasson, who is single and 58 years old. LCC operates a campground and snack bar just off Road 72, in a wilderness area that provides access to Fire Lake in Nova Scotia. Except for snack bar revenues, which are earned year-round from people who drive by, most revenue is earned in the camping season (May to August). LCC’s income statement for its year ended October 31, 2018, is in Appendix I. Today is November 28, 2018. Although she enjoys operating the campground, Janie is planning to retire to British Columbia. Janie has asked Harmuck & Hudan LLP (HH) to assist with some major decisions. You, CPA, work at HH. On June 1, 2018, the provincial government (the province) announced that Road 72 will be widened, requiring expropriation of all of LCC’s 49.2 hectares of land. The province offered LCC two options. LCC must select either Offer A or Offer B by December 31, 2018 (Appendix II). Other relevant information is presented in Appendix III. Offer A would mean closing down the business and would allow Janie to retire right away. Offer B would provide a substitute property and a cash relocation allowance. The substitute property would accommodate more campsites. If she chooses Offer B, Janie would hire a full-time manager to replace her and would retire after a short transition period. To help Janie assess Offer B, the partner asks you to forecast the normalized annual revenues and expenses. The partner would then like you to use this to value the business for Janie under Offer B. In this industry, a normalized after-tax earnings multiplier of between 4 and 7 would apply. The partner would like you to use this valuation to provide both a quantitative and a qualitative comparison of Offer A and Offer B, and to recommend to Janie which option to choose. The partner would like you to calculate and discuss the tax implications of each offer. The substitute property also provides the opportunity to offer motorboat rentals. While she does not want you to include this in your assessment of Offer B, Janie asks you to calculate the contribution margin and required breakeven volume, and assess the qualitative factors, for the potential motorboat rentals. LCC has never had its financial statements audited. Under Offer B, LCC would likely have an audit performed in the future. Janie is interested in knowing what substantive procedures would be performed on several accounts: campground fees; snack bar revenue; snack bar cost of sales; and repairs and maintenance.
Appendix D: September 14, 2018 – Day 3 Simulation and Marking Guides Page 193
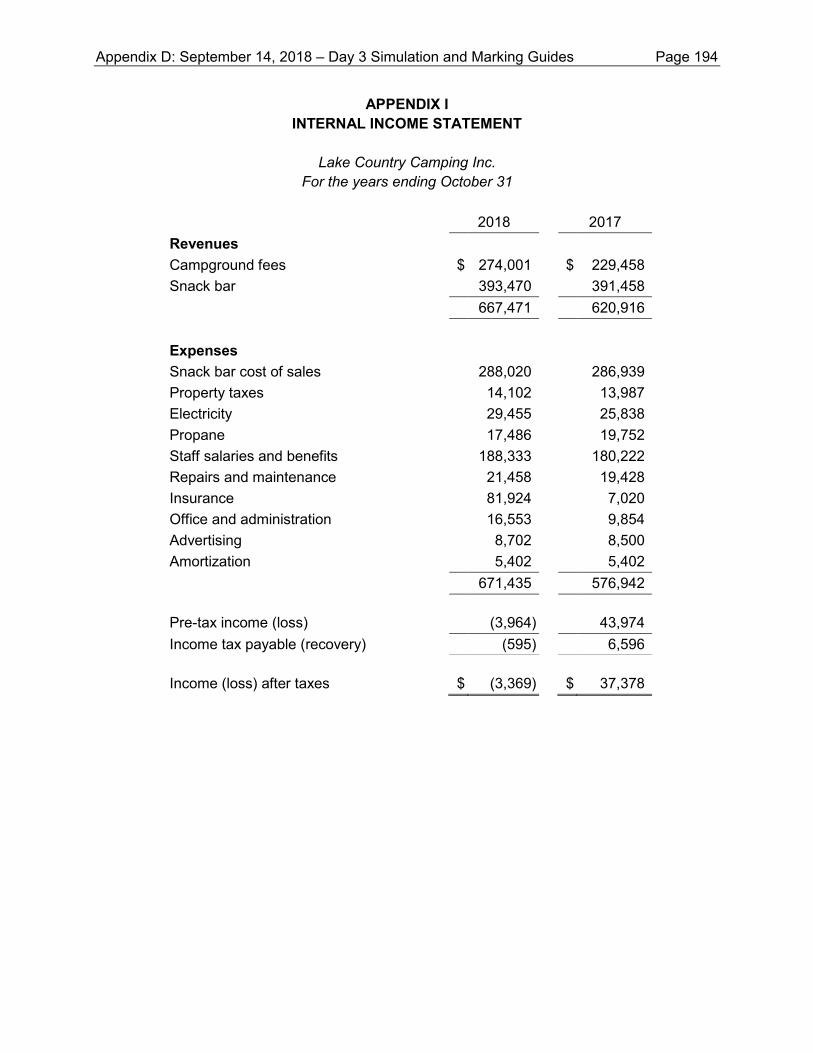
APPENDIX I INTERNAL INCOME STATEMENT
Lake Country Camping Inc.
For the years ending October 31
2018 2017 Revenues Campground fees $ 274,001 $ 229,458 Snack bar 393,470 391,458 667,471 620,916 Expenses Snack bar cost of sales 288,020 286,939 Property taxes 14,102 13,987 Electricity 29,455 25,838 Propane 17,486 19,752 Staff salaries and benefits 188,333 180,222 Repairs and maintenance 21,458 19,428 Insurance 81,924 7,020 Office and administration 16,553 9,854 Advertising 8,702 8,500 Amortization 5,402 5,402 671,435 576,942 Pre-tax income (loss) (3,964) 43,974 Income tax payable (recovery) (595) 6,596 Income (loss) after taxes $ (3,369) $ 37,378
Appendix D: September 14, 2018 – Day 3 Simulation and Marking Guides Page 194
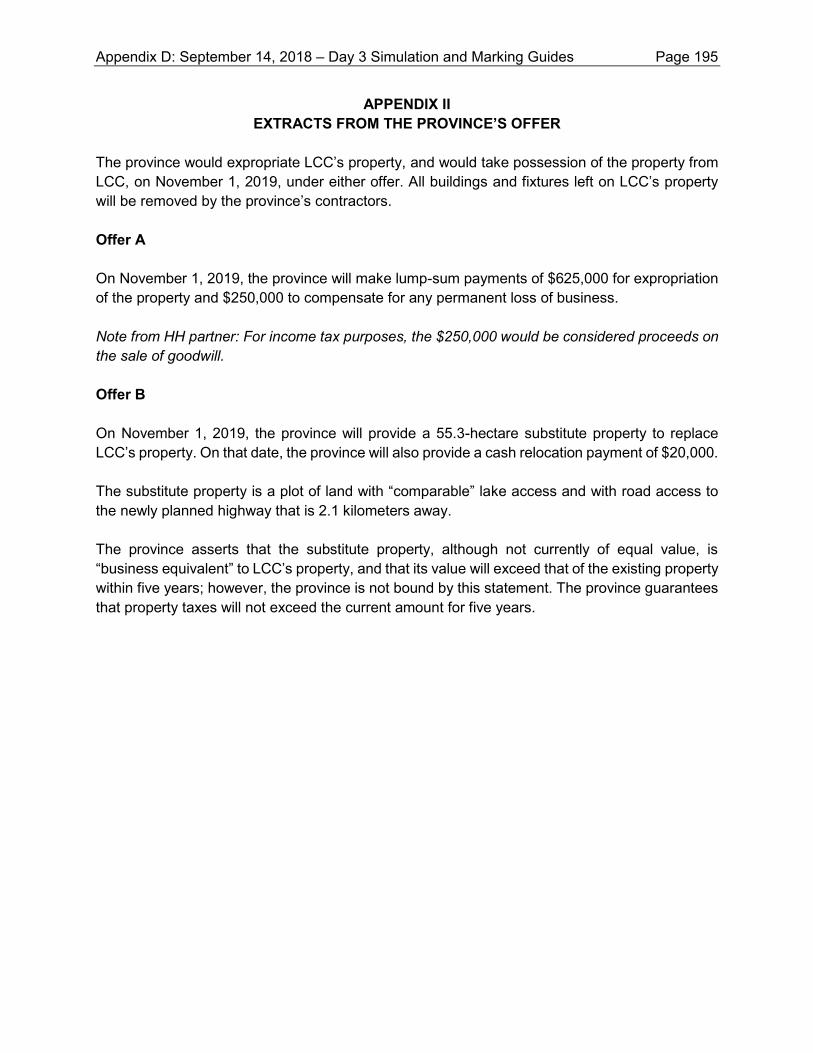
APPENDIX II EXTRACTS FROM THE PROVINCE’S OFFER
The province would expropriate LCC’s property, and would take possession of the property from LCC, on November 1, 2019, under either offer. All buildings and fixtures left on LCC’s property will be removed by the province’s contractors. Offer A On November 1, 2019, the province will make lump-sum payments of $625,000 for expropriation of the property and $250,000 to compensate for any permanent loss of business. Note from HH partner: For income tax purposes, the $250,000 would be considered proceeds on the sale of goodwill. Offer B On November 1, 2019, the province will provide a 55.3-hectare substitute property to replace LCC’s property. On that date, the province will also provide a cash relocation payment of $20,000. The substitute property is a plot of land with “comparable” lake access and with road access to the newly planned highway that is 2.1 kilometers away. The province asserts that the substitute property, although not currently of equal value, is “business equivalent” to LCC’s property, and that its value will exceed that of the existing property within five years; however, the province is not bound by this statement. The province guarantees that property taxes will not exceed the current amount for five years.
Appendix D: September 14, 2018 – Day 3 Simulation and Marking Guides Page 195
APPENDIX III OTHER INFORMATION
The business has been relatively stable in recent years, with a small increase in US customers. However, 2017 was an unusually rainy year, which led to unexpectedly low campground revenues for that year. The campground is only full once per year. The campers rent campsites on a per-use basis and can book up to nine months in advance with a deposit. In 2018, the average age of campers was 61.2 years of age, an increase from previous years. LCC surveyed its regular campers in September 2018; 72% said they would stay at the new location, 5% said they would not, and 23% were undecided. In May 2018, a tree fell on a camper’s trailer during a storm, causing extensive damage. Taking into account the deductible and payout limit, LCC paid out $74,522, which is included in insurance expense. LCC historically received free shipping of goods for the snack bar from its wholesaler. Beginning next season, the wholesaler will charge 1.2% of the wholesale price for delivery. Janie works full time for LCC from May to August and takes a $90,000 salary. She hires a supervisor to manage the snack bar outside of those months and spends most of the winter travelling. In the summer of 2017, Janie hurt her back and was bedridden for a short time. She hired a replacement campground manager, at $1,100 per week, and was satisfied with her performance. If Janie accepts Offer A and closes the business, she will need to lay off employees with a total of 17 years of service, and will pay severance of two weeks’ salary per year of service. Because they are personal friends, Janie does not feel good about this. LCC originally paid $457,522 for its land. Its depreciable assets have a nominal undepreciated capital cost for tax purposes. LCC has nominal working capital.
Appendix D: September 14, 2018 – Day 3 Simulation and Marking Guides Page 196
APPENDIX III (continued) OTHER INFORMATION
Setup costs at the new site would be as follows:
Relocation of existing camp office and snack bar $ 4,500 Relocation and upgrade of recreation building 19,400 Construction of new washrooms 27,500 Landscaping of new site 24,000 Construction of campsites and roads 35,000 Digging of a well 29,000
$ 139,400
The average lifespan of these improvements will be 20 years. The efficiency of the new washroom facilities means that propane consumption will decrease by 20%. There will be no scrap value to the remaining items at the old property. Maintenance costs at the new site will be $5,000 lower than historic levels. Year-round employees are paid, on average, $700 per week. Seasonal and part-time employees are paid $15 per hour, or approximately $16 per hour including benefits. Except for the potential addition of a motorboat rental attendant, staff levels would be the same at the new location. One-time advertising to announce the move would cost $12,000. Beginning in taxation year 2019, the company’s tax rate will be 13% on active business income and 52% on investment income. Possible expansion in new location It would cost $15,000 to build a dock, and eight motorboats will cost $3,000 each. The motorboat rental would be open eight weeks per year, for eight hours each day, and one attendant would need to be present for all the opening hours. Total annual overhead of the motorboat operations is estimated at $5,000, and 18 one-hour rentals are expected per day, at $20 per motorboat per hour. Fuel for the motorboats is estimated to cost $4 per hour of usage.
Appendix D: September 14, 2018 – Day 3 Simulation and Marking Guides Page 197
MARKING GUIDE 3-1 LAKE COUNTRY CAMPING INC. (LCC)
ASSESSMENT OPPORTUNITIES
MEMO
To: Ms. Janie Sasson From: CPA Re: Lake Country Camping Inc. Assessment Opportunity #1 (Breadth Opportunity)
The candidate forecasts the normalized annual revenues and expenses under Offer B, in order to value the business.
The candidate demonstrates competence in Finance. CPA Map Competencies: 5.4.2 Applies appropriate methods to estimate the value of a business (Core – Level B)
Financial Projections for the Relocated Business
We must project your future earnings at the new location, which will essentially be a continuation of the existing business, with no expansions considered for now.
To carry out this analysis, I have looked at the last two years of earnings and made relevant adjustments for the future of the business. While most of this information was provided by you, it should be verified by you to ensure accuracy and completeness. You also need to determine the appropriateness of any financial assumptions I have made. Changes in assumptions may result in significant impacts to the calculation provided.
Campground fee revenues increased significantly between 2017 and 2018, but the new location is further from the highway and only 72% of campers have confirmed they would renew at the new location. In addition, the 2017 season was marred by rain and is likely below the normal level of revenue. However, the expansion of the highway may attract more casual visitors. To be conservative, campground revenues have been assumed to be 72% of the current revenue.
Snack bar sales increased slightly, so I have assumed they will not change. However, as the new store is much further from the road, there is a risk that there could be less drive-by business. Snack bar cost of sales as a percentage of sales was 73.2% in 2018 and 73.3% in 2017, showing basically no change. Consequently, we will use the 2018 percentage, increased by the new freight charge of 1.2%.
Appendix D: September 14, 2018 – Day 3 Simulation and Marking Guides Page 198
Due to the province’s guarantee to maintain property taxes for five years, the property taxes are set at the 2018 rate.
On the assumption that prices will continue to rise, electricity has been increased by the 2017 to 2018 increase of 14%.
Due to the improved efficiency of the new washroom facilities, propane has been decreased by 20%.
Since you plan to retire shortly after the transition period, we have assumed you are not working. We have removed your salary and added in a salary for a manager who is paid the same rate paid to your replacement when you hurt your back.
Since most facilities will be newer, historic repairs and maintenance has been reduced by the suggested amount of $5,000.
Insurance expense has been reduced by the payout for the claim that was settled last year. However, the tree falling claim will mean increased liability insurance. You can talk to your broker about the impact of this event on your insurance rates so that we could adjust this amount.
The one-time advertising cost to announce the move was excluded from the projection as it is not a recurring expense. Amortization has been increased to account for the amount of relocation costs, amortized over the 20 years you mentioned. A small amount of existing amortization should probably be removed because of abandoned assets, though we do not know the actual amount.
Office and administration expense increased significantly from 2017 to 2018. Further analysis should be performed to determine if this amount will be sustained at this level. An estimate of the cost of the annual audit required in the future has not been provided, but would increase the amount of office and administration expense in the future.
The total moving and construction costs provided are $139,400; the majority of costs could be capitalized, and over 20 years this would generate $6,970 of additional amortization per year.
The remaining costs have been assumed to be the same.
Since the transaction will not occur until the first day of the next fiscal year (fiscal year 2020) and we have no results from fiscal year 2019, many of these assumptions could change.
We have used the company’s 13% tax rate to determine income taxes payable.
Appendix D: September 14, 2018 – Day 3 Simulation and Marking Guides Page 199
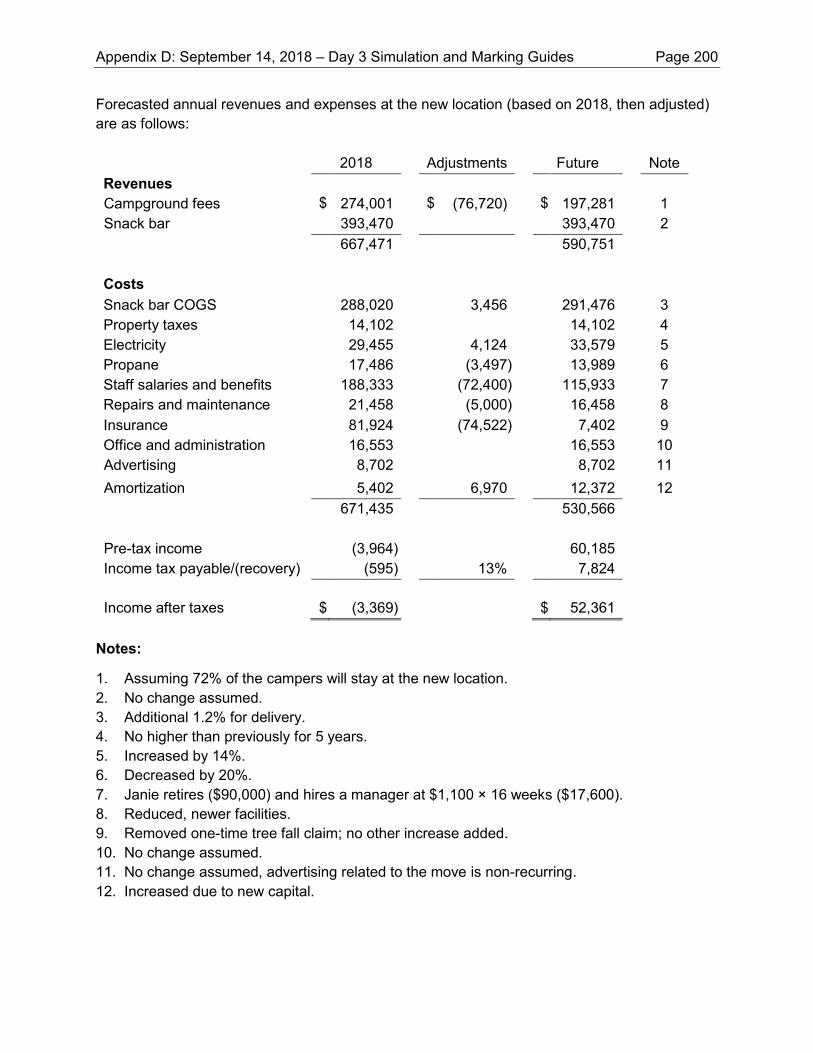
Forecasted annual revenues and expenses at the new location (based on 2018, then adjusted) are as follows:
2018 Adjustments Future Note Revenues Campground fees $ 274,001 $ (76,720) $ 197,281 1 Snack bar 393,470 393,470 2
667,471 590,751 Costs Snack bar COGS 288,020 3,456 291,476 3 Property taxes 14,102 14,102 4 Electricity 29,455 4,124 33,579 5 Propane 17,486 (3,497) 13,989 6 Staff salaries and benefits 188,333 (72,400) 115,933 7 Repairs and maintenance 21,458 (5,000) 16,458 8 Insurance 81,924 (74,522) 7,402 9 Office and administration 16,553 16,553 10 Advertising 8,702 8,702 11 Amortization 5,402 6,970 12,372 12
671,435 530,566 Pre-tax income (3,964) 60,185 Income tax payable/(recovery) (595) 13% 7,824
Income after taxes
$ (3,369)
$ 52,361
Notes:
1. Assuming 72% of the campers will stay at the new location. 2. No change assumed. 3. Additional 1.2% for delivery. 4. No higher than previously for 5 years. 5. Increased by 14%. 6. Decreased by 20%. 7. Janie retires ($90,000) and hires a manager at $1,100 × 16 weeks ($17,600). 8. Reduced, newer facilities. 9. Removed one-time tree fall claim; no other increase added. 10. No change assumed. 11. No change assumed, advertising related to the move is non-recurring. 12. Increased due to new capital.
Appendix D: September 14, 2018 – Day 3 Simulation and Marking Guides Page 200
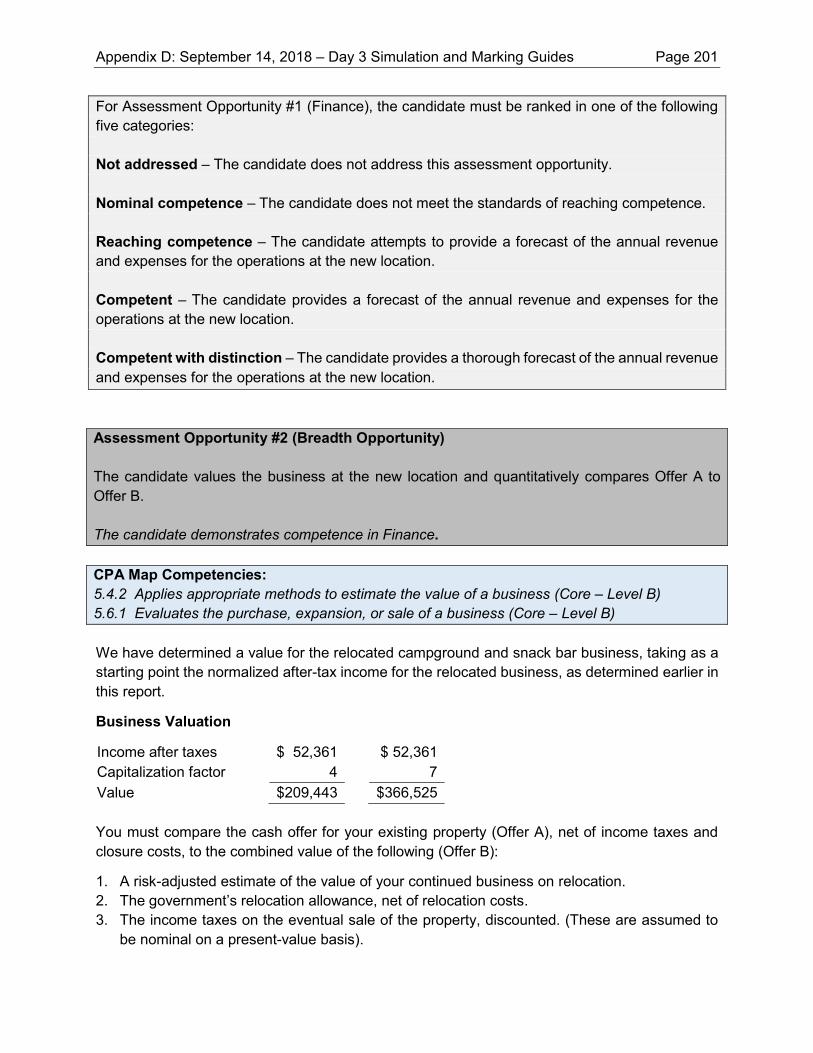
For Assessment Opportunity #1 (Finance), the candidate must be ranked in one of the following five categories:
Not addressed – The candidate does not address this assessment opportunity. Nominal competence – The candidate does not meet the standards of reaching competence.
Reaching competence – The candidate attempts to provide a forecast of the annual revenue and expenses for the operations at the new location.
Competent – The candidate provides a forecast of the annual revenue and expenses for the operations at the new location.
Competent with distinction – The candidate provides a thorough forecast of the annual revenue and expenses for the operations at the new location.
Assessment Opportunity #2 (Breadth Opportunity)
The candidate values the business at the new location and quantitatively compares Offer A to Offer B.
The candidate demonstrates competence in Finance. CPA Map Competencies: 5.4.2 Applies appropriate methods to estimate the value of a business (Core – Level B) 5.6.1 Evaluates the purchase, expansion, or sale of a business (Core – Level B) We have determined a value for the relocated campground and snack bar business, taking as a starting point the normalized after-tax income for the relocated business, as determined earlier in this report.
Business Valuation
Income after taxes $ 52,361 $ 52,361 Capitalization factor 4 7 Value $209,443 $366,525 You must compare the cash offer for your existing property (Offer A), net of income taxes and closure costs, to the combined value of the following (Offer B):
1. A risk-adjusted estimate of the value of your continued business on relocation. 2. The government’s relocation allowance, net of relocation costs. 3. The income taxes on the eventual sale of the property, discounted. (These are assumed to
be nominal on a present-value basis).
Appendix D: September 14, 2018 – Day 3 Simulation and Marking Guides Page 201
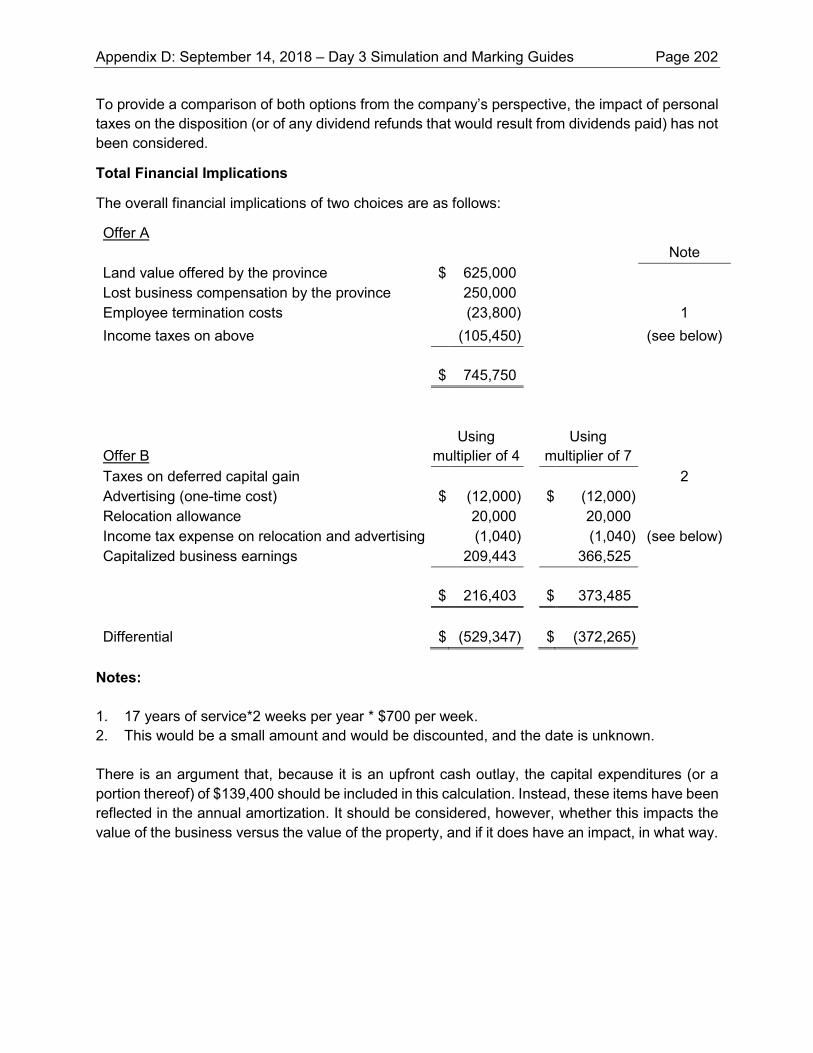
To provide a comparison of both options from the company’s perspective, the impact of personal taxes on the disposition (or of any dividend refunds that would result from dividends paid) has not been considered.
Total Financial Implications
The overall financial implications of two choices are as follows:
Offer A Note Land value offered by the province $ 625,000 Lost business compensation by the province 250,000 Employee termination costs (23,800) 1 Income taxes on above (105,450) (see below)
$ 745,750
Offer B
Using multiplier of 4
Using multiplier of 7
Taxes on deferred capital gain 2 Advertising (one-time cost) $ (12,000) $ (12,000) Relocation allowance 20,000 20,000 Income tax expense on relocation and advertising (1,040) (1,040) (see below) Capitalized business earnings 209,443 366,525
$ 216,403
$ 373,485
Differential $ (529,347) $ (372,265)
Notes: 1. 17 years of service*2 weeks per year * $700 per week. 2. This would be a small amount and would be discounted, and the date is unknown. There is an argument that, because it is an upfront cash outlay, the capital expenditures (or a portion thereof) of $139,400 should be included in this calculation. Instead, these items have been reflected in the annual amortization. It should be considered, however, whether this impacts the value of the business versus the value of the property, and if it does have an impact, in what way.
Appendix D: September 14, 2018 – Day 3 Simulation and Marking Guides Page 202
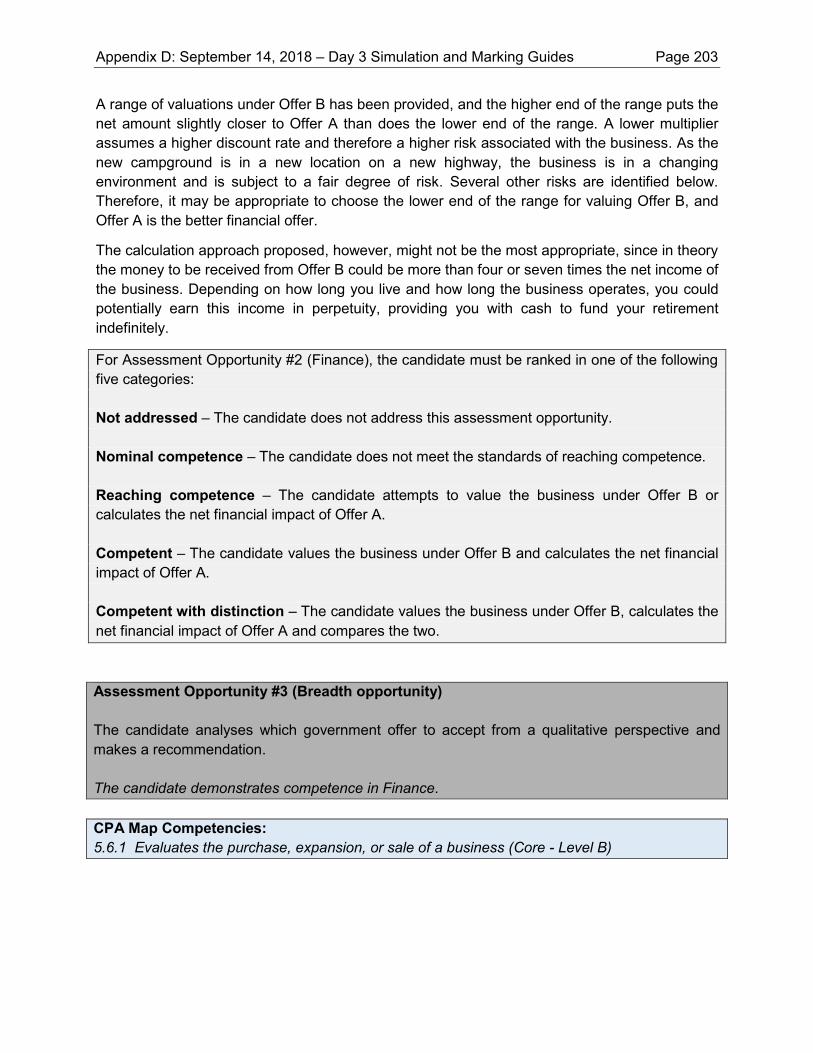
A range of valuations under Offer B has been provided, and the higher end of the range puts the net amount slightly closer to Offer A than does the lower end of the range. A lower multiplier assumes a higher discount rate and therefore a higher risk associated with the business. As the new campground is in a new location on a new highway, the business is in a changing environment and is subject to a fair degree of risk. Several other risks are identified below. Therefore, it may be appropriate to choose the lower end of the range for valuing Offer B, and Offer A is the better financial offer.
The calculation approach proposed, however, might not be the most appropriate, since in theory the money to be received from Offer B could be more than four or seven times the net income of the business. Depending on how long you live and how long the business operates, you could potentially earn this income in perpetuity, providing you with cash to fund your retirement indefinitely.
For Assessment Opportunity #2 (Finance), the candidate must be ranked in one of the following five categories:
Not addressed – The candidate does not address this assessment opportunity. Nominal competence – The candidate does not meet the standards of reaching competence.
Reaching competence – The candidate attempts to value the business under Offer B or calculates the net financial impact of Offer A.
Competent – The candidate values the business under Offer B and calculates the net financial impact of Offer A.
Competent with distinction – The candidate values the business under Offer B, calculates the net financial impact of Offer A and compares the two.
Assessment Opportunity #3 (Breadth opportunity)
The candidate analyses which government offer to accept from a qualitative perspective and makes a recommendation.
The candidate demonstrates competence in Finance. CPA Map Competencies: 5.6.1 Evaluates the purchase, expansion, or sale of a business (Core - Level B)
Appendix D: September 14, 2018 – Day 3 Simulation and Marking Guides Page 203
Qualitative Considerations
In addition to the preceding quantitative analysis, there are a number of qualitative factors that need to be evaluated.
In favour of accepting the cash offer (Offer A) and against relocating:
• It is worth investigating whether any new campgrounds or hotels are planned in the new location. If so, LLC would face increased competition, which would negatively impact net income.
• As it will be received from the government, the expropriation cash flow is certain and has no risk attached to it.
• All future business, economic, weather, liability, and exchange rate risks are eliminated. • This option avoids the risk that the new location will not perform as well as the old one. • Funds will be available to purchase another business elsewhere, if desired, including another
campground at a different site. • The transaction would be completed without a real estate commission, which you would likely
have to pay when selling the replacement property. • Rather than waiting until the transition period is over, you will be able to retire to
British Columbia immediately, as desired. • As the age of campers is high and increasing, significant work will be required to expand the
customer base and attract a younger crowd, to sustain revenues. • The additional 2.1 kilometre distance from the new highway to the new site could potentially
negatively impact the relocated business. • The fact that 23% of the regular renters are undecided about the new location and that 5% are
opposed to it is a concern. • As you will be further from the highway, snack bar sales will likely decrease. • As the campground currently only reaches capacity once a year, the additional sites are of little
value. • You avoid having to finance approximately $131,000 ($139,000 + $12,000 - $20,000) of initial
costs at the new location.
In favour of relocating (Offer B) and against accepting the cash offer:
• As they are more modern than those at the existing site, the new toilet facilities and upgraded recreational building may attract more clients.
• The construction of the new highway may bring a tourism and camping boom to the region. • The opportunity exists to make money from future land appreciation. • You will be able to avoid the personal hardship of laying off any employees, many of whom
are friends. • You can continue operating the campground business, an enjoyable activity for you. • The replacement property is 6.1 hectares larger than the old site, which provides opportunities
for future expansion and potentially a higher value when you decide to sell your business in the future
Appendix D: September 14, 2018 – Day 3 Simulation and Marking Guides Page 204
• As Americans discover their purchasing power in Canada, the strong U.S. exchange rate may further increase sales volumes.
• It is encouraging that 72% of seasonal renters have expressed interest in continuing at the new location.
Recommendation
I recommend that you pursue Offer A. This option provides a better financial result and has significantly less uncertainty.
Other Considerations
Regardless of which option you accept, you have one more season, 2019, in which to operate the business at the current location. If you choose Offer B and have a really bad year or get more information suggesting against relocating the business, you could choose not to build the campground, and instead try to resell the replacement land. Another option is to operate the campground for a few years and then sell the business.
For Assessment Opportunity #3 (Finance), the candidate must be ranked in one of the following five categories:
Not addressed – The candidate does not address this assessment opportunity. Nominal competence – The candidate does not meet the standards of reaching competence.
Reaching competence – The candidate attempts to compare the qualitative decision factors for the two offers provided by the government.
Competent – The candidate discusses some of the qualitative factors of the two offers provided by the government and provides a recommendation as to which government offer to accept.
Competent with distinction – The candidate provides a thorough discussion of the qualitative factors of the two offers provided by the government and provides a recommendation as to which government offer to accept.
Assessment Opportunity #4 (Breadth Opportunity) The candidate discusses the tax implications of each offer. The candidate demonstrates competence in Taxation. CPA Map Competencies: 6.1.2 Determines taxes payable for a corporation in routine situations (Core – Level B)
Appendix D: September 14, 2018 – Day 3 Simulation and Marking Guides Page 205
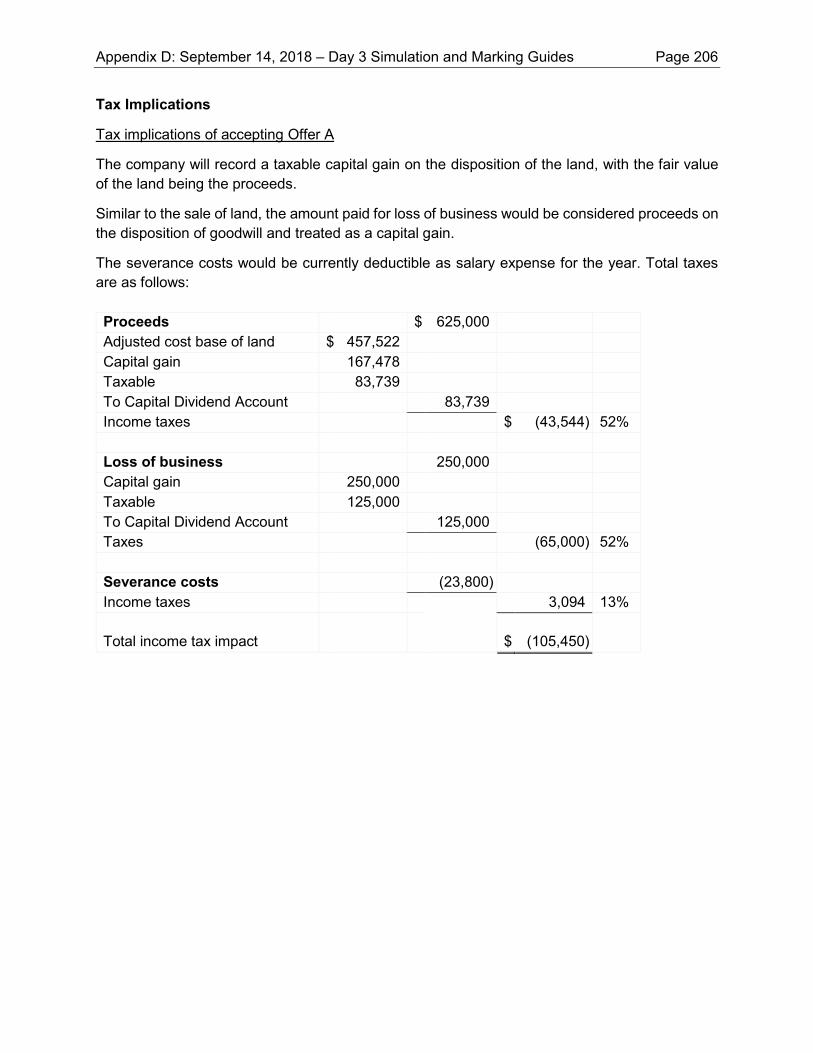
Tax Implications
Tax implications of accepting Offer A
The company will record a taxable capital gain on the disposition of the land, with the fair value of the land being the proceeds.
Similar to the sale of land, the amount paid for loss of business would be considered proceeds on the disposition of goodwill and treated as a capital gain.
The severance costs would be currently deductible as salary expense for the year. Total taxes are as follows: Proceeds $ 625,000 Adjusted cost base of land $ 457,522 Capital gain 167,478 Taxable 83,739 To Capital Dividend Account 83,739 Income taxes $ (43,544) 52% Loss of business 250,000 Capital gain 250,000 Taxable 125,000 To Capital Dividend Account 125,000 Taxes (65,000) 52% Severance costs (23,800) Income taxes 3,094 13%
Total income tax impact
$ (105,450)
Appendix D: September 14, 2018 – Day 3 Simulation and Marking Guides Page 206
The cash remaining after paying the tax will need to be distributed out of the company. The tax-free portion of the capital gains can be taken out of the Capital Dividend Account (CDA) tax-free, and the remaining amount available for distribution will be treated as a deemed dividend, subject to the gross-up and credit regime. Assuming the requirements are met, a dividend refund should result, which would reduce the net corporate taxes payable.
Since the assets being disposed of were used in the business, the capital gains will not be included in Adjusted Aggregate Investment Income and the small business deduction will not be limited.
If desired, the company can be wound up, so annual tax and other filings are not required.
Tax implication of accepting Offer B
The expropriation of the land results in an involuntary disposition. Since the substitute property was acquired within 24 months, the replacement property rules deem that there are no tax consequences of the effective sale of the old property (ss. 44(1)). An election must be filed to take advantage of these provisions.
The moving costs have all been amortized for purposes of the calculations performed above, but some of them may be deductible immediately. For example, all landscaping costs can be expensed, as can building moving costs, net of the government allowance.
The $20,000 cash relocation payment will be taxable immediately and the one-time advertising costs of $12,000 will be deductible immediately. The additional business income of $8,000 ($20,000 - $12,000), taxed on a net basis at 13%, will have a total impact of $1,040.
Capital cost allowance can be claimed on the roads (Class 17), new building (Class 1), well and toilet building (Class 1).
The boat dock would be considered a Class 3 asset for capital cost allowance purposes, and the boats would be considered Class 7 assets.
Other comments
Based on the loss for accounting purposes in 2018, it is likely that there was a loss for income tax purposes which was carried back to a prior year. However, this should be confirmed. If Offer A happens in 2020, however, it may be desirable to carry forward the loss to 2020, to reduce taxable income. Due to the income being mostly aggregate investment income, it would be subject to a much higher tax rate. Even with the time value of money, it will be more useful to carry the loss forward than to carry it back against earlier years of business income.
Appendix D: September 14, 2018 – Day 3 Simulation and Marking Guides Page 207
For this Assessment Opportunity #4 (Taxation), the candidate must be ranked in one of the following five categories: Not addressed – The candidate does not address this assessment opportunity. Nominal competence – The candidate does not meet the standards of reaching competence. Reaching competence – The candidate identifies the tax implications of either of the government offers. Competent – The candidate discusses the tax implications of either of the government offers. Competent with distinction – The candidate discusses the tax implications of each of the government offers. Assessment Opportunity #5 (Breadth and Depth Opportunity) The candidate calculates the contribution margin and break-even volume and discusses the qualitative factors for the possible new business venture (boating). The candidate demonstrates competence in Management Accounting. CPA Map Competencies: 3.5.1 Performs sensitivity analysis (Core – Level A) 3.5.2 Evaluates sustainable profit maximization and capacity management performance (Core – Level A) As requested, we have prepared a contribution margin and break-even volume analysis.
Appendix D: September 14, 2018 – Day 3 Simulation and Marking Guides Page 208
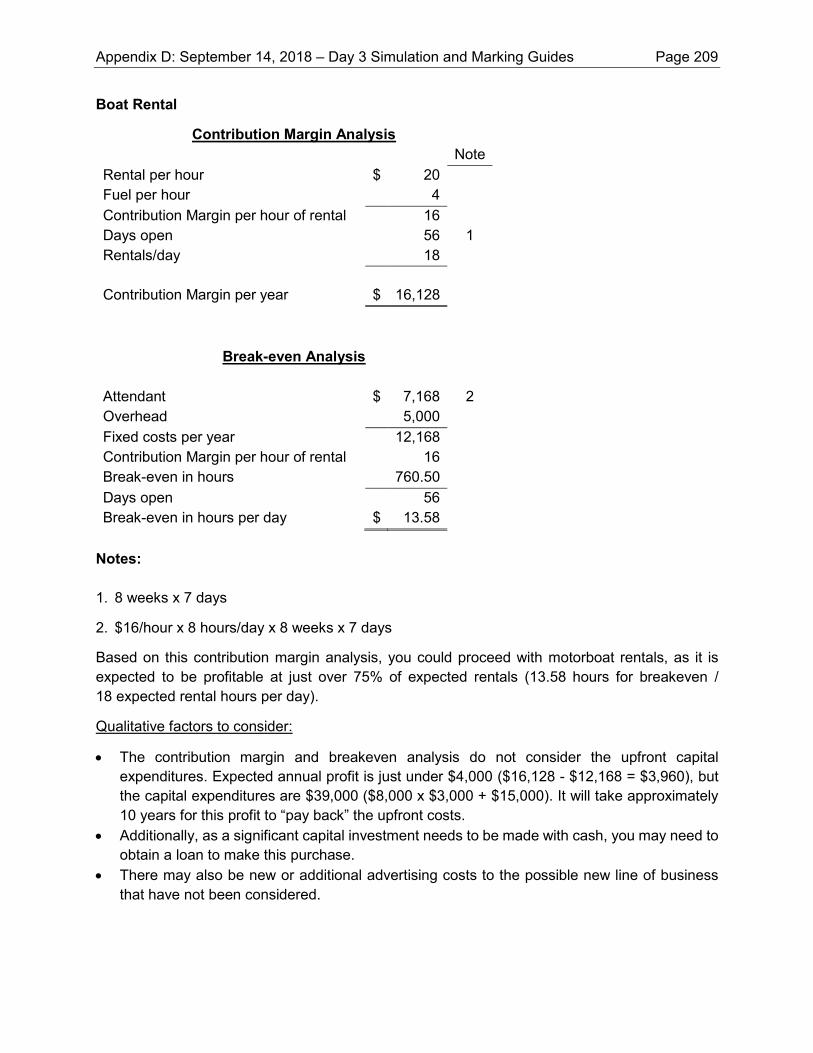
Boat Rental
Contribution Margin Analysis
Note
Rental per hour $ 20 Fuel per hour 4 Contribution Margin per hour of rental 16 Days open 56 1 Rentals/day 18 Contribution Margin per year
$ 16,128
Break-even Analysis
Attendant $ 7,168 2 Overhead 5,000 Fixed costs per year 12,168 Contribution Margin per hour of rental 16 Break-even in hours 760.50 Days open 56 Break-even in hours per day $ 13.58
Notes: 1. 8 weeks x 7 days
2. $16/hour x 8 hours/day x 8 weeks x 7 days
Based on this contribution margin analysis, you could proceed with motorboat rentals, as it is expected to be profitable at just over 75% of expected rentals (13.58 hours for breakeven / 18 expected rental hours per day).
Qualitative factors to consider:
• The contribution margin and breakeven analysis do not consider the upfront capital expenditures. Expected annual profit is just under $4,000 ($16,128 - $12,168 = $3,960), but the capital expenditures are $39,000 ($8,000 x $3,000 + $15,000). It will take approximately 10 years for this profit to “pay back” the upfront costs.
• Additionally, as a significant capital investment needs to be made with cash, you may need to obtain a loan to make this purchase.
• There may also be new or additional advertising costs to the possible new line of business that have not been considered.
Appendix D: September 14, 2018 – Day 3 Simulation and Marking Guides Page 209
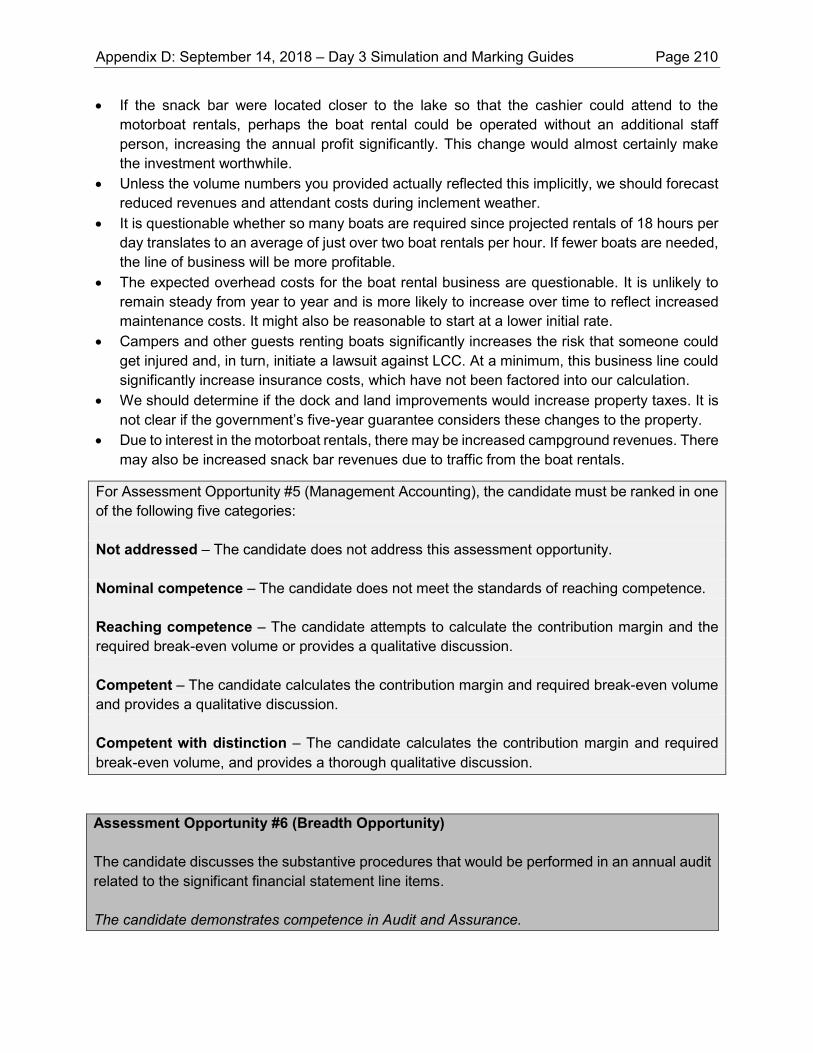
• If the snack bar were located closer to the lake so that the cashier could attend to the motorboat rentals, perhaps the boat rental could be operated without an additional staff person, increasing the annual profit significantly. This change would almost certainly make the investment worthwhile.
• Unless the volume numbers you provided actually reflected this implicitly, we should forecast reduced revenues and attendant costs during inclement weather.
• It is questionable whether so many boats are required since projected rentals of 18 hours per day translates to an average of just over two boat rentals per hour. If fewer boats are needed, the line of business will be more profitable.
• The expected overhead costs for the boat rental business are questionable. It is unlikely to remain steady from year to year and is more likely to increase over time to reflect increased maintenance costs. It might also be reasonable to start at a lower initial rate.
• Campers and other guests renting boats significantly increases the risk that someone could get injured and, in turn, initiate a lawsuit against LCC. At a minimum, this business line could significantly increase insurance costs, which have not been factored into our calculation.
• We should determine if the dock and land improvements would increase property taxes. It is not clear if the government’s five-year guarantee considers these changes to the property.
• Due to interest in the motorboat rentals, there may be increased campground revenues. There may also be increased snack bar revenues due to traffic from the boat rentals.
For Assessment Opportunity #5 (Management Accounting), the candidate must be ranked in one of the following five categories:
Not addressed – The candidate does not address this assessment opportunity. Nominal competence – The candidate does not meet the standards of reaching competence.
Reaching competence – The candidate attempts to calculate the contribution margin and the required break-even volume or provides a qualitative discussion.
Competent – The candidate calculates the contribution margin and required break-even volume and provides a qualitative discussion.
Competent with distinction – The candidate calculates the contribution margin and required break-even volume, and provides a thorough qualitative discussion.
Assessment Opportunity #6 (Breadth Opportunity)
The candidate discusses the substantive procedures that would be performed in an annual audit related to the significant financial statement line items.
The candidate demonstrates competence in Audit and Assurance.
Appendix D: September 14, 2018 – Day 3 Simulation and Marking Guides Page 210
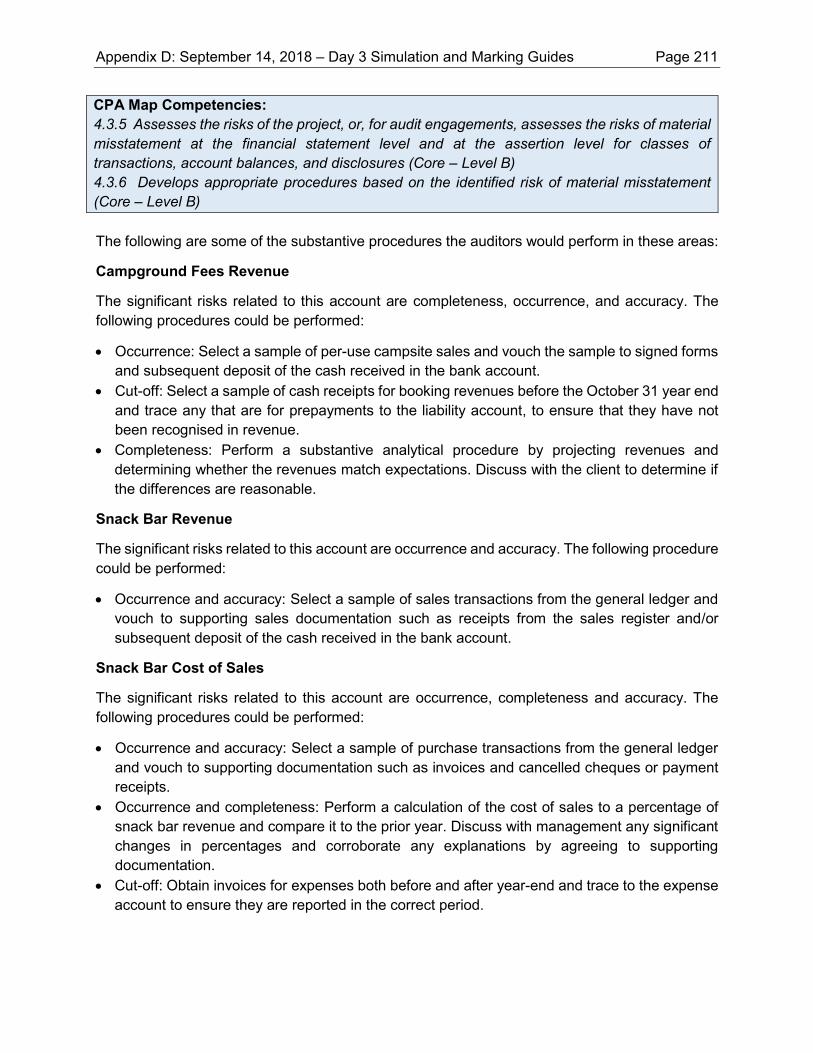
CPA Map Competencies: 4.3.5 Assesses the risks of the project, or, for audit engagements, assesses the risks of material misstatement at the financial statement level and at the assertion level for classes of transactions, account balances, and disclosures (Core – Level B) 4.3.6 Develops appropriate procedures based on the identified risk of material misstatement (Core – Level B) The following are some of the substantive procedures the auditors would perform in these areas:
Campground Fees Revenue
The significant risks related to this account are completeness, occurrence, and accuracy. The following procedures could be performed:
• Occurrence: Select a sample of per-use campsite sales and vouch the sample to signed forms and subsequent deposit of the cash received in the bank account.
• Cut-off: Select a sample of cash receipts for booking revenues before the October 31 year end and trace any that are for prepayments to the liability account, to ensure that they have not been recognised in revenue.
• Completeness: Perform a substantive analytical procedure by projecting revenues and determining whether the revenues match expectations. Discuss with the client to determine if the differences are reasonable.
Snack Bar Revenue
The significant risks related to this account are occurrence and accuracy. The following procedure could be performed:
• Occurrence and accuracy: Select a sample of sales transactions from the general ledger and vouch to supporting sales documentation such as receipts from the sales register and/or subsequent deposit of the cash received in the bank account.
Snack Bar Cost of Sales
The significant risks related to this account are occurrence, completeness and accuracy. The following procedures could be performed:
• Occurrence and accuracy: Select a sample of purchase transactions from the general ledger and vouch to supporting documentation such as invoices and cancelled cheques or payment receipts.
• Occurrence and completeness: Perform a calculation of the cost of sales to a percentage of snack bar revenue and compare it to the prior year. Discuss with management any significant changes in percentages and corroborate any explanations by agreeing to supporting documentation.
• Cut-off: Obtain invoices for expenses both before and after year-end and trace to the expense account to ensure they are reported in the correct period.
Appendix D: September 14, 2018 – Day 3 Simulation and Marking Guides Page 211
Repairs and Maintenance
The significant risks related to this account are classification, occurrence and completeness. The following procedures could be performed:
• Classification: Obtain invoices for a sample of repairs and maintenance expense items as well as capital asset acquisitions and review the details to determine if the items are repairs as opposed to capital items.
• Occurrence: Obtain invoices and payment receipts or cancelled cheques to determine that the expense incurred did occur.
• Completeness: Obtain a list of disbursements subsequent to year-end and obtain supporting documents (invoices, purchase orders) to determine whether the services were performed or items delivered before or after year-end.
For this Assessment Opportunity #6 (Assurance), the candidate must be ranked in one of the following five categories:
Not addressed – The candidate does not address this assessment opportunity.
Nominal competence – The candidate does not meet the standards of reaching competence.
Reaching competence – The candidate identifies some audit procedures that would be performed in an annual audit.
Competent – The candidate discusses some audit procedures that would be performed in an annual audit.
Competent with distinction – The candidate discusses several audit procedures that would be performed in an annual audit.
Appendix D: September 14, 2018 – Day 3 Simulation and Marking Guides Page 212
Case #2 (Suggested time: 80 minutes) Perkins Packing Inc. (PPI) is a private corporation founded in 1995. PPI provides redistribution services to retail companies (Appendix I). Peter Perkins, the founder, owned and operated PPI until he retired on December 31, 2017. His two children, Ann and Christopher, now own and operate PPI. It is January 2019 and you, CPA, are employed by a CPA firm (not PPI’s auditors) and Jaqueline Hamon, PPI’s CFO, has hired your firm to advise her on a few issues. PPI has always been profitable. However, Jaqueline is troubled by the substantial increase in warehouse payroll costs. As a first step, she would like you to perform a quantitative and qualitative analysis of the warehouse payroll costs by comparing the first half of 2018 with the last half of 2017 and discuss the potential causes for the increase. You discussed the business and the payroll system with Jaqueline (Appendix II). She also provided you with warehouse metrics (Appendix III). Jaqueline would then like you to quantify the costs and the benefits of the owners’ decision to eliminate the packing coordinators (Appendix IV), and provide your comments on the decision, so that she can include that information in a report to the owners. Jaqueline also suspects that the damage rate is increasing. She asks you to perform a quantitative analysis to confirm whether she is right, and to then discuss the probable causes. Information on damaged goods is in Appendix V. Jaqueline thinks it may be time to rethink PPI’s current practices because of the way they are affecting PPI’s operations. She asks you to suggest changes or new policies that could improve PPI’s operations and profitability, and to explain how the changes would help. Jaqueline also wants you to discuss any control weaknesses you identify within the payroll system and provide recommendations to improve them. Finally, Jaqueline realizes that a lot has changed in the last year. She wants to know whether you think that these changes align with PPI’s founder’s strategy and values.
Appendix D: September 14, 2018 – Day 3 Simulation and Marking Guides Page 213
APPENDIX I PPI’S OPERATIONS
In PPI’s warehouse, multiple skids of goods are unloaded from big trucks and reloaded onto smaller trucks, each destined for different stores. The trucks are all owned by the retail companies. PPI’s operations are not cyclical. However, some redistribution jobs are simple while others are more complex, involving coordinating multiple trucks and perishable or breakable items. If PPI damages the content on a skid, it must purchase the full skid of goods from the customer at wholesale prices. Because it would constitute competition with its customers, PPI is not allowed to resell any of the products it purchases. Instead, employees take whatever they want from the damaged goods before they are discarded. Although a formal policy was never set by Peter, employees came to expect this and the practice has continued. PPI operates three eight-hour shifts per day, Monday to Friday. Employees are expected to work 35 hours a week, one shift per day, Monday to Friday. Any additional hours required are scheduled on weekends only. While each shift had 12 employees up until June 30, 2018 (Appendix IV), each now has 10: one foreman; six forklift operators; and three truck packers. One packer for every two forklifts has been found to be optimal in meeting the company’s objective of being efficient while maintaining a low rate of damaged goods.
Appendix D: September 14, 2018 – Day 3 Simulation and Marking Guides Page 214
APPENDIX II DISCUSSION WITH JAQUELINE
“I have been with PPI since its inception. Peter did everything himself. He would often show up at 2:00 am to talk with the night shift employees and give them a pat on the back for their good work. Peter valued the employees and believed they are at the core of the business. Every Friday at lunch, Peter used to order pizza for everyone and gather the employees to distribute weekly awards, for things such as the longest streak without sick leave, the best team in terms of number of skids handled safely during the week, the best employee “idea” of the week. The winners would get a $100 gift certificate for a restaurant and a fleece jacket that cost PPI $75. Employees really appreciated these gatherings. Peter’s children thought the gatherings reduced productivity because they took longer than the lunch hour, so they discontinued them when Peter left. Peter signed every cheque, knew where every dollar was going and knew every employee and customer. He said PPI’s strategy was to treat their customers well. Now that he is retired, his children are struggling to manage PPI. “Our accounting department consists of three people: a head of the department; a supervisor reporting to the head of the department; and an accountant reporting to the supervisor. When an employee joins the company, the head of the department, or the supervisor when the head is absent, enters their details in the employee database. Any changes, such as a new bank account or pay raise, get entered in the same way. No one reviews the changes. Employee records remain active after employees are terminated. “Warehouse employees have an electronic badge with their name and picture on it, which they swipe at the card reader on their way in and out of work. The card reader sends the information collected to our payroll computer system, and every two weeks, the system generates a report of the hours worked by each employee. Monday to Friday hours are considered regular time, and any time worked on a Saturday or Sunday is considered overtime, paid at time-and-one-half. “The report goes directly to the accountant, or to the supervisor in the accountant’s absence, who reviews and adjusts the time if necessary. For example, employees accumulate 0.5 sick days per month. If an employee misses a day for any reason and has sufficient accumulated sick days, they are paid for that day. If not, the day is considered unpaid leave. There is no limit to the amount of unpaid leave an employee can take. Peter has always been very generous with unpaid leave and we are still very flexible, possibly because he originally hired mostly family members. “PPI has never used part-time employees. Each warehouse employee earns $20, $22 or $24 per hour plus benefits, depending on their years of service and position. “We are only understaffed in the warehouse when employees take unpaid leave. Employees taking unpaid leave seem to impact us every week now, especially because we don’t hire part-time staff. Fortunately, we have managed to meet every client commitment, albeit sometimes barely, through a push by employees, on weekends, to get the stuff out the door.”
Appendix D: September 14, 2018 – Day 3 Simulation and Marking Guides Page 215
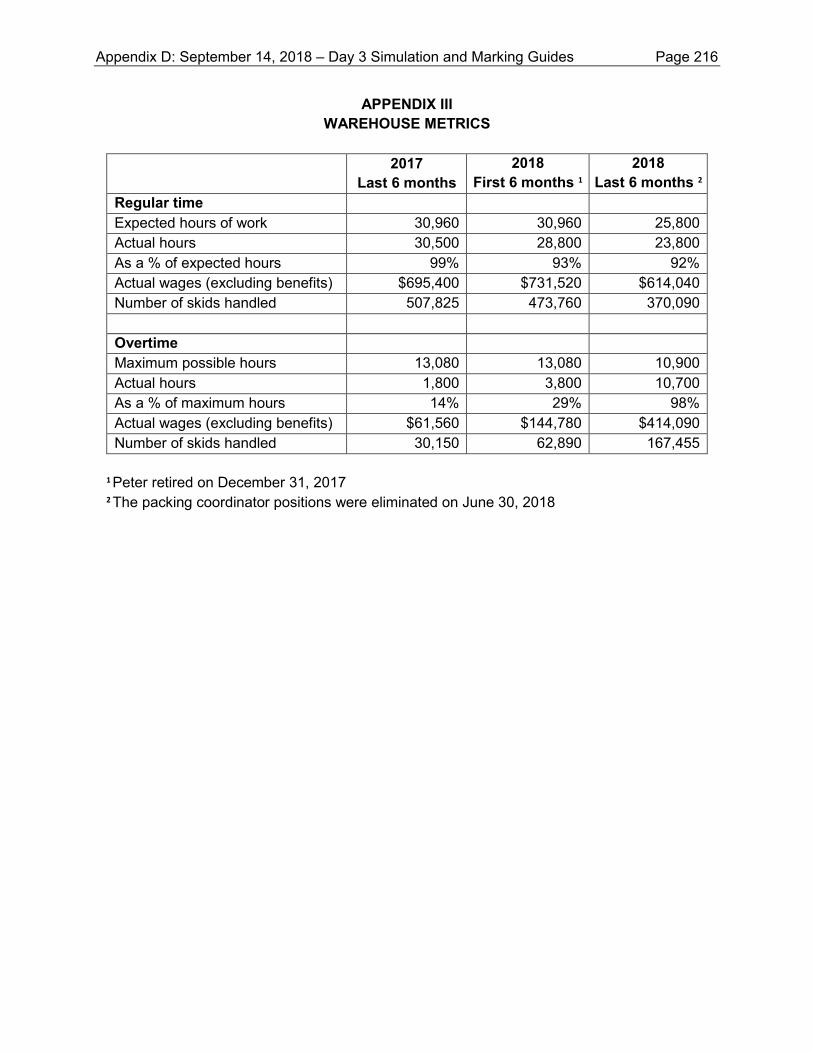
APPENDIX III WAREHOUSE METRICS
2017
Last 6 months 2018
First 6 months 1 2018
Last 6 months 2 Regular time
Expected hours of work 30,960 30,960 25,800 Actual hours 30,500 28,800 23,800 As a % of expected hours 99% 93% 92% Actual wages (excluding benefits) $695,400 $731,520 $614,040 Number of skids handled 507,825 473,760 370,090 Overtime Maximum possible hours 13,080 13,080 10,900 Actual hours 1,800 3,800 10,700 As a % of maximum hours 14% 29% 98% Actual wages (excluding benefits) $61,560 $144,780 $414,090 Number of skids handled 30,150 62,890 167,455
1 Peter retired on December 31, 2017
2 The packing coordinator positions were eliminated on June 30, 2018
Appendix D: September 14, 2018 – Day 3 Simulation and Marking Guides Page 216
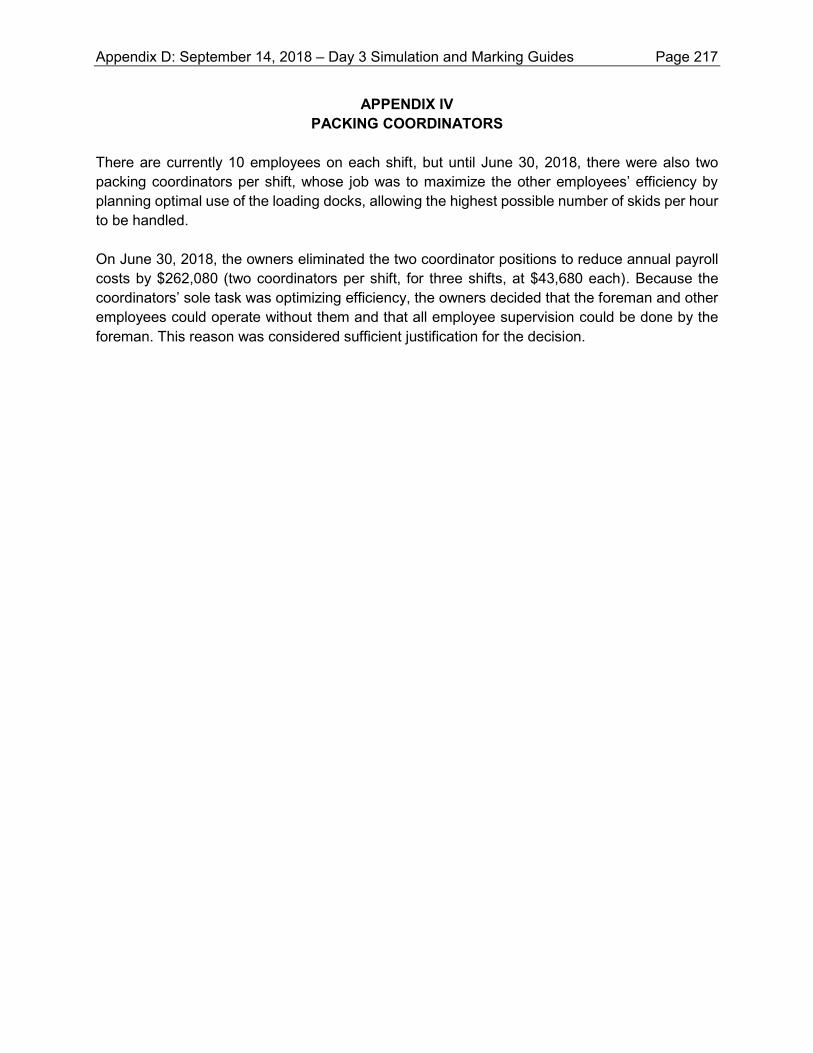
APPENDIX IV PACKING COORDINATORS
There are currently 10 employees on each shift, but until June 30, 2018, there were also two packing coordinators per shift, whose job was to maximize the other employees’ efficiency by planning optimal use of the loading docks, allowing the highest possible number of skids per hour to be handled. On June 30, 2018, the owners eliminated the two coordinator positions to reduce annual payroll costs by $262,080 (two coordinators per shift, for three shifts, at $43,680 each). Because the coordinators’ sole task was optimizing efficiency, the owners decided that the foreman and other employees could operate without them and that all employee supervision could be done by the foreman. This reason was considered sufficient justification for the decision.
Appendix D: September 14, 2018 – Day 3 Simulation and Marking Guides Page 217
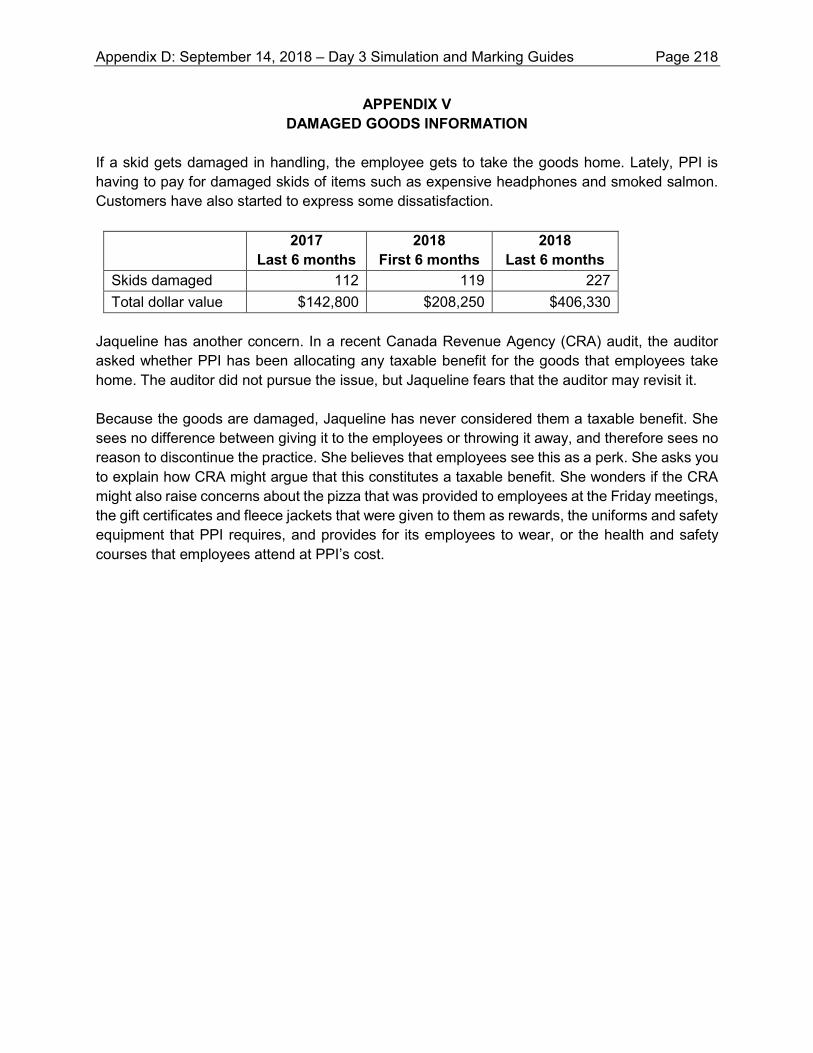
APPENDIX V DAMAGED GOODS INFORMATION
If a skid gets damaged in handling, the employee gets to take the goods home. Lately, PPI is having to pay for damaged skids of items such as expensive headphones and smoked salmon. Customers have also started to express some dissatisfaction.
2017 Last 6 months
2018 First 6 months
2018 Last 6 months
Skids damaged 112 119 227 Total dollar value $142,800 $208,250 $406,330
Jaqueline has another concern. In a recent Canada Revenue Agency (CRA) audit, the auditor asked whether PPI has been allocating any taxable benefit for the goods that employees take home. The auditor did not pursue the issue, but Jaqueline fears that the auditor may revisit it. Because the goods are damaged, Jaqueline has never considered them a taxable benefit. She sees no difference between giving it to the employees or throwing it away, and therefore sees no reason to discontinue the practice. She believes that employees see this as a perk. She asks you to explain how CRA might argue that this constitutes a taxable benefit. She wonders if the CRA might also raise concerns about the pizza that was provided to employees at the Friday meetings, the gift certificates and fleece jackets that were given to them as rewards, the uniforms and safety equipment that PPI requires, and provides for its employees to wear, or the health and safety courses that employees attend at PPI’s cost.
Appendix D: September 14, 2018 – Day 3 Simulation and Marking Guides Page 218
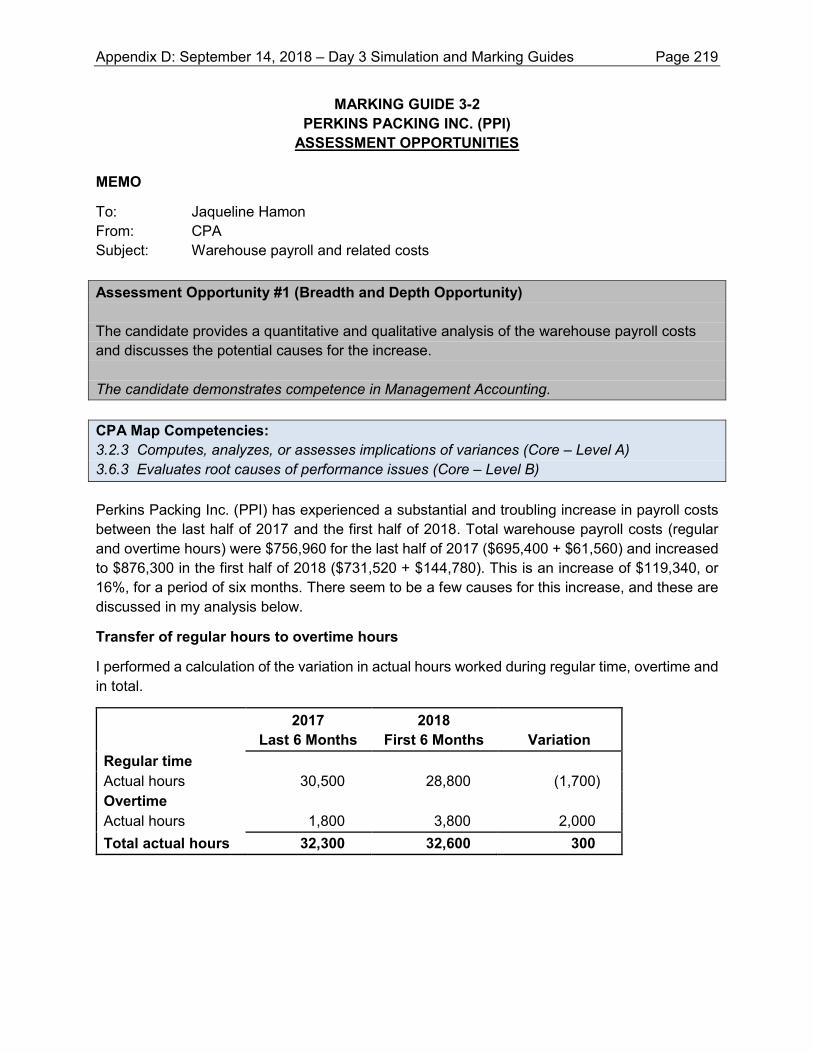
MARKING GUIDE 3-2 PERKINS PACKING INC. (PPI)
ASSESSMENT OPPORTUNITIES MEMO
To: Jaqueline Hamon From: CPA Subject: Warehouse payroll and related costs Assessment Opportunity #1 (Breadth and Depth Opportunity)
The candidate provides a quantitative and qualitative analysis of the warehouse payroll costs and discusses the potential causes for the increase.
The candidate demonstrates competence in Management Accounting. CPA Map Competencies: 3.2.3 Computes, analyzes, or assesses implications of variances (Core – Level A) 3.6.3 Evaluates root causes of performance issues (Core – Level B) Perkins Packing Inc. (PPI) has experienced a substantial and troubling increase in payroll costs between the last half of 2017 and the first half of 2018. Total warehouse payroll costs (regular and overtime hours) were $756,960 for the last half of 2017 ($695,400 + $61,560) and increased to $876,300 in the first half of 2018 ($731,520 + $144,780). This is an increase of $119,340, or 16%, for a period of six months. There seem to be a few causes for this increase, and these are discussed in my analysis below.
Transfer of regular hours to overtime hours
I performed a calculation of the variation in actual hours worked during regular time, overtime and in total.
2017
Last 6 Months 2018
First 6 Months Variation Regular time Actual hours 30,500 28,800 (1,700) Overtime Actual hours 1,800 3,800 2,000 Total actual hours 32,300 32,600 300
Appendix D: September 14, 2018 – Day 3 Simulation and Marking Guides Page 219
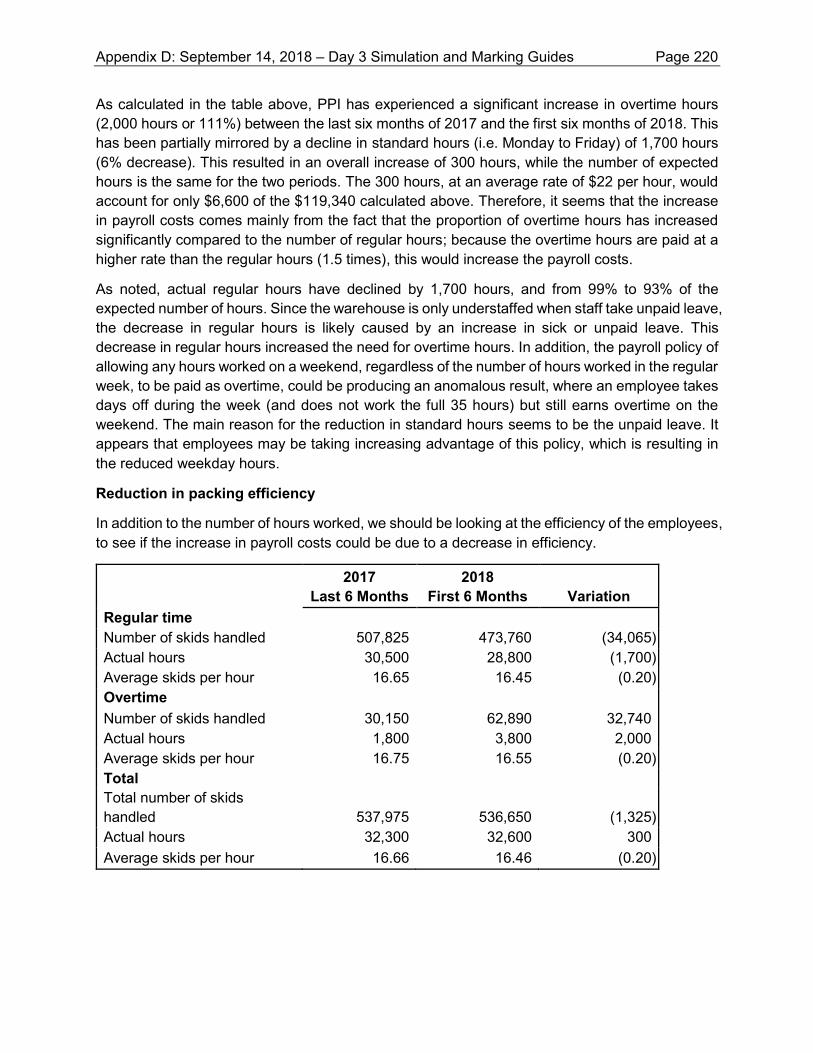
As calculated in the table above, PPI has experienced a significant increase in overtime hours (2,000 hours or 111%) between the last six months of 2017 and the first six months of 2018. This has been partially mirrored by a decline in standard hours (i.e. Monday to Friday) of 1,700 hours (6% decrease). This resulted in an overall increase of 300 hours, while the number of expected hours is the same for the two periods. The 300 hours, at an average rate of $22 per hour, would account for only $6,600 of the $119,340 calculated above. Therefore, it seems that the increase in payroll costs comes mainly from the fact that the proportion of overtime hours has increased significantly compared to the number of regular hours; because the overtime hours are paid at a higher rate than the regular hours (1.5 times), this would increase the payroll costs.
As noted, actual regular hours have declined by 1,700 hours, and from 99% to 93% of the expected number of hours. Since the warehouse is only understaffed when staff take unpaid leave, the decrease in regular hours is likely caused by an increase in sick or unpaid leave. This decrease in regular hours increased the need for overtime hours. In addition, the payroll policy of allowing any hours worked on a weekend, regardless of the number of hours worked in the regular week, to be paid as overtime, could be producing an anomalous result, where an employee takes days off during the week (and does not work the full 35 hours) but still earns overtime on the weekend. The main reason for the reduction in standard hours seems to be the unpaid leave. It appears that employees may be taking increasing advantage of this policy, which is resulting in the reduced weekday hours.
Reduction in packing efficiency
In addition to the number of hours worked, we should be looking at the efficiency of the employees, to see if the increase in payroll costs could be due to a decrease in efficiency.
2017 Last 6 Months
2018 First 6 Months Variation
Regular time Number of skids handled 507,825 473,760 (34,065) Actual hours 30,500 28,800 (1,700) Average skids per hour 16.65 16.45 (0.20) Overtime Number of skids handled 30,150 62,890 32,740 Actual hours 1,800 3,800 2,000 Average skids per hour 16.75 16.55 (0.20) Total Total number of skids handled 537,975 536,650 (1,325) Actual hours 32,300 32,600 300 Average skids per hour 16.66 16.46 (0.20)
Appendix D: September 14, 2018 – Day 3 Simulation and Marking Guides Page 220
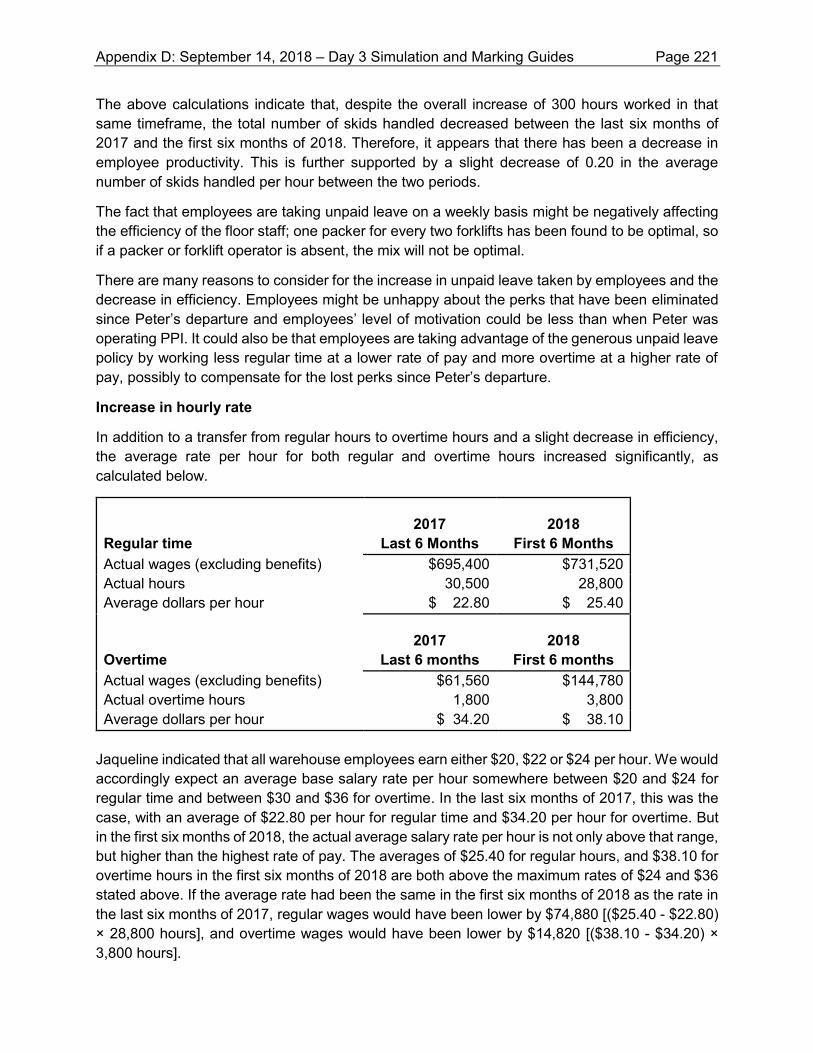
The above calculations indicate that, despite the overall increase of 300 hours worked in that same timeframe, the total number of skids handled decreased between the last six months of 2017 and the first six months of 2018. Therefore, it appears that there has been a decrease in employee productivity. This is further supported by a slight decrease of 0.20 in the average number of skids handled per hour between the two periods.
The fact that employees are taking unpaid leave on a weekly basis might be negatively affecting the efficiency of the floor staff; one packer for every two forklifts has been found to be optimal, so if a packer or forklift operator is absent, the mix will not be optimal.
There are many reasons to consider for the increase in unpaid leave taken by employees and the decrease in efficiency. Employees might be unhappy about the perks that have been eliminated since Peter’s departure and employees’ level of motivation could be less than when Peter was operating PPI. It could also be that employees are taking advantage of the generous unpaid leave policy by working less regular time at a lower rate of pay and more overtime at a higher rate of pay, possibly to compensate for the lost perks since Peter’s departure.
Increase in hourly rate
In addition to a transfer from regular hours to overtime hours and a slight decrease in efficiency, the average rate per hour for both regular and overtime hours increased significantly, as calculated below.
Regular time 2017
Last 6 Months 2018
First 6 Months Actual wages (excluding benefits) $695,400 $731,520 Actual hours 30,500 28,800 Average dollars per hour $ 22.80 $ 25.40
Overtime 2017
Last 6 months 2018
First 6 months Actual wages (excluding benefits) $61,560 $144,780 Actual overtime hours 1,800 3,800 Average dollars per hour $ 34.20 $ 38.10
Jaqueline indicated that all warehouse employees earn either $20, $22 or $24 per hour. We would accordingly expect an average base salary rate per hour somewhere between $20 and $24 for regular time and between $30 and $36 for overtime. In the last six months of 2017, this was the case, with an average of $22.80 per hour for regular time and $34.20 per hour for overtime. But in the first six months of 2018, the actual average salary rate per hour is not only above that range, but higher than the highest rate of pay. The averages of $25.40 for regular hours, and $38.10 for overtime hours in the first six months of 2018 are both above the maximum rates of $24 and $36 stated above. If the average rate had been the same in the first six months of 2018 as the rate in the last six months of 2017, regular wages would have been lower by $74,880 [($25.40 - $22.80) × 28,800 hours], and overtime wages would have been lower by $14,820 [($38.10 - $34.20) × 3,800 hours].
Appendix D: September 14, 2018 – Day 3 Simulation and Marking Guides Page 221
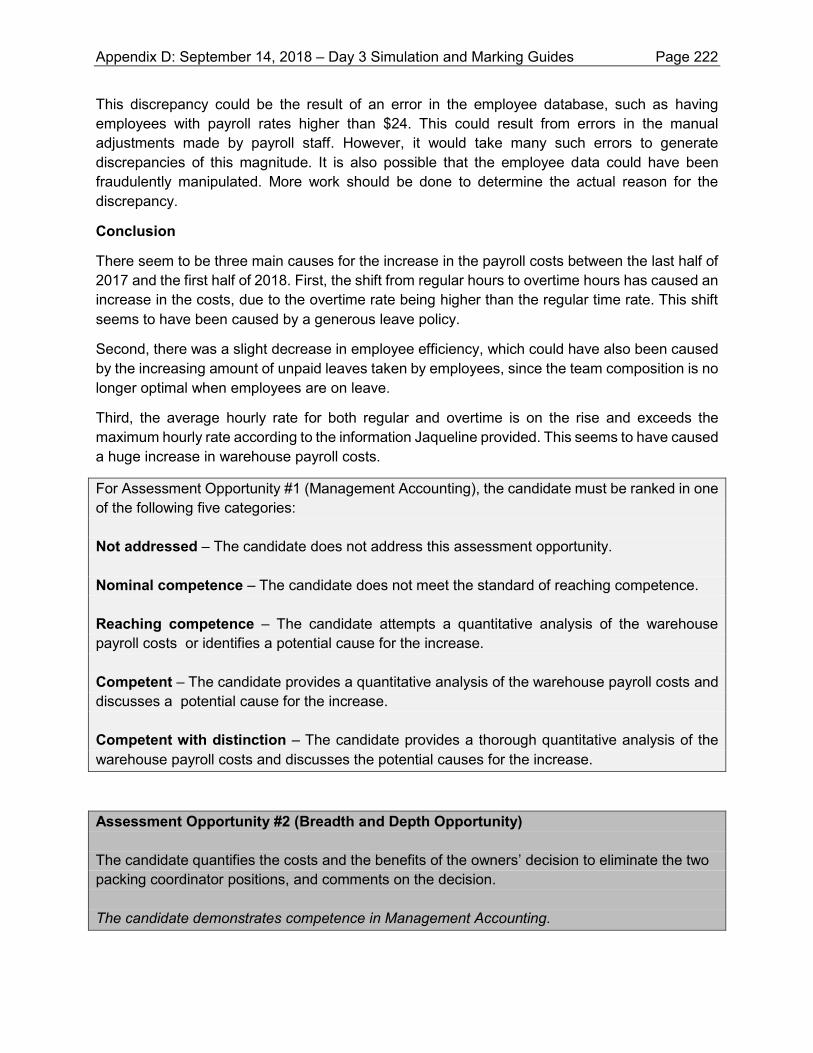
This discrepancy could be the result of an error in the employee database, such as having employees with payroll rates higher than $24. This could result from errors in the manual adjustments made by payroll staff. However, it would take many such errors to generate discrepancies of this magnitude. It is also possible that the employee data could have been fraudulently manipulated. More work should be done to determine the actual reason for the discrepancy.
Conclusion
There seem to be three main causes for the increase in the payroll costs between the last half of 2017 and the first half of 2018. First, the shift from regular hours to overtime hours has caused an increase in the costs, due to the overtime rate being higher than the regular time rate. This shift seems to have been caused by a generous leave policy.
Second, there was a slight decrease in employee efficiency, which could have also been caused by the increasing amount of unpaid leaves taken by employees, since the team composition is no longer optimal when employees are on leave.
Third, the average hourly rate for both regular and overtime is on the rise and exceeds the maximum hourly rate according to the information Jaqueline provided. This seems to have caused a huge increase in warehouse payroll costs.
For Assessment Opportunity #1 (Management Accounting), the candidate must be ranked in one of the following five categories: Not addressed – The candidate does not address this assessment opportunity. Nominal competence – The candidate does not meet the standard of reaching competence. Reaching competence – The candidate attempts a quantitative analysis of the warehouse payroll costs or identifies a potential cause for the increase. Competent – The candidate provides a quantitative analysis of the warehouse payroll costs and discusses a potential cause for the increase. Competent with distinction – The candidate provides a thorough quantitative analysis of the warehouse payroll costs and discusses the potential causes for the increase. Assessment Opportunity #2 (Breadth and Depth Opportunity) The candidate quantifies the costs and the benefits of the owners’ decision to eliminate the two packing coordinator positions, and comments on the decision. The candidate demonstrates competence in Management Accounting.
Appendix D: September 14, 2018 – Day 3 Simulation and Marking Guides Page 222
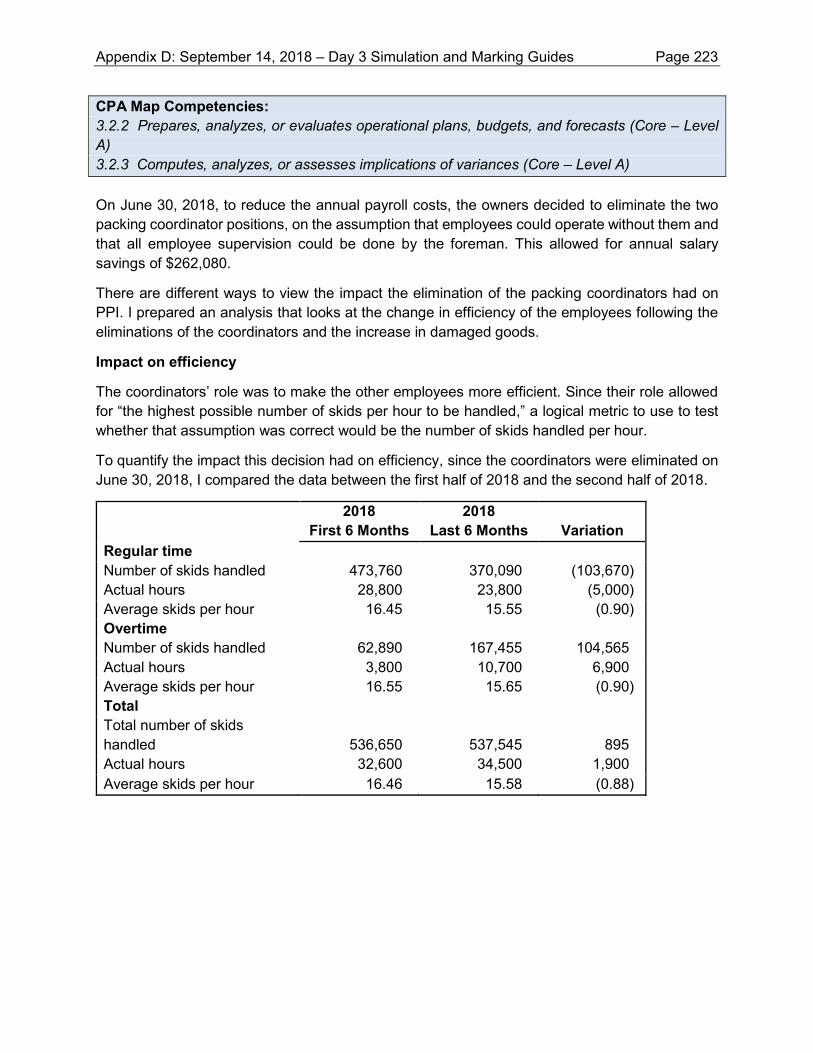
CPA Map Competencies: 3.2.2 Prepares, analyzes, or evaluates operational plans, budgets, and forecasts (Core – Level A) 3.2.3 Computes, analyzes, or assesses implications of variances (Core – Level A) On June 30, 2018, to reduce the annual payroll costs, the owners decided to eliminate the two packing coordinator positions, on the assumption that employees could operate without them and that all employee supervision could be done by the foreman. This allowed for annual salary savings of $262,080.
There are different ways to view the impact the elimination of the packing coordinators had on PPI. I prepared an analysis that looks at the change in efficiency of the employees following the eliminations of the coordinators and the increase in damaged goods.
Impact on efficiency
The coordinators’ role was to make the other employees more efficient. Since their role allowed for “the highest possible number of skids per hour to be handled,” a logical metric to use to test whether that assumption was correct would be the number of skids handled per hour.
To quantify the impact this decision had on efficiency, since the coordinators were eliminated on June 30, 2018, I compared the data between the first half of 2018 and the second half of 2018.
2018
First 6 Months 2018
Last 6 Months Variation Regular time Number of skids handled 473,760 370,090 (103,670) Actual hours 28,800 23,800 (5,000) Average skids per hour 16.45 15.55 (0.90) Overtime Number of skids handled 62,890 167,455 104,565 Actual hours 3,800 10,700 6,900 Average skids per hour 16.55 15.65 (0.90) Total Total number of skids handled 536,650 537,545 895 Actual hours 32,600 34,500 1,900 Average skids per hour 16.46 15.58 (0.88)
Appendix D: September 14, 2018 – Day 3 Simulation and Marking Guides Page 223
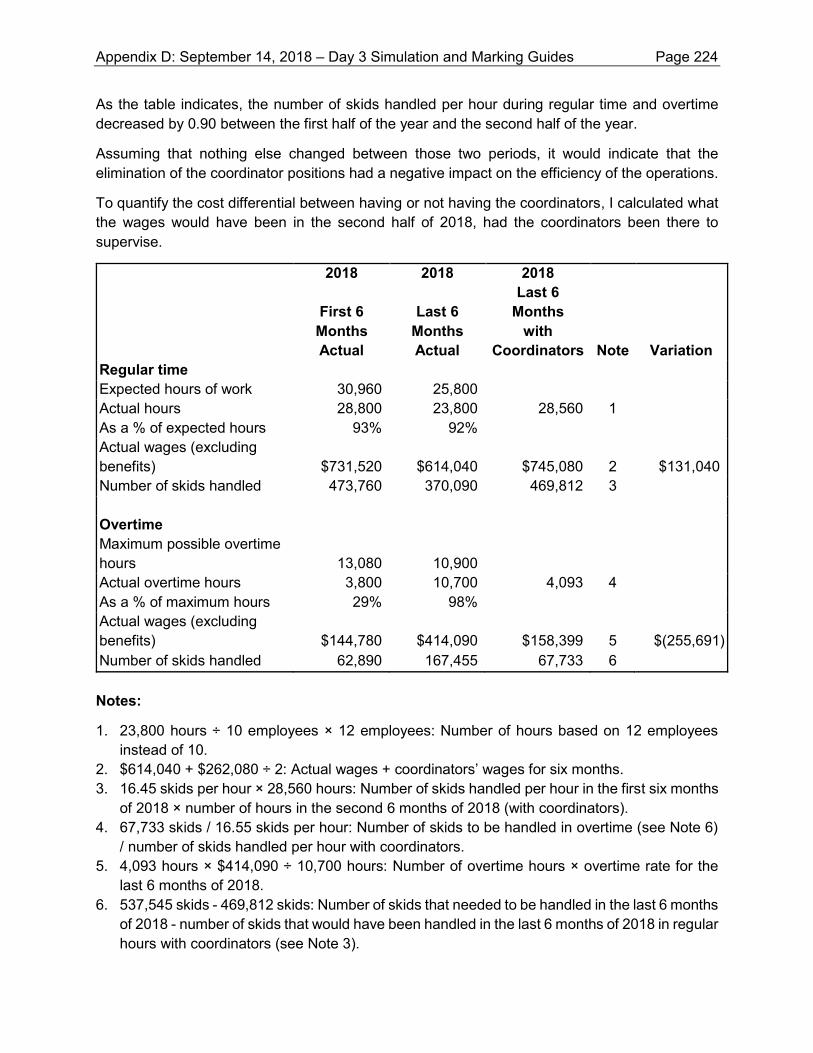
As the table indicates, the number of skids handled per hour during regular time and overtime decreased by 0.90 between the first half of the year and the second half of the year.
Assuming that nothing else changed between those two periods, it would indicate that the elimination of the coordinator positions had a negative impact on the efficiency of the operations.
To quantify the cost differential between having or not having the coordinators, I calculated what the wages would have been in the second half of 2018, had the coordinators been there to supervise.
2018
First 6 Months Actual
2018
Last 6 Months Actual
2018 Last 6
Months with
Coordinators Note Variation Regular time Expected hours of work 30,960 25,800 Actual hours 28,800 23,800 28,560 1 As a % of expected hours 93% 92% Actual wages (excluding benefits) $731,520 $614,040 $745,080 2 $131,040 Number of skids handled 473,760 370,090 469,812 3 Overtime Maximum possible overtime hours 13,080 10,900 Actual overtime hours 3,800 10,700 4,093 4 As a % of maximum hours 29% 98% Actual wages (excluding benefits) $144,780 $414,090 $158,399 5 $(255,691) Number of skids handled 62,890 167,455 67,733 6 Notes:
1. 23,800 hours ÷ 10 employees × 12 employees: Number of hours based on 12 employees instead of 10.
2. $614,040 + $262,080 ÷ 2: Actual wages + coordinators’ wages for six months. 3. 16.45 skids per hour × 28,560 hours: Number of skids handled per hour in the first six months
of 2018 × number of hours in the second 6 months of 2018 (with coordinators). 4. 67,733 skids / 16.55 skids per hour: Number of skids to be handled in overtime (see Note 6)
/ number of skids handled per hour with coordinators. 5. 4,093 hours × $414,090 ÷ 10,700 hours: Number of overtime hours × overtime rate for the
last 6 months of 2018. 6. 537,545 skids - 469,812 skids: Number of skids that needed to be handled in the last 6 months
of 2018 - number of skids that would have been handled in the last 6 months of 2018 in regular hours with coordinators (see Note 3).
Appendix D: September 14, 2018 – Day 3 Simulation and Marking Guides Page 224
From this analysis, we see that the savings in overtime could be $255,691 for six months, or $511,382 per year, which well exceeds the $262,080 additional payroll cost of keeping the coordinators. The savings come from a reduced number of hours worked due to the efficiency gained by having the coordinators working in the warehouse, but also from the fact that some of the overtime hours would be worked during regular hours, at a lower hourly rate.
Increase in damaged goods
The number of skids damaged increased from 119 to 227 between the first half of 2018 and the second half of 2018. The total dollar value of the damaged goods increased by $198,080 ($406,330 - $208,250) for the same period. Since the coordinators were eliminated in the second half of 2018, it could be assumed that the elimination of the coordinators had a major impact on the increase in the number of skids damaged between first half of 2018 and second half of 2018. Part of the increase could also be due to the increase in the number of skids handled during the second half of 2018, compared to the first half. However, this increase is less than 1% (895 ÷ 536,650) and is therefore insignificant.
Since the savings in salary for six months is $131,040 ($262,080 ÷ 2), we could conclude that solely based on the increase in the value of the damaged goods, the decision to eliminate the packing coordinators cost $67,040 ($198,080 - $131,040) for six months.
The increase in the number of skids damaged could be caused by the foreman now doing the coordinating job that the packing coordinators were doing. The foreman might not have enough time to do it properly since they already had their own workload to manage, resulting in employees working with less directions and guidance and causing more accidents in the warehouse.
Conclusion
Multiples factors support the conclusion that the decision to eliminate the coordinators was not appropriate. The role of the coordinators was to optimize the efficiency of the loading docks. However, my analysis above shows that the efficiency was lower after the coordinator positions were eliminated. It also shows that the number of skids damaged and therefore the total value of the damaged goods increased after the coordinator positions were eliminated.
Therefore, I would recommend rehiring the coordinators, as it seems that they do maximize the employees’ efficiency.
Appendix D: September 14, 2018 – Day 3 Simulation and Marking Guides Page 225
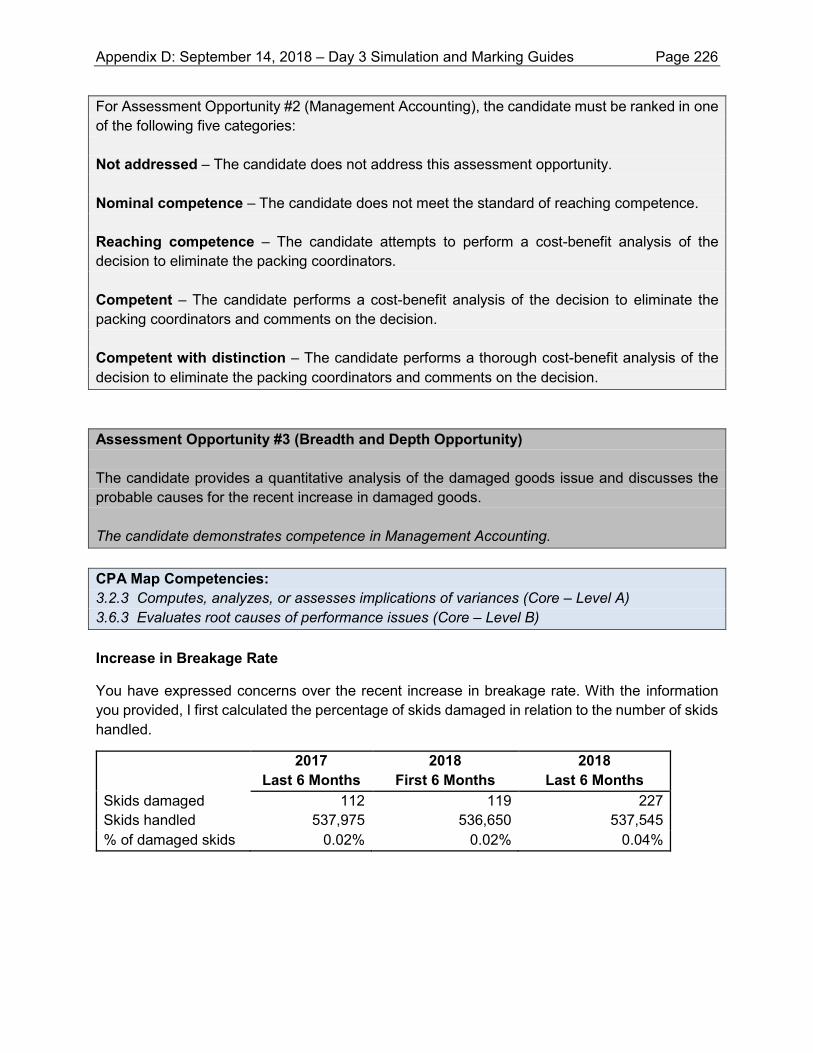
For Assessment Opportunity #2 (Management Accounting), the candidate must be ranked in one of the following five categories:
Not addressed – The candidate does not address this assessment opportunity.
Nominal competence – The candidate does not meet the standard of reaching competence.
Reaching competence – The candidate attempts to perform a cost-benefit analysis of the decision to eliminate the packing coordinators.
Competent – The candidate performs a cost-benefit analysis of the decision to eliminate the packing coordinators and comments on the decision.
Competent with distinction – The candidate performs a thorough cost-benefit analysis of the decision to eliminate the packing coordinators and comments on the decision.
Assessment Opportunity #3 (Breadth and Depth Opportunity)
The candidate provides a quantitative analysis of the damaged goods issue and discusses the probable causes for the recent increase in damaged goods.
The candidate demonstrates competence in Management Accounting.
CPA Map Competencies: 3.2.3 Computes, analyzes, or assesses implications of variances (Core – Level A) 3.6.3 Evaluates root causes of performance issues (Core – Level B)
Increase in Breakage Rate
You have expressed concerns over the recent increase in breakage rate. With the information you provided, I first calculated the percentage of skids damaged in relation to the number of skids handled.
2017 Last 6 Months
2018 First 6 Months
2018 Last 6 Months
Skids damaged 112 119 227 Skids handled 537,975 536,650 537,545 % of damaged skids 0.02% 0.02% 0.04%
Appendix D: September 14, 2018 – Day 3 Simulation and Marking Guides Page 226
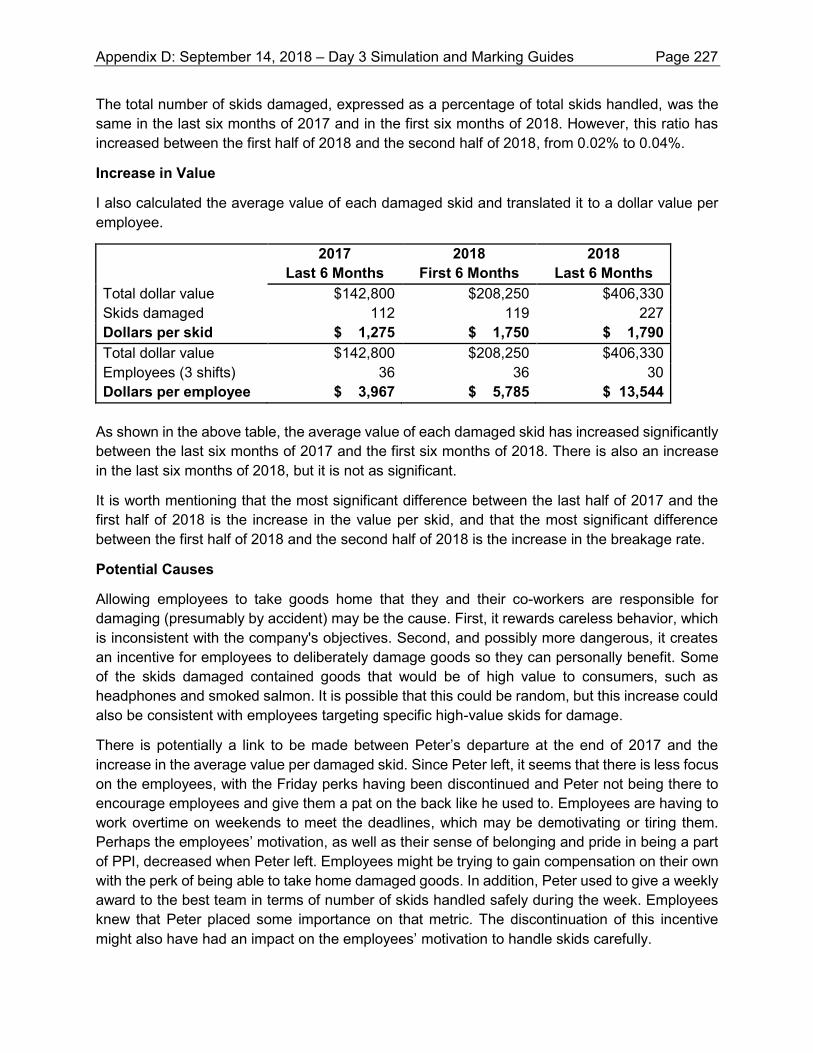
The total number of skids damaged, expressed as a percentage of total skids handled, was the same in the last six months of 2017 and in the first six months of 2018. However, this ratio has increased between the first half of 2018 and the second half of 2018, from 0.02% to 0.04%.
Increase in Value
I also calculated the average value of each damaged skid and translated it to a dollar value per employee.
2017
Last 6 Months 2018
First 6 Months 2018
Last 6 Months Total dollar value $142,800 $208,250 $406,330 Skids damaged 112 119 227 Dollars per skid $ 1,275 $ 1,750 $ 1,790 Total dollar value $142,800 $208,250 $406,330 Employees (3 shifts) 36 36 30 Dollars per employee $ 3,967 $ 5,785 $ 13,544
As shown in the above table, the average value of each damaged skid has increased significantly between the last six months of 2017 and the first six months of 2018. There is also an increase in the last six months of 2018, but it is not as significant.
It is worth mentioning that the most significant difference between the last half of 2017 and the first half of 2018 is the increase in the value per skid, and that the most significant difference between the first half of 2018 and the second half of 2018 is the increase in the breakage rate.
Potential Causes
Allowing employees to take goods home that they and their co-workers are responsible for damaging (presumably by accident) may be the cause. First, it rewards careless behavior, which is inconsistent with the company's objectives. Second, and possibly more dangerous, it creates an incentive for employees to deliberately damage goods so they can personally benefit. Some of the skids damaged contained goods that would be of high value to consumers, such as headphones and smoked salmon. It is possible that this could be random, but this increase could also be consistent with employees targeting specific high-value skids for damage.
There is potentially a link to be made between Peter’s departure at the end of 2017 and the increase in the average value per damaged skid. Since Peter left, it seems that there is less focus on the employees, with the Friday perks having been discontinued and Peter not being there to encourage employees and give them a pat on the back like he used to. Employees are having to work overtime on weekends to meet the deadlines, which may be demotivating or tiring them. Perhaps the employees’ motivation, as well as their sense of belonging and pride in being a part of PPI, decreased when Peter left. Employees might be trying to gain compensation on their own with the perk of being able to take home damaged goods. In addition, Peter used to give a weekly award to the best team in terms of number of skids handled safely during the week. Employees knew that Peter placed some importance on that metric. The discontinuation of this incentive might also have had an impact on the employees’ motivation to handle skids carefully.
Appendix D: September 14, 2018 – Day 3 Simulation and Marking Guides Page 227
This issue could be quite significant, not only for the impact it has on financial performance, but for the impact on overall corporate ethics. If employees continue breaking items deliberately, it could lead to an overall decline in corporate ethical culture and encourage employees to commit even greater improprieties. My recommendations for the damaged goods policy are discussed later in this report.
There is also a potential link to be made between the elimination of the coordinator positions mid-year, and the increase in the breakage rate in the second half of 2018. Perhaps the moving of skids is more chaotic without the coordinators around, exposing PPI to a higher breakage rate.
For Assessment Opportunity #3 (Management Accounting), the candidate must be ranked in one of the following five categories: Not addressed – The candidate does not address this assessment opportunity. Nominal competence – The candidate does not meet the standard of reaching competence. Reaching competence – The candidate attempts a quantitative analysis of the damaged goods issue and attempts to identify one of the potential causes for the recent increase in damaged goods. Competent – The candidate provides a quantitative analysis of the damaged goods issue and discusses one of the potential causes for the recent increase in damaged goods. Competent with distinction – The candidate provides a quantitative analysis of the damaged goods issue, discusses more than one potential cause for the recent increase in damaged goods, and identifies the possibility of deliberate breakage, recognizing the link to PPI’s policy. Assessment Opportunity #4 (Breadth Opportunity) The candidate analyzes the income tax implications of the benefits provided by PPI. The candidate demonstrates competence in Taxation. CPA Map Competencies: 6.2.2 Determines income taxes payable for an individual in routine situations (Core – Level B) Damaged Goods
An employee is required to include in taxable income all income earned by virtue of employment. Employees are eligible to receive gifts from an employer, up to $500 per year, without any taxable benefits. However, these gifts have to be given on special occasions, such as on birthdays or for special celebrations. This is not the case for the damaged goods, so if considered a taxable benefit, the whole amount would be taxable as part of the employee’s remuneration.
Appendix D: September 14, 2018 – Day 3 Simulation and Marking Guides Page 228
For the benefit calculation, the value used for those goods is generally the fair market value (or, in some cases, the employer’s cost). The precise value of the damaged goods is unknown. Some of the goods are likely damaged beyond use and have no value at all. Others might be partially damaged and could have a value greater than zero but less than a pristine new product, and some of the goods might not be damaged at all.
It is clear that the employees believe that the value of these goods is greater than zero. As the breakage rate has been increasing, the amount taken home increases. In fact, the value might be very significant. In the last half of 2018, the total dollar value of skids damaged was $406,330, or $13,544 per each of PPI’s 30 warehouse employees. Even if the value of the salvageable goods was only 10% of that total, the average employee would be obtaining a benefit of almost $1,354. As this is based on wholesale prices, it could be argued that the retail value to the employees was even higher.
It might, however, be difficult for PPI to establish a meaningful value for these damaged goods. Many will be so damaged that they will be completely worthless. Any arbitrary percentage, such as the 10% used above to illustrate, would be completely without basis.
Further, the benefit to the employee might be much less than the market value. An employee might take home a dented can of chicken soup if it is offered for free but would not have bought it at the store.
There is a strong possibility that CRA could insist on some level of taxable benefit being imputed. This would not only result in a taxable benefit to employees, which they would not appreciate, but CRA could insist that PPI institute a system for tracking which employee has taken which item and require that PPI value it before it is taken off the premises. Such a system could be difficult and expensive to institute. You should consult with a GST/HST specialist to determine if there are sales tax implications as well.
Uniforms, Safety Equipment and Health and Safety Courses
In order to determine whether a taxable benefit exists, we must determine the primary beneficiary of the uniforms and safety equipment supplied to PPI’s employees.
Because employees would not be allowed to work without wearing these items, the benefit is clearly to PPI. These are items used on the job on a daily basis, and it seems unlikely that employees would use them outside of work. Therefore, this would not be a taxable benefit to the employees. The CRA confirms this policy in its Employers’ Guide – Taxable Benefits and Allowance (publication T4130), chapter 3:
“Your employee does not receive a taxable benefit if either of the following conditions apply:
• You supply your employee with a distinctive uniform he or she has to wear while carrying out the employment duties
• You provide your employee with protective clothing (including safety footwear and safety glasses) designed to protect him or her from hazards associated with the employment”
Appendix D: September 14, 2018 – Day 3 Simulation and Marking Guides Page 229
For the health and safety courses, a similar principle applies. Since these courses are about health and safety, which are important in a warehousing environment where employees could get seriously injured or where skids of customers’ products could be dropped, the benefit is clearly in favour of PPI. Employees who are better trained will perform better, and the risk of lawsuits related to injuries will decrease. While employees could, in theory, take these skills and use them elsewhere, there is no guarantee that they would do so, nor is there any reason to assume they would even take these courses if not required to by PPI. This is therefore not a taxable benefit to the employees. It is also in line with CRA’s policy in the same document:
“General employment-related training
We generally consider that other business-related courses, although not directly related to your own business, are taken mainly for your benefit.
For example, fees you pay for stress management, employment equity, first aid, and language courses are not a taxable benefit.”
Free Pizza
In the case of the free pizza, because it was provided for the convenience of the employer (the lunch was provided so they could have the meeting during the employees’ lunch break), it is not a taxable benefit.
Alternatively, it could be argued that these lunches are “social events,” where CRA’s policy clearly excludes from taxable benefits events that cost less than $150 per employee:
“If you provide a free party or other social event to all your employees and the cost is $150 per person or less, we do not consider it to be a taxable benefit.”
$100 Gift Certificates
The $100 gift certificates to restaurants are considered a near-cash benefit, which is taxable regardless of the amount, since it is considered part of the remuneration. Specifically, CRA states:
“Regardless of the cost, the following gifts and awards are considered a taxable employment benefit: cash or near-cash gifts and awards such as Christmas or holiday bonuses or near-cash gifts and awards such as gift certificates;”
Fleece Jackets
The fleece jackets given to the employees as an award are considered gifts, since they are for a special occasion. Therefore, they are not taxable, up to a limit of $500 per employee per year. In this case, the jackets won by the employees are not taxable, unless one employee wins multiple jackets in a year and that total amount adds up to more than $500 for the year.
Appendix D: September 14, 2018 – Day 3 Simulation and Marking Guides Page 230
In T4130, CRA specifies:
“You may give an employee an unlimited number of non-cash gifts and awards with a combined total value of $500 or less annually. If the FMV of the gifts and awards you give your employee is greater than $500, the amount over $500 must be included in the employee's income. For example, if you give gifts and awards with a total value of $650, there is a taxable benefit of $150 ($650 – $500).
“Items of small or trivial value do not have to be included when calculating the total value of gifts and awards given in the year for the purpose of the exemption. Examples of items of small or trivial value include: coffee or tea, T-shirts with employer's logos, mugs, plaques or trophies.”
For Assessment Opportunity #4 (Taxation), the candidate must be ranked in one of the following five categories: Not addressed – The candidate does not address this assessment opportunity. Nominal competence – The candidate does not meet the standard of reaching competence. Reaching competence – The candidate attempts to discuss the potential taxable benefits. Competent – The candidate discusses the potential taxable benefits and concludes. Competent with distinction – The candidate discusses the potential taxable benefits and concludes. The candidate identifies the consequences to PPI of continuing with its current policy or provides additional insight. Assessment Opportunity #5 (Breadth Opportunity) The candidate suggests changes to current practices or new policies that could improve PPI’s operations and profitability and explains how the changes would help. The candidate demonstrates competence in Strategy and Governance. CPA Map Competencies: 2.1.1 Evaluates the entity’s governance structure (policies, processes, codes) (Core – Level B) The issues identified in the warehouse need to be addressed, as they are significantly affecting warehouse payroll costs and PPI’s operations and profitability. The issues seem to source back to the current practices and how they are motivating employees to act.
Appendix D: September 14, 2018 – Day 3 Simulation and Marking Guides Page 231
Overtime
PPI currently defines any time worked on a weekend as overtime, without reference to the hours worked within the same week. Given the decline in regular hours worked, it appears likely that employees are working less than 35 hours during the week but still earning overtime on the weekends. This is inappropriate and inconsistent with standard business practice. It is also creating an incentive for employees to work less during the regular hours and more during overtime hours, in order to earn more money for the same amount of work.
Recommendation
PPI should instate a policy that is consistent with standard business practice, that is, that overtime is only paid when an employee exceeds a certain number of hours worked in the week.
PPI should also monitor and control overtime hours per employee, by having them approved by the foreman or the HR manager, to ensure that no employee is working at an unsafe level of fatigue.
Part-Time Employees
PPI has never employed part-time employees. An employee on sick or unpaid leave could affect the optimal ratio of one packer for every two forklifts, and therefore PPI could be operating with less efficiency.
Recommendation
Management should revisit the decision of not hiring part-time employees. Having part-time or temporary employees could be beneficial, as it would provide PPI with more flexibility in staffing, allowing for short-term vacancies to be filled. It could also provide help during the full-time employees’ summer vacations.
Unpaid Leave
PPI’s generous unpaid leave policy appears to be contributing to several issues. It is increasing the need for overtime and decreasing team efficiency. It is also possible that it is perpetuating a vicious cycle in which employees work both days on the weekend, get tired, and then take a day or two off during the week, creating the need for overtime on the following weekend. Employees taking leave regularly also disturb the optimal ratio of one packer for every two forklifts, which has a great influence on warehouse efficiency.
Recommendation
PPI’s unpaid leave system does not appear to be workable. PPI should change to a less generous system, more consistent with standard business practice; for example, one in which unpaid leave is only given in special circumstances, and only with prior approval from the human resources department, so that staffing can be planned ahead.
Appendix D: September 14, 2018 – Day 3 Simulation and Marking Guides Page 232
Damaged Goods Policy
PPI’s current practice to allow employees to take home damaged goods is creating an incentive for employees to purposely damage skids while handling them, and especially skids that contain valuable items. This is encouraging behaviours that are in opposition to PPI’s objectives.
Recommendation
PPI should discontinue its current practice of allowing employees to take damaged goods home. Such goods should be stored in a locked area to which regular employees do not have access. PPI should request permission from its customers to donate the damaged goods to food banks or to charities (i.e. non-for-profit organizations independent of PPI). PPI should also renegotiate its agreement with customers in order to pay only for the goods that are damaged rather than for the entire skid of goods. To compensate for this lost perk, PPI should find other ways to encourage and remunerate employees.
Friday Perks
Peter’s children have decided to eliminate the Friday perks, where Peter used to gather the employees, order pizza for everyone and distribute weekly awards. This practice was discontinued based on the fact that, since employees were taking a longer lunch hour, it negatively impacted productivity.
Recommendation
To show employees what values and metrics are important to PPI, the company should reinstate this practice. It would provide employees with a sense of belonging and a motivation to do their job well.
For Assessment Opportunity #5 (Strategy and Governance), the candidate must be ranked in one of the following five categories:
Not addressed – The candidate does not address this assessment opportunity. Nominal competence – The candidate does not meet the standard of reaching competence. Reaching competence – The candidate identifies some changes or new policies that could improve PPI’s operations and profitability. Competent – The candidate discusses some changes or new policies that could improve PPI’s operations and profitability. Competent with distinction – The candidate discusses several changes or new policies that could improve PPI’s operations and profitability and clearly explains how the changes would help.
Appendix D: September 14, 2018 – Day 3 Simulation and Marking Guides Page 233
Assessment Opportunity #6 (Breadth Opportunity) The candidate discusses the control weaknesses within the payroll system, and provides recommendations to improve them. The candidate demonstrates competence in Audit and Assurance. CPA Map Competencies: 4.1.1 Assesses the entity’s risk assessment processes (Core – Level A) 4.1.2 Evaluates the information system, including the related processes (Core – Level B) Jaqueline asked for an assessment of the controls within the payroll system to ensure they are functioning properly and to discuss possible improvements.
I have identified a number of issues with respect to PPI’s payroll control systems.
Segregation of Duties
Weakness: The supervisor has the ability to modify employee data, in particular to add new employees or change remuneration rates, and also has the ability to approve or process payroll payments. PPI’s supervisor acts as backup to both the head of the department and the accountant, and accordingly has access to both functions.
Implication: The supervisor could create a false employee and then process the payments for that employee or change their own compensation amount.
Recommendation: The supervisor should not have access to the employee database. Only the head of the department should have access to it, and the CFO, or some other non-payroll employee, should back up the head of the department. To reduce the risk of false employees in the system, any new employee created in the system by the supervisor should be approved by the head of the department.
Approval of Employee Time
Weakness: Under the current system, the employee time is tracked electronically using employees’ badges and the info is sent directly to the payroll system. The time system generates a report, but it is not approved by the foreman or other warehouse management personnel.
Implication: This would allow an employee to clock in and out for an absent employee, or potentially for a non-existent employee (depending on the control of the badges, since the employees are left in the database even after they are terminated). It would also allow employees to clock in even if they are not working.
Appendix D: September 14, 2018 – Day 3 Simulation and Marking Guides Page 234
Recommendation: Before going to the accounting department for processing, the time report should go to the appropriate shift foreman or manager for review and approval.
Management of Employee Database
Weakness: Employee records remain active even after employees are terminated and the database does not appear to be reviewed on a regular basis.
Implication: This would permit the creation of fictitious employees, or the manipulation of employee data, such as pay rates and years of service. This could be done by the head of the department or supervisor, or by some other internal or external person who has “hacked” the system.
Recommendation: The database should be reviewed on a regular basis by an employee not involved in its ongoing updating and maintenance. That person could check for pre-defined anomalies (such as payroll rates higher than $24) as well as check this database against the payroll report to identify anomalies such as retired employees still receiving a pay cheque. PPI should see if it is possible to set a restriction within the current payroll system, not allowing any rates higher than $24 per hour. Another recommendation would be to remove departed employees from the system and archive that data elsewhere.
Adjustments to Time not Reviewed
Weakness: The accountant or supervisor can make adjustments to the time clock data that are not approved or reviewed.
Implication: This would allow them to manipulate the number of hours worked.
Recommendation: Any changes to the time records, such as adjustments for sick time or other leave (now approved by the foreman as recommended above) should be documented and approved by the head of the department. A “payroll change report” for each pay period should be produced and reviewed by the head of the department, and perhaps even the CFO, depending on the number of changes that occur and the desired level of control.
Appendix D: September 14, 2018 – Day 3 Simulation and Marking Guides Page 235
For Assessment Opportunity #6 (Audit and Assurance), the candidate must be ranked in one of the following five categories: Not addressed – The candidate does not address this assessment opportunity. Nominal competence – The candidate does not meet the standard of reaching competence. Reaching competence – The candidate identifies some of the control weaknesses within the payroll system and provides recommendations to improve them. Competent – The candidate discusses some of the control weaknesses within the payroll system and provides recommendations to improve them. Competent with distinction – The candidate discusses several of the control weaknesses within the payroll system and provides recommendations to improve them. Assessment Opportunity #7 (Breadth Opportunity) The candidate discusses whether the changes in the past year align with PPI’s founder’s strategy and values. The candidate demonstrates competence in Strategy and Governance. CPA Map Competencies: 2.4.1 Analyzes the key operational issues and alignment with strategy (Core – Level B) You want to know whether the changes in the past year align with PPI’s founder’s strategy and values. PPI’s founder believed that employees are at the core of the business. He also believed that PPI maintains its competitive advantage by treating its customers well. I have analyzed each change in terms of whether it aligns with these beliefs.
Discontinuation of the Friday Perks
The owners recently decided to discontinue the Friday perks. Employees no longer get together as a group on Fridays, and no longer receive awards for good performance. They also no longer receive the prizes that came with the “win.” Employees seemed to really enjoy these gatherings on Fridays.
Peter was also very present in the daily operations. He knew every employee and would often show up to talk with the night shift and compliment them for their good work. This was likely a great motivator for the employees. Peter’s children, in comparison, do not seem as involved and are struggling to manage the operations.
Appendix D: September 14, 2018 – Day 3 Simulation and Marking Guides Page 236
Although the Friday gatherings reduced the number of working hours, they were a great source of motivation for the employees and encouraged behaviours that align with PPI’s ultimate strategy of being efficient and profitable. With the awards and the team spirit that came with it, employees were motivated to work well together, be efficient and provide quality work. The only perk that remains is to take damaged goods home, which contravenes PPI’s goals by rewarding employees for careless behaviours.
Elimination of the Friday perks is not a good fit with PPI’s founder’s strategy to treat its employees as being at the core of the business. The employees are showing signs of decreased motivation and this is starting to be detrimental to the business.
Elimination of Packing Coordinator Positions
As previously discussed, the elimination of the coordinator positions has decreased operational efficiency, which has led to PPI barely meeting customer deadlines. The breakage rate has also increased, and whether caused by the elimination of the coordinator positions or by employees deliberately damaging skids, it has led to an increased level of customer dissatisfaction. Although PPI pays for the damaged inventory, the goods are not available to the customers to deliver to their own clients.
The elimination of the coordinator positions is therefore not aligned with PPI’s founder’s strategy to treat its customers well.
Change in Control Environment
When Peter was managing PPI, he signed every cheque, knew where every dollar was going and knew every employee and customer. The control environment was stronger when Peter was there, since he provided an overview and ensured that operations were running smoothly. In Peter’s absence, his children are struggling to manage PPI and a lot of the high-level controls have disappeared.
This situation has led to some questionable results, such as the discrepancy in hourly rates and, as previously discussed, some unsatisfactory employee behaviours.
This change in the control environment is not aligned with PPI’s founder’s strategy as it is causing behaviours that reduce PPI’s profitability and smooth running of the organization and could result in additional customer dissatisfaction.
Recommendation
Peter’s children need to take actions that will realign the operations with PPI’s founder’s strategy to value its employees and customers. They should reinstate some of the practices that Peter had put in place, such as some or all of the Friday perks. They should also put more emphasis on taking care of their customers, by ensuring that they meet deadlines and improve operations in order to provide undamaged goods.
Appendix D: September 14, 2018 – Day 3 Simulation and Marking Guides Page 237
It seems that Peter’s children should get more involved in the daily operations of the business, just as Peter did, to show their employees how important they are to the business. Recognition of effort is an effective method of motivating employees.
For Assessment Opportunity #7 (Strategy and Governance), the candidate must be ranked in one of the following five categories: Not addressed – The candidate does not address this assessment opportunity. Nominal competence – The candidate does not meet the standard of reaching competence. Reaching competence – The candidate recognizes that the recent changes are not aligned with PPI’s founder’s strategy and values. Competent – The candidate discusses how the recent changes are not aligned with PPI’s founder’s strategy and values. Competent with distinction – The candidate thoroughly discusses how some of the recent changes are not aligned with PPI’s founder’s strategy and values.
Appendix D: September 14, 2018 – Day 3 Simulation and Marking Guides Page 238
Case #3 (Suggested time: 70 minutes) King Street Theatre (KST) is a Canadian-controlled private corporation that operates a for-profit neighbourhood theatre in Toronto, Ontario. KST was founded in 2014 by Ellen Chang, the managing director. Ellen’s vision was to provide a venue in which performers could showcase their skills and creativity while earning a living from their art, and give the community access to live theatre. The primary revenue source is ticket sales, although refreshments are also sold during performances. KST has a Board of Directors with three members, Andy, Claire and Ellen. During their last meeting, Ellen presented a summary of current operations (Appendix I) and Andy submitted a proposal to increase ticket sales (Appendix II). It is December 15, 2018, and you, CPA, have been engaged to provide consulting services to Ellen and KST. Ellen is looking for a quantitative and qualitative analysis of Andy’s proposal. Ellen has arranged a bank loan and the bank is asking for a review engagement, at a minimum. Ellen has only heard of an audit. She would like you to explain the difference between an audit and a review. In addition, she would like to see examples of the procedures that would be performed on the theatre’s operating expenses in both cases. KST entered into an agreement to lease a new soundboard for the theatre (Appendix III). Ellen would like to know how the lease should be accounted for under ASPE on KST's 2018 financial statements. KST is expecting to finish 2018 with a profit of about $30,000. Ellen estimates that KST had losses for income tax purposes of $5,000 in each of its first four taxation years. KST also incurred a capital loss of $3,500 three years ago and made charitable donations of $1,000 last year. Ellen is wondering if these losses or donations can be used to reduce any taxes payable there may be this year. She has never filed a corporate tax return for KST and asks when KST’s corporate income tax return and payment are due for the year ending December 31, 2018, now that KST is profitable. Ellen also asks about the filing and payment requirements and deadlines for GST/HST, as she is not sure she has been doing it properly. While Ellen appreciates the advice from Andy and Claire, she would like you to suggest ways to improve KST's board and the role it plays. Her notes on the board are in Appendix IV.
Appendix D: September 14, 2018 – Day 3 Simulation and Marking Guides Page 239

APPENDIX I SUMMARY OF OPERATIONS
KST’s 800-seat theatre offers, on average, 15 different shows each year, with 10 performances of each show. The average ticket price is $30 and the theatre is, on average, 60% full. KST pays the performers 30% of their performances’ gross ticket revenues and performers do not receive any other remuneration from KST. KST currently sells refreshments during performances. About 65% of the patrons spend an average of $8 on refreshments, which cost KST an average of $2. The refreshments are served by two drama students, who are each paid $30 per show. There are no other incremental costs.
Appendix D: September 14, 2018 – Day 3 Simulation and Marking Guides Page 240
APPENDIX II ANDY'S PROPOSAL – ONLINE TICKETING
Andy proposes that KST add online ticket purchasing to its current telephone and box office sales. Andy believes that online buyers who are used to the convenience of online shopping will not bother to telephone for tickets or buy at the box office. Andy recommends that KST enter into a three-year contract with ShowTix, a marketing and ticketing site owned by his brother. ShowTix claims that use of their service will result in 3,000 tickets sold online in the first year, 6,000 in the second year and 12,000 in the third year. They expect that one-third of all online sales will be from new patrons. ShowTix Proposal ShowTix works with many similar venues, providing online ticket purchasing and payment. ShowTix will add a link to KST’s existing website that will take users to the ShowTix site, where they can purchase tickets. ShowTix will accept payment and notify KST of the tickets purchased. On a weekly basis, ShowTix will remit the funds received, less its commission, directly to KST’s bank account, and will submit a summary of ticket sales to Andy, who will approve the reports before forwarding them to KST’s accounting department. ShowTix will also provide KST with cross-marketing services. ShowTix would like access to KST’s client database, including customer names, addresses and other personal information. ShowTix would use this information to send emails to KST and non-KST clients, recommending both KST shows and non-KST shows. The ticket sale projections have factored in this cross-marketing service. ShowTix will charge KST an upfront fee of $20,000 and an ongoing fee of 15% of the total gross ticket sales made through its online service.
Appendix D: September 14, 2018 – Day 3 Simulation and Marking Guides Page 241
APPENDIX III LEASE TERM DETAILS
• KST entered into a 10-year lease agreement for a state-of-the-art soundboard to be used for
all performances. • The lease agreement allows KST to use the soundboard at an annual lease rate of $17,000,
paid at the beginning of each year. • The soundboard’s retail sales price is $150,000, and will be worth about $50,000 in 10 years. • It is estimated that the soundboard will have a useful life of 15 years. • KST has the option to purchase the soundboard at the end of the lease for $50,000. • KST’s borrowing rate is 6%.
Appendix D: September 14, 2018 – Day 3 Simulation and Marking Guides Page 242
APPENDIX IV ELLEN’S NOTES ON THE BOARD OF DIRECTORS
I formed a board a year ago for independent business advice when making decisions about KST’s operations. Both Andy and Claire are actors who regularly perform at KST. I often seek advice from them on operational decisions. They have helped significantly by referring Andy’s brother, as well as with other projects. Andy even proposed a supplier for the soundboard lease. I almost went with this supplier, but I found another supplier whose prices were much lower and chose them. I am wondering whether I should increase the number of board members. I have a childhood friend whose personality would fit right in with Andy and Claire. He operates an apartment building, so he knows what it is like to deal with clients, just like we do at the theatre. There is also my uncle, who has time since recently retiring from his career in accounting. I wonder if there is anything else I should expect the board to be doing. Is there anything else I should be considering in terms of their role?
Appendix D: September 14, 2018 – Day 3 Simulation and Marking Guides Page 243
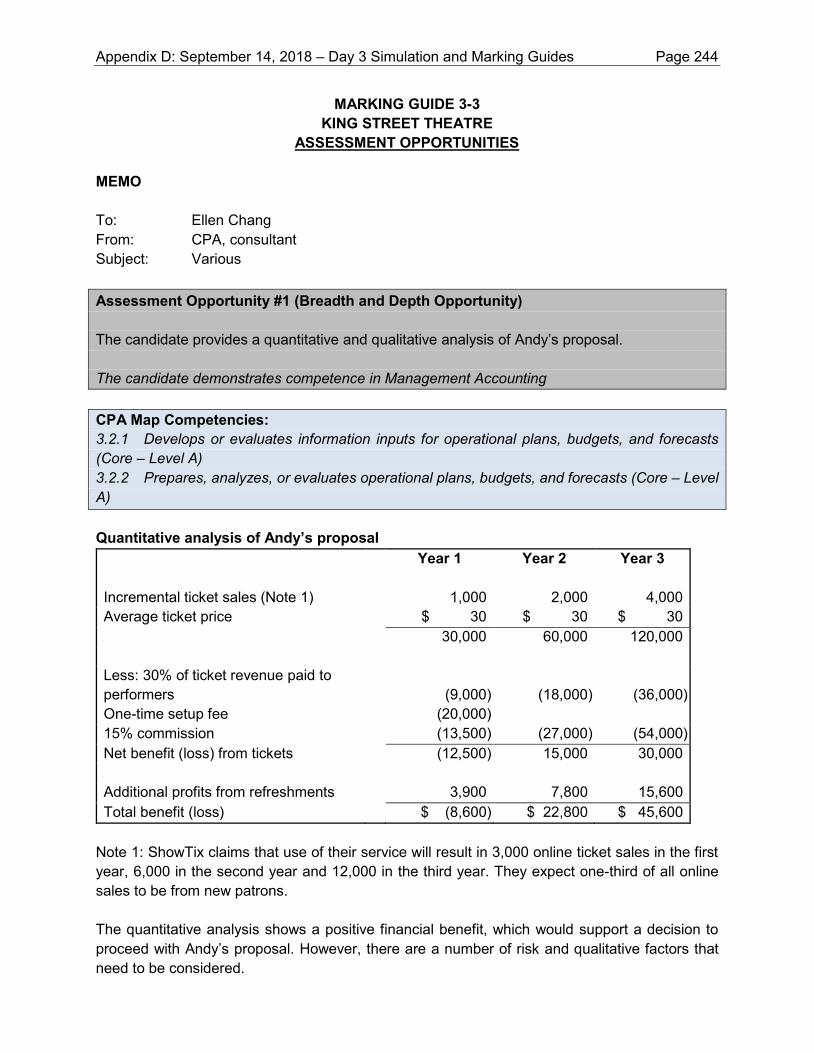
MARKING GUIDE 3-3 KING STREET THEATRE
ASSESSMENT OPPORTUNITIES MEMO To: Ellen Chang From: CPA, consultant Subject: Various Assessment Opportunity #1 (Breadth and Depth Opportunity) The candidate provides a quantitative and qualitative analysis of Andy’s proposal. The candidate demonstrates competence in Management Accounting CPA Map Competencies: 3.2.1 Develops or evaluates information inputs for operational plans, budgets, and forecasts (Core – Level A)
3.2.2 Prepares, analyzes, or evaluates operational plans, budgets, and forecasts (Core – Level A)
Quantitative analysis of Andy’s proposal Year 1 Year 2 Year 3
Incremental ticket sales (Note 1) 1,000 2,000
4,000 Average ticket price $ 30 $ 30 $ 30 30,000 60,000 120,000 Less: 30% of ticket revenue paid to performers (9,000) (18,000) (36,000) One-time setup fee (20,000) 15% commission (13,500) (27,000) (54,000) Net benefit (loss) from tickets (12,500) 15,000 30,000 Additional profits from refreshments 3,900 7,800 15,600 Total benefit (loss) $ (8,600) $ 22,800 $ 45,600
Note 1: ShowTix claims that use of their service will result in 3,000 online ticket sales in the first year, 6,000 in the second year and 12,000 in the third year. They expect one-third of all online sales to be from new patrons. The quantitative analysis shows a positive financial benefit, which would support a decision to proceed with Andy’s proposal. However, there are a number of risk and qualitative factors that need to be considered.
Appendix D: September 14, 2018 – Day 3 Simulation and Marking Guides Page 244
Qualitative analysis of Andy’s proposal Conflict of interest Andy is the brother of the owner of ShowTix, and accordingly in a position of conflict. Therefore, his perception of the potential benefits might not be completely objective. Given this conflict of interest, it is also of concern that Andy will be the one receiving the summary of ticket sales directly from ShowTix. Timing of benefits Without considering the one-time fee, which is discussed below, the financial benefits are marginal in the first year, with substantial projected increases in the second and third years. These projected increases in the second and third years are troubling as it is not clear why it would take users a year or two to start using an online ticket purchase system. Reliability of data The fact that the projections are such round numbers (doubling, then doubling again) is also suspicious. You should ask ShowTix to provide information to support these projected increases. It is also recommended that you obtain references from some of ShowTix’s clients. One-time fee The total benefit to KST in the first year is negative, mostly because of the one-time fee. It is difficult to understand why ShowTix would charge an upfront fee as high as $20,000. ShowTix is supposed to be experienced, having set up websites for other clients. Does it cost that much for them to add one more client? We need more details of what this fee is for. Cross-marketing ShowTix indicates that the ticket sale projections have factored in the cross-marketing benefits. It is unlikely that ShowTix will be able to do the cross-marketing it proposes without KST obtaining customers’ consent. As it will likely significantly affect the revenue assumption, we should determine the impact on the proposed figures if we cannot obtain consent from our customers. We would need to see if the proposal is still attractive after removing the cross-marketing benefits. In addition, since it increases the chances of KST’s customers deciding to go to non-KST shows rather than to KST’s shows, cross-marketing might negatively affect KST’s sales.
Also, privacy of customers’ data should be a priority for KST. If the decision is made to go ahead with the proposal, KST should ensure that ShowTix has proper processes and controls in place to protect customers’ data. Any customer information that is divulged by ShowTix without customer approval could reflect negatively on KST and affect its reputation.
Appendix D: September 14, 2018 – Day 3 Simulation and Marking Guides Page 245
Performers’ fee We also need to consider that the sharing arrangement with the performers is for them to get 30% of gross ticket revenues. This means that any costs that KST incurs to increase ticket sales, such as the 15% ShowTix commission, are borne wholly by KST. If it proceeds with the ShowTix arrangement, KST should speak to the performers about modifying the revenue-sharing arrangement. Conclusion Although the ShowTix proposal is providing positive returns, there are a number of factors that need to be addressed before proceeding with the proposal. To ensure that ShowTix’s offering is fair, it would also be beneficial to look at alternatives. For Assessment Opportunity #1, the candidate must be ranked in one of the following five categories: Not addressed – The candidate does not address this assessment opportunity. Nominal competence – The candidate does not meet the standard of reaching competence. Reaching competence – The candidate attempts a quantitative analysis of Andy’s proposal and identifies qualitative factors to consider. Competent – The candidate provides a quantitative analysis of Andy’s proposal and discusses qualitative factors to consider. Competent with distinction – The candidate provides a thorough quantitative analysis of Andy’s proposal and discusses qualitative factors to consider. Assessment Opportunity #2 (Breadth Opportunity) The candidate discusses the differences between a review and an audit engagement, and provides examples of the procedures that would be performed in both cases. The candidate demonstrates competence in Audit and Assurance. CPA Map Competencies: 4.2.1 Advises on an entity’s assurance needs (Core – Level B) 4.3.6 Develops appropriate procedures based on the identified risk of material misstatement (Core – Level B)
Appendix D: September 14, 2018 – Day 3 Simulation and Marking Guides Page 246
Level of Assurance The purpose of assurance engagements is to enhance the degree of confidence of intended users of the financial statements, in this case, the bank. In an audit, this is achieved by the expression of an opinion by the auditor on whether the financial statements are prepared, in all material respects, in accordance with accounting standards for private enterprises (ASPE). In a review of financial statements, the practitioner expresses a conclusion, rather than an opinion. It therefore provides negative assurance, noting that nothing has come to the practitioner’s attention that would cause them to believe that the financial statements do not present fairly, in all material respects, the financial position and results of operations of KST in accordance with ASPE. The conclusion is based on the practitioner obtaining limited assurance. Therefore, the level of assurance is lower in a review than in an audit. Type of work performed Because the auditor is providing a higher level of assurance in an audit, the amount of evidence that needs to be gathered is also higher. The type of procedures performed during an audit can include inspection, observation, confirmation, recalculation, re-performance and analytical procedures, often in some combination, in addition to enquiry. For example, the auditor would likely inspect documents (e.g., vouching costs), observe control activities or assets (e.g., attendance at counts, observation of assets), and perform enquiry and analytical procedures. For the most part, a review engagement will focus on analytical procedures and enquiry. The procedures performed for a review are less rigorous compared to those performed for an audit. Cost Because of the higher level of assurance needed in an audit, and therefore the higher level of evidence that the auditor will need to gather, there is more work involved than in a review engagement. Therefore, an audit will be costlier than a review. Recommendation Since the bank loan is the reason you will need a review or audit engagement done on your financial statements, I recommend a review, which would limit the amount of work that would be required by you, and the additional fees that KST will have to incur.
Appendix D: September 14, 2018 – Day 3 Simulation and Marking Guides Page 247
Examples of review procedures on operating expenses • Calculate the variance from the prior year to the current year of each category of operating
costs, and discuss with management the ones that present an unreasonable variation. • Calculate the cost of refreshments sold at the performances as a percentage of revenue,
compare it to the prior year or management’s expectations, to make sure it is in line, and discuss any anomalies with management.
• Inquire of management about any existing leases, contracts or commitments that will trigger an expense for KST, and their process to make sure these are recorded properly.
Examples of audit procedures on operating expenses In addition to the review procedures mentioned above, the following procedures would be performed: • For expenses such as cost of refreshments, heating, repairs and maintenance, vouch a
sample of expenses from the general ledger to the original document, such as the invoice, to validate that they are legitimate expenses of KST, the expense is recorded in the right period, and the amount is accurate. For the lease expense, review the terms of the lease agreement to ensure that the classification of the lease is correct, and that the proper expense has been recorded in the financial statements.
• Review bank statements for cheques made to suppliers and make sure these expenses were included in the general ledger, and in the proper period.
For Assessment Opportunity #2, the candidate must be ranked in one of the following five categories: Not addressed – The candidate does not address this assessment opportunity. Nominal competence – The candidate does not meet the standard of reaching competence. Reaching competence – The candidate discusses the difference between a review and an audit engagement, or provides examples of the procedures that would be performed in both cases. Competent – The candidate discusses the difference between a review and an audit engagement and provides examples of the procedures that would be performed in both cases. Competent with distinction – The candidate thoroughly discusses the difference between a review and an audit engagement and provides several examples of the procedures that would be performed in both cases.
Appendix D: September 14, 2018 – Day 3 Simulation and Marking Guides Page 248
Assessment Opportunity #3 (Breadth and Depth Opportunity) The candidate discusses the accounting treatment for the soundboard lease. The candidate demonstrates competence in Financial Reporting. CPA Map Competencies: 1.2.2 Evaluates treatment for routine transactions (Core – Level A) KST entered into a new lease agreement for a soundboard. Leases are covered under ASPE 3065, Leases. As a lessee, KST needs to determine whether its lease qualifies as an operating lease or a capital lease. Per HB 3065 – Leases: “…a lease that transfers substantially all of the benefits and risks of ownership to the lessee is in substance an acquisition of an asset and an incurrence of an obligation by the lessee...” According to HB 3065, from the point of view of a lessee, a lease normally transfers substantially all of the benefits and risks of ownership to the lessee when, at the inception of the lease, one or more of the following conditions are present:
(a) There is reasonable assurance that the lessee will obtain ownership of the leased property by the end of the lease term. Reasonable assurance that the lessee will obtain ownership of the leased property is present when the terms of the lease result in ownership being transferred to the lessee by the end of the lease term or when the lease provides for a bargain purchase option.
KST has the option to purchase the soundboard at the end of the 10-year lease for $50,000. It is estimated that the soundboard will have a value of $50,000 at the end of the lease. Therefore, $50,000 is not a bargain purchase price and there is no reasonable assurance that KST will obtain ownership of the soundboard at the end of the lease. This criterion is not met.
(b) The lease term is of such a duration that the lessee will receive substantially all of the
economic benefits expected to be derived from the use of the leased property over its life span. Although the lease term may not be equal to the economic life of the leased property in terms of years, the lessee is normally expected to receive substantially all of the economic benefits to be derived from the leased property when the lease term is equal to a major portion (usually 75 percent or more) of the economic life of the leased property. This is due to the fact that new equipment, reflecting later technology and in prime condition, may be assumed to be more efficient than old equipment that has been subject to obsolescence and wear”
Appendix D: September 14, 2018 – Day 3 Simulation and Marking Guides Page 249
The lease is for 67% of the soundboard’s useful life (10 years ÷ 15 years). Therefore, it is unlikely that the lease term is 75% or more of the economic life of the soundboard. This criterion is not met.
(c) The lessor is assured of recovering the investment in the leased property and of earning
a return on the investment as a result of the lease agreement. This condition exists if the present value, at the beginning of the lease term, of the minimum lease payments, excluding any portion thereof relating to executory costs, is equal to substantially all (usually 90 percent or more) of the fair value of the leased property, at the inception of the lease. In determining the present value, the discount rate used by the lessee is the lower of the lessee's rate for incremental borrowing and the interest rate implicit in the lease, if known.
The present value (PV) at the beginning of the lease is equal to:
PV of lease payments = (I/Y = 6%, N = 10 years, PMT = $17,000, beginning of the period) = $132,629 PV of bargain purchase option = None Total PV = $132,629
Based on the terms of the lease and KST’s incremental borrowing rate, the lease has a PV of $132,629. This equals 88% of the FV ($132,629 / $150,000), which is lower than 90%. Therefore, this criterion is not met.
Based on the fact that none of the criteria have been met, the lease should be classified as an operating lease. According to HB 3065:
Because most operating leases are short term, charging lease rentals to expense on a straight-line basis over the lease term, even if not payable in such a manner, would normally result in recognition of the expense in a manner that is representative of the time pattern in which the user derives benefit from the leased property. However, circumstances may indicate that another basis is required to achieve this result.
In this case, it is intended that the soundboard will be used for all performances at the theatre, so we can assume that KST will benefit from the soundboard over the 10-year term. Therefore, the lease rental should be charged to expense on a straight-line basis, over the 10-year term, resulting in an annual expense of $17,000.
Appendix D: September 14, 2018 – Day 3 Simulation and Marking Guides Page 250
For Assessment Opportunity #3, the candidate must be ranked in one of the following five categories: Not addressed – The candidate does not address this assessment opportunity. Nominal competence – The candidate does not meet the standard of reaching competence. Reaching competence – The candidate attempts to discuss the accounting treatment for the soundboard lease. Competent – The candidate discusses the accounting treatment for the soundboard lease. Competent with distinction – The candidate thoroughly discusses the accounting treatment for the soundboard lease. Assessment Opportunity #4 (Breadth Opportunity) The candidate discusses the tax treatment for the potential carry forward amounts and discusses the deadlines for the filing and payments of the corporate income tax and GST/HST. The candidate demonstrates competence in Taxation. CPA Map Competencies: 6.1.1 Assesses a corporate entity’s general tax issues (Core – Level B) 6.1.2 Determines taxes payable for a corporation in routine situations (Core – Level B) Non-capital losses After four consecutive years of losses for income tax purposes, KST expects to turn a profit this year. Since Ellen has never filed a corporate tax return for KST, the estimated $5,000 loss in each year will have to be validated. KST will need to file the last four years’ income tax returns first, to determine the exact amounts of the losses, and to establish its right to carry forward these losses. Non-capital losses can be carried forward up to 20 years, so the losses incurred in the last four years can be applied against KST’s income of $30,000 this year. If, after deducting the loss carryforwards, KST were to be subject to corporate income tax in 2018, it would be at the small business income tax rate, which is approximately 15%. KST meets the criteria of being a Canadian-controlled private corporation (CCPC) earning active business income.
Appendix D: September 14, 2018 – Day 3 Simulation and Marking Guides Page 251
Capital losses A capital loss occurs when a capital asset is sold at a price lower than the original purchase price. Capital losses can only be applied against capital gains, which occur when a capital asset is sold at a price higher than the original purchase price. Capital losses, if not used immediately, can be carried forward indefinitely. Therefore, the $3,500 in capital losses you incurred three years ago can be applied to any capital gains that have been incurred since. Charitable donations KST has $1,000 in charitable donations from last year that have never been claimed on a tax return. These donations can be carried forward for a maximum of five years. KST can deduct a maximum of 75% of its net income for tax purposes in donations. Prioritization In order to minimize its overall tax expense, KST should prioritize what should be used first between the losses and the donations. Since the charitable donations are the first to expire, they should be given priority and used first. If there is enough income to use the non-capital losses, these should be used next, since they expire 20 years after they were first incurred. The capital losses should be used as soon as capital gains arise, unless the non-capital losses are about to expire, in which case, non-capital gains should be used first since capital losses do not have an expiry date. Tax return filing deadline Because KST is a CCPC, it will not be required to make the payment of its income taxes for the year ended December 31, 2018, until three months after its year end―March 31, 2019. The tax return itself, however, is not due until June 30, 2019―six months after the year end. Since KST did not have any income taxes payable in the past, there was no requirement to make installment payments, in the past or during this year. KST does not need to make installment payments if its federal taxes payable for either the current or previous year are less than $3,000. Because its taxes for 2018 are likely to be less than this (roughly speaking, $30,000 - $20,000 of losses is $10,000, so the balance owing would be around 15% of $10,000, or $1,500), installment payments will likely not be required for 2019.
Appendix D: September 14, 2018 – Day 3 Simulation and Marking Guides Page 252
GST/HST filing deadline With respect to GST/HST, we first need to determine whether KST is an annual, quarterly, or monthly filer. This is based on taxable supplies, which in KST’s case would be equivalent to its revenues – if KST’s revenues are less than $1.5 million, it is an annual filer, and if they are between $1.5 million and $6 million, it is a quarterly filer, and if they are higher than $6 million, they are a monthly filer. Sales are estimated at 15 shows x 10 performances x 800 seats x 60% capacity x $30 average ticket price = $2,160,000; therefore, KST must be a quarterly filer. Its returns, and the payment of the GST/HST it owes on those returns, are both due one month after the end of each quarter. Therefore, KST should have filed three of its GST/HST returns for 2018 already and paid those balances. The return for the fourth quarter is due by January 31, 2019. There will likely be late-filing penalties for not filing these returns on time, and interest accumulating on both the balances owing and the late-filing penalties. There are no late payment penalties. Since KST is required to file its GST/HST returns quarterly, no installments are required. In addition, input tax credits expire after four years, so KST should make sure they have been filed before they expire; given that KST is in its fifth year of operations, some might have already expired. Also, note that penalties and interest related to income tax and GST/HST filing are not tax deductible.
To avoid further penalties and interest, you should ensure that the filing, and payments of amounts owed, of income tax and GST/HST are dealt with as soon as possible. You should also consider hiring a tax practitioner to assist you with the preparation of your returns, and to perform a historical review. For Assessment Opportunity #4, the candidate must be ranked in one of the following five categories: Not addressed – The candidate does not address this assessment opportunity. Nominal competence – The candidate does not meet the standard of reaching competence. Reaching competence – The candidate attempts to discuss the tax treatment for the potential carryforward amounts or provides some information on deadlines. Competent – The candidate discusses the tax treatment for the potential carryforward amounts and provides some information on deadlines. Competent with distinction – The candidate discusses the tax treatment for the potential carryforward amounts, provides some information on deadlines, and provides additional insight.
Appendix D: September 14, 2018 – Day 3 Simulation and Marking Guides Page 253
Assessment Opportunity #5 (Breadth Opportunity) The candidate discusses ways for Ellen to improve the Board of Directors and the role it plays. The candidate demonstrates competence in Strategy and Governance. CPA Map Competencies: 2.1.1 Evaluates the entity’s governance structure (policies, processes, codes) (Core – Level B) You have asked about possible ways to improve your Board of Directors and the role it plays. There are many things that could be proposed. Potential conflict of interest Andy and Claire have a background in acting and regularly perform at KST. Currently, actors are paid as a percentage of sales. There is a potential conflict of interest in that they may try to influence the amount paid to the actors while guiding you in your decisions. The board members should be independent. Since both Andy and Claire earn money from KST, they may be acting in their own personal best interests rather than in KST’s best interest. If you want to continue to get insights and advice on the theatre industry, you could consider having actors who do not perform at KST on the board. There is also a potential conflict of interest in that Andy proposed that you enter into an agreement with ShowTix, but ShowTix’s owner is Andy’s brother. The proposal also mentions that the sales reports will be sent directly to Andy from ShowTix, even though he is in conflict of interest. Andy might have the best intentions by putting you in contact with his brother, but you need to be aware that he might also be looking out for his brother’s interests. Andy also helped with the soundboard lease, but it seems that the supplier he proposed offered the lease at a much higher price than its competitors. You should try to see if there is a reason why Andy proposed this supplier to you, to assess whether he was putting priority on this other supplier’s interest over KST’s. Skills While Andy’s and Claire’s experience may help in advising how to manage shows or which shows to choose, they do not seem to have experience in business management that would help you in your decision making. You could recruit individuals who are involved in the operations of a theatre, such as a general manager or production manager; however, you would not want someone who is currently involved with a competitor. As KST is considering new projects, you should get someone with an accounting background to help with financing, monitoring cash flows and providing financial advice. Considering his accounting background, your uncle might be a good choice.
Appendix D: September 14, 2018 – Day 3 Simulation and Marking Guides Page 254
Your friend, however, might not be an appropriate choice for the board. While he has experience with clients, it is in a very different context, and the operations of an apartment building are very different from a theatre’s operations. However, he may be able to provide advice around building regulations and building maintenance that could be helpful, and he may have some financial and business knowledge. As well, his relationship with you should be considered; ideally, a board member is someone who can provide constructive criticism of the owner’s or president’s ideas and proposals, and a friend may find that challenging. Expectations You mentioned that the board is currently helping you with operational decisions. They seem very involved in different projects, including the online ticketing proposal and the soundboard lease. Although you should get both operating and strategic advice from your board, the board should be much more focused on the strategic direction of the company. For example, they should be providing unbiased advice about the offer from ShowTix, and should probably not be as directly involved in the decision-making related to the day-to-day operations. The board is responsible for reviewing the financial statements on a regular basis. They would also be able to provide advice as to whether an audit would be necessary. As well, the board should help in other areas of concern and review a risk analysis, particularly for areas that may have a significant impact on your company. As a smaller company, the board may not need to meet monthly; quarterly meetings may be sufficient. Typically, the board would also advise you on an appropriate compensation and incentive plan for executive management; in your case, they could advise you on appropriate compensation for staff. The board should also help you develop policies and procedures―for example, a code of ethics, which would help avoid any future conflicts of interest. Size The board currently has only three members, including yourself. To be better supported, you might want to consider appointing at least one, and maybe two, more members. I have included suggestions above on the type of background you could be looking for in board members. It is always a good idea to have an uneven number of members, in case there is a need for a vote, so that it does not result in a tie.
Appendix D: September 14, 2018 – Day 3 Simulation and Marking Guides Page 255
For Assessment Opportunity #5, the candidate must be ranked in one of the following five categories: Not addressed – The candidate does not address this assessment opportunity. Nominal competence – The candidate does not meet the standard of reaching competence. Reaching competence – The candidate identifies possible issues with the current board or proposes improvements. Competent – The candidate discusses possible issues with the current board and proposes improvements. Competent with distinction – The candidate thoroughly discusses possible issues with the current board and proposes improvements.
Appendix D: September 14, 2018 – Day 3 Simulation and Marking Guides Page 256
APPENDIX E
RESULTS BY ASSESSMENT OPPORTUNITIES FOR DAY 2 AND DAY 3
Appendix E: Results by Assessment Opportunities for Day 2 and Day 3 Page 257
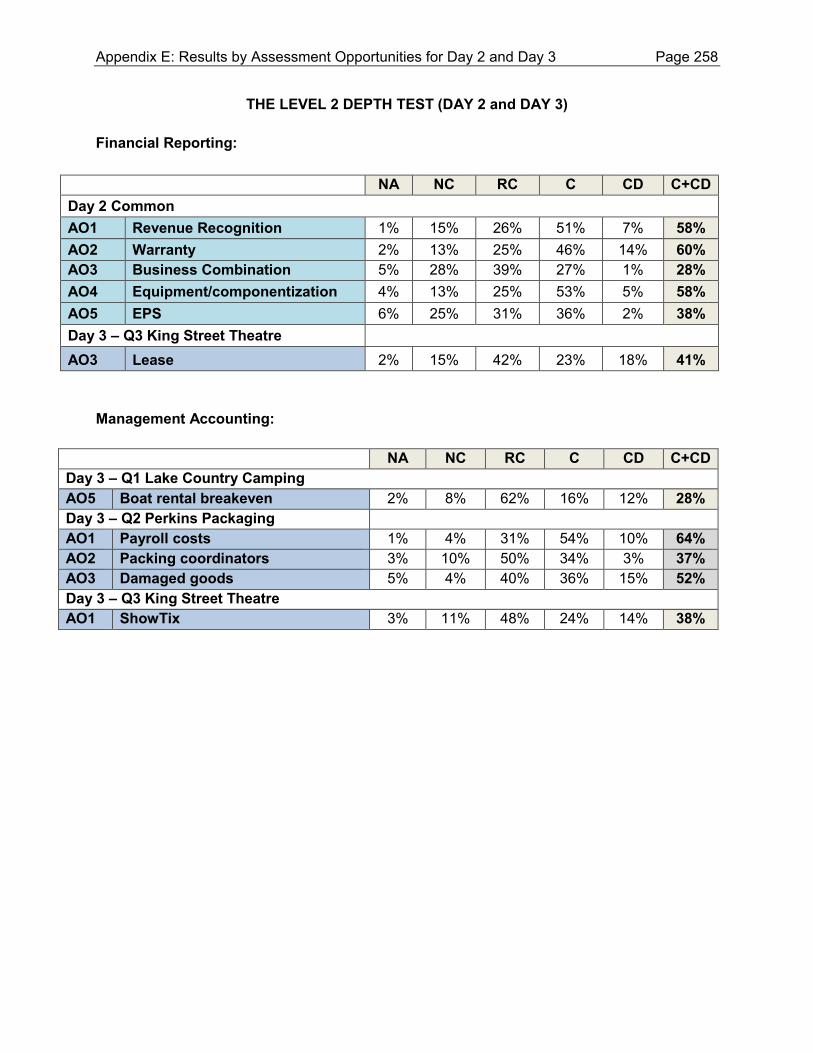
THE LEVEL 2 DEPTH TEST (DAY 2 and DAY 3) Financial Reporting:
NA NC RC C CD C+CD
Day 2 Common AO1 Revenue Recognition 1% 15% 26% 51% 7% 58% AO2 Warranty 2% 13% 25% 46% 14% 60% AO3 Business Combination 5% 28% 39% 27% 1% 28% AO4 Equipment/componentization 4% 13% 25% 53% 5% 58% AO5 EPS 6% 25% 31% 36% 2% 38% Day 3 – Q3 King Street Theatre AO3 Lease 2% 15% 42% 23% 18% 41%
Management Accounting:
NA NC RC C CD C+CD Day 3 – Q1 Lake Country Camping AO5 Boat rental breakeven 2% 8% 62% 16% 12% 28% Day 3 – Q2 Perkins Packaging AO1 Payroll costs 1% 4% 31% 54% 10% 64% AO2 Packing coordinators 3% 10% 50% 34% 3% 37% AO3 Damaged goods 5% 4% 40% 36% 15% 52% Day 3 – Q3 King Street Theatre AO1 ShowTix 3% 11% 48% 24% 14% 38%
Appendix E: Results by Assessment Opportunities for Day 2 and Day 3 Page 258
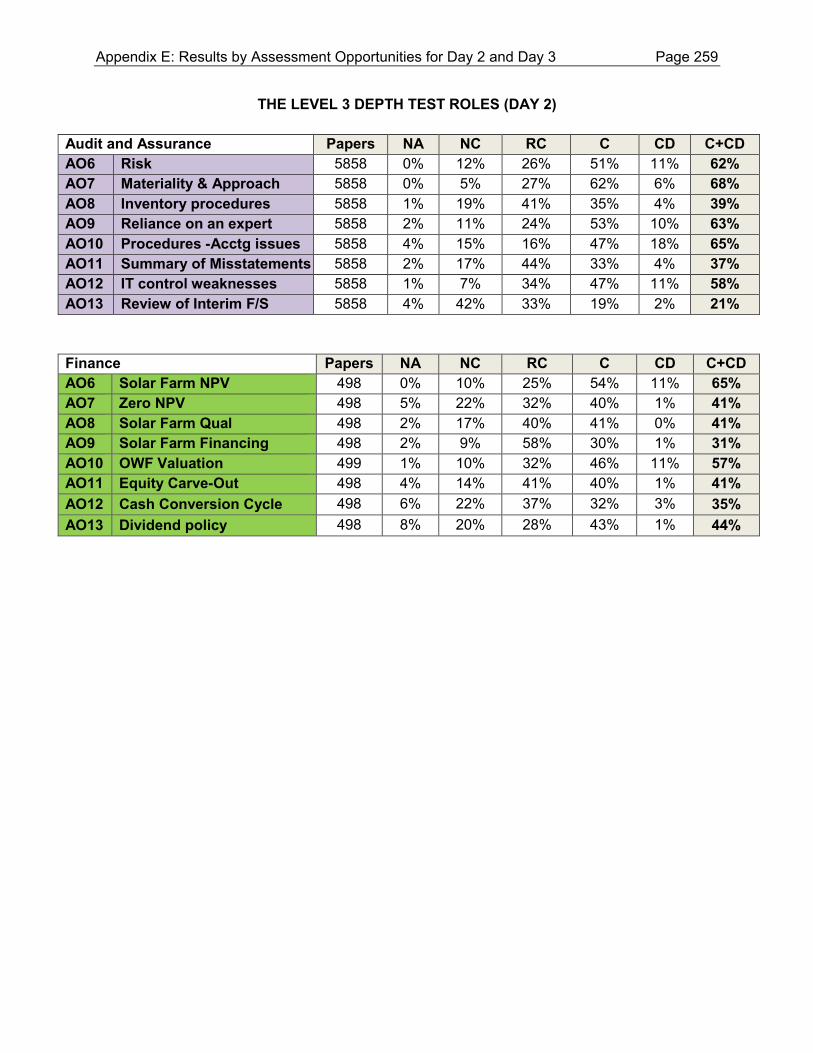
THE LEVEL 3 DEPTH TEST ROLES (DAY 2)
Audit and Assurance Papers NA NC RC C CD C+CD AO6 Risk 5858 0% 12% 26% 51% 11% 62% AO7 Materiality & Approach 5858 0% 5% 27% 62% 6% 68% AO8 Inventory procedures 5858 1% 19% 41% 35% 4% 39% AO9 Reliance on an expert 5858 2% 11% 24% 53% 10% 63% AO10 Procedures -Acctg issues 5858 4% 15% 16% 47% 18% 65% AO11 Summary of Misstatements 5858 2% 17% 44% 33% 4% 37% AO12 IT control weaknesses 5858 1% 7% 34% 47% 11% 58% AO13 Review of Interim F/S 5858 4% 42% 33% 19% 2% 21%
Finance Papers NA NC RC C CD C+CD AO6 Solar Farm NPV 498 0% 10% 25% 54% 11% 65% AO7 Zero NPV 498 5% 22% 32% 40% 1% 41% AO8 Solar Farm Qual 498 2% 17% 40% 41% 0% 41% AO9 Solar Farm Financing 498 2% 9% 58% 30% 1% 31% AO10 OWF Valuation 499 1% 10% 32% 46% 11% 57% AO11 Equity Carve-Out 498 4% 14% 41% 40% 1% 41% AO12 Cash Conversion Cycle 498 6% 22% 37% 32% 3% 35% AO13 Dividend policy 498 8% 20% 28% 43% 1% 44%
Appendix E: Results by Assessment Opportunities for Day 2 and Day 3 Page 259
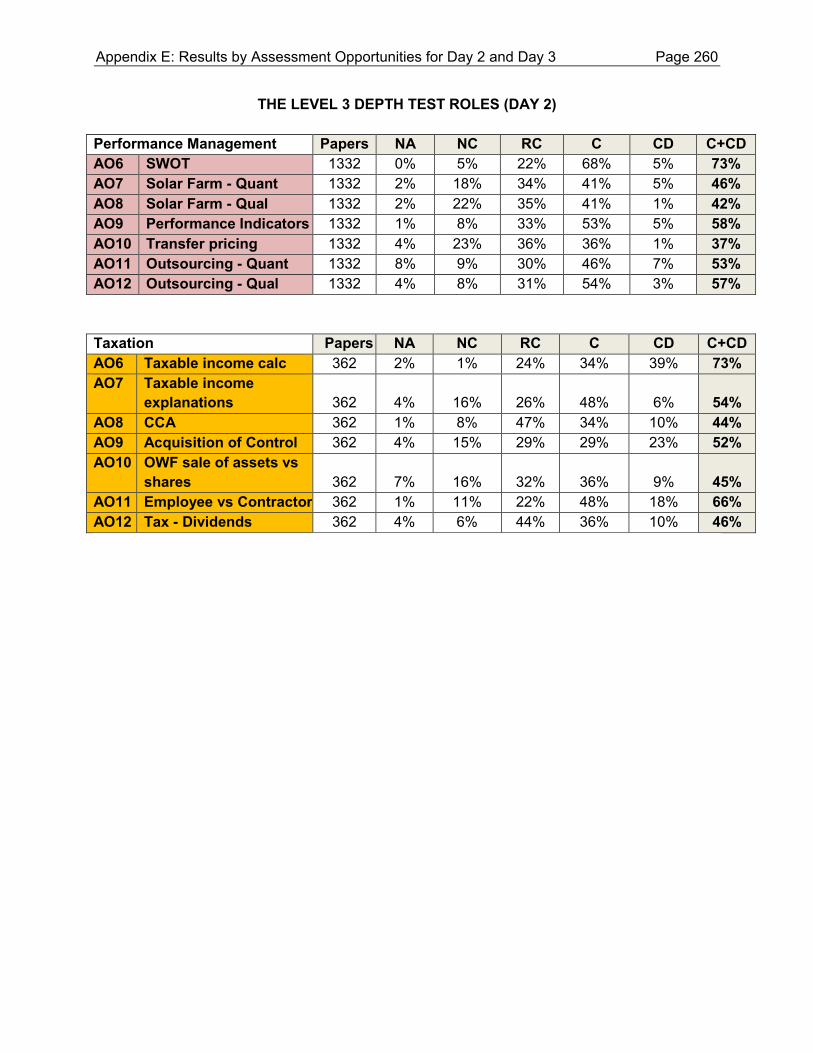
THE LEVEL 3 DEPTH TEST ROLES (DAY 2)
Performance Management Papers NA NC RC C CD C+CD AO6 SWOT 1332 0% 5% 22% 68% 5% 73% AO7 Solar Farm - Quant 1332 2% 18% 34% 41% 5% 46% AO8 Solar Farm - Qual 1332 2% 22% 35% 41% 1% 42% AO9 Performance Indicators 1332 1% 8% 33% 53% 5% 58% AO10 Transfer pricing 1332 4% 23% 36% 36% 1% 37% AO11 Outsourcing - Quant 1332 8% 9% 30% 46% 7% 53% AO12 Outsourcing - Qual 1332 4% 8% 31% 54% 3% 57%
Taxation Papers NA NC RC C CD C+CD AO6 Taxable income calc 362 2% 1% 24% 34% 39% 73% AO7 Taxable income
explanations 362 4% 16% 26% 48% 6% 54% AO8 CCA 362 1% 8% 47% 34% 10% 44% AO9 Acquisition of Control 362 4% 15% 29% 29% 23% 52% AO10 OWF sale of assets vs
shares 362 7% 16% 32% 36% 9% 45% AO11 Employee vs Contractor 362 1% 11% 22% 48% 18% 66% AO12 Tax - Dividends 362 4% 6% 44% 36% 10% 46%
Appendix E: Results by Assessment Opportunities for Day 2 and Day 3 Page 260
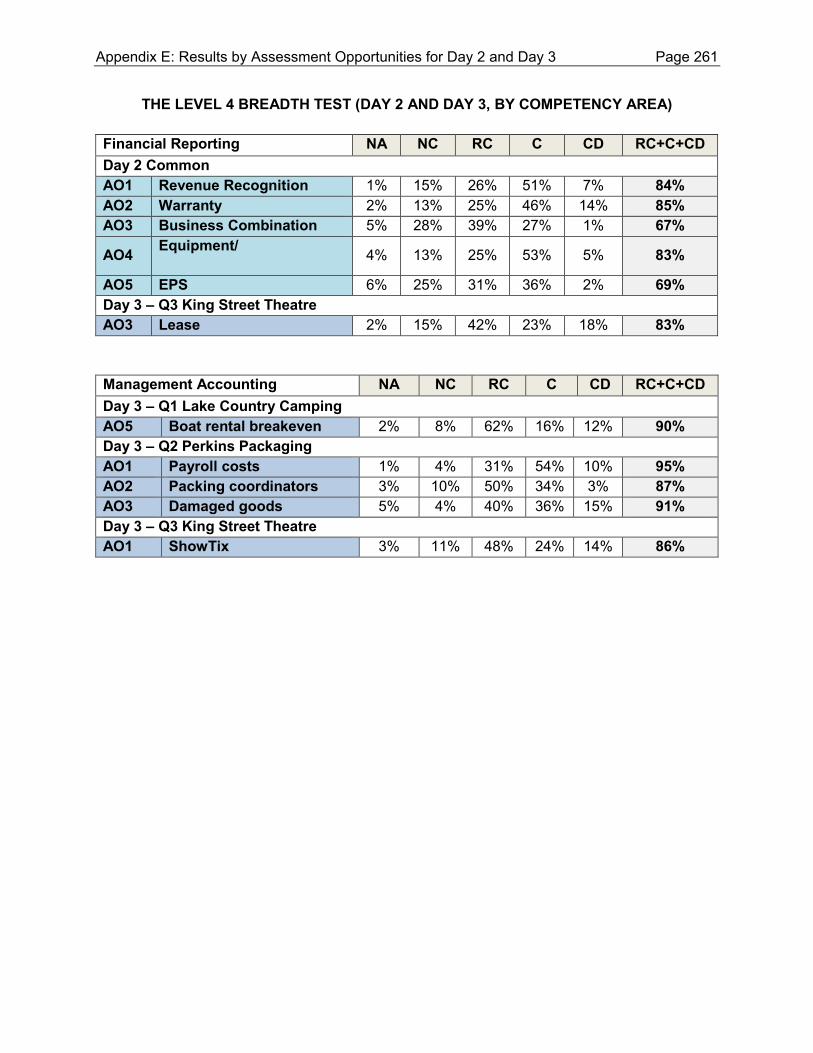
THE LEVEL 4 BREADTH TEST (DAY 2 AND DAY 3, BY COMPETENCY AREA)
Financial Reporting NA NC RC C CD RC+C+CD Day 2 Common AO1 Revenue Recognition 1% 15% 26% 51% 7% 84% AO2 Warranty 2% 13% 25% 46% 14% 85% AO3 Business Combination 5% 28% 39% 27% 1% 67%
AO4 Equipment/ componentization 4% 13% 25% 53% 5% 83%
AO5 EPS 6% 25% 31% 36% 2% 69% Day 3 – Q3 King Street Theatre AO3 Lease 2% 15% 42% 23% 18% 83%
Management Accounting NA NC RC C CD RC+C+CD Day 3 – Q1 Lake Country Camping AO5 Boat rental breakeven 2% 8% 62% 16% 12% 90% Day 3 – Q2 Perkins Packaging AO1 Payroll costs 1% 4% 31% 54% 10% 95% AO2 Packing coordinators 3% 10% 50% 34% 3% 87% AO3 Damaged goods 5% 4% 40% 36% 15% 91% Day 3 – Q3 King Street Theatre AO1 ShowTix 3% 11% 48% 24% 14% 86%
Appendix E: Results by Assessment Opportunities for Day 2 and Day 3 Page 261
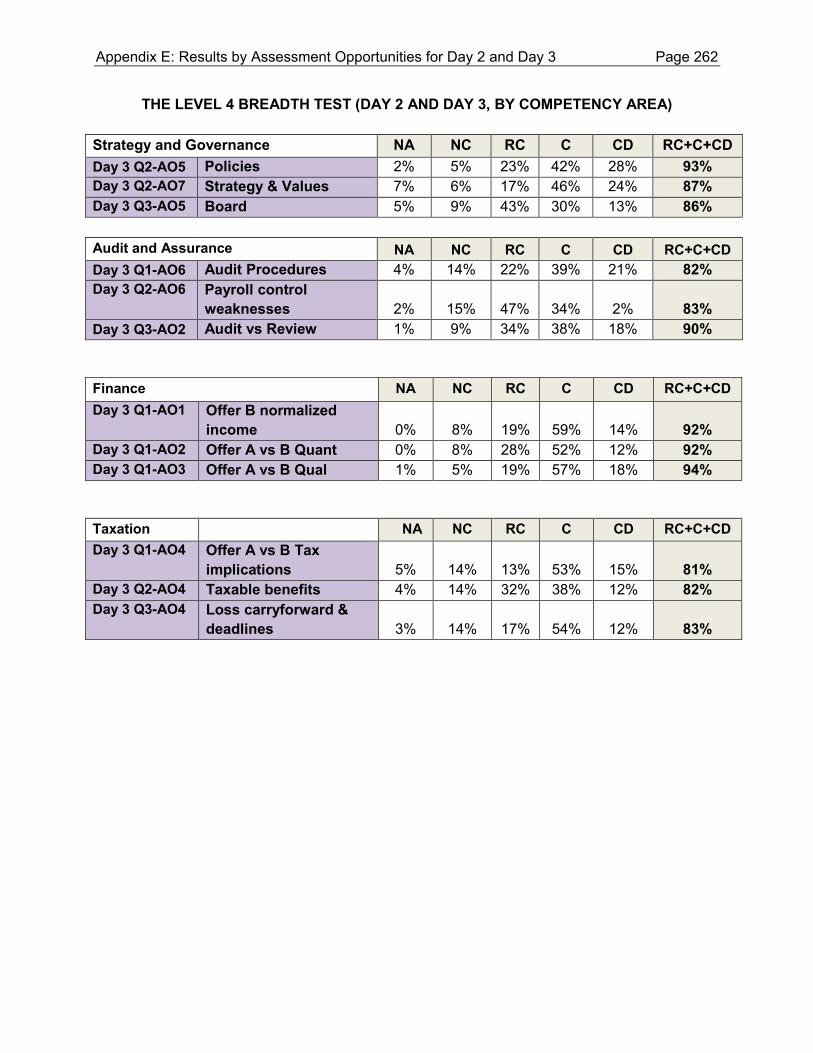
THE LEVEL 4 BREADTH TEST (DAY 2 AND DAY 3, BY COMPETENCY AREA)
Strategy and Governance NA NC RC C CD RC+C+CD Day 3 Q2-AO5 Policies 2% 5% 23% 42% 28% 93% Day 3 Q2-AO7 Strategy & Values 7% 6% 17% 46% 24% 87% Day 3 Q3-AO5 Board 5% 9% 43% 30% 13% 86%
Audit and Assurance NA NC RC C CD RC+C+CD Day 3 Q1-AO6 Audit Procedures 4% 14% 22% 39% 21% 82% Day 3 Q2-AO6 Payroll control
weaknesses 2% 15% 47% 34% 2% 83% Day 3 Q3-AO2 Audit vs Review 1% 9% 34% 38% 18% 90% Finance NA NC RC C CD RC+C+CD Day 3 Q1-AO1 Offer B normalized
income 0% 8% 19% 59% 14% 92% Day 3 Q1-AO2 Offer A vs B Quant 0% 8% 28% 52% 12% 92% Day 3 Q1-AO3 Offer A vs B Qual 1% 5% 19% 57% 18% 94% Taxation NA NC RC C CD RC+C+CD Day 3 Q1-AO4 Offer A vs B Tax
implications 5% 14% 13% 53% 15% 81% Day 3 Q2-AO4 Taxable benefits 4% 14% 32% 38% 12% 82% Day 3 Q3-AO4 Loss carryforward &
deadlines 3% 14% 17% 54% 12% 83%
Appendix E: Results by Assessment Opportunities for Day 2 and Day 3 Page 262
APPENDIX F
BOARD OF EXAMINERS’ COMMENTS ON DAY 2 AND DAY 3 SIMULATIONS
Appendix F: Board of Examiners’ Comments on Day 2 and Day 3 Simulations Page 263
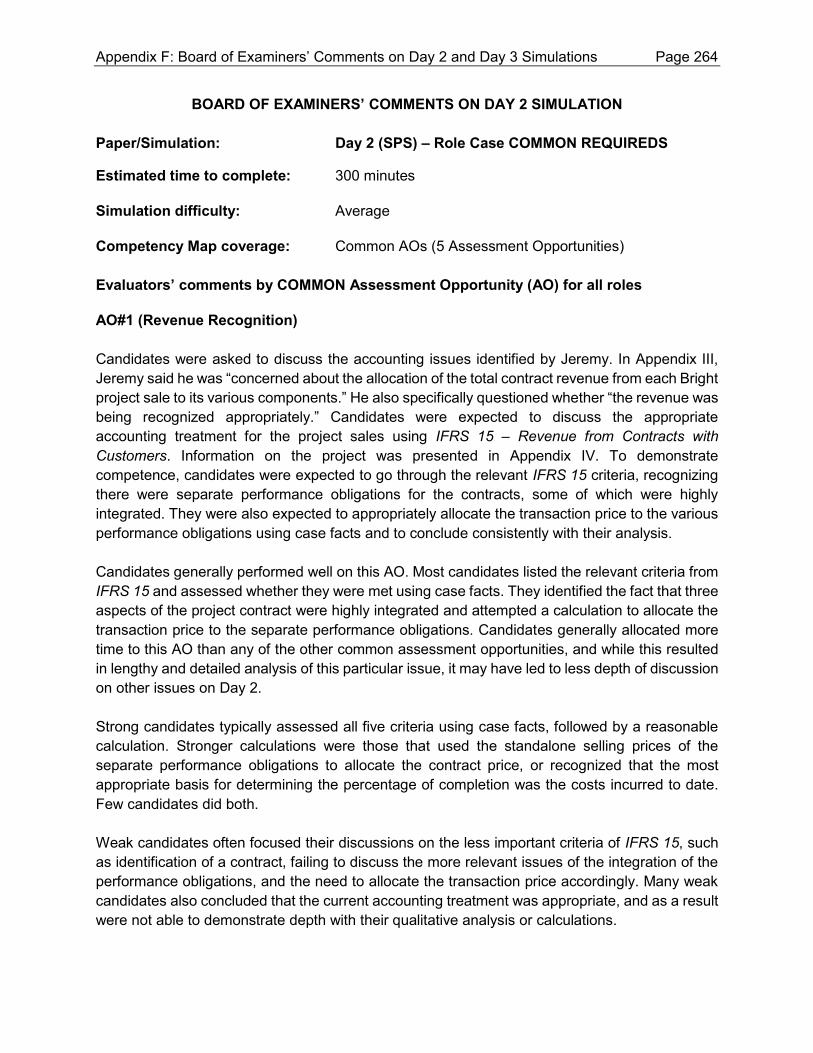
BOARD OF EXAMINERS’ COMMENTS ON DAY 2 SIMULATION Paper/Simulation: Day 2 (SPS) – Role Case COMMON REQUIREDS
Estimated time to complete: 300 minutes
Simulation difficulty: Average
Competency Map coverage: Common AOs (5 Assessment Opportunities)
Evaluators’ comments by COMMON Assessment Opportunity (AO) for all roles
AO#1 (Revenue Recognition) Candidates were asked to discuss the accounting issues identified by Jeremy. In Appendix III, Jeremy said he was “concerned about the allocation of the total contract revenue from each Bright project sale to its various components.” He also specifically questioned whether “the revenue was being recognized appropriately.” Candidates were expected to discuss the appropriate accounting treatment for the project sales using IFRS 15 – Revenue from Contracts with Customers. Information on the project was presented in Appendix IV. To demonstrate competence, candidates were expected to go through the relevant IFRS 15 criteria, recognizing there were separate performance obligations for the contracts, some of which were highly integrated. They were also expected to appropriately allocate the transaction price to the various performance obligations using case facts and to conclude consistently with their analysis. Candidates generally performed well on this AO. Most candidates listed the relevant criteria from IFRS 15 and assessed whether they were met using case facts. They identified the fact that three aspects of the project contract were highly integrated and attempted a calculation to allocate the transaction price to the separate performance obligations. Candidates generally allocated more time to this AO than any of the other common assessment opportunities, and while this resulted in lengthy and detailed analysis of this particular issue, it may have led to less depth of discussion on other issues on Day 2. Strong candidates typically assessed all five criteria using case facts, followed by a reasonable calculation. Stronger calculations were those that used the standalone selling prices of the separate performance obligations to allocate the contract price, or recognized that the most appropriate basis for determining the percentage of completion was the costs incurred to date. Few candidates did both. Weak candidates often focused their discussions on the less important criteria of IFRS 15, such as identification of a contract, failing to discuss the more relevant issues of the integration of the performance obligations, and the need to allocate the transaction price accordingly. Many weak candidates also concluded that the current accounting treatment was appropriate, and as a result were not able to demonstrate depth with their qualitative analysis or calculations.
Appendix F: Board of Examiners’ Comments on Day 2 and Day 3 Simulations Page 264
AO#2 (Warranty Provision) Candidates were asked to discuss the accounting issues identified by Jeremy. In Appendix III, Jeremy discussed the regulatory requirement to now provide a five-year warranty on all solar panels sold. With regards to the warranty, he specifically asked whether “it should be shown as a liability on the statements.” Information on the nature of the warranty was presented in Appendix V. To demonstrate competence, candidates were expected to recognize that the warranty should be accounted for under IAS 37 – Provisions, Contingent Liabilities and Contingent Assets and use case facts to determine whether the three criteria for recognizing a provision had been met. Candidates were also expected to recommend that the correct amount be set up as a provision. Candidates performed well on this AO. Most candidates identified the correct Handbook criteria to apply to this situation, as well as the relevant case facts to use in their assessment of whether the warranties should be recognized at the time of sale. Candidates typically concluded that a warranty provision should be recognized, and they calculated the estimated warranty cost using the amount provided in the simulation. However, they generally forgot to remove the warranty claim expenses already incurred in the current period from their provision calculation. Strong candidates were more likely to remove the current warranty claim expenses from their calculation of the provision amount and provide a correct journal entry. Many strong candidates also began their response with a discussion of the nature of the warranty agreement, in which they supported the fact that IFRS 15 was not appropriate in this situation and that IAS 37 should be used. Many weak candidates listed the correct Handbook criteria but did not assess them using case facts, thus jumping to an unsupported conclusion. Other weak candidates attempted to assess the situation using IFRS 15 or other revenue recognition criteria only, incorrectly concluding that the warranty costs should be classified as deferred revenue. Still others used alternative sections of the Handbook (e.g., definition of liability), and while this did not preclude these candidates from demonstrating their competence, it often limited the usefulness of the response and resulted in candidates missing key elements of the discussion or arriving at an incorrect conclusion or journal entry. AO#3 (Business Combination) Candidates were asked to discuss the accounting issues identified by Jeremy. In Appendix III, Jeremy specifically asked whether “the Bright acquisition qualifies as a business combination when SPS only purchased net assets.” Information regarding the purchase of the net assets was presented in Appendix VI. To demonstrate competence, candidates were expected to apply case facts to IFRS 3 – Business Combinations to assess whether SPS acquired control of a business, to allocate the consideration paid based on the fair value of the identifiable assets acquired and liabilities assumed, and to support their discussions using Handbook guidance.
Appendix F: Board of Examiners’ Comments on Day 2 and Day 3 Simulations Page 265
Of all the common AOs, candidates struggled the most with this one. It was considered one of the more difficult financial reporting issues. Candidates often struggled with applying Handbook guidance, frequently misinterpreting paraphrased sections, including entire sections without identifying the subsection relevant to the scenario, or using guidance from a Handbook section that did not apply to the situation. Many candidates concluded that the purchase qualified as a business combination without providing any supporting case facts. Of those candidates who did provide an analysis, many focused their discussion on whether the acquirer obtained control, which, although relevant, did not allow for further discussion of whether the assets purchased constituted a business, where additional case facts could be incorporated. Candidates generally provided a reasonable calculation of the allocation of the consideration paid, but many of these calculations lacked supporting explanations (e.g., how to calculate goodwill; which assets should be included). Strong candidates typically structured their response better and were able to incorporate relevant case facts to support their conclusion that a business had been purchased. Strong candidates also supported their calculation of the allocation of the consideration paid with relevant explanations, such as a description of when goodwill is recognized or an analysis of how the various assets and liabilities acquired should be accounted for. Weak candidates were more likely to simply state that a business had been purchased without incorporating case facts to support their conclusion. Many candidates used irrelevant Handbook sections (e.g., IFRS 10 – Consolidation, IFRS 11 – Joint Ventures, IAS 32 – Financial Instruments) to frame their analysis. Weak candidates were also more likely to have errors in their calculations, such as using the book value of acquired assets instead of fair value, subtracting book value from fair value, failing to include all of the identifiable assets, or omitting a supporting explanation. AO#4 (Equipment/Componentization) Candidates were asked to discuss the accounting issues identified by Jeremy. In Appendix III, Jeremy and Thomas discussed the accounting treatment for a new piece of robotic equipment. Further information on the robotic equipment is presented in Appendix VII, showing the different component parts, each with varying useful lives. To demonstrate competence, candidates were expected to use the concepts of IAS 16 – Property, Plant and Equipment to recognize that since the components were individually significant and had different useful lives, they should be depreciated separately. Candidates were also expected to provide a revised calculation of depreciation for the equipment.
Appendix F: Board of Examiners’ Comments on Day 2 and Day 3 Simulations Page 266
Overall, candidates performed adequately on this AO. Most candidates recognized that the components should be amortized separately and used Handbook guidance to support their conclusion. In general, candidates were able to provide a reasonable calculation of the revised depreciation. Some candidates chose to focus their discussions on the treatment of the spare parts, which were not as significant as the other components. This AO appeared to be ranked last in importance by candidates. As a result, candidates’ discussions of this issue were often briefer and contained fewer case facts compared to the other accounting issues. This was not a problem, since a lengthy discussion was not required in order to demonstrate competence on this AO. Strong candidates had a better structure to their responses, providing Handbook guidance and then using case facts to support their analysis. They also applied more case facts to their analysis. As a result, they were able to demonstrate more depth than average candidates. These candidates were also more likely to pro-rate the depreciation of the various components for the partial year of ownership in their calculations. Weak candidates often focused their discussion on assessing whether the components fit the definition of PP&E, an approach that resulted in their failing to appropriately bring in case facts to discuss the useful life and significance of the various components. Weak candidates were also more likely to just discuss the spare parts and not conclude on the other more significant components. Many of these candidates concluded on the treatment of the spare parts without sufficient analysis and provided unsupported or invalid conclusions (e.g.., spare parts should be classified as a prepaid expense or a capital asset). AO#5 (EPS) In each of the role requireds, candidates were specifically asked to calculate the basic and diluted EPS for the draft financial statements, before accounting adjustments, and to explain the impact that the stock options and convertible bond have on the EPS calculations. Information required to calculate basic and dilutive EPS was presented in Appendix II. To demonstrate competence, candidates were expected to correctly calculate basic EPS, provide a reasonable calculation of diluted EPS that incorporated the dilutive impact of either the options or the convertible bond, and explain the impact the dilutive elements would have on the earnings per share calculations. Candidates performed adequately on this AO. Most candidates provided a correct basic EPS calculation, attempted a reasonable dilutive EPS calculation incorporating the dilutive effect of either the convertible bond or the stock options, and explained their calculations. Many candidates focused their discussions on explaining the mechanics of their calculations instead of the dilutive impact of the bond and options, or they copied IAS 33 sections that explained how EPS calculations should be performed. While the basic EPS calculations were generally done well, many dilutive calculations contained errors, such as including both in- and out-of-the-money options or deducting interest paid on the convertible bond from net income.
Appendix F: Board of Examiners’ Comments on Day 2 and Day 3 Simulations Page 267
Strong candidates were more likely to provide explanations of the impact of the dilutive elements in their own words, rather than just copy Handbook guidance or simply explain their calculations. Strong candidates also identified the fact that some of the options were out of the money and correctly removed these options from their calculations. Such candidates were also more likely to correctly add back the interest paid on the convertible bond in their calculations. Weak candidates provided a wide variety of responses. Many had numerous errors in their dilutive EPS calculation or did not attempt a calculation at all. Some weak candidates also used incorrect figures in their basic EPS, such as gross profit instead of net income for the numerator or retained earnings instead of common shares for the denominator. Others performed an analysis of the accounting treatment of the bonds and options (which candidates were specifically directed to not address) or framed their discussion on the implications of dilution from a strategic perspective, which was not part of the required.
Appendix F: Board of Examiners’ Comments on Day 2 and Day 3 Simulations Page 268
Paper/Simulation: Day 2 (SPS) – Role Case ASSURANCE
Estimated time to complete: 300 minutes
Simulation difficulty: Average
Competency Map coverage: Audit and Assurance role (8 Assessment Opportunities)
Evaluators’ comments by Assessment Opportunity (AO) for the ASSURANCE ROLE
AO#6 (Risk) Candidates were asked by the partner to update the preliminary audit planning completed in October 2017 for the information acquired since that time. The partner specified that the risk assessment should be updated. Information on the preliminary audit plan was provided in Appendix VIII (Assurance). To demonstrate competence, candidates were expected to provide a discussion of some of the risk factors that had changed since the initial planning, and to conclude on the revised overall financial statement risk of the audit engagement. Candidates performed relatively well on this AO. Most were able to provide several risk factors that have changed since October 2017 and explain how they had an impact on the financial statement risk, using facts from the case as support. The most commonly addressed risks included the fact that the controller had left for maternity leave, there were already accounting errors noted, there were several new transactions during the year that would result in more complex accounting, and the share price had decreased significantly in the past six months. Most candidates were also able to provide a conclusion on the revised overall financial statement risk that was consistent with their analysis. Strong candidates provided a more complete list of factors that had changed since October 2017 and, for each risk factor they identified, explained how it would increase or decrease risk. They also provided a logical conclusion on the revised overall financial statement risk. Weak candidates generally did not provide sufficient risk factors that had changed, or they simply listed risk factors without explaining how they would increase or decrease the overall financial statement risk. Some candidates also provided business risk factors instead of focusing on financial statement risk factors and, therefore, had difficulty providing a useful analysis. Others simply repeated elements already in the preliminary audit plan that had not changed and were, therefore, not relevant (e.g., the Board of Directors met six times per year, there was only one error found in past audits, etc.), which was not useful given that a significant number of changes had occurred since October 2017.
Appendix F: Board of Examiners’ Comments on Day 2 and Day 3 Simulations Page 269
AO#7 (Materiality and Approach) Candidates were asked by the partner to update the preliminary audit planning completed in October 2017 for the information obtained since that time. The partner specified that CPA should address the audit approach, as well as recommend a revised materiality and performance materiality and improve the documentation surrounding the materiality assessment. Information on the preliminary audit plan was provided in Appendix VIII (Assurance). To demonstrate competence, candidates were expected to discuss how the audit approach should change from the initial planning, as well as calculate a revised materiality and performance materiality to be used for the audit engagement, in light of the users, and support the basis and percentage chosen with case facts. Candidates performed relatively well on this AO. Most candidates were able to provide a reasonable discussion of how the planned approach should be revised, using changes since October 2017 to support their recommendations. In addition, they addressed the required changes to materiality by discussing multiple users of the financial statements and choosing a basis that would address their needs. They were also able to provide a revised calculation of materiality and performance materiality, adjusted for any accounting errors noted. Strong candidates provided a good discussion of both how and why the planned approach needed to be revised, incorporating several changes at SPS into their discussions to support their recommendations. Many of these candidates also recognized that many of the control changes only occurred near the end of the year, and thus the planned approach may still be appropriate for the first part of 2017. Strong candidates also provided a more in-depth discussion of the users, identifying more of the relevant users. They discussed each user’s needs and linked the basis they chose to calculate materiality to those needs. They also used a percentage that was within the acceptable range and justified the choice by linking it to the sensitivity of the users. Some strong candidates also recognized the fact that a revised materiality would have an impact on the planned amount of audit work that would have to be performed. Weak candidates generally thought that the planned approach would not have to change, despite several noticeable changes at SPS since October 2017. They also only identified the users; they did not discuss what their needs would be. Some used an inappropriate basis or percentage, or both, to calculate materiality, and many did not justify the use of either with relevant case facts. Some weak candidates attempted to justify their choice of percentage based on the overall financial statement risk, instead of basing it on the sensitivity of the users, making it difficult to demonstrate competence in this area.
Appendix F: Board of Examiners’ Comments on Day 2 and Day 3 Simulations Page 270
AO#8 (Inventory Procedures) Candidates were asked by the partner to determine what audit procedures could be performed to ensure the existence and completeness of the inventory on the balance sheet, given that CPA LLP did not attend the Quebec inventory count and SPS and CPA LLP did not count any offsite inventory at year end. He also wanted CPA to design the appropriate audit procedures for valuation. Additional information related to the inventory held by SPS was provided in Appendix VIII (Assurance). To demonstrate competence, candidates were expected to provide a reasonable number of procedures that covered both the existence and the completeness of the inventory, as well as its valuation. Candidates struggled with this AO. Candidates seemed uncomfortable with the request to provide multiple procedures on the same financial statement item. Most candidates attempted to provide several procedures over inventory, but many of them were generic, with no consideration for the fact that it was now after year end. Candidates did not seem to understand that simply performing an inventory count today would not be sufficient to gain comfort over the existence and completeness of the inventory at year end, and that additional procedures, such as rollback procedures, would be required. Even those candidates who recognized a rollback was necessary did not describe how to perform it in any helpful way. Candidates also struggled with the fact that there were different types of inventory stored at different locations, and each type and location would have specific characteristics that would lead to different types of inventory procedures. For example, many candidates suggested counting both the Quebec inventory and the offsite inventory, without recognizing that there was a possibility the offsite supplier would not be open to the idea of CPA LLP being at its premises. Candidates performed better on the valuation procedures, since the typical valuation procedures were valid in the scenario. Strong candidates were able to provide precise and well-described procedures that clearly considered both the unique timing of the scenario and the nature of the inventory. Strong candidates also provided more procedures, ensuring they covered all the assertions requested by the partner. Weak candidates generally provided generic inventory procedures, with many simply providing year-end inventory count procedures without any recognition of the additional work that would need to be performed. In addition, many weak candidates repeated the same procedures for the different types of inventory, which provided little value. In other cases, the procedures provided were too vague to be useful.
Appendix F: Board of Examiners’ Comments on Day 2 and Day 3 Simulations Page 271
AO#9 (Reliance on an Expert) Candidates were asked by the partner to prepare a memo to file, documenting why using the work of the valuator hired by CPA LLP would be appropriate, as well as what additional procedures would have to be performed to use the report received from the valuator. Excerpts from the valuator’s report were provided in Appendix VIII (Assurance). To achieve competence, candidates were expected to provide a reasonable discussion on the appropriateness of relying on the valuator, as well as provide additional procedures to be performed on the report. Candidates performed adequately on this AO. Most candidates provided a reasonable analysis of the appropriateness of relying on the valuator’s work, by discussing the valuator’s competency and objectivity using specific case facts. Candidates were also generally able to attempt some procedures that would be performed, such as procedures to audit the assumptions of the report, the underlying data included in the report, and the competence and objectivity of the valuator. However, these procedures were not always well explained. For example, many candidates simply recommended auditing the assumptions of the report without specifying what assumptions should be audited or how to go about doing it. Strong candidates considered, in their discussion of the appropriateness of relying on the valuator’s work, the need for an expert and the adequacy of the valuator’s work, in addition to the analysis of competence and objectivity. They often referred to the relevant Handbook sections to frame their analysis. They were also able to better describe procedures and tended to focus their discussions on the specific items presented in the report.
Weak candidates tended to simply copy and paste the relevant sections of the Handbook related to reliance on an auditor’s expert without applying any specific case facts to that Handbook guidance. Many of their discussions on the procedures to perform were not valid, such as suggesting that no procedures needed to be done on the report at all or that another expert should be hired to evaluate the work of the valuator.
AO#10 (Procedures – Accounting Issues) Candidates were asked by the partner to recommend audit procedures for the new, specific accounting issues identified by Jeremy. Information on the accounting issues was presented in Appendix IV to Appendix VII. To demonstrate competence, candidates were expected to provide a reasonable number of procedures that were specific to the accounting issues identified at SPS. Candidates performed adequately on this AO. Most candidates were able to provide a sufficient number of procedures that appropriately addressed the risks related to the specific accounting issues. The most commonly addressed procedures were related to the new Bright project sales, the warranty provision, and the robotic equipment purchase. Candidates were less likely to address procedures surrounding the Bright acquisition.
Appendix F: Board of Examiners’ Comments on Day 2 and Day 3 Simulations Page 272
Strong candidates were able to provide precise and well-described procedures that were clearly tied to the significant risks identified. Strong candidates also provided more procedures, both for each specific accounting issue and for more of the accounting issues. Many of them provided auditing procedures immediately following each accounting discussion, which was an efficient way to ensure that the procedures provided addressed the most relevant risk areas related to each accounting issue. Weak candidates provided vague procedures, which made it difficult to determine what exactly they were proposing to do and what risk they were trying to cover. Weak candidates tended to focus on the minor risks related to the accounting issue identified, as opposed to the significant risk. For example, many weak candidates proposed testing the total value of the robotic equipment, as opposed to the specific components. They also were more likely than average candidates to avoid the topics it was more difficult to provide procedures for, such as the new Bright project sales or the Bright acquisition. Some candidates wasted time providing audit procedures for the misstatements already identified in the audit, which was not the request from the partner. AO#11 (Summary of Identified Misstatements) Candidates were asked by the partner to prepare the summary of identified misstatements to date and to comment on how the aggregate errors, if left uncorrected, would impact the audit opinion. Information on the identified misstatements to date was provided in Appendix VIII (Assurance). To achieve competence, candidates were expected to complete the summary of identified misstatements template provided, as well as provide a reasonable discussion of the impact the aggregate misstatements would have on the audit opinion. Candidates struggled with this AO. Most candidates had difficulty completing the summary of identified misstatements despite the fact that the journal entries required to correct the misstatements were relatively straightforward. In addition, while candidates generally understood the difference between a qualified opinion and an adverse opinion, they could only explain it in a theoretical way and did not discuss these concepts within the context of the scenario they were provided. In particular, candidates struggled with the application of the materiality and pervasiveness concepts. While most candidates understood the need to compare the aggregate misstatements to materiality, they struggled with what conclusions could be drawn after they performed the comparison. Similarly, many candidates recognized that pervasiveness of the errors was a factor to consider, but then did not discuss whether the errors were in fact pervasive. Strong candidates were able to complete the summary of identified misstatements with minimal errors, and they compared the aggregate misstatements to their calculated revised materiality. They provided reasonable discussions of whether the misstatements would be considered pervasive before concluding on whether a qualified or adverse opinion would be more likely if the errors were left uncorrected. Strong candidates also generally recognized that management would need to be asked to adjust the errors, and that if they were adjusted, a clean opinion could be possible. They also recognized the fact that the audit was not yet complete and, therefore, the conclusions drawn were preliminary, since other errors had been found.
Appendix F: Board of Examiners’ Comments on Day 2 and Day 3 Simulations Page 273
Weak candidates did not do a reasonable job of completing the summary of identified misstatements. Many provided only half the journal entry for each misstatement or provided a significant number of incorrect journal entries to fix the misstatements. They also provided only generic discussions of the possible audit opinions, often copying and pasting Handbook sections without considering whether they were relevant. For example, many weak candidates provided a significant discussion on disclaimers of opinion; however, given the fact that there was no evidence of CPA LLP’s inability to obtain sufficient appropriate audit evidence, this discussion provided little value. Many weak candidates also provided technically incorrect advice, such as suggesting that materiality could be changed so that a clean opinion could be issued. AO#12 (IT Control Weaknesses) Candidates were asked by the partner to discuss any control weaknesses they identified with the job-costing program acquired from Bright and the related processes, along with recommendations to improve them. Information on the Cogna system and related processes was provided in Appendix VIII (Assurance). To demonstrate competence, candidates were expected to identify some of the control weaknesses, explain the implication of each weakness, and provide a reasonable recommendation to address the problem. Candidates performed adequately on this AO. Most candidates were able to identify some of the control weaknesses, explain their impact, and provide valid recommendations. The most commonly identified issues were the fact that there was only one super-user account, Josh had stopped reviewing the changes made by his staff, information was automatically transferred into the accounting system, and there were issues surrounding the backups. Few candidates addressed the fact that the project managers manually created the project numbers in the system. Strong candidates were able to provide good coverage of the issues and appropriately explain the implications of each weakness identified. They also proposed practical recommendations to address the weaknesses. Weak candidates did not always adequately explain why a control weakness they identified would cause issues for SPS. For example, some weak candidates discussed the fact that there was only one super-user account and stated that it could cause issues, but did not explain what the issues would be or how they would occur. Many weak candidates also did not provide valid recommendations that would address the weakness. Some recommendations made by weak candidates were not consistent with the case facts presented or did not resolve the issue at hand. For example, many candidates simply suggested that Josh should review all programmers’ work, when it was explicitly stated in the case that Josh was too busy to do so. As another example, some candidates suggested that backups should be kept for two days instead of one; this is not a significant improvement to the current situation and is unlikely to address the weakness adequately. Some weak candidates also discussed issues that were not significant, such as the fact that the IT team was overworked or that the backups needed to be stored offsite. There were more significant control issues presented related to Cogna, so discussion of these minor issues did not provide significant value.
Appendix F: Board of Examiners’ Comments on Day 2 and Day 3 Simulations Page 274
AO#13 (Review of Interim Financial Statement) Candidates were asked by the partner to draft a memo to Jeremy explaining what a review of interim financial statements is, including how it differs from an annual financial statement audit, and any first-time interim review considerations SPS should be made aware of. In addition, the partner wanted CPA to suggest how the year-end audit plan could be changed to address Jeremy’s concerns. To achieve competence, candidates were expected to provide a reasonable explanation of an interim financial statement review and suggestions to address Jeremy’s concerns of detecting errors earlier. This AO was considered difficult. This was the Assurance AO that candidates struggled with the most. The number of candidates who addressed this required by only comparing a year-end audit with a year-end review was disappointing. Most candidates simply provided a generic discussion of the difference between an audit and a review, without any specific discussion on the unique nature of an interim financial statement review. A generic comparison did not demonstrate that they understood what an interim financial statement review is, which was one of the topics being tested in this AO. Candidates performed slightly better on the ways that Jeremy’s concerns could be addressed, with many recommending interim work or the audit of specific accounting transactions as they occur. Strong candidates demonstrated an understanding of the nature of an interim review, going beyond the generic discussion of how a review provides less assurance than an audit and noting things Jeremy would want to be made aware of if they were to go ahead with interim reviews (e.g., the impact having interim reviews would have on SPS from a time and cost perspective; the ability to leverage the interim reviews for the year-end audit and vice versa). They were also able to provide several reasonable recommendations to address Jeremy’s concern about detecting accounting errors earlier. Weak candidates often simply provided a generic discussion of audit versus review considerations or copied and pasted significant portions of the Handbook guidance related to interim financial statement reviews without any additional explanations or discussions. Some weak candidates provided discussions of several special reports (e.g., Section 5815, Section 8600, or Section 9100 reports), none of which were relevant to this situation. Many weak candidates also provided technically incorrect discussions. For example, some thought that there would be an independence issue with performing both the interim review and the year-end audit. Weak candidates also struggled with recommendations to address Jeremy’s concerns, with many simply suggesting that materiality be reduced or more substantive work be performed at year end. While these recommendations would help with detecting more errors at year end, they would not address Jeremy’s concern about being able to detect errors earlier in the year.
Appendix F: Board of Examiners’ Comments on Day 2 and Day 3 Simulations Page 275
Paper/Simulation: Day 2 (SPS) – Role Case FINANCE
Estimated time to complete: 300 minutes
Simulation difficulty: Average
Competency Map coverage: Finance role (8 Assessment Opportunities)
Evaluators’ comments by Assessment Opportunity (AO) for the FINANCE ROLE
AO#6 (Solar Farm Net Present Value) Candidates were asked for a quantitative and qualitative analysis of a potential investment in a solar farm. This AO was for the quantitative part of the analysis of this proposal. In Appendix VIII of the case, candidates were supplied with the information required to perform the calculation. To demonstrate competence, candidates were expected to provide a net present value (NPV) analysis of the potential investment. Candidates performed very well on this AO. Most candidates calculated the net present value of the solar farm over 40 years using an 8% discount rate and included most of the relevant adjustments — typically these would include the initial investment, revenue, annual costs, the CCA tax shield, the salvage value, and decommissioning costs. Strong candidates performed the same calculations and included almost all the relevant adjustments, including tax and the investment in accounts receivable. Most of these candidates also performed a sensitivity analysis. Weak candidates usually calculated the net present value of the solar farm but used an inappropriate time period or discount rate. They also tended to leave out many elements of the calculation. AO#7 (Sensitivity and Minimum Revenue for Zero NPV) Candidates were asked to determine the minimum amount of revenue required for the project to be financially acceptable for SPS. They were also asked for the minimum hours of annual sunlight and minimum selling price, using certain assumptions, to achieve this revenue. To demonstrate competence, candidates were expected to determine the minimum revenue required to obtain an NPV of zero (based on their calculations in AO#1) and to use this to determine the required sunlight hours and selling price under the specified assumptions.
Appendix F: Board of Examiners’ Comments on Day 2 and Day 3 Simulations Page 276
Candidate performance was below average on this AO. Most candidates attempted to determine the revenue to obtain zero NPV for the project, but some did not use the best tool to achieve this, instead resorting to trial and error or attempting calculations that excluded the significant variable costs. They usually understood what needed to be done but still struggled with how to do it. However, most candidates attempted to extrapolate their result to determine the required sunlight hours and minimum price. Strong candidates determined the revenue to obtain zero NPV for the project, generally using the PMT formula or another Excel tool to determine the required amount of revenue. They then used the required amount of revenue to determine an appropriate amount of required sunlight hours and minimum price, and they commented on whether those amounts could reasonably be achieved. Weak candidates usually attempted to determine the required sunlight hours, the minimum price, or both, but they skipped the step of determining required revenue and, in turn, struggled to determine reasonable amounts, instead using the estimated amounts provided in the case. AO#8 (Qualitative Analysis of New Solar Farm) Candidates were asked for a quantitative and qualitative analysis of a potential investment in a solar farm. This AO was for the qualitative part of the analysis of this proposal. To demonstrate competence, candidates were expected to discuss several qualitative elements associated with the solar farm project in order to demonstrate an understanding of the risk of the project and provide a recommendation on whether SPS should proceed. Candidate performance on this AO was average. Candidates typically discussed the qualitative issues associated with the solar farm project, often focusing on the validity of the assumptions used in the calculation, the termination clause, and the penalty for failing to meet the electricity commitment. Strong candidates discussed the qualitative issues associated with the solar farm project, focusing on issues similar to those average candidates discussed, but also discussing several other qualitative concerns, such as SPS’s lack of experience and the impacts on cash flow timing. Strong candidates recognized the risks of the project and made supported recommendations. Weak candidates typically focused entirely on the assumptions inherent in the calculation rather than on other qualitative issues. Many also failed to address the risks that should be considered and focused their discussion on the benefits of the proposed project.
Appendix F: Board of Examiners’ Comments on Day 2 and Day 3 Simulations Page 277
AO#9 (Solar Farm Financing) Candidates were told that there was a potential additional solar farm investment, and that Jeremy was considering project financing for this second project. Candidates were asked to determine the appropriate cost of capital for this project, to discuss why project financing might be appropriate, and to list both advantages and disadvantages of using project financing, assuming SPS would go forward with this investment. To demonstrate competence, candidates were expected to calculate the weighted average cost of capital (WACC) and to discuss project financing as it applied to this scenario. Even though the simulation described what project financing is, candidates still struggled with this AO. Candidates generally did not have trouble calculating the WACC with appropriate factors included. However, most candidates’ qualitative analysis of project financing focused on either the benefits or risks (but not both) or failed to step back to consider the nature of project financing and what made it unique compared to other kinds of financing available. Of all the Finance role AOs, performance was the weakest on this AO. Strong candidates, however, calculated the WACC with appropriate factors included and provided a qualitative analysis of project financing, demonstrating an understanding of the nature of project financing and what made it unique compared to other kinds of financing available. Many of these candidates’ qualitative discussions discussed how project financing limits the financial risk for SPS while also reducing the amount of control SPS has over the project. Weak candidates struggled to calculate the WACC correctly (excluding factors in the calculation or bringing incorrect case facts into it), provided little to no qualitative discussion, or did both. AO#10 (OWF Valuation) Candidates were told that SPS had received an offer from Grain Farmers Co-op (GFC) to acquire Ontario Wind Farms Inc. (OWF) from SPS. They were asked to determine the value of OWF to SPS, as well as whether GFC’s offer should be accepted. Given that OWF had only one asset (the wind farm), an asset approach was to be used for this analysis. Candidates were told, in Appendix VIII, that a discounted cash flow approach was used to value this tangible asset. To demonstrate competence, candidates were expected to use the discounted cash flow approach to perform a calculation of the value of OWF and compare it to the offer received. Candidates performed quite well on this AO. Most candidates calculated a discounted cash flow over 10 years using a discount rate of 9% and included many of the relevant components of the calculation, such as revenue, operating costs, decommissioning costs, salvage value, and costs to complete. They also compared this amount to the $20 million offer received for OWF. Strong candidates performed a similar analysis but included most of the relevant components of the calculation, including taxes and depreciation.
Appendix F: Board of Examiners’ Comments on Day 2 and Day 3 Simulations Page 278
Weak candidates attempted to calculate a discounted cash flow, but some used inappropriate time periods or rates. Many of these candidates tried to make an adjustment for depreciation but did so erroneously (either backing it out of the expenses that were clearly less than the amount of depreciation or bringing it into the cash flow calculation despite it being a non-cash item). Many poor responses did not compare the value to the offer that was received, excluded the costs to complete from their analysis, or did both. AO#11 (Equity Carve-Out) Jeremy wondered whether SPS should instead offer GFC a 25% ownership in OWF. OWF would then issue enough new shares from OWF to provide GFC with 25% ownership. Candidates were asked to calculate the amount that OWF should require in exchange for these shares, and to list the advantages and disadvantages of the possible share issue and determine whether it would be appropriate for SPS. To demonstrate competence, candidates were expected to determine the amount of investment required and to provide a discussion of the qualitative implications of this offer. Candidate performance on this AO was mixed. Most candidates determined the required cash injection by multiplying the value of OWF by 25%, failing to recognize that the cash injection would itself increase the value of the company. However, most candidates did go on to discuss several qualitative concerns with respect to a 25% share issuance, such as the additional influence GFC would exert, the experience GFC would bring to the wind farm, and the benefit of extra cash being available to OWF. Strong candidates discussed similar qualitative concerns with respect to a 25% share issuance. However, they correctly determined the required cash injection by grossing up the value by the amount of the injection and calculating 33% of the value of OWF, recognizing that the cash injection would itself increase the value of the company. Weak candidates determined the required cash injection by multiplying the value of OWF by 25%, similar to average candidates. However, most weak candidates did not provide much in the way of qualitative analysis or focused on minor issues, such as the accounting treatment of the investment or logistical issues. AO#12 (Cash Conversion Cycle and Credit Policy) Candidates were asked to calculate the impact on SPS's income before taxes, as well as on its cash cycle, of offering 60-day credit terms instead of the current policy of a 30-day credit period. They were also asked to recommend improvements to SPS’s current working capital management and to evaluate the option of offering a discount for early payment to its largest customer. Candidates were not provided with the current cash cycle number, so this required them to calculate that number as a starting point for the rest of their analysis. To demonstrate competence, candidates were required to perform some of these required calculations and to recommend some improvements.
Appendix F: Board of Examiners’ Comments on Day 2 and Day 3 Simulations Page 279
Overall, candidates did not perform well on this AO. Many did not attempt the cash cycle calculations, attempted them in a way that showed they did not understand how to determine the cash cycle, or based their analysis only on industry numbers given in the case rather than actual numbers from SPS. However, many candidates did calculate the impact on net income of the bad debts (although not necessarily the related interest expense) derived from a change to credit terms, and they recommended improvements to the cash cycle management at SPS. Strong candidates determined the cash cycle under existing conditions and then determined the impact of the proposals on that cash cycle. They also provided recommendations to improve the cash cycle in the future, and they calculated the cost of extending the credit terms or evaluated the impact of the discount. Weak candidates typically calculated the impact on net income of the bad debts and interest expense derived from a change to credit terms or recommended improvements to the cash cycle management at SPS, but few attempted any other analysis. AO#13 (Dividend Policy) Candidates were told about several options Jeremy had identified with respect to a dividend policy for SPS, including a one-time dividend payout, a one-time share repurchase, and an ongoing residual dividend policy. They were asked to calculate the amount of dividends (or repurchased shares) that would be involved in each of these options, as well as provide an analysis of the options and a recommendation. To demonstrate competence, candidates were expected to attempt calculations of the impacts of the various policies and to discuss the options involved. Candidate performance on this AO was average to weak. Many responses were brief, and it is possible that candidates were rushing to complete their analysis on this AO. However, most candidates were able to calculate either the number of shares to be repurchased or the residual dividend and to provide a qualitative discussion of the impact of the dividend policy on the company and its market performance. Most candidates’ qualitative discussions considered the impact on liquidity and on earnings per share. Strong candidates calculated the number of shares to be repurchased or the dividend payout, and then calculated the amount of dividends that would result from a residual dividend policy. They also provided a qualitative discussion of the impact of the dividend policy on the company and its market performance, typically providing more depth by discussing the signalling that would be provided to the market by the policy chosen. Weak candidates only attempted a calculation of either the dividend to be paid out or the shares to be repurchased, and they did not consider the qualitative impacts of any of the proposed policies.
Appendix F: Board of Examiners’ Comments on Day 2 and Day 3 Simulations Page 280
Paper/Simulation: Day 2 (SPS) – Role Case PERFORMANCE MANAGEMENT
Estimated time to complete: 300 minutes
Simulation difficulty: Average
Competency Map coverage: Performance Management Role (7 Assessment Opportunities)
Evaluators’ comments by Assessment Opportunity (AO) for the PERFORMANCE MANAGEMENT ROLE
AO#6 (Situational Analysis and Risk Mitigation Strategy) Candidates were asked by Jeremy Whitman to prepare a situational analysis of SPS, along with an identification of the risks SPS is currently facing and suggestions of ways to mitigate them. Candidates were provided with some of the information required in Appendix I of the common section of the case (pages 9 and 10 in particular) and in Appendix VIII. Candidates could also integrate other information found in the beginning, common part of the case. Candidates were expected to identify and analyze the major elements of SPS’s external and internal environment, identify the most important risks, and develop ways to mitigate them, integrating the information presented in the case. Overall, candidates performed very well on this AO. They were able to identify several elements of relevance to SPS’s environment and provide an adequate analysis of them. Candidates are very accustomed to this kind of analysis and had no trouble identifying the relevant elements sprinkled throughout the case. They seemed to have devoted a significant amount of their allotted time to this AO, resulting in generally good performance. However, it may have resulted in briefer analyses on the later issues. Most candidates were able to identify a sufficient number of relevant elements related to the company’s internal environment (strengths and weaknesses) and external environment (opportunities and threats), as well as a sufficient number of relevant risks the company was facing. The analysis candidates provided of the risks SPS was facing was generally shorter, but most contained a sufficient number of risks and a reasonable mitigation strategy. What made the biggest difference in candidates’ performance was the level of depth in their analysis of each element they identified. Strong candidates not only identified the relevant case facts, but also attempted to identify the cause or the consequence, or both, of the elements of the external and internal environment they had identified. This enabled them to provide an analysis that would be very useful to Jeremy. They were also able to identify the various risks that SPS was facing, with many using the “threats” section of their situational analysis as a starting point and continuing from there to provide relevant suggestions to mitigate these risks.
Appendix F: Board of Examiners’ Comments on Day 2 and Day 3 Simulations Page 281
Weak candidates typically presented their response in a bullet-point format, merely categorizing various case facts into the four buckets (strengths, weaknesses, opportunities, threats) without taking the time to explain why these elements were relevant or what their impact on SPS would be. In some cases, candidates’ responses provided very little added value to Jeremy because they never went beyond restating case facts, which he was likely already aware of. Some weak candidates ignored the second component of this AO, the risk mitigation strategy. Others seemed to have misinterpreted this part of the required because they attempted to solve the internal weaknesses they had identified earlier as part of their situational analysis instead of identifying and attempting to mitigate the relevant risks. AO#7 (Solar Farm Proposal – Quantitative Analysis) SPS has received an offer from a computer processing company (Comcap) to operate a solar farm it built to supply the electricity it needs. Jeremy asked CPA to provide a quantitative and qualitative assessment of the project. This AO deals with the quantitative aspects of the project, while AO#3 addresses the qualitative elements. Candidates were provided with the relevant information for this analysis as part of Appendix VIII of the case. Candidates were expected to analyze the offer, which was to operate the solar farm on behalf of Comcap, incurring all the operating costs and then selling all the electricity generated by the solar farm to Comcap at a predetermined price per kWh. If candidates recommended that SPS accept the offer, they also had to determine if $4.5 million should be invested to upgrade the solar farm and increase its electricity-generating capacity. Since the proposed contract requires SPS to commit to generating a minimum number of kWh for Comcap’s needs, rain or shine, the key component of this quantitative analysis was determining the electricity surplus or shortfall under both scenarios (upgrade or not), to then be able to quantify the additional revenues or costs generated by either the resale of the surplus or the purchase of the shortfall. The quality of candidates’ responses varied the most in this AO. This offer was unusual for two reasons: first, SPS would operate a third party’s business on its behalf without owning it, and second, the product sold was electricity, not a tangible manufactured good. Given the unusual nature of the proposal, this AO was considered challenging, and candidates performed as expected. The industry (the production and sale of electricity) seemed to puzzle some candidates, while others understood the scenario and provided near-perfect calculations. The case provided quantitative information concerning electricity delivery costs, which most candidates were able to integrate correctly into their calculations. The most common errors were to consider delivery a revenue, when electricity was sold to the public utility, and to consider delivery costs when providing electricity to Comcap, when the solar farm was located on Comcap’s premises.
Appendix F: Board of Examiners’ Comments on Day 2 and Day 3 Simulations Page 282
Strong candidates realized that a capacity analysis was required, given that SPS would have to commit to delivering 46 million kWh but the solar farm could provide only 26 million kWh without its equipment being upgraded. They realized that the 20 million kWh shortfall would have to either be purchased from the public utility at market prices, which were expected to be higher than the selling price to Comcap, or be generated internally by way of a $4.5 million investment to upgrade the existing equipment. They also realized that the upgrade option would generate an electricity surplus that could then be resold to the public utility, contributing to the financial benefits of the upgrade investment. In addition, strong candidates generally presented their calculation in the form of a comparison of the cash flows generated under the two scenarios for the duration of the contract. These candidates realized that the financial merits of the offer were highly dependent of the market price of electricity, and they performed a sensitivity analysis using the low and high range of electricity prices per kWh provided in the case. Weak candidates had difficulty transforming the case facts into a reasonable and useful calculation. Many of them failed to realize that the electricity produced by the farm could not be sold on the market unless the full 46 million kWh committed to Comcap had been delivered, and, more generally, they failed to realize that SPS was not currently in the business of selling electricity and that this project would not generate an opportunity cost in terms of electricity sales. Some weak candidates were able to calculate the surplus or shortfall arising from both options, but then were unable to integrate them into a useful calculation of incremental profits/cash flows for SPS. AO#8 (Solar Farm Proposal – Qualitative Analysis) Candidates were also asked to perform a qualitative analysis of the Comcap offer. Candidates were expected to identify the significant qualitative decision factors. The AO was more difficult than the usual qualitative analysis of an offer from a third party for three reasons: the unusual nature of the business model, the unusual nature of the industry itself, and the limited number of case facts that the candidates were provided in the section of Appendix VIII devoted to this required. Overall, candidates struggled with this AO, which was expected given its difficult nature. Most candidates structured their analysis in a “pros” versus “cons” format, and most compared the status quo to accepting the offer, without integrating the upgrading decision discussion into their qualitative analysis directly. A surprisingly high number of candidates labelled “qualitative” what was in fact a narrative expression of parts of their quantitative analysis. Strong candidates were able to identify the major qualitative elements, such as the uncertainty of electricity prices in the future, the short-term nature of the contract (potentially only one year), the fact that Comcap was created only two years ago and had no proven track record, the risk associated with the weather (sunlight hours), the diversification provided by this new revenue stream, and the link with the company’s mission and strategy, among others.
Appendix F: Board of Examiners’ Comments on Day 2 and Day 3 Simulations Page 283
Weak candidates did as mentioned for candidates overall, but rather than identifying the qualitative elements, they merely repeated each key component of their quantitative analysis in a narrative form as either a pro or a con, failing to discuss enough of the actual qualitative elements. AO#9 (Performance Indicators) Jeremy also asked CPA to assess the six current performance indicators used by SPS to evaluate and compensate its two plant managers, and to make improvements to them or to suggest new ones. It was also mentioned in the case that the managers were complaining that the indicators were unfair because they measured factors outside of their control. Therefore, the required specifically asked candidates to assess the fairness of the current indicators, among other things. The information that the candidates could use was presented in a separate section of Appendix VIII of the Performance Management role. Candidates performed well on this AO. They typically analyzed most of the six current indicators and suggested improvements to them, new indicators that would more fairly evaluate the plant managers’ performance, or both. The fact that the case mentions that the current indicators were labelled as unfair by the managers on the basis that they measured factors outside of their control seemed to help candidates focus their response on the control attribute, which was a key component of this AO. Strong candidates generally discussed the six indicators one by one and identified the component of the indicator that was outside of the control of the managers. For example, the managers did not control the administrative overhead of the whole company, so it was, therefore, unfair to evaluate them based on the net operating income of their plant since this measure was affected by the allocated administration costs. Strong candidates were able to do this with all six indicators and suggest modifications or make relevant recommendations for new indicators. Weak candidates fell short in one of the following areas: they addressed only one or two indicators; the changes they recommended to the indicators were vague, weak, or absent; or they missed the required altogether, and, rather than critique the indicators themselves, they recommended ways the managers could get a larger bonus on the basis of the current indicators. AO#10 (Transfer Pricing) Jeremy also asked CPA to discuss the transfer pricing options between the two manufacturing plants and the sales division. The plant managers mentioned that the recent change from variable costs plus a profit margin to variable costs alone is unfair to them, and Jeremy asked CPA to recommend a more equitable transfer pricing policy. Information on the evolution of the various transfer pricing policies followed over the years, as well as some quantitative information on the various options considered, were presented to the candidates in a specific section of Appendix VIII of the case.
Appendix F: Board of Examiners’ Comments on Day 2 and Day 3 Simulations Page 284
This is the most difficult AO in the performance management role, and candidate performance in it was the weakest. Many candidates did not seem to know how to approach this AO. In general, candidates attempted to discuss the four transfer pricing options suggested in the case, but their analysis only involved quantifying the impact on the bonuses of the sales division manager and the plant managers, or their discussion was very theoretical and not specific to SPS’s scenario. Strong candidates focused on the transferring of inefficiencies between the manufacturing plants and the sales division, on the way the plant managers should be evaluated, or on the incentive the transfer price was giving the managers to potentially enter into transactions that would not be beneficial to SPS as a whole. They also linked their discussion to the current capacity availability in the production plants, and they realized that the optimal transfer pricing option could potentially be dependent on the use of the plants’ capacity. Weak candidates either merely determined the mathematical impact of increasing or decreasing the transfer price on the plant managers’ and the sales manager’s bonus, or proceeded to provide a theoretical analysis of transfer pricing without attempting to link it specifically to the case and the data provided in Appendix VIII. Some weak candidates ignored the transfer pricing component altogether and simply reiterated their opinion on how the plant managers should be evaluated (considering the plants as cost centers, for example), without linking this potentially valid discussion to the topic of transfer pricing. AO#11 (Outsourcing Decision – Quantitative Analysis) Candidates were told that SPS was contemplating outsourcing the sales division. The projected data relevant to a quantitative analysis of this decision was presented in a specific section of Appendix VIII. Jeremy asked CPA to provide a quantitative and qualitative analysis of this decision. This AO deals with the quantitative aspects of the decision, while AO#12 addresses the qualitative elements. Jeremy specifically asked candidates to perform a sensitivity analysis of the decision, assuming the possibility of a 10% increase or decrease in sales. Candidates were expected to realize that the decision ultimately involved transforming mostly fixed costs (such as salaries and travel expenses) to mostly variable costs (commissions), adequately quantifying the ongoing costs under both scenarios (status quo versus outsourcing), correctly ignoring irrelevant costs that would be present in both scenarios (the training costs as well as the salary of the sales manager who would be retained), and properly segregating the one-time severance cost and treating it as a non-recurring cost. Given the relatively easy nature of the calculation required, candidates’ performance was disappointing. This was one of the last two AOs in the PM role, and some candidates appeared to be rushed for time. This resulted in calculations that were not as well structured as for AO#7. Some candidates did not attempt this AO at all. Several candidates were able to provide a useful calculation to help determine if the outsourcing decision would be profitable at the current sales volume. However, most candidates did not realize that the conclusion was highly dependent on volume, and their performance in that aspect of the AO was disappointing. In addition, a surprisingly high number of candidates ignored the specific requirement to perform a sensitivity analysis based on various sales projections.
Appendix F: Board of Examiners’ Comments on Day 2 and Day 3 Simulations Page 285
Strong candidates were able to correctly calculate the commissions paid under both options, considering that only solar panel sales were eligible and that 10% of the sales were done through a sales counter where no salespeople were required. They were able to ignore the two non-relevant costs from their analysis and properly include the salaries and travel costs as specific to the status quo option. They were also able to adequately segregate the severance package as being non-recurring and to address it differently than the ongoing costs. Many candidates were able to provide a near-perfect calculation. Weak candidates made conceptual errors related to the non-relevant costs (they considered them anyways), treated the severance costs as recurring costs, or made many errors in the computation of the various inputs of this calculation. AO#12 (Outsourcing Decision – Qualitative Analysis) Candidates were also asked to perform a qualitative analysis of the outsourcing decision. Again, most candidates structured their analysis in a “pros” versus “cons” format. Candidates performed well on this AO, despite it being the last one in the PM role. Most candidates were able to provide a sufficient, useful qualitative analysis on which Jeremy could base SPS’s outsourcing decision. Contrary to AO#3, the case provided numerous facts that the candidates could use to qualitatively assess this decision, which made it an easier assessment opportunity. Strong candidates were able to identify and explain numerous valid qualitative elements to consider before making this important move, like the potential loss of control on the sales function of the business, the high qualifications and performance of the current sales force, the relatively short duration of the outsourcing contract, the short 30-day notice that both parties could give to opt out of the outsourcing contract, and the turnover issues in the sales division, among others. Weak candidates displayed one or more of the following flaws: they provided Jeremy with an insufficient number of valid elements; they discussed one element in depth, but never went beyond that one argument; they made a laundry list of case facts, labelled as pros and cons, in a bullet-point format, without adding any further analysis or value to Jeremy; or, as was the case in AO#8, their qualitative assessment was merely a narrative restatement of key elements of their quantitative analysis performed in AO#11. Overall, candidates’ performance was good for this relatively easy assessment opportunity. However, as mentioned earlier, some candidates experienced time management issues at this point of the examination, and their responses reflected those time constraints.
Appendix F: Board of Examiners’ Comments on Day 2 and Day 3 Simulations Page 286
Paper/Simulation: Day 2 (SPS) – Role Case TAXATION
Estimated time to complete: 300 minutes
Simulation difficulty: Average
Competency Map coverage: Taxation role (7 Assessment Opportunities)
Evaluators’ comments by Assessment Opportunity (AO) for the TAXATION ROLE
AO#6 (Calculation of Net Income for Tax Purposes, Taxable Income, and Taxes Payable) Candidates were asked to calculate both the taxable income and the taxes payable for SPS for 2017 based on the revised net earnings. To demonstrate competence, candidates were expected to provide a reasonable calculation of the taxable income and tax liability. Candidates performed quite well on this AO. Most candidates calculated net income for tax purposes, taxable income, and taxes payable with a number of adjustments (often most of them). Typical responses included all of the more straightforward adjustments, such as depreciation and the accounting gain, and several of the more difficult ones, such as the reserves or the SR&ED items. Strong candidates calculated net income for tax purposes, taxable income, and taxes payable with virtually all of the adjustments. Their responses usually also considered all the components of the SR&ED calculations. Weak candidates typically still calculated net income for tax purposes or taxable income, but with a minimal number of adjustments or with many significant errors. Many of them invented adjustments that did not apply or left out material adjusting items such as the income tax expense (i.e., they started with net income after tax and did not add it back), the depreciation, or both. AO#7 (Taxable Income Explanations) Candidates were asked to discuss each adjustment that they included in their calculations. To demonstrate competence, candidates were expected to discuss several of these adjustments in some depth. Candidates performed reasonably well on this AO. Most candidates discussed several adjustments in their calculation, including some of the more straightforward ones (like the depreciation, CCA, accounting gain, and membership dues) and some of the more complicated ones (like the SR&ED, reserves for warranties and decommissioning costs, appraisal costs, share-based compensation, and consolidation).
Appendix F: Board of Examiners’ Comments on Day 2 and Day 3 Simulations Page 287
Strong candidates discussed all the adjustments in their calculation, including many of the more complicated ones. Most of these responses communicated the explanations in a way that clearly connected the adjustments and the explanations, by, for example, numbering their adjustments and providing footnotes to their exhibit that both explained why the item was being adjusted and how the adjustment was calculated. Weak candidates discussed very few of the adjustments in their calculation or provided very brief explanations of their adjustments immediately beside the calculation without elaborating. Many of these responses focused on the simple adjustments that required little explanation, such as depreciation and accounting gain, and avoided the ones that required more in-depth discussions. AO#8 (Calculation of Capital Cost Allowance) Candidates were asked to provide a detailed capital cost allowance (CCA) in support of their taxes payable calculation. To demonstrate competence, candidates were expected to calculate the CCA deduction in some depth, considering the major components of the calculation. While candidates generally understood the most basic components of the CCA calculation, many struggled to provide depth in their calculation. Typical candidates calculated CCA using the opening balances and the additions provided for the year. Most of these candidates attempted to deal with the disposition that was made during the year, although many struggled to correctly apply the lesser of cost and proceeds rule. Most strong candidates calculated CCA using the opening balances and the additions provided for the year, and they correctly dealt with the disposition that was made during the year by correctly applying the lesser of cost and proceeds rule. Their responses usually integrated one of the more difficult adjustments in the calculation, such as the appraisal costs, integration of spare parts adjustment, or Bright acquisition. Many weak candidates simply calculated CCA using the opening balances and some of the basic additions provided for the year, with no further adjustments for any of the other components of the calculation. AO#9 (Acquisition of Control) Candidates were asked to discuss the implications for Ontario Wind Farms Inc. (OWF) of its acquisition by SPS in 2017. They were specifically told that Roger wants to understand the tax implications of this acquisition of control. To demonstrate competence, candidates were expected to discuss the implications of an acquisition of control, with some application to this specific transaction. Candidate performance on this AO was relatively strong given that this was a difficult subject. Most candidates identified that there was an acquisition of control and discussed some of the simpler implications, such as the deemed year end and the fact that non-capital losses will only be available against income from a same or similar business.
Appendix F: Board of Examiners’ Comments on Day 2 and Day 3 Simulations Page 288
Strong candidates, in addition to the above, also discussed more complex issues, such as the requirement to recognize accrued losses and the availability of an elective bump. Weak candidates identified that there was an acquisition of control, but then many made technically incorrect statements about the implications, often suggesting that all assets were deemed to have been disposed of at fair value or discussing implications that were only applicable to CCPCs changing status (which was not applicable in this case). AO#10 (Sale of Assets versus Shares of OWF) Candidates were asked for an analysis of the tax issues arising from the sale of OWF, whether for assets or shares, and the implications for both OWF and SPS. Specifically, they were told to determine which option would yield the most after-tax cash for SPS. To demonstrate competence, candidates were expected to provide a reasonable calculation of the taxes payable for both options. Candidate performance on this AO was relatively weak. Typical candidates calculated the taxable capital gain and taxes payable associated with the disposition of shares and calculated the taxable capital gain on the disposition of the land and wind farm assets. Many made errors with respect to the adjusted cost basis for the land and wind farm assets, which usually revealed that they were confused about the impact of the initial acquisition that had taken place earlier in the year. Only some candidates completed the analysis to flow through the after-tax proceeds to SPS from OWF. It was disappointing how few candidates took their analysis past the taxable capital gain calculation stage to consider the wind-up. Strong candidates, as with average candidates, calculated the gains. However, most of these candidates also used the correct (consistent with their AO#9 analysis) adjusted cost basis for the land and wind farm assets and completed the analysis to flow through the after-tax proceeds to the parent corporation. Weak candidates typically calculated the taxable capital gain and taxes payable associated with the disposition of shares, but then made technical errors when attempting to calculate the taxable capital gain on the disposition of the land and wind farm assets, often using incorrect proceeds figures, using cost bases that were inconsistent with their AO#9 analyses, or confusing capital gains with other types of income. Few completed the analysis to flow through the after-tax proceeds to the parent corporation. AO#11 (Employee and Contractor Discussions) Candidates were asked to discuss the tax differences for SPS between having employees and having independent contractors. They were also asked to discuss the tax implications from the salesperson’s perspective of being an independent contractor as opposed to an employee — specifically, what independent contractors can deduct from their commission income. To demonstrate competence, candidates were expected to discuss some of the differences between the two worker structures and explain some deductions that would be available to independent contractors.
Appendix F: Board of Examiners’ Comments on Day 2 and Day 3 Simulations Page 289
Candidate performance on this AO was average. Most candidates identified several differences between employees and contractors (often focusing on income tax/CPP/EI withholdings) and explained some deductions that would be available to contractors. Strong candidates identified many differences between employees and contractors, considering not only income tax/CPP/EI withholdings, but also the impact on SPS of things like tax reporting and severance pay. Their responses also explained several deductions that are available to contractors in depth, considering the more complex ones such as workspace in the home, automobile expenses, and CCA. Many weak candidates did not address the required that was presented to them. For example, many discussed the criteria for being treated as an employee versus a contractor. Their responses typically only provided a list of deductions available rather than explaining them in any level of depth, and, in many cases, they focused on deductions that were available to commissioned employees rather than independent contractors, which they were asked about. Many weak candidates also stated, incorrectly, that the deductions available against self-employment income were limited to the commission income earned. AO#12 (Tax-Dividends) Candidates were asked to help Roger, the founder of SPS, understand from a qualitative and quantitative perspective how the tax treatment of dividends paid by SPS would differ from dividends he receives from VC, a private company earning less than the small business deduction. To demonstrate competence, candidates were expected to discuss the differences between the two types of dividends and provide a calculation that attempted to demonstrate the difference quantitatively. Candidate performance on this AO was below average. The information presented was clear and almost overly simplistic; candidates had to address a $100,000 dividend in each case. Many still struggled to provide calculations. However, most did explain that public corporations generally pay eligible dividends and that CCPCs earning less than the small business deduction typically pay other-than-eligible dividends. They then went on to calculate the gross-up and dividend tax credit on each type of dividend, with many incorporating these into a calculation of taxes payable. Strong candidates elaborated, explaining the tax integration policies behind the distinction between the two types of dividends. They calculated the gross-up and dividend tax credit on each type of dividend, incorporated these into a calculation of taxes payable, and concluded on the results. Weak candidates attempted a calculation of the gross-up and dividend tax credit on each type of dividend but made errors in the calculations (for example, by deducting the tax credit from the dividend income rather than from taxes, or by calculating the tax credit incorrectly). Only some of these candidates attempted a qualitative discussion of which dividends applied to which type of entity or why.
Appendix F: Board of Examiners’ Comments on Day 2 and Day 3 Simulations Page 290
BOARD OF EXAMINERS’ COMMENTS ON DAY 3 SIMULATIONS
Paper/Simulation: Day 3, Case 1 (LCC) Estimated time to complete: 90 minutes Simulation difficulty: Average 1 Competency Map coverage: Finance (3);
Taxation (1); Management Accounting (1);Assurance (1)
Evaluators’ comments by Assessment Opportunity (AO) AO#1 (Offer B-Forecast of Normalized Earnings) Candidates were asked to forecast the normalized annual revenues and expenses to help Janie assess the province’s offer to provide a 55.3 hectare substitute property to replace LCC's existing property. Details related to LCC’s annual revenues and expenses for the years ending October 31, 2017 and 2018 were provided in Appendix I. Additional information was provided in Appendix II for candidates to identify both past unusual transactions and future anticipated changes in revenues and expenses at the new site under Offer B. Candidates had multiple opportunities to either incorporate normalizing adjustments into their calculation or explain why an amount remained unchanged. To demonstrate competence, candidates were expected to calculate the normalized revenues and expenses, considering both past transactions that were unlikely to reoccur and future changes that would result from accepting the substitute property and operating at the new location. Candidates performed well on this AO. Most candidates provided a reasonable calculation of normalized revenues and expenses for LCC’s operations at the new location and incorporated multiple adjustments. Candidates generally demonstrated an understanding of the requirement to add back non-recurring expenses from the past and to adjust future revenues and expenses for anticipated changes resulting from the move to the new location. This included adjustments to revenue projections, known increases to the cost of goods sold related to the increase in the wholesale price for delivery, the additional insurance expense related to the storm damage in 2018, the elimination of Janie’s salary upon her retirement, the replacement campground manager’s salary, the decrease in propane consumption, the reduction in maintenance costs, and the changes to amortization expense resulting from the investment in setup costs at the new location.
Appendix F: Board of Examiners’ Comments on Day 2 and Day 3 Simulations Page 291
Strong candidates were able to accurately incorporate most of the normalization adjustments, integrating the information provided throughout the case by including items that were not part of the internal income statement. These candidates also demonstrated a greater depth of understanding by providing additional insight through either the performance of a sensitivity analysis or the questioning of the assumptions underlying the calculation made. Weak candidates provided a superficial normalization that incorporated only a few of the adjustments required to account for past and future changes in revenues and expenses. Often, these candidates did not clearly understand the requirement to adjust revenues and expenses for anticipated changes resulting from the move to the new location. Instead, they focused on the past unusual transactions at the existing location, which limited the number of adjustments they could incorporate. These candidates appeared to lose sight of the purpose of the analysis they were preparing. Many weak candidates also took the approach of starting with net income and adjusting that rather than restating the full income statement. While this was an acceptable approach, it tended to result in candidates missing some of the adjustments and making mistakes in terms of the direction of their adjustments. AO#2 (Business Valuation and Quantitative Comparison of the Offers) Candidates were asked to use the normalized annual revenues and expenses forecasted in AO#1 to value the business for Janie under Offer B (substitute property). Candidates were provided with information for this industry (i.e., that a normalized after-tax earnings multiplier of between 4 and 7 would apply). Candidates were further asked to provide a quantitative comparison of Offer A (lump-sum payment) and Offer B. Information on the payments to be received under Offer A and on the replacement property and cash relocation payment to be provided under Offer B was included in Appendix II. Information on the severance costs related to Offer A and setup costs at the new site under Offer B was provided in Appendix III. To achieve competence, candidates were required to provide an analysis of the net proceeds to be received under Offer A and to integrate their analysis from AO#1 to calculate a reasonable estimate of the business value under Offer B. Most candidates were able to clearly identify the total lump-sum payment provided under Offer A, and some were able to identify either one or both of 1) severance costs, and 2) income taxes affecting the net proceeds received under this offer. However, candidates typically struggled with the quantitative analysis of Offer B. Many attempted to value the existing location, when a valuation of the business at the future location would have been a more useful analysis for the client. Strong candidates were able to determine the net proceeds received under Offer A and the value of the business under Offer B while incorporating some of the other adjustments provided, such as the severance payments, cash relocation payments, advertising costs, initial setup costs, and income taxes.
Appendix F: Board of Examiners’ Comments on Day 2 and Day 3 Simulations Page 292
Weak candidates either addressed only one of the two offers or failed to provide a useful value of the business under Offer B because they were focused on the current location. Those candidates who performed an analysis of the business at the current location struggled to provide an analysis of the future changes to expenses and setup costs in a meaningful way, with many trying to do a cash flow analysis for the future operations but then failing to find a way to incorporate this into their overall analysis. These candidates appeared to lose sight of the purpose of their analysis, since operating the business in the current location was not a valid option. Weak candidates were also less successful in incorporating the various adjustments required, such as severance payments, setup costs, and income taxes. AO#3 (Qualitative Comparison of the Two Offers and Recommendation) Candidates were asked to provide a qualitative comparison of Offer A and Offer B and to recommend to Janie which option to choose. Information on the qualitative factors that would influence Janie’s choice was provided throughout the case, but mostly in Appendix III. To demonstrate competence, candidates were expected to provide a balanced discussion of the decision factors relating to the two offers and to provide a recommendation to Janie as to which offer to choose. Candidates performed well on this AO. Most candidates were quickly able to identify that Offer A would allow Janie to retire immediately, which was stated in the case as being an important consideration for her. Most candidates were also able to address the concerns around closing the business under Offer A and the impact this would have on the long-term employees of the business. There were many other case facts supplied that allowed candidates to provide a balanced, insightful analysis for Janie’s consideration, such as the fact that Janie enjoyed operating the campground, she had a recent back injury, and she planned to retire to British Columbia, among others. Strong candidates were able to provide multiple factors in favour of both offers and were able to explain how or why these factors would influence Janie’s decision. These candidates were then able to provide a strong, supported recommendation in favour of either Offer A or Offer B. Weak candidates typically restated case facts, which they categorized as pros or cons of either offer, or provided an unbalanced discussion, focusing on one offer over the other. Some candidates were also unwilling to provide a firm recommendation to Janie, which weakened their response. AO#4 (Tax implications of Offer A and Offer B) Candidates were asked to calculate and discuss the tax implications of each offer. Information on the proceeds of the expropriation of the property and sale of goodwill under Offer A and the replacement property and cash relocation payment under Offer B was provided in Appendix II. The cost base of the land and information on the setup costs were provided in Appendix III. To demonstrate competence, candidates were expected to provide a reasonable analysis of the tax implications of the government offers.
Appendix F: Board of Examiners’ Comments on Day 2 and Day 3 Simulations Page 293
Candidates struggled with this AO. Most candidates were able to recognize that the expropriation of the property and sale of goodwill would result in capital gains; however, many incorrectly assumed that the company would have access to the lifetime capital gains exemption to eliminate the taxable capital gain that would result. Other candidates assumed that the proceeds would be applied to the sale of Janie’s shares in the company and, therefore, provided an incorrect analysis of the tax implications in her personal hands, rather than addressing the sale of assets within the corporation. Strong candidates were more likely to attempt a discussion of the replacement property, and when they did, they generally provided a reasonable analysis, correctly identifying that there would be no immediate tax consequences and either identifying some of the criteria or recognizing that there was a time limit to the replacement of the property. Weak candidates either did not address the tax concepts involved or performed only a superficial analysis. Weak candidates also lacked technical knowledge; for example, stating that 100% of the proceeds on the expropriation of the property would be taxed at 13% or that there would be no tax consequences to the company because it could apply the lifetime capital gains exemption to eliminate the gain. AO#5 (Contribution Margin and Breakeven Analysis) Candidates were asked to calculate the contribution margin and required breakeven volume, as well as assess the qualitative factors for the potential motorboat rentals. Information on the potential expansion into motorboat rentals was provided at the end of Appendix III. To demonstrate competence, candidates were expected to correctly calculate the contribution margin and the breakeven volume and to provide a reasonable qualitative analysis of the project. Candidates struggled with this AO. In attempting to calculate the contribution margin, many candidates included the salary of the attendant in variable costs rather than fixed costs, despite being told that the attendant would need to be present during all the opening hours. In attempting to calculate the breakeven margin, a surprising number of candidates incorrectly included the initial investment in the dock and eight motorboats. On the other hand, candidates were able to provide several qualitative factors to consider in the decision. Strong candidates were able to accurately calculate the contribution margin. They were also able to calculate an appropriate breakeven volume, incorporating both the annual overhead and the attendant’s salary, and were successful in providing more than one qualitative factor for Janie’s consideration. Weak candidates struggled with the quantitative analysis. These candidates had difficulty differentiating between the variable costs and the fixed costs (e.g., including the attendant’s salary in the contribution margin calculation) and between fixed costs and capital costs (e.g., including the full investment cost of the dock and boats in their breakeven analysis). As a result, their analysis contained significant errors and was considered of limited use to Janie.
Appendix F: Board of Examiners’ Comments on Day 2 and Day 3 Simulations Page 294
AO#6 (Audit Procedures) Candidates were asked to provide examples of substantive audit procedures that would be performed on several accounts: campground fees, snack bar revenue, snack bar cost of sales, and repairs and maintenance. To demonstrate competence, candidates had to provide some valid audit procedures that were relevant to the accounts specified. Candidates performed as expected on this AO. Most candidates were able to suggest enough valid procedures for Janie to understand what audit procedures would be performed in the future. Campground revenue was the account for which most candidates provided a procedure. Candidates used both analytical procedures and tests of detail to address this AO. Strong candidates were able to suggest audit-level procedures that were specific, complete, and clear in purpose. They were able to address more than one account, thereby providing more breadth of analysis. They also recognized that analytical procedures and tests of detail were relevant. Weak candidates provided fewer procedures. These candidates suggested procedures that were incomplete, vague, not useful in assessing the underlying account, or very general. Many weak candidates also failed to incorporate the specific information provided in the case into their procedures. For example, some weak candidates provided a generic procedure for all revenue (campground fee and snack bar revenue) that could also be applied to any organization, instead of a specific procedure aimed at assessing revenue sources such as, for example, campground fees. Weak candidates also struggled to provide procedures that were appropriate for this industry, with many failing to identify appropriate source documents for the specified revenue and expense accounts for this type of business.
Appendix F: Board of Examiners’ Comments on Day 2 and Day 3 Simulations Page 295
Paper/Simulation: Day 3, Case 2 (PPI) Estimated time to complete: 80 minutes Simulation difficulty: Average 2 Competency Map coverage: Management Accounting (3);
Taxation (1); Assurance (1); and Strategy and Governance (2)
Evaluators’ comments by Assessment Opportunity (AO) AO#1 (Warehouse Payroll Costs) Candidates were asked to provide a quantitative and qualitative analysis of the warehouse payroll costs by comparing the first half of 2018 with the last half of 2017. Candidates were also asked to discuss the potential causes of the increase. Appendix II provided a description of the payroll system, while Appendix III provided warehouse metrics that included total wages paid for each period, as well as other relevant information that could be used to perform an analysis on the warehouse payroll costs. To demonstrate competence, candidates had to identify the main reason for the increase, quantify its impact on the warehouse payroll costs, and explain why the behaviour was occurring. Candidates performed well on this AO. Most candidates were able to identify a reason for the increase and perform a quantitative analysis that was relevant to the case. Based on the information provided in Appendix III, they identified the transfer of hours from regular to overtime, the reduction in packing efficiency, or the increase in the hourly rate as the reason for the increase, with the most common reason being the switch from regular hours to overtime hours. Most candidates also provided a plausible explanation for the situation, the most commonly discussed being the lack of a formal unpaid leave policy that allowed employees to take time off during the week and work overtime during the weekend in order to get paid a higher hourly rate. Strong candidates were able to identify more possible reasons for the increase in warehouse payroll costs. They were also more likely to explain why employees were behaving the way they were and to provide a clear link between the employees’ actions and the increase in warehouse payroll costs. Most of these candidates also provided greater depth in their analysis of each of the reasons they identified.
Appendix F: Board of Examiners’ Comments on Day 2 and Day 3 Simulations Page 296
Weak candidates struggled to provide a reasonable quantitative analysis. Many of them performed a variance analysis, calculating the increase in warehouse payroll costs between the last six months of 2017 and the first six months of 2018, ignoring every other factor that could have an impact on the cost. These candidates did not realize that the cost could be influenced by the rate of pay or the efficiency of the employees. This analysis was not valuable for Jaqueline, since she already knew that the warehouse payroll costs had increased. Others noted an increase in overtime hours and concluded that the costs increased because the overtime increased, not realizing that the number of regular hours had decreased. Some weak candidates misinterpreted case facts, thinking that the elimination of the packing coordinators could be part of the explanation, when they were only eliminated halfway through 2018. AO#2 (Packing Coordinators) Candidates were asked to quantify the costs and benefits of the owners’ decision to eliminate the packing coordinators and to provide their comments on the decision. Candidates were given most of the information necessary for their analysis in Appendix III, where they could find the warehouse metrics, and in Appendix IV, where they could find information on the packing coordinators. To demonstrate competence, candidates were expected to quantify the impact on the company of the elimination of the packing coordinators. Candidates could perform that analysis from a few angles, with the best one being a calculation of the loss of efficiency (number of skids handled per hour before and after the decision was made). Candidates were also expected to compare the additional costs the decision created to the cost savings from not having to pay the packing coordinators’ salaries. A lot of integration was required to address this AO, since candidates had to draw on many case facts that were interrelated. This increased the level of difficulty of this AO. Candidates struggled significantly with this AO. Most candidates were able to identify that the packing coordinators acted as supervisors in the warehouse and to recognize that their elimination resulted in either a decrease in efficiency or an increase in damaged goods. However, candidates struggled when trying to quantify the cost of those inefficiencies. Most candidates did not seem to know where to start their quantitative analysis, and instead based their discussion on the fact that since the packing coordinators had left, the wages had increased, failing to realize that an increase in payroll costs on its own, without taking the change in volume of skids handled into account, was insufficient to conclude on whether the packing coordinators were useful in the warehouse. Strong candidates quantified the decline in employee efficiency by using different indicators, such as the number of skids handled per hour or the cost per skid. Strong candidates were also able to provide a supported conclusion as to whether it was a good decision to eliminate the packing coordinators. Some strong candidates went further and quantified the loss of efficiency in terms of additional warehouse wages and compared it to the savings generated from the packing coordinators’ salaries.
Appendix F: Board of Examiners’ Comments on Day 2 and Day 3 Simulations Page 297
Weak candidates based their discussion solely on the increase in actual wages between the first half of 2018 and the last half of 2018, without any reference to the volume of skids handled or the salary savings from the wages that would have normally been paid to the packing coordinators. This type of calculation failed to demonstrate an understanding of the costs and benefits of the owners’ decision. AO#3 (Damaged Goods) Candidates were told that Jaqueline suspected the damage rate was increasing and were asked to perform a quantitative analysis to confirm whether she was right, and then to discuss the probable causes. The necessary information to perform this analysis was mostly found in Appendices III and V. Candidates were expected to integrate the information provided in these two appendices to quantitatively analyze the information on damaged goods and discuss the probable causes for the increase. Candidates performed adequately on this AO. Most candidates recognized both parts of the client’s request (quantitative analysis and discussion of the causes), but some struggled to realize that they could provide more than a simple variance analysis to help Jaqueline understand the situation. Some candidates simply calculated the increase in the number of damaged skids or the increase in total dollar value of the damaged skids, not realizing that this information provided very little value to Jaqueline, since she was the one who provided the information on the damaged skids and would, therefore, know that the number of damaged skids was increasing. Strong candidates either calculated the increase in the number of skids being damaged over the number of skids being handled, or the increase in the average value per skid damaged, which was also useful information to provide to Jaqueline. Strong candidates also identified and discussed the potential causes, focusing mostly on the damaged goods policy, which could be incentivizing the employees to purposely damage skids. Strong candidates also made a clear link between their calculation and the causes they identified. Weak candidates only performed a variance analysis on the increase in the number of damaged skids or the increase in the total dollar value of damaged goods. This was an incomplete analysis since it did not take the volume of skids handled into consideration. Although most of these candidates were still able to discuss the potential causes of the increase, their analysis was superficial and did not sufficiently analyze the causes of the increase. AO#4 (Taxable Benefits) In Appendix V, candidates were asked to explain how CRA might argue that the damaged goods given to employees constituted a taxable benefit. In addition, the case mentioned that Jaqueline wondered if the CRA might also raise concerns about several other items provided to employees, such as free pizza, gift certificates, and fleece jackets. To demonstrate competence on this AO, candidates were expected to discuss some of the potential taxable benefits mentioned by Jaqueline.
Appendix F: Board of Examiners’ Comments on Day 2 and Day 3 Simulations Page 298
Candidates performed as expected on this AO. Most candidates addressed the taxation of the damaged goods given to employees; however, many concluded that it was a taxable benefit without supporting their conclusion or without providing further information, such as what value the goods would be taxed at. In addition, some candidates were confused between the taxable benefits for the employees and the tax deduction for the employer. Strong candidates were able to address most of the items mentioned by Jaqueline and included technically correct explanations for each of them. The most common items addressed were the gift certificates, the uniforms and safety equipment, and the damaged goods. Weak candidates discussed fewer taxable benefits or did not provide explanations for their conclusions, simply stating what would or would not be taxable. Many weak candidates addressed the tax issues from the company’s point of view, instead of addressing the tax consequences from the employees’ perspective. This prevented them from providing a valuable response to Jaqueline. AO#5 (Policies) Candidates were asked to suggest changes or new policies that could improve PPI’s operations and profitability and explain how the changes would help. PPI’s operations were explained in Appendix I, and Appendix II provided more information on the policies. To demonstrate their competence, candidates needed to suggest some changes or new policies that could improve PPI operations. Candidates did well on this AO. Most candidates were able to identify issues with the existing practices, provide recommendations that would help address each issue, and explain how the changes would be beneficial to PPI’s operations. This AO was highly integrated with the other AOs since most of the issues in AO#1, AO#2, and AO#3 were being caused by policy flaws. Candidates demonstrated a good integration of the different issues presented in the case, and most were able to propose policies that would solve those issues. The most common policies addressed by candidates were the ones related to the damaged goods and unpaid leave. Strong candidates were able to discuss a greater number of policy changes in detail. Their discussions were complete and included explanations of the benefit to be derived from the suggested change in policy. The damaged goods and unpaid leave policies were the main issues in the case, since they were the source of the increase in warehouse payroll costs (analyzed in AO#1) and the increase in damaged goods (analyzed in AO#3). Strong candidates also integrated their discussion of the policies with their previous discussions of those AOs.
Appendix F: Board of Examiners’ Comments on Day 2 and Day 3 Simulations Page 299
Weak candidates recommended fewer policy changes, and some did not even follow their discussion of the current policy with a recommendation. In addition, the policy changes recommended were often not clearly explained. For example, some candidates mentioned that having unlimited unpaid leave was not good for PPI and recommended limiting the amount of unpaid leave each employee could take. However, these candidates did not explain why having unlimited unpaid leave available to employees was a problem. Other weak candidates confused the policy changes and the control weaknesses (AO#6), addressing them together and sometimes trying to fix a policy issue with the implementation of a control. This approach was not always appropriate since some of the issues with the current policies could not be solved with new controls. AO#6 (Payroll Control Weaknesses) Candidates were asked to discuss control weaknesses within the payroll system and provide recommendations to improve them. Detailed information on payroll control weaknesses was provided in Appendix II. To demonstrate their competence, candidates had to discuss some of the payroll control weaknesses and provide recommendations to improve them. Candidates struggled with this AO. Most candidates either identified too few of the weaknesses in the case or provided explanations of the implications of the weaknesses that lacked depth. Strong candidates were able to address more of the control weaknesses. They also provided realistic recommendations that would eliminate the weakness identified. Most of these candidates provided a good structure to their response, describing the weakness they had identified and the implication it had for the operations, and providing a recommendation that was linked to the weakness identified. Weak candidates addressed only a few of the control weaknesses. In addition, many weak candidates provided incomplete or disconnected discussions, where either the implication was missing from their discussion or the recommendation did not address the weakness identified. Some weak candidates also explained the implication in a way that was too general for the client to understand what the issue was. For example, some candidates stated that the weakness could cause an increase in payroll, without explaining how (i.e., could cause employees to make errors or commit fraud). As mentioned above, some weak candidates confused the control weaknesses with the lack of policies and provided confused discussions as a result. AO#7 (Alignment with Founder's Strategy and Values) Candidates were asked by Jaqueline whether they thought the changes made in the past year aligned with PPI’s founder’s strategy and values. The founder’s strategy and values were outlined throughout Appendix II. To demonstrate competence, candidates had to identify a recent change made by the new owners, comment on whether it aligned with Peter’s strategy and values, and support their conclusion with case facts.
Appendix F: Board of Examiners’ Comments on Day 2 and Day 3 Simulations Page 300
Candidates performed well on this AO. It required them to first identify Peter’s strategy and values, and then analyze the changes made in the past year with these in mind. Most candidates identified that Peter believed the employees were the core of the business and provided an example that showed how the changes made by the new owners were not aligned with this value. Among the most discussed changes was the elimination of the Friday perks. Strong candidates clearly identified the misalignment between Peter’s strategy and values and the recent changes. They also supported this statement with a greater number of examples to highlight the misalignment. Their discussion used numerous case facts, and their explanations were communicated clearly. Strong candidates also carried their discussion further, making links between the misalignments and the issues they had previously discussed, such as the link between the increase in damaged goods and the fact that the new owners were no longer seeing the employees as the core of the business. Weak candidates often concluded that the new changes were not in line with Peter’s strategy and values, but they did not support this with any analysis or case facts. Weak candidates typically stated that Peter valued employees and concluded that the new owners did not value the employees, without supporting either of these statements. This prevented them from demonstrating their understanding of the issue.
Appendix F: Board of Examiners’ Comments on Day 2 and Day 3 Simulations Page 301
Paper/Simulation: Day 3, Case 3 (KST) Estimated time to complete: 70 minutes Simulation difficulty: Average 1 Competency Map coverage: Management Accounting (1);
Assurance (1) Financial Reporting (1); Taxation (1); and Strategy and Governance (1)
Evaluators’ comments by Assessment Opportunity (AO) AO#1 (Analysis of Andy’s Proposal – ShowTix) Candidates were asked to provide a quantitative and qualitative analysis of a proposal from Andy (a board member) to increase ticket sales through an online ordering platform, called ShowTix. Details relating to the current operations of KST were provided in Appendix I, including information relating to performance fees paid and refreshments sold during performances. Appendix II provided details of the proposal, including total sales volume expected and incremental sales from new patrons, an upfront fee, and commission expense. To demonstrate competence, candidates were required to prepare a three-year analysis incorporating expected revenue and a number of costs relating to the proposal, as well as discuss the qualitative considerations. Candidates struggled with this AO. Most candidates attempted a quantitative analysis and included some of the relevant costs in their analysis; however, they did not base their calculation on incremental sales, but rather used total sales (including the tickets sold to current customers). As a result, their assessment of the opportunity was distorted. Candidates performed better on the qualitative analysis. Most candidates were able to discuss some of the qualitative considerations. Strong candidates addressed both quantitative and qualitative factors. They used incremental sales for their quantitative analysis, and they also correctly calculated most of the costs, including the commission costs, which had to be calculated on total sales rather than incremental sales. Strong candidates also focused on the more relevant qualitative considerations, such as the potential conflict of interest and the privacy concerns.
Appendix F: Board of Examiners’ Comments on Day 2 and Day 3 Simulations Page 302
Weak candidates provided an incomplete quantitative analysis. They provided only a few adjustments, which often contained errors. Common errors included using total rather than incremental sales, omitting the one-time setup fee, or applying the setup fee to every year. In terms of the qualitative analysis, many of these candidates’ discussions lacked depth since they repeated case facts without explaining further why these aspects were important. Some weak candidates addressed only one of the components of the required, either providing a quantitative analysis without a qualitative discussion or providing only a qualitative discussion, which resulted in an unbalanced analysis. AO#2 (Differences between an Audit and a Review Engagement) Candidates were asked to explain the difference between an audit and a review engagement, and to provide examples of procedures that would be performed on the theatre’s operating expenses in both cases. To demonstrate competence, candidates had to discuss some of the differences between the two types of engagements and provide examples of both audit and review procedures that could be done on operating expenses. Candidates performed well on this AO. Most candidates were able to demonstrate the differences between a review and an audit, usually focusing on the difference in the level of assurance and the difference in the cost. However, some candidates struggled to provide procedures that demonstrated their understanding of the difference between a review and an audit. The procedures were sometimes incorrect, too general, or not focused on the operating expenses as specifically requested. Many candidates struggled more with describing the review procedures than the audit procedures. Strong candidates were able to clearly demonstrate that they understood the differences between an audit and a review engagement by discussing the differences in depth and by providing audit and review procedures for operating expenses. They demonstrated that they had a clear understanding of the different levels of assurance for both engagements, and their procedures were linked to the type of work performed in both engagements. For example, the audit procedures focused on vouching to external evidence, and the review procedures focused on inquiry and analytical procedures. Many weak candidates were incorrect in their explanation of the differences between a review and an audit engagement; for example, stating that a review does not provide assurance, or that it provides positive assurance. Other weak candidates did not address the level of assurance at all. Weak candidates also provided incomplete procedures by, for example, not explaining what source documents would be used or providing the same procedure for both an audit and a review. They specifically struggled with the review procedures. They also provided procedures that were not focused on the operating expenses as specifically requested.
Appendix F: Board of Examiners’ Comments on Day 2 and Day 3 Simulations Page 303
AO#3 (Accounting Treatment for Lease) Candidates were asked how to account for the new soundboard lease under ASPE on KST’s 2018 financial statements. Appendix III provided the candidates with all the information that was needed to assess whether the lease was an operating or capital lease. Candidates were expected to assess whether any of the benefits and risks of ownership had transferred by considering ownership at the end of the term, the duration of the lease, and the recovery of the initial investment. To demonstrate competence, candidates were expected to analyze the criteria presented in the Handbook using case facts to support their discussion. Candidates were also required to provide a conclusion on whether the lease was an operating or a capital lease, and the conclusion had to be consistent with their analysis. Candidates struggled with this AO. Most candidates identified that they needed to analyze whether this was an operating or capital lease; however, they were not able to correctly apply the Handbook criteria to assess whether the risks of ownership had transferred. The most common mistake was related to the treatment of the purchase option. The case stated that KST had an option to purchase the soundboard at the end of the lease for $50,000 and that the soundboard would be worth $50,000 at the end of the lease. Many candidates incorrectly determined that a bargain purchase option existed, which resulted in these candidates concluding incorrectly that this was a capital lease. Candidates also struggled with their present value calculation and made mistakes such as including the $50,000 purchase option price in the calculation or calculating a future value instead of a present value. Strong candidates were able to identify the relevant Handbook guidance and correctly apply the case facts to determine whether the risk of ownership had transferred. These candidates correctly evaluated the relevant criteria and provided a consistent conclusion as to whether this was an operating or capital lease. Strong candidates were also able to recognize that there was no bargain purchase option, and their present value calculation was consistent with this fact. Weak candidates attempted to apply the Handbook guidance, but their discussion lacked depth or was technically weak. Many weak candidates jumped to a conclusion without supporting it with case facts or only discussed one of the considerations correctly, typically the duration of the lease. Some weak candidates confused the guidelines; for example, stating that the duration benchmark was 90% and the present value of the minimum lease payments benchmark was 75%. Weak candidates also struggled to recognize that there was no bargain purchase option, instead concluding that there was, despite the case fact that the purchase option price equaled the value of the equipment in 10 years.
Appendix F: Board of Examiners’ Comments on Day 2 and Day 3 Simulations Page 304
AO#4 (Loss Carryforwards and Filing Deadlines) Candidates were asked if previous losses and donations could be used to reduce taxes payable in the current year. They were also asked when KST’s corporate income tax return and payment were due for the year ending December 31, 2018. Finally, Ellen asked about the filing and payment requirements and deadlines for GST/HST because she was not sure if she was doing it properly. Candidates were provided with information relating to the amount of losses for tax purposes over the past four years and the expected profit for the current year, as well as details on capital losses incurred in the past and charitable donations made over the past year. Candidates were told the company had not previously filed a tax return. Case facts also indicated that KST was a Canadian-controlled private corporation (CCPC). To demonstrate competence, candidates were expected to address both the treatment of the carryforwards and the filing deadlines, including information on the application or the timelines of the carryforwards and the filing or payment deadlines for the returns. Candidates performed well on this AO. Most candidates addressed the tax carryforwards and the filing deadlines and discussed a reasonable number of the tax concepts involved. Candidates showed a good understanding of the application of the carryforwards, demonstrating they understood that the non-capital losses could be applied against KST’s current income and the capital losses could only be applied against capital gains. They also showed a good understanding of the corporate tax deadlines for a CCPC. Strong candidates addressed both the carryforwards and the deadlines and discussed many of the tax concepts. They demonstrated that they understood the application of the different types of carryforwards, addressing the difference between capital and non-capital losses and correctly identifying the timeline for applying each. They also showed that they knew the deadlines for the income tax filing and payment and showed some understanding of the GST/HST filing/payment deadlines. Weak candidates lacked technical knowledge in some areas; for instance, not recognizing the different timelines for each type of loss or failing to identify that GST/HST has revenue thresholds for determining filing periods. Weak candidates also provided a lot of incorrect information. For example, they provided incorrect timelines for losses and filing deadlines, often confusing corporate filing deadlines with the personal income tax filing due in April or discussing donations from a personal tax perspective.
Appendix F: Board of Examiners’ Comments on Day 2 and Day 3 Simulations Page 305
AO#5 (KST’s Board of Directors) Candidates were asked for suggestions on ways to improve the Board of Directors and the role it played. Appendix IV provided information on the current board, including the number of board members and their relation to KST, which highlighted the weaknesses in the board. Candidates were also asked, within Appendix IV, whether the board size should be increased, and they were provided with details on possible new members, including a childhood friend and an uncle. To demonstrate competence on this AO, candidates were expected to discuss some of the important considerations related to the board, such as the conflict of interest between board members and KST, the skills of the current board members, and the board’s role and its size, and to provide recommendations on how to improve the board. Candidates struggled with this AO. Although most were able to identify the issues with the current board or provide recommendations to improve it, many candidates’ discussions were incomplete. Most discussions consisted of a repetition of case facts or a list of recommendations without an initial identification of the issue or an explanation of the reason an improvement was needed. Many candidates also combined multiple issues into one discussion and, therefore, did not provide a complete explanation of each weakness. Most candidates identified the potential conflicts of interest and the lack of diversified skills as issues, but they either did not adequately explain why these were a concern or did not provide a reasonable recommendation. Strong candidates were able to provide complete discussions of a few of the weaknesses. They identified the issues with the current board, explained the implication to KST, and provided a recommendation to improve the board going forward. They also focused on the significant issues, such as the potential conflicts of interest and the lack of diversified skills of the current board. Strong candidates were able to provide Ellen with valuable suggestions to improve the current board and the role it played. Weak candidates did not provide complete discussions. Many of them provided a list of recommendations without first identifying the underlying problem or explaining why the application of these recommendations would be beneficial to KST. Some weak candidates provided recommendations that were not specific to the situation by listing improvements that were generic in nature and could apply to any organization (for example, suggesting the creation of multiple sub-committees or proposing an increase in the number of board members), without supporting their recommendation. Some weak candidates provided impractical suggestions, in particular recommending the numbers of board members and sub-committees be increased to sizes that were too large and would not be realistic for KST.
Appendix F: Board of Examiners’ Comments on Day 2 and Day 3 Simulations Page 306
APPENDIX G
CPA COMMON FINAL EXAMINATION REFERENCE SCHEDULE
Appendix G: CPA Common Final Examination Reference Schedule Page 307
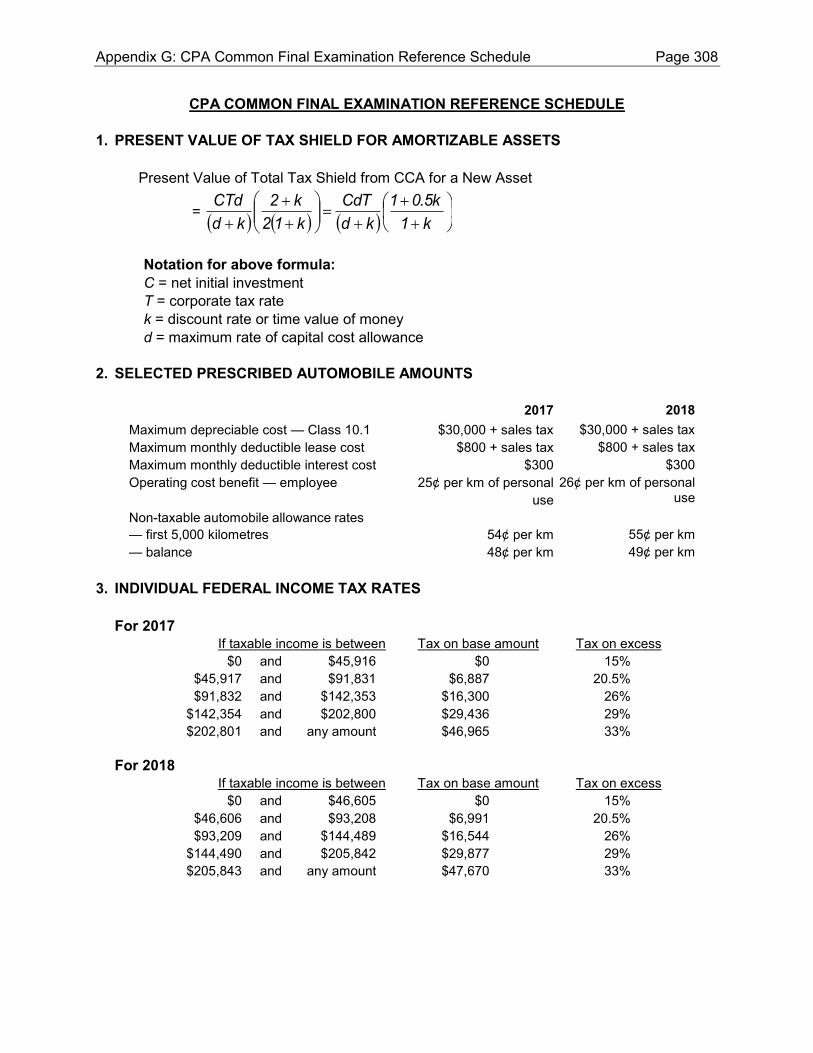
CPA COMMON FINAL EXAMINATION REFERENCE SCHEDULE
1. PRESENT VALUE OF TAX SHIELD FOR AMORTIZABLE ASSETS
Present Value of Total Tax Shield from CCA for a New Asset
=
k10.5k1
kdCdT
k12k2
kdCTd
Notation for above formula: C = net initial investment T = corporate tax rate k = discount rate or time value of money d = maximum rate of capital cost allowance
2. SELECTED PRESCRIBED AUTOMOBILE AMOUNTS
2017 2018 Maximum depreciable cost — Class 10.1 $30,000 + sales tax $30,000 + sales tax Maximum monthly deductible lease cost $800 + sales tax $800 + sales tax Maximum monthly deductible interest cost $300 $300 Operating cost benefit — employee 25¢ per km of personal
use 26¢ per km of personal
use Non-taxable automobile allowance rates — first 5,000 kilometres 54¢ per km 55¢ per km — balance 48¢ per km 49¢ per km
3. INDIVIDUAL FEDERAL INCOME TAX RATES
For 2017 If taxable income is between Tax on base amount Tax on excess
$0 and $45,916 $0 15% $45,917 and $91,831 $6,887 20.5% $91,832 and $142,353 $16,300 26%
$142,354 and $202,800 $29,436 29% $202,801 and any amount $46,965 33%
For 2018 If taxable income is between Tax on base amount Tax on excess
$0 and $46,605 $0 15% $46,606 and $93,208 $6,991 20.5% $93,209 and $144,489 $16,544 26%
$144,490 and $205,842 $29,877 29% $205,843 and any amount $47,670 33%
Appendix G: CPA Common Final Examination Reference Schedule Page 308
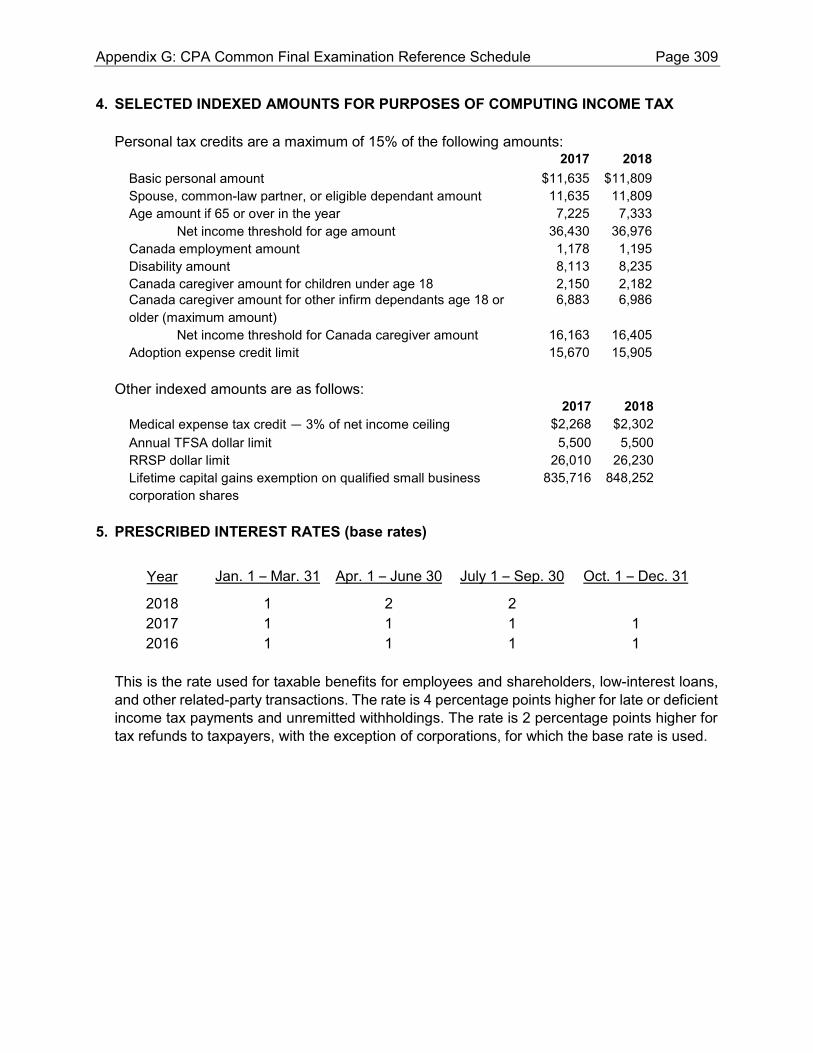
4. SELECTED INDEXED AMOUNTS FOR PURPOSES OF COMPUTING INCOME TAX
Personal tax credits are a maximum of 15% of the following amounts: 2017 2018
Basic personal amount $11,635 $11,809Spouse, common-law partner, or eligible dependant amount 11,635 11,809Age amount if 65 or over in the year 7,225 7,333
Net income threshold for age amount 36,430 36,976Canada employment amount 1,178 1,195Disability amount 8,113 8,235Canada caregiver amount for children under age 18 2,150 2,182Canada caregiver amount for other infirm dependants age 18 or older (maximum amount)
6,883 6,986
Net income threshold for Canada caregiver amount 16,163 16,405Adoption expense credit limit 15,670 15,905
Other indexed amounts are as follows: 2017 2018
Medical expense tax credit — 3% of net income ceiling $2,268 $2,302Annual TFSA dollar limit 5,500 5,500RRSP dollar limit 26,010 26,230Lifetime capital gains exemption on qualified small business corporation shares
835,716 848,252
5. PRESCRIBED INTEREST RATES (base rates)
Year Jan. 1 – Mar. 31 Apr. 1 – June 30 July 1 – Sep. 30 Oct. 1 – Dec. 31
2018 1 2 2 2017 1 1 1 1 2016 1 1 1 1
This is the rate used for taxable benefits for employees and shareholders, low-interest loans, and other related-party transactions. The rate is 4 percentage points higher for late or deficient income tax payments and unremitted withholdings. The rate is 2 percentage points higher for tax refunds to taxpayers, with the exception of corporations, for which the base rate is used.
Appendix G: CPA Common Final Examination Reference Schedule Page 309
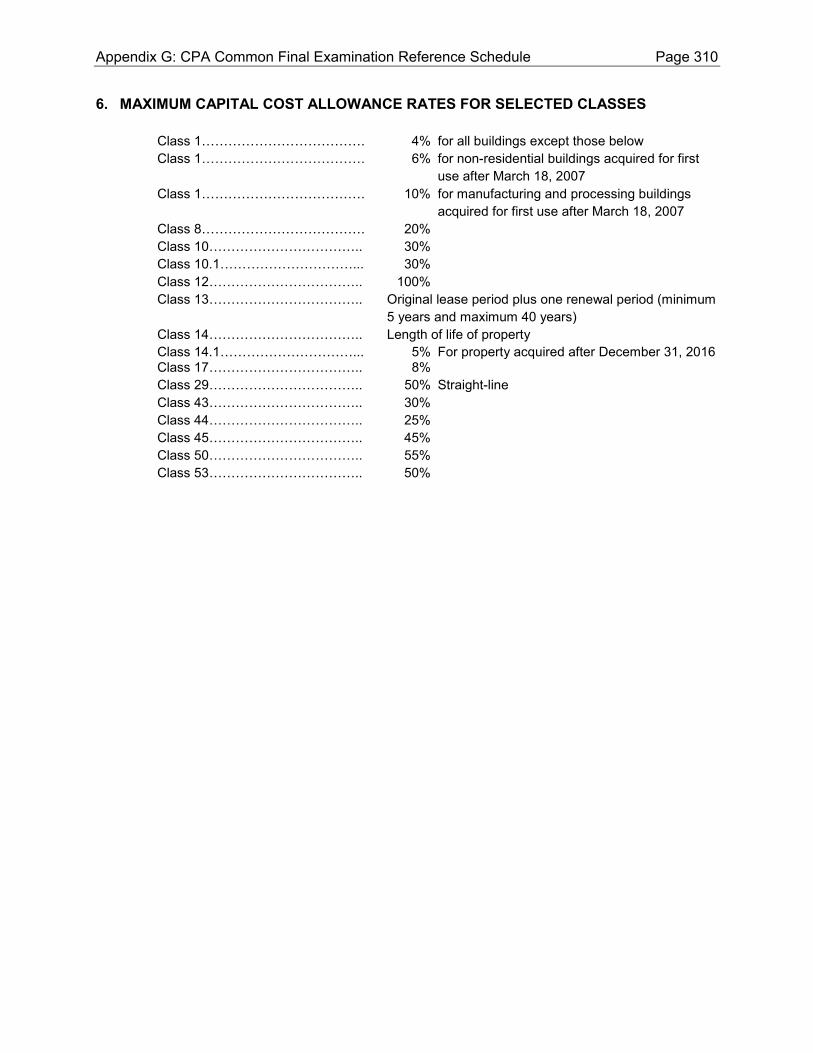
6. MAXIMUM CAPITAL COST ALLOWANCE RATES FOR SELECTED CLASSES
Class 1………………………………. 4% for all buildings except those below Class 1………………………………. 6% for non-residential buildings acquired for first
use after March 18, 2007 Class 1………………………………. 10% for manufacturing and processing buildings
acquired for first use after March 18, 2007 Class 8………………………………. 20% Class 10…………………………….. 30% Class 10.1…………………………... 30% Class 12…………………………….. 100% Class 13…………………………….. Original lease period plus one renewal period (minimum
5 years and maximum 40 years) Class 14…………………………….. Length of life of property Class 14.1…………………………... 5% For property acquired after December 31, 2016 Class 17…………………………….. 8% Class 29…………………………….. 50% Straight-line Class 43…………………………….. 30% Class 44…………………………….. 25% Class 45…………………………….. 45% Class 50…………………………….. 55% Class 53…………………………….. 50%
Appendix G: CPA Common Final Examination Reference Schedule Page 310

The CPA certification program prepares future CPAs to meet the challenges that await them.
For more information on the qualification process, the common final examination (CFE), and
the specific education requirements for your jurisdiction, contact your provincial/regional
CPA body.
CPA PROVINCIAL/REGIONAL BODIES AND CPA REGIONAL SCHOOLS OF BUSINESS
CPA Alberta
1900 TD Tower, 10088 – 102 Avenue
Edmonton, Alberta, T5J 2Z1
Toll free: +1 780-424-7391
Email: [email protected]
Website: www.cpaalberta.ca
CPA Bermuda
Penboss Building, 50 Parliament Street
Hamilton HM 12 Bermuda
Telephone: +1 441-292-7479
Email: [email protected]
Website: www.cpabermuda.bm
CPA British Columbia
800 – 555 West Hastings Street
Vancouver, British Columbia V6B 4N6
Telephone: +1 604-872-7222
Email: [email protected]
Website: www.bccpa.ca
CPA Manitoba
1675 One Lombard Place
Winnipeg, Manitoba R3B 0X3
Telephone: +1 204-943-7148
Toll Free: 1 800-841-7148 (within MB)
Email: [email protected]
Website: www.cpamb.ca
CPA New Brunswick
602 – 860 Main Street
Moncton, New Brunswick E1C 1G2
Telephone: +1 506-830-3300
Fax: +1 506-830-3310
Email: [email protected]
Web site: www.cpanewbrunswick.ca
CPA Newfoundland and Labrador
500 – 95 Bonaventure Avenue
St. John’s, Newfoundland A1B 2X5
Telephone: +1 709-753-3090
Email: [email protected]
Website: www.cpanl.ca
CPA Northwest Territories and
Nunavut
Telephone: +1 867-873-5020
Email: [email protected]
CPA Nova Scotia
1871 Hollis Street, Suite 300
Halifax, Nova Scotia, B3J 0C3
Telephone: + 1 902-425-7273
Email: [email protected]
Website: www.cpans.ca
CPA Ontario
69 Bloor Street East
Toronto, Ontario M4W 1B3
Telephone +1 416- 962-1841
Email: [email protected]
Website: www.cpaontario.ca
CPA Prince Edward Island
600 – 97 Queen Street
P.O. Box 301
Charlottetown, Prince Edward Island C1A 7K7
Telephone: +1 902-894-4290
Email: [email protected]
Website: www.cpapei.ca
Ordre des comptables professionnels
agréés du Québec
5, Place Ville Marie, bureau 800
Montréal, Québec H3B 2G2
Telephone: +1 514-982-4606[6]
Toll free: 1 800-363-4688
Email: [email protected]
Website: www.cpaquebec.ca
CPA Saskatchewan
101 – 4581 Parliament Avenue
Regina, Saskatchewan S4W 0G3
Telephone: +1 306-359-0272
Toll free: 1 800-667-3535
Email: [email protected]
Website: www.cpask.ca
CPA Yukon Territory
c/o CPA British Columbia
800 – 555 West Hastings Street
Vancouver, British Columbia V6B 4N6
Telephone: +1 604-872-7222
Toll free: +1 800-663-2677
Email: [email protected]
Website: www.bccpa.ca
CPA Canada International
277 Wellington Street, West
Toronto, Ontario M5V 3H2
Email: [email protected]
CPA Atlantic School of Business
Suite 1306, 2000 Barrington Street
Halifax, Nova Scotia B3J 3K1
Telephone: +1 902-429-4462
Email: [email protected]
Website: www.cpaatlantic.ca/en
CPA Western School of Business
301, 1253 - 91 Street SW
Edmonton, Alberta T6X 1E9
Toll Free: 1 866-420-2350
Email: [email protected]
Website: www.cpawsb.ca
CPA Regional and Provincial Contact Information Page 311