gas hydrates modelling with cpa - kbc.global
35
GAS HYDRATES MODELLING WITH CPA HYDRATE THEORIES AND MODEL VALIDATION PRESENTED BY: XIAOHONG ZHANG NUNO PEDROSA RICHARD SZCZEPANSKI Executive Summary Gas hydrates, also named as clathrates, are ice-like crystalline solid composed of water and light gases or hydrocarbons. It usually forms in high pressure environment where water molecules form a cage to stabilize the guest light gas or hydrocarbon molecule. Naturally occurring gas hydrates may be an important future hydrocarbon energy resource with the development of appropriate means of capture, transportation and storage. However, for conventional oil and gas production systems the presence of hydrates is considered to be an operational and safety problem. Hydrate plugs can form in gas and oil pipelines (and facilities) at typical operating temperatures and pressures under normal operating conditions, under pipeline shutdown where temperatures fall significantly as a result of closing a well or flowing gas through a choke valve. As a result, flow assurance studies including hydrate formation analysis and management have become an essential part of engineering work for the design, commissioning and operation of offshore and onshore well production facilities. This white paper provides detailed description on the thermodynamic model of gas hydrates in Multiflash TM , and its capabilities and performance in providing accurate predictions on hydrate formation and inhibition. Together with the accurate thermodynamic fluid model (Cubic Plus Association, CPA) for modelling the gas, hydrocarbon liquid and aqueous phases, the gas hydrate models in Multiflash TM : Can accurately predict at what condition the gas hydrate forms, and how much it form. Can reliably predict what type of gas hydrates forms: Hydrate I, II or H as well as the complex phase transitions among the fluid and hydrate phases. Can predict not only the partitioning of the thermodynamic hydrate inhibitors among the fluid phases but also the accurate prediction on hydrate inhibition. The hydrate inhibitors that can be modelled by Multiflash TM include: Methanol, ethanol, MEG, DEG and TEG. Can provide accurate calculation on the required inhibitor injection rates/dosages to suppress the hydrate formation for drilling and/or production. Has been extened to include a well-developed electrolyte model to model the effect of salts on hydrate inhibition and the salts precipitation. Is a fully integrated model that is readily imbedded in pipeline software, topside and a plant- wide processing facilities simulation environment. Such a reliable and versatile flow assurance engineering tool will enable reservoir, petroleum and process engineers to achieve the more detailed field planning activities such as: Initial assessment of potential operational problem arising from hydrate formation. Life of field study on inhibitor requirement and formulation of hydrate prevention strategies. If you are interested in further details on hydrate prediction and management strategies using Multiflash TM , please feel free contact KBC at [email protected].
-
Upload
khangminh22 -
Category
Documents
-
view
2 -
download
0
Transcript of gas hydrates modelling with cpa - kbc.global

GAS HYDRATES MODELLING WITH CPA HYDRATE THEORIES AND MODEL VALIDATION
PRESENTED BY:
XIAOHONG ZHANG NUNO PEDROSA
RICHARD SZCZEPANSKI
Executive Summary
Gas hydrates, also named as clathrates, are ice-like crystalline solid composed of water and light gases or
hydrocarbons. It usually forms in high pressure environment where water molecules form a cage to stabilize
the guest light gas or hydrocarbon molecule.
Naturally occurring gas hydrates may be an important future hydrocarbon energy resource with the
development of appropriate means of capture, transportation and storage. However, for conventional oil and
gas production systems the presence of hydrates is considered to be an operational and safety problem.
Hydrate plugs can form in gas and oil pipelines (and facilities) at typical operating temperatures and
pressures under normal operating conditions, under pipeline shutdown where temperatures fall significantly
as a result of closing a well or flowing gas through a choke valve. As a result, flow assurance studies including
hydrate formation analysis and management have become an essential part of engineering work for the
design, commissioning and operation of offshore and onshore well production facilities.
This white paper provides detailed description on the thermodynamic model of gas hydrates in MultiflashTM,
and its capabilities and performance in providing accurate predictions on hydrate formation and inhibition.
Together with the accurate thermodynamic fluid model (Cubic Plus Association, CPA) for modelling the gas,
hydrocarbon liquid and aqueous phases, the gas hydrate models in MultiflashTM:
Can accurately predict at what condition the gas hydrate forms, and how much it form.
Can reliably predict what type of gas hydrates forms: Hydrate I, II or H as well as the complex
phase transitions among the fluid and hydrate phases.
Can predict not only the partitioning of the thermodynamic hydrate inhibitors among the fluid
phases but also the accurate prediction on hydrate inhibition. The hydrate inhibitors that can be
modelled by MultiflashTM include: Methanol, ethanol, MEG, DEG and TEG.
Can provide accurate calculation on the required inhibitor injection rates/dosages to suppress
the hydrate formation for drilling and/or production.
Has been extened to include a well-developed electrolyte model to model the effect of salts on
hydrate inhibition and the salts precipitation.
Is a fully integrated model that is readily imbedded in pipeline software, topside and a plant-
wide processing facilities simulation environment.
Such a reliable and versatile flow assurance engineering tool will enable reservoir, petroleum and process engineers to achieve the more detailed field planning activities such as:
Initial assessment of potential operational problem arising from hydrate formation.
Life of field study on inhibitor requirement and formulation of hydrate prevention strategies.
If you are interested in further details on hydrate prediction and management strategies using MultiflashTM,
please feel free contact KBC at [email protected].

July 2016
1 of 35
KBC ADVANCED TECHNOLOGIES LTD
www.kbcat.com
CONTENTS
Executive Summary ................................................................................................. 0
1. Introduction .................................................................................................... 3
2. Hydrate Basics ............................................................................................... 4
3. Hydrate Structures ........................................................................................ 4
4. Hydrate Forming Components ..................................................................... 7
5. Hydrate I and II Phase Transition ................................................................. 8
6. Water Content ................................................................................................ 9
7. Gas Hydrate Model ...................................................................................... 10
8. Gas Hydrate Inhibition ................................................................................ 13
Removal of Hydrate Formers ................................................................................... 14
Dehydration ............................................................................................................. 14
Molecular Sieves ..................................................................................................... 14
Refrigeration ............................................................................................................ 14
Heat 15
Pressure .................................................................................................................. 15
Chemical Inhibition .................................................................................................. 15
Thermodynamic Inhibitors ....................................................................................... 15
Kinetic Inhibitors and Anti-Agglomerants ................................................................. 18
9. Hydrate Calculations with Thermodynamic Inhibitors ............................. 18
Alcohols and Glycols ............................................................................................... 18
Salts – Electrolyte Model ......................................................................................... 20
10. Field Applications ........................................................................................ 21
Hydrate Inhibition Strategy ...................................................................................... 21
Thermodynamic models .......................................................................................... 22
Hydrate Nucleation model in MultifashTM ................................................................. 23
Kinetic hydrate modelling......................................................................................... 24
11. Validation of Gas Hydrates and CPA Model in MultiflashTM .................... 25
Complex Phase Behaviour of CO2-H2O and H2S-H2O ............................................. 25
Methanol Partitioning and LLE ................................................................................. 26
Structure Gas Hydrate I: Methane, CO2 and H2S .................................................... 26
Natural Gases - Structure Gas Hydrate II ................................................................ 28

July 2016
2 of 35
KBC ADVANCED TECHNOLOGIES LTD
www.kbcat.com
Natural Gas Liquids - Structure Gas Hydrate II ........................................................ 28
Crude Oil - Structure Gas Hydrate II ........................................................................ 29
Effect of Heavy Hydrate Formers - Structure Gas Hydrate II and H ......................... 30
12. MultiflashTM Hydrate Inhibition Model Validation...................................... 30
Effect of Methanol on Methane Hydrate ................................................................... 30
Effect of Methanol on Hydrate Formation for a Condensate .................................... 31
Effect of MEG on Hydrate Formation for a Condensate ........................................... 31
Effect of Salt on Hydrate Formation for Methane ..................................................... 32
Black Oil with Salts and Methanol ............................................................................ 33
13. Conclusion ................................................................................................... 33

July 2016
3 of 35
KBC ADVANCED TECHNOLOGIES LTD
www.kbcat.com
1. Introduction
Gas hydrates are compounds containing water. More specifically, in the oil and gas industry they are
crystalline solid compounds composed of water and light gases or hydrocarbons.
The driving force to understanding how, where and when hydrates form or how to prevent their formation is
the economic impact of hydrates to the oil and gas production and process industries. Loss of production
due to a pipeline blockage can result in several million dollars of lost revenue, adding to the cost of hydrate
plug removal. Also, there is a direct relationship between safety and cost, as remediation can lead to process
damage, and even loss of lives.
Therefore the suppression and preventation of gas hydrates is of major importance, especially with the
continuing trend towards deep-water exploration and production. The conventional engineering approach is
to add inhibitors such as methanol or glycol to alter the thermodynamic equilibrium so that hydrates cannot
form under production conditions. Although there has been much work recently on low-dosage kinetic
inhibitors, there are many situations where it remains essential to use thermodynamic inhibitors in driling,
production and tranportation.
However continuous injecting hydrate inhibitors in production line can be very expensive business. The
ability in understanding and anticipating when and where the hydrates likely form, and having engineer tools
that can provide reliable calculation of hydrate inhibition dosage, therefore, is essential. Thermodynamic
models have been proved to be reliable tools to accurately predict the hydrate phase behaviour and to
provide the industries the best knowledge on gas hydrates management.
The following sections are the summary of the basic fundamentals of the gas hydrates, the well-developed
thermodynamic fluid model based on CPA ( Cubic Plus Association), the gas hydrate formation and inhibition
model, and the accuracy and performance of the gas hydrates models in MultiflashTM.

July 2016
4 of 35
KBC ADVANCED TECHNOLOGIES LTD
www.kbcat.com
2. Hydrate Basics
Three principal conditions are required to form gas hydrates. They include:
1) The presence of a hydrate former – This is the gas or light hydrocarbon molecule that sits within the water cage and stabilises the hydrate structure. Typical hydrate formers are methane, ethane, propane, carbon dioxide, nitrogen and hydrogen sulphide. However, some larger hydrocarbons can also form hydrates in the presence of these light gases.
2) Water – Water is needed to form the hydrate cage; typically hydrates contain 85% water. The amount of water may affect the hydrate formation conditions. It is certainly ther-modynamically possible for hydrates to form even when no free water is present – whether the hydrates actually form in these conditions or, if they do, form in sufficient quantities to cause a problem is hotly debated.
3) A suitable combination of temperature and pressure – Hydrate formation is more likely at low temperatures and high pressures. The actual temperatures and pressures will depend on the gas, condensate or oil composition but hydrates can certainly form above 0°C, the freezing point of water. Typical seabed temperatures are 4°C, well within the hydrate formation conditions for many gases, especially at high pressures. On-shore conditions can often reach these temperatures in winter months in many gas-producing regions. At 4°C many natural gases will form hydrates at less than 10 bar, while at 100 bar many common gases will form hydrates at ambient temperatures.
While the conditions above are necessary for hydrate formation other factors may favour hydrate production.
1) Nucleation sites – This is a site which favours the formation of a new phase, in this case enhances the possibility of the first hydrate crystal forming from the fluid phase. In oil and gas production, such sites may vary from imperfections or disruptions in the smooth pipeline wall to the presence of other pipeline solids, such as sand or scale.
2) Free water present – Although not strictly necessary for hydrate formation, it is known that in many cases hydrates form at the gas-water interface. In gas-condensate-water systems, hydrates tend to form at the abundant gas-water interfaces, whereas in low gas-oil-ratio (GOR) gas-oil-water systems they tend to form at the oil-water interfaces.
3) Agitation – Mixing in process equipment encourages hydrate formation by creating more water/gas interfaces. Turbulence when the stream passes through a choke or valve has a similar effect with the added probability of a sudden drop in temperature.
3. Hydrate Structures
Hydrates, or clathrates as they may be known, occur when water forms a cage-like structure round a "guest"
molecule.

July 2016
5 of 35
KBC ADVANCED TECHNOLOGIES LTD
www.kbcat.com
There are many compounds that can form hydrates and several hydrate structures, however, for practical
purposes in the oil and gas industry only three forms of hydrate structure need to be considered, Structures
I, II and H.
Structure I is the simplest hydrate structure made up of two types of cages, a dodecahedron (often referred
to as the small cage) and a tetrakaidecahedron, 14-sided polyhedron, referred to as the large cage. The size
of the cage determines the size of the "guest" molecule that can fit inside. Some of the common Structure I
hydrate formers, methane, CO2 and H2S can fit into either the small or large cages. Ethane fits only into the
larger cage.
Small cage Large cage
A stable hydrate can form without a guest molecule occupying all the cages. The degree of saturation is a
function of temperature and pressure. Structure I (sI) hydrates are the primary structure for the hydrate
reserves found in the deep oceans.
Structure II hydrate also has a dodecahedron cage as Structure I but the second cage is a larger 16-sided
polyhedron.
Small cage Large cage
Pure components that typically form Structure II hydrates are nitrogen, propane and isobutane. Nitrogen
occupies both the large and small cages whereas propane and isobutane occupy only the large cages. The
largest pure component that forms a hydrate is isobutane.
Hydrates can also be formed from occupation by more than one type of component. In most cases a hydrate
former such as methane or nitrogen helps stabilise hydrate formation of a second, larger, component. An
example would be n-butane, which does not form a hydrate as a pure component. However, its size is such
that it can fit into the larger cages of Structure II and forms hydrates in the presence of another, lighter hydrate
former. Other heavier hydrocarbons, found in oil and gas condensate systems, have an effective size which
allows them to enter the large cavities of structure II gas hydrates. For instance, several cyclic hydrocarbons,
such as benzene or cyclopentane, will form hydrates with small "help" gases, such as methane or nitrogen
in the small cavities.

July 2016
6 of 35
KBC ADVANCED TECHNOLOGIES LTD
www.kbcat.com
Structure H, is the last hydrate structure which is relevant to the oil and gas industry. Unlike Structures I and
II, Structure H is never formed by a single pure component but requires two formers, a small molecule such
as methane and a larger Type H forming molecule. Typical of the latter are branched butanes and cyclics.
Structure H is made up from three types of cage: a regular dodecahedron, an irregular dodecahedron and
an irregular 20 sided polyhedron.
The larger molecules of a gas mixture normally determine the structure formed so the presence of propane
and isobutane means that the normal form found in gas production and processing is Structure II (sII).
Indications from laboratory experiments are that Structure H (sH) hydrates can form at higher temperatures
and lower pressures than sI and sII.
The figure below shows that the addition of 25% of sH former (neohexane) to methane produces a sH
hydrate which is more stable than the pure methane sI hydrate. However, if the 25% neohexane is replaced
with propane (a composition much more representative of a natural gas) then the sII hydrate is most stable.
It is therefore likely that in the majority of oil and gas systems, sII will be the most stable and sH is unlikely
to form unless all of the sII formers are consumed producing sII. One instance of in-situ Structure H has
been reported in the Gulf of Mexico and components that may form Structure H are present in naphtha and
gasoline.
There is some evidence that the most stable hydrate structure can change from Structure II to Structure I,
usually as the pressure increases. Changes in structure have been shown to be true for methane/ethane
binaries in the laboratory and anecdotally reported for some heavy oils. The gas hydrate models in
MultiflashTM is able to predict such phase transitions accurately, which will be shown in the later sections.
0
20
40
60
80
100
120
0 2 4 6 8 10 12 14 16
Temperature, °C
Pre
ss
ure
, b
ara
Structure I - Methane
Structure H - Methane (75%)+Neohexane (25%)
Structure II - Methane (75%)+Propane (25%)
Source: Edmonds et al. 1998

July 2016
7 of 35
KBC ADVANCED TECHNOLOGIES LTD
www.kbcat.com
There is no clear evidence that the hydrate structure formed has direct implications for engineering
applications. However, this could be a contributory factor to:
The choice of kinetic inhibitor.
Hydrate crystal growth.
The formation of hydrate as a crystalline solid or a slurry.
4. Hydrate Forming Components
Gas hydrate formation requires the gas or light hydrocarbon components to occupy the hydrate cages to
stablize the hydrate structures. As one may know, many of the components in condensates or oils that could
form hydrates are not explicitly identified in compositional analyses and therefore will not be included in any
modelling of hydrate formation.
However, the most common hydrate forming components that are relevant to oil and gas prudction and
processing can be modelled by MultiflashTM. The details are summarsied in the following table.
Natural Gas Condensates/oils Process
Nitrogen Benzene* Ethylene
Carbon dioxide Cyclopentane* Propylene
Hydrogen sulphide Cyclohexane* Other olefins
Methane Methylcyclopentane*
Ethane Cycloheptane*
Propane Methylcyclohexane*
Butane* Ethylcyclopentane*
Isobutane Cyclooctane*
Neopentane* 1,1 Dimethylcyclohexane*
cis 1,2 Dimethylcyclohexane*
2 Methyl butane*
2,2 Dimethyl butane*
2,3 Dimethyl butane*
2,2,3 Trimethyl butane*
3,3 Dimethyl pentane*
2,2 Dimethyl pentane*
2,3 Dimethyl-1-butene*
3,3 Dimethyl -1-butene*
3,3 Dimethyl-1-butyne*
cis cyclooctene*
bicyclo[2,2,2] oct-2-ene*
Adamantane*
* denotes help gas needed
For engineering purposes, most gases and condensates have sufficient propane and isobutane for Structure
II to be the most stable hydrate form and a typical phase diagram for a natural gas with free water predicted
by MultiflashTM is shown below.

July 2016
8 of 35
KBC ADVANCED TECHNOLOGIES LTD
www.kbcat.com
5. Hydrate I and II Phase Transition
Hydrate phase transition may occur when the temperature, pressure as well as the composition is satisfied.
For example, the transition between hydrate structure I and II may occur when the gas is very lean, with a
typically high methane content (99+%), or has high levels of H2S.
In the following case predicted by MultiflashTM, the boundary for Structure II shows a very sharp change in
direction as the pressure increases. Following the Structure I boundary from high to low pressure shows that
this too changes sharply over a similar pressure range. In this example, there is a region where both
Structure I and II are both present. The composite boundary for Hydrate I and Hydrate II defines the hydrate
dissociation line.
Gas condensates and oils are usually composed of the natural gas formers plus varying amounts of heavier
non-hydrate formers. The effect of this heavy end on the hydrate boundary will depend on:
The composition of the gas,
The nature of the heavy end,
Whether the system is above or below its bubble point.

July 2016
9 of 35
KBC ADVANCED TECHNOLOGIES LTD
www.kbcat.com
6. Water Content
As hydrates consist of approximately 85% water, water is a necessary element for hydrate formation. Water
is often associated with natural gases in the reservoir and produced natural gas is often saturated with water.
Occasionally formation water is produced along with the gas, and at later stages in the life of a reservoir
water may also be injected. More water may be added during gas processing as a solvent for other
components, e.g. alkanolamines used for gas sweetening. So water content as well as the water distribution
among the fluid phases is a very important factor in gas hydrates management and water removal process.
It has been observed that gas hydrate forms regardless of the presence of free water phase, this
phenomenon can be captured and predicted by the hydrate model in MultiflashTM. Of course the truth may
lie in a complex mixture of factors:
In absence of free water, hydrates may form as frost on pipeline walls, but cause no operational
problems.
The amount of hydrates formed in the absence of free water may be small and flow with the
hydrocarbon fluid.
Hydrates may appear to have been formed from a "dry" gas, due to a change of conditions for
a short period causing free water to form or there may have been a failure of a dehydration
system or water carry-over.
There have been reported cases that hydrate apparently forms during processing of a dry gas. In one case,
although the gas had been dehydrated, on passing through a pinhole screen prior to a heat exchanger a
solid formed blocked the screen. Thermodynamic calculations by MultiflashTM showed that even the reported
water concentration after dehydration was sufficient for hydrates to form at the process conditions. Other
examples of blockages occurring in gas processing that can be attributed to hydrate formation indicate that
it is worth considering the possibility of hydrate formation even in the absence of free water.
Hydrate measurements carried out in the laboratory are usually made in the presence of excess water.
Similarly, most calculations of hydrate formation conditions will assume an excess of water. If the amount
of water is not known, it is appropriate to calculate the saturation level of water at reservoir conditions or to
assume that free water will be present.
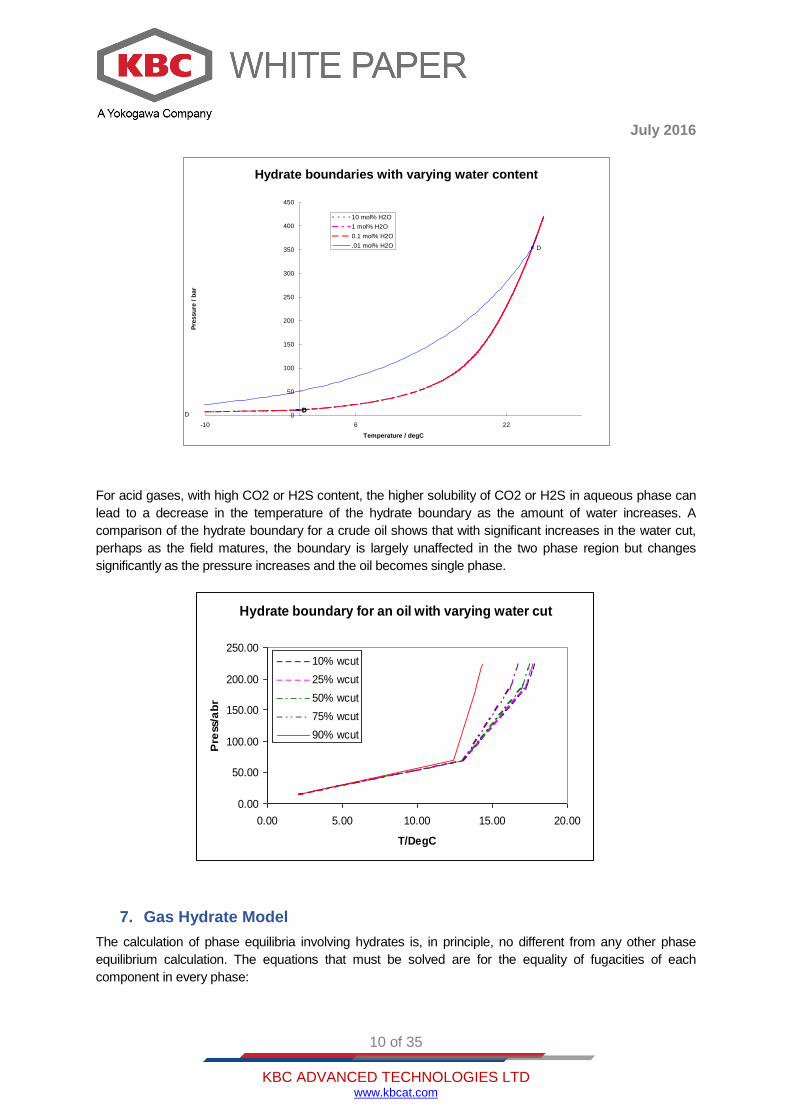
Calculations of the hydrate dissociation boundary with typical natural gases indicate that the water content
must drop to around 0.01 mol% to affect the hydrate phase boundary.
Moles H2O per 100 Moles gas
10 mol% 1 mol% 0.1 mol% 0.01 mol%
P/bar T/C T/C T/C T/C
10 -3.01 -3.01 -3.01 -19.44
20 4.78 4.78 4.78 -11.48
50 12.35 12.35 12.35 -0.28
75 15.33 15.32 15.32 4.92
100 17.21 17.21 17.21 8.71
150 19.57 19.57 19.57 14.06
200 21.19 21.19 21.19 17.76
July 2016
10 of 35
KBC ADVANCED TECHNOLOGIES LTD
www.kbcat.com
For acid gases, with high CO2 or H2S content, the higher solubility of CO2 or H2S in aqueous phase can
lead to a decrease in the temperature of the hydrate boundary as the amount of water increases. A
comparison of the hydrate boundary for a crude oil shows that with significant increases in the water cut,
perhaps as the field matures, the boundary is largely unaffected in the two phase region but changes
significantly as the pressure increases and the oil becomes single phase.
7. Gas Hydrate Model
The calculation of phase equilibria involving hydrates is, in principle, no different from any other phase
equilibrium calculation. The equations that must be solved are for the equality of fugacities of each
component in every phase:
Hydrate boundaries with varying water content
DDD
D
D 0
50
100
150
200
250
300
350
400
450
-10 6 22
Temperature / degC
Pre
ssu
re /
ba
r
10 mol% H2O
1 mol% H2O
0.1 mol% H2O
.01 mol% H2O
Hydrate boundary for an oil with varying water cut
0.00
50.00
100.00
150.00
200.00
250.00
0.00 5.00 10.00 15.00 20.00
T/DegC
Pre
ss/a
br
10% wcut
25% wcut
50% wcut
75% wcut
90% wcut
July 2016
11 of 35
KBC ADVANCED TECHNOLOGIES LTD
www.kbcat.com
ipiii ffff 321
In practice, it is only possible to solve the complex systems of equations involved using numerical procedures
implemented in software packages. Hydrate equilibria are even more difficult to handle than fluid phase
equilibria, because of the number of phases that may exist and because the models required to describe the
hydrate and ice phases are very different from those used for the gas and liquid phases.
Usually it is necessary to consider up to six phases: gas, hydrocarbon liquid, aqueous liquid, ice, Hydrate I
and Hydrate II. To model the effect of salts on hydrate inhibition, additional solid salt phases are also
required, leading up to total of 17 phases that may be considered. The types of models typically used to
describe the properties of each of these phases are briefly reviewed in the following sections.
Hydrate Phases I, II and H
The gas hydrate model in MultiflashTM is based on the work of Van der Waals and Platteeuw, which dates
back to the 1950s. The formation of gas hydrate is thermodynamically thought of as having two steps:
Firstly, pure liquid water solidifies to form an empty hydrate lattice. This is analogous to the
formation of ice and is described by the same thermodynamic equations, although the
parameter values of hydrate lattice are different.
Secondly, gas molecules are adsorbed into the cavities in the hydrate lattice. The statistical
mechanics of the hydrate adsorption process was derived by Van der Waals and Platteeuw,
who modelled the interaction between the gas molecules and the hydrate lattice using an
effective intermolecular potential. The difference in chemical potential between an empty and
filled lattice is given by:
H
k ik
ikRTn ln( )1
The sums are over the cavities k and components i
nC f
C fik
ik i
jk j
j
1
The Langmuir constants for each component and cavity are functions of temperature
);( ikikik TCC a
where the adjustable parameters aik are estimated by matching experimental hydrate dissociation data. This
approach has been widely used and tested for many years and is capable of accurately representing the
experimental data on hydrates provided that great care is taken in obtaining an appropriate set of fitted
parameters.
The gas hydrate model in MultiflashTM has been developed in collaboration with Shell, based on very large
sets of experimental data. Later the model was extended and further improved as part of a deepwater JIP
project.
Fluid Phases

July 2016
12 of 35
KBC ADVANCED TECHNOLOGIES LTD
www.kbcat.com
Modelling the gas hydrate phase behaviour accurately demands modelling of not only gas and oil phase but
must also encompass an aqueous phase that will usually contain alcohols, glycols, electrolytes and several
possible solid phases.
The generic fluid modelling approach in MultiflashTM is to enhance the basic cubic equation of state (EOS)
by adding appropriate thermodynamic terms to the Helmholtz energy. Hence our general fluid phase model
in MultiflashTM has the following structure
𝐴𝑟𝑒𝑠 = 𝐴𝑅𝐾𝑆𝑟𝑒𝑠 + 𝐴𝑎𝑠𝑠𝑜𝑐 + 𝐴𝑒𝑙𝑒𝑐𝑡𝑟𝑜𝑙𝑦𝑡𝑒
where 𝐴𝑟𝑒𝑠 is the total fluid phase residual Helmholtz energy, 𝐴𝑎𝑠𝑠𝑜𝑐 is the contribution from chemical
association and 𝐴𝑒𝑙𝑒𝑐𝑡𝑟𝑜𝑙𝑦𝑡𝑒 is the term that accounts for contributions in electrolyte solutions. 𝐴𝑅𝐾𝑆𝑟𝑒𝑠 is the
residual term from the cubic EoS. In MultiflashTM the enhanced version of Redlich-Kwong-Soave (RKS)
EOS is the recommended model for hydrate modelling, which has the “a” parameters determined by fitting
the vapour pressure to improve the saturation pressure prediction and the peneloux volume correction is
consdiered to improve the liquid density.
The aqueous phase is perhaps the most difficult to represent, particularly if inhibitors such as methanol
and/or salts are present. The aqueous phase cannot be adequately modelled with a conventional cubic
EOS and a variety of other methods have been used. MultiflashTM offers the Advanced version of RKSA
model either with an NRTL type mixing rule (RKSA-Infochem) or with an explicit association term (CPA).
But the latter, CPA is the recommended model in MultiflashTM that offers better prediction of the methanol
partitioning and more reliable extroplation performance in the region outside of the conditions covered by
the experimental data.
A reliable fluid model is essential to guarantee very accurate results in the solution of the fluid phase
equilibria and the partitioning of polar components such as water and alcohols or glycols, playing a crucial
part in hydrates formation, mitigation strategies and inhibition.
The CPA approach in MultiflashTM makes it possible to model highly non-ideal aqueous phases containing
hydrate inhibitors such as alcohols and glycols, whereas the electrolyte term allows us to handle mixed-
solvent electrolyte solutions and to model the effect of salts on hydrate inhibition. The details of the CPA
model will be presented in later sections.
Other Pure Solid Phases
Solving the thermodynamic phase equilibrium calculations simunetenously involing other solid phases
together with gas, hydrocarbon liquid , aqueous and gas hydrate phases (sI,sII,sH) is important to ensure
the true phase equilibrium solution and thermodynamic consistency.
Modelling pure solid formation such as ice or solid CO2 purely depends on the thermal properties of an
individual component; the melting point temperature, enthalpy of fusion and volume change on fusion. The
model is used to calculate the thermodynamic properties of solid phases formed by freezing one or more of
the components in the fluid mixture. It may be applied to any component with given thermal properties.
The freeze-out model in general is defined by:

July 2016
13 of 35
KBC ADVANCED TECHNOLOGIES LTD
www.kbcat.com
For the freeze-out of pure solids, the parameters are defined as follows; 𝜑𝑖 the fugacity coefficient of pure
solid component i, 𝜑𝑖𝑙𝑖𝑞
is the fugacity coefficient of the same component as a pure liquid at the same
pressure P and temperature T (calculated from the liquid phase model associated with the freeze-out model),
α = 1, ∆H, ∆𝐶𝑝 and ∆V are the changes in molar enthalpy, molar heat capacity and molar volume
respectively on fusion at the melting point, 𝑇𝑟𝑒𝑓 is a reference temperature which corresponds to the normal
melting point when 𝑆𝑐𝑜𝑟𝑟 = 0, which is assumed in this case. 𝑃𝑎𝑡𝑚 is atmospheric pressure. ∆H, ∆𝐶𝑝 and
∆V are constants, which are normally obtained from the chosen physical property data source.
Solid freeze-out can be used to model the solidification of compounds such as water, carbon dioxide or
methane, for example in natural gases. It can also be used to model eutectics.
Another set of components that may form a solid phase, are the salts present in the water. The presence of
these components may occur for several reasons:
already present in the formation water
added with the mud used to stabilize the well
when sea water is used in the process
Another consequence of having salts in solution is that the water activity is reduced, hence, the salts have a
hydrate inhibition inhibition effect. The model used to account for the presence of salts in MultiflashTM is
based on the Debye-Hückel theory which determines the effect of the electrolytes on the water activity.
8. Gas Hydrate Inhibition
Understanding the key requirements and the likely location at which gas hydrates form are crucial for the
successful gas hydrates preventation and remediation in drilling, production and transportation.
Based on the three key criteria of hydrate formation, the possible means of preventation may be:
Removal of hydrate formers
Dehydration – removal of water from the system either by separation or dehydration.
Heat – maintaining high temperatures through insulation and pipe-bundling or introducing
heat using hot fluids or electrical heating.
Pressure - Operating at reduced pressure, although this will decrease transportation
efficiency.
Chemical Inhibition – injection of a chemical components to alter the fugacity of water
and move the hydrate formation conditions to lower temperatures and higher pressures
(thermodynamic inhibition) or use of kinetic or anti-agglomerants to slow down hydrate
crystals growth or maintain crystals as a dispersed phase.
July 2016
14 of 35
KBC ADVANCED TECHNOLOGIES LTD
www.kbcat.com
Removal of Hydrate Formers
Preventing the formation of hydrates by removing the supply of hydrate forming molecules is not practical
as most of the hydrate formers are the primary species in natural gas and petroleum systems. However
this approach may be useful for subsea operation where gas and liquids are separated in subsea, and are
transported to the processing facilities in separate pipelines. The gas pipeline still requires hydrate inhibition
(through chemical inhibitors) but the liquids line (containing oil and water) is able to operate satisfactorily
without forming hydrates due to the absence of hydrate formers. It is not known whether such a system has
yet been installed and operated in this way.
Dehydration
If water could be removed completely then hydrates could not form. On the other hand, if it can be reduced
significantly, then the formation of hydrates will be less likely and the amounts formed will be much smaller
not to cause any dangerous damages. Dehydration is a therefore common method for hydrates prevention
and has the additional engineering benefits of reducing the risk of corrosion and increasing transportation
efficiency by reducing liquid accumulation in gas lines.
Dehydration may be achieved by glycol dehydration, molecular sieves or refrigeration. Glycols are usually
used for gas dehydration as:
1) Water is highly soluble in glycols.
2) Hydrocarbons, in contrast, are not soluble in glycols, minimising loss of product.
3) Glycols have low vapour pressures, reducing solvent losses due to vaporisation.
4) Glycols are thermally stable, allowing regeneration of the solvent by heating to drive off water.
5) Glycols don’t react with CO2 or H2S and are generally non-corrosive.
The glycols most often considered for use are monoethylene glycol (MEG), diethyleneglycol (DEG) and
triethyleneglycol (TEG). Of these, TEG is the most popular.
Often the water content of the gas leaving the contactor will be specified or it should be low enough to a
avoid hydrate formation at later points in the process as when gases are cooled through gas expansion.
Problems may occur if the gas is not dried sufficiently or there is water carry-over.
Molecular Sieves
Molecular sieves are based on an absorption process whereby the water, present in the gas phase, adheres
to the solid phase that forms the sieve. They are usually used when a very dry gas in required, such as
cryogenic gas processing and may follow a glycol de-hydrator used for bulk water removal. The bed must
be regenerated once saturated with water.
Over time, if the desiccant is not adequate, sufficient water can pass through these sieves to allow hydrates
to form in the colder sections of the downstream process.
Refrigeration
Refrigeration is often used when wet gas is being processed for hydrocarbon liquid recovery, and has the
consequent effect of removing water. An advantage of this process is that it can be used to meet both
hydrocarbon dew point and water content specification.
July 2016
15 of 35
KBC ADVANCED TECHNOLOGIES LTD
www.kbcat.com
The metal walls of the chillers and heat exchangers can be cold enough for hydrates to form on the surfaces
and cause hydrate fouling. To avoid this, glycol is sprayed into the exchangers and chillers. Owing to its
better low temperature properties, MEG is the usual choice for this application.
However hydrate problems may occur due to unequal distribution of glycol in the heat exchanger tubes,
excessive glycol viscosity, restricting flow in narrow tubes, and inadequate glycol injection for hydrate
prevention. An added complication is that MEG and water have an eutectic at approximately 80 wt% MEG,
i.e. mixtures of MEG and water freeze at lower temperatures than the pure components.
Heat
Maintaining high temperatures keeps the system in the hydrate free zone. The initial high reservoir
temperatures may be retained by some degree by insulation. Pipeline burial is one means of providing
insulation and protection, the degree of insulation depending on the thermal gradient along the pipeline route,
the pipeline depth and the ambient temperature. Pipeline burial may be economic on land but very expensive
in deep water.
Temperature control by passive insulation only offers hydrate control during normal operation when the
system is being continually heated by hot production fluids. Sub-sea and buried pipelines will inevitably lose
heat to their surroundings, especially following a shutdown the production fluids will cool down and can enter
the hydrate envelope. Additional heating can be supplied by either line heaters or heat tracing, although
neither may be practical or economic in all circumstances. A heater has to supply sufficient heat to maintain
the fluid temperature outside the hydrate forming region until the next point where heat is supplied.
Alternatively heat tracing may be used to inject heat continuously along a line, using electrical or fluid
mediums. Common means of supplying heat are bundling hot water lines, induction heating with current
flowing through cables outside the pipe but within insulation and direct electrical heating in which the pipe
acts as a conductor with a current return line in parallel.
Supplying heat is usually limited to strategic points in a process, such as valves. Heating tools were later
introductions for pipelines and, to be economic, may be available only when the line is most vulnerable, e.g.
during shut-in.
Pressure
Much of the process may be controlled by pressure including transportation, compression and expansion.
Depressurisation is not used as much in hydrate prevention as hydrate remediation.
Chemical Inhibition
The final, and probably the most frequent and effective, means of hydrate prevention is by injecting an
hydrate inhibitor, such as methanol or MEG, which acts as an antifreeze and decreases the hydrate
formation temperature to below the operating temperature. These inhibitors are known as thermodynamic
inhibitors. Ionic salts also act as inhibitors. These ionic salts are almost always present in the formation or
production water that must be considered in hydrate inhibition.
Thermodynamic Inhibitors
The mechanism for thermodynamic hydrate inhibition is the inhibitor dissolving in the free water phase
thereby reducing the fugacity of water. As water is the principal component of hydrates, reducing the fugacity
of water also reduces the tendency of hydrates to form.

July 2016
16 of 35
KBC ADVANCED TECHNOLOGIES LTD
www.kbcat.com
It is also important to realise that thermodynamic inhibitors modify the properties of the fluid phases, not the
solid gas hydrate phase, and as a result they have a number of other effects. The presence of inhibitors
raises the solubility of gases and hydrocarbons in the water phase thereby inhibiting the formation of
hydrates further. The inhibitor also depresses the ice point. It reduces the vapour pressure of water, i.e. it
has a dehydrating effect on the vapour and hydrocarbon liquid phases.
Weight for weight methanol provides a greater inhibiting effect than the glycols. However, as can be seen
from the plot below salt is also very effective at inhibiting hydrates. While the corrosion effects of salt mean
that it would not necessarily be added as an inhibitor, it clearly should not be neglected when determining
the injection dosage/rate of the thermodynamic inhibitors.
Although methanol is the most frequently used inhibitor for pipelines and process equipment it can have
some adverse effects:
July 2016
17 of 35
KBC ADVANCED TECHNOLOGIES LTD
www.kbcat.com
1) In subsequent processing of the hydrocarbon stream, the methanol may concentrate in the liquefied petroleum gas (LPG). LPG consists largely of propane and butanes, and both propane and n-butane form azeotropes with methanol, making it impossible to separate the systems using binary distillation.
2) Methanol may also cause problems in relation to corrosion. As some corrosion inhibitors are alcohol based, methanol dissolves the inhibitor leading to unexpected corrosion problems. Moreover, if stored on site in tanks open to the atmosphere, it dissolves air, adding to the long-term corrosion effects.
3) Another reported finding is that under-inhibition with methanol is worse than no inhibition because under-inhibited systems form hydrates faster than systems without inhibitors.
4) Hydrates stick to pipe walls more aggressively when insufficient methanol is injected.
Methanol is relatively volatile, so significant amounts of injected methanol are lost to the hydrocarbon gas,
oil or condensate phases. This can add considerably to costs, particularly when the total fraction of the
hydrocarbon phase is large compared to the water phase, for example in the early phases of reservoir
production. Methanol can be recovered from the free water phase to reduce concentration such that the
water can be dumped overboard. Methanol recovery from the vapour phase, while possible, is seldom done
due to considerations of cost and safety.
The use of methanol has become so expensive in terms of capital cost, storage and operational costs that
alternatives to methanol injection have been implemented, particularly in the North Sea.
MEG is the most frequently used of the glycols as it has a lower viscosity and is more effective per unit
weight. MEG is also less volatile than methanol, so it is more easily recovered and recycled on platforms
and less is lost to the hydrocarbon phases. One potential complication in MEG recovery is that MEG is
recovered with water, and salt also concentrates in the MEG regenerator bottoms. The salt solubility limit in
MEG is often exceeded leading to salt precipitation and consequent fouling of exchangers and other
equipment.
Weight for weight methanol is still a more efficient hydrate inhibitor than MEG and its use is much more
prevalent in the US and some sectors of the North Sea, especially for flow lines and platform topsides. MEG
is used primarily for hydrates in wells and risers and has higher usage in the UK sector of the North Sea.
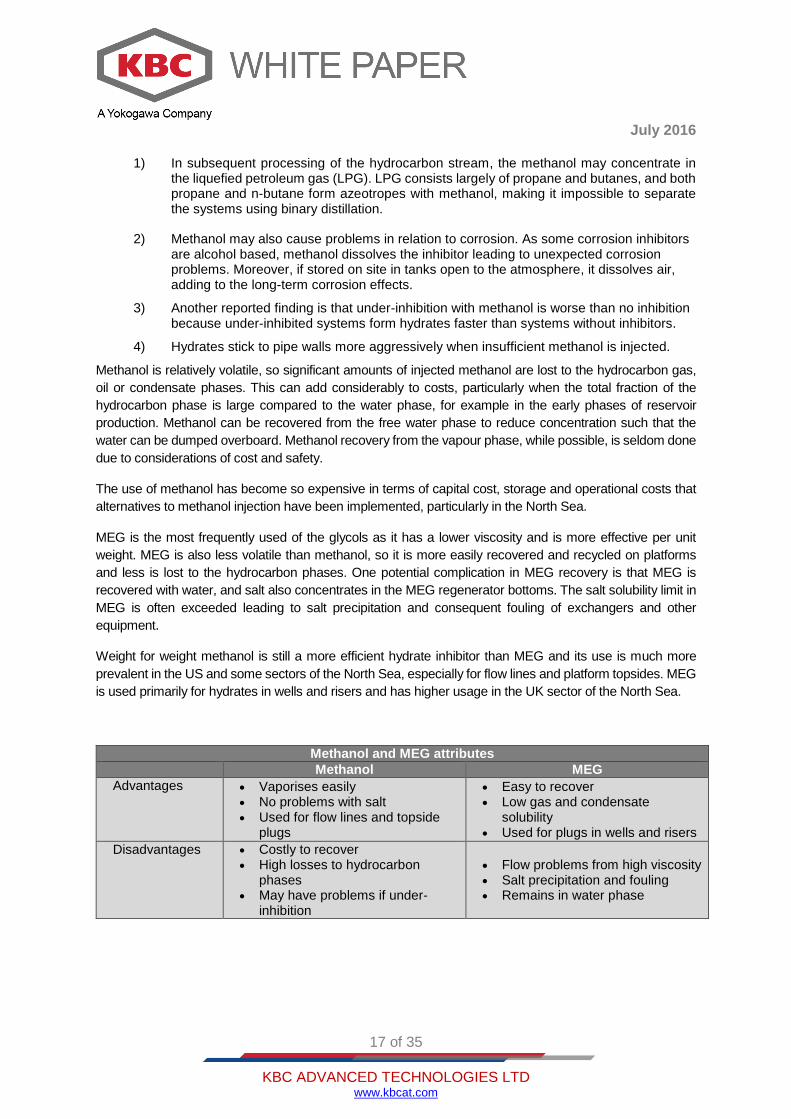
Methanol and MEG attributes
Methanol MEG
Advantages Vaporises easily No problems with salt Used for flow lines and topside
plugs
Easy to recover Low gas and condensate
solubility Used for plugs in wells and risers
Disadvantages Costly to recover High losses to hydrocarbon
phases May have problems if under-
inhibition
Flow problems from high viscosity Salt precipitation and fouling Remains in water phase

July 2016
18 of 35
KBC ADVANCED TECHNOLOGIES LTD
www.kbcat.com
Kinetic Inhibitors and Anti-Agglomerants
Kinetic hydrate inhibitors are injected in much smaller quantities compared to thermodynamic inhibitors and
therefore offer significant potential cost savings, depending on the pricing policies of major chemical
suppliers. They are also typically non-toxic and environmentally friendly. Moreover, considerable field
experience is now available following a number of successful trials. However, they have some important
limitations, including restrictions on the degree of sub-cooling (typically only guaranteed for less than 10°C)
and problems associated with residence times (implications for shutdowns). In addition, the effectiveness of
kinetic inhibitors appears to be system specific, meaning that testing programmes are required prior to
implementation. Unfortunately adequate testing can require appreciable quantities of production fluids which
may not be available, particularly for new field developments. Furthermore, they can interact with other
chemical inhibitors (e.g. corrosion inhibitors). Finally, there are no established models for predicting the
effectiveness of the kinetic inhibitors, which presents difficulties for field developers considering the
application of these chemicals.
The benefits and limitations of anti-agglomerants are largely similar to those for kinetic inhibitors, although
they do not have the same sub-cooling limitations. However, there is uncertainty about the effectiveness of
anti-agglomerants under shutdown or low flow rate conditions and it is postulated that agglomeration may
still proceed. In addition, they are limited to lower water cuts due the requirement for a continuous
hydrocarbon liquid phase and field experience with anti-agglomerants appears to be lacking which is re-
flected by the relatively small number of publications available in the open literature.
9. Hydrate Calculations with Thermodynamic Inhibitors
The most common inhibitors used to suppress hydrate formation are alcohols (principally methanol) and
glycols (usually ethylene glycol). As dissolved salts in produced water also acts as a hydrate inhibitor it is
important to be able to predict the cumulative effects of the salts and other chemical inhibitors. All these
chemicals suppress hydrate formation by decreasing the activity of water in the aqueous phase and hence
making the liquid more stable than the solid hydrate phase.
Modern hydrate calculation methods involving thermodynamic inhibitors are, in principle, the same as those
for ‘simple’ hydrate calculations. What is necessary is a set of thermodynamic models for all the phases that
may be present plus the robust numerical methods required to solve the complex phase equilibrium equa-
tions.
The main practical difficulty is to develop a model that will accurately describe the effect of an inhibitor or
mixed solvents on the aqueous phase and the loss of inhibitors between aqueous, gas and hydrocarbon
liquid phases. The thermodynamic models in MultiflashTM have been applied by the oil and gas, petroleum
chemical and gas processing industries for nearly 30 years. The accurate fluid models together with the gas
hydrate, waxes and asphaltene model provide the energy industires a parctical engineering tool to tackle all
the flow assurance problems. Two of the well-developed fluid models are summarised in the following
sections.
Alcohols and Glycols
The aqueous phase cannot be adequately modelled with a conventional cubic equation of state. KBC-
Infochem has successfully used two approaches to model all the fluid phases simuteneously. Firstly,
following modified mixing rules, combined with a RKS EOS:

July 2016
19 of 35
KBC ADVANCED TECHNOLOGIES LTD
www.kbcat.com
b b nii
i
a b nn b G
n b Gi
i
j j j ji ji
j j j ji
where:
ji
i j ji
i j
a a k
b b
2 1( )
and:
GRT
ji
ji ji ii
exp
( )
These expressions are excess Gibbs energy mixing rules and the NRTL model based on the work of Huron
and Vidal. There are three adjustable parameters for each binary pair - 𝑘𝑖𝑗, 𝑘𝑗𝑖 and 𝛼𝑗𝑖 but the model reduces
to the classical van der Waals mixing rules when no polar components are present. This allows complex
phase behaviour including electrolytes and polar species to be represented whilst maintaining the good
performance of the conventional cubic EOS for hydrocarbon phases.
The second approach combines a chemical association term with the RKS EOS. This is a robust general-
purpose implementation of the CPA (Cubic Plus Association) model of Kontogeorgis et al.
The general mathematic formulation of the model is:
The model uses the standard (Van der Waals 1-fluid) mixing rules which are:
The association term is complex; for a complete discussion refers to the scientific literature. In summary, the
terms 𝑋𝑖 are found by simultaneously solving the Wertheim equations, which in the CPA model have the
form:
)(45.0
1
bVV
a
bV
NRT
bV
XFn
pi
i
iii
N ni
i
a a a k n ni j
ij
ij i j ( )1
b b ni i
i
bRT
pi
ci
ci
0 08664.

July 2016
20 of 35
KBC ADVANCED TECHNOLOGIES LTD
www.kbcat.com
where 𝐹𝑗 are the number of (donor) bonding sites on component i and 𝑘𝑖𝑗 is the association constant for
components i and j.
This model explicitly takes into account the hydrogen-bonding in aqueous solutions and provides a reliable
physically-based model for all the fluid phases involved in hydrate systems. The Muiltflash CPA (MF-CPA)
approach is the recommended model in MultiflashTM for better prediction of the methanol partitioning and
more reliable extroplation performance in the region exceeded the experimental data range.
Note that the implementation of the MF-CPA model in MultiflashTM is different from those in public domain in
terms of the model paramertisation and the assoication model parameters.
Salts – Electrolyte Model
Modelling salt inhibition on gas hydrates is important as the formation water and drilling muds may contain
concentrated solutions of sodium chloride, calcium chloride or other salts. Typical examples of composition
of formation and seawater are as shown below.
Composition of North Sea Brine and Forties Formation Water
North Sea Brine, wt% Forties Formation Water, wt%
NaCl 2.354 6.993
CaCl2 0.116 0.735
MgCl2 0.524 0.186
KCl 0.086 0.186
Na2SO4 0.428
SrCl2 0.099
BaCl2 0.036
Although it is possible to estimate the effect of individual salts on hydrates quite well with an excess Gibbs
energy mixing rule as described above, this approach is incapable of covering the whole range of pressures,
temperatures and concentrations that are required, and is not quite accurate for modelling effect of mixed
solvents. In practice, it is necessary to model the mixed solvent electrolyte solutions because in addition to
water and salts the aqueous phase may contain alcohols or other solvents. KBC-Infochem have developed
an electrolyte model based on Debye-Hückel theory plus virial corrections that performs very well for hydrate
inhibition applications.
The general contribution term of Debye-Hückel theory to the total residual Helmholtz energy can be written
in the following form:
𝐴𝐷𝐻 = −4𝐴0𝑉
𝑍+𝑍−∑ 𝑛𝑖𝑛𝑗𝑧𝑖𝑧𝑗
𝜏𝑖𝑗
(𝑏𝑖𝑗0 )
3
𝑖,𝑗
where 𝐴0 is a constant, 𝑍+ and 𝑍− are the total positive and negative charge respectively. The index 𝑖
represents the cations, and 𝑗 the anions, and 𝑧𝑖 is the charge of the ions. 𝑏𝑖𝑗0 is specific Debye-Hückel
parameter for each pair of ions and 𝜏𝑖𝑗 is defined as:
bV
XFK
X
j
jjij
i 45.01
1
July 2016
21 of 35
KBC ADVANCED TECHNOLOGIES LTD
www.kbcat.com
𝜏𝑖𝑗 = 𝑙𝑛(1 + 𝑦𝑖𝑗) − 𝑦𝑖𝑗 + 0.5 𝑦𝑖𝑗2
And
𝑦𝑖𝑗 =𝑏𝑖𝑗
0
√𝑉𝜖𝑇Φ1/2
where 𝑉 is the total volume, 𝑇 is the temperature, 𝜖 the relative permittivity of the solvent and Φ the ionic
strength defined as
Φ = 1
2( ∑ 𝑛𝑖𝑧𝑖
2 + ∑ 𝑛𝑗𝑧𝑗2
𝑗∈𝑎𝑛𝑖𝑜𝑛𝑖∈𝑐𝑎𝑡𝑖𝑜𝑛
)
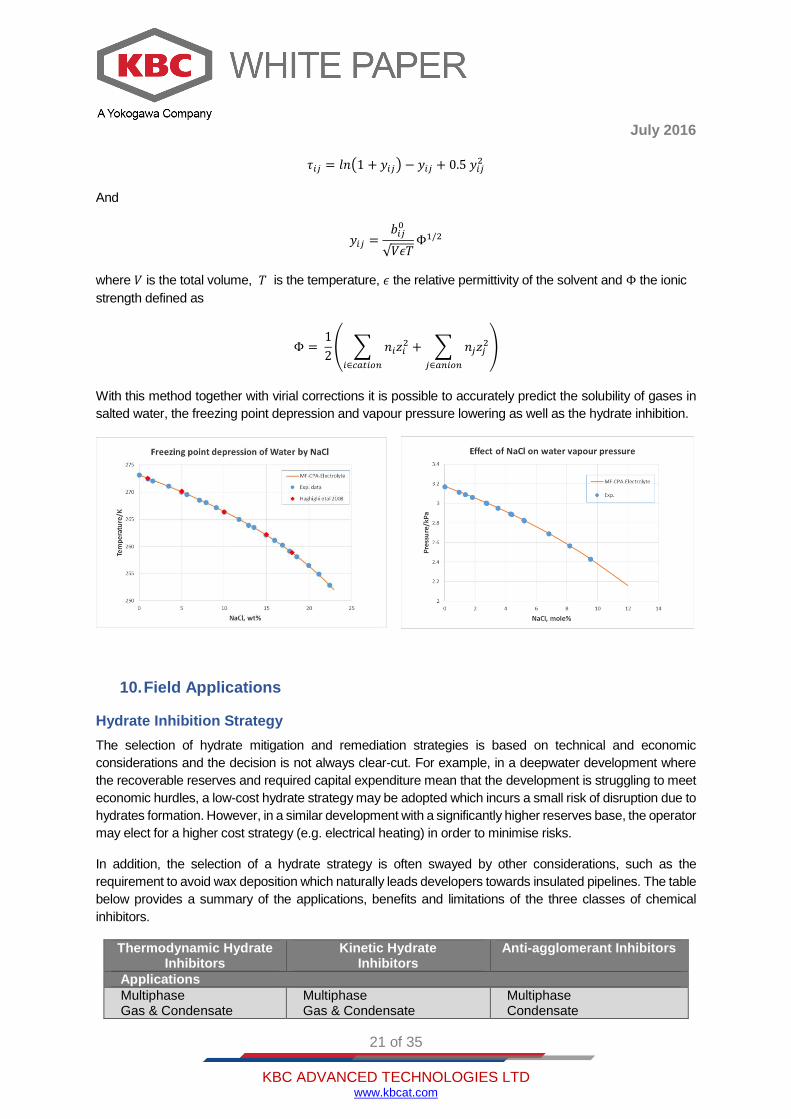
With this method together with virial corrections it is possible to accurately predict the solubility of gases in
salted water, the freezing point depression and vapour pressure lowering as well as the hydrate inhibition.
10. Field Applications
Hydrate Inhibition Strategy
The selection of hydrate mitigation and remediation strategies is based on technical and economic
considerations and the decision is not always clear-cut. For example, in a deepwater development where
the recoverable reserves and required capital expenditure mean that the development is struggling to meet
economic hurdles, a low-cost hydrate strategy may be adopted which incurs a small risk of disruption due to
hydrates formation. However, in a similar development with a significantly higher reserves base, the operator
may elect for a higher cost strategy (e.g. electrical heating) in order to minimise risks.
In addition, the selection of a hydrate strategy is often swayed by other considerations, such as the
requirement to avoid wax deposition which naturally leads developers towards insulated pipelines. The table
below provides a summary of the applications, benefits and limitations of the three classes of chemical
inhibitors.
Thermodynamic Hydrate Inhibitors
Kinetic Hydrate Inhibitors
Anti-agglomerant Inhibitors
Applications
Multiphase Gas & Condensate
Multiphase Gas & Condensate
Multiphase Condensate
July 2016
22 of 35
KBC ADVANCED TECHNOLOGIES LTD
www.kbcat.com
Crude Oil Crude Oil? Crude Oil
Benefits
Robust & effective Well understood Predictable Proven track-record
Lower OPEX/CAPEX Low volumes (< 1wt%) Environmentally friendly Non-toxic Tested in gas systems
Lower OPEX/CAPEX Low volumes (< 1wt%) Environmentally friendly Non-toxic Wide range of sub cooling
Limitations
Higher OPEX/CAPEX High volumes (10-60 wt%) Toxic / hazardous Environmentally harmful Volatile – losses to vapour ‘Salting out’
Limited sub cooling (<10°C) Time dependency Shutdowns System specific – testing Compatibility Precipitation at higher temps Limited exp. in oil systems No predictive models
Time dependency? Shutdowns? Restricted to lower water cuts System specific – testing Compatibility Limited experience No predictive models
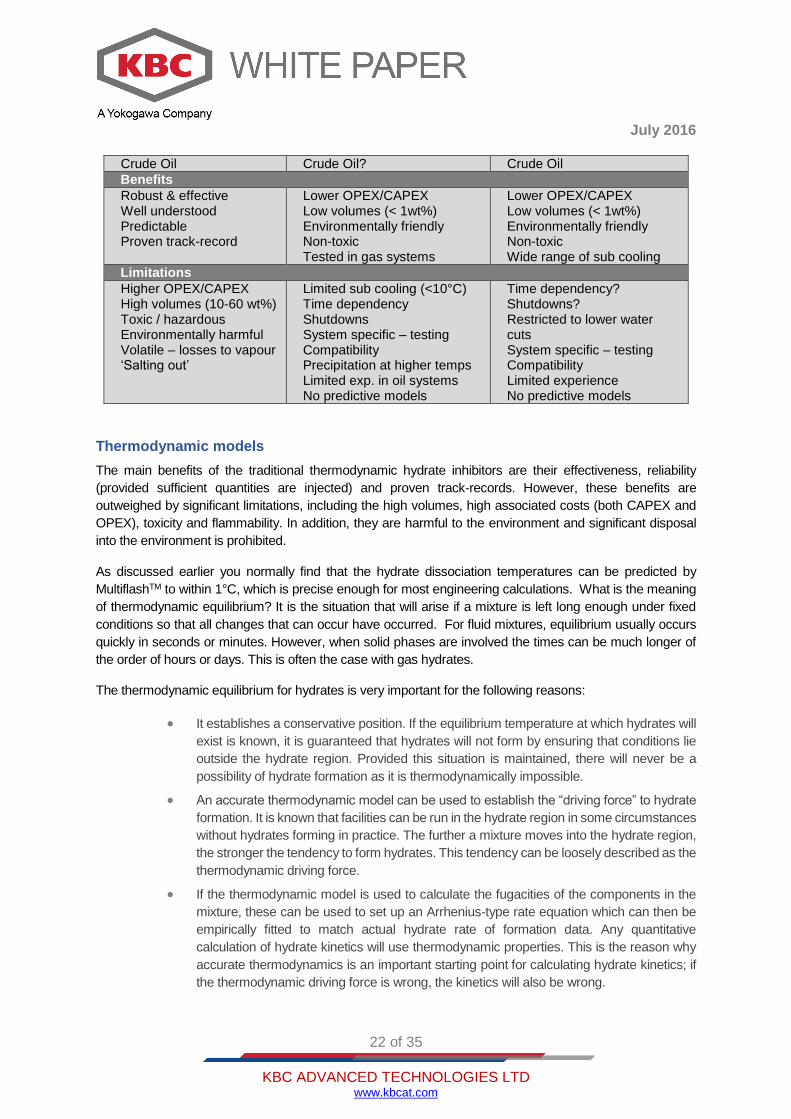
Thermodynamic models
The main benefits of the traditional thermodynamic hydrate inhibitors are their effectiveness, reliability
(provided sufficient quantities are injected) and proven track-records. However, these benefits are
outweighed by significant limitations, including the high volumes, high associated costs (both CAPEX and
OPEX), toxicity and flammability. In addition, they are harmful to the environment and significant disposal
into the environment is prohibited.
As discussed earlier you normally find that the hydrate dissociation temperatures can be predicted by
MultiflashTM to within 1°C, which is precise enough for most engineering calculations. What is the meaning
of thermodynamic equilibrium? It is the situation that will arise if a mixture is left long enough under fixed
conditions so that all changes that can occur have occurred. For fluid mixtures, equilibrium usually occurs
quickly in seconds or minutes. However, when solid phases are involved the times can be much longer of
the order of hours or days. This is often the case with gas hydrates.
The thermodynamic equilibrium for hydrates is very important for the following reasons:
It establishes a conservative position. If the equilibrium temperature at which hydrates will
exist is known, it is guaranteed that hydrates will not form by ensuring that conditions lie
outside the hydrate region. Provided this situation is maintained, there will never be a
possibility of hydrate formation as it is thermodynamically impossible.
An accurate thermodynamic model can be used to establish the “driving force” to hydrate
formation. It is known that facilities can be run in the hydrate region in some circumstances
without hydrates forming in practice. The further a mixture moves into the hydrate region,
the stronger the tendency to form hydrates. This tendency can be loosely described as the
thermodynamic driving force.
If the thermodynamic model is used to calculate the fugacities of the components in the
mixture, these can be used to set up an Arrhenius-type rate equation which can then be
empirically fitted to match actual hydrate rate of formation data. Any quantitative
calculation of hydrate kinetics will use thermodynamic properties. This is the reason why
accurate thermodynamics is an important starting point for calculating hydrate kinetics; if
the thermodynamic driving force is wrong, the kinetics will also be wrong.

July 2016
23 of 35
KBC ADVANCED TECHNOLOGIES LTD
www.kbcat.com
Hydrate Nucleation model in MultifashTM
KBC-Infochem was involved in the development of BP hydrate nucleation model (EUCHARIS JIP) based
on multi-component nucleation theory.
For engineering applications, the model required several simplifying assumptions and initially modelled
homogeneous nucleation, largely based on data available for water/ice. To adapt this to heterogeneous
nucleation further assumptions were included to take account of nucleation at a surface rather than from
within the bulk of a fluid phase, including the geometry of a hydrate nucleus on a plane surface.
Parameterisation of the model involved:
expressions for the diffusion of hydrate formers,
the hydrate-water interfacial tension and
an approximate means of allowing for the influence of an external surface in lowering the free
energy barrier to hydrate nucleation, such as might be provided by a pipeline wall. The latter was
expressed in terms of a contact angle, effectively a wetting angle for the hydrate on the external
surface.
θ
Hydrate nucleus
Contact angles were fitted to hydrate formation data for a variety of systems and a default value chosen that
gave reasonable predictions for multi-component gas systems. If the contact angle were presumed to be
zero there would be no barrier to nucleation and the hydrate formation curve will tend to towards the
dissociation curve. Raising the value of the contact angle to 180 produces the highest possible value of sub-
cooling, corresponding to a homogeneously nucleating system. Sub-cooling far outside the range is normally
associated with the range of operating conditions experienced.
The BP nucleation model has been developed by KBC-Infochem as part of Multiflash™. It would normally
be expected that the predicted hydrate formation temperatures would be lower than those observed in the
field.

July 2016
24 of 35
KBC ADVANCED TECHNOLOGIES LTD
www.kbcat.com
The BP hydrate nucleation model is commercially available in MultiflashTM. With both the gas hydrate dissociation and the hydrate nucleation formation model in MultiflashTM, the hydrate risk region can be fully identified as shown below.
Kinetic hydrate modelling
The thermodynamic and nucleation models only predict hydrate boundaries, albeit the extremely useful
dissociation boundary from the former. They can be viewed as approximating to what happens at infinite
time (thermodynamic) and at zero time (nucleation). For engineering applications they do not predict the
hydrate induction time, i.e. how long a fluid can be held in a sub-cooled condition before hydrate formation
starts and the rate at which, once nucleated, hydrate forms. Both aspects require a hydrate kinetics model.
Hydrate Dissociation and Nucleation
H2S (32%) - Propane (7%) - Methane (61%)
0
100
200
300
400
500
600
700
0 5 10 15 20 25 30
Tem/DegC
Pre
ss
/ps
ia
Experimental (dissociation)Calculated (dissociation)Calculated (formation0Experimental (formation)
T e m p e r a t u r e
P
r
e
ss
u
r
e
Hydrate freeHydraterisk
Hydrate zone
Hydrate dissociation curveHydrate formation curve

July 2016
25 of 35
KBC ADVANCED TECHNOLOGIES LTD
www.kbcat.com
An excellent review of the state of kinetics modelling to 1998 is provided in Sloan’s book. A kinetics model
has to describe two stages in hydrate formatio; nucleation (induction time) and hydrate growth.
11. Validation of Gas Hydrates and CPA Model in MultiflashTM
MultiflashTM, a comprehensive physical properties, PVT and phase equilibrium software package, offers the accurate and robust CPA approach for many flow assurance applications. The purpose of this section is to provide the assessment study on how well the fluid phases and the hydrate conditions can be predicted using the gas hydrate and CPA model in MultiflashTM.
Complex Phase Behaviour of CO2-H2O and H2S-H2O
The complex phase behaviour of CO2-water and H2S-water is well predicted by CPA in MultiflashTM. The accurate gas hydrate prediction strongly depends on the reliability of the fluid model applied.

July 2016
26 of 35
KBC ADVANCED TECHNOLOGIES LTD
www.kbcat.com
Methanol Partitioning and LLE
The methanol partitioning among the fluid phases and liquid-liquid equilibrium (LLE) are well predicted by
the CPA model in MultiflashTM.
Structure Gas Hydrate I: Methane, CO2 and H2S
Methane forms a structure I hydrate and has been extensively studied. Measurements cover a very wide
range of pressure and temperature conditions. The kink in the curve corresponds to the change from ice-
hydrate-gas to water-hydrate-gas equilibrium, which is well predicted by MultiflashTM.
July 2016
27 of 35
KBC ADVANCED TECHNOLOGIES LTD
www.kbcat.com
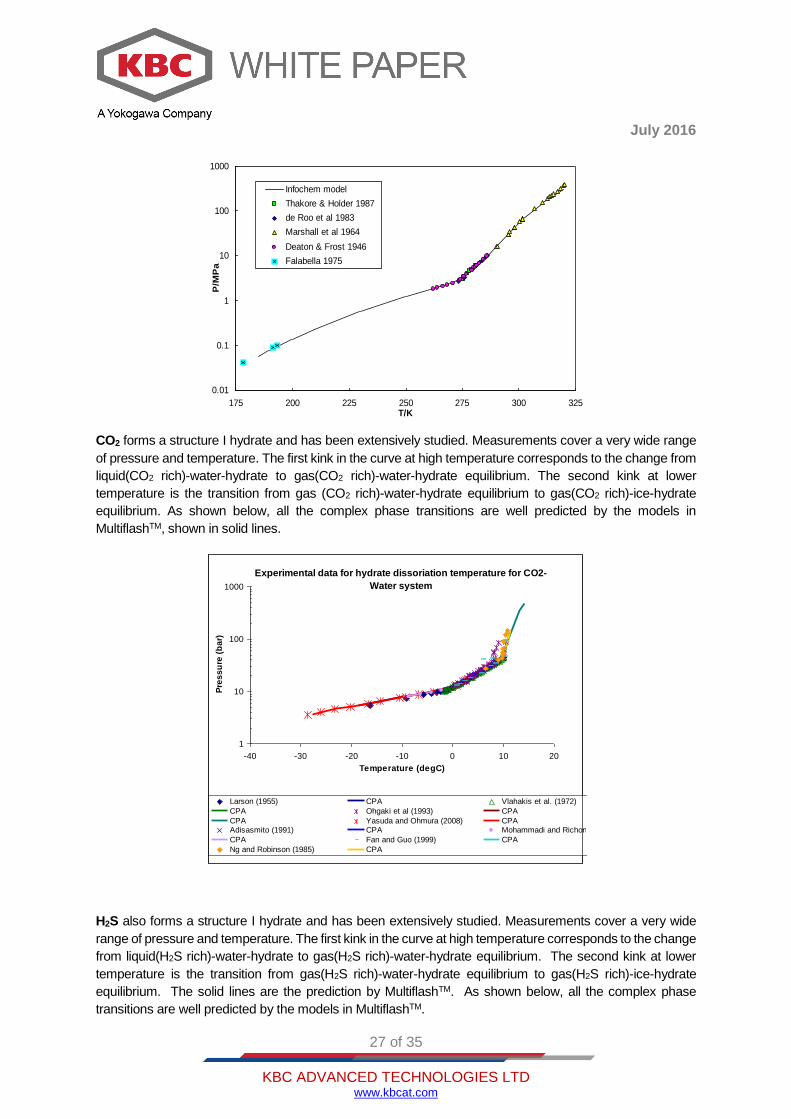
CO2 forms a structure I hydrate and has been extensively studied. Measurements cover a very wide range
of pressure and temperature. The first kink in the curve at high temperature corresponds to the change from
liquid(CO2 rich)-water-hydrate to gas(CO2 rich)-water-hydrate equilibrium. The second kink at lower
temperature is the transition from gas (CO2 rich)-water-hydrate equilibrium to gas(CO2 rich)-ice-hydrate
equilibrium. As shown below, all the complex phase transitions are well predicted by the models in
MultiflashTM, shown in solid lines.
H2S also forms a structure I hydrate and has been extensively studied. Measurements cover a very wide
range of pressure and temperature. The first kink in the curve at high temperature corresponds to the change
from liquid(H2S rich)-water-hydrate to gas(H2S rich)-water-hydrate equilibrium. The second kink at lower
temperature is the transition from gas(H2S rich)-water-hydrate equilibrium to gas(H2S rich)-ice-hydrate
equilibrium. The solid lines are the prediction by MultiflashTM. As shown below, all the complex phase
transitions are well predicted by the models in MultiflashTM.
0.01
0.1
1
10
100
1000
175 200 225 250 275 300 325T/K
P/M
Pa
Infochem model
Thakore & Holder 1987
de Roo et al 1983
Marshall et al 1964
Deaton & Frost 1946
Falabella 1975
Experimental data for hydrate dissoriation temperature for CO2-
Water system
1
10
100
1000
-40 -30 -20 -10 0 10 20
Temperature (degC)
Pre
ss
ure
(b
ar)
Larson (1955) CPA Vlahakis et al. (1972)
CPA Ohgaki et al (1993) CPA
CPA Yasuda and Ohmura (2008) CPAAdisasmito (1991) CPA Mohammadi and Richon (2009b)
CPA Fan and Guo (1999) CPA
Ng and Robinson (1985) CPA

July 2016
28 of 35
KBC ADVANCED TECHNOLOGIES LTD
www.kbcat.com
Natural Gases - Structure Gas Hydrate II
The data in this figure were measured by Wilcox. et al. Small amounts of heavier gases such as propane
result in a structure II hydrate which forms at higher temperatures/lower pressures than structure I.
For simple mixtures of natural gas components up to moderate pressures MultiflashTM is able to make
accurate predictions of hydrate formation conditions in the absence of inhibitors. Typically, at a given
pressure it should be possible to predict the hydrate formation temperature to within 1ºC.
Natural Gas Liquids - Structure Gas Hydrate II
The data are from Ng and Robinson (1976). The liquids contain mainly ethane, propane and isobutane with
traces of methane.
Hydrate dissociation temperature for H2S
0
1
10
100
1000
-30 -20 -10 0 10 20 30 40
Temperature( degC )
Pre
ssu
re (
bar
)
Selleck et al. (1952)
Bond and Russel (1949)
Carroll and Mather (1991)
Scheffer (1913)
Mohammadi and Richon (2009a)
Temperature
V/L line
Hydrate I
0
5
10
15
20
25
30
275 280 285 290 295 300T/K
P/M
Pa
Gas B Gas C
N2 0.64
C1 86.41
C2 6.47
C3 3.57
iC4 0.99
C4 1.14
C5+ 0.78
N2 0.64
CO2 0.51
C1 93.20
C2 4.25
C3 1.61
Gas B Gas C

July 2016
29 of 35
KBC ADVANCED TECHNOLOGIES LTD
www.kbcat.com
The four-phase equilibria involving water, hydrate, hydrocarbon liquid and gas provide a more difficult
computational challenge because it is necessary to estimate accurate vapour-liquid equilibria in addition to
the hydrate equilibria. As shown below, the complex phase behaviour and transitions are well predicted by
the models in MultiflashTM.
Crude Oil - Structure Gas Hydrate II
The measurements are from Avlonites. As in the previous example there are four phases present.
A prerequisite for hydrate calculations for crude oils is to characterise the heavy end (C7+ fraction) in terms
of petroleum fraction pseudo components.
0
50
100
150
270 275 280 285 290 295T/K
p/b
ar
Gas I
Gas II
Gas III
Gas IV
Gas V
Gas VI
1
10
278 280 282 284 286 288 290 292 294
T/K
P/M
Pa
N2 0.61
CO2 2.01
C1 35.56
C2 9.90
C3 8.06
iC4 1.34
C4 4.26
iC5 1.28
C5 2.57
C6 3.15
C7+ 31.26

July 2016
30 of 35
KBC ADVANCED TECHNOLOGIES LTD
www.kbcat.com
Effect of Heavy Hydrate Formers - Structure Gas Hydrate II and H
It was a widespread assumption that molecules larger than butane were not hydrate formers. In fact there
are very many larger molecules that will form hydrate structure II or hydrate structure H. Structure H is not
likely to form in most natural gas/oil systems but structure II formers such as benzene are present in most
oils. The following diagram shows the effect on hydrate predictions of correctly including benzene,
cyclohexane etc. as hydrate formers.
The difference between the two lines is about 1ºC which is within the typical experimental uncertainty.
However, for oils with higher concentrations of heavy hydrate formers the effect could be significant.
12. MultiflashTM Hydrate Inhibition Model Validation
The purpose of this section is to provide an impression of how well hydrate conditions in the presence of
inhibitors can be predicted using the gas hydrate model with MF-CPA. All the examples presented here
have been calculated with MultiflashTM.
Effect of Methanol on Methane Hydrate
This system has been well-studied and although there is some scatter in the measurements the effect of
methanol is predicted very well.
Hydrate Calculations with SII formers
0
10
20
30
40
50
60
70
80
90
100
0 10 20 30 40 50 60
Temp/DegF
Pre
ss/b
ar
SII formers to C4
All SII formers

July 2016
31 of 35
KBC ADVANCED TECHNOLOGIES LTD
www.kbcat.com
Effect of Methanol on Hydrate Formation for a Condensate
The predictions are again very good even though there are four phases (gas, aqueous liquid, hydrocarbon
liquid and hydrate) present.
Effect of MEG on Hydrate Formation for a Condensate
This is the same condensate as in the previous example but this time MEG is used as the inhibitor. Because
of its low volatility little MEG is lost to the gas phase but there is some solubility in the hydrocarbon liquid
phase.
0.1
1
10
100
200 220 240 260 280 300T/K
P/M
Pa
Wt% Methanol solution 65% 50% 35% 20% 10% 0%
Ng et al., GPA Report 92
0
5
10
15
20
-40 -30 -20 -10 0 10 20 30T/C
P/M
Pa
0 wt% MeOH
25 wt% MeOH
50 wt% MeOH
C1 74.13C2 7.21C3 4.50
iC4 .90C4 1.8iC5 .87C5 .89
C6s 1.82C7s 2.72C8+ 5.16

July 2016
32 of 35
KBC ADVANCED TECHNOLOGIES LTD
www.kbcat.com
Effect of Salt on Hydrate Formation for Methane
The calculations in this figure were carried out with the electrolyte model. The data extend to near saturation
conditions and up to nearly 1000 bar. They are well represented by the model in MultiflashTM.
Ng et al., GPA Report 92
0
5
10
15
20
-20 -10 0 10 20 30T/C
P/M
Pa
0 wt% MEG
25 wt% MEG
50 wt% MEG
Methane hydrate inhibition by NaCl
data from de Roo at al and Sloan et al
1
1.2
1.4
1.6
1.8
2
2.2
2.4
2.6
2.8
3
260 270 280 290 300T/ K
log
10
(Pre
ss
ure
/ba
r)
de Roo 0 wt %
12 wt %
17 wt %
22 wt %
24 wt %
Sloan 0 wt %
6 wt %
11 wt %
17 wt %
22 wt %

July 2016
33 of 35
KBC ADVANCED TECHNOLOGIES LTD
www.kbcat.com
Black Oil with Salts and Methanol
In this example, we have taken data from Tohide et al. for an oil system. Both the effects of salt and methanol plus salt are handled well by the model in MultiflashTM.
13. Conclusion
Gas hydrate formation analysis and management have become an essential part of engineering work for
the design, commissioning and operation of offshore and onshore production and transportation.
This paper has presented the theory of gas hydrate formation and inhibition mechanisms, thermodynamic
fluid models as well as the BP hydrate nucleation formation model in MultiflashTM. The validation study with
experimental data demonstrated the capabilities of the MultiflashTM thermodynamic models in providing
accurate predictions on hydrate formation and inhibition as well as the fluid phase behaviour.
Together with the accurate thermodynamic fluid model (Cubic Plus Association, CPA) for modelling the gas,
hydrocarbon liquid and aqueous phases, the gas hydrate models in MultiflashTM:
Can accurately predict at what condition the gas hydrate forms, and how much it form.
Can reliably predict what type of gas hydrates forms: Hydrate I, II or H as well as the complex
phase transitions among the fluid and hydrate phases.
Can predict not only the partitioning of the thermodynamic hydrate inhibitors among the fluid
phases but also the accurate prediction on hydrate inhibition. The hydrate inhibitors that can be
modelled by MultiflashTM include: Methanol, ethanol, MEG, DEG and TEG.
Can provide accurate calculation on the required inhibitor injection rates/dosages to suppress
the hydrate formation for drilling and/or production.
Has been extended to include a well-developed electrolyte model to model the effect of salts
on hydrate inhibition and the salts precipitation.
Is a fully integrated model that is readily imbedded in pipeline software, topside and a plant-
wide processing facilities simulation environment.

July 2016
34 of 35
KBC ADVANCED TECHNOLOGIES LTD
www.kbcat.com
Such a reliable and versatile flow assurance engineering tool enables reservoir, petroleum and process engineers to achieve the more detailed field planning activities such as:
Initial assessment of potential operational problem arising from hydrate formation.
Life of field study on inhibitor requirement and formulation of hydrate prevention strategies
If you are interested in further details on hydrate prediction and management strategies using MultiflashTM,
please feel free contact KBC at [email protected].