
How could Unethical corporate governance leads to Economical and social Downturn ?

Journal of Corporate Finance 11 (2005) 319ndash335
wwwelseviercomlocateeconbase
Managerial actions in response to a market
downturn valuation effects of name changes in the
dotcom decline
Michael J Coopera Ajay Khoranab Igor Osobova
Ajay Patelc P Raghavendra Raua
aDepartment of Finance Krannert School of Management Purdue University West Lafayette
IN 47907-2056 USAbCollege of Management Georgia Institute of Technology Atlanta GA 30332-0520 USA
cBabcock Graduate School of Management Wake Forest University Winston-Salem NC 27109 USA
Received 8 December 2003 accepted 4 February 2004
Available online 28 July 2004
Abstract
We investigate stock price reactions to Internet-related name changes in a market downturn In
contrast to the Internet boom period during which there was a surge of dotcom additions in the bust
period there is a dramatic reduction in the pace of dotcom additions accompanied by a rapid
increase in dotcom name deletions Following the Internet bcrashQ of mid-2000 investors react
positively to name changes for firms that remove dotcom from their name This dotcom deletion
effect produces cumulative abnormal returns on the order of 64 for the 60 days surrounding the
announcement day Our results add support to a growing body of literature that documents that
investors are potentially influenced by cosmetic effects and that managers rationally time corporate
actions to take advantage of these biases
D 2005 Elsevier BV All rights reserved
JEL classification G30 G14
Keywords Name changes Valuation effects Inefficient markets Internet firms Dotcom bubble
0929-1199$ -
doi101016j
Corresp
E-mail add
see front matter D 2005 Elsevier BV All rights reserved
jcorpfin200402005
onding author Tel +1 765 494 4448 fax +1 765 494 9658
ress raumgmtpurdueedu (PR Rau)
MJ Cooper et al Journal of Corporate Finance 11 (2005) 319ndash335320
1 Introduction
A growing body of literature argues that markets are inefficient and that investors in
financial markets do not always behave rationally In addition it argues that managers
understand these stock market inefficiencies and take advantage of them through
corporate actions Examples of such corporate actions include security issuance decisions
(Baker and Wurgler 2000 2002 Baker et al 2003) dividend issuance decisions (Baker
and Wurgler 2004) and mergers (Shleifer and Vishny 2003)1
However evidence in favor of managerial timing is limited almost entirely to periods
of positive investor sentiment For example the academic literature has argued that
initial public offerings (IPOs) of equity and seasoned equity (SEOs) financing decisions
are timed to take advantage of high market valuations2 or investor optimism about the
firmrsquos future3 Similarly Shleifer and Vishny (2003) argue that merger activity is driven by
stock market overvaluations and managersrsquo rational responses to these inefficiencies If
investors are irrational when the market rises we should also expect them to behave
irrationally in periods when the market declines Not finding evidence of similar
irrationality during market downturns would cast doubt on current models of investor
behavior in the behavioral finance literature since these models do not predict this type of
asymmetry
However testing investor irrationality and managerial timing in periods of negative
investor sentiment is not straightforward In periods of positive sentiment firms can
undertake positive actions such as equity issues to take advantage of investor sentiment In
periods of negative sentiment they can only choose not to initiate an equity issue while
repurchasing shares may be subject to cash constraints Dittmar (2000) documents that
share repurchase activity dropped to lows in the early 1980s and between 1989 and 1992
both periods coinciding with downturns in the economy Consequently tests of managerial
timing and investor irrationality during periods of negative investor sentiment are
contaminated by cash flow constraints
In this paper we study the valuation effects of cosmetic name changes in the Internet
sector before and after the end of the dotcom bbubbleQ in 2000 corporate actions that are
unlikely to be affected by cash flow constraints Specifically we examine a sample of 183
firms that added a dotcom and 67 firms that deleted a dotcom from their names in the
dotcom boom period (pre mid-2000) and in the dotcom bust period (post mid-2000)
We find evidence that managers reduce the number of dotcom additions and increase
the number of dotcom name deletions as sentiment in the Internet sector (as measured by
an Internet index) swings from very positive to extremely negative after the dramatic
decline in Internet valuations during 2000 Anecdotal evidence in the popular press is
2 See for example Loughran et al (1994) and Pagano et al (1998) for IPOs Marsh (1982) Asquith and
Mullins (1986) Korajczyk et al (1991) Jung et al (1996) and Hovakimian et al (2001) among others present
evidence for SEOs3 See Ritter (1991) Loughran and Ritter (1995) Brav and Gompers (1997) Rajan and Servaes (1997) and
Teoh et al (1998a) for IPOs See Speiss and Affleck-Graves (1995) and Teoh et al (1998b) among others for
SEOs
1 Similarly Graham and Harvey (2001) provide survey evidence that managers react to mispricing of their
firmsrsquo share prices
MJ Cooper et al Journal of Corporate Finance 11 (2005) 319ndash335 321
consistent with the notion that managers deliberately time firm name changes to exploit
investor sentiment For example according to Associated Press
4 M
shares)
and the
price ju
Low 25 C
Interne
order o
Now that dot-com fever has turned into a plague companies left and right are
changing their names to disassociate themselves with the stigma of failure Eden
Prairie-based IntraNet Solutions renamed itself Stellent Inc on Wednesday and
Internetcom became INT Media Group in May Industry officials say thriving dot-
coms are trying to avoid being lumped in with the rotting corpses of failed dot-
coms such as petscom gardencom furniturecom and livingcom bCompanies are
distancing themselves from that smellQ said Bridget Levin of Minneapolis-based
Nametag International Inc IntraNet Solutions said its name change was intended to
reflect its expanded business But Alan Meckler chairman and CEO of
Internetcom was more pointed bItrsquos window dressing for the financial
communityQ he said It retains its coveted Internetcom domain name bFor thosein the know our customers nothing ever changedQ (Associated Press News Wire
August 30 2001)4
We first examine whether the market reacts to dotcom deletions in the dotcom bust
period in the same way that they reacted to dotcom additions as documented by Cooper
et al (2001) (hereafter referred to as CDR)5 We find that the stock market reacts
positively to announcements of dotcom deletions after the Internet sector collapse of mid-
2000 Also consistent with CDR we find (on a new sample of dotcom additions relative
to the CDR sample) that the market continues to react positively to additions during the
last year of the Internet sectorrsquos dramatic price run up from 1999 to 2000 To put this name
change effect into perspective the average addition firm in our sample has a capitalization
of $365 million 5 days prior to the name change announcement For the 183 addition
firms the name change effect translates into a raw (market adjusted) total increase in
shareholder wealth of approximately $31 billion ($26 billion) Similarly for the 67 firms
in our deletion sample the total increase in shareholder wealth on a raw return basis
(market adjusted basis) is approximately $22 billion ($55 billion) Clearly the effect is
smaller for the deletions than for the additions but still appears to be economically
significant
We next examine whether these price reactions are related to the type of name
change Specifically we classify our sample into two types of name changes First we
observe instances where a firm merely adds to or drops a dotcom from its name As
an example Infospacecom changed its name to Infospace We refer to these name
changes as bminorQ name changes Second we observe instances where a firm not only
r Meckler always conscious of his firmrsquos stock price as a good CEO should be (he owns 53 of the
changed his firmrsquos name twice first by adding a dotcom (from Mecklermedia to Internetcom in 1998)
n later by deleting the dotcom (from Internetcom to INTMedia Group in April 2001) His firmrsquos stock
mped by 54 increasing from approximately $3 per share to $450 on the news of the deletion (Bryan-
001)
DR examine stock price reactions to the announcement of dotcom name additions during the run-up of
t firm stock prices from 1998 to 1999 The name change produces cumulative abnormal returns on the
f 74 for the 10 days surrounding the announcement day
MJ Cooper et al Journal of Corporate Finance 11 (2005) 319ndash335322
adds to or drops dotcom from its name but also changes its name altogether An
example of such a bmajorQ name change is USLabcom changing its name to Fly
Networks The cumulative abnormal returns following a major name change addition in
the Internet boom periods are significantly greater than the returns exhibited by firms
undertaking minor name change additions over the same period Similar return
differentials are observed for major versus minor name change deletions in the post-
2000 period
To examine whether the name change valuation effects are driven by the name change
signaling changing firm growth opportunities we explicitly classify our sample firms into
firms that do and do not change their business model concurrent with the name change
Out of our sample of 67 deletion firms only 7 appear to have changed their business
model from Internet to non-Internet suggesting that our results are not driven by changes
in the company investment and involvement in the Internet sector in the months
surrounding the announcement of the name change In fact these seven firms earn
statistically insignificant abnormal returns around the name change in contrast to firms
that do not change their business model and earn statistically significant 60-day abnormal
returns of 9799 (for non-Internet firms who remain non-Internet firms) and 4158 (for
Internet firms who remain Internet firms)
Reports of this kind of name change behavior on the glamour side are not new For
example Gordon (2001) reports evidence of name changes during the incredible growth in
stock prices for firms in the railroad and mining industries in the 1850s the automobile
industry in the 1910s airplane firms in the late 1920s the high-tech industry in the 1960s
bio-genetic firms in the 1980s In all these growth periods investors appeared extremely
interested in bgetting a piece of the actionQ often times at the expense of due diligence For
example during the airplane bcrazeQ investors rushed to purchase shares of Seaboard
Airlines which turned out to be a renamed railroad stock However the evidence of firms
systematically changing their names away from the out-of-favor industry and the
associated effects on shareholder wealth that we document is to the best of our
knowledge a new and previously undocumented effect
Our results suggest that managers do in fact attempt to time corporate events to take
advantage of both positive and negative investor sentiment Our evidence is not only
consistent with market irrationality it is consistent with the notion that managers rationally
take advantage of that irrationality Evidence in the prior literature (see for example Baker
et al 2003) cannot definitively distinguish between the hypothesis that managers
rationally time the market and the hypothesis that managers try in vain to time the market
Our evidence has broader implications for corporate finance in the sense that it supports
the view that there is another important dimension to managersrsquo decisions regarding
financial policies In other words managers consider not only what is boptimalQ in the
sense of traditional models but also what is the current market sentiment about that policy
In this way our findings complement those in the prior literature and imply that managers
may omit some actions that might otherwise appear to be optimal because the market
views them as negative
The remainder of the paper is organized as follows In Section 2 we discuss the data
sources and the methodology employed Section 3 discusses our empirical results and
Section 4 presents our conclusions
MJ Cooper et al Journal of Corporate Finance 11 (2005) 319ndash335 323
2 Data and methodology
Our sample consists of all publicly traded companies on the NYSE Amex Nasdaq and
the OTC Bulletin Board (OTCBB) that changed their names between January 1 1998 and
August 31 2001 For additions (deletions) the new (old) name has to be either a dotcom
name (eg Wareforcecom) a dotnet name (eg Docplusnet) or has to include the word
bInternetQ (eg Internet Solutions for Business) bwebQ (eg Homeweb) or bonlineQ (egOnline Hearing Dot Com) We refer to all these changes as dotcom name changes
Appendix A reports the sources we use to search for news announcements of dotcom
additions and deletions These sources include Bloomberg Dow Jones SEC filings and
various websites
In Table 1 we report the initial number of firms in the sample and the number
remaining after screening our sample for possible confounding events (such as mergers
acquisitions spinoffs or divestitures) in a 10- to +10-day window around the event date
uncertain event dates and a lack of data To control for potential problems due to
microstructure issues we also use a price filter to exclude firms that have a mean daily
price per share of under $050 in the 61-day event window surrounding the name change
announcement6 These screens result in a relatively clean initial sample of 67 deletions and
183 additions Because of the difficulty in obtaining exact announcement dates the
announcement day (day 0) is defined based on the first available information of the name
change which is either an announcement date or an effective trading date We use the
Amex Interctive Index as the relevant benchmark for price comparison7
To examine the effects of name changes on shareholder wealth as a function of positive
and negative investor sentiment we require an empirical proxy to measure the degree of
investor optimism and pessimism towards Internet stocks The level of the Amex
Interctive Index appears to be a good proxy for the level of sentiment or mispricing in
the Internet sector as it is highly correlated with sentiment proxies For example Baker
and Wurgler (2003) create an annual sentiment index orthogonalized to business cycles
composed of six variables including closed-end fund discounts turnover and number of
IPOs According to their index investor sentiment reached a decade-long high in 2000 and
then suffered a dramatic decline in 2001 closely following the dramatic run-up and
subsequent decline in Internet stock prices Thus their index suggests sentiment shifted
sometime during the year 2000 Since our name changes occur on a daily basis we require
a more specific shift-in-sentiment date From our Fig 1 while the Interctive Index first
peaked in FebruaryndashMarch 2000 and collapsed in AprilndashMay 2000 it recovered to another
(lower) peak in August 2000 before collapsing a second time till the end of the sample
period Thus while it appears to be straightforward to determine the annual break point in
sentiment it is not as straightforward to determine when sentiment in the Internet sector
peaked within the year 2000
6 After the price filter the average (median) price per share for the deletion sample over the 61 day event
window is $753 ($205)7 We compare this index with a number of other Internet indices such as the Bloomberg US Internet Index
the Streetcom Net Index and the DJ Internet Commerce Index All these indices are highly correlated
Table 1
Sample of name change additions and deletions
Additions Deletions
Initial number of firms in sample 432 164
Excluded due to mergers and acquisitions
spinoffs or divestitures in the 10 to +10 period
157 38
Excluded due to uncertain event date 25 14
Excluded due to data not available 45 15
Excluded due to price filter 22 30
Total number of remaining firms 183 67
First of either effective or
announcement dates
First of either effective or
announcement dates
Total remaining firms after all exclusions 183 67
Pre-February 2000 151 6
Post-February 2000 32 61
Major name change 168 45
Minor name change 15 22
This table describes the sample of companies that add or delete a dotcom from their names between June 1998
and August 2001 We report the initial number of firms in the sample and the number remaining after all
exclusions of firms Firms are deleted due to confounding events (including mergers acquisitions spinoffs or
divestitures) uncertain event dates lack of data and after using a price filter (firms that have a mean daily price-
per-share of under $050 in the 61-day event window surrounding the name change announcement are removed)
Because of the difficulty in obtaining exact announcement dates the announcement day (day 0) is defined as the
first available information on the name change whether from an announcement or effective trading day We also
report name change additions and deletions broken down into pre- and post-February 2000 periods and by major
or minor categories A bminorQ name change is one for which a firm merely adds or drops a dotcom from its
name A bmajorQ name change is one for which the firm not only adds or drops dotcom from its name but also
changes its name completely
MJ Cooper et al Journal of Corporate Finance 11 (2005) 319ndash335324
Consequently to separate our sample into periods of bhotQ versus bcoldQ markets (and
presumably positive and negative investor sentiment) we adopt a conservative approach
We report results using February 1 2000 as the earliest plausible cutoff date and we also
report results using September 1 2000 as an alternative cutoff date Finally since the number
of dotcom deletions peaks in April 2001 we report results for deletions after this date8
8 To further reinforce a link between sentiment and the level of the Internet index we obtain monthly sentimen
proxies from Jeff Wurgler These monthly variables are related to the annual sentiment variables used in Baker and
Wurgler (2003) The monthly sentiment proxies are the initial 1-day return on IPOs (IPORET) number of IPOs
(IPONUM) and the average of the daily dividend premium in a month (MDIVPREM) where the dividend premium
is the log of the average market to book of dividend payers divided by the average market to book of non-dividend
payers We estimate the average values of these three sentiment variables before and after the bhotQ and bcoldcutoff dates in our paper For the cutoff date of February 1 2000 all three variables exhibit marked differences in
positive and negative sentiment values pre-post-cutoff For example from the beginning of our sample in January
1998 to February 2000 IPORET IPONUM andMDIVPREM average 5145 3456 and041 respectively
numbers consistent with high levels of investor sentiment After the first bcrashQ of the Internet index in early 2000until the end of our sample the average sentiment decreased with the three variables averaging 3215 23 and
018 respectively After AugustSeptember 2000 the sentiment further decreased with averages of 1721
1058 and 010 respectively From the peak in dotcom deletions in April 2001 to the end of our sample the
sentiment remains low as the three variables average 1392 76 and 013 respectively
t
Q
Fig 1 Dotcom additions and deletions over time This figure plots the Interctive week Index level against the
number of firms that added or deleted a dotcom from their names over the 1998ndash2001 period
MJ Cooper et al Journal of Corporate Finance 11 (2005) 319ndash335 325
Stock prices (adjusted for stock splits) firm capitalization and other data for individual
firms are collected from Bloomberg We compute cumulative abnormal returns relative to
the Amex Interctive Index for event firms over various event windows as in Brown and
Warner (1985) T-statistics are calculated using the crude dependence method with a
holdout period t=30 to t=16
3 Results
31 The pattern in Internet name changes
Table 2 reports the distribution of name changes for both dotcom additions and
deletions The table shows that most additions occur when returns to the Internet sector are
increasing (Q1 1998 to Q2 2000) and the majority of deletions occur when returns to the
sector are decreasing (Q3 2000 to Q3 2001) One question that our figure raises is why the
volume of dotcom additions peaked in May 1999 while the index itself peaked for the
final time in August 2000 One possible explanation is that managers believed (and as it
turns out correctly) that the sector was overvalued and thus they consequently scaled back
on dotcom additions to their names Though we leave this an open question it is
interesting that our cycle of dotcom additions during the June 1998 to August 2000 period
corresponds closely with the volume of Internet IPOs during the same period as
documented by Schultz and Zaman (2001)
Table 2 also indicates that there are no dotcom deletions prior to Q2 1999 (the
peak in dotcom addition activity in our sample) As the Interctive Week Index
increases the level of additions increases In early to mid-2000 as the index levels
fall the volume of dotcom deletions increases as the volume of dotcom additions
Table 2
Occurrences and characteristics of name changes
Panel A Occurrences of announcement dates
Date Additions Deletions
All firms Major name
change
Minor name
change
All firms Major name
change
Minor name
change
Q1 1998 1 1 0 0 0 0
Q2 1998 2 2 0 0 0 0
Q3 1998 4 4 0 0 0 0
Q4 1998 6 6 0 0 0 0
Q1 1999 32 29 3 0 0 0
Q2 1999 44 40 4 0 0 0
Q3 1999 31 29 2 4 4 0
Q4 1999 24 20 4 1 1 0
Q1 2000 17 15 2 5 4 1
Q2 2000 12 12 0 6 5 1
Q3 2000 6 6 0 6 4 2
Q4 2000 1 1 0 11 8 3
Q1 2001 2 2 0 9 5 4
Q2 2001 1 1 0 17 10 7
Q3 2001 0 0 0 8 4 4
Panel B Time-series regression of the monthly number of name changes on lagged index returns and lagged
number of name changes
Lagged Interctive Week
Index 6-month return
Lagged number of
name changes
Adjusted R2
Additions All firms 3584 (381) 048 (276) 5057
Major name change 3337 (399) 048 (283) 5150
Minor name change 434 (231) 042 (085) 1680
Deletions All firms 1689 (222) 008 (020) 2778
Major name change 1091 (231) 073 (128) 1780
Minor name change 1174 (137) 006 (006) 553
Panel A contains the distribution of announcement dates over time and across firm category types for dotcom
additions and deletions A bminorQ name change is one for which a firm merely adds or drops a dotcom from its
name A bmajorQ name change is one for which the firm not only adds or drops a dotcom from its name but also
changes its name completely Panel B reports an OLS time-series regression of the monthly number of name
change firms on the 6-month average of the Interctive Week Index lagged 1 month and the 6-month average of
the number of name change firms lagged 1 month T-statistics are reported in parentheses T-statistics significant
at the 5 level are shown in bold
MJ Cooper et al Journal of Corporate Finance 11 (2005) 319ndash335326
declines Dotcom deletions peak in April 2001 Table 2 also indicates that dotcom
additions and deletions are primarily major name changes One hundred and thirty-six of
the 151 additions (90) in the pre-February 2000 period are major name changes while 39
of the 61 deletions (64) in the post-February 2000 period are major name changes
In Panel B of Table 2 we test whether the timing and type of name changes can be
predicted by investor sentiment as proxied by the Internet index and prior name change
activity Specifically for each type of name change (all additions and deletions and
combinations of major and minor name changes) we regress the monthly number of name
changes on the 6-month holding period return to the Interctive Week Index (lagged 1
MJ Cooper et al Journal of Corporate Finance 11 (2005) 319ndash335 327
month) and the 6-month moving average of the number of name changes (also lagged 1
month) in the same category as the dependent variable Using the entire data sample
(between January 1 1998 and August 31 2001) we find that the coefficient on the
lagged index return is positive and significant for the additions and negative and
significant for the deletions suggesting that managers time their name change activity
depending on the perceived positive (negative) sentiment levels of the market At least
for the additions sample the timing decision is also related to the prior level of name
changes as we see a positive and significant loading on the lagged number of name
changes For both additions and deletions the timing decision is more strongly linked to
the two lagged sentiment variables for major name changes (recall that major name
changes were defined as a firm not only adding or dropping a dotcom from its name but
also changing its name altogether) than for minor name changes To formally test
whether the coefficients on the lagged market and the lagged number of name changes
respectively are statistically different across major and minor name change categories
we estimate a seemingly unrelated regression (SUR) model for both additions and
deletions (not reported in the tables) Each SUR model estimates jointly two equations
where each equation is the same form as the OLS regressions in Panel B for the major
and minor name changes For both deletions and additions the results from the SUR
models strongly reject the equality of the coefficients on the lagged market and the
lagged number of previous name changes across major and minor name changes Wald
tests (similar results are obtained with Likelihood ratio tests and Lagrange multiplier
tests) reject the null of equal coefficients at a less than 1 significance level for both
additions and deletions
32 Value changes surrounding dotcom deletions
Table 3 reports cumulative abnormal returns (CARs) relative to the AMEX Interctive
Week Internet Index across various event windows for firms deleting a dotcom from their
name Panel A reports CARs across different event windows for the six firms deleting a
dotcom from their names over the pre-February 2000 period Not surprisingly we find no
evidence of a significant market reaction to this event during the bhotQ Internet period Incontrast after February 2000 the market reacts very positively to dotcom deletions For
example in Panel B of Table 3 the CAR over the 2 to +2 window is 126 and
statistically significant We see similar results over longer windows for the 30 to +30
period the CAR is 64 (t-statistic=312) for dotcom deletions The abnormal returns we
report are not an artifact of the decline in the index Specifically the cumulative raw
returns to post-February 2000 deletions are 475 (t-statistic=243) over the 30 to +30
period
February 2000 is the earliest plausible cutoff date in our sample based on the level of
the Interctive Index over the sample period However as discussed earlier it is not
entirely clear that all investors believed that the Internet sector had turned cold as of this
date We therefore examine the value changes to dotcom deletions using later cutoff dates
Consistent with the hypothesis that the level of negative sentiment strengthened over the
period firms earn higher returns when we use later cutoff dates In Panel C we report
CARs using a cutoff date of September 1 2000 The CAR over the 2 to +2 window is
MJ Cooper et al Journal of Corporate Finance 11 (2005) 319ndash335328
17 (t-statistic=293) Over the 30 to +30 period the CAR is 702 (t-statistic=347)
Dotcom deletions peak in April 2001 (see Fig 1) In Panel D we report CARs to dotcom
deletions after April 1 2001 Twenty-five firms delete the dotcom from their names in this
period Consistent with decreasing sentiment towards the Internet sector after mid-2000
the CAR over the 2 to +2 window increase to 334 (t-statistic=433) Over the 30 to
+30 period the CAR is 775 (t-statistic=287)910
We also compute abnormal returns using a control group of firms We calculate
CARs relative to a price-matched control group of firms selected from Internet firms
that did not change their name over the sample period Specifically we identify using
the Nasdaq OTCBB and AMEX websites Bloomberg company profiles and firm
websites all Internet firms that did not change their names over this period For each of
the 67 firms in our dotcom deletion sample we then match the closest firm in the
Internet non-name change sample on price over a two-week window around the event
date for the dotcom sample firm We refer to this control group as the bInternet controlgroupQ The abnormal return for each firm in our dotcom sample is then calculated as
the difference between the returns it earns and the returns earned by its price-matched
control firm (results not reported) Consistent with the CARs estimated using the AMEX
Interctive Week Internet Index we find no significant run up in prices for dotcom
deletions prior to February 2000 but large statistically significant CARs associated with
name change deletions after February 2000 For example CARs over the 0 to +1 period
and the 30 to +30 period are 106 (t-statistic=258) and 53 (t-statistic=232)
respectively11
10 Boehmer et al (1991) document that conventional t-statistics are misspecified when there is event induced
variance To check if we have event-induced variance in our sample we compute daily cross-sectional variances
to the abnormal returns over the 30- to +30-day window to see if there is a spike around day 0 or a sustained
increase following day 0 There does not seem to be a major shift in cross-sectional variance from the period we
use now to compute the t-statistics to any other window in the30- to +30-day period We also use three different
windows during the event period to compute the standard errors (30 to 11 10 to +10 and +11 to +30) Our
results are qualitatively similar
9 During the sample period the returns to the SampP 500 dominated the returns to any of the Internet indices
For example over the 18 months following February 2000 the SampP 500 declined by about 20 while the Amex
Interctive Index declined by about 60 A concern with our results might be that they are due to a survivorship
effectmdashin contrast with a declining Internet index any surviving firm might seem to earn significant abnormal
returns whether it is viewed as a dotcom firm or not We therefore reproduce our event study results using the
SampP 500 as our proxy for the market portfolio Our results are qualitatively unchanged though the magnitude of
the abnormal returns declines For example using the SampP 500 abnormal returns for dotcom deletion firms in
the 2- to +2-day window is 109 (in contrast to 126 using the Amex Interctive Index) This 17
difference in abnormal returns is consistent with the 18-month spread of 60 between the SampP 500 Index and the
Amex Interctive Index
11 We also carry out a number of robustness checks We examine returns to samples that exclude outliers on
the basis of the abnormal returns earned and on the basis of an bextra-cleanQ sample constructed so as to screen
out other confounding events (such as firms with new private investment news ticker changes changes in
exchange listings earnings announcements and changes in analyst ratings) in addition to our basic screens (that
exclude firms with mergers and acquisitions financing news and divestitures) We compute market model returns
instead of market-adjusted returns to examine if inadequate controls for risk drive our results Finally we compute
capitalization weighted abnormal returns to examine if microstructure effects drive our results Our results are
qualitatively similar when we use these alternative methodologies
Table 3
Abnormal returns to name change deletions
Panel A Deletions pre-February 2000
15 to 2 0 to 1 2 to +2 +2 to +15 +1 to +30 30 to +30
All (N=6) 36 (019) 68 (095) 132 (117) 253 (133) 317 (114) 106 (027)
Panel B Deletions post-February 2000
15 to 2 0 to 1 2 to +2 +2 to +15 +1 to +30 30 to +30
All (N=61) 224 (228) 83 (224) 126 (214) 33 (033) 236 (164) 640 (312)
Major (N=39) 317 (199) 138 (229) 167 (175) 64 (040) 285 (122) 889 (266)
Minor (N=22) 108 (134) 02 (008) 66 (137) 12 (014) 167 (142) 310 (185)
Test of differences
(one-sided)
006 005 017 022 021 001
Panel C Deletions post-September 2000
15 to 2 0 to 1 2 to +2 +2 to +15 +1 to +30 30 to +30
All (N=48) 216 (223) 102 (279) 170 (293) 95 (098) 285 (201) 702 (347)
Panel D Deletions post-April 2001
15 to 2 0 to 1 2 to +2 +2 to +15 +1 to +30 30 to +30
All (N=25) 265 (205) 197 (402) 334 (433) 100 (078) 394 (208) 775 (287)
This table reports market-adjusted cumulative abnormal returns expressed in percent relative to the AMEX
Interctive Week Internet index In Panels A through D we report CARs for dotcom name change deletions at
different points of time Each cell reports the average CAR across all firms for the respective event windows
T-statistics are reported in parentheses T-statistics significant at the 5 level are bolded We report p-values for
tests of the null hypothesis of equality of means across major and minor name changes A bminorQ name change is
one for which a firm merely adds or drops a dotcom from its name A bmajorQ name change is one for which the
firm not only adds or drops dotcom from its name but also changes its name completely
MJ Cooper et al Journal of Corporate Finance 11 (2005) 319ndash335 329
33 Does the type of deletion matter
We dichotomize our sample of additions and deletions into major and minor name
changes As discussed previously the decline (increase) in the AMEX Interctive Week
Internet Index in the post-February (pre-February) 2000 period is larger when firms make
major name changes through dotcom deletions (additions) relative to when they engage in
minor name changes Since these major name-change deletions result in dramatically
different ticker symbols in most instances it is possible that investors view the firm with a
major name change as a potentially bnew firmQ that is not associated with the Internet
sector In contrast the ticker symbol does not change or changes only marginally for
minor name changes12 If investors are less likely to be deceived into believing that this is
a new firm we expect the cumulative abnormal return for these firms to be less positive
than that for a major name change
The results in Table 3 are consistent with our conjecture For major name change
deletions in the post-February 2000 period the 0 to +1 event window CAR in Panel B
12 For example perfumaniacom (ticker PF) changed its name to Envision Development (ticker EDV) This
major name change deletion results in a dramatically different ticker symbol In contrast click2learncom (ticker
CLKS) changing to click2learn Inc leaves the ticker symbol unchanged
MJ Cooper et al Journal of Corporate Finance 11 (2005) 319ndash335330
is a significantly positive 138 and the corresponding CAR for minor name changes is an
insignificant 02 Across all event windows in Panel B major name change firms
consistently earn greater CARs than do minor name change firms There is a statistically
significant difference in the CARs between major and minor categories for the 30 to +30
window and for the 0 to +1 window The remaining windows although having point
estimates in the correct direction are not significantly different across the two types of
name changes For the later cutoff dates in Panels C and D we find that the abnormal return
point estimates for major name changes are always greater than for minor name changes
(not reported in the tables) In addition for Panel C (D) the major name change returns are
statistically greater than the minor changes in 3 (5) of the event windows We find
qualitatively similar returns based on control-group adjusted returns
34 Changing growth opportunities
One explanation for the dramatic abnormal returns that we document to dotcom
deletions is a growth opportunity story As investor perception of growth opportunities in
the Internet sector increased in the 1997ndash1999 period more firms entered the sector and
changed their names accordingly As growth opportunities faded after mid-2000 firms
exited the industry and again changed their names accordingly If the name change
suggests a change in the business model of the firm this might be a signal for investors of
potential cash flow changes in the firm Our elimination of confounding events in the 10-
to +10-day period may not capture this effect13
We examine the growth opportunity hypothesis in more detail by examining the extent
to which the sample firms are indeed Internet firms (before and after the name change) and
how much of the firmrsquos business is derived from the Internet In the 2-month period around
the name change we use company news releases company home pages published
company profiles SEC filings and other contemporaneous news releases to select any
firms in our sample that identify a change in strategic focus as one of the reasons for the
name change We classify our firms into two major categories of bInternetQ or bnon-InternetQ firms We then subdivide the abnormal returns into four groups based on a firmrsquos
pre- and post-business category Thus we examine returns across bInternet to InternetQbInternet to non-InternetQ bnon-Internet to InternetQ and bnon-Internet to non-InternetQclassifications For example on April 25 2001 ZapWorldcom announced a name change
to Zap Before and after the name change the firmrsquos underlying business model does not
appear to change the firm is primarily engaged in making electric bicycle power kits
electric bicycles and tricycles as well as electric scooters and motorcycles Thus we
classify this firm as bnon-Internet to non-InternetQ The Dow Jones News Service had this
to say about Zaprsquos name change
The board (of Zap) noted that because of recent developments with Internet
companies and the need to have a corporate name thatrsquos more closely associated
with the products it sells its in the best interest of shareholders to disassociate from
13 Note however that the name change is essentially cheap talk Hence it would be costless for any firm that
did not wish to change its business model to change its name and imitate a firm that did wish to change its
business model
MJ Cooper et al Journal of Corporate Finance 11 (2005) 319ndash335 331
bdotcomQ companies in view of the negative image that people may have for these
companies (Dow Jones News Service April 25 2001)
This type of statement appears to be typical for the bnon-Internet to non-InternetQ name
changes the firms were apparently all too eager to be perceived as an Internet company
while dotcom market valuations were rapidly increasing but not willing to be associated
with the Internet sector once it became perceived as btoxicQ In our sample of dotcom
deletions we have 33 bInternet to InternetQ 24 bnon-Internet to non-InternetQ and 6
bInternet to non-InternetQ firms (we were not able to classify four of the firms) In addition
there were no occurrences of bnon-Internet to InternetQ dotcom deletions
Recalling that all of these firms started out with a dotcom suffix on their name before the
deletion it is interesting to speculate on how the market should react to different categories
of name change firms and whether or not the reaction is brationalQ We might expect that if
investors are informationally constrained on the actual operating practices of some of these
firms (which may be the case since these are relatively small firms with little analyst
coverage) then we would see a positive abnormal return to firms whose core business was
and is still not Internet related before and after the name change For these bnon-internet tonon-internetQ firms the cosmetic name change may serve as a piece of salient news simply
bringing these firms back to investorsrsquo attention This would be consistent with Klibanoff et
al (1998) who find that the stock price reaction to closed-end country mutual funds is
higher when salient news on the country is reported on the front page of the New York
Times Thus positive abnormal returns to bnon-Internet to non-InternetQ firms would be
consistent with a rational investor response if investors are informationally constrained
However note that a positive abnormal return after the dotcom deletion may imply that the
market wrongly believed that the firm was an Internet company prior to the name change
Next consider bInternet to InternetQ name changes If these cosmetic name changes bring
previously obscured valid information about the firm to the attention of investors (if
investors are informationally constrained on these firms before the name changes) we might
expect zero abnormal returns or even negative returns as the market learns that these firms
are truly Internet firms However if the dotcom deletion succeeds in deceiving investors
into believing that the firm is no longer a dotcom firm resulting in positive abnormal
returns this would not appear to be consistent with rational investor behavior Finally for
bInternet to non-InternetQ name changes (which may be the only name changes that are non-
cosmetic in the sense that they may signal a potential change in the cash flows) it is not clear
whether a positive or negative abnormal return can be attributed to any degree of investor
irrationality it may simply be the case that if investors are informationally constrained and
the name change serves to illuminate a companyrsquos underlying change in cash flows that
positive (negative) abnormal returns would be associated with investorsrsquo evaluating the net
present values of future cash flows to the new business model as positive (negative)
When we separate the deletions into the above categories we see no evidence of
significant abnormal returns prior to February 2000 Post-February 2000 the 23 bnon-Internet to non-InternetQ firms earn 9799 (t-statistic=292) the 7 bInternet to non-
InternetQ firms earn statistically insignificant returns and the 30 bInternet to InternetQ firms
earn 416 (t-statistic=179) over the 60-day window surrounding the event For the
alternative cutoff date of September 2000 the 17 bnon-Internet to non-InternetQ firms earn
MJ Cooper et al Journal of Corporate Finance 11 (2005) 319ndash335332
983 (t-statistic=441) the 6 bInternet to non-InternetQ firms earn statistically insignificant
returns and the 24 bInternet to InternetQ firms earn 498 (t-statistic=225) over the 60-day
window surrounding the event Thus as discussed above the positive return results for the
bnon-Internet to non-InternetQ firms may be consistent with investor rationality if investors
are informationally constrained (although it is still a gross violation of semistrong market
efficiency) and the results to the bInternet to non-internetQ do not provide us with a clean
test of rationality However the bInternet to InternetQ results show that investors are
deceived by Internet firms attempting to look like non-internet firms thus suggesting some
degree of investor irrationality
35 Out-of-sample abnormal returns for name change additions
Finally we test whether the results for dotcom additions obtained by CDR persist in an
out-of-sample period We indeed find that the market reacts favorably to name change
additions using a hold-out period from the CDR paper Specifically we analyze a sample of
43 firms that add a dotcom to their names in the period from August 1999 to February
able 4
ut-of-sample abnormal returns for name change additions
anel A Additions January 1998ndashAugust 1999
15 to 2 0 to 1 2 to +2 +2 to +15 +1 to +30 30 to +30
ll (N=108) 580 (912) 65 (273) 144 (378) 195 (307) 321 (345) 1186 (894)
ajor (N=100) 632 (923) 71 (272) 159 (389) 192 (281) 328 (327) 1257 (880)
inor (N=8) 185 (143) 21 (043) 23 (029) 235 (181) 265 (139) 630 (233)
est of differences 001 002 003 037 039 001
anel B Additions August 1999ndashFebruary 2000
15 to 2 0 to 1 2 to +2 +2 to +15 +1 to +30 30 to +30
ll (N=43) 364 (253) 77 (142) 229 (266) 298 (207) 318 (151) 1018 (338)
ajor (N=36) 371 (205) 82 (120) 260 (241) 366 (202) 356 (134) 1088 (288)
inor (N=7) 328 (215) 54 (094) 105 (114) 18 (012) 154 (069) 687 (215)
est of differences 044 041 012 007 025 024
anel C Additions post-February 2000
15 to 2 0 to 1 2 to +2 +2 to +15 +1 to +30 30 to +30
ll (N=32) 318 (154) 243 (312) 395 (321) 177 (086) 307 (102) 704 (163)
anel D Additions Post-September 2000
15 to 2 0 to 1 2 to +2 +2 to +15 +1 to +30 30 to +30
ll (N=5) 128 (032) 77 (051) 105 (044) 225 (056) 109 (019) 407 (049)
his table reports market-adjusted cumulative abnormal returns expressed in percent relative to the AMEX
terctive Week Internet index Panel A reproduces the results for the time period analyzed by Cooper et al
001) In Panels B through D we report various event window CARs for dotcom additions from the subsequent
me periods Each cell reports the average CAR across all firms for the respective event windows T-statistics are
ported in parentheses T-statistics significant at the 5 level are shown in bold We report p-values for tests of
e null hypothesis of equality of means across major and minor name changes A bminorQ name change is one for
hich a firm merely adds or drops a dotcom from its name A bmajorQ name change is one for which the firm not
nly adds or drops dotcom from its name but also changes its name completely
T
O
P
A
M
M
T
P
A
M
M
T
P
A
P
A
T
In
(2
ti
re
th
w
o
MJ Cooper et al Journal of Corporate Finance 11 (2005) 319ndash335 333
2000 Table 4 reports cumulative abnormal returns for these firms Panel A duplicates the
CDR results in the pre-August 1999 period Our sample is larger than theirs though our
results are qualitatively similar Panel B reports results for the post-CDR period from
August 1999 to February 2000 Similar to our results in Panel A and to CDR firms adding a
dotcom to their names in this period earn significant positive cumulative abnormal returns
over all event windows
Panel C reports CARs for dotcom additions during the post-February 2000 period
Consistent with the hypothesis that investor sentiment slowly changed over the Februaryndash
September period firms announcing dotcom additions over this period continued to earn
significant positive abnormal returns in the period around the announcement Finally
Panel D reports CARs for dotcom additions in the post-September 2000 periods We can
identify only five firms of this type and all these firms undertook major name changes
Unlike the results for the pre-February 2000 period we find no statistically significant
price reaction to the announcement of a dotcom addition over any of the event windows
We repeat our classification of dotcom additions into major vs minor name changes and
report the results in Table 4 In the January 1998 to August 1999 period (Panel A) the major
name change firms earn statistically greater returns than the minor name change firms in
four out of the six event windows In the August 1999ndashFebruary 2000 period (Panel B) we
observe the same pattern but with less statistical significance across majorminor name
changes For example abnormal returns following a major name change addition average a
significantly positive 260 over the2 to +2 event window The corresponding CAR for a
minor name change is an insignificant 105 The differences across major and minor
additions are not significant over any of the pre-event windows but are significant over the
+2- to +15-day window For the entire 61-day window surrounding the announcement date
the point estimates are consistent (major name changes earn approximately 40 more than
minor) but the difference is not statistically significant
4 Conclusions
In this paper we examine the valuation effects of a dotcom name change a natural
experiment to test investor rationality in a period of negative market sentiment We find
that firms that change their name to a dotcom name during the pre-February 2000 Internet
boom period and firms that remove the dotcom from their name during the post-February
2000 Internet bust period experience large gains in shareholder wealth associated with the
name change
This name change does not appear to signal a change in growth opportunities for the
firm Firms classified as Internet companies both before and after the name change
announcement experience large increases in shareholder wealth simply by removing
dotcom from their names Moreover the gains in shareholder wealth are greater for major
name changes than for minor changes suggesting that the investors are deceived by
companies seeking to be disassociated from their past in order to appear to be more (less)
like the current glamour (out-of-favor) industry
Our paper thus contributes to the literature by providing evidence of investor
irrationality in periods of negative sentiment in a manner consistent with results from
MJ Cooper et al Journal of Corporate Finance 11 (2005) 319ndash335334
periods of positive investor sentiment in the Internet sector Our results suggest that there
is another important dimension to managersrsquo decisions regarding financial policies in that
they consider not only what is boptimalQ in the sense of traditional models but also what is
the current market sentiment about that policy
Acknowledgements
We would like to thank John Banko Mike Cliff Dave Denis Diane Denis John
McConnell Jeff Netter (the editor) Todd Pulvino Jeff Wurgler an anonymous referee and
seminar participants at the University of Illinois 2002 FMA meetings 2002 FMA
European meetings and the 2002 Northwestern conference on Risk Perceptions and
Capital Markets for helpful comments
Appendix A
This appendix reports the data sources used in the paper
Nasdaq OTC Board wwwotcbbcom
Nasdaq listings wwwnasdaqtradercom
AMEX listings wwwamextradercom
Company profiles Bloomberg Dow Jones Publications Library
Company news Dow Jones Publications Library Bloomberg
Stock splits Bloomberg
SEC filings wwwfreeedgarcom wwwsecgovedgarhphtm
Historical prices Bloomberg
Market capitalization Bloomberg DataStream
Volume bid ask spreads Bloomberg
References
Asquith P Mullins DW 1986 Equity issues and offering dilution Journal of Financial Economics 15 61ndash89
Baker M Wurgler J 2000 The equity share in new issues and aggregate stock returns Journal of Finance 55
2219ndash2257
Baker M Wurgler J 2002 Market timing and capital structure Journal of Finance 57 1ndash32
Baker M Wurgler J 2004 A catering theory of dividends Journal of Finance 59 1125ndash1165
Baker M Wurgler J 2003 Investor sentiment and the cross-section of stock returns working paper NYU
Baker M Greenwood R Wurgler J 2003 The maturity of debt issues and predictable variation in bond
returns Journal of Financial Economics 70 261ndash291
Boehmer E Musumeci J Poulsen AB 1991 Event study methodology under conditions of event-induced
variance Journal of Financial Economics 30 253ndash272
Brav A Gompers PA 1997 Myth or reality The long-run underperformance of initial public offerings
evidence from venture capital and nonventure capital-backed companies Journal of Finance 52 1791ndash1822
Brown SJ Warner JB 1985 Using daily stock returns the case of event studies Journal of Financial
Economics 14 3ndash31
Bryan-Low C 2001 By any other name a dot-com would be sweeter to investors Wall Street Journal B1
(April 18)
Cooper MJ Dimitrov O Rau RP 2001 A rosecom by any other name Journal of Finance 56 2371ndash2388
Dittmar A 2000 Why do firms repurchase stock Journal of Business 73 321ndash355
MJ Cooper et al Journal of Corporate Finance 11 (2005) 319ndash335 335
Gordon JS 2001 The Business of America Walker Publishing New York
Graham JR Harvey CR 2001 The theory and practice of corporate governance evidence from the field
Journal of Financial Economics 60 187ndash244
Hovakimian A Opler T Titman S 2001 The debt-equity choice Journal of Financial and Quantitative
Analysis 36 1ndash24
Jung K Kim Y-C Stulz RM 1996 Timing investment opportunities managerial discretion and the security
issue decision Journal of Financial Economics 42 159ndash185
Klibanoff P Lamont O Wizman TA 1998 Investor reaction to salient news in closed-end country funds
Journal of Finance 53 673ndash699
Korajczyk R Lucas D McDonald R 1991 The effects of information releases on the pricing and timing of
equity issues Review of Financial Studies 4 685ndash708
Loughran T Ritter JR 1995 The new issues puzzle Journal of Finance 50 23ndash51
Loughran T Ritter JR Rydqvist K 1994 Initial public offerings international insights Pacific-Basin
Finance Journal 2 1823ndash1850
Marsh P 1982 The choice between equity and debt an empirical study Journal of Finance 37 121ndash144
Pagano M Panetta F Zingales L 1998 Why do companies go public An empirical analysis Journal of
Finance 53 27ndash64
Rajan RG Servaes H 1997 Analyst following of initial public offerings Journal of Finance 52 507ndash529
Ritter JR 1991 The long-run performance of initial public offerings Journal of Finance 42 365ndash394
Schultz P Zaman M 2001 Do the individuals closest to Internet firms believe they are overvalued Journal of
Financial Economics 59 347ndash381
Shleifer A Vishny RW 2003 Stock market driven acquisitions Journal of Financial Economics 70 295ndash311
Speiss DK Affleck-Graves J 1995 Underperformance in long-run stock returns following seasoned equity
offerings Journal of Financial Economics 38 243ndash267
Teoh SH Welch I Wong TJ 1998a Earnings management and the long-run market performance of initial
public offerings Journal of Finance 50 1935ndash1974
Teoh SH Welch I Wong TJ 1998b Earnings management and the underperformance of seasoned equity
offerings Journal of Financial Economics 50 63ndash99
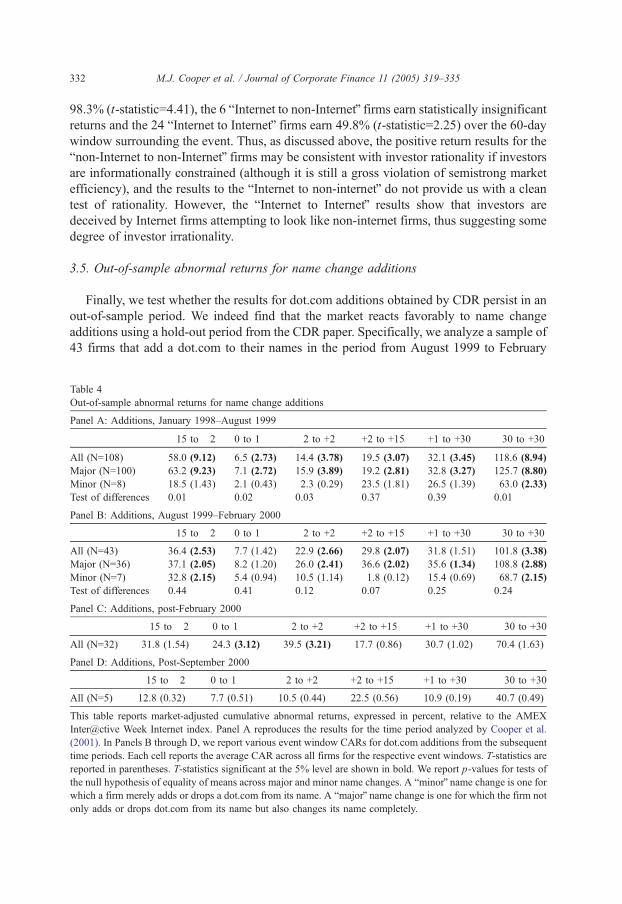
Copyright © 2022 FDOKUMEN