Managerial Moral Hazard and Bond Covenants
57
Electronic copy available at: http://ssrn.com/abstract=611801 Managerial Moral Hazard and Bond Covenants 1 by Sudheer Chava, Praveen Kumar, and Arthur Warga 2 May 26, 2007 1 We thank an anonymous referee for very helpful comments. We also thank Michael Bradley, Martin Dierker, Yaniv Grinstein, Jean Helwege, Kose John, Dmitry Livdan, Milton Harris, Roni Michaely, Amiy- atosh Purnanandam, Latha Ramchand, Michael Roberts, Steve Ross, Matt Spiegel, Sheridan Titman, Stuart Turnbull, and Toni Whited for helpful comments or discussions and Andrew Metrick for providing us the G-index data. We especially thank Annette Poulsen for detailed comments at the WFA (2005) Meetings in Portland. All remaining shortcomings are our responsibility. 2 Chava is from the Mays School of Business, Texas A&M University; email: [email protected]. Ku- mar and Warga are from the C.T. Bauer College of Business, University of Houston; emails: [email protected] and [email protected].
-
Upload
independent -
Category
Documents
-
view
1 -
download
0
Transcript of Managerial Moral Hazard and Bond Covenants
Electronic copy available at: http://ssrn.com/abstract=611801
Managerial Moral Hazard and Bond Covenants1
by
Sudheer Chava, Praveen Kumar, and Arthur Warga2
May 26, 2007
1We thank an anonymous referee for very helpful comments. We also thank Michael Bradley, MartinDierker, Yaniv Grinstein, Jean Helwege, Kose John, Dmitry Livdan, Milton Harris, Roni Michaely, Amiy-atosh Purnanandam, Latha Ramchand, Michael Roberts, Steve Ross, Matt Spiegel, Sheridan Titman, StuartTurnbull, and Toni Whited for helpful comments or discussions and Andrew Metrick for providing us theG-index data. We especially thank Annette Poulsen for detailed comments at the WFA (2005) Meetings inPortland. All remaining shortcomings are our responsibility.
2Chava is from the Mays School of Business, Texas A&M University; email: [email protected]. Ku-mar and Warga are from the C.T. Bauer College of Business, University of Houston; emails: [email protected] [email protected].
Electronic copy available at: http://ssrn.com/abstract=611801
Abstract
Based on an analysis of the agency risk for bondholders from managerial entrenchment and fraud,
and using an e¢ cient contracting framework, we derive and test refutable hypotheses about the
in�uence of managerial moral hazard on the use of bond covenants. Entrenched managers can both
exacerbate and ameliorate bondholder agency risk, and the in�uence of fraud risk on bond covenants
is determined by the quality of information on the �rms�net assets and economic prospects. Our
empirical analysis indicates that managerial entrenchment and the risk of managerial fraud signif-
icantly in�uence the use of covenants, in the direction predicted by our agency-theoretic analysis.
Moreover, the use of covenants responds to cross-sectional variations in the �rms� informational
environment that in�uence the risk of managerial fraud. We also �nd that the Sarbanes-Oxley Act
(SOX) has not signi�cantly in�uenced the overall use of bond covenants; however, the passage of
SOX appears to have reduced the agency risk to bondholders from managerial moral hazard with
respect to investment.
Keywords : Managerial entrenchment, Fraud, Bond covenants, Contracting e¢ ciency
JEL classi�cation codes: G32, G34, D82
1 Introduction
One of the most important, and interesting, implications of the agency cost or �nexus of contracts�
view of the �rm [Jensen and Meckling (1976)] is that corporate bond covenants reduce the cost
of debt. By reducing the discretion of shareholders and managers ex post, and ameliorating the
agency risk faced by bondholders, covenants reduce the cost of debt ex ante. For example, Smith
and Warner (1979, page 121) note that while bond covenants restrict �exibility, they can increase
the value of the �rm at the time bonds are issued by, �. . . reducing the opportunity loss which
results when stockholders of a levered �rm follow a policy which does not maximize the value of
the �rm.�
However, the literature almost exclusively focuses on agency risks faced by bondholders due to
con�icts of interests between equity- and debt-holders. This focus assumes that managers pursue
stockholders�interests in maximizing shareholder value. But the �nance literature has long empha-
sized shareholder-manager con�icts because of the separation between ownership and control by
self-interested managers [Berle and Means (1932)]; the recent spate of corporate scandals, involving
prominent cases of top-management malfeasance, have only intensi�ed this concern.
A substantial body of corporate �nance research examines the mechanisms through which man-
agers entrench themselves [e.g., Stulz (1988) and Shleifer and Vishny (1989)] to pursue policies
� such as, the misuse of free cash �ows for �empire building�[Jensen (1986, 1993), Stulz (1990)
and Hart (1995)] � that do not maximize shareholder value. Moreover, the recent cases of top-
management malfeasance, ranging from seemingly excessive executive compensation awards [e.g.,
Computer Associates, NYSE, and Home Depot] to executive self-dealing and accounting frauds
[e.g., Enron, Tyco, Worldcom], have emphasized the risk to investors of managerial fraud abetted
by overly-optimistic representations of �nancial performance and economic prospects.
In this paper, we analyze the agency risk for bondholders from managerial entrenchment and
fraud. We then formulate and empirically test refutable hypotheses regarding the e¤ects of man-
agerial moral hazard on the inclusion (or exclusion) of the major types of bond covenants. Our
empirical analysis indicates that managerial moral hazard plays a signi�cant and multi-faceted role
on the use of bond covenants and, more generally, on the agency risk for bondholders.
We �rst extend the entrenchment literature to examine the e¤ects of managerial entrenchment
on the agency risk faced by bondholders � as opposed to equity-holders. Importantly, manager-
ial entrenchment does not always increase bondholder risk. This is because entrenched managers
1
sometimes bene�t the bondholders by opposing the interests of shareholders, especially in situa-
tions where bondholder and shareholder interests are in con�ict. For example, entrenchment may
aggravate bondholder risk from the �asset substitution�e¤ect [Jensen and Meckling (1976)], espe-
cially if the �rm has access to risky growth options. But the interests of entrenched managers may
be aligned with bondholders in resisting change of control through takeovers, in contravention of
shareholders�preferences. Our analysis serves to separate situations where entrenched managers
threaten versus support bondholder interests.
In a related vein, the actual risk of managerial fraud for bondholders depends on the quality
of information that is available on the �rm�s performance and prospects. This information quality
is determined partly by the transparency of the �nancial statements (which can be controlled by
insiders) and partly by the regulatory environment.
To derive testable hypotheses on the relationship between managerial moral hazard and the
use of various types of bond covenants, we appeal to the contractual e¢ ciency hypothesis (CEH),
which implies that bond covenants will be included to minimize the sum of agency and (reduced)
operational �exibility costs [see, Smith and Warner (1979)]. Thus, the likelihood of covenant inclu-
sion depends on the intensity of the agency risk to bondholders from shareholders and managerial
moral hazard. We carefully parse factors that determine the intensity of bondholder agency risk in
relation to the four major types of covenants, namely, restrictions on investments, dividend payouts,
subsequent �nancing, and �rm behavior during speci�c events such as when the �rm is a takeover
target.
Our empirical test design builds on the emerging empirical literature on entrenchment [e.g.,
Berger et al. (1997) and Hu and Kumar (2004)] that posits a number of empirical proxies � based
on executive compensation and the strength of internal governance mechanisms � for the extent
of managerial entrenchment. However, there is a signi�cant correlation amongst theses proxies,
and their latent interaction can be problematic for empirical test design. We therefore develop an
entrenchment measure based on principal components analysis. Moreover, to address the risk of
managerial fraud, we examine the impact of the �rms�information environment on the utilization
of bond covenants. We do so by analyzing the in�uence of the Sarbanes-Oxley Act (SOX) of 2002,
the transparency of the �rms��nancial statements, and the dispersion in analysts�forecasts. Our
analysis is based on all corporate bonds issued during 1993-2005,1 and contains information on
1We focus attention on this period because our analysis requires information on executive compensation and CEOcharacteristics through S&P�s Execucomp.
2
over 54 covenants.
The principal result of our empirical analysis is that managerial moral hazard has a signi�cant
in�uence on the use of bond covenants. We �nd that managerial entrenchment and the risk of
managerial fraud signi�cantly in�uence the use of covenants, in the direction predicted by the
CEH. That is, corporate bond contracts are contractually e¢ cient in the use of the various types of
covenants by taking into account factors that aggravate or ameliorate the agency risk to bondholders
from managerial moral hazard.
Managerial entrenchment signi�cantly increases the use of investment-related covenants, espe-
cially for high growth option �rms. Moreover, the use of investment restrictions responds to factors
that increase managers� incentives for adopting risky investments and aggressive debt �nancing
policy; for example, in high-growth option �rms, the use of investment restrictions is positively as-
sociated with the sensitivity of the CEO�s wealth with respect to stock price volatility (vega). On
the other hand, �rms with entrenched management are signi�cantly less likely to use restrictions
on dividend payouts and the behavior of the �rm when it is a takeover target. Both individual
entrenchment proxies and the composite entrenchment measure load signi�cantly on the likelihood
of using covenants.
Consistent with our predictions, the use of covenants responds to cross-sectional variations in
the �rms� informational environment that in�uence the risk of managerial fraud. We �nd that
higher �nancial transparency, by reducing the fog around the �rm�s assets in hand, reduces the use
of dividend payout covenants. In addition, the dispersion of analysts�earnings forecasts � being
forward-looking and being correlated with uncertainty of economic prospects � increases the use
of investment-related covenants. Interestingly, the passage of SOX has not signi�cantly in�uenced
the use of covenants; however, it appears to have reduced the agency risk to bondholders from
managerial moral hazard with respect to investment.
Our analysis makes several contributions. We are among the �rst to examine the e¤ect of
managerial entrenchment and fraud on the agency risk faced by bondholders; to emphasize that
entrenched managers can both exacerbate and ameliorate this risk; to empirically measure the risk
of managerial fraud through cross-sectional and time-series variations in the �rm�s information
environment; and, overall, to empirically test the e¤ect of managerial moral hazard on bondholder
agency risk through the observed usage patterns of corporate bond covenants.
Our results add to the literature that studies the design and use of bond covenants. Among other
3
factors, this literature emphasizes �rm size and capital structure [e.g., Malitz (1986) and Begley
(1994)] and growth options [e.g., Nash et al. (2003) and Bradley and Roberts (2003)] as in�uencing
the use of bond covenants. But we �nd that factors associated with managerial entrenchment �
such as, the length of the CEO�s tenure, the CEO�s compensation structure and share ownership,
and the presence of large shareholders � and the risk of managerial fraud � such as, the �rm�s
�nancial transparency and uncertainty about its investment prospects � play a signi�cant role in
the use of bond covenants, even when we control for the factors identi�ed in the literature. These
results substantially expand the rather limited literature on the in�uence of managerial moral
hazard on bond covenants [e.g., Begley and Feltham (1999)].2 Moreover, our results point to a
multi-faceted interaction between managerial moral hazard and bondholder agency risk; they also
highlight the heterogeneity that underlies the use of di¤erent types of bond covenants.
Our analysis therefore has interesting implications for the long-standing literature that examines
bondholder-shareholder con�icts [e.g., Jensen and Meckling (1976) and Myers (1977)], and ways
to mitigate such con�icts [e.g. Green (1984)]. This literature emphasizes problems with respect
to claim dilution, excessive dividend payouts (with liquidating dividends as an extreme case), and
asset substitution. However, the intervening role of entrenched management in ameliorating these
problems � for example, the dividend payout risk and the leveraged takeover risk � or exacerbating
them � for example, asset substitution risk � is rarely considered. The evidence presented in this
paper on the use of bond covenants suggests that bondholders take into account the in�uence
of entrenched management on their overall agency risk. Moreover, an important area for future
research is to examine the implications of the common interests of bondholders and shareholders
in reducing the risk of managerial fraud.
Our results also add to the emerging literature on the role of managerial entrenchment on cor-
porate investment and �nancial policies. For example, Berger et al (1997) �nd that entrenchment
in�uences the choice of �rms�capital structure, and Hu and Kumar (2004) show that entrench-
ment is a signi�cant factor in the determination of �rms�payout policy. Our results here indicate
that managerial entrenchment is also a signi�cant factor in the design and use of bond covenants.
However, and unlike the shareholder-manager con�ict, where entrenchment unambiguously hurts
shareholder interests, managerial entrenchment can support bondholder interests in certain situa-
2Begley and Feltham (1999) examine the e¤ect of managerial opportunism on the inclusion of restrictions ondividend payouts and subsequent �nancing on a sample of 91 non-convertible debentures issued between 1975 and1979. Their analysis indicates that managerial share-ownership has a signi�cant e¤ect on the inclusion of thesecovenants.
4
tions. Moreover, our construction of a composite managerial entrenchment measure is novel and
will be useful in further empirical research on this issue.
Finally, our analysis indicates that �nancial markets are quite sophisticated in adapting the
design of debt contracts to cross-sectional variations in the quality of information available to
assess �rms�net assets position and future prospects. For example, �nancial transparency reduces
the use of covenants restricting dividends and other payouts, but not investment or event speci�c
restrictions, while the dispersion in analysts�forecasts increases the use of investment restrictions,
but not subsequent �nancing or dividend payout restrictions. Similarly, the design of bond contracts
appears to have responded appropriately to structural changes in the quality of �nancial information
regarding �rms following the passage of the Sarbanes-Oxley Act in 2002, by reducing the role of
managerial moral hazard in the use of investment restrictions. These results are supportive of the
view that �rms tend toward an e¢ ciently designed �nexus of contracts.�
We organize the remaining paper as follows. Section 2 analyzes the e¤ects of managerial moral
hazard on bondholder agency risk. Section 3 derives the refutable hypotheses and describes the
empirical test design. Section 4 describes the data and discusses the results of the empirical analysis,
and Section 5 concludes.
2 Managerial Moral Hazard and Bondholder Agency Risk
Corporations typically issue bonds with a variety of restrictive covenants � our database includes
over �fty � that restrict issuer behavior and protect bondholders. Following Smith and Warner
(1979), the literature usually classi�es these covenants in four major categories: those that restrict
the �rm�s (1) investments, (2) payouts to shareholders, (3) issuance of debt instruments (subsequent
to the current issue), and (4) response to major events such as when the �rms is a takeover target
and is in �nancial distress. However, and as we noted earlier, the literature almost exclusively
focuses on the agency risk faced by bondholders due to con�icts of interest with shareholders. In
this section, we start by summarizing the agency risk for bondholders when shareholders pursue
their own agenda. But our focus is to develop the agency risk to bondholders from managerial
moral hazard and to explicate the implications of this risk for e¢ cient design of bond covenants.
5

2.1 Bondholder-Shareholder Con�icts
Bondholders can be hurt by excessive payouts to shareholders; by claim dilution due to subsequent
issuance of debt of higher priority; by asset substitution involving a shift toward high risk projects
that bene�t shareholders [e.g., Jensen and Meckling (1976)]; by under-investment when �rms forego
positive NPV projects if they principally bene�t the bondholders [e.g., Myers (1977)]; and, by
acquisitions that increase leverage and a¤ect debt seniority [e.g., Warga and Welch (1993)]. To
address these agency risks, bondholders use covenants that restrict investment policy, subsequent
�nancing policy, payout policy, and management response to takeover bids and �nancial distress.
2.2 Managerial Entrenchment and Agency Risk for Bondholders
From a practical perspective, shareholders cannot easily separate corporate managers involuntarily
from control. Such separation typically requires a successful proxy motion by shareholders [e.g.,
Fluck (1999)], or a takeover [e.g., Shleifer and Vishny (1986)], or a bankruptcy [e.g., Zwiebel (1996)].
Managerial entrenchment is possible because there are transactions costs in shareholder activism
and the market for corporate control, and corporations can avoid bankruptcy through renegotiation
with debt-holders [e.g., Leland (1994)]. Managers may also e¤ectively entrench themselves by mak-
ing manager-speci�c investments [e.g., Shleifer and Vishny (1989)] and by strategically enhancing
their voting rights [e.g., Stulz (1988)].
Entrenchment allows self-interested managers signi�cant �exibility to pursue their own agenda
� for example, undertaking risky projects to expand the asset base under their control. Entrenched
management can clearly threaten bondholder interests in a variety of ways. Opportunistic invest-
ment choice by entrenched managers, who value increasing the size of assets under their control,
i.e., �empire-building� [e.g., Jensen (1986, 1993) and Stulz (1990)] can increase the default risk.
Moreover, indiscriminate �nancing of such investments can upset the seniority of claims of the
existing lenders.
We note that bondholders are substantially constrained in eliminating agency con�icts with
entrenched managers through monitoring and incentive contracts. The objective of most internal
governance mechanisms, such as monitoring by the board of directors, is to protect shareholder
� and not bondholder � interests. Similarly, the board writes long-term incentive contracts with
managers to advance shareholder interests. Thus, bondholders usually protect themselves from
opportunistic managerial behavior only through covenants that restrict such behavior
6
However, the incentives of entrenched managers can sometimes be aligned with bondholder
interests. An important illustration of this occurs when the �rm faces an unfriendly takeover
attempt. As is well known, heavily debt-�nanced takeovers are often inimical to the interests of the
current bondholders because they substantially increase leverage (and hence the default risk) and
can subvert the existing seniority of claims. But while a change of control may be in shareholders�
interests, it will (almost axiomatically) be resisted by an entrenched management. Therefore,
bondholder and entrenched management interests are aligned � against the shareholders � in the
face of unfriendly takeover attempts. In a related vein, entrenched managers resist exceptionally
large dividend payouts to shareholders, because they value liquid assets to �nance �empire building�
and manager-speci�c investments. Therefore, entrenched managers reduce the risk of large dividend
payouts for bondholders.
2.3 Managerial Fraud and Agency Risk for Bondholders
Another important managerial agency risk for bondholders is the possibility of managerial fraud.
To hide self-dealing, to misrepresent the economic prospects of the �rm in order to induce outside
investment, and to set up o¤-balance-sheet transactions and entities, management may strategically
make �nancial statements impenetrable. Therefore, the managerial fraud-related agency risk for
bondholders will be inversely related to the quality of information on the �rm�s net asset position
and its economic (or investment) prospects. Moreover, and unlike the case of entrenchment, the
prospect of managerial fraud is unambiguously inimical to bondholder interests. We thus expect
that the use of covenants will be positively related to the extent of informational asymmetry about
the �rm.
Building on Myers� (1977) categorization of �rm value into the value of assets-in-place and
growth options, we can distinguish between two major types of informational asymmetries between
insiders and outsiders. One type of informational asymmetry is with respect to the true quality
of the �rm�s investment prospects (or the value of its growth options), and is therefore forward-
looking. The other type of informational asymmetry is with respect to the �rm�s current balance
sheet (or the value of its assets in place), and is typically based on the �rm�s past performance
and �nancial policies (i.e., its past capital structure and payout decisions). Clearly, the accounting
or �nancial disclosure regulations focus on the latter, because they require public companies to
follow certain protocols (e.g., the Generally Accepted Accounting Principles (GAAP)) in disclosing
7
income and balance sheet entities. But these protocols do not ensure that insiders provide high-
quality information on the form�s economic or investment prospects. Outside analysts generally
provide this type of assessment. In sum, we expect that the use of covenants will be related to the
�rms��nancial transparency and the quality (or precision) of assessment of its economic prospects
by outside analysts.
2.4 Contractual E¢ ciency and Inclusion of Bond Covenants
While covenants are the principal instruments available to bondholders to address agency risk
from shareholders and entrenched managers, including an ever-greater variety of restrictions is
not always in bondholder interest. This is because covenants constrain management�s ability to
implement policies that improve the �rm�s operational position and reduce default risk. Of course,
management attempts to minimize the inclusion of covenants subject to maintaining a given cost
of debt. Therefore, in an e¢ cient contracting outcome, the likelihood of covenant inclusion will be
higher when, (1) there is intrinsic agency risk for bondholders from shareholders or from managerial
moral hazard and (2) there are no alternative mechanisms that will reduce this risk. Conversely,
the likelihood of covenant inclusion is low if either of these conditions is not satis�ed.
Some illustrations will clarify our terminology. Bondholders of �rms with high growth oppor-
tunities face low intrinsic risk of excess shareholder payouts, ceteris paribus, because any positive
cash �ows are largely re-invested by such �rms. Similarly, bondholders of large �rms face lower
intrinsic risk of a leveraged takeover of the �rm, because it is more di¢ cult to �nance and manage
the takeover of large �rms, other things being the same. On the other hand, bondholders face a
higher intrinsic risk of excess dividend payouts from �rms with high default risk, because sharehold-
ers know that they will be unable to extract any cash from the �rm once it declares bankruptcy.
Finally, the demand for payout covenants will be lower if the �rm is incorporated in a State that
imposes �nancial conditions on dividend payouts, such as the �total assets� constraint [see, e.g.,
Peterson and Hawker (1997)].
We conclude, therefore, that other things held �xed, the use of bond covenants will be positively
(negatively) related to the extent of managerial entrenchment whenever entrenchment threatens
(supports) bondholder interests. Similarly, the use of managerial fraud related covenants will
be negatively related to the quality of information regarding the �rms�net assets and economic
prospects.
8
3 Hypotheses and Empirical Test Design
In this section, we build on the foregoing analysis to derive testable hypotheses on the likelihood of
inclusion of the four principal types of bond covenants. We �rst derive hypotheses related to the
agency risk of �empire building�and misuse of free cash �ows because of managerial entrenchment.
We then derive hypotheses relating to the agency risk of managerial fraud. Finally, we specify the
empirical proxies and the data we use to test these hypotheses.
3.1 Entrenchment and Inclusion of Covenants
We start with factors that drive the inclusion (or exclusion) of investment (related) covenants. The
foregoing analysis then suggests that the likelihood of including such covenants will be positively
associated with the extent of managerial entrenchment, other things being the same.3
Hypothesis 1 The likelihood of including investment-related covenants will be positively (nega-
tively) related to factors that enhance (weaken) managerial entrenchment.
The CEH further re�nes the somewhat generic Hypothesis 1. Unlike shareholders, bondholders
are not concerned per se about entrenched managers adopting negative NPV projects. Rather, their
concern is when entrenchment aggravates the well known �asset substitution� e¤ect [Jensen and
Meckling (1976)], where shareholders or managers of levered �rms have an incentive to undertake
risky projects because debt-holders bear the consequences of investment failure. But it is well
known that the asset substitution problem is most acute for �rms with high default probability;
hence, for a given level of entrenchment, the likelihood of including investment restrictions will be
higher for �rms with greater default probability.
Meanwhile, there is an argument in the literature that the investment risk for bondholders is
greater for high-growth option �rms [e.g., Smith and Warner (1979)] when managers presumably
have access to a rich menu of high-growth and high-risk investment opportunities. This argument
implies that the positive in�uence of managerial entrenchment on the use of investment restrictions
will be greater for high-growth option �rms. Another important implication is that the asset
substitution problem for bondholders will be exacerbated in high-growth option �rms if managers
have incentives to take risky investments. Speci�cally, if managers hold stock options with a
3 In the usual fashion, our empirical hypotheses are stated under the �ceteris paribus�(i.e., other things held �xed)assumption. However, for expositional ease we do not make this assumption explicit in these statements.
9

high delta (i.e., their wealth is more sensitive to the stock price), then their incentives for risk-
shifting (toward bondholders) will be higher, ceteris paribus, because such activities bene�t equity
holders. Moreover, bondholder investment risk will also be positively related to the sensitivity of
the managers�wealth to stock volatility, or vega, because a higher vega increases the managers�
incentives for undertaking risky investments and an aggressive debt policy [e.g., Cohen et al. (2000)
and Coles et al. (2006)].
Hypothesis 2 The likelihood of including investment-related covenants will be positively related to
the default risk of the �rm. Moreover, the e¤ects of managerial entrenchment and the delta and
vega of the CEO�s stock option holdings on the use of investment restrictions will be greater for
high-growth option �rms.
Hypotheses 1 and 2 refer to the �rm�s investment policies, generally speaking. However, the
entrenchment hypothesis is especially relevant for investments in the form of mergers with or
acquisitions of other �rms by the issuing �rm. This is because a common instrument for �empire
building� by managers is the expansion of assets through mergers and acquisitions by the �rm.
Thus, we predict that,
Hypothesis 3 The likelihood of including restrictions on mergers and acquisitions by the issuing
�rm will be positively (negatively) related to factors that enhance (weaken) managerial entrench-
ment.
Next, we consider the determinants of including dividend payout covenants. Entrenched man-
agers prefer lower payouts because they use internal resources to expand the assets under their
control [Jensen (1983) and Hart (1995)]. Therefore, for bondholders, the risk of excessive dividend
payouts to shareholders is intrinsically lower with entrenched managers, because such managers
will resist shareholders in relinquishing their control over internal resources.
Hypothesis 4 The likelihood of including dividend payout covenants will be negatively (positively
related to factors that enhance (weaken) managerial entrenchment.
Apart from entrenchment, the use of dividend payout restrictions will also be in�uenced by other
factors that in�uence the intrinsic risk of excessive payout to shareholders. We have mentioned
some of these factors above.
10

Hypothesis 5 The likelihood of including dividend payout restrictions is more likely when the �rm
is small and has low growth-options and when the default risk is high.
Turning to the subsequent �nancing covenants, entrenchment has two opposing e¤ects. For
a given level of investment, managers that are more entrenched will be less likely to do debt
�nancing [see, e.g., Hart and Moore (1995)], and this reduces the subsequent �nancing risk for
bondholders. But, as we have pointed out before, more entrenched managers are also likely to
over-invest because of �empire-building,�which increases the demand for �nancial resources, and
therefore may push management toward debt �nancing. The net e¤ect of managerial entrenchment
on the subsequent �nancing restrictions therefore appears to be ambiguous. Meanwhile, �rms with
higher borrowing costs pose a lower intrinsic risk of subsequent debt �nancing for bondholders.
The e¢ cient contracting framework therefore implies that such �rms will be less likely to include
subsequent �nancing restrictions, ceteris paribus.
Hypothesis 6 Controlling for the investment opportunity set, the likelihood of including subse-
quent �nancing covenants will be negatively (positively) related to factors that enhance (weaken)
managerial entrenchment. Moreover, �rms with low (high) cost of debt will be more (less) likely to
use these restrictions.
We now examine the e¤ects of entrenchment on the use of event-speci�c covenants. For the
reasons mentioned above, bondholders often su¤er when the �rm is taken over, especially in highly
levered transactions. Therefore, the interests of entrenched management will be aligned with bond-
holders in thwarting change of control through takeovers; conversely, the interests of bondholders
and shareholders will con�ict if the shareholders bene�t from the tender o¤er for the �rm. Bond-
holders thus face a lower intrinsic risk of a leveraged takeover of the �rm if shareholder power
to facilitate the takeover is restricted by the corporate charter or if the likelihood of successful
takeovers is low because of large �rm size and presence of poison pills. Finally, we note that high
default risk will be positively associated with the use of �nancial-distress related covenants.
Hypothesis 7 The likelihood of including event-speci�c covenants is higher if, (i) shareholder
power is relatively unrestricted in takeover situations, (ii) there are no signi�cant anti-takeover
provisions in the corporate charter, (iii) the level of managerial entrenchment is low, (iv) the �rm
size is small, (v) the cost of borrowing to �nance takeovers is low, and (vi) the default risk is high.
11

3.2 Managerial Fraud and Inclusion of Covenants
Based on the observed pattern of managerial fraud, we posit that some of the principal types of
fraud are the misuse of investment funds, excessive payouts to managers, and aggressive senior debt
�nancing (of value-destroying activities) � often camou�aged through o¤-balance-sheet transac-
tions. Therefore, better (poor) quality of information regarding the economic performance and
net asset position of the �rm, along with the nature of the �rm�s economic prospects, reduces
(increases) the agency risk bondholders from managerial fraud.
Our framework implies that di¤erent types of informational asymmetries (between insiders and
bondholders) will be correlated with the use of di¤erent types of covenants. This is because particu-
lar types of informational asymmetries exacerbate speci�c types of agency risks for the bondholders.
To explicate, let us compare the implications (for bondholders) of insiders�private information on
the net assets of the �rm versus their private information on the investment or economic prospects
of the �rm. Greater uncertainty about the �rm�s net assets undermines bondholders�ability to mon-
itor payouts to shareholders and additional debt �nancing by the �rm, while greater uncertainty
about the investment prospects undermines bondholders�ability to assess investment-related man-
agerial moral hazard. Thus, we conclude that greater uncertainty regarding the �rms�investment
opportunities will lead to a greater use of investment restrictions, while lower �nancial transparency
or impenetrable �nancial statements will increase the use of restrictions on payouts and subsequent
�nancing.
Hypothesis 8 The likelihood of including payout and subsequent �nancing restrictions will be neg-
atively related to the quality of information regarding the �rms�net assets. And the likelihood of
including investment restrictions will be negatively related to the quality of information regarding
the �rms�investment prospects.
We now specify the proxies and test design we use to confront the foregoing hypotheses with
the data.
3.3 Empirical Proxies
3.3.1 Managerial Entrenchment and Incentives
While the theoretical literature on entrenchment is well developed, empirical tests of the entrench-
ment hypothesis have only recently emerged in the literature [e.g., Berger et al. (1997) and Hu and
12
Kumar (2004)]. As measures of entrenchment, these studies use proxies for CEO power, e¤ective-
ness of internal governance mechanisms, monitoring by large external shareholders, and the CEO�s
incentives for shareholder value-maximization. Building on this literature, we posit that managerial
entrenchment is positively correlated with long CEO tenure, lack of independence of the board of
directors, low share of CEO compensation derived from equity-based incentives, high CEO com-
pensation relative to other top executives, CEO share-ownership, and absence of monitoring by
large shareholders.
However, Hu and Kumar (2004) �nd that some proxies have con�icting e¤ects on entrenchment.
Take, for example, the e¤ects of a signi�cant stock ownership in the �rm by the CEO. On the one
hand, a large personal equity stake by the CEO makes his or her interests intrinsically more aligned
with the shareholders�, and thereby reduces entrenchment. On the other hand, signi�cant stock-
ownership enhances the CEO�s power, improves his or her bargaining position with respect to
the board, and makes unfriendly takeovers more di¢ cult; all of these e¤ects increase managerial
entrenchment.
To address the issue of con�icting e¤ects of various entrenchment proxies, we develop uni�ed
measures of managerial entrenchment. These �rm-speci�c composite entrenchment measures use a
principal components analysis to derive a linear combination of the major entrenchment variables.
Our �rst measure (ENTRP) uses (a combination of) long CEO tenure (LNGCEOTNR), the ratio
of cash or non-performance compensation to total compensation (PCASHCOMP), the ratio of the
CEO�s total compensation to the sum of the compensation of the other four highest paid executives
(CEORELCOMP), the delta of the CEO�s stock-option holdings based on the Black-Scholes option
valuation model (CEODELTA), the CEO�s share-ownership in the �rm (CEOSHROWN ), and the
presence of blockholders (BLOCKHOLDERS ), i.e., shareholders that own greater than 5 percent
of outstanding equity.4 The weights in this linear representation are the elements of the eigenvector
that accounts for the highest percentage of the variation in the said variables. Our second composite
entrenchment measure (ENTRC ) disentangles the e¤ects of managerial compensation from other
proxies for entrenchment. We construct this measure using a smaller set of compensation-based
variable such as CEODELTA, PCASHCOMP, and CEOSHROWN.
4 Information on the percentage of independent directors on the board is available only for less than two-thirds ofthe sample. Therefore, we do not directly include board independence in the principal components analysis, but wecheck its signi�cance as a separate covariate. We also note that while the delta aligns CEO interests with shareholdersand makes the manager less entrenched, there is no theoretical argument for directly linking the vega to entrenchment.
13
3.3.2 Shareholder Power and State Restrictions
Apart from the presence of blockholders,5 shareholder power is also a¤ected by the enumeration of
shareholder rights in the corporate charter. Recently, Gompers, Ishii, and Metrick (GIM) (2003)
use a governance index (G-Index ) that scores the extent of managerial power (relative to sharehold-
ers) by examining 24 corporate charter provisions that limit shareholders�ability to monitor and
remove or separate management from control. The index, computed for each �rm by adding one
point for every provision that restricts shareholder rights (or increases managerial power), takes a
value between 0 and 24, with higher values indicating relatively weak shareholder rights or power.
GIM also sub-divide the 24 charter provisions into �ve sub-indices: delay provisions (G-Delay);
protection provisions (G-Protection); voting provisions (G-Voting); miscellaneous provisions (G-
Other); and, state level provisions (G-State). We use these sub-indices in our analysis. Finally, we
also include shareholder power index (E-Index ) of Bebchuk et al. (2004) as a proxy for shareholder
power.
We use a dummy variable to identify if there is a poison pills in the issuing �rm�s charter
(PPILL). An a¢ rmative indicator on poison pills suggests higher managerial power in the face
of a takeover attempt on the �rm. Hence, such �rms would be less likely to use event-related
restrictions, ceteris paribus.
Finally, we also incorporate restrictions, based on the laws of the State of incorporation of the
�rms, that in�uence the intrinsic risk to bondholders of excessive dividend payouts to sharehold-
ers. From the e¢ cient contracting perspective, the intrinsic risk for bondholders of large dividend
payouts is lower (higher) if the �rm is incorporated in a State that restricts (eases) shareholder
�exibility in dividend payouts. We follow Peterson and Hawker (1997) and �ag a �rm if its State
of incorporation allows �nimble dividends,� i.e., if the board of directors can pay cash and prop-
erty dividends out of either earned surplus or the sum of the �preceding and current �scal year�s
earnings�. Because earnings � rather than earned surplus � de�ne the operative limit on the
legality of these �nimble dividends,� the �rm can conceivably declare cash dividends even when
total liabilities exceed total assets. On the other hand, corporate laws of some States impose a
�total asset�constraint on payouts, so that dividends can only be paid out if the net assets of the
�rm exceed its liabilities. We �ag such �rms as well.
5 Interestingly, large institutional ownership does not intrinsically raise agency risk for bondholders. This is because�nancial institutions are themselves monitored and, therefore, are less likely to pressurize managers to make excessivedividend payouts or to take very risky investment projects at the expense of bondholder interests.
14

3.3.3 Financial Transparency and Information Quality
We examine three proxies for the quality of information on the �rms��nancial situation and eco-
nomic prospects. Two of these measures are �rm-speci�c, namely, the dispersion of analysts�
forecasts for the �rm�s earnings and the quality of disclosure of the �rm�s �nancial statements. The
third measure is the e¤ect of the Sarbanes-Oxley (SOX) Act of 2002 that in�uences the information
asymmetry between insiders and bondholders for all public �rms.
We use a �rm-speci�c accounting transparency score from S&P (available for 2002). This score
measures the number of items disclosed by the �rm in its �nancial statements; hence, the greater
the transparency of the �rm�s �nancial statements, the higher is the score [see, e.g., Cheng et al.
(2006)]. We use the transparency score (FINTRNSP) as a measure of the quality of information
on the �rms�net assets position.
While �nancial statements provide outsiders with a picture of the �rms�net assets position, they
are usually not very informative with respect to the their investment prospects, for e.g., the quality
of the �rms�growth options. However, �nancial markets have developed measures, such as earnings
forecasts by analysts, to provide forward-looking assessments to outsiders. Consistent with this,
the literature interprets the dispersion in analysts�forecasts to indicate greater uncertainty in the
�rm�s economic prospects [e.g., Gebhardt et al. (2001) and Diether et al. (2002)]. We thus take the
dispersion in the analysts�earnings forecasts (ANYLDISP) to be negatively related to the quality
of information regarding the �rms�economic prospects. As is typically done in the literature, we
use the standard deviation of I/B/E/S earnings per share forecasts by analysts for the next �scal
year end, scaled by the previous �scal year end�s stock price.
The Sarbanes-Oxley Act of 2002 (SOX) was motivated by a spate of corporate and accounting
scandals (including Enron, Tyco, and Worldcom), and has a wide ambit. Among other things, it
sets up performance benchmarks to enhance auditor independence, corporate governance, and the
quality of �nancial disclosures. If the SOX has been e¤ective, then it should increase the quality
of the information that �ows to the capital markets regarding the �rms��nancial situation. Based
on Hypothesis 8, we therefore expect that payout and subsequent �nancing restrictions will be
reduced, other things held �xed, after the passage of SOX. We use a
15
3.3.4 Other Characteristics
To isolate and highlight the e¤ects of managerial moral hazard on covenant design, we control
for �rm-speci�c and macro factors that are emphasized in the existing literature as signi�cant
determinants of covenant design. We have already incorporated above the role of growth options,
�rm size, and default risk. Other factors highlighted in the literature include �rms� leverage,
tangible assets, the stability of operating cash �ows, and the credit spread (at the time of issue).6
We use the log of the market-to-book ratio (MTB) as a proxy for growth options and the log of total
assets (SIZE ) as a measure of �rm size. We control for leverage (LEVER), the ratio of tangible
to total assets (TNGASSET ), the volatility of operating income (OPINCVOL). For assessing the
default risk, we control for the ratio of pro�ts to assets (PROFIT ), the ratio of the loan (or issue)
size to assets (LOANSIZE ), and identify if the bond is non-investment grade at the time of issuance
(JUNKRATED). For the credit spread (CREDITSPR) at the time of issue, we use the di¤erence
between the yields of BAA and AAA rated bonds in the month before the issue.
3.4 Test Design
We analyze the determinants of covenant inclusion using multinomial probit regressions. Specif-
ically, for any given covenant-type j (where, j ranges from investment-related to event-speci�c
covenants), our dependent variable is yj 2 f0; 1g. Here, yj = 1 if covenant-type j is included in the
bond issue, is set equal to 0 otherwise. The multinomial probit speci�cation thus implies that
Pr(yj = 1) = �(�+ �0X) (1)
Here, X is a vector of covariates representing proxies for managerial entrenchment, shareholder
power, �rm-speci�c characteristics, and control variables. And, �(�) is the normal cumulative
distribution function.
6Studies by Nash et al. (2003) and Bradley and Roberts (2003) �nd a role for growth options and the use ofcovenants in corporate bonds and private loans. Malitz (1986) �nds �rm size and leverage to be a signi�cant factors,while Begley (1994) emphasizes the role of default risk and operating cash �ows. Bradley and Roberts (2003) also�nd that the inclusion of covenants varies systematically with macroeconomic factors such as the credit spread.
16
4 Results
In this section, we discuss the results of our empirical analysis. We start by describing the data, the
sample construction, and some salient characteristics of the sample. We then describe the results
for the tests of Hypotheses 1-8 that we explicated in the previous section.
4.1 Data
Our primary data sources are FISD database for bond issuance and covenant usage data; ExecCom-
pustat for managerial incentives and tenure data, Compustat for �rm level balance sheet variables;
CRSP for market information; IRRC for data on G-Index and board composition, and Thomson
13-F data for institutional ownership. We restrict the sample period to 1993�2005 because of data
availability on ExecCompustat. FISD contains detailed information on the bonds at the time of
issuance, such as o¤ering yield, o¤ering amount, call and put features etc. But the unique feature
that sets this database apart from other bond databases is the comprehensive information on 54
bond covenants, which cover the gamut of restrictions that are observed on bonds.
We only consider bonds issued by U.S. domiciled non-�nancial �rms that are in the intersection
of CRSP, COMPUSTAT, FISD and Executive Compensation databases. Further, the bond must be
a corporate debenture with issuance, o¤ering date and covenant information available in FISD. We
exclude convertible bonds, secured lease obligations, perpetual bonds, unit deals, rule 144a bonds,
Medium Term Notes (MTNs), private placement bonds, Yankee, Canadian, and foreign currency
bonds. The sample only includes those bond that have been issued during 1993� 2005.
The �nal sample includes 3108 bonds issued by 764 unique �rms. We take the balance sheet
information from the annual COMPUSTAT �les. We allow a three-month lag after the �scal year-
end to ensure that the annual balance sheet information is available to the market. We intersect
the balance sheet information with the bond data from FISD to ensure that we include only the
latest available annual data (as of the month of the bond issue). We obtain secondary yields on
the AAA and BAA bonds � required to compute the credit spread � from the Federal Reserve.
Analyst forecast information required to construct the analyst dispersion variable (ANYLDISP)
is taken from I/B/E/S summary �les. We consider the analyst earnings forecasts one month prior to
the bond o¤ering date, and compute ANYLDISP as the standard deviation of the analyst earnings
forecasts scaled by the previous �scal year end�s stock price.
As we mentioned above, we use Standard and Poor�s Transparency and Disclosure study
17

as the source for the �nancial transparency score (FINTRNSP). The study involved measure-
ment/assessment of 98 disclosure attributes, 35 of which are related to �nancial transparency and
information disclosure [see, Cheng et al. (2006) for more details]. We consider only the �nancial
transparency and information disclosure score. The ranking re�ects the quantity of items dis-
closed and does not directly assess the quality of the disclosed information. However, past studies
have suggested that the disclosure quantity and quality are highly correlated [e.g., Durnev and
Kim (2005)]. In order to construct a meaningful sample, we assume that the transparency score
published during October 2002 is valid for the calendar years 2001, 2002 and 2003.
4.2 Sample Characteristics
Table 1 displays some salient characteristics of the bonds in our sample. The predominant majority
of bonds are senior with a median o¤ering amount of $250 million and a median maturity of 10
years. Just over three-quarters of the sample comprises of investment grade bonds (with a rating of
BAA and above), with only 1% receiving the highest rating (AAA) and 39% receiving the minimum
investment grade ranking (BAA). Of the quarter of the sample that is below investment-grade, 14%
are low-grade bonds (with a rating of BA) and about 10% are in the �very speculative�category
(with a rating of B).
In Table 2, we compare the use of the four major categories of bond covenants in investment
versus non-investment grade bonds. This comparison gives an indication of the role default risk
plays in the use of the various types of covenants. Clearly, indirect investment restrictions � for
example, restricting transaction with a¢ liates, requiring maintenance of net worth, and requiring
properties acquired after issue to be included in the current issue mortgage � are used much more
frequently in non-investment grade bonds compared to the investment grade bonds. However,
merger and asset disposition restrictions are used in the preponderant majority of bonds, whether
they be investment or non-investment grade.
Turning to dividend restrictions, the use of such restrictions is strikingly more frequent for
high default-risk bonds, which is consistent with predictions from the literature on bondholder-
shareholder con�icts. Not surprisingly, high default-risk bonds are substantially more likely to
restrict to issuers� ability to change debt priority, because �rms closer to bankruptcy have the
greatest incentive to raise funds by issuing senior debt. Note that such bonds also use restrictions
on stock issuance much more frequently. However, most bonds, whether they are investment or
18
non-investment grade, include some form of subsequent �nancing restrictions. On the other hand,
high default risk bonds use change of control related (event) restrictions much more frequently than
investment-grade bond do.
4.3 Tests of Entrenchment Related Hypotheses
Table 3 presents the �rst set of results for the inclusion of investment-related covenants, i.e., Hy-
potheses 1 and 2. Model 1 is a speci�cation that includes �rm and bond-speci�c covariates, but
does not include the managerial entrenchment related covariates. Consistent with Hypothesis 2, we
�nd that high default risk �rms (i.e., the ones that tend to issue non-investment grade bonds) are
signi�cantly more likely to include investment-related covenants. Moreover, bonds are more likely
to include investment related covenants if the credit spread is higher. At this level of analysis,
we do not �nd that high-growth option �rms are more likely to include investment restrictions.
However, we will examine the role of high-growth option �rms more closely in Table 5 below when
we test (the other parts of) Hypothesis 2.
Models 2 and 3 in Table 3 start the analysis of the in�uence of entrenchment on the use of
investment restrictions. The results for these models indicate that factors positively associated
with the extent of CEO entrenchment � such as, a long CEO tenure and extraordinarily high
CEO compensation relative to other senior executives � load signi�cantly on the likelihood of
including investment covenants. That is, even after controlling for the usual covariates (cf. Model
1), the likelihood of including investment-related covenants is signi�cantly and positively related to
the CEO�s long tenure and the ratio of the CEO�s compensation to the sum of the compensation
of other top executives.
The analysis in Table 4 further investigates the relationship between entrenchment and invest-
ment restrictions. We examine the e¤ects of the composite entrenchment variables (ENTRP and
ENTRC ) on the likelihood of including investment covenants. Both these composite entrenchment
measures have a sizeable and signi�cant positive in�uence on the likelihood of including investment
restrictions.
Taken together, the results in Table 3 and 4 show that the positive in�uence of managerial
entrenchment on the inclusion of investment restrictions is robust � loading signi�cantly for both
individual proxies and composite measures of entrenchment � and thus provide strong overall
support for Hypothesis 1. It is also noteworthy that the credit spread at the time of issue is no
19
longer a signi�cant factor in the inclusion of investment restrictions once we control for managerial
entrenchment related moral hazard. However, high default risk (i.e., JUNKRATED) continues to
load signi�cantly, even when we control for the entrenchment related variables.
Table 5 displays the analysis for the role of high-growth options on the inclusion of investment
restrictions, as explicated in Hypothesis 2. Model 1 in this table examines the interaction between
entrenchment and the presence of growth options. We �nd that the likelihood of covenant inclusion
is higher when entrenched management controls high growth option �rms, which is consistent with
the prediction of Hypothesis 2. Next, Models 2 and 3 in this Table indicate that the in�uence of
the delta and vega of the CEO�s stock option holdings on the inclusion of investment restrictions
is greater for high growth-option �rms, again supporting Hypothesis 2. Interestingly, we �nd (but
do not show) that the delta and vega of the CEO�s stock option holds load signi�cantly in the
likelihood of investment restrictions. However, as we see in Models 2 and 3, the in�uence of delta
and vega occurs mostly for high-growth option �rms. We therefore conclude that bondholders face
greater agency risk from high-growth option �rms with respect to managerial moral hazard on the
�rm�s investment policy. Therefore, for bondholders, the agency risk of managerial entrenchment
and incentives for risky investment is especially acute for high-growth option �rms.
Table 6 tests Hypothesis 3 by examining the likelihood function for including restrictions on
investments by the �rm through mergers and acquisitions. Model 1 shows a benchmark speci�cation
that excludes the managerial entrenchment variables. Firms with higher default risk, as measured
by a high ratio of loan size to assets and non-investment grade bond ratings are more likely to
include merger restrictions. On the other hand, and consistent with the CEH, utility �rms that
are under regulatory supervision for expansion plans are less likely to include the said covenants,
ceteris paribus.
Models 2-4 of Table 6 show the e¤ects of managerial entrenchment related variables on the
use of mergers restrictions. Even controlling for the benchmark covariates, entrenchment variables
such as long CEO tenure and the two composite entrenchment measures (ENTRP and ENTRC )
have a signi�cant and positive in�uence on the likelihood of including merger restrictions. The
evidence therefore supports the notion that bondholders target risky �empire building�behavior by
entrenched managers through restrictions on the scope of the mergers and acquisitions activity by
the �rm.
Table 7 presents results for the inclusion of dividend payout restrictions, and therefore tests
20
Hypotheses 4 and 5. Again, we estimate a benchmark speci�cation ( Model 1) that does not include
entrenchment related covariates. Consistent with Hypothesis 5, �rms with low (high) intrinsic risk
of excessive dividend payouts also have a lower (higher) likelihood of including dividend restrictions,
other things being the same. Thus, larger �rms and �rms with high growth options (high market-
to-book �rms) are less likely to include dividend instructions. On the other hand, �rms with higher
default risk � i.e., �rms with higher leverage or issuing bonds with non-investment grade ratings
� and �rms in industries known for high dividend payout ratios (e.g., utilities) are more likely to
include such restrictions, ceteris paribus.
Models 2-5 of Table 7 exhibit the in�uence of managerial entrenchment on the inclusion of
dividend restrictions. Consistent with Hypothesis 4, entrenchment variables such as long CEO
tenure and the two composite entrenchment measures (ENTRP and ENTRC ) have a signi�cant
and negative in�uence on the likelihood of including dividend payout restrictions. These results
indicate that bondholders view managerial entrenchment as ameliorating the risk of shareholders
paying themselves large dividends. In a related vein, we �nd (but do not tabulate) that, for a given
level of managerial entrenchment, �rms with more independent boards are less likely to include
payout restrictions in their bond issues. Thus, our analysis suggests that independent boards
monitor not only management but also shareholder moral hazard in terms of excessive dividend
payouts.
Table 8 examines the in�uence of the State corporate laws on the likelihood of including dividend
payout restrictions [see, Section 3.3.2]. Consistent with the predictions from the CEH, we �nd that
�rms incorporated in States that allow �nimble dividends�are signi�cantly more likely to include
payout restrictions when issuing bonds, other things being the same. On the other hand, �rms
incorporated in States that impose a �total assets�type of constraint on payouts are signi�cantly
less likely to include such restrictions.
We turn, next, to examine the determinants of the use of subsequent �nancing restrictions.
Table 8 reports these results. From the benchmark speci�cation (Model 1), we �nd that larger and
high growth option �rms are less likely to include such restrictions. Such restrictions are also less
likely to be used when the overall cost of corporate debt is high � note that the coe¢ cient for the
credit spread is negative and signi�cant � and this result is consistent with Hypothesis 6.
Models 2-3 in Table 9 show the e¤ects of managerial entrenchment on the likelihood of includ-
ing subsequent �nancing covenants. For the reasons mentioned above, this e¤ect is theoretically
21
ambiguous. However, Hypothesis 6 asserts that entrenchment will have a negative e¤ect on the
need for subsequent debt �nancing, once we control for growth options. Indeed, we �nd that when
we control for growth options through the market-to-book ratio, factors positively correlated with
managerial entrenchment signi�cantly reduce the likelihood of including subsequent debt �nancing
restrictions. In fact, comparing Model 1 with the other models in Table 9, we notice that the e¤ect
of market-to-book is no longer signi�cant once we include the entrenchment related covariates.
This result reinforces our interpretation that the �entrenchment e¤ect�dominates the �investment
opportunity�e¤ect when bondholders consider the e¤ects of managerial moral hazard on the risk
of subsequent debt �nancing.
Table 10 examines the determinants of using event-speci�c covenants. Consistent with Hypoth-
esis 7, Model 1 indicates that the likelihood of including event related restrictions is negatively
related to �rm size and the credit spread (which in�uences the cost of borrowing), but positively
related to default risk. And, Models 2 and 3 indicate that these restrictions are less likely to be used
if shareholder power is restricted by the corporate charter, as measured by the G-Index of Gompers
et al. (2003) and the E-Index of Bebchuk et al. (2004). These results further support Hypothesis
7. However, the composite entrenchment variables (e.g., ENTRP) do not load signi�cantly on the
likelihood of using event-speci�c covenants.
Table 11 further explores the e¤ects of corporate charter restrictions on shareholder power
and takeovers on the likelihood of including event-speci�c covenants. Model 1 here shows that,
consistent with Hypothesis 7, such covenants are signi�cantly less likely to be included if there
are anti-takeover provisions in the corporate charter, such as poison pills. Model 2 examines the
in�uence of the sub-indices of the G-Index. We �nd that restrictions on shareholder power that
tend to protect management are most in�uential, i.e., �rms with charter provisions that protect
management against shareholder proxy motions are signi�cantly less likely to include takeover-
speci�c covenants. Because such restrictions essentially enhance managerial entrenchment, the
results of Model 2 reinforce the evidence that takeover-speci�c covenants are less likely to be
included if managerial power is enhanced in relation to shareholder power.
22
4.4 Tests of Fraud Related Hypotheses
4.4.1 The E¤ect of the Sarbanes-Oxley Act
While the objectives of SOX have received considerable prominence, its actual impact on the quality
of information �owing from corporations to outsiders, and on managerial behavior, is still unclear.
Indeed, the recent literature that assesses the e¤ects of SOX �nds mixed results [e.g., Cohen et al.
(2005), Jain et al. (2004), and Beneish et al. (2005)].7 Therefore, the e¤ect of SOX on the use of
corporate bond covenants is of substantial interest. For, if we observe a signi�cant reduction in the
use of certain types of covenants after the passage of SOX (when controlling for other exogenous
variations), then this would suggest that the legislation has reduced certain types of agency risks
for corporate bondholders. Conversely, an insigni�cant change in the pattern of covenant usage
after the passage of SOX would suggest that the legislation has not signi�cantly in�uenced the
agency risk faced by bondholders of public corporations. However, we can directly examine this
issue, because we examine a panel data with detailed information on the use of various types of
covenants.
In Table 12, we examine how the passage of SOX has in�uenced the use of corporate bond
covenants. We do so by analyzing the di¤erences in the patterns of covenant use for bonds issued
before and after the passage of SOX. We restrict attention to those �rms that have issued bonds
both before and after the passage of SOX. We �nd that SOX does not appear to have signi�cantly
in�uenced the use of any of the major types of bond covenants. The only e¤ect of SOX, which we
observe by comparing Table 12 with Table 3, is that the in�uence of managerial entrenchment on
the use of investment restrictions has fallen after its passage. That is, the role of managerial moral
hazard in the use of investment restrictions has been reduced in the new regulatory regime.
Our results reinforce the mixed picture that is emerging in the literature regarding the e¤ect
of SOX on agency costs. For bondholders, it appears that the SOX has not signi�cantly changed
their desired pattern of covenant use. To some extent, this is not surprising because SOX, by itself,
has not signi�cantly in�uenced the �ow of forward-looking information on the �rms� investment
prospects, or signi�cantly a¤ected shareholder power with respect to high dividend payouts, or
7While Jain et al. (2004) �nd that information uncertainty or adverse selection re�ected in liquidity measures,such as bid-ask spreads, has declined after the passage of SOX, Cohen et al. (2005) �nd no change in the informationcontent of earnings in the post-SOX era. Beneish et al. (2005) �nd that the e¤ects of implementing some of the SOXprovisions depends on the �rms�information environment; for example, �rms that hire high-quality auditors exhibitlower e¤ects of implementing such provisions.
23

restricted the �rms� behavior while being a takeover target. On the other hand, our analysis
suggests that the SOX requirements have reduced bondholder risk from managerial moral hazard
on investment, possibly by increasing the expected penalty costs for managers if they camou�age
ine¢ cient investments by misrepresenting the �rm�s �nancial statements.
4.4.2 The E¤ects of Firm-Speci�c Information Asymmetry Measures
Table 13 examines the relationship between the likelihood of covenant usage and the dispersion in
analysts�forecasts, for each of the four major covenant types. Consistent with Hypothesis 8, we
�nd that �rms with higher forecast dispersion are signi�cantly more likely to use investment-related
covenants. These results reinforce earlier evidence in Table 4 that � from the bondholders�per-
spective � managerial moral hazard with respect to risky investments increases signi�cantly with
a greater range (or uncertainty) in investment prospects. Interestingly, the dispersion of analysts�
forecasts does not signi�cantly in�uence the use of the other three major types of covenants. This
result further supports the CEH, because uncertainty about future earnings, implicit in higher
dispersion of analysts� forecasts, is not substantively relevant to the agency risk with respect to
excessive dividend payouts (to shareholders), subsequent debt �nancing, or the �rm�s behavior as
a takeover target or during �nancial distress.
Table 14 presents the results of an analysis of the e¤ect of the �rms�transparency score on its
covenant usage in 2001-2003. We �nd that the use of dividend payout restrictions is signi�cantly
and negatively related to the �rm�s transparency score, which is consistent with the prediction from
the contracting e¢ ciency framework. However, the transparency score is not signi�cantly related
to the use of the subsequent �nancing restrictions; and, consistent with the priors, it also does
not signi�cantly in�uence the use of investment-related and event-speci�c covenants. It appears
that the agency risk of excessive debt �nancing is not signi�cantly a¤ected by the number of items
disclosed in the �nancial statements, but the risk of large dividend payouts to shareholders is.
5 Summary and Conclusions
Bond covenants play a prominent role in the agency theory of the �rm. Their use exempli�es
the idea that �rms voluntarily proscribe their operational �exibility to lower agency risk for bond-
holders, and therefore also the cost of debt. However, the literature almost exclusively focuses on
bondholder-shareholder con�icts. We examine the e¤ects of managerial moral hazard on agency
24
risk for bondholders. Based on an analysis of the agency risk for bondholders from managerial
entrenchment and fraud, and using the contractual e¢ ciency hypothesis (CEH), we derive testable
hypotheses on in�uence of managerial moral hazard on the inclusion (or exclusion) of the major
types of bond covenants. Our analysis emphasizes that entrenched managers can both exacerbate
and ameliorate bondholder agency risk, because they sometimes bene�t the bondholders by op-
posing the interests of shareholders in situations where there are bondholder-shareholder con�icts.
Moreover, in calibrating agency risk due to managerial fraud, we emphasize the quality of the
information regarding the �rm�s net assets position and economic prospects.
Our empirical analysis, based on all corporate bonds issued during 1993-2005 and containing
information on over 54 covenants, indicates that managerial moral hazard has a signi�cant in�uence
on the use of bond covenants. The extent of managerial entrenchment and the risk of managerial
fraud signi�cantly in�uence the use of (the various types of) bond covenants, in the direction
predicted by the CEH. We �nd that individual entrenchment proxies and composite entrenchment
measures both load signi�cantly on the likelihood of including (or excluding) various covenants.
Moreover, the use of covenants responds to cross-sectional and time-series variations in the �rms�
informational environment in a manner consistent with addressing the risk of managerial fraud.
Overall, our analysis suggests that there is a multi-faceted interaction between managerial moral
hazard and bondholder agency risk, and supports the view that �rms tend toward an e¢ ciently
designed �nexus of contracts.�
25
References
Bebchuk, L.A., Cohen, A., and A. Ferrell, 2004, What matters in corporate governance?, Harvard
University Discussion paper No. 491.
Begley, J., 1994, Restrictive covenants included in pubic debt agreements: An empirical investigation,
Working paper, University of British Columbia.
Begley, J., and G. Feltham, 1999, An empirical examination of the relation between debt contracts and
management incentives, Journal of Accounting and Economics 39, 857-878.
Berger, P., E. Ofek, and D. Yermack, 1997, Managerial entrenchment and capital structure decisions,
Journal of Finance, 52, 1411-1438.
Billet, M., T. King, and D. Mauer, 2004, Bondholder wealth e¤ects in mergers and acquisitions: New
evidence from 1980s and 1990s, Journal of Finance 59, 107-135.
Beneish, M., M. Billings and L. Hodder, 2005, Internal control weaknesses and information asymmetry,
Working Paper, Indiana University.
Berle, A., and G. Means, 1932, The modern corporation and private property (Macmillan, New York).
Bradley, M., and M. Roberts, 2003, Are bond covenants priced?, Working paper, Duke University.
Cheng, A., D. Collins and H. Huang, 2006, The Market Response to the October 15, 2002 Standard &
Poors Transparency & Disclosure Rankings, Working Paper, University of Memphis.
Coles, J., N. Daniel, and L. Naveen, 2006, Executive compensation and managerial risk-taking, Forth-
coming, Journal of Financial Economics.
Cohen, R., B. Hall, and L. Viceira, 2000, Do executive stock options encourage risk-taking?, Working
Paper, Harvard University.
Cohen D., A. Dey and T. Lys, 2005, Trends in earnings management and informativeness of earnings
announcements in the pre- and post- Sarbanes-Oxley periods, Working Paper, Northwestern University.
Core, J., and W. Guay, 1999, The use of equity grants to manage optimal equity incentive levels, Journal
of Accounting and Economics 28, 151-184.
Cremers, K., V. Nair, and C. Wei, 2003, The impact of shareholder control on bondholders, forthcoming,
Review of Financial Studies.
Diether, K., C. Malloy, and A. Scherbina, 2002, Di¤erences of Opinion and the Cross-Section of Stock
Returns, Journal of Finance 57, 2113-2141.
Durnev, A., and E. H. Kim, 2005, To steal or not to steal: Firm attributes, legal environment and
valuation, The Journal of Finance 60, 1461-1493.
26
Fluck, Z, 1999, The Dynamics of the management-shareholder con�ict, Review of Financial Studies 12,
379-404.
Gebhardt, W., C. Lee, and B. Swaminathan, 2001, Toward an implied cost of capital, Journal of Ac-
counting Research 39, 135-142.
Gompers, P., J. Ishii, and A. Metrick, 2003, Corporate governance and equity prices, Quarterly Journal
of Economics, 118, 107-155.
Hart, O., 1995, Financial contracting (Oxford University Press, Oxford, U.K.)
Hart, O., and J. Moore, 1995, Debt and seniority: An analysis of the role of hard claims in constraining
management, American Economic Review 85, 567-585.
Hu, A., and P. Kumar, 2004, Managerial entrenchment and payout policy, Journal of Financial and
Quantitative Analysis 39, 759-790.
Jensen, M., 1986, Agency costs of free cash �ow, corporate �nance, and the market for takeovers,
American Economic Review 76, 323-329.
Jensen, M., 1993, The modern industrial revolution, exit, and failure of internal control systems, Journal
of Finance 48, 35-44.
Jensen, M., and W. Meckling, 1976, Theory of the �rm: Managerial behavior, agency costs and ownership
structure, Journal of Financial Economics 3, 305-360.
Jain P., J. Kim and Z. Rezaee, 2004, The e¤ect of Sarbanes-Oxley act of 2002 on market liquidity,
Working Paper, University of Memphis.
Leland, H., 1994, Corporate debt value, bond covenants, and optimal capital structure, Journal of
Finance, 49, 1213-1252.
Malitz, I., 1986, On �nancial contracting: The determinants of bond covenants, Financial Management
15, 18-25
Myers, S., 1977, Determinants of corporate borrowing, Journal of Financial economics 5, 147-175.
Nash, R., J. Netter, and A. Poulsen, 2003, Determinants of contractual relations between shareholders
and bondholders: Investment opportunities and restrictive covenants, Journal of Corporate Finance 9, 201-
232.
Peterson C., and N. Hawker, 1997 , Does corporate law matter? Legal capital restrictions on stock
distributions, Akron Law Review, 31, 175-228.
Shleifer, A., and R., Vishny, 1986, Large shareholders and corporate control, Journal of Political Economy
94, 461-488.
27
Shleifer, A., and R. Vishny, 1989, Management entrenchment: The case of manager-speci�c investments,
Journal of Financial Economics 25, 123-139.
Smith, C., and J. Warner, 1979, On �nancial contracting: An analysis of bond covenants, Journal of
Financial Economics 7, 117-161.
Stulz, R, 1988, Managerial control of voting rights: Financing policies and the market for corporate
control, Journal of Financial Economics 20, 25-54.
Stulz, R., 1990, Managerial discretion and optimal �nancing policies, Journal of Financial Economics
26, 3-27.
Warga, A., and I. Welch, 1993, Bondholder losses in leveraged buyouts, Review of Financial Studies 6,
959-982.
Zwiebel, J., 1996, Dynamic capital structure under managerial entrenchment, American Economic Re-
view 86, 1197-1215.
28

Table1:BondCharacteristics
Thefollowingtabledocumentsthevariouscharacteristicsofbondsinoursample.The2006editionoftheFixedIncomeSecurities
Database(FISD)isthesourceforallthedatapresentedinthistable.ThesampleisrestrictedtobondsissuedbyU.S.domicilednon-
�nancial�rmsintheintersectionofCRSP/COMPUSTAT,FISDandExecutiveCompensationdatabases.Weconsideronlycorporate
debentureswithissuanceandcovenantinformationavailableinFISD.Weexcludeconvertiblebonds,securedleaseobligations,perpetual
bonds,unitdeals,rule144abonds,MediumTermNotes(MTNs),privateplacementbonds,Yankee,Canadianandforeigncurrency
bonds.PanelApresentsthesummarystatisticsforspread,amountandmaturity.PanelBtabulatestheseniorityfeaturesofthebonds
inthesampleandPanelCtabulatestheMoody�sratingofthebondsatissuance.Alltheissuecharacteristicsaretheaveragesforall
thebondsissuedduringthesampleperiod,1993-2005.O¤eringyieldistheactualyield-to-maturityonbondissued.Thespreadofthe
bondisthedi¤erencebetweenitsyieldandtheyieldofatreasurybondofsimilarmaturity.O¤eringamountisthetotalfacevalue
oftheissueinmillionsofUSdollars.Maturityisthedi¤erenceoftheissuedateandthematuritydateandismeasuredinmonths.
Seniorityreferstotheseniorityofthebond.InPanelC,wepresentthenumberofbondswithagivenratingasapercentageofthe
totalnumberofbondsthatareissuedduringthesampleperiod.
PanelA:BondCharacteristics
variable
mean
25thpcntl
50thpcntl
75thpcntl
o¤eringspread
6.83
6.13
6.89
7.56
treasuryspread
124.57
67.00
98.00
157.00
o¤eringamount($mil)
332.50
150.00
250.00
400.00
maturity(inmonths)
162.64
83.00
120.00
145.00
PanelB:SecurityFeatures
Seniority
Frequency
Percentage
seniorsecured
154
5.0%
senior
2719
87.5%
seniorsubordinate
230
7.4%
junior
10.0%
subordinate
10.0%
PanelC:Moody�sBondRatings
Moody�sRating
Frequency
Percentage
AAA
341.1%
AA
173
5.6%
A923
29.7%
BAA
1215
39.0%
BA
436
14.1%
B302
9.7%
CAAandbelow
230.7%
29

Table2:Classi�cation
ofCovenantsbytheNatureofRestrictions
The2006editionoftheFixedIncomeSecuritiesDatabase(FISD)isthesourceforallthedatapresentedinthistable.Thesample
isrestrictedtobondsissuedbyU.S.domicilednon-�nancial�rmsintheintersectionofCRSP/COMPUSTAT,FISDandExecutive
Compensationdatabases.WeconsideronlycorporatedebentureswithissuanceandcovenantinformationavailableinFISD.W
eexclude
convertiblebonds,securedleaseobligations,perpetualbonds,unitdeals,rule144abonds,MTN,privateplacementbonds,Yankee,
Canadian,andforeigncurrencybonds.The�fty-fourcovenantsinthebondindenturearegroupedintovariouscategoriesbasedon
thenatureoftherestrictions.WeuseSmithandWarner(1979)frameworktogroupthecovenantsandcodethebondashavinga
particularcovenantifthebondcontainsoneormoreofthecovenantsfallingunderthatcategory.Restrictionsonthesubsidiaryand
parentcompanyarebothconsidered.Mergerrestrictionsarecovenantsthatrestrictsaconsolidationormergerbytheissuing�rm.
Assetsaledispositioncovenantsincluderestrictionsonsaleofassets,assetsaleclauseandsaleandtransferofassetstounrestricted
subsidiaries.Abondiscodedashavinganindirectinvestmentrestrictioncovenantifthebond�sindentureincludesatleastoneofthe
followingcovenants:restrictionsontransactionswitha¢liates,�xedchargecoverage,maintenanceofminimum
networth,restrictions
onredesignatingsubsidiaries,subsidiary�xedchargecoverageratioandafteracquiredpropertyclause(thatmandatesthattheproperty
acquiredafterthecurrentdebtissueissoldwouldbeincludedinthecurrentissuersmortgage).Abondiscodedashavinginvestment
restrictionsifthebond�sindenturecontainsatleastoneofthefollowingrestrictions:restrictionsonconsolidationormergers,asset
dispositionrestriction,indirectinvestmentrestrictions,bondissecured,stocksalerestrictionsor,directinvestmentrestrictions.A
bondiscodedashavingdividendandpaymentrestrictionsifthebond�sindenturerestrictseitherdividendsorotherpayments.Debt
priorityrestrictionsincluderestrictionsonfundeddebt,indebtedness,liensand,seniordebtissuanceofparentandsubsidiary�rms.
Stockissuancerestrictioncategoryincluderestrictionsonissuanceofstockand,preferencestockofparentandsubsidiary�rms.Abond
iscodedashavingasubordinatedebtcovenantifthebondindentureincludesoneormoreofthefollowingrestrictions:subordinate
debtissuance,netearningstest,leveragetest,subsidiaryborrowings,subsidiaryguarantees,subsidiaryleveragetestandnegative
pledgecovenant(theissuercannotissuesecureddebtunlessitsecuresthecurrentissueonapari-passubasis).SubsequentFinancing
Restrictionsequalsoneifthebond�sindenturecontainsoneofdebtpriorityrestrictions,stockissuancerestrictions,subordinatedebt
restrictions,restrictionsonsaleandleaseobligations.Defaultrelatedeventcovenantsinclude:crossdefault,crossacceleration,rating
declinetriggerputanddecliningnetworthcovenant.Eventrestrictionsiscodedasoneifthebond�sindenturecontainsatleastone
covenantfallingunderdefaultrelatedeventcovenantsoriftheindenturecontainsachangeincontrolpoisonput.Eachrowlists
thenumberofbondswithoneormorecovenantsbelongingtothatcategoryasapercentageofinvestmentgradebonds(column1),
non-investmentgradebonds(column2)andallthebonds(column3)issuedduringthesampleperiodof1993-2005.
30

Covenant
Investment
Non-Inv.
Total
Grade
Grade
(N=2347)
(N=761)
(N=3108)
PanelA:InvestmentRestrictions
MergerRestrictions
91.0%
98.6%
92.9%
AssetDispositionRestriction
90.4%
98.8%
92.4%
IndirectInvestmentRestrictions
5.5%
71.7%
21.7%
Secured
4.6%
5.9%
5.0%
StockSaleRestrictions
0.7%
9.2%
2.8%
DirectInvestmentRestrictions
0.2%
5.0%
1.4%
InvestmentRestriction
94.5%
99.7%
95.8%
PanelB:DividendRestrictions
DividendPaymentRestrictions
2.7%
65.5%
18.1%
RestrictionsonOtherPayments
0.8%
70.3%
17.8%
DividendorOtherPaymentRestriction
3.2%
72.4%
20.1%
PanelC:SubsequentFinancingRestrictions
RestrictionsonSubordinateDebtIssuance
88.0%
90.1%
88.5%
RestrictionsonSaleandLeaseObligations
69.0%
49.9%
64.3%
RestrictionsonDebtPriority
14.0%
77.1%
29.4%
StockIssuanceRestriction
1.8%
48.4%
13.2%
SubsequentFinancingRestrictions
92.0%
97.9%
93.5%
PanelD:EventRelated
Restrictions
DefaultRelatedEventCovenants
46.7%
87.8%
56.7%
ChangeinControlPoisonPut
2.7%
73.3%
20.0%
EventRestrictions
47.6%
92.6%
58.6%
31
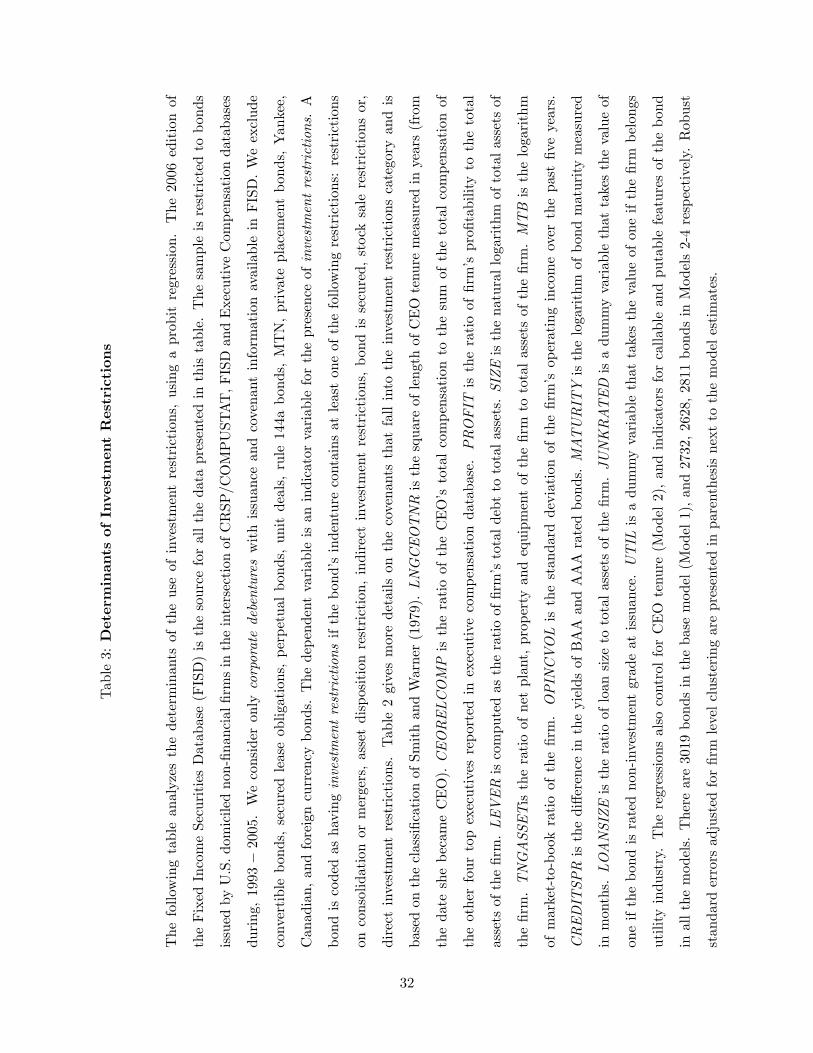
Table3:DeterminantsofInvestmentRestrictions
Thefollowingtableanalyzesthedeterminantsoftheuseofinvestmentrestrictions,usingaprobitregression.The2006editionof
theFixedIncomeSecuritiesDatabase(FISD)isthesourceforallthedatapresentedinthistable.Thesampleisrestrictedtobonds
issuedbyU.S.domicilednon-�nancial�rmsintheintersectionofCRSP/COMPUSTAT,FISDandExecutiveCompensationdatabases
during,1993�2005.WeconsideronlycorporatedebentureswithissuanceandcovenantinformationavailableinFISD.Weexclude
convertiblebonds,securedleaseobligations,perpetualbonds,unitdeals,rule144abonds,MTN,privateplacementbonds,Yankee,
Canadian,andforeigncurrencybonds.Thedependentvariableisanindicatorvariableforthepresenceofinvestmentrestrictions.A
bondiscodedashavinginvestmentrestrictionsifthebond�sindenturecontainsatleastoneofthefollowingrestrictions:restrictions
onconsolidationormergers,assetdispositionrestriction,indirectinvestmentrestrictions,bondissecured,stocksalerestrictionsor,
directinvestmentrestrictions.Table2givesmoredetailsonthecovenantsthatfallintotheinvestmentrestrictionscategoryandis
basedontheclassi�cationofSmithandWarner(1979).LNGCEOTNRisthesquareoflengthofCEOtenuremeasuredinyears(from
thedateshebecameCEO).CEORELCOMPistheratiooftheCEO�stotalcompensationtothesumofthetotalcompensationof
theotherfourtopexecutivesreportedinexecutivecompensationdatabase.PROFIT
istheratioof�rm�spro�tabilitytothetotal
assetsofthe�rm.LEVERiscomputedastheratioof�rm�stotaldebttototalassets.SIZEisthenaturallogarithmoftotalassetsof
the�rm.TNGASSETistheratioofnetplant,propertyandequipmentofthe�rmtototalassetsofthe�rm.MTBisthelogarithm
ofmarket-to-bookratioofthe�rm.OPINCVOListhestandarddeviationofthe�rm�soperatingincomeoverthepast�veyears.
CREDITSPRisthedi¤erenceintheyieldsofBAAandAAAratedbonds.MATURITYisthelogarithmofbondmaturitymeasured
inmonths.LOANSIZEistheratioofloansizetototalassetsofthe�rm.JUNKRATEDisadummyvariablethattakesthevalueof
oneifthebondisratednon-investmentgradeatissuance.UTILisadummyvariablethattakesthevalueofoneifthe�rmbelongs
utilityindustry.TheregressionsalsocontrolforCEOtenure(Model2),andindicatorsforcallableandputablefeaturesofthebond
inallthemodels.Thereare3019bondsinthebasemodel(Model1),and2732,2628,2811bondsinModels2-4respectively.Robust
standarderrorsadjustedfor�rmlevelclusteringarepresentedinparenthesisnexttothemodelestimates.
32
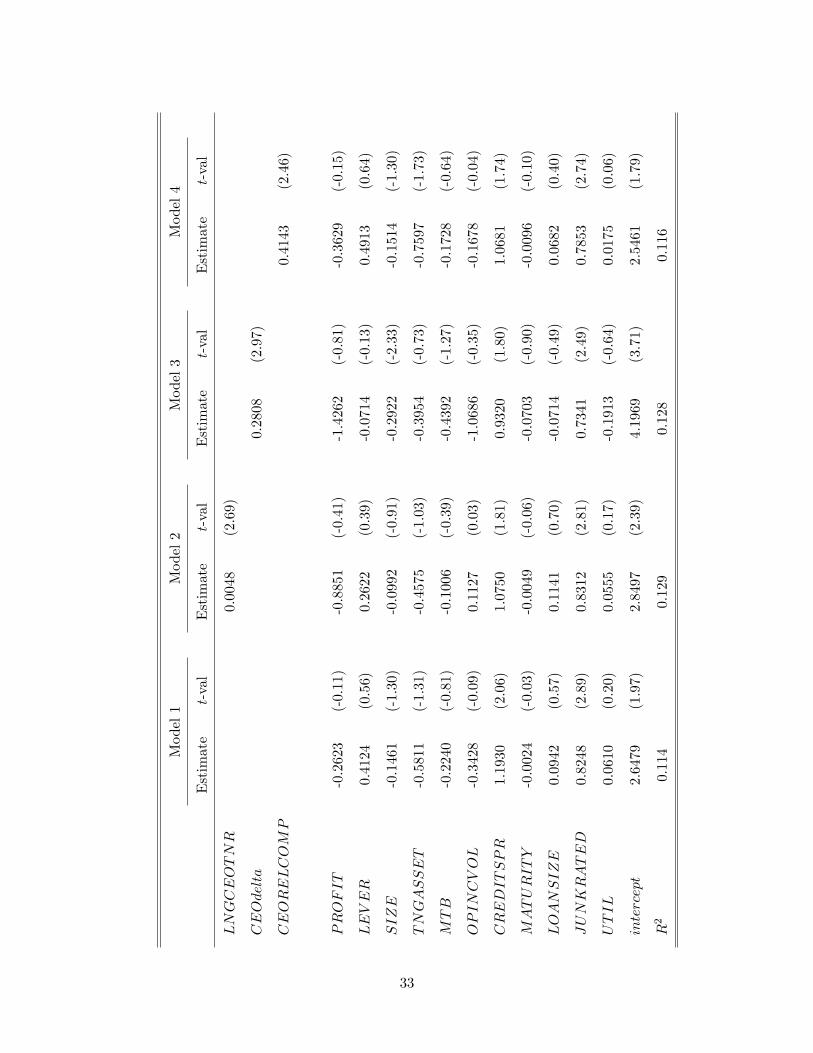
Model1
Model2
Model3
Model4
Estimate
t-val
Estimate
t-val
Estimate
t-val
Estimate
t-val
LNGCEOTNR
0.0048
(2.69)
CEOdelta
0.2808
(2.97)
CEORELCOMP
0.4143
(2.46)
PROFIT
-0.2623
(-0.11)
-0.8851
(-0.41)
-1.4262
(-0.81)
-0.3629
(-0.15)
LEVER
0.4124
(0.56)
0.2622
(0.39)
-0.0714
(-0.13)
0.4913
(0.64)
SIZE
-0.1461
(-1.30)
-0.0992
(-0.91)
-0.2922
(-2.33)
-0.1514
(-1.30)
TNGASSET
-0.5811
(-1.31)
-0.4575
(-1.03)
-0.3954
(-0.73)
-0.7597
(-1.73)
MTB
-0.2240
(-0.81)
-0.1006
(-0.39)
-0.4392
(-1.27)
-0.1728
(-0.64)
OPINCVOL
-0.3428
(-0.09)
0.1127
(0.03)
-1.0686
(-0.35)
-0.1678
(-0.04)
CREDITSPR
1.1930
(2.06)
1.0750
(1.81)
0.9320
(1.80)
1.0681
(1.74)
MATURITY
-0.0024
(-0.03)
-0.0049
(-0.06)
-0.0703
(-0.90)
-0.0096
(-0.10)
LOANSIZE
0.0942
(0.57)
0.1141
(0.70)
-0.0714
(-0.49)
0.0682
(0.40)
JUNKRATED
0.8248
(2.89)
0.8312
(2.81)
0.7341
(2.49)
0.7853
(2.74)
UTIL
0.0610
(0.20)
0.0555
(0.17)
-0.1913
(-0.64)
0.0175
(0.06)
intercept
2.6479
(1.97)
2.8497
(2.39)
4.1969
(3.71)
2.5461
(1.79)
R2
0.114
0.129
0.128
0.116
33
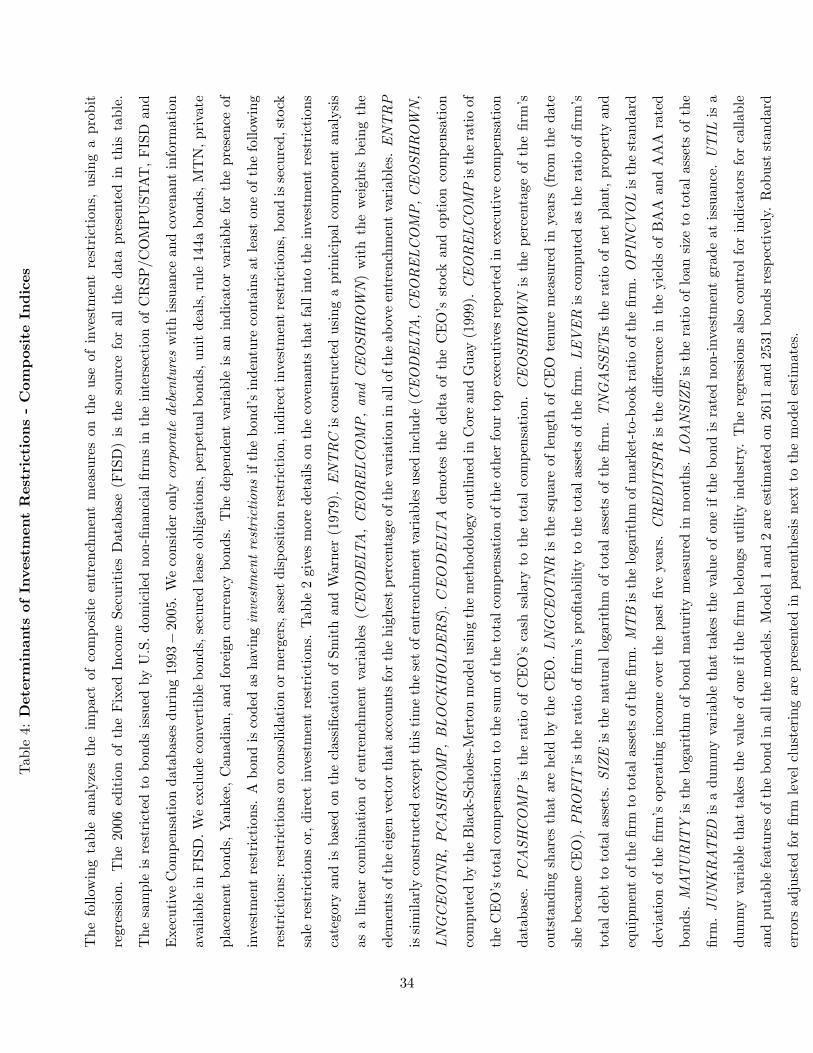
Table4:DeterminantsofInvestmentRestrictions-Com
positeIndices
Thefollowingtableanalyzestheimpactofcompositeentrenchmentmeasuresontheuseofinvestmentrestrictions,usingaprobit
regression.The2006editionoftheFixedIncomeSecuritiesDatabase(FISD)isthesourceforallthedatapresentedinthistable.
ThesampleisrestrictedtobondsissuedbyU.S.domicilednon-�nancial�rmsintheintersectionofCRSP/COMPUSTAT,FISDand
ExecutiveCompensationdatabasesduring1993�2005.Weconsideronlycorporatedebentureswithissuanceandcovenantinformation
availableinFISD.Weexcludeconvertiblebonds,securedleaseobligations,perpetualbonds,unitdeals,rule144abonds,MTN,private
placementbonds,Yankee,Canadian,andforeigncurrencybonds.Thedependentvariableisanindicatorvariableforthepresenceof
investmentrestrictions.Abondiscodedashavinginvestmentrestrictionsifthebond�sindenturecontainsatleastoneofthefollowing
restrictions:restrictionsonconsolidationormergers,assetdispositionrestriction,indirectinvestmentrestrictions,bondissecured,stock
salerestrictionsor,directinvestmentrestrictions.Table2givesmoredetailsonthecovenantsthatfallintotheinvestmentrestrictions
categoryandisbasedontheclassi�cationofSmithandWarner(1979).ENTRCisconstructedusingaprinicipalcomponentanalysis
asalinearcombinationofentrenchmentvariables(CEODELTA,CEORELCOMP,andCEOSHROWN)withtheweightsbeingthe
elementsoftheeigenvectorthataccountsforthehighestpercentageofthevariationinalloftheaboveentrenchmentvariables.ENTRP
issimilarlyconstructedexceptthistimethesetofentrenchmentvariablesusedinclude(CEODELTA,CEORELCOMP,CEOSHROWN,
LNGCEOTNR,PCASHCOMP,BLOCKHOLDERS).CEODELTAdenotesthedeltaoftheCEO�sstockandoptioncompensation
computedbytheBlack-Scholes-MertonmodelusingthemethodologyoutlinedinCoreandGuay(1999).CEORELCOMPistheratioof
theCEO�stotalcompensationtothesumofthetotalcompensationoftheotherfourtopexecutivesreportedinexecutivecompensation
database.PCASHCOMPistheratioofCEO�scashsalarytothetotalcompensation.CEOSHROWNisthepercentageofthe�rm�s
outstandingsharesthatareheldbytheCEO.LNGCEOTNRisthesquareoflengthofCEOtenuremeasuredinyears(fromthedate
shebecameCEO).PROFITistheratioof�rm�spro�tabilitytothetotalassetsofthe�rm.LEVERiscomputedastheratioof�rm�s
totaldebttototalassets.SIZEisthenaturallogarithmoftotalassetsofthe�rm.TNGASSETistheratioofnetplant,propertyand
equipmentofthe�rmtototalassetsofthe�rm.MTBisthelogarithmofmarket-to-bookratioofthe�rm.OPINCVOListhestandard
deviationofthe�rm�soperatingincomeoverthepast�veyears.CREDITSPRisthedi¤erenceintheyieldsofBAAandAAArated
bonds.MATURITYisthelogarithmofbondmaturitymeasuredinmonths.LOANSIZEistheratioofloansizetototalassetsofthe
�rm.JUNKRATEDisadummyvariablethattakesthevalueofoneifthebondisratednon-investmentgradeatissuance.UTILisa
dummyvariablethattakesthevalueofoneifthe�rmbelongsutilityindustry.Theregressionsalsocontrolforindicatorsforcallable
andputablefeaturesofthebondinallthemodels.Model1and2areestimatedon2611and2531bondsrespectively.Robuststandard
errorsadjustedfor�rmlevelclusteringarepresentedinparenthesisnexttothemodelestimates.
34
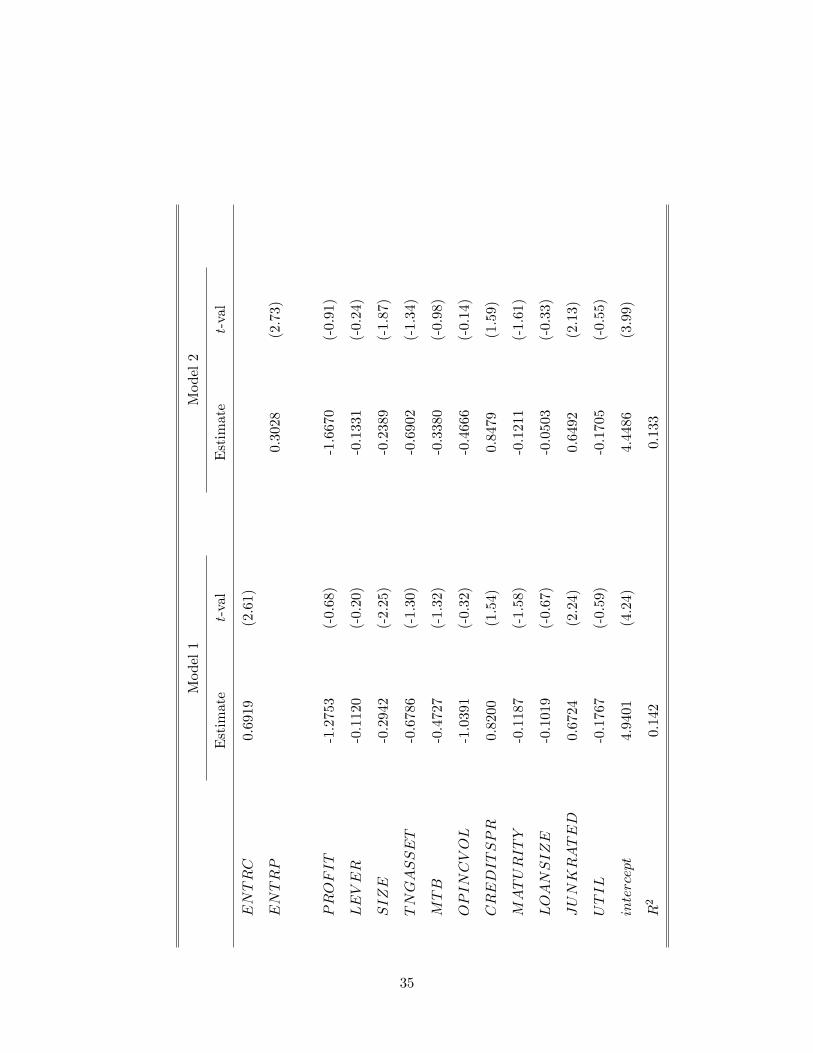
Model1
Model2
Estimate
t-val
Estimate
t-val
ENTRC
0.6919
(2.61)
ENTRP
0.3028
(2.73)
PROFIT
-1.2753
(-0.68)
-1.6670
(-0.91)
LEVER
-0.1120
(-0.20)
-0.1331
(-0.24)
SIZE
-0.2942
(-2.25)
-0.2389
(-1.87)
TNGASSET
-0.6786
(-1.30)
-0.6902
(-1.34)
MTB
-0.4727
(-1.32)
-0.3380
(-0.98)
OPINCVOL
-1.0391
(-0.32)
-0.4666
(-0.14)
CREDITSPR
0.8200
(1.54)
0.8479
(1.59)
MATURITY
-0.1187
(-1.58)
-0.1211
(-1.61)
LOANSIZE
-0.1019
(-0.67)
-0.0503
(-0.33)
JUNKRATED
0.6724
(2.24)
0.6492
(2.13)
UTIL
-0.1767
(-0.59)
-0.1705
(-0.55)
intercept
4.9401
(4.24)
4.4486
(3.99)
R2
0.142
0.133
35

Table5:ImpactofGrowthOptionson
InvestmentRestrictions
Thefollowingtableanalyzestheimpactofgrowthopportunitiesontheinclusionofinvestmentrestrictions,usingaprobitregression.
The2006editionoftheFixedIncomeSecuritiesDatabase(FISD)isthesourceforallthedatapresentedinthistable.Thesample
isrestrictedtobondsissuedbyU.S.domicilednon-�nancial�rmsintheintersectionofCRSP/COMPUSTAT,FISDandExecutive
Compensationdatabasesduring1993�2005.Weconsideronlycorporatedebentureswithissuanceandcovenantinformationavailable
inFISD.Weexcludeconvertiblebonds,securedleaseobligations,perpetualbonds,unitdeals,rule144abonds,MTN,privateplacement
bonds,Yankee,Canadian,andforeigncurrencybonds.Thedependentvariableisanindicatorvariableforthepresenceofinvestment
restrictions.Abondiscodedashavinginvestmentrestrictionsifthebond�sindenturecontainsatleastoneofthefollowingrestrictions:
restrictionson
consolidationormergers,assetdispositionrestriction,indirectinvestmentrestrictions,bondissecured,stocksale
restrictionsor,directinvestmentrestrictions.Table2givesmoredetailsonthecovenantsthatfallintotheinvestmentrestrictions
categoryandisbasedontheclassi�cationofSmithandWarner(1979).ENTRCisconstructedusingaprinicipalcomponentanalysis
asalinearcombinationofentrenchmentvariables(CEODELTA,CEORELCOMP,andCEOSHROWN)withtheweightsbeingthe
elementsoftheeigenvectorthataccountsforthehighestpercentageofthevariationinalloftheaboveentrenchmentvariables.
CEODELTAandCEOVEGAdenotesthedeltaandvegarespectivelyoftheCEO�sstockandoptioncompensationcomputedbythe
Black-Scholes-MertonmodelusingthemethodologyoutlinedinCoreandGuay(1999).PROFITistheratioof�rm�spro�tabilityto
thetotalassetsofthe�rm.LEVERiscomputedastheratioof�rm�stotaldebttototalassets.SIZEisthenaturallogarithmof
totalassetsofthe�rm.TNGASSETistheratioofnetplant,propertyandequipmentofthe�rmtototalassetsofthe�rm.MTBis
thelogarithmofmarket-to-bookratioofthe�rm.OPINCVOListhestandarddeviationofthe�rm�soperatingincomeoverthepast
�veyears.CREDITSPRisthedi¤erenceintheyieldsofBAAandAAAratedbonds.MATURITYisthelogarithmofbondmaturity
measuredinmonths.LOANSIZEistheratioofloansizetototalassetsofthe�rm.JUNKRATEDisadummyvariablethattakes
thevalueofoneifthebondisratednon-investmentgradeatissuance.UTILisadummyvariablethattakesthevalueofoneifthe
�rmbelongsutilityindustry.Theregressionsalsocontrolforindicatorsforcallableandputablefeaturesofthebondinallthemodels.
Model1,2and3areestimatedon2611,2628and2674bondsrespectively.Robuststandarderrorsadjustedfor�rmlevelclustering
arepresentedinparenthesisnexttothemodelestimates.
36
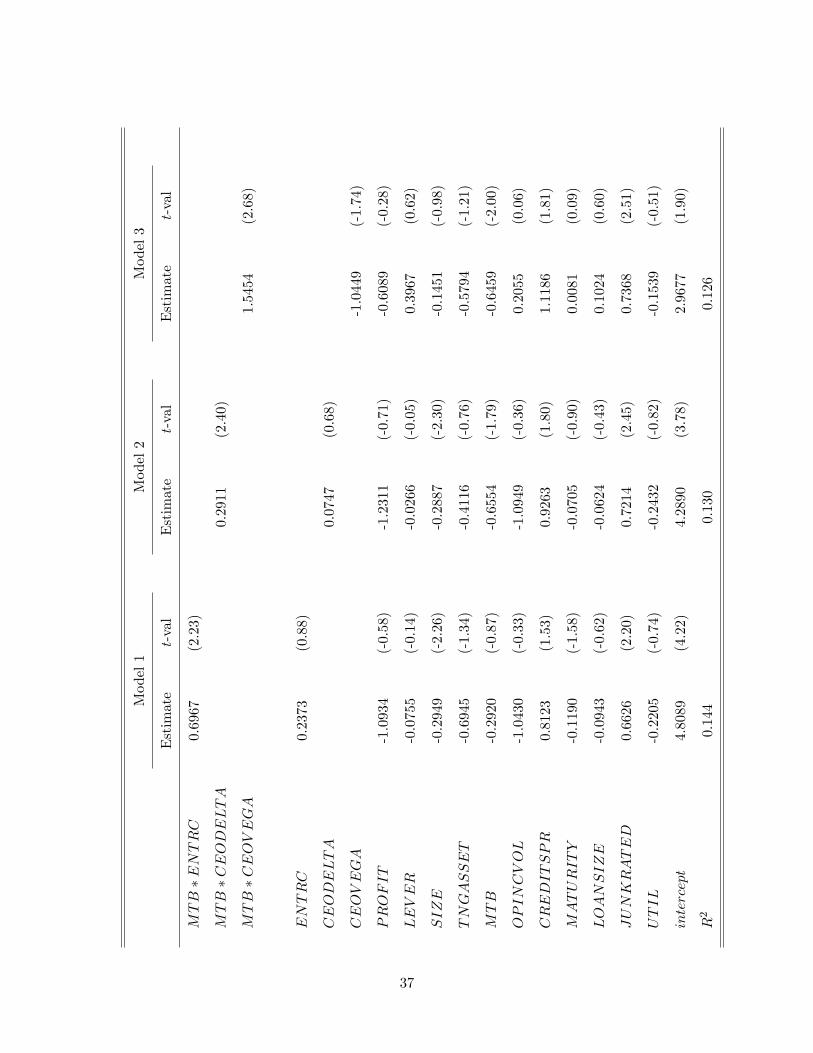
Model1
Model2
Model3
Estimate
t-val
Estimate
t-val
Estimate
t-val
MTB�ENTRC
0.6967
(2.23)
MTB�CEODELTA
0.2911
(2.40)
MTB�CEOVEGA
1.5454
(2.68)
ENTRC
0.2373
(0.88)
CEODELTA
0.0747
(0.68)
CEOVEGA
-1.0449
(-1.74)
PROFIT
-1.0934
(-0.58)
-1.2311
(-0.71)
-0.6089
(-0.28)
LEVER
-0.0755
(-0.14)
-0.0266
(-0.05)
0.3967
(0.62)
SIZE
-0.2949
(-2.26)
-0.2887
(-2.30)
-0.1451
(-0.98)
TNGASSET
-0.6945
(-1.34)
-0.4116
(-0.76)
-0.5794
(-1.21)
MTB
-0.2920
(-0.87)
-0.6554
(-1.79)
-0.6459
(-2.00)
OPINCVOL
-1.0430
(-0.33)
-1.0949
(-0.36)
0.2055
(0.06)
CREDITSPR
0.8123
(1.53)
0.9263
(1.80)
1.1186
(1.81)
MATURITY
-0.1190
(-1.58)
-0.0705
(-0.90)
0.0081
(0.09)
LOANSIZE
-0.0943
(-0.62)
-0.0624
(-0.43)
0.1024
(0.60)
JUNKRATED
0.6626
(2.20)
0.7214
(2.45)
0.7368
(2.51)
UTIL
-0.2205
(-0.74)
-0.2432
(-0.82)
-0.1539
(-0.51)
intercept
4.8089
(4.22)
4.2890
(3.78)
2.9677
(1.90)
R2
0.144
0.130
0.126
37

Table6:DeterminantsofConsolidationandMergerRestrictions
Thefollowingtableanalyzesthedeterminantsoftheuseofrestrictionsonconsolidationsandmergersbythe�rm,usingaprobit
regression.The2006editionoftheFixedIncomeSecuritiesDatabase(FISD)isthesourceforallthedatapresentedinthistable.
ThesampleisrestrictedtobondsissuedbyU.S.domicilednon-�nancial�rmsintheintersectionofCRSP/COMPUSTAT,FISDand
ExecutiveCompensationdatabasesduring1993�2005.Weconsideronlycorporatedebentureswithissuanceandcovenantinformation
availableinFISD.Weexcludeconvertiblebonds,securedleaseobligations,perpetualbonds,unitdeals,rule144abonds,MTN,private
placementbonds,Yankee,Canadian,andforeigncurrencybonds.Thedependentvariableisanindicatorvariableforthepresenceof
consolidationandmergerrestrictions.Table2givesmoredetailsonthecovenantsthatfallintotheinvestmentrestrictionscategory
andisbasedontheclassi�cationofSmithandWarner(1979).ENTRCisconstructedusingaprinicipalcomponentanalysisasalinear
combinationofentrenchmentvariables(CEODELTA,CEORELCOMP,andCEOSHROWN)withtheweightsbeingtheelementsof
theeigenvectorthataccountsforthehighestpercentageofthevariationinalloftheaboveentrenchmentvariables.
ENTRPis
similarlyconstructedexceptthistimethesetofentrenchmentvariablesusedinclude(CEODELTA,CEORELCOMP,CEOSHROWN,
LNGCEOTNR,PCASHCOMP,BLOCKHOLDERS).CEODELTAdenotesthedeltaoftheCEO�sstockandoptioncompensation
computedbytheBlack-Scholes-MertonmodelusingthemethodologyoutlinedinCoreandGuay(1999).CEORELCOMPistheratioof
theCEO�stotalcompensationtothesumofthetotalcompensationoftheotherfourtopexecutivesreportedinexecutivecompensation
database.PCASHCOMPistheratioofCEO�scashsalarytothetotalcompensation.CEOSHROWNisthepercentageofthe�rm�s
outstandingsharesthatareheldbytheCEO.LNGCEOTNRisthesquareoflengthofCEOtenuremeasuredinyears(fromthedate
shebecameCEO).PROFITistheratioof�rm�spro�tabilitytothetotalassetsofthe�rm.LEVERiscomputedastheratioof�rm�s
totaldebttototalassets.SIZEisthenaturallogarithmoftotalassetsofthe�rm.TNGASSETistheratioofnetplant,propertyand
equipmentofthe�rmtototalassetsofthe�rm.MTBisthelogarithmofmarket-to-bookratioofthe�rm.OPINCVOListhestandard
deviationofthe�rm�soperatingincomeoverthepast�veyears.CREDITSPRisthedi¤erenceintheyieldsofBAAandAAArated
bonds.MATURITYisthelogarithmofbondmaturitymeasuredinmonths.LOANSIZEistheratioofloansizetototalassetsofthe
�rm.JUNKRATEDisadummyvariablethattakesthevalueofoneifthebondisratednon-investmentgradeatissuance.UTILisa
dummyvariablethattakesthevalueofoneifthe�rmbelongsutilityindustry.TheregressionsalsocontrolforCEOtenure(Model2),
andindicatorsforcallableandputablefeaturesofthebondinallthemodels.Model1-4areestimatedon3019,2732,2611and2531
bondsrespectively.Robuststandarderrorsadjustedfor�rmlevelclusteringarepresentedinparenthesisnexttothemodelestimates.
38
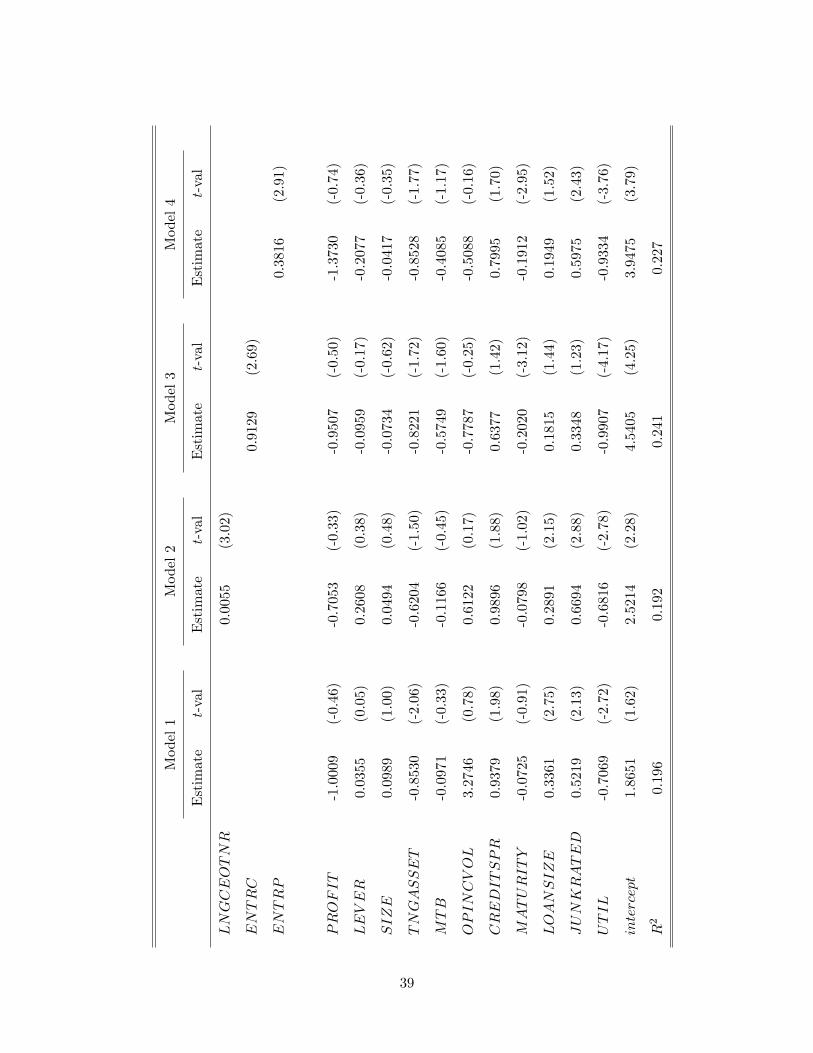
Model1
Model2
Model3
Model4
Estimate
t-val
Estimate
t-val
Estimate
t-val
Estimate
t-val
LNGCEOTNR
0.0055
(3.02)
ENTRC
0.9129
(2.69)
ENTRP
0.3816
(2.91)
PROFIT
-1.0009
(-0.46)
-0.7053
(-0.33)
-0.9507
(-0.50)
-1.3730
(-0.74)
LEVER
0.0355
(0.05)
0.2608
(0.38)
-0.0959
(-0.17)
-0.2077
(-0.36)
SIZE
0.0989
(1.00)
0.0494
(0.48)
-0.0734
(-0.62)
-0.0417
(-0.35)
TNGASSET
-0.8530
(-2.06)
-0.6204
(-1.50)
-0.8221
(-1.72)
-0.8528
(-1.77)
MTB
-0.0971
(-0.33)
-0.1166
(-0.45)
-0.5749
(-1.60)
-0.4085
(-1.17)
OPINCVOL
3.2746
(0.78)
0.6122
(0.17)
-0.7787
(-0.25)
-0.5088
(-0.16)
CREDITSPR
0.9379
(1.98)
0.9896
(1.88)
0.6377
(1.42)
0.7995
(1.70)
MATURITY
-0.0725
(-0.91)
-0.0798
(-1.02)
-0.2020
(-3.12)
-0.1912
(-2.95)
LOANSIZE
0.3361
(2.75)
0.2891
(2.15)
0.1815
(1.44)
0.1949
(1.52)
JUNKRATED
0.5219
(2.13)
0.6694
(2.88)
0.3348
(1.23)
0.5975
(2.43)
UTIL
-0.7069
(-2.72)
-0.6816
(-2.78)
-0.9907
(-4.17)
-0.9334
(-3.76)
intercept
1.8651
(1.62)
2.5214
(2.28)
4.5405
(4.25)
3.9475
(3.79)
R2
0.196
0.192
0.241
0.227
39

Table7:DeterminantsofDividendRestrictions
Thefollowingtableanalyzesthedeterminantsoftheuseofrestrictionsondividendsandotherpayments,usingaprobitregression.
The2006editionoftheFixedIncomeSecuritiesDatabase(FISD)isthesourceforallthedatapresentedinthistable.Thesample
isrestrictedtobondsissuedbyU.S.domicilednon-�nancial�rmsintheintersectionofCRSP/COMPUSTAT,FISDandExecutive
Compensationdatabasesduring1993�2005.Weconsideronlycorporatedebentureswithissuanceandcovenantinformationavailable
inFISD.Weexcludeconvertiblebonds,securedleaseobligations,perpetualbonds,unitdeals,rule144abonds,MTN,privateplacement
bonds,Yankee,Canadian,andforeigncurrencybonds.Thedependentvariableisanindicatorvariableforthepresenceofdividend
andotherpaymentrestrictions.Table2givesmoredetailsonthecovenantsthatfallintotheinvestmentrestrictionscategoryand
isbasedontheclassi�cationofSmithandWarner(1979).ENTRCisconstructedusingaprinicipalcomponentanalysisasalinear
combinationofentrenchmentvariables(CEODELTA,CEORELCOMP,andCEOSHROWN)withtheweightsbeingtheelementsof
theeigenvectorthataccountsforthehighestpercentageofthevariationinalloftheaboveentrenchmentvariables.
ENTRPis
similarlyconstructedexceptthistimethesetofentrenchmentvariablesusedinclude(CEODELTA,CEORELCOMP,CEOSHROWN,
LNGCEOTNR,PCASHCOMP,BLOCKHOLDERS).CEODELTAdenotesthedeltaoftheCEO�sstockandoptioncompensation
computedbytheBlack-Scholes-MertonmodelusingthemethodologyoutlinedinCoreandGuay(1999).CEORELCOMPistheratioof
theCEO�stotalcompensationtothesumofthetotalcompensationoftheotherfourtopexecutivesreportedinexecutivecompensation
database.PCASHCOMPistheratioofCEO�scashsalarytothetotalcompensation.CEOSHROWNisthepercentageofthe�rm�s
outstandingsharesthatareheldbytheCEO.LNGCEOTNRisthesquareoflengthofCEOtenuremeasuredinyears(fromthedate
shebecameCEO).PROFITistheratioof�rm�spro�tabilitytothetotalassetsofthe�rm.LEVERiscomputedastheratioof�rm�s
totaldebttototalassets.SIZEisthenaturallogarithmoftotalassetsofthe�rm.TNGASSETistheratioofnetplant,propertyand
equipmentofthe�rmtototalassetsofthe�rm.MTBisthelogarithmofmarket-to-bookratioofthe�rm.OPINCVOListhestandard
deviationofthe�rm�soperatingincomeoverthepast�veyears.CREDITSPRisthedi¤erenceintheyieldsofBAAandAAArated
bonds.MATURITYisthelogarithmofbondmaturitymeasuredinmonths.LOANSIZEistheratioofloansizetototalassetsofthe
�rm.JUNKRATEDisadummyvariablethattakesthevalueofoneifthebondisratednon-investmentgradeatissuance.UTILisa
dummyvariablethattakesthevalueofoneifthe�rmbelongsutilityindustry.TheregressionsalsocontrolforCEOtenure(Model2),
andindicatorsforcallableandputablefeaturesofthebondinallthemodels.Model1-4areestimatedon3019,2732,2611and2531
bondsrespectively.Robuststandarderrorsadjustedfor�rmlevelclusteringarepresentedinparenthesisnexttothemodelestimates.
40
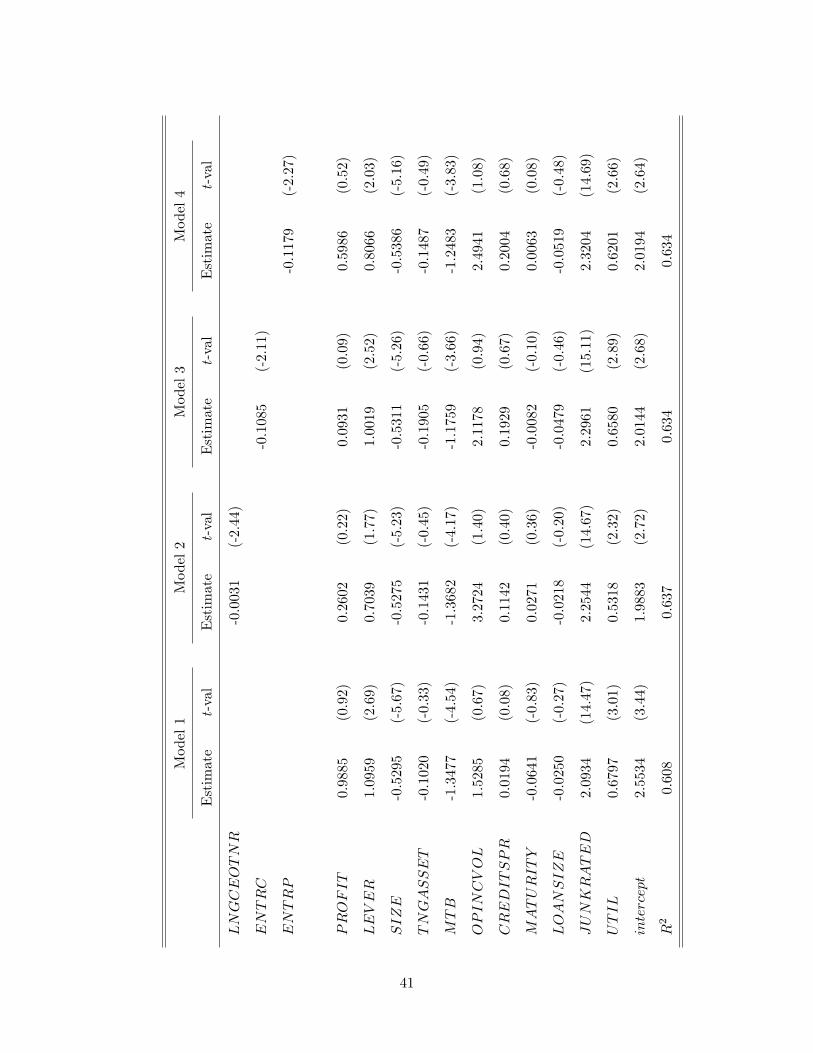
Model1
Model2
Model3
Model4
Estimate
t-val
Estimate
t-val
Estimate
t-val
Estimate
t-val
LNGCEOTNR
-0.0031
(-2.44)
ENTRC
-0.1085
(-2.11)
ENTRP
-0.1179
(-2.27)
PROFIT
0.9885
(0.92)
0.2602
(0.22)
0.0931
(0.09)
0.5986
(0.52)
LEVER
1.0959
(2.69)
0.7039
(1.77)
1.0019
(2.52)
0.8066
(2.03)
SIZE
-0.5295
(-5.67)
-0.5275
(-5.23)
-0.5311
(-5.26)
-0.5386
(-5.16)
TNGASSET
-0.1020
(-0.33)
-0.1431
(-0.45)
-0.1905
(-0.66)
-0.1487
(-0.49)
MTB
-1.3477
(-4.54)
-1.3682
(-4.17)
-1.1759
(-3.66)
-1.2483
(-3.83)
OPINCVOL
1.5285
(0.67)
3.2724
(1.40)
2.1178
(0.94)
2.4941
(1.08)
CREDITSPR
0.0194
(0.08)
0.1142
(0.40)
0.1929
(0.67)
0.2004
(0.68)
MATURITY
-0.0641
(-0.83)
0.0271
(0.36)
-0.0082
(-0.10)
0.0063
(0.08)
LOANSIZE
-0.0250
(-0.27)
-0.0218
(-0.20)
-0.0479
(-0.46)
-0.0519
(-0.48)
JUNKRATED
2.0934
(14.47)
2.2544
(14.67)
2.2961
(15.11)
2.3204
(14.69)
UTIL
0.6797
(3.01)
0.5318
(2.32)
0.6580
(2.89)
0.6201
(2.66)
intercept
2.5534
(3.44)
1.9883
(2.72)
2.0144
(2.68)
2.0194
(2.64)
R2
0.608
0.637
0.634
0.634
41

Table8:ImpactofStateLawson
theUseofDividendRestrictions
ThefollowingtableanalyzestheimpactofStatepayoutrestrictionsontheinclusionofdividendandpaymentcovenants,usingaprobit
regression.The2006editionoftheFixedIncomeSecuritiesDatabase(FISD)isthesourceforallthedatapresentedinthistable.
ThesampleisrestrictedtobondsissuedbyU.S.domicilednon-�nancial�rmsintheintersectionofCRSP/COMPUSTAT,FISDand
ExecutiveCompensationdatabasesduring1993�2005.Weconsideronlycorporatedebentureswithissuanceandcovenantinformation
availableinFISD.Weexcludeconvertiblebonds,securedleaseobligations,perpetualbonds,unitdeals,rule144abonds,MTN,private
placementbonds,Yankee,Canadianandforeigncurrencybonds.Thedependentvariableisanindicatorvariableforthepresenceof
dividendandotherpaymentrestrictions.Table2givesmoredetailsonthecovenantsthatfallintothedividend
andotherpayment
restrictionscategoryandisbasedontheclassi�cationofSmithandWarner(1979).Thehistoricalstateofincorporationisobtained
from
EDGAR10-K
�lingsofthe�rm.NimbleDividends:WefollowPetersonandHawker(1997)andassignNIMBLE=1ifthe
corporatelawofthestateinwhichthebondissuerisincorporatedallowsboardsofdirectorstopaycashandpropertydividendsoutof
eitherearnedsurplusorthesumofthe"precedingandcurrent�scalyear�searnings".Earningsratherthanearnedsurplusde�nethe
operativelimitonthelegalityofthese"nimbledividends."Consequently,boardsofdirectorscouldconceivablydeclarecashdividends
evenwhentotalliabilitiesexceedtotalassets.TotalAssetConstraint:TACONSTR=1ifthecorporatelawofthestateinwhichthe
bondissuerisincorporatedrequiresthatthe�rmcanpaydividendsorotherdistributionsonlyifitmeetstheassettest,i.e.,thatthenet
assetsofthe�rmshouldbegreaterthanitsliabilities.PROFITistheratioof�rm�spro�tabilitytothetotalassetsofthe�rm.LEVER
iscomputedastheratioof�rm�stotaldebttototalassets.SIZEisthenaturallogarithmoftotalassetsofthe�rm.TNGASSETis
theratioofnetplant,propertyandequipmentofthe�rmtototalassetsofthe�rm.MTBisthelogarithmofmarket-to-bookratioof
the�rm.OPINCVOListhestandarddeviationofthe�rm�soperatingincomeoverthepast�veyears.CREDITSPRisthedi¤erence
intheyieldsofBAAandAAAratedbonds.MATURITYisthelogarithmofbondmaturitymeasuredinmonths.LOANSIZEis
theratioofloansizetototalassetsofthe�rm.JUNKRATEDisadummyvariablethattakesthevalueofoneifthebondisrated
non-investmentgradeatissuance.UTILisadummyvariablethattakesthevalueofoneifthe�rmbelongsutilityindustry.The
regressionsalsoincludeindicatorsforcallableandputablefeaturesofthebondinboththemodels.Models1and2areestimatedon
2173bonds.Robuststandarderrorsadjustedfor�rmlevelclusteringarepresentedinparenthesisnexttothemodelestimates.
42

Model1
Model2
Estimate
t-val
Estimate
t-val
TACONSTR
-0.4084
(-2.28)
NIMBLE
0.3876
(2.23)
PROFIT
0.6908
(0.48)
0.3204
(0.22)
LEVER
1.4293
(2.88)
1.4912
(2.90)
SIZE
-0.4077
(-2.87)
-0.4672
(-3.40)
TNGASSET
-0.4275
(-0.96)
-0.3200
(-0.72)
MTB
-1.5462
(-3.82)
-1.5910
(-3.83)
OPINCVOL
2.3255
(0.67)
2.1448
(0.60)
CREDITSPR
0.2332
(0.69)
0.3163
(0.92)
MATURITY
-0.1561
(-0.96)
-0.0866
(-0.55)
LOANSIZE
0.1889
(1.40)
0.1348
(1.03)
JUNKRATED
2.1693
(11.03)
2.1985
(11.14)
UTIL
0.3579
(0.98)
0.3600
(0.97)
intercept
2.3579
(1.78)
1.8842
(1.43)
R2
0.706
0.713
43
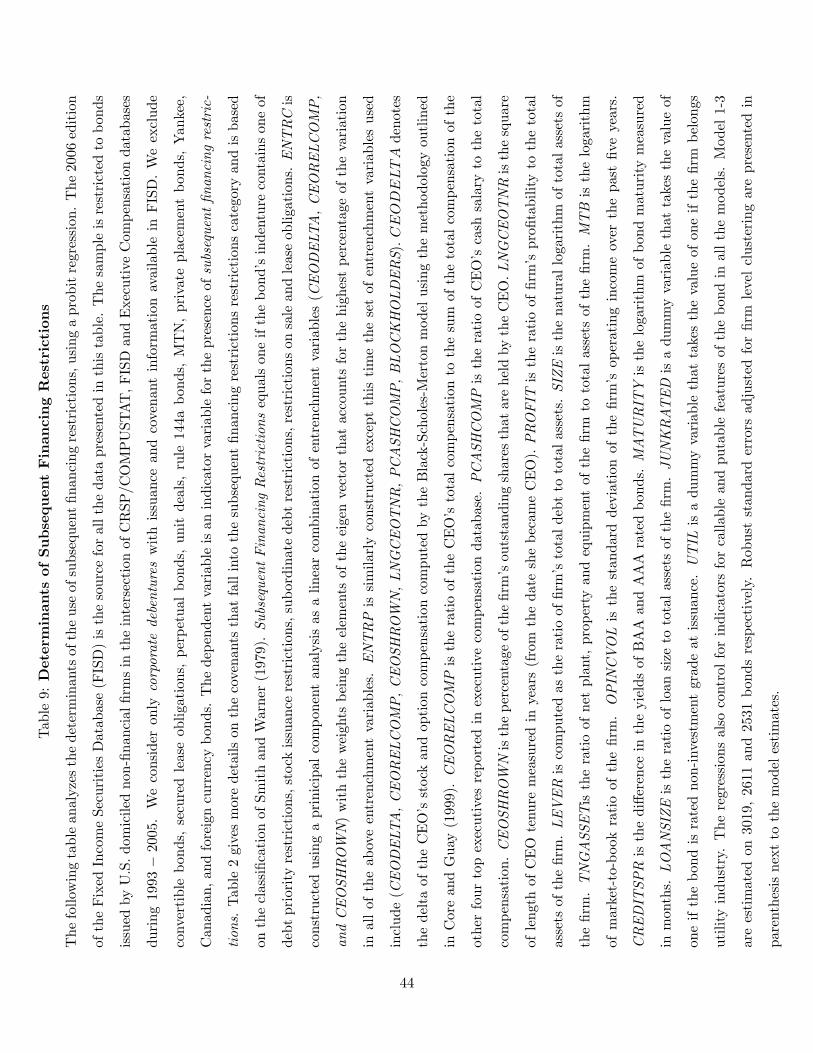
Table9:DeterminantsofSubsequentFinancingRestrictions
Thefollowingtableanalyzesthedeterminantsoftheuseofsubsequent�nancingrestrictions,usingaprobitregression.The2006edition
oftheFixedIncomeSecuritiesDatabase(FISD)isthesourceforallthedatapresentedinthistable.Thesampleisrestrictedtobonds
issuedbyU.S.domicilednon-�nancial�rmsintheintersectionofCRSP/COMPUSTAT,FISDandExecutiveCompensationdatabases
during1993�2005.WeconsideronlycorporatedebentureswithissuanceandcovenantinformationavailableinFISD.Weexclude
convertiblebonds,securedleaseobligations,perpetualbonds,unitdeals,rule144abonds,MTN,privateplacementbonds,Yankee,
Canadian,andforeigncurrencybonds.Thedependentvariableisanindicatorvariableforthepresenceofsubsequent�nancingrestric-
tions.Table2givesmoredetailsonthecovenantsthatfallintothesubsequent�nancingrestrictionsrestrictionscategoryandisbased
ontheclassi�cationofSmithandWarner(1979).SubsequentFinancingRestrictionsequalsoneifthebond�sindenturecontainsoneof
debtpriorityrestrictions,stockissuancerestrictions,subordinatedebtrestrictions,restrictionsonsaleandleaseobligations.ENTRCis
constructedusingaprinicipalcomponentanalysisasalinearcombinationofentrenchmentvariables(CEODELTA,CEORELCOMP,
andCEOSHROWN)withtheweightsbeingtheelementsoftheeigenvectorthataccountsforthehighestpercentageofthevariation
inalloftheaboveentrenchmentvariables.ENTRPissimilarlyconstructedexceptthistimethesetofentrenchmentvariablesused
include(CEODELTA,CEORELCOMP,CEOSHROWN,LNGCEOTNR,PCASHCOMP,BLOCKHOLDERS).CEODELTAdenotes
thedeltaoftheCEO�sstockandoptioncompensationcomputedbytheBlack-Scholes-Mertonmodelusingthemethodologyoutlined
inCoreandGuay(1999).CEORELCOMPistheratiooftheCEO�stotalcompensationtothesumofthetotalcompensationofthe
otherfourtopexecutivesreportedinexecutivecompensationdatabase.PCASHCOMPistheratioofCEO�scashsalarytothetotal
compensation.CEOSHROWNisthepercentageofthe�rm�soutstandingsharesthatareheldbytheCEO.LNGCEOTNRisthesquare
oflengthofCEOtenuremeasuredinyears(fromthedateshebecameCEO).PROFITistheratioof�rm�spro�tabilitytothetotal
assetsofthe�rm.LEVERiscomputedastheratioof�rm�stotaldebttototalassets.SIZEisthenaturallogarithmoftotalassetsof
the�rm.TNGASSETistheratioofnetplant,propertyandequipmentofthe�rmtototalassetsofthe�rm.MTBisthelogarithm
ofmarket-to-bookratioofthe�rm.OPINCVOListhestandarddeviationofthe�rm�soperatingincomeoverthepast�veyears.
CREDITSPRisthedi¤erenceintheyieldsofBAAandAAAratedbonds.MATURITYisthelogarithmofbondmaturitymeasured
inmonths.LOANSIZEistheratioofloansizetototalassetsofthe�rm.JUNKRATEDisadummyvariablethattakesthevalueof
oneifthebondisratednon-investmentgradeatissuance.UTILisadummyvariablethattakesthevalueofoneifthe�rmbelongs
utilityindustry.Theregressionsalsocontrolforindicatorsforcallableandputablefeaturesofthebondinallthemodels.Model1-3
areestimatedon3019,2611and2531bondsrespectively.Robuststandarderrorsadjustedfor�rmlevelclusteringarepresentedin
parenthesisnexttothemodelestimates.
44
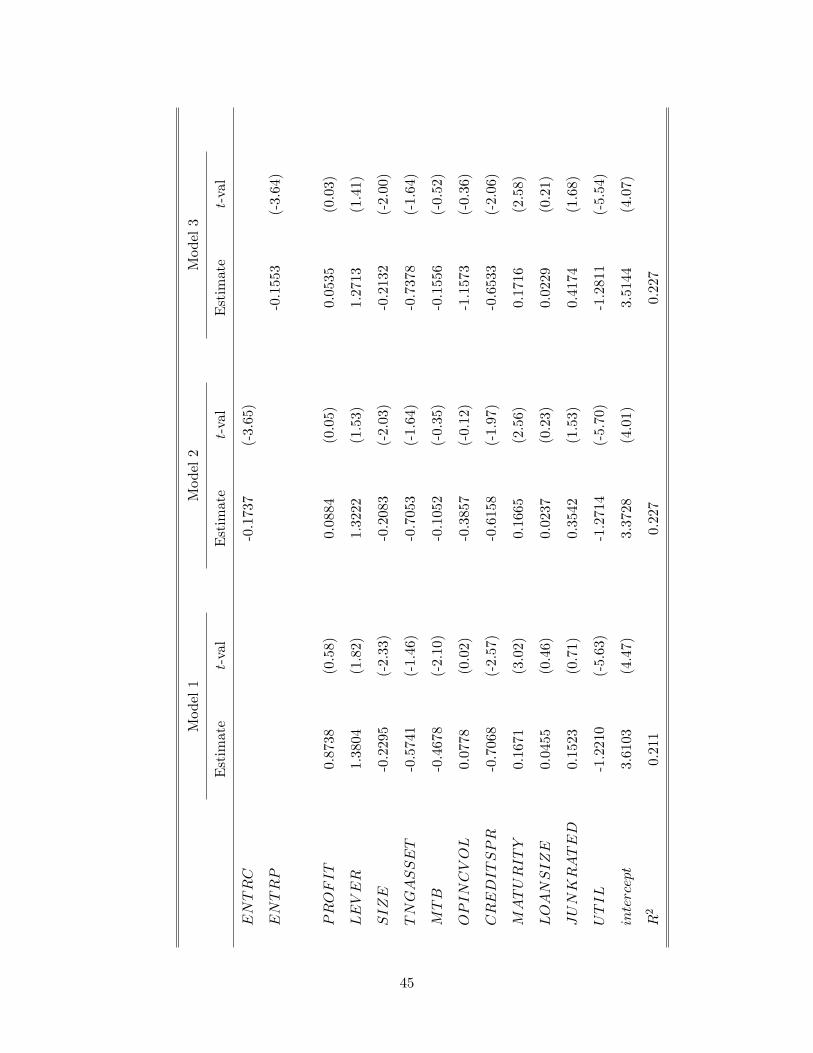
Model1
Model2
Model3
Estimate
t-val
Estimate
t-val
Estimate
t-val
ENTRC
-0.1737
(-3.65)
ENTRP
-0.1553
(-3.64)
PROFIT
0.8738
(0.58)
0.0884
(0.05)
0.0535
(0.03)
LEVER
1.3804
(1.82)
1.3222
(1.53)
1.2713
(1.41)
SIZE
-0.2295
(-2.33)
-0.2083
(-2.03)
-0.2132
(-2.00)
TNGASSET
-0.5741
(-1.46)
-0.7053
(-1.64)
-0.7378
(-1.64)
MTB
-0.4678
(-2.10)
-0.1052
(-0.35)
-0.1556
(-0.52)
OPINCVOL
0.0778
(0.02)
-0.3857
(-0.12)
-1.1573
(-0.36)
CREDITSPR
-0.7068
(-2.57)
-0.6158
(-1.97)
-0.6533
(-2.06)
MATURITY
0.1671
(3.02)
0.1665
(2.56)
0.1716
(2.58)
LOANSIZE
0.0455
(0.46)
0.0237
(0.23)
0.0229
(0.21)
JUNKRATED
0.1523
(0.71)
0.3542
(1.53)
0.4174
(1.68)
UTIL
-1.2210
(-5.63)
-1.2714
(-5.70)
-1.2811
(-5.54)
intercept
3.6103
(4.47)
3.3728
(4.01)
3.5144
(4.07)
R2
0.211
0.227
0.227
45
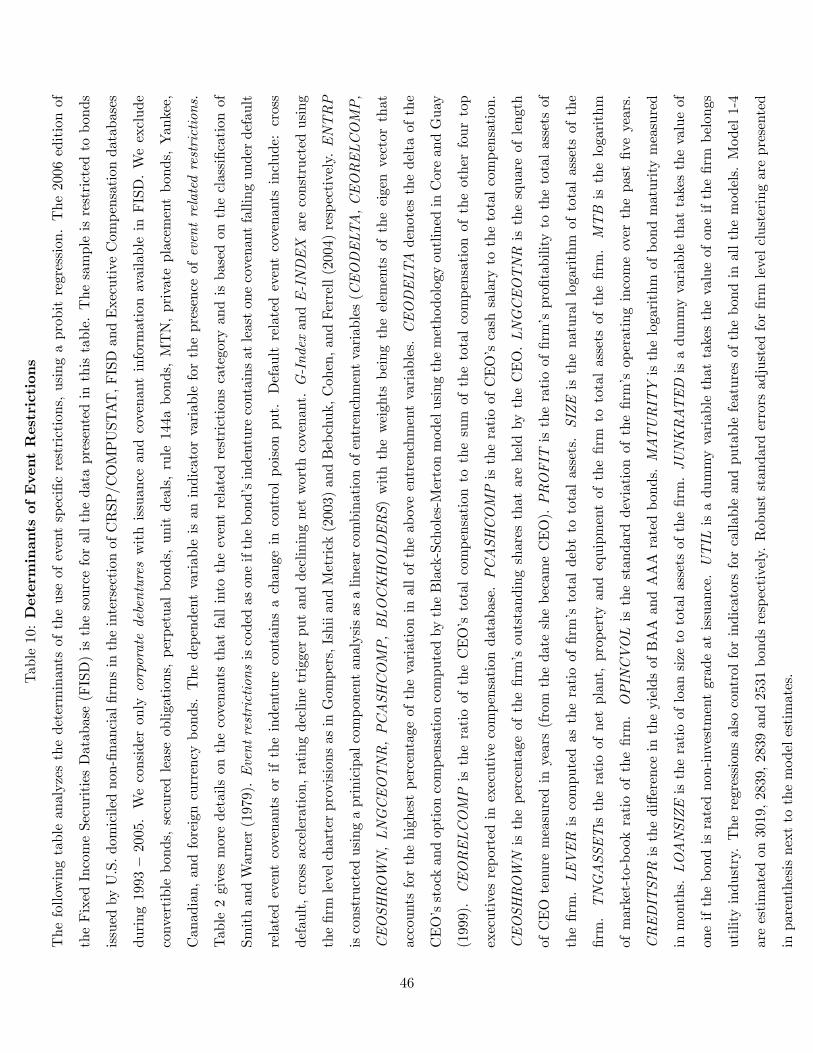
Table10:DeterminantsofEventRestrictions
Thefollowingtableanalyzesthedeterminantsoftheuseofeventspeci�crestrictions,usingaprobitregression.The2006editionof
theFixedIncomeSecuritiesDatabase(FISD)isthesourceforallthedatapresentedinthistable.Thesampleisrestrictedtobonds
issuedbyU.S.domicilednon-�nancial�rmsintheintersectionofCRSP/COMPUSTAT,FISDandExecutiveCompensationdatabases
during1993�2005.WeconsideronlycorporatedebentureswithissuanceandcovenantinformationavailableinFISD.Weexclude
convertiblebonds,securedleaseobligations,perpetualbonds,unitdeals,rule144abonds,MTN,privateplacementbonds,Yankee,
Canadian,andforeigncurrencybonds.Thedependentvariableisanindicatorvariableforthepresenceofeventrelatedrestrictions.
Table2givesmoredetailsonthecovenantsthatfallintotheeventrelatedrestrictionscategoryandisbasedontheclassi�cationof
SmithandWarner(1979).Eventrestrictionsiscodedasoneifthebond�sindenturecontainsatleastonecovenantfallingunderdefault
relatedeventcovenantsoriftheindenturecontainsachangeincontrolpoisonput.Defaultrelatedeventcovenantsinclude:cross
default,crossacceleration,ratingdeclinetriggerputanddecliningnetworthcovenant.G-IndexandE-INDEXareconstructedusing
the�rmlevelcharterprovisionsasinGompers,IshiiandMetrick(2003)andBebchuk,Cohen,andFerrell(2004)respectively.ENTRP
isconstructedusingaprinicipalcomponentanalysisasalinearcombinationofentrenchmentvariables(CEODELTA,CEORELCOMP,
CEOSHROWN,LNGCEOTNR,PCASHCOMP,BLOCKHOLDERS)withtheweightsbeing
theelementsoftheeigenvectorthat
accountsforthehighestpercentageofthevariationinalloftheaboveentrenchmentvariables.CEODELTAdenotesthedeltaofthe
CEO�sstockandoptioncompensationcomputedbytheBlack-Scholes-MertonmodelusingthemethodologyoutlinedinCoreandGuay
(1999).CEORELCOMPistheratiooftheCEO�stotalcompensationtothesumofthetotalcompensationoftheotherfourtop
executivesreportedinexecutivecompensationdatabase.PCASHCOMPistheratioofCEO�scashsalarytothetotalcompensation.
CEOSHROWNisthepercentageofthe�rm�soutstandingsharesthatareheldbytheCEO.LNGCEOTNRisthesquareoflength
ofCEOtenuremeasuredinyears(fromthedateshebecameCEO).PROFITistheratioof�rm�spro�tabilitytothetotalassetsof
the�rm.LEVERiscomputedastheratioof�rm�stotaldebttototalassets.SIZEisthenaturallogarithmoftotalassetsofthe
�rm.TNGASSETistheratioofnetplant,propertyandequipmentofthe�rmtototalassetsofthe�rm.MTBisthelogarithm
ofmarket-to-bookratioofthe�rm.OPINCVOListhestandarddeviationofthe�rm�soperatingincomeoverthepast�veyears.
CREDITSPRisthedi¤erenceintheyieldsofBAAandAAAratedbonds.MATURITYisthelogarithmofbondmaturitymeasured
inmonths.LOANSIZEistheratioofloansizetototalassetsofthe�rm.JUNKRATEDisadummyvariablethattakesthevalueof
oneifthebondisratednon-investmentgradeatissuance.UTILisadummyvariablethattakesthevalueofoneifthe�rmbelongs
utilityindustry.Theregressionsalsocontrolforindicatorsforcallableandputablefeaturesofthebondinallthemodels.Model1-4
areestimatedon3019,2839,2839and2531bondsrespectively.Robuststandarderrorsadjustedfor�rmlevelclusteringarepresented
inparenthesisnexttothemodelestimates.
46
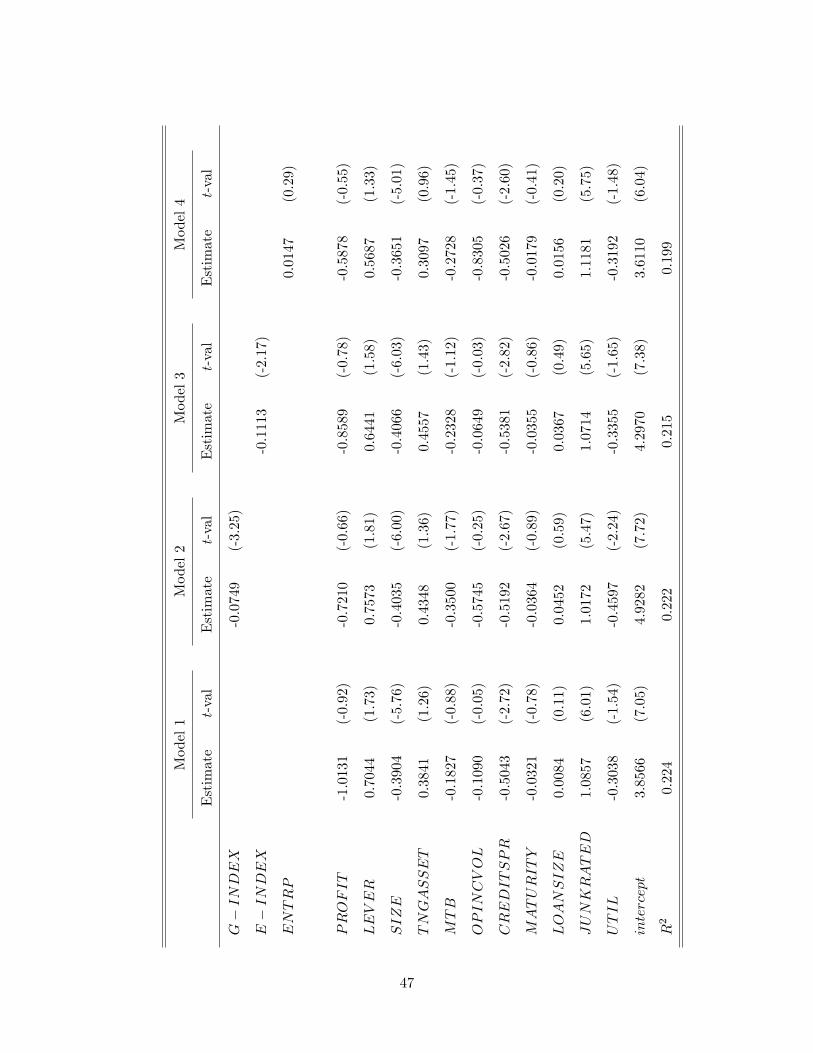
Model1
Model2
Model3
Model4
Estimate
t-val
Estimate
t-val
Estimate
t-val
Estimate
t-val
G�INDEX
-0.0749
(-3.25)
E�INDEX
-0.1113
(-2.17)
ENTRP
0.0147
(0.29)
PROFIT
-1.0131
(-0.92)
-0.7210
(-0.66)
-0.8589
(-0.78)
-0.5878
(-0.55)
LEVER
0.7044
(1.73)
0.7573
(1.81)
0.6441
(1.58)
0.5687
(1.33)
SIZE
-0.3904
(-5.76)
-0.4035
(-6.00)
-0.4066
(-6.03)
-0.3651
(-5.01)
TNGASSET
0.3841
(1.26)
0.4348
(1.36)
0.4557
(1.43)
0.3097
(0.96)
MTB
-0.1827
(-0.88)
-0.3500
(-1.77)
-0.2328
(-1.12)
-0.2728
(-1.45)
OPINCVOL
-0.1090
(-0.05)
-0.5745
(-0.25)
-0.0649
(-0.03)
-0.8305
(-0.37)
CREDITSPR
-0.5043
(-2.72)
-0.5192
(-2.67)
-0.5381
(-2.82)
-0.5026
(-2.60)
MATURITY
-0.0321
(-0.78)
-0.0364
(-0.89)
-0.0355
(-0.86)
-0.0179
(-0.41)
LOANSIZE
0.0084
(0.11)
0.0452
(0.59)
0.0367
(0.49)
0.0156
(0.20)
JUNKRATED
1.0857
(6.01)
1.0172
(5.47)
1.0714
(5.65)
1.1181
(5.75)
UTIL
-0.3038
(-1.54)
-0.4597
(-2.24)
-0.3355
(-1.65)
-0.3192
(-1.48)
intercept
3.8566
(7.05)
4.9282
(7.72)
4.2970
(7.38)
3.6110
(6.04)
R2
0.224
0.222
0.215
0.199
47

Table11:ImpactofCorporateCharterProvisionson
EventRestrictions
Thefollowingtableanalyzestheimpactofcertaincorporatecharterpovisionsontheuseofeventrestrictions,usingaprobitregression.
The2006editionoftheFixedIncomeSecuritiesDatabase(FISD)isthesourceforallthedatapresentedinthistable.Thesample
isrestrictedtobondsissuedbyU.S.domicilednon-�nancial�rmsintheintersectionofCRSP/COMPUSTAT,FISDandExecutive
Compensationdatabasesduring1993�2005.Weconsideronlycorporatedebentureswithissuanceandcovenantinformationavailable
inFISD.Weexcludeconvertiblebonds,securedleaseobligations,perpetualbonds,unitdeals,rule144abonds,MTN,privateplacement
bonds,Yankee,Canadian,andforeigncurrencybonds.Thedependentvariableisanindicatorvariableforthepresenceofeventrelated
restrictions.Table2givesmoredetailsonthecovenantsthatfallintotheeventrelatedrestrictionscategoryandisbasedonthe
classi�cationofSmithandWarner(1979).Eventrestrictionsiscodedasoneifthebond�sindenturecontainsatleastonecovenant
fallingunderdefaultrelatedeventcovenantsoriftheindenturecontainsachangeincontrolpoisonput.Defaultrelatedeventcovenants
include:crossdefault,crossacceleration,ratingdeclinetriggerputanddecliningnetworthcovenant.PPILLisadummyvariablethat
takesthevalueofoneifthe�rm�scharterhasapoisionpillprovisionandzerootherwise.G-INDEXandthesub-indicesG-DELAY,
G-PROTECTION,G-STATE,G-VOTING,G-OTHERareconstructedusingthe�rmlevelcharterprovisionsasinGompersetal.
(2003).PROFITistheratioof�rm�spro�tabilitytothetotalassetsofthe�rm.LEVERiscomputedastheratioof�rm�stotaldebt
tototalassets.SIZEisthenaturallogarithmoftotalassetsofthe�rm.TNGASSETistheratioofnetplant,propertyandequipment
ofthe�rmtototalassetsofthe�rm.MTBisthelogarithmofmarket-to-bookratioofthe�rm.OPINCVOListhestandarddeviation
ofthe�rm�soperatingincomeoverthepast�veyears.CREDITSPRisthedi¤erenceintheyieldsofBAAandAAAratedbonds.
MATURITYisthelogarithmofbondmaturitymeasuredinmonths.LOANSIZEistheratioofloansizetototalassetsofthe�rm.
JUNKRATEDisadummyvariablethattakesthevalueofoneifthebondisratednon-investmentgradeatissuance.UTILisadummy
variablethattakesthevalueofoneifthe�rmbelongsutilityindustry.Theregressionsalsocontrolforindicatorsforcallableand
putablefeaturesofthebondinallthemodels.Models1-2areestimatedon2839bonds.Robuststandarderrorsadjustedfor�rmlevel
clusteringarepresentedinparenthesisnexttothemodelestimates.
48
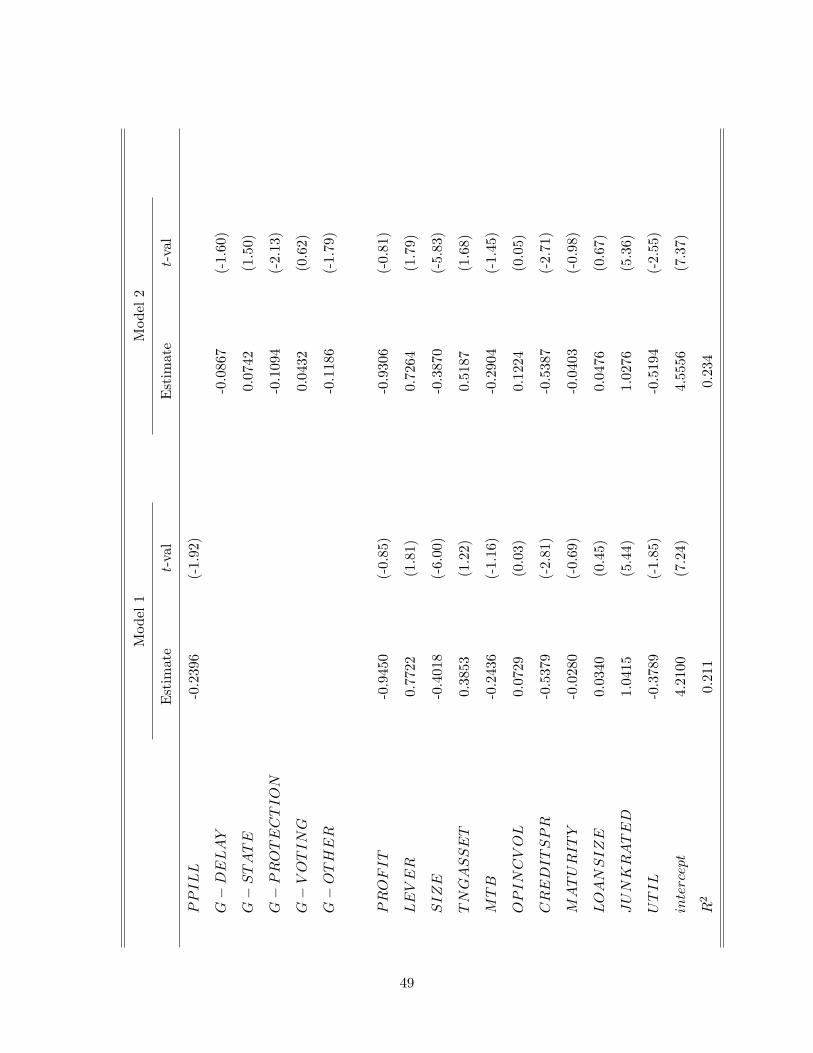
Model1
Model2
Estimate
t-val
Estimate
t-val
PPILL
-0.2396
(-1.92)
G�DELAY
-0.0867
(-1.60)
G�STATE
0.0742
(1.50)
G�PROTECTION
-0.1094
(-2.13)
G�VOTING
0.0432
(0.62)
G�OTHER
-0.1186
(-1.79)
PROFIT
-0.9450
(-0.85)
-0.9306
(-0.81)
LEVER
0.7722
(1.81)
0.7264
(1.79)
SIZE
-0.4018
(-6.00)
-0.3870
(-5.83)
TNGASSET
0.3853
(1.22)
0.5187
(1.68)
MTB
-0.2436
(-1.16)
-0.2904
(-1.45)
OPINCVOL
0.0729
(0.03)
0.1224
(0.05)
CREDITSPR
-0.5379
(-2.81)
-0.5387
(-2.71)
MATURITY
-0.0280
(-0.69)
-0.0403
(-0.98)
LOANSIZE
0.0340
(0.45)
0.0476
(0.67)
JUNKRATED
1.0415
(5.44)
1.0276
(5.36)
UTIL
-0.3789
(-1.85)
-0.5194
(-2.55)
intercept
4.2100
(7.24)
4.5556
(7.37)
R2
0.211
0.234
49

Table12:TheImpactoftheSarbanes-OxleyActon
BondCovenants
Inthefollowingtable,weanalyzetheimpactoftheSarbanes-OxleyActof2002onthedeterminantsofthevariouscovenants.The
2006editionoftheFixedIncomeSecuritiesDatabase(FISD)isthesourceforallthedatapresentedinthistable.
Thesample
isrestrictedtobondsissuedbyU.S.domicilednon-�nancial�rmsintheintersectionofCRSP/COMPUSTAT,FISDandExecutive
Compensationdatabasesduring1993�2005.Weconsideronlycorporatedebentureswithissuanceandcovenantinformationavailablein
FISD.Weexcludeconvertiblebonds,securedleaseobligations,perpetualbonds,unitdeals,rule144abonds,MTN,privateplacement
bonds,Yankee,Canadian,andforeigncurrencybonds.Further,only�rmsthatissuedbondsbothbeforeandafterthepassageof
Sarbanes-Oxleyactareincludedintheanalysis.InModel1,thedependentvariableisan
indicatorvariableforthepresenceof
investmentrestrictions.InModels2-4,thedependentvariablesareindicatorvariablesforthepresenceofdividendandotherpayment
restrictions,subsequent�nancingrestrictionsandeventrelatedrestrictionsrespectively.Table2givesmoredetailsontheclassi�cation
ofthecovenantsthatisbasedonSmithandWarner(1979).POSTSOXisadummyvariablethattakesthevalueofoneforbonds
thatareissuedafterthepassageofSarbanes-OxleyAct(Oct,2002).ENTRPisconstructedusingaprinicipalcomponentanalysis
asalinearcombinationofentrenchmentvariables(CEODELTA,CEORELCOMP,CEOSHROWN,LNGCEOTNR,PCASHCOMP,
BLOCKHOLDERS)withtheweightsbeingtheelementsoftheeigenvectorthataccountsforthehighestpercentageofthevariation
inalloftheaboveentrenchmentvariables.CEODELTAdenotesthedeltaoftheCEO�sstockandoptioncompensationcomputed
bytheBlack-Scholes-MertonmodelusingthemethodologyoutlinedinCoreandGuay(1999).CEORELCOMPistheratioofthe
CEO�stotalcompensationtothesumofthetotalcompensationoftheotherfourtopexecutivesreportedinexecutivecompensation
database.PCASHCOMPistheratioofCEO�scashsalarytothetotalcompensation.CEOSHROWNisthepercentageofthe�rm�s
outstandingsharesthatareheldbytheCEO.LNGCEOTNRisthesquareoflengthofCEOtenuremeasuredinyears(fromthedate
shebecameCEO).PROFITistheratioof�rm�spro�tabilitytothetotalassetsofthe�rm.LEVERiscomputedastheratioof�rm�s
totaldebttototalassets.SIZEisthenaturallogarithmoftotalassetsofthe�rm.TNGASSETistheratioofnetplant,propertyand
equipmentofthe�rmtototalassetsofthe�rm.MTBisthelogarithmofmarket-to-bookratioofthe�rm.OPINCVOListhestandard
deviationofthe�rm�soperatingincomeoverthepast�veyears.CREDITSPRisthedi¤erenceintheyieldsofBAAandAAArated
bonds.MATURITYisthelogarithmofbondmaturitymeasuredinmonths.LOANSIZEistheratioofloansizetototalassetsofthe
�rm.JUNKRATEDisadummyvariablethattakesthevalueofoneifthebondisratednon-investmentgradeatissuance.UTILisa
dummyvariablethattakesthevalueofoneifthe�rmbelongsutilityindustry.Theregressionscontrolforindicatorsforcallableand
putablefeaturesofthebondinallthemodels.Models1-4areestimatedon1555bonds.Robuststandarderrorsadjustedfor�rmlevel
clusteringarepresentedinparenthesisnexttothemodelestimates.
50
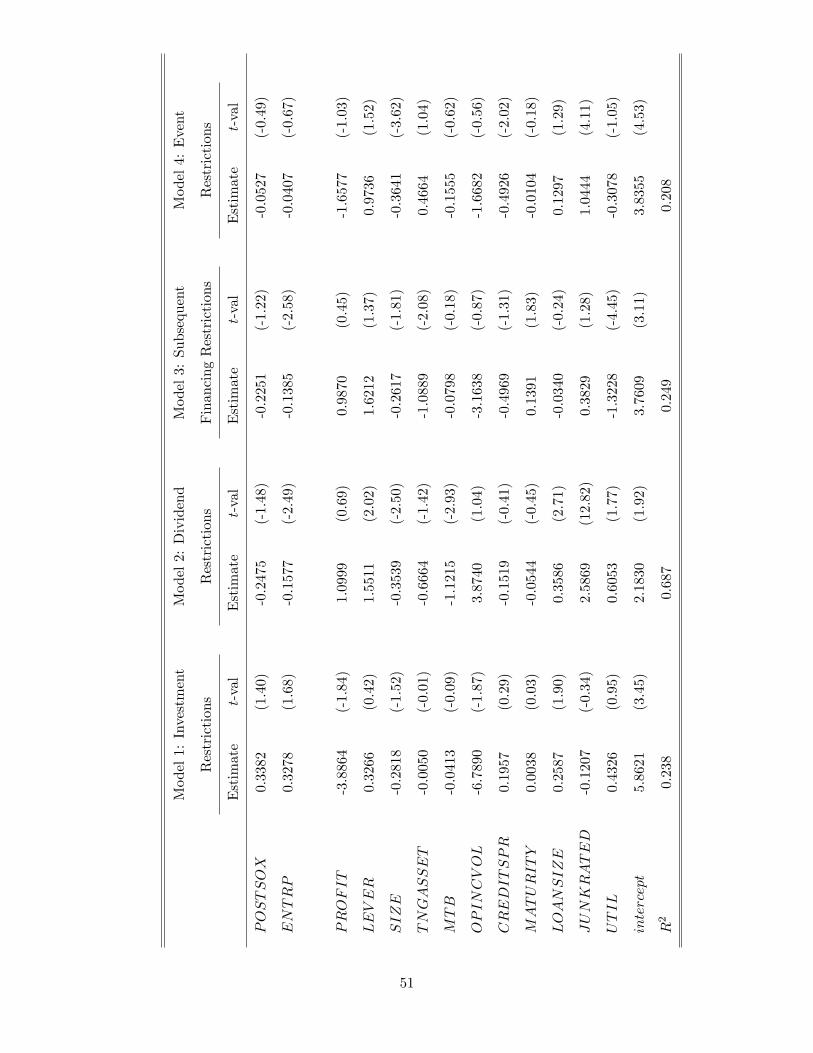
Model1:Investment
Model2:Dividend
Model3:Subsequent
Model4:Event
Restrictions
Restrictions
FinancingRestrictions
Restrictions
Estimate
t-val
Estimate
t-val
Estimate
t-val
Estimate
t-val
POSTSOX
0.3382
(1.40)
-0.2475
(-1.48)
-0.2251
(-1.22)
-0.0527
(-0.49)
ENTRP
0.3278
(1.68)
-0.1577
(-2.49)
-0.1385
(-2.58)
-0.0407
(-0.67)
PROFIT
-3.8864
(-1.84)
1.0999
(0.69)
0.9870
(0.45)
-1.6577
(-1.03)
LEVER
0.3266
(0.42)
1.5511
(2.02)
1.6212
(1.37)
0.9736
(1.52)
SIZE
-0.2818
(-1.52)
-0.3539
(-2.50)
-0.2617
(-1.81)
-0.3641
(-3.62)
TNGASSET
-0.0050
(-0.01)
-0.6664
(-1.42)
-1.0889
(-2.08)
0.4664
(1.04)
MTB
-0.0413
(-0.09)
-1.1215
(-2.93)
-0.0798
(-0.18)
-0.1555
(-0.62)
OPINCVOL
-6.7890
(-1.87)
3.8740
(1.04)
-3.1638
(-0.87)
-1.6682
(-0.56)
CREDITSPR
0.1957
(0.29)
-0.1519
(-0.41)
-0.4969
(-1.31)
-0.4926
(-2.02)
MATURITY
0.0038
(0.03)
-0.0544
(-0.45)
0.1391
(1.83)
-0.0104
(-0.18)
LOANSIZE
0.2587
(1.90)
0.3586
(2.71)
-0.0340
(-0.24)
0.1297
(1.29)
JUNKRATED
-0.1207
(-0.34)
2.5869
(12.82)
0.3829
(1.28)
1.0444
(4.11)
UTIL
0.4326
(0.95)
0.6053
(1.77)
-1.3228
(-4.45)
-0.3078
(-1.05)
intercept
5.8621
(3.45)
2.1830
(1.92)
3.7609
(3.11)
3.8355
(4.53)
R2
0.238
0.687
0.249
0.208
51

Table13:TheE¤ectofAnalysts�ForecastDispersion
onBondCovenants
Theimpactofanalystforecastdispersiononthedeterminantsofthevariouscovenantsisanalyzedinthistable.The2006editionofthe
FixedIncomeSecuritiesDatabase(FISD)isthesourceforallthedatapresentedinthistable.Thesampleisrestrictedtobondsissued
byU.S.domicilednon-�nancial�rmsintheintersectionofCRSP/COMPUSTAT,FISDandExecutiveCompensationdatabasesduring
1993�2005.WeconsideronlycorporatedebentureswithissuanceandcovenantinformationavailableinFISD.Weexcludeconvertible
bonds,securedleaseobligations,perpetualbonds,unitdeals,rule144abonds,MTN,privateplacementbonds,Yankee,Canadian,and
foreigncurrencybonds.Further,only�rmsthathaveanalystforecastdataavailableinI/B/E/Sareincludedintheanalysis.InModel
1,thedependentvariableisanindicatorvariableforthepresenceofinvestmentrestrictions.InModels2-4,thedependentvariables
areindicatorvariablesforthepresenceofdividendandotherpaymentrestrictions,subsequent�nancingrestrictionsandeventrelated
restrictionsrespectively.Table2givesmoredetailsontheclassi�cationofthecovenantsthatisbasedonSmithandWarner(1979).
ThekeyexplanatoryvariableisANYLDISPthatisconstructedasthestandarddeviationofearningsforecastdividedbystockprice
attheendof�scalyear.PROFITistheratioof�rm�spro�tabilitytothetotalassetsofthe�rm.LEVERiscomputedastheratioof
�rm�stotaldebttototalassets.SIZEisthenaturallogarithmoftotalassetsofthe�rm.TNGASSETistheratioofnetplant,property
andequipmentofthe�rmtototalassetsofthe�rm.MTBisthelogarithmofmarket-to-bookratioofthe�rm.OPINCVOListhe
standarddeviationofthe�rm�soperatingincomeoverthepast�veyears.CREDITSPRisthedi¤erenceintheyieldsofBAAand
AAAratedbonds.MATURITYisthelogarithmofbondmaturitymeasuredinmonths.LOANSIZEistheratioofloansizetototal
assetsofthe�rm.JUNKRATEDisadummyvariablethattakesthevalueofoneifthebondisratednon-investmentgradeatissuance.
UTILisadummyvariablethattakesthevalueofoneifthe�rmbelongsutilityindustry.Theregressionsalsocontrolforindicatorsfor
callableandputablefeaturesofthebondinallthemodels.Models1-4areestimatedon2450bonds.Robuststandarderrorsadjusted
for�rmlevelclusteringarepresentedinparenthesisnexttothemodelestimates.
52
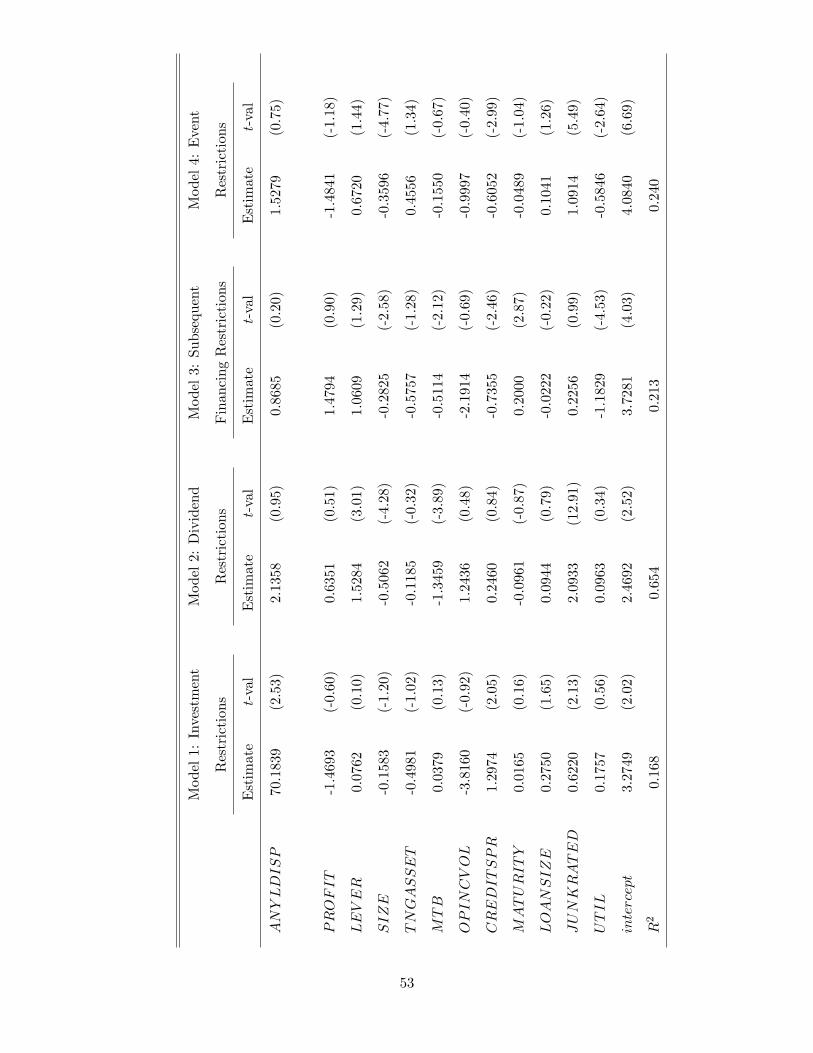
Model1:Investment
Model2:Dividend
Model3:Subsequent
Model4:Event
Restrictions
Restrictions
FinancingRestrictions
Restrictions
Estimate
t-val
Estimate
t-val
Estimate
t-val
Estimate
t-val
ANYLDISP
70.1839
(2.53)
2.1358
(0.95)
0.8685
(0.20)
1.5279
(0.75)
PROFIT
-1.4693
(-0.60)
0.6351
(0.51)
1.4794
(0.90)
-1.4841
(-1.18)
LEVER
0.0762
(0.10)
1.5284
(3.01)
1.0609
(1.29)
0.6720
(1.44)
SIZE
-0.1583
(-1.20)
-0.5062
(-4.28)
-0.2825
(-2.58)
-0.3596
(-4.77)
TNGASSET
-0.4981
(-1.02)
-0.1185
(-0.32)
-0.5757
(-1.28)
0.4556
(1.34)
MTB
0.0379
(0.13)
-1.3459
(-3.89)
-0.5114
(-2.12)
-0.1550
(-0.67)
OPINCVOL
-3.8160
(-0.92)
1.2436
(0.48)
-2.1914
(-0.69)
-0.9997
(-0.40)
CREDITSPR
1.2974
(2.05)
0.2460
(0.84)
-0.7355
(-2.46)
-0.6052
(-2.99)
MATURITY
0.0165
(0.16)
-0.0961
(-0.87)
0.2000
(2.87)
-0.0489
(-1.04)
LOANSIZE
0.2750
(1.65)
0.0944
(0.79)
-0.0222
(-0.22)
0.1041
(1.26)
JUNKRATED
0.6220
(2.13)
2.0933
(12.91)
0.2256
(0.99)
1.0914
(5.49)
UTIL
0.1757
(0.56)
0.0963
(0.34)
-1.1829
(-4.53)
-0.5846
(-2.64)
intercept
3.2749
(2.02)
2.4692
(2.52)
3.7281
(4.03)
4.0840
(6.69)
R2
0.168
0.654
0.213
0.240
53

Table14:TheE¤ectofFinancialTransparency
onBondCovenants
Thefollowingtableanalyzestheimpactof�nancialtransparencyonthedeterminantsofthevariouscovenants.The2006editionofthe
FixedIncomeSecuritiesDatabase(FISD)isthesourceforallthedatapresentedinthistable.Thesampleisrestrictedtobondsissued
byU.S.domicilednon-�nancial�rmsintheintersectionofCRSP/COMPUSTAT,FISDandExecutiveCompensationdatabasesduring
1993�2005.WeconsideronlycorporatedebentureswithissuanceandcovenantinformationavailableinFISD.Weexcludeconvertible
bonds,securedleaseobligations,perpetualbonds,unitdeals,rule144abonds,MTN,privateplacementbonds,Yankee,Canadian,and
foreigncurrencybonds.InModel1,thedependentvariableisanindicatorvariableforthepresenceofinvestmentrestrictions.In
Models2-4,thedependentvariablesareindicatorvariablesforthepresenceofdividend
andotherpaymentrestrictions,subsequent
�nancingrestrictionsandeventrelatedrestrictionsrespectively.Table2givesmoredetailsontheclassi�cationofthecovenantsthatis
basedonSmithandWarner(1979).FINTRNSPisameasureof�nancialtransparencyandmeasuresthenumberofitemsdisclosedin
theannualreport.ThisinformationiscompiledbyS&Paspartoftheirtransparencyanddisclosurerankings[see,Chengetal.(2006)
formoreinformationonStandard&PoorsTransparency&DisclosureRankings].Theindexisavailablefor2002andweassumethat
�rmshavethesamelevelofdisclosurefor2001and2003alsoandusethisdatafor2001-2003period.PROFITistheratioof�rm�s
pro�tabilitytothetotalassetsofthe�rm.LEVERiscomputedastheratioof�rm�stotaldebttototalassets.SIZEisthenatural
logarithmoftotalassetsofthe�rm.TNGASSETistheratioofnetplant,propertyandequipmentofthe�rmtototalassetsofthe
�rm.MTBisthelogarithmofmarket-to-bookratioofthe�rm.OPINCVOListhestandarddeviationofthe�rm�soperatingincome
overthepast�veyears.CREDITSPRisthedi¤erenceintheyieldsofBAAandAAAratedbonds.MATURITYisthelogarithmof
bondmaturitymeasuredinmonths.LOANSIZEistheratioofloansizetototalassetsofthe�rm.JUNKRATEDisadummyvariable
thattakesthevalueofoneifthebondisratednon-investmentgradeatissuance.UTILisadummyvariablethattakesthevalueofone
ifthe�rmbelongsutilityindustry.Theregressionsalsocontrolforindicatorsforcallableandputablefeaturesofthebondinallthe
models.InModel1,JUNKRATED=1predictssuccessperfectlyandhenceitisdroppedandthemodelisestimatedon456bonds.
Models2-4areestimatedon511bonds.Robuststandarderrorsadjustedfor�rmlevelclusteringarepresentedinparenthesisnextto
themodelestimates.
54
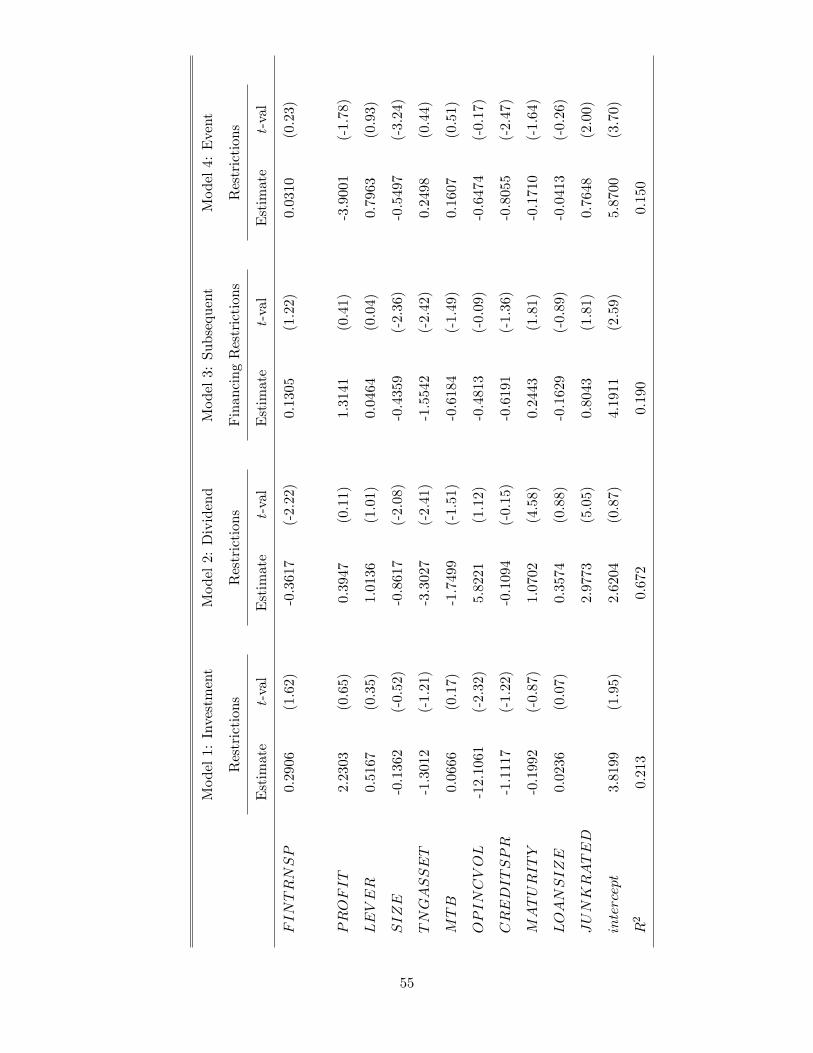
Model1:Investment
Model2:Dividend
Model3:Subsequent
Model4:Event
Restrictions
Restrictions
FinancingRestrictions
Restrictions
Estimate
t-val
Estimate
t-val
Estimate
t-val
Estimate
t-val
FINTRNSP
0.2906
(1.62)
-0.3617
(-2.22)
0.1305
(1.22)
0.0310
(0.23)
PROFIT
2.2303
(0.65)
0.3947
(0.11)
1.3141
(0.41)
-3.9001
(-1.78)
LEVER
0.5167
(0.35)
1.0136
(1.01)
0.0464
(0.04)
0.7963
(0.93)
SIZE
-0.1362
(-0.52)
-0.8617
(-2.08)
-0.4359
(-2.36)
-0.5497
(-3.24)
TNGASSET
-1.3012
(-1.21)
-3.3027
(-2.41)
-1.5542
(-2.42)
0.2498
(0.44)
MTB
0.0666
(0.17)
-1.7499
(-1.51)
-0.6184
(-1.49)
0.1607
(0.51)
OPINCVOL
-12.1061
(-2.32)
5.8221
(1.12)
-0.4813
(-0.09)
-0.6474
(-0.17)
CREDITSPR
-1.1117
(-1.22)
-0.1094
(-0.15)
-0.6191
(-1.36)
-0.8055
(-2.47)
MATURITY
-0.1992
(-0.87)
1.0702
(4.58)
0.2443
(1.81)
-0.1710
(-1.64)
LOANSIZE
0.0236
(0.07)
0.3574
(0.88)
-0.1629
(-0.89)
-0.0413
(-0.26)
JUNKRATED
2.9773
(5.05)
0.8043
(1.81)
0.7648
(2.00)
intercept
3.8199
(1.95)
2.6204
(0.87)
4.1911
(2.59)
5.8700
(3.70)
R2
0.213
0.672
0.190
0.150
55