Mammographic screening: Patterns of use and estimated impact on breast carcinoma survival
13
Mammographic Screening: Patterns of Use and Estimated Impact on Breast Carcinoma Survival Karen Blanchard 1 James A. Colbert 1 Dhruv Puri 1 Joel Weissman, Ph.D. 2–4 Beverly Moy, M.D. 2 Daniel B. Kopans, M.D. 5,6 Emily M. Kaine, M.D. 1 Richard H. Moore, B.A. 5 Elkan F. Halpern, Ph.D. 5,6 Kevin S. Hughes, M.D. 1,7 Kenneth K. Tanabe, M.D. 1,7 Barbara L. Smith, M.D., Ph.D. 1,7 James S. Michaelson, Ph.D. 1,8,9 1 Department of Surgery, Massachusetts General Hospital, Boston, Massachusetts. 2 Department of Medicine, Massachusetts General Hospital, Boston, Massachusetts. 3 Institute for Health Policy, Massachusetts Gen- eral Hospital, Boston, Massachusetts. 4 Department of Health Care Policy, Harvard Med- ical School, Boston, Massachusetts. 5 Department of Radiology, Massachusetts General Hospital, Boston, Massachusetts. 6 Department of Radiology, Harvard Medical School, Boston, Massachusetts. 7 Department of Surgery, Harvard Medical School, Boston, Massachusetts. 8 Department of Pathology, Massachusetts General Hospital, Boston, Massachusetts. 9 Department of Pathology, Harvard Medical School, Boston, Massachusetts. Supported by a Dana-Farber/Harvard Cancer Care New Nodal Award in Cancer Disparities. The authors thank Bruce Chabner, M.D., for his many useful suggestions. Address for reprints: James Michaelson, Ph.D., Division of Surgical Oncology, Cox Building Room 626, Massachusetts General Hospital, 100 Blos- som Street, Boston, MA 02114; Fax: (617) 724- 3895; E-mail: [email protected] Received November 4, 2003; revision received April 24, 2004; accepted April 30, 2004. BACKGROUND. Although many studies support the life-saving potential of screening mammography, the actual utilization of screening and the impact of the actual pattern of screening use on the breast carcinoma death rate, remain incompletely understood. In the current report, the authors describe patterns of screening use among women who were examined at a large screening and diagnostic service and estimate the added mortality associated with missed screening mammograms. METHODS. Mammography use was assessed in a population of 72,417 women who received a total of 254,818 screening mammograms at the Massachusetts General Hospital (MGH) Avon Comprehensive Breast Center (Boston, MA) between Janu- ary 1, 1985, and February 19, 2002. A computer simulation of breast carcinoma growth, spread, and detection of breast carcinoma was used to estimate the likely health consequences of various types of screening use. RESULTS. Both prompt return for annual screening and full use of screening over extended periods of time were rare, and comparison of the MGH popula- tion with other populations revealed that the low level of use observed in the MGH population was not atypical. Only 6% of women who received a mam- mogram in 1992 received all annual mammograms that were available over the next 10 years; the mean number of mammograms received during this period was 5.06, or 51% of the number recommended by the American Cancer Society. Computer simulation results indicate that this underutilization of screening should result in higher mortality levels. Women from traditionally underserved socioeconomic, racial, and ethnic groups, women without insurance, and women who did not speak English had lower levels of use compared with other women. Lower levels of use also were observed among women receiving their first mammogram or who in the past had not returned promptly. Women ages 55– 65 years had higher levels of use than did younger or older women. Women who previously had breast carcinoma also had higher levels of screening use. Nonetheless, none of the subpopulations of women stratified by age, race, ethnicity, zip code, income, language, insurance, status, previous screening use, or medical history exhibited a widespread propensity to promptly return for annual screening over an extended period of time. CONCLUSIONS. By many measures, the current analysis is one of the most detailed descriptions of screening use to date. The authors observed a level of screening use that was disappointingly low, with potentially negative health-related conse- quences, among women across categories defined by racial, ethnic, socioeco- nomic, and geographic characteristics; insurance status; language; age; medical history; and previous screening use. Improvements in the promptness with which women return to screening appear to have the potential to lead to considerable reductions in breast carcinoma death. Cancer 2004;101:495–507. © 2004 American Cancer Society. KEYWORDS: breast carcinoma, mammography, screening, disparity. 495 © 2004 American Cancer Society DOI 10.1002/cncr.20392 Published online 21 June 2004 in Wiley InterScience (www.interscience.wiley.com).
-
Upload
independent -
Category
Documents
-
view
3 -
download
0
Transcript of Mammographic screening: Patterns of use and estimated impact on breast carcinoma survival

Mammographic Screening: Patterns of Use andEstimated Impact on Breast Carcinoma Survival
Karen Blanchard1
James A. Colbert1
Dhruv Puri1
Joel Weissman, Ph.D.2–4
Beverly Moy, M.D.2
Daniel B. Kopans, M.D.5,6
Emily M. Kaine, M.D.1
Richard H. Moore, B.A.5
Elkan F. Halpern, Ph.D.5,6
Kevin S. Hughes, M.D.1,7
Kenneth K. Tanabe, M.D.1,7
Barbara L. Smith, M.D., Ph.D.1,7
James S. Michaelson, Ph.D.1,8,9
1 Department of Surgery, Massachusetts GeneralHospital, Boston, Massachusetts.
2 Department of Medicine, Massachusetts GeneralHospital, Boston, Massachusetts.
3 Institute for Health Policy, Massachusetts Gen-eral Hospital, Boston, Massachusetts.
4 Department of Health Care Policy, Harvard Med-ical School, Boston, Massachusetts.
5 Department of Radiology, Massachusetts GeneralHospital, Boston, Massachusetts.
6 Department of Radiology, Harvard MedicalSchool, Boston, Massachusetts.
7 Department of Surgery, Harvard Medical School,Boston, Massachusetts.
8 Department of Pathology, Massachusetts GeneralHospital, Boston, Massachusetts.
9 Department of Pathology, Harvard MedicalSchool, Boston, Massachusetts.
Supported by a Dana-Farber/Harvard Cancer CareNew Nodal Award in Cancer Disparities.
The authors thank Bruce Chabner, M.D., for hismany useful suggestions.
Address for reprints: James Michaelson, Ph.D.,Division of Surgical Oncology, Cox Building Room626, Massachusetts General Hospital, 100 Blos-som Street, Boston, MA 02114; Fax: (617) 724-3895; E-mail: [email protected]
Received November 4, 2003; revision receivedApril 24, 2004; accepted April 30, 2004.
BACKGROUND. Although many studies support the life-saving potential of
screening mammography, the actual utilization of screening and the impact of
the actual pattern of screening use on the breast carcinoma death rate, remain
incompletely understood. In the current report, the authors describe patterns of
screening use among women who were examined at a large screening and
diagnostic service and estimate the added mortality associated with missed
screening mammograms.
METHODS. Mammography use was assessed in a population of 72,417 women who
received a total of 254,818 screening mammograms at the Massachusetts General
Hospital (MGH) Avon Comprehensive Breast Center (Boston, MA) between Janu-
ary 1, 1985, and February 19, 2002. A computer simulation of breast carcinoma
growth, spread, and detection of breast carcinoma was used to estimate the likely
health consequences of various types of screening use.
RESULTS. Both prompt return for annual screening and full use of screening
over extended periods of time were rare, and comparison of the MGH popula-
tion with other populations revealed that the low level of use observed in the
MGH population was not atypical. Only 6% of women who received a mam-
mogram in 1992 received all annual mammograms that were available over the
next 10 years; the mean number of mammograms received during this period
was 5.06, or 51% of the number recommended by the American Cancer Society.
Computer simulation results indicate that this underutilization of screening
should result in higher mortality levels. Women from traditionally underserved
socioeconomic, racial, and ethnic groups, women without insurance, and
women who did not speak English had lower levels of use compared with other
women. Lower levels of use also were observed among women receiving their
first mammogram or who in the past had not returned promptly. Women ages
55– 65 years had higher levels of use than did younger or older women. Women
who previously had breast carcinoma also had higher levels of screening use.
Nonetheless, none of the subpopulations of women stratified by age, race,
ethnicity, zip code, income, language, insurance, status, previous screening
use, or medical history exhibited a widespread propensity to promptly return
for annual screening over an extended period of time.
CONCLUSIONS. By many measures, the current analysis is one of the most detailed
descriptions of screening use to date. The authors observed a level of screening use
that was disappointingly low, with potentially negative health-related conse-
quences, among women across categories defined by racial, ethnic, socioeco-
nomic, and geographic characteristics; insurance status; language; age; medical
history; and previous screening use. Improvements in the promptness with which
women return to screening appear to have the potential to lead to considerable
reductions in breast carcinoma death. Cancer 2004;101:495–507.
© 2004 American Cancer Society.
KEYWORDS: breast carcinoma, mammography, screening, disparity.
495
© 2004 American Cancer SocietyDOI 10.1002/cncr.20392Published online 21 June 2004 in Wiley InterScience (www.interscience.wiley.com).

While a number of studies have shown that promptannual attendance is important for realizing the
life-saving potential of mammographic screening,1–3
many other studies have indicated that such atten-dance is not commonly observed.4 –15 For example, werecently reported that at the Massachusetts GeneralHospital (MGH) Avon Comprehensive Breast Center(Boston, MA), fewer than 10% of women who receiveda mammogram in 1992 complied with the AmericanCancer Society’s (ACS) recommendation of annualscreening by receiving the full complement of 9 mam-mograms over the next 9 years, whereas more thanhalf had fewer than 5 mammograms during this peri-od.4 In addition, Ulcickas Yood et al.6 reported thatonly 16% of all women who had received a mammo-gram between 1983 and 1993 at the largest healthmaintenance organization (HMO) in Michigan re-ceived all 5 recommended mammograms over the5-year period following the index mammogram. Sabo-gal et al.,15 using California Medicare data for theperiod 1992–1998, found that only 30% of non-HMO-enrolled women age � 65 years who participated inscreening did so regularly (i.e., without failing to at-tend in more than 2 consecutive years). Finally, Phil-lips et al.,12 using data obtained from a number ofsources, reported that although 70% of women ages50 –74 years had received at least 1 mammogram, only16% had undergone annual screening. These popula-tionwide rates of prompt return for screening are dis-appointingly low; however, even lower rates of long-term screening use and prompt return have beenobserved among women in traditionally underservedgroups as defined by race, ethnicity, and socioeco-nomic status.6,12
The negative consequences of failing to returnpromptly for screening have been noted in a numberof screening populations. For example, in the MGHscreening population, approximately 20% of all inva-sive breast malignancies detected in women who hadreceived at least 1 screening mammogram before or atthe time of detection were discovered by nonmammo-graphic methods more than a year after the previousnegative screening mammogram.4 Malignancies thatwere not detected by mammographic methods tendedto be larger and thus potentially more lethal thanscreen-detected malignancies.16 Several observationssuggest that the majority of tumors detected by non-mammographic methods in women with a previousnegative mammogram would have been detected atscreening had patients returned more promptly. First,almost all such tumors were observable on the diag-nostic mammograms that were obtained at the time ofdetection.4 Second, by back-calculating the likely sizeof each of these cancers at the time of the negative
mammogram, it could be seen that most of thesetumors were probably too small to have been reason-able candidates for detection at the time of the previ-ous mammogram. Thus, most of these tumors prob-ably emerged as larger, palpable masses not because aprevious mammogram failed to detect them but be-cause too much time had been allowed to pass sincethe last screening mammogram.4 Similar findingswere documented by Mandelson et al.,17 who reportedthat 17% of all malignancies found in an HMO screen-ing population were discovered by nonmammo-graphic methods between 12 and 24 months after aprevious negative mammogram, and by Hunt et al.,3
who noted that breast tumors found in women whoreceived biennial screening were, on average, largerthan those found in women who received annualscreening.
The negative consequences of failing to returnpromptly for screening also have been estimated withrespect to patient survival. For example, computersimulation studies18,19 (based on 1) quantitative esti-mates of the sizes at which invasive malignancies aredetected when screening mammography is used ver-sus when it is not used,20 2) rates of tumor growth, and3) the relation between tumor size and survival16 sug-gest that each year of delay between screening mam-mograms decreases the life-sparing potential ofscreening by approximately one-third. Similar esti-mates have been reported by Tabar et al.,2 who used aMarkov chain screening model.
This widespread failure to return promptly islikely to be a major component of screening underuti-lization, as most eligible women in the United Stateshave already received at least one screening mammo-gram.12,14,21 The Behavioral Risk Factor SurveillanceSystem telephone survey revealed that by 1997, ap-proximately 80% of women ages 40 – 49 years and ap-proximately 90% of women ages 50 – 69 years had re-ceived at least 1 mammogram.21 Similar rates werenoted in subpopulations of white, Hispanic, and blackwomen, and only marginally lower rates were notedamong women ages 40 – 49 years, women with medianincome � $10,000, and women with � 12 years ofeducation. Even among women without insurance,the subpopulation found to have the lowest rate ofscreening use in the Behavioral Risk Factor Surveil-lance System survey, 68% reported having received atleast 1 mammogram. Furthermore, because reportedscreening rates increased over the 8-year period pre-ceding this 1997 survey (from 62% to 80% amongwomen ages 40 – 49 years and from �65% to �90%among women ages 50 – 69 years), it is likely that thepercentage of women who have received at least 1
496 CANCER August 1, 2004 / Volume 101 / Number 3

mammogram is even greater at present than it was atthe time of the survey.
The MGH Avon Comprehensive Breast Center da-tabase contains information on more than 80,000women, accounting for a combined total of more than300,000 mammograms performed at MGH since 1985.Thus, it represents one of the largest available sets ofdata on mammographic screening use and its conse-quences.4,5,16,19,20,22 We recently reported on generalpatterns of screening use in this population and on therelation between patterns of use and the sizes at whichinvasive breast tumors come to medical attention.4,22
In the current report, we describe in greater detail thepatterns of screening use observed in the MGH pop-ulation as a whole and in subpopulations defined bysite of residence, race, ethnicity, previous benign bi-opsy findings, and pattern of previous screening use.In addition, we report on the use of values obtained incomputer simulations19,20 to calculate expected ratesof breast carcinoma–related death in association withthe observed screening use patterns.
MATERIALS AND METHODSThe MGH Avon Comprehensive Breast Center data-base contains entries on screening mammography useby 83,511 women, accounting for a combined total of314,185 mammograms performed at MGH betweenJanuary 1, 1985, and February 19, 2002. We recentlyreported on the general features of screening use atMGH4; however, in that study, we examined the use ofboth screening and diagnostic mammography,whereas in the current report, we present a moredetailed analysis that is limited to screening mam-mography use. Our database includes data on theAmerican College of Radiology Breast Imaging Report-ing and Data System assessment of disease and on themore detailed MGH assessment; these data make itpossible to determine which visits correspond to neg-ative screening mammograms. Furthermore, since1993, all mammograms have been classified as screen-ing, diagnostic, or procedural measures, and this clas-sification makes it possible to determine which visitscorrespond to positive screening mammograms andwhich visits correspond to negative screening mam-mograms. Of the 314,185 mammograms documentedin the database, 254,818 were identified as screeningmammograms and were performed for a total of72,417 patients. Pathologic and survival data allowedthe identification of patients with breast carcinomadiagnoses before the time of the study. Demographicdata, including name, home address, zip code, andrace, were available for all patients who had visited
our institution since January 1996. Geographic loca-tion was determined by zip code, with the U.S. Censusproviding median income data for each zip code.Asian and Hispanic patients were identified by analy-sis of names, the standard method used by tumorregistries in the U.S.,23,24 and data on race were avail-able from MGH’s patient demographic database.Among patients who visited our institution between1996 and 2000, 3.80% had Hispanic names, 2.95% hadAsian names, and 93.3% had non-Hispanic, non-Asiannames. (Percentages sum to slightly more than 100%because of a small degree of overlap between theAsian and Hispanic name categories.) Of the patientswho participated in screening, 82.33% were white,whereas 4.48% were black.
Long-term patterns of screening use were exam-ined in 2 overlapping data sets: 1) a 5-year group,which consisted of 19,579 women who received ascreening mammogram at an MGH screening centerin 1996, with these patients’ screening use being char-acterized for the period between the index mammo-gram and December 31, 2000; and 2) a 10-year group,which consisted of 15,610 women who had negativefindings on screening mammography at an MGHscreening center in 1992, with these patients’ screen-ing use being characterized for the period between theindex mammogram and December 31, 2001. Data onthe time to first return after the index mammogram(Figs. 1–3) and on total screening use over the time
FIGURE 1. Return curves for women who received a screening mammogram
in 1992 and women who received a screening mammogram in 1996.
Patterns of Mammographic Screening Use/Blanchard et al. 497

periods examined (Table 1) were collected. Findings inthe two groups were generally similar, and conse-quently, most results presented in the current reportwere derived from the 5-year group.
Estimates of breast carcinoma–related death ratesfor the various subsets of women who received ascreening mammogram in 1996 were based on valuesobtained from a computer simulation model.1,18,19 Allstudies had appropriate institutional review board ap-proval and were in compliance with the human re-search study guidelines set forth by the National In-stitutes of Health.
RESULTSUnderutilization of Screening in the Study Population asa WholeFew women in the MGH population returnedpromptly for annual screening (Fig. 1) or took fulladvantage of screening opportunities over extendedperiods of time (Table 1). Among women who receiveda mammogram in either 1992 or 1996, the mediantime to first return to screening was 1.3 years, and�25% of these women had not returned within 3 years(Fig. 1). Eighteen percent of women who received ascreening mammogram in 1992 or 1996 had no recordof returning for screening, although some of thesewomen could have undergone screening elsewhere. Inthe 5-year group, only 16% of women received 5 sub-sequent mammograms in compliance with the ACSrecommendation of annual mammography, whereasmore than 35% received only 1 or 2 mammogramsduring this period (Table 1). Similarly, only 6% ofwomen who received a screening mammogram in1992 complied with the ACS recommendation by re-ceiving the full complement of 10 mammograms overthe following 10 years, whereas 40% received fewerthan 5 mammograms during this period. The meannumber of mammograms received over the subse-quent 5-year period by women who received a screen-ing mammogram in 1996 was 3.03, or 61% of theACS-recommended number (Table 1), while the meannumber of mammograms received over the subse-quent 10-year period by women who received ascreening mammogram in 1992 was 5.06, or 51% ofthe ACS-recommended number.
We do not have information on the fraction ofwomen in the MGH screening population who re-ceived mammograms elsewhere. Nonetheless, thereare a number of indications that most women remainwithin the MGH screening system, despite the findingthat many do not return promptly. For example, 82%of women who received a screening mammogram in1992 eventually returned (Fig. 1); in addition, 93% ofpatients in this population who had undergonescreening within 1.1 years before the index (i.e., 1992)visit eventually returned (Fig. 2). Another indicationthat the majority of women remain within the MGHsystem, even if they do not return promptly for screen-ing, is our previously published observation that 20%of invasive breast tumors detected in women whoreceived screening between 1991 and 2000 were pal-pable masses found in patients whose precedingscreening mammograms occurred more than a yearbefore detection; this finding suggests that manywomen remained within the MGH system but stoppedreceiving regular screening.4 Ten percent of all malig-
FIGURE 2. Return curves for women who received a screening mammogram
in 1992 according to previous screening behavior.
FIGURE 3. Correlation between previous and subsequent times to return to
screening. For women who received a mammogram in 1992 and who had
received a previous mammogram, median time to return following the 1992
mammogram was calculated according to the time between the pre-1992
mammogram and the 1992 mammogram. See Table 1 for the numeric data
used to construct this graph.
498 CANCER August 1, 2004 / Volume 101 / Number 3

nancies detected by nonmammographic methodswere found more than 1.5 years after the precedingnegative mammogram, 7% were found more than 2years after the preceding negative mammogram, and3% were found more than 5 years after the precedingnegative mammogram.4
Patterns of screening use in the MGH populationwere compared with screening use patterns in twoother populations,6,15 and these comparisons revealedremarkably similar results in all three populations (Ta-ble 2). Ulcickas Yood et al.6 examined the screeningbehavior of women with 5 years of continuous enroll-ment in Health Alliance Plan, the largest HMO inMichigan (membership, 525,000), after an indexscreening mammogram in 1989; as in the current5-year population, the mean number of mammo-grams subsequently received was 3.03. Similarly,Sabogal et al.,15 using California Medicare data for theperiod 1992–1998, found that only 30% of non-HMO-enrolled women age � 65 years who participated inscreening did so regularly (i.e., without failing to at-tend in more than 2 consecutive years); in the MGHpopulation, 26% of women age � 65 years met thiscriterion (data not shown).
Underutilization of Screening in All SubpopulationsExaminedPrevious screening behaviorWomen who had received at least one previousscreening mammogram at MGH were far more likelyto return for another mammogram and to returnpromptly compared with women who had not previ-ously received a mammogram at MGH (Table 1). Only13% of all women who had received a screening mam-mogram in 1996 and who had received at least 1previous screening mammogram did not return foranother mammogram in the 5 years following theindex year, compared with 39% of all women who hadno record of a screening mammogram before 1996 (P� 0.001).
For women who had received a mammogram be-fore the index year, the time since that previous mam-mogram was predictive of future screening behavior(Fig. 2; Table 1). Thus, for women who had received amammogram � 2 years before the index year, therewas a correlation between previous time to return (i.e.,time between the visit before the index visit and theindex visit itself) and median time to return followingthe index visit (R2 � 0.99; Fig. 3). In contrast, amongwomen whose previous time to return was � 2 years,the median time to return following the index visit wasapproximately 2 years; this finding indicates that theextreme degree of tardiness observed in a patient’sfirst return to screening tended not to be fully re-
peated. Previous screening behavior also had an ob-servable predictive impact on subsequent long-termscreening use (Fig. 4). For example, 29% of all womenwho received a mammogram 1.0 –1.1 years before the1996 index mammogram received all 5 possiblescreening mammograms over the following 5 years,compared with � 5% of all women who received amammogram � 2.3 years before the index mammo-gram (P � 0.001).
Race, ethnicity, insurance status, language, site ofresidence, and incomeRace, ethnicity, insurance status, language, site of res-idence, and income were found to be correlated withscreening behavior (Figs. 5, 6; Table 1). Whereas 18%of all non-Asian, non-Hispanic patients and 19% of allwhite patients received all 5 possible screening mam-mograms between 1996 and 2000, only 11% of allblack patients, 14% of all Asian patients, and 8% of allHispanic patients did so (P � 0.01 for all comparisons;Table 1). In addition, English-speaking women hadhigher levels of screening use than did non-English-speaking women, and women with health insurancereceived screening more frequently than did womenwho were uninsured (Table 1). There also were differ-ences in screening use when women were groupedaccording to site of residence as indicated by zip code,which was weakly correlated with income as reportedon the U.S. Census (Fig. 6; Table 1). For example, only8% of all women who received a screening mammo-gram in 1996 and who were residents of Chelsea, MA,a community with a median family income of $30,161,received all 5 mammograms recommended by theACS, whereas 23% of women residing in Arlington,MA, a community with a median family income of$63,621, received all 5 recommended mammograms(P � 0.001) (Table 1). Overall, when the study popu-lation was stratified according to site of residence, amodest degree of correlation between screening useand median income was noted (R2 � 0.65; Fig. 6).
AgeWomen ages 55– 65 years tended to have higher levelsof screening use than did younger or older women(Fig. 7). Whereas women ages 55– 65 years who had anindex mammogram in 1996 received 68% of the rec-ommended number of mammograms between 1996and 2000, women ages 35– 45 years, as well as womenages 75– 85 years, received approximately 50% of thetotal number of mammograms recommended by theACS over that same period (P � 0.001). Even lowerlevels of use were noted among women age � 80 yearsand women age � 40 years (45% and 40%, respec-tively, of the total number of mammograms recom-
Patterns of Mammographic Screening Use/Blanchard et al. 499

TABL
E1
Five
-Yea
rSc
reen
ing
Use
(199
6–20
00)f
orW
omen
Who
Rece
ived
aSc
reen
ing
Mam
mog
ram
in19
96
Char
acter
istic
No.o
fpati
ents
whor
eceiv
eda
scre
enin
gm
amm
ogra
min
1996
Total
no.o
fsc
reen
ing
mam
mog
ram
sbe
twee
n19
96an
d20
00
Mean
no.o
fm
amm
ogra
ms
rece
ived
betw
een
1996
and
2000
%of
ACS-
reco
mm
ende
dm
amm
ogra
ms
rece
ived
(95%
CI)
Media
ntim
eto
retu
rnto
scre
enin
g(yr
s)
Media
ntim
eto
retu
rnto
scre
enin
gfor
patie
ntsw
hodid
retu
rn(yr
s)
%of
patie
nts(
95%
CI)
1scr
eeni
ngm
amm
ogra
mbe
twee
n19
96an
d20
00
2scr
eeni
ngm
amm
ogra
ms
betw
een
1996
and
2000
3scr
eeni
ngm
amm
ogra
ms
betw
een
1996
and
2000
4scr
eeni
ngm
amm
ogra
ms
betw
een
1996
and
2000
5scr
eeni
ngm
amm
ogra
ms
betw
een
1996
and
2000
Media
nan
nual
inco
me(
$)
Estim
ated
brea
stca
rcin
oma
death
rate
(%)
Entir
epop
ulatio
n19
,579
59,36
23.0
360
(60–6
0)1.3
11.1
718
(17–1
9)17
(16–1
8)21
(20–2
2)26
(25–2
750)
16(15
–17)
—16
.01Pr
eviou
sscre
ening
mam
mog
ram
atM
GHNo
3899
8852
2.27
45(44
–46)
2.53
1.47
39(38
–40)
22(21
–23)
18(17
–19)
15(14
–16)
6(6–
6)—
19.16
Yes
15,68
050
,238
3.264
(64–6
4)1.2
11.1
313
(13–1
3)16
(15–1
7)22
(21–2
3)29
(28–3
0)19
(18–2
0)—
15.47
Prev
ioust
imet
oretu
rn(yr
s)1.0
–1.1
4344
15,78
23.6
372
(71–7
3)1.0
61.0
47(
7–7)
11(11
–11)
17(16
–18)
35(34
–36)
29(28
–30)
—14
.291.1
–1.2
1499
5017
3.35
69(68
–70)
1.16
1.12
10(10
–10)
14(14
–14)
23(22
–24)
31(30
–32)
20(19
–21)
—14
.871.2
–1.3
887
2836
3.263
(62–6
4)1.2
31.1
713
(13–1
3)14
(14–1
4)23
(22–2
4)36
(35–3
7)13
(13–1
3)—
15.44
1.3–1
.466
421
143.1
863
(61–6
5)1.2
81.2
112
(12–1
2)17
(16–1
8)26
(25–2
7)31
(30–3
2)14
(14–1
4)—
15.65
1.4–1
.555
215
692.8
456
(54–5
8)1.3
41.2
513
(13–1
3)17
(16–1
8)26
(25–2
7)32
(31–3
3)12
(12–1
2)—
15.79
1.5–1
.642
212
132.8
757
(55–5
9)1.5
34.4
19(
9–9)
18(17
–19)
29(28
–30)
28(27
–29)
9(9–
9)—
14.52
1.6–1
.734
599
42.8
857
(55–5
9)1.5
81.4
117
(16–1
8)21
(20–2
2)29
(28–3
0)25
(24–2
6)8(
8–8)
—16
.581.7
–1.8
284
849
2.99
59(56
–62)
1.45
1.32
13(13
–13)
21(20
–22)
30(29
–31)
27(26
–28)
10(10
–10)
—16
.211.8
–1.9
309
915
2.96
59(57
–62)
1.51.4
14(14
–14)
19(18
–20)
33(32
–34)
24(23
–25)
10(10
–10)
—16
.161.9
–2.0
433
1220
2.82
56(54
–58)
1.71.3
620
(19–2
1)19
(18–2
0)26
(25–2
7)24
(23–2
5)9(
9–9)
—16
.522.0
–2.1
541
1495
2.76
55(53
–57)
1.89
1.59
19(18
–20)
23(22
–24)
26(25
–27)
25(24
–26)
7(7–
7)—
16.88
2.1–2
.227
475
32.7
555
(52–5
8)1.8
91.2
220
(19–2
1)21
(20–2
2)30
(29–3
1)22
(21–2
3)7(
7–7)
—16
.972.2
–2.3
191
541
2.83
56(53
–59)
1.76
1.58
16(15
–17)
20(19
–21)
36(35
–37)
20(19
–21)
7(7–
7)—
16.40
2.3–2
.418
142
22.3
346
(43–4
9)2.3
1.58
34(33
–35)
22(21
–23)
25(24
–26)
15(14
–16)
4(4–
4)—
18.68
2.4–2
.514
134
42.4
448
(44–5
2)2.1
21.7
125
(24–2
6)27
(26–2
8)31
(30–3
2)13
(13–1
3)4(
4–4)
—17
.942.5
–2.6
105
236
2.25
45(41
–49)
2.09
1.61
29(28
–30)
32(31
–33)
25(24
–26)
14(14
–14)
0(0–
0)—
18.62
2.6–2
.711
126
02.3
446
(42–5
0)2.2
41.8
28(27
–29)
26(25
–27)
30(29
–31)
16(15
–17)
0(0–
0)—
18.28
2.7–2
.811
328
12.4
949
(45–5
3)2.0
81.7
920
(19–2
1)36
(35–3
7)22
(21–2
3)17
(16–1
8)4(
4–4)
—17
.502.8
–2.9
9924
12.4
348
(44–5
2)2.0
91.6
526
(25–2
7)27
(26–2
8)28
(27–2
9)13
(13–1
3)5(
5–5)
—17
.872.9
–3.0
9324
72.6
653
(49–5
8)2
1.718
(17–1
9)28
(27–2
9)29
(28–3
0)19
(18–2
00)
5(5–
5)—
16.96
Nega
tiveb
iopsy
in19
9527
891
23.2
866
(64–6
9)1.1
61.0
915
(14–1
6)15
(14–1
6)20
(19–2
1)28
(27–2
9)23
(22–2
4)—
15.84
Prev
iousb
reast
carci
nom
a10
8839
153.6
573
(72–7
4)1.0
41.0
418
(16–2
1)17
(15–1
9)21
(19–2
4)26
(24–2
9)16
(14–1
9)—
—Ra
ce/e
thnic
ityW
hite
15,97
150
,745
3.18
64(64
–64)
1.26
1.17
16(15
–16)
16(16
–17)
21(21
–22)
28(27
–29)
18(17
–18)
—16
.78Bl
ack
869
2462
2.83
57(55
–58)
1.56
1.31
21(21
–23)
20(17
–22)
24(21
–27)
24(21
–27)
11(8–
13)
—17
.26No
n-As
ian,
non-
Hisp
anic
18,26
855
,894
3.06
61(61
–61)
1.29
1.15
18(17
–19)
17(16
–18)
21(20
–22)
27(26
–28)
17(16
–18)
—16
.26Hi
span
ic74
418
942.5
551
(49–5
3)1.9
21.4
030
(27–3
3)22
(19–2
5)21
(18–2
4)19
(16–2
2)8(
6–10
)—
18.08
Asian
578
1677
2.90
58(56
–60)
2.22
1.22
23(20
–26)
18(15
–21)
22(19
–25)
22(19
–25)
14(11
–17)
—16
.85 (cont
inue
d)
500 CANCER August 1, 2004 / Volume 101 / Number 3

Lang
uage
spok
enEn
glish
18,09
657
,179
3.16
63.2
(63–6
4)1.2
71.1
516
(16–1
7)17
(16–1
7)21
(21–2
2)28
(27–2
8)17
(17–1
8)—
15.89
Othe
r75
517
142.2
745
.4(43
–48)
2.24
1.53
36(33
–40)
23(20
–26)
22(19
–25)
13(11
–16)
4(4–
6)—
18.67
Insu
ranc
etyp
eHM
O45
6214
,326
3.14
62.8
(62–6
4)1.3
11.1
916
(15–1
7)17
(16–1
8)23
(22–2
4)27
(26–2
8)16
(15–1
7)—
15.93
PPO
1763
5705
3.24
64.7
(63–6
6)1.2
81.1
713
(12–1
5)17
(15–1
8)23
(21–2
5)29
(27–3
1)17
(16–1
9)—
15.56
Inde
mnit
y21
2662
092.9
258
.4(57
–60)
1.35
1.13
23(22
–25)
18(16
–20)
20(18
–21)
22(20
–24)
16(14
–17)
—16
.79An
ypriv
ateins
uran
ce91
9528
,702
3.12
62.4
(62–6
3)1.3
1.17
17(16
–18)
17(16
–18)
22(21
–23)
26(25
–27)
16(16
–17)
—15
.91M
edica
id/fre
e78
419
592.5
050
.0(48
–53)
1.89
1.430
(26–3
3)23
(20–2
6)21
(18–2
4)19
(16–2
2)6.
(5–8)
—18
.02Sit
eofr
eside
nce
Chels
ea80
421
702.7
54(53
–56)
1.63
1.37
23(20
–26)
21(18
–24)
26(23
–29)
22(19
–25)
8(6–
10)
30,16
117
.26Do
rches
ter37
910
482.7
755
(53–5
7)1.6
11.2
224
(20–2
8)20
(16–2
4)23
(19–2
7)21
(17–2
5)11
(8–14
)35
,569
17.12
East
Bosto
n38
010
992.8
958
(56–6
0)1.5
31.2
520
(16–2
4)17
(13–2
1)21
(17–2
5)25
(21–2
9)11
(8–14
)31
,013
15.79
Som
erville
409
1196
2.92
59(57
–61)
1.56
1.81
20(16
–24)
19(15
–23)
23(19
–27)
27(23
–31)
11(8–
14)
44,58
616
.71M
alden
370
1117
3.02
60(58
–62)
1.33
1.16
21(17
–25)
15(11
–19)
22(18
–26)
24(20
–28)
16(12
–20)
45,65
416
.30Re
vere
1400
4236
3.03
61(60
–62)
1.44
1.26
17(15
–19)
18(16
–20)
23(21
–25)
30(28
–32)
12(10
–14)
37,07
816
.28Ch
arles
Rive
rPa
rk42
512
993.0
661
(59–6
3)1.3
31.1
519
(15–2
3)18
(14–2
2)21
(17–2
5)25
(21–2
9)16
(13–1
9)55
,678
16.32
Char
lesto
wn50
415
483.0
761
(59–6
3)1.3
91.2
317
(14–2
0)18
(15–2
1)20
(17–2
3)28
(24–3
2)15
(12–1
8)55
,700
15.94
North
End
260
800
3.08
62(59
–65)
1.32
1.16
17(12
–22)
19(14
–24)
21(16
–26)
28(23
–33)
15(11
–19)
47,54
716
.26Ev
erett
367
1129
3.08
62(60
–64)
1.39
1.25
16(12
–20)
19(15
–23)
24(20
–28)
27(22
–32)
13(10
–16)
40,66
116
.08Ca
mbr
idge
616
1905
3.09
62(60
–64)
1.31.1
619
(16–2
2)15
(12–1
8)21
(18–2
4)27
(23–3
1)16
(13–1
9)50
,120
16.04
Med
ford
424
1341
3.16
63(61
–65)
1.29
1.16
15(12
–18)
18(14
–22)
21(17
–25)
28(24
–32)
17(13
–21)
52,51
215
.82Br
ookli
ne30
593
63.1
764
(62–6
6)1.2
21.1
416
(12–2
0)16
(12–2
0)20
(16–2
4)29
(24–3
4)18
(14–2
2)46
,388
15.81
Quinc
y29
593
63.1
764
(62–6
6)1.2
71.1
814
(10–1
8)17
(13–2
1)24
(19–2
6)29
(24–3
4)15
(11–1
9)46
,388
15.72
Wint
hrop
306
980
3.264
(62–6
6)1.2
81.1
716
(12–2
0)17
(13–2
1)19
(15–2
3)29
(24–3
4)17
(13–2
1)53
,122
15.72
Cople
y/Ba
ckBa
y27
088
53.2
866
(64–6
9)1.2
11.1
214
(10–1
8)16
(12–2
0)19
(14–2
4)31
(25–3
7)19
(14–2
4)60
,467
15.54
Arlin
gton
220
733
3.33
67(64
–70)
1.24
1.13
14(9–
19)
15(10
–20)
20(15
–25)
28(22
–34)
23(17
–29)
63,62
115
.59Th
eoret
ical5
yrsc
reenin
guse
1mam
mog
ram
——
120
——
100
00
00
—25
.265m
amm
ogra
ms
——
510
0—
—0
00
010
0—
11.97
ACS:
Amer
ican
Canc
erSo
ciety
;CI:
confi
denc
ein
terv
al;M
GH:M
assa
chus
etts
Gene
ralH
ospi
tal;
HM
O:he
alth
mai
nten
ance
orga
niza
tion;
PPO:
pref
erre
dpr
ovid
eror
gani
zatio
n.
*Med
ian
inco
me
fora
llpe
rson
sres
idin
gin
the
loca
lity
ofin
tere
stac
cord
ing
toth
eU.
S.Ce
nsus
.
Patterns of Mammographic Screening Use/Blanchard et al. 501
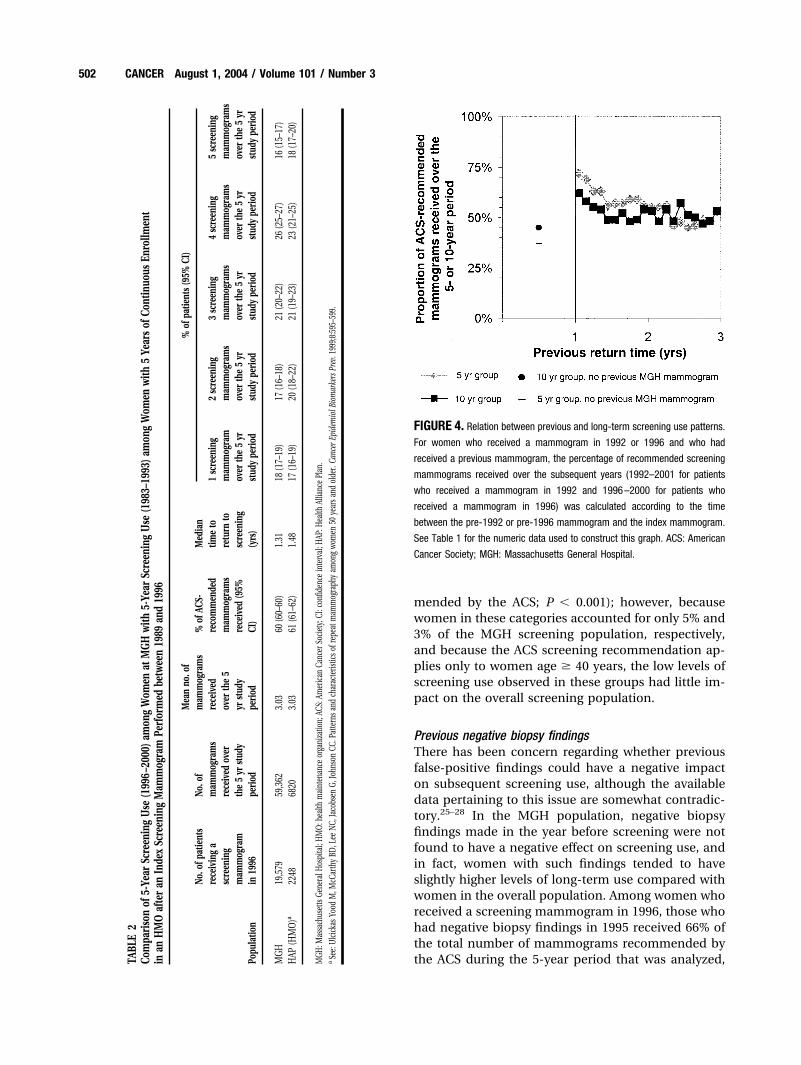
mended by the ACS; P � 0.001); however, becausewomen in these categories accounted for only 5% and3% of the MGH screening population, respectively,and because the ACS screening recommendation ap-plies only to women age � 40 years, the low levels ofscreening use observed in these groups had little im-pact on the overall screening population.
Previous negative biopsy findingsThere has been concern regarding whether previousfalse-positive findings could have a negative impacton subsequent screening use, although the availabledata pertaining to this issue are somewhat contradic-tory.25–28 In the MGH population, negative biopsyfindings made in the year before screening were notfound to have a negative effect on screening use, andin fact, women with such findings tended to haveslightly higher levels of long-term use compared withwomen in the overall population. Among women whoreceived a screening mammogram in 1996, those whohad negative biopsy findings in 1995 received 66% ofthe total number of mammograms recommended bythe ACS during the 5-year period that was analyzed,TA
BLE
2Co
mpa
riso
nof
5-Ye
arSc
reen
ing
Use
(199
6–20
00)a
mon
gW
omen
atM
GHw
ith5-
Year
Scre
enin
gU
se(1
983–
1993
)am
ong
Wom
enw
ith5
Year
sof
Cont
inuo
usEn
rollm
ent
inan
HM
Oaf
ter
anIn
dex
Scre
enin
gM
amm
ogra
mPe
rfor
med
betw
een
1989
and
1996
Popu
latio
n
No.o
fpat
ient
sre
ceiv
ing
asc
reen
ing
mam
mog
ram
in19
96
No.o
fm
amm
ogra
ms
rece
ived
over
the
5yr
stud
ype
riod
Mea
nno
.of
mam
mog
ram
sre
ceiv
edov
erth
e5
yrst
udy
perio
d
%of
ACS-
reco
mm
ende
dm
amm
ogra
ms
rece
ived
(95%
CI)
Med
ian
time
tore
turn
tosc
reen
ing
(yrs
)
%of
patie
nts
(95%
CI)
1sc
reen
ing
mam
mog
ram
over
the
5yr
stud
ype
riod
2sc
reen
ing
mam
mog
ram
sov
erth
e5
yrst
udy
perio
d
3sc
reen
ing
mam
mog
ram
sov
erth
e5
yrst
udy
perio
d
4sc
reen
ing
mam
mog
ram
sov
erth
e5
yrst
udy
perio
d
5sc
reen
ing
mam
mog
ram
sov
erth
e5
yrst
udy
perio
d
MGH
19,5
7959
,362
3.03
60(6
0–60
)1.
3118
(17–
19)
17(1
6–18
)21
(20–
22)
26(2
5–27
)16
(15–
17)
HAP
(HM
O)a
2248
6820
3.03
61(6
1–62
)1.
4817
(16–
19)
20(1
8–22
)21
(19–
23)
23(2
1–25
)18
(17–
20)
MGH
:Mas
sach
uset
tsGe
nera
lHos
pita
l;H
MO:
heal
thm
aint
enan
ceor
gani
zatio
n;AC
S:Am
erica
nCa
ncer
Socie
ty;C
I:co
nfide
nce
inte
rval
;HAP
:Hea
lthAl
lianc
ePl
an.
aSe
e:Ul
cicka
sYoo
dM
,McC
arth
yBD
,Lee
NC,J
acob
sen
G,Jo
hnso
nCC
.Pat
tern
sand
char
acte
ristic
sofr
epea
tmam
mog
raph
yam
ong
wom
en50
year
sand
olde
r.Ca
ncer
Epid
emio
lBio
mar
kers
Prev
.199
9;8:59
5–59
9.
FIGURE 4. Relation between previous and long-term screening use patterns.
For women who received a mammogram in 1992 or 1996 and who had
received a previous mammogram, the percentage of recommended screening
mammograms received over the subsequent years (1992–2001 for patients
who received a mammogram in 1992 and 1996–2000 for patients who
received a mammogram in 1996) was calculated according to the time
between the pre-1992 or pre-1996 mammogram and the index mammogram.
See Table 1 for the numeric data used to construct this graph. ACS: American
Cancer Society; MGH: Massachusetts General Hospital.
502 CANCER August 1, 2004 / Volume 101 / Number 3

whereas the overall population received 60% of therecommended number of mammograms during thatsame period (P � 0.001) (Table 1).
Breast carcinoma survivorsWomen with previous breast malignancies were foundto have especially high levels of screening use. Thesewomen had a median time to first return to screeningof 1.02 years. In addition, they received 73% of thetotal number of screening mammograms recom-mended by the ACS between 1992 and 1996, whereasthe overall MGH screening population received 60% ofthe recommended number of mammograms duringthat same period (P � 0.001) (Fig. 1; Table 1). Thesecalculations were made possible by the fact that 1088women who received a screening mammogram in1996 had been diagnosed with breast carcinoma be-fore the index year and were alive throughout thestudy period. (Women with a previous diagnosis ofbreast carcinoma who died between 1992 and 1996were eliminated to avoid bias in the assessment ofscreening use.)
Estimating the health consequences of various screeninguse patternsThe goal of screening, of course, is not to meet somespecified schedule, but rather to reduce the incidence
of breast carcinoma–related death. It was possible totranslate the various screening use patterns describedabove into expected rates of breast carcinoma–relateddeath using a computer simulation model18,19 basedon 1) quantitative estimates of the sizes at which in-vasive malignancies are detected in the presence andabsence of screening,18,19 2) rates of tumor growth,5
FIGURE 5. Return curves for women who received a screening mammogram
in 1996 according to race and ethnicity (as determined by analysis of names).
Asian vs. non-Asian, non-Hispanic: P � 0.05; Hispanic vs. non-Asian, non-
Hispanic: P � 0.01; black vs. white: P � 0.01. All comparisons were made
using the t test. MGH: Massachusetts General Hospital.
FIGURE 6. Relation between income/site of residence and long-term screen-
ing use pattern. For women who received a mammogram in 1996, the
percentage of recommended screening mammograms received between 1996
and 2000 was calculated according to the median income in the patients place
of residence. See Table 1 for the numeric data used to construct this graph.
ACS: American Cancer Society; MGH: Massachusetts General Hospital.
FIGURE 7. Relation between age and long-term screening use pattern for
women who received a mammogram in 1996. ACS: American Cancer Society.
Patterns of Mammographic Screening Use/Blanchard et al. 503

and 3) the relation between tumor size and survival.16
These simulations indicate that among women diag-nosed with invasive breast carcinoma, those who at-tend screening every year have an expected breastcarcinoma–related death rate of 11.97%, whereaswomen who are screened only once every 5 years havean expected death rate that is nearly twice as large(25.26%) (Fig. 8). The expected breast carcinoma–related death rate associated with the screening usepattern observed in the MGH population as a wholelies between these two extremes (16.01%) (Fig. 9; Table1). We were surprised to find that none of the sub-populations defined by race, ethnicity, zip code, pre-vious screening use, or medical history approachedeither of the extreme patterns of screening use (i.e.,prompt annual screening or screening only once every5 years). For example, excluding breast carcinoma sur-vivors, women screened 1.0 –1.1 years before the indexscreening mammogram had the highest levels ofscreening use and thus the lowest expected death rateof any subpopulation (14.29%), but this death rate stillwas markedly higher than the rate that was associatedwith prompt annual screening (11.97%). Furthermore,women who had not previously been screened had thelowest levels of screening use and thus the highestexpected breast carcinoma–related death rate of anysubpopulation (19.16%), but this rate still was consid-erably lower than the expected rate associated withthe use of screening only once every 5 years (25.26%).Differences in screening use according to zip code,income, race, and ethnicity, while significant, wererelatively small, and no subgroup approached the rec-ommended level of screening use over an extendedperiod of time (Fig. 9B). Nonetheless, the disappoint-ing finding that no subgroup used screening at the
recommended level was balanced by the finding thatno subgroup used screening at a completely unsatis-factory level; in fact, all subgroups examined appearedto have derived some amount of benefit from the useof screening mammography (Fig. 9).
FIGURE 8. Computer simulation estimates of the relation between screening
interval and breast carcinoma death rate in a population of women ages 40–85
years. See Michaelson et al., 20001; Michaelson et al., 199918; and Michael-
son, 200119 for further information.
FIGURE 9. Expected breast carcinoma death rates (calculated using values
generated by the computer simulation model) associated with long-term
screening use patterns in patients sorted by (A) time between preindex
mammogram and index mammogram and (B) median income for the patient’s
site of residence. See Table 1 for the numeric data used to construct this graph.
Black horizontal line: expected death rate associated with use of screening
once every 5 years; gray horizontal line: expected death rate associated with
yearly screening use. MGH: Massachusetts General Hospital.
504 CANCER August 1, 2004 / Volume 101 / Number 3

DISCUSSIONThe MGH Avon Comprehensive Breast Center screen-ing population is one of the largest and most com-pletely described screening populations in exis-tence.4,5,16,19,20 As a result, the current report providesone of the most detailed descriptions of screening useto date. Because it is a large, urban tertiary care facil-ity, MGH probably is not representative of mostscreening centers in the U.S. Nonetheless, we foundthat the overall pattern of use in the MGH populationwas remarkably similar to the patterns of use observedin other cohorts reported on in the literature.6,15 Forthis reason, we believe that many of the lessonslearned from the MGH population may be applicableto a wide variety of settings.
MGH, which vigorously advocates prompt annualscreening for women age � 40 years, has an aggressivereminder program. Three to 6 hours are spent eachday calling women to remind them of their upcomingexaminations. As a result, approximately 90% of allwomen who make appointments at MGH actuallykeep them (unpublished data); this rate is quite highcompared with published attendance rates in otherscreening populations.29,30 Nonetheless, the currentreport reveals that overall screening use in the MGHpopulation is far from ideal and that the observedlevels of screening use may have unfavorable health-related consequences. In the MGH population as awhole, screening use falls far short of what is recom-mended by the ACS, with women receiving only ap-proximately 50 – 60% of the total number of mammo-grams recommended by the ACS over an extendedperiod of time.
We previously examined the negative conse-quences of failing to return promptly for screening byinvestigating the appearance of lesions detected bynonmammographic methods. Such lesions are largerand thus more likely to be lethal16 compared withmammographically detected lesions, and they beginto appear at a regular rate approximately 1 year afternegative findings are made on mammography.5,22 Inthe current study, we determined the expected healthconsequences associated with various screening inter-vals using a simulation model that was based on 1)quantitative estimates of the sizes at which invasivetumors are detected in the presence and absence ofscreening,18,19 2) rates of tumor growth,5 and 3) therelation between tumor size and survival.16 The resultsof these computer simulation studies suggest thatwomen can reduce breast carcinoma–related deathrates to as low as 11.97% by adhering to the ACSguidelines regarding prompt annual screening; how-ever, only approximately 1 of every 7 patients in the
MGH population complied with the ACS recommen-dation. For the MGH screening population consideredas a whole, simulation analysis yields an expectedbreast carcinoma–related death rate of 16.01%, whichis approximately one-third greater than the expectedrate for women who are screened regularly. Approxi-mately 1 of every 5 patients who attended screeningdid so only once every 5 (or more) years, and thesimulation model indicated that these women had afar higher expected rate of breast carcinoma–relateddeath (25.26% or greater).
As expected, the observed levels of screening usevaried among the subsets of women within the MGHpopulation. It was not surprising that lower levels ofscreening use were noted among historically under-served (i.e., Hispanic, Asian, and black) women andamong women who lived in lower-income communi-ties. Although the ultimate goal would be to increaselevels of use across the entire screening population,these findings indicate that additional attention andresources should be focused on equalizing disparitieswithin the population.
We were surprised to find that no subset ofwomen in the MGH population approached the rec-ommended level of screening use. The highest level oflong-term use was noted among breast carcinomasurvivors, and even this subpopulation of women withan obvious motivation to undergo screening receivedonly 73% of the total number of mammographic ex-aminations recommended by the ACS over the 5-yearstudy period. The next highest level of long-term usewas observed among women who had been screened1.0 –1.1 years before the index examination, and thesewomen, for whom there was evidence of previousprompt screening use, received only 72% of the ACS-recommended number of examinations over the5-year period following the index mammogram. Thispattern of use was associated with an expected breastcarcinoma–related death rate of 14.29%, which is ap-proximately one-fifth greater than the expected rate of11.97% for women who are screened promptly eachyear. Women from Arlington (median family income,$63,621), the most affluent community served byMGH, received only 67% of the total number of rec-ommended mammograms over the 5-year period thatwas analyzed; this use pattern was associated with anexpected breast carcinoma–related death rate of15.59%, which is approximately one-third higher thanthe expected death rate for women who are screenedpromptly each year.
The data reported here reveal that the widespreadfailure of many women to attend screening regularlyoccurs to a degree that is likely to reduce the life-sparingpotential of screening. Many psychologic, sociologic,
Patterns of Mammographic Screening Use/Blanchard et al. 505

and economic factors contribute to a woman’s tendencyto receive prompt screening;6,9,10,12,13,15,31 nonetheless,we are impressed by the simple importance of appoint-ment making and keeping29,30 and by the finding (madein more than 100 studies) that postal and telephonereminders enhance the likelihood of screening atten-dance.32–34 Reminders are a somewhat unglamorousand neglected aspect of breast screening, but we believethat their use can have an enormous impact on breastcarcinoma death rates.
We propose that there are two types of determi-nants, which we shall call systematic and individualdeterminants, that affect return to screening. System-atic determinants are those factors governing appoint-ment-making and appointment-keeping behaviorsthat are independent of each woman’s specific char-acteristics. In contrast, individual determinants arefactors that distinguish one patient’s return behaviorfrom another patient’s return behavior. Although thedevelopment of a statistical model will be necessaryfor quantitative isolation of the relative contributionmade by each type of determinant and for assessmentof the nature of these determinants (the data assem-bled should form the basis for such a model), a generalidea of the relative importance of these two types offactors can be obtained from the raw data. For exam-ple, the finding that a very large fraction of womenwho received consecutive screening mammogramsseparated by only 1.0 –1.1 years (89% of such womenwho received a screening mammogram in 1992) didnot continue to return promptly for annual examina-tions over longer periods of time suggests that promptreturn in the past does not invariably predict subse-quent prompt return. Likewise, the finding that a sig-nificant proportion (�5%) of women who previouslyallowed 2.9 –3.0 years to pass between consecutivescreening examinations returned promptly for annualexaminations over the 5-year period that was investi-gated indicates that past failure to be screenedpromptly is not invariably repeated in the future. Webelieve that such observations point to the central roleof systematic factors in determining levels of screen-ing use. In this sense we suggest that the challengeahead is an operations-research challenge,35 not un-like the challenge posed by the efficient managementof any large enterprise, but a challenge whose solutionhas the potential to save enormous numbers of lives.
REFERENCES1. Michaelson JS, Kopans DB, Cady B. The breast cancer
screening interval is important. Cancer. 2000;88:1282–1284.2. Tabar L, Duffy SW, Vitak B, Chen HH, Prevost TC. The
natural history of breast carcinoma: what have we learnedfrom screening? Cancer. 1999;86:449 – 462.
3. Hunt KA, Rosen EL, Sickles EA. Outcome analysis for womenundergoing annual versus biennial screening mammogra-phy: a review of 24,211 examinations. AJR Am J Roentgenol.1999;173:285–289.
4. Michaelson JS, Satija S, Moore R, et al. The pattern of breastcancer screening utilization and its consequences. Cancer.2002;94:37– 43.
5. Michaelson JS, Satija S, Moore R, Weber G, Garland G,Kopans DB. Estimates of the breast cancer growth rate andsojourn time from screening database information. J Wom-en’s Imaging. 2003;5:3–10.
6. Ulcickas Yood M, McCarthy BD, Lee NC, Jacobsen G, John-son CC. Patterns and characteristics of repeat mammogra-phy among women 50 years and older. Cancer EpidemiolBiomarkers Prev. 1999;8:595–599.
7. Jepson C, Barudin JL, Weiner JR. Variability in the timing ofrepeat screening mammography. Prev Med. 1997;26:483–485.
8. Johnson MM, Hislop TG, Kan L, Coldman AJ, Lai A. Com-pliance with the screening mammography program of Brit-ish Columbia: will she return? Can J Public Health. 1996;87:176 –180.
9. Elwood M, McNoe B, Smith T, Bandaranayake M, Doyle TC.Once is enough—why some women do not continue toparticipate in a breast cancer screening programme. N ZMed J. 1998;111:180 –183.
10. Song L, Fletcher R. Breast cancer rescreening in low-incomewomen. Am J Prev Med. 1998;15:128 –133.
11. Howe HL. Repeat mammography among women over 50years of age. Am J Prev Med. 1992;8:182–185.
12. Phillips KA, Kelikowse K, Baker LC, Chang SW, BrownML. Factors associated with women’s adherence to mam-mography screening guidelines. Health Serv Res. 1998;33:29 –53.
13. Stoddard AM, Rimer BK, Lane D, et al. Underusers of mam-mogram screening: stage of adoption in five U.S. subpopu-lations. The NCI Breast Cancer Screening Consortium. PrevMed. 1998;27:478 – 487.
14. Anderson LM, May DS. Has the use of cervical, breast, andcolorectal cancer screening increased in the United States?Am J Public Health. 1995;85:840 – 842.
15. Sabogal F, Merrill SS, Packel L. Mammography rescreeningamong older California women. Health Care Financ Rev.2001;22:63–75.
16. Michaelson JS, Silverstein M, Wyatt J, et al. The prediction ofbreast cancer survival from tumor size. Cancer. 2002;95:713–723.
17. Mandelson MT, Oestreicher N, Porter PL, et al. Breast den-sity as a predictor of mammographic detection: comparisonof interval- and screen-detected cancers. J Natl Cancer Inst.2000;92:1081–1087.
18. Michaelson J, Halpern E, Kopans D. A computer simulationmethod for estimating the optimal intervals for breast can-cer screening. Radiology. 1999;212:551–560.
19. Michaelson JS. Using information on breast cancer growth,spread, and detectability to find the best ways to use screen-ing to reduce breast cancer death. J Women’s Imaging. 2001;3:54 –57.
20. Michaelson JS, Satija S, Moore R, et al. Estimates of the sizesat which breast cancers become detectable on mammo-graphic and on clinical grounds. J Women’s Imaging. 2003;5;10 –19.
506 CANCER August 1, 2004 / Volume 101 / Number 3

21. Blackman DK, Bennett EM, Miller DS. Trends in self re-ported use of mammograms (1989-1997) and Papanicolaoutests (1991-1997)—Behavioral Risk Factor Surveillance Sys-tem. MMWR Morb Mortal Wkly Rep. 1999;48:1–25.
22. Michaelson JS, Satija S, Moore R, Weber G, Garland G,Kopans DB. Observations on invasive breast cancers diag-nosed in a service screening and diagnostic breast imagingprogram. J Womens Imaging. 2001;3:99 –104.
23. Hultstrom D, editor. Standards for cancer registries. VolumeII. Data standards and data dictionary. Record Layout Ver-sion 9.1 (6th edition). Springfield, IL: North American Asso-ciation of Central Cancer Registries, 2001.
24. Dolecek TA, Lawhun G, Vann S, Snodgrass JL, Stewart SL.Hispanic identification in the Illinois State Cancer Registry.J Registry Manage. 2000;27:43–50.
25. McCann J, Stockton D, Godward S. Impact of false positivemammography on subsequent screening attendance andrisk of cancer. Breast Cancer Res. 2002;4:1–9.
26. Pisano ED, Earp J, Schell M, Vokaty K, Denham A. Screeningbehavior of women after a false-positive mammogram. Ra-diology. 1998;208:245–249.
27. Fletcher SW. False-positive screening mammograms: goodnews, but more to do? Ann Intern Med. 1999;131:60 – 62.
28. Burman ML, Taplin SH, Herta DF, Elmore JG. Effect offalse-positive mammograms on interval breast cancerscreening in a health maintenance organization. Ann InternMed. 1999;131:1– 6.
29. McCoy CB, Nielsen BB, Chitwood DD, Zavertnik JJ, KhouryEL. Increasing the cancer screening of the medically under-served in South Florida. Cancer. 1991;67(6 Suppl):1808 –1813.
30. Margolis KL, Lurie N, McGovern PG, Slater JS. Predictors offailure to attend scheduled mammography appointments ata public teaching hospital. J Gen Intern Med. 1993;8:602–605.
31. Rimer BK. Cancer control research 2001. Cancer CausesControl. 2000;11:257–270.
32. Rimer BK. Use of multiple media and breast cancer screen-ing: an introduction. J Health Commun. 2000;5:113–116.
33. Wagner TH. The effectiveness of mailed patient reminderson mammography screening: a meta-analysis. Am J PrevMed. 1998;14:64 –70.
34. Steele A. Computer telephony solution reduces no-shows.Health Manag Technol. 1999;20:8 –10.
35. Hillier FS, Lieberman GJ. Introduction to operations re-search (7th edition). New York: McGraw-Hill, 2002.
Patterns of Mammographic Screening Use/Blanchard et al. 507


![Astrocytic tracer dynamics estimated from [1-11C]-acetate PET measurements](https://static.fdokumen.com/doc/165x107/6334cca03e69168eaf070c95/astrocytic-tracer-dynamics-estimated-from-1-11c-acetate-pet-measurements.jpg)