Nonlinear Wavelet Estimation of Time-Varying Autoregressive Processes
Upload
independentCategory
view
4download
0
MALE AND FEMALE DEVELOPMENT OF DELINQUENCYDURING ADOLESCENCE AND EARLY ADULTHOOD :A DIFFERENTIAL AUTOREGRESSIVE MODEL OF
DELINQUENCY USING AN OVERLAPPING COHORT DESIGN
Johannes A. Landsheer, Johan H. L. Oud,and Cor van Dgkum
ABSTRACT
Although it is well known that during adolescence the delinquent involvementof females is consistently less when compared to male involvement, it remainsan important question whether the development of delinquency has a similartrajectory for both sexes. The main hypothesis tested is whether sex differencesm dehnquency, specifically growth, peak age, and decline, are constant. Anautoregression model in continuous time, implemented as a structural equa-tion model, is used for the description of the development of delinquency inmales and females. The data are collected in an overlapping cohort design,and both within-person and between-persons data are integrated into a singlemodel. The result shows that the involvement with delinquency over time isdifferent for males and females. The main difference increases up to the ageof 16, and decreases thereafter. The model indicates that both sexes reach themaximum in delinquency at the same age. It is concluded that males andfemales differ both in their start level at age 12 and in the amount of changewith age.
INTRODUCTION
Hirschi and Gottfredson have argued that using social correlates toexplain desistance is misguided, as the factors that explain crime orits absence are constant across the life course (Hirschi & Gottfredson,1983, 1984, 1994; Gottfredson & Hirschi, 1988, 1990). They showedthat a similar age-crime curve has been found in many studies in
This study was supported by the Dutch Ministry of Justice and the DutchOrganization for Scientific Research (NWO).
Johan H. L. Oud, University of Nijmegen, Institute of Family and ChildCare Studies, Nijmegen, The Netherlands.
Cor van Dijkum, Department of Methodology and Statistics, Utrecht Univer-sity, The Netherlands.
Requests for reprints should he sent to Johannes A. Landsheer, Departmentof Methodology and Statistics, Utrecht University, P. O. Box 80140, 3508 TCUtrecht, The Netherlands. E-mail: [email protected]
ADOLESCENCE, Vol. 43, No. 169, Spring 2008Libra Publishers, Inc., 3089C Clairemont Dr., PMB 383, San Diego, CA 92117
different times and places. In most of these studies, cross-sectionaldata have been used, which excludes the possibility of making appro-priate inferences regarding changes over time.
Two demographic variables appear to be especially important for theexplanation of juvenile delinquency: age and sex. According to Hirschiand Gottfredson (1983), "the age distrihution of crime cannot be ac-counted for by any variable or combination of variables currently avail-able to criminology" (p. 554). Shavit and Rattner (1988) have presenteddata that confirm Hirschi and Gottfredson's position, vi^hereas Tittleand Ward (1993) have also provided support. With regard to the rela-tion between sex and crime, Gottfredson and Hirschi (1990) assertedthat sex differences appear to be invariant across time and space, withmales committing more offenses than females. Hagan (1998) endorsedthis conclusion, stating that sex is the best predictor of criminality, ofall the available demographic variables. D'Unger, Land, and McCall(2002) used a nonparametric mixed Poisson model to study the differ-ences between male and female trajectories. Their tentative conclusionis that patterns are similar for males and females, with lower overalloffending levels for females. Self-report studies show that the moreserious the offense, the greater the disproportionately (Adler,Mueller, & Laufer, 1998). Overbeek, VoUebergh, Meeus, Engels, andLuijpers (2001) found that a relatively stable pattern of offending is arelatively strong predictor of the rate of later offenses. VanderValk,Spruijt, de Goede, Maas, and Meeus (2005) applied the latent growthcurve (LGC) model with a quadratic component and found that thedevelopment of delinquency does not differ by gender. However, Hoytand Scherer (1998) concluded their extensive review concerning femalejuvenile delinquency with the statement that the research results arenot conclusive. Females have a slight lead in development during ado-lescence, and the difference in timing of puberty (Palmert & Boepple,2001) may have significant implications for the development of adoles-cent delinquent behavior. Adolescent females also tend to associatewith males who are somewhat older (Harrington Cleveland, 2003).Males and females may therefore differ on such measures as peak agesof committing the offense. Even though this difference has not beenreported in earlier studies (Van der Ende & Verbulst, 2005; D'Unger,Land, & McCall, 2002), we could expect that general developmentaldifferences are also reflected in the development of delinquent behav-ior. An interesting question is whether the differences between malesand females are constant over their respective developmental curves;that is, whether sex differences in delinquency are invariant across
90

age. Main differences can concern the proportion of offenders, the fre-quency of offense, and the age at which delinquency reaches a peaklevel. The model presented here is based on the autoregressive differ-ential equation, which features parameter estimates that are indepen-dent of the chosen origin and measurement interval.
METHOD
Model. An autoregression model states that current delinquency isdependent on prior delinquency (Dijkum & Landsheer, 2000). For bothmales and females, autoregression parameters are estimated, andthese parameters can be compared to describe the developmental dif-ferences. Our main question is whether different parameters are neces-sary to describe the development, and, if so, what parameters areneeded. An autoregressive model in continuous time can be describedin an elegant way by a differential equation. The basic model (Oud,1978, 2001) is a practical, statistical extension of the work of Coleman(1968). The exact discrete model (EDM) Unks exactly the discrete timeparameters, based on the discrete measurements, to the underlyingcontinuous time parameters (Oud & Jansen, 2000; Oud, 2002).
The authors describe change with the following differential equation(formula 1):
dx(t)/dt = a * xit) + (b-\-c*t)+g* dW(i)/diIn this formula, a represents the drift parameter of change in xit), brepresents the constant contribution to change, c the contribution tochange linearly increasing or decreasing with time, and parameter gthe amount of stochastic fluctuation as can be described by the Wienerprocess W(() (Oud, 2002). The c parameter contributes more (> 0) orless (< 0) as time progresses. Focusing on the (statistical) expectedoutcome, this differential model has a solution in the form of a com-pound exponential equation. The expected value of the state variablex( ) can be interpreted as a proportion, and the resulting curve indi-cates the inclination and declination of delinquency.
Design. We have used the overlapping cohort design (OCD). TheOCD has been developed to tackle the problems that are inherent tolongitudinal designs, especially attrition (Raudenbush & Chan, 1993).Essentially, this design uses a reduced number of longitudinal mea-surements, but multiple overlapping cohorts. This reduces the chancethat respondents drop out as it limits the commitment period of the re-spondents.
Sample. The data were collected as part of an extensive researchproject, the "Utrecht Study of Adolescent Development (USAD)
91
1991-1997" Ct Hart 1992; Meeus & 't Hart, 1993). This is a longitudinalstudy with three waves and three-year intervals.
Each wave can be considered as a representative cross-section of thepopulation. As the longitudinal data collection period covers six years,and the cross-sectional data collection in 1991 covers the age cohortsfrom 12 to 25, this design allows the longitudinal modeling of develop-mental curves from ages 12 to 31.
The 1991 sample of 3,393 Dutch adolescents aged 12 to 23 was drawnfrom an existing panel of 10,000 households, 't Hart (1994) checkedwhether the first wave sample was representative by comparing itwith population data published by the Dutch Central Statistics Office(CBS). No differences were found between the sample and the CBSdata with regard to district, urbanization level, educational level, andreligious affiliation. The sample was therefore regarded as representa-tive of the Dutch indigenous adolescent population of the early 1990s.
To reduce costs, only a part of respondents were followed over thetotal period of six years. Therefore, in 1994 a smaller but still consider-able random selection of 1,966 subjects was taken from the 1991 sam-ple. A total of 1,781 respondents participated in 1997. The sample wasreplenished in 1994 and 1997 with new respondents between 12 and 15years of age. As a consequence of this resampling, the design combineddifferent cohorts simultaneously with overlapping developmental peri-ods, allowing the study of period differences. Over all waves, therewere 3,954 participants in this study, of which 3,393 were sampled in1991, 335 in 1994, and 226 in 1997. Although the 3,393 subjects of thefirst wave gave their informed consent to remain participants in thelongitudinal study, 822 of the selected participants eventually refusedto partake in the second and third wave, and the response rate betweenwaves 1 and 3 was 76%.
Measurement. The adolescents were interviewed in their homes bytrained interviewers. After the interview, respondents were given an-other questionnaire to fill out on their own and return to the researchorganization. For this study, dehnquency is assessed as one or moreoffenses that are committed in the past year (see Appendix). This mea-sure is more practical when using complex models than frequency mea-sures that vary widely and, in the case of delinquency, deviate largelyfrom the normal distribution. This measure allows the authors to studythe age-dependent differentiation in male and female participation indelinquency. The self-report questionnaire includes 23 nonviolent of-fenses, ranging from "riding a bus without buying a ticket" to "cartheft," and six violent offenses, ranging from "illegal possession of aweapon" to "violent assault." An estimate of the reliability of the scaleis .65 (Cronbach's alpha).
92

RESEARCH QUESTIONS
The object of the present research is to determine the relation be-tween age and the proportion of respondents who have reported atleast one delinquent act in the year previous to their interview. Theauthors use the differential autoregressive model to test the hypothesisthat sex differences in delinquency are invariant across age; that is,whether the same parameters apply for males as well as females.
.' : RESULTS
To handle the data as efficiently as possible, all cohorts were dividedinto data groups, with either one, two, or three measurements. Some ofthese groups containing very few subjects (1 through 3) were discarded,because of lack of variance. In most cases, these invariant groups con-sisted of a single respondent, and only 52 respondents had to be dis-carded from the analysis. All other data were analyzed. The next stepwas to integrate the data on a single-time axis of 20 years.
Before analyzing the integrated data set, the authors tested whetherthe parameters of cohorts of equal age but from different historicalperiods could be considered as being equal. As a result of the resam-pling, it was found that 1,349 respondents were of the same age, butlived in different periods. The authors found neither a period effectIF(2,1337) = 1.7, n.s.], nor an interaction effect between age and period[F(6, 1337) ^ 1.7, n.s.]. Next, we looked into the possible problem ofinstrumentation. As a consequence of resampling on the second mea-surement in 1994, 70 of the adolescents who were 15 years old hadcompleted the questionnaire three years ago, whereas 55 adolescentsof the same age group had no previous experience. Comparing thesetwo groups indicated no significant instrumentation effect tF(l, 123)= 1.3, n.s.]. On the third measurement in 1997, 32 adolescents whowere 15 years old experienced the questionnaire for the first time, and43 for the second time. Again, there were no significant differences inself-reported dehnquency [F(l, 73) = 0.07, n.s.]. In 1997, there werealso adolescents who were 18 years old who experienced the question-naire for the second (36 respondents) or third time (48 respondents).Again, no significant differences [F(l, 83) = 0.02, n.s.] were found.
Model fit. We started with the comparison of the parameters formales and females (Table 1). The parameters 70 (initial mean), a (drift),and b (constant change) are significantly different for males and fe-males. Next, the authors compared a null model (0) with all parameters
93
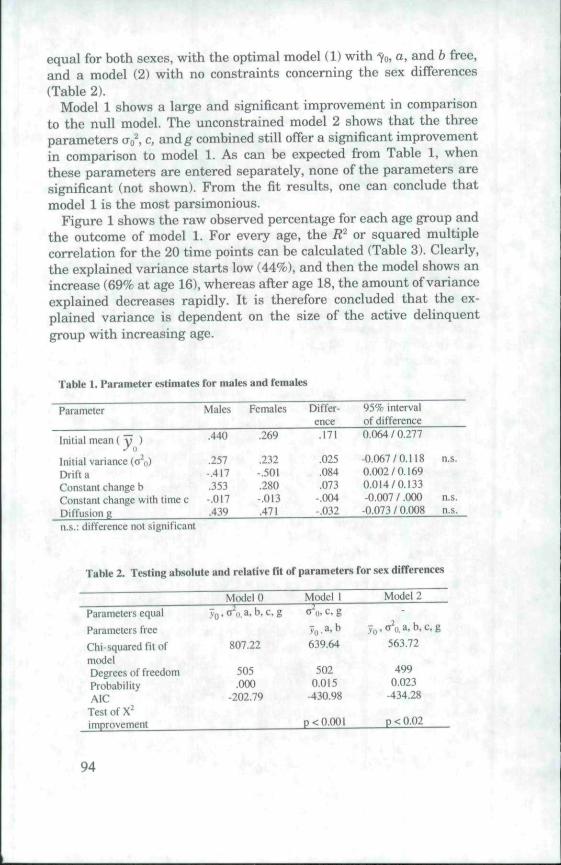
equal for both sexes, with the optimal model (1) with 70, a, and b free,and a model (2) with no constraints conceming the sex differences(Table 2).
Model 1 shows a large and significant improvement in comparisonto the null model. The unconstrained model 2 shows that the threeparameters (Jo c, and g combined still offer a significant improvementin comparison to model 1. As can be expected from Table 1, whenthese parameters are entered separately, none of the parameters aresignificant (not shown). From the fit results, one can conclude thatmodel 1 is the most parsimonious.
Figure 1 shows the raw observed percentage for each age group andthe outcome of model 1. For every age, the R^ or squared multiplecorrelation for the 20 time points can be calculated (Table 3). Clearly,the explained variance starts low (44%), and then the model shows anincrease (69% at age 16), whereas after age 18, the amount of varianceexplained decreases rapidly. It is therefore concluded that the ex-plained variance is dependent on the size of the active dehnquentgroup with increasing age.
Table I. Parameter estimates for males and females
Parameter
Initial mean ( y )
Initial variance (0^0)Drift aConstant change bConstant change with time cDiffusion a
Males
.440
.257-.417.353-.017.439
Females
.269
.232-.501.280-.013.471
Differ-ence.171
.025
.084
.073-.004-.032
95% inlervalof difference0.064 / 0.277
-0.067/0.1180.002/0.1690.014/0.133-0.007 / .000-0.073 / 0.008
n.s.
n.s.n.s.
n.s.: difference not significant
Table 2. Testing absolute and relative fit of parameters for sex differences
Paiameters equal
Parameters freeChi-squared Tit ofmcxJelDegrees of freedomProbabilityAIC
Test of Ximprovement
Model 0vo.o-o.a.b.c.g
807.22
505.000
-202.79
Model 1O~ih C. g
vn.a^b639.64
5020.015430.98
p< 0.001
Model 2-
y,,,(TVa,b.c,g563.72
4990.023
-434.28
p < 0.02
94
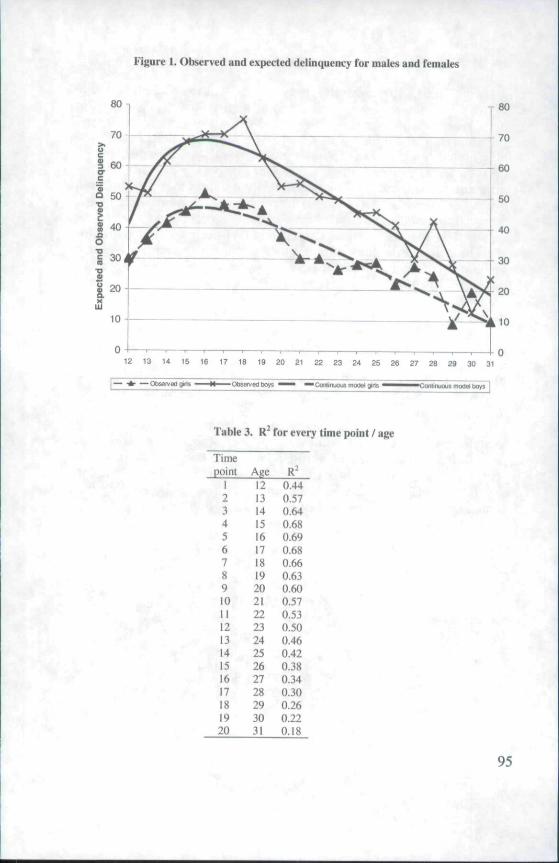
Figure 1. Observed and expected delinquency for males and females
'2 13 15 16 17 IB 19 20 21 22 23 24 25 26 27 26 29 30 31
— Observed girts -ooservea boys • Continuous model gins ' moOel Doys
Table 3. R* for every time point / age
Timepoint123456789
to11121314151617181920
Age1213141516171819202122232425262728293031
R»0.440.570.640680.690.680.660.630.600.570.530.500.460.420.380.340.300.260.220.18
95

. < - DISCUSSION . .
Hirschi and Gottfredson (1994) have stated that the basic differencesin delinquency between sexes seem to be invariant across age. In ourdata, the percentage of the self-reported delinquency for males is ap-proximately 1.5 that for females. But males reach a peak at a consider-ably higher level, and the changes over age are also more prominent.Most importantly, the difference between the percentages diminishesafter the peak age of 16. The modeled curve does refiect a significantdifference in maturation or growth: females are constantly less delin-quent than males, but male involvement in delinquency changesfaster. The results of this study are not entirely in line with theHirschi-Gottfredson thesis of invariance, as the rate of change is higherfor males than for females. Basically, we interpret these results asdisconfirmation of the view that the differences between males andfemales are invariant over age. At the same time, it must be recognizedthat these developments are neither easily measured, nor easily mod-eled. Unexplained variance is considerable, especially at later ages.Roughly, the percentage grows and declines at about the same ages,and in this respect the results of this study do not contradict the find-ings of D'Unger, Land, and McCall (2002), who also found similar pat-terns for males and females, but a much higher involvement indelinquency for males.
In another respect the curve seems to be equal for both sexes: themodeled peak ages are the same. In view of the fact that females havea slight lead in development during adolescence and tend to associatewith males who are somewhat older (Harrington Cleveland, 2003), itis a bit surprising that this developmental difference is not reflectedin delinquency data. Further research is needed on this point.
; • ; . ; , - ,
APPENDIX AItems of the self-report questionnaire
In the past year, have you1. taken a ride on the bus, tram, or underground without a valid ticket?2. taken a ride on the treiin without a valid ticket?3. driven a car, motorcycle, or moped without a valid driver's license or in-
surance?4. painted graffiti on walls, buses, or bus stops?5. set fire to something that did not belong to you?6. damaged or destroyed things?7. stolen money from a call box or a vending machine?8. stolen something from a shop?9. stolen something in school?
96
10. stolen something from home?11. stolen something from your work?12. stolen a motorcycle, moped, or bicycle?13. stolen a car?14. stolen something from or in a car?15. pickpocketed someone?16. stolen a handbag or suitcase from someone?17. broken into a house or building or entered witbout permission?18. stolen something else?19. bought sometbing while you knew it was stolen?20. sold something that had been stolen?21. carried a knife or other weapon?22. threatened to hurt someone to obtain money or valuable goods?23. been involved in fights, for instance in football stadiums, during demon-
strations, or on tbe street?24. seriously molested someone outside your family, so that a visit to the
bospital was necessary?25. seriously molested someone of your family, so tbat a visit to the hospital
was necessary?26. burt someone with a knife or otber weapon? •.:27. used marihuana or hashish?28. used hard drugs, such as heroin, cocaine, lsd, or speed?29. used beer, wine, or liquor while you were too young?
REFERENCES
Adier, F., Mueller, G. O. W., & Laufer, W. S. (1998). Criminology (3rd edition).Boston: McGraw-Hill.
Coleman, J. S. (1968). The mathematical study of change. In H. M. Blalock &A. B. Blalock (Eds.), Methodology on social research, (pp. 428-478) NewYork; McGraw-Hill.
Dijkum, C. van, & Landsheer, H. (2000). Experimenting witb a non-lineardynamic model of juvenile criminal behavior. Simulation & Gamins31, 479-490.
D'Unger, A. V., Land, K. C, & McCall, P. L. (2002). Sex differences in agepattems of delinquent/criminal careers: Results from Poisson latent
, class analysis of the Philadelphia cohort study. Journal of QuantitativeCriminology, 18, 349-375.
Gonfredson, M., & Hirschi, T. (1988). Science, public policy, and the careerparadigm. Crimonology, 26, 37-55.
Gottfredson, M., & Hirschi, T. (1990). A general theory of crime. Stanford:Stanford University Press.
Hagan, F. E., (1998). Introduction to criminology: Theories, methods and crimi-nal behavior. Chicago: Nelson Hall.
Hart, H. 't. (1992). Opzet en uitvoering van het WIL-panel 1 en 2 [Design anddata-collection of The Utrecht Study of Adolescent Development 1 and 2\.Unpublished manuscript, Utrecht University.
97

Hart, H. 't. (1994). Criminaliteit in latente klassen: Een voorlopige analysevan de structuur van crimineel gedrag van jongeren [Criminal behaviorin latent classes: A preliminary analysis of the structure of adolescents'criminal behavior]. Utrecht University: Internal Publication.
Harrington Cleveland, H. (2003). The infiuence of female and male risk on theoccurrence of sexual intercourse within adolescent relationships. Jour-nal of Research on Adolescence, 13, 81-112
Hirschi. T., & Gottfredson, M. (1983). Age and the explanation of crime. Ameri-can Journal of Sociology, 89, 552-584.
Hirschi, T., & Gottfredson, M. (1984). All wise after the fact learning theory,again: Reply to Baldwin. American Journal of Sociology, 90, 1330-1333.
Hirschi, T., & Gottfredson, M. (1994). The generality of deviance. New Bruns-wick, NJ: Transaction Publishers.
Hoyt, S., & Scherer, D. G. (1998). Female juvenile delinquency: Misunderstoodby the juvenile system, neglected by social science. Law and HumanBehavior, 22, 81-107.
Meeus, W., & 't Hart, H. (1993). Jongeren in Nederland. [Young People in theNetherlands}. Amersfoort: Academische uitgeverij.
Oud, J. H. L. (1978). Systeem-methodologie in sociaal-wetenschappelijk onder-zoek [Systems methodology in social science research.] Doctoral disserta-tion. Nijmegen, The Netherlands: Alfa.
Oud, J. H. (2001). Quasi-longitudinal designs in SEM state space modeling.Statistica Neerlandica, 55, 200-220.
Oud, J. H. L. (2002). Continuous time modeling of the cross-lagged panel de-sign. Kwantitatieue Methoden, 69, 1-26.
Oud, J. H. L., & Jansen, R. A. R. G. (2000). Continuous time state spacemodeling of panel data by means of SEM. Psychometrika, 65, 199-215.
Overbeek, G., Vollebergh, W., Meeus, W., Engels, R., & Luijpers, E. (2001).Course, co-occurrence, and longitudinal associations of emotional distur-bance and delinquency from adolescence to young adulthood: A six-yearthree-wave study. Journal ofYouth and Adolescence, 30, 401^26.
Palmert, M. R., & Boepple, P. A. (2001). Variation in the timing of puberty:Clinical spectrum and genetic investigation. Journal of Clinical Endocri-nology & Metabolism, 86, 2634-2368.
Raudenbush, S. W., & Chan, W. (1993). Application of a hierarchical linearmodel to the study of adolescent deviance in an overlapping cohort de-sign. Journal of Consulting and Clinical Psychology, 61, 941-951.
Shavit, Y., & Rattner, A. (1988). Age, crime and the early life course. AmericanJournal of Sociology, 93, 1457-1470.
Tittle, C. R., & Ward, D. A. (1993). The interaction of age with the correlatesand causes of crime. Journal of Quantitative Criminology, 9, 3-53.
Van der Ende, J., & Verhulst, F. C. (2005). Informant, gender and age differ-ences in ratings of adolescent problem behavior. European Child & Ado-lescent Psychiatry, 14iS), 117-126.
VanderValk, I., Spruijt, E., de Goede, M., Maas, M., & Meeus, W. (2005).Family structure and problem behavior of adolescents and young adults:A growth-curve study. Journal of Youth and Adolescence, 34, 533-546.
98

Copyright © 2022 FDOKUMEN