Youth poverty and transition to adulthood in Europe
32
Demographic Research a free, expedited, online journal of peer-reviewed research and commentary in the population sciences published by the Max Planck Institute for Demographic Research Konrad-Zuse Str. 1, D-18057 Rostock · GERMANY www.demographic-research.org DEMOGRAPHIC RESEARCH VOLUME 15, ARTICLE 2, PAGES 21-50 PUBLISHED 27 JULY 2006 http://www.demographic-research.org/Volumes/Vol15/2/ DOI: 10.4054/DemRes.2006.15.2 Descriptive finding Youth poverty and transition to adulthood in Europe Arnstein Aassve Maria Iacovou Letizia Mencarini © 2006 Max-Planck-Gesellschaft.
Transcript of Youth poverty and transition to adulthood in Europe

Demographic Research a free, expedited, online journal of peer-reviewed research and commentary in the population sciences published by the Max Planck Institute for Demographic Research Konrad-Zuse Str. 1, D-18057 Rostock · GERMANY www.demographic-research.org
DEMOGRAPHIC RESEARCH VOLUME 15, ARTICLE 2, PAGES 21-50 PUBLISHED 27 JULY 2006 http://www.demographic-research.org/Volumes/Vol15/2/ DOI: 10.4054/DemRes.2006.15.2 Descriptive finding
Youth poverty and transition to adulthood in Europe
Arnstein Aassve
Maria Iacovou
Letizia Mencarini © 2006 Max-Planck-Gesellschaft.

Table of Contents
1 Introduction 22 2 What is youth? 24 3 Poverty among youth: the literature 26 3.1 Child poverty 26 3.2 Poverty among youth 27 3.3 The determinants of poverty among youth 28 4 Data: The European Household Panel Survey (ECHP) 29 5 Patterns of poverty among youth in Europe 31 5.1 Age-poverty profiles 31 5.2 Poverty and leaving home 34 5.3 Single-person households 39 5.4 Children 40 5.5 Poverty rates by activity status 41 6 Conclusions 43 7 Acknowledgements 45 References 46
Demographic Research: Volume 15, Article 2
descriptive finding
http://www.demographic-research.org 21
Youth poverty and transition to adulthood in Europe
Arnstein Aassve 1
Maria Iacovou 2
Letizia Mencarini 3
Abstract
There is an increasing amount of research focussing on the transition to adulthood, a stage of the life cycle where young people face demanding life decisions, including completion of education, finding stable employment, and establishing their household and family. Whereas there is a well-developed literature on poverty among households in general, very little research has focused on poverty among young adults. Using the European Community Household Panel (ECHP) we provide a detailed description of youth poverty in Europe. Across the European Union youth poverty varies greatly, being higher in Southern European countries, as well as in the ‘liberal’ regimes of the UK and Ireland. However, there are also large variations in the extent of youth poverty within countries, between what we might term “younger youth” (aged 16-19) and “older youth” aged (25-29). In the UK, poverty rates among “younger youth” are much higher than among “older youth”, suggesting that poverty among young people is closely associated with child poverty. In the Scandinavian countries, poverty peaks dramatically in the early twenties, indicating that in these countries, poverty is associated with leaving home.
1 Institute for Social and Economic Research, Essex University. 2 Institute for Social and Economic Research, Essex University, Wivenhoe Park, Colchester CO4 3SQ, U.K., Please send correspondence to [email protected].
3 Faculty of Political Science, University of Florence Italy. Dept of Statistics, viale Morgagni 59 ,50136 Florence, Italy
Aassve, Iacovou, & Mencarini: Youth poverty and transition to adulthood in Europe
22 http://www.demographic-research.org
1. Introduction
Over the last decade a considerable amount of research has focussed on the transition to adulthood, a stage of the life cycle where young people face demanding life decisions, including the completion of education, finding stable employment, and establishing their household and family. The transition to adulthood in the Western world has not followed a consistent trend. Modell et al (1976) show that between the nineteenth and the mid-twentieth centuries, the transition to adulthood became more temporally organised and more predictable. In the 1950s and the decades immediately following, the transition to adulthood continued to occur in a reasonably ordered and predictable fashion, with all the constituent transitions taking place over the space of only a few years. However, the last decades of the twentieth century and the start of the twenty-first century have seen the transition to adulthood in many countries becoming more complex and protracted – often in ways which leave young people particularly vulnerable. With increasing levels of participation in higher education, young people are spending longer dependent on the state or their families for financial support, and without earned incomes of their own. Additionally, changes to youth labour markets over recent decades mean that when young people do enter the labour market, they may spend considerable periods without a job (Hammer 2003; Russell and O’Connell 2001), or in low-waged or insecure employment. Young people are also vulnerable in other areas, being more likely than those in other age groups to experience problems with housing (Rugg 1999), drug abuse (Boys, Marsden and Strang 2001), and mental health (Shucksmith and Spratt 2002). The mid-to-late teens and early twenties are also the years in which individuals are most likely to commit crimes and be incarcerated (Hansen2003).
Whereas a great deal of research exists about the multiple dimensions of vulnerability facing young people, much less has been written about how the often precarious situation of young people maps on to their economic situation, and the degree of poverty experienced by young adults. This lack of research on poverty among young people is particularly striking when viewed against the rather large body of research on poverty among other age groups at high risk – particularly children, among whom poverty, and the later effects of poverty, have been comprehensively documented (Bradbury and Jantti 1999, Cantillon and Van den Bosch 2002, and many others).
For individuals at the very start of the transition to adulthood, the factors associated with youth poverty are similar to the factors associated with child poverty (Beaujot and Liu 2002; Cantillon and Van den Bosch 2003).The majority have no incomes of their own, and their risk of poverty is thus largely dependent on the incomes of adult members of their households (mainly, their parents) in relation to the size of their households. However, as young people move towards adulthood, the factors

Demographic Research: Volume 15, Article 2
http://www.demographic-research.org 23
associated with youth poverty become more complex. Young people’s incomes vary widely – both between countries, and within countries. Young people may be in education; they may have a job (low-waged or better-paid); they may be unemployed; they may be caring for children; or they may be out of the labour market for other reasons. The proportions of young people in each of these situations vary between countries, and the incomes associated with each situation vary between countries and also within each country. Young people’s living arrangements also vary – and again, this variation is observed both within and between countries. Many young people live with their family of origin; others have left home and live alone, or with a partner, or with friends. Some have children of their own, with or without a partner. For young people with low or no earnings, living with their parents may protect them against poverty – although conversely, the extra burden their presence places on household finances may throw the whole household into poverty. Young people whose own earnings are relatively high may not be poor if they live apart from their families of origin, and if they do live at home, they may act as a resource for their families of origin, increasing household equivalent income to a level higher than it would otherwise have been (Canto-Sanchez and Mercader-Prats 1999).
This paper documents the pattern of youth poverty in Europe. Though our analysis is cross-sectional and descriptive, it fills an important gap not only in the poverty literature but also the literature concerned with transition to adulthood. Our analysis sheds light on how the complicated nexus of living arrangements, economic status and income impacts on poverty for young people across Europe.
Most of the analysis in this paper is carried out at the single-country level, presenting statistics separately for each country. However, for the purposes of discussion and synthesis it becomes useful to think in terms of clusters of countries. We use a typology based on the classification outlined by Esping-Andersen (1990). This consists of:
♦ the ‘social-democratic’ regime type, characterised by high levels of state support and an emphasis on the individual rather than the family, typified by the Scandinavian countries and the Netherlands
♦ the ‘conservative’ regime type, characterised by an emphasis on insurance-based benefits providing support for the family rather than the individual, and typified by the continental European states of France, Germany, Austria, Belgium and Luxembourg.
♦ the ‘liberal’ group of welfare states typified by a modest level of welfare state provision and a reliance on means-tested benefits, exemplified by the US, and to a lesser extent by the UK and Ireland.

Aassve, Iacovou, & Mencarini: Youth poverty and transition to adulthood in Europe
24 http://www.demographic-research.org
Ferrera (1996) proposes the addition of a fourth category for the Southern European countries which were excluded in Esping-Andersen’s original typology:
♦ a ‘Southern’ group of ‘residual’ welfare states, typified by low levels of welfare
provision, and a reliance on the family as a locus of support – here, typified by Italy, Spain, Portugal and Greece.
As well as providing a convenient and theoretically-motivated means of
simplifying the interpretation of our analysis, this type of welfare-regime analysis also prompts us to consider the links between the welfare state and youth poverty: to what extent can youth poverty be relieved by welfare state benefits, or state intervention in the labour market?
The paper is structured as follows. We first discuss definitions of “youth”, and assess the definition most appropriate for this analysis. Next we provide a review of the literature relating to poverty among young people. We then introduce data from the European Community Household Panel (ECHP), which is used for analysis in later sections of the paper, before focussing specifically on poverty. We present an analysis of young people’s vulnerability to poverty, relative to their counterparts in other countries, and also relative to other age groups in their own countries. We also assess the relative risk of poverty on young people by family status and employment status. The last section concludes and offers an agenda for future research on youth poverty.
2. What is youth?
One reason why youth poverty is such a difficult issue is because there is no unique or clear-cut definition of “youth”. The “young” constitute a group of individuals located somewhere between childhood and adulthood, but the notion of “youth” does not lend itself to definition as a lifecycle period in the same way as other groups such as “children” or the “elderly” might be defined.
The United Nations defines youth as composed of individuals aged between 15 and 24 years of age4. The European Union follows this definition, both in its programmes targeted at young people and in its White Paper on Youth (European Commission 2001). The UK’s Economic and Social Research Council’s Youth, Citizenship and Social Change programme used a working definition of youth as 15-25
4 The United Nations General Assembly defined ‘youth’ as those persons falling between the ages of 15 and 24 years inclusive. This definition was made for International Youth Year, held around the world in 1985. All United Nations statistics on youth are based on this definition, as illustrated by the annual yearbooks of statistics published by the United Nations system on demography, education, employment and health.
Demographic Research: Volume 15, Article 2
http://www.demographic-research.org 25
(Catan, 2004), and the Joseph Rowntree Foundation’s Young People programme looked at those aged 16-25 (Jones, 2002). National bodies often define the lower age band as the statutory minimum school leaving age in their country – so, for example, the British Office for National Statistics usually defines “young adults” as aged between 16 and 24 years of age (Office for National Statistics 2004).
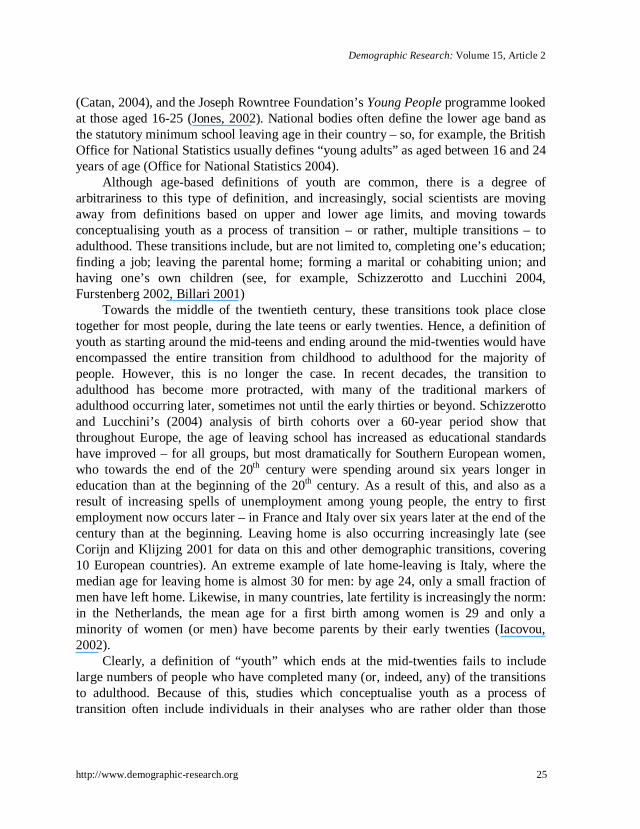
Although age-based definitions of youth are common, there is a degree of arbitrariness to this type of definition, and increasingly, social scientists are moving away from definitions based on upper and lower age limits, and moving towards conceptualising youth as a process of transition – or rather, multiple transitions – to adulthood. These transitions include, but are not limited to, completing one’s education; finding a job; leaving the parental home; forming a marital or cohabiting union; and having one’s own children (see, for example, Schizzerotto and Lucchini 2004, Furstenberg 2002, Billari 2001)
Towards the middle of the twentieth century, these transitions took place close together for most people, during the late teens or early twenties. Hence, a definition of youth as starting around the mid-teens and ending around the mid-twenties would have encompassed the entire transition from childhood to adulthood for the majority of people. However, this is no longer the case. In recent decades, the transition to adulthood has become more protracted, with many of the traditional markers of adulthood occurring later, sometimes not until the early thirties or beyond. Schizzerotto and Lucchini’s (2004) analysis of birth cohorts over a 60-year period show that throughout Europe, the age of leaving school has increased as educational standards have improved – for all groups, but most dramatically for Southern European women, who towards the end of the 20th century were spending around six years longer in education than at the beginning of the 20th century. As a result of this, and also as a result of increasing spells of unemployment among young people, the entry to first employment now occurs later – in France and Italy over six years later at the end of the century than at the beginning. Leaving home is also occurring increasingly late (see Corijn and Klijzing 2001 for data on this and other demographic transitions, covering 10 European countries). An extreme example of late home-leaving is Italy, where the median age for leaving home is almost 30 for men: by age 24, only a small fraction of men have left home. Likewise, in many countries, late fertility is increasingly the norm: in the Netherlands, the mean age for a first birth among women is 29 and only a minority of women (or men) have become parents by their early twenties (Iacovou, 2002).
Clearly, a definition of “youth” which ends at the mid-twenties fails to include large numbers of people who have completed many (or, indeed, any) of the transitions to adulthood. Because of this, studies which conceptualise youth as a process of transition often include individuals in their analyses who are rather older than those
Aassve, Iacovou, & Mencarini: Youth poverty and transition to adulthood in Europe
26 http://www.demographic-research.org
considered as “young” by the conventional definitions. One of the very few existing studies devoted specifically to youth poverty also adopts a higher upper age limit: in this case, 29 years (Cantó-Sanchés & Mercader-Pratz, 1999). In this paper, we follow the approach of adopting a wide age range for youth5, from 16 to 29, breaking this down into three subgroups: 16-19, 20-24, and 25-29.
3. Poverty among youth: the literature
3.1 Child poverty
We have already remarked that in contrast to the lack of research on youth poverty, there exists an extensive and well-developed literature on child poverty. Findings on child poverty are relevant to the study of youth poverty for two reasons. First, as already remarked, those at the start of the transition to adulthood are similar to children, differing only in terms of a year or two in age. Second, older groups of young people are likely to have young children themselves, and therefore child poverty impacts on their households, as parents.
Child poverty rates vary widely between countries. Income transfers and other welfare state services are clearly important for the living standards of poor children, and these have been the focus of much previous research on child (and adult) poverty. Bradbury & Jantti (1999) examine the historical, political and economic developments that have led to the different structures of welfare state institutions, and characterise countries as ‘welfare leaders’, which tend to have low poverty rates, and ‘welfare laggards’ which have much higher child poverty rates. In this context, the English-speaking countries stand out: even though they are usually categorised as ‘welfare laggards’ because of their low aggregate levels of social expenditures, the tight targeting of this expenditure means that in most cases (with the exception of the US) they actually provide quite substantial income transfers to their most needy children. The living standards of these children, however, remain relatively low because of low labour market incomes. The higher living standards of the most disadvantaged children in the ‘welfare leaders’ (particularly the Nordic countries) is due to the higher market incomes in these families. Because of their well-known rigidities, continental European labour markets do a better job in providing resources to the most disadvantaged children.
5 The full range of ECHP data is available only for individuals aged 17 and over, though data on household structure is available for 16-year-olds.
Demographic Research: Volume 15, Article 2
http://www.demographic-research.org 27
Two important determinants of child poverty are living with a lone mother, and maternal employment. Children are generally more likely to be poor if living with a lone mother (Garfinkel et al. 2004) – although, as we show in the following section, poverty rates among lone mothers vary between countries. Maternal employment may also be a key determinant of child poverty: other things being equal, families where mothers have paid jobs are less likely to experience poverty than those where the mother does not have a job. However, as Chen and Corak (2005) show, maternal employment may not be sufficient to raise a family out of poverty in the absence of sufficiently high wages or institutional support.
3.2 Poverty among youth
The relatively small number of studies focusing on poverty among young people are based mainly on two data sources: the cross-sectional Luxembourg Income Study (LIS) and the longitudinal European Community Household Panel (ECHP).
Iacovou and Berthoud (2001), using data from the ECHP, find that across Europe, the risk of poverty falls with age over the age range 17-30. They find that various factors - being in employment, having a working partner, and living in one’s family of origin - protect against poverty, and that the risk of poverty is highest for those people for whom none of these protective factors is present. Young people in the social democratic group of countries are most likely to have no protective factors present, and most likely to be poor given the absence of protective factors.
Kangas and Palme (2000) use LIS data to study variations in poverty rates over the life cycle in eight OECD countries. They first analyse poverty rates by age group alone, and find high poverty rates among those under 25. They then consider a life-stage typology, based on four groups: “youth”, “family”, “empty nest” and “old age”. Those who are childless young adults, under 25, are defined as “youth”, and this group is found to be at relatively high risk of poverty – in some countries more than others.
Smeeding and Ross Phillips (2002) use LIS data from seven countries (France, Germany, Italy, Sweden, the UK, the US and the Netherlands) to analyse the economic sufficiency of young people’s earnings, and the incidence of poverty on young people. They find that in all countries, only a minority of young people of either sex in their late teens and early twenties are able to support themselves with their earnings alone – though wages for this age group in Britain are rather higher than elsewhere. Even when social transfers are taken into account, a significant proportion of young people remain unable to support themselves – and much less, a family – before their mid- to-late twenties. Although income sufficiency increases markedly through the early twenties, poverty rates decline much more slowly over this age group, indicating that young
Aassve, Iacovou, & Mencarini: Youth poverty and transition to adulthood in Europe
28 http://www.demographic-research.org
people with low earnings are protected from poverty to a degree because of living with their families of origin.
Fahmy (2002), using data from the 1999 Poverty and Social Exclusion Survey of Britain, finds that on a range of five poverty measures, those aged 16-24 are more likely to be poor than those aged 25-34 years. For example, using a standard measure of poverty based on 60% of median income and the OECD equivalence scale, 33% of those in the 16-24 age group were poor, compared with only 16% of those aged 25-34 years.
The European commission report on poverty (Eurostat 2002) is based on ECHP data. Across Europe, the incomes of young people below age 24 are below national averages: the only groups poorer than young people are children and older people over age 65. Using an alternative approach which assesses the risk of poverty as a function of an individual’s position in the income distribution, young people appear at even greater risk of poverty relative to other groups: this relative risk is particularly high in Scandinavian countries. Young people are also at higher risk of non-monetary deprivation than older groups – though the differentials in risks are less marked, which may be related to the fact that many young people continue to rely on support from parents through transfers-in-kind.
33 The determinants of poverty among youth
Family structure is an important determinant of youth poverty. We have already referred to the protective effect of living in the family of origin found by Iacovou and Berthoud (2001). The risk of poverty is also elevated for households in which the head is female, young or a single parent (OECD 2001). Mejer (2000), using the ECHP, finds that single parents, who are often young adults, have some of the highest poverty rates, especially in the UK.
Smeeding et al (1999) and Berthoud and Robson (2003) confirm that in most Anglo-Saxon nations, single parenthood is a strong risk factor for youth poverty. In both the US and the UK, former teen mothers are markedly more likely than women who first gave birth in their twenties not to be in work and to be in the bottom fifth of the income distribution. Teenage motherhood is much less common in continental Europe, but it is still the case that former teen mothers fare much less well on average in later life.
Labour market factors such as unemployment and low pay are risk factors for poverty among young people. Canto-Sanchez and Mercader-Prats (1999) study entry-level jobs held by new school leavers (aged 16 to 29) one year after leaving education in different selected European countries, and find that the labour market varies
Demographic Research: Volume 15, Article 2
http://www.demographic-research.org 29
markedly between countries. The key role of education has also been highlighted by Pavis, Platt and Hubbard (2000), who point out that simply getting a job is not enough to avoid social exclusion: even if they find a job, those with low educational levels may remain trapped in poorly paid low quality employment.
The existing literature demonstrates that youth poverty is likely to be an issue worthy of research, and that substantial cross-country variations are to be expected. We build upon the literature in this paper by providing a detailed account of youth poverty rates across Europe, and by investigating the relationship of youth poverty to aspects of family structure such as living with one’s parents, and lone parenthood; and to the young person’s employment status.
4. Data: The European Household Panel Survey (ECHP)
The data we use for our analysis come from the European Community Household Panel (ECHP), a set of comparable large-scale longitudinal studies set up and funded by the European Union. The first wave of the ECHP was collected in 1994 for the original countries in the survey: Germany, Denmark, the Netherlands, Belgium, Luxembourg, France, the UK, Ireland, Italy, Greece, Spain and Portugal. Three countries were late joiners to the project: Austria joined in 1995, Finland in 1996 and Sweden in 1997. All countries except Luxembourg and Sweden are included in the analysis. Luxembourg is omitted because of an extremely small sample, Sweden because the data do not form a panel. Although the analysis in this paper is cross-sectional (therefore not involving any need for longitudinal data) the income measure which we use for our analysis, and which we describe later in this section, does require longitudinal data. Eight waves of the ECHP were collected in total (fewer for late-joining countries), with the last wave collected in 2001.
Income data in the ECHP is very detailed. Each individual is asked about his or her income from earnings; private and state pensions and benefits; and other sources, such as rental and investment income, and private transfers. Additionally, information is gathered about any other income (nearly always a rather small proportion) accruing to the household rather than individuals within the household, and the assumption is made that this income should be attributed equally to each individual living in the household.
However, all this information is collected retrospectively, and covers the calendar year prior to the survey interview. Thus, a Wave 1 interview conducted in, say, August 1994 will collect information about respondents’ incomes between January and December 1993, while other variables (such as household composition, labour market status, and so on) pertain to respondents’ situation at the time of the interview. This means that there is a temporal mismatch between most of the data in Wave 1, and the
Aassve, Iacovou, & Mencarini: Youth poverty and transition to adulthood in Europe
30 http://www.demographic-research.org
income data collected in Wave 1. This degree of mismatch varies depending on the date of the interview, but on average it is well over six months: over half of all ECHP interviews were conducted in August or later in the year.
This presents a problem when computing household equivalent income, for the following reason. Suppose we wish to calculate a household’s total income in 1995 (Wave 2). Adding together the incomes reported at Wave 2 for all individuals present in a household in that year, generates not total household income in 1995, but rather, the sum of 1994 incomes for those present in the household in 1995. This is not the same as the household’s total income in 1994, because household composition may have changed between 1994 and 1995. For population groups for whom household structure is relatively stable, the problems arising from this inaccuracy may not be serious. However, for young people, for whom household structure is likely to be fluid, and highly dependent upon the sufficiency of current incomes, the problems are potentially serious.
We take the following approach, suggested by Heuberger (2003). To compute household equivalent income in year t, we use income data pertaining to year t collected at year t + 1, summing this over all the individuals present in the household at year t, and using an equivalence scale based on the numbers and ages of individuals present at year t.
Consistent with many previous studies, we define the poverty threshold to be 60 percent of the net equivalised household income as specified above. If the household income falls below this threshold an individual is defined as poor. Our poverty measure is thus relative, which facilitates comparisons between countries, even countries with different per capita incomes (see for instance Layte and Whelan 2002; Whelan et al 2003)6.
In order to maximise sample sizes, we use pooled data from all available waves for each country. Because of the way we have computed income data, we have no measure of income for 2001 in any country. Therefore, we pool seven waves of data 1994-2000 for most countries; six for Austria (1995-2000); and five for Finland (1996-2000). Using this pooled data means that we generate estimates of poverty rates approximating to the mean poverty rates in each country over the years in question. In fact, of course, poverty rates do change over time, and our estimates may mask this. In order to assess whether this was a serious problem, we compared youth poverty rates over the first two
6 Some authors, for example Berthoud (2004) and Immervoll, Sutherland and de Vos (2000) use a poverty line based on an EU-wide measure of median income: however, the usual practice is to use country-specific median income. A problem of using relative poverty is the choice of an appropriate poverty threshold. Often a threshold of 60 per cent of the median is chosen, but many papers also use alternative poverty thresholds of 40, 50 and 70 percent of median net household income (see Whelan et al 2003). In this paper, for consistency with the Eurostat definition, we use 60 per cent of median income as a main poverty indicator (see Aassve et al 2005 for analysis also using these other thresholds).

Demographic Research: Volume 15, Article 2
http://www.demographic-research.org 31
years of the sample with youth poverty rates over the last two years. We found that poverty rates had fallen somewhat in all countries over the period concerned, but that rankings between countries were almost identical over the period.
5. Patterns of poverty among youth in Europe
5.1 Age-poverty profiles
Figures 1 to 3 present smoothed data on poverty rates, by age, for the age range 0-70 (in each country, poverty rates rise after age 70). For clarity, three graphs are presented, showing the UK plotted together with 1) Ireland and the Social Democratic countries, 2) the Conservative countries, and 3) the Southern countries. On each graph, the poverty rate for the UK is shown by the bold black line.
Figure 1: Poverty rates in the UK, Ireland and the Social Democratic countries
0%
10%
20%
30%
40%
0 10 20 30 40 50 60 70
Age
% p
oo
r (i
nco
me
un
der
60%
med
ian
)
Finland DenmarkNetherlands UKIreland

Aassve, Iacovou, & Mencarini: Youth poverty and transition to adulthood in Europe
32 http://www.demographic-research.org
Figure 2: Poverty rates in the UK and the Conservative countries
0%
10%
20%
30%
40%
0 10 20 30 40 50 60 70
Age
% p
oo
r (i
nco
me
un
der
60%
med
ian
)
UK France Germany
Austria Belgium
Figure 3: Poverty rates in the UK and the Southern European countries
0%
10%
20%
30%
40%
0 10 20 30 40 50 60 70
Age
% w
ith
incom
e u
nder 6
0%
of
med
ian
UK Portugal Spain
Italy Greece

Demographic Research: Volume 15, Article 2
http://www.demographic-research.org 33
As is clear from these figures, the UK has some of the highest child poverty rates in Europe, rivalled only by Italy, Spain and Ireland. High levels of child poverty in the UK are not a new finding (Micklewright 2004, Bradbury and Jäntti 2001, and many others). However, child poverty has been at the centre of UK government anti-poverty measures since 1997, and recent evidence indicates that child poverty in the UK has indeed declined in recent years (Brewer et al. 2005).
After childhood, UK poverty rates show a steady decline with age, until around age 53, when they start rising again. Thus, in the UK, poverty rates among young people are lower than those among children, but higher than those of any other age group, until well into retirement age. We also observe that the “younger young” are at substantially higher risk of poverty than the “older young”.
The age-poverty profiles of other groups of countries all show distinct patterns. The social democratic group of countries have much the lowest general poverty rates in Europe (in Finland and Denmark, poverty rates are well under 10% over most of the age range considered) and in contrast to the UK, child poverty rates are very low. However, in all social democratic countries, poverty rates peak dramatically in the early twenties, rising to almost 20% in Denmark, and almost 30% in Finland. These are some of the highest youth poverty rates in Europe, and are particularly striking in the context of low overall poverty rates in these countries.
The most likely explanation for these high rates of youth poverty may be driven by the fact that young people in social democratic countries leave home at an extremely early age (see Figure 4), and are therefore unlikely to have high enough earnings at the time of home-leaving to protect them against poverty. How much of a problem are high rates of youth poverty in these countries? If (a) they are generated by large numbers of young people having brief spells in poverty around the time of home-leaving, which end quickly on finding employment, and (b) they are spells of moderate rather than extreme poverty, then they may present less of a problem than appears at first sight. There is no space in this paper to pursue these questions further, but they will provide an interesting avenue for future research in this area.
The Conservative countries (Figure 2) exhibit much flatter poverty-age profiles – at least up till retirement age. In these countries, child poverty rates are slightly higher than those for prime-aged people, but much lower than child poverty rates in the UK. Youth poverty rates are also lower than in the UK, with the exception of France, which exhibits a pattern akin to the social democratic pattern, though much less marked. Austria and Germany are interesting in that they show absolutely no elevated level of poverty among youth. What is special about these countries? One explanation may be their low levels of youth unemployment, related to the vocational training systems in place in these countries (see Müller et al. 1998). This, in combination with the fact that

Aassve, Iacovou, & Mencarini: Youth poverty and transition to adulthood in Europe
34 http://www.demographic-research.org
young people in these countries tend leave the parental home at a higher age than in the Social Democratic states, may generate low youth poverty rates.
Figure 3 compares poverty rates in the UK with those in Southern European countries. In these countries, poverty rates are generally high, particularly in Spain and Italy for the younger group, and in Portugal and Greece for older people. In all Southern European countries, child poverty rates are higher than in the other groups of countries, except the UK and Ireland. Youth poverty rates in Spain and Greece are very similar to those in the UK, while those in Portugal are lower, and those in Italy are very high. Again, an important reason behind these differences is that youth unemployment is low in Portugal, intermediate in Spain and Greece, and very high in Italy (see Aassve et al 2005). It is noticeable that in the southern European countries, there is no peak in poverty rates either in the early twenties, or at any age which might be associated with leaving home. Rather, in all these countries, poverty rates reach a peak towards the mid-teens (possibly associated with older teenagers’ increased contribution to the equivalence scale), and fall throughout the twenties.
5.2 Poverty and leaving home
Living arrangements affect the incidence of poverty for two principal reasons. First, via the numerator of the household equivalent income calculation: young people living alone will have only their own incomes contributing to the numerator, whereas those living with other adults will have the incomes of the other adults contributing. Second, via the equivalence scale, which serves as the denominator of the household equivalent income calculation: this denominator will be 1 for young people living alone, and greater than 1 for those living with other people – whether adults or children. Because additional household members feature in both the numerator and denominator of the calculation, it is not clear a priori what effect they will have on poverty rates. However, we may expect that in general, additional adults in employment will increase household equivalent income, whereas additional adults without employment, and children, will decrease it. The age at leaving home, and living arrangements on leaving home are highly diverse in Europe (see Aassve et al. 2003 and Iacovou 2002 for detailed accounts of this), and as we shall show later, these variations are closely linked to poverty rates.
Figure 4 shows the proportion of young people who have left the parental home, for three different age groups: the “younger young” aged 16-19; those aged 20-24; and the “older young” aged 25-29.
In every country, the proportion of young people who have left home rises with age group. In the youngest age group, the highest proportion of young people who have

Demographic Research: Volume 15, Article 2
http://www.demographic-research.org 35
left home is to be found in the UK, where it stands at nearly 12%, compared with 7% in the Scandinavian countries and 3% or lower in the Southern European countries.
Figure 4: Percentage of young people who have left home, by age group and country
0%20%40%60%80%100%
Age 16-19 Age 20-24 Age 25-29
Finland, Denmark, Netherlands UK, Ireland
France, Germany, Austria, Belgium Portugal, Spain, Italy, Greece
0%
20%
40%
60%
80%
100%
Age 16-19 Age 20-24 Age 25-29
For the 20-24 and the 25-29 age groups, the highest proportion of young people
who have left home is found in the social democratic countries, and the lowest in the Southern European countries. For example, among those aged 25-29, in the social democratic countries over 90% have left home, while the corresponding proportion in the Southern countries is well under half this level. Behaviour falls quite neatly into welfare regime clusters on this indicator, with the exception of the “liberal” cluster, where the UK occupies an intermediate position between the social democratic and conservative clusters, while Ireland shares all the features of the Southern European countries.
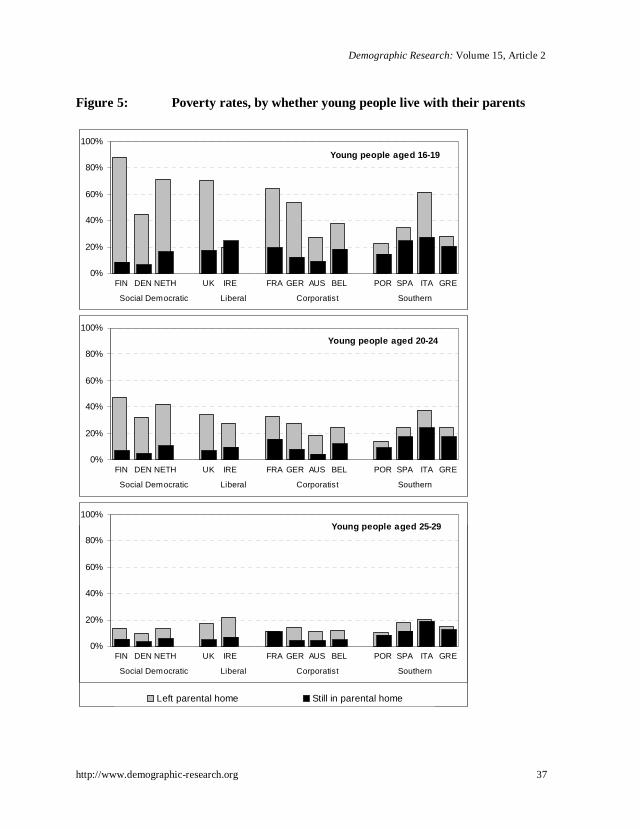
We now consider how poverty rates are linked with residential status. Figure 5 shows poverty rates by whether a young person is still living in the parental home, for three age groups: 16-19, 20-24, and 25-29. The grey lines indicate poverty rates among those young people who have left home, and the black lines indicate poverty rates among those remaining in the parental home. For each country, the left-hand column indicates poverty rates among those aged 16-19, the middle column indicates poverty
Aassve, Iacovou, & Mencarini: Youth poverty and transition to adulthood in Europe
36 http://www.demographic-research.org
rates among those aged 20-24, and the right-hand column indicates poverty rates among those aged 25-29.
Of those remaining in the parental home, the proportion who are poor decreases with increasing age, in every single country. This accords with intuition: those in older age groups are more likely to have a job, and higher wages within jobs, and thus household incomes are likely to be higher. Of those who have left home, poverty rates also decline as age group increases, in all countries but one. In most countries, this decline is much more dramatic than the decline for those living with parents.
In nearly all cases, young people are far more likely to be poor if they have left home, than if they live at home. This effect is strongest for the youngest group, and least so for the oldest group. The difference in poverty rates between those living at home and those who have left home (ie, the difference in height between the black bars and the grey bars) varies between countries. It is highest in the Scandinavian countries (where poverty rates among the general population are low, and where poverty rates among young people who have left home are extremely high). The differential is lowest in the Southern European countries, where poverty rates among the general population are high, and where poverty rates among young people who have left home are rather low. Italy forms a partial exception to this, with very high poverty rates among the young who have left home in the youngest group – but even in the case of Italy, the differentials in poverty rates are not as high as they are in the Scandinavian countries.
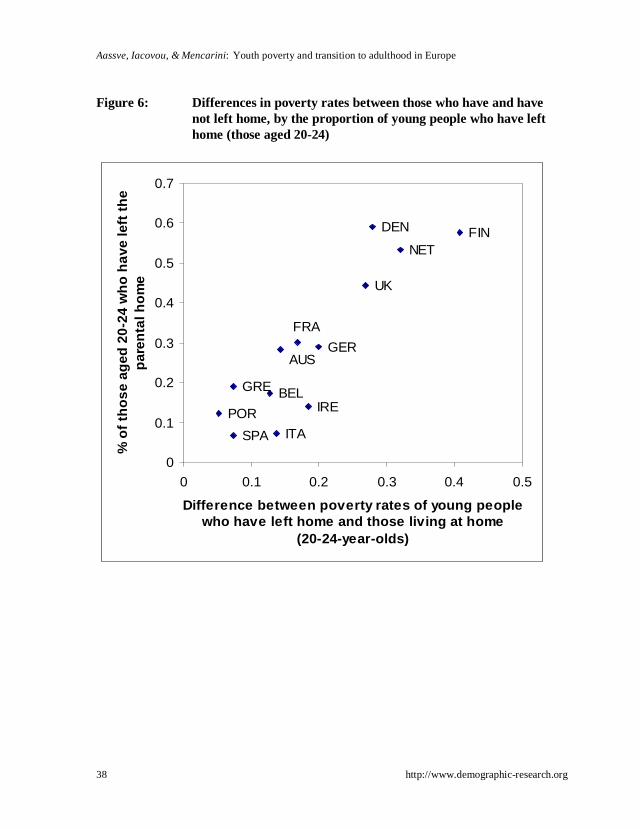
There is a strong relationship between poverty rates and age at leaving home: countries where there are large differences in poverty rates between young people living with their parents and those living away from home, are precisely those countries where young people are more likely to move away from home early. For young people aged 20-24, Figure 6 shows a scatterplot of differences in poverty rates between those at home and those who have left home, against the proportion of those still living at home. The relationship between the two variables is apparent, and the correlation coefficient is 0.89 between the two variables measured at a country level.
This is in some sense counter-intuitive: we might expect those countries where leaving home is “expensive” – in terms of an increased risk of poverty – to be those countries where home-leaving is late, not early. In fact, we find the reverse. What does this finding tell us? First, that in those countries where early home-leaving is the norm, this early home-leaving is at best only partially explained by differences in economic sufficiency among young people: other factors, such as social and cultural norms, must also play a part. Second, that there is scope for research into issues of causality and heterogeneity. This simple descriptive analysis has compared the situation of those who have left home to the situation of those who have not left home. However, we have not taken account of the fact that the two groups may have very different characteristics or preferences, which may underlie a selection effect in the home-leaving decision.
Demographic Research: Volume 15, Article 2
http://www.demographic-research.org 37
Figure 5: Poverty rates, by whether young people live with their parents
0%
20%
40%
60%
80%
100%
FIN DE N NE TH UK IRE FRA GE R A US BE L P OR SP A IT A GRE
Soci al Democ r at i c Li ber al Cor por at i st Souther n
Left parental home Still in parental home
0%
20%
40%
60%
80%
100%
FIN DEN NETH UK IRE FRA GER AUS BEL POR SPA ITA GRE
Social Democratic Liberal Corporatist Southern
Young people aged 20-24
0%
20%
40%
60%
80%
100%
FIN DEN NETH UK IRE FRA GER AUS BEL POR SPA ITA GRE
Social Democratic Liberal Corporatist Southern
Young people aged 25-29
0%
20%
40%
60%
80%
100%
FIN DEN NETH UK IRE FRA GER AUS BEL POR SPA ITA GRE
Social Democratic Liberal Corporatist Southern
Young people aged 16-19
Aassve, Iacovou, & Mencarini: Youth poverty and transition to adulthood in Europe
38 http://www.demographic-research.org
Figure 6: Differences in poverty rates between those who have and have not left home, by the proportion of young people who have left home (those aged 20-24)
POR
SPA
GRE BEL
ITA
AUS
FRA
GER
IRE
UK
DEN
NETFIN
0
0.1
0.2
0.3
0.4
0.5
0.6
0.7
0 0.1 0.2 0.3 0.4 0.5
Difference between poverty rates of young people who have left home and those living at home
(20-24-year-olds)
% o
f th
ose
ag
ed 2
0-24
wh
o h
ave
left
th
e p
aren
tal h
om
e
Demographic Research: Volume 15, Article 2
http://www.demographic-research.org 39
5.3 Single-person households
Those countries where home-leaving is the earliest are also those countries where young people are the most likely to live in single-person households (Iacovou 2002a). Poverty rates in this paper are adjusted for household size using equivalence scales, but the choice of equivalence scales is in some sense arbitrary, and it may be that the differences in poverty rates between countries are driven by differences in household composition. For example, it may be that the very high poverty rates observed among young people in the social democratic countries in the early twenties are simply an artefact of the fact that they are much more likely to live alone.
Figure 7 shows poverty rates broken down by household type, for 20-24 year olds who do not have children (across Europe, only 7% of young people in this age group have children, and poverty rates among young people with children is dealt with in the next section).
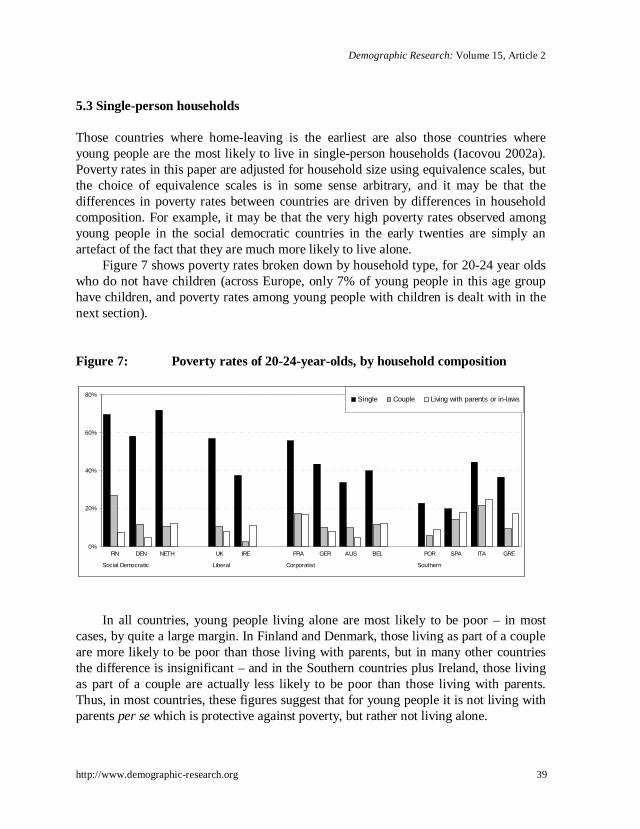
Figure 7: Poverty rates of 20-24-year-olds, by household composition
0%
20%
40%
60%
80%
FIN DEN NETH UK IRE FRA GER AUS BEL POR SPA ITA GRE
Social Democratic Liberal Corporatist Southern
Single Couple Living with parents or in-laws
In all countries, young people living alone are most likely to be poor – in most
cases, by quite a large margin. In Finland and Denmark, those living as part of a couple are more likely to be poor than those living with parents, but in many other countries the difference is insignificant – and in the Southern countries plus Ireland, those living as part of a couple are actually less likely to be poor than those living with parents. Thus, in most countries, these figures suggest that for young people it is not living with parents per se which is protective against poverty, but rather not living alone.

Aassve, Iacovou, & Mencarini: Youth poverty and transition to adulthood in Europe
40 http://www.demographic-research.org
Returning to the question of high youth poverty rates in the social democratic countries, the differentials between those living alone and others suggest that youth poverty in these countries is to a degree attributable to the high proportions living alone. However, this cannot be the whole story. Among those living alone, poverty rates are far higher in the social democratic countries than elsewhere – only in the UK and France are they of a similar magnitude. Thus, the very high poverty rates observed in the social democratic countries are not simply a compositional effect driven by young people’s living arrangements, but rather they relate both to high proportions of young people living alone, and high poverty rates among those who do live alone.
5.4 Children
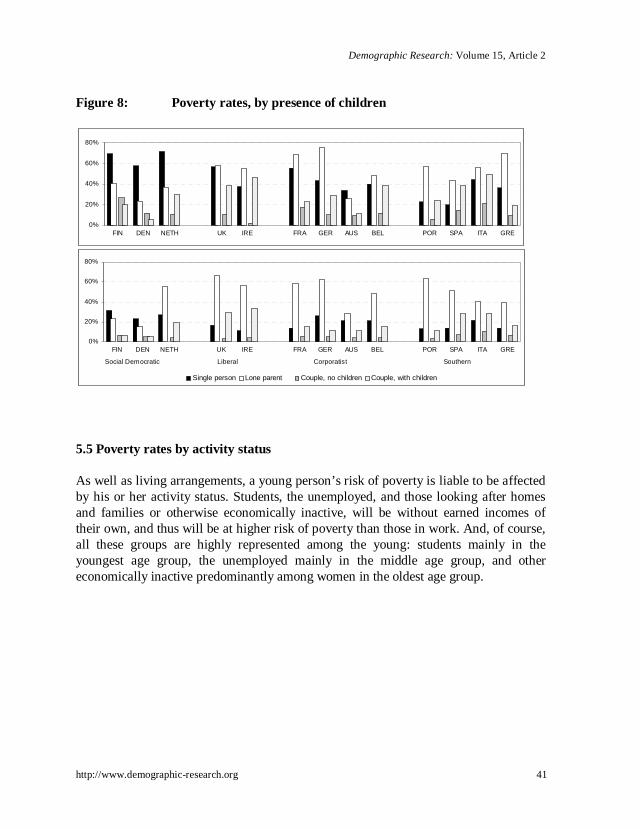
The previous discussion focused on young people without children. We now turn our attention to young people who have children of their own, comparing them to their childless counterparts. Figure 8 presents poverty rates for two groups of young people: those aged 20-24 (among whom only 7% live with children), and those aged 25-29 (among whom 27% live with children). In nearly every country, couples with children are at higher risk of poverty than couples without children. The exceptions are Finland and Denmark (for the younger age group), where the opposite is true. The country with the most noticeably increased risk of poverty for couples with children is Ireland, where for the younger age group, the risk of poverty is almost twenty times higher for couples with children than for couples without. The risk is also much increased in the UK, Belgium and Italy. In nearly every country, lone parents are at a higher risk of poverty than single adults. The exceptions are the social democratic group of countries plus Austria, where lone parents are at lower risk of poverty than single adults. Lone parents appear worst off relative to single adults in the Southern countries (where there are very few lone parents), and also in Germany and (for the older age group) the UK and France. In all countries – even the Scandinavian countries, which have the most highly developed anti-poverty programmes for lone parents – lone parent families with children are at higher risk of poverty than couples with children.
Demographic Research: Volume 15, Article 2
http://www.demographic-research.org 41
Figure 8: Poverty rates, by presence of children
0%
20%
40%
60%
80%
FIN DEN NETH UK IRE FRA GER AUS BEL POR SPA ITA GRE
0%
20%
40%
60%
80%
FIN DEN NETH UK IRE FRA GER AUS BEL POR SPA ITA GRE
Social Democratic Liberal Corporatist Southern
Single person Lone parent Couple, no children Couple, with children
5.5 Poverty rates by activity status
As well as living arrangements, a young person’s risk of poverty is liable to be affected by his or her activity status. Students, the unemployed, and those looking after homes and families or otherwise economically inactive, will be without earned incomes of their own, and thus will be at higher risk of poverty than those in work. And, of course, all these groups are highly represented among the young: students mainly in the youngest age group, the unemployed mainly in the middle age group, and other economically inactive predominantly among women in the oldest age group.
Aassve, Iacovou, & Mencarini: Youth poverty and transition to adulthood in Europe
42 http://www.demographic-research.org
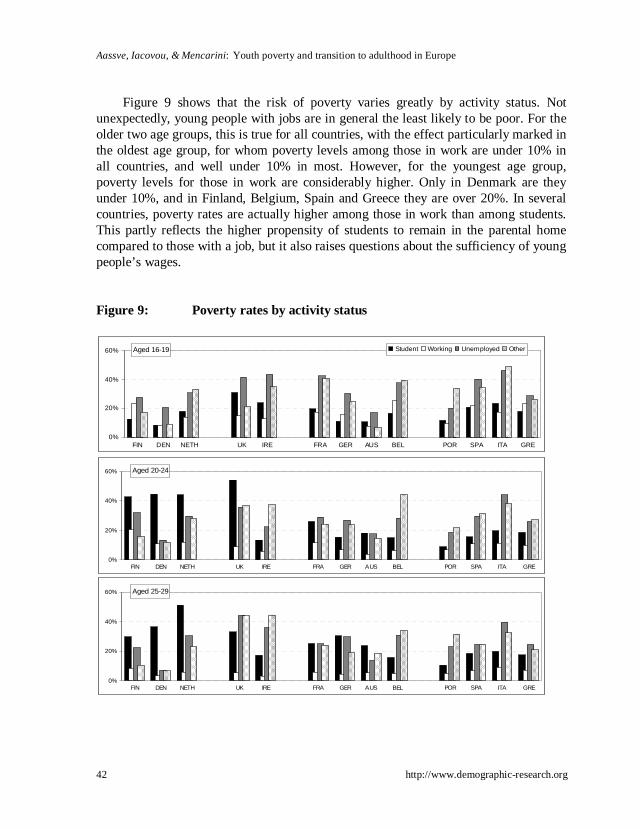
Figure 9 shows that the risk of poverty varies greatly by activity status. Not unexpectedly, young people with jobs are in general the least likely to be poor. For the older two age groups, this is true for all countries, with the effect particularly marked in the oldest age group, for whom poverty levels among those in work are under 10% in all countries, and well under 10% in most. However, for the youngest age group, poverty levels for those in work are considerably higher. Only in Denmark are they under 10%, and in Finland, Belgium, Spain and Greece they are over 20%. In several countries, poverty rates are actually higher among those in work than among students. This partly reflects the higher propensity of students to remain in the parental home compared to those with a job, but it also raises questions about the sufficiency of young people’s wages.
Figure 9: Poverty rates by activity status
Aged 16-19
0%
20%
40%
60%
FIN DEN NETH UK IRE FRA GER AUS BEL POR SPA ITA GRE
Student Working Unemployed Other
Aged 20-24
0%
20%
40%
60%
FIN DEN NETH UK IRE FRA GER AUS BEL POR SPA ITA GRE
Aged 25-29
0%
20%
40%
60%
FIN DEN NETH UK IRE FRA GER AUS BEL POR SPA ITA GRE
Demographic Research: Volume 15, Article 2
http://www.demographic-research.org 43
It is worth devoting particular attention to the social democratic countries, since as we have previously remarked, they have particularly high rates of youth poverty, and as Figure 9 shows, they demonstrate a rather different distribution of youth poverty from the other countries. In particular, the higher level of student poverty among the two older groups stands out in the social democratic countries. How far is this responsible for high overall rates of poverty in these countries? In Denmark, the rate of poverty among those in work, the unemployed and the economically inactive are generally lower (and in some cases much lower) than cross-country averages – and thus, the Danish peak in youth poverty rates may largely be attributed to the high level of poverty among students. In the Netherlands, poverty rates among the other occupational groups are higher than cross-country averages, but they are far from being the highest in the sample. In the Netherlands, therefore, student poverty is not solely responsible for high youth poverty rates, and some contribution is also made by relatively high poverty rates among other groups. In Finland, poverty rates are low among the economically inactive, but tend to be high among the unemployed and those with jobs. Since the numbers economically inactive are small relative to the other groups, it appears that the main driver behind youth poverty is student poverty, but that poverty among those with jobs and the unemployed also contribute.
6. Conclusions
We have measured the extent of youth poverty across 13 countries, by age group, by family structure and by employment status, and compared levels of youth poverty to levels of poverty among other age groups. We have shown that young people in many European countries are at higher-than-average risk of poverty and that in some countries, young people are more likely than almost any other group to be poor. We have found significant variations by country, and we have also identified situations which put young people at particular risk of poverty.
There are several key findings in this review. Young people’s living arrangements and activity status varies widely between countries, with these variations being reflected in the risk of poverty experienced by young people in each country. Living in one’s family of origin, or living as a couple but without children, tend to protect young people against poverty, whereas living alone, or as a lone parent, tend to increase the risk. Not having a job, whether one is a student, unemployed, or out of the labour force, increases the risk of poverty, while having a job tends to protect young people against poverty
Leaving aside those over 70, who in most countries suffer high rates of poverty, we find that in Finland, Denmark and the Netherlands, young people are at a higher risk of poverty than any other age group, with youth poverty rates among the highest in
Aassve, Iacovou, & Mencarini: Youth poverty and transition to adulthood in Europe
44 http://www.demographic-research.org
Europe. In the UK, young people are less susceptible to poverty than children, but more susceptible than any other age group. In France, Germany, Austria and Belgium, poverty rates vary less with age, but in France particularly, young people suffer disproportionately from poverty. In Greece, Spain and Portugal, youth poverty rates are high in relation to most other countries, but not particularly high compared to other age groups in their own countries. In Italy, youth poverty rates are very high in comparison to other countries, and also in comparison to other age groups in Italy.
In almost all countries, the risk of poverty declines with age over the twenties, and is lower in the thirties than in the twenties. This is partly driven by changes in occupational status among young people (who are less likely to be studying or unemployed at later ages), but also by a reduced risk of poverty within groups: for example, those with a job are less likely to be poor in their late twenties than in their teens or early twenties. However, this is offset by the fact that more young people have left home at later ages, and more of them have had children.
Given that the existing literature on youth poverty is so scant, perhaps one of the main contributions of this study has been to demonstrate that youth poverty is a major problem in many parts of Europe, and thus to identify this area of investigation as one wide open for further research. A range of potential research questions can be derived from this study. This paper has touched only marginally on gender differences in poverty rates. This is potentially an extremely important issue and one that deserves prompt attention. We have found that the risk of poverty is associated with employment status, but we have not examined the impact of insecure or other non-standard employment on youth poverty. Nor have we looked at wage distributions and the impact on low wages. Iacovou and Berthoud (2001) provide evidence that the very highest risk of poverty arises at particular intersections of family and labour market situations. We have not explored these interactions in this paper, but this is clearly a fruitful avenue for further research. This paper has dealt only with cross-sectional statistics of a descriptive nature. Clearly this is only a first step, and says little about the processes behind youth poverty. As a panel data set, the ECHP lends itself to analysis of the longitudinal aspects of youth poverty.
One simple exercise which we have suggested, particularly in relation to youth poverty in the social democratic countries, is to examine the length of spells in poverty. If high youth poverty rates at a national level are caused by a majority of young people experiencing a year or two in poverty, with a high probability of exit thereafter, this denotes a far less serious problem than a smaller “underclass” subject to persistent poverty, and a low probability of exiting poverty. Additionally, it would be useful to look at the events which trigger entries to and/or exits from poverty, rather than the situations with which poverty is associated in a cross-sectional context: losing or gaining a job, finding or splitting from a partner, childbirth, and so on.
Demographic Research: Volume 15, Article 2
http://www.demographic-research.org 45
In this paper, we have focused on measures of relative poverty based on percentages of national median household equivalent income. Although these measures are widely used, they are subject to a number of criticisms, and there is a case for repeating the analysis using alternative measures of poverty. In the ECHP, subjective measures of economic sufficiency, and measures of material deprivation, are available. There is some evidence that the high rates of poverty experienced by young people living alone are the function of equivalence scales. This could be addressed by looking at alternative measures of poverty, such as subjective measures, or by experimenting with alternative equivalence scales.
Finally, while many of our findings in this paper have potentially important implications for social policy, space has not permitted a discussion of these policy issues. Further research could usefully investigate whether youth poverty is an area which should be given priority by policy-makers; and if so, how the issue would be best addressed. Our findings may appear to suggest that measures to prolong young people’s residence in the parental home would be beneficial to young people’s economic situation. However, such measures would be unlikely to meet with public support, particularly in those countries with a tradition of early home-leaving (which are precisely those countries where youth poverty is most of a problem). There are a number of other areas where policy interventions may benefit young people: these include the labour market; tax and benefit systems; and housing markets. Again, assessment of these possible interventions is beyond the scope of this paper, but would provide fruitful avenues for further research.
7. Acknowledgements
This paper forms part of the project “Poverty Among Youth: International Lessons for the UK”, funded by the Joseph Rowntree Foundation Grant no. 803554 under the Ladders Out Of Poverty programme. We would like to thank Chris Goulden of JRF, and Paul Gregg, Simon Burgess, Jackie Scott, Elaine Squires and Simon Lunn of the project advisory group, for comments on earlier versions of the paper. We also thank those who commented on the paper after presentations at ISER and the EPUNET conference 2005, and two anonymous referees. The ECHP data used in the analysis were produced and made available by Eurostat. All errors and inconsistencies in the paper are our own.

Aassve, Iacovou, & Mencarini: Youth poverty and transition to adulthood in Europe
46 http://www.demographic-research.org
References
Aassve A, Mazzucco S, Mencarini L. (2005), “Childbearing and Wellbeing: a comparative analysis of the European community”, Journal of European Social Policy, 15(4):283-300.
Aassve A, Billari FC, Mazzuco S and Ongaro F. (2003), “Leaving home: a comparative analysis of ECHP data”, Journal of European Social Policy, 12(4):259-275.
Beaujot R, Liu J. (2002), “Children, Social Assistance and Outcomes: Cross National Comparisons” LIS Working Paper Series, Working paper No. 304, Luxembourg.
Berthoud R, Robson K. (2003). “Early Motherhood and Disadvantage: A Comparison Between Ethnic Groups”, ISER working paper no. 2003-29, Colchester, Essex.
Berthoud R. (2004). Patterns of Poverty Across Europe, Policy Press.
Billari F. (2001). “The analysis of early life courses: complex descriptions of the transition to adulthood”, Journal of Population Research, 18, 2: 119-142.
Boys A, Marsden J, Strang J. (2001). “Understanding reasons for drug use amongst young people: a functional perspective”, Health Education Research, 16(4): 457-469.
Bradbury B, Jantti M. (1999), “Child Poverty Across Industrialized Nations”, Innocenti Occasional Papers, Economic and Social Policy Series no. 71, UNICEF, Florence.
Bradshaw J (2001), “Methodologies To Measure Poverty: More Than One Is Best!”, Paper For International Symposium on Poverty: Concepts And Methodologies, Mexico City, March 2001.
Brewer M, Goodman A, Shaw J, Shephard, A. (2005), “Living standards, inequality and poverty: 2005 election briefing note no. 9”, Institute for Fiscal Studies: London.
Cantillon B, Van den Bosch K. (2003) “Social Policy Strategies to Combat Income Poverty of Children and Families in Europe”, Maxwell School of Citizenship and Public Affairs working paper no. 336, Syracuse University, New York.
Cantó-Sanchéz O, Mercader-Prats M. (1999), “Poverty among children and youth in Spain: the role of parents and youth employment status”. Document de Treball 99.07, Departament d”Economia Aplicada, Universitat Autònoma de Barcelona, Spain.
Demographic Research: Volume 15, Article 2
http://www.demographic-research.org 47
Catan L. (2004). Becoming adult: changing youth transitions in the 21st century, Trust for the Study of Adolescence. Brighton, UK.
Chen, W.-H. and Corak, M. (2005), “Child Poverty and Changes in Child Poverty in Rich Countries since 1990”. Innocenti Working Paper No. 2005-02. Florence, UNICEF Innocenti Research Centre.
Corijn M, Klijzing E. (2001). Transitions to Adulthood in Europe, European Association for Population Studies, Kluwer: Dordrecht-Boston-London.
Esping-Andersen G. (1990). Three Worlds of Welfare Capitalism, Cambridge: Policy Press.
Esping-Andersen G. (1999). Social Foundations of Post Industrial Economies, Oxford: Oxford University Press.
European Commission (2001). European Commission White Paper: A New Impetus for European Youth. Commission of the European Communities, Brussels.
EUROSTAT (2002). Income, Poverty and Social Exclusion: second report, European Social Statistics, Luxembourg, pp. 76 – 92.
Fahmy E. (2002), “Youth, Poverty and Social Exclusion”, Working Paper 27, Townsend Centre for International Poverty Research, University of Bristol.
Ferrara M. (1999) “The ‘southern model’ of welfare in social Europe”, Journal of European Social Policy, 6 (1) pp. 179-189.
Fouarge D, Layte R. (2005). “Duration of poverty spells in Europe”, Journal of Social Policy, 34(3):407 – 426.
Furstenberg FFJr. (ed). (2002). “Early Adulthood in Cross-National Perspective”. The Annals of the American Academy of Political and Social Science. Special issue.
Garfinkel I, Rainwater L,Smeeding T. (2004). “Welfare State Expenditures and the Distribution of Child Opportunities”. LIS Working Paper no. 379, Luxembourg.
Hammer T. (2003). Youth Unemployment and Social Exclusion in Europe, Policy Press, Bristol, United Kingdom.
Hansen K. (2003) “Education and the Crime-Age Profile” The British Journal of Criminology 43: pp141-168
Heuberger R. (2003). “What household gets what income?”. Conference paper, EPUNET, June, 2003, Essex, United Kingdom.
Iacovou M. (2002), “Regional Differences in the Transition to Adulthood”, Annals of the American Association of Political and Social Science, no. 580, pp 40-69.

Aassve, Iacovou, & Mencarini: Youth poverty and transition to adulthood in Europe
48 http://www.demographic-research.org
Iacovou M, Berthoud R. (2001). Young People’s Lives: A Map of Europe, Colchester: University of Essex, Institute for Social and Economic Research.
Jones G. (2002). The youth divide: diverging paths to adulthood, Joseph Rowntree Foundation, York, United Kingdom.
Kangas O, Palme J. (2000). “Does Social Policy Matter? Poverty Cycles in the OECD Countries.” International Journal of Health Services, 30:335--52.
Layte R, Whelan CT. (2002). “Moving in and out of poverty: the impact of welfare regimes on poverty dynamics in the EU”, EPAG working paper no. 30, Colchester, University of Essex.
Layte R, Whelan CT. (2001). “Cumulative disadvantage or individualisation? A comparative analysis of poverty risk incidence”, EPAG working paper 22, Colchester, University of Essex.
Mejer L. (2000). Social Exclusion in EU Member States, Luxembourg: EUROSTAT
Micklewright J. (2004). “Child poverty in English-speaking countries”. LIS working paper no. 376, Syracuse University, New York.
Modell, J., Furstenberg, F. and Hershberg, T. (1976). "Social Change and Transitions to Adulthood in Historical Perspective." Journal of Family History 1:7-32
Müller, W., Steinmann, S. and Ell, R. (1998) 'Education and labor market entry in Germany', in: S. Yossi and W. Müller (eds.), From School to Work. A Comparative Study of Educational Qualifications and Occupational Destinations, Oxford: Clarendon: pp. 143-188.)
OECD (2001). When Money Is Tight: Poverty Dynamics in OECD Countries, OECD Employment Outlook 2001: Paris, France.
Office for National Statistics. (2004). Social Trends HMSO, London.
Pavis S. Platt S. Hubbard G. (2000). Young People in Scotland: Pathways to Social Inclusion and Exclusion. Joseph Rowntree Foundation, York, United Kingdom.
Rugg J. (1999). Young People, Housing and Social Policy. Routledge, London, 1999.
Russell H, O’Connell P. (2001). “Getting a Job in Europe: the transition from unemployment to work among young people in nine European countries”, Work, Employment and Society, 15(1) 1–24.
Demographic Research: Volume 15, Article 2
http://www.demographic-research.org 49
Schizzerotto A, Lucchini M. (2004). “Transitions to Adulthood”, in Berthoud R. and Iacovou M. (eds), Social Europe: Living Standards and Welfare States, Edward Elgar, Cheltenham, UK, 2004, pp. 46-68.
Shucksmith J, Spratt J. (2002). “Young people’s self identified health needs, HEBS Young People and Health Initiative Working Paper”, University of Aberdeen.
Smeeding T, Ross Phillips K. (2002) “Cross-National Differences in Employment and Economic Sufficiency”, Annals of the American Association of Political and Social Science, No. 580, pp 103-133.
Smeeding T, Ross K, England P, Christopher K, McLanahan S. (1999). Poverty and Parenthood across Modern Nations: Findings from the Luxembourg Income Study LIS Working Paper no. 194, Luxembourg.
Whelan CT, Layte R, Maitre B. (2003). “Poverty, deprivation and time: a comparative analysis of the structure of disadvantage”. EPAG working paper no. 48, Colchester, University of Essex.

Aassve, Iacovou, & Mencarini: Youth poverty and transition to adulthood in Europe
50 http://www.demographic-research.org